2011 Annual Report to...
159
2011 Annual Report to Stockholders
-
Upload
vuonghuong -
Category
Documents
-
view
213 -
download
0
Transcript of 2011 Annual Report to...

2011 Annual Report to Stockholders

HCA Holdings, Inc. is one of the leading health care services companies in the United States. At December 31, 2011, we operated 163 hospitals, comprised of 157 general, acute care hospitals; five psychiatric hospitals; and one rehabilitation hospital. In addition, we operated 108 freestanding surgery centers. Our facilities are located in 20 states and England.
Company Overview
Corporate InformationTransfer Agent and RegistrarWells Fargo Shareowner Services P.O. Box 64874 St. Paul, Minnesota 55164-0874Toll free: 800-468-9716
Certified/Overnight Mail:Wells Fargo Shareowner Services161 North Concord ExchangeSouth St. Paul, Minnesota 55075
Independent Registered Public Accounting FirmErnst & Young LLPNashville, Tennessee
Corporate HeadquartersOne Park PlazaNashville, Tennessee 37203615-344-9551
Form 10-KThe Company has filed an annual report on Form 10-K for the year ended December 31, 2011, with the United States Securities and Exchange Commission. Stockholders may obtain a copy of this report, without
charge, by writing: Investor Relations, HCA Holdings, Inc., One Park Plaza, Nashville, TN 37203 or by visiting the Company’s website at www.hcahealthcare.com.
Common Stock and Dividend InformationThe Common Stock of HCA Holdings, Inc. is listed on the New York Stock Exchange (NYSE) under the symbol “HCA”.
On March 1, 2012, the Company had a total of approximately 1,080 stockholders of record.The Company does not currently intend to declare or pay a regular quarterly dividend.
During March 2011, we completed the initial public offering of 87,719,300 shares of our common stock at a price of $30.00 per share (before deducting underwriter discounts, commissions and other related offering expenses). Certain of our stockholders also sold 57,410,700 shares of our common stock in this offering. We did not receive any proceeds from the shares sold by the selling stockholders.
Annual Meeting of ShareholdersThe annual meeting of stockholders will be held on April 26, 2012, at 2:00 pm local time at the HCA corporate offices located at One Park Plaza, Nashville, Tennessee. Stockholders of record as of March 1, 2012, are invited to attend.
AK
ENG
FL
GA
CO
MT ND
SD
NE
WY
OR
WA
AZ NM
MN
AR
AL
IA
WI
IL
MI
OHPA
NY
NC
NJ
ME
CA
WV
NV
ID
KS
TX
OK
IN
MO
MS
SC
VA
TN
UTMD
DE
VT
MARI
CT
NH
KY
LA
facilities map
Kansas CityDenver
Salt Lake City
HoustonTampa
Jacksonville
Nashville
Richmond
Dallas
BatonRouge
San Jose
Las Vegas
Anchorage
El Paso
Oklahoma City
Austin
New Orleans
Atlanta
Charleston
Portsmouth
Miami
San AntonioLondon
The terms “HCA” or the “Company” as used in this report refer to HCA Holdings, Inc. and its affiliates, unless otherwise stated or indicated by context. The term “facilities” refers to entities owned or operated by subsidiaries or affiliates of HCA Holdings, Inc. References herein to “HCA employees” refer to employees or affiliates of HCA Management Services, LP or HCA Holdings, Inc.

Directors
Executive Officers
Richard M. BrackenChairman and Chief Executive OfficerHCA Holdings, Inc.
John P. ConnaughtonManaging DirectorBain Capital
Kenneth W. FreemanKohlberg Kravis Roberts & Co.Dean – Boston University School of Management
Thomas F. Frist IIIPrincipal Frist Capital LLC
William R. FristPrincipalFrist Capital LLC
Christopher R. GordonManaging DirectorBain Capital
R. Milton JohnsonPresident and Chief Financial OfficerHCA Holdings, Inc.
Jay O. LightDean EmeritusHarvard Business School
Geoffrey G. MeyersExecutive Vice President, Chief Financial Officer (Retired) – Manor Care, Inc.
Michael W. MichelsonMember – KKR Management LLC
James C. MomtazeeMember – KKR Management LLC
Stephen G. PagliucaManaging DirectorBain Capital
Wayne J. Riley, M.D.President and Chief Executive OfficerMeharry Medical College
Richard M. BrackenChairman and Chief Executive Officer
R. Milton JohnsonPresident and Chief Financial Officer
Samuel N. HazenPresident - Operations
David G. AndersonSenior Vice PresidentFinance and Treasurer
Victor L. CampbellSenior Vice President
Jana J. DavisSenior Vice PresidentCommunications
Jon M. FosterPresidentSouthwest Group
Charles J. HallPresidentNational Group
A. Bruce Moore, Jr.PresidentService Line and Operations Integration
Michael P. O’BoylePresident and CEOParallon Business Solutions
Jonathan B. Perlin, MDPresidentClinical and Physician Services Group and Chief Medical Officer
W. Paul RutledgePresidentCentral Group
Joseph A. Sowell, IIISenior Vice President and Chief Development Officer
Joseph N. SteakleySenior Vice PresidentInternal Audit Services
John M. SteeleSenior Vice President Human Resources
Donald W. StinnettSenior Vice President and Controller
Juan VallarinoSenior Vice PresidentStrategic Pricing and Analytics
Robert A. WatermanSenior Vice President, General Counsel and Chief Labor Relations Officer
Noel Brown WilliamsSenior Vice President and Chief Information Officer
Alan R. YuspehSenior Vice President and Chief Ethics and Compliance Officer

UNITED STATESSECURITIES AND EXCHANGE COMMISSION
Washington, D.C. 20549
Form 10-K(Mark One)
Í ANNUAL REPORT PURSUANT TO SECTION 13 OR 15(d) OFTHE SECURITIES EXCHANGE ACT OF 1934For the fiscal year ended December 31, 2011
OR
‘ TRANSITION REPORT PURSUANT TO SECTION 13 OR 15(d) OFTHE SECURITIES EXCHANGE ACT OF 1934For the transition period from to
Commission File Number 1-11239
HCA HOLDINGS, INC.(Exact Name of Registrant as Specified in its Charter)
Delaware 27-3865930(State or Other Jurisdiction ofIncorporation or Organization)
(I.R.S. Employer Identification No.)
One Park PlazaNashville, Tennessee 37203
(Address of Principal Executive Offices) (Zip Code)
Registrant’s telephone number, including area code: (615) 344-9551
Securities Registered Pursuant to Section 12(b) of the Act:
Title of Each Class Name of Each Exchange on Which RegisteredCommon Stock, $0.01 Par Value New York Stock Exchange
Securities Registered Pursuant to Section 12(g) of the Act: None
Indicate by check mark if the Registrant is a well-known seasoned issuer, as defined in Rule 405 of the SecuritiesAct. Yes Í No ‘
Indicate by check mark if the Registrant is not required to file reports pursuant to Section 13 or Section 15(d) of theAct. Yes ‘ No Í
Indicate by check mark whether the Registrant (1) has filed all reports required to be filed by Section 13 or 15(d) of the SecuritiesExchange Act of 1934 during the preceding 12 months (or for such shorter period that the Registrant was required to file such reports), and(2) has been subject to such filing requirements for the past 90 days. Yes Í No ‘
Indicate by check mark whether the Registrant has submitted electronically and posted on its corporate Web site, if any, everyInteractive Data File required to be submitted and posted pursuant to Rule 405 of Regulation S-T during the preceding 12 months (or for suchshorter period that the Registrant was required to submit and post such files). Yes Í No ‘
Indicate by check mark if disclosure of delinquent filers pursuant to Item 405 of Regulation S-K (§ 229.405 of this chapter) is notcontained herein, and will not be contained, to the best of Registrant’s knowledge, in definitive proxy or information statements incorporatedby reference in Part III of this Form 10-K or any amendment to this Form 10-K. ‘
Indicate by check mark whether the Registrant is a large accelerated filer, an accelerated filer, a non-accelerated filer, or a smallerreporting company. See the definitions of “large accelerated filer,” “accelerated filer” and “smaller reporting company” in Rule 12b-2 of theExchange Act.
Large accelerated filerÍ Accelerated filer‘ Non-accelerated filer‘ Smaller reporting company‘(Do not check if a smaller reporting company)
Indicate by check mark whether the Registrant is a shell company (as defined in Rule 12b-2 of the Exchange Act). Yes ‘ No Í
As of January 31, 2012, there were 437,618,000 outstanding shares of the Registrant’s common stock. As of June 30, 2011, theaggregate market value of the common stock held by nonaffiliates was approximately $5.186 billion. For purposes of the foregoingcalculation only, Hercules Holding II, LLC and the Registrant’s directors and executive officers have been deemed to be affiliates.
DOCUMENTS INCORPORATED BY REFERENCE
Portions of the Registrant’s definitive proxy materials for its 2012 Annual Meeting of Stockholders are incorporated by reference intoPart III hereof.

INDEX
PageReference
PART IItem 1. Business . . . . . . . . . . . . . . . . . . . . . . . . . . . . . . . . . . . . . . . . . . . . . . . . . . . . . . . . . . . . . . . . . 3Item 1A. Risk Factors . . . . . . . . . . . . . . . . . . . . . . . . . . . . . . . . . . . . . . . . . . . . . . . . . . . . . . . . . . . . . . . 39Item 1B. Unresolved Staff Comments . . . . . . . . . . . . . . . . . . . . . . . . . . . . . . . . . . . . . . . . . . . . . . . . . . 52Item 2. Properties . . . . . . . . . . . . . . . . . . . . . . . . . . . . . . . . . . . . . . . . . . . . . . . . . . . . . . . . . . . . . . . . 53Item 3. Legal Proceedings . . . . . . . . . . . . . . . . . . . . . . . . . . . . . . . . . . . . . . . . . . . . . . . . . . . . . . . . . . 53Item 4. Mine Safety Disclosures . . . . . . . . . . . . . . . . . . . . . . . . . . . . . . . . . . . . . . . . . . . . . . . . . . . . . 55
PART IIItem 5. Market for Registrant’s Common Equity, Related Stockholder Matters and Issuer
Purchases of Equity Securities . . . . . . . . . . . . . . . . . . . . . . . . . . . . . . . . . . . . . . . . . . . . . . . . 55Item 6. Selected Financial Data . . . . . . . . . . . . . . . . . . . . . . . . . . . . . . . . . . . . . . . . . . . . . . . . . . . . . . 58Item 7. Management’s Discussion and Analysis of Financial Condition and Results of
Operations . . . . . . . . . . . . . . . . . . . . . . . . . . . . . . . . . . . . . . . . . . . . . . . . . . . . . . . . . . . . . . . . 60Item 7A. Quantitative and Qualitative Disclosures about Market Risk . . . . . . . . . . . . . . . . . . . . . . . . . 85Item 8. Financial Statements and Supplementary Data . . . . . . . . . . . . . . . . . . . . . . . . . . . . . . . . . . . . 85Item 9. Changes in and Disagreements with Accountants on Accounting and Financial
Disclosure . . . . . . . . . . . . . . . . . . . . . . . . . . . . . . . . . . . . . . . . . . . . . . . . . . . . . . . . . . . . . . . . 85Item 9A. Controls and Procedures . . . . . . . . . . . . . . . . . . . . . . . . . . . . . . . . . . . . . . . . . . . . . . . . . . . . . 85Item 9B. Other Information . . . . . . . . . . . . . . . . . . . . . . . . . . . . . . . . . . . . . . . . . . . . . . . . . . . . . . . . . . 88
PART IIIItem 10. Directors, Executive Officers and Corporate Governance . . . . . . . . . . . . . . . . . . . . . . . . . . . 88Item 11. Executive Compensation . . . . . . . . . . . . . . . . . . . . . . . . . . . . . . . . . . . . . . . . . . . . . . . . . . . . . 88Item 12. Security Ownership of Certain Beneficial Owners and Management and Related
Stockholder Matters . . . . . . . . . . . . . . . . . . . . . . . . . . . . . . . . . . . . . . . . . . . . . . . . . . . . . . . . 88Item 13. Certain Relationships and Related Transactions, and Director Independence . . . . . . . . . . . . 89Item 14. Principal Accountant Fees and Services . . . . . . . . . . . . . . . . . . . . . . . . . . . . . . . . . . . . . . . . . 89
PART IVItem 15. Exhibits and Financial Statement Schedules . . . . . . . . . . . . . . . . . . . . . . . . . . . . . . . . . . . . . 90
Signatures . . . . . . . . . . . . . . . . . . . . . . . . . . . . . . . . . . . . . . . . . . . . . . . . . . . . . . . . . . . . . . . . 101
2

PART I
Item 1. Business
General
HCA Holdings, Inc. is one of the leading health care services companies in the United States. AtDecember 31, 2011, we operated 163 hospitals, comprised of 157 general, acute care hospitals; five psychiatrichospitals; and one rehabilitation hospital. In addition, we operated 108 freestanding surgery centers. Our facilitiesare located in 20 states and England.
The terms “Company,” “HCA,” “we,” “our” or “us,” as used herein and unless otherwise stated or indicatedby context, refer to HCA Inc. and its affiliates prior to the Corporate Reorganization (as defined below) and toHCA Holdings, Inc. and its affiliates after the Corporate Reorganization. The term “affiliates” means direct andindirect subsidiaries of HCA Holdings, Inc. and partnerships and joint ventures in which such subsidiaries arepartners. The terms “facilities” or “hospitals” refer to entities owned and operated by affiliates of HCA and theterm “employees” refers to employees of affiliates of HCA.
Our primary objective is to provide a comprehensive array of quality health care services in the most cost-effective manner possible. Our general, acute care hospitals typically provide a full range of services toaccommodate such medical specialties as internal medicine, general surgery, cardiology, oncology, neurosurgery,orthopedics and obstetrics, as well as diagnostic and emergency services. Outpatient and ancillary health careservices are provided by our general, acute care hospitals, freestanding surgery centers, diagnostic centers andrehabilitation facilities. Our psychiatric hospitals provide a full range of mental health care services throughinpatient, partial hospitalization and outpatient settings.
On November 17, 2006, HCA Inc. was acquired by a private investor group, including affiliates of or fundssponsored by Bain Capital Partners, LLC, Kohlberg Kravis Roberts & Co., BAML Capital Partners and HCAfounder, Dr. Thomas F. Frist, Jr. (collectively, the “Investors”) and by members of management and certain otherinvestors. The transaction was accounted for as a recapitalization in our financial statements, with no adjustmentsto the historical basis of our assets and liabilities.
During February 2011, our Board of Directors approved an increase in the number of our authorized sharesto 1,800,000,000 shares of common stock and a 4.505-to-one split of our issued and outstanding common shares.All common share and per common share amounts in these consolidated financial statements and notes toconsolidated financial statements reflect the 4.505-to-one split. During March 2011, we completed the initialpublic offering of 87,719,300 shares of our common stock at a price of $30.00 per share (before deductingunderwriter discounts, commissions and other related offering expenses). Certain of our stockholders also sold57,410,700 shares of our common stock in this offering. We did not receive any proceeds from the shares sold bythe selling stockholders. Our common stock is now traded on the New York Stock Exchange (symbol “HCA”).
The Company was incorporated in Nevada in January 1990 and reincorporated in Delaware in September1993. Our principal executive offices are located at One Park Plaza, Nashville, Tennessee 37203, and ourtelephone number is (615) 344-9551.
Corporate Reorganization
On November 22, 2010, HCA Inc. reorganized by creating a new holding company structure (the“Corporate Reorganization”). We are the new parent company, and HCA Inc. is now our wholly-owned directsubsidiary. As part of the Corporate Reorganization, HCA Inc.’s outstanding shares of capital stock wereautomatically converted, on a share for share basis, into identical shares of our common stock. As a result of the
3

Corporate Reorganization, we are deemed the successor registrant to HCA Inc. under the Exchange Act. As partof the Corporate Reorganization, we became a guarantor but did not assume the debt of HCA Inc.’s outstandingsecured notes.
We have assumed all of HCA Inc.’s obligations with respect to the outstanding shares previously registeredon Form S-8 for distribution pursuant to HCA Inc.’s stock incentive plan and have also assumed HCA Inc.’sother equity incentive plans that provide for the right to acquire HCA Inc.’s common stock. The agreements andplans we assumed were each deemed to be automatically amended as necessary to provide that references thereinto HCA Inc. now refer to HCA Holdings, Inc. Following the Corporate Reorganization, the right to receive HCAInc.’s common stock under its various compensation plans and agreements automatically converted into rightsfor the same number of shares of our common stock, with the same rights and conditions as the correspondingHCA Inc. rights prior to the Corporate Reorganization.
Available Information
We file certain reports with the Securities and Exchange Commission (the “SEC”), including annual reportson Form 10-K, quarterly reports on Form 10-Q and current reports on Form 8-K. The public may read and copyany materials we file with the SEC at the SEC’s Public Reference Room at 100 F Street, N.E., Washington, DC20549. The public may obtain information on the operation of the Public Reference Room by calling the SEC at1-800-SEC-0330. We are an electronic filer, and the SEC maintains an Internet site at http://www.sec.gov thatcontains the reports, proxy and information statements and other information we file electronically. Our websiteaddress is www.hcahealthcare.com. Please note that our website address is provided as an inactive textualreference only. We make available free of charge, through our website, our annual report on Form 10-K,quarterly reports on Form 10-Q, current reports on Form 8-K and all amendments to those reports filed orfurnished pursuant to Section 13 or 15(d) of the Exchange Act, as soon as reasonably practicable after suchmaterial is electronically filed with or furnished to the SEC. The information provided on our website is not partof this report, and is therefore not incorporated by reference unless such information is specifically referencedelsewhere in this report.
Our Code of Conduct is available free of charge upon request to our Corporate Secretary, HCA Holdings,Inc., One Park Plaza, Nashville, Tennessee 37203.
Business Strategy
We are committed to providing the communities we serve with high quality, cost-effective health care whilegrowing our business, increasing our profitability and creating long-term value for our stockholders. To achievethese objectives, we align our efforts around the following growth agenda:
• grow our presence in existing markets;
• achieve industry-leading performance in clinical and satisfaction measures;
• recruit and employ physicians to meet the need for high quality health services;
• continue to leverage our scale and market positions to enhance profitability; and
• selectively pursue a disciplined development strategy.
Health Care Facilities
We currently own, manage or operate hospitals; freestanding surgery centers; diagnostic and imagingcenters; radiation and oncology therapy centers; comprehensive rehabilitation and physical therapy centers; andvarious other facilities.
4

At December 31, 2011, we owned and operated 157 general, acute care hospitals with 40,988 licensed beds.Most of our general, acute care hospitals provide medical and surgical services, including inpatient care,intensive care, cardiac care, diagnostic services and emergency services. The general, acute care hospitals alsoprovide outpatient services such as outpatient surgery, laboratory, radiology, respiratory therapy, cardiology andphysical therapy. Each hospital has an organized medical staff and a local board of trustees or governing board,made up of members of the local community.
Our hospitals do not typically engage in extensive medical research and education programs. However,some of our hospitals are affiliated with medical schools and may participate in the clinical rotation of medicalinterns and residents and other education programs.
At December 31, 2011, we operated five psychiatric hospitals with 506 licensed beds. Our psychiatrichospitals provide therapeutic programs including child, adolescent and adult psychiatric care, adult andadolescent alcohol and drug abuse treatment and counseling.
We also operate outpatient health care facilities which include freestanding ambulatory surgery centers(“ASCs”), freestanding emergency care facilities, diagnostic and imaging centers, comprehensive outpatientrehabilitation and physical therapy centers, outpatient radiation and oncology therapy centers and various otherfacilities. These outpatient services are an integral component of our strategy to develop comprehensive healthcare networks in select communities. Most of our ASCs are operated through partnerships or limited liabilitycompanies, with majority ownership of each partnership or limited liability company typically held by a generalpartner or subsidiary that is an affiliate of HCA.
Certain of our affiliates provide a variety of management services to our health care facilities, includingpatient safety programs; ethics and compliance programs; national supply contracts; equipment purchasing andleasing contracts; accounting, financial and clinical systems; governmental reimbursement assistance;construction planning and coordination; information technology systems and solutions; legal counsel; humanresources services; and internal audit services.
Sources of Revenue
Hospital revenues depend upon inpatient occupancy levels, the medical and ancillary services ordered byphysicians and provided to patients, the volume of outpatient procedures and the charges or payment rates forsuch services. Charges and reimbursement rates for inpatient services vary significantly depending on the type ofpayer, the type of service (e.g., medical/surgical, intensive care or psychiatric) and the geographic location of thehospital. Inpatient occupancy levels fluctuate for various reasons, many of which are beyond our control.
5

We receive payments for patient services from the federal government under the Medicare program, stategovernments under their respective Medicaid or similar programs, managed care plans, private insurers anddirectly from patients. Our revenues from third-party payers and the uninsured for the years ended December 31,2011, 2010 and 2009 are summarized in the following table (dollars in millions):
Years Ended December 31,
2011 Ratio 2010 Ratio 2009 Ratio
Medicare . . . . . . . . . . . . . . . . . . . . . . . . $ 7,653 25.8% $ 7,203 25.7% $ 6,866 25.6%Managed Medicare . . . . . . . . . . . . . . . . 2,442 8.2 2,162 7.7 2,006 7.5Medicaid . . . . . . . . . . . . . . . . . . . . . . . . 1,845 6.2 1,962 7.0 1,691 6.3Managed Medicaid . . . . . . . . . . . . . . . . 1,265 4.3 1,165 4.2 1,113 4.2Managed care and other insurers . . . . . . 15,703 52.9 14,762 52.7 14,323 53.5International (managed care and otherinsurers) . . . . . . . . . . . . . . . . . . . . . . . 938 3.2 784 2.8 702 2.6
29,846 100.6 28,038 100.1 26,701 99.7Uninsured . . . . . . . . . . . . . . . . . . . . . . . 1,846 6.2 1,732 6.2 2,350 8.8Other . . . . . . . . . . . . . . . . . . . . . . . . . . . 814 2.7 913 3.3 1,001 3.7
Revenues before provision for doubtfulaccounts . . . . . . . . . . . . . . . . . . . . . . . 32,506 109.5 30,683 109.6 30,052 112.2
Provision for doubtful accounts . . . . . . (2,824) (9.5) (2,648) (9.6) (3,276) (12.2)
Revenues . . . . . . . . . . . . . . . . . . . . . . . . $29,682 100.0% $28,035 100.0% $26,776 100.0%
Medicare is a federal program that provides certain hospital and medical insurance benefits to personsage 65 and over, some disabled persons, persons with end-stage renal disease and persons with Lou Gehrig’sDisease. Medicaid is a federal-state program, administered by the states, which provides hospital and medicalbenefits to qualifying individuals who are unable to afford health care. All of our general, acute care hospitalslocated in the United States are certified as health care services providers for persons covered under Medicareand Medicaid programs. Amounts received under Medicare and Medicaid programs are generally significantlyless than established hospital gross charges for the services provided.
Our hospitals generally offer discounts from established charges to certain group purchasers of health careservices, including private insurance companies, employers, health maintenance organizations (“HMOs”),preferred provider organizations (“PPOs”) and other managed care plans. These discount programs generallylimit our ability to increase revenues in response to increasing costs. See Item 1, “Business — Competition.”Patients are generally not responsible for the total difference between established hospital gross charges andamounts reimbursed for such services under Medicare, Medicaid, HMOs, PPOs and other managed care plans,but are responsible to the extent of any exclusions, deductibles or coinsurance features of their coverage. Theamount of such exclusions, deductibles and coinsurance continues to increase. Collection of amounts due fromindividuals is typically more difficult than from governmental or third-party payers. We provide discounts touninsured patients who do not qualify for Medicaid or charity care under our charity care policy. These discountsare similar to those provided to many local managed care plans. In implementing the discount policy, we attemptto qualify uninsured patients for Medicaid, other federal or state assistance or charity care under our charity carepolicy. If an uninsured patient does not qualify for these programs, the uninsured discount is applied.
Medicare
Inpatient Acute Care
Under the Medicare program, we receive reimbursement under a prospective payment system (“PPS”) forgeneral, acute care hospital inpatient services. Under the hospital inpatient PPS, fixed payment amounts perinpatient discharge are established based on the patient’s assigned Medicare severity diagnosis-related group
6

(“MS-DRG”). MS-DRGs classify treatments for illnesses according to the estimated intensity of hospitalresources necessary to furnish care for each principal diagnosis. MS-DRG weights represent the averageresources for a given MS-DRG relative to the average resources for all MS-DRGs. MS-DRG payments areadjusted for area wage differentials. Hospitals, other than those defined as “new,” receive PPS reimbursement forinpatient capital costs based on MS-DRG weights multiplied by a geographically adjusted federal rate. When thecost to treat certain patients falls well outside the normal distribution, providers typically receive additional“outlier” payments.
MS-DRG rates are updated and MS-DRG weights are recalibrated using cost relative weights each federalfiscal year (which begins October 1). The index used to update the MS-DRG rates (the “market basket”) givesconsideration to the inflation experienced by hospitals and entities outside the health care industry in purchasinggoods and services. The Patient Protection and Affordable Care Act, as amended by the Health Care andEducation Reconciliation Act of 2010 (collectively, the “Health Reform Law”) provides for annual decreases tothe market basket, including the following reductions for each of the following federal fiscal years: 0.25% in2011, 0.1% in 2012 and 2013, 0.3% in 2014, 0.2% in 2015 and 2016 and 0.75% in 2017, 2018 and 2019. Forfederal fiscal year 2012 and each subsequent federal fiscal year, the Health Reform Law provides for the annualmarket basket update to be further reduced by a productivity adjustment. The amount of that reduction will be theprojected, nationwide productivity gains over the preceding 10 years. To determine the projection, theDepartment of Health and Human Services (“HHS”) will use the Bureau of Labor Statistics (“BLS”) 10-yearmoving average of changes in specified economy-wide productivity (the BLS data is typically a few years old).The Health Reform Law does not contain guidelines for use by HHS in projecting the productivity figure. CMSestimates that the combined market basket and productivity adjustments will reduce Medicare payments underthe inpatient PPS by $112.6 billion from 2010 to 2019. A decrease in payment rates or an increase in rates that isbelow the increase in our costs may adversely affect our results of operations.
CMS increased the MS-DRG rate for federal fiscal year 2011 by 2.35%, representing the full market basketof 2.6% minus the 0.25% reduction required by the Health Reform Law. CMS also applied a documentation andcoding adjustment of negative 2.9% in federal fiscal year 2011 to account for increases in aggregate paymentsduring implementation of the MS-DRG system, which resulted in an aggregate adjustment of negative 0.55% infederal fiscal year 2011. For federal fiscal year 2012, CMS issued a final rule that results in a net increase of1.0%. This increase reflects the 2.9% market basket increase, a prospective documentation and codingadjustment of negative 2.0%, a productivity adjustment of negative 1.0%, and a 1.1% increase in light of aJanuary 2011 court decision. In addition, CMS intends to make an additional negative 1.9% documentation andcoding adjustment in the future, but has not specified when the adjustment will be made.
Further realignments in the MS-DRG system could also reduce the payments we receive for certainspecialties, including cardiology and orthopedics. CMS has focused on payment levels for such specialties inrecent years in part because of the proliferation of specialty hospitals. Changes in the payments received forspecialty services could have an adverse effect on our results of operations.
The Medicare Prescription Drug, Improvement, and Modernization Act of 2003 (“MMA”) provides forhospitals to receive a 2% reduction to their market basket updates if they fail to submit data for patient carequality indicators to the Secretary of HHS. As required by the Deficit Reduction Act of 2005 (“DRA 2005”),CMS has expanded, through a series of rulemakings, the number of quality measures that must be reported toavoid the market basket reduction. In federal fiscal year 2012, CMS requires hospitals to report 55 qualitymeasures in order to avoid the market basket reduction for inpatient PPS payments in federal fiscal year 2013.All of our hospitals paid under the Medicare inpatient PPS are participating in the quality initiative by submittingthe requested quality data. While we will endeavor to comply with all data submission requirements as additionalrequirements continue to be added, our submissions may not be deemed timely or sufficient to entitle us to thefull market basket adjustment for all of our hospitals.
As part of CMS’ goal of transforming Medicare from a passive payer to an active purchaser of quality goodsand services, Medicare does not allow an inpatient hospital discharge to be assigned to a higher paying MS-DRG
7

if a selected hospital acquired condition (“HAC”) was not present on admission. In this situation, the case is paidas though the secondary diagnosis was not present. Currently, there are ten categories of conditions on the list ofHACs. In addition, CMS has established three National Coverage Determinations that prohibit Medicarereimbursement for erroneous surgical procedures performed on an inpatient or outpatient basis. The HealthReform Law provides for reduced payments based on a hospital’s HAC rates. Beginning in federal fiscal year2015, the 25% of hospitals with the worst national risk-adjusted HAC rates in the previous year will receive a 1%reduction in their total inpatient operating Medicare payments. In addition, effective July 1, 2011, the HealthReform Law prohibits the use of federal funds under the Medicaid program to reimburse providers for medicalservices provided to treat HACs.
The Health Reform Law also provides for reduced payments to hospitals based on readmission rates.Beginning in federal fiscal year 2013, inpatient payments will be reduced if a hospital experiences “excessive”readmissions within the 30-day time period from the date of discharge for heart attack, heart failure, pneumoniaor other conditions that may be designated by CMS. Hospitals with what CMS defines as excessive readmissionsfor these conditions will receive reduced payments for all inpatient discharges, not just discharges relating to theconditions subject to the excessive readmission standard. Each hospital’s performance will be publicly reportedby CMS. On August 1, 2011, CMS issued a final rule implementing portions of this program but indicated that itwill issue in future rulemakings additional policies with respect to excessive readmissions, including the specificpayment adjustment methodology.
The Health Reform Law additionally establishes a value-based purchasing program to further link paymentsto quality and efficiency. In federal fiscal year 2013, HHS is directed to implement a value-based purchasingprogram for inpatient hospital services. Beginning in federal fiscal year 2013, CMS will reduce the inpatient PPSpayment amount for all discharges by the following: 1% for 2013; 1.25% for 2014; 1.5% for 2015; 1.75% for2016; and 2% for 2017 and subsequent years. For each federal fiscal year, the total amount collected from thesereductions will be pooled and used to fund payments to reward hospitals that meet certain quality performancestandards established by HHS. The Health Reform Law provides HHS with considerable discretion over thevalue-based purchasing program. On April 29, 2011, CMS issued a final rule establishing the value-basedpurchasing program for hospital inpatient services. Under this final rule, CMS estimates it will distribute$850 million in federal fiscal year 2013 to hospitals based on their overall performance on a set of qualitymeasures that have been linked to improved clinical processes of care and patient satisfaction. For payments infederal fiscal year 2013, hospitals will be scored based on a weighted average of patient experience scores usingthe Hospital Consumer Assessment of Healthcare Providers and Systems survey and 12 clinical process-of-caremeasures. CMS will score each hospital based on achievement (relative to other hospitals) and improvementranges (relative to the hospital’s own past performance) for each applicable measure. Because the Health ReformLaw provides that the pool will be fully distributed, hospitals that meet or exceed the quality performancestandards will receive greater reimbursement under the value-based purchasing program than they would haveotherwise. Hospitals that do not achieve the necessary quality performance will receive reduced Medicareinpatient hospital payments. CMS will notify each hospital of the amount of its value-based incentive paymentfor fiscal year 2013 discharges on November 1, 2012.
Historically, the Medicare program has set aside 5.10% of Medicare inpatient payments to pay for outliercases. For federal fiscal year 2011, CMS established an outlier threshold of $23,075, and for federal fiscal year2012, CMS reduced the outlier threshold to $22,385. We do not anticipate that the decrease to the outlierthreshold for federal fiscal year 2012 will have a material impact on our results of operations.
Outpatient
CMS reimburses hospital outpatient services (and certain Medicare Part B services furnished to hospitalinpatients who have no Part A coverage) on a PPS basis. CMS uses fee schedules to pay for physical,occupational and speech therapies, durable medical equipment, clinical diagnostic laboratory services andnonimplantable orthotics and prosthetics, freestanding surgery center services and services provided byindependent diagnostic testing facilities.
8

Hospital outpatient services paid under PPS are classified into groups called ambulatory paymentclassifications (“APCs”). Services for each APC are similar clinically and in terms of the resources they require.A payment rate is established for each APC. Depending on the services provided, a hospital may be paid formore than one APC for a patient visit. The APC payment rates are updated for each calendar year. For calendaryear 2011, CMS increased APC payment rates by 2.35%, which represented a market basket update of 2.6% anda 0.25% reduction required by the Health Reform Law. The Health Reform Law also provides for the followingreductions to the market basket update for each of the following calendar years: 0.1% in 2012 and 2013, 0.3% in2014, 0.2% in 2015 and 2016 and 0.75% in 2017, 2018 and 2019. For calendar year 2012 and each subsequentcalendar year, the Health Reform Law provides for an annual market basket update to be further reduced by aproductivity adjustment. The amount of that reduction will be the projected, nationwide productivity gains overthe preceding 10 years. To determine the projection, HHS will use the BLS 10-year moving average of changesin specified economy-wide productivity (the BLS data is typically a few years old). The Health Reform Law doesnot contain guidelines for use by HHS in projecting the productivity figure. However, CMS estimates that thecombined market basket and productivity adjustments will reduce Medicare payments under the outpatient PPSby $26.3 billion from 2010 to 2019. CMS has issued a final rule that increases the APC payment rate for calendaryear 2012 by 1.9%, which includes the full market basket update of 3.0%, a negative 1.0% productivityadjustment and the negative 0.1% adjustment required by the Health Reform Law. CMS continues to requirehospitals to submit quality data relating to outpatient care to avoid receiving a 2% reduction to the market basketupdate under the outpatient PPS. CMS required hospitals to report data on 15 quality measures in calendar year2011 for the payment determination in calendar year 2012 and requires hospitals to report 23 quality measures incalendar year 2012 to avoid reduced payments in calendar year 2013.
Rehabilitation
CMS reimburses inpatient rehabilitation facilities (“IRFs”) on a PPS basis. Under the IRF PPS, patients areclassified into case mix groups based upon impairment, age, comorbidities (additional diseases or disorders fromwhich the patient suffers) and functional capability. IRFs are paid a predetermined amount per discharge thatreflects the patient’s case mix group and is adjusted for area wage levels, low-income patients, rural areas and high-cost outliers. For federal fiscal year 2011, CMS updated the market basket by 2.25%, which represented the fullmarket basket of 2.5% reduced by 0.25% as required by the Health Reform Law. The Health Reform Law alsoprovides for the following reductions to the market basket update for each of the following federal fiscal years:0.1% in 2012 and 2013, 0.3% in 2014, 0.2% in 2015 and 2016 and 0.75% in 2017, 2018 and 2019. For federal fiscalyear 2012 and each subsequent federal fiscal year, the Health Reform Law provides for the annual market basketupdate to be further reduced by a productivity adjustment. The amount of that reduction will be the projected,nationwide productivity gains over the preceding 10 years. To determine the projection, HHS will use the BLS 10-year moving average of changes in specified economy-wide productivity (the BLS data is typically a few years old).The Health Reform Law does not contain guidelines for use by HHS in projecting the productivity figure. However,CMS estimates that the combined market basket and productivity adjustments will reduce Medicare payments underthe IRF PPS by $5.7 billion from 2010 to 2019. For federal fiscal year 2012, CMS has issued a final rule updatinginpatient rehabilitation payment rates by 2.2%, which reflects a 2.9% market basket increase, a negative 1.0%productivity adjustment, a 0.1% reduction required by the Health Reform Law, and a 0.4% increase resulting froman update to the outlier threshold amount. Beginning in federal fiscal year 2014, IRFs will be required to reportquality measures to CMS or will receive a two percentage point reduction to the market basket update.
In order to qualify for classification as an IRF, at least 60% of a facility’s inpatients during the most recent12-month CMS-defined review period must have required intensive rehabilitation services for one or more of13 specified conditions. IRFs must also meet additional coverage criteria, including patient selection and carerequirements relating to pre-admission screenings, post-admission evaluations, ongoing coordination of care andinvolvement of rehabilitation physicians. A facility that fails to meet the 60% threshold or other criteria to beclassified as an IRF will be paid under the acute care hospital inpatient or outpatient PPS, which generallyprovide for lower payment amounts. As of December 31, 2011, we had one rehabilitation hospital and 42hospital rehabilitation units.
9

Psychiatric
Inpatient hospital services furnished in psychiatric hospitals and psychiatric units of general, acute carehospitals and critical access hospitals are reimbursed under a prospective payment system (the “IPF PPS”), a perdiem payment, with adjustments to account for certain patient and facility characteristics. The IPF PPS containsan “outlier” policy for extraordinarily costly cases and an adjustment to a facility’s base payment if it maintains afull-service emergency department. CMS has established the IPF PPS payment rate in a manner intended to bebudget neutral and historically has used a July 1 update cycle, with each twelve month period referred to as a“rate year.” However, CMS has issued a final rule that will transition the IPF PPS to a federal fiscal year updatecycle. Accordingly, the rates for 2012 will be effective from July 1, 2011 through September 30, 2012, withfuture updates coinciding with the federal fiscal year (from October 1 through September 30). The rehabilitation,psychiatric and long-term care (“RPL”) market basket update is used to update the IPF PPS. For rate year 2011,CMS updated the market basket by 2.15%, representing the full market basket of 2.4% reduced by 0.25% asrequired by the Health Reform Law. The Health Reform Law also provides for the following reductions to themarket basket update for payment years that begin in the following calendar years: 0.1% in 2012 and 2013, 0.3%in 2014, 0.2% in 2015 and 2016 and 0.75% in 2017, 2018 and 2019. For rate year 2012 and each subsequentpayment year, the Health Reform Law provides for the annual market basket update to be further reduced by aproductivity adjustment. The amount of that reduction will be the projected, nationwide productivity gains overthe preceding 10 years. To determine the projection, HHS will use the BLS 10-year moving average of changesin specified economy-wide productivity (the BLS data is typically a few years old). The Health Reform Law doesnot contain guidelines for use by HHS in projecting the productivity figure. However, CMS estimates that thecombined market basket and productivity adjustments will reduce Medicare payments under the IPF PPS by$4.3 billion from 2010 to 2019. For rate year 2012, which will span 15 months from July 1, 2011 throughSeptember 30, 2012, CMS increased inpatient psychiatric payment rates by 2.95%, which includes a marketbasket increase of 3.2% and a 0.25% reduction required by the Health Reform Law. As of December 31, 2011,we had five psychiatric hospitals and 36 hospital psychiatric units.
Ambulatory Surgery Centers
CMS reimburses ASCs using a predetermined fee schedule. Reimbursements for ASC overhead costs arelimited to no more than the overhead costs paid to hospital outpatient departments under the Medicare hospitaloutpatient PPS for the same procedure. If CMS determines that a procedure is commonly performed in aphysician’s office, the ASC reimbursement for that procedure is limited to the reimbursement allowable underthe Medicare Part B Physician Fee Schedule, with limited exceptions. All surgical procedures, other than thosethat pose a significant safety risk or generally require an overnight stay, are payable as ASC procedures. Fromtime to time, CMS considers expanding the services that may be performed in ASCs, which may result in moreMedicare procedures that historically have been performed in hospitals being moved to ASCs, reducing surgicalvolume in our hospitals. Also, more Medicare procedures that historically have been performed in ASCs may bemoved to physicians’ offices. Commercial third-party payers may adopt similar policies. For federal fiscal year2011 and each subsequent federal fiscal year, the Health Reform Law provides for the annual market basketupdate to be reduced by a productivity adjustment. The amount of that reduction will be the projected nationwideproductivity gains over the preceding 10 years. To determine the projection, HHS will use the BLS 10-yearmoving average of changes in specified economy-wide productivity (the BLS data is typically a few years old).The Health Reform Law also required HHS to submit a report to Congress on plans for developing a value-basedpurchasing program for ASCs. In its report, HHS recommends a phased-in approach for implementing a value-based purchasing program but states additional statutory authority would be required to allow performance-basedpayments. CMS issued a final rule on November 1, 2011 that provides for a 1.6% annual update to ASCpayments for calendar year 2012, which includes the market basket update of 2.7% and a negative 1.1%productivity adjustment. The final rule also establishes a quality reporting program for ASCs under which ASCsthat fail to report on five quality measures beginning on October 1, 2012 will receive a 2% reduction inreimbursement for calendar year 2014.
10

Physician Services
Physician services are reimbursed under the physician fee schedule (“PFS”) system, under which CMS hasassigned a national relative value unit (“RVU”) to most medical procedures and services that reflects the variousresources required by a physician to provide the services relative to all other services. Each RVU is calculatedbased on a combination of work required in terms of time and intensity of effort for the service, practice expense(overhead) attributable to the service and malpractice insurance expense attributable to the service. These threeelements are each modified by a geographic adjustment factor to account for local practice costs and are thenaggregated. The aggregated amount is multiplied by a conversion factor that accounts for inflation and targetedgrowth in Medicare expenditures (as calculated by the sustainable growth rate (“SGR”)) to arrive at the paymentamount for each service. While RVUs for various services may change in a given year, any alterations arerequired by statute to be virtually budget neutral, such that total payments made under the PFS may not differ bymore than $20 million from what payments would have been if adjustments were not made.
The PFS rates are adjusted each year, and reductions in both current and future payments are anticipated.The SGR formula, if implemented as mandated by statute, would result in significant reductions to paymentsunder the PFS. Since 2003, the U.S. Congress has passed multiple legislative acts delaying application of theSGR to the PFS. The most recent legislative delay extends calendar year 2011 payment rates throughDecember 31, 2012. We cannot predict whether the U.S. Congress will intervene to prevent this reduction topayments in the future. Barring delay or repeal of the SGR by Congress, Medicare payments to physicians arescheduled to be cut by more than 30% effective January 1, 2013.
Other
Under PPS, the payment rates are adjusted for the area differences in wage levels by a factor (“wage index”)reflecting the relative wage level in the geographic area compared to the national average wage level. Beginningin federal fiscal year 2007, CMS adjusted 100% of the wage index factor for occupational mix. The redistributiveimpact of wage index changes, while slightly negative in the aggregate, is not anticipated to have a materialfinancial impact for 2012. However, the Health Reform Law requires HHS to provide Congress withrecommendations on how to comprehensively reform the Medicare wage index system.
Medicare reimburses hospitals for a portion of bad debts resulting from deductible and coinsurance amountsthat are uncollectible from Medicare beneficiaries. The Middle Class Tax Relief and Jobs Creation Act of 2012(the “Jobs Creation Act”) reduces the percentage of bad debt amounts that Medicare reimburses from 70% to65% beginning in federal fiscal year 2013. These reductions are intended to offset, in part, the impact of the mostrecent legislative delay of the SGR reductions in physician compensation under the PFS. The U.S. Congress hasnot permanently addressed the SGR reductions, and any further delays or revisions to the SGR may be offset byadditional reductions in Medicare payments to other types of providers.
As required by the MMA, CMS is implementing contractor reform whereby CMS has competitively bid theMedicare fiscal intermediary and Medicare carrier functions to 15 Medicare Administrative Contractors(“MACs”), which are geographically assigned and service both Part A and Part B providers within a givenjurisdiction. Although CMS has awarded initial contracts to all 15 MAC jurisdictions, full transition to the MACjurisdictions has been delayed due to CMS resoliciting some bids and implementing other corrective actions inresponse to filed protests. While chain providers had the option of having all hospitals use one home officeMAC, HCA chose to use the MACs assigned to the geographic areas in which our hospitals are located. Theindividual MAC jurisdictions are in varying phases of transition. During the transition periods and for apotentially unforeseen period thereafter, all of these changes could impact claims processing functions and theresulting cash flow; however, we are unable to predict the impact at this time.
Under the Recovery Audit Contractor (“RAC”) program, CMS contracts with RACs on a contingency basisto conduct post-payment reviews to detect and correct improper payments in the fee-for-service Medicareprogram. CMS has implemented the RAC program on a permanent, nationwide basis as required by statute.
11

Managed Medicare
Managed Medicare plans relate to situations where a private company contracts with CMS to providemembers with Medicare Part A, Part B and Part D benefits. Managed Medicare plans can be structured as HMOs,PPOs or private fee-for-service plans. The Medicare program allows beneficiaries to choose enrollment in certainmanaged Medicare plans. In 2003, MMA increased reimbursement to managed Medicare plans and expandedMedicare beneficiaries’ health care options. Since 2003, the number of beneficiaries choosing to receive theirMedicare benefits through such plans has increased. However, the Medicare Improvements for Patients andProviders Act of 2008 imposed new restrictions and implemented focused cuts to certain managed Medicareplans. In addition, the Health Reform Law reduces, over a three year period starting in 2012, premium paymentsto managed Medicare plans such that CMS’ managed care per capita premium payments are, on average, equal totraditional Medicare. The Health Reform Law also implements fee payment adjustments based on servicebenchmarks and quality ratings. The Congressional Budget Office (“CBO”) has estimated that, as a result ofthese changes, payments to plans will be reduced by $138 billion between 2010 and 2019, while CMS hasestimated the reduction to be $145 billion. In addition, the Health Reform Law expands the RAC program toinclude managed Medicare plans. In light of the current economic downturn and the Health Reform Law,managed Medicare plans may experience reduced premium payments, which may lead to decreased enrollmentin such plans.
Medicaid
Medicaid programs are funded jointly by the federal government and the states and are administered bystates under approved plans. Most state Medicaid program payments are made under a PPS or are based onnegotiated payment levels with individual hospitals. Medicaid reimbursement is often less than a hospital’s costof services. The Health Reform Law requires states to expand Medicaid coverage to all individuals under age 65with incomes up to 133% of the federal poverty level (“FPL”) by 2014. However, the Health Reform Law alsorequires states to apply a “5% income disregard” to the Medicaid eligibility standard, so that Medicaid eligibilitywill effectively be extended to those with incomes up to 138% of the FPL. In addition, effective July 1, 2011, theHealth Reform Law prohibits the use of federal funds under the Medicaid program to reimburse providers formedical assistance provided to treat HACs. However, CMS has delayed enforcement of this prohibition until July1, 2012. In a final rule issued June 1, 2011, CMS authorizes states to add additional provider-preventableconditions to the list of HACs for which Medicaid reimbursement will not be allowed.
Since most states must operate with balanced budgets and since the Medicaid program is often the state’slargest program, states can be expected to adopt or consider adopting legislation designed to reduce theirMedicaid expenditures. The current economic downturn has increased the budgetary pressures on most states,and these budgetary pressures have resulted and likely will continue to result in decreased spending, or decreasedspending growth, for Medicaid programs in many states. The American Recovery and Reinvestment Act of 2009(“ARRA”) allocated approximately $87.0 billion to temporarily increase the share of program costs paid by thefederal government to fund each state’s Medicaid program. Although initially scheduled to expire at the end of2010, Congress allocated additional funds to extend this increased federal funding to states through June 2011.Although these increased funds provided a benefit to state Medicaid programs by temporarily helping to avoidmore extensive program and reimbursement cuts, the expiration of the increased federal funding could result insignificant reductions to state Medicaid programs.
Certain states in which we operate have adopted broad-based provider taxes to fund the non-federal share ofMedicaid programs. Many states have also adopted, or are considering, legislation designed to reduce coverage,enroll Medicaid recipients in managed care programs and/or impose additional taxes on hospitals to help financeor expand the states’ Medicaid systems. Effective March 23, 2010, the Health Reform Law requires states to atleast maintain Medicaid eligibility standards established prior to the enactment of the law for adults untilJanuary 1, 2014 and for children until October 1, 2019. However, states with budget deficits may seek a waiverfrom this requirement to address eligibility standards that apply to adults making more than 133% of the FPL.
12

Through DRA 2005, Congress has expanded the federal government’s involvement in fighting fraud, wasteand abuse in the Medicaid program by creating the Medicaid Integrity Program. Among other things, DRA 2005requires CMS to employ private contractors, referred to as Medicaid Integrity Contractors (“MICs”), to performpost-payment audits of Medicaid claims and identify overpayments. MICs are assigned to five geographicregions and have commenced audits in states assigned to those regions. The Health Reform Law increases federalfunding for the MIC program for federal fiscal year 2011 and later years. In addition to MICs, several othercontractors and state Medicaid agencies have increased their review activities. The Health Reform Law expandsthe RAC program’s scope to include Medicaid claims.
Managed Medicaid
Managed Medicaid programs enable states to contract with one or more entities for patient enrollment, caremanagement and claims adjudication. The states usually do not relinquish program responsibilities for financing,eligibility criteria and core benefit plan design. We generally contract directly with one of the designated entities,usually a managed care organization. The provisions of these programs are state-specific.
Enrollment in managed Medicaid plans has increased in recent years, as state governments seek to controlthe cost of Medicaid programs. However, general economic conditions in the states in which we operate mayrequire reductions in premium payments to these plans and may reduce enrollment in these plans.
Accountable Care Organizations and Bundled Payment Initiatives
The Health Reform Law requires HHS to establish a Medicare Shared Savings Program (“MSSP”) thatpromotes accountability and coordination of care through the creation of Accountable Care Organizations(“ACOs”), beginning no later than January 1, 2012. The program will allow certain providers and suppliers(including hospitals, physicians and other designated professionals) to voluntarily form ACOs and work togetheralong with other ACO participants to invest in infrastructure and redesign delivery processes to achieve highquality and efficient delivery of services. The program is intended to produce savings as a result of improvedquality and operational efficiency. ACOs that achieve quality performance standards established by HHS will beeligible to share in a portion of the amounts saved by the Medicare program. HHS has significant discretion todetermine key elements of the program. In 2011, CMS, the HHS Office of Inspector General (the “OIG”) andcertain other federal agencies released a series of rules and guidance further defining and implementing the ACOprogram. These rules and guidance provide for two different ACO tracks, the first of which allows ACOs toshare only in the savings under the MSSP. The second track requires ACOs to share in any savings or lossesunder the MSSP but offers ACOs a greater share of any savings realized under the MSSP. As authorized by theHealth Reform Law, the rules and guidance also provide for certain waivers from fraud and abuse laws forACOs. In addition, beginning January 1, 2012, CMS has authorized 32 organizations to participate in the“Pioneer” ACO program, which is similar to, but separate from, the ACOs created under the MSSP regulations.
The Health Reform Law created the Center for Medicare and Medicaid Innovation with responsibility forestablishing demonstration projects and other initiatives in order to identify, develop, test and encourage theadoption of new methods of delivering and paying for healthcare that create savings under the Medicare andMedicaid programs while improving quality of care. For example, the Center for Medicare and MedicaidInnovation has announced a voluntary bundled payment initiative that will link payments to participatingproviders for services provided during an episode of care. In addition, the Health Reform Law requires HHS toestablish a five-year, voluntary national bundled payment pilot program for Medicare services beginning no laterthan January 1, 2013. Under the program, providers would agree to receive one payment for services provided toMedicare patients for certain medical conditions or episodes of care. In addition, the Health Reform Lawprovides for a five-year bundled payment pilot program for Medicaid services. HHS may select up to eight statesto participate, and these state programs may target particular categories of beneficiaries, selected diagnoses orgeographic regions of the state. The selected state programs will provide one payment for both hospital andphysician services provided to Medicaid patients for certain episodes of inpatient care.
13

Disproportionate Share Hospital Payments
In addition to making payments for services provided directly to beneficiaries, Medicare makes additionalpayments to hospitals that treat a disproportionately large number of low-income patients (Medicaid andMedicare patients eligible to receive Supplemental Security Income). Disproportionate share hospital (“DSH”)payments are determined annually based on certain statistical information required by HHS and are calculated asa percentage addition to MS-DRG payments.
Under the Health Reform Law, beginning in federal fiscal year 2014, Medicare DSH payments will bereduced to 25% of the amount they otherwise would have been absent the law. The remaining 75% of the amountthat would otherwise be paid under Medicare DSH will be effectively pooled, and this pool will be reducedfurther each year by a formula that reflects reductions in the national level of uninsured who are under 65 yearsof age. Each DSH hospital will then be paid, out of the reduced DSH payment pool, an amount allocated basedupon its level of uncompensated care. It is difficult to predict the full impact of the Medicare DSH reductions.The CBO estimates $22 billion in reductions to Medicare DSH payments between 2010 and 2019, while for thesame time period, CMS estimates reimbursement reductions totaling $50 billion.
Hospitals that provide care to a disproportionately high number of low-income patients may receiveMedicaid DSH payments. The federal government distributes federal Medicaid DSH funds to each state based ona statutory formula. The states then distribute the DSH funding among qualifying hospitals. States have broaddiscretion to define which hospitals qualify for Medicaid DSH payments and the amount of such payments. TheHealth Reform Law will reduce funding for the Medicaid DSH hospital program in federal fiscal years 2014through 2020 by the following amounts: 2014 ($500 million); 2015 ($600 million); 2016 ($600 million); 2017($1.8 billion); 2018 ($5 billion); 2019 ($5.6 billion); and 2020 ($4 billion). In addition, the Jobs Creation Actprovides for an additional Medicaid DSH reduction of $4.1 billion in federal fiscal year 2021. How such cuts areallocated among the states and how the states allocate these cuts among providers, have yet to be determined.
TRICARE
TRICARE is the Department of Defense’s health care program for members of the armed forces. Forinpatient services, TRICARE reimburses hospitals based on a DRG system modeled on the Medicare inpatientPPS. The Department of Defense has also implemented a PPS for hospital outpatient services furnished toTRICARE beneficiaries similar to that utilized for services furnished to Medicare beneficiaries. Because theMedicare outpatient PPS APC rates have historically been below TRICARE rates, the adoption of this paymentmethodology for TRICARE beneficiaries has reduced our reimbursement; however, TRICARE outpatientservices do not represent a significant portion of our patient volumes.
Annual Cost Reports
All hospitals participating in the Medicare, Medicaid and TRICARE programs, whether paid on areasonable cost basis or under a PPS, are required to meet certain financial reporting requirements. Federal and,where applicable, state regulations require the submission of annual cost reports covering the revenues, costs andexpenses associated with the services provided by each hospital to Medicare beneficiaries and Medicaidrecipients.
Annual cost reports required under the Medicare and Medicaid programs are subject to routine audits, whichmay result in adjustments to the amounts ultimately determined to be due to us under these reimbursementprograms. These audits often require several years to reach the final determination of amounts due to or from usunder these programs. Providers also have rights of appeal, and it is common to contest issues raised in audits ofcost reports.
14

Managed Care and Other Discounted Plans
Most of our hospitals offer discounts from established charges to certain large group purchasers of healthcare services, including managed care plans and private insurance companies. Admissions reimbursed bycommercial managed care and other insurers were 31%, 32%, and 34% of our total admissions for the yearsended December 31, 2011, 2010 and 2009, respectively. Managed care contracts are typically negotiated forterms between one and three years. While we generally received contracted annual average increases that wereexpected to yield 5% to 6% from managed care payers during 2011, there can be no assurance that we willcontinue to receive increases in the future. It is not clear what impact, if any, the increased obligations onmanaged care payers and other health plans imposed by the Health Reform Law will have on our ability tonegotiate reimbursement increases.
Uninsured and Self-Pay Patients
A high percentage of our uninsured patients are initially admitted through our emergency rooms. For theyear ended December 31, 2011, approximately 82% of our admissions of uninsured patients occurred through ouremergency rooms. The Emergency Medical Treatment and Labor Act (“EMTALA”) requires any hospital thatparticipates in the Medicare program to conduct an appropriate medical screening examination of every personwho presents to the hospital’s emergency room for treatment and, if the individual is suffering from anemergency medical condition, to either stabilize that condition or make an appropriate transfer of the individualto a facility that can handle the condition. The obligation to screen and stabilize emergency medical conditionsexists regardless of an individual’s ability to pay for treatment. The Health Reform Law requires health plans toreimburse hospitals for emergency services provided to enrollees without prior authorization and without regardto whether a participating provider contract is in place. Further, as enacted, the Health Reform Law containsprovisions that seek to decrease the number of uninsured individuals, including requirements and incentives,which do not become effective until 2014, for individuals to obtain, and large employers to provide, insurancecoverage. These mandates may reduce the financial impact of screening for and stabilizing emergency medicalconditions. However, many factors are unknown regarding the impact of the Health Reform Law, including howmany previously uninsured individuals will obtain coverage as a result of the law or the change, if any, in thevolume of inpatient and outpatient hospital services that are sought by and provided to previously uninsuredindividuals and the payer mix. In addition, it is difficult to predict the full impact of the Health Reform Law dueto the law’s complexity, lack of implementing regulations or interpretive guidance, gradual and potentiallydelayed implementation, pending court challenges and possible amendment or repeal.
Electronic Health Record Incentives
ARRA provides for Medicare and Medicaid incentive payments beginning in federal fiscal year 2011 foreligible hospitals and calendar year 2011 for eligible professionals that adopt and meaningfully use certifiedelectronic health record (“EHR”) technology. A total of at least $20 billion in incentives is being made availablethrough the Medicare and Medicaid EHR incentive programs to eligible hospitals and eligible professionals inthe adoption of EHRs.
Under the Medicare incentive program, eligible hospitals that demonstrate meaningful use will receiveincentive payments for up to four fiscal years. The Medicare incentive payment amount is the product of threefactors: (1) an initial amount comprised of a base amount of $2,000,000, plus $200 for each acute care inpatientdischarge, beginning with a hospital’s 1,150th discharge of the applicable year and ending with a hospital’s23,000th discharge of the applicable year; (2) the “Medicare share,” which is the sum of Medicare Part A andPart C acute care inpatient-bed-days divided by the product of the total acute care inpatient-bed-days and acharity care factor; and (3) a transition factor applicable to the payment year. In order to maximize their incentivepayments, acute care hospitals must participate in the incentive program by federal fiscal year 2013. Beginning infederal fiscal year 2015, acute care hospitals that fail to demonstrate meaningful use of certified EHR technologywill receive reduced market basket updates under inpatient PPS.
15

Eligible professionals who demonstrate meaningful use are entitled to incentive payments for up to fivepayment years in an amount equal to 75% of their estimated Medicare allowed charges for covered professionalservices furnished during the relevant calendar year, subject to an annual limit. Eligible professionals mustparticipate in the incentive payment program by calendar year 2012 in order to maximize their incentivepayments and must participate by calendar year 2014 in order to receive any incentive payments. Beginning incalendar year 2015, eligible professionals who do not demonstrate meaningful use of certified EHR technologywill face Medicare payment reductions.
The Medicaid EHR incentive program is voluntary for states to implement. For participating states, theMedicaid EHR incentive program will provide incentive payments for acute care hospitals and eligibleprofessionals that meet certain volume percentages of Medicaid patients, as well as children’s hospitals.Providers may only participate in a single state’s Medicaid EHR incentive program. Eligible professionals canonly participate in either the Medicaid incentive program or the Medicare incentive program and can change thiselection only one time. Eligible hospitals may participate in both the Medicare and Medicaid incentive programs.
To qualify for incentive payments under the Medicaid program, providers must either adopt, implement,upgrade or demonstrate meaningful use of, certified EHR technology during their first participation year orsuccessfully demonstrate meaningful use of certified EHR technology in subsequent participation years.Payments may be received for up to six participation years. For hospitals, the aggregate Medicaid EHR incentiveamount is the product of two factors: (1) the overall EHR amount which is comprised of a base amount of$2,000,000 plus a discharge-related amount, multiplied by the Medicare share (which is set at one by statute)multiplied by a transition factor, and (2) the “Medicaid share,” which is the estimated Medicaid inpatient-beddays plus estimated Medicaid managed care inpatient bed-days, divided by the product of the estimated totalinpatient bed-days and a charity care factor. Under the Medicaid incentive program, eligible professionals mayreceive payments based on their EHR costs, up to total amount of $63,750, or for pediatricians, $42,500. There isno penalty for hospitals or professionals under Medicaid for failing to meet EHR meaningful use requirements.
Hospital Utilization
We believe the most important factors relating to the overall utilization of a hospital are the quality andmarket position of the hospital and the number and quality of physicians and other health care professionalsproviding patient care within the facility. Generally, we believe the ability of a hospital to be a market leader isdetermined by its breadth of services, level of technology, quality and condition of the facilities, emphasis onquality of care and convenience for patients and physicians. Other factors that impact utilization include thegrowth in local population, local economic conditions and market penetration of managed care programs.
16

The following table sets forth certain operating statistics for our health care facilities. Health care facilityoperations are subject to certain seasonal fluctuations, including decreases in patient utilization during holidayperiods and increases in the cold weather months. The data set forth in this table includes only those facilities thatare consolidated for financial reporting purposes.
Years Ended December 31,
2011 2010 2009 2008 2007
Number of hospitals at end of period(a) . . . . . . . . . 163 156 155 158 161Number of freestanding outpatient surgery centersat end of period(b) . . . . . . . . . . . . . . . . . . . . . . . . 108 97 97 97 99
Number of licensed beds at end of period(c) . . . . . 41,594 38,827 38,839 38,504 38,405Weighted average licensed beds(d) . . . . . . . . . . . . . 39,735 38,655 38,825 38,422 39,065Admissions(e) . . . . . . . . . . . . . . . . . . . . . . . . . . . . . 1,620,400 1,554,400 1,556,500 1,541,800 1,552,700Equivalent admissions(f) . . . . . . . . . . . . . . . . . . . . . 2,595,900 2,468,400 2,439,000 2,363,600 2,352,400Average length of stay (days)(g) . . . . . . . . . . . . . . . 4.8 4.8 4.8 4.9 4.9Average daily census(h) . . . . . . . . . . . . . . . . . . . . . 21,123 20,523 20,650 20,795 21,049Occupancy rate(i) . . . . . . . . . . . . . . . . . . . . . . . . . . 53% 53% 53% 54% 54%Emergency room visits(j) . . . . . . . . . . . . . . . . . . . . 6,143,500 5,706,200 5,593,500 5,246,400 5,116,100Outpatient surgeries(k) . . . . . . . . . . . . . . . . . . . . . . 799,200 783,600 794,600 797,400 804,900Inpatient surgeries(l) . . . . . . . . . . . . . . . . . . . . . . . . 484,500 487,100 494,500 493,100 516,500
(a) Excludes eight facilities in 2010, 2009, 2008 and 2007 that were not consolidated (accounted for using theequity method) for financial reporting purposes.
(b) Excludes one facility in 2011, nine facilities in 2010 and 2007 and eight facilities in 2009 and 2008 thatwere not consolidated (accounted for using the equity method) for financial reporting purposes.
(c) Licensed beds are those beds for which a facility has been granted approval to operate from the applicablestate licensing agency.
(d) Represents the average number of licensed beds, weighted based on periods owned.
(e) Represents the total number of patients admitted to our hospitals and is used by management and certaininvestors as a general measure of inpatient volume.
(f) Equivalent admissions are used by management and certain investors as a general measure of combinedinpatient and outpatient volume. Equivalent admissions are computed by multiplying admissions (inpatientvolume) by the sum of gross inpatient revenue and gross outpatient revenue and then dividing the resultingamount by gross inpatient revenue. The equivalent admissions computation “equates” outpatient revenue tothe volume measure (admissions) used to measure inpatient volume, resulting in a general measure ofcombined inpatient and outpatient volume.
(g) Represents the average number of days admitted patients stay in our hospitals.
(h) Represents the average number of patients in our hospital beds each day.
(i) Represents the percentage of hospital licensed beds occupied by patients. Both average daily census andoccupancy rate provide measures of the utilization of inpatient rooms.
(j) Represents the number of patients treated in our emergency rooms.
(k) Represents the number of surgeries performed on patients who were not admitted to our hospitals. Painmanagement and endoscopy procedures are not included in outpatient surgeries.
(l) Represents the number of surgeries performed on patients who have been admitted to our hospitals. Painmanagement and endoscopy procedures are not included in inpatient surgeries.
17

Competition
Generally, other hospitals in the local communities served by most of our hospitals provide services similarto those offered by our hospitals. Additionally, in recent years the number of freestanding ASCs and diagnosticcenters (including facilities owned by physicians) in the geographic areas in which we operate has increasedsignificantly. As a result, most of our hospitals operate in a highly competitive environment. In some cases,competing hospitals are more established than our hospitals. Some competing hospitals are owned bytax-supported government agencies and many others are owned by not-for-profit entities that may be supportedby endowments, charitable contributions and/or tax revenues and are exempt from sales, property and incometaxes. Such exemptions and support are not available to our hospitals and may provide the tax supported or not-for-profit entities an advantage in funding capital expenditures. In certain localities there are large teachinghospitals that provide highly specialized facilities, equipment and services which may not be available at most ofour hospitals. We also face competition from specialty hospitals, some of which are physician-owned, and fromboth our own and unaffiliated freestanding ASCs for market share in certain high margin services.
Psychiatric hospitals frequently attract patients from areas outside their immediate locale and, therefore, ourpsychiatric hospitals compete with both local and regional hospitals, including the psychiatric units of general,acute care hospitals.
Our strategies are designed to ensure our hospitals are competitive. We believe our hospitals compete withinlocal communities on the basis of many factors, including the quality of care, ability to attract and retain qualityphysicians, skilled clinical personnel and other health care professionals, location, breadth of services,technology offered, quality and condition of the facilities and prices charged. The Health Reform Law requireshospitals to publish annually a list of their standard charges for items and services. We have increased our focuson operating outpatient services with improved accessibility and more convenient service for patients, andincreased predictability and efficiency for physicians.
Two of the most significant factors to the competitive position of a hospital are the number and quality ofphysicians affiliated with or employed by the hospital. Although physicians may at any time terminate theirrelationship with a hospital we operate, our hospitals seek to retain physicians with varied specialties on thehospitals’ medical staffs and to attract other qualified physicians. We believe physicians refer patients to ahospital on the basis of the quality and scope of services it renders to patients and physicians, the quality ofphysicians on the medical staff, the location of the hospital and the quality of the hospital’s facilities, equipmentand employees. Accordingly, we strive to maintain and provide quality facilities, equipment, employees andservices for physicians and patients.
Another major factor in the competitive position of a hospital is our ability to negotiate service contractswith purchasers of group health care services. Managed care plans attempt to direct and control the use ofhospital services and obtain discounts from hospitals’ established gross charges. In addition, employers andtraditional health insurers continue to attempt to contain costs through negotiations with hospitals for managedcare programs and discounts from established gross charges. Generally, hospitals compete for service contractswith group health care services purchasers on the basis of price, market reputation, geographic location, qualityand range of services, quality of the medical staff and convenience. Our future success will depend, in part, onour ability to retain and renew our managed care contracts and enter into new managed care contracts onfavorable terms. Other health care providers may impact our ability to enter into managed care contracts ornegotiate increases in our reimbursement and other favorable terms and conditions. For example, some of ourcompetitors may negotiate exclusivity provisions with managed care plans or otherwise restrict the ability ofmanaged care companies to contract with us. The trend toward consolidation among non-government payerstends to increase their bargaining power over fee structures. In addition, as various provisions of the HealthReform Law are implemented, including the establishment of American Health Benefit Exchanges(“Exchanges”) and limitations on rescissions of coverage and pre-existing condition exclusions, non-governmentpayers may increasingly demand reduced fees or be unwilling to negotiate reimbursement increases. The
18

importance of obtaining contracts with managed care organizations varies from community to community,depending on the market strength of such organizations.
State certificate of need (“CON”) laws, which place limitations on a hospital’s ability to expand hospitalservices and facilities, make capital expenditures and otherwise make changes in operations, may also have theeffect of restricting competition. We currently operate health care facilities in a number of states with CON laws.Before issuing a CON, these states consider the need for additional or expanded health care facilities or services.In those states which have no CON laws or which set relatively high levels of expenditures before they becomereviewable by state authorities, competition in the form of new services, facilities and capital spending is moreprevalent. See Item 1, “Business — Regulation and Other Factors.”
We and the health care industry as a whole face the challenge of continuing to provide quality patient carewhile dealing with rising costs and strong competition for patients. Changes in medical technology, existing andfuture legislation, regulations and interpretations and managed care contracting for provider services by privateand government payers remain ongoing challenges.
Admissions, average lengths of stay and reimbursement amounts continue to be negatively affected bypayer-required pre-admission authorization, utilization review and payer pressure to maximize outpatient andalternative health care delivery services for less acutely ill patients. The Health Reform Law potentially expandsthe use of prepayment review by Medicare contractors by eliminating statutory restrictions on their use.Increased competition, admission constraints and payer pressures are expected to continue. To meet thesechallenges, we intend to expand and update our facilities or acquire or construct new facilities where appropriate,to enhance the provision of a comprehensive array of outpatient services, offer market competitive pricing toprivate payer groups, upgrade facilities and equipment and offer new or expanded programs and services.
Regulation and Other Factors
Licensure, Certification and Accreditation
Health care facility construction and operation are subject to numerous federal, state and local regulationsrelating to the adequacy of medical care, equipment, personnel, operating policies and procedures, maintenanceof adequate records, fire prevention, rate-setting and compliance with building codes and environmentalprotection laws. Facilities are subject to periodic inspection by governmental and other authorities to assurecontinued compliance with the various standards necessary for licensing and accreditation. We believe our healthcare facilities are properly licensed under applicable state laws. Each of our acute care hospitals is certified forparticipation in the Medicare and Medicaid programs and is accredited by The Joint Commission. If any facilitywere to lose its Medicare or Medicaid certification, the facility would be unable to receive reimbursement fromfederal health care programs. If any facility were to lose accreditation by The Joint Commission, the facilitywould be subject to state surveys, potentially be subject to increased scrutiny by CMS and likely lose paymentfrom non-government payers. Management believes our facilities are in substantial compliance with currentapplicable federal, state, local and independent review body regulations and standards. The requirements forlicensure, certification and accreditation are subject to change and, in order to remain qualified, it may becomenecessary for us to make changes in our facilities, equipment, personnel and services. The requirements forlicensure, certification and accreditation also include notification or approval in the event of the transfer orchange of ownership or certain other changes. Failure to provide required notifications or obtain necessaryapprovals in these circumstances can result in the inability to complete an acquisition or change of ownership,loss of licensure or other penalties.
Certificates of Need
In some states where we operate hospitals and other health care facilities, the construction or expansion ofhealth care facilities, the acquisition of existing facilities, the transfer or change of ownership and the addition of
19

new beds or services may be subject to review by and prior approval of, or notifications to, state regulatoryagencies under a CON program. Such laws generally require the reviewing state agency to determine the publicneed for additional or expanded health care facilities and services. Failure to provide required notifications orobtain necessary state approvals can result in the inability to expand facilities, complete an acquisition or changeownership or other penalties.
State Rate Review
Some states have adopted legislation mandating rate or budget review for hospitals or have adopted taxes onhospital revenues, assessments or licensure fees to fund indigent health care within the state. In the aggregate,indigent tax provisions have not materially, adversely affected our results of operations. Although we do notcurrently operate facilities in states that mandate rate or budget reviews, we cannot predict whether we willoperate in such states in the future, or whether the states in which we currently operate may adopt legislationmandating such reviews.
Federal Health Care Program Regulations
Participation in any federal health care program, including the Medicare and Medicaid programs, is heavilyregulated by statute and regulation. If a hospital fails to substantially comply with the numerous conditions ofparticipation in the Medicare and Medicaid programs or performs certain prohibited acts, the hospital’sparticipation in the federal health care programs may be terminated, or civil and/or criminal penalties may beimposed.
Anti-kickback Statute
A section of the Social Security Act known as the “Anti-kickback Statute” prohibits providers and othersfrom directly or indirectly soliciting, receiving, offering or paying any remuneration with the intent of generatingreferrals or orders for services or items covered by a federal health care program. Courts have interpreted thisstatute broadly and held that there is a violation of the Anti-kickback Statute if just one purpose of theremuneration is to generate referrals, even if there are other lawful purposes. Furthermore, the Health ReformLaw provides that knowledge of the law or the intent to violate the law is not required. Violations of the Anti-kickback Statute may be punished by a criminal fine of up to $25,000 for each violation or imprisonment, civilmoney penalties of up to $50,000 per violation and damages of up to three times the total amount of theremuneration and/or exclusion from participation in federal health care programs, including Medicare andMedicaid. The Health Reform Law provides that submission of a claim for services or items generated inviolation of the Anti-kickback Statute constitutes a false or fraudulent claim and may be subject to additionalpenalties under the federal False Claims Act (“FCA”).
The OIG, among other regulatory agencies, is responsible for identifying and eliminating fraud, abuse andwaste. The OIG carries out this mission through a nationwide program of audits, investigations and inspections.The OIG provides guidance to the industry through various methods including advisory opinions and “SpecialFraud Alerts.” These Special Fraud Alerts do not have the force of law, but identify features of arrangements ortransactions that the government believes may cause the arrangements or transactions to violate the Anti-kickback Statute or other federal health care laws. The OIG has identified several incentive arrangements thatconstitute suspect practices, including: (a) payment of any incentive by a hospital each time a physician refers apatient to the hospital, (b) the use of free or significantly discounted office space or equipment in facilitiesusually located close to the hospital, (c) provision of free or significantly discounted billing, nursing or other staffservices, (d) free training for a physician’s office staff in areas such as management techniques and laboratorytechniques, (e) guarantees which provide, if the physician’s income fails to reach a predetermined level, thehospital will pay any portion of the remainder, (f) low-interest or interest-free loans, or loans which may beforgiven if a physician refers patients to the hospital, (g) payment of the costs of a physician’s travel andexpenses for conferences, (h) coverage on the hospital’s group health insurance plans at an inappropriately lowcost to the physician, (i) payment for services (which may include consultations at the hospital) which requirefew, if any, substantive duties by the physician, (j) purchasing goods or services from physicians at prices in
20

excess of their fair market value, and (k) rental of space in physician offices, at other than fair market valueterms, by persons or entities to which physicians refer. The OIG has encouraged persons having informationabout hospitals who offer the above types of incentives to physicians to report such information to the OIG.
The OIG also issues Special Advisory Bulletins as a means of providing guidance to health care providers.These bulletins, along with the Special Fraud Alerts, have focused on certain arrangements that could be subjectto heightened scrutiny by government enforcement authorities, including: (a) contractual joint venturearrangements and other joint venture arrangements between those in a position to refer business, such asphysicians, and those providing items or services for which Medicare or Medicaid pays, and (b) certain“gainsharing” arrangements, i.e., the practice of giving physicians a share of any reduction in a hospital’s costsfor patient care attributable in part to the physician’s efforts.
In addition to issuing Special Fraud Alerts and Special Advisory Bulletins, the OIG issues complianceprogram guidance for certain types of health care providers. The OIG guidance identifies a number of risk areasunder federal fraud and abuse statutes and regulations. These areas of risk include compensation arrangementswith physicians, recruitment arrangements with physicians and joint venture relationships with physicians.
As authorized by Congress, the OIG has published safe harbor regulations that outline categories ofactivities deemed protected from prosecution under the Anti-kickback Statute. Currently, there are statutoryexceptions and safe harbors for various activities, including the following: certain investment interests, spacerental, equipment rental, practitioner recruitment, personnel services and management contracts, sale of practice,referral services, warranties, discounts, employees, group purchasing organizations, waiver of beneficiarycoinsurance and deductible amounts, managed care arrangements, obstetrical malpractice insurance subsidies,investments in group practices, freestanding surgery centers, ambulance replenishing, and referral agreements forspecialty services.
The fact that conduct or a business arrangement does not fall within a safe harbor, or it is identified in aSpecial Fraud Alert, Special Advisory Bulletin or other guidance or as a risk area in the SupplementalCompliance Guidelines for Hospitals, does not necessarily render the conduct or business arrangement illegalunder the Anti-kickback Statute. However, such conduct and business arrangements may lead to increasedscrutiny by government enforcement authorities.
We have a variety of financial relationships with physicians and others who either refer or influence thereferral of patients to our hospitals and other health care facilities, including employment contracts, leases,medical director agreements and professional service agreements. We also have similar relationships withphysicians and facilities to which patients are referred from our facilities. In addition, we provide financialincentives, including minimum revenue guarantees, to recruit physicians into the communities served by ourhospitals. While we endeavor to comply with the applicable safe harbors, certain of our current arrangements,including joint ventures and financial relationships with physicians and other referral sources and persons andentities to which we refer patients, do not qualify for safe harbor protection.
Although we believe our arrangements with physicians and other referral sources have been structured tocomply with current law and available interpretations, there can be no assurance regulatory authorities enforcingthese laws will determine these financial arrangements comply with the Anti-kickback Statute or other applicablelaws. An adverse determination could subject us to liabilities under the Social Security Act and other laws,including criminal penalties, civil monetary penalties and exclusion from participation in Medicare, Medicaid orother federal health care programs.
Stark Law
The Social Security Act also includes a provision commonly known as the “Stark Law.” The Stark Lawprohibits physicians from referring Medicare and Medicaid patients to entities with which they or any of their
21

immediate family members have a financial relationship, if these entities provide certain “designated healthservices” reimbursable by Medicare or Medicaid unless an exception applies. The Stark Law also prohibitsentities that provide designated health services reimbursable by Medicare and Medicaid from billing theMedicare and Medicaid programs for any items or services that result from a prohibited referral and requires theentities to refund amounts received for items or services provided pursuant to the prohibited referral. “Designatedhealth services” include inpatient and outpatient hospital services, clinical laboratory services and radiologyservices. Sanctions for violating the Stark Law include denial of payment, civil monetary penalties of up to$15,000 per claim submitted and exclusion from the federal health care programs. The statute also provides for apenalty of up to $100,000 for a circumvention scheme. There are exceptions to the self-referral prohibition formany of the customary financial arrangements between physicians and providers, including employmentcontracts, leases and recruitment agreements. Unlike safe harbors under the Anti-kickback Statute with whichcompliance is voluntary, an arrangement must comply with every requirement of a Stark Law exception or thearrangement is in violation of the Stark Law. Although there is an exception for a physician’s ownership interestin an entire hospital, the Health Reform Law prohibits newly created physician-owned hospitals from billing forMedicare patients referred by their physician owners. As a result, the law effectively prevents the formation ofnew physician-owned hospitals after December 31, 2010. While the Health Reform Law grandfathers existingphysician-owned hospitals, it does not allow these hospitals to increase the percentage of physician ownershipand significantly restricts their ability to expand services.
Through a series of rulemakings, CMS has issued final regulations implementing the Stark Law. Additionalchanges to these regulations, which became effective October 1, 2009, further restrict the types of arrangementsfacilities and physicians may enter, including additional restrictions on certain leases, percentage compensationarrangements, and agreements under which a hospital purchases services “under arrangements.” While theseregulations were intended to clarify the requirements of the exceptions to the Stark Law, it is unclear how thegovernment will interpret many of these exceptions for enforcement purposes. Further, we do not always havethe benefit of significant regulatory or judicial interpretation of the Stark Law and its implementing regulations.We attempt to structure our relationships to meet an exception to the Stark Law, but the regulationsimplementing the exceptions are detailed and complex, and we cannot assure that every relationship compliesfully with the Stark Law.
Similar State Laws
Many states in which we operate also have laws similar to the Anti-kickback Statute that prohibit paymentsto physicians for patient referrals and laws similar to the Stark Law that prohibit certain self-referrals. The scopeof these state laws is broad, since they can often apply regardless of the source of payment for care, and littleprecedent exists for their interpretation or enforcement. These statutes typically provide for criminal and civilpenalties, as well as loss of facility licensure.
Other Fraud and Abuse Provisions
HIPAA broadened the scope of certain fraud and abuse laws by adding several criminal provisions forhealth care fraud offenses that apply to all health benefit programs. The Social Security Act also imposescriminal and civil penalties for making false claims and statements to Medicare and Medicaid. False claimsinclude, but are not limited to, billing for services not rendered or for misrepresenting actual services rendered inorder to obtain higher reimbursement, billing for unnecessary goods and services and cost report fraud. Federalenforcement officials have the ability to exclude from Medicare and Medicaid any investors, officers andmanaging employees associated with business entities that have committed health care fraud, even if the officeror managing employee had no knowledge of the fraud. Criminal and civil penalties may be imposed for a numberof other prohibited activities, including failure to return known overpayments, certain gainsharing arrangements,billing Medicare amounts that are substantially in excess of a provider’s usual charges, offering remuneration toinfluence a Medicare or Medicaid beneficiary’s selection of a health care provider, contracting with an individualor entity known to be excluded from a federal health care program, making or accepting a payment to induce aphysician to reduce or limit services, and soliciting or receiving any remuneration in return for referring an
22

individual for an item or service payable by a federal health care program. Like the Anti-kickback Statute, theseprovisions are very broad. Under the Health Reform Law, civil penalties may be imposed for the failure to reportand return an overpayment within 60 days of identifying the overpayment or by the date a corresponding costreport is due, whichever is later. To avoid liability, providers must, among other things, carefully and accuratelycode claims for reimbursement, promptly return overpayments and accurately prepare cost reports.
Some of these provisions, including the federal Civil Monetary Penalty Law, require a lower burden ofproof than other fraud and abuse laws, including the Anti-kickback Statute. Civil monetary penalties that may beimposed under the federal Civil Monetary Penalty Law range from $10,000 to $50,000 per act, and in some casesmay result in penalties of up to three times the remuneration offered, paid, solicited or received. In addition, aviolator may be subject to exclusion from federal and state health care programs. Federal and state governmentsincreasingly use the federal Civil Monetary Penalty Law, especially where they believe they cannot meet thehigher burden of proof requirements under the Anti-kickback Statute. Further, individuals can receive up to$1,000 for providing information on Medicare fraud and abuse that leads to the recovery of at least $100 ofMedicare funds under the Medicare Integrity Program.
The Federal False Claims Act and Similar State Laws
The qui tam, or whistleblower, provisions of the FCA allow private individuals to bring actions on behalf ofthe government alleging that the defendant has defrauded the federal government. Further, the government mayuse the FCA to prosecute Medicare and other government program fraud in areas such as coding errors, billingfor services not provided and submitting false cost reports. When a private party brings a qui tam action underthe FCA, the defendant is not made aware of the lawsuit until the government commences its own investigationor makes a determination whether it will intervene. If a defendant is determined by a court of law to be liableunder the FCA, the defendant may be required to pay three times the actual damages sustained by thegovernment, plus mandatory civil penalties of between $5,500 and $11,000 for each separate false claim. Thereare many potential bases for liability under the FCA. Liability often arises when an entity knowingly submits afalse claim for reimbursement to the federal government. The FCA defines the term “knowingly” broadly.Though simple negligence will not give rise to liability under the FCA, submitting a claim with recklessdisregard to its truth or falsity constitutes a “knowing” submission under the FCA and, therefore, may createliability. The Fraud Enforcement and Recovery Act of 2009 expanded the scope of the FCA by, among otherthings, creating liability for knowingly and improperly avoiding repayment of an overpayment received from thegovernment and broadening protections for whistleblowers. Under the Health Reform Law, the FCA isimplicated by the knowing failure to report and return an overpayment within 60 days of identifying theoverpayment or by the date a corresponding cost report is due, whichever is later. Further, the Health ReformLaw expands the scope of the FCA to cover payments in connection with the Exchanges to be created by theHealth Reform Law, if those payments include any federal funds.
In some cases, whistleblowers and the federal government have taken the position, and some courts haveheld, that providers who allegedly have violated other statutes, such as the Anti-kickback Statute and the StarkLaw, have thereby submitted false claims under the FCA. The Health Reform Law clarifies this issue withrespect to the Anti-kickback Statute by providing that submission of claims for services or items generated inviolation of the Anti-kickback Statute constitutes a false or fraudulent claim under the FCA. Every entity thatreceives at least $5 million annually in Medicaid payments must have written policies for all employees,contractors or agents, providing detailed information about false claims, false statements and whistleblowerprotections under certain federal laws, including the FCA, and similar state laws. In addition, federal lawprovides an incentive to states to enact false claims laws comparable to the FCA. A number of states in which weoperate have adopted their own false claims provisions as well as their own whistleblower provisions underwhich a private party may file a civil lawsuit in state court. We have adopted and distributed policies pertainingto the FCA and relevant state laws.
23

HIPAA Administrative Simplification and Privacy and Security Requirements
The Administrative Simplification Provisions of HIPAA require the use of uniform electronic datatransmission standards for certain health care claims and payment transactions submitted or receivedelectronically. These provisions are intended to encourage electronic commerce in the health care industry. HHShas issued regulations implementing the HIPAA Administrative Simplification Provisions and compliance withthese regulations is mandatory for our facilities. The Health Reform Law requires HHS to adopt standards foradditional electronic transactions and to establish operating rules to promote uniformity in the implementation ofeach standardized electronic transaction. In addition, HIPAA requires that each provider use a National ProviderIdentifier. CMS has also published a final rule requiring the use of updated standard code sets for certaindiagnoses and procedures known as ICD-10 code sets. Implementing the ICD-10 code sets will requiresignificant administrative changes. By regulation, use of the ICD-10 code sets is required beginning October 1,2013, but CMS has announced that it intends to extend this deadline.
The privacy and security regulations promulgated pursuant to HIPAA extensively regulate the use anddisclosure of individually identifiable health information and require covered entities, including health plans andmost health care providers, to implement administrative, physical and technical safeguards to protect the securityof such information. ARRA broadened the scope of the HIPAA privacy and security regulations. In addition,ARRA extends the application of certain provisions of the security and privacy regulations to business associates(entities that handle identifiable health information on behalf of covered entities) and subjects business associatesto civil and criminal penalties for violation of the regulations. On July 14, 2010, HHS issued a proposed rule thatwould implement many of these ARRA provisions. If finalized, these changes would likely require amendmentsto existing agreements with business associates and would subject business associates and their subcontractors todirect liability under the HIPAA privacy and security regulations. We currently enforce a HIPAA complianceplan, which we believe complies with HIPAA privacy and security requirements and under which a HIPAAcompliance group monitors our compliance. The privacy regulations and security regulations have and willcontinue to impose significant costs on our facilities in order to comply with these standards.
As required by ARRA, HHS published an interim final rule on August 24, 2009, that requires coveredentities to report breaches of unsecured protected health information to affected individuals without unreasonabledelay but not to exceed 60 days of discovery of the breach by a covered entity or its agents. Notification mustalso be made to HHS and, in certain situations involving large breaches, to the media. HHS is required to publishon its website a list of all covered entities that report a breach involving more than 500 individuals. Various statelaws and regulations may also require us to notify affected individuals in the event of a data breach involvingindividually identifiable information.
Violations of the HIPAA privacy and security regulations may result in civil and criminal penalties, andARRA has strengthened the enforcement provisions of HIPAA, which may result in increased enforcementactivity. As required by ARRA, HHS has announced a pilot program to perform audits of up to 150 coveredentities by the end of 2012. ARRA broadens the applicability of the criminal penalty provisions to employees ofcovered entities and requires HHS to impose penalties for violations resulting from willful neglect. ARRA alsosignificantly increases the amount of the civil penalties, with penalties of up to $50,000 per violation for amaximum civil penalty of $1,500,000 in a calendar year for violations of the same requirement. In addition,ARRA authorizes state attorneys general to bring civil actions seeking either injunction or damages in responseto violations of HIPAA privacy and security regulations that threaten the privacy of state residents.
There are numerous other laws and legislative and regulatory initiatives at the federal and state levelsaddressing privacy and security concerns. Our facilities remain subject to any federal or state privacy-relatedlaws that are more restrictive than the privacy regulations issued under HIPAA. These laws vary and couldimpose additional penalties.
24

EMTALA
All of our hospitals in the United States are subject to EMTALA. This federal law requires any hospitalparticipating in the Medicare program to conduct an appropriate medical screening examination of everyindividual who presents to the hospital’s emergency room for treatment and, if the individual is suffering from anemergency medical condition, to either stabilize the condition or make an appropriate transfer of the individual toa facility able to handle the condition. The obligation to screen and stabilize emergency medical conditions existsregardless of an individual’s ability to pay for treatment. There are severe penalties under EMTALA if a hospitalfails to screen or appropriately stabilize or transfer an individual or if the hospital delays appropriate treatment inorder to first inquire about the individual’s ability to pay. Penalties for violations of EMTALA include civilmonetary penalties and exclusion from participation in the Medicare program. In addition, an injured individual,the individual’s family or a medical facility that suffers a financial loss as a direct result of a hospital’s violationof the law can bring a civil suit against the hospital.
The government broadly interprets EMTALA to cover situations in which individuals do not actuallypresent to a hospital’s emergency room, but present for emergency examination or treatment to the hospital’scampus, generally, or to a hospital-based clinic that treats emergency medical conditions or are transported in ahospital-owned ambulance, subject to certain exceptions. At least one court has interpreted the law also to applyto a hospital that has been notified of a patient’s pending arrival in a non-hospital owned ambulance. EMTALAdoes not generally apply to individuals admitted for inpatient services. The government has expressed its intentto investigate and enforce EMTALA violations actively in the future. We believe our hospitals operate insubstantial compliance with EMTALA.
Corporate Practice of Medicine/Fee Splitting
Some of the states in which we operate have laws prohibiting corporations and other entities fromemploying physicians, practicing medicine for a profit and making certain direct and indirect payments orfee-splitting arrangements between health care providers designed to induce or encourage the referral of patientsto, or the recommendation of, particular providers for medical products and services. Possible sanctions forviolation of these restrictions include loss of license and civil and criminal penalties. In addition, agreementsbetween the corporation and the physician may be considered void and unenforceable. These statutes vary fromstate to state, are often vague and have seldom been interpreted by the courts or regulatory agencies.
Health Care Industry Investigations
Significant media and public attention has focused in recent years on the hospital industry. This media andpublic attention, changes in government personnel or other factors may lead to increased scrutiny of the healthcare industry. Except as may be disclosed in our SEC filings, we are not aware of any material investigations ofthe Company under federal or state health care laws or regulations. It is possible that governmental entities couldinitiate investigations or litigation in the future at facilities we operate and that such matters could result insignificant penalties, as well as adverse publicity. It is also possible that our executives and managers could beincluded in governmental investigations or litigation or named as defendants in private litigation.
Our substantial Medicare, Medicaid and other governmental billings result in heightened scrutiny of ouroperations. We continue to monitor all aspects of our business and have developed a comprehensive ethics andcompliance program that is designed to meet or exceed applicable federal guidelines and industry standards.Because the law in this area is complex and constantly evolving, governmental investigations or litigation mayresult in interpretations that are inconsistent with our or industry practices.
In public statements surrounding current investigations, governmental authorities have taken positions on anumber of issues, including some for which little official interpretation previously has been available, that appearto be inconsistent with practices that have been common within the industry and that previously have not beenchallenged in this manner. In some instances, government investigations that have in the past been conductedunder the civil provisions of federal law may now be conducted as criminal investigations.
25

Both federal and state government agencies have increased their focus on and coordination of civil andcriminal enforcement efforts in the health care area. The OIG and the Department of Justice (“DOJ”) have, fromtime to time, established national enforcement initiatives, targeting all hospital providers that focus on specificbilling practices or other suspected areas of abuse. The Health Reform Law includes additional federal funding of$350 million over the next 10 years to fight health care fraud, waste and abuse, including $105 million for federalfiscal year 2011 and $65 million in federal fiscal year 2012. In addition, governmental agencies and their agents,such as MACs, fiscal intermediaries and carriers, may conduct audits of our health care operations. Privatepayers may conduct similar post-payment audits, and we also perform internal audits and monitoring.
In addition to national enforcement initiatives, federal and state investigations have addressed a wide varietyof routine health care operations such as: cost reporting and billing practices, including for Medicare outliers;financial arrangements with referral sources; physician recruitment activities; physician joint ventures; andhospital charges and collection practices for self-pay patients. We engage in many of these routine health careoperations and other activities that could be the subject of governmental investigations or inquiries. For example,we have significant Medicare and Medicaid billings, numerous financial arrangements with physicians who arereferral sources to our hospitals, and joint venture arrangements involving physician investors. Certain of ourindividual facilities have received, and other facilities may receive, government inquiries from, and may besubject to investigation by, federal and state agencies. Any additional investigations of the Company, ourexecutives or managers could result in significant liabilities or penalties to us, as well as adverse publicity.
Health Care Reform
As enacted, the Health Reform Law will change how health care services are covered, delivered andreimbursed through expanded coverage of uninsured individuals, reduced growth in Medicare program spending,reductions in Medicare and Medicaid DSH payments, and the establishment of programs where reimbursement istied to quality and integration. In addition, the law reforms certain aspects of health insurance, expands existingefforts to tie Medicare and Medicaid payments to performance and quality, and contains provisions intended tostrengthen fraud and abuse enforcement. Numerous lawsuits have challenged the constitutionality of the HealthReform Law. Some federal courts have upheld the constitutionality of the Health Reform Law or dismissed caseson procedural grounds. Others have held unconstitutional the requirement that individuals maintain healthinsurance or pay a penalty and have either found the Health Reform Law void in its entirety or left the remainderof the law intact. The U.S. Supreme Court is expected to decide the constitutionality of the Health Reform Lawin 2012. Based on the outcome of the U.S. Supreme Court’s review, the Health Reform Law, or individualcomponents of it, may be upheld, invalidated or modified. In addition, repeal of the Health Reform Law hasbecome a theme in political campaigns during this election year.
Expanded Coverage
Based on CBO and CMS estimates made prior to enactment of the Health Reform Law, by 2019, the HealthReform Law will expand coverage to 32 to 34 million additional individuals (resulting in coverage of anestimated 94% of the legal U.S. population). This increased coverage will occur through a combination of publicprogram expansion and private sector health insurance and other reforms.
Medicaid Expansion
The primary public program coverage expansion will occur through changes in Medicaid, and to a lesserextent, expansion of the Children’s Health Insurance Program (“CHIP”). The most significant changes willexpand the categories of individuals eligible for Medicaid coverage and permit individuals with relatively higherincomes to qualify. The federal government reimburses the majority of a state’s Medicaid expenses, and itconditions its payment on the state meeting certain requirements. The federal government currently requires thatstates provide coverage for only limited categories of low-income adults under 65 years old (e.g., women whoare pregnant, and the blind or disabled). In addition, the income level required for individuals and families toqualify for Medicaid varies widely from state to state.
26

The Health Reform Law materially changes the requirements for Medicaid eligibility. CommencingJanuary 1, 2014, all state Medicaid programs are required to provide, and the federal government will subsidize,Medicaid coverage to virtually all adults under 65 years old with incomes at or under 133% of the federalpoverty level (“FPL”). This expansion will create a minimum Medicaid eligibility threshold that is uniformacross states. Further, the Health Reform Law also requires states to apply a “5% income disregard” to theMedicaid eligibility standard, so that Medicaid eligibility will effectively be extended to those with incomes upto 138% of the FPL. According to the CBO’s March 2011 projection, the new eligibility requirements willexpand Medicaid and CHIP coverage by an estimated 17 million persons nationwide. A disproportionately largepercentage of the new Medicaid coverage is likely to be in states that currently have relatively low incomeeligibility requirements.
As Medicaid is a joint federal and state program, the federal government provides states with “matchingfunds” in a defined percentage, known as the federal medical assistance percentage (“FMAP”). Beginning in2014, states will receive an enhanced FMAP for the individuals enrolled in Medicaid pursuant to the HealthReform Law. The FMAP percentage is as follows: 100% for calendar years 2014 through 2016; 95% for 2017;94% in 2018; 93% in 2019; and 90% in 2020 and thereafter.
The Health Reform Law also provides that the federal government will subsidize states that create non-Medicaid plans for residents whose incomes are greater than 133% of the FPL but do not exceed 200% of theFPL. Approved state plans will be eligible to receive federal funding. The amount of that funding per individualwill be equal to 95% of subsidies that would have been provided for that individual had he or she enrolled in ahealth plan offered through one of the Exchanges, as discussed below.
Historically, states often have attempted to reduce Medicaid spending by limiting benefits and tighteningMedicaid eligibility requirements. However, the Health Reform Law requires states to at least maintain Medicaideligibility standards established prior to the enactment of the law for adults until January 1, 2014 and for childrenuntil October 1, 2019. States with budget deficits may seek a waiver from this requirement, but only to addresseligibility standards that apply to adults making more than 133% of the FPL.
Private Sector Expansion
The expansion of health coverage through the private sector as a result of the Health Reform Law will occurthrough new requirements applicable to health insurers, employers and individuals. Health insurers must keeptheir annual nonmedical costs lower than 15% of premium revenue for the group market and lower than 20% inthe small group and individual markets or rebate to enrollees the amount spent in excess of the percentage. Inaddition, health insurers are not permitted to deny coverage to children based upon a pre-existing condition andmust allow dependent care coverage for children up to 26 years old. Commencing January 1, 2014, healthinsurers will be prohibited from imposing annual coverage limits, dropping coverage, excluding persons basedupon pre-existing conditions or denying coverage for any individual who is willing to pay the premiums for suchcoverage.
Larger employers will be subject to new requirements and incentives to provide health insurance benefits totheir full time employees. Effective January 1, 2014, employers with 50 or more employees that do not offerhealth insurance will be held subject to a penalty if an employee obtains government-subsidized coveragethrough an Exchange. The employer penalties will range from $2,000 to $3,000 per employee, subject to certainthresholds and conditions.
As enacted, the Health Reform Law uses various means to induce individuals who do not have healthinsurance to obtain coverage. By January 1, 2014, individuals will be required to maintain health insurance for aminimum defined set of benefits or pay a tax penalty. The penalty in most cases is $95 in 2014, $325 in 2015,$695 in 2016, and indexed to a cost of living adjustment in subsequent years. The Internal Revenue Service(“IRS”), in consultation with HHS, is responsible for enforcing the tax penalty, although the Health Reform Law
27

limits the availability of certain IRS enforcement mechanisms. In addition, for individuals and families below400% of the FPL, the cost of obtaining health insurance through the Exchanges will be subsidized by the federalgovernment. Those with lower incomes will be eligible to receive greater subsidies. It is anticipated that those atthe lowest income levels will have the majority of their premiums subsidized by the federal government, in somecases in excess of 95% of the premium amount.
To facilitate the purchase of health insurance by individuals and small employers, each state must establish anExchange by January 1, 2014. Based on CBO estimates issued in March 2011, approximately 24 million individualswill obtain their health insurance coverage through an Exchange by 2021. This amount will include individuals whowere previously uninsured and individuals who have switched from their prior insurance coverage to a planobtained through the Exchange. The Health Reform Law requires that the Exchanges be designed to make theprocess of evaluating, comparing and acquiring coverage simple for consumers. For example, each state’s Exchangemust maintain an internet website through which consumers may access health plan ratings that are assigned by thestate based on quality and price, view governmental health program eligibility requirements and calculate the actualcost of health coverage. Health insurers participating in an Exchange must offer a set of minimum benefits to bedefined by HHS and may offer more benefits. Health insurers must offer at least two, and up to five, levels of plansthat vary by the percentage of medical expenses that must be paid by the enrollee. These levels are referred to asplatinum, gold, silver, bronze and catastrophic plans, with gold and silver being the two mandatory levels of plans.Each level of plan must require the enrollee to share the following percentages of medical expenses up to thedeductible/copayment limit: platinum, 10%; gold, 20%; silver, 30%; bronze, 40%; and catastrophic, 100%. Healthinsurers may establish varying deductible/copayment levels, up to the statutory maximum (estimated to be between$6,000 and $7,000 for an individual). The health insurers must cover 100% of the amount of medical expenses inexcess of the deductible/copayment limit. For example, an individual making 100% to 200% of the FPL will havecopayments and deductibles reduced to about one-third of the amount payable by those with the same plan withincomes at or above 400% of the FPL.
Public Program Spending
The Health Reform Law provides for Medicare, Medicaid and other federal health care program spendingreductions between 2010 and 2019. In March 2010, CMS estimated Medicare fee-for-service reductions from2010 to 2019 would be $233 billion and the Medicare and Medicaid DSH reductions would be an additional $64billion. In February 2011, the CBO estimated that from 2012 to 2021, the Health Reform Law reductions wouldinclude $379 billion in Medicare fee-for-service market basket and productivity reimbursement reductions, themajority of which will come from hospitals. The CBO estimate included an additional $57 billion in reductionsin Medicare and Medicaid DSH funding.
Payments for Hospitals and Ambulatory Surgery Centers
Inpatient Market Basket and Productivity Adjustment. Under the Medicare program, hospitals receivereimbursement under a PPS for general, acute care hospital inpatient services. CMS establishes fixed PPSpayment amounts per inpatient discharge based on the patient’s assigned MS-DRG. These MS-DRG rates areupdated each federal fiscal year, which begins October 1, using a market basket index that takes into accountinflation experienced by hospitals and other entities outside the health care industry in purchasing goods andservices.
The Health Reform Law provides for three types of annual reductions in the market basket. The first is ageneral reduction of a specified percentage each federal fiscal year starting in 2010 and extending through 2019.These reductions are as follows: federal fiscal year 2010, 0.25% for discharges occurring on or after April 1,2010; 2011 (0.25%); 2012 (0.1%); 2013 (0.1%); 2014 (0.3%); 2015 (0.2%); 2016 (0.2%); 2017 (0.75%); 2018(0.75%); and 2019 (0.75%).
The second type of reduction to the market basket is a “productivity adjustment” that was implemented byHHS beginning in federal fiscal year 2012. The amount of that reduction is the projected nationwide productivity
28

gains over the preceding 10 years. To determine the projection, HHS uses the BLS 10-year moving average ofchanges in specified economy-wide productivity (the BLS data is typically a few years old). The Health ReformLaw does not contain guidelines for HHS to use in projecting the productivity figure. For federal fiscal year2012, CMS has announced a negative 1.0% productivity adjustment to the market basket. CMS estimates that thecombined market basket and productivity adjustments will reduce Medicare payments under the inpatient PPS by$112.6 billion from 2010 to 2019.
The third type of reduction is in connection with the value-based purchasing program discussed in moredetail below. Beginning in federal fiscal year 2013, CMS will reduce the inpatient PPS payment amount for alldischarges by the following: 1% for 2013; 1.25% for 2014; 1.5% for 2015; 1.75% for 2016; and 2% for 2017 andsubsequent years. For each federal fiscal year, the total amount collected from these reductions will be pooledand used to fund payments to hospitals that satisfy certain quality metrics. While some or all of these reductionsmay be recovered if a hospital satisfies these quality metrics, the recovery amounts may be delayed.
If the aggregate of the three market basket reductions described above is more than the annual market basketadjustments made to account for inflation, there will be a reduction in the MS-DRG rates paid to hospitals. Forexample, for the federal fiscal year 2011 hospital inpatient PPS, the market basket increase to account forinflation was 2.6% and the aggregate reduction due to the Health Reform Law and the documentation and codingadjustment was 3.15%. Thus, the rates paid to a hospital for inpatient services in federal fiscal year 2011 were0.55% less than rates paid for the same services in the prior year.
Quality-Based Payment Adjustments and Reductions for Inpatient Services. The Health Reform Lawestablishes or expands three provisions to promote value-based purchasing and to link payments to quality andefficiency. First, in federal fiscal year 2013, HHS is directed to implement a value-based purchasing program forinpatient hospital services. This program will reward hospitals that meet certain quality performance standardsestablished by HHS. The Health Reform Law provides HHS considerable discretion over the value-basedpurchasing program. On April 29, 2011, CMS issued a final rule establishing the value-based purchasingprogram for hospital inpatient services. Under this final rule, CMS states that it estimates it will distribute $850million in federal fiscal year 2013 to hospitals based on their overall performance on a set of quality measuresthat have been linked to improved clinical processes of care and patient satisfaction. For payments in federalfiscal year 2013, hospitals will be scored based on a weighted average of patient experience scores using theHospital Consumer Assessment of Healthcare Providers and Systems survey and 12 clinical process-of-caremeasures. CMS will score each hospital based on achievement (relative to other hospitals) and improvementranges (relative to the hospital’s own past performance) for each applicable measure. Because the Health ReformLaw provides that the pool will be fully distributed, hospitals that meet or exceed the quality performancestandards set by HHS will receive greater reimbursement under the value-based purchasing program than theywould have otherwise. Hospitals that do not achieve the necessary quality performance will receive reducedMedicare inpatient hospital payments. CMS will notify each hospital of the amount of its value-based incentivepayment for fiscal year 2013 discharges on November 1, 2012.
Second, beginning in federal fiscal year 2013, inpatient payments will be reduced if a hospital experiences“excessive readmissions” within the 30-day period from the date of discharge for heart attack, heart failure,pneumonia or other conditions that may be designated by CMS. Hospitals with what CMS defines as “excessivereadmissions” for these conditions will receive reduced payments for all inpatient discharges, not just dischargesrelating to the conditions subject to the excessive readmission standard. Each hospital’s performance will bepublicly reported by CMS. On August 1, 2011, CMS issued a final rule implementing portions of this programbut indicated that it will issue in future rulemakings additional policies with respect to excessive readmissions,including the specific payment adjustment methodology.
Third, reimbursement will be reduced based on a facility’s HAC rates. An HAC is a condition that isacquired by a patient while admitted as an inpatient in a hospital, such as a surgical site infection. Beginning infederal fiscal year 2015, the 25% of hospitals with the worst national risk-adjusted HAC rates in the previous
29
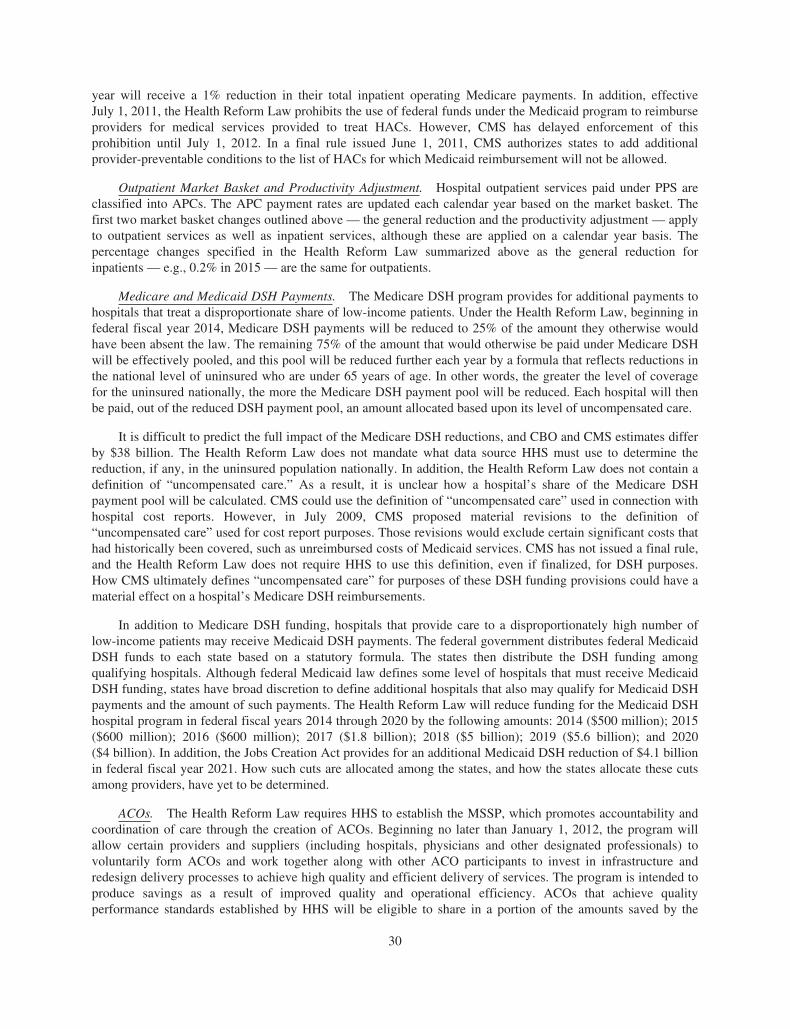
year will receive a 1% reduction in their total inpatient operating Medicare payments. In addition, effectiveJuly 1, 2011, the Health Reform Law prohibits the use of federal funds under the Medicaid program to reimburseproviders for medical services provided to treat HACs. However, CMS has delayed enforcement of thisprohibition until July 1, 2012. In a final rule issued June 1, 2011, CMS authorizes states to add additionalprovider-preventable conditions to the list of HACs for which Medicaid reimbursement will not be allowed.
Outpatient Market Basket and Productivity Adjustment. Hospital outpatient services paid under PPS areclassified into APCs. The APC payment rates are updated each calendar year based on the market basket. Thefirst two market basket changes outlined above — the general reduction and the productivity adjustment — applyto outpatient services as well as inpatient services, although these are applied on a calendar year basis. Thepercentage changes specified in the Health Reform Law summarized above as the general reduction forinpatients — e.g., 0.2% in 2015 — are the same for outpatients.
Medicare and Medicaid DSH Payments. The Medicare DSH program provides for additional payments tohospitals that treat a disproportionate share of low-income patients. Under the Health Reform Law, beginning infederal fiscal year 2014, Medicare DSH payments will be reduced to 25% of the amount they otherwise wouldhave been absent the law. The remaining 75% of the amount that would otherwise be paid under Medicare DSHwill be effectively pooled, and this pool will be reduced further each year by a formula that reflects reductions inthe national level of uninsured who are under 65 years of age. In other words, the greater the level of coveragefor the uninsured nationally, the more the Medicare DSH payment pool will be reduced. Each hospital will thenbe paid, out of the reduced DSH payment pool, an amount allocated based upon its level of uncompensated care.
It is difficult to predict the full impact of the Medicare DSH reductions, and CBO and CMS estimates differby $38 billion. The Health Reform Law does not mandate what data source HHS must use to determine thereduction, if any, in the uninsured population nationally. In addition, the Health Reform Law does not contain adefinition of “uncompensated care.” As a result, it is unclear how a hospital’s share of the Medicare DSHpayment pool will be calculated. CMS could use the definition of “uncompensated care” used in connection withhospital cost reports. However, in July 2009, CMS proposed material revisions to the definition of“uncompensated care” used for cost report purposes. Those revisions would exclude certain significant costs thathad historically been covered, such as unreimbursed costs of Medicaid services. CMS has not issued a final rule,and the Health Reform Law does not require HHS to use this definition, even if finalized, for DSH purposes.How CMS ultimately defines “uncompensated care” for purposes of these DSH funding provisions could have amaterial effect on a hospital’s Medicare DSH reimbursements.
In addition to Medicare DSH funding, hospitals that provide care to a disproportionately high number oflow-income patients may receive Medicaid DSH payments. The federal government distributes federal MedicaidDSH funds to each state based on a statutory formula. The states then distribute the DSH funding amongqualifying hospitals. Although federal Medicaid law defines some level of hospitals that must receive MedicaidDSH funding, states have broad discretion to define additional hospitals that also may qualify for Medicaid DSHpayments and the amount of such payments. The Health Reform Law will reduce funding for the Medicaid DSHhospital program in federal fiscal years 2014 through 2020 by the following amounts: 2014 ($500 million); 2015($600 million); 2016 ($600 million); 2017 ($1.8 billion); 2018 ($5 billion); 2019 ($5.6 billion); and 2020($4 billion). In addition, the Jobs Creation Act provides for an additional Medicaid DSH reduction of $4.1 billionin federal fiscal year 2021. How such cuts are allocated among the states, and how the states allocate these cutsamong providers, have yet to be determined.
ACOs. The Health Reform Law requires HHS to establish the MSSP, which promotes accountability andcoordination of care through the creation of ACOs. Beginning no later than January 1, 2012, the program willallow certain providers and suppliers (including hospitals, physicians and other designated professionals) tovoluntarily form ACOs and work together along with other ACO participants to invest in infrastructure andredesign delivery processes to achieve high quality and efficient delivery of services. The program is intended toproduce savings as a result of improved quality and operational efficiency. ACOs that achieve qualityperformance standards established by HHS will be eligible to share in a portion of the amounts saved by the
30

Medicare program. HHS has significant discretion to determine key elements of the program. In 2011, CMS, theOIG and certain other federal agencies released a series of rules and guidance further defining and implementingthe ACO program. These rules and guidance provide for two different ACO tracks, the first of which allowsACOs to share only in the savings under the MSSP. The second track requires ACOs to share in any savings orlosses under the MSSP but offers ACOs a greater share of any savings realized under the MSSP. As authorizedby the Health Reform Law, the rules and guidance also provide for certain waivers from fraud and abuse laws forACOs. In addition, beginning January 1, 2012, CMS has authorized 32 organizations to participate in the“Pioneer” ACO program, which is similar to, but separate from, the ACOs created under the MSSP regulations.
Bundled Payment Pilot Programs. The Health Reform Law created the Center for Medicare and MedicaidInnovation with responsibility for establishing demonstration projects and other initiatives in order to identify,develop, test and encourage the adoption of new methods of delivering and paying for healthcare that createsavings under the Medicare and Medicaid programs while improving quality of care. In addition, the HealthReform Law requires HHS to establish a five-year, voluntary national bundled payment pilot program forMedicare services beginning no later than January 1, 2013. Under the program, providers would agree to receiveone payment for services provided to Medicare patients for certain medical conditions or episodes of care. HHSwill have the discretion to determine how the program will function. For example, HHS will determine whatmedical conditions will be included in the program and the amount of the payment for each condition. Inaddition, the Health Reform Law provides for a five-year bundled payment pilot program for Medicaid services.HHS may select up to eight states to participate based on the potential to lower costs under the Medicaid programwhile improving care. State programs may target particular categories of beneficiaries, selected diagnoses orgeographic regions of the state. The selected state programs will provide one payment for both hospital andphysician services provided to Medicaid patients for certain episodes of inpatient care. For both pilot programs,HHS will determine the relationship between the programs and restrictions in certain existing laws, including theCivil Monetary Penalty Law, the Anti-kickback Statute, the Stark Law and the HIPAA privacy, security andtransaction standard requirements. However, the Health Reform Law does not authorize HHS to waive other lawsthat may impact the ability of hospitals and other eligible participants to participate in the pilot programs, such asantitrust laws.
Ambulatory Surgery Centers. The Health Reform Law reduces reimbursement for ASCs through aproductivity adjustment to the market basket similar to the productivity adjustment for inpatient and outpatienthospital services, beginning in federal fiscal year 2011. On November 1, 2011, CMS issued a final ruleestablishing a quality reporting program for ASCs by which ASCs that fail to report on five quality measuresbeginning on October 1, 2012, will receive a 2% reduction in reimbursement for calendar year 2014.
Medicare Managed Care (Medicare Advantage or “MA”). Under the MA program, the federalgovernment contracts with private health plans to provide inpatient and outpatient benefits to beneficiaries whoenroll in such plans. For 2012, approximately 12.8 million Medicare beneficiaries have elected to enroll in MAplans. Effective in 2014, the Health Reform Law requires MA plans to keep annual administrative costs lowerthan 15% of annual premium revenue. The Health Reform Law reduces, over a three year period starting in 2012,premium payments to the MA plans such that CMS’ managed care per capita premium payments are, on average,equal to traditional Medicare. In addition, the Health Reform Law implements fee payment adjustments based onservice benchmarks and quality ratings. As a result of these changes, payments to MA plans are estimated to bereduced by $138 to $145 billion between 2010 and 2019. These reductions to MA plan premium payments maycause some plans to raise premiums or limit benefits, which in turn might cause some Medicare beneficiaries toterminate their MA coverage and enroll in traditional Medicare.
Specialty Hospital Limitations
Over the last decade, we have faced significant competition from hospitals that have physician ownership.The Health Reform Law prohibits newly created physician-owned hospitals from billing for Medicare patientsreferred by their physician owners. As a result, the law effectively prevents the formation of new physician-owned hospitals after December 31, 2010. While the law grandfathers existing physician-owned hospitals, it doesnot allow these hospitals to increase the percentage of physician ownership and significantly restricts their abilityto expand services.
31

Program Integrity and Fraud and Abuse
The Health Reform Law makes several significant changes to health care fraud and abuse laws, providesadditional enforcement tools to the government, increases cooperation between agencies by establishingmechanisms for the sharing of information and enhances criminal and administrative penalties for non-compliance. For example, the Health Reform Law: (1) provides $350 million in increased federal funding overthe next 10 years to fight health care fraud, waste and abuse; (2) expands the scope of the RAC program toinclude MA plans and Medicaid; (3) authorizes HHS, in consultation with the OIG, to suspend Medicare andMedicaid payments to a provider of services or a supplier “pending an investigation of a credible allegation offraud;” (4) provides Medicare contractors with additional flexibility to conduct random prepayment reviews; and(5) tightens up the rules for returning overpayments made by governmental health programs and expands FCAliability to include failure to timely repay identified overpayments.
Impact of Health Reform Law on the Company
The expansion of health insurance coverage under the Health Reform Law may result in a material increasein the number of patients using our facilities who have either private or public program coverage. In addition, adisproportionately large percentage of the new Medicaid coverage is likely to be in states that currently haverelatively low income eligibility requirements. Two such states are Texas and Florida, where about one-half ofthe Company’s licensed beds are located. We also have a significant presence in other relatively low incomeeligibility states, including Georgia, Kansas, Louisiana, Missouri, Oklahoma and Virginia. Further, the HealthReform Law provides for a value-based purchasing program, the establishment of ACOs and bundled paymentpilot programs, which will create possible sources of additional revenue.
However, it is difficult to predict the size of the potential revenue gains to the Company as a result of theseelements of the Health Reform Law, because of uncertainty surrounding a number of material factors, includingthe following:
• how many previously uninsured individuals will obtain coverage as a result of the Health Reform Law(while the CBO estimates 32 million by 2016 and 34 million by 2021, CMS estimates almost34 million by 2019; both agencies made a number of assumptions to derive that figure, including howmany individuals will ignore substantial subsidies and decide to pay the penalty rather than obtainhealth insurance and what percentage of people in the future will meet the new Medicaid incomeeligibility requirements);
• what percentage of the newly insured patients will be covered under the Medicaid program and whatpercentage will be covered by private health insurers;
• the extent to which states will enroll new Medicaid participants in managed care programs;
• the pace at which insurance coverage expands, including the pace of different types of coverageexpansion;
• the change, if any, in the volume of inpatient and outpatient hospital services that are sought by andprovided to previously uninsured individuals;
• the rate paid to hospitals by private payers for newly covered individuals, including those coveredthrough the newly created Exchanges and those who might be covered under the Medicaid programunder contracts with the state;
• the rate paid by state governments under the Medicaid program for newly covered individuals;
• the effect of the value-based purchasing program on our hospitals’ revenues and the effects of otherquality programs;
• the percentage of individuals in the Exchanges who select the high deductible plans, since healthinsurers offering those kinds of products have traditionally sought to pay lower rates to hospitals;
32

• whether the net effect of the Health Reform Law, including the prohibition on excluding individualsbased on pre-existing conditions, the requirement to keep medical costs at or above a specifiedminimum percentage of premium revenue, other health insurance reforms and the annual fee applied toall health insurers, will be to put pressure on the bottom line of health insurers, which in turn mightcause them to seek to reduce payments to hospitals with respect to both newly insured individuals andtheir existing business; and
• the possibility that implementation of the provisions expanding health insurance coverage or the entireHealth Reform Law will be delayed due to court challenges or revised or eliminated as a result of courtchallenges and efforts to repeal or amend the law. Numerous lawsuits have challenged theconstitutionality of the Health Reform Law. Some federal courts have upheld the constitutionality ofthe Health Reform Law or dismissed cases on procedural grounds. Others have held unconstitutionalthe requirement that individuals maintain health insurance or pay a penalty and have either found theHealth Reform Law void in its entirety or left the remainder of the law intact. The U.S. Supreme Courtis expected to decide the constitutionality of the Health Reform Law in 2012. In addition, repeal of theHealth Reform Law has become a theme in political campaigns during this election year.
On the other hand, the Health Reform Law provides for significant reductions in the growth of Medicarespending, reductions in Medicare and Medicaid DSH payments and the establishment of programs wherereimbursement is tied to quality and integration. Since 44.5% of our revenues in 2011 were from Medicare andMedicaid, reductions to these programs may significantly impact the Company and could offset any positiveeffects of the Health Reform Law. It is difficult to predict the size of the revenue reductions to Medicare andMedicaid spending, because of uncertainty regarding a number of material factors, including the following:
• the amount of overall revenues the Company will generate from Medicare and Medicaid business whenthe reductions are implemented;
• whether reductions required by the Health Reform Law will be changed by statute or by judicialdecision prior to becoming effective;
• the size of the Health Reform Law’s annual productivity adjustment to the market basket;
• the amount of the Medicare DSH reductions that will be made, commencing in federal fiscal year 2014;
• the allocation to our hospitals of the Medicaid DSH reductions, commencing in federal fiscal year 2014;
• what the losses in revenues will be, if any, from the Health Reform Law’s quality initiatives;
• how successful ACOs will be at coordinating care and reducing costs or whether they will decreasereimbursement;
• the scope and nature of potential changes to Medicare reimbursement methods, such as an emphasis onbundling payments or coordination of care programs;
• whether the Company’s revenues from upper payment limit (“UPL”) programs, or other Medicaidsupplemental programs developed through a federally approved waiver program (“Waiver Program”),will be adversely affected because there may be reductions in available state and local governmentfunding for the programs; and
• reductions to Medicare payments CMS may impose for “excessive readmissions.”
Because of the many variables involved, we are unable to predict the net effect on the Company of theexpected increases in insured individuals using our facilities, reductions in Medicare spending, reductions inMedicare and Medicaid DSH funding, and numerous other provisions in the Health Reform Law that may affectthe Company. Further, it is unclear how efforts to repeal or revise the Health Reform Law and federal lawsuitschallenging its constitutionality will be resolved or what the impact would be of any resulting changes to the law.
33

General Economic and Demographic Factors
The United States economy has weakened significantly in recent years. Depressed consumer spending andhigher unemployment rates continue to pressure many industries. During economic downturns, governmentalentities often experience budget deficits as a result of increased costs and lower than expected tax collections.These budget deficits have forced federal, state and local government entities to decrease spending for health andhuman service programs, including Medicare, Medicaid and similar programs, which represent significant payersources for our hospitals. Other risks we face from general economic weakness include potential declines in thepopulation covered under managed care agreements, increased patient decisions to postpone or cancel electiveand nonemergency health care procedures, increases in the uninsured and underinsured populations, increasedadoption of health plan structures that shift financial responsibility to patients and further difficulties in ourcollecting patient copayment and deductible receivables. The Health Reform Law seeks to decrease over time thenumber of uninsured individuals, by among other things requiring employers to offer, and individuals to carry,health insurance or be subject to penalties. However, it is difficult to predict the full impact of the Health ReformLaw due to the law’s complexity, lack of implementing regulations or interpretive guidance, gradual andpotentially delayed implementation, pending court challenges, and possible amendment or repeal.
The health care industry is impacted by the overall United States economy. The federal deficit, the growingmagnitude of Medicare expenditures and the aging of the United States population will continue to place pressureon federal health care programs.
Compliance Program
We maintain a comprehensive ethics and compliance program that is designed to meet or exceed applicablefederal guidelines and industry standards. The program is intended to monitor and raise awareness of variousregulatory issues among employees and to emphasize the importance of complying with governmental laws andregulations. As part of the ethics and compliance program, we provide annual ethics and compliance training toour employees and encourage all employees to report any violations to their supervisor, an ethics and complianceofficer or a toll-free telephone ethics line. The Health Reform Law requires providers to implement coreelements of compliance program criteria to be established by HHS, on a timeline to be established by HHS, as acondition of enrollment in the Medicare or Medicaid programs, and we may have to modify our complianceprograms to comply with these new criteria.
Antitrust Laws
The federal government and most states have enacted antitrust laws that prohibit certain types of conductdeemed to be anti-competitive. These laws prohibit price fixing, concerted refusal to deal, market monopolization,price discrimination, tying arrangements, acquisitions of competitors and other practices that have, or may have, anadverse effect on competition. Violations of federal or state antitrust laws can result in various sanctions, includingcriminal and civil penalties. Antitrust enforcement in the health care industry is currently a priority of the FederalTrade Commission. We believe we are in compliance with such federal and state laws, but courts or regulatoryauthorities may reach a determination in the future that could adversely affect our operations.
Environmental Matters
We are subject to various federal, state and local statutes and ordinances regulating the discharge ofmaterials into the environment. We do not believe that we will be required to expend any material amounts inorder to comply with these laws and regulations.
Insurance
As is typical in the health care industry, we are subject to claims and legal actions by patients in the ordinarycourse of business. Subject to a $5 million per occurrence self-insured retention, our facilities are insured by ourwholly-owned insurance subsidiary for losses up to $50 million per occurrence. The insurance subsidiary has
34

obtained reinsurance for professional liability risks generally above a retention level of $15 million peroccurrence. We also maintain professional liability insurance with unrelated commercial carriers for losses inexcess of amounts insured by our insurance subsidiary.
We purchase, from unrelated insurance companies, coverage for directors and officers liability and propertyloss in amounts we believe are adequate. The directors and officers liability coverage includes a $25 millioncorporate deductible for the period prior to November 2006, a $1 million corporate deductible for the periodsubsequent to November 2006 until our initial public offering in March 2011 and a $5 million corporatedeductible subsequent to our initial public offering in March 2011. In addition, we will continue to purchasecoverage for our directors and officers on an ongoing basis. The property coverage includes varying deductiblesdepending on the cause of the property damage. These deductibles range from $500,000 per claim up to 5% ofthe affected property values for certain flood and wind and earthquake related incidents.
Employees and Medical Staffs
At December 31, 2011, we had approximately 199,000 employees, including approximately 49,000 part-time employees. References herein to “employees” refer to employees of our affiliates. We are subject to variousstate and federal laws that regulate wages, hours, benefits and other terms and conditions relating to employment.At December 31, 2011, employees at 38 of our hospitals are represented by various labor unions. While noelections are expected in 2012, it is possible additional hospitals may unionize in the future. We consider ouremployee relations to be good and have not experienced work stoppages that have materially, adversely affectedour business or results of operations. Our hospitals, like most hospitals, have experienced rising labor costs. Insome markets, nurse and medical support personnel availability has become a significant operating issue tohealth care providers. To address this challenge, we have implemented several initiatives to improve retention,recruiting, compensation programs and productivity.
Our hospitals are staffed by licensed physicians, including both employed physicians and physicians whoare not employees of our hospitals. Some physicians provide services in our hospitals under contracts, whichgenerally describe a term of service, provide and establish the duties and obligations of such physicians, requirethe maintenance of certain performance criteria and fix compensation for such services. Any licensed physicianmay apply to be accepted to the medical staff of any of our hospitals, but the hospital’s medical staff and theappropriate governing board of the hospital, in accordance with established credentialing criteria, must approveacceptance to the staff. Members of the medical staffs of our hospitals often also serve on the medical staffs ofother hospitals and may terminate their affiliation with one of our hospitals at any time.
We may be required to continue to enhance wages and benefits to recruit and retain nurses and othermedical support personnel or to hire more expensive temporary or contract personnel. As a result, our labor costscould increase. We also depend on the available labor pool of semi-skilled and unskilled employees in each ofthe markets in which we operate. Certain proposed changes in federal labor laws and the National LaborRelations Board’s (the “NLRB”) modification of its election procedures could increase the likelihood ofemployee unionization attempts. To the extent a significant portion of our employee base unionizes, our costscould increase materially. In addition, the states in which we operate could adopt mandatory nurse-staffing ratiosor could reduce mandatory nurse-staffing ratios already in place. State-mandated nurse-staffing ratios couldsignificantly affect labor costs, and have an adverse impact on revenues if we are required to limit patientadmissions in order to meet the required ratios.
35

Executive Officers of the Registrant
As of February 17, 2012, our executive officers were as follows:
Name Age Position(s)
Richard M. Bracken . . . . . . . . . . . . . 59 Chairman of the Board and Chief Executive OfficerR. Milton Johnson . . . . . . . . . . . . . . . 55 President, Chief Financial Officer and DirectorDavid G. Anderson . . . . . . . . . . . . . . 64 Senior Vice President — Finance and TreasurerVictor L. Campbell . . . . . . . . . . . . . . 65 Senior Vice PresidentJana J. Davis . . . . . . . . . . . . . . . . . . . 53 Senior Vice President — CommunicationsJon M. Foster . . . . . . . . . . . . . . . . . . 50 President — Southwest GroupCharles J. Hall . . . . . . . . . . . . . . . . . . 58 President — National GroupSamuel N. Hazen . . . . . . . . . . . . . . . 51 President — OperationsA. Bruce Moore, Jr. . . . . . . . . . . . . . 51 President — Service Line and Operations IntegrationMichael P. O’Boyle . . . . . . . . . . . . . 55 President and CEO— Parallon Business Solutionssm
Jonathan B. Perlin, M.D. . . . . . . . . . . 50 President — Clinical and Physician Services Group and ChiefMedical Officer
W. Paul Rutledge . . . . . . . . . . . . . . . 57 President — Central GroupJoseph A. Sowell, III . . . . . . . . . . . . . 55 Senior Vice President and Chief Development OfficerJoseph N. Steakley . . . . . . . . . . . . . . 57 Senior Vice President — Internal Audit ServicesJohn M. Steele . . . . . . . . . . . . . . . . . . 56 Senior Vice President — Human ResourcesDonald W. Stinnett . . . . . . . . . . . . . . 55 Senior Vice President and ControllerJuan Vallarino . . . . . . . . . . . . . . . . . . 51 Senior Vice President — Strategic Pricing and AnalyticsRobert A. Waterman . . . . . . . . . . . . . 58 Senior Vice President, General Counsel and Chief Labor Relations
OfficerNoel Brown Williams . . . . . . . . . . . . 56 Senior Vice President and Chief Information OfficerAlan R. Yuspeh . . . . . . . . . . . . . . . . . 62 Senior Vice President and Chief Ethics and Compliance Officer
Richard M. Bracken has served as Chief Executive Officer of the Company since January 2009 and wasappointed as Chairman of the Board in December 2009. Mr. Bracken served as President and Chief ExecutiveOfficer from January 2009 to December 2009. Mr. Bracken was appointed Chief Operating Officer in July 2001and served as President and Chief Operating Officer from January 2002 to January 2009. Mr. Bracken served asPresident — Western Group of the Company from August 1997 until July 2001. From January 1995 to August1997, Mr. Bracken served as President of the Pacific Division of the Company. Prior to 1995, Mr. Brackenserved in various hospital Chief Executive Officer and Administrator positions with HCA-Hospital Corporationof America.
R. Milton Johnson has served as President and Chief Financial Officer of the Company since February 2011and was appointed as a director in December 2009. Mr. Johnson served as Executive Vice President and ChiefFinancial Officer from July 2004 to February 2011 and as Senior Vice President and Controller of the Companyfrom July 1999 until July 2004. Mr. Johnson served as Vice President and Controller of the Company fromNovember 1998 to July 1999. Prior to that time, Mr. Johnson served as Vice President — Tax of the Companyfrom April 1995 to October 1998. Prior to that time, Mr. Johnson served as Director of Tax for Healthtrust,Inc. — The Hospital Company from September 1987 to April 1995.
David G. Anderson has served as Senior Vice President — Finance and Treasurer of the Company since July1999. Mr. Anderson served as Vice President — Finance of the Company from September 1993 to July 1999 andwas appointed to the additional position of Treasurer in November 1996. From March 1993 until September 1993,Mr. Anderson served as Vice President — Finance and Treasurer of Galen Health Care, Inc. From July 1988 toMarch 1993, Mr. Anderson served as Vice President — Finance and Treasurer of Humana Inc.
Victor L. Campbell has served as Senior Vice President of the Company since February 1994. Prior to thattime, Mr. Campbell served as HCA-Hospital Corporation of America’s Vice President for Investor, Corporate
36

and Government Relations. Mr. Campbell joined HCA-Hospital Corporation of America in 1972. Mr. Campbellserves on the board of the Nashville Health Care Council, as a member of the American Hospital Association’sPresident’s Forum, and on the board and Executive Committee of the Federation of American Hospitals.
Jana J. Davis was appointed Senior Vice President — Communications in February 2011. Prior to that time,she served as Vice President of Communications for the Company from November 1997 to February 2011.Ms. Davis joined HCA in 1997 from Burson-Marsteller, where she was a Managing Director and served asCorporate Practice Chair for Latin American operations. Ms. Davis also held a number of Public Affairspositions in the George H.W. Bush and Reagan Administrations. Ms. Davis is an attorney and serves on theBoard of Governors for the Federation of American Hospitals.
Jon M. Foster was appointed President Southwest Group in February 2011. Prior to that, Mr. Foster servedas Division President for the Central and West Texas Division from January 2006 to February 2011. Mr. Fosterjoined HCA in March 2001 as President and CEO of St. David’s HealthCare in Austin, Texas and served in thatposition until February 2011. Prior to joining the Company, Mr. Foster served in various executive capacitieswithin the Baptist Health System, Knoxville, Tennessee and The Methodist Hospital System in Houston, Texas.
Charles J. Hall was appointed President-National Group in February 2011. Prior to that, Mr. Hall served asPresident — Eastern Group from October 2006 to February 2011. Mr. Hall had previously served the Companyas President — North Florida Division from April 2003 until October 2006, as President of the East FloridaDivision from January 1999 until April 2003, as a Market President in the East Florida Division from January1998 until December 1998, as President of the South Florida Division from February 1996 until December 1997,and as President of the Southwest Florida Division from October 1994 until February 1996, and in various othercapacities since 1987.
Samuel N. Hazen was appointed President — Operations of the Company in February 2011. Mr. Hazenserved as President — Western Group from July 2001 to February 2011 and as Chief Financial Officer —Western Group of the Company from August 1995 to July 2001. Mr. Hazen served as Chief Financial Officer —North Texas Division of the Company from February 1994 to July 1995. Prior to that time, Mr. Hazen served invarious hospital and regional Chief Financial Officer positions with Humana Inc. and Galen Health Care, Inc.
A. Bruce Moore, Jr., was appointed President — Service Line and Operations Integration in February 2011.Prior to that, Mr. Moore had served as President — Outpatient Services Group since January 2006. Mr. Mooreserved as Senior Vice President and as Chief Operating Officer — Outpatient Services Group from July 2004 toJanuary 2006 and as Senior Vice President — Operations Administration from July 1999 until July 2004.Mr. Moore served as Vice President — Operations Administration of the Company from September 1997 to July1999, as Vice President — Benefits from October 1996 to September 1997, and as Vice President —Compensation from March 1995 until October 1996.
Michael O’Boyle was appointed President and Chief Executive Officer of Parallon Business Solutions inJanuary 2012. Prior to that, Mr. O’Boyle served as President of UnitedHealth Networks from 2008 to 2012. From2005 to 2008, he served as the Chief Operating Officer of the Cleveland Clinic. He joined the Cleveland Clinic asChief Financial Officer in 2001. From 1991 to 2001, he served as Chief Financial Officer for MedlanticHealthcare Group and MedStar Health, Inc. From 1987 to 1991, he held several financial leadership roles,including Chief Financial Officer, for three hospitals.
Dr. Jonathan B. Perlin was appointed President — Clinical and Physician Services Group and ChiefMedical Officer in February 2011. Dr. Perlin had served as President — Clinical Services Group and ChiefMedical Officer from November 2007 to February 2011 and as Chief Medical Officer and Senior VicePresident — Quality of the Company from August 2006 to November 2007. Prior to joining the Company,Dr. Perlin served as Under Secretary for Health in the U.S. Department of Veterans Affairs since April 2004.Dr. Perlin joined the Veterans Health Administration in November 1999 where he served in various capacities,including as Deputy Under Secretary for Health from July 2002 to April 2004, and as Chief Quality andPerformance Officer from November 1999 to September 2002.
37

W. Paul Rutledge has served as President — Central Group since October 2005. Mr. Rutledge served asPresident of the MidAmerica Division from January 2001 to October 2005. He served as President of TriStarHealth System from June 1996 to January 2001 and served as President of Centennial Medical Center from May1993 to June 1996. He has served in leadership capacities with HCA for more than 29 years, working withhospitals in the United States and London, England.
Joseph A. Sowell, III was appointed as Senior Vice President and Chief Development Officer of theCompany in December 2009. From 1987 to 1996 and again from 1999 to 2009, Mr. Sowell was a partner at thelaw firm of Waller Lansden Dortch & Davis where he specialized in the areas of health care law, mergers andacquisitions, joint ventures, private equity financing, tax law and general corporate law. He also co-managed thefirm’s corporate and commercial transactions practice. From 1996 to 1999, Mr. Sowell served as the head ofdevelopment, and later as the Chief Operating Officer of Arcon Healthcare.
Joseph N. Steakley has served as Senior Vice President — Internal Audit Services of the Company sinceJuly 1999. Mr. Steakley served as Vice President — Internal Audit Services from November 1997 to July 1999.From October 1989 until October 1997, Mr. Steakley was a partner with Ernst & Young LLP. Mr. Steakley is amember of the board of directors of J. Alexander’s Corporation, where he serves on the compensation committeeand as chairman of the audit committee.
John M. Steele has served as Senior Vice President — Human Resources of the Company since November2003. Mr. Steele served as Vice President — Compensation and Recruitment of the Company from November1997 to October 2003. From March 1995 to November 1997, Mr. Steele served as Assistant Vice President —Recruitment.
Donald W. Stinnett has served as Senior Vice President and Controller since December 2008. Mr. Stinnettserved as Chief Financial Officer — Eastern Group from October 2005 to December 2008 and Chief FinancialOfficer of the Far West Division from July 1999 to October 2005. Mr. Stinnett served as Chief Financial Officerand Vice President of Finance of Franciscan Health System of the Ohio Valley from 1995 until 1999, and servedin various capacities with Franciscan Health System of Cincinnati and Providence Hospital in Cincinnati prior tothat time.
Juan Vallarino was appointed Senior Vice President — Strategic Pricing and Analytics in February 2011.Prior to that time, Mr. Vallarino had served as Vice President — Strategic Pricing and Analytics since October2006. Prior to that, Mr. Vallarino served as Vice President of Managed Care for the Western Group of theCompany from January 1998 to October 2006.
Robert A. Waterman has served as Senior Vice President and General Counsel of the Company sinceNovember 1997 and Chief Labor Relations Officer since March 2009. Mr. Waterman served as a partner in thelaw firm of Latham & Watkins from September 1993 to October 1997; he was Chair of the firm’s health caregroup during 1997.
Noel Brown Williams has served as Senior Vice President and Chief Information Officer of the Companysince October 1997. From October 1996 to September 1997, Ms. Williams served as Chief Information Officerfor American Service Group/Prison Health Services, Inc. From September 1995 to September 1996,Ms. Williams worked as an independent consultant. From June 1993 to June 1995, Ms. Williams served as VicePresident, Information Services for HCA Information Services. From February 1979 to June 1993, she heldvarious positions with HCA-Hospital Corporation of America Information Services.
Alan R. Yuspeh has served as Senior Vice President and Chief Ethics and Compliance Officer of theCompany since May 2007. From October 1997 to May 2007, Mr. Yuspeh served as Senior Vice President —Ethics, Compliance and Corporate Responsibility of the Company. From September 1991 until October 1997,Mr. Yuspeh was a partner with the law firm of Howrey & Simon. As a part of his law practice, Mr. Yuspehserved from 1987 to 1997 as Coordinator of the Defense Industry Initiative on Business Ethics and Conduct.
38

Item 1A. Risk Factors
If any of the events discussed in the following risk factors were to occur, our business, financial position,results of operations, cash flows or prospects could be materially, adversely affected. Additional risks anduncertainties not presently known, or currently deemed immaterial, may also constrain our business andoperations.
Our substantial leverage could adversely affect our ability to raise additional capital to fund our operations,limit our ability to react to changes in the economy or our industry, expose us to interest rate risk to the extentof our variable rate debt and prevent us from meeting our obligations.
We are highly leveraged. As of December 31, 2011, our total indebtedness was $27.052 billion. As ofDecember 31, 2011, we had availability of $1.935 billion under our senior secured revolving credit facility and$202 million under our asset-based revolving credit facility, after giving effect to letters of credit and borrowingbase limitations. Our high degree of leverage could have important consequences, including:
• increasing our vulnerability to downturns or adverse changes in general economic, industry orcompetitive conditions and adverse changes in government regulations;
• requiring a substantial portion of cash flow from operations to be dedicated to the payment of principaland interest on our indebtedness, therefore reducing our ability to use our cash flow to fund ouroperations, capital expenditures and future business opportunities;
• exposing us to the risk of increased interest rates as certain of our unhedged borrowings are at variablerates of interest;
• limiting our ability to make strategic acquisitions or causing us to make nonstrategic divestitures;
• limiting our ability to obtain additional financing for working capital, capital expenditures, product orservice line development, debt service requirements, acquisitions and general corporate or otherpurposes; and
• limiting our ability to adjust to changing market conditions and placing us at a competitivedisadvantage compared to our competitors who are less highly leveraged.
We and our subsidiaries have the ability to incur additional indebtedness in the future, subject to therestrictions contained in our senior secured credit facilities and the indentures governing our outstanding notes. Ifnew indebtedness is added to our current debt levels, the related risks that we now face could intensify.
We may not be able to generate sufficient cash to service all of our indebtedness and may not be able torefinance our indebtedness on favorable terms. If we are unable to do so, we may be forced to take otheractions to satisfy our obligations under our indebtedness, which may not be successful.
Our ability to make scheduled payments on or to refinance our debt obligations depends on our financialcondition and operating performance, which are subject to prevailing economic and competitive conditions andto certain financial, business and other factors beyond our control. We cannot assure you we will maintain a levelof cash flows from operating activities sufficient to permit us to pay the principal, premium, if any, and intereston our indebtedness.
In addition, we conduct our operations through our subsidiaries. Accordingly, repayment of ourindebtedness is dependent on the generation of cash flow by our subsidiaries and their ability to make such cashavailable to us by dividend, debt repayment or otherwise. Our subsidiaries may not be able to, or may not bepermitted to, make distributions to enable us to make payments in respect of our indebtedness. Each subsidiary isa distinct legal entity, and, under certain circumstances, legal and contractual restrictions may limit our ability toobtain cash from our subsidiaries.
39

We may find it necessary or prudent to refinance our outstanding indebtedness with longer-maturity debt ata higher interest rate. Our ability to refinance our indebtedness on favorable terms, or at all, is directly affectedby the current global economic and financial conditions. In addition, our ability to incur secured indebtedness(which would generally enable us to achieve better pricing than the incurrence of unsecured indebtedness)depends in part on the value of our assets, which depends, in turn, on the strength of our cash flows and results ofoperations, and on economic and market conditions and other factors.
If our cash flows and capital resources are insufficient to fund our debt service obligations or we are unableto refinance our indebtedness, we may be forced to reduce or delay investments and capital expenditures, or tosell assets, seek additional capital or restructure our indebtedness. These alternative measures may not besuccessful and may not permit us to meet our scheduled debt service obligations. If our operating results andavailable cash are insufficient to meet our debt service obligations, we could face substantial liquidity problemsand might be required to dispose of material assets or operations to meet our debt service and other obligations.We may not be able to consummate those dispositions, or the proceeds from the dispositions may not beadequate to meet any debt service obligations then due.
Our debt agreements contain restrictions that limit our flexibility in operating our business.
Our senior secured credit facilities and the indentures governing our outstanding notes contain variouscovenants that limit our ability to engage in specified types of transactions. These covenants limit our and certainof our subsidiaries’ ability to, among other things:
• incur additional indebtedness or issue certain preferred shares;
• pay dividends on, repurchase or make distributions in respect of our capital stock or make otherrestricted payments;
• make certain investments;
• sell or transfer assets;
• create liens;
• consolidate, merge, sell or otherwise dispose of all or substantially all of our assets; and
• enter into certain transactions with our affiliates.
Under our asset-based revolving credit facility, when (and for as long as) the combined availability underour asset-based revolving credit facility and our senior secured revolving credit facility is less than a specifiedamount for a certain period of time or, if a payment or bankruptcy event of default has occurred and iscontinuing, funds deposited into any of our depository accounts will be transferred on a daily basis into a blockedaccount with the administrative agent and applied to prepay loans under the asset-based revolving credit facilityand to cash collateralize letters of credit issued thereunder.
Under our senior secured credit facilities, we are required to satisfy and maintain specified financial ratios.Our ability to meet those financial ratios can be affected by events beyond our control, and there can be noassurance we will continue to meet those ratios. A breach of any of these covenants could result in a defaultunder both the cash flow credit facility and the asset-based revolving credit facility. Upon the occurrence of anevent of default under the senior secured credit facilities, the lenders thereunder could elect to declare allamounts outstanding under the senior secured credit facilities to be immediately due and payable and terminateall commitments to extend further credit. If we were unable to repay those amounts, the lenders under the seniorsecured credit facilities could proceed against the collateral granted to them to secure such indebtedness. Wehave pledged a significant portion of our assets under our senior secured credit facilities and that collateral (otherthan certain European collateral securing our senior secured European term loan facility) is also pledged ascollateral under our first lien notes. If any of the lenders under the senior secured credit facilities accelerate therepayment of borrowings, there can be no assurance there will be sufficient assets to repay the senior securedcredit facilities, the first lien notes and our other indebtedness.
40

Our hospitals face competition for patients from other hospitals and health care providers.
The health care business is highly competitive, and competition among hospitals and other health careproviders for patients has intensified in recent years. Generally, other hospitals in the local communities we serveprovide services similar to those offered by our hospitals. In addition, CMS publicizes on its Hospital Comparewebsite performance data related to quality measures and data on patient satisfaction surveys hospitals submit inconnection with their Medicare reimbursement. Federal law provides for the future expansion of the number ofquality measures that must be reported. Additional quality measures and future trends toward clinicaltransparency may have an unanticipated impact on our competitive position and patient volumes. Further, theHealth Reform Law requires all hospitals to annually establish, update and make public a list of the hospital’sstandard charges for items and services. If any of our hospitals achieve poor results (or results that are lower thanour competitors) on these quality measures or on patient satisfaction surveys or if our standard charges are higherthan our competitors, our patient volumes could decline.
In addition, the number of freestanding specialty hospitals, surgery centers and diagnostic and imagingcenters in the geographic areas in which we operate has increased significantly. As a result, most of our hospitalsoperate in a highly competitive environment. Some of the facilities that compete with our hospitals are owned bygovernmental agencies or not-for-profit corporations supported by endowments, charitable contributions and/ortax revenues and can finance capital expenditures and operations on a tax-exempt basis. Our hospitals facecompetition from specialty hospitals, some of which are physician-owned, and from both our own andunaffiliated freestanding surgery centers for market share in certain high margin services and for qualityphysicians and personnel. If ambulatory surgery centers are better able to compete in this environment than ourhospitals, our hospitals may experience a decline in patient volume, and we may experience a decrease in margin,even if those patients use our ambulatory surgery centers. In states that do not require a CON for the purchase,construction or expansion of health care facilities or services, competition in the form of new services, facilitiesand capital spending is more prevalent. Further, if our competitors are better able to attract patients, make capitalexpenditures and maintain modern and technologically upgraded facilities and equipment, recruit physicians,expand services or obtain favorable managed care contracts at their facilities than our hospitals and ambulatorysurgery centers, we may experience an overall decline in patient volume. See Item 1, “Business — Competition.”
The growth of uninsured and patient due accounts and a deterioration in the collectibility of these accountscould adversely affect our results of operations.
The primary collection risks of our accounts receivable relate to the uninsured patient accounts and patientaccounts for which the primary insurance carrier has paid the amounts covered by the applicable agreement, butpatient responsibility amounts (exclusions, deductibles and copayments) remain outstanding. The provision fordoubtful accounts relates primarily to amounts due directly from patients. Although Medicare reimburseshospitals for a portion of Medicare bad debts, the Jobs Creation Act will reduce the reimbursement level from70% of eligible bad debts to 65% beginning in federal fiscal year 2013.
The amount of the provision for doubtful accounts is based upon management’s assessment of historicalwrite-offs and expected net collections, business and economic conditions, trends in federal and stategovernmental and private employer health care coverage, the rate of growth in uninsured patient admissions andother collection indicators. At December 31, 2011, our allowance for doubtful accounts representedapproximately 92% of the $4.478 billion patient due accounts receivable balance. The sum of the provision fordoubtful accounts, uninsured discounts and charity care increased from $8.362 billion for 2009 to $9.626 billionfor 2010 and to $11.214 billion for 2011.
A continuation of the trends that have resulted in an increasing proportion of accounts receivable beingcomprised of uninsured accounts and a deterioration in the collectibility of these accounts will adversely affectour collection of accounts receivable, cash flows and results of operations. We may also be adversely affected bythe growth in patient responsibility accounts as a result of increases in the adoption of plan structures, including
41

health savings accounts, that shift greater responsibility for care to individuals through greater exclusions andcopayment and deductible amounts. Prior to the Health Reform Law being fully implemented, our facilities mayexperience growth in bad debts, uninsured discounts and charity care as a result of a number of factors, includingthe economic downturn and continued high unemployment. The Health Reform Law seeks to decrease, overtime, the number of uninsured individuals through reforms that mostly will become effective January 1, 2014,provided the law is not found to be unconstitutional or otherwise revised. Even after full implementation of theHealth Reform Law, we may continue to experience bad debts and have to provide uninsured discounts andcharity care for undocumented aliens who are not permitted to enroll in a health insurance exchange orgovernment health care programs and certain others who may not have insurance coverage. Further,implementation of the Health Reform Law could result in some patients terminating their current insurance plansin favor of lower cost Medicaid plans or other insurance coverage with lower reimbursement levels. Patientresponsibility accounts may continue to increase even with expanded health plan coverage as a result of increasesin plan exclusions and deductibles and copayment amounts.
It is difficult to predict the full impact of the Health Reform Law due to the law’s complexity, lack ofimplementing regulations or interpretive guidance, gradual and potentially delayed implementation, pendingcourt challenges and possible amendment or repeal, as well as our inability to foresee how individuals andbusinesses will respond to the choices afforded them by the law.
Changes in government health care programs may adversely affect our revenues.
A significant portion of our patient volume is derived from government health care programs, principallyMedicare and Medicaid. Specifically, we derived 44.5% of our revenues from the Medicare and Medicaidprograms in 2011. Changes in government health care programs may reduce the reimbursement we receive andcould adversely affect our business and results of operations.
In recent years, legislative and regulatory changes have resulted in limitations on and, in some cases,reductions in levels of payments to health care providers for certain services under the Medicare program. TheBudget Control Act of 2011 (the “BCA”) provides for new spending on program integrity initiatives intendedto reduce fraud and abuse under the Medicare program. Further, pursuant to the BCA, a bipartisan jointcongressional committee was created to identify additional deficit reductions. Because the committee failed topropose a plan to cut the deficit by an additional $1.2 trillion by the November 23, 2011, deadline, the BCArequires automatic spending reductions of $1.2 trillion for federal fiscal years 2013 through 2021, minus anydeficit reductions enacted by Congress and debt service costs. However, the percentage reduction for Medicaremay not be more than 2% for a fiscal year, with a uniform percentage reduction across all Medicare programs.We are unable to predict how these spending reductions will be structured, what other deficit reductioninitiatives may be proposed by Congress or whether Congress will attempt to suspend or restructure theautomatic budget cuts.
These reductions will be in addition to reductions mandated by the Health Reform Law, which provides formaterial reductions in the growth of Medicare program spending, including reductions in Medicare market basketupdates and Medicare DSH funding. Further, from time to time, CMS revises the reimbursement systems used toreimburse health care providers, including changes to the MS-DRG system and other payment systems, whichmay result in reduced Medicare payments.
Since most states must operate with balanced budgets and since the Medicaid program is often a state’slargest program, some states have enacted or may consider enacting legislation designed to reduce their Medicaidexpenditures. Further, many states have also adopted, or are considering, legislation designed to reduce coverage,enroll Medicaid recipients in managed care programs and/or impose additional taxes on hospitals to help financeor expand the states’ Medicaid systems. The current economic environment has increased the budgetarypressures on many states, and these budgetary pressures have resulted, and likely will continue to result, indecreased spending, or decreased spending growth, for Medicaid programs and the Children’s Health Insurance
42

Program in many states. For example, in May 2011, the Florida legislature passed a budget agreement for thefiscal year beginning July 1, 2011 that reduces Medicaid reimbursements to hospitals. As a result, we estimatethat Florida Medicaid payments to our hospitals may be reduced by approximately $35 million during the firsthalf of calendar year 2012. Additionally, the Texas legislature passed a budget agreement effective September 1,2011 that reduces Medicaid reimbursements to hospitals. As a result, we estimate that Texas Medicaid paymentsto our hospitals may be reduced by approximately $60 million in 2012. Some states that provide Medicaidsupplemental payments are reviewing these programs or have filed waiver requests with CMS to replace theseprograms, which could result in Medicaid supplemental payments being reduced or eliminated. CMS approved aMedicaid waiver in December 2011 that allows Texas to continue receiving supplemental Medicaidreimbursement while expanding its Medicaid managed care program. However, we cannot predict whether theTexas private supplemental Medicaid Waiver Program will continue or guarantee that revenues recognized fromthe program will not decrease.
The Health Reform Law has changed and will likely result in additional changes to the Medicaid program.For example, the Health Reform Law provides for material reductions to Medicaid DSH funding. EffectiveMarch 23, 2010, the Health Reform Law requires states to at least maintain Medicaid eligibility standardsestablished prior to the enactment of the law for adults until January 1, 2014 and for children until October 1,2019. However, states with budget deficits may seek a waiver from this requirement to address eligibilitystandards that apply to adults making more than 133% of the federal poverty level. The Health Reform Law alsoprovides for significant expansions to the Medicaid program, but these changes are not required until 2014. Inaddition, the Health Reform Law will result in increased state legislative and regulatory changes in order forstates to comply with new federal mandates, such as the requirement to establish Exchanges, and to participate ingrants and other incentive opportunities.
In some cases, commercial third-party payers rely on all or portions of Medicare payment systems todetermine payment rates. Changes to government health care programs that reduce payments under theseprograms may negatively impact payments from commercial third-party payers.
Current or future health care reform and deficit reduction efforts, changes in laws or regulations regardinggovernment health care programs, other changes in the administration of government health care programs andchanges to commercial third-party payers in response to health care reform and other changes to governmenthealth care programs could have a material, adverse effect on our financial position and results of operations.
We are unable to predict the impact of the Health Reform Law, which represents a significant change to thehealth care industry.
As enacted, the Health Reform Law will change how health care services are covered, delivered, andreimbursed through expanded coverage of uninsured individuals, reduced growth in Medicare program spending,reductions in Medicare and Medicaid DSH payments and the establishment of programs where reimbursement istied to quality and integration. In addition, the law reforms certain aspects of health insurance, expands existingefforts to tie Medicare and Medicaid payments to performance and quality, and contains provisions intended tostrengthen fraud and abuse enforcement. The expansion of health insurance coverage under the Health ReformLaw may result in a material increase in the number of patients using our facilities who have either private orpublic program coverage. In addition, a disproportionately large percentage of the new Medicaid coverage islikely to be in states that currently have relatively low income eligibility requirements. Two such states are Texasand Florida, where about one-half of the Company’s licensed beds are located. The Company also has asignificant presence in other relatively low income eligibility states, including Georgia, Kansas, Louisiana,Missouri, Oklahoma and Virginia. Further, the Health Reform Law provides for a value-based purchasingprogram, the establishment of ACOs and bundled payment pilot programs, which will create possible sources ofadditional revenue.
43

However, it is difficult to predict the size of the potential revenue gains to the Company as a result of theseelements of the Health Reform Law, because of uncertainty surrounding a number of material factors, includingthe following:
• how many previously uninsured individuals will obtain coverage as a result of the Health Reform Law(while the CBO estimates 32 million by 2016 and 34 million by 2021, CMS estimates almost34 million by 2019; both agencies made a number of assumptions to derive that figure, including howmany individuals will ignore substantial subsidies and decide to pay the penalty rather than obtainhealth insurance and what percentage of people in the future will meet the new Medicaid incomeeligibility requirements);
• what percentage of the newly insured patients will be covered under the Medicaid program and whatpercentage will be covered by private health insurers;
• the extent to which states will enroll new Medicaid participants in managed care programs;
• the pace at which insurance coverage expands, including the pace of different types of coverageexpansion;
• the change, if any, in the volume of inpatient and outpatient hospital services that are sought by andprovided to previously uninsured individuals;
• the rate paid to hospitals by private payers for newly covered individuals, including those coveredthrough the newly created Exchanges and those who might be covered under the Medicaid programunder contracts with the state;
• the rate paid by state governments under the Medicaid program for newly covered individuals;
• the effect of the value-based purchasing program on our hospitals’ revenues and the effects of otherquality programs;
• the percentage of individuals in the Exchanges who select the high deductible plans, since healthinsurers offering those kinds of products have traditionally sought to pay lower rates to hospitals;
• whether the net effect of the Health Reform Law, including the prohibition on excluding individualsbased on pre-existing conditions, the requirement to keep medical costs at or above a specifiedminimum percentage of premium revenue, other health insurance reforms and the annual fee applied toall health insurers, will be to put pressure on the bottom line of health insurers, which in turn mightcause them to seek to reduce payments to hospitals with respect to both newly insured individuals andtheir existing business; and
• the possibility that implementation of the provisions expanding health insurance coverage or the entireHealth Reform Law will be delayed, revised or eliminated as a result of court challenges and efforts torepeal or amend the law. Numerous lawsuits have challenged the constitutionality of the Health ReformLaw. Some federal courts have upheld the constitutionality of the Health Reform Law or dismissedcases on procedural grounds. Others have held unconstitutional the requirement that individualsmaintain health insurance or pay a penalty and have either found the Health Reform Law void in itsentirety or left the remainder of the law intact. The U.S. Supreme Court is expected to decide theconstitutionality of the Health Reform Law in 2012. In addition, repeal of the Health Reform Law hasbecome a theme in political campaigns during this election year.
44

On the other hand, the Health Reform Law provides for significant reductions in the growth of Medicarespending, reductions in Medicare and Medicaid DSH payments and the establishment of programs wherereimbursement is tied to quality and integration. Since 44.5% of our revenues in 2011 were from Medicare andMedicaid, reductions to these programs may significantly impact the Company and could offset any positiveeffects of the Health Reform Law. It is difficult to predict the size of the revenue reductions to Medicare andMedicaid spending, because of uncertainty regarding a number of material factors, including the following:
• the amount of overall revenues the Company will generate from Medicare and Medicaid business whenthe reductions are implemented;
• whether reductions required by the Health Reform Law will be changed by statute or by judicialdecision prior to becoming effective;
• the size of the Health Reform Law’s annual productivity adjustment to the market basket;
• the amount of the Medicare DSH reductions that will be made, commencing in federal fiscal year 2014;
• the allocation to our hospitals of the Medicaid DSH reductions, commencing in federal fiscal year2014;
• what the losses in revenues will be, if any, from the Health Reform Law’s quality initiatives;
• how successful ACOs will be at coordinating care and reducing costs or whether they will decreasereimbursement;
• the scope and nature of potential changes to Medicare reimbursement methods, such as an emphasis onbundling payments or coordination of care programs;
• whether the Company’s revenues from upper payment limit (“UPL”) programs, or other Medicaidsupplemental programs developed through a federally approved waiver program (“Waiver Program”),will be adversely affected because there may be reductions in available state and local governmentfunding for the programs; and
• reductions to Medicare payments CMS may impose for “excessive readmissions.”
Because of the many variables involved, we are unable to predict the net effect on the Company of theexpected increases in insured individuals using our facilities, reductions in Medicare spending, reductions inMedicare and Medicaid DSH funding, and numerous other provisions in the Health Reform Law that may affectthe Company. Further, it is unclear how efforts to repeal or revise the Health Reform Law and federal lawsuitschallenging its constitutionality will be resolved or what the impact would be of any resulting changes to the law.
If we are unable to retain and negotiate favorable contracts with nongovernment payers, including managedcare plans, our revenues may be reduced.
Our ability to obtain favorable contracts with nongovernment payers, including HMOs, PPOs and othermanaged care plans significantly affects the revenues and operating results of our facilities. Revenues derivedfrom these entities and other insurers accounted for 52.9% and 52.7% of our revenues for 2011 and 2010,respectively. Nongovernment payers, including managed care payers, continue to demand discounted feestructures, and the trend toward consolidation among nongovernment payers tends to increase their bargainingpower over fee structures. As various provisions of the Health Reform Law are implemented, including theestablishment of the Exchanges, nongovernment payers increasingly may demand reduced fees. Our futuresuccess will depend, in part, on our ability to retain and renew our managed care contracts and enter into newmanaged care contracts on terms favorable to us. Other health care providers may impact our ability to enter intomanaged care contracts or negotiate increases in our reimbursement and other favorable terms and conditions.For example, some of our competitors may negotiate exclusivity provisions with managed care plans orotherwise restrict the ability of managed care companies to contract with us. It is not clear what impact, if any,the increased obligations on managed care payers and other payers imposed by the Health Reform Law will haveon our ability to negotiate reimbursement increases. If we are unable to retain and negotiate favorable contractswith managed care plans or experience reductions in payment increases or amounts received fromnongovernment payers, our revenues may be reduced.
45

Our performance depends on our ability to recruit and retain quality physicians.
The success of our hospitals depends in part on the number and quality of the physicians on the medicalstaffs of our hospitals, the admitting and utilization practices of those physicians, maintaining good relations withthose physicians and controlling costs related to the employment of physicians. Although we employ somephysicians, physicians are often not employees of the hospitals at which they practice and, in many of themarkets we serve, most physicians have admitting privileges at other hospitals in addition to our hospitals. Suchphysicians may terminate their affiliation with our hospitals at any time. If we are unable to provide adequatesupport personnel or technologically advanced equipment and hospital facilities that meet the needs of thosephysicians and their patients, they may be discouraged from referring patients to our facilities, admissions maydecrease and our operating performance may decline.
Our hospitals face competition for staffing, which may increase labor costs and reduce profitability.
Our operations are dependent on the efforts, abilities and experience of our management and medicalsupport personnel, such as nurses, pharmacists and lab technicians, as well as our physicians. We compete withother health care providers in recruiting and retaining qualified management and support personnel responsiblefor the daily operations of each of our hospitals, including nurses and other nonphysician health careprofessionals. In some markets, the availability of nurses and other medical support personnel has been asignificant operating issue to health care providers. We may be required to continue to enhance wages andbenefits to recruit and retain nurses and other medical support personnel or to hire more expensive temporary orcontract personnel. As a result, our labor costs could increase. We also depend on the available labor pool ofsemi-skilled and unskilled employees in each of the markets in which we operate. Certain proposed changes infederal labor laws and the NLRB’s modification of its election procedures could increase the likelihood ofemployee unionization attempts. To the extent a significant portion of our employee base unionizes, it is possibleour labor costs could increase materially. When negotiating collective bargaining agreements with unions,whether such agreements are renewals or first contracts, there is the possibility that strikes could occur during thenegotiation process, and our continued operation during any strikes could increase our labor costs. In addition,the states in which we operate could adopt mandatory nurse-staffing ratios or could reduce mandatory nursestaffing ratios already in place. State-mandated nurse-staffing ratios could significantly affect labor costs andhave an adverse impact on revenues if we are required to limit admissions in order to meet the required ratios. Ifour labor costs increase, we may not be able to raise rates to offset these increased costs. Because a significantpercentage of our revenues consists of fixed, prospective payments, our ability to pass along increased labor costsis constrained. Our failure to recruit and retain qualified management, nurses and other medical supportpersonnel, or to control labor costs, could have a material, adverse effect on our results of operations.
If we fail to comply with extensive laws and government regulations, we could suffer penalties or be requiredto make significant changes to our operations.
The health care industry is required to comply with extensive and complex laws and regulations at thefederal, state and local government levels relating to, among other things:
• billing and coding for services and properly handling overpayments;
• classification of level of care provided, including proper classification of inpatient admissions,observation services and outpatient care;
• relationships with physicians and other referral sources;
• necessity and adequacy of medical care;
• quality of medical equipment and services;
• qualifications of medical and support personnel;
• confidentiality, maintenance, data breach, identity theft and security issues associated with health-related and personal information and medical records;
46

• screening, stabilization and transfer of individuals who have emergency medical conditions;
• licensure and certification;
• hospital rate or budget review;
• preparing and filing of cost reports;
• operating policies and procedures;
• activities regarding competitors; and
• addition of facilities and services.
Among these laws are the federal Anti-kickback Statute, the federal Stark Law, the federal FCA and similarstate laws. We have a variety of financial relationships with physicians and others who either refer or influencethe referral of patients to our hospitals and other health care facilities, and these laws govern those relationships.The OIG has enacted safe harbor regulations that outline practices deemed protected from prosecution under theAnti-kickback Statute. While we endeavor to comply with the applicable safe harbors, certain of our currentarrangements, including joint ventures and financial relationships with physicians and other referral sources andpersons and entities to which we refer patients, do not qualify for safe harbor protection. Failure to qualify for asafe harbor does not mean the arrangement necessarily violates the Anti-kickback Statute but may subject thearrangement to greater scrutiny. However, we cannot offer assurance that practices outside of a safe harbor willnot be found to violate the Anti-kickback Statute. Allegations of violations of the Anti-kickback Statute may bebrought under the federal Civil Monetary Penalty Law, which requires a lower burden of proof than other fraudand abuse laws, including the Anti-kickback Statute.
Our financial relationships with referring physicians and their immediate family members must comply withthe Stark Law by meeting an exception. We attempt to structure our relationships to meet an exception to theStark Law, but the regulations implementing the exceptions are detailed and complex, and we cannot provideassurance that every relationship complies fully with the Stark Law. Unlike the Anti-kickback Statute, failure tomeet an exception under the Stark Law results in a violation of the Stark Law, even if such violation is technicalin nature.
Additionally, if we violate the Anti-kickback Statute or Stark Law, or if we improperly bill for our services,we may be found to violate the FCA, either under a suit brought by the government or by a private person undera qui tam, or “whistleblower,” suit. See Item 1, “Business — Regulation and Other Factors.”
If we fail to comply with the Anti-kickback Statute, the Stark Law, the FCA or other applicable laws andregulations, we could be subjected to liabilities, including civil penalties (including the loss of our licenses tooperate one or more facilities), exclusion of one or more facilities from participation in the Medicare, Medicaidand other federal and state health care programs and, for violations of certain laws and regulations, criminalpenalties.
We do not always have the benefit of significant regulatory or judicial interpretation of these laws andregulations. In the future, different interpretations or enforcement of, or amendment to, these laws andregulations could subject our current or past practices to allegations of impropriety or illegality or could requireus to make changes in our facilities, equipment, personnel, services, capital expenditure programs and operatingexpenses. A determination that we have violated these laws, or the public announcement that we are beinginvestigated for possible violations of these laws, could have a material, adverse effect on our business, financialcondition, results of operations or prospects, and our business reputation could suffer significantly. In addition,other legislation or regulations at the federal or state level may be adopted that adversely affect our business.
We have been and could become the subject of governmental investigations, claims and litigation.
Health care companies are subject to numerous investigations by various governmental agencies. Further,under the FCA, private parties have the right to bring qui tam, or “whistleblower,” suits against companies that
47

submit false claims for payments to, or improperly retain overpayments from, the government. Some states haveadopted similar state whistleblower and false claims provisions. Certain of our individual facilities have received,and other facilities may receive, government inquiries from, and may be subject to investigation by, federal andstate agencies. Depending on whether the underlying conduct in these or future inquiries or investigations couldbe considered systemic, their resolution could have a material, adverse effect on our financial position, results ofoperations and liquidity.
Governmental agencies and their agents, such as the Medicare Administrative Contractors, fiscalintermediaries and carriers, as well as the OIG, CMS and state Medicaid programs, conduct audits of our healthcare operations. Private payers may conduct similar post-payment audits, and we also perform internal audits andmonitoring. Depending on the nature of the conduct found in such audits and whether the underlying conductcould be considered systemic, the resolution of these audits could have a material, adverse effect on our financialposition, results of operations and liquidity.
As required by statute, CMS has implemented the RAC program on a nationwide basis. Under the program,CMS contracts with RACs on a contingency fee basis to conduct post-payment reviews to detect and correctimproper payments in the fee-for-service Medicare program. The Health Reform Law expands the RACprogram’s scope to include managed Medicare plans and to include Medicaid claims. In addition, CMS employsMICs to perform post-payment audits of Medicaid claims and identify overpayments. The Health Reform Lawincreases federal funding for the MIC program. In addition to RACs and MICs, the state Medicaid agencies andother contractors have increased their review activities.
Should we be found out of compliance with any of these laws, regulations or programs, depending on thenature of the findings, our business, our financial position and our results of operations could be negativelyimpacted.
Physician utilization practices and treatment methodologies or governmental or managed care controlsdesigned to reduce inpatient services or surgical procedures may reduce our revenues.
Controls imposed by Medicare, managed Medicare, Medicaid, managed Medicaid and commercial third-party payers designed to reduce admissions, intensity of services, surgical volumes and lengths of stay, in someinstances referred to as “utilization review,” have affected and are expected to continue to affect our facilities.Utilization review entails the review of the admission and course of treatment of a patient by health plans.Inpatient utilization, average lengths of stay and occupancy rates continue to be negatively affected by payer-required preadmission authorization and utilization review and by payer pressure to maximize outpatient andalternative health care delivery services for less acutely ill patients. Efforts to impose more stringent cost controlsare expected to continue. For example, the Health Reform Law potentially expands the use of prepayment reviewby Medicare contractors by eliminating statutory restrictions on their use. Although we are unable to predict theeffect these changes will have on our operations, significant limits on the scope of services reimbursed and onreimbursement rates and fees could have a material, adverse effect on our business, financial position and resultsof operations. Additionally, trends in physician treatment protocols and managed care health plan design, such asplans that shift increased costs and accountability for care to patients, could reduce our surgical volumes andadmissions in favor of lower intensity and lower cost treatment methodologies.
Our overall business results may suffer from the economic downturn.
During periods of high unemployment, governmental entities often experience budget deficits as a result ofincreased costs and lower than expected tax collections. These budget deficits at federal, state and localgovernment entities have decreased, and may continue to decrease, spending for health and human serviceprograms, including Medicare, Medicaid and similar programs, which represent significant payer sources for ourhospitals. Other risks we face during periods of high unemployment include potential declines in the populationcovered under managed care agreements, patient decisions to postpone or cancel elective and non-emergencyhealth care procedures (including delaying surgical procedures), potential increases in the uninsured andunderinsured populations and further difficulties in our collecting patient copayment and deductible receivables.
48

The industry trend towards value-based purchasing may negatively impact our revenues.
There is a trend in the health care industry towards value-based purchasing of health care services. Thesevalue-based purchasing programs include both public reporting of quality data and preventable adverse eventstied to the quality and efficiency of care provided by facilities. Governmental programs including Medicarecurrently require hospitals to report certain quality data to receive full reimbursement updates. In addition,Medicare does not reimburse for care related to certain preventable adverse events (also called “never events”).Many large commercial payers currently require hospitals to report quality data, and several commercial payersdo not reimburse hospitals for certain preventable adverse events. Further, we have implemented a policypursuant to which we do not bill patients or third-party payers for fees or expenses incurred due to certainpreventable adverse events.
Effective July 1, 2011, the Health Reform Law also prohibits the use of federal funds under the Medicaidprogram to reimburse providers for medical assistance provided to treat HACs. Beginning in federal fiscal year2015, the 25% of hospitals with the worst national risk-adjusted HAC rates in the previous year will receive a 1%reduction in their total inpatient operating Medicare payments. Beginning in fiscal year 2013, hospitals withexcessive readmissions for conditions designated by HHS will receive a reduction of 1% in operating paymentsfor all inpatient discharges, not just discharges relating to the conditions subject to the excessive readmissionstandard. This rate will increase by 1% each year up to 3% in federal fiscal year 2015.
The Health Reform Law also requires HHS to implement a value-based purchasing program for inpatienthospital services. The Health Reform Law requires HHS to reduce inpatient hospital payments for all dischargesby a percentage beginning at 1% in federal fiscal year 2013 and increasing by 0.25% each fiscal year up to 2% infederal fiscal year 2017 and subsequent years. HHS will pool the amount collected from these reductions to fundpayments to reward hospitals that meet or exceed certain quality performance standards established by HHS.According to the value-based purchasing program final rule, CMS estimates that it will distribute $850 million tohospitals in federal fiscal year 2013 based on their achievement (relative to other hospitals) and improvementranges (relative to the hospital’s own past performance). Hospitals that meet or exceed the quality performancestandards will receive greater reimbursement under the value-based purchasing program than they would haveotherwise.
We expect value-based purchasing programs, including programs that condition reimbursement on patientoutcome measures, to become more common and to involve a higher percentage of reimbursement amounts. Weare unable at this time to predict how this trend will affect our results of operations, but it could negativelyimpact our revenues.
Our operations could be impaired by a failure of our information systems.
Any system failure that causes an interruption in service or availability of our systems could adversely affectoperations or delay the collection of revenues. Even though we have implemented network security measures,our servers are vulnerable to computer viruses, break-ins and similar disruptions from unauthorized tampering.The occurrence of any of these events could result in interruptions, delays, the loss or corruption of data,cessations in the availability of systems or liability under privacy and security laws, all of which could have amaterial adverse effect on our financial position and results of operations and harm our business reputation.
The performance of our information technology and systems is critical to our business operations. Inaddition to our shared services initiatives, our information systems are essential to a number of critical areas ofour operations, including:
• accounting and financial reporting;
• billing and collecting accounts;
• coding and compliance;
49

• clinical systems;
• medical records and document storage;
• inventory management;
• negotiating, pricing and administering managed care contracts and supply contracts; and
• monitoring quality of care and collecting data on quality measures necessary for full Medicare paymentupdates.
If we fail to effectively and timely implement electronic health record systems and transition to the ICD-10coding system, our operations could be adversely affected.
As required by ARRA, the Secretary of HHS has developed and implemented an incentive paymentprogram for eligible hospitals and health care professionals that adopt and meaningfully use certified EHRtechnology. HHS uses the Provider Enrollment, Chain and Ownership System (“PECOS”) to verify Medicareenrollment prior to making EHR incentive program payments. During 2011, we received Medicare and Medicaidincentive payments for being a meaningful user of certified EHR technology and recorded incentive income of$210 million for the year. EHR incentive income for our eligible hospitals and professionals is estimated to rangefrom $325 million to $350 million for 2012. Actual incentive payments could vary from our estimates due tocertain factors such as availability of federal funding for both Medicare and Medicaid incentive payments, timingof the approval of state Medicaid incentive payment plans by CMS and our ability to continue to demonstratemeaningful use of certified EHR technology.
We have incurred and will continue to incur both capital costs and operating expenses in order to implementour certified EHR technology and meet meaningful use requirements. These expenses are ongoing and areprojected to continue over all stages of implementation of meaningful use. The timing of expenses will notcorrelate with the receipt of the incentive payments and the recognition of incentive income. During 2011, weincurred $77 million of operating expenses to implement our certified EHR technology and to meet meaningfuluse. We estimate that operating expenses to implement our certified EHR technology and meet meaningful usewill range from $140 million to $160 million for 2012. Actual operating expenses could vary from theseestimates. If our eligible hospitals and employed professionals are unable to meet the requirements forparticipation in the incentive payment program, including having an enrollment record in PECOS, we will not beeligible to receive incentive payments that could offset some of the costs of implementing EHR systems. Further,eligible providers that fail to demonstrate meaningful use of certified EHR technology will be subject to reducedpayments from Medicare, beginning in federal fiscal year 2015 for eligible hospitals and calendar year 2015 foreligible professionals. Failure to implement certified EHR systems effectively and in a timely manner could havea material, adverse effect on our financial position and results of operations.
Health plans and providers, including our hospitals, are required to transition to the new ICD-10 codingsystem, which greatly expands the number and detail of billing codes used for inpatient claims. Under currentregulations, use of the ICD-10 system is required beginning October 1, 2013, but CMS has announced its intentto extend this deadline. Transition to the new ICD-10 system requires significant investment in codingtechnology and software as well as the training of staff involved in the coding and billing process. In addition tothese upfront costs of transition to ICD-10, it is possible that our hospitals could experience disruption or delaysin payment due to technical or coding errors or other implementation issues involving our systems or the systemsand implementation efforts of health plans and their business partners. Further, the transition to the more detailedICD-10 coding system could result in decreased reimbursement if the use of ICD-10 codes results in conditionsbeing reclassified to MS-DRGs or commercial payer payment groupings with lower levels of reimbursement thanassigned under the previous system.
State efforts to regulate the construction or expansion of health care facilities could impair our ability tooperate and expand our operations.
Some states, particularly in the eastern part of the country, require health care providers to obtain priorapproval, known as a CON, for the purchase, construction or expansion of health care facilities, to make certain
50

capital expenditures or to make changes in services or bed capacity. In giving approval, these states consider theneed for additional or expanded health care facilities or services. We currently operate health care facilities in anumber of states with CON laws. The failure to obtain any requested CON could impair our ability to operate orexpand operations. Any such failure could, in turn, adversely affect our ability to attract patients and physiciansto our facilities and grow our revenues, which would have an adverse effect on our results of operations.
Our facilities are heavily concentrated in Florida and Texas, which makes us sensitive to regulatory,economic, environmental and competitive conditions and changes in those states.
We operated 163 hospitals at December 31, 2011, and 75 of those hospitals are located in Florida and Texas.Our Florida and Texas facilities’ combined revenues represented approximately 50% of our consolidatedrevenues for the year ended December 31, 2011. This concentration makes us particularly sensitive to regulatory,economic, environmental and competitive conditions and changes in those states. Any material change in thecurrent payment programs or regulatory, economic, environmental or competitive conditions in those states couldhave a disproportionate effect on our overall business results.
In addition, our hospitals in Florida, Texas and other areas across the Gulf Coast are located in hurricane-prone areas. In the past, hurricanes have had a disruptive effect on the operations of our hospitals in Florida,Texas and other coastal states, and the patient populations in those states. Our business activities could beharmed by a particularly active hurricane season or even a single storm, and the property insurance we obtainmay not be adequate to cover losses from future hurricanes or other natural disasters.
We may be subject to liabilities from claims by the Internal Revenue Service.
We are currently contesting certain claimed deficiencies and adjustments proposed by the IRS ExaminationDivision in connection with its audit of HCA Inc.’s 2005 and 2006 federal income tax returns. The disputeditems include the timing of recognition of certain patient service revenues, the deductibility of certain debtretirement costs and our method for calculating the tax allowance for doubtful accounts. The IRS ExaminationDivision began an audit of HCA Inc.’s 2007, 2008 and 2009 federal income tax returns in 2010.
Management believes HCA Holdings, Inc., its predecessors, subsidiaries and affiliates properly reportedtaxable income and paid taxes in accordance with applicable laws and agreements established with the IRS andfinal resolution of these disputes will not have a material, adverse effect on our results of operations or financialposition. However, if payments due upon final resolution of these issues exceed our recorded estimates, suchresolutions could have a material, adverse effect on our results of operations or financial position.
We may be subject to liabilities from claims brought against our facilities.
We are subject to litigation relating to our business practices, including claims and legal actions by patientsand others in the ordinary course of business alleging malpractice, product liability or other legal theories. Manyof these actions involve large claims and significant defense costs. We insure a portion of our professionalliability risks through a wholly-owned subsidiary. Management believes our reserves for self-insured retentionsand insurance coverage are sufficient to cover insured claims arising out of the operation of our facilities. Ourwholly-owned insurance subsidiary has entered into certain reinsurance contracts, and the obligations covered bythe reinsurance contracts are included in its reserves for professional liability risks, as the subsidiary remainsliable to the extent that the reinsurers do not meet their obligations under the reinsurance contracts. If paymentsfor claims exceed actuarially determined estimates, are not covered by insurance, or reinsurers, if any, fail tomeet their obligations, our results of operations and financial position could be adversely affected.
We are exposed to market risks related to changes in the market values of securities and interest rate changes.
We are exposed to market risk related to changes in market values of securities. The investments in debt andequity securities of our wholly-owned insurance subsidiaries were $621 million and $7 million, respectively, at
51

December 31, 2011. These investments are carried at fair value, with changes in unrealized gains and lossesbeing recorded as adjustments to other comprehensive income. At December 31, 2011, we had a net unrealizedgain of $11 million on the insurance subsidiaries’ investment securities.
We are exposed to market risk related to market illiquidity. Investments in debt and equity securities of ourwholly-owned insurance subsidiaries could be impaired by the inability to access the capital markets. Should thewholly-owned insurance subsidiaries require significant amounts of cash in excess of normal cash requirementsto pay claims and other expenses on short notice, we may have difficulty selling these investments in a timelymanner or be forced to sell them at a price less than what we might otherwise have been able to in a normalmarket environment. We may be required to recognize other-than-temporary impairments on long-terminvestments in future periods should issuers default on interest payments or should the fair market valuations ofthe securities deteriorate due to ratings downgrades or other issue specific factors.
We are also exposed to market risk related to changes in interest rates, and we periodically enter intointerest rate swap agreements to manage our exposure to these fluctuations. Our interest rate swap agreementsinvolve the exchange of fixed and variable rate interest payments between two parties, based on commonnotional principal amounts and maturity dates. The notional amounts of the swap agreements represent balancesused to calculate the exchange of cash flows and are not our assets or liabilities.
The Investors control us and may have conflicts of interest with us in the future.
As of December 31, 2011, the Investors indirectly owned approximately 62% of our capital stock. As aresult, the Investors have control over our decisions to enter into any significant corporate transaction and havethe ability to prevent any transaction that requires the approval of stockholders. For example, the Investors couldcause us to make acquisitions that increase the amount of our indebtedness or sell assets.
Additionally, the Investors are in the business of making investments in companies and may acquire andhold interests in businesses that compete directly or indirectly with us. One or more of the Investors may alsopursue acquisition opportunities that may be complementary to our business and, as a result, those acquisitionopportunities may not be available to us. So long as investment funds associated with or designated by theInvestors continue to indirectly own a significant amount of the outstanding shares of our common stock, even ifsuch amount is less than 50%, the Investors will continue to be able to strongly influence or effectively controlour decisions.
Item 1B. Unresolved Staff Comments
None.
52

Item 2. Properties
The following table lists, by state, the number of hospitals (general, acute care, psychiatric andrehabilitation) directly or indirectly owned and operated by us as of December 31, 2011:
State Hospitals Beds
Alaska . . . . . . . . . . . . . . . . . . . . . . . . . . . . . . . . . . . . . . . . . . . . . . . . . . . . . . . . . . . 1 250California . . . . . . . . . . . . . . . . . . . . . . . . . . . . . . . . . . . . . . . . . . . . . . . . . . . . . . . . . 5 1,617Colorado . . . . . . . . . . . . . . . . . . . . . . . . . . . . . . . . . . . . . . . . . . . . . . . . . . . . . . . . . 7 2,259Florida . . . . . . . . . . . . . . . . . . . . . . . . . . . . . . . . . . . . . . . . . . . . . . . . . . . . . . . . . . . 39 10,335Georgia . . . . . . . . . . . . . . . . . . . . . . . . . . . . . . . . . . . . . . . . . . . . . . . . . . . . . . . . . . 9 1,588Idaho . . . . . . . . . . . . . . . . . . . . . . . . . . . . . . . . . . . . . . . . . . . . . . . . . . . . . . . . . . . . 2 480Indiana . . . . . . . . . . . . . . . . . . . . . . . . . . . . . . . . . . . . . . . . . . . . . . . . . . . . . . . . . . . 1 278Kansas . . . . . . . . . . . . . . . . . . . . . . . . . . . . . . . . . . . . . . . . . . . . . . . . . . . . . . . . . . . 4 1,286Kentucky . . . . . . . . . . . . . . . . . . . . . . . . . . . . . . . . . . . . . . . . . . . . . . . . . . . . . . . . . 2 384Louisiana . . . . . . . . . . . . . . . . . . . . . . . . . . . . . . . . . . . . . . . . . . . . . . . . . . . . . . . . . 6 1,264Mississippi . . . . . . . . . . . . . . . . . . . . . . . . . . . . . . . . . . . . . . . . . . . . . . . . . . . . . . . . 1 130Missouri . . . . . . . . . . . . . . . . . . . . . . . . . . . . . . . . . . . . . . . . . . . . . . . . . . . . . . . . . . 6 1,055Nevada . . . . . . . . . . . . . . . . . . . . . . . . . . . . . . . . . . . . . . . . . . . . . . . . . . . . . . . . . . . 3 1,092New Hampshire . . . . . . . . . . . . . . . . . . . . . . . . . . . . . . . . . . . . . . . . . . . . . . . . . . . . 2 295Oklahoma . . . . . . . . . . . . . . . . . . . . . . . . . . . . . . . . . . . . . . . . . . . . . . . . . . . . . . . . 2 784South Carolina . . . . . . . . . . . . . . . . . . . . . . . . . . . . . . . . . . . . . . . . . . . . . . . . . . . . . 3 748Tennessee . . . . . . . . . . . . . . . . . . . . . . . . . . . . . . . . . . . . . . . . . . . . . . . . . . . . . . . . 12 2,327Texas . . . . . . . . . . . . . . . . . . . . . . . . . . . . . . . . . . . . . . . . . . . . . . . . . . . . . . . . . . . . 36 10,619Utah . . . . . . . . . . . . . . . . . . . . . . . . . . . . . . . . . . . . . . . . . . . . . . . . . . . . . . . . . . . . . 6 901Virginia . . . . . . . . . . . . . . . . . . . . . . . . . . . . . . . . . . . . . . . . . . . . . . . . . . . . . . . . . . 10 3,074InternationalEngland . . . . . . . . . . . . . . . . . . . . . . . . . . . . . . . . . . . . . . . . . . . . . . . . . . . . . . . . . . 6 828
163 41,594
In addition to the hospitals listed in the above table, we directly or indirectly operate 108 freestandingsurgery centers. We also operate medical office buildings in conjunction with some of our hospitals. These officebuildings are primarily occupied by physicians who practice at our hospitals. Fourteen of our general, acute carehospitals and three of our other properties have been mortgaged to support our obligations under our seniorsecured cash flow credit facility and first lien secured notes. These three other properties are also subject tosecond mortgages to support our obligations under our second lien secured notes.
We maintain our headquarters in approximately 1,300,000 square feet of space in the Nashville, Tennesseearea. In addition to the headquarters in Nashville, we maintain regional service centers related to our sharedservices initiatives. These service centers are located in markets in which we operate hospitals.
We believe our headquarters, hospitals and other facilities are suitable for their respective uses and are, ingeneral, adequate for our present needs. Our properties are subject to various federal, state and local statutes andordinances regulating their operation. Management does not believe that compliance with such statutes andordinances will materially affect our financial position or results of operations.
Item 3. Legal Proceedings
We operate in a highly regulated and litigious industry. As a result, various lawsuits, claims and legal andregulatory proceedings have been and can be expected to be instituted or asserted against us. The resolution ofany such lawsuits, claims or legal and regulatory proceedings could materially and adversely affect our results ofoperations and financial position in a given period.
53

Government Investigations, Claims and Litigation
Health care companies are subject to numerous investigations by various governmental agencies. Further,under the federal FCA, private parties have the right to bring qui tam, or “whistleblower,” suits againstcompanies that submit false claims for payments to, or improperly retain overpayments from, the government.Some states have adopted similar state whistleblower and false claims provisions. Certain of our individualfacilities have received, and from time to time, other facilities may receive, government inquiries from, and maybe subject to investigation by, federal and state agencies. Depending on whether the underlying conduct in theseor future inquiries or investigations could be considered systemic, their resolution could have a material, adverseeffect on our financial position, results of operations and liquidity.
The DOJ has contacted the Company in connection with its nationwide review of whether, in certain cases,hospital charges to the federal government relating to implantable cardio-defibrillators (“ICDs”) met the CMScriteria. In connection with this nationwide review, the DOJ has indicated that it will be reviewing certain ICDbilling and medical records at 95 HCA hospitals; the review covers the period from October 2003 to the present.The review could potentially give rise to claims against the Company under the federal FCA or other statutes,regulations or laws. At this time, we cannot predict what effect, if any, this review or any resulting claims couldhave on the Company.
New Hampshire Hospital Litigation
In 2006, the Foundation for Seacoast Health (the “Foundation”) filed suit against HCA in state court in NewHampshire. The Foundation alleged that both the 2006 recapitalization transaction and a prior 1999 intra-corporate transaction violated a 1983 agreement that placed certain restrictions on transfers of the PortsmouthRegional Hospital. In May 2007, the trial court ruled against the Foundation on all its claims. On appeal, the NewHampshire Supreme Court affirmed the ruling on the 2006 recapitalization, but remanded to the trial court theclaims based on the 1999 intra-corporate transaction. The trial court ruled in December 2009 that the 1999 intra-corporate transaction breached the transfer restriction provisions of the 1983 agreement. In September of 2011,the trial court issued its remedies phase decision and held that the only remedy to which the Foundation wasentitled was rescission of the intra-corporate transfer that breached the transfer restriction (the Company hascomplied with the Court’s order, and it is not expected that such compliance will have any material effect on ouroperations or financial position). The Court awarded the Foundation, under the terms of the Asset PurchaseAgreement, a “fraction” of its attorney fees. The Foundation appealed the remedy phase ruling, and the Companycross-appealed the liability determination. On October 31, 2011, the New Hampshire Supreme Court, on its own,raised the question whether the appeal needed to await the trial court’s further ruling on attorney fees. OnNovember 21, 2011, after the parties briefed the issue, the New Hampshire Supreme Court dismissed the appealas premature and remanded the case to the trial court. In February 2012, the trial court certified the case for apossible interlocutory appeal without addressing the attorney fees issue.
Securities Class Action Litigation
On October 28, 2011, a shareholder action, Schuh v. HCA Holdings, Inc. et al., was filed in the UnitedStates District Court for the Middle District of Tennessee seeking monetary relief. The case seeks to include as aclass all persons who acquired the Company’s stock pursuant or traceable to the Company’s RegistrationStatement and Prospectus issued in connection with the March 9, 2011 initial public offering. The lawsuit assertsa claim under Section 11 of the Securities Act of 1933 against the Company, certain members of the board ofdirectors, and certain underwriters in the offering. It further asserts a claim under Section 15 of the Securities Actof 1933 against the same members of the board of directors. The action alleges deficiencies in the Company’sdisclosures in the Registration Statement relating to: (1) accounting for its 2006 recapitalization and 2010reorganization; (2) the Company’s failure to maintain effective internal controls relating to its accounting forsuch transactions; and (3) the Company’s revenue growth rate. Subsequently, two additional class actioncomplaints, Kishtah v. HCA Holdings, Inc. et al. and Daniels v. HCA Holdings, Inc. et al., setting forthsubstantially similar claims against substantially the same defendants in addition to Ernst & Young, LLP werefiled in the same federal court on November 16, 2011 and December 12, 2011, respectively. All three of the caseshave been consolidated, and the parties have agreed to initial scheduling matters.
54

In addition to the above described shareholder class actions, on December 8, 2011, a federal shareholderderivative action, Sutton v. Bracken, et al., putatively initiated in the name of the Company, was filed in theUnited States District Court for the Middle District of Tennessee against certain officers and present and formerdirectors of the Company seeking monetary relief. The action alleges breaches of fiduciary duties by the namedofficers and directors in connection with the accounting and earnings claims set forth in the shareholder classactions. Setting forth substantially similar claims against substantially the same defendants, an additional federalderivative action, Schroeder v. Bracken, et al., was filed in the United States District Court for the MiddleDistrict of Tennessee on December 16, 2011, and a state derivative action, Bagot v. Bracken, et al., was filed inTennessee state court in the Davidson County Circuit Court on December 20, 2011. The federal derivativeactions have been consolidated in the Middle District of Tennessee and the parties have agreed that those casesshall be stayed pending developments in the shareholder class actions. The state derivative action has been stayedpending developments in the shareholder class actions.
General Liability and Other Claims
We are subject to claims for additional income taxes and related interest. For a description of thoseproceedings, see Item 7, “Management’s Discussion and Analysis of Financial Condition and Results ofOperations — IRS Disputes” and Note 5 to our consolidated financial statements.
We are also subject to claims and suits arising in the ordinary course of business, including claims forpersonal injuries or for wrongful restriction of, or interference with, physicians’ staff privileges. In certain ofthese actions the claimants have asked for punitive damages against us, which may not be covered by insurance.In the opinion of management, the ultimate resolution of these pending claims and legal proceedings will nothave a material, adverse effect on our results of operations or financial position.
Item 4. Mine Safety Disclosures
None.
PART II
Item 5. Market for Registrant’s Common Equity, Related Stockholder Matters and Issuer Purchases ofEquity Securities
See Item 7, “Management’s Discussion and Analysis of Financial Condition and Results of Operations —Liquidity and Capital Resources — Financing Activities” for a description of the restrictions on our ability to paydividends. We did not declare any dividends in 2009 or 2011.
On January 27, 2010, our Board of Directors declared a distribution to the Company’s stockholders andholders of vested stock options. The distribution was $3.88 per share and vested stock option, or $1.751 billion inthe aggregate. The distribution was paid on February 5, 2010 to holders of record on February 1, 2010. Pursuantto the terms of our stock option plans, the holders of nonvested stock options received a $3.88 per share reductionto the exercise price of their share-based awards.
On May 5, 2010, our Board of Directors declared a distribution to the Company’s stockholders and holdersof vested stock options. The distribution was $1.11 per share and vested stock option, or $500 million in theaggregate. The distribution was paid on May 14, 2010 to holders of record on May 6, 2010. Pursuant to the termsof our stock option plans, the holders of nonvested stock options received a $1.11 per share reduction to theexercise price of their share-based awards.
On November 23, 2010, our Board of Directors declared a distribution to the Company’s stockholders andholders of stock options. The distribution was $4.44 per share and vested stock option, or approximately$2.1 billion in the aggregate. The distribution to stockholders and holders of vested options was paid onDecember 1, 2010 to holders of record on November 24, 2010. Pursuant to the terms of our stock option plans,the holders of nonvested options received $4.44 per share reductions (subject to certain tax imitations thatresulted in deferred distributions for a portion of the declared distribution, which will be paid upon the vesting ofthe applicable stock options) to the exercise price of the share-based awards.
55

During February 2011, our Board of Directors approved an increase in the number of our authorized sharesto 1,800,000,000 shares of common stock and a 4.505-to-one split of our issued and outstanding common shares.All common share and per common share amounts in this Form 10-K reflect the 4.505-to-one split. DuringMarch 2011, we completed the initial public offering of 87,719,300 shares of our common stock at a price of$30.00 per share (before deducting underwriter discounts, commissions and other related offering expenses).Certain of our stockholders also sold 57,410,700 shares of our common stock in this offering. We did not receiveany proceeds from the shares sold by the selling stockholders. Our common stock is now traded on the New YorkStock Exchange (the “NYSE”) (symbol “HCA”). Our first day of trading was March 10, 2011.
On September 21, 2011, we repurchased 80,771,143 shares of our common stock beneficially owned byaffiliates of Bank of America Corporation at a purchase price of $18.61 per share, the closing price of theCompany’s common stock on the NYSE on September 14, 2011. The repurchase was financed using acombination of cash on hand and borrowings under available credit facilities. The shares repurchased representedapproximately 15.6% of our total shares outstanding at the time of the repurchase.
The table below sets forth, for the calendar quarters indicated, the high and low sales prices per sharereported on the NYSE for our common stock.
Sales Price
High Low
2011First Quarter . . . . . . . . . . . . . . . . . . . . . . . . . . . . . . . . . . . . . . . . . . . . . . . . . . . . . $34.57 $30.36Second Quarter . . . . . . . . . . . . . . . . . . . . . . . . . . . . . . . . . . . . . . . . . . . . . . . . . . . 35.37 30.75Third Quarter . . . . . . . . . . . . . . . . . . . . . . . . . . . . . . . . . . . . . . . . . . . . . . . . . . . . . 34.92 17.03Fourth Quarter . . . . . . . . . . . . . . . . . . . . . . . . . . . . . . . . . . . . . . . . . . . . . . . . . . . . 26.86 17.43
At the close of business on January 12, 2012, there were approximately 1,030 holders of record of ourcommon stock.
On February 3, 2012, our Board of Directors declared a cash distribution to the Company’s stockholders andholders of vested stock options. The distribution was $2.00 per share and vested stock option, or approximately$975 million in the aggregate (inclusive of the distributions to holders of stock options and restricted share units).The distribution will be paid on February 29, 2012 to the holders of record on February 16, 2012. Thedistribution will be funded through existing cash and borrowings under our existing senior secured creditfacilities. Pursuant to the terms of our equity incentive plans, (1) the holders of any unvested options will receive$2.00 per share reductions (subject to certain tax limitations that resulted in deferred distributions for a portion ofthe declared distribution, which will be paid upon vesting of the applicable stock options) to the exercise price ofthe stock option awards; (2) the holders of any unvested stock appreciation rights will receive $2.00 per sharereductions to the base price of the stock appreciation right awards; and (3) the holders of any unvested restrictedshare units will receive $2.00 per unit, which will be paid upon vesting of the applicable restricted share units.
56

$0
$20
$40
$60
$80
$100
$120
11/03/2111/03/911/03/611/13/311/01/3
STOCK PERFORMANCE GRAPHCOMPARISON OF CUMULATIVE TOTAL RETURN
Among HCA Holdings, Inc., the S&P 500 Index and the S&P Health Care Index
HCA Holdings, Inc. S&P 500 S&P Health Care
3/10/2011 3/31/2011 6/30/2011 9/30/2011 12/30/2011
HCA Holdings, Inc. 100.00 109.19 106.38 64.99 71.02S&P 500 100.00 100.04 100.14 86.25 96.44S&P Health Care 100.00 101.90 109.91 98.90 108.76
The graph shows the cumulative total return to our stockholders beginning as of March 10, 2011, the dayour stock began trading on the NYSE, and through December 30, 2011, in comparison to the cumulative returnsof the S&P 500 Index and the S&P Health Care Index. The graph assumes $100 invested on March 10, 2011 inour common stock and in each index with the subsequent reinvestment of dividends. The stock performanceshown on the graph represents historical stock performance and is not necessarily indicative of future stock priceperformance.
57

Item 6. Selected Financial Data
HCA HOLDINGS, INC.SELECTED FINANCIAL DATA
AS OF AND FOR THE YEARS ENDED DECEMBER 31(Dollars in millions, except per share amounts)
2011 2010 2009 2008 2007
Summary of Operations:Revenues before provision for doubtful accounts . . . . . . $32,506 $ 30,683 $30,052 $28,374 $26,858Provision for doubtful accounts . . . . . . . . . . . . . . . . . . . . 2,824 2,648 3,276 3,409 3,130
Revenues . . . . . . . . . . . . . . . . . . . . . . . . . . . . . . . . . . . . . . 29,682 28,035 26,776 24,965 23,728
Salaries and benefits . . . . . . . . . . . . . . . . . . . . . . . . . . . . . 13,440 12,484 11,958 11,440 10,714Supplies . . . . . . . . . . . . . . . . . . . . . . . . . . . . . . . . . . . . . . . 5,179 4,961 4,868 4,620 4,395Other operating expenses . . . . . . . . . . . . . . . . . . . . . . . . . 5,470 5,004 4,724 4,554 4,233Electronic health record incentive income . . . . . . . . . . . . (210) — — — —Equity in earnings of affiliates . . . . . . . . . . . . . . . . . . . . . (258) (282) (246) (223) (206)Depreciation and amortization . . . . . . . . . . . . . . . . . . . . . 1,465 1,421 1,425 1,416 1,426Interest expense . . . . . . . . . . . . . . . . . . . . . . . . . . . . . . . . . 2,037 2,097 1,987 2,021 2,215Losses (gains) on sales of facilities . . . . . . . . . . . . . . . . . . (142) (4) 15 (97) (471)Gain on acquisition of controlling interest in equityinvestment . . . . . . . . . . . . . . . . . . . . . . . . . . . . . . . . . . . (1,522) — — — —
Impairments of long-lived assets . . . . . . . . . . . . . . . . . . . — 123 43 64 24Losses on retirement of debt . . . . . . . . . . . . . . . . . . . . . . . 481 — — — —Termination of management agreement . . . . . . . . . . . . . . 181 — — — —
26,121 25,804 24,774 23,795 22,330
Income before income taxes . . . . . . . . . . . . . . . . . . . . . . . 3,561 2,231 2,002 1,170 1,398Provision for income taxes . . . . . . . . . . . . . . . . . . . . . . . . 719 658 627 268 316
Net income . . . . . . . . . . . . . . . . . . . . . . . . . . . . . . . . . . . . 2,842 1,573 1,375 902 1,082Net income attributable to noncontrolling interests . . . . . 377 366 321 229 208
Net income attributable to HCA Holdings, Inc. . . . . . . $ 2,465 $ 1,207 $ 1,054 $ 673 $ 874
Per common share data:Basic earnings per share . . . . . . . . . . . . . . . . . . . . . . . . . . $ 5.17 $ 2.83 $ 2.48 $ 1.59 $ 2.07Diluted earnings per share . . . . . . . . . . . . . . . . . . . . . . . . $ 4.97 $ 2.76 $ 2.44 1.56 2.03Cash dividends declared per share . . . . . . . . . . . . . . . . . . — $ 9.43 — — —
Financial Position:Assets . . . . . . . . . . . . . . . . . . . . . . . . . . . . . . . . . . . . . . . . $26,898 $ 23,852 $24,131 $24,280 $24,025Working capital . . . . . . . . . . . . . . . . . . . . . . . . . . . . . . . . . 1,679 2,650 2,264 2,391 2,356Long-term debt, including amounts due within oneyear . . . . . . . . . . . . . . . . . . . . . . . . . . . . . . . . . . . . . . . . 27,052 28,225 25,670 26,989 27,308
Equity securities with contingent redemption rights . . . . — 141 147 155 164Noncontrolling interests . . . . . . . . . . . . . . . . . . . . . . . . . . 1,244 1,132 1,008 995 938Stockholders’ deficit . . . . . . . . . . . . . . . . . . . . . . . . . . . . . (7,014) (10,794) (7,978) (9,260) (9,600)
Cash Flow Data:Cash provided by operating activities . . . . . . . . . . . . . . . . $ 3,933 $ 3,085 $ 2,747 $ 1,990 $ 1,564Cash used in investing activities . . . . . . . . . . . . . . . . . . . . (2,995) (1,039) (1,035) (1,467) (479)Capital expenditures . . . . . . . . . . . . . . . . . . . . . . . . . . . . . (1,679) (1,325) (1,317) (1,600) (1,444)Cash used in financing activities . . . . . . . . . . . . . . . . . . . (976) (1,947) (1,865) (451) (1,326)
58

2011 2010 2009 2008 2007
Operating Data:Number of hospitals at end ofperiod(a) . . . . . . . . . . . . . . . . . . . . . . . . 163 156 155 158 161
Number of freestanding outpatientsurgical centers at end of period(b) . . . . 108 97 97 97 99
Number of licensed beds at end ofperiod(c) . . . . . . . . . . . . . . . . . . . . . . . . 41,594 38,827 38,839 38,504 38,405
Weighted average licensed beds(d) . . . . . . 39,735 38,655 38,825 38,422 39,065Admissions(e) . . . . . . . . . . . . . . . . . . . . . . 1,620,400 1,554,400 1,556,500 1,541,800 1,552,700Equivalent admissions(f) . . . . . . . . . . . . . . 2,595,900 2,468,400 2,439,000 2,363,600 2,352,400Average length of stay (days)(g) . . . . . . . . 4.8 4.8 4.8 4.9 4.9Average daily census(h) . . . . . . . . . . . . . . 21,123 20,523 20,650 20,795 21,049Occupancy(i) . . . . . . . . . . . . . . . . . . . . . . . 53% 53% 53% 54% 54%Emergency room visits(j) . . . . . . . . . . . . . 6,143,500 5,706,200 5,593,500 5,246,400 5,116,100Outpatient surgeries(k) . . . . . . . . . . . . . . . 799,200 783,600 794,600 797,400 804,900Inpatient surgeries(l) . . . . . . . . . . . . . . . . . 484,500 487,100 494,500 493,100 516,500Days revenues in accountsreceivable(m) . . . . . . . . . . . . . . . . . . . . . 53 50 50 55 60
Gross patient revenues(n) . . . . . . . . . . . . . $ 141,516 $ 125,640 $ 115,682 $ 102,843 $ 92,429Outpatient revenues as a % of patientrevenues(o) . . . . . . . . . . . . . . . . . . . . . . 37% 36% 39% 39% 39%
(a) Excludes eight facilities in 2010, 2009, 2008 and 2007 that were not consolidated (accounted for using the equity method) for financialreporting purposes.
(b) Excludes one facility in 2011, nine facilities in 2010 and 2007 and eight facilities in 2009 and 2008 that were not consolidated(accounted for using the equity method) for financial reporting purposes.
(c) Licensed beds are those beds for which a facility has been granted approval to operate from the applicable state licensing agency.(d) Represents the average number of licensed beds, weighted based on periods owned.(e) Represents the total number of patients admitted to our hospitals and is used by management and certain investors as a general measure
of inpatient volume.(f) Equivalent admissions are used by management and certain investors as a general measure of combined inpatient and outpatient volume.
Equivalent admissions are computed by multiplying admissions (inpatient volume) by the sum of gross inpatient revenue and grossoutpatient revenue and then dividing the resulting amount by gross inpatient revenue. The equivalent admissions computation “equates”outpatient revenue to the volume measure (admissions) used to measure inpatient volume, resulting in a general measure of combinedinpatient and outpatient volume.
(g) Represents the average number of days admitted patients stay in our hospitals.(h) Represents the average number of patients in our hospital beds each day.(i) Represents the percentage of hospital licensed beds occupied by patients. Both average daily census and occupancy rate provide
measures of the utilization of inpatient rooms.(j) Represents the number of patients treated in our emergency rooms.(k) Represents the number of surgeries performed on patients who were not admitted to our hospitals. Pain management and endoscopy
procedures are not included in outpatient surgeries.(l) Represents the number of surgeries performed on patients who have been admitted to our hospitals. Pain management and endoscopy
procedures are not included in inpatient surgeries.(m) Revenues per day is calculated by dividing the revenues for the period by the days in the period. Days revenues in accounts receivable is
then calculated as accounts receivable, net of the allowance for doubtful accounts, at the end of the period divided by revenues per day.With our adoption of ASU 2011-07, “revenues” used in this computation are net of the provision for doubtful accounts and thecomputations for all prior periods presented have been restated.
(n) Gross patient revenues are based upon our standard charge listing. Gross charges/revenues typically do not reflect what our hospitalfacilities are paid. Gross charges/revenues are reduced by the provision for doubtful accounts, contractual adjustments, discounts andcharity care to determine reported revenues.
(o) Represents the percentage of patient revenues related to patients who are not admitted to our hospitals.
59

HCA HOLDINGS, INC.
MANAGEMENT’S DISCUSSION AND ANALYSIS OF FINANCIAL CONDITIONAND RESULTS OF OPERATIONS
Item 7. Management’s Discussion and Analysis of Financial Condition and Results of Operations
The selected financial data and the accompanying consolidated financial statements present certaininformation with respect to the financial position, results of operations and cash flows of HCA Holdings, Inc.which should be read in conjunction with the following discussion and analysis. The terms “HCA,” “Company,”“we,” “our,” or “us,” as used herein, refer HCA Inc. and our affiliates prior to the Corporate Reorganization andto HCA Holdings, Inc. and our affiliates after the Corporate Reorganization unless otherwise stated or indicatedby context. The term “affiliates” means direct and indirect subsidiaries of HCA Holdings, Inc. and partnershipsand joint ventures in which such subsidiaries are partners.
Forward-Looking Statements
This annual report on Form 10-K includes certain disclosures which contain “forward-looking statements.”Forward-looking statements include all statements that do not relate solely to historical or current facts, and canbe identified by the use of words like “may,” “believe,” “will,” “expect,” “project,” “estimate,” “anticipate,”“plan,” “initiative” or “continue.” These forward-looking statements are based on our current plans andexpectations and are subject to a number of known and unknown uncertainties and risks, many of which arebeyond our control, which could significantly affect current plans and expectations and our future financialposition and results of operations. These factors include, but are not limited to, (1) the impact of our substantialindebtedness and the ability to refinance such indebtedness on acceptable terms, (2) the effects related to theenactment and implementation of the Budget Control Act of 2011 (“BCA”) and the Patient Protection andAffordable Care Act, as amended by the Health Care and Education Reconciliation Act (collectively, the “HealthReform Law”), the possible enactment of additional federal or state health care reforms and possible changes tothe Health Reform Law and other federal, state or local laws or regulations affecting the health care industry,(3) increases in the amount and risk of collectibility of uninsured accounts and deductibles and copaymentamounts for insured accounts, (4) the ability to achieve operating and financial targets, and attain expected levelsof patient volumes and control the costs of providing services, (5) possible changes in the Medicare, Medicaidand other state programs, including Medicaid upper payment limit programs or Waiver Programs, that mayimpact reimbursements to health care providers and insurers, (6) the highly competitive nature of the health carebusiness, (7) changes in service mix and revenue mix, including potential declines in the population coveredunder managed care agreements and the ability to enter into and renew managed care provider agreements onacceptable terms, (8) the efforts of insurers, health care providers and others to contain health care costs, (9) theoutcome of our continuing efforts to monitor, maintain and comply with appropriate laws, regulations, policiesand procedures, (10) increases in wages and the ability to attract and retain qualified management and personnel,including affiliated physicians, nurses and medical and technical support personnel, (11) the availability andterms of capital to fund the expansion of our business and improvements to our existing facilities, (12) changes inaccounting practices, (13) changes in general economic conditions nationally and regionally in our markets,(14) future divestitures which may result in charges and possible impairments of long-lived assets, (15) changesin business strategy or development plans, (16) delays in receiving payments for services provided, (17) theoutcome of pending and any future tax audits, appeals and litigation associated with our tax positions,(18) potential adverse impact of known and unknown government investigations, litigation and other claims thatmay be made against us, (19) our ongoing ability to demonstrate meaningful use of certified electronic healthrecord technology and recognize income for the related Medicare or Medicaid incentive payments, and (20) otherrisk factors described in this annual report on Form 10-K. As a consequence, current plans, anticipated actionsand future financial position and results of operations may differ from those expressed in any forward-lookingstatements made by or on behalf of HCA. You are cautioned not to unduly rely on such forward-lookingstatements when evaluating the information presented in this report.
60

HCA HOLDINGS, INC.
MANAGEMENT’S DISCUSSION AND ANALYSIS OF FINANCIAL CONDITIONAND RESULTS OF OPERATIONS— (Continued)
2011 Operations Summary
Net income attributable to HCA Holdings, Inc. totaled $2.465 billion, or $4.97 per diluted share, for 2011,compared to $1.207 billion, or $2.76 per diluted share, for 2010. The 2011 results include net gains on sales offacilities of $142 million (pretax), or $0.16 per diluted share, a gain on the acquisition of controlling interest in anequity investment of $1.522 billion (pretax), or $2.87 per diluted share, losses on retirement of debt of $481million (pretax), or $0.61 per diluted share, and termination of management agreement fees of $181 million(pretax), or $0.30 per diluted share. The 2010 results include net gains on sales of facilities of $4 million (pretax),or $0.01 per diluted share, and impairments of long-lived assets of $123 million (pretax), or $0.18 per dilutedshare. All “per diluted share” disclosures are based upon amounts net of the applicable income taxes. Shares usedfor diluted earnings per share were 495.943 million shares and 437.347 million shares for the years endedDecember 31, 2011 and 2010, respectively. During March 2011, we completed the initial public offering of87.719 million shares of our common stock, and during September 2011, we repurchased 80.771 million sharesof our common stock from affiliates of Bank of America Corporation.
Revenues increased to $29.682 billion for 2011 from $28.035 billion for 2010. Revenues increased 5.9%and 3.3%, respectively, on a consolidated basis and on a same facility basis for 2011, compared to 2010. Theconsolidated revenues increase can be attributed to the combined impact of a 0.7% increase in revenue perequivalent admission and a 5.2% increase in equivalent admissions. The same facility revenues increase resultedfrom a 0.3% increase in same facility revenue per equivalent admission and a 3.0% increase in same facilityequivalent admissions. We experienced a shift in service mix from more complex surgical cases to less acutemedical cases, resulting in lower than anticipated revenue per equivalent admission growth for 2011.
During 2011, consolidated admissions increased 4.2% and same facility admissions increased 2.3%,compared to 2010. Inpatient surgical volumes declined 0.5% on a consolidated basis and declined 1.7% on asame facility basis during 2011, compared to 2010. Outpatient surgical volumes increased 2.0% on aconsolidated basis and declined 0.6% on a same facility basis during 2011, compared to 2010. Emergency roomvisits increased 7.7% on a consolidated basis and increased 6.2% on a same facility basis during 2011, comparedto 2010.
For 2011, the provision for doubtful accounts increased $176 million, compared to 2010. The self-payrevenue deductions for charity care and uninsured discounts increased $346 million and $1.066 billion,respectively, for 2011, compared to 2010. The sum of the provision for doubtful accounts, uninsured discountsand charity care, as a percentage of the sum of revenues, the provision for doubtful accounts, uninsured discountsand charity care, was 27.4% for 2011, compared to 25.6% for 2010. Same facility uninsured admissionsincreased 7.4% and same facility uninsured emergency room visits increased 5.8% for 2011, compared to 2010.
Interest expense totaled $2.037 billion for 2011, compared to $2.097 billion for 2010. The $60 milliondecline in interest expense for 2011 was due primarily to a decline in the average interest rate.
Cash flows from operating activities increased $848 million, from $3.085 billion for 2010 to $3.933 billionfor 2011. The increase in cash flows from operating activities was primarily due to improved cash flows of $885million related to income taxes.
Business Strategy
We are committed to providing the communities we serve with high quality, cost-effective health care whilegrowing our business, increasing our profitability and creating long-term value for our stockholders. To achievethese objectives, we align our efforts around the following growth agenda:
61

HCA HOLDINGS, INC.
MANAGEMENT’S DISCUSSION AND ANALYSIS OF FINANCIAL CONDITIONAND RESULTS OF OPERATIONS— (Continued)
Business Strategy (Continued)
Grow Our Presence in Existing Markets. We believe we are well positioned in a number of large andgrowing markets that will allow us the opportunity to generate long-term, attractive growth through theexpansion of our presence in these markets. We plan to continue recruiting and strategically collaborating withthe physician community and adding attractive service lines such as cardiology, emergency services, oncologyand women’s services. Additional components of our growth strategy include expanding our footprint throughdeveloping various outpatient access points, including surgery centers, rural outreach, freestanding emergencydepartments and walk-in clinics.
Achieve Industry-Leading Performance in Clinical and Satisfaction Measures. Achieving high levels ofpatient safety, patient satisfaction and clinical quality are central goals of our business model. To achieve thesegoals, we have implemented a number of initiatives including infection reduction initiatives, hospitalistprograms, advanced health information technology and evidence-based medicine programs. We routinely analyzeoperational practices from our best-performing hospitals to identify ways to implement organization-wideperformance improvements and reduce clinical variation. We believe these initiatives will continue to improvepatient care, help us achieve cost efficiencies, grow our revenues and favorably position us in an environmentwhere our constituents are increasingly focused on quality, efficacy and efficiency.
Recruit and Employ Physicians to Meet Need for High Quality Health Services. We depend on the qualityand dedication of the health care providers and other team members who serve at our facilities. We believe acritical component of our growth strategy is our ability to successfully recruit and strategically collaborate withphysicians and other professionals to provide high quality care. We attract and retain physicians by providinghigh quality, convenient facilities with advanced technology, by expanding our specialty services and by buildingour outpatient operations. We believe our continued investment in the employment, recruitment and retention ofphysicians will improve the quality of care at our facilities.
Continue to Leverage Our Scale and Market Positions to Enhance Profitability. We believe there issignificant opportunity to continue to grow the profitability of our company by fully leveraging the scale andscope of our franchise. We are currently pursuing next generation performance improvement initiatives such ascontracting for services on a multistate basis and expanding our support infrastructure for additional clinical andsupport functions, such as physician credentialing, medical transcription and electronic medical recordkeeping.We believe our centrally managed business processes and ability to leverage cost-saving practices across ourextensive network will enable us to continue to manage costs effectively. We have created a subsidiary, ParallonBusiness Solutions, to leverage key components of our support infrastructure, including revenue cyclemanagement, healthcare group purchasing, supply chain management and staffing functions and are offeringthese services to other hospital companies.
Selectively Pursue a Disciplined Development Strategy. We continue to believe there are significantgrowth opportunities in our markets. We will continue to provide financial and operational resources tosuccessfully execute on our in-market opportunities. To complement our in-market growth agenda, we intend tofocus on selectively developing and acquiring new hospitals, outpatient facilities and other health care serviceproviders. We believe the challenges faced by the hospital industry may spur consolidation and we believe oursize, scale, national presence and access to capital will position us well to participate in any such consolidation.We have a strong record of successfully acquiring and integrating hospitals and entering into joint ventures andintend to continue leveraging this experience.
62

HCA HOLDINGS, INC.
MANAGEMENT’S DISCUSSION AND ANALYSIS OF FINANCIAL CONDITIONAND RESULTS OF OPERATIONS— (Continued)
Critical Accounting Policies and Estimates
The preparation of our consolidated financial statements requires management to make estimates andassumptions that affect the reported amounts of assets and liabilities, the disclosure of contingent liabilities andthe reported amounts of revenues and expenses. Our estimates are based on historical experience and variousother assumptions we believe are reasonable under the circumstances. We evaluate our estimates on an ongoingbasis and make changes to the estimates and related disclosures as experience develops or new informationbecomes known. Actual results may differ from these estimates.
We believe the following critical accounting policies affect our more significant judgments and estimatesused in the preparation of our consolidated financial statements.
Revenues
Revenues are recorded during the period the health care services are provided, based upon the estimatedamounts due from payers. Estimates of contractual allowances under managed care health plans are based uponthe payment terms specified in the related contractual agreements. Laws and regulations governing the Medicareand Medicaid programs are complex and subject to interpretation. The estimated reimbursement amounts aremade on a payer-specific basis and are recorded based on the best information available regarding management’sinterpretation of the applicable laws, regulations and contract terms. Management continually reviews thecontractual estimation process to consider and incorporate updates to laws and regulations and the frequentchanges in managed care contractual terms resulting from contract renegotiations and renewals. We haveinvested significant resources to refine and improve our computerized billing systems and the information systemdata used to make contractual allowance estimates. We have developed standardized calculation processes andrelated training programs to improve the utility of our patient accounting systems.
The Emergency Medical Treatment and Labor Act (“EMTALA”) requires any hospital participating in theMedicare program to conduct an appropriate medical screening examination of every person who presents to thehospital’s emergency room for treatment and, if the individual is suffering from an emergency medical condition,to either stabilize the condition or make an appropriate transfer of the individual to a facility able to handle thecondition. The obligation to screen and stabilize emergency medical conditions exists regardless of anindividual’s ability to pay for treatment. Federal and state laws and regulations, including but not limited toEMTALA, require, and our commitment to providing quality patient care encourages, the provision of services topatients who are financially unable to pay for the health care services they receive. The Patient Protection andAffordable Care Act, as amended by the Health Care and Education Reconciliation Act of 2010 (collectively, the“Health Reform Law”), requires health plans to reimburse hospitals for emergency services provided to enrolleeswithout prior authorization and without regard to whether a participating provider contract is in place. Further, asenacted, the Health Reform Law contains provisions that seek to decrease the number of uninsured individuals,including requirements or incentives, which do not become effective until 2014, for individuals to obtain, andlarge employers to provide, insurance coverage. These mandates may reduce the financial impact of screeningfor and stabilizing emergency medical conditions. However, many factors are unknown regarding the impact ofthe Health Reform Law, including the outcome of court challenges to the constitutionality of the law andCongressional efforts to amend or repeal the law, how many previously uninsured individuals will obtaincoverage as a result of the law or the change, if any, in the volume of inpatient and outpatient hospital servicesthat are sought by and provided to previously uninsured individuals and the payer mix.
We do not pursue collection of amounts related to patients who meet our guidelines to qualify as charitycare; therefore, they are not reported in revenues. Patients treated at our hospitals for nonelective care, who haveincome at or below 200% of the federal poverty level, are eligible for charity care. The federal poverty level isestablished by the federal government and is based on income and family size. We provide discounts from our
63

HCA HOLDINGS, INC.
MANAGEMENT’S DISCUSSION AND ANALYSIS OF FINANCIAL CONDITIONAND RESULTS OF OPERATIONS— (Continued)
Critical Accounting Policies and Estimates (Continued)
Revenues (Continued)
gross charges to uninsured patients who do not qualify for Medicaid or charity care. These discounts are similarto those provided to many local managed care plans. After the discounts are applied, we are still unable to collecta significant portion of uninsured patients’ accounts, and we record significant provisions for doubtful accounts(based upon our historical collection experience) related to uninsured patients in the period the services areprovided.
Due to the complexities involved in the classification and documentation of health care services authorizedand provided, the estimation of revenues earned and the related reimbursement are often subject to interpretationsthat could result in payments that are different from our estimates. Adjustments to estimated Medicare andMedicaid reimbursement amounts and disproportionate-share funds, which resulted in net increases to revenues,related primarily to cost reports filed during the respective year were $40 million, $52 million and $40 million in2011, 2010 and 2009, respectively. The adjustments to estimated reimbursement amounts, which resulted in netincreases to revenues, related primarily to cost reports filed during previous years were $30 million, $50 millionand $60 million in 2011, 2010 and 2009, respectively. We expect adjustments during the next 12 months relatedto Medicare and Medicaid cost report filings and settlements and disproportionate-share funds will result inincreases to revenues within generally similar ranges.
Provision for Doubtful Accounts and the Allowance for Doubtful Accounts
The collection of outstanding receivables from Medicare, managed care payers, other third-party payers andpatients is our primary source of cash and is critical to our operating performance. The primary collection risksrelate to uninsured patient accounts, including patient accounts for which the primary insurance carrier has paidthe amounts covered by the applicable agreement, but patient responsibility amounts (deductibles andcopayments) remain outstanding. The provision for doubtful accounts and the allowance for doubtful accountsrelate primarily to amounts due directly from patients. An estimated allowance for doubtful accounts is recordedfor all uninsured accounts, regardless of the aging of those accounts. Accounts are written off when allreasonable internal and external collection efforts have been performed. Our collection policies include a reviewof all accounts against certain standard collection criteria, upon completion of our internal collection efforts.Accounts determined to possess positive collectibility attributes are forwarded to a secondary external collectionagency and the other accounts are written off. The accounts that are not collected by the secondary externalcollection agency are written off when they are returned to us by the collection agency (usually within12 months). Writeoffs are based upon specific identification and the writeoff process requires a writeoffadjustment entry to the patient accounting system. We do not pursue collection of amounts related to patients thatmeet our guidelines to qualify as charity care.
During 2011, we adopted the provisions of Accounting Standards Update No. 2011-07, Presentation andDisclosure of Patient Service Revenue, Provision for Bad Debts, and the Allowance for Doubtful Accounts forCertain Health Care Entities (“ASU 2011-07”). ASU 2011-07 requires health care entities to change thepresentation of the statement of operations by reclassifying the provision for doubtful accounts from an operatingexpense to a deduction from patient service revenues. All periods presented in this Form 10-K have beenreclassified in accordance with ASU 2011-07. The amount of the provision for doubtful accounts is based uponmanagement’s assessment of historical writeoffs and expected net collections, business and economic conditions,trends in federal, state, and private employer health care coverage and other collection indicators. Managementrelies on the results of detailed reviews of historical writeoffs and recoveries at facilities that represent a majorityof our revenues and accounts receivable (the “hindsight analysis”) as a primary source of information in
64

HCA HOLDINGS, INC.
MANAGEMENT’S DISCUSSION AND ANALYSIS OF FINANCIAL CONDITIONAND RESULTS OF OPERATIONS— (Continued)
Critical Accounting Policies and Estimates (Continued)
Provision for Doubtful Accounts and the Allowance for Doubtful Accounts (Continued)
estimating the collectibility of our accounts receivable. We perform the hindsight analysis quarterly, utilizingrolling twelve-months accounts receivable collection and writeoff data. We believe our quarterly updates to theestimated allowance for doubtful accounts at each of our hospital facilities provide reasonable valuations of ouraccounts receivable. These routine, quarterly changes in estimates have not resulted in material adjustments toour allowance for doubtful accounts, provision for doubtful accounts or period-to-period comparisons of ourresults of operations. At December 31, 2011 and 2010, the allowance for doubtful accounts representedapproximately 92% and 93%, respectively, of the $4.478 billion and $4.249 billion, respectively, patient dueaccounts receivable balance. The patient due accounts receivable balance represents the estimated uninsuredportion of our accounts receivable. The estimated uninsured portion of Medicaid pending and uninsured discountpending accounts is included in our patient due accounts receivable balance.
The revenue deductions related to uninsured accounts (charity care and uninsured discounts) generally havethe inverse effect on the provision for doubtful accounts. To quantify the total impact of and trends related touninsured accounts, we believe it is beneficial to view these revenue deductions and provision for doubtfulaccounts in combination, rather than each separately. A summary of these amounts for the years endedDecember 31, follows (dollars in millions):
2011 2010 2009
Charity care . . . . . . . . . . . . . . . . . . . . . . . . . . . . . . . . . . . . . . . . . . . . . . $ 2,683 $2,337 $2,151Uninsured discounts . . . . . . . . . . . . . . . . . . . . . . . . . . . . . . . . . . . . . . . . 5,707 4,641 2,935Provision for doubtful accounts . . . . . . . . . . . . . . . . . . . . . . . . . . . . . . . 2,824 2,648 3,276
Totals . . . . . . . . . . . . . . . . . . . . . . . . . . . . . . . . . . . . . . . . . . . . . . . . . . . $11,214 $9,626 $8,362
Increases to our uninsured discounts have directly contributed to the declining trend in the provision fordoubtful accounts. However, the sum of the provision for doubtful accounts, uninsured discounts and charitycare, as a percentage of the sum of revenues, the provision for doubtful accounts, uninsured discounts and charitycare increased from 23.8% for 2009 to 25.6% for 2010 and to 27.4% for 2011.
Days revenues in accounts receivable were 53 days, 50 days and 50 days at December 31, 2011, 2010 and 2009,respectively. Management expects a continuation of the challenges related to the collection of the patient due accounts.Adverse changes in the percentage of our patients having adequate health care coverage, general economic conditions,patient accounting service center operations, payer mix, or trends in federal, state, and private employer health carecoverage could affect the collection of accounts receivable, cash flows and results of operations.
65

HCA HOLDINGS, INC.
MANAGEMENT’S DISCUSSION AND ANALYSIS OF FINANCIAL CONDITIONAND RESULTS OF OPERATIONS— (Continued)
Critical Accounting Policies and Estimates (Continued)
Provision for Doubtful Accounts and the Allowance for Doubtful Accounts (Continued)
The approximate breakdown of accounts receivable by payer classification as of December 31, 2011 and2010 is set forth in the following table:
% of Accounts Receivable
Under 91 Days 91—180 Days Over 180 Days
Accounts receivable aging at December 31, 2011:Medicare and Medicaid . . . . . . . . . . . . . . . . . . . . . . . 14% 1% 1%Managed care and other insurers . . . . . . . . . . . . . . . . 22 5 5Uninsured . . . . . . . . . . . . . . . . . . . . . . . . . . . . . . . . . . 15 8 29
Total . . . . . . . . . . . . . . . . . . . . . . . . . . . . . . . . . . . . 51% 14% 35%
Accounts receivable aging at December 31, 2010:Medicare and Medicaid . . . . . . . . . . . . . . . . . . . . . . . 14% 1% 1%Managed care and other insurers . . . . . . . . . . . . . . . . 21 4 4Uninsured . . . . . . . . . . . . . . . . . . . . . . . . . . . . . . . . . . 17 8 30
Total . . . . . . . . . . . . . . . . . . . . . . . . . . . . . . . . . . . . 52% 13% 35%
Professional Liability Claims
We, along with virtually all health care providers, operate in an environment with professional liabilityrisks. Our facilities are insured by our wholly-owned insurance subsidiary for losses up to $50 million peroccurrence, subject to a $5 million per occurrence self-insured retention. We purchase excess insurance on aclaims-made basis for losses in excess of $50 million per occurrence. Our professional liability reserves, net ofreceivables under reinsurance contracts, do not include amounts for any estimated losses covered by our excessinsurance coverage. Provisions for losses related to professional liability risks were $244 million, $222 millionand $211 million for the years ended December 31, 2011, 2010 and 2009, respectively.
Reserves for professional liability risks represent the estimated ultimate cost of all reported and unreportedlosses incurred through the respective consolidated balance sheet dates. The estimated ultimate cost includesestimates of direct expenses and fees paid to outside counsel and experts, but does not include the generaloverhead costs of our insurance subsidiary or corporate office. Individual case reserves are established basedupon the particular circumstances of each reported claim and represent our estimates of the future costs that willbe paid on reported claims. Case reserves are reduced as claim payments are made and are adjusted upward ordownward as our estimates regarding the amounts of future losses are revised. Once the case reserves for knownclaims are determined, information is stratified by loss layers and retentions, accident years, reported years, andgeographic location of our hospitals. Several actuarial methods are employed to utilize this data to produceestimates of ultimate losses and reserves for incurred but not reported claims, including: paid and incurredextrapolation methods utilizing paid and incurred loss development to estimate ultimate losses; frequency andseverity methods utilizing paid and incurred claims development to estimate ultimate average frequency (numberof claims) and ultimate average severity (cost per claim); and Bornhuetter-Ferguson methods which add expecteddevelopment to actual paid or incurred experience to estimate ultimate losses. These methods use our company-specific historical claims data and other information. Company-specific claim reporting and settlement datacollected over an approximate 20-year period is used in our reserve estimation process. This company-specificdata includes information regarding our business, including historical paid losses and loss adjustment expenses,
66

HCA HOLDINGS, INC.
MANAGEMENT’S DISCUSSION AND ANALYSIS OF FINANCIAL CONDITIONAND RESULTS OF OPERATIONS— (Continued)
Critical Accounting Policies and Estimates (Continued)
Professional Liability Claims (Continued)
historical and current case loss reserves, actual and projected hospital statistical data, professional liabilityretentions for each policy year, geographic information and other data.
Reserves and provisions for professional liability risks are based upon actuarially determined estimates. Theestimated reserve ranges, net of amounts receivable under reinsurance contracts, were $1.134 billion to$1.354 billion at December 31, 2011 and $1.067 billion to $1.276 billion at December 31, 2010. Our estimatedreserves for professional liability claims may change significantly if future claims differ from expected trends.We perform sensitivity analyses which model the volatility of key actuarial assumptions and monitor ourreserves for adequacy relative to all our assumptions in the aggregate. Based on our analysis, we believe theestimated professional liability reserve ranges represent the reasonably likely outcomes for ultimate losses. Weconsider the number and severity of claims to be the most significant assumptions in estimating reserves forprofessional liabilities. A 2% change in the expected frequency trend could be reasonably likely and wouldincrease the reserve estimate by $18 million or reduce the reserve estimate by $17 million. A 2% change in theexpected claim severity trend could be reasonably likely and would increase the reserve estimate by $78 millionor reduce the reserve estimate by $71 million. We believe adequate reserves have been recorded for ourprofessional liability claims; however, due to the complexity of the claims, the extended period of time to settlethe claims and the wide range of potential outcomes, our ultimate liability for professional liability claims couldchange by more than the estimated sensitivity amounts and could change materially from our current estimates.
The reserves for professional liability risks cover approximately 2,700 individual claims at bothDecember 31, 2011 and 2010 and estimates for unreported potential claims. The time period required to resolvethese claims can vary depending upon the jurisdiction and whether the claim is settled or litigated. The averagetime period between the occurrence and payment of final settlement for our professional liability claims isapproximately five years, although the facts and circumstances of each individual claim can result in anoccurrence-to-settlement timeframe that varies from this average. The estimation of the timing of paymentsbeyond a year can vary significantly.
Reserves for professional liability risks were $1.291 billion and $1.262 billion at December 31, 2011 and2010, respectively. The current portion of these reserves, $298 million and $268 million at December 31, 2011and 2010, respectively, is included in “other accrued expenses.” Obligations covered by reinsurance contracts areincluded in the reserves for professional liability risks, as the insurance subsidiary remains liable to the extentreinsurers do not meet their obligations. Reserves for professional liability risks (net of $39 million and$14 million receivable under reinsurance contracts at December 31, 2011 and 2010, respectively) were$1.252 billion and $1.248 billion at December 31, 2011 and 2010, respectively. The estimated total net reservesfor professional liability risks at December 31, 2011 and 2010 are comprised of $817 million and $758 million,respectively, of case reserves for known claims and $435 million and $490 million, respectively, of reserves forincurred but not reported claims.
67

HCA HOLDINGS, INC.
MANAGEMENT’S DISCUSSION AND ANALYSIS OF FINANCIAL CONDITIONAND RESULTS OF OPERATIONS— (Continued)
Critical Accounting Policies and Estimates (Continued)
Professional Liability Claims (Continued)
Changes in our professional liability reserves, net of reinsurance recoverable, for the years endedDecember 31, are summarized in the following table (dollars in millions):
2011 2010 2009
Net reserves for professional liability claims, January 1 . . . . . . . . . . . . . $1,248 $1,269 $1,330Provision for current year claims . . . . . . . . . . . . . . . . . . . . . . . . . . . . . 298 272 258Favorable development related to prior years’ claims . . . . . . . . . . . . . (54) (50) (47)
Total provision . . . . . . . . . . . . . . . . . . . . . . . . . . . . . . . . . . . . . . . . . 244 222 211
Payments for current year claims . . . . . . . . . . . . . . . . . . . . . . . . . . . . . 7 7 4Payments for prior years’ claims . . . . . . . . . . . . . . . . . . . . . . . . . . . . . 233 236 268
Total claim payments . . . . . . . . . . . . . . . . . . . . . . . . . . . . . . . . . . . . 240 243 272
Net reserves for professional liability claims, December 31 . . . . . . . . . . $1,252 $1,248 $1,269
The favorable development related to prior years’ claims resulted from declining claim frequency andmoderating claim severity trends. We believe these favorable trends are primarily attributable to tort reformsenacted in key states, particularly Texas, and our risk management and patient safety initiatives, particularly inthe area of obstetrics.
Income Taxes
We calculate our provision for income taxes using the asset and liability method, under which deferred taxassets and liabilities are recognized by identifying the temporary differences that arise from the recognition ofitems in different periods for tax and accounting purposes. Deferred tax assets generally represent the tax effectsof amounts expensed in our income statement for which tax deductions will be claimed in future periods.
Although we believe we have properly reported taxable income and paid taxes in accordance withapplicable laws, federal, state or international taxing authorities may challenge our tax positions upon audit.Significant judgment is required in determining and assessing the impact of uncertain tax positions. We report aliability for unrecognized tax benefits from uncertain tax positions taken or expected to be taken in our incometax return. During each reporting period, we assess the facts and circumstances related to uncertain tax positions.If the realization of unrecognized tax benefits is deemed probable based upon new facts and circumstances, theestimated liability and the provision for income taxes are reduced in the current period. Final audit results mayvary from our estimates.
Results of Operations
Revenue/Volume Trends
Our revenues depend upon inpatient occupancy levels, the ancillary services and therapy programs orderedby physicians and provided to patients, the volume of outpatient procedures and the charge and negotiatedpayment rates for such services. Gross charges typically do not reflect what our facilities are actually paid. Ourfacilities have entered into agreements with third-party payers, including government programs and managedcare health plans, under which the facilities are paid based upon the cost of providing services, predeterminedrates per diagnosis, fixed per diem rates or discounts from gross charges. We do not pursue collection of amountsrelated to patients who meet our guidelines to qualify for charity care; therefore, they are not reported in
68

HCA HOLDINGS, INC.
MANAGEMENT’S DISCUSSION AND ANALYSIS OF FINANCIAL CONDITIONAND RESULTS OF OPERATIONS— (Continued)
Results of Operations (Continued)
Revenue/Volume Trends (Continued)
revenues. We provide discounts to uninsured patients who do not qualify for Medicaid or charity care that aresimilar to the discounts provided to many local managed care plans.
Revenues increased 5.9% to $29.682 billion for 2011 from $28.035 billion for 2010 and increased 4.7% for2010 from $26.776 billion for 2009. The increase in revenues in 2011 can be primarily attributed to the combinedimpact of a 0.7% increase in revenue per equivalent admission and a 5.2% increase in equivalent admissionscompared to the prior year. The increase in revenues in 2010 can be primarily attributed to the combined impact of a3.5% increase in revenue per equivalent admission and a 1.2% increase in equivalent admissions compared to 2009.
Consolidated admissions increased 4.2% in 2011 compared to 2010 and declined 0.1% in 2010 compared to2009. Consolidated inpatient surgeries declined 0.5% and consolidated outpatient surgeries increased 2.0%during 2011 compared to 2010. Consolidated inpatient surgeries declined 1.5% and consolidated outpatientsurgeries declined 1.4% during 2010 compared to 2009. Consolidated emergency room visits increased 7.7%during 2011 compared to 2010 and increased 2.0% during 2010 compared to 2009.
Same facility revenues increased 3.3% for the year ended December 31, 2011 compared to the year endedDecember 31, 2010 and increased 4.6% for the year ended December 31, 2010 compared to the year endedDecember 31, 2009. The 3.3% increase for 2011 can be primarily attributed to the combined impact of a 0.3%increase in same facility revenue per equivalent admission and a 3.0% increase in same facility equivalentadmissions. The 4.6% increase for 2010 can be primarily attributed to the combined impact of a 3.2% increase insame facility revenue per equivalent admission and a 1.4% increase in same facility equivalent admissions.
Same facility admissions increased 2.3% in 2011 compared to 2010 and increased 0.1% in 2010 comparedto 2009. Same facility inpatient surgeries declined 1.7% and same facility outpatient surgeries declined 0.6%during 2011 compared to 2010. Same facility inpatient surgeries declined 1.4% and same facility outpatientsurgeries declined 1.2% during 2010 compared to 2009. Same facility emergency room visits increased 6.2%during 2011 compared to 2010 and increased 2.1% during 2010 compared to 2009.
Same facility uninsured emergency room visits increased 5.8% and same facility uninsured admissionsincreased 7.4% during 2011 compared to 2010. Same facility uninsured emergency room visits increased 1.2%and same facility uninsured admissions increased 5.4% during 2010 compared to 2009.
The approximate percentages of our admissions related to Medicare, managed Medicare, Medicaid,managed Medicaid, managed care and other insurers and the uninsured for the years ended December 31, 2011,2010 and 2009 are set forth below.
Years Ended December 31,
2011 2010 2009
Medicare . . . . . . . . . . . . . . . . . . . . . . . . . . . . . . . . . . . . . . . . . . . . . . . . . . . . . . 34% 34% 34%Managed Medicare . . . . . . . . . . . . . . . . . . . . . . . . . . . . . . . . . . . . . . . . . . . . . . 11 10 10Medicaid . . . . . . . . . . . . . . . . . . . . . . . . . . . . . . . . . . . . . . . . . . . . . . . . . . . . . . 9 9 9Managed Medicaid . . . . . . . . . . . . . . . . . . . . . . . . . . . . . . . . . . . . . . . . . . . . . . 8 8 7Managed care and other insurers . . . . . . . . . . . . . . . . . . . . . . . . . . . . . . . . . . . 31 32 34Uninsured . . . . . . . . . . . . . . . . . . . . . . . . . . . . . . . . . . . . . . . . . . . . . . . . . . . . . 7 7 6
100% 100% 100%
69

HCA HOLDINGS, INC.
MANAGEMENT’S DISCUSSION AND ANALYSIS OF FINANCIAL CONDITIONAND RESULTS OF OPERATIONS— (Continued)
Results of Operations (Continued)
Revenue/Volume Trends (Continued)
The approximate percentages of our inpatient revenues, before provision for doubtful accounts, related toMedicare, managed Medicare, Medicaid, managed Medicaid, managed care plans and other insurers and theuninsured for the years ended December 31, 2011, 2010 and 2009 are set forth below.
Years Ended December 31,
2011 2010 2009
Medicare . . . . . . . . . . . . . . . . . . . . . . . . . . . . . . . . . . . . . . . . . . . . . . . . . . . . . . 31% 31% 31%Managed Medicare . . . . . . . . . . . . . . . . . . . . . . . . . . . . . . . . . . . . . . . . . . . . . . 9 9 8Medicaid . . . . . . . . . . . . . . . . . . . . . . . . . . . . . . . . . . . . . . . . . . . . . . . . . . . . . . 8 9 8Managed Medicaid . . . . . . . . . . . . . . . . . . . . . . . . . . . . . . . . . . . . . . . . . . . . . . 4 4 4Managed care and other insurers . . . . . . . . . . . . . . . . . . . . . . . . . . . . . . . . . . . 45 44 44Uninsured(a) . . . . . . . . . . . . . . . . . . . . . . . . . . . . . . . . . . . . . . . . . . . . . . . . . . . 3 3 5
100% 100% 100%
(a) Increases in discounts to uninsured revenues have resulted in declines in the percentage of our inpatientrevenues related to the uninsured, as the percentage of uninsured admissions compared to total admissionshas increased slightly.
At December 31, 2011, we owned and operated 39 hospitals and 31 surgery centers in the state of Florida.Our Florida facilities’ revenues totaled $6.989 billion, $6.538 billion and $6.217 billion for the years endedDecember 31, 2011, 2010 and 2009, respectively. At December 31, 2011, we owned and operated 36 hospitalsand 22 surgery centers in the state of Texas. Our Texas facilities’ revenues totaled $7.829 billion, $7.597 billionand $7.180 billion for the years ended December 31, 2011, 2010 and 2009, respectively. During each year 2011,2010 and 2009, 57% of our admissions and 50% of our revenues were generated by our Florida and Texasfacilities. Uninsured admissions in Florida and Texas represented 63%, 63% and 64% of our uninsuredadmissions during 2011, 2010 and 2009, respectively.
We receive a significant portion of our revenues from government health programs, principally Medicareand Medicaid, which are highly regulated and subject to frequent and substantial changes. We provide indigentcare services in several communities in the state of Texas, in affiliation with other hospitals. The state of Texashas been involved in efforts to increase the indigent care provided by private hospitals. As a result of additionalindigent care being provided by private hospitals, public hospital districts or counties in Texas have availablefunds that were previously devoted to indigent care. The public hospital districts or counties are under nocontractual or legal obligation to provide such indigent care. The public hospital districts or counties have electedto transfer some portion of these available funds to the state’s Medicaid program. Such action is at the solediscretion of the public hospital districts or counties. It is anticipated that these contributions to the state will bematched with federal Medicaid funds. The state then may make supplemental payments to hospitals in the statefor Medicaid services rendered. Hospitals receiving Medicaid supplemental payments may include those that areproviding additional indigent care services. Our Texas Medicaid revenues included $540 million, $657 millionand $474 million during 2011, 2010 and 2009, respectively, of Medicaid supplemental payments. In addition, wereceive supplemental payments in several other states. We are aware these supplemental payment programs arecurrently being reviewed by certain state agencies and some states have made waiver requests to the Centers forMedicare & Medicaid Services (“CMS”) to replace their existing supplemental payment programs. It is possiblethese reviews and waiver requests will result in the restructuring of such supplemental payment programs and
70

HCA HOLDINGS, INC.
MANAGEMENT’S DISCUSSION AND ANALYSIS OF FINANCIAL CONDITIONAND RESULTS OF OPERATIONS— (Continued)
Results of Operations (Continued)
Revenue/Volume Trends (Continued)
could result in the payment programs being reduced or eliminated. In December 2011, CMS approved aMedicaid waiver that allows Texas to continue receiving supplemental Medicaid reimbursement while expandingits Medicaid managed care program, thus Texas is operating pursuant to a Waiver Program. However, we cannotpredict whether the Texas private supplemental Medicaid reimbursement program will continue or guarantee thatrevenues recognized for the program will not decline. Because deliberations about these programs are ongoing,we are unable to estimate the financial impact the program structure modifications, if any, may have on ourresults of operations.
Electronic Health Record Incentive Payments
The American Recovery and Reinvestment Act of 2009 provides for Medicare and Medicaid incentivepayments beginning in 2011 for eligible hospitals and professionals that adopt and meaningfully use certifiedelectronic health record (“EHR”) technology. We recognize income related to Medicare and Medicaid incentivepayments using a gain contingency model that is based upon when our eligible hospitals have demonstratedmeaningful use of certified EHR technology for the applicable period and the cost report information for the fullcost report year that will determine the final calculation of the incentive payment is available.
Medicaid EHR incentive calculations and related payment amounts are based upon prior period cost reportinformation available at the time our eligible hospitals adopt, implement or demonstrate meaningful use ofcertified EHR technology for the applicable period, and are not subject to revision for cost report data filed for asubsequent period. Thus, incentive income recognition occurs at the point our eligible hospitals adopt, implementor demonstrate meaningful use of certified EHR technology for the applicable period, as the cost reportinformation for the full cost report year that will determine the final calculation of the incentive payment isknown at that time.
Medicare EHR incentive calculations and related initial payment amounts are based upon the most currentfiled cost report information available at the time our eligible hospitals demonstrate meaningful use of certifiedEHR technology for the applicable period. However, unlike Medicaid, this initial payment amount will be adjustedbased upon an updated calculation using the annual cost report information for the cost report period that beganduring the applicable payment year. Thus, incentive income recognition occurs at the point our eligible hospitalsdemonstrate meaningful use of certified EHR technology for the applicable period and the cost report informationfor the full cost report year that will determine the final calculation of the incentive payment is available.
We recognized $210 million of electronic health record incentive income related to Medicaid ($87 million)and Medicare ($123 million) incentive programs during 2011. At December 31, 2011, we have $134 million ofdeferred EHR incentive income, which represents initial incentive payments received for which EHR incentiveincome has not been recognized. Actual incentive payments could vary from these estimates due to certainfactors such as availability of federal funding for both Medicare and Medicaid incentive payments, timing of theapproval of state Medicaid incentive payment plans by CMS and our ability to continue to demonstratemeaningful use of certified EHR technology. We have incurred and will continue to incur both capital costs andoperating expenses in order to implement our certified EHR technology and meet meaningful use requirements.These expenses are ongoing and are projected to continue over all stages of implementation of meaningful use.The timing of recognizing the expenses may not correlate with the receipt of the incentive payments and therecognition of revenues. For 2011, we incurred $77 million of operating expenses to implement our certifiedEHR technology and meet meaningful use.
71

HCA HOLDINGS, INC.
MANAGEMENT’S DISCUSSION AND ANALYSIS OF FINANCIAL CONDITIONAND RESULTS OF OPERATIONS— (Continued)
Results of Operations (Continued)
Electronic Health Record Incentive Payments (Continued)
For 2012, we estimate EHR incentive income will be recognized in the range of $325 million to $350million and that related EHR operating expenses will be in the range of $140 million to $160 million. ActualEHR incentive income and EHR operating expenses could vary from these estimates. There can be no assurancethat we will be able to continue to demonstrate meaningful use of certified EHR technology, and the failure to doso could have a material, adverse effect on our results of operations.
72

HCA HOLDINGS, INC.
MANAGEMENT’S DISCUSSION AND ANALYSIS OF FINANCIAL CONDITIONAND RESULTS OF OPERATIONS— (Continued)
Results of Operations (Continued)
Operating Results Summary
The following are comparative summaries of operating results for the years ended December 31, 2011, 2010and 2009 (dollars in millions):
2011 2010 2009
Amount Ratio Amount Ratio Amount Ratio
Revenues before provision for doubtful accounts . . . . . . . . . . . . . . $32,506 $30,683 $30,052Provision for doubtful accounts . . . . . . . . . . . . . . . . . . . . . . . . . . . 2,824 2,648 3,276
Revenues . . . . . . . . . . . . . . . . . . . . . . . . . . . . . . . . . . . . . . . . . . . . . 29,682 100.0 28,035 100.0 26,776 100.0
Salaries and benefits . . . . . . . . . . . . . . . . . . . . . . . . . . . . . . . . . . . . 13,440 45.3 12,484 44.5 11,958 44.7Supplies . . . . . . . . . . . . . . . . . . . . . . . . . . . . . . . . . . . . . . . . . . . . . . 5,179 17.4 4,961 17.7 4,868 18.2Other operating expenses . . . . . . . . . . . . . . . . . . . . . . . . . . . . . . . . 5,470 18.5 5,004 17.9 4,724 17.6Electronic health record incentive income . . . . . . . . . . . . . . . . . . . (210) (0.7) — — — —Equity in earnings of affiliates . . . . . . . . . . . . . . . . . . . . . . . . . . . . (258) (0.9) (282) (1.0) (246) (0.9)Depreciation and amortization . . . . . . . . . . . . . . . . . . . . . . . . . . . . 1,465 4.9 1,421 5.0 1,425 5.2Interest expense . . . . . . . . . . . . . . . . . . . . . . . . . . . . . . . . . . . . . . . . 2,037 6.9 2,097 7.5 1,987 7.4Losses (gains) on sales of facilities . . . . . . . . . . . . . . . . . . . . . . . . . (142) (0.5) (4) — 15 0.1Gain on acquisition of controlling interest in equity investment . . (1,522) (5.1) — — — —Impairments of long-lived assets . . . . . . . . . . . . . . . . . . . . . . . . . . — — 123 0.4 43 0.2Losses on retirement of debt . . . . . . . . . . . . . . . . . . . . . . . . . . . . . . 481 1.6 — — — —Termination of management agreement . . . . . . . . . . . . . . . . . . . . . 181 0.6 — — — —
26,121 88.0 25,804 92.0 24,774 92.5
Income before income taxes . . . . . . . . . . . . . . . . . . . . . . . . . . . . . . 3,561 12.0 2,231 8.0 2,002 7.5Provision for income taxes . . . . . . . . . . . . . . . . . . . . . . . . . . . . . . . 719 2.4 658 2.4 627 2.4
Net income . . . . . . . . . . . . . . . . . . . . . . . . . . . . . . . . . . . . . . . . . . . 2,842 9.6 1,573 5.6 1,375 5.1Net income attributable to noncontrolling interests . . . . . . . . . . . . 377 1.3 366 1.3 321 1.2
Net income attributable to HCA Holdings, Inc. . . . . . . . . . . . . . . . $ 2,465 8.3 $ 1,207 4.3 $ 1,054 3.9
% changes from prior year: . . . . . . . . . . . . . . . . . . . . . . . . . . . . . . .Revenues . . . . . . . . . . . . . . . . . . . . . . . . . . . . . . . . . . . . . . . . . . . 5.9% 4.7% 7.2%Income before income taxes . . . . . . . . . . . . . . . . . . . . . . . . . . . . 59.6 11.5 71.1Net income attributable to HCA Holdings, Inc. . . . . . . . . . . . . . 104.3 14.5 56.7Admissions(a) . . . . . . . . . . . . . . . . . . . . . . . . . . . . . . . . . . . . . . . 4.2 (0.1) 1.0Equivalent admissions(b) . . . . . . . . . . . . . . . . . . . . . . . . . . . . . . 5.2 1.2 3.2Revenue per equivalent admission . . . . . . . . . . . . . . . . . . . . . . . 0.7 3.5 3.9
Same facility % changes from prior year(c): . . . . . . . . . . . . . . . . .Revenues . . . . . . . . . . . . . . . . . . . . . . . . . . . . . . . . . . . . . . . . . . . 3.3 4.6 7.5Admissions(a) . . . . . . . . . . . . . . . . . . . . . . . . . . . . . . . . . . . . . . . 2.3 0.1 1.2Equivalent admissions(b) . . . . . . . . . . . . . . . . . . . . . . . . . . . . . . 3.0 1.4 3.4Revenue per equivalent admission . . . . . . . . . . . . . . . . . . . . . . . 0.3 3.2 4.0
(a) Represents the total number of patients admitted to our hospitals and is used by management and certain investors as ageneral measure of inpatient volume.
(b) Equivalent admissions are used by management and certain investors as a general measure of combined inpatient andoutpatient volume. Equivalent admissions are computed by multiplying admissions (inpatient volume) by the sum ofgross inpatient revenue and gross outpatient revenue and then dividing the resulting amount by gross inpatientrevenue. The equivalent admissions computation “equates” outpatient revenue to the volume measure (admissions)used to measure inpatient volume, resulting in a general measure of combined inpatient and outpatient volume.
(c) Same facility information excludes the operations of hospitals and their related facilities that were either acquired,divested or removed from service during the current and prior year.
73

HCA HOLDINGS, INC.
MANAGEMENT’S DISCUSSION AND ANALYSIS OF FINANCIAL CONDITIONAND RESULTS OF OPERATIONS— (Continued)
Results of Operations (Continued)
Years Ended December 31, 2011 and 2010
Net income attributable to HCA Holdings, Inc. totaled $2.465 billion, or $4.97 per diluted share, for the yearended December 31, 2011 compared to $1.207 billion, or $2.76 per diluted share, for the year endedDecember 31, 2010. Financial results for 2011 include net gains on sales of facilities of $142 million (pretax), or$0.16 per diluted share, a gain on the acquisition of controlling interest in an equity investment of $1.522 billion(pretax), or $2.87 per diluted share, losses on retirement of debt of $481 million (pretax), or $0.61 per dilutedshare, and termination of management agreement fees of $181 million (pretax), or $0.30 per diluted share.Financial results for 2010 include net gains on sales of facilities of $4 million (pretax), or $0.01 per diluted share,and asset impairment charges of $123 million (pretax), or $0.18 per diluted share. All “per diluted share”disclosures are based upon amounts net of the applicable income taxes. Shares used for diluted earnings per sharewere 495.943 million shares and 437.347 million shares for the years ended December 31, 2011 and 2010,respectively. During March 2011, we completed the initial public offering of 87.719 million shares of ourcommon stock, and during September 2011, we repurchased 80.771 million shares of our common stock fromaffiliates of Bank of America Corporation.
During 2011, consolidated admissions increased 4.2% and same facility admissions increased 2.3% for2011, compared to 2010. Consolidated inpatient surgical volumes declined 0.5%, and same facility inpatientsurgeries declined 1.7% during 2011 compared to 2010. Consolidated outpatient surgical volumes increased2.0%, and same facility outpatient surgeries declined 0.6% during 2011 compared to 2010. Emergency roomvisits increased 7.7% on a consolidated basis and increased 6.2% on a same facility basis during 2011 comparedto 2010.
Revenues before provision for doubtful accounts increased 5.9% to $32.506 billion for 2011 from $30.683billion for 2010. Provision for doubtful accounts increased $176 million from $2.648 billion in 2010 to $2.824billion in 2011. With our adoption of ASU 2011-07, the provision for doubtful accounts has been reclassifiedfrom an operating expense to a deduction from patient service revenues. The provision for doubtful accounts andthe allowance for doubtful accounts relate primarily to uninsured amounts due directly from patients, includingcopayment and deductible amounts for patients who have health care coverage. The self-pay revenue deductionsfor charity care and uninsured discounts increased $346 million and $1.066 billion, respectively, during 2011compared to 2010. The sum of the provision for doubtful accounts, uninsured discounts and charity care, as apercentage of the sum of revenues, the provision for doubtful accounts, uninsured discounts and charity care, was27.4% for 2011 compared to 25.6% for 2010. At December 31, 2011, our allowance for doubtful accountsrepresented approximately 92% of the $4.478 billion total patient due accounts receivable balance, includingaccounts, net of estimated contractual discounts, related to patients for which eligibility for Medicaid coverage oruninsured discounts was being evaluated.
Revenues increased 5.9% to $29.682 billion for 2011 from $28.035 billion for 2010. The increase inrevenues was due primarily to the combined impact of a 0.7% increase in revenue per equivalent admission and a5.2% increase in equivalent admissions compared to 2010. Same facility revenues increased 3.3% due primarilyto the combined impact of a 0.3% increase in same facility revenue per equivalent admission and a 3.0% increasein same facility equivalent admissions compared to 2010.
Salaries and benefits, as a percentage of revenues, were 45.3% in 2011 and 44.5% in 2010. Salaries andbenefits per equivalent admission increased 2.4% in 2011 compared to 2010. Same facility labor rate increasesaveraged 2.3% for 2011 compared to 2010.
74

HCA HOLDINGS, INC.
MANAGEMENT’S DISCUSSION AND ANALYSIS OF FINANCIAL CONDITIONAND RESULTS OF OPERATIONS— (Continued)
Results of Operations (Continued)
Years Ended December 31, 2011 and 2010 (Continued)
Supplies, as a percentage of revenues, were 17.4% in 2011 and 17.7% in 2010. Supply costs per equivalentadmission declined 0.7% in 2011 compared to 2010. Supply costs per equivalent admission declined 3.0% formedical devices, 1.5% for pharmacy supplies and 1.7% for blood products, and increased 3.1% for generalmedical and surgical items in 2011 compared to 2010.
Other operating expenses, as a percentage of revenues, increased to 18.5% in 2011 from 17.9% in 2010.Other operating expenses are primarily comprised of contract services, professional fees, repairs andmaintenance, rents and leases, utilities, insurance (including professional liability insurance) and nonincometaxes. Each of contract services and professional fees increased 20 basis points in 2011 compared to 2010. Otheroperating expenses include $317 million and $354 million of indigent care costs in certain Texas markets during2011 and 2010, respectively. Provisions for losses related to professional liability risks were $244 million and$222 million for 2011 and 2010, respectively.
We recognized $210 million of electronic health record incentive income related to Medicaid ($87 million)and Medicare ($123 million) incentive programs during 2011. We recognize income related to Medicare andMedicaid incentive payments using a gain contingency model that is based upon when our eligible hospitals havedemonstrated meaningful use of certified EHR technology for the applicable period and the cost reportinformation for the full cost report year that will determine the final calculation of the incentive payment isavailable.
Equity in earnings of affiliates declined from $282 million for 2010 to $258 million for 2011. Equity inearnings of affiliates relates primarily to our Denver, Colorado market joint venture, which effectiveNovember 1, 2011, we began consolidating due to our acquisition of the approximate 40% remaining ownershipinterest.
Depreciation and amortization declined, as a percentage of revenues, to 4.9% in 2011 from 5.0% in 2010.Depreciation expense was $1.461 billion for 2011 and $1.416 billion for 2010.
Interest expense declined to $2.037 billion for 2011 from $2.097 billion for 2010. The decline in interestexpense was due primarily to a decline in the average interest rate. Our average debt balance was $26.588 billionfor 2011 compared to $26.751 billion for 2010. The average interest rate for our long-term debt declined from7.8% for 2010 to 7.7% for 2011.
Net gains on sales of facilities were $142 million for 2011 and primarily related to the sale of a hospitalfacility and other health care entity investments. Net gains on sales of facilities were $4 million for 2010 andwere related to sales of real estate and other health care entity investments.
During October 2011, we completed our acquisition of the Colorado Health Foundation’s (“Foundation”)approximate 40% remaining ownership interest in the HCA-HealthONE LLC (“HealthONE”) joint venture for$1.450 billion. We recorded a gain on the acquisition of a controlling interest in an equity investment of $1.522billion related to the remeasurement of our previous equity investment in HealthONE based upon our acquisitionof the Foundation’s ownership interest and the resulting consolidation of the entire enterprise at estimated fairvalue.
75

HCA HOLDINGS, INC.
MANAGEMENT’S DISCUSSION AND ANALYSIS OF FINANCIAL CONDITIONAND RESULTS OF OPERATIONS— (Continued)
Results of Operations (Continued)
Years Ended December 31, 2011 and 2010 (Continued)
Impairments of long-lived assets were $123 million for 2010 and included $74 million related to twohospital facilities and $49 million related to other health care entity investments, which includes $35 million forthe writeoff of capitalized engineering and design costs related to certain building safety requirements (Californiaearthquake standards) that have been revised. There were no impairments of long-lived assets in 2011.
During 2011, we recorded losses on retirement of debt of $481 million related to the redemptions of all$1.000 billion aggregate principal amount of our 91⁄8% Senior Secured Notes due 2014, at a redemption price of104.563% of the principal amount; $108 million aggregate principal amount of our 97⁄8% Senior Secured Notesdue 2017, at a redemption price of 109.875% of the principal amount; all of our outstanding $1.578 billion95⁄8%/103⁄8% second lien toggle notes due 2016, at a redemption price of 106.783% of the principal amount andall of our outstanding $3.200 billion 91⁄4% second lien notes due 2016, at a redemption price of 106.513% of theprincipal amount. There were no losses on retirement of debt during the 2010.
Our Investors have provided management and advisory services to the Company, pursuant to a managementagreement among HCA and the Investors executed in connection with the Investors’ acquisition of HCA inNovember 2006. In March 2011, the management agreement was terminated pursuant to its terms uponcompletion of the initial public offering of our common stock, and the Investors were paid a final fee of$181 million.
The effective tax rate was 22.6% and 35.3% for 2011 and 2010, respectively. The effective tax ratecomputations exclude net income attributable to noncontrolling interests as it relates to consolidated partnerships.Our income before income taxes for 2011 included $1.255 billion of nontaxable gain related to the reported gainon the acquisition of a controlling interest in an equity investment. Our provision for income taxes for 2010 wasreduced by $44 million related to reductions in interest expense related to taxing authority examinations.Excluding the effect of these adjustments, the effective tax rate for 2011 and 2010 would have been 37.3% and37.6%, respectively.
Net income attributable to noncontrolling interests increased from $366 million for 2010 to $377 million for2011. The increase in net income attributable to noncontrolling interests related primarily to growth in operatingresults of certain surgery center joint ventures.
Years Ended December 31, 2010 and 2009
Net income attributable to HCA Holdings, Inc. totaled $1.207 billion, or $2.76 per diluted share, for the yearended December 31, 2010 compared to $1.054 billion, or $2.44 per diluted share, for the year endedDecember 31, 2009. Financial results for 2010 include net gains on sales of facilities of $4 million (pretax), or$0.01 per diluted share, and asset impairment charges of $123 million (pretax), or $0.18 per diluted share.Financial results for 2009 include net losses on sales of facilities of $15 million (pretax), or $0.02 per dilutedshare, and asset impairment charges of $43 million (pretax), or $0.08 per diluted share. All “per diluted share”disclosures are based upon amounts net of the applicable income taxes. Shares used for diluted earnings per sharewere 437.347 million shares and 432.227 million shares for the years ended December 31, 2010 and 2009,respectively.
During 2010, consolidated admissions declined 0.1% and same facility admissions increased 0.1% for 2010,compared to 2009. Consolidated inpatient surgical volumes declined 1.5%, and same facility inpatient surgeries
76

HCA HOLDINGS, INC.
MANAGEMENT’S DISCUSSION AND ANALYSIS OF FINANCIAL CONDITIONAND RESULTS OF OPERATIONS— (Continued)
Results of Operations (Continued)
Years Ended December 31, 2010 and 2009 (Continued)
declined 1.4% during 2010 compared to 2009. Consolidated outpatient surgical volumes declined 1.4%, and samefacility outpatient surgeries declined 1.2% during 2010 compared to 2009. Emergency room visits increased 2.0%on a consolidated basis and increased 2.1% on a same facility basis during 2010 compared to 2009.
Revenues before provision for doubtful accounts increased 2.1% to $30.683 billion for 2010 from$30.052 billion for 2009. Provision for doubtful accounts declined $628 million from $3.276 billion in 2009 to$2.648 billion in 2010. With our adoption of ASU 2011-07, the provision for doubtful accounts has beenreclassified from an operating expense to a deduction from patient service revenues. The provision for doubtfulaccounts and the allowance for doubtful accounts relate primarily to uninsured amounts due directly frompatients, including copayment and deductible amounts for patients who have health care coverage. The decline inthe provision for doubtful accounts can be attributed to the $1.892 billion increase in the combined self-payrevenue deductions for charity care and uninsured discounts during 2010, compared to 2009. The self-payrevenue deductions for charity care and uninsured discounts increased $186 million and $1.706 billion,respectively, during 2010 compared to 2009. The sum of the provision for doubtful accounts, uninsured discountsand charity care, as a percentage of the sum of revenues, the provision for doubtful accounts, uninsured discountsand charity care, was 25.6% for 2010 compared to 23.8% for 2009. At December 31, 2010, our allowance fordoubtful accounts represented approximately 93% of the $4.249 billion total patient due accounts receivablebalance, including accounts, net of estimated contractual discounts, related to patients for which eligibility forMedicaid coverage or uninsured discounts was being evaluated.
Revenues increased 4.7% to $28.035 billion for 2010 from $26.776 billion for 2009. The increase inrevenues was due primarily to the combined impact of a 3.5% increase in revenue per equivalent admission and a1.2% increase in equivalent admissions compared to 2009. Same facility revenues increased 4.6% due primarilyto the combined impact of a 3.2% increase in same facility revenue per equivalent admission and a 1.4% increasein same facility equivalent admissions compared to 2009.
Salaries and benefits, as a percentage of revenues, were 44.5% in 2010 and 44.7% in 2009. Salaries andbenefits per equivalent admission increased 3.2% in 2010 compared to 2009. Same facility labor rate increasesaveraged 2.7% for 2010 compared to 2009.
Supplies, as a percentage of revenues, were 17.7% in 2010 and 18.2% in 2009. Supply costs per equivalentadmission increased 0.7% in 2010 compared to 2009. Supply costs per equivalent admission increased 2.4% formedical devices, 0.8% for blood products, and 2.9% for general medical and surgical items, and declined 0.7%for pharmacy supplies in 2010 compared to 2009.
Other operating expenses, as a percentage of revenues, increased to 17.9% in 2010 from 17.6% in 2009.Other operating expenses are primarily comprised of contract services, professional fees, repairs andmaintenance, rents and leases, utilities, insurance (including professional liability insurance) and nonincometaxes. The major component of the increase in other operating expenses, as a percentage of revenues, was relatedto indigent care costs in certain Texas markets which increased to $354 million for 2010 from $248 million for2009. Provisions for losses related to professional liability risks were $222 million and $211 million for 2010 and2009, respectively.
Equity in earnings of affiliates increased from $246 million for 2009 to $282 million for 2010. Equity inearnings of affiliates related primarily to our Denver, Colorado market joint venture.
77

HCA HOLDINGS, INC.
MANAGEMENT’S DISCUSSION AND ANALYSIS OF FINANCIAL CONDITIONAND RESULTS OF OPERATIONS— (Continued)
Results of Operations (Continued)
Years Ended December 31, 2010 and 2009 (Continued)
Depreciation and amortization declined, as a percentage of revenues, to 5.0% in 2010 from 5.2% in 2009.Depreciation expense was $1.416 billion for 2010 and $1.419 billion for 2009.
Interest expense increased to $2.097 billion for 2010 from $1.987 billion for 2009. The increase in interestexpense was due primarily to an increase in the average interest rate. Our average debt balance was$26.751 billion for 2010 compared to $26.267 billion for 2009. The average interest rate for our long-term debtincreased from 7.6% for 2009 to 7.8% for 2010.
Net gains on sales of facilities were $4 million for 2010 and were related to sales of real estate and otherhealth care entity investments. Net losses on sales of facilities were $15 million for 2009 and included $8 millionof net losses on the sales of three hospital facilities and $7 million of net losses on sales of real estate and otherhealth care entity investments.
Impairments of long-lived assets were $123 million for 2010 and included $74 million related to twohospital facilities and $49 million related to other health care entity investments, which includes $35 million forthe writeoff of capitalized engineering and design costs related to certain building safety requirements (Californiaearthquake standards) that have been revised. Impairments of long-lived assets were $43 million for 2009 andincluded $19 million related to goodwill and $24 million related to property and equipment.
The effective tax rate was 35.3% and 37.3% for 2010 and 2009, respectively. The effective tax ratecomputations exclude net income attributable to noncontrolling interests as it relates to consolidated partnerships.Our provisions for income taxes for 2010 and 2009 were reduced by $44 million and $12 million, respectively,related to reductions in interest expense related to taxing authority examinations. Excluding the effect of theseadjustments, the effective tax rate for 2010 and 2009 would have been 37.6% and 38.0%, respectively.
Net income attributable to noncontrolling interests increased from $321 million for 2009 to $366 million for2010. The increase in net income attributable to noncontrolling interests related primarily to growth in operatingresults of hospital joint ventures in two Texas markets.
Liquidity and Capital Resources
Our primary cash requirements are paying our operating expenses, servicing our debt, capital expenditureson our existing properties, acquisitions of hospitals and other health care entities, repurchases of our commonstock, distributions to stockholders and distributions to noncontrolling interests. Our primary cash sources arecash flows from operating activities, issuances of debt and equity securities and dispositions of hospitals andother health care entities.
Cash provided by operating activities totaled $3.933 billion in 2011 compared to $3.085 billion in 2010 and$2.747 billion in 2009. Working capital totaled $1.679 billion at December 31, 2011 and $2.650 billion atDecember 31, 2010. The decline in working capital is primarily related to an increase in our long-term debt duewithin one year. The $848 million increase in cash provided by operating activities for 2011, compared to 2010,was primarily related to $885 million improvement from lower income tax payments. The $338 million increasein cash provided by operating activities for 2010, compared to 2009, was primarily comprised of the net impactof the $198 million increase in net income, a $547 million improvement from lower income tax payments and a
78

HCA HOLDINGS, INC.
MANAGEMENT’S DISCUSSION AND ANALYSIS OF FINANCIAL CONDITIONAND RESULTS OF OPERATIONS— (Continued)
Liquidity and Capital Resources (Continued)
$384 million decline from changes in operating assets and liabilities and the provision for doubtful accounts.Cash payments for interest and income taxes declined $780 million for 2011 compared to 2010 and declined$387 million for 2010 compared to 2009.
Cash used in investing activities was $2.995 billion, $1.039 billion and $1.035 billion in 2011, 2010 and2009, respectively. Excluding acquisitions, capital expenditures were $1.679 billion in 2011, $1.325 billion in2010 and $1.317 billion in 2009. We expended $1.682 billion, $233 million and $61 million for acquisitions ofhospitals and health care entities during 2011, 2010 and 2009, respectively. Expenditures for acquisitions in 2011included eight hospital facilities, seven of which were related to the acquisition of the remaining interests in ourjoint venture in the Denver market. Expenditures for acquisitions in 2010 included two hospital facilities and in2009 were generally comprised of outpatient and ancillary services entities. Planned capital expenditures areexpected to approximate $1.9 billion in 2012. At December 31, 2011, there were projects under constructionwhich had an estimated additional cost to complete and equip over the next five years of approximately$1.5 billion. We expect to finance capital expenditures with internally generated and borrowed funds.
During 2011, we received cash of $281 million from sales of one hospital, other health care entities and realestate investments. We also received net cash proceeds of $80 million related to net changes in our investments.During 2010, we received cash proceeds of $37 million from sales of other health care entities and real estateinvestments. We also received net cash proceeds of $472 million related to net changes in our investments.During 2009, we received cash proceeds of $41 million from dispositions of three hospitals and sales of otherhealth care entities and real estate investments. We also received net cash proceeds of $303 million related to netchanges in our investments.
Cash used in financing activities totaled $976 million in 2011, $1.947 billion in 2010 and $1.865 billion in2009. During 2011, we received cash of $2.506 billion related to the issuance of common stock in conjunctionwith our initial public offering; we used cash of $1.503 billion for repurchases of common stock; and we usedcash proceeds from issuance of common stock and available cash provided by operations to make net debtrepayments of $1.589 billion. During 2010, we received net proceeds of $2.533 billion from our debt issuanceand debt repayment activities. During 2009, we used cash proceeds from sales of facilities and available cashprovided by operations to make net debt repayments of $1.459 billion. During 2011 and 2010, we paid $31million and $4.257 billion, respectively, in distributions to our stockholders. During 2010, we receivedcontributions from noncontrolling interests of $57 million. During 2011, 2010 and 2009, we made distributionsto noncontrolling interests of $378 million, $342 million and $330 million, respectively. We paid debt issuancecosts of $92 million, $50 million and $70 million for 2011, 2010 and 2009, respectively. During 2011 and 2010,we received income tax benefits of $63 million and $114 million, respectively, for certain items (primarily thecash distributions to holders of our stock options and exercises of stock options) that were deductible expensesfor tax purposes, but were recognized as adjustments to stockholders’ deficit for financial reporting purposes. Weor our affiliates, including affiliates of the Sponsors, may in the future repurchase portions of our debt or equitysecurities, subject to certain limitations, from time to time in either the open market or through privatelynegotiated transactions, in accordance with applicable SEC and other legal requirements. The timing, prices, andsizes of purchases depend upon prevailing trading prices, general economic and market conditions, and otherfactors, including applicable securities laws. Funds for the repurchase of debt or equity securities have, and areexpected to, come primarily from cash generated from operations and borrowed funds.
79

HCA HOLDINGS, INC.
MANAGEMENT’S DISCUSSION AND ANALYSIS OF FINANCIAL CONDITIONAND RESULTS OF OPERATIONS— (Continued)
Liquidity and Capital Resources (Continued)
In addition to cash flows from operations, available sources of capital include amounts available under oursenior secured credit facilities ($2.137 billion as of December 31, 2011 and $2.070 billion as of January 31,2012) and anticipated access to public and private debt and equity markets.
During 2010, our Board of Directors declared three distributions to our stockholders and holders of stockoptions. The distributions totaled $9.43 per share and vested stock option, or $4.332 billion in the aggregate. Thedistributions were funded using funds available under our existing senior secured credit facilities, proceeds fromthe November 2010 issuance of $1.525 billion aggregate principal amount of 73⁄4% senior unsecured notes due2021 and cash on hand.
On February 3, 2012, our Board of Directors declared a distribution to the Company’s existing stockholdersand holders of vested stock awards. The distribution declared was $2.00 per share and vested stock award, orapproximately $975 million in the aggregate.
Investments of our professional liability insurance subsidiaries, to maintain statutory equity and pay claims,totaled $628 million and $742 million at December 31, 2011 and 2010, respectively. The insurance subsidiarymaintained net reserves for professional liability risks of $410 million and $452 million at December 31, 2011and 2010, respectively. Our facilities are insured by our wholly-owned insurance subsidiary for losses up to$50 million per occurrence; however, this coverage is subject to a $5 million per occurrence self-insuredretention. Net reserves for the self-insured professional liability risks retained were $842 million and$796 million at December 31, 2011 and 2010, respectively. Claims payments, net of reinsurance recoveries,during the next 12 months are expected to approximate $285 million. We estimate that approximately$205 million of the expected net claim payments during the next 12 months will relate to claims subject to theself-insured retention.
Financing Activities
We are a highly leveraged company with significant debt service requirements. Our debt totaled$27.052 billion and $28.225 billion at December 31, 2011 and 2010, respectively. Our interest expense was$2.037 billion for 2011 and $2.097 billion for 2010.
During March 2010, we issued $1.400 billion aggregate principal amount of 71⁄4% senior secured first liennotes due 2020 at a price of 99.095% of their face value, resulting in $1.387 billion of gross proceeds. After thepayment of related fees and expenses, we used the proceeds to repay outstanding indebtedness under our seniorsecured term loan facilities. During November 2010, we issued $1.525 billion aggregate principal amount of73⁄4% senior unsecured notes due 2021 at a price of 100% of their face value. After the payment of related feesand expenses, we used the proceeds to make a distribution to our stockholders and optionholders.
During June 2011, we redeemed all $1.000 billion aggregate principal amount of our 91⁄8% senior securednotes due 2014, at a redemption price of 104.563% of the principal amount, and $108 million aggregate principalamount of our 97⁄8% senior secured notes due 2017, at a redemption price of 109.875% of the principal amount.
During August 2011, we issued $5.000 billion aggregate principal amount of notes, comprised of$3.000 billion of 6.50% senior secured first lien notes due 2020 and $2.000 billion of 7.50% senior unsecurednotes due 2022. After the payment of related fees and expenses, we used the net proceeds from these debtissuances to redeem all of our outstanding $1.578 billion 95⁄8%/103⁄8% second lien toggle notes due 2016, at aredemption price of 106.783% of the principal amount, and all of our outstanding $3.200 billion 91⁄4% secondlien notes due 2016, at a redemption price of 106.513% of the principal amount.
80

HCA HOLDINGS, INC.
MANAGEMENT’S DISCUSSION AND ANALYSIS OF FINANCIAL CONDITIONAND RESULTS OF OPERATIONS— (Continued)
Liquidity and Capital Resources (Continued)
Financing Activities (Continued)
On September 21, 2011, we repurchased 80,771,143 shares of our common stock beneficially owned byaffiliates of Bank of America Corporation at a purchase price of $18.61 per share, the closing price of theCompany’s common stock on the New York Stock Exchange on September 14, 2011. The repurchase wasfinanced using a combination of cash on hand and borrowings under available credit facilities. The sharesrepurchased represented approximately 15.6% of our total shares outstanding.
During October 2011, we issued $500 million aggregate principal amount of 8.00% senior unsecured notesdue 2018. After the payment of related fees and expenses, we used the net proceeds for general corporatepurposes, which included funding a portion of the acquisition of the Colorado Health Foundation’s approximate40% remaining ownership interest in the HCA-HealthONE LLC joint venture, which was purchased duringOctober 2011 for $1.450 billion.
Management believes that cash flows from operations, amounts available under our senior secured creditfacilities and our anticipated access to public and private debt markets will be sufficient to meet expectedliquidity needs during the next twelve months.
81

HCA HOLDINGS, INC.
MANAGEMENT’S DISCUSSION AND ANALYSIS OF FINANCIAL CONDITIONAND RESULTS OF OPERATIONS— (Continued)
Contractual Obligations and Off-Balance Sheet Arrangements
As of December 31, 2011, maturities of contractual obligations and other commercial commitments arepresented in the table below (dollars in millions):
Payments Due by Period
Contractual Obligations(a) Total Current 2-3 Years 4-5 Years After 5 Years
Long-term debt including interest, excluding the seniorsecured credit facilities(b) . . . . . . . . . . . . . . . . . . . . . . . $28,545 $2,248 $4,089 $4,063 $18,145
Loans outstanding under the senior secured creditfacilities, including interest(b) . . . . . . . . . . . . . . . . . . . . 11,560 860 2,931 3,384 4,385
Operating leases(c) . . . . . . . . . . . . . . . . . . . . . . . . . . . . . . . 1,934 280 482 302 870Purchase and other obligations(c) . . . . . . . . . . . . . . . . . . . 27 19 8 — —
Total contractual obligations . . . . . . . . . . . . . . . . . . . . . . . $42,066 $3,407 $7,510 $7,749 $23,400
Commitment Expiration by Period
Other Commercial Commitments Not Recorded on theConsolidated Balance Sheet Total Current 2-3 Years 4-5 Years After 5 Years
Surety bonds(d) . . . . . . . . . . . . . . . . . . . . . . . . . . . . . . . . . . . . $ 52 $51 $ 1 $— $—Letters of credit(e) . . . . . . . . . . . . . . . . . . . . . . . . . . . . . . . . . . 65 7 15 43 —Physician commitments(f) . . . . . . . . . . . . . . . . . . . . . . . . . . . . 24 17 7 — —Guarantees(g) . . . . . . . . . . . . . . . . . . . . . . . . . . . . . . . . . . . . . 2 — — — 2
Total commercial commitments . . . . . . . . . . . . . . . . . . . . . . . $143 $75 $23 $43 $ 2
(a) We have not included obligations to pay net estimated professional liability claims ($1.252 billion at December 31, 2011,including net reserves of $410 million relating to the wholly-owned insurance subsidiary) in this table. The estimatedprofessional liability claims, which occurred prior to 2007, are expected to be funded by the designated investmentsecurities that are restricted for this purpose ($628 million at December 31, 2011). We also have not included obligationsrelated to unrecognized tax benefits of $494 million at December 31, 2011, as we cannot reasonably estimate the timingor amounts of cash payments, if any, at this time.
(b) Estimates of interest payments assume that interest rates, borrowing spreads and foreign currency exchange rates atDecember 31, 2011, remain constant during the period presented.
(c) Amounts relate to future operating lease obligations, purchase obligations and other obligations and are not recorded inour consolidated balance sheet. Amounts also include physician commitments that are recorded in our consolidatedbalance sheet.
(d) Amounts relate primarily to instances in which we have agreed to indemnify various commercial insurers who haveprovided surety bonds to cover self-insured workers’ compensation claims, utility deposits and damages for malpracticecases which were awarded to plaintiffs by the courts. These cases are currently under appeal and the bonds will not bereleased by the courts until the cases are closed.
(e) Amounts relate primarily to various insurance programs and employee benefit plan obligations for which we have lettersof credit outstanding.
(f) In consideration for physicians relocating to the communities in which our hospitals are located and agreeing to engagein private practice for the benefit of the respective communities, we make advances to physicians, normally over a periodof one year, to assist in establishing the physicians’ practices. The actual amount of these commitments to be advancedoften depends upon the financial results of the physicians’ private practice during the recruitment agreement paymentperiod. The physician commitments reflected were based on our maximum exposure on effective agreements atDecember 31, 2011.
(g) We have entered into guarantee agreements related to certain leases.
82

HCA HOLDINGS, INC.
MANAGEMENT’S DISCUSSION AND ANALYSIS OF FINANCIAL CONDITIONAND RESULTS OF OPERATIONS— (Continued)
Market Risk
We are exposed to market risk related to changes in market values of securities. The investments in debt andequity securities of our wholly-owned insurance subsidiaries were $621 million and $7 million, respectively, atDecember 31, 2011. These investments are carried at fair value, with changes in unrealized gains and lossesbeing recorded as adjustments to other comprehensive income. At December 31, 2011, we had a net unrealizedgain of $11 million on the insurance subsidiaries’ investment securities.
We are exposed to market risk related to market illiquidity. Investments in debt and equity securities of ourwholly-owned insurance subsidiaries could be impaired by the inability to access the capital markets. Should thewholly-owned insurance subsidiaries require significant amounts of cash in excess of normal cash requirements to payclaims and other expenses on short notice, we may have difficulty selling these investments in a timely manner or beforced to sell them at a price less than what we might otherwise have been able to in a normal market environment. AtDecember 31, 2011, our wholly-owned insurance subsidiaries had invested $131 million ($139 million par value) intax-exempt student loan auction rate securities that continue to experience market illiquidity. It is uncertain if auction-related market liquidity will resume for these securities. We may be required to recognize other-than-temporaryimpairments on these long-term investments in future periods should issuers default on interest payments or should thefair market valuations of the securities deteriorate due to ratings downgrades or other issue specific factors.
We are also exposed to market risk related to changes in interest rates, and we periodically enter intointerest rate swap agreements to manage our exposure to these fluctuations. Our interest rate swap agreementsinvolve the exchange of fixed and variable rate interest payments between two parties, based on commonnotional principal amounts and maturity dates. The notional amounts of the swap agreements represent balancesused to calculate the exchange of cash flows and are not our assets or liabilities. Our credit risk related to theseagreements is considered low because the swap agreements are with creditworthy financial institutions. Theinterest payments under these agreements are settled on a net basis. These derivatives have been recognized inthe financial statements at their respective fair values. Changes in the fair value of these derivatives, which aredesignated as cash flow hedges, are included in other comprehensive income, and changes in the fair value ofderivatives which have not been designated as hedges are recorded in operations.
With respect to our interest-bearing liabilities, approximately $5.082 billion of long-term debt atDecember 31, 2011 was subject to variable rates of interest, while the remaining balance in long-term debt of$21.970 billion at December 31, 2011 was subject to fixed rates of interest. Both the general level of interestrates and, for the senior secured credit facilities, our leverage affect our variable interest rates. Our variable debtis comprised primarily of amounts outstanding under the senior secured credit facilities. Borrowings under thesenior secured credit facilities bear interest at a rate equal to an applicable margin plus, at our option, either (a) abase rate determined by reference to the higher of (1) the federal funds rate plus 0.50% and (2) the prime rate ofBank of America or (b) a LIBOR rate for the currency of such borrowing for the relevant interest period. Theapplicable margin for borrowings under the senior secured credit facilities may fluctuate according to a leverageratio. The average effective interest rate for our long-term debt declined from 7.8% for 2010 to 7.7% for 2011.
On November 8, 2010, an amended and restated joinder agreement was entered into with respect to the cashflow credit facility to establish a new replacement revolving credit series, which will mature on November 17, 2015.
On May 4, 2011, we completed amendments to our senior secured credit agreement and senior securedasset-based revolving credit agreement, as well as extensions of certain of our term loans. The amendmentsextend $594 million of our term loan A facility with a final maturity of November 2012 to a final maturity ofMay 2016 and $2.373 billion of our term loan A and term loan B-1 facilities with final maturities of November2012 and November 2013, respectively, to a final maturity of May 2018.
83
HCA HOLDINGS, INC.
MANAGEMENT’S DISCUSSION AND ANALYSIS OF FINANCIAL CONDITIONAND RESULTS OF OPERATIONS— (Continued)
Market Risk (Continued)
On September 30, 2011, we refinanced our $2.000 billion asset-based revolving credit facility maturing onNovember 16, 2012 to increase the total capacity to $2.500 billion and extend the maturity to 2016.
The estimated fair value of our total long-term debt was $27.199 billion at December 31, 2011. Theestimates of fair value are based upon the quoted market prices for the same or similar issues of long-term debtwith the same maturities. Based on a hypothetical 1% increase in interest rates, the potential annualized reductionto future pretax earnings would be approximately $51 million. To mitigate the impact of fluctuations in interestrates, we generally target a portion of our debt portfolio to be maintained at fixed rates.
Our international operations and the European term loan expose us to market risks associated with foreigncurrencies. In order to mitigate the currency exposure related to debt service obligations through December 31,2011 under the European term loan, we have entered into cross currency swap agreements. A cross currencyswap is an agreement between two parties to exchange a stream of principal and interest payments in onecurrency for a stream of principal and interest payments in another currency over a specified period.
Financial Instruments
Derivative financial instruments are employed to manage risks, including foreign currency and interest rateexposures, and are not used for trading or speculative purposes. We recognize derivative instruments, such asinterest rate swap agreements and foreign exchange contracts, in the consolidated balance sheets at fair value.Changes in the fair value of derivatives are recognized periodically either in earnings or in stockholders’ equity,as a component of other comprehensive income, depending on whether the derivative financial instrumentqualifies for hedge accounting, and if so, whether it qualifies as a fair value hedge or a cash flow hedge. Gainsand losses on derivatives designated as cash flow hedges, to the extent they are effective, are recorded in othercomprehensive income, and subsequently reclassified to earnings to offset the impact of the hedged items whenthey occur. Changes in the fair value of derivatives not qualifying as hedges, and for any portion of a hedge thatis ineffective, are reported in earnings.
The net interest paid or received on interest rate swaps is recognized as interest expense. Gains and lossesresulting from the early termination of interest rate swap agreements are deferred and amortized as adjustmentsto expense over the remaining period of the debt originally covered by the terminated swap.
Effects of Inflation and Changing Prices
Various federal, state and local laws have been enacted that, in certain cases, limit our ability to increaseprices. Revenues for general, acute care hospital services rendered to Medicare patients are established under thefederal government’s prospective payment system. Total fee-for-service Medicare revenues were 25.8%, 25.7%and 25.6% of our revenues for 2011, 2010 an 2009, respectively.
Management believes hospital industry operating margins have been, and may continue to be, undersignificant pressure because of changes in payer and service mix and growth in operating expenses in excess ofthe increase in prospective payments under the Medicare program. In addition, as a result of increasingregulatory and competitive pressures, our ability to maintain operating margins through price increases tonon-Medicare patients is limited.
84

HCA HOLDINGS, INC.
MANAGEMENT’S DISCUSSION AND ANALYSIS OF FINANCIAL CONDITIONAND RESULTS OF OPERATIONS— (Continued)
Effects of Inflation and Changing Prices (Continued)
IRS Disputes
We are contesting, before the IRS Appeals Division, certain claimed deficiencies and adjustments proposedby the IRS Examination Division in connection with its audit of HCA Inc.’s 2005 and 2006 federal income taxreturns. The disputed items include the timing of recognition of certain patient service revenues, the deductibilityof certain debt retirement costs and our method for calculating the tax allowance for doubtful accounts. The IRSExamination Division began an audit of HCA Inc.’s 2007, 2008 and 2009 federal income tax returns in 2010.
Management believes HCA Holdings, Inc., its predecessors and affiliates properly reported taxable incomeand paid taxes in accordance with applicable laws and agreements established with the IRS and final resolutionof these disputes will not have a material, adverse effect on our results of operations or financial position.However, if payments due upon final resolution of these issues exceed our recorded estimates, such resolutionscould have a material, adverse effect on our results of operations or financial position.
Item 7A. Quantitative and Qualitative Disclosures about Market Risk
Information with respect to this Item is provided under the caption “Market Risk” under Item 7,“Management’s Discussion and Analysis of Financial Condition and Results of Operations.”
Item 8. Financial Statements and Supplementary Data
Information with respect to this Item is contained in our consolidated financial statements indicated in theIndex to Consolidated Financial Statements on Page F-1 of this annual report on Form 10-K.
Item 9. Changes in and Disagreements with Accountants on Accounting and Financial Disclosure
None.
Item 9A. Controls and Procedures
1. Conclusion Regarding the Effectiveness of Disclosure Controls and Procedures
Under the supervision and with the participation of our management, including our principal executiveofficer and principal financial officer, we conducted an evaluation of our disclosure controls and procedures, assuch term is defined under Rule 13a-15(e) promulgated under the Securities Exchange Act of 1934, as amended(the “Exchange Act”). Based on this evaluation, our principal executive officer and our principal financial officerconcluded that our disclosure controls and procedures were effective as of the end of the period covered by thisannual report.
85

2. Internal Control Over Financial Reporting
(a) Management’s Report on Internal Control Over Financial Reporting
Our management is responsible for establishing and maintaining effective internal control over financialreporting, as such term is defined in Exchange Act Rule 13a-15(f). Because of its inherent limitations, internalcontrol over financial reporting may not prevent or detect misstatements. Therefore, even those systemsdetermined to be effective, can provide only reasonable assurance with respect to financial statement preparationand presentation.
Under the supervision and with the participation of our management, including our principal executiveofficer and principal financial officer, we conducted an assessment of the effectiveness of our internal controlover financial reporting based on the framework in Internal Control — Integrated Framework issued by theCommittee of Sponsoring Organizations of the Treadway Commission. Based on our assessment under theframework in Internal Control — Integrated Framework, our management concluded that our internal controlover financial reporting was effective as of December 31, 2011.
Ernst & Young, LLP, the independent registered public accounting firm that audited our consolidatedfinancial statements included in this Form 10-K, has issued a report on our internal control over financialreporting, which is included herein.
(b) Attestation Report of the Independent Registered Public Accounting Firm
86

Report of Independent Registered Public Accounting Firm
The Board of Directors and StockholdersHCA Holdings, Inc.
We have audited HCA Holdings, Inc.’s internal control over financial reporting as of December 31, 2011,based on criteria established in Internal Control — Integrated Framework issued by the Committee of SponsoringOrganizations of the Treadway Commission (the COSO criteria). HCA Holdings, Inc.’s management isresponsible for maintaining effective internal control over financial reporting, and for its assessment of theeffectiveness of internal control over financial reporting included in the accompanying Management’s Report onInternal Control Over Financial Reporting. Our responsibility is to express an opinion on the company’s internalcontrol over financial reporting based on our audit.
We conducted our audit in accordance with the standards of the Public Company Accounting OversightBoard (United States). Those standards require that we plan and perform the audit to obtain reasonable assuranceabout whether effective internal control over financial reporting was maintained in all material respects. Ouraudit included obtaining an understanding of internal control over financial reporting, assessing the risk that amaterial weakness exists, testing and evaluating the design and operating effectiveness of internal control basedon the assessed risk, and performing such other procedures as we considered necessary in the circumstances. Webelieve that our audit provides a reasonable basis for our opinion.
A company’s internal control over financial reporting is a process designed to provide reasonable assuranceregarding the reliability of financial reporting and the preparation of financial statements for external purposes inaccordance with generally accepted accounting principles. A company’s internal control over financial reportingincludes those policies and procedures that (1) pertain to the maintenance of records that, in reasonable detail,accurately and fairly reflect the transactions and dispositions of the assets of the company; (2) provide reasonableassurance that transactions are recorded as necessary to permit preparation of financial statements in accordancewith generally accepted accounting principles, and that receipts and expenditures of the company are being madeonly in accordance with authorizations of management and directors of the company; and (3) provide reasonableassurance regarding prevention or timely detection of unauthorized acquisition, use, or disposition of thecompany’s assets that could have a material effect on the financial statements.
Because of its inherent limitations, internal control over financial reporting may not prevent or detectmisstatements. Also, projections of any evaluation of effectiveness to future periods are subject to the risk thatcontrols may become inadequate because of changes in conditions, or that the degree of compliance with thepolicies or procedures may deteriorate.
In our opinion, HCA Holdings, Inc. maintained, in all material respects, effective internal control overfinancial reporting as of December 31, 2011, based on the COSO criteria.
We also have audited, in accordance with the standards of the Public Company Accounting Oversight Board(United States), the consolidated balance sheets of HCA Holdings, Inc. as of December 31, 2011 and 2010, andthe related consolidated statements of income, stockholders’ deficit, and cash flows for each of the three years inthe period ended December 31, 2011 and our report dated February 23, 2012 expressed an unqualified opinionthereon.
/s/ Ernst & Young LLP
Nashville, TennesseeFebruary 23, 2012
87

(c) Changes in Internal Control Over Financial Reporting
During the fourth quarter of 2011, there have been no changes in our internal control over financialreporting that have materially affected or are reasonably likely to materially affect our internal control overfinancial reporting.
Item 9B. Other Information
On February 22, 2012, the Compensation Committee of the Board of Directors approved a one-time cashpayment of approximately $1.3 million to Beverly B. Wallace, formerly President–Parallon Business Solutions,to be paid upon her retirement from the Company, effective February 29, 2012. This payment will be in additionto any other payments made to Ms. Wallace in connection with her retirement as set forth in her employmentagreement and the Company’s other benefit plans in which she participates.
PART III
Item 10. Directors, Executive Officers and Corporate Governance
The information required by this Item regarding the identity and business experience of our directors andexecutive officers is set forth under the heading “Election of Directors” in the definitive proxy materials of HCAto be filed in connection with our 2012 Annual Meeting of Stockholders with respect to our directors and is setforth in Item 1 of Part I of this annual report on Form 10-K with respect to our executive officers. Theinformation required by this Item contained in such definitive proxy materials is incorporated herein byreference.
Information on the beneficial ownership reporting for our directors and executive officers required by thisItem is contained under the caption “Section 16(a) Beneficial Ownership Reporting Compliance” in the definitiveproxy materials to be filed in connection with our 2012 Annual Meeting of Stockholders and is incorporatedherein by reference.
Information on our Audit and Compliance Committee and Audit Committee Financial Experts required bythis Item is contained under the caption “Corporate Governance” in the definitive proxy materials to be filed inconnection with our 2012 Annual Meeting of Stockholders and is incorporated herein by reference.
We have a Code of Conduct which is applicable to all our directors, officers and employees (the “Code ofConduct”). The Code of Conduct is available on the Ethics and Compliance and Corporate Governance pages ofour website at www.hcahealthcare.com. To the extent required pursuant to applicable SEC regulations, we intendto post amendments to or waivers from our Code of Conduct (to the extent applicable to our chief executiveofficer, principal financial officer or principal accounting officer) at this location on our website or report thesame on a Current Report on Form 8-K. Our Code of Conduct is available free of charge upon request to ourCorporate Secretary, HCA Holdings, Inc., One Park Plaza, Nashville, TN 37203.
Item 11. Executive Compensation
The information required by this Item is set forth under the headings “Executive Compensation” and“Compensation Committee Interlocks and Insider Participation” in the definitive proxy materials to be filed inconnection with our 2012 Annual Meeting of Stockholders, which information is incorporated herein byreference.
Item 12. Security Ownership of Certain Beneficial Owners and Management and Related StockholderMatters
Information about security ownership of certain beneficial owners required by this Item is set forth underthe heading “Security Ownership of Certain Beneficial Owners and Management and Related StockholderMatters” in the definitive proxy materials to be filed in connection with our 2012 Annual Meeting ofStockholders, which information is incorporated herein by reference.
88
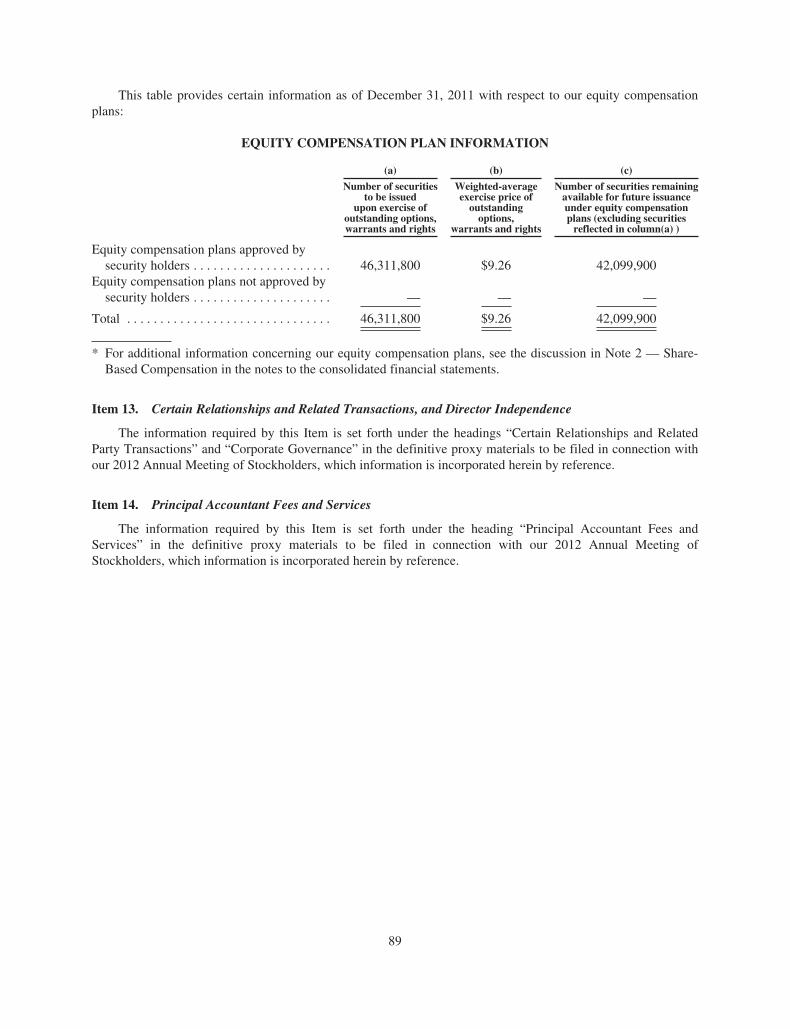
This table provides certain information as of December 31, 2011 with respect to our equity compensationplans:
EQUITY COMPENSATION PLAN INFORMATION
(a) (b) (c)
Number of securitiesto be issued
upon exercise ofoutstanding options,warrants and rights
Weighted-averageexercise price ofoutstandingoptions,
warrants and rights
Number of securities remainingavailable for future issuanceunder equity compensationplans (excluding securitiesreflected in column(a) )
Equity compensation plans approved bysecurity holders . . . . . . . . . . . . . . . . . . . . . 46,311,800 $9.26 42,099,900
Equity compensation plans not approved bysecurity holders . . . . . . . . . . . . . . . . . . . . . — — —
Total . . . . . . . . . . . . . . . . . . . . . . . . . . . . . . . 46,311,800 $9.26 42,099,900
* For additional information concerning our equity compensation plans, see the discussion in Note 2 — Share-Based Compensation in the notes to the consolidated financial statements.
Item 13. Certain Relationships and Related Transactions, and Director Independence
The information required by this Item is set forth under the headings “Certain Relationships and RelatedParty Transactions” and “Corporate Governance” in the definitive proxy materials to be filed in connection withour 2012 Annual Meeting of Stockholders, which information is incorporated herein by reference.
Item 14. Principal Accountant Fees and Services
The information required by this Item is set forth under the heading “Principal Accountant Fees andServices” in the definitive proxy materials to be filed in connection with our 2012 Annual Meeting ofStockholders, which information is incorporated herein by reference.
89

PART IV
Item 15. Exhibits and Financial Statement Schedules
(a) Documents filed as part of the report:
1. Financial Statements. The accompanying Index to Consolidated Financial Statements on page F-1 of thisannual report on Form 10-K is provided in response to this item.
2. List of Financial Statement Schedules. All schedules are omitted because the required information iseither not present, not present in material amounts or presented within the consolidated financial statements.
3. List of Exhibits
2.1 — Agreement and Plan of Merger, dated July 24, 2006, by and among HCA Inc., Hercules Holding II, LLCand Hercules Acquisition Corporation (filed as Exhibit 2.1 to the Company’s Current Report onForm 8-K filed July 25, 2006, and incorporated herein by reference).
2.2 — Merger Agreement, dated November 22, 2010, by and among HCA Inc., HCA Holdings, Inc., and HCAMerger Sub LLC (filed as Exhibit 2.1 to the Company’s Current Report on Form 8-K filed November 24,2010, and incorporated herein by reference).
2.3 — Membership Interest Purchase Agreement by and between HealthONE, D/B/A The Colorado HealthFoundation, and HealthONE of Denver, Inc., dated August 2, 2011 (Registrant agrees to furnishsupplementally a copy of any omitted schedule to the Securities and Exchange Commission uponrequest) (filed as Exhibit 2.1 to the Company’s Quarterly Report on Form 10-Q for the quarter endedJune 30, 2011, and incorporated herein by reference).
3.1 — Amended and Restated Certificate of Incorporation of the Company (filed as Exhibit 3.1 to theCompany’s Registration Statement on Form S-1 (File No. 333-171369), and incorporated herein byreference).
3.2 — Amended and Restated Bylaws of the Company (filed as Exhibit 3.2 to the Company’s RegistrationStatement on Form S-1 (File No. 333-171369), and incorporated herein by reference).
4.1 — Specimen Certificate for shares of Common Stock, par value $0.01 per share, of the Company. (filed asExhibit 4.1 to the Company’s Registration Statement on Form S-1 (File No. 333-171369), andincorporated herein by reference).
4.2 — Security Agreement, dated as of November 17, 2006, among HCA Inc., the subsidiary grantors partythereto and The Bank of New York, as collateral agent (filed as Exhibit 4.2 to the Company’s CurrentReport on Form 8-K filed November 24, 2006, and incorporated herein by reference).
4.3 — Pledge Agreement, dated as of November 17, 2006, among HCA Inc., the subsidiary pledgors partythereto and The Bank of New York, as collateral agent (filed as Exhibit 4.3 to the Company’s CurrentReport of Form 8-K filed November 24, 2006, and incorporated herein by reference).
4.4 — Indenture, dated February 19, 2009, among HCA Inc, the guarantors party thereto, The Bank of NewYork Mellon, as collateral agent and The Bank of New York Mellon Trust Company, N.A., as trustee(filed as Exhibit 4.1 to the Company’s Current Report on Form 8-K filed February 25, 2009, andincorporated herein by reference).
4.5 — Form of 97⁄8% Senior Secured Notes due 2017 (included in Exhibit 4.6).
90

4.6(a) — $13,550,000,000 — €1,000,000,000 Credit Agreement, dated as of November 17, 2006, among HCAInc., HCA UK Capital Limited, the lending institutions from time to time parties thereto, Banc ofAmerica Securities LLC, J.P. Morgan Securities Inc., Citigroup Global Markets Inc. and MerrillLynch, Pierce, Fenner & Smith Incorporated, as joint lead arrangers and joint bookrunners, Bank ofAmerica, N.A., as administrative agent, JPMorgan Chase Bank, N.A. and Citicorp North America,Inc., as co-syndication agents and Merrill Lynch Capital Corporation, as documentation agent (filed asExhibit 4.8 to the Company’s Current Report on Form 8-K filed November 24, 2006, and incorporatedherein by reference).
4.6(b) — Amendment No. 1 to the Credit Agreement, dated as of February 16, 2007, among HCA Inc., HCAUK Capital Limited, the lending institutions from time to time parties thereto, Bank of America, N.A.,as administrative agent, JPMorgan Chase Bank, N.A., and Citicorp North America, Inc., asCo-Syndication Agents, Banc of America Securities, LLC, J.P. Morgan Securities Inc., CitigroupGlobal Markets Inc. and Merrill Lynch, Pierce, Fenner & Smith Incorporated, as joint lead arrangersand bookrunners, Deutsche Bank Securities and Wachovia Capital Markets LLC, as joint bookrunnersand Merrill Lynch Capital Corporation, as documentation agent (filed as Exhibit 4.7(b) to theCompany’s Annual Report on Form 10-K for the fiscal year ended December 31, 2006, andincorporated herein by reference).
4.6(c) — Amendment No. 2 to the Credit Agreement, dated as of March 2, 2009, among HCA Inc., HCA UKCapital Limited, the lending institutions from time to time parties thereto, Bank of America, N.A., asadministrative agent, JPMorgan Chase Bank, N.A., and Citicorp North America, Inc., as Co-Syndication Agents, Banc of America Securities, LLC, J.P. Morgan Securities Inc., Citigroup GlobalMarkets Inc. and Merrill Lynch, Pierce, Fenner & Smith Incorporated, as joint lead arrangers andbookrunners, Deutsche Bank Securities and Wachovia Capital Markets LLC, as joint bookrunners andMerrill Lynch Capital Corporation, as documentation agent (filed as exhibit 4.8(c) to the Company’sAnnual Report on Form 10-K for the fiscal year ended December 31, 2008, and incorporated hereinby reference).
4.6(d) — Amendment No. 3 to the Credit Agreement, dated as of June 18, 2009, among HCA Inc., HCA UKCapital Limited, the lending institutions from time to time parties thereto, Bank of America, N.A., asadministrative agent, JPMorgan Chase Bank, N.A., and Citicorp North America, Inc., as Co-Syndication Agents, Banc of America Securities, LLC, J.P. Morgan Securities Inc., Citigroup GlobalMarkets Inc. and Merrill Lynch, Pierce, Fenner & Smith Incorporated, as joint lead arrangers andbookrunners, Deutsche Bank Securities and Wachovia Capital Markets LLC, as joint bookrunners andMerrill Lynch Capital Corporation, as documentation agent (filed as Exhibit 4.1 to the Company’sCurrent Report on Form 8-K filed June 22, 2009, and incorporated herein by reference).
4.6(e) — Extension Amendment No. 1 to the Credit Agreement, dated as of April 6, 2010, among HCA Inc.,HCA UK Capital Limited, the lending institutions from time to time parties thereto, Bank of America,N.A., as administrative agent and collateral agent (filed as Exhibit 10.1 to the Company’s CurrentReport on Form 8-K filed April 8, 2010, and incorporated herein by reference).
4.6(f) — Amended and Restated Joinder Agreement No. 1, dated as of November 8, 2010, by and among eachof the financial institutions listed as a “Replacement-1 Revolving Credit Lender” on Schedule Athereto, HCA Inc., Bank of America, N.A., as Administrative Agent and as Collateral Agent, and theother parties listed on the signature pages thereto (filed as Exhibit 4.1 to the Company’s QuarterlyReport on Form 10-Q filed November 9, 2010, and incorporated herein by reference).
4.6(g) — Restatement Agreement, dated as of May 4, 2011, by and among HCA Inc., HCA UK CapitalLimited, the lenders party thereto and Bank of America, N.A., as administrative agent and collateralagent to the Credit Agreement, dated as of November 17, 2006, as amended on February 16, 2007,March 2, 2009, June 18, 2009, April 6, 2010 and November 8, 2010 (filed as Exhibit 10.1 to theCompany’s Current Report on Form 8-K filed May 9, 2011, and incorporated herein by reference).
91

4.7 — U.S. Guarantee, dated November 17, 2006, among HCA Inc., the subsidiary guarantors party theretoand Bank of America, N.A., as administrative agent (filed as Exhibit 4.9 to the Company’s CurrentReport on Form 8-K filed November 24, 2006, and incorporated herein by reference).
4.8 — Indenture, dated as of April 22, 2009, among HCA Inc., the guarantors party thereto, Deutsche BankTrust Company Americas, as paying agent, registrar and transfer agent, and Law DebentureTrust Company of New York, as trustee (filed as Exhibit 4.1 to the Company’s Current Report onForm 8-K filed April 28, 2009, and incorporated herein by reference).
4.9 — Security Agreement, dated as November 17, 2006, and amended and restated as of March 2, 2009,among the Company, the Subsidiary Grantors named therein and Bank of America, N.A., asCollateral Agent (filed as exhibit 4.10 to the Company’s Annual Report on Form 10-K for the fiscalyear ended December 31, 2008, and incorporated herein by reference).
4.10 — Pledge Agreement, dated as of November 17, 2006, and amended and restated as of March 2, 2009,among the Company, the Subsidiary Pledgors named therein and Bank of America, N.A., asCollateral Agent (filed as exhibit 4.11 to the Company’s Annual Report on Form 10-K for the fiscalyear ended December 31, 2008, and incorporated herein by reference).
4.11 — Form of 81⁄2% Senior Secured Notes due 2019 (included in Exhibit 4.10).
4.12 — Indenture, dated as of August 11, 2009, among HCA Inc., the guarantors party thereto, DeutscheBank Trust Company Americas, as paying agent, registrar and transfer agent, and Law DebentureTrust Company of New York, as trustee (filed as Exhibit 4.1 to the Company’s Current Report onForm 8-K filed August 17, 2009, and incorporated herein by reference).
4.13 — Form of 77⁄8% Senior Secured Notes due 2020 (included in Exhibit 4.14).
4.14 — Indenture, dated as of March 10, 2010, among HCA Inc., the guarantors party thereto, DeutscheBank Trust Company Americas, as paying agent, registrar and transfer agent, and Law DebentureTrust Company of New York, as trustee (filed as Exhibit 4.1 to the Company’s Current Report onForm 8-K filed March 12, 2010, and incorporated herein by reference).
4.15 — Form of 71⁄4% Senior Secured Notes due 2020 (included in Exhibit 4.16).
4.16 — $2,500,000,000 Credit Agreement, dated as of September 30, 2011, by and among HCA Inc., thesubsidiary borrowers party thereto, the lenders from time to time party thereto and Bank of America,N.A., as administrative agent (filed as Exhibit 4.4 to the Company’s Current Report on Form 8-Kfiled October 3, 2011, and incorporated herein by reference).
4.17 — Security Agreement, dated as of September 30, 2011, by and among HCA Inc., the subsidiaryborrowers party thereto and Bank of America, N.A., as collateral agent (filed as Exhibit 4.5 to theCompany’s Current Report on Form 8-K filed October 3, 2011, and incorporated herein byreference).
4.18(a) — General Intercreditor Agreement, dated as of November 17, 2006, between Bank of America, N.A.,as First Lien Collateral Agent, and The Bank of New York, as Junior Lien Collateral Agent (filed asExhibit 4.13(a) to the Company’s Registration Statement on Form S-4 (File No. 333-145054), andincorporated herein by reference).
4.18(b) — Additional General Intercreditor Agreement, dated as of April 22, 2009, by and among Bank ofAmerica, N.A., in its capacity as First Lien Collateral Agent, The Bank of New York Mellon, in itscapacity as Junior Lien Collateral Agent and in its capacity as 2006 Second Lien Trustee and TheBank of New York Mellon Trust Company, N.A., in its capacity as 2009 Second Lien Trustee (filedas Exhibit 4.6 to the Company’s Current Report on Form 8-K filed April 28, 2009, and incorporatedherein by reference).
92

4.18(c) — Additional General Intercreditor Agreement, dated as of August 11, 2009, by and among Bank ofAmerica, N.A., in its capacity as First Lien Collateral Agent, The Bank of New York Mellon, in itscapacity as Junior Lien Collateral Agent and in its capacity as trustee for the Second Lien Notes issuedon November 17, 2006, and The Bank of New York Mellon Trust Company, N.A., in its capacity astrustee for the Second Lien Notes issued on February 19, 2009 (filed as Exhibit 4.6 to the Company’sCurrent Report on Form 8-K filed August 17, 2009, and incorporated herein by reference).
4.18(d) — Receivables Intercreditor Agreement, dated as of November 17, 2006, among Bank of America,N.A., as ABL Collateral Agent, Bank of America, N.A., as CF Collateral Agent and The Bank ofNew York, as Bonds Collateral Agent (filed as Exhibit 4.13(b) to the Company’s RegistrationStatement on Form S-4 (File No. 333-145054), and incorporated herein by reference).
4.18(e) — Additional Receivables Intercreditor Agreement, dated as of April 22, 2009, by and between Bank ofAmerica, N.A. as ABL Collateral Agent, and Bank of America, N.A. as New First Lien CollateralAgent (filed as Exhibit 4.7 to the Company’s Current Report on Form 8-K filed April 28, 2009, andincorporated herein by reference).
4.18(f) — Additional Receivables Intercreditor Agreement, dated as of August 11, 2009, by and between Bankof America, N.A., as ABL Collateral Agent, and Bank of America, N.A., as New First LienCollateral Agent (filed as Exhibit 4.7 to the Company’s Current Report on Form 8-K filedAugust 17, 2009, and incorporated herein by reference).
4.18(g) — First Lien Intercreditor Agreement, dated as of April 22, 2009, among Bank of America, N.A. asCollateral Agent, Bank of America, N.A. as Authorized Representative under the Credit Agreementand Law Debenture Trust Company of New York as the Initial Additional Authorized Representative(filed as Exhibit 4.5 to the Company’s Current Report on Form 8-K filed April 28, 2009, andincorporated herein by reference).
4.18(h) — Additional General Intercreditor Agreement, dated as of August 1, 2011, by and among Bank ofAmerica, N.A., in its capacity as First Lien Collateral Agent, The Bank of New York Mellon, in itscapacity as Junior Lien Collateral Agent and in its capacity as trustee for the Second Lien Notesissued on November 17, 2006, and The Bank of New York Mellon Trust Company, N.A., in itscapacity as trustee for the Second Lien Notes issued on February 19, 2009 (filed as Exhibit 4.9 to theCompany’s Current Report on Form 8-K filed August 1, 2011, and incorporated herein byreference).
4.18(i) — Additional Receivables Intercreditor Agreement, dated as of August 1, 2011 by and between Bank ofAmerica, N.A., as ABL Collateral Agent, and Bank of America, N.A., as New First Lien CollateralAgent (filed as Exhibit 4.1 to the Company’s Current Report on Form 8-K filed October 3, 2011, andincorporated herein by reference).
4.18(j) — Additional General Intercreditor Agreement, dated as of February 16, 2012, by and among Bank ofAmerica, N.A., in its capacity as First Lien Collateral Agent, The Bank of New York Mellon, in itscapacity as Junior Lien Collateral Agent and in its capacity as trustee for the Second Lien Notesissued on November 17, 2006, and The Bank of New York Mellon Trust Company, N.A., in itscapacity as trustee for the Second Lien Notes issued on February 19, 2009 (filed as Exhibit 4.9 to theCompany’s Current Report on Form 8-K filed February 16, 2012, and incorporated herein byreference).
4.18(k) — Additional Receivables Intercreditor Agreement, dated as of February 16, 2012, by and betweenBank of America, N.A., as ABL Collateral Agent, and Bank of America, N.A., as New First LienCollateral Agent (filed as Exhibit 4.10 to the Company’s Current Report on Form 8-K filed February16, 2012, and incorporated herein by reference).
4.19 — Registration Rights Agreement, dated as of November 22, 2010, among HCA Holdings, Inc.,Hercules Holding II, LLC and certain other parties thereto (filed as Exhibit 4.4 to the Company’sCurrent Report on Form 8-K filed November 24, 2010, and incorporated herein by reference).
93

4.20 — Registration Rights Agreement, dated as of March 16, 1989, by and among HCA-HospitalCorporation of America and the persons listed on the signature pages thereto (filed as Exhibit 4.14 tothe Company’s Registration Statement on Form S-4 (File No. 333-145054), and incorporated hereinby reference).
4.21 — Assignment and Assumption Agreement, dated as of February 10, 1994, between HCA-HospitalCorporation of America and the Company relating to the Registration Rights Agreement, as amended(filed as Exhibit 4.15 to the Company’s Registration Statement on Form S-4 (File No. 333-145054),and incorporated herein by reference).
4.22(a) — Indenture, dated as of December 16, 1993 between the Company and The First National Bank ofChicago, as Trustee (filed as Exhibit 4.16(a) to the Company’s Registration Statement on Form S-4(File No. 333-145054), and incorporated herein by reference).
4.22(b) — First Supplemental Indenture, dated as of May 25, 2000 between the Company and Bank OneTrust Company, N.A., as Trustee (filed as Exhibit 4.16(b) to the Company’s Registration Statementon Form S-4 (File No. 333-145054), and incorporated herein by reference).
4.22(c) — Second Supplemental Indenture, dated as of July 1, 2001 between the Company and Bank OneTrust Company, N.A., as Trustee (filed as Exhibit 4.16(c) to the Company’s Registration Statementon Form S-4 (File No. 333-145054), and incorporated herein by reference).
4.22(d) — Third Supplemental Indenture, dated as of December 5, 2001 between the Company and The Bank ofNew York, as Trustee (filed as Exhibit 4.16(d) to the Company’s Registration Statement onForm S-4 (File No. 333-145054), and incorporated herein by reference).
4.22(e) — Fourth Supplemental Indenture, dated as of November 14, 2006, between the Company and TheBank of New York, as Trustee (filed as Exhibit 4.1 to the Company’s Current Report on Form 8-Kfiled November 16, 2006, and incorporated herein by reference).
4.23 — Form of 7.5% Debentures due 2023 (filed as Exhibit 4.17 to the Company’s Registration Statementon Form S-4 (File No. 333-145054), and incorporated herein by reference).
4.24 — Form of 8.36% Debenture due 2024 (filed as Exhibit 4.18 to the Company’s Registration Statementon Form S-4 (File No. 333-145054), and incorporated herein by reference).
4.25 — Form of Fixed Rate Global Medium-Term Note (filed as Exhibit 4.19 to the Company’s RegistrationStatement on Form S-4 (File No. 333-145054), and incorporated herein by reference).
4.26 — Form of Floating Rate Global Medium-Term Note (filed as Exhibit 4.20 to the Company’sRegistration Statement on Form S-4 (File No. 333-145054), and incorporated herein by reference).
4.27 — Form of 7.69% Note due 2025 (filed as Exhibit 4.10 to the Company’s Annual Report on Form 10-Kfor the fiscal year ended December 31, 2004 (File No. 001-11239), and incorporated herein byreference).
4.28 — Form of 7.19% Debenture due 2015 (filed as Exhibit 4.22 to the Company’s Registration Statementon Form S-4 (File No. 333-145054), and incorporated herein by reference).
4.29 — Form of 7.50% Debenture due 2095 (filed as Exhibit 4.23 to the Company’s Registration Statementon Form S-4 (File No. 333-145054), and incorporated herein by reference).
4.30 — Form of 7.05% Debenture due 2027 (filed as Exhibit 4.24 to the Company’s Registration Statementon Form S-4 (File No. 333-145054), and incorporated herein by reference).
4.31(a) — 6.95% Note due 2012 in the principal amount of $400,000,000 (filed as Exhibit 4.29(a) to theCompany’s Registration Statement on Form S-4 (File No. 333-145054), and incorporated herein byreference).
94

4.31(b) — 6.95% Note due 2012 in the principal amount of $100,000,000 (filed as Exhibit 4.29(b) to theCompany’s Registration Statement on Form S-4 (File No. 333-145054), and incorporated herein byreference).
4.32(a) — 6.30% Note due 2012 in the principal amount of $400,000,000 (filed as Exhibit 4.1 to theCompany’s Current Report on Form 8-K dated September 18, 2002 (File No. 001-11239), andincorporated herein by reference).
4.32(b) — 6.30% Note due 2012 in the principal amount of $100,000,000 (filed as Exhibit 4.2 to theCompany’s Current Report on Form 8-K dated September 18, 2002 (File No. 001-11239), andincorporated herein by reference).
4.33(a) — 6.25% Note due 2013 in the principal amount of $400,000,000 (filed as Exhibit 4.1 to theCompany’s Current Report on Form 8-K dated February 5, 2003 (File No. 001-11239), andincorporated herein by reference).
4.33(b) — 63⁄4% Note due 2013 in the principal amount of $100,000,000 (filed as Exhibit 4.2 to the Company’sCurrent Report on Form 8-K dated February 5, 2003 (File No. 001-11239), and incorporated hereinby reference).
4.34(a) — 63⁄4% Note due 2013 in the principal amount of $400,000,000 (filed as Exhibit 4.1 to the Company’sCurrent Report on Form 8-K dated July 23, 2003 (File No. 001-11239), and incorporated herein byreference).
4.34(b) — 63⁄4% Note due 2013 in the principal amount of $100,000,000 (filed as Exhibit 4.2 to the Company’sCurrent Report on Form 8-K dated July 23, 2003 (File No. 001-11239), and incorporated herein byreference).
4.35 — 7.50% Note due 2033 in the principal amount of $250,000,000 (filed as Exhibit 4.2 to theCompany’s Current Report on Form 8-K dated November 6, 2003 (File No. 001-11239), andincorporated herein by reference).
4.36 — 5.75% Note due 2014 in the principal amount of $500,000,000 (filed as Exhibit 4.1 to theCompany’s Current Report on Form 8-K dated March 8, 2004 (File No. 001-11239), andincorporated herein by reference).
4.37(a) — 6.375% Note due 2015 in the principal amount of $500,000,000 (filed as Exhibit 4.2 to theCompany’s Current Report on Form 8-K dated November 16, 2004 (File No. 001-11239), andincorporated herein by reference).
4.37(b) — 6.375% Note due 2015 in the principal amount of $250,000,000 (filed as Exhibit 4.3 to theCompany’s Current Report on Form 8-K dated November 16, 2004 (File No. 001-11239), andincorporated herein by reference).
4.38(a) — 6.500% Note due 2016 in the principal amount of $500,000,000 (filed as Exhibit 4.1 to theCompany’s Current Report on Form 8-K filed on February 8, 2006, and incorporated herein byreference).
4.38(b) — 6.500% Note due 2016 in the principal amount of $500,000,000 (filed as Exhibit 4.2 to theCompany’s Current Report on Form 8-K filed on February 8, 2006, and incorporated herein byreference).
4.39 — Indenture, dated as of November 23, 2010, among HCA Holdings, Inc., Deutsche BankTrust Company Americas, as paying agent, registrar and transfer agent, and Law DebentureTrust Company of New York, as trustee (filed as Exhibit 4.1 to the Company’s Current Report onForm 8-K filed November 24, 2010, and incorporated herein by reference).
4.40 — Form of 73⁄4% Senior Notes due 2021 (included in Exhibit 4.39).
95

4.41 — Form of Indenture of HCA Inc. (filed as Exhibit 4.2 to the Registrant’s Registration Statement onForm S-3 (File No. 333-175791), and incorporated herein by reference).
4.42 — Supplemental Indenture No. 1, dated as of August 1, 2011, among HCA Inc., HCA Holdings, Inc., LawDebenture Trust Company of New York, as trustee, and Deutsche Bank Trust Company Americas, aspaying agent, registrar and transfer agent (filed as Exhibit 4.2 to the Company’s Current Report onForm 8-K filed August 1, 2011, and incorporated herein by reference).
4.43 — Supplemental Indenture No. 2, dated as of August 1, 2011, among HCA Inc., HCA Holdings, Inc., thesubsidiary guarantors named therein, Law Debenture Trust Company of New York, as trustee, andDeutsche Bank Trust Company Americas, as paying agent, registrar and transfer agent (filed as Exhibit4.3 to the Company’s Current Report on Form 8-K filed August 1, 2011, and incorporated herein byreference).
4.44 — Form of 7.50% Senior Notes Due 2022 (included in Exhibit 4.42).
4.45 — Form of 6.50% Senior Secured Notes Due 2020 (included in Exhibit 4.43).
4.46 — Supplemental Indenture No. 3, dated as of October 3, 2011, among HCA Inc., HCA Holdings, Inc., LawDebenture Trust Company of New York, as trustee, and Deutsche Bank Trust Company Americas, aspaying agent, registrar and transfer agent (filed as Exhibit 4.2 to the Company’s Current Report onForm 8-K filed October 3, 2011, and incorporated herein by reference).
4.47 — Form of 8.00% Senior Notes Due 2018 (included in Exhibit 4.46).
4.48 — Supplemental Indenture No. 4, dated as of February 16, 2012, among HCA Inc., HCA Holdings, Inc.,the subsidiary guarantors named therein, Law Debenture Trust Company of New York, as trustee, andDeutsche Bank Trust Company Americas, as paying agent, registrar and transfer agent (filed as Exhibit4.2 to the Company’s Current Report on Form 8-K filed February 16, 2012, and incorporated herein byreference).
4.49 — Form of 5.875% Senior Secured Notes due 2022 (included in Exhibit 4.48).
10.1 — HCA-Hospital Corporation of America Nonqualified Initial Option Plan (filed as Exhibit 4.6 to theCompany’s Registration Statement on Form S-3 (File No. 33-52379), and incorporated herein byreference).*
10.2 — Form of Indemnity Agreement with certain officers and directors (filed as Exhibit 10.3 to the Company’sRegistration Statement on Form S-4 (File No. 333-145054) and incorporated herein by reference).
10.3 — Columbia/HCA Healthcare Corporation 2000 Equity Incentive Plan (filed as Exhibit A to theCompany’s Proxy Statement for the Annual Meeting of Stockholders on May 25, 2000, andincorporated herein by reference).*
10.4 — Form of Non-Qualified Stock Option Award Agreement (Officers) (filed as Exhibit 99.2 to theCompany’s Current Report on Form 8-K dated February 2, 2005 (File No. 001-11239), andincorporated herein by reference).*
10.5 — HCA 2005 Equity Incentive Plan (filed as Exhibit B to the Company’s Proxy Statement for the AnnualMeeting of Shareholders on May 26, 2005, and incorporated herein by reference).*
10.6 — Form of 2005 Non-Qualified Stock Option Agreement (Officers) (filed as Exhibit 99.2 to theCompany’s Current Report on Form 8-K dated October 6, 2005, and incorporated herein by reference).*
10.7 — Form of 2006 Non-Qualified Stock Option Award Agreement (Officers) (filed as Exhibit 10.2 to theCompany’s Current Report on Form 8-K dated February 1, 2006, and incorporated herein byreference).*
96

10.8(a) — 2006 Stock Incentive Plan for Key Employees of HCA Holdings, Inc. and its Affiliates as Amendedand Restated (filed as Exhibit 10.11(b) to the Company’s Registration Statement on Form S-1 (FileNo. 333-171369), and incorporated herein by reference).*
10.8(b) — First Amendment to 2006 Stock Incentive Plan for Key Employees of HCA Holdings, Inc. and itsAffiliates, as amended and restated (filed as Exhibit 10.1 to the Company’s Quarterly Report onForm 10-Q for the quarter ended June 30, 2011, and incorporated herein by reference).*
10.9(a) — Management Stockholder’s Agreement dated November 17, 2006 (filed as Exhibit 10.12 to theCompany’s Annual Report on Form 10-K for the fiscal year ended December 31, 2006, andincorporated herein by reference).
10.9(b) — Form of Omnibus Amendment to HCA Holdings, Inc’s Management Stockholder’s Agreements(filed as Exhibit 10.39 to the Company’s Registration Statement on Form S-1 (File No. 333-171369),and incorporated herein by reference).*
10.10 — Form of Option Rollover Agreement (filed as Exhibit 10.14 to the Company’s Annual Report onForm 10-K for the fiscal year ended December 31, 2006, and incorporated herein by reference).*
10.11 — Form of Stock Option Agreement (2007) (filed as Exhibit 10.15 to the Company’s Annual Report onForm 10-K for the fiscal year ended December 31, 2006, and incorporated herein by reference).*
10.12 — Form of Stock Option Agreement (2008) (filed as Exhibit 10.16 to the Company’s Annual Report onForm 10-K for the fiscal year ended December 31, 2007, and incorporated herein by reference).*
10.13 — Form of Stock Option Agreement (2009) (filed as Exhibit 10.17 to the Company’s Annual Report onForm 10-K for the fiscal year ended December 31, 2008, and incorporated herein by reference).*
10.14 — Form of Stock Option Agreement (2010) (filed as Exhibit 10.20 to the Company’s Annual Report onForm 10-K for the fiscal year ended December 31, 2009, and incorporated herein by reference).*
10.15 — Form of 2x Time Stock Option Agreement (filed as Exhibit 10.2 to the Company’s Quarterly Report onForm 10-Q for the quarterly period ended September 30, 2009, and incorporated herein by reference).
10.16 — Form Stock Option Agreement (2011) (filed as Exhibit 10.1 to the Company’s Quarterly Report onForm 10-Q for the quarter ended September 30, 2011, and incorporated herein by reference).*
10.17 — Form of Stock Appreciation Right Award Agreement Under the 2006 Stock Incentive Plan for KeyEmployees of HCA Holdings, Inc. and its Affiliates, as Amended and Restated (filed as Exhibit 10.1 tothe Company’s Current Report on Form 8-K filed February 14, 2012, and incorporated herein byreference).*
10.18 — Form of Director Restricted Share Unit Agreement (Initial Award) Under the 2006 Stock IncentivePlan for Key Employees of HCA Holdings, Inc. and its Affiliates, as Amended and Restated (filed asExhibit 10.2 to the Company’s Current Report on Form 8-K filed February 14, 2012, and incorporatedherein by reference).*
10.19 — Form of Director Restricted Share Unit Agreement (Annual Award) Under the 2006 Stock IncentivePlan for Key Employees of HCA Holdings, Inc. and its Affiliates, as Amended and Restated (filed asExhibit 10.3 to the Company’s Current Report on Form 8-K filed February 14, 2012, and incorporatedherein by reference).*
10.20 — Exchange and Purchase Agreement (filed as Exhibit 10.16 to the Company’s Annual Report onForm 10-K for the fiscal year ended December 31, 2006, and incorporated herein by reference).
10.21 — Civil and Administrative Settlement Agreement, dated December 14, 2000 between the Company,the United States Department of Justice and others (filed as Exhibit 99.2 to the Company’s CurrentReport on Form 8-K dated December 20, 2000 (File No. 001-11239), and incorporated herein byreference).
97

10.22 — Plea Agreement, dated December 14, 2000 between the Company, Columbia Homecare Group,Inc., Columbia Management Companies, Inc. and the United States Department of Justice (filed asExhibit 99.3 to the Company’s Current Report on Form 8-K dated December 20, 2000 (FileNo. 001-11239), and incorporated herein by reference).
10.23 — Corporate Integrity Agreement, dated December 14, 2000 between the Company and the Office ofInspector General of the United States Department of Health and Human Services (filed asExhibit 99.4 to the Company’s Current Report on Form 8-K dated December 20, 2000 (FileNo. 001-11239), and incorporated herein by reference).
10.24 — Management Agreement, dated November 17, 2006, among HCA Inc., Bain Capital Partners, LLC,Kohlberg Kravis Roberts & Co. L.P., Dr. Thomas F. Frist, Jr., Patricia F. Elcan, William R. Fristand Thomas F. Frist III, and Merrill Lynch Global Partners, Inc. (filed as Exhibit 10.20 to theCompany’s Annual Report on Form 10-K for the fiscal year ended December 31, 2006, andincorporated herein by reference).
10.25 — Retirement Agreement between the Company and Thomas F. Frist, Jr., M.D. dated as of January 1,2002 (filed as Exhibit 10.30 to the Company’s Annual Report on Form 10-K for the fiscal yearended December 31, 2001 (File No. 001-11239), and incorporated herein by reference).*
10.26 — Amended and Restated HCA Supplemental Executive Retirement Plan, effective December 22,2010, except as provided therein (filed as Exhibit 10.26 to the Company’s Annual Report on Form10-K for the fiscal year ended December 31, 2010, and incorporated herein by reference).*
10.27 — Amended and Restated HCA Restoration Plan, effective December 22, 2010 (filed as Exhibit 10.27to the Company’s Annual Report on Form 10-K for the fiscal year ended December 31, 2010, andincorporated herein by reference).*
10.28(a) — HCA Inc. 2008-2009 Senior Officer Performance Excellence Program (filed as Exhibit 10.27 to theCompany’s Annual Report on Form 10-K for the fiscal year ended December 31, 2007, andincorporated herein by reference).*
10.28(b) — HCA Inc. Amendment No. 1 to the 2008-2009 Senior Officer Performance Excellence Program(filed as Exhibit 10.28(b) to the Company’s Annual Report on Form 10-K for the fiscal year endedDecember 31, 2008, and incorporated herein by reference).*
10.29(a) — Employment Agreement dated November 16, 2006 (Richard M. Bracken) (filed as Exhibit 10.27(b)to the Company’s Annual Report on Form 10-K for the fiscal year ended December 31, 2006, andincorporated herein by reference).*
10.29(b) — Employment Agreement dated November 16, 2006 (R. Milton Johnson) (filed as Exhibit 10.27(c)to the Company’s Annual Report on Form 10-K for the fiscal year ended December 31, 2006, andincorporated herein by reference).*
10.29(c) — Employment Agreement dated November 16, 2006 (Samuel N. Hazen) (filed as Exhibit 10.27(d) tothe Company’s Annual Report on Form 10-K for the fiscal year ended December 31, 2006, andincorporated herein by reference).*
10.29(d) — Employment Agreement dated November 16, 2006 (William P. Rutledge) (filed as Exhibit 10.27(e)to the Company’s Annual Report on Form 10-K for the fiscal year ended December 31, 2006, andincorporated herein by reference).*
10.29(e) — Employment Agreement dated November 16, 2006 (Beverly B. Wallace) (filed as Exhibit 10.28(e)to the Company’s Annual Report on Form 10-K for the fiscal year ended December 31, 2007, andincorporated herein by reference).*
10.29(f) — Amended and Restated Employment Agreement dated October 27, 2008 (Jack O. Bovender, Jr.)(filed as Exhibit 10.29(f) to the Company’s Annual Report on Form 10-K for the fiscal year endedDecember 31, 2008, and incorporated herein by reference).*
98

10.29(g) — Amendment to Employment Agreement effective January 1, 2009 (Richard M. Bracken) (filed asExhibit 10.29(g) to the Company’s Annual Report on Form 10-K for the fiscal year endedDecember 31, 2008, and incorporated herein by reference).*
10.29(h) — Amendment No. 2 to Employment Agreement effective February 9, 2011 (Richard M. Bracken)(filed as Exhibit 10.29(h) to the Company’s Annual Report on Form 10-K for the fiscal year endedDecember 31, 2010, and incorporated herein by reference).*
10.29(i) — Amendment to Employment Agreement effective February 9, 2011 (R. Milton Johnson) (filed asExhibit 10.29(i) to the Company’s Annual Report on Form 10-K for the fiscal year endedDecember 31, 2010, and incorporated herein by reference).*
10.29(j) — Amendment to Employment Agreement effective February 9, 2011 (Samuel N. Hazen) (filed asExhibit 10.29(j) to the Company’s Annual Report on Form 10-K for the fiscal year endedDecember 31, 2010, and incorporated herein by reference).*
10.29(k) — Amendment to Employment Agreement effective February 9, 2011 (Beverly B. Wallace) (filed asExhibit 10.29(k) to the Company’s Annual Report on Form 10-K for the fiscal year endedDecember 31, 2010, and incorporated herein by reference).*
10.30 — Administrative Settlement Agreement dated June 25, 2003 by and between the United StatesDepartment of Health and Human Services, acting through the Centers for Medicare and MedicaidServices, and the Company (filed as Exhibit 10.1 to the Company’s Quarterly Report onForm 10-Q for the quarter ended June 30, 2003 (File No. 001-11239), and incorporated herein byreference).
10.31 — Civil Settlement Agreement by and among the United States of America, acting through theUnited States Department of Justice and on behalf of the Office of Inspector General of theDepartment of Health and Human Services, the TRICARE Management Activity (filed asExhibit 10.2 to the Company’s Quarterly Report of Form 10-Q for the quarter ended June 30, 2003(File No. 001-11239), and incorporated herein by reference).
10.32(a) — Form of Amended and Restated Limited Liability Company Agreement of Hercules Holding II,LLC dated as of November 17, 2006, among Hercules Holding II, LLC and certain other partiesthereto (filed as Exhibit 10.3 to the Company’s Registration Statement on Form 8-A, filedApril 29, 2008 (File No. 000-18406) and incorporated herein by reference).
10.32(b) — Form of Amendment to the Amended and Restated Limited Liability Company Agreement ofHercules Holding II, LLC (filed as Exhibit 10.32(a) to the Company’s Registration Statement onForm S-1 (File No. 333-171369), and incorporated herein by reference).
10.33 — Indemnification Priority and Information Sharing Agreement, dated as of November 1, 2009,between HCA Inc. and certain other parties thereto (filed as Exhibit 10.35 to the Company’sAnnual Report on Form 10-K for the fiscal year ended December 31, 2009 (File No. 001-11239),and incorporated herein by reference).
10.34 — HCA Inc. 2010 Senior Officer Performance Excellence Program (filed as Exhibit 10.1 to theCompany’s Current Report on Form 8-K dated April 6, 2010, and incorporated herein byreference).*
10.35 — Form of Restricted Share Unit Agreement (Officers) (filed as Exhibit 10.2 to the Company’sCurrent Report on Form 8-K dated April 6, 2010, and incorporated herein by reference).*
10.36 — Assignment and Assumption Agreement, dated November 22, 2010, by and among HCA Inc.,HCA Holdings, Inc. and HCA Merger Sub LLC (filed as Exhibit 10.1 to the Company’s CurrentReport on Form 8-K filed November 24, 2010, and incorporated herein by reference).
99

10.37 — Omnibus Amendment to Various Stock and Option Plans and the Management Stockholders’Agreement, dated November 22, 2010 (filed as Exhibit 10.2 to the Company’s Current Report onForm 8-K filed November 24, 2010, and incorporated herein by reference).*
10.38 — Omnibus Amendment to Stock Option Agreements Issued Under the 2006 Stock Incentive Plan for KeyEmployees of HCA Holdings, Inc. and its Affiliates, as amended, effective February 16, 2011 (filed asExhibit 10.38 to the Company’s Annual Report on Form 10-K for the fiscal year ended December 31,2010, and incorporated herein by reference).*
10.39 — Stockholders’ Agreement, dated as of March 9, 2011, by and among the Company, Hercules Holding II,LLC and the other signatories thereto (filed as Exhibit 10.1 to the Company’s Current Report onForm 8-K filed March 16, 2011, and incorporated herein by reference).
10.40 — Amendment, dated as of September 21, 2011, to the Stockholders’ Agreement, dated as of March 9,2011 (filed as Exhibit 10.2 to the Company’s Current Report on Form 8-K filed September 21, 2011,and incorporated herein by reference).
10.41 — HCA Holdings, Inc. 2011 Senior Officer Performance Excellence Program (filed as Exhibit 10.1 to theCompany’s Current Report on Form 8-K filed April 5, 2011, and incorporated herein by reference).*
10.42 — Form of 2011 PEP Restricted Share Unit Agreement (Officers) (filed as Exhibit 10.2 to the Company’sCurrent Report on Form 8-K filed April 5, 2011, and incorporated herein by reference).*
10.43 — Form of Director Restricted Share Unit Agreement Under the 2006 Stock Incentive Plan for KeyEmployees of HCA Holdings, Inc. and its Affiliates, as Amended and Restated (filed as Exhibit 10.5 tothe Company’s Quarterly Report on Form 10-Q for the quarter ended March 31, 2011, and incorporatedherein by reference).*
10.44 — Share Repurchase Agreement, dated September 15, 2011, between HCA Holdings, Inc. and ML GlobalPrivate Equity Fund, L.P. and ML HCA Co-Invest, L.P. (filed as Exhibit 10.1 to the Company’s CurrentReport on Form 8-K filed September 21, 2011, and incorporated herein by reference).
21 — List of Subsidiaries.
23 — Consent of Ernst & Young LLP.
31.1 — Certification of Chief Executive Officer Pursuant to Section 302 of the Sarbanes-Oxley Act of 2002.
31.2 — Certification of Chief Financial Officer Pursuant to Section 302 of the Sarbanes-Oxley Act of 2002.
32 — Certification Pursuant to 18 U.S.C. Section 1350, as Adopted Pursuant to Section 906 of theSarbanes-Oxley Act of 2002.
101 — The following financial information from our annual report on Form 10-K for the year endedDecember 31, 2011, filed with the SEC on February 23, 2012, formatted in Extensible BusinessReporting Language (XBRL): (i) the consolidated balance sheets at December 31, 2011 and 2010,(ii) the consolidated income statements for the years ended December 31, 2011, 2010 and 2009,(iii) the consolidated comprehensive income statements for the years ended December 31, 2011, 2010and 2009, (iv) the consolidated statements of stockholders’ deficit for the years ended December 31,2011, 2010 and 2009, (v) the consolidated statements of cash flows for the years ended December 31,2011, 2010 and 2009, and (vi) the notes to consolidated financial statements.(1)
(1) The XBRL related information in Exhibit 101 to this annual report on Form 10-K shall not be deemed“filed” for purposes of Section 18 of the Securities Exchange Act of 1934, as amended, or otherwise subjectto liability of that section and shall not be incorporated by reference into any filing or other documentpursuant to the Securities Act of 1933, as amended, except as shall be expressly set forth by specificreference in such filing or document.
* Management compensatory plan or arrangement.
100

SIGNATURES
Pursuant to the requirements of Section 13 or 15(d) of the Securities Exchange Act of 1934, the Registranthas duly caused this report to be signed on its behalf by the undersigned, thereunto duly authorized.
HCA HOLDINGS, INC.
By: /S/ RICHARD M. BRACKEN
Richard M. BrackenChairman of the Board andChief Executive Officer
Dated: February 23, 2012
Pursuant to the requirements of the Securities Exchange Act of 1934, this report has been signed below bythe following persons on behalf of the registrant and in the capacities and on the dates indicated.
Signature Title Date
/S/ RICHARD M. BRACKEN
Richard M. Bracken
Chairman of the Board andChief Executive Officer
(Principal Executive Officer)
February 23, 2012
/S/ R. MILTON JOHNSON
R. Milton Johnson
President, Chief Financial Officer andDirector (Principal Financial Officer and
Principal Accounting Officer)
February 23, 2012
/S/ JOHN P. CONNAUGHTON
John P. Connaughton
Director February 23, 2012
/S/ KENNETH W. FREEMAN
Kenneth W. Freeman
Director February 23, 2012
/S/ THOMAS F. FRIST III
Thomas F. Frist III
Director February 23, 2012
/S/ WILLIAM R. FRIST
William R. Frist
Director February 23, 2012
101

Signature Title Date
/S/ CHRISTOPHER R. GORDON
Christopher R. Gordon
Director February 23, 2012
/S/ JAY O. LIGHT
Jay O. Light
Director February 23, 2012
/S/ MICHAEL W. MICHELSON
Michael W. Michelson
Director February 23, 2012
/S/ JAMES C. MOMTAZEE
James C. Momtazee
Director February 23, 2012
/S/ GEOFFREY G. MEYERS
Geoffrey G. Meyers
Director February 23, 2012
/S/ STEPHEN G. PAGLIUCA
Stephen G. Pagliuca
Director February 23, 2012
/S/ WAYNE J. RILEY
Wayne J. Riley
Director February 23, 2012
102

HCA HOLDINGS, INC.
INDEX TO CONSOLIDATED FINANCIAL STATEMENTS
Page
Report of Independent Registered Public Accounting Firm . . . . . . . . . . . . . . . . . . . . . . . . . . . . . . . . . . . . . . F-2Consolidated Financial Statements:Consolidated Income Statements for the years ended December 31, 2011, 2010 and 2009 . . . . . . . . . . . . F-3Consolidated Comprehensive Income Statements for the years ended December 31, 2011, 2010 and2009 . . . . . . . . . . . . . . . . . . . . . . . . . . . . . . . . . . . . . . . . . . . . . . . . . . . . . . . . . . . . . . . . . . . . . . . . . . . . . F-4
Consolidated Balance Sheets, December 31, 2011 and 2010 . . . . . . . . . . . . . . . . . . . . . . . . . . . . . . . . . . . F-5Consolidated Statements of Stockholders’ Deficit for the years ended December 31, 2011, 2010 and2009 . . . . . . . . . . . . . . . . . . . . . . . . . . . . . . . . . . . . . . . . . . . . . . . . . . . . . . . . . . . . . . . . . . . . . . . . . . . . . F-6
Consolidated Statements of Cash Flows for the years ended December 31, 2011, 2010 and 2009 . . . . . . F-7Notes to Consolidated Financial Statements . . . . . . . . . . . . . . . . . . . . . . . . . . . . . . . . . . . . . . . . . . . . . . . . F-8Quarterly Consolidated Financial Information (Unaudited) . . . . . . . . . . . . . . . . . . . . . . . . . . . . . . . . . . . . F-49
F-1

REPORT OF INDEPENDENT REGISTERED PUBLIC ACCOUNTING FIRM
The Board of Directors and StockholdersHCA Holdings, Inc.
We have audited the accompanying consolidated balance sheets of HCA Holdings, Inc. as of December 31,2011 and 2010, and the related consolidated statements of income, comprehensive income, stockholders’ deficit,and cash flows for each of the three years in the period ended December 31, 2011. These financial statements arethe responsibility of the Company’s management. Our responsibility is to express an opinion on these financialstatements based on our audits.
We conducted our audits in accordance with the standards of the Public Company Accounting OversightBoard (United States). Those standards require that we plan and perform the audit to obtain reasonable assuranceabout whether the financial statements are free of material misstatement. An audit includes examining, on a testbasis, evidence supporting the amounts and disclosures in the financial statements. An audit also includesassessing the accounting principles used and significant estimates made by management, as well as evaluatingthe overall financial statement presentation. We believe that our audits provide a reasonable basis for ouropinion.
In our opinion, the financial statements referred to above present fairly, in all material respects, theconsolidated financial position of HCA Holdings, Inc. at December 31, 2011 and 2010, and the consolidatedresults of its operations and its cash flows for each of the three years in the period ended December 31, 2011, inconformity with U.S. generally accepted accounting principles.
As discussed in Note 1 to the consolidated financial statements, the Company changed its presentation ofrevenues and provision for doubtful accounts as a result of the adoption of the amendments to the FASBAccounting Standards Codification resulting from Accounting Standards Update No. 2011-07, Presentation andDisclosure of Patient Service Revenue, Provision for Bad Debts, and the Allowance for Doubtful Accounts forCertain Healthcare Entities.
We also have audited, in accordance with the standards of the Public Company Accounting Oversight Board(United States), HCA Holdings, Inc.’s internal control over financial reporting as of December 31, 2011, basedon criteria established in Internal Control — Integrated Framework issued by the Committee of SponsoringOrganizations of the Treadway Commission and our report dated February 23, 2012 expressed an unqualifiedopinion thereon.
/s/ Ernst & Young LLP
Nashville, TennesseeFebruary 23, 2012
F-2

HCA HOLDINGS, INC.CONSOLIDATED INCOME STATEMENTS
FOR THE YEARS ENDED DECEMBER 31, 2011, 2010 AND 2009(Dollars in millions, except per share amounts)
2011 2010 2009
Revenues before the provision for doubtful accounts . . . . . . . . . . . . . . . . . . . . $ 32,506 $ 30,683 $ 30,052Provision for doubtful accounts . . . . . . . . . . . . . . . . . . . . . . . . . . . . . . . . . . . . . 2,824 2,648 3,276
Revenues . . . . . . . . . . . . . . . . . . . . . . . . . . . . . . . . . . . . . . . . . . . . . . . . . . . . . . 29,682 28,035 26,776
Salaries and benefits . . . . . . . . . . . . . . . . . . . . . . . . . . . . . . . . . . . . . . . . . . . . . . 13,440 12,484 11,958Supplies . . . . . . . . . . . . . . . . . . . . . . . . . . . . . . . . . . . . . . . . . . . . . . . . . . . . . . . 5,179 4,961 4,868Other operating expenses . . . . . . . . . . . . . . . . . . . . . . . . . . . . . . . . . . . . . . . . . . 5,470 5,004 4,724Electronic health record incentive income . . . . . . . . . . . . . . . . . . . . . . . . . . . . . (210) — —Equity in earnings of affiliates . . . . . . . . . . . . . . . . . . . . . . . . . . . . . . . . . . . . . . (258) (282) (246)Depreciation and amortization . . . . . . . . . . . . . . . . . . . . . . . . . . . . . . . . . . . . . . 1,465 1,421 1,425Interest expense . . . . . . . . . . . . . . . . . . . . . . . . . . . . . . . . . . . . . . . . . . . . . . . . . 2,037 2,097 1,987Losses (gains) on sales of facilities . . . . . . . . . . . . . . . . . . . . . . . . . . . . . . . . . . (142) (4) 15Gain on acquisition of controlling interest in equity investment . . . . . . . . . . . . (1,522) — —Impairments of long-lived assets . . . . . . . . . . . . . . . . . . . . . . . . . . . . . . . . . . . . — 123 43Losses on retirement of debt . . . . . . . . . . . . . . . . . . . . . . . . . . . . . . . . . . . . . . . 481 — —Termination of management agreement . . . . . . . . . . . . . . . . . . . . . . . . . . . . . . . 181 — —
26,121 25,804 24,774
Income before income taxes . . . . . . . . . . . . . . . . . . . . . . . . . . . . . . . . . . . . . . . . 3,561 2,231 2,002Provision for income taxes . . . . . . . . . . . . . . . . . . . . . . . . . . . . . . . . . . . . . . . . . 719 658 627
Net income . . . . . . . . . . . . . . . . . . . . . . . . . . . . . . . . . . . . . . . . . . . . . . . . . . . . . 2,842 1,573 1,375Net income attributable to noncontrolling interests . . . . . . . . . . . . . . . . . . . . . . 377 366 321
Net income attributable to HCA Holdings, Inc. . . . . . . . . . . . . . . . . . . . . . . . $ 2,465 $ 1,207 $ 1,054
Per share data:Basic earnings per share . . . . . . . . . . . . . . . . . . . . . . . . . . . . . . . . . . . . . . . . . $ 5.17 $ 2.83 $ 2.48Diluted earnings per share . . . . . . . . . . . . . . . . . . . . . . . . . . . . . . . . . . . . . . . $ 4.97 $ 2.76 $ 2.44
Shares used in earnings per share calculations (in thousands):Basic . . . . . . . . . . . . . . . . . . . . . . . . . . . . . . . . . . . . . . . . . . . . . . . . . . . . . . . . 476,609 426,424 425,567Diluted . . . . . . . . . . . . . . . . . . . . . . . . . . . . . . . . . . . . . . . . . . . . . . . . . . . . . . 495,943 437,347 432,227
The accompanying notes are an integral part of the consolidated financial statements.
F-3

HCA HOLDINGS, INC.CONSOLIDATED COMPREHENSIVE INCOME STATEMENTSFOR THE YEARS ENDED DECEMBER 31, 2011, 2010 AND 2009
(Dollars in millions)
2011 2010 2009
Net income . . . . . . . . . . . . . . . . . . . . . . . . . . . . . . . . . . . . . . . . . . . . . . . . . . . . . . . . . . . $2,842 $1,573 $1,375Other comprehensive income (loss) before taxes:Foreign currency translation . . . . . . . . . . . . . . . . . . . . . . . . . . . . . . . . . . . . . . . . . . . (9) (25) 39
Unrealized gains on available-for-sale securities . . . . . . . . . . . . . . . . . . . . . . . . . . . . 2 2 69Less: gains included in other operating expenses . . . . . . . . . . . . . . . . . . . . . . . . . — (13) —
2 (11) 69
Defined benefit plans . . . . . . . . . . . . . . . . . . . . . . . . . . . . . . . . . . . . . . . . . . . . . . . . . (67) (76) (18)Less: pension costs included in salaries and benefits . . . . . . . . . . . . . . . . . . . . . . . 25 18 16
(42) (58) (2)
Change in fair value of derivative financial instruments . . . . . . . . . . . . . . . . . . . . . . (311) (255) (209)Less: interest costs included in interest expense . . . . . . . . . . . . . . . . . . . . . . . . . . 341 384 345
30 129 136
Other comprehensive income (loss) before taxes . . . . . . . . . . . . . . . . . . . . . . . . . . . . . (19) 35 242Income taxes (benefits) related to other comprehensive income items . . . . . . . . . . . . . (7) 13 88
Other comprehensive income (loss) . . . . . . . . . . . . . . . . . . . . . . . . . . . . . . . . . . . . . . . . (12) 22 154
Comprehensive income . . . . . . . . . . . . . . . . . . . . . . . . . . . . . . . . . . . . . . . . . . . . . . . . . 2,830 1,595 1,529Comprehensive income attributable to noncontrolling interests . . . . . . . . . . . . . . . . . . 377 366 321
Comprehensive income attributable to HCA Holdings, Inc. . . . . . . . . . . . . . . . . . . . . . $2,453 $1,229 $1,208
The accompanying notes are an integral part of the consolidated financial statements.
F-4

HCA HOLDINGS, INC.CONSOLIDATED BALANCE SHEETS
DECEMBER 31, 2011 AND 2010(Dollars in millions)
2011 2010
ASSETSCurrent assets: . . . . . . . . . . . . . . . . . . . . . . . . . . . . . . . . . . . . . . . . . . . . . . . . . . . . . . . . . . . . . . . . . . . . .Cash and cash equivalents . . . . . . . . . . . . . . . . . . . . . . . . . . . . . . . . . . . . . . . . . . . . . . . . . . . . . . . . . . $ 373 $ 411Accounts receivable, less allowance for doubtful accounts of $4,106 and $3,939 . . . . . . . . . . . . . . . 4,533 3,832Inventories . . . . . . . . . . . . . . . . . . . . . . . . . . . . . . . . . . . . . . . . . . . . . . . . . . . . . . . . . . . . . . . . . . . . . . 1,054 897Deferred income taxes . . . . . . . . . . . . . . . . . . . . . . . . . . . . . . . . . . . . . . . . . . . . . . . . . . . . . . . . . . . . . 594 931Other . . . . . . . . . . . . . . . . . . . . . . . . . . . . . . . . . . . . . . . . . . . . . . . . . . . . . . . . . . . . . . . . . . . . . . . . . . . 679 848
7,233 6,919Property and equipment, at cost: . . . . . . . . . . . . . . . . . . . . . . . . . . . . . . . . . . . . . . . . . . . . . . . . . . . . . . .Land . . . . . . . . . . . . . . . . . . . . . . . . . . . . . . . . . . . . . . . . . . . . . . . . . . . . . . . . . . . . . . . . . . . . . . . . . . . 1,416 1,215Buildings . . . . . . . . . . . . . . . . . . . . . . . . . . . . . . . . . . . . . . . . . . . . . . . . . . . . . . . . . . . . . . . . . . . . . . . 10,231 9,438Equipment . . . . . . . . . . . . . . . . . . . . . . . . . . . . . . . . . . . . . . . . . . . . . . . . . . . . . . . . . . . . . . . . . . . . . . 15,431 14,310Construction in progress . . . . . . . . . . . . . . . . . . . . . . . . . . . . . . . . . . . . . . . . . . . . . . . . . . . . . . . . . . . 997 678
28,075 25,641Accumulated depreciation . . . . . . . . . . . . . . . . . . . . . . . . . . . . . . . . . . . . . . . . . . . . . . . . . . . . . . . . . . (15,241) (14,289)
12,834 11,352
Investments of insurance subsidiaries . . . . . . . . . . . . . . . . . . . . . . . . . . . . . . . . . . . . . . . . . . . . . . . . . . . 548 642Investments in and advances to affiliates . . . . . . . . . . . . . . . . . . . . . . . . . . . . . . . . . . . . . . . . . . . . . . . . . 101 869Goodwill and other intangible assets . . . . . . . . . . . . . . . . . . . . . . . . . . . . . . . . . . . . . . . . . . . . . . . . . . . . 5,251 2,693Deferred loan costs . . . . . . . . . . . . . . . . . . . . . . . . . . . . . . . . . . . . . . . . . . . . . . . . . . . . . . . . . . . . . . . . . . 290 374Other . . . . . . . . . . . . . . . . . . . . . . . . . . . . . . . . . . . . . . . . . . . . . . . . . . . . . . . . . . . . . . . . . . . . . . . . . . . . . 641 1,003
$26,898 $ 23,852
LIABILITIES AND STOCKHOLDERS’ DEFICITCurrent liabilities: . . . . . . . . . . . . . . . . . . . . . . . . . . . . . . . . . . . . . . . . . . . . . . . . . . . . . . . . . . . . . . . . . . .Accounts payable . . . . . . . . . . . . . . . . . . . . . . . . . . . . . . . . . . . . . . . . . . . . . . . . . . . . . . . . . . . . . . . . . $ 1,597 $ 1,537Accrued salaries . . . . . . . . . . . . . . . . . . . . . . . . . . . . . . . . . . . . . . . . . . . . . . . . . . . . . . . . . . . . . . . . . . 965 895Other accrued expenses . . . . . . . . . . . . . . . . . . . . . . . . . . . . . . . . . . . . . . . . . . . . . . . . . . . . . . . . . . . . 1,585 1,245Long-term debt due within one year . . . . . . . . . . . . . . . . . . . . . . . . . . . . . . . . . . . . . . . . . . . . . . . . . . 1,407 592
5,554 4,269
Long-term debt . . . . . . . . . . . . . . . . . . . . . . . . . . . . . . . . . . . . . . . . . . . . . . . . . . . . . . . . . . . . . . . . . . . . . 25,645 27,633Professional liability risks . . . . . . . . . . . . . . . . . . . . . . . . . . . . . . . . . . . . . . . . . . . . . . . . . . . . . . . . . . . . 993 995Income taxes and other liabilities . . . . . . . . . . . . . . . . . . . . . . . . . . . . . . . . . . . . . . . . . . . . . . . . . . . . . . . 1,720 1,608
Equity securities with contingent redemption rights . . . . . . . . . . . . . . . . . . . . . . . . . . . . . . . . . . . . . . . . — 141
Stockholders’ deficit: . . . . . . . . . . . . . . . . . . . . . . . . . . . . . . . . . . . . . . . . . . . . . . . . . . . . . . . . . . . . . . . .Common stock $0.01 par; authorized 1,800,000,000 shares; outstanding 437,477,900 shares —2011 and 427,458,800 shares — 2010 . . . . . . . . . . . . . . . . . . . . . . . . . . . . . . . . . . . . . . . . . . . . . . . 4 4
Capital in excess of par value . . . . . . . . . . . . . . . . . . . . . . . . . . . . . . . . . . . . . . . . . . . . . . . . . . . . . . . . 1,601 386Accumulated other comprehensive loss . . . . . . . . . . . . . . . . . . . . . . . . . . . . . . . . . . . . . . . . . . . . . . . . (440) (428)Retained deficit . . . . . . . . . . . . . . . . . . . . . . . . . . . . . . . . . . . . . . . . . . . . . . . . . . . . . . . . . . . . . . . . . . (9,423) (11,888)
Stockholders’ deficit attributable to HCA Holdings, Inc. . . . . . . . . . . . . . . . . . . . . . . . . . . . . . . . . (8,258) (11,926)Noncontrolling interests . . . . . . . . . . . . . . . . . . . . . . . . . . . . . . . . . . . . . . . . . . . . . . . . . . . . . . . . . . . . 1,244 1,132
(7,014) (10,794)
$26,898 $ 23,852
The accompanying notes are an integral part of the consolidated financial statements.
F-5

HCA HOLDINGS, INC.CONSOLIDATED STATEMENTS OF STOCKHOLDERS’ DEFICITFOR THE YEARS ENDED DECEMBER 31, 2011, 2010 AND 2009
(Dollars in millions)
Equity (Deficit) Attributable to HCA Holdings, Inc.
Common Stock Capital inExcess of
ParValue
AccumulatedOther
ComprehensiveLoss
RetainedDeficit
EquityAttributable toNoncontrolling
InterestsShares(000)
ParValue Total
Balances, December 31, 2008 . . 425,125 $ 4 $ 162 $(604) $ (9,817) $ 995 $ (9,260)Comprehensive income . . . . . 154 1,054 321 1,529Share-based benefit plans . . . 1,216 47 47Distributions . . . . . . . . . . . . . (330) (330)Other . . . . . . . . . . . . . . . . . . . 14 22 36
Balances, December 31, 2009 . . 426,341 4 223 (450) (8,763) 1,008 (7,978)Comprehensive income . . . . . 22 1,207 366 1,595Share-based benefit plans . . . 1,118 43 43Distributions . . . . . . . . . . . . . (4,332) (342) (4,674)Contributions . . . . . . . . . . . . . 57 57Other . . . . . . . . . . . . . . . . . . . 120 43 163
Balances, December 31, 2010 . . 427,459 4 386 (428) (11,888) 1,132 (10,794)Comprehensive income . . . . . (12) 2,465 377 2,830Issuance of common stock . . . 87,719 1 2,505 2,506Repurchase of commonstock . . . . . . . . . . . . . . . . . . (80,771) (1) (1,502) (1,503)
Share-based benefit plans . . . 3,071 35 35Distributions . . . . . . . . . . . . . (378) (378)Consolidation of acquiredcontrolling interest inequity investment . . . . . . . . 93 93
Reclassification of equitysecurities with contingentredemption rights . . . . . . . . 141 141
Other . . . . . . . . . . . . . . . . . . . 36 20 56
Balances, December 31, 2011 . . 437,478 $ 4 $ 1,601 $(440) $ (9,423) $1,244 $ (7,014)
The accompanying notes are an integral part of the consolidated financial statements.
F-6

HCA HOLDINGS, INC.CONSOLIDATED STATEMENTS OF CASH FLOWS
FOR THE YEARS ENDED DECEMBER 31, 2011, 2010 AND 2009(Dollars in millions)
2011 2010 2009
Cash flows from operating activities:Net income . . . . . . . . . . . . . . . . . . . . . . . . . . . . . . . . . . . . . . . . . . . . . . . . . . . . . . . $ 2,842 $ 1,573 $ 1,375Adjustments to reconcile net income to net cash provided by operatingactivities:Increase (decrease) in cash from operating assets and liabilities:Accounts receivable . . . . . . . . . . . . . . . . . . . . . . . . . . . . . . . . . . . . . . . . . . . . (3,248) (2,789) (3,180)Inventories and other assets . . . . . . . . . . . . . . . . . . . . . . . . . . . . . . . . . . . . . . (18) (287) (191)Accounts payable and accrued expenses . . . . . . . . . . . . . . . . . . . . . . . . . . . . 313 229 280
Provision for doubtful accounts . . . . . . . . . . . . . . . . . . . . . . . . . . . . . . . . . . . . . 2,824 2,648 3,276Depreciation and amortization . . . . . . . . . . . . . . . . . . . . . . . . . . . . . . . . . . . . . . 1,465 1,421 1,425Income taxes . . . . . . . . . . . . . . . . . . . . . . . . . . . . . . . . . . . . . . . . . . . . . . . . . . . . 912 27 (520)Losses (gains) on sales of facilities . . . . . . . . . . . . . . . . . . . . . . . . . . . . . . . . . . (142) (4) 15Gain on acquisition of controlling interest in equity investment . . . . . . . . . . . . (1,522) — —Impairments of long-lived assets . . . . . . . . . . . . . . . . . . . . . . . . . . . . . . . . . . . . — 123 43Losses on retirement of debt . . . . . . . . . . . . . . . . . . . . . . . . . . . . . . . . . . . . . . . 481 — —Amortization of deferred loan costs . . . . . . . . . . . . . . . . . . . . . . . . . . . . . . . . . . 70 81 80Share-based compensation . . . . . . . . . . . . . . . . . . . . . . . . . . . . . . . . . . . . . . . . . 26 32 40Pay-in-kind interest . . . . . . . . . . . . . . . . . . . . . . . . . . . . . . . . . . . . . . . . . . . . . . (78) — 58Other . . . . . . . . . . . . . . . . . . . . . . . . . . . . . . . . . . . . . . . . . . . . . . . . . . . . . . . . . . 8 31 46
Net cash provided by operating activities . . . . . . . . . . . . . . . . . . . . . . . . . . . 3,933 3,085 2,747
Cash flows from investing activities:Purchase of property and equipment . . . . . . . . . . . . . . . . . . . . . . . . . . . . . . . . . . . (1,679) (1,325) (1,317)Acquisition of hospitals and health care entities . . . . . . . . . . . . . . . . . . . . . . . . . . (1,682) (233) (61)Disposal of hospitals and health care entities . . . . . . . . . . . . . . . . . . . . . . . . . . . . 281 37 41Change in investments . . . . . . . . . . . . . . . . . . . . . . . . . . . . . . . . . . . . . . . . . . . . . . 80 472 303Other . . . . . . . . . . . . . . . . . . . . . . . . . . . . . . . . . . . . . . . . . . . . . . . . . . . . . . . . . . . . 5 10 (1)
Net cash used in investing activities . . . . . . . . . . . . . . . . . . . . . . . . . . . . . . . (2,995) (1,039) (1,035)
Cash flows from financing activities:Issuances of long-term debt . . . . . . . . . . . . . . . . . . . . . . . . . . . . . . . . . . . . . . . . . . 5,500 2,912 2,979Net change in revolving bank credit facilities . . . . . . . . . . . . . . . . . . . . . . . . . . . . (449) 1,889 (1,335)Repayment of long-term debt . . . . . . . . . . . . . . . . . . . . . . . . . . . . . . . . . . . . . . . . . (6,640) (2,268) (3,103)Distributions to noncontrolling interests . . . . . . . . . . . . . . . . . . . . . . . . . . . . . . . . (378) (342) (330)Contributions from noncontrolling interests . . . . . . . . . . . . . . . . . . . . . . . . . . . . . — 57 —Payment of debt issuance costs . . . . . . . . . . . . . . . . . . . . . . . . . . . . . . . . . . . . . . . (92) (50) (70)Issuance of common stock . . . . . . . . . . . . . . . . . . . . . . . . . . . . . . . . . . . . . . . . . . . 2,506 — —Repurchase of common stock . . . . . . . . . . . . . . . . . . . . . . . . . . . . . . . . . . . . . . . . (1,503) — —Distributions to stockholders . . . . . . . . . . . . . . . . . . . . . . . . . . . . . . . . . . . . . . . . . (31) (4,257) —Income tax benefits . . . . . . . . . . . . . . . . . . . . . . . . . . . . . . . . . . . . . . . . . . . . . . . . 63 114 —Other . . . . . . . . . . . . . . . . . . . . . . . . . . . . . . . . . . . . . . . . . . . . . . . . . . . . . . . . . . . . 48 (2) (6)
Net cash used in financing activities . . . . . . . . . . . . . . . . . . . . . . . . . . . . . . . (976) (1,947) (1,865)
Change in cash and cash equivalents . . . . . . . . . . . . . . . . . . . . . . . . . . . . . . . . . . . . . (38) 99 (153)Cash and cash equivalents at beginning of period . . . . . . . . . . . . . . . . . . . . . . . . . . . 411 312 465
Cash and cash equivalents at end of period . . . . . . . . . . . . . . . . . . . . . . . . . . . . . . . . $ 373 $ 411 $ 312
Interest payments . . . . . . . . . . . . . . . . . . . . . . . . . . . . . . . . . . . . . . . . . . . . . . . . . . . . $ 1,987 $ 1,994 $ 1,751Income tax (refunds) payments, net . . . . . . . . . . . . . . . . . . . . . . . . . . . . . . . . . . . . . . $ (256) $ 517 $ 1,147
The accompanying notes are an integral part of the consolidated financial statements.
F-7

HCA HOLDINGS, INC.
NOTES TO CONSOLIDATED FINANCIAL STATEMENTS
NOTE 1 — ACCOUNTING POLICIES
Reporting Entity and Corporate Reorganization
On November 17, 2006, HCA Inc. was acquired by a private investor group, including affiliates of or fundssponsored by Bain Capital Partners, LLC, Kohlberg Kravis Roberts & Co., BAML Capital Partners and HCAfounder, Dr. Thomas F. Frist Jr. (collectively, the “Investors”) and by members of management and certain otherinvestors. The transaction was accounted for as a recapitalization in our financial statements, with no adjustmentsto the historical basis of our assets and liabilities.
On November 22, 2010, HCA Inc. reorganized by creating a new holding company structure (the“Corporate Reorganization”). HCA Holdings, Inc. became the new parent company, and HCA Inc. became HCAHoldings, Inc.’s wholly-owned direct subsidiary. As part of the Corporate Reorganization, HCA Inc.’soutstanding shares of common stock were automatically converted, on a share for share basis, into identicalshares of HCA Holdings, Inc.’s common stock. As a result of the Corporate Reorganization, HCA Holdings, Inc.was deemed the successor registrant to HCA Inc. under the Exchange Act.
During February 2011, our Board of Directors approved an increase in the number of our authorizedshares to 1,800,000,000 shares of common stock and a 4.505-to-one split of our issued and outstandingcommon shares. All common share and per common share amounts in these consolidated financial statementsand notes to consolidated financial statements reflect the 4.505-to-one split. During March 2011, wecompleted the initial public offering of 87,719,300 shares of our common stock at a price of $30.00 per share(before deducting underwriter discounts, commissions and other related offering expenses). Certain of ourstockholders also sold 57,410,700 shares of our common stock in this offering. We did not receive anyproceeds from the shares sold by the selling stockholders. Our common stock is now traded on the New YorkStock Exchange (symbol “HCA”).
HCA Holdings, Inc. is a holding company whose affiliates own and operate hospitals and related health careentities. The term “affiliates” includes direct and indirect subsidiaries of HCA Holdings, Inc. and partnershipsand joint ventures in which such subsidiaries are partners. At December 31, 2011, these affiliates owned andoperated 163 hospitals, 108 freestanding surgery centers and provided extensive outpatient and ancillary services.HCA Holdings, Inc.’s facilities are located in 20 states and England. The terms “Company,” “HCA,” “we,” “our”or “us,” as used herein and unless otherwise stated or indicated by context, refer to HCA Inc. and its affiliatesprior to the Corporate Reorganization and to HCA Holdings, Inc. and its affiliates after the CorporateReorganization. The term “facilities” or “hospitals” refer to entities owned and operated by affiliates of HCA andthe term “employees” refers to employees of affiliates of HCA.
F-8

HCA HOLDINGS, INC.
NOTES TO CONSOLIDATED FINANCIAL STATEMENTS— (Continued)
NOTE 1 — ACCOUNTING POLICIES (Continued)
Basis of Presentation
The preparation of financial statements in conformity with generally accepted accounting principles requiresmanagement to make estimates and assumptions that affect the amounts reported in the consolidated financialstatements and accompanying notes. Actual results could differ from those estimates.
The consolidated financial statements include all subsidiaries and entities controlled by HCA. We generallydefine “control” as ownership of a majority of the voting interest of an entity. The consolidated financialstatements include entities in which we absorb a majority of the entity’s expected losses, receive a majority of theentity’s expected residual returns, or both, as a result of ownership, contractual or other financial interests in theentity. Significant intercompany transactions have been eliminated. Investments in entities we do not control, butin which we have a substantial ownership interest and can exercise significant influence, are accounted for usingthe equity method.
We have completed various acquisitions and joint venture transactions. The accounts of these entities havebeen included in our consolidated financial statements for periods subsequent to our acquisition of controllinginterests. The majority of our expenses are “cost of revenue” items. Costs that could be classified as general andadministrative include our corporate office costs, which were $228 million, $182 million and $164 million for theyears ended December 31, 2011, 2010 and 2009, respectively.
Revenues
In 2011, we adopted the provisions of Accounting Standards Update No. 2011-07, Presentation andDisclosure of Patient Service Revenue, Provision for Bad Debts, and the Allowance for Doubtful Accounts forCertain Health Care Entities (“ASU 2011-07”). ASU 2011-07 requires health care entities to change thepresentation of the statement of operations by reclassifying the provision for doubtful accounts from an operatingexpense to a deduction from patient service revenues. All periods presented in these consolidated financialstatements and notes to consolidated financial statements have been reclassified in accordance with ASU2011-07.
F-9

HCA HOLDINGS, INC.
NOTES TO CONSOLIDATED FINANCIAL STATEMENTS— (Continued)
NOTE 1 — ACCOUNTING POLICIES (Continued)
Revenues (Continued)
Revenues consist primarily of net patient service revenues that are recorded based upon established billingrates less allowances for contractual adjustments. Revenues are recorded during the period the health careservices are provided, based upon the estimated amounts due from the patients and third-party payers. Third-party payers include federal and state agencies (under the Medicare and Medicaid programs), managed carehealth plans, commercial insurance companies and employers. Estimates of contractual allowances undermanaged care health plans are based upon the payment terms specified in the related contractual agreements.Contractual payment terms in managed care agreements are generally based upon predetermined rates perdiagnosis, per diem rates or discounted fee-for-service rates. Revenues related to uninsured patients andcopayment and deductible amounts for patients who have health care coverage may have discounts applied(uninsured discounts and contractual discounts). We also record a provision for doubtful accounts (basedprimarily on historical collection experience) related to these uninsured accounts to record the net self payaccounts receivable at the estimated amounts we expect to collect. Our revenues from third party payers and theuninsured for the years ended December 31, are summarized in the following table (dollars in millions):
2011 Ratio 2010 Ratio 2009 Ratio
Medicare . . . . . . . . . . . . . . . . . . . . . . . . . . . . . . . . . $ 7,653 25.8% $ 7,203 25.7% $ 6,866 25.6%Managed Medicare . . . . . . . . . . . . . . . . . . . . . . . . . 2,442 8.2 2,162 7.7 2,006 7.5Medicaid . . . . . . . . . . . . . . . . . . . . . . . . . . . . . . . . . 1,845 6.2 1,962 7.0 1,691 6.3Managed Medicaid . . . . . . . . . . . . . . . . . . . . . . . . . 1,265 4.3 1,165 4.2 1,113 4.2Managed care and other insurers . . . . . . . . . . . . . . . 15,703 52.9 14,762 52.7 14,323 53.5International (managed care and other insurers) . . . 938 3.2 784 2.8 702 2.6
29,846 100.6 28,038 100.1 26,701 99.7Uninsured . . . . . . . . . . . . . . . . . . . . . . . . . . . . . . . . 1,846 6.2 1,732 6.2 2,350 8.8Other . . . . . . . . . . . . . . . . . . . . . . . . . . . . . . . . . . . . 814 2.7 913 3.3 1,001 3.7
Revenues before provision for doubtfulaccounts . . . . . . . . . . . . . . . . . . . . . . . . . . . . . . . . 32,506 109.5 30,683 109.6 30,052 112.2
Provision for doubtful accounts . . . . . . . . . . . . . . . (2,824) (9.5) (2,648) (9.6) (3,276) (12.2)
Revenues . . . . . . . . . . . . . . . . . . . . . . . . . . . . . . . $29,682 100.0% $28,035 100.0% $26,776 100.0%
Laws and regulations governing the Medicare and Medicaid programs are complex and subject tointerpretation. As a result, there is at least a reasonable possibility recorded estimates will change by a materialamount. Estimated reimbursement amounts are adjusted in subsequent periods as cost reports are prepared andfiled and as final settlements are determined (in relation to certain government programs, primarily Medicare,this is generally referred to as the “cost report” filing and settlement process). The adjustments to estimatedMedicare and Medicaid reimbursement amounts and disproportionate-share funds, which resulted in netincreases to revenues, related primarily to cost reports filed during the respective year were $40 million,$52 million and $40 million in 2011, 2010 and 2009, respectively. The adjustments to estimated reimbursementamounts, which resulted in net increases to revenues, related primarily to cost reports filed during previous yearswere $30 million, $50 million and $60 million in 2011, 2010 and 2009, respectively.
The Emergency Medical Treatment and Labor Act (“EMTALA”) requires any hospital participating in theMedicare program to conduct an appropriate medical screening examination of every person who presents to thehospital’s emergency room for treatment and, if the individual is suffering from an emergency medical condition,
F-10

HCA HOLDINGS, INC.
NOTES TO CONSOLIDATED FINANCIAL STATEMENTS— (Continued)
NOTE 1 — ACCOUNTING POLICIES (Continued)
Revenues (Continued)
to either stabilize the condition or make an appropriate transfer of the individual to a facility able to handle thecondition. The obligation to screen and stabilize emergency medical conditions exists regardless of anindividual’s ability to pay for treatment. Federal and state laws and regulations, including but not limited toEMTALA, require, and our commitment to providing quality patient care encourages, us to provide services topatients who are financially unable to pay for the health care services they receive. Because we do not pursuecollection of amounts determined to qualify as charity care, they are not reported in revenues. Patients treated athospitals for nonelective care, who have income at or below 200% of the federal poverty level, are eligible forcharity care. The federal poverty level is established by the federal government and is based on income andfamily size. We provide discounts to uninsured patients who do not qualify for Medicaid or charity care. Thesediscounts are similar to those provided to many local managed care plans. In implementing the discount policy,we first attempt to qualify uninsured patients for Medicaid, other federal or state assistance or charity care. If anuninsured patient does not qualify for these programs, the uninsured discount is applied.
The revenue deductions related to uninsured accounts (charity care and uninsured discounts) generally havethe inverse impact on the provision for doubtful accounts. To quantify the total impact of and trends related touninsured accounts, we believe it is beneficial to view charity care, uninsured discounts and the provision fordoubtful accounts in combination, rather than each separately. A summary of these amounts for the years endedDecember 31, follows (dollars in millions):
2011 Ratio 2010 Ratio 2009 Ratio
Charity care . . . . . . . . . . . . . . . . . . . . . . . . . . . . . . . . . . $ 2,683 24% $2,337 24% $2,151 26%Uninsured discounts . . . . . . . . . . . . . . . . . . . . . . . . . . . . 5,707 51 4,641 48 2,935 35Provision for doubtful accounts . . . . . . . . . . . . . . . . . . . 2,824 25 2,648 28 3,276 39
Total uncompensated care . . . . . . . . . . . . . . . . . . . . . $11,214 100% $9,626 100% $8,362 100%
A summary of the estimated cost of total uncompensated care for the years ended December 31, follows(dollars in millions):
2011 2010 2009
Gross patient charges . . . . . . . . . . . . . . . . . . . . . . . . . . . . . . . . . . $141,516 $125,640 $115,682Patient care costs (salaries and benefits, supplies, otheroperating expenses and depreciation and amortization) . . . . . 25,554 23,870 22,975
Cost-to-charges ratio . . . . . . . . . . . . . . . . . . . . . . . . . . . . . . . . . . 18.1% 19.0% 19.9%
Total uncompensated care . . . . . . . . . . . . . . . . . . . . . . . . . . . . . . $ 11,214 $ 9,626 $ 8,362Multiplied by the cost-to-charges ratio . . . . . . . . . . . . . . . . . . . . 18.1% 19.0% 19.9%
Estimated cost of total uncompensated care . . . . . . . . . . . . . . . . $ 2,030 $ 1,829 $ 1,664
The sum of charity care, uninsured discounts and the provision for doubtful accounts, as a percentage of thesum of revenues, charity care, uninsured discounts and the provision for doubtful accounts increased from 23.8%for 2009, to 25.6% for 2010 and to 27.4% for 2011. The trend of the three components of uncompensated careindicates that increases to our uninsured discounts have resulted in the provision for doubtful accounts decliningfrom 39% of total uncompensated care for 2009 to 25% of total uncompensated care for 2011, and uninsureddiscounts increasing from 35% of total uncompensated care for 2009 to 51% of total uncompensated care for 2011.
F-11

HCA HOLDINGS, INC.
NOTES TO CONSOLIDATED FINANCIAL STATEMENTS— (Continued)
NOTE 1 — ACCOUNTING POLICIES (Continued)
Cash and Cash Equivalents
Cash and cash equivalents include highly liquid investments with a maturity of three months or less whenpurchased. Our insurance subsidiaries’ cash equivalent investments in excess of the amounts required to payestimated professional liability claims during the next twelve months are not included in cash and cashequivalents as these funds are not available for general corporate purposes. Carrying values of cash and cashequivalents approximate fair value due to the short-term nature of these instruments.
Our cash management system provides for daily investment of available balances and the funding ofoutstanding checks when presented for payment. Outstanding, but unpresented, checks totaling $382 million and$384 million at December 31, 2011 and 2010, respectively, have been included in “accounts payable” in theconsolidated balance sheets. Upon presentation for payment, these checks are funded through available cashbalances or our credit facility.
Accounts Receivable
We receive payments for services rendered from federal and state agencies (under the Medicare andMedicaid programs), managed care health plans, commercial insurance companies, employers and patients. Werecognize that revenues and receivables from government agencies are significant to our operations, but do notbelieve there are significant credit risks associated with these government agencies. We do not believe there areany other significant concentrations of revenues from any particular payer that would subject us to anysignificant credit risks in the collection of our accounts receivable.
Additions to the allowance for doubtful accounts are made by means of the provision for doubtful accounts.Accounts written off as uncollectible are deducted from the allowance for doubtful accounts and subsequentrecoveries are added. The amount of the provision for doubtful accounts is based upon management’s assessmentof historical and expected net collections, business and economic conditions, trends in federal, state and privateemployer health care coverage and other collection indicators. The provision for doubtful accounts and theallowance for doubtful accounts relate to “uninsured” amounts (including copayment and deductible amountsfrom patients who have health care coverage) due directly from patients. Accounts are written off when allreasonable internal and external collection efforts have been performed. We consider the return of an accountfrom the secondary external collection agency to be the culmination of our reasonable collection efforts and thetiming basis for writing off the account balance. Writeoffs are based upon specific identification and the writeoffprocess requires a writeoff adjustment entry to the patient accounting system. Management relies on the resultsof detailed reviews of historical writeoffs and recoveries at facilities that represent a majority of our revenues andaccounts receivable (the “hindsight analysis”) as a primary source of information to utilize in estimating thecollectibility of our accounts receivable. We perform the hindsight analysis quarterly, utilizing rolling twelve-months accounts receivable collection and writeoff data. At December 31, 2011 and 2010, the allowance fordoubtful accounts represented approximately 92% and 93%, respectively, of the $4.478 billion and$4.249 billion, respectively, patient due accounts receivable balance. The patient due accounts receivable balancerepresents the estimated uninsured portion of our accounts receivable. The estimated uninsured portion ofMedicaid pending and uninsured discount pending accounts is included in our patient due accounts receivablebalance. Days revenues in accounts receivable were 53 days, 50 days and 50 days at December 31, 2011, 2010and 2009, respectively. Adverse changes in general economic conditions, patient accounting service centeroperations, payer mix or trends in federal or state governmental health care coverage could affect our collectionof accounts receivable, cash flows and results of operations.
F-12

HCA HOLDINGS, INC.
NOTES TO CONSOLIDATED FINANCIAL STATEMENTS— (Continued)
NOTE 1 — ACCOUNTING POLICIES (Continued)
Inventories
Inventories are stated at the lower of cost (first-in, first-out) or market.
Property and Equipment
Depreciation expense, computed using the straight-line method, was $1.461 billion in 2011, $1.416 billionin 2010 and $1.419 billion in 2009. Buildings and improvements are depreciated over estimated useful livesranging generally from 10 to 40 years. Estimated useful lives of equipment vary generally from four to 10 years.
When events, circumstances or operating results indicate the carrying values of certain long-lived assetsexpected to be held and used, might be impaired, we prepare projections of the undiscounted future cash flowsexpected to result from the use of the assets and their eventual disposition. If the projections indicate the recordedamounts are not expected to be recoverable, such amounts are reduced to estimated fair value. Fair value may beestimated based upon internal evaluations that include quantitative analyses of revenues and cash flows, reviewsof recent sales of similar facilities and independent appraisals.
Long-lived assets to be disposed of are reported at the lower of their carrying amounts or fair value lesscosts to sell or close. The estimates of fair value are usually based upon recent sales of similar assets and marketresponses based upon discussions with and offers received from potential buyers.
Investments of Insurance Subsidiaries
At December 31, 2011 and 2010, the investments of our wholly-owned insurance subsidiaries wereclassified as “available-for-sale” as defined in Accounting Standards Codification (“ASC”) No. 320,Investments — Debt and Equity Securities and are recorded at fair value. The investment securities are held forthe purpose of providing the funding source to pay professional liability claims covered by the insurancesubsidiaries. We perform a quarterly assessment of individual investment securities to determine whetherdeclines in market value are temporary or other-than-temporary. Our investment securities evaluation processinvolves multiple subjective judgments, often involves estimating the outcome of future events, and requires asignificant level of professional judgment in determining whether an impairment has occurred. We evaluate,among other things, the financial position and near term prospects of the issuer, conditions in the issuer’sindustry, liquidity of the investment, changes in the amount or timing of expected future cash flows from theinvestment, and recent downgrades of the issuer by a rating agency, to determine if, and when, a decline in thefair value of an investment below amortized cost is considered other-than-temporary. The length of time andextent to which the fair value of the investment is less than amortized cost and our ability and intent to retain theinvestment, to allow for any anticipated recovery of the investment’s fair value, are important components of ourinvestment securities evaluation process.
Goodwill and Other Intangible Assets
Goodwill is not amortized but is subject to annual impairment tests. In addition to the annual impairmentreview, impairment reviews are performed whenever circumstances indicate a possible impairment may exist.Impairment testing for goodwill is done at the reporting unit level. Reporting units are one level below thebusiness segment level, and our impairment testing is performed at the operating division or market level. Wecompare the fair value of the reporting unit assets to the carrying amount, on at least an annual basis, to
F-13

HCA HOLDINGS, INC.
NOTES TO CONSOLIDATED FINANCIAL STATEMENTS— (Continued)
NOTE 1 — ACCOUNTING POLICIES (Continued)
Goodwill and Other Intangible Assets (Continued)
determine if there is potential impairment. If the fair value of the reporting unit assets is less than their carryingvalue, we compare the fair value of the goodwill to its carrying value. If the fair value of the goodwill is less thanits carrying value, an impairment loss is recognized. Fair value of goodwill is estimated based upon internalevaluations of the related long-lived assets for each reporting unit that include quantitative analyses of revenuesand cash flows and reviews of recent sales of similar facilities. No goodwill impairments were recognized during2011, and we recognized goodwill impairments of $14 million and $19 million during 2010 and 2009,respectively.
During 2011, goodwill increased by $2.329 billion related to acquisitions, declined by $24 million related tofacility sales, and declined by $16 million related to foreign currency translation and other adjustments. During2010, goodwill increased by $125 million related to acquisitions, declined by $14 million related to impairmentsand increased by $5 million related to foreign currency translation and other adjustments.
Since January 1, 2000, we have recognized total goodwill impairments of $102 million in the aggregate.None of the goodwill impairments related to evaluations of goodwill at the reporting unit level, as all recognizedgoodwill impairments during this period related to goodwill allocated to asset disposal groups.
During 2011, other intangible assets increased by $269 million. Other intangible assets are not amortizedbut are subject to annual impairment tests.
Deferred Loan Costs
Debt issuance costs are amortized based upon the terms of the respective debt obligations. The grosscarrying amount of deferred loan costs at December 31, 2011 and 2010 was $638 million and $712 million,respectively, and accumulated amortization was $348 million and $338 million, respectively. Amortization ofdeferred loan costs is included in interest expense and was $70 million, $81 million and $80 million for 2011,2010 and 2009, respectively.
Physician Recruiting Agreements
In order to recruit physicians to meet the needs of our hospitals and the communities they serve, we enterinto minimum revenue guarantee arrangements to assist the recruited physicians during the period they arerelocating and establishing their practices. A guarantor is required to recognize, at the inception of a guarantee, aliability for the fair value of the stand-ready obligation undertaken in issuing the guarantee. We expense the totalestimated guarantee liability amount at the time the physician recruiting agreement becomes effective as we arenot able to justify recording a contract-based asset based upon our analysis of the related control, regulatory andlegal considerations.
The physician recruiting liability amount of $15 million at both December 31, 2011 and 2010 represents theamount of expense recognized in excess of payments made through December 31, 2011 and 2010. AtDecember 31, 2011 the maximum amount we could have to pay under all effective minimum revenue guaranteeswas $39 million.
F-14

HCA HOLDINGS, INC.
NOTES TO CONSOLIDATED FINANCIAL STATEMENTS— (Continued)
NOTE 1 — ACCOUNTING POLICIES (Continued)
Professional Liability Claims
Reserves for professional liability risks were $1.291 billion and $1.262 billion at December 31, 2011 and2010, respectively. The current portion of the reserves, $298 million and $268 million at December 31, 2011 and2010, respectively, is included in “other accrued expenses” in the consolidated balance sheets. Provisions forlosses related to professional liability risks were $244 million, $222 million and $211 million for 2011, 2010 and2009, respectively, and are included in “other operating expenses” in our consolidated income statements.Provisions for losses related to professional liability risks are based upon actuarially determined estimates. Lossand loss expense reserves represent the estimated ultimate net cost of all reported and unreported losses incurredthrough the respective consolidated balance sheet dates. The reserves for unpaid losses and loss expenses areestimated using individual case-basis valuations and actuarial analyses. Those estimates are subject to the effectsof trends in loss severity and frequency. The estimates are continually reviewed and adjustments are recorded asexperience develops or new information becomes known. Adjustments to the estimated reserve amounts areincluded in current operating results. The reserves for professional liability risks cover approximately 2,700individual claims at both December 31, 2011 and 2010 and estimates for unreported potential claims. The timeperiod required to resolve these claims can vary depending upon the jurisdiction and whether the claim is settledor litigated. During 2011 and 2010, $240 million and $243 million, respectively, of net payments were made forprofessional and general liability claims. The estimation of the timing of payments beyond a year can varysignificantly. Although considerable variability is inherent in professional liability reserve estimates, we believethe reserves for losses and loss expenses are adequate; however, there can be no assurance the ultimate liabilitywill not exceed our estimates.
A portion of our professional liability risks is insured through a wholly-owned insurance subsidiary. Subjectto a $5 million per occurrence self-insured retention, our facilities are insured by our wholly-owned insurancesubsidiary for losses up to $50 million per occurrence. The insurance subsidiary has obtained reinsurance forprofessional liability risks generally above a retention level of $15 million per occurrence. We also maintainprofessional liability insurance with unrelated commercial carriers for losses in excess of amounts insured by ourinsurance subsidiary.
The obligations covered by reinsurance contracts are included in the reserves for professional liability risks,as the insurance subsidiary remains liable to the extent the reinsurers do not meet their obligations under thereinsurance contracts. The amounts receivable under the reinsurance contracts include $25 million and$11 million at December 31, 2011 and 2010, respectively, recorded in “other assets” and $14 million and$3 million at December 31, 2011 and 2010, respectively, recorded in “other current assets”.
Financial Instruments
Derivative financial instruments are employed to manage risks, including interest rate and foreign currencyexposures, and are not used for trading or speculative purposes. We recognize derivative instruments, such asinterest rate swap agreements and foreign exchange contracts, in the consolidated balance sheets at fair value.Changes in the fair value of derivatives are recognized periodically either in earnings or in stockholders’ equity,as a component of other comprehensive income (loss), depending on whether the derivative financial instrumentqualifies for hedge accounting, and if so, whether it qualifies as a fair value hedge or a cash flow hedge.Generally, changes in fair values of derivatives accounted for as fair value hedges are recorded in earnings, alongwith the changes in the fair value of the hedged items related to the hedged risk. Gains and losses on derivativesdesignated as cash flow hedges, to the extent they are effective, are recorded in other comprehensive income
F-15

HCA HOLDINGS, INC.
NOTES TO CONSOLIDATED FINANCIAL STATEMENTS— (Continued)
NOTE 1 — ACCOUNTING POLICIES (Continued)
Financial Instruments (Continued)
(loss), and subsequently reclassified to earnings to offset the impact of the forecasted transactions when theyoccur. In the event the forecasted transaction to which a cash flow hedge relates is no longer likely, the amount inother comprehensive income (loss) is recognized in earnings and generally the derivative is terminated. Changesin the fair value of derivatives not qualifying as hedges, and for any portion of a hedge that is ineffective, arereported in earnings.
The net interest paid or received on interest rate swaps is recognized as interest expense. Gains and lossesresulting from the early termination of interest rate swap agreements are deferred and amortized as adjustmentsto interest expense over the remaining term of the debt originally associated with the terminated swap.
Electronic Health Record Incentive Payments
The American Recovery and Reinvestment Act of 2009 provides for Medicare and Medicaid incentivepayments beginning in 2011 for eligible hospitals and professionals that adopt and meaningfully use certifiedelectronic health record (“EHR”) technology. We recognize income related to Medicare and Medicaid incentivepayments using a gain contingency model that is based upon when our eligible hospitals have demonstratedmeaningful use of certified EHR technology for the applicable period and the cost report information for the fullcost report year that will determine the final calculation of the incentive payment is available.
Medicaid EHR incentive calculations and related payment amounts are based upon prior period cost reportinformation available at the time our eligible hospitals adopt, implement or demonstrate meaningful use ofcertified EHR technology for the applicable period, and are not subject to revision for cost report data filed for asubsequent period. Thus, incentive income recognition occurs at the point our eligible hospitals adopt, implementor demonstrate meaningful use of certified EHR technology for the applicable period, as the cost reportinformation for the full cost report year that will determine the final calculation of the incentive payment isknown at that time.
Medicare EHR incentive calculations and related initial payment amounts are based upon the most currentfiled cost report information available at the time our eligible hospitals demonstrate meaningful use of certifiedEHR technology for the applicable period. However, unlike Medicaid, this initial payment amount will beadjusted based upon an updated calculation using the annual cost report information for the cost report periodthat began during the applicable payment year. Thus, incentive income recognition occurs at the point oureligible hospitals demonstrate meaningful use of certified EHR technology for the applicable period and the costreport information for the full cost report year that will determine the final calculation of the incentive payment isavailable.
We recognized $210 million of electronic health record incentive income related to Medicaid ($87 million)and Medicare ($123 million) incentive programs during the year ended December 31, 2011. At December 31,2011, we have $134 million of deferred EHR incentive income, which represents initial incentive paymentsreceived for which EHR incentive income has not been recognized. We previously reported $39 million ofMedicaid EHR incentives and $51 million ($34 million of Medicaid EHR incentives and $17 million of MedicareEHR incentives) for the quarters ended June 30, 2011 and September 30, 2011, respectively, in the line item“Revenues” in our consolidated income statements. These amounts have been reclassified and are now includedin the line item “Electronic health record incentive income” in our consolidated income statement for the yearended December 31, 2011.
F-16

HCA HOLDINGS, INC.
NOTES TO CONSOLIDATED FINANCIAL STATEMENTS— (Continued)
NOTE 1 — ACCOUNTING POLICIES (Continued)
Noncontrolling Interests in Consolidated Entities
The consolidated financial statements include all assets, liabilities, revenues and expenses of less than 100%owned entities that we control. Accordingly, we have recorded noncontrolling interests in the earnings and equityof such entities.
Related Party Transactions — Management Agreement
The Investors have provided management and advisory services to the Company pursuant to a managementagreement among HCA Inc. and the Investors executed in connection with the Investors’ acquisition of HCA Inc.in November 2006. The management agreement was terminated pursuant to its terms upon completion of theinitial public offering of our common stock during March 2011, and the Company paid the Investors a final feeof $181 million. The management agreement also provided that the Company pay a 1% fee in connection withcertain financing, acquisition, divestiture and change of control transactions. The Company paid the Investors afee of $26 million related to the initial public offering of our common stock, and this fee was recorded as a costof the stock offering. The annual management fee was $18 million for 2010 and $15 million for 2009.
Reclassifications
Certain prior year amounts have been reclassified to conform to the 2011 presentation.
NOTE 2 — SHARE-BASED COMPENSATION
Stock Incentive Plan
The 2006 Stock Incentive Plan for Key Employees of HCA Holdings Inc. and its Affiliates, as Amendedand Restated (the “Stock Incentive Plan”) is designed to promote the long term financial interests and growth ofthe Company and its subsidiaries by attracting and retaining management and other personnel and key serviceproviders and to motivate management personnel by means of incentives to achieve long range goals and furtherthe alignment of interests of participants with those of our stockholders through opportunities for increased stock,or stock-based, ownership in the Company. During 2011, our Board of Directors approved certain amendmentsto the Stock Incentive Plan that became effective upon the initial public offering of our common stock. Theamendments included an increase to the number of shares available for issuance under the plan by 40,000,000shares. A portion of the options under the Stock Incentive Plan vests solely based upon continued employmentover a specific period of time, and a portion of the options vests based both upon continued employment over aspecific period of time and upon the achievement of predetermined financial and Investor return targets overtime. We granted 1,288,000 and 964,000 options under the Stock Incentive Plan during 2011 and 2010,respectively. As of December 31, 2011, 35,090,800 options granted under the Stock Incentive Plan have vested,of which 30,723,400 are outstanding and exercisable, and there were 42,099,900 shares available for futuregrants under the Stock Incentive Plan.
Rollover Options
Certain management holders of outstanding prerecapitalization HCA stock options retained certain of theirstock options (the “Rollover Options”). The Rollover Options remain outstanding in accordance with the terms ofthe governing stock incentive plans and grant agreements pursuant to which the holder originally received the
F-17

HCA HOLDINGS, INC.
NOTES TO CONSOLIDATED FINANCIAL STATEMENTS— (Continued)
NOTE 2 — SHARE-BASED COMPENSATION (Continued)
Rollover Options (Continued)
stock option grants. Pursuant to the rollover option agreement, 49,408,100 prerecapitalization HCA stock optionswere converted into 10,294,500 Rollover Options, of which 2,825,100 are outstanding and exercisable atDecember 31, 2011.
Stock Option Activity
The fair value of each stock option award is estimated on the grant date, using option valuation models andthe weighted average assumptions indicated in the following table. Awards under the Stock Incentive Plangenerally vest based on continued employment and based upon achievement of certain financial and Investorreturn targets. Each grant is valued as a single award with an expected term equal to the average expected term ofthe component vesting tranches. We use historical option exercise behavior data and other factors to estimate theexpected term of the options. The expected term of the option is limited by the contractual term, and employeepost-vesting termination behavior is incorporated in the historical option exercise behavior data. Compensationcost is recognized on the straight-line attribution method. The straight-line attribution method requires that totalcompensation expense recognized must at least equal the vested portion of the grant-date fair value. Theexpected volatility is derived using historical stock price information of certain peer group companies for aperiod of time equal to the expected option term. The risk-free interest rate is the approximate yield on UnitedStates Treasury Strips having a life equal to the expected option life on the date of grant. The expected life is anestimate of the number of years an option will be held before it is exercised.
2011 2010 2009
Risk-free interest rate . . . . . . . . . . . . . . . . . . . . . . . . . . . . . . . . . . . . . . . . . . . . . . 0.89% 2.07% 1.45%Expected volatility . . . . . . . . . . . . . . . . . . . . . . . . . . . . . . . . . . . . . . . . . . . . . . . . 41% 35% 35%Expected life, in years . . . . . . . . . . . . . . . . . . . . . . . . . . . . . . . . . . . . . . . . . . . . . 5 5 5Expected dividend yield . . . . . . . . . . . . . . . . . . . . . . . . . . . . . . . . . . . . . . . . . . . . — — —
Information regarding stock option activity during 2011, 2010 and 2009 is summarized below (shareamounts in thousands):
StockOptions
WeightedAverageExercisePrice
WeightedAverage
RemainingContractual Term
AggregateIntrinsic Value
(dollars in millions)
Options outstanding, December 31, 2008 . . . . . . . . . . . . 47,906 $ 9.99Granted . . . . . . . . . . . . . . . . . . . . . . . . . . . . . . . . . . . . 8,045 19.70Exercised . . . . . . . . . . . . . . . . . . . . . . . . . . . . . . . . . . . (2,278) 3.81Cancelled . . . . . . . . . . . . . . . . . . . . . . . . . . . . . . . . . . . (1,756) 11.56
Options outstanding, December 31, 2009 . . . . . . . . . . . . 51,917 11.72Granted . . . . . . . . . . . . . . . . . . . . . . . . . . . . . . . . . . . . 964 15.73Exercised . . . . . . . . . . . . . . . . . . . . . . . . . . . . . . . . . . . (1,726) 4.06Cancelled . . . . . . . . . . . . . . . . . . . . . . . . . . . . . . . . . . . (629) 7.96
Options outstanding, December 31, 2010 . . . . . . . . . . . . 50,526 8.58Granted . . . . . . . . . . . . . . . . . . . . . . . . . . . . . . . . . . . . 1,288 23.35Exercised . . . . . . . . . . . . . . . . . . . . . . . . . . . . . . . . . . . (5,044) 6.31Cancelled . . . . . . . . . . . . . . . . . . . . . . . . . . . . . . . . . . . (458) 5.88
Options outstanding, December 31, 2011 . . . . . . . . . . . . 46,312 9.26 5.6 years $595
Options exercisable, December 31, 2011 . . . . . . . . . . . . 33,548 $ 9.74 5.4 years $414
F-18

HCA HOLDINGS, INC.
NOTES TO CONSOLIDATED FINANCIAL STATEMENTS— (Continued)
NOTE 2 — SHARE-BASED COMPENSATION (Continued)
Stock Option Activity (Continued)
During 2010, our Board of Directors declared three distributions to the Company’s stockholders and holdersof stock options. The distributions totaled $9.43 per share and vested stock option. Pursuant to the terms of ourstock option plans, the holders of nonvested stock options received $9.43 per share reductions (subject to certaintax related limitations for certain stock options that resulted in deferred distributions for a portion of the declareddistribution, which will be paid upon the vesting of the applicable stock options) to the exercise price of theshare-based awards.
The weighted average fair values of stock options granted during 2011, 2010 and 2009 were $8.53, $7.13and $3.54 per share, respectively. The total intrinsic value of stock options exercised in the year endedDecember 31, 2011 was $121 million. As of December 31, 2011, the unrecognized compensation cost related tononvested awards was $23 million.
NOTE 3 — ACQUISITIONS AND DISPOSITIONS
HealthONE Acquisition
During October 2011, we completed the acquisition of the Colorado Health Foundation’s (“Foundation”)approximate 40% remaining ownership interest in the HCA-HealthONE LLC (“HealthONE”) joint venture for$1.450 billion. HealthONE’s assets include seven hospitals and 12 freestanding surgery centers in the Denverarea. We accounted for our investment in HealthONE using the equity method through October 2011 with ourshare of their operations all recorded in the line item “Equity in earnings of affiliates” in our consolidated incomestatements, and we began consolidating HealthONE’s operations in our consolidated income statementsbeginning November 2011.
The total cost of the HealthONE acquisition has been allocated to the assets acquired and liabilities assumedbased upon their respective fair values in accordance with ASC No. 805, Business Combinations. The purchaseprice represented a premium over the fair value of the net tangible and identifiable intangible assets acquired forreasons such as expected cash flows and HealthONE’s assembled workforce.
Based on our purchase price allocation as of December 31, 2011, we identified and analyzed the acquired fixedassets, contracts, contractual commitments and legal contingencies to record the fair value of all assets acquired andliabilities assumed, resulting in goodwill of $2.261 billion being recorded. The amount of goodwill expected to betax deductible is approximately $894 million. We also recorded a gain of $1.522 billion related to this acquisitiondue to the remeasurement of our previous equity investment in HealthONE, based upon our acquisition of theFoundation’s ownership interest and the resulting consolidation of the entire enterprise at estimated fair value.Adjustments to the December 31, 2011 purchase price allocation are not expected to be material.
A summary of the purchase price allocation, including assumed liabilities, follows (in millions):
Current assets . . . . . . . . . . . . . . . . . . . . . . . . . . . . . . . . . . . . . . . . . . . . . . . $ 400Property and equipment . . . . . . . . . . . . . . . . . . . . . . . . . . . . . . . . . . . . . . . 1,040Identifiable intangible asset (trade name) . . . . . . . . . . . . . . . . . . . . . . . . . 269Goodwill . . . . . . . . . . . . . . . . . . . . . . . . . . . . . . . . . . . . . . . . . . . . . . . . . . . 2,261Other assets . . . . . . . . . . . . . . . . . . . . . . . . . . . . . . . . . . . . . . . . . . . . . . . . 7
Liabilities . . . . . . . . . . . . . . . . . . . . . . . . . . . . . . . . . . . . . . . . . . . . . . . . . . 152Noncontrolling interests . . . . . . . . . . . . . . . . . . . . . . . . . . . . . . . . . . . . . . . 93
F-19

HCA HOLDINGS, INC.
NOTES TO CONSOLIDATED FINANCIAL STATEMENTS— (Continued)
NOTE 3 — ACQUISITIONS AND DISPOSITIONS (Continued)
HealthONE Acquisition (Continued)
The acquired HealthONE operating results have been included in the consolidated income statements sincethe acquisition date. The revenues and net income attributable to HCA Holdings, Inc. related to the acquiredHealthONE operations for the period from November 1, 2011 through December 31, 2011 were $347 million and$15 million, respectively. The unaudited pro forma combined summary of our operations gives effect toincluding the acquired HealthONE operating results as if the acquisition had occurred as of January 1, 2010,follows (in millions):
Years EndedDecember 31,
2011 2010
Pro forma revenues . . . . . . . . . . . . . . . . . . . . . . . . . . . . . . . . . . . . . . . . $31,383 $29,925Pro forma net income attributable to HCA Holdings, Inc. . . . . . . . . . . 2,507 1,257
Pro forma adjustments to net income attributable to HCA Holdings, Inc. include adjustments to recordHealthONE’s operating results on a consolidated basis and eliminate the equity method operating results, torecord depreciation expense based on the estimated fair value assigned to the long-lived assets acquired, torecord interest expense assuming the increase in long-term debt used to fund the acquisition had occurred as ofJanuary 1, 2010 and to record the related tax effects. These pro forma results are not necessarily indicative of theactual results of operations that would have occurred if the acquisition had occurred on January 1, 2010.
Other Acquisitions and Dispositions
During 2011, we paid $136 million to acquire a hospital and $96 million to acquire other nonhospital healthcare entities. During 2010, we paid $163 million to acquire two hospitals and $70 million to acquire other healthcare entities. During 2009, we paid $61 million to acquire nonhospital health care entities. Purchase priceamounts have been allocated to the related assets acquired and liabilities assumed based upon their respective fairvalues. The purchase price paid in excess of the fair value of identifiable net assets of these acquired entitiesaggregated $68 million, $125 million and $5 million in 2011, 2010 and 2009, respectively. The consolidatedfinancial statements include the accounts and operations of the acquired entities subsequent to the respectiveacquisition dates. The pro forma effects of these acquired entities on our results of operations for periods prior tothe respective acquisition dates were not significant.
During 2011, we received proceeds of $281 million and recognized a net pretax gain of $142 million($80 million after tax) related to the sales of a hospital facility and our investment in a hospital joint venture.During 2010, we received proceeds of $37 million and recognized a net pretax gain of $4 million ($2 millionafter tax) from sales of nonhospital health care entities and real estate investments. During 2009, we receivedproceeds of $3 million and recognized a net pretax loss of $8 million ($5 million after tax) on the sales of threehospitals. We also received proceeds of $38 million and recognized a net pretax loss of $7 million ($4 millionafter tax) from sales of other health care entities and real estate investments.
F-20

HCA HOLDINGS, INC.
NOTES TO CONSOLIDATED FINANCIAL STATEMENTS— (Continued)
NOTE 4 — IMPAIRMENTS OF LONG-LIVED ASSETS
There were no impairments of long-lived assets for 2011. During 2010, we recorded pretax charges of$123 million to reduce the carrying value of identified assets to estimated fair value. The $123 million assetimpairment includes $57 million related to a hospital facility in our Central Group, $5 million related to otherhealth care entity investments in our National Group, $17 million related to a hospital facility in our SouthwestGroup and $44 million related to Corporate and other, which includes $35 million for the writeoff of capitalizedengineering and design costs related to certain building safety requirements (California earthquake standards)that have been revised. During 2009, we recorded pretax charges of $43 million to reduce the carrying value ofidentified assets to estimated fair value. The $43 million asset impairment includes $15 million related to certainhospital facilities and other health care entity investments in our Central Group, $16 million related to otherhealth care entity investments in our National Group and $12 million related to certain hospital facilities in ourSouthwest Group.
The asset impairment charges did not have a significant impact on our operations or cash flows and are notexpected to significantly impact cash flows for future periods. The impairment charges affected our property andequipment asset category by $109 million and $24 million in 2010 and 2009, respectively.
NOTE 5 — INCOME TAXES
The provision for income taxes consists of the following (dollars in millions):
2011 2010 2009
Current:Federal . . . . . . . . . . . . . . . . . . . . . . . . . . . . . . . . . . . . . . . . . . . . . . . . . . . . $(119) $401 $ 809State . . . . . . . . . . . . . . . . . . . . . . . . . . . . . . . . . . . . . . . . . . . . . . . . . . . . . . (12) 26 75Foreign . . . . . . . . . . . . . . . . . . . . . . . . . . . . . . . . . . . . . . . . . . . . . . . . . . . . 44 33 21
Deferred:Federal . . . . . . . . . . . . . . . . . . . . . . . . . . . . . . . . . . . . . . . . . . . . . . . . . . . . 714 161 (274)State . . . . . . . . . . . . . . . . . . . . . . . . . . . . . . . . . . . . . . . . . . . . . . . . . . . . . . 71 17 (37)Foreign . . . . . . . . . . . . . . . . . . . . . . . . . . . . . . . . . . . . . . . . . . . . . . . . . . . . 21 20 33
$ 719 $658 $ 627
The provision for income taxes reflects $100 million, $69 million and $18 million ($63 million, $44 millionand $12 million net of tax, respectively) reductions in interest related to taxing authority examinations for theyears ended December 31, 2011, 2010 and 2009, respectively.
A reconciliation of the federal statutory rate to the effective income tax rate follows:
2011 2010 2009
Federal statutory rate . . . . . . . . . . . . . . . . . . . . . . . . . . . . . . . . . . . . . . . . . . . . . . . 35.0% 35.0% 35.0%State income taxes, net of federal tax benefit . . . . . . . . . . . . . . . . . . . . . . . . . . . . . 2.0 2.7 3.2Change in liability for uncertain tax positions . . . . . . . . . . . . . . . . . . . . . . . . . . . . 1.0 0.3 (0.2)Nontaxable gain on acquisition of controlling interest in equity investment . . . . . (13.8) — —Tax exempt interest income . . . . . . . . . . . . . . . . . . . . . . . . . . . . . . . . . . . . . . . . . . (0.2) (0.4) (0.8)Income attributable to noncontrolling interests from consolidated partnerships . . (2.4) (5.8) (6.0)Other items, net . . . . . . . . . . . . . . . . . . . . . . . . . . . . . . . . . . . . . . . . . . . . . . . . . . . . (1.4) (2.3) 0.1
Effective income tax rate . . . . . . . . . . . . . . . . . . . . . . . . . . . . . . . . . . . . . . . . . . . . 20.2% 29.5% 31.3%
F-21

HCA HOLDINGS, INC.
NOTES TO CONSOLIDATED FINANCIAL STATEMENTS— (Continued)
NOTE 5 — INCOME TAXES (Continued)
A summary of the items comprising the deferred tax assets and liabilities at December 31 follows (dollars inmillions):
2011 2010
Assets Liabilities Assets Liabilities
Depreciation and fixed asset basis differences . . . . . . . . . $ — $402 $ — $211Allowances for professional liability and other risks . . . . 337 — 329 —Accounts receivable . . . . . . . . . . . . . . . . . . . . . . . . . . . . . . 706 — 1,011 —Compensation . . . . . . . . . . . . . . . . . . . . . . . . . . . . . . . . . . 216 — 202 —Other . . . . . . . . . . . . . . . . . . . . . . . . . . . . . . . . . . . . . . . . . . 698 511 776 400
$1,957 $913 $2,318 $611
At December 31, 2011, state net operating loss carryforwards (expiring in years 2012 through2031) available to offset future taxable income approximated $34 million. Utilization of net operating losscarryforwards in any one year may be limited and, in certain cases, result in an adjustment to intangible assets.Net deferred tax assets related to such carryforwards are not significant.
At December 31, 2011, we were contesting, before the IRS Appeals Division, certain claimed deficienciesand adjustments proposed by the IRS Examination Division in connection with its audit of HCA Inc.’s 2005 and2006 federal income tax returns. The disputed items include the timing of recognition of certain patient servicerevenues, the deductibility of certain debt retirement costs and our method for calculating the tax allowance fordoubtful accounts. The IRS Examination Division began an audit of HCA Inc.’s 2007, 2008 and 2009 federalincome tax returns in 2010.
The following table summarizes the activity related to our unrecognized tax benefits (dollars in millions):
2011 2010
Balance at January 1 . . . . . . . . . . . . . . . . . . . . . . . . . . . . . . . . . . . . . . . . . . . . . . . . . . . $313 $ 485Additions (reductions) based on tax positions related to the current year . . . . . . . . . . . 83 (18)Additions for tax positions of prior years . . . . . . . . . . . . . . . . . . . . . . . . . . . . . . . . . . . 73 61Reductions for tax positions of prior years . . . . . . . . . . . . . . . . . . . . . . . . . . . . . . . . . . (15) (78)Settlements . . . . . . . . . . . . . . . . . . . . . . . . . . . . . . . . . . . . . . . . . . . . . . . . . . . . . . . . . . . — (134)Lapse of applicable statutes of limitations . . . . . . . . . . . . . . . . . . . . . . . . . . . . . . . . . . . (9) (3)
Balance at December 31 . . . . . . . . . . . . . . . . . . . . . . . . . . . . . . . . . . . . . . . . . . . . . . . . $445 $ 313
During 2011, we finalized settlements with the IRS Examination Division resolving all outstanding issuesfor our 1997 through 2004 tax years. During 2010, we finalized settlements with the Appeals Division of the IRSresolving the deductibility of our 2003 government settlement payment, the timing of certain patient servicerevenues for 2003 and 2004 and the method for calculating the tax allowance for doubtful accounts for certainaffiliated partnerships for 2003 and 2004.
Our liability for unrecognized tax benefits was $494 million, including accrued interest of $62 million andexcluding $13 million that was recorded as reductions of the related deferred tax assets, as of December 31, 2011($413 million, $115 million and $15 million, respectively, as of December 31, 2010). Unrecognized tax benefitsof $173 million ($190 million as of December 31, 2010) would affect the effective rate, if recognized. The
F-22
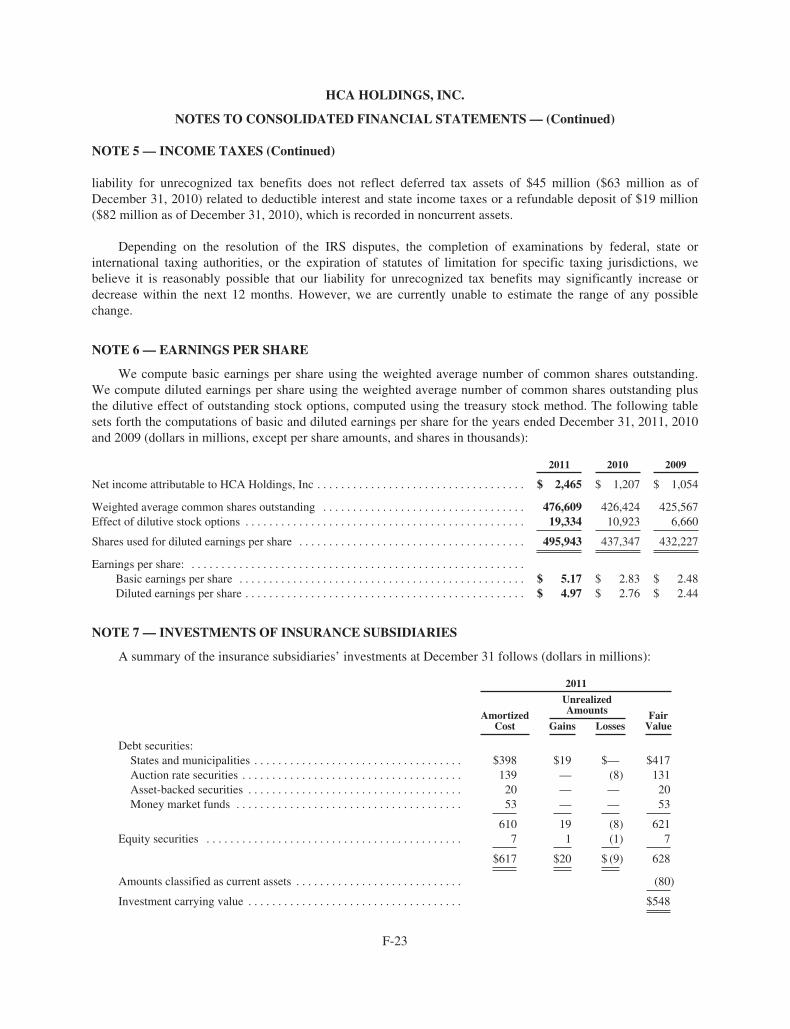
HCA HOLDINGS, INC.
NOTES TO CONSOLIDATED FINANCIAL STATEMENTS— (Continued)
NOTE 5 — INCOME TAXES (Continued)
liability for unrecognized tax benefits does not reflect deferred tax assets of $45 million ($63 million as ofDecember 31, 2010) related to deductible interest and state income taxes or a refundable deposit of $19 million($82 million as of December 31, 2010), which is recorded in noncurrent assets.
Depending on the resolution of the IRS disputes, the completion of examinations by federal, state orinternational taxing authorities, or the expiration of statutes of limitation for specific taxing jurisdictions, webelieve it is reasonably possible that our liability for unrecognized tax benefits may significantly increase ordecrease within the next 12 months. However, we are currently unable to estimate the range of any possiblechange.
NOTE 6 — EARNINGS PER SHARE
We compute basic earnings per share using the weighted average number of common shares outstanding.We compute diluted earnings per share using the weighted average number of common shares outstanding plusthe dilutive effect of outstanding stock options, computed using the treasury stock method. The following tablesets forth the computations of basic and diluted earnings per share for the years ended December 31, 2011, 2010and 2009 (dollars in millions, except per share amounts, and shares in thousands):
2011 2010 2009
Net income attributable to HCA Holdings, Inc . . . . . . . . . . . . . . . . . . . . . . . . . . . . . . . . . . . $ 2,465 $ 1,207 $ 1,054
Weighted average common shares outstanding . . . . . . . . . . . . . . . . . . . . . . . . . . . . . . . . . . 476,609 426,424 425,567Effect of dilutive stock options . . . . . . . . . . . . . . . . . . . . . . . . . . . . . . . . . . . . . . . . . . . . . . . 19,334 10,923 6,660
Shares used for diluted earnings per share . . . . . . . . . . . . . . . . . . . . . . . . . . . . . . . . . . . . . . 495,943 437,347 432,227
Earnings per share: . . . . . . . . . . . . . . . . . . . . . . . . . . . . . . . . . . . . . . . . . . . . . . . . . . . . . . . .Basic earnings per share . . . . . . . . . . . . . . . . . . . . . . . . . . . . . . . . . . . . . . . . . . . . . . . . $ 5.17 $ 2.83 $ 2.48Diluted earnings per share . . . . . . . . . . . . . . . . . . . . . . . . . . . . . . . . . . . . . . . . . . . . . . . $ 4.97 $ 2.76 $ 2.44
NOTE 7 — INVESTMENTS OF INSURANCE SUBSIDIARIES
A summary of the insurance subsidiaries’ investments at December 31 follows (dollars in millions):
2011
AmortizedCost
UnrealizedAmounts Fair
ValueGains Losses
Debt securities:States and municipalities . . . . . . . . . . . . . . . . . . . . . . . . . . . . . . . . . . . $398 $19 $— $417Auction rate securities . . . . . . . . . . . . . . . . . . . . . . . . . . . . . . . . . . . . . 139 — (8) 131Asset-backed securities . . . . . . . . . . . . . . . . . . . . . . . . . . . . . . . . . . . . 20 — — 20Money market funds . . . . . . . . . . . . . . . . . . . . . . . . . . . . . . . . . . . . . . 53 — — 53
610 19 (8) 621Equity securities . . . . . . . . . . . . . . . . . . . . . . . . . . . . . . . . . . . . . . . . . . . 7 1 (1) 7
$617 $20 $ (9) 628
Amounts classified as current assets . . . . . . . . . . . . . . . . . . . . . . . . . . . . (80)
Investment carrying value . . . . . . . . . . . . . . . . . . . . . . . . . . . . . . . . . . . . $548
F-23

HCA HOLDINGS, INC.
NOTES TO CONSOLIDATED FINANCIAL STATEMENTS— (Continued)
NOTE 7 — INVESTMENTS OF INSURANCE SUBSIDIARIES (Continued)
2010
AmortizedCost
UnrealizedAmounts Fair
ValueGains Losses
Debt securities:States and municipalities . . . . . . . . . . . . . . . . . . . . . . . . . . . . . . . . . . $312 $12 $ (1) $ 323Auction rate securities . . . . . . . . . . . . . . . . . . . . . . . . . . . . . . . . . . . . 251 — (1) 250Asset-backed securities . . . . . . . . . . . . . . . . . . . . . . . . . . . . . . . . . . . . 26 1 (1) 26Money market funds . . . . . . . . . . . . . . . . . . . . . . . . . . . . . . . . . . . . . . 135 — — 135
724 13 (3) 734Equity securities . . . . . . . . . . . . . . . . . . . . . . . . . . . . . . . . . . . . . . . . . . . 8 1 (1) 8
$732 $14 $ (4) 742
Amounts classified as current assets . . . . . . . . . . . . . . . . . . . . . . . . . . . . (100)
Investment carrying value . . . . . . . . . . . . . . . . . . . . . . . . . . . . . . . . . . . . $ 642
At December 31, 2011 and 2010 the investments of our insurance subsidiaries were classified as“available-for-sale.” Changes in temporary unrealized gains and losses are recorded as adjustments to othercomprehensive income (loss). At December 31, 2011 and 2010, $19 million and $92 million, respectively, of ourinvestments were subject to the restrictions included in insurance bond collateralization and assumed reinsurancecontracts.
Scheduled maturities of investments in debt securities at December 31, 2011 were as follows (dollars inmillions):
AmortizedCost
FairValue
Due in one year or less . . . . . . . . . . . . . . . . . . . . . . . . . . . . . . . . . . . . . . . . . . . . . . . $101 $102Due after one year through five years . . . . . . . . . . . . . . . . . . . . . . . . . . . . . . . . . . . 112 119Due after five years through ten years . . . . . . . . . . . . . . . . . . . . . . . . . . . . . . . . . . . 143 151Due after ten years . . . . . . . . . . . . . . . . . . . . . . . . . . . . . . . . . . . . . . . . . . . . . . . . . . 95 98
451 470Auction rate securities . . . . . . . . . . . . . . . . . . . . . . . . . . . . . . . . . . . . . . . . . . . . . . . 139 131Asset-backed securities . . . . . . . . . . . . . . . . . . . . . . . . . . . . . . . . . . . . . . . . . . . . . . . 20 20
$610 $621
The average expected maturity of the investments in debt securities at December 31, 2011 was 4.4 years,compared to the average scheduled maturity of 10.8 years. Expected and scheduled maturities may differ becausethe issuers of certain securities have the right to call, prepay or otherwise redeem such obligations prior to theirscheduled maturity date. The average expected maturities for our auction rate and asset-backed securities werederived from valuation models of expected cash flows and involved management’s judgment. The averageexpected maturities for our auction rate and asset-backed securities at December 31, 2011 were 4.9 years and4.8 years, respectively, compared to average scheduled maturities of 24.9 years and 24.8 years, respectively.
F-24

HCA HOLDINGS, INC.
NOTES TO CONSOLIDATED FINANCIAL STATEMENTS— (Continued)
NOTE 7 — INVESTMENTS OF INSURANCE SUBSIDIARIES (Continued)
The cost of securities sold is based on the specific identification method. Sales of securities for the yearsended December 31 are summarized below (dollars in millions):
2011 2010 2009
Debt securities:Cash proceeds . . . . . . . . . . . . . . . . . . . . . . . . . . . . . . . . . . . . . . . . . . . . . . . $— $329 $141Gross realized gains . . . . . . . . . . . . . . . . . . . . . . . . . . . . . . . . . . . . . . . . . . — 14 —Gross realized losses . . . . . . . . . . . . . . . . . . . . . . . . . . . . . . . . . . . . . . . . . . — 1 1
Equity securities:Cash proceeds . . . . . . . . . . . . . . . . . . . . . . . . . . . . . . . . . . . . . . . . . . . . . . . $— $ — $ 3Gross realized gains . . . . . . . . . . . . . . . . . . . . . . . . . . . . . . . . . . . . . . . . . . — — 1Gross realized losses . . . . . . . . . . . . . . . . . . . . . . . . . . . . . . . . . . . . . . . . . . — — —
NOTE 8 — FINANCIAL INSTRUMENTS
Interest Rate Swap Agreements
We have entered into interest rate swap agreements to manage our exposure to fluctuations in interest rates.These swap agreements involve the exchange of fixed and variable rate interest payments between two partiesbased on common notional principal amounts and maturity dates. Pay-fixed interest rate swaps effectivelyconvert LIBOR indexed variable rate obligations to fixed interest rate obligations. The interest payments underthese agreements are settled on a net basis. The net interest payments, based on the notional amounts in theseagreements, generally match the timing of the related liabilities, for the interest rate swap agreements which havebeen designated as cash flow hedges. The notional amounts of the swap agreements represent amounts used tocalculate the exchange of cash flows and are not our assets or liabilities. Our credit risk related to theseagreements is considered low because the swap agreements are with creditworthy financial institutions.
The following table sets forth our interest rate swap agreements, which have been designated as cash flowhedges, at December 31, 2011 (dollars in millions):
NotionalAmount Maturity Date
FairValue
Pay-fixed interest rate swaps . . . . . . . . . . . . . . . . . . . . . . . . . . . $ 500 December 2014 $ (7)Pay-fixed interest rate swaps . . . . . . . . . . . . . . . . . . . . . . . . . . . 3,000 December 2016 (339)Pay-fixed interest rate swaps . . . . . . . . . . . . . . . . . . . . . . . . . . . 1,000 December 2017 (53)
During the next 12 months, we estimate $110 million will be reclassified from other comprehensive income(“OCI”) to interest expense.
Cross Currency Swaps
The Company and certain subsidiaries have incurred obligations and entered into various intercompanytransactions where such obligations are denominated in currencies, other than the functional currencies of theparties executing the trade. In order to mitigate the currency exposure risks and better match the cash flows ofour obligations and intercompany transactions with cash flows from operations, we enter into various crosscurrency swaps. Our credit risk related to these agreements is considered low because the swap agreements arewith creditworthy financial institutions.
F-25
HCA HOLDINGS, INC.
NOTES TO CONSOLIDATED FINANCIAL STATEMENTS— (Continued)
NOTE 8 — FINANCIAL INSTRUMENTS (Continued)
Cross Currency Swaps (Continued)
Our cross currency swap is not designated as a hedge, and changes in fair value are recognized in results ofoperations. The following table sets forth our cross currency swap agreement at December 31, 2011 (amounts inmillions):
NotionalAmount Maturity Date
FairValue
Euro — United States Dollar Currency Swap . . . . . . . . . . . . . 291 Euro November 2013 $(16)
Derivatives — Results of Operations
The following tables present the effect of our interest rate and cross currency swaps on our results ofoperations for the year ended December 31, 2011 (dollars in millions):
Derivatives in Cash Flow Hedging Relationships
Amount of LossRecognized in OCI onDerivatives, Net of Tax
Location of LossReclassified fromAccumulated OCIinto Operations
Amount of LossReclassified fromAccumulated OCIinto Operations
Interest rate swaps . . . . . . . . . . . . . . . . . . $197 Interest expense $341
Derivatives Not Designated as Hedging Instruments
Location of LossRecognized inOperations onDerivatives
Amount of LossRecognized inOperations onDerivatives
Interest rate swaps . . . . . . . . . . . . . . . . . . . . . . . . . . . . . . . Other operating expenses $ 1Cross currency swap . . . . . . . . . . . . . . . . . . . . . . . . . . . . . Other operating expenses 54
Credit-risk-related Contingent Features
We have agreements with each of our derivative counterparties that contain a provision where we could bedeclared in default on our derivative obligations if repayment of the underlying indebtedness is accelerated by thelender due to our default on the indebtedness. As of December 31, 2011, we have not been required to post anycollateral related to these agreements. If we had breached these provisions at December 31, 2011, we would havebeen required to settle our obligations under the agreements at their aggregate, estimated termination value of$452 million.
NOTE 9 — ASSETS AND LIABILITIES MEASURED AT FAIR VALUE
Accounting Standards Codification 820, Fair Value Measurements and Disclosures (“ASC 820”) definesfair value, establishes a framework for measuring fair value, and expands disclosures about fair valuemeasurements. ASC 820 applies to reported balances that are required or permitted to be measured at fair valueunder existing accounting pronouncements.
ASC 820 emphasizes fair value is a market-based measurement, not an entity-specific measurement.Therefore, a fair value measurement should be determined based on the assumptions market participants woulduse in pricing the asset or liability. As a basis for considering market participant assumptions in fair valuemeasurements, ASC 820 establishes a fair value hierarchy that distinguishes between market participantassumptions based on market data obtained from sources independent of the reporting entity (observable inputsclassified within Levels 1 and 2 of the hierarchy) and the reporting entity’s own assumptions about marketparticipant assumptions (unobservable inputs classified within Level 3 of the hierarchy).
F-26

HCA HOLDINGS, INC.
NOTES TO CONSOLIDATED FINANCIAL STATEMENTS— (Continued)
NOTE 9 — ASSETS AND LIABILITIES MEASURED AT FAIR VALUE (Continued)
Level 1 inputs utilize quoted prices (unadjusted) in active markets for identical assets or liabilities. Level 2inputs are inputs other than quoted prices included in Level 1 that are observable for the asset or liability, eitherdirectly or indirectly. Level 2 inputs may include quoted prices for similar assets and liabilities in active markets,as well as inputs observable for the asset or liability (other than quoted prices), such as interest rates, foreignexchange rates, and yield curves observable at commonly quoted intervals. Level 3 inputs are unobservableinputs for the asset or liability, which are typically based on an entity’s own assumptions, as there is little, if any,related market activity. In instances where the determination of the fair value measurement is based on inputsfrom different levels of the fair value hierarchy, the level in the fair value hierarchy within which the entire fairvalue measurement falls is based on the lowest level input significant to the fair value measurement in itsentirety. Our assessment of the significance of a particular input to the fair value measurement in its entiretyrequires judgment, and considers factors specific to the asset or liability.
Cash Traded Investments
Our cash traded investments are generally classified within Level 1 or Level 2 of the fair value hierarchybecause they are valued using quoted market prices, broker or dealer quotations, or alternative pricing sourceswith reasonable levels of price transparency. Certain types of cash traded instruments are classified withinLevel 3 of the fair value hierarchy because they trade infrequently and therefore have little or no pricetransparency. Such instruments include auction rate securities (“ARS”) and limited partnership investments. Thetransaction price is initially used as the best estimate of fair value.
Our wholly-owned insurance subsidiaries had investments in tax-exempt ARS, which are backed by studentloans substantially guaranteed by the federal government, of $131 million ($139 million par value) atDecember 31, 2011. We do not currently intend to attempt to sell the ARS as the liquidity needs of our insurancesubsidiaries are expected to be met by other investments in their investment portfolios. During 2011 and 2010,certain issuers and their broker/dealers redeemed or repurchased $112 million and $150 million, respectively, ofour ARS at par value. The valuation of these securities involved management’s judgment, after consideration ofmarket factors and the absence of market transparency, market liquidity and observable inputs. Our valuationmodels derived a fair market value compared to tax-equivalent yields of other student loan backed variable ratesecurities of similar credit worthiness and similar effective maturities.
Derivative Financial Instruments
We have entered into interest rate and cross currency swap agreements to manage our exposure to fluctuationsin interest rates and foreign currency risks. The valuation of these instruments is determined using widely acceptedvaluation techniques, including discounted cash flow analysis on the expected cash flows of each derivative. Thisanalysis reflects the contractual terms of the derivatives, including the period to maturity, and uses observablemarket-based inputs, including interest rate curves, foreign exchange rates and implied volatilities. To comply withthe provisions of ASC 820, we incorporate credit valuation adjustments to reflect both our own nonperformance riskand the respective counterparty’s nonperformance risk in the fair value measurements.
Although we determined the majority of the inputs used to value our derivatives fall within Level 2 of thefair value hierarchy, the credit valuation adjustments associated with our derivatives utilize Level 3 inputs, suchas estimates of current credit spreads to evaluate the likelihood of default by us and our counterparties. Weassessed the significance of the impact of the credit valuation adjustments on the overall valuation of ourderivative positions and at December 31, 2011 and 2010, we determined the credit valuation adjustments werenot significant to the overall valuation of our derivatives.
F-27
HCA HOLDINGS, INC.
NOTES TO CONSOLIDATED FINANCIAL STATEMENTS— (Continued)
NOTE 9 — ASSETS AND LIABILITIES MEASURED AT FAIR VALUE (Continued)
The following table summarizes our assets and liabilities measured at fair value on a recurring basis as ofDecember 31, 2011 and 2010, aggregated by the level in the fair value hierarchy within which thosemeasurements fall (dollars in millions):
December 31, 2011
Fair Value Measurements Using
Fair Value
Quoted Prices inActive Markets forIdentical Assetsand Liabilities
(Level 1)
Significant OtherObservable Inputs
(Level 2)
SignificantUnobservable Inputs
(Level 3)
Assets:Investments of insurance subsidiaries:Debt securities:States and municipalities . . . . . . . . . $417 $ — $417 $ —Auction rate securities . . . . . . . . . . . 131 — — 131Asset-backed securities . . . . . . . . . . . 20 — 20 —Money market funds . . . . . . . . . . . . . 53 53 — —
621 53 437 131Equity securities . . . . . . . . . . . . . . . . . . 7 1 5 1
Investments of insurancesubsidiaries . . . . . . . . . . . . . . . . . . 628 54 442 132
Less amounts classified as currentassets . . . . . . . . . . . . . . . . . . . . . . . (80) (54) (26) —
$548 $ — $416 $132
Liabilities:Cross currency swap (Income taxes andother liabilities) . . . . . . . . . . . . . . . . . . . $ 16 $ — $ 16 $ —
Interest rate swaps (Income taxes andother liabilities) . . . . . . . . . . . . . . . . . . . 399 — 399 —
F-28

HCA HOLDINGS, INC.
NOTES TO CONSOLIDATED FINANCIAL STATEMENTS— (Continued)
NOTE 9 — ASSETS AND LIABILITIES MEASURED AT FAIR VALUE (Continued)
December 31, 2010
Fair Value Measurements Using
Fair Value
Quoted Prices inActive Markets forIdentical Assetsand Liabilities
(Level 1)
Significant OtherObservable Inputs
(Level 2)
SignificantUnobservable Inputs
(Level 3)
Assets:Investments of insurance subsidiaries:Debt securities:States and municipalities . . . . . . . . . $ 323 $ — $323 $ —Auction rate securities . . . . . . . . . . . 250 — — 250Asset-backed securities . . . . . . . . . . . 26 — 26 —Money market funds . . . . . . . . . . . . . 135 135 — —
734 135 349 250Equity securities . . . . . . . . . . . . . . . . . . 8 2 5 1
Investments of insurancesubsidiaries . . . . . . . . . . . . . . . . . . 742 137 354 251
Less amounts classified as currentassets . . . . . . . . . . . . . . . . . . . . . . . (100) (100) — —
$ 642 $ 37 $354 $251
Cross currency swap (Other assets) . . . . . $ 39 $ — $ 39 $ —Liabilities:Interest rate swaps (Income taxes andother liabilities) . . . . . . . . . . . . . . . . . . . $ 426 $ — $426 $ —
The following table summarizes the activity related to the auction rate and equity securities investments ofour insurance subsidiaries which have fair value measurements based on significant unobservable inputs(Level 3) during the year ended December 31, 2011 (dollars in millions):
Asset balances at December 31, 2010 . . . . . . . . . . . . . . . . . . . . . . . . . . . . . . . . . . . . . . . . . . . . . $ 251Unrealized losses included in other comprehensive income . . . . . . . . . . . . . . . . . . . . . . . . . . . . (7)Settlements . . . . . . . . . . . . . . . . . . . . . . . . . . . . . . . . . . . . . . . . . . . . . . . . . . . . . . . . . . . . . . . . . . (112)
Asset balances at December 31, 2011 . . . . . . . . . . . . . . . . . . . . . . . . . . . . . . . . . . . . . . . . . . . . . $ 132
The estimated fair value of our long-term debt was $27.199 billion and $28.738 billion at December 31,2011 and 2010, respectively, compared to carrying amounts aggregating $27.052 billion and $28.225 billion,respectively. The estimates of fair value are generally based upon the quoted market prices or quoted marketprices for similar issues of long-term debt with the same maturities.
F-29

HCA HOLDINGS, INC.
NOTES TO CONSOLIDATED FINANCIAL STATEMENTS— (Continued)
NOTE 10 — LONG-TERM DEBT
A summary of long-term debt at December 31, including related interest rates at December 31, 2011,follows (dollars in millions):
2011 2010
Senior secured asset-based revolving credit facility (effective interest rate of1.8%) . . . . . . . . . . . . . . . . . . . . . . . . . . . . . . . . . . . . . . . . . . . . . . . . . . . . . . . . . $ 2,155 $ 1,875
Senior secured revolving credit facility . . . . . . . . . . . . . . . . . . . . . . . . . . . . . . . . — 729Senior secured term loan facilities (effective interest rate of 4.8%) . . . . . . . . . . . 7,425 7,530Senior secured first lien notes (effective interest rate of 7.7%) . . . . . . . . . . . . . . 7,081 4,075Other senior secured debt (effective interest rate of 6.8%) . . . . . . . . . . . . . . . . . . 350 322
First lien debt . . . . . . . . . . . . . . . . . . . . . . . . . . . . . . . . . . . . . . . . . . . . . . . . . . . . . 17,011 14,531
Senior secured second lien notes (effective interest rate of 11.0%) . . . . . . . . . . . 197 4,501Senior secured toggle notes . . . . . . . . . . . . . . . . . . . . . . . . . . . . . . . . . . . . . . . . . . — 1,578
Second lien debt . . . . . . . . . . . . . . . . . . . . . . . . . . . . . . . . . . . . . . . . . . . . . . . . . . 197 6,079
Senior unsecured notes (effective interest rate of 7.3%) . . . . . . . . . . . . . . . . . . . . 9,844 7,615
Total debt (average life of 6.9 years, rates averaging 6.3%) . . . . . . . . . . . . . . . . . 27,052 28,225Less amounts due within one year . . . . . . . . . . . . . . . . . . . . . . . . . . . . . . . . . . . . 1,407 592
$25,645 $27,633
2011 Activity
During May 2011, we completed amendments to our senior secured credit agreement and senior secured asset-based revolving credit agreement, as well as extensions of certain of our term loans. The amendments extended$594 million ($572 million outstanding at December 31, 2011) of our term loan A facility with a final maturity ofNovember 2012 to a final maturity of May 2016 and $2.373 billion of our term loan A and term loan B-1 facilitieswith final maturities of November 2012 and November 2013, respectively, to a final maturity of May 2018.
During June 2011, we redeemed all $1.000 billion aggregate principal amount of our 91⁄8% senior securednotes due 2014, at a redemption price of 104.563% of the principal amount, and $108 million aggregate principalamount of our 97⁄8% senior secured notes due 2017, at a redemption price of 109.875% of the principal amount.The pretax loss on retirement of debt related to these redemptions was $75 million.
During August 2011, we issued $5.000 billion aggregate principal amount of notes, comprised of$3.000 billion of 6.50% senior secured first lien notes due 2020 and $2.000 billion of 7.50% senior unsecured notesdue 2022. We used the net proceeds from these debt issuances to redeem all of our outstanding $1.578 billion95⁄8%/103⁄8% second lien toggle notes due 2016, at a redemption price of 106.783% of the principal amount, and allof our outstanding $3.200 billion 91⁄4% second lien notes due 2016, at a redemption price of 106.513% of theprincipal amount. The pretax loss on retirement of debt related to these redemptions was $406 million.
During September 2011, we refinanced our $2.000 billion asset-based revolving credit facility maturing onNovember 16, 2012 to increase the total capacity to $2.500 billion and extend the maturity to 2016.
During October 2011, we issued $500 million aggregate principal amount of 8.00% senior unsecured notesdue 2018. We used the net proceed for general corporate purposes, which included funding a portion of theacquisition of the remaining interest in HealthONE.
F-30

HCA HOLDINGS, INC.
NOTES TO CONSOLIDATED FINANCIAL STATEMENTS— (Continued)
NOTE 10 — LONG-TERM DEBT (Continued)
Senior Secured Credit Facilities And Other First Lien Debt
We have entered into the following senior secured credit facilities: (i) a $2.500 billion asset-based revolvingcredit facility maturing on September 30, 2016 with a borrowing base of 85% of eligible accounts receivable,subject to customary reserves and eligibility criteria ($2.155 billion outstanding at December 31, 2011) (the“ABL credit facility”); (ii) a $2.000 billion senior secured revolving credit facility maturing on November 17,2015 (none outstanding at December 31, 2011 without giving effect to certain outstanding letters of credit); (iii) a$414 million senior secured term loan A-1 facility maturing on November 17, 2012; (iv) a $572 million seniorsecured term loan A-2 facility maturing on May 2, 2016; (v) a $1.689 billion senior secured term loan B-1facility maturing on November 17, 2013; (vi) a $2.000 billion senior secured term loan B-2 facility maturing onMarch 31, 2017; (vii) a $2.373 billion senior secured term loan B-3 facility maturing on May 1, 2018; and (viii) a€291 million, or $377 million-equivalent, senior secured European term loan facility maturing on November 17,2013. We refer to the facilities described under (ii) through (viii) above, collectively, as the “cash flow creditfacility” and, together with the ABL credit facility, the “senior secured credit facilities.”
Borrowings under the senior secured credit facilities bear interest at a rate equal to, at our option, either (a) abase rate determined by reference to the higher of (1) the federal funds rate plus 0.50% or (2) the prime rate ofBank of America or (b) a LIBOR rate for the currency of such borrowing for the relevant interest period, plus, ineach case, an applicable margin. The applicable margin for borrowings under the senior secured credit facilitiesmay be reduced subject to attaining certain leverage ratios.
The senior secured credit facilities contain a number of covenants that restrict, subject to certain exceptions,our (and some or all of our subsidiaries’) ability to incur additional indebtedness, repay subordinatedindebtedness, create liens on assets, sell assets, make investments, loans or advances, engage in certaintransactions with affiliates, pay dividends and distributions, and enter into sale and leaseback transactions. Inaddition, we are required to satisfy and maintain a maximum total leverage ratio covenant under the cash flowcredit facility and, in certain situations under the ABL credit facility, a minimum interest coverage ratiocovenant.
Senior secured first lien notes consist of (i) $1.500 billion aggregate principal amount of 81⁄2% seniorsecured first lien notes due 2019; (ii) $1.250 billion aggregate principal amount of 77⁄8% senior secured first liennotes due 2020; (iii) $1.400 billion aggregate principal amount of 71⁄4% senior secured first lien notes due 2020;(iv) $3.000 billion aggregate principal amount of 6.50% senior secured first lien notes due 2020; and (v)$69 million of unamortized debt discounts that reduces the senior secured first lien indebtedness. Capital leasesand other secured debt totaled $350 million at December 31, 2011.
We use interest rate swap agreements to manage the variable rate exposure of our debt portfolio. AtDecember 31, 2011, we had entered into effective interest rate swap agreements, in a total notional amount of$4.500 billion, in order to hedge a portion of our exposure to variable rate interest payments associated with thesenior secured credit facility. The effect of the interest rate swaps is reflected in the effective interest rates for thesenior secured credit facilities.
Senior Secured Second Lien Notes
Senior secured second lien notes is comprised of $202 million aggregate principal amount of 97⁄8% seniorsecured second lien notes due 2017 and $5 million of unamortized debt discounts that reduces the senior securedsecond lien indebtedness.
F-31

HCA HOLDINGS, INC.
NOTES TO CONSOLIDATED FINANCIAL STATEMENTS— (Continued)
NOTE 10 — LONG-TERM DEBT (Continued)
Senior Unsecured Notes
Senior unsecured notes consist of (i) $7.194 billion aggregate principal amount of senior notes withmaturities ranging from 2012 to 2033; (ii) an aggregate principal amount of $246 million medium-term noteswith maturities ranging from 2014 to 2025; (iii) an aggregate principal amount of $886 million debentures withmaturities ranging from 2015 to 2095; (iv) an aggregate principal amount of $1.525 billion senior notes due 2021issued by HCA Holdings, Inc. (the “2021 Notes”); and (v) $7 million of unamortized debt discounts that reducethe indebtedness.
General Debt Information
The senior secured credit facilities and senior secured notes are fully and unconditionally guaranteed bysubstantially all existing and future, direct and indirect, wholly-owned material domestic subsidiaries that are“Unrestricted Subsidiaries” under our Indenture (the “1993 Indenture”) dated December 16, 1993 (except for certainspecial purpose subsidiaries that only guarantee and pledge their assets under our ABL credit facility). In addition,borrowings under the European term loan are guaranteed by all material, wholly-owned European subsidiaries.
All obligations under the ABL credit facility, and the guarantees of those obligations, are secured, subject topermitted liens and other exceptions, by a first-priority lien on substantially all of the receivables of theborrowers and each guarantor under such ABL credit facility (the “Receivables Collateral”).
All obligations under the cash flow credit facility and the guarantees of such obligations are secured, subjectto permitted liens and other exceptions, by:
• a first-priority lien on the capital stock owned by HCA Inc., or by any U.S. guarantor, in each of theirrespective first-tier subsidiaries;
• a first-priority lien on substantially all present and future assets of HCA Inc. and of each U.S. guarantorother than (i) “Principal Properties” (as defined in the 1993 Indenture), (ii) certain other real propertiesand (iii) deposit accounts, other bank or securities accounts, cash, leaseholds, motor-vehicles andcertain other exceptions; and
• a second-priority lien on certain of the Receivables Collateral.
Our senior secured first lien notes and the related guarantees are secured by first-priority liens, subject topermitted liens, on our and our subsidiary guarantors’ assets, subject to certain exceptions, that secure our cashflow credit facility on a first-priority basis and are secured by second priority liens, subject to permitted liens, onour and our subsidiary guarantors’ assets that secure our ABL credit facility on a first priority basis and our othercash flow credit facility on a second-priority basis.
Our second lien debt and the related guarantees are secured by second-priority liens, subject to permittedliens, on our and our subsidiary guarantors’ assets, subject to certain exceptions, that secure our cash flow creditfacility on a first-priority basis and are secured by third-priority liens, subject to permitted liens, on our and oursubsidiary guarantors’ assets that secure our asset-based revolving credit facility on a first priority basis and ourother cash flow credit facility on a second-priority basis.
Maturities of long-term debt in years 2013 through 2016, excluding amounts under the ABL credit facility,are $3.167 billion, $751 million, $1.020 billion and $1.537 billion, respectively.
F-32

HCA HOLDINGS, INC.
NOTES TO CONSOLIDATED FINANCIAL STATEMENTS— (Continued)
NOTE 11 — CONTINGENCIES
We operate in a highly regulated and litigious industry. As a result, various lawsuits, claims and legal andregulatory proceedings have been and can be expected to be instituted or asserted against us. The resolution ofany such lawsuits, claims or legal and regulatory proceedings could have a material, adverse effect on our resultsof operations or financial position.
Health care companies are subject to numerous investigations by various governmental agencies. Under thefederal false claims act (“FCA”) private parties have the right to bring qui tam, or “whistleblower,” suits againstcompanies that submit false claims for payments to, or improperly retain overpayments from, the government.Some states have adopted similar state whistleblower and false claims provisions. Certain of our individualfacilities have received government inquiries from federal and state agencies and our facilities may receive suchinquiries in future periods. Depending on whether the underlying conduct in these or future inquiries orinvestigations could be considered systemic, their resolution could have a material, adverse effect on our resultsof operations or financial position.
We are subject to claims and suits arising in the ordinary course of business, including claims for personalinjuries or wrongful restriction of, or interference with, physicians’ staff privileges. In certain of these actions theclaimants may seek punitive damages against us which may not be covered by insurance. It is management’sopinion that the ultimate resolution of these pending claims and legal proceedings will not have a material,adverse effect on our results of operations or financial position.
The Civil Division of the Department of Justice (“DOJ”) has contacted the Company in connection with itsnationwide review of whether, in certain cases, hospital charges to the federal government relating to implantablecardio-defibrillators (“ICDs”) met the Centers for Medicare & Medicaid Services criteria. In connection with thisnationwide review, the DOJ has indicated that it will be reviewing certain ICD billing and medical records at 95HCA hospitals; the review covers the period from October 2003 to the present. The review could potentially giverise to claims against the Company under the federal False Claims Act or other statutes, regulations or laws. Atthis time, we cannot predict what effect, if any, this review or any resulting claims could have on the Company.
On October 28, 2011, a shareholder action was filed in the United States District Court for the MiddleDistrict of Tennessee. The case seeks to include as a class all persons who acquired the Company’s stockpursuant or traceable to the Company’s Registration Statement and Prospectus issued in connection with theMarch 9, 2011 initial public offering. The lawsuit asserts a claim under Section 11 of the Securities Act of 1933against the Company, certain members of the board of directors, and certain underwriters in the offering. Itfurther asserts a claim under Section 15 of the Securities Act of 1933 against the same members of the board ofdirectors. The action alleges deficiencies in the Company’s disclosures in the Registration Statement relating to:(1) accounting for its 2006 recapitalization and 2010 reorganization; (2) the Company’s failure to maintaineffective internal controls relating to its accounting for such transactions; and (3) the Company’s revenue growthrate. Subsequently, two additional class action complaints setting forth substantially similar claims were filed inthe same federal court. All three of the cases have been consolidated.
F-33

HCA HOLDINGS, INC.
NOTES TO CONSOLIDATED FINANCIAL STATEMENTS— (Continued)
NOTE 12 — LEASES
We lease medical office buildings and certain equipment under operating lease agreements. Commitmentsrelating to noncancellable operating leases for each of the next five years and thereafter are as follows (dollars inmillions):
For the Year Ended December 31,
2012 . . . . . . . . . . . . . . . . . . . . . . . . . . . . . . . . . . . . . . . . . . . . . . . . . . . . . . $ 2802013 . . . . . . . . . . . . . . . . . . . . . . . . . . . . . . . . . . . . . . . . . . . . . . . . . . . . . . 2642014 . . . . . . . . . . . . . . . . . . . . . . . . . . . . . . . . . . . . . . . . . . . . . . . . . . . . . . 2182015 . . . . . . . . . . . . . . . . . . . . . . . . . . . . . . . . . . . . . . . . . . . . . . . . . . . . . . 1712016 . . . . . . . . . . . . . . . . . . . . . . . . . . . . . . . . . . . . . . . . . . . . . . . . . . . . . . 131Thereafter . . . . . . . . . . . . . . . . . . . . . . . . . . . . . . . . . . . . . . . . . . . . . . . . . . 870
1,934Less sublease income . . . . . . . . . . . . . . . . . . . . . . . . . . . . . . . . . . . . . . . . . (51)
$1,883
NOTE 13 — CAPITAL STOCK
The amended and restated certificate of incorporation authorizes the Company to issue up to1,800,000,000 shares of common stock, and our amended and restated by-laws set the number of directorsconstituting the board of directors of the Company at not less than one nor more than 15. During February 2011,our Board of Directors approved a 4.505-to-one split of our issued and outstanding common shares. All commonshare and per common share amounts in these consolidated financial statements and notes to consolidatedfinancial statements reflect the 4.505-to-one stock split. During March 2011, we completed the initial publicoffering of 87,719,300 shares of our common stock at a price of $30.00 per share and realized net proceeds (aftercosts of the offering) of $2.506 billion.
On September 21, 2011, we repurchased 80,771,143 shares of our common stock beneficially owned byaffiliates of Bank of America Corporation at a purchase price of $18.61 per share, the closing price of theCompany’s common stock on the New York Stock Exchange on September 14, 2011. The repurchase wasfinanced using a combination of cash on hand and borrowings under available credit facilities. The sharesrepurchased represented approximately 15.6% of our total shares outstanding at the time of the repurchase.
Distributions
During 2010, our Board of Directors declared three distributions to the Company’s stockholders and holdersof stock options. The distributions totaled $9.43 per share and vested stock option, or $4.332 billion in theaggregate. The distributions were funded using funds available under our senior secured credit facilities,proceeds from the 2021 Notes offering and cash on hand. Pursuant to the terms of our stock option plans, theholders of nonvested stock options received $9.43 per share reductions (subject to certain tax related limitationsfor certain stock options that resulted in deferred distributions for a portion of the declared distribution, whichwill be paid upon the vesting of the applicable stock options) to the exercise price of the share-based awards.There were no distributions declared during 2011.
F-34

HCA HOLDINGS, INC.
NOTES TO CONSOLIDATED FINANCIAL STATEMENTS— (Continued)
NOTE 13 — CAPITAL STOCK (Continued)
Stockholder Agreements and Equity Securities with Contingent Redemption Rights
Prior to the consummation of the initial public offering of our common stock, certain employees could electto have the Company redeem their common stock and vested options in the event of death or permanentdisability, pursuant to the terms of their management stockholder agreements. The consummation of the initialpublic offering of our common stock effectively terminated the contingent redemption rights and the applicableamounts have been reclassified back to stockholders’ equity.
NOTE 14 — EMPLOYEE BENEFIT PLANS
We maintain contributory, defined contribution benefit plans that are available to employees who meetcertain minimum requirements. Certain of the plans require that we match specified percentages of participantcontributions up to certain maximum levels (generally, 100% of the first 3% to 9%, depending upon years ofvesting service, of compensation deferred by participants). The cost of these plans totaled $321 million for 2011,$307 million for 2010 and $283 million for 2009. Our contributions are funded periodically during each year.
We maintain the noncontributory, nonqualified Restoration Plan to provide certain retirement benefits foreligible employees. Eligibility for the Restoration Plan is based upon earning eligible compensation in excess ofthe Social Security Wage Base and attaining 1,000 or more hours of service during the plan year. Companycredits to participants’ account balances (the Restoration Plan is not funded) depend upon participants’compensation, years of vesting service and certain IRS limitations related to the HCA 401(k) plan. Benefitsexpense under this plan was $25 million for 2011, $19 million for 2010 and $26 million for 2009. Accruedbenefits liabilities under this plan totaled $105 million at December 31, 2011 and $84 million at December 31,2010.
We maintain a Supplemental Executive Retirement Plan (“SERP”) for certain executives. The plan isdesigned to ensure that upon retirement the participant receives the value of a prescribed life annuity from thecombination of the SERP and our other benefit plans. Benefits expense under the plan was $33 million for 2011,$27 million for 2010 and $24 million for 2009. Accrued benefits liabilities under this plan totaled $237 million atDecember 31, 2011 and $197 million at December 31, 2010.
We maintain defined benefit pension plans which resulted from certain hospital acquisitions in prior years.Benefits expense under these plans was $37 million for 2011, $30 million for 2010, and $39 million for 2009.Accrued benefits liabilities under these plans totaled $147 million at December 31, 2011 and $131 million atDecember 31, 2010.
NOTE 15 — SEGMENT AND GEOGRAPHIC INFORMATION
We operate in one line of business, which is operating hospitals and related health care entities. Ouroperations are structured into three geographically organized groups: the National, Southwest and CentralGroups. During February 2011, we reorganized our operational groups and have restated the prior periodamounts to reflect this reorganization. At December 31, 2011, the National Group includes 64 hospitals locatedin Florida, South Carolina, southern Georgia, Alaska, California, Nevada, Utah and Idaho, the Southwest Groupincludes 46 hospitals located in Colorado, Texas, Oklahoma and the Wichita, Kansas market, and the CentralGroup includes 47 hospitals located in Louisiana, Indiana, Kentucky, Tennessee, Virginia, New Hampshire,northern Georgia and the Kansas City market. We also operate six hospitals in England, and these facilities areincluded in the Corporate and other group.
F-35

HCA HOLDINGS, INC.
NOTES TO CONSOLIDATED FINANCIAL STATEMENTS— (Continued)
NOTE 15 — SEGMENT AND GEOGRAPHIC INFORMATION (Continued)
Adjusted segment EBITDA is defined as income before depreciation and amortization, interest expense,losses (gains) on sales of facilities, gain on acquisition of controlling interest in equity investment, impairmentsof long-lived assets, losses on retirement of debt, termination of management agreement, income taxes and netincome attributable to noncontrolling interests. We use adjusted segment EBITDA as an analytical indicator forpurposes of allocating resources to geographic areas and assessing their performance. Adjusted segmentEBITDA is commonly used as an analytical indicator within the health care industry, and also serves as ameasure of leverage capacity and debt service ability. Adjusted segment EBITDA should not be considered as ameasure of financial performance under generally accepted accounting principles, and the items excluded fromadjusted segment EBITDA are significant components in understanding and assessing financial performance.Because adjusted segment EBITDA is not a measurement determined in accordance with generally acceptedaccounting principles and is thus susceptible to varying calculations, adjusted segment EBITDA, as presented,may not be comparable to other similarly titled measures of other companies. The geographic distributions of ourrevenues, equity in earnings of affiliates, adjusted segment EBITDA, depreciation and amortization, assets andgoodwill and other intangible assets are summarized in the following table (dollars in millions):
For the Years Ended December 31,
2011 2010 2009
Revenues:National Group . . . . . . . . . . . . . . . . . . . . . . . . . . . . . . . . . . . . . . . . $12,224 $11,624 $11,047Southwest Group . . . . . . . . . . . . . . . . . . . . . . . . . . . . . . . . . . . . . . 9,311 8,700 8,282Central Group . . . . . . . . . . . . . . . . . . . . . . . . . . . . . . . . . . . . . . . . . 6,982 6,727 6,570Corporate and other . . . . . . . . . . . . . . . . . . . . . . . . . . . . . . . . . . . . 1,165 984 877
$29,682 $28,035 $26,776
Equity in earnings of affiliates:National Group . . . . . . . . . . . . . . . . . . . . . . . . . . . . . . . . . . . . . . . . $ (7) $ (4) $ (4)Southwest Group . . . . . . . . . . . . . . . . . . . . . . . . . . . . . . . . . . . . . . (251) (277) (240)Central Group . . . . . . . . . . . . . . . . . . . . . . . . . . . . . . . . . . . . . . . . . — (1) (2)Corporate and other . . . . . . . . . . . . . . . . . . . . . . . . . . . . . . . . . . . . — — —
$ (258) $ (282) $ (246)
Adjusted segment EBITDA:National Group . . . . . . . . . . . . . . . . . . . . . . . . . . . . . . . . . . . . . . . . $ 2,531 $ 2,431 $ 2,250Southwest Group . . . . . . . . . . . . . . . . . . . . . . . . . . . . . . . . . . . . . . 2,370 2,254 2,089Central Group . . . . . . . . . . . . . . . . . . . . . . . . . . . . . . . . . . . . . . . . . 1,285 1,272 1,325Corporate and other . . . . . . . . . . . . . . . . . . . . . . . . . . . . . . . . . . . . (125) (89) (192)
$ 6,061 $ 5,868 $ 5,472
Depreciation and amortization:National Group . . . . . . . . . . . . . . . . . . . . . . . . . . . . . . . . . . . . . . . . $ 512 $ 508 $ 516Southwest Group . . . . . . . . . . . . . . . . . . . . . . . . . . . . . . . . . . . . . . 464 427 426Central Group . . . . . . . . . . . . . . . . . . . . . . . . . . . . . . . . . . . . . . . . . 347 352 352Corporate and other . . . . . . . . . . . . . . . . . . . . . . . . . . . . . . . . . . . . 142 134 131
$ 1,465 $ 1,421 $ 1,425
F-36

HCA HOLDINGS, INC.
NOTES TO CONSOLIDATED FINANCIAL STATEMENTS— (Continued)
NOTE 15 — SEGMENT AND GEOGRAPHIC INFORMATION (Continued)
For the Years Ended December 31,
2011 2010 2009
Adjusted segment EBITDA . . . . . . . . . . . . . . . . . . . . . . . . . . . . . . . . $ 6,061 $ 5,868 $ 5,472Depreciation and amortization . . . . . . . . . . . . . . . . . . . . . . . . . . . . 1,465 1,421 1,425Interest expense . . . . . . . . . . . . . . . . . . . . . . . . . . . . . . . . . . . . . . . 2,037 2,097 1,987Losses (gains) on sales of facilities . . . . . . . . . . . . . . . . . . . . . . . . (142) (4) 15Gain on acquisition of controlling interest in equityinvestment . . . . . . . . . . . . . . . . . . . . . . . . . . . . . . . . . . . . . . . . . (1,522) — —
Impairments of long-lived assets . . . . . . . . . . . . . . . . . . . . . . . . . . — 123 43Losses on retirement of debt . . . . . . . . . . . . . . . . . . . . . . . . . . . . . 481 — —Termination of management agreement . . . . . . . . . . . . . . . . . . . . . 181 — —
Income before income taxes . . . . . . . . . . . . . . . . . . . . . . . . . . . . . . . . $ 3,561 $ 2,231 $ 2,002
As of December 31,
2011 2010
Assets:National Group . . . . . . . . . . . . . . . . . . . . . . . . . . . . . . . . . . . . . . . . . . . . . . . . . $ 7,827 $ 7,345Southwest Group . . . . . . . . . . . . . . . . . . . . . . . . . . . . . . . . . . . . . . . . . . . . . . . . 9,908 6,747Central Group . . . . . . . . . . . . . . . . . . . . . . . . . . . . . . . . . . . . . . . . . . . . . . . . . . 5,187 5,271Corporate and other . . . . . . . . . . . . . . . . . . . . . . . . . . . . . . . . . . . . . . . . . . . . . . 3,976 4,489
$26,898 $23,852
NationalGroup
SouthwestGroup
CentralGroup
Corporateand Other Total
Goodwill and other intangible assets:Balance at December 31, 2010 . . . . . . . . . . . . $787 $ 636 $1,019 $251 $2,693Acquisitions . . . . . . . . . . . . . . . . . . . . . . . . . 32 2,533 — 33 2,598Dispositions . . . . . . . . . . . . . . . . . . . . . . . . . (19) (5) — — (24)Foreign currency translation and other . . . . — (4) — (12) (16)
Balance at December 31, 2011 . . . . . . . . . . . . $800 $3,160 $1,019 $272 $5,251
F-37

HCA HOLDINGS, INC.
NOTES TO CONSOLIDATED FINANCIAL STATEMENTS— (Continued)
NOTE 16 — OTHER COMPREHENSIVE LOSS
The components of accumulated other comprehensive loss are as follows (dollars in millions):
UnrealizedGains (Losses) onAvailable-for-Sale
Securities
ForeignCurrencyTranslationAdjustments
DefinedBenefitPlans
Changein FairValue ofDerivativeInstruments Total
Balances at December 31, 2008 . . . . . . . . . . . . . . . . $(30) $(28) $(106) $(440) $(604)Unrealized gains on available-for-sale securities,net of $25 of income taxes . . . . . . . . . . . . . . . . 44 — — — 44
Foreign currency translation adjustments, net of$14 of income taxes . . . . . . . . . . . . . . . . . . . . . — 25 — — 25
Defined benefit plans, net of $8 income taxbenefit . . . . . . . . . . . . . . . . . . . . . . . . . . . . . . . . — — (10) — (10)
Change in fair value of derivative instruments,net of $76 income tax benefit . . . . . . . . . . . . . . — — — (133) (133)
Expense reclassified into operations from othercomprehensive income, net of $6 and $127,respectively, income tax benefits . . . . . . . . . . . — — 10 218 228
Balances at December 31, 2009 . . . . . . . . . . . . . . . . 14 (3) (106) (355) (450)Unrealized gains on available-for-sale securities,net of $1 of income taxes . . . . . . . . . . . . . . . . . 1 — — — 1
Foreign currency translation adjustments, net of$9 income tax benefit . . . . . . . . . . . . . . . . . . . . — (16) — — (16)
Defined benefit plans, net of $28 income taxbenefit . . . . . . . . . . . . . . . . . . . . . . . . . . . . . . . . — — (48) — (48)
Change in fair value of derivative instruments,net of $94 income tax benefit . . . . . . . . . . . . . . — — — (161) (161)
(Income) expense reclassified into operationsfrom other comprehensive income, net of $(4),$7 and $140, respectively, income (taxes)benefits . . . . . . . . . . . . . . . . . . . . . . . . . . . . . . . (9) — 11 244 246
Balances at December 31, 2010 . . . . . . . . . . . . . . . . 6 (19) (143) (272) (428)Unrealized gains on available-for-sale securities,net of $1 of income taxes . . . . . . . . . . . . . . . . . 1 — — — 1
Foreign currency translation adjustments, net of$3 income tax benefit . . . . . . . . . . . . . . . . . . . . — (6) — — (6)
Defined benefit plans, net of $25 income taxbenefit . . . . . . . . . . . . . . . . . . . . . . . . . . . . . . . . — — (42) — (42)
Change in fair value of derivative instruments,net of $114 income tax benefit . . . . . . . . . . . . . — — — (197) (197)
Expense reclassified into operations from othercomprehensive income, net of $9 and $125,respectively, income tax benefits . . . . . . . . . . . — — 16 216 232
Balances at December 31, 2011 . . . . . . . . . . . . . . . . $ 7 $(25) $(169) $(253) $(440)
F-38

HCA HOLDINGS, INC.
NOTES TO CONSOLIDATED FINANCIAL STATEMENTS— (Continued)
NOTE 17 — ACCRUED EXPENSES AND ALLOWANCE FOR DOUBTFUL ACCOUNTS
A summary of other accrued expenses at December 31 follows (dollars in millions):
2011 2010
Professional liability risks . . . . . . . . . . . . . . . . . . . . . . . . . . . . . . . . . . . . . . . . . . . . . $ 298 $ 268Interest . . . . . . . . . . . . . . . . . . . . . . . . . . . . . . . . . . . . . . . . . . . . . . . . . . . . . . . . . . . . 383 309Taxes other than income . . . . . . . . . . . . . . . . . . . . . . . . . . . . . . . . . . . . . . . . . . . . . . 232 197Other . . . . . . . . . . . . . . . . . . . . . . . . . . . . . . . . . . . . . . . . . . . . . . . . . . . . . . . . . . . . . 672 471
$1,585 $1,245
A summary of activity for the allowance of doubtful accounts follows (dollars in millions):
Balanceat
Beginningof Year
Provisionfor
DoubtfulAccounts
AccountsWrittenoff,
Net ofRecoveries
Balanceat Endof Year
Allowance for doubtful accounts:Year ended December 31, 2009 . . . . . . . . . . . . . . . . . $4,741 $3,276 $(3,157) $4,860Year ended December 31, 2010 . . . . . . . . . . . . . . . . . 4,860 2,648 (3,569) 3,939Year ended December 31, 2011 . . . . . . . . . . . . . . . . . 3,939 2,824 (2,657) 4,106
NOTE 18 — SUPPLEMENTAL CONDENSED CONSOLIDATING FINANCIAL INFORMATION ANDOTHER COLLATERAL-RELATED INFORMATION
On November 22, 2010, HCA Inc. reorganized by creating a new holding company structure. HCAHoldings, Inc. became the new parent company, and HCA Inc. is now HCA Holdings, Inc.’s wholly-owneddirect subsidiary. On November 23, 2010, HCA Holdings, Inc. issued the 2021 Notes. These notes are seniorunsecured obligations and are not guaranteed by any of our subsidiaries.
The senior secured credit facilities and senior secured notes described in Note 10 are fully andunconditionally guaranteed by substantially all existing and future, direct and indirect, wholly-owned materialdomestic subsidiaries that are “Unrestricted Subsidiaries” under our Indenture dated December 16, 1993 (exceptfor certain special purpose subsidiaries that only guarantee and pledge their assets under our ABL credit facility).
Our condensed consolidating balance sheets at December 31, 2011 and 2010 and condensed consolidatingstatements of income and cash flows for each of the three years in the period ended December 31, 2011,segregating HCA Holdings, Inc. issuer, HCA Inc. issuer, the subsidiary guarantors, the subsidiary non-guarantorsand eliminations, follow.
F-39

HCA HOLDINGS, INC.
NOTES TO CONSOLIDATED FINANCIAL STATEMENTS— (Continued)
NOTE 18 — SUPPLEMENTAL CONDENSED CONSOLIDATING FINANCIAL INFORMATION ANDOTHER COLLATERAL-RELATED INFORMATION (Continued)
HCA HOLDINGS, INC.CONDENSED CONSOLIDATING INCOME STATEMENT
For The Year Ended December 31, 2011(Dollars in millions)
HCAHoldings, Inc.
IssuerHCA Inc.Issuer
SubsidiaryGuarantors
SubsidiaryNon-
Guarantors EliminationsCondensedConsolidated
Revenues before provision fordoubtful accounts . . . . . . . . . . . . . $ — $ — $18,126 $14,380 $ — $32,506
Provision for doubtful accounts . . . . — — 1,644 1,180 — 2,824
Revenues . . . . . . . . . . . . . . . . . . . . . — — 16,482 13,200 — 29,682
Salaries and benefits . . . . . . . . . . . . — — 7,584 5,856 — 13,440Supplies . . . . . . . . . . . . . . . . . . . . . . — — 2,851 2,328 — 5,179Other operating expenses . . . . . . . . . — 4 2,741 2,725 — 5,470Electronic health record incentiveincome . . . . . . . . . . . . . . . . . . . . . — — (126) (84) — (210)
Equity in earnings of affiliates . . . . . (2,543) — (86) (172) 2,543 (258)Depreciation and amortization . . . . . — — 777 688 — 1,465Interest expense . . . . . . . . . . . . . . . . 120 2,390 (342) (131) — 2,037Gains on sales of facilities . . . . . . . . — — (127) (15) — (142)Gain on acquisition of controllinginterest in equity investment . . . . — — — (1,522) — (1,522)
Losses on retirement of debt . . . . . . — 481 — — — 481Termination of managementagreement . . . . . . . . . . . . . . . . . . . — 181 — — — 181
Management fees . . . . . . . . . . . . . . . — — (491) 491 — —
(2,423) 3,056 12,781 10,164 2,543 26,121
Income (loss) before incometaxes . . . . . . . . . . . . . . . . . . . . . . . 2,423 (3,056) 3,701 3,036 (2,543) 3,561
Provision (benefit) for incometaxes . . . . . . . . . . . . . . . . . . . . . . . (42) (1,068) 1,271 558 — 719
Net income (loss) . . . . . . . . . . . . . . . 2,465 (1,988) 2,430 2,478 (2,543) 2,842Net income attributable tononcontrolling interests . . . . . . . . — — 63 314 — 377
Net income (loss) attributable toHCA Holdings, Inc. . . . . . . . . . . . $ 2,465 $(1,988) $ 2,367 $ 2,164 $(2,543) $ 2,465
F-40

HCA HOLDINGS, INC.
NOTES TO CONSOLIDATED FINANCIAL STATEMENTS— (Continued)
NOTE 18 — SUPPLEMENTAL CONDENSED CONSOLIDATING FINANCIAL INFORMATION ANDOTHER COLLATERAL-RELATED INFORMATION (Continued)
HCA HOLDINGS, INC.CONDENSED CONSOLIDATING INCOME STATEMENT
For The Year Ended December 31, 2010(Dollars in millions)
HCAHoldings, Inc.
IssuerHCA Inc.Issuer
SubsidiaryGuarantors
SubsidiaryNon-
Guarantors EliminationsCondensedConsolidated
Revenues before provision fordoubtful accounts . . . . . . . . . . . . . $ — $ — $17,647 $13,036 $ — $30,683
Provision for doubtful accounts . . . . — — 1,632 1,016 — 2,648
Revenues . . . . . . . . . . . . . . . . . . . . . — — 16,015 12,020 — 28,035
Salaries and benefits . . . . . . . . . . . . — — 7,315 5,169 — 12,484Supplies . . . . . . . . . . . . . . . . . . . . . . — — 2,825 2,136 — 4,961Other operating expenses . . . . . . . . . — 5 2,634 2,365 — 5,004Equity in earnings of affiliates . . . . . (1,215) — (107) (175) 1,215 (282)Depreciation and amortization . . . . . — — 782 639 — 1,421Interest expense . . . . . . . . . . . . . . . . 12 2,700 (761) 146 — 2,097Gains on sales of facilities . . . . . . . . — — — (4) — (4)Impairments of long-lived assets . . . — — 58 65 — 123Management fees . . . . . . . . . . . . . . . — — (454) 454 — —
(1,203) 2,705 12,292 10,795 1,215 25,804
Income (loss) before incometaxes . . . . . . . . . . . . . . . . . . . . . . . 1,203 (2,705) 3,723 1,225 (1,215) 2,231
Provision (benefit) for incometaxes . . . . . . . . . . . . . . . . . . . . . . . (4) (955) 1,299 318 — 658
Net income (loss) . . . . . . . . . . . . . . . 1,207 (1,750) 2,424 907 (1,215) 1,573Net income attributable tononcontrolling interests . . . . . . . . — — 44 322 — 366
Net income (loss) attributable toHCA Holdings, Inc. . . . . . . . . . . . $ 1,207 $(1,750) $ 2,380 $ 585 $(1,215) $ 1,207
F-41

HCA HOLDINGS, INC.
NOTES TO CONSOLIDATED FINANCIAL STATEMENTS— (Continued)
NOTE 18 — SUPPLEMENTAL CONDENSED CONSOLIDATING FINANCIAL INFORMATION ANDOTHER COLLATERAL-RELATED INFORMATION (Continued)
HCA HOLDINGS, INC.CONDENSED CONSOLIDATING INCOME STATEMENT
For The Year Ended December 31, 2009(Dollars in millions)
HCA Inc.Issuer
SubsidiaryGuarantors
SubsidiaryNon-
Guarantors EliminationsCondensedConsolidated
Revenues before provision for doubtfulaccounts . . . . . . . . . . . . . . . . . . . . . . . . . . . . . . . $ — $17,584 $12,468 $ — $30,052
Provision for doubtful accounts . . . . . . . . . . . . . . . — 2,043 1,233 — 3,276
Revenues . . . . . . . . . . . . . . . . . . . . . . . . . . . . . . . . . — 15,541 11,235 — 26,776
Salaries and benefits . . . . . . . . . . . . . . . . . . . . . . . . — 7,149 4,809 — 11,958Supplies . . . . . . . . . . . . . . . . . . . . . . . . . . . . . . . . . . — 2,846 2,022 — 4,868Other operating expenses . . . . . . . . . . . . . . . . . . . . 14 2,497 2,213 — 4,724Equity in earnings of affiliates . . . . . . . . . . . . . . . . (2,540) (95) (151) 2,540 (246)Depreciation and amortization . . . . . . . . . . . . . . . . — 787 638 — 1,425Interest expense . . . . . . . . . . . . . . . . . . . . . . . . . . . . 2,356 (500) 131 — 1,987Losses (gains) on sales of facilities . . . . . . . . . . . . — 17 (2) — 15Impairments of long-lived assets . . . . . . . . . . . . . . — 34 9 — 43Management fees . . . . . . . . . . . . . . . . . . . . . . . . . . — (443) 443 — —
(170) 12,292 10,112 2,540 24,774
Income before income taxes . . . . . . . . . . . . . . . . . . 170 3,249 1,123 (2,540) 2,002Provision (benefit) for income taxes . . . . . . . . . . . . (884) 1,189 322 — 627
Net income . . . . . . . . . . . . . . . . . . . . . . . . . . . . . . . 1,054 2,060 801 (2,540) 1,375Net income attributable to noncontrollinginterests . . . . . . . . . . . . . . . . . . . . . . . . . . . . . . . . — 61 260 — 321
Net income attributable to HCA Holdings, Inc. . . . $ 1,054 $ 1,999 $ 541 $(2,540) $ 1,054
F-42

HCA HOLDINGS, INC.
NOTES TO CONSOLIDATED FINANCIAL STATEMENTS— (Continued)
NOTE 18 — SUPPLEMENTAL CONDENSED CONSOLIDATING FINANCIAL INFORMATION ANDOTHER COLLATERAL-RELATED INFORMATION (Continued)
HCA HOLDINGS, INC.CONDENSED CONSOLIDATING BALANCE SHEET
DECEMBER 31, 2011(Dollars in millions)
HCAHoldings, Inc.
IssuerHCA Inc.Issuer
SubsidiaryGuarantors
SubsidiaryNon-
Guarantors EliminationsCondensedConsolidated
ASSETSCurrent assets:Cash and cash equivalents . . . . . . . . . $ — $ — $ 115 $ 258 $ — $ 373Accounts receivable, net . . . . . . . . . . — — 2,429 2,104 — 4,533Inventories . . . . . . . . . . . . . . . . . . . . . — — 602 452 — 1,054Deferred income taxes . . . . . . . . . . . . 594 — — — — 594Other . . . . . . . . . . . . . . . . . . . . . . . . . . 50 — 184 445 — 679
644 — 3,330 3,259 — 7,233
Property and equipment, net . . . . . . . . . — — 7,088 5,746 — 12,834Investments of insurance subsidiaries . . — — — 548 — 548Investments in and advances toaffiliates . . . . . . . . . . . . . . . . . . . . . . . — — 15 86 — 101
Goodwill and other intangible assets . . . — — 1,605 3,646 — 5,251Deferred loan costs . . . . . . . . . . . . . . . . . 22 268 — — — 290Investments in and advances tosubsidiaries . . . . . . . . . . . . . . . . . . . . . 16,825 — — — (16,825) —
Other . . . . . . . . . . . . . . . . . . . . . . . . . . . 450 — 21 170 — 641
$17,941 $ 268 $ 12,059 $13,455 $(16,825) $26,898
LIABILITIES ANDSTOCKHOLDERS’ (DEFICIT)
EQUITYCurrent liabilities:Accounts payable . . . . . . . . . . . . . . . . $ — $ — $ 899 $ 698 $ — $ 1,597Accrued salaries . . . . . . . . . . . . . . . . . — — 568 397 — 965Other accrued expenses . . . . . . . . . . . 15 367 449 754 — 1,585Long-term debt due within oneyear . . . . . . . . . . . . . . . . . . . . . . . . . — 1,347 28 32 — 1,407
15 1,714 1,944 1,881 — 5,554
Long-term debt . . . . . . . . . . . . . . . . . . . . 1,525 23,454 110 556 — 25,645Intercompany balances . . . . . . . . . . . . . . 24,121 (12,814) (15,183) 3,876 — —Professional liability risks . . . . . . . . . . . — — — 993 — 993Income taxes and other liabilities . . . . . . 538 415 556 211 — 1,720
26,199 12,769 (12,573) 7,517 — 33,912
Stockholders’ (deficit) equityattributable to HCA Holdings, Inc. . . (8,258) (12,501) 24,534 4,792 (16,825) (8,258)
Noncontrolling interests . . . . . . . . . . . . . — — 98 1,146 — 1,244
(8,258) (12,501) 24,632 5,938 (16,825) (7,014)
$17,941 $ 268 $ 12,059 $13,455 $(16,825) $26,898
F-43

HCA HOLDINGS, INC.
NOTES TO CONSOLIDATED FINANCIAL STATEMENTS— (Continued)
NOTE 18 — SUPPLEMENTAL CONDENSED CONSOLIDATING FINANCIAL INFORMATION ANDOTHER COLLATERAL-RELATED INFORMATION (Continued)
HCA HOLDINGS, INC.CONDENSED CONSOLIDATING BALANCE SHEET
DECEMBER 31, 2010(Dollars in millions)
HCAHoldings, Inc.
IssuerHCA Inc.Issuer
SubsidiaryGuarantors
SubsidiaryNon-
Guarantors EliminationsCondensedConsolidated
ASSETSCurrent assets:Cash and cash equivalents . . . . . . . $ 6 $ — $ 156 $ 249 $ — $ 411Accounts receivable, net . . . . . . . . . — — 2,214 1,618 — 3,832Inventories . . . . . . . . . . . . . . . . . . . — — 547 350 — 897Deferred income taxes . . . . . . . . . . 931 — — — — 931Other . . . . . . . . . . . . . . . . . . . . . . . . 202 — 223 423 — 848
1,139 — 3,140 2,640 — 6,919Property and equipment, net . . . . . . . . — — 6,817 4,535 — 11,352Investments of insurancesubsidiaries . . . . . . . . . . . . . . . . . . . — — — 642 — 642
Investments in and advances toaffiliates . . . . . . . . . . . . . . . . . . . . . — — 248 621 — 869
Goodwill and other intangibleassets . . . . . . . . . . . . . . . . . . . . . . . . — — 1,635 1,058 — 2,693
Deferred loan costs . . . . . . . . . . . . . . . 23 351 — — — 374Investments in and advances tosubsidiaries . . . . . . . . . . . . . . . . . . . 14,282 — — — (14,282) —
Other . . . . . . . . . . . . . . . . . . . . . . . . . . 776 39 21 167 — 1,003
$ 16,220 $ 390 $ 11,861 $9,663 $(14,282) $ 23,852
LIABILITIES ANDSTOCKHOLDERS’ (DEFICIT)
EQUITYCurrent liabilities:Accounts payable . . . . . . . . . . . . . . $ — $ — $ 919 $ 618 $ — $ 1,537Accrued salaries . . . . . . . . . . . . . . . — — 556 339 — 895Other accrued expenses . . . . . . . . . 12 296 328 609 — 1,245Long-term debt due within oneyear . . . . . . . . . . . . . . . . . . . . . . . — 554 12 26 — 592
12 850 1,815 1,592 — 4,269Long-term debt . . . . . . . . . . . . . . . . . . 1,525 25,758 95 255 — 27,633Intercompany balances . . . . . . . . . . . . 25,985 (16,130) (12,833) 2,978 — —Professional liability risks . . . . . . . . . — — — 995 — 995Income taxes and other liabilities . . . . 483 425 505 195 — 1,608
28,005 10,903 (10,418) 6,015 — 34,505Equity securities with contingentredemption rights . . . . . . . . . . . . . . 141 — — — — 141
Stockholders’ (deficit) equityattributable to HCA Holdings,Inc. . . . . . . . . . . . . . . . . . . . . . . . . . (11,926) (10,513) 22,167 2,628 (14,282) (11,926)
Noncontrolling interests . . . . . . . . . . . — — 112 1,020 — 1,132
(11,926) (10,513) 22,279 3,648 (14,282) (10,794)
$ 16,220 $ 390 $ 11,861 $9,663 $(14,282) $ 23,852
F-44

HCA HOLDINGS, INC.
NOTES TO CONSOLIDATED FINANCIAL STATEMENTS— (Continued)
NOTE 18 — SUPPLEMENTAL CONDENSED CONSOLIDATING FINANCIAL INFORMATION ANDOTHER COLLATERAL-RELATED INFORMATION (Continued)
HCA HOLDINGS, INC.CONDENSED CONSOLIDATING STATEMENT OF CASH FLOWS
For The Year Ended December 31, 2011(Dollars in millions)
HCAHoldings, Inc.
IssuerHCA Inc.Issuer
SubsidiaryGuarantors
SubsidiaryNon-
Guarantors EliminationsCondensedConsolidated
Cash flows from operating activities:Net income (loss) . . . . . . . . . . . . . . . . . . . . $ 2,465 $(1,988) $ 2,430 $ 2,478 $(2,543) $ 2,842Adjustments to reconcile net income (loss)to net cash provided by (used in)operating activities: . . . . . . . . . . . . . . . . .Change in operating assets andliabilities . . . . . . . . . . . . . . . . . . . . . . . 6 71 (1,755) (1,275) — (2,953)
Provision for doubtful accounts . . . . . . . — — 1,644 1,180 — 2,824Depreciation and amortization . . . . . . . . — — 777 688 — 1,465Income taxes . . . . . . . . . . . . . . . . . . . . . . 912 — — — — 912Gains on sales of facilities . . . . . . . . . . . — — (127) (15) — (142)Gain on acquisition of controllinginterest in equity investment . . . . . . . . — — — (1,522) — (1,522)
Losses on retirement of debt . . . . . . . . . . — 481 — — — 481Amortization of deferred loan costs . . . . — 70 — — — 70Share-based compensation . . . . . . . . . . . 26 — — — — 26Pay-in-kind interest . . . . . . . . . . . . . . . . . — (78) — — — (78)Equity in earnings of affiliates . . . . . . . . (2,543) — — — 2,543 —Other . . . . . . . . . . . . . . . . . . . . . . . . . . . . — 9 — (1) — 8
Net cash provided by (used in)operating activities . . . . . . . . . . . . . 866 (1,435) 2,969 1,533 — 3,933
Cash flows from investing activities:Purchase of property and equipment . . . . . — — (910) (769) — (1,679)Acquisition of hospitals and health careentities . . . . . . . . . . . . . . . . . . . . . . . . . . . — — (142) (1,540) — (1,682)
Disposal of hospitals and health careentities . . . . . . . . . . . . . . . . . . . . . . . . . . . — — 200 81 — 281
Change in investments . . . . . . . . . . . . . . . . — — 34 46 — 80Other . . . . . . . . . . . . . . . . . . . . . . . . . . . . . . — — — 5 — 5
Net cash used in investing activities . . . . — — (818) (2,177) — (2,995)
Cash flows from financing activities:Issuances of long-term debt . . . . . . . . . . . . — 5,500 — — — 5,500Net change in revolving bank creditfacilities . . . . . . . . . . . . . . . . . . . . . . . . . — (449) — — — (449)
Repayment of long-term debt . . . . . . . . . . . — (6,577) (17) (46) — (6,640)Distributions to noncontrolling interests . . — — (77) (301) — (378)Payment of debt issuance costs . . . . . . . . . — (92) — — — (92)Issuance of common stock . . . . . . . . . . . . . 2,506 — — — — 2,506Repurchase of common stock . . . . . . . . . . . (1,503) — — — — (1,503)Distributions to stockholders . . . . . . . . . . . (31) — — — — (31)Income tax benefits . . . . . . . . . . . . . . . . . . . 63 — — — — 63Changes in intercompany balances withaffiliates, net . . . . . . . . . . . . . . . . . . . . . . (1,918) 3,053 (2,098) 963 — —
Other . . . . . . . . . . . . . . . . . . . . . . . . . . . . . . 11 — — 37 — 48
Net cash provided by (used in) financingactivities . . . . . . . . . . . . . . . . . . . . . . . (872) 1,435 (2,192) 653 — (976)
Change in cash and cash equivalents . . . . . (6) — (41) 9 — (38)Cash and cash equivalents at beginning ofperiod . . . . . . . . . . . . . . . . . . . . . . . . . . . 6 — 156 249 — 411
Cash and cash equivalents at end ofperiod . . . . . . . . . . . . . . . . . . . . . . . . . . . $ — $ — $ 115 $ 258 $ — $ 373
F-45

HCA HOLDINGS, INC.
NOTES TO CONSOLIDATED FINANCIAL STATEMENTS— (Continued)
NOTE 18 — SUPPLEMENTAL CONDENSED CONSOLIDATING FINANCIAL INFORMATION ANDOTHER COLLATERAL-RELATED INFORMATION (Continued)
HCA HOLDINGS, INC.CONDENSED CONSOLIDATING STATEMENT OF CASH FLOWS
For The Year Ended December 31, 2010(Dollars in millions)
HCAHoldings, Inc.
IssuerHCA Inc.Issuer
SubsidiaryGuarantors
SubsidiaryNon-
Guarantors EliminationsCondensedConsolidated
Cash flows from operating activities:Net income (loss) . . . . . . . . . . . . . . . . . . . . $ 1,207 $(1,750) $ 2,424 $ 907 $(1,215) $ 1,573Adjustments to reconcile net income (loss)to net cash provided by (used in)operating activities: . . . . . . . . . . . . . . . . .
Change in operating assets andliabilities . . . . . . . . . . . . . . . . . . . . . . . . . 12 13 (1,759) (1,113) — (2,847)
Provision for doubtful accounts . . . . . . . . . — — 1,632 1,016 — 2,648Depreciation and amortization . . . . . . . . . . — — 782 639 — 1,421Income taxes . . . . . . . . . . . . . . . . . . . . . . . . 27 — — — — 27Gains on sales of facilities . . . . . . . . . . . . . — — — (4) — (4)Impairments of long-lived assets . . . . . . . . — — 58 65 — 123Amortization of deferred loan costs . . . . . . — 81 — — — 81Share-based compensation . . . . . . . . . . . . . 32 — — — — 32Equity in earnings of affiliates . . . . . . . . . . (1,215) — — — 1,215 —Other . . . . . . . . . . . . . . . . . . . . . . . . . . . . . . — 31 — — — 31
Net cash provided by (used in) operatingactivities . . . . . . . . . . . . . . . . . . . . . . . 63 (1,625) 3,137 1,510 — 3,085
Cash flows from investing activities:Purchase of property and equipment . . . . . — — (602) (723) — (1,325)Acquisition of hospitals and health careentities . . . . . . . . . . . . . . . . . . . . . . . . . . . — — (21) (212) — (233)
Disposal of hospitals and health careentities . . . . . . . . . . . . . . . . . . . . . . . . . . . — — 29 8 — 37
Change in investments . . . . . . . . . . . . . . . . — — 1 471 — 472Other . . . . . . . . . . . . . . . . . . . . . . . . . . . . . . — — (3) 13 — 10
Net cash used in investing activities . . . . — — (596) (443) — (1,039)
Cash flows from financing activities:Issuances of long-term debt . . . . . . . . . . . . 1,525 1,387 — — — 2,912Net change in revolving bank creditfacilities . . . . . . . . . . . . . . . . . . . . . . . . . — 1,889 — — — 1,889
Repayment of long-term debt . . . . . . . . . . . — (2,164) (32) (72) — (2,268)Distributions to noncontrolling interests . . — — (61) (281) — (342)Contributions from noncontrollinginterests . . . . . . . . . . . . . . . . . . . . . . . . . . — — — 57 — 57
Payment of debt issuance costs . . . . . . . . . (23) (27) — — — (50)Distributions to stockholders . . . . . . . . . . . (4,257) — — — — (4,257)Income tax benefits . . . . . . . . . . . . . . . . . . . 114 — — — — 114Changes in intercompany balances withaffiliates, net . . . . . . . . . . . . . . . . . . . . . . 2,590 556 (2,387) (759) — —
Other . . . . . . . . . . . . . . . . . . . . . . . . . . . . . . (6) (16) — 20 — (2)
Net cash provided by (used in) financingactivities . . . . . . . . . . . . . . . . . . . . . . . (57) 1,625 (2,480) (1,035) — (1,947)
Change in cash and cash equivalents . . . . . 6 — 61 32 — 99Cash and cash equivalents at beginning ofperiod . . . . . . . . . . . . . . . . . . . . . . . . . . . — — 95 217 — 312
Cash and cash equivalents at end ofperiod . . . . . . . . . . . . . . . . . . . . . . . . . . . $ 6 $ — $ 156 $ 249 $ — $ 411
F-46

HCA HOLDINGS, INC.
NOTES TO CONSOLIDATED FINANCIAL STATEMENTS— (Continued)
NOTE 18 — SUPPLEMENTAL CONDENSED CONSOLIDATING FINANCIAL INFORMATION ANDOTHER COLLATERAL-RELATED INFORMATION (Continued)
HCA HOLDINGS, INC.CONDENSED CONSOLIDATING STATEMENT OF CASH FLOWS
For The Year Ended December 31, 2009(Dollars in millions)
HCA Inc.Issuer
SubsidiaryGuarantors
SubsidiaryNon-
Guarantors EliminationsCondensedConsolidated
Cash flows from operating activities:Net income . . . . . . . . . . . . . . . . . . . . . . . . . . . . . . . . . . . . $ 1,054 $ 2,060 $ 801 $(2,540) $ 1,375Adjustments to reconcile net income to net cashprovided by (used in) operating activities:Change in operating assets and liabilities . . . . . . . . . . 90 (1,882) (1,299) — (3,091)Provision for doubtful accounts . . . . . . . . . . . . . . . . . . — 2,043 1,233 — 3,276Depreciation and amortization . . . . . . . . . . . . . . . . . . . — 787 638 — 1,425Income taxes . . . . . . . . . . . . . . . . . . . . . . . . . . . . . . . . (520) — — — (520)Losses (gains) on sales of facilities . . . . . . . . . . . . . . . — 17 (2) — 15Impairments of long-lived assets . . . . . . . . . . . . . . . . . — 34 9 — 43Amortization of deferred loan costs . . . . . . . . . . . . . . . 80 — — — 80Share-based compensation . . . . . . . . . . . . . . . . . . . . . . 40 — — — 40Pay-in-kind interest . . . . . . . . . . . . . . . . . . . . . . . . . . . 58 — — — 58Equity in earnings of affiliates . . . . . . . . . . . . . . . . . . . (2,540) — — 2,540 —Other . . . . . . . . . . . . . . . . . . . . . . . . . . . . . . . . . . . . . . 50 (2) (2) — 46
Net cash provided by (used in) operatingactivities . . . . . . . . . . . . . . . . . . . . . . . . . . . . . . . . (1,688) 3,057 1,378 — 2,747
Cash flows from investing activities:Purchase of property and equipment . . . . . . . . . . . . . . — (720) (597) — (1,317)Acquisition of hospitals and health care entities . . . . . — (38) (23) — (61)Disposal of hospitals and health care entities . . . . . . . — 21 20 — 41Change in investments . . . . . . . . . . . . . . . . . . . . . . . . . — (7) 310 — 303Other . . . . . . . . . . . . . . . . . . . . . . . . . . . . . . . . . . . . . . — — (1) — (1)
Net cash used in investing activities . . . . . . . . . . . . — (744) (291) — (1,035)
Cash flows from financing activities:Issuances of long-term debt . . . . . . . . . . . . . . . . . . . . . 2,979 — — — 2,979Net change in revolving bank credit facilities . . . . . . . (1,335) — — — (1,335)Repayment of long-term debt . . . . . . . . . . . . . . . . . . . (2,972) (7) (124) — (3,103)Distributions to noncontrolling interests . . . . . . . . . . . — (70) (260) — (330)Payment of debt issuance costs . . . . . . . . . . . . . . . . . . (70) — — — (70)Changes in intercompany balances with affiliates,net . . . . . . . . . . . . . . . . . . . . . . . . . . . . . . . . . . . . . . . 3,107 (2,275) (832) — —
Other . . . . . . . . . . . . . . . . . . . . . . . . . . . . . . . . . . . . . . (21) — 15 — (6)
Net cash provided by (used in) financingactivities . . . . . . . . . . . . . . . . . . . . . . . . . . . . . . . . 1,688 (2,352) (1,201) — (1,865)
Change in cash and cash equivalents . . . . . . . . . . . . . . — (39) (114) — (153)Cash and cash equivalents at beginning of period . . . . — 134 331 — 465
Cash and cash equivalents at end of period . . . . . . . . . $ — $ 95 $ 217 $ — $ 312
F-47

HCA HOLDINGS, INC.
NOTES TO CONSOLIDATED FINANCIAL STATEMENTS— (Continued)
NOTE 18 — SUPPLEMENTAL CONDENSED CONSOLIDATING FINANCIAL INFORMATION ANDOTHER COLLATERAL-RELATED INFORMATION (Continued)
Healthtrust, Inc. — The Hospital Company (“Healthtrust”) is the first-tier subsidiary of HCA Inc. Thecommon stock of Healthtrust has been pledged as collateral for the senior secured credit facilities and seniorsecured notes described in Note 10. Rule 3-16 of Regulation S-X under the Securities Act requires the filing ofseparate financial statements for any affiliate of the registrant whose securities constitute a substantial portion ofthe collateral for any class of securities registered or being registered. We believe the separate financialstatements requirement applies to Healthtrust due to the pledge of its common stock as collateral for the seniorsecured notes. Due to the corporate structure relationship of HCA and Healthtrust, HCA’s operating subsidiariesare also the operating subsidiaries of Healthtrust. The corporate structure relationship, combined with theapplication of push-down accounting in Healthtrust’s consolidated financial statements related to HCA’s debtand financial instruments, results in the consolidated financial statements of Healthtrust being substantiallyidentical to the consolidated financial statements of HCA. The consolidated financial statements of HCA andHealthtrust present the identical amounts for revenues, expenses, net income, assets, liabilities, totalstockholders’ deficit, net cash provided by operating activities, net cash used in investing activities and net cashused in financing activities. Certain individual line items in the HCA consolidated statements of stockholders’deficit are combined into one line item in the Healthtrust consolidated statements of stockholder’s deficit.
Reconciliations of the HCA Holdings, Inc. Consolidated Statements of Stockholders’ Deficit presentation tothe Healthtrust, Inc. — The Hospital Company Consolidated Statements of Stockholder’s Deficit presentation forthe years ended December 31, 2011, 2010 and 2009 are as follows (dollars in millions):
2011 2010 2009
Presentation in HCA Holdings, Inc. Consolidated Statements of Stockholders’ Deficit:Share-based benefit plans . . . . . . . . . . . . . . . . . . . . . . . . . . . . . . . . . . . . . . . . . . . . . . . . . . . . . . . $ 35 $ 43 $47Reclassification of certain equity securities with contingent redemption rights . . . . . . . . . . . . . . 141 — —Other . . . . . . . . . . . . . . . . . . . . . . . . . . . . . . . . . . . . . . . . . . . . . . . . . . . . . . . . . . . . . . . . . . . . . . . 36 120 14
Presentation in Healthtrust, Inc. — The Hospital Company Consolidated Statements ofStockholder’s Deficit:Distributions from HCA Holdings, Inc., net of contributions to HCA Holdings, Inc. . . . . . . . . . $212 $163 $61
Due to the consolidated financial statements of Healthtrust being substantially identical to the consolidatedfinancial statements of HCA, except for the items presented in the tables above, the separate consolidatedfinancial statements of Healthtrust are not presented.
NOTE 19 — SUBSEQUENT EVENT
On February 3, 2012, our Board of Directors declared a distribution to the Company’s stockholders andholders of vested stock awards. The distribution will be $2.00 per share and vested stock award, or approximately$975 million in the aggregate. The distribution is expected to be paid on February 29, 2012 to holders of recordon February 16, 2012. The distribution is expected to be funded using funds available under our existing seniorsecured credit facilities. Pursuant to the terms of our stock award plans, the holders of nonvested stock optionsand stock appreciation rights will receive a $2.00 per share reduction (subject to certain tax related limitations forcertain stock awards that resulted in deferred distributions for a portion of the declared distribution, which will bepaid upon the vesting of the applicable stock award) to the exercise price of their share-based awards. Theholders of any nonvested restricted share units will be paid $2.00 per unit upon the vesting of the applicablerestricted share units.
F-48

HCA HOLDINGS, INC.QUARTERLY CONSOLIDATED FINANCIAL INFORMATION
(UNAUDITED)(Dollars in millions)
2011
First Second Third Fourth
Revenues(i) . . . . . . . . . . . . . . . . . . . . . . . . . . . . . . . . . . . . . . . . . . . . . $7,406 $7,249 $7,258 $7,769Net income . . . . . . . . . . . . . . . . . . . . . . . . . . . . . . . . . . . . . . . . . . . . . $ 334(a) $ 320(b) $ 146(c) $2,042(d)Net income attributable to HCA Holdings, Inc. . . . . . . . . . . . . . . . . . $ 240(a) $ 229(b) $ 61(c) $1,935(d)Basic earnings per share . . . . . . . . . . . . . . . . . . . . . . . . . . . . . . . . . . . $ 0.54 $ 0.44 $ 0.12 $ 4.43Diluted earnings per share . . . . . . . . . . . . . . . . . . . . . . . . . . . . . . . . . . $ 0.52 $ 0.43 $ 0.11 $ 4.25
2010
First Second Third Fourth
Revenues(i) . . . . . . . . . . . . . . . . . . . . . . . . . . . . . . . . . . . . . . . . . . . . . $6,980 $6,968 $6,926 $7,161Net income . . . . . . . . . . . . . . . . . . . . . . . . . . . . . . . . . . . . . . . . . . . . . $ 476(e) $ 378(f) $ 325(g) $ 394(h)Net income attributable to HCA Holdings, Inc. . . . . . . . . . . . . . . . . . $ 388(e) $ 293(f) $ 243(g) $ 283(h)Basic earnings per share . . . . . . . . . . . . . . . . . . . . . . . . . . . . . . . . . . . $ 0.91 $ 0.69 $ 0.57 $ 0.66Diluted earnings per share . . . . . . . . . . . . . . . . . . . . . . . . . . . . . . . . . . $ 0.89 $ 0.67 $ 0.55 $ 0.65
(a) First quarter results include $2 million of losses on sales of facilities (See NOTE 3 of the notes toconsolidated financial statements) and $149 million of costs related to the termination of managementagreement (See NOTE 1 of the notes to consolidated financial statements).
(b) Second quarter results include $1 million of losses on sales of facilities (See NOTE 3 of the notes toconsolidated financial statements) and $47 million of losses on retirement of debt (See NOTE 10 of thenotes to consolidated financial statements).
(c) Third quarter results include $1 million of losses on sales of facilities (See NOTE 3 of the notes toconsolidated financial statements) and $256 million of losses on retirement of debt (See NOTE 10 of thenotes to consolidated financial statements).
(d) Fourth quarter results include $84 million of gains on sales of facilities (See NOTE 3 of the notes toconsolidated financial statements) and $1.424 billion of gain on acquisition of controlling interest in equityinvestment (See NOTE 3 of the notes to consolidated financial statements).
(e) First quarter results include $12 million of costs related to the impairments of long-lived assets (SeeNOTE 4 of the notes to consolidated financial statements).
(f) Second quarter results include $57 million of costs related to the impairments of long-lived assets (SeeNOTE 4 of the notes to consolidated financial statements).
(g) Third quarter results include $1 million of losses on sales of facilities (See NOTE 3 of the notes toconsolidated financial statements) and $6 million of costs related to the impairments of long-lived assets(See NOTE 4 of the notes to consolidated financial statements).
(h) Fourth quarter results include $3 million of gains on sales of facilities (See NOTE 3 of the notes toconsolidated financial statements) and $2 million of costs related to the impairments of long-lived assets(See NOTE 4 of the notes to consolidated financial statements).
(i) The “Revenues” presented for each quarter of 2010 and the first and second quarters of 2011 have beenreduced by the provision for doubtful accounts for each quarter in accordance with our adoption of ASU2011-07 in the third quarter of 2011. The “Revenues” presented for the second and third quarters of 2011have been reduced for the reclassification of “Electronic health record incentive income” as a separate lineitem in our consolidated income statements (See NOTE 1 of the notes to consolidated financial statements).
F-49

[THIS PAGE INTENTIONALLY LEFT BLANK]

EXHIBIT 31.1
CERTIFICATIONS
I, Richard M. Bracken, certify that:
1. I have reviewed this annual report on Form 10-K of HCA Holdings, Inc.;
2. Based on my knowledge, this report does not contain any untrue statement of a material fact or omit tostate a material fact necessary to make the statements made, in light of the circumstances under which suchstatements were made, not misleading with respect to the period covered by this report;
3. Based on my knowledge, the financial statements, and other financial information included in this report,fairly present in all material respects the financial condition, results of operations and cash flows of the registrantas of, and for, the periods presented in this report;
4. The registrant’s other certifying officer(s) and I are responsible for establishing and maintainingdisclosure controls and procedures (as defined in Exchange Act Rules 13a-15(e) and 15d-15(e)) and internalcontrol over financial reporting (as defined in Exchange Act Rules 13a-15(f) and 15d-15(f)) for the registrant andhave:
(a) Designed such disclosure controls and procedures, or caused such disclosure controls and procedures tobe designed under our supervision, to ensure that material information relating to the registrant, including itsconsolidated subsidiaries, is made known to us by others within those entities, particularly during the period inwhich this report is being prepared;
(b) Designed such internal control over financial reporting, or caused such internal control over financialreporting to be designed under our supervision, to provide reasonable assurance regarding the reliability offinancial reporting and the preparation of financial statements for external purposes in accordance withgenerally accepted accounting principles;
(c) Evaluated the effectiveness of the registrant’s disclosure controls and procedures and presented in thisreport our conclusions about the effectiveness of the disclosure controls and procedures, as of the end of theperiod covered by this report based on such evaluation; and
(d) Disclosed in this report any change in the registrant’s internal control over financial reporting thatoccurred during the registrant’s most recent fiscal quarter (the registrant’s fourth fiscal quarter in the case of anannual report) that has materially affected, or is reasonably likely to materially affect, the registrant’s internalcontrol over financial reporting; and
5. The registrant’s other certifying officer(s) and I have disclosed, based on our most recent evaluation ofinternal control over financial reporting, to the registrant’s auditors and the audit and compliance committee ofthe registrant’s board of directors (or persons performing the equivalent functions):
(a) All significant deficiencies and material weaknesses in the design or operation of internal control overfinancial reporting which are reasonably likely to adversely affect the registrant’s ability to record, process,summarize and report financial information; and
(b) Any fraud, whether or not material, that involves management or other employees who have asignificant role in the registrant’s internal control over financial reporting.
By: /S/ RICHARD M. BRACKEN
Richard M. BrackenChairman of the Board and Chief Executive Officer
Date: February 23, 2012


EXHIBIT 31.2
CERTIFICATIONS
I, R. Milton Johnson, certify that:
1. I have reviewed this annual report of Form 10-K of HCA Holdings, Inc.;
2. Based on my knowledge, this report does not contain any untrue statement of a material fact or omit to state a material factnecessary to make the statements made, in light of the circumstances under which such statements were made, not misleading withrespect to the period covered by this report;
3. Based on my knowledge, the financial statements, and other financial information included in this report, fairly present in allmaterial respects the financial condition, results of operations and cash flows of the registrant as of, and for, the periods presented inthis report;
4. The registrant’s other certifying officer(s) and I are responsible for establishing and maintaining disclosure controls andprocedures (as defined in Exchange Act Rules 13a-15(e) and 15d-15(e)) and internal control over financial reporting (as defined inExchange Act Rules 13a-15(f) and 15d-15(f)) for the registrant and have:
(a) Designed such disclosure controls and procedures, or caused such disclosure controls and procedures to be designedunder our supervision, to ensure that material information relating to the registrant, including its consolidated subsidiaries, ismade known to us by others within those entities, particularly during the period in which this report is being prepared;
(b) Designed such internal control over financial reporting, or caused such internal control over financial reporting to bedesigned under our supervision, to provide reasonable assurance regarding the reliability of financial reporting and thepreparation of financial statements for external purposes in accordance with generally accepted accounting principles;
(c) Evaluated the effectiveness of the registrant’s disclosure controls and procedures and presented in this report ourconclusions about the effectiveness of the disclosure controls and procedures, as of the end of the period covered by this reportbased on such evaluation; and
(d) Disclosed in this report any change in the registrant’s internal control over financial reporting that occurred during theregistrant’s most recent fiscal quarter (the registrant’s fourth fiscal quarter in the case of an annual report) that has materiallyaffected, or is reasonably likely to materially affect, the registrant’s internal control over financial reporting; and
5. The registrant’s other certifying officer(s) and I have disclosed, based on our most recent evaluation of internal control overfinancial reporting, to the registrant’s auditors and the audit and compliance committee of the registrant’s board of directors (orpersons performing the equivalent functions):
(a) All significant deficiencies and material weaknesses in the design or operation of internal control over financialreporting which are reasonably likely to adversely affect the registrant’s ability to record, process, summarize and reportfinancial information; and
(b) Any fraud, whether or not material, that involves management or other employees who have a significant role in theregistrant’s internal control over financial reporting.
By: /S/ R. MILTON JOHNSON
R. Milton JohnsonPresident and Chief Financial Officer
Date: February 23, 2012

EXHIBIT 32
CERTIFICATION PURSUANT TO18 U.S.C. SECTION 1350,
AS ADOPTED PURSUANT TOSECTION 906 OF THE SARBANES-OXLEY ACT OF 2002
In connection with the Annual Report of HCA Holdings, Inc. (the “Company”) on Form 10-K for the yearended December 31, 2011, as filed with the Securities and Exchange Commission on the date hereof (the“Report”), each of the undersigned certifies, pursuant to 18 U.S.C. Section 1350, as adopted pursuant toSection 906 of the Sarbanes-Oxley Act of 2002, that:
(1) The Report fully complies with the requirements of section 13(a) or 15(d) of the Securities ExchangeAct of 1934; and
(2) The information contained in the Report fairly presents, in all material respects, the financial conditionand results of operations of the Company.
By: /S/ RICHARD M. BRACKEN
Richard M. BrackenChairman of the Board and Chief ExecutiveOfficer
February 23, 2012
By: /S/ R. MILTON JOHNSON
R. Milton JohnsonPresident and Chief Financial Officer
February 23, 2012