
Audit of the Parking Function - La Ville d'Ottawa, La Capitale du

2011 AnnuAl RepoRt

2011 AnnuAl RepoRt I tAble of Contents lA CApItAle CIVIl seRVICe mutuAl
2
2011 Key fACts And fIguRes . . . . . . . . . . . . . . . . . . . . . . . . . . . . . . . . . . . . . . . . . . . . . . . . . . . . 3
organizational Chart . . . . . . . . . . . . . . . . . . . . . . . . . . . . . . . . . . . . . . . . . . . . . . . . . . . . . . . . . . . . . 4
members of the board of directors . . . . . . . . . . . . . . . . . . . . . . . . . . . . . . . . . . . . . . . . . . . . . . . . .5
WoRd fRom tHe CHAIRmAn of tHe boARd And CHIef eXeCutIVe offICeR . . . . . . . 6
tHe yeAR In ReVIeW . . . . . . . . . . . . . . . . . . . . . . . . . . . . . . . . . . . . . . . . . . . . . . . . . . . . . . . . . . . . . 9
life and Health Insurance and financial services sector . . . . . . . . . . . . . . . . . . . . . . . . . . . . . . . . . . . . 9
property and Casualty Insurance sector . . . . . . . . . . . . . . . . . . . . . . . . . . . . . . . . . . . . . . . . . . . . . . . .11
financial group . . . . . . . . . . . . . . . . . . . . . . . . . . . . . . . . . . . . . . . . . . . . . . . . . . . . . . . . . . . . . . . . . . 12
ConsolIdAted fInAnCIAl stAtements . . . . . . . . . . . . . . . . . . . . . . . . . . . . . . . . . . . . . . . . .15
management’s responsibility for the consolidated financial statements . . . . . . . . . . . . . . . . . . . . . . . . 16
Independent Auditors’ Report . . . . . . . . . . . . . . . . . . . . . . . . . . . . . . . . . . . . . . . . . . . . . . . . . . . . . . . 17
Consolidated statement of financial position . . . . . . . . . . . . . . . . . . . . . . . . . . . . . . . . . . . . . . . . . . . 18
Consolidated statement of Income . . . . . . . . . . . . . . . . . . . . . . . . . . . . . . . . . . . . . . . . . . . . . . . . . . . 20
Consolidated statement of Comprehensive Income . . . . . . . . . . . . . . . . . . . . . . . . . . . . . . . . . . . . . . . 21
Consolidated statement of Changes in equity . . . . . . . . . . . . . . . . . . . . . . . . . . . . . . . . . . . . . . . . . . . 22
Consolidated statement of Cash flows . . . . . . . . . . . . . . . . . . . . . . . . . . . . . . . . . . . . . . . . . . . . . . . . 23
notes to Consolidated financial statements . . . . . . . . . . . . . . . . . . . . . . . . . . . . . . . . . . . . . . . . . . . . 24
CompAny pRofIles . . . . . . . . . . . . . . . . . . . . . . . . . . . . . . . . . . . . . . . . . . . . . . . . . . . . . . . . . . . 80
life and Health Insurance and financial services sector . . . . . . . . . . . . . . . . . . . . . . . . . . . . 80
officers – life and Health Insurance and financial services sector . . . . . . . . . . . . . . . . . . . . . . . . . . . . 82
property and Casualty Insurance sector . . . . . . . . . . . . . . . . . . . . . . . . . . . . . . . . . . . . . . . . . . . 83
officers – property and Casualty Insurance sector . . . . . . . . . . . . . . . . . . . . . . . . . . . . . . . . . . . . . . . 84
senior management of la Capitale financial group . . . . . . . . . . . . . . . . . . . . . . . . . . . . . . . . . 85
la Capitale financial group points of service . . . . . . . . . . . . . . . . . . . . . . . . . . . . . . . . . . . . . . 86
life and Health Insurance and financial services sector . . . . . . . . . . . . . . . . . . . . . . . . . . . . . . . . . . . 86
property and Casualty Insurance sector . . . . . . . . . . . . . . . . . . . . . . . . . . . . . . . . . . . . . . . . . . . . . . . 88

2011 AnnuAl RepoRt I 2011 Key fACts And fIguRes lA CApItAle CIVIl seRVICe mutuAl
3
2011 Key fACts And fIguRes
n Assets $4.3Bn total income $1.7B
n equity $768.7M
n net income $65.7Mn participating
policyholder dividends $13M
lIfe And HeAltH InsuRAnCe And fInAnCIAl seRVICes seCtoR
n total income$926.7M up 10%
n net income $30.6M
n sales of individual insurance premiums and deposits
$139.8M Record results
n savings and investments portfolio
$773M up 7%
n group insurance sales$76.3M up 69%
n group insurance premiums in force
$453M up 10.4% up 53.9% in rest of Canada
n new mortgage loans$116.2M up 41.3%
n 446 financial information sessions given to more than 8,000 public service employees
n number of mutual members 230,930
n donations to the community from the foundation $1.3M
n Contracts and certificates in force 1,653,712
n number of employees 2,256
pRopeRty And CAsuAlty InsuRAnCe seCtoR
n Consolidated grosswritten premiums $743.5M
n net income $35.1M
n Return on equity 13.9%n gross written premium
volume for la Capitale general Insurance
$494.2M up 9.1%
n gross written premium volume for l’unique general Insurance*
$134.1M up 10.4%
n turnaround of unica Insurance completed and new brand image launched
n 20th anniversary of the introduction of legal Access Insurance
* Excluding a block of business closed outside Quebec

2011 AnnuAl RepoRt I oRgAnIzAtIonAl CHARt lA CApItAle CIVIl seRVICe mutuAl
4
Organizational Chart la Capitale Civil service mutual
la CapitaleCivil service Insurer
la CapitaleInsurance and
financial services
l’uniquegeneral Insurance
la Capitalefinancial services
la Capitalegeneral Insurance
unica Insurance
promutuel life
la CapitalemfQ Real estate
management
AgA
financial group
penncorplife Insurance
Company
la Capitale Civil service mutual
la Capitale financial group
92.09%
100%
100%
100%
100%
75.95%
100%
50%
100%
100%
70%

2011 AnnuAl RepoRt I boARd of dIReCtoRs lA CApItAle CIVIl seRVICe mutuAl
5
Members of the Board of Directors la Capitale Civil service mutual
René ROULEAU
Chair
dominique DUBUC
Vice-Chair
Jean-paul BEAULiEU
Richard FisEt
marie-Josée LiNtEAU
danielle ChEvREttE
françois JUtRAs
danielle POiRÉ
nikolas DUChARME
françois LAtREiLLE
louise POtviN

2011 AnnuAl RepoRt I WoRd fRom tHe CHAIRmAn of tHe boARd And CHIef eXeCutIVe offICeR lA CApItAle CIVIl seRVICe mutuAl
6
WoRd fRom tHe CHAIRmAn of tHe boARd And CHIef eXeCutIVe offICeR
la Capitale Civil service mutual has seen sustained growth in recent years . In spite of its relatively modest size, the company has succeeded in gaining ground in a highly concentrated and consolidated industry . We are naturally very proud of this progress .
We went into 2011 with a sense of apprehension, given the more difficult economic setting . persistently low interest rates and volatile markets certainly complicated the situation throughout the year . but all in all, the challenges of 2011 once again highlighted the strengths of our mutualist management approach . la Capitale’s governance model, which is based on mutualist values, has proven itself time and again . We believe that our prudent management methods and our long-term vision are definite assets . We are now even stronger than we were at the beginning of the 2008 financial crisis and our member companies have the agility they need to adapt to fluctuating market conditions . even better, the momentum generated by year after year of strong results has enabled la Capitale to stay the course and continue building on its strategy for controlled growth across Canada .
Enviable results
At the end of the fiscal year, our organization was pleased to report positive results and highlight a number of achievements . our income grew by 9 .3% to reach nearly $1 .7 billion, while our assets amounted to $4 .3 billion, up 10 .5% over the previous year . net income reached $65 .7 million, $50 .5 million of which went directly to mutual members and participating policyholders, a small increase over last year . We had a total of $768 .7 million in equity, which represents a return of 9 .3% . Approximately $13 million was paid out to policyholders in participating dividends .
these outstanding results are the fruit of many labours: our unique customer-centric mindset, the quality and diversity of our product and service offering, the accessibility of our distribution channels, and the professionalism of our brokers, agents and business partners—all of which revolve around efficient management and exceptional employee engagement . As our presidents and Chief operating officers will explain in their respective reports, every one of our business sectors reported impressive progress this year .
the life and Health Insurance and financial services sector enjoyed continued strong growth, particularly in group insurance, and reported highly satisfactory profitability in spite of an exceptional increase in actuarial liabilities, dictated by low interest rates .
this sector comprises the activities of la Capitale Civil service Insurer, la Capitale Insurance and financial services, la Capitale financial services, penncorp life Insurance, AgA financial group and promutuel life . these companies complement each other by designing and distributing individual and group life, health and disability insurance products, as well as individual annuities, savings and investment vehicles and mortgage loans .
It was also an excellent year for our property and Casualty Insurance sector, with highlights including the turnaround of its ontario-based subsidiary as well as record profitability . this sector, which comprises la Capitale general Insurance, l’unique general Insurance and unica Insurance (formerly york fire and Casualty Insurance Company), offers a range of services from automobile and home insurance to recreational vehicle insurance, commercial insurance, roadside assistance services and legal access insurance .
René RouleAu

2011 AnnuAl RepoRt I WoRd fRom tHe CHAIRmAn of tHe boARd And CHIef eXeCutIVe offICeR lA CApItAle CIVIl seRVICe mutuAl
7
la Capitale senior management is pleased with the results posted by its member companies and is delighted that its mutual members—those who are active in or have retired from the public sector—will reap the benefits . la Capitale Civil service mutual belongs to them, as it was created to meet their needs for financial security . for more than seventy years, the company has continued to grow its line of products to meet these evolving needs, all in the context of a constantly changing society .
today, the 230,930 mutual members who benefit from la Capitale products can be proud to call themselves the owners of a financial institution that is wholly dedicated to them, and is even more receptive to their needs due to its presence in the public sector workplace . la Capitale serves this client base by offering a complete range of insurance and financial services and achieving financial results that prove, year after year, that there is a place for solidarity and mutual aid alongside earnings and profitability .
A new beginning
the year 2011 inaugurated our new five-year strategic plan, which is centred around seven key concepts: growth, profitability, client focus, distribution, organizational capacity, innovation and public sector development .
Reinventing our brand image—a vast operation which took all year to complete—was an essential prelude to rolling out these new strategic orientations .
projecting a fresh, dynamic and youthful image has helped us to stand out from our competitors and get closer to our clients . We launched several impressive advertising campaigns in Quebec, to great public acclaim . our efforts have started to bear fruit . We saw proof of this when la Capitale financial group recently ranked top of its field in a léger marketing/Les Affaires survey about Quebec’s most admired companies . And that’s not all: la Capitale general Insurance also ranked in first place among property and casualty insurance companies in the same poll . these distinctions, awarded on the basis of a survey conducted last January, bring well-deserved recognition of our member companies’ dedication to providing our clients with products and services—and an overall experience—of the highest quality .
by unifying all of its components through its values, organizational culture, management philosophy and strategic directions, la Capitale will be recognized as a responsible, customer-centric corporate citizen and hold a competitive position among those having influence in the Canadian insurance market .
We plan to make this vision a reality by maintaining a strong profitability rate, by positioning ourselves in the Canadian market as a diversified, multi-network, accessible, flexible and professional financial group, and by becoming the first choice of Quebec public service workers for their insurance and financial services needs .
Client satisfaction: Our top priority
Without a doubt, the people who benefit the most from our strengthened market presence are our clients and mutual members . everything we do is in their best interests . In accordance with our mission to value and protect what they feel counts for their financial security and that of their loved ones, this is the promise we make: to offer our clients insurance products and financial services tailored to their needs, at the most competitive cost possible, and according to their choice of payment method . these are the principles that guided us throughout 2011 .
In savings and investments, for instance, we diversified our product range and offered our clients preferential interest rates on their investments, while focusing on long-term growth potential to make the most of current market conditions . In property and casualty insurance, we offer special promotions for families and mutual members to provide them with complete coverage at an affordable cost .
the great diversity of our distribution channels gives us the flexibility we need to stay close to our clients and meet their various needs . We feel it is important for our clients to have a choice in how they do business with us . that’s why we give them the option of dealing with us by telephone, in person or online . they can choose to meet with a financial security advisor right in their workplace, contact one of our affiliated agents or go through one of our partner brokers . our clients and mutual members have much to gain from the increased synergy across the group as we bring more stakeholders in the organization on board .
Changes to senior management
the year 2011 saw a number of changes in our senior management team . under our succession plan, which is built on skills, experience and expertise, we leveraged our internal resources to fill two new positions that were created to ensure greater cohesion of the financial group’s activities . effective January 1, 2012, marie-Josée guérette and marthe lacroix were named executive Vice-president, Corporate Affairs and executive Vice-president, finance, Real estate and technological Infrastructure, respectively .
this new structure was put in place in anticipation of the planned departure of the current president and Chief operating officer of la Capitale financial group, Robert st-denis, whose retirement has been on the horizon for some time now .
Robert has held this position since 2007, and as such, spearheaded the integration of core functions at the group level . under his leadership and strategic direction, all corporate functions were centralized to improve our efficiency and productivity . making optimal use of shared resources means that all our member companies can benefit today from specialized expertise and services at a more competitive cost .
on behalf of the board of directors, I would like to express our heartfelt appreciation for the spectacular progress Robert st-denis has enabled us to make as a financial group, and also thank him for the remarkable human aspect he has always brought to his work, even while shouldering immense responsibilities .

2011 AnnuAl RepoRt I WoRd fRom tHe CHAIRmAn of tHe boARd And CHIef eXeCutIVe offICeR lA CApItAle CIVIl seRVICe mutuAl
8
true to our established human resources practice, Robert will stay on until the fall of 2012 to work with our senior management and ensure a smooth transition . We thank him sincerely for agreeing to share his experience and expertise with his successors .
A modern approach to governance
In addition to ensuring la Capitale’s compliance with the company’s mission and mutualist values, the board of directors has a duty to stringently monitor the progress of the company’s strategic plan . to do this, it assigns specific responsibilities to board members and devotes the necessary resources to examine questions likely to impact the mutual’s business, such as risk management, major technology projects and compensation .
In 2011, the board reviewed its governance structures and revised the duties of its committees in order to simplify and streamline management of the organization, while harmonizing the financial group’s focus . to arrive at a modern vision of these broader issues, the board created a new mutualism, ethics and governance Committee . We have our board directors to thank for ensuring compliance of our policies with regard to participating policyholders, and examining the feasibility of this model in years to come .
It is worth pointing out the healthy balance in the composition of the board of directors, in terms of the gender and age mix, the diversity of members’ professional expertise and the regions they represent .
social commitment
the report on our activities would not be complete if we failed to mention our social commitment, which continues to grow year after year . mutual aid and solidarity are two of la Capitale’s founding values, and the desire to share the fruits of the company’s success with the community is hard-wired in our dnA .
In 2011, we merged our two existing foundations into one . now, the la Capitale financial group foundation will work to achieve the same goals as its predecessors . on the one hand, it provides financial support to organizations that promote quality of life, including people who are dealing with addiction and troubled youth . on the other, it supports activities that value the role of public service employees and further the development and promotion of mutualism .
In 2011, we gave back close to $1 .3 million . this is our way of upholding the sense of sharing on which la Capitale was founded, and ensuring we practise the mutualist values we preach .
our social engagement is also reflected through our sustainable development initiatives . Highlights for 2011 include the delta 3 building earning bomA Quebec’s prestigious 2011-2012 building of the year Award, in recognition of its sustainable qualities and leed® certification . We are also seeking leed® gold certification for our Head office on Quebec City’s parliament Hill, the expansion of which is scheduled for completion in late 2012 .
In addition, I would like to acknowledge the efforts of our employees, who demonstrate their concern for the environment each day through their involvement in the initiatives promoted by our eco-Committee and the Good for you! health and wellness program or by using alternative means of transportation for their daily commute .
Employee engagement
our success is not due to chance . We owe a large part of it to the dedication of our greatest resource: our human assets .
fostering a work climate where great value is placed on communication between staff and senior management is how la Capitale promotes collaboration . In 2011, employee participation in a Canada-wide workplace satisfaction survey conducted by Aon Hewitt led to la Capitale being ranked as one of the best employers in Canada for 2012 and one of la presse’s best employers in Quebec . It is a great honour for our organization to be awarded such prestigious recognition .
year after year, we call upon our employees’ generosity and 2011 was no exception . once again, they contributed to various humanitarian causes, either by raising tens of thousands of dollars or by donating their time . In response to popular demand by our staff, our internal President’s Challenge bonus plan includes a new component specifically for community involvement, starting this year . this gives me a great sense of pride .
I would like to take this opportunity to thank each and every one of our staff on behalf of the members of our boards of directors . their unfailing commitment and continued hard work have enabled la Capitale Civil service mutual to report once again such remarkable results in a challenging economic situation . It is thanks to them that each and every day our mutual is able to serve the public with efficiency, empathy and respect .
René ROULEAUChairman of the board and Chief executive officer

2011 AnnuAl RepoRt I tHe yeAR In ReVIeW lA CApItAle CIVIl seRVICe mutuAl
9
tHe yeAR In ReVIeW
LiFE AND hEALth iNsURANCE AND FiNANCiAL sERviCEs sECtORthe entire industry was affected by the extremely difficult economic conjuncture in 2011, and the life and Health Insurance and financial services sector was no exception . Interest rates reached historic lows, which led us to significantly increase our actuarial liabilities . this raises the stakes for life and health insurers, due to their long-term commitment to the people they insure . In spite of this unfavourable context, our business line reported highly satisfactory net income of $30 .6 million . If we had not been obliged to strengthen our actuarial liabilities, 2011 would have been a year of unprecedented profitability .
We also saw some impressive growth in 2011 . total income for the sector reached $926 .7 million, an increase of almost 10% over the previous year .
Life insurance and Financial services
In individual insurance and financial services, we reached and even exceeded many of our goals . new insurance premiums and deposits, for instance, totalled $139 .8 million—the best result we have ever reported . this amount can be broken down into $122 .9 million in savings products and $16 .9 million in insurance .
Savings and Investments
our portfolio for this business line amounted to $773 million, nearly 7% more than in 2010 . this increase is the result of two main factors .
first is the great popularity of the deferred life annuity LifeAnew, sales of which increased by 25% . note that almost 90% of the people who hold this product work in the public service . such a resounding success shows that LifeAnew is meeting a real need felt by our clients, who are increasingly aware of the importance of planning for a reliable retirement income or income supplement .
LifeAnew is now available as a locked-in retirement account (lIRA) . In addition, to further diversify our product offering and better meet investors’ needs, we added nine new investment accounts to the fifteen already available . All of our accounts include a capital guarantee in the event of death, for even more peace of mind .
second, the la Capitale stow & grow Account, a high-interest online savings account, experienced strong growth, with a 27 .3% increase in deposits . Another aspect worthy of mention is that close to 57% of those with la Capitale stow & grow Accounts work in the Quebec public service . the la Capitale stow & grow Account is also offered as a tax-free savings Account (tfsA) .
Individual Life and Health Insurance
sales of individual life and health insurance generated by our distribution channels were 6 .1% higher than the previous year . this is the result of sustained efforts by our la Capitale financial services advisors, our ontario member company penncorp’s field agents, our broker partners and our customer service and product development teams, who, in spite of the economic slowdown, managed to keep our growth on track . note that 92% of sales by the la Capitale financial services channel were to the public service—our core market . every year we offer special promotions to our primary client base, as well as the option to participate in financial education sessions tailored to the various stages in life . In 2011, we organized 446 of these sessions for more than 8,000 Quebec public service employees, an increase of nearly 21% over 2010 .
penncorp decided to open two new branch offices—one in manitoba, and the other in Hamilton, ontario . It also launched the Pillar Series, a new line of disability insurance products designed to meet the needs of blue-collar workers and the self-employed and distributed through our broker partners . this represented 13 .1% of our health insurance sales in 2011 .
Constance lemIeuX
president and Chief operating officer property and Casualty Insurance sector
Robert st-denIs
president and Chief operating officer la Capitale financial group
steven Ross
president and Chief operating officer life and Health Insurance and
financial services sector

2011 AnnuAl RepoRt I tHe yeAR In ReVIeW lA CApItAle CIVIl seRVICe mutuAl
10
la Capitale also distributed its products through promutuel life, for a fourth year running . la Capitale financial group Inc . holds a 50% share in this company, which reported stable sales in 2011 .
Carte Capitale Card
At the end of 2011, our budget-discount card Carte Capitale was the target of a major fraud scheme, which fortunately had no financial impact for our clients . these circumstances led la Capitale to stop offering the payment of car-related expenses through the card . In today’s market, it would have been too expensive to maintain the security of Carte Capitale as a payment card offered at a reasonable cost to our clients . We quickly implemented measures that would allow cardholders to continue enjoying the other benefits of their cards, such as budgeting for municipal and school taxes, savings and other projects through payroll deduction . In certain cases, we also offered clients the opportunity to transfer their balance into a la Capitale stow & grow Account . more than 85% of our clients wanted to continue enjoying these benefits and opted for one of the proposed solutions . this incident served to demonstrate, once again, the agility and determination that la Capitale is capable of when it comes to protecting its clients’ interests .
Mortgage Loans
during the year, we approved $116 .2 million in mortgage loans—41 .3% more than in 2010 . this increase is partly attributable to the launch of a new product, the First Home package . this package targets young people who work in the Quebec public service and combines a range of benefits to make life easier for first-time buyers, including free Home Insurance for a year, free legal Access Insurance, the option of a cash rebate of up to $10,000 upon disbursement of the loan, as well as a free property appraisal .
Group insurance
our group Insurance line reported a record number of new group policyholders in 2011, which drove sales up 69% over the previous year, primarily in Quebec . Inforce premiums amounted to $453 million, up 10 .4% over 2010, in spite of a persistency rate that was slightly lower than anticipated . the strongest growth was seen in the rest of Canada, with inforce business up by 53 .9% . these outstanding results can be explained by a number of factors, notably the quality of our customer service, our privileged relationships with our partners, the breakthrough of our credit insurance products and finally, the unique approach we take to promoting workplace health and wellness through our innovative Good for you! program .
In 2009, we began overhauling our computer systems to allow group plan administrators and plan members to manage their group insurance files online . We started the final phase of this major project in 2011 . up to now, we have converted some 30,000 plan members’ files to the new system, called Expresso .
moreover, we are pleased to welcome Éric marcoux as executive Vice-president, group Insurance, who replaces mario Cusson . Éric joins us from his previous position as Vice-president, Administration and Customer service – Individual Insurance and financial services . We extend our warmest thanks and appreciation to mario for his exceptional work in group Insurance . His great energy and leadership have enabled this business line to make strong progress and experience rapid expansion .
for our member company AgA financial group, 2011 was essentially marked by the conversion and sale of a large proportion of its business to private management—a move that was facilitated by the launch and promotion of two product lines developed exclusively for this subsidiary’s clients . AgAfleX is a product targeting small- and medium-sized businesses with less than $50,000 in annual premiums, while the Signature product line is designed to meet the needs of medium- and large-sized companies . note that AgA financial group’s income grew by 13 .5% in 2011 .
increased efficiency
the most competitive companies today have made it an integral part of their corporate culture to continually improve their operational efficiency . At la Capitale, we share the same concern at all levels of the organization, as the many suggestions we have received from our staff will attest . this is why we have created working groups, which include employees from the sector concerned, and tasked them with putting forward ideas on how to reduce unit costs, optimize resources and improve processes . Acting on the recommendations of these committees and applying more efficient working methods have enabled us to considerably reduce our operating costs and shorten processing times . to ensure consistency in our customer approach, we grouped certain activities under a single administrative unit . now, across the entire business line, all claims processing functions are carried out by a single department . We also carried out the same exercise for all of our underwriting activities .
Everything we do revolves around our clients
our customer-centric mindset is a fundamental element of our strategic plan . In this perspective, we renewed our client promise in all of our business lines, for individual as well as group insurance . We strive to provide service that goes above and beyond expectations, and our employees’ active involvement in the process has helped us to define this even more clearly .
la Capitale has always made it a priority to provide its financial security advisors with the cutting-edge tools they need to serve their clients . this is what led us to begin rolling out a new client relationship management system . once is it fully implemented, this technological platform will enable advisors to offer better follow-up, offer products and services that are even better adapted to clients’ needs, and ultimately improve the quality of the service they offer their clients .

2011 AnnuAl RepoRt I tHe yeAR In ReVIeW lA CApItAle CIVIl seRVICe mutuAl
11
Distribution channels
In a context where the financial services industry is struggling to deal with a shortage of qualified personnel, la Capitale brought in programs to improve advisor retention, as well as their productivity . both penncorp and la Capitale financial services (Cfs) saw improved retention . thanks to these new programs, Cfs advisors can now boast of new highs in average sales per advisor as well as an unprecedented volume of new business .
We also introduced a referral system to bring advisors in our Cfs channel into contact with our general insurance agents and mortgage loan advisors, which now gives clients easier access to our complete range of products and services . decompartmentalizing the field and promoting direct sales to meet the needs of our clients who do not have a dedicated advisor, are just some of the practices we applied to improve how we serve our clients and encourage the sales force .
to further diversify the way our clients access our products and services, we continued in 2011 to develop close, privileged long-term relationships with our individual and group insurance broker partners . Achieving the growth and profitability objectives we set for the company would not be possible without their invaluable contribution .
A teamwork success story
the high level of performance achieved by the life and Health Insurance and financial services sector is, first and foremost, a product of the engagement, initiative and flexibility of our employees, managers and officers . We wish to thank each and every member of our extended la Capitale family for their exemplary commitment and excellent work in 2011 .
Outlook
the year 2011 inaugurated our 2011-2015 strategic plan . Although it looks like the economic situation will remain difficult in 2012, our prudent management approach, along with the diversification of our products and services, our enviable capitalization ratio and our highly engaged employees and managers all mean that we are well positioned to face the challenges ahead . strengthened by these assets, we will maximize the leverage of the group to grow our new business volume for individual insurance and expand our inforce business for group insurance and savings products— in a profitable way .
We will continue to expand our distribution channels by maximizing their complementary nature, by decompartmen tali zing them with the development of offerings from other components of the group and our broker partners, as well as by focusing on the retention of our sales force .
We aim to offer a level of service that is a step ahead of the needs of our clients—particularly those in our target market—and which puts the necessary structures in place to meet those needs . All of our clients across the country—and above all, our mutual members—will benefit from the effects of our growth as we are increasingly able to offer products that are designed and tailored for their situation and are available at an affordable cost through their choice of our various distribution channels .
PROPERty AND CAsUALty iNsURANCE sECtOR It was an excellent year for the property and Casualty Insurance sector, which includes la Capitale general Insurance, l’unique general Insurance and unica Insurance (formerly york fire and Casualty Insurance Company), with highlights including the turnaround of its ontario-based subsidiary, as well as record profitability .
Growth
At 2011 year-end, our companies reported a consolidated gross written premium volume of $743 .5 million .
la Capitale general Insurance posted 9 .1% growth, with $494 .2 million in gross written premiums . this growth can be attributed to progress in all business lines, and particularly in the public service market . 2011 marked the twentieth anniversary of our legal Access Insurance coverage, a milestone that was further reinforced by a 12 .7% increase in sales of this product, helping our clients stand up for their legal rights . our client satisfaction levels also remained high throughout the year .
our clients can do business with la Capitale however and whenever they like . they can call us, or meet with us at any one of our 19 branch offices throughout Quebec, contact one of our 211 affiliated agents, get a quote online (which more and more clients are choosing to do) and even purchase their policy online, if they wish to do so .
our member company l’unique general Insurance reported $134 .1 million in gross written premiums, excluding a block of business closed outside Quebec, representing an increase of 10 .4% . this is excellent performance for a brokerage-based insurer in the highly competitive Quebec market . l’unique general Insurance distributes its products through a network of 314 brokerage firms . A fresh logo and a brand new website, www .lunique .qc .ca, were launched during the year .
unica Insurance ended 2011 with $100 .3 million in written premiums, a decrease of 22 .7%, which was a planned consequence of the decisions made as part of its turnaround . note the company now distributes its products through a network of 128 brokers, 93 fewer than in 2010 . A number of other courses of action were taken to shore up the company’s business portfolio . the company is now entering a phase of development fuelled by the launch of a new brand image, a change of name, and a completely revamped website (www .unicainsurance .com) .
Profitability
Consolidated net income in the property and Casualty Insurance sector reached a record level of $35 .1 million, generating a 13 .9% return on equity .
these outstanding results are a direct reflection of strong performance by la Capitale and l’unique, and the turnaround of unica Insurance, which is now complete . this comeback is the result of hard work and leveraging a number of factors, as well as certain advantages that came with the introduction of new automobile insurance regulation in ontario in september 2010 .

2011 AnnuAl RepoRt I tHe yeAR In ReVIeW lA CApItAle CIVIl seRVICe mutuAl
12
Personal insurance
Automobile Insurance
strong results in the Quebec auto insurance sector enabled la Capitale and l’unique to lower consumer rates for a ninth consecutive year . Activities in Quebec generated an operating profit, including income from recreational vehicle insurance, of $14 .3 million .
satisfaction remains high among our clients for our CAp Roadside Assistance service . In 2011, our roadside assistance centre fielded more than 45,000 calls—over 125 per day—and dispatched services to more than 36,500 motorists .
Recreational Vehicle Insurance
Recreational Vehicle Insurance, which is designed for owners of motorcycles, snowmobiles, AtVs, trailers, motorhomes and boats, has now been on the market for over five years and continues to make impressive inroads . our products offer unparalleled protection and we make sure that claims are settled quickly and efficiently so our clients can make the most of the season .
la Capitale general Insurance renewed its partnership with the Ministère des Transports du Québec, bombardier Recreational products (bRp) and Éduc’alcool as part of a safety campaign targeting snowmobilers, AtV drivers, motorcyclists and boaters across the province . the campaign urges people to act responsibly and think about their safety and that of their passengers and loved ones .
Home Insurance
In spite of a higher rate of water damage claims and three catastrophes caused by heavy rains and the remnants of Hurricane Irene, la Capitale and l’unique managed to generate an operating profit of $11 .4 million .
Claims for water damage remained the main cause of compensation payments, representing 50% of claims incurred . fire damage represented 29% of claims incurred, less than in 2010 .
to help raise public awareness of the risk of fire, la Capitale general Insurance has been a major partner in the fire prevention initiatives led by the Ministère de la Sécurité publique for more than 20 years .
Commercial insurance and surety Lines
the operating profit generated in Quebec was $2 .0 million .
2011 saw the beginning of a major overhaul of the computer systems at la Capitale and unica, which will allow us to better serve our clients and respond to new opportunities .
Legal Access insurance
legal Access Insurance generated an operating profit of $0 .9 million, in spite of a steep increase in the number of cases handled .
hats off to our team!
the whole team’s exceptional competence, engagement and client focus are what have driven the growth of our two companies in Quebec, as well as the turnaround of our member company in ontario . they all deserve a big thank you .
Outlook for 2012
the property and Casualty Insurance sector will continue to implement its 2011-2015 strategic plan and work to achieve its clearly defined growth and profitability targets . We will continue to place our clients’ interests at the heart of our activity . We will endeavour to meet all of their needs in our field of expertise and give them reasons to be loyal to us .
similarly, we will maintain close ties with our distribution partners and do our part to support them as they offer added value to their clients .
As a member company of a financial group that has its roots in the public service, we will continue to offer our clients in this core market segment attractive products that are tailored to their needs .
What’s more, we will continue to support and encourage new ideas so that we can keep offering our clients the best value for their money .
In June 2012, mr . Jean tardif will retire from his position as president and Chief operating officer of l’unique general Insurance . Jean’s great expertise is recognized across the industry . He will be leaving the company that he and his team built in an excellent position, and we thank him sincerely for all of his hard work . We will all miss him for his great human qualities and his sound advice .
We are pleased to welcome mario Cusson, who took the helm on march 19, 2012 . He joins us from the life and Health Insurance and financial services sector, where he was previously executive Vice-president of group Insurance .
FiNANCiAL GROUPla Capitale has centralized the following activities under its core financial group: investments, real estate management, technological infrastructure, risk management and internal control, legal affairs, finance, human resources, and corporate marketing and communications .
investments
growing uncertainty surrounding the euro zone, as well as the slowing economic growth expected around the world, left stock markets down by about 5% at the end of 2011 . In Quebec and the rest of Canada, employment figures rose above the peak that was reached in 2008 . things were less rosy in the united states, however, where job losses continued, contributing to the gloomy mood on the financial markets .
overshadowing the whole year was the spate of bad news surrounding the quality of sovereign bonds and the likelihood of default . these bonds, like cash, are seen as reliable and they play a key role in modern finance . doubt about their investment value can have a significant detrimental effect . However, the prudent, rigorous management approach preferred by Canadian public administrations and financial institutions have served us well . other countries now see Canada as a model for investment stability .

2011 AnnuAl RepoRt I tHe yeAR In ReVIeW lA CApItAle CIVIl seRVICe mutuAl
13
this same context in 2011 brought a drop of around 1% in interest rates in Canada for federal and provincial bonds, which presents an additional challenge for our new investments . In line with la Capitale’s strategy to prioritize premium quality investments offering stable income and long-term performance, during the year we increased our weighting in preferred shares, real estate and private equity . doing so will allow us to maintain a careful balance between performance, financial risk and prudent diversification of matching . the consolidated investment income from the life and Health Insurance and financial services and property and Casualty Insurance sectors was $294 .3 million, up 18 .1% from 2010 .
We should also point out that the returns generated by asset classes have changed so much since the previous financial crisis that the relative appeal of various investment vehicles and the relevance of market indices are no longer what they used to be .
In light of these observations and our in-depth knowledge of the profitability and stability requirements for each of the components of la Capitale, we plan to further diversify our portfolio into new types of investments . We will also need to adapt the way we manage matching in this new financial environment, characterized by low interest rates and extreme central bank intervention, which appear to be more of a permanent than a temporary fixture . this will allow us to continue offering financial products to our mutual members that are attractive, competitive and profitable .
Real estate projects
the expansion of our Head office on saint-Amable street in Quebec is still progressing according to schedule and within budget . this major investment includes a complete renovation of the existing Head office building, the original structure of which dates back to the 1960s . once the work is completed, la Capitale will be the proud owner of a prestigious office building with a surface area of more than 340,000 square feet, right at the heart of Quebec City’s parliament Hill . this will allow the company to bring all of its employees in Quebec City together under one roof—some 1,230 people, expected to grow to more than 1,500 in coming years—thereby enabling the group to implement significant operational efficiencies . All our employees will move to the new offices by the end of 2012 . In accordance with the policy on sustainable development we adopted a few years ago, we are seeking leed® gold certification for this real estate project, the same level achieved by the delta 3 building .
We are proud to announce that the delta 3 building, located in the sainte-foy district of Quebec City, was awarded the prestigious title of Building of the Year by the building owners management Association of Quebec (bomA Quebec) . this award recognizes companies that stand out from the competition through excellence in property management, operations, resource conservation, and environmental awareness .
technological infrastructure
the Head office expansion project created significant work for our technological infrastructure teams, specifically the launch of a new online processing centre, the re-engineering of our internal telecommunications network and a major upgrade to our computer equipment and collaboration tools, which will be used to equip our new meeting and work rooms in 2012 .
While this work was being done, our teams also put the finishing touches to our backup site in mississauga, helped our business lines prepare for the launch of the new brand image and provided support to la Capitale financial services advisors for the rollout of their new client relationship management system, not to mention the conversion of all of our call centres to Ip technology .
As part of our 2011-2015 strategic plan, we created four committees to explore the following operations in greater depth: It security, enterprise architecture, project management methodology and systems production .
finally, our Help desk fielded some 45,000 calls and received more than 17,500 support requests in 2011 . As for la Capitale’s Client Centre online services team, it answered nearly 37,000 calls .
New financial information reporting standards
la Capitale adopted the new mandatory International financial Reporting standards (IfRs) on January 1, 2011 . the team tasked with implementing these new standards, as well as la Capitale’s Audit Committee, invested great energy into making sure the conversion went smoothly and all necessary information was shared throughout the company . the move to IfRs significantly impacted our accounting practices, processes, computer systems and human resources . but by making efforts to simplify and present financial information in plain language, working in close collaboration with our external auditors and maintaining good relations with the Autorité des marchés financiers (Amf), we were able to make this important transition a smooth one .
Risk management and internal control
In 2011, as well as adopting various measures for the self-assessment of risk in the member companies of the group, the Internal Audit, Integration and Risk measurement department also implemented policies and procedures required by Amf guidelines for investments, derivative products, reinsurance and business continuity . the department was also represented on a number of industry committees set up in response to the Amf guidelines consultation process .
the team also carried out a number of audit mandates for operational processes, It processes, major technology implementation and systems conversion, along with other audits related, among other things, to the Head office expansion project and compliance with money laundering regulations .

2011 AnnuAl RepoRt I tHe yeAR In ReVIeW lA CApItAle CIVIl seRVICe mutuAl
14
In terms of regulatory compliance management, our legal Affairs team oversaw the implementation of compliance management software in all of the group’s member companies and identified the regulatory environments in which they operate . legal Affairs also introduced online training about money laundering for la Capitale financial services partner agents, as well as all employees of la Capitale Civil service Insurer and la Capitale Insurance and financial services . the team also drafted a complaints management policy for all of the member companies of the group, and began work on harmonizing complaints procedures .
New structure for Finance
during the year, the finance team underwent a change in structure and is now organized by specialty rather than by business line— a change that will improve processes and optimize the use of resources and financial systems . the team continued its work to upgrade fusion/Hyperion, the accounting and budget monitoring system used across the group, as well as revising its management fee methodology .
human Resources
2011 was an active year on the human resources front . first of all, in an organizational climate survey conducted by Aon Hewitt, la Capitale earned prestigious honours as one of the best employers in Canada for 2012 and one of la presse’s best employers in Quebec . some 82% of the employees in our member companies responded to this survey, which shows an overall engagement index of 71% . these honours serve to demonstrate, once again, our employees’ great commitment and the calibre of our human resources management practices .
the company continues to stand out by reinvesting more than 3% of its overall payroll in employee training . the interactive training modules we produced to highlight the fact that a positive client experience is in everyone’s interests, was a resounding success, with an employee participation rate of more than 90% . As a company renowned for the quality of our service, we intend to build on this aspect so we can continue to offer a unique client experience .
Corporate Communications and Marketing
the highlight of 2011 for the Corporate Communications and marketing division was undoubtedly the launch of our new brand image—a more youthful image that reflects the company’s sustained growth in recent years and the diversity of its service offering . the introduction of a new logo and new corporate signature—Taking care of what counts—meant that all of our channels of communication needed to be refreshed, including our long-standing magazine Pensez-y bien! (think about it), now rebranded Zone Capitale .
We also took advantage of launching our new brand image to completely redesign the lacapitale .com website to give users a simple and enjoyable browsing experience . la Capitale earned prestigious recognition for its new site, scooping up the Best of Show award at the 2011 Annual Awards gala Ceremony of the Insurance and Financial Communicators Association (IfCA), an industry organization with member companies across Canada, the u .s . and worldwide . the IfCA also gave la Capitale an award of excellence for the Taylor-Ogusto Family web series, which enables the company to appeal to its clients in an innovative and entertaining manner .
In 2011, la Capitale was also very involved in its sponsorship of events likely to boost its brand awareness, while continuing its cultural involvement . We were the official presenter of the 12th edition of the Carrefour international de théâtre de Québec, part of the 2011 program (and 40th birthday celebrations) of the Grand Théâtre de Québec, and we were also proud to present the show Edgar et ses fantômes (edgar’s ghosts) . We renewed our sponsorship of the annual Quebec City International festival of military bands and were pleased to present Les filles de Caleb (Caleb’s daughters), a major production that portrays one of the greatest sagas in Quebec popular culture . last but not least, la Capitale partnered with the montreal museum of fine Arts to present the acclaimed exhibition The Warrior Emperor and China’s Terracotta Army to the general public . this event generated the highest attendance in the last 10 years at the museum . We also supported the Musée national des beaux-arts du Québec and its Grande soirée au jardin (An evening in the gardens) benefit event .
through our foundation, we furthered our social involvement by supporting various causes that are dear to us . We were proud to present the first edition of the Défi Motivaction jeunesse . All money raised by this event went toward a new campaign against sedentary lifestyles and obesity among underprivileged youth . We also provided support to Le Grand Chemin, a foundation that provides specialized services to young people aged 12 to 17 who are dealing with drug and gambling dependency issues, as well as to other organizations, including the Quebec foundation for Athletic excellence, the Kiwanis Club of Quebec City and young musicians of the World, an organization we have supported for the last two years, to name but a few .
In 2011, our company also won the prestigious Fidéides Award for Business and Social Involvement, Large Organization Category .
steven ROssPresident and Chief Operating OfficerLife and Health Insurance and Financial Services Sector
Constance LEMiEUxPresident and Chief Operating OfficerProperty and Casualty Insurance Sector
Robert st-DENisPresident and Chief Operating Officer La Capitale Financial Group

CONSOLIDATED FINANCIAL STATEMENTS

2011 ANNUAL REPORT I CONSOLIDATED FINANCIAL STATEMENTS LA CAPITALE CIVIL SERVICE MUTUAL
16
MANAgEMENT’S RESPONSIbILITy FOR ThE CONSOLIDATED FINANCIAL STATEMENTS
The consolidated financial statements of La Capitale Civil Service Mutual (the “Mutual”) have been approved by the Board of Directors of the Mutual. These consolidated financial statements have been prepared in accordance with International Financial Reporting Standards and contain certain amounts based on management’s best estimates and judgment within reasonable limits of materiality. In management’s opinion, the significant accounting policies are appropriate and present fairly, in all material respects, the Mutual’s financial position and the results of its operations.
In discharging its responsibilities with regard to the financial statements, management maintains internal control systems that provide reasonable assurance that transactions are authorized, proper financial records are maintained and assets are safeguarded. These control systems are strengthened by the work of the internal auditors who conduct a periodic review of all of the key lines of business of the Mutual.
The Appointed Actuary, designated by the Board of Directors of every insurance company under the Insurance Act (Quebec), is responsible for ensuring that the assumptions made and the methods used to calculate insurance contract liabilities are in accordance with the standards of practice of the Canadian Institute of Actuaries. The Appointed Actuary must issue an opinion on the adequacy of insurance contract liabilities to meet all policyholder obligations of the Mutual at the balance sheet date.
The independent auditors, Ernst & Young LLP, appointed by the members, are responsible for carrying out an independent audit of these consolidated financial statements in accordance with Canadian generally accepted auditing standards and reporting on the fairness of the presentation of the consolidated financial statements of the Mutual.
On behalf of management,
René Rouleau Chairman of the Board and Chief Executive Officer
Quebec City, February 28, 2012

2011 ANNUAL REPORT I CONSOLIDATED FINANCIAL STATEMENTS LA CAPITALE CIVIL SERVICE MUTUAL
17
INDEPENDENT AUDITORS’ REPORT
To the Members of La Capitale Civil Service Mutual
We have audited the accompanying consolidated financial statements of La Capitale Civil Service Mutual (the “Mutual”), which comprise the consolidated statement of financial position as at December 31, 2011 and 2010 and as at January 1, 2010 and the consolidated statements of income, comprehensive income, changes in equity and cash flows for the years ended December 31, 2011 and 2010, and a summary of significant accounting policies and other explanatory information.
Management’s responsibility for the consolidated financial statements
Management is responsible for the preparation and fair presentation of these consolidated financial statements in accordance with International Financial Reporting Standards, and for such internal control as management determines is necessary to enable the preparation of consolidated financial statements that are free from material misstatement, whether due to fraud or error.
Auditors’ responsibility
Our responsibility is to express an opinion on these consolidated financial statements based on our audits. We conducted our audits in accordance with Canadian generally accepted auditing standards. Those standards require that we comply with ethical requirements and plan and perform the audit to obtain reasonable assurance about whether the consolidated financial statements are free from material misstatement.
An audit involves performing procedures to obtain audit evidence about the amounts and disclosures in the consolidated financial statements. The procedures selected depend on the auditors’ judgment, including the assessment of the risks of material misstatement of the consolidated financial statements, whether due to fraud or error. In making those risk assessments, the auditors consider internal control relevant to the entity’s preparation and fair presentation of the consolidated financial statements in order to design audit procedures that are appropriate in the circumstances, but not for the purpose of expressing an opinion on the effectiveness of the entity’s internal control. An audit also includes evaluating the appropriateness of accounting policies used and the reasonableness of accounting estimates made by management, as well as evaluating the overall presentation of the consolidated financial statements.
We believe that the audit evidence we have obtained in our audits is sufficient and appropriate to provide a basis for our audit opinion.
Opinion
In our opinion, the consolidated financial statements present fairly, in all material respects, the financial position of La Capitale Civil Service Mutual as at December 31, 2011 and 2010 and as at January 1, 2010 and of its financial performance and its cash flows for the years ended December 31, 2011 and 2010 in accordance with International Financial Reporting Standards.
Chartered Accountants
Quebec City, Canada February 28, 2012
1. CA auditor permit no. 13102

2011 ANNUAL REPORT I CONSOLIDATED FINANCIAL STATEMENTS LA CAPITALE CIVIL SERVICE MUTUAL
18
CONSOLIDATED STATEMENT OF FINANCIAL POSITION
AS AT [in thousands of Canadian dollars]
ASSETSDecember 31, 2011 December 31, 2010 January 1, 2010
Investments [note 5] Cash and cash equivalents $90,995 $97,593 $84,062Bonds 1,793,886 1,589,149 1,505,836Stocks 672,260 597,861 411,256Mortgage loans 498,832 483,889 490,216Investment properties 181,922 177,761 149,719Policy loans 29,775 28,409 26,775Other investments 61,501 47,585 42,790
$3,329,171 $3,022,247 $2,710,654Premiums receivable 377,750 347,914 316,250Reinsurance assets [notes 6, 15 and 16] 159,413 143,638 134,450Income taxes receivable 41,842 28,472 6,782Deferred taxes [note 7] 12,831 16,490 18,672Deferred premium acquisition costs [note 8] 42,765 52,204 40,366Other assets [note 9] 71,381 62,955 75,343Employee future benefits [note 20] 17,976 2,368 —Property and equipment [note 10] 105,670 72,881 56,658Intangible assets [note 11] 67,569 65,950 58,435Goodwill [note 12] 101,140 101,140 101,140
TOTAL ASSETS $4,327,508 $3,916,259 $3,518,750
On behalf of the Board of Directors,
René Rouleau, Chairman of the Board
Dominique Dubuc, Vice-Chairman of the Board

2011 ANNUAL REPORT I CONSOLIDATED FINANCIAL STATEMENTS LA CAPITALE CIVIL SERVICE MUTUAL
19
LIABILITIESDecember 31, 2011 December 31, 2010 January 1, 2010
Life and health insurance contract liabilities [note 15]Actuarial liabilities $2,340,461 $2,061,682 $1,849,448Provisions for benefits incurred 34,307 26,397 24,035Provisions for dividends and experience rating refunds 34,831 26,680 18,226Policyholder amounts on deposit 48,060 47,168 46,367
$2,457,659 $2,161,927 $1,938,076Property and casualty insurance contract liabilities [note 16]
Unearned premiums $493,179 $462,109 $409,140Provision for claims and loss adjustment expenses 302,453 314,948 279,456
$795,632 $777,057 $688,596$3,253,291 $2,938,984 $2,626,672
Accrued liabilities 117,327 108,073 111,936Other liabilities [note 17] 112,118 99,926 76,117Income taxes payable 1,489 963 19,566Deferred taxes [note 7] 37,515 29,423 28,441Employee future benefits [note 20] 13,164 11,735 26,572Long-term debt [note 18] 23,939 22,174 7,000
$3,558,843 $3,211,278 $2,896,304
EQUITYRetained earnings attributable to members $450,518 $413,196 $372,948Accumulated other comprehensive income attributable
to members 16,464 16,049 6,825$466,982 $429,245 $379,773
Participating policyholders’ account 157,728 145,655 129,344Non-controlling interests 143,955 130,081 113,329
$768,665 $704,981 $622,446
TOTAL LIABILITIES AND EQUITY $4,327,508 $3,916,259 $3,518,750
Commitments [note 25]
Contingencies [note 26]
The accompanying notes are an integral part of these consolidated financial statements

2011 ANNUAL REPORT I CONSOLIDATED FINANCIAL STATEMENTS LA CAPITALE CIVIL SERVICE MUTUAL
20
CONSOLIDATED STATEMENT OF INCOME
FOR ThE YEARS ENDED DECEMBER 31 [in thousands of Canadian dollars]
2011 2010RevenuesInsurance and annuity premiums $1,416,637 $1,315,227Insurance and annuity premiums ceded to reinsurers (63,025) (61,596)Net insurance and annuity premiums $1,353,612 $1,253,631Investment income [notes 22 and 28] 294,257 249,198Fees, commissions and royalties [note 28] 17,874 17,912Other revenues [note 28] 1,079 4,385
$1,666,822 $1,525,126
Policy benefits and expensesBenefits and claims incurred $873,742 $844,028Benefits and claims ceded to reinsurers (36,523) (29,738)Net benefits and claims $837,219 $814,290Participating policyholder dividends 12,969 12,392Experience rating refunds 15,616 13,005Changes in actuarial liabilities [note 15] 278,779 212,234Changes in reinsurance assets [note 15] (17,057) (4,005)
$1,127,526 $1,047,916Commissions 151,482 111,292Premium taxes 38,512 35,656Finance costs 2,984 1,485General expenses [note 28] 240,651 214,918Investment management costs 24,754 21,932
$1,585,909 $1,433,199
Income before income taxes $80,913 $91,927Income taxes [note 7] 15,208 25,293NET INCOME $65,705 $66,634
Attributable to members of the Mutual $35,946 $38,929Attributable to participating policyholders 14,550 13,870Attributable to non-controlling interests 15,209 13,835
$65,705 $66,634
The accompanying notes are an integral part of these consolidated financial statements

2011 ANNUAL REPORT I CONSOLIDATED FINANCIAL STATEMENTS LA CAPITALE CIVIL SERVICE MUTUAL
21
CONSOLIDATED STATEMENT OF COMPREhENSIVE INCOME
FOR ThE YEARS ENDED DECEMBER 31 [in thousands of Canadian dollars]
2011 2010
Net income $65,705 $66,634
Other comprehensive income, net of income taxes
Unrealized gains for the year on available-for-sale financial assets, net of income taxes of $5,381 [2010: $9,817] $13,738 $23,673
Reclassification of realized gains to net income, net of income taxes of $5,373 [2010: $3,093] (13,624) (7,250)
Share of other comprehensive income of joint ventures (12) —$102 $16,423
COMPREHENSIVE INCOME $65,807 $83,057
Attributable to members of the Mutual $36,361 $48,153Attributable to participating policyholders 13,449 17,630Attributable to non-controlling interests 15,997 17,274
$65,807 $83,057
The accompanying notes are an integral part of these consolidated financial statements

2011 ANNUAL REPORT I CONSOLIDATED FINANCIAL STATEMENTS LA CAPITALE CIVIL SERVICE MUTUAL
22
CONSOLIDATED STATEMENT OF ChANgES IN EqUITy
FOR ThE YEARS ENDED DECEMBER 31 [in thousands of Canadian dollars]
Retained earnings
attributable to members1
Accumulated other
comprehensive income
attributable to members
Total retained earnings and accumulated
other comprehensive
income attributable to members
Retained earnings
attributable to participating policyholders
Accumulated other
comprehensive income
attributable to participating policyholders
Total participating
policyholders’ account
Non-controlling interests Total equity
Balance as at January 1, 2010 $372,948 $6,825 $379,773 $132,184 $(2,840) $129,344 $113,329 $622,446Net income $38,929 $ — $38,929 $13,870 $ — $13,870 $13,835 $66,634Other comprehensive income,
net of income taxes — 9,224 9,224 — 3,760 3,760 3,439 16,423Total comprehensive income $38,929 $9,224 $48,153 $13,870 $3,760 $17,630 $17,274 $83,057
Transfer of funds from participating policies to retained earnings $1,319 $ — $1,319 $(1,319) $ — $(1,319) $ — $ —
Increase in non-controlling interests — — — — — — 1,901 1,901
Dividends paid to non-controlling interests — — — — — — (1,647) (1,647)
Changes in non-controlling interests — — — — — — (17) (17)
Other — — — — — — (759) (759)$1,319 $ — $1,319 $(1,319) $ — $(1,319) $(522) $(522)
Balance as at December 31, 2010 $413,196 $16,049 $429,245 $144,735 $920 $145,655 $130,081 $704,981
Balance as at January 1, 2011 $413,196 $16,049 $429,245 $144,735 $920 $145,655 $130,081 $704,981Net income $35,946 $ — $35,946 $14,550 $ — $14,550 $15,209 $65,705Other comprehensive income,
net of income taxes — 415 415 — (1,101) (1,101) 788 102Total comprehensive income $35,946 $415 $36,361 $14,550 $(1,101) $13,449 $15,997 $65,807
Transfer of funds from participating policies to retained earnings $1,376 $ — $1,376 $(1,376) $ — $(1,376) $ — $ —
Decrease in non-controlling interests — — — — — — (108) (108)
Dividends paid to non-controlling interests — — — — — — (1,781) (1,781)
Changes in non-controlling interests — — — — — — (504) (504)
Other — — — — — — 270 270$1,376 $ — $1,376 $(1,376) $ — $(1,376) $(2,123) $(2,123)
Balance as at December 31, 2011 $450,518 $16,464 $466,982 $157,909 $(181) $157,728 $143,955 $768,665
1. During the fiscal year, the Mutual allocated an amount of $954 [December 31, 2010: $907] to the optional reserve for earthquakes under retained earnings. The reserve totalled $9,151 [December 31, 2010: $8,197] [January 1, 2010: $7,290].
The accompanying notes are an integral part of these consolidated financial statements

2011 ANNUAL REPORT I CONSOLIDATED FINANCIAL STATEMENTS LA CAPITALE CIVIL SERVICE MUTUAL
23
CONSOLIDATED STATEMENT OF CASh FLOwS
FOR ThE YEARS ENDED DECEMBER 31 [in thousands of Canadian dollars]
2011 2010OPERATING ACTIVITIESNet income $65,705 $66,634Items not affecting cash and cash equivalents:
Changes in actuarial liabilities 278,779 212,234Changes in unearned premiums 31,070 52,969Changes in reinsurance assets (15,775) (9,188)Changes in net discounts on investments (36,726) (37,707)Changes in fair value of investments designated as at fair value through net income (122,489) (97,368)Realized gains on available-for-sale financial assets (18,997) (10,343)Share of net income of joint ventures (227) (585)Deferred taxes 10,539 2,306Amortization of deferred premium acquisition costs 91,366 72,023Net employee future benefit expense 12,468 5,425Amortization of property and equipment 6,102 5,794Amortization of intangible assets 9,070 9,721Other items included in net income (1,379) (580)
Taxes paid (16,771) (67,979)$292,735 $203,356
Net change in other items related to operating activities (109,635) (39,925)Cash flows related to operating activities $183,100 $163,431
INVESTING ACTIVITIESPurchase of stocks and bonds $(1,126,573) $(954,742)Stock and bond sales and maturities 1,025,104 853,554Issue of mortgage loans and advances (295,519) (214,572)Maturities, sales and repayments of mortgage loans and advances and securitization 269,442 213,891Additions to investment properties (4,161) (7,009)Net acquisition of other investments and other assets (3,105) (716)Withdrawals under joint ventures 276 276Net additions to property and equipment (38,689) (21,709)Additions to intangible assets (11,856) (17,723)Business acquisitions net of cash and cash equivalents [note 24] — (4,092)Cash flows related to investing activities $(185,081) $(152,842)
FINANCING ACTIVITIESIncrease in long-term debt $1,990 $ —Repayment of long-term debt (225) —Changes in non-controlling interests (504) (17)Dividends paid to non-controlling interests (1,781) (1,647)Interest paid on long-term debt (1,391) (445)Cash flows related to financing activities $(1,911) $(2,109)
Net increase (decrease) in cash and cash equivalents $(3,892) $8,480Cash and cash equivalents, beginning of year 92,542 84,062Cash and cash equivalents, end of year1 $88,650 $92,542
1. Consisting of:Cash and cash equivalents $90,995 $97,593Excess of outstanding cheques over cash [note 17] (2,345) (5,051)
$88,650 $92,542
The accompanying notes are an integral part of these consolidated financial statements

2011 ANNUAL REPORT I NOTES TO CONSOLIDATED FINANCIAL STATEMENTS LA CAPITALE CIVIL SERVICE MUTUAL
24
NOTES TO CONSOLIDATED FINANCIAL STATEMENTS
DECEMBER 31, 2011
[in thousands of Canadian dollars]
1) INCORPORATING STATUTE AND NATURE OF OPERATIONS
La Capitale Civil Service Mutual (“the Mutual”), incorporated on December 6, 1991 under the Act respecting the Québec Civil Servants Mutual Life, is a mutual management corporation.
Its operations are carried out mainly in Canada through its subsidiaries and consist principally of life and health insurance and property and casualty insurance.
The Mutual is headquartered at 625 Saint-Amable Street, Quebec City, Quebec, Canada.
2) SIGNIFICANT ACCOUNTING POLICIES
Statement of compliance
The financial statements of the Mutual have been prepared in accordance with International Financial Reporting Standards (“IFRS”) as issued by the International Accounting Standards Board (“IASB”). The IFRS adoption date for the Mutual is January 1, 2011. Comparative information was restated to comply with the adopted IFRS.
These financial statements were approved for issue by the Board of Directors of the Mutual on February 28, 2012.
Basis of preparation
The financial statements have been prepared on an historic cost basis except for investment properties, held-for-trading financial instruments, financial instruments designated at fair value through profit and loss and available-for-sale financial instruments that have been measured at fair value.
The Mutual presents its statement of financial position broadly in order of liquidity.
Assets are considered as current when the Mutual expects to realize them in its normal operating cycle within twelve months after the reporting date. Liabilities are considered as current when the Mutual expects to settle them in its normal operating cycle within twelve months after the reporting date. All other assets and liabilities are considered as non-current. The Mutual’s statement of financial position is not presented using current and non-current classification.
The following statement of financial position items are typically considered as current: cash and cash equivalents, premiums receivable, reinsurance assets, income taxes receivable, deferred premium acquisition costs, other assets, provisions for benefits incurred, provisions for dividends and experience rating refunds, policyholder amounts on deposit, unearned premiums, accrued liabilities, other liabilities and income taxes payable.
The following statement of financial position items are typically considered as non-current: bonds, stocks, mortgage loans, investment properties, policy loans, other investments, deferred taxes, employee future benefits, property and equipment, intangible assets, goodwill, actuarial liabilities, provision for claims and loss adjustment expenses, and long-term debt.
The significant accounting policies used to prepare the consolidated financial statements are summarized below.
Basis of consolidation
The consolidated financial statements include the accounts of the Mutual and those of its subsidiaries. The investment in joint ventures has been accounted for using the equity method.
Investments
Financial instruments are recorded at fair value at acquisition. Subsequent remeasurements will depend on the category in which financial instruments were initially classified. The transaction costs of assets classified as held for trading and designated at fair value through profit and loss and assets classified as available for sale are recognized in income. Transaction costs of assets classified as loans and receivables are capitalized and amortized using the effective interest method.
Cash and cash equivalents
Cash and cash equivalents classified as held for trading consist of cash, short-term deposits and bankers’ acceptances. Short-term deposits and bankers’ acceptances are classified as cash equivalents when the period between the acquisition date and maturity is less than three months. The excess of outstanding cheques over cash is accounted for under other liabilities.
Stocks and bonds
The Mutual has elected to designate stocks and bonds backing life and health insurance contract liabilities at fair value through profit or loss. Life and health insurance contract liabilities are determined using the Canadian asset liability method and the changes in fair value of assets backing the life and health insurance contract liabilities are included directly in life and health insurance contract liabilities. Changes in fair value of held-for-trading assets backing the liabilities and changes in life and health insurance contract liabilities are charged directly to income, thereby avoiding an accounting mismatch. Stocks and bonds that are not used to cover life and health insurance contract liabilities are classified as available for sale.

2011 ANNUAL REPORT I NOTES TO CONSOLIDATED FINANCIAL STATEMENTS LA CAPITALE CIVIL SERVICE MUTUAL
25
Stocks and bonds classified as available for sale are recorded at fair value. Unrealized gains and losses are recognized in other comprehensive income except when there is objective evidence of impairment, in which case the impairment loss is recognized in income. When realized, gains and losses are reclassified to income.
Financial instruments classified as available for sale are tested for impairment and, when there is evidence of impairment and the decline in value is significant or prolonged, any loss recognized in accumulated other comprehensive income is considered reclassified to income. An impairment loss recorded in the statement of income may be reversed through profit or loss, in the case of a debt instrument, if its fair value increases during a subsequent period and the increase can be objectively related to an event occurring after the impairment loss was recognized. Financial instruments continue to be recognized at fair value even if an impairment loss has been recorded. Any subsequent declines in value for impaired financial instruments are recognized in income.
The Mutual uses settlement date accounting for regular-way purchases and sales of financial assets. Under this method, any gains or losses between the transaction and settlement dates are recognized in income for held-for-trading assets and in other comprehensive income for available-for-sale assets.
Fair values for stocks and bonds are determined with reference to market bid prices where available. Where bid prices cannot be obtained, fair value is determined using valuation techniques that factor in the interest rate particular to each security and discounted cash flows, and are based on indirectly observable market data.
Mortgage loans
Mortgage loans are classified as loans and receivables and reported at amortized cost using the effective interest method. Amortized cost is the amount at which the mortgage loan is initially recognized less any principal repayments, plus or minus accumulated amortization determined using the effective interest method and less any allowance for losses. Realized gains and losses on disposal of these securities are recognized through income. The fair value of mortgage loans is determined primarily by discounting future cash flows using market interest rates for loans with similar terms and conditions.
Commissions paid and other mortgage acquisition costs incurred are recognized and presented under mortgage loans. These costs are amortized using the effective interest method.
Mortgage loan securitization
The Mutual periodically securitizes pools of insured mortgage loans that meet the criteria of the National housing Act (“NhA”) program of the Canada Mortgage and housing Corporation (“CMhC”). As part of these securitization transactions and as required by the NhA’s Mortgage-Backed Securities Program (“NhA MBS”), the Mutual transfers substantially all the risks and rewards related to the loans ceded to a third party and complies with the criteria of derecognizing ceded mortgage loans.
Furthermore, prior to January 1, 2010, the Mutual carried out securitization transactions under the CMhC’s Canada Mortgage Bond (“CMB”) Program. The Mutual applied the exemption allowed by IFRS 1 and derecognized its CMB and NhA MBS securitization transactions carried out before January 1, 2010.
In securitization transactions, the Mutual retains a portion of the future interest that will be paid by the borrower whose mortgage loan was sold, accounting for this future revenue, net of servicing expenses, as retained interests.
The fair value of retained interests is calculated using the discounted value of expected future cash flows based on assumptions concerning prepayments, servicing expenses and discount rates. Retained interests are classified as held for trading and reported at fair value.
Gains and losses arising from securitization are recorded to the extent of the excess or shortfall of the consideration received over the carrying amount allocated to the assets sold. These gains and losses are recognized through income and included in investment income.
Investment properties
Investment properties are accounted for at fair value. The fair values of investment properties are determined by valuations prepared by chartered appraisers or by Mutual personnel and are revised annually. Realized and unrealized gains and losses on investment properties are recognized through income.
Policy loans
Policy loans classified under loans and receivables are recorded at amortized cost and are fully secured by the cash surrender value of the insurance policies on which the respective loans are granted. The fair value of policy loans approximates their carrying amount due to their short-term maturity.
Other investments
Other investments include personal loans, other loans, properties held for resale, investments in joint ventures, and other investments, including investments in private companies and a limited partnership. Personal loans and other loans are classified as loans and receivables and recognized at amortized cost using the effective interest method. The fair value of these personal and other loans is determined by discounting future cash flows using market interest rates for loans with similar terms and conditions. Properties held for resale is measured at the lower of fair value less cost to sell and the carrying value of underlying mortgage loans at foreclosure date. When the fair value of a property held for resale is less than the carrying value of underlying mortgage loans at the foreclosure date, losses are immediately recognized through income. Realized gains and losses on the disposal of such real estate are recognized through income for the year. Investments in joint ventures have been accounted for using the equity method. Investments in the other private companies classified as available for sale are recorded at cost where no active market exists. The investment in the limited partnership is accounted for at fair value.
Provisions for impairment of debt securities
The Mutual maintains provisions for impairment on mortgage loans, personal loans and other loans. Evidence of impairment arises when there is reasonable doubt as to the timely collection of the principal or interest on a debt security or if a payment is over 90 days past due. When an asset is classified as impaired, an estimated allowance for losses is established to adjust the asset’s carrying amount based on its net recoverable amount. Furthermore, interest on impaired assets is no longer accrued.

2011 ANNUAL REPORT I NOTES TO CONSOLIDATED FINANCIAL STATEMENTS LA CAPITALE CIVIL SERVICE MUTUAL
26
2) SIGNIFICANT ACCOUNTING POLICIES [Cont’d]
Reinsurance assets
The Mutual enters into reinsurance agreements with other insurers to limit risks related to its insurance contracts. Reinsurance assets represent balances due from insurance companies with respect to liabilities relating to ceded insurance contracts. Amounts recoverable are estimated based on actuarial liabilities and provisions for claims related to the underlying insurance contracts in accordance with reinsurance agreements.
Reinsurance assets are reviewed for impairment at each reporting date or more frequently if an indication of impairment arises during the reporting year. An impairment loss is recognized when there is objective evidence that the Mutual may not receive all outstanding amounts due under the terms of the agreement and that the unrecoverable amount can be estimated reliably.
Income taxes
The income tax expense (benefit) comprises current taxes and deferred taxes. Income taxes are recognized through profit or loss except to the extent that they relate to items recognized in other comprehensive income or directly in equity.
Current income tax is based on the results of operations in the current year, adjusted for items that are not taxable or not deductible. Current income tax is calculated based on income tax laws and rates enacted or substantively enacted as at the reporting date. Provisions are established where appropriate on the basis of amounts expected to be paid to the tax authorities.
Deferred tax assets and liabilities are recorded based on temporary differences between the financial statement carrying amount and the corresponding tax basis. These deferred income tax assets and liabilities are calculated using enacted or substantively enacted tax rates that are expected to be in effect when the assets are realized or the liabilities settled in future years. Deferred tax assets are recognized only if management deems it likely that deferred tax assets will be realized.
Deferred premium acquisition costs
Deferred premium acquisition costs include commissions and taxes on premiums and are recorded at amortized cost over the term of the relevant insurance contract provided that they are recoverable. They are considered recoverable to the extent that unearned premiums and investment income, net of projected losses, loss adjustment expenses and administrative costs, exceed deferred charges.
Other assets
Other assets consist of other financial assets and the other asset. Other financial assets consist of retained interests in securitized loans, investment income receivable, cash in trust, amounts due from reinsurers in the property and casualty insurance segment, subrogation and other receivables. The other asset comprises prepaid expenses.
Investment income receivable, amounts due from reinsurers in the property and casualty insurance segment, subrogation and other receivables are classified as loans and receivables and recognized at amortized cost using the effective interest method. The fair value of these items approximates their carrying amount due to their short-term maturities. Cash in trust and retained interests are classified as held for trading and recognized at fair value.
Employee future benefits
The Mutual offers defined benefit and defined contribution pension plans and post-employment benefits to its employees. The cost of pension benefits under defined benefit plans and of other post-employment benefits earned by employees is determined according to actuarial calculations using the projected unit credit method and management’s most likely assumptions of expected plan investment performance, salary escalation, the retirement age of employees and expected health care costs. Plan obligations are discounted based on current market interest rates, and plan assets are recorded at fair value.
The excess of net actuarial gain or loss over 10% of the greater of the benefit obligation and the fair value of plan assets is amortized over the average remaining service life of employees.
For defined contribution plans, the Mutual pays specified contributions into a separate entity and has no legal or constructive obligation to pay further amounts. As a result, no liability appears on the Mutual’s consolidated financial statements, except for the expense recognized for contributions due but not yet paid at the end of the reporting period. Contributions payable to defined contribution plans are charged to income.
Property and equipment
Property and equipment comprise land, own-use properties, the building under construction, furniture, automotive and other equipment, computer hardware and leasehold improvements and are recorded at cost, net of accumulated amortization and impairment losses.
The cost consists of the purchase price and all costs directly attributable to the construction of the asset or its installation. Subsequent costs, excluding day-to-day maintenance costs, are included in the carrying amount of property and equipment.
Amortization is calculated on a straight-line basis and periodically recognized in the statement of income. Components of own-use properties are amortized over their estimated useful life, taking into account their residual value. The useful lives of components of own-use properties as determined for amortization purposes vary between 20 and 100 years. Realized gains and losses on disposal of property and equipment are recognized through income for the year.

2011 ANNUAL REPORT I NOTES TO CONSOLIDATED FINANCIAL STATEMENTS LA CAPITALE CIVIL SERVICE MUTUAL
27
Amortization is periodically charged to income according to the following useful lives.
Category Useful lifeOwn-use properties 20–100 yearsFurniture, automotive equipment and other 3–10 yearsComputer hardware 3–5 yearsLeasehold improvements 5 years and lease term
Amortization methods used, useful lives and the residual value of property and equipment are reviewed annually. Any changes are recognized prospectively.
Amortization is recognized under general expenses in the statement of income.
Intangible assets
The cost of intangible assets is the fair value at the acquisition date. Subsequently, intangible assets are recorded at cost less accumulated amortization and any accumulated impairment losses. Internally generated intangible assets and software under development are recorded at the lower of incurred development costs and future economic benefits. Software is amortized when implemented.
Intangible assets consist of indefinite-life intangible assets, namely trademarks, and finite-life intangible assets, namely the client base, distribution networks and software. Indefinite-life intangible assets are not amortized.
Finite-life intangible assets are amortized on a straight-line basis as follows:
Useful lifeClient base and distribution networks 30 months–18 yearsSoftware 3–15 years
Amortization methods used, useful lives and the residual value of property and equipment are reviewed annually. Any changes are recognized prospectively.
Amortization is recognized under general expenses in the statement of income.
Impairment of long-lived assets
Where significant circumstances or events indicate a possible impairment, the Mutual remeasures the carrying amount of long-lived assets. Indefinite-life intangible assets are tested for impairment every year.
An impairment loss is recognized when the carrying amount of an asset exceeds the higher of its fair value less costs to sell and its value in use. The value in use of an asset corresponds to the value of its total discounted cash flows.
Goodwill
Goodwill represents the excess of the cost of businesses acquired over the estimated fair value of their net identifiable assets. After initial recognition, goodwill is measured at cost less any accumulated impairment losses.
Goodwill is tested for impairment at least once a year for each cash-generating unit (“CGU”) or group of CGUs or when events or changes in circumstances indicate that its carrying amount may not recoverable. A CGU is made of the smallest group of assets that can generate largely independent cash flows and corresponds either to an operating segment or to a lower level. Any impairment of goodwill is identified by comparing the recoverable amounts of a CGU or a group of CGUs with its carrying amount.
The recoverable amount of a CGU is defined as the higher of its estimated fair value less costs to sell and its value in use. In assessing value in use, estimated future cash flows are discounted to their present value using a pre-tax discount rate that reflects current market assessments of the time value of money and the risks specific to the asset.
Classification of insurance contracts
The contracts issued by the Mutual are classified as insurance contracts, investment contracts or service contracts. Contracts under which the Mutual accepts to assume significant insurance risk of policyholders are classified as insurance contracts. A contract is considered as transferring significant insurance risk if, and only if, an insured event could cause an insurer to pay significant additional benefits in any scenario. Contracts under which the Mutual does not assume significant insurance are classified as investment contracts or service contracts.
Investment contracts are contracts that transfer financial risk but not significant insurance risk. Service contracts are contracts under which the Mutual offers administrative services.
Financial risk is the risk of a possible future change in one or more of the following elements: specified interest rate, financial instrument price, foreign exchange rate, index of price or rates, credit rating or credit index or other variable, provided in the case of a non-financial variable that the variable is not specific to a party to the contract.
Once a contract has been classified as an insurance contract, it remains an insurance contract for the remainder of its lifetime, even if the insurance risk reduces significantly during this period, unless all rights and obligations are extinguished or expire. Investment contracts can, however, be reclassified as insurance contracts after inception if insurance risk becomes significant.
Certain insurance contracts contain discretionary participation features under which policyholders are entitled to receive additional benefits based on actual performance of assets.
Unpaid balances of dividends and refunds are accounted for in provisions for dividends and experience rating refunds under liabilities.

2011 ANNUAL REPORT I NOTES TO CONSOLIDATED FINANCIAL STATEMENTS LA CAPITALE CIVIL SERVICE MUTUAL
28
2) SIGNIFICANT ACCOUNTING POLICIES [Cont’d]
Actuarial liabilities
Actuarial liabilities represent the amount that, when added to premiums and future investment income, secures current policy commitments. These actuarial liabilities are determined using the Canadian Asset Liability Method (“CALM”), which is generally accepted actuarial practice established by the Canadian Institute of Actuaries (“CIA”).
The CALM involves projecting asset and liability cash flows for each business segment under a set of prescribed interest rates, plus additional scenarios chosen by the Appointed Actuary, if applicable. Net cash flows are invested in new assets, if positive, or assets are sold or borrowed against to meet cash needs in accordance with the assumptions of each scenario. The reinvestment strategies are founded on investment policies for each segment and the reinvestment returns are drawn from the underlying scenarios. The insurance contract liabilities are at least as great as the liabilities determined under the worst of the scenarios tested.
This method meets the minimum requirements of the liability adequacy test, i.e. it uses current estimates of all contractual cash flows, related cash flows, and the total inadequacy is recognized in the statement of income.
Property and casualty insurance contract liabilities
Unearned premiums are calculated on a pro rata basis, based on the unexpired portion of the premiums written. At the end of each reporting period, a liability adequacy test is performed to ensure the adequacy of unearned premiums and deferred policy acquisition costs. A premium deficiency results when unearned premiums are considered insufficient to cover the estimated future costs for the unexpired portion of the insurance contracts written. A premium deficiency is recognized immediately as a reduction of deferred premium acquisition costs to the extent that the aggregate amount of unearned premiums and the expected investment income is considered inadequate to cover all the deferred premium acquisition costs and related claims and insurance expenses. If the premium deficiency exceeds the unamortized deferred policy acquisition costs, a liability is recognized with regard to the excess deficiency.
The provision for claims and loss adjustment expenses is initially determined on a case-by-case basis for each claim reported and includes an additional amount based on the estimate of claims incurred but not reported. The provision is recorded on a discounted basis. Claims and loss adjustment expenses are charged to income as incurred until contract expiry, whether through settlement or termination.
The provision for claims and loss adjustment expenses is estimated on a gross basis without taking into account recoveries from reinsurers and net of recoveries from reinsurers. It also includes a provision for adverse deviation, as required by Canadian accepted actuarial practice. This estimate is based on the assumption that future changes in claims will be comparable to the historical experience. The analysis also includes assumptions regarding future claims, the average claim cost, inflation and other relevant factors. The provisions for internal and external loss adjustment expenses are estimated based on the historical relationship between these expenses and claims. If past experience is not applicable to current claims, either due to changes in practices or a new line of business, additional assumptions must be made to take into account three major variables or values: future claims, reinsurance recoveries and future investment income.
The provision for claims and loss adjustment expenses and the related reinsurers’ share are estimates subject to variability during the year. These variations are due to events affecting the ultimate settlement of claims, but which have not yet occurred and may not occur for some time. These variations may also be caused by additional information regarding the claims, by changes in court interpretations of policies, or by significant differences in claim severity and frequency relative to historical trends. The estimates are based on the experience of the Mutual’s subsidiaries.
According to management, the estimation methods used produce reasonable results based on the data currently available.
Accrued liabilities and other liabilities
Accrued liabilities and other liabilities are classified in other liabilities and recognized at amortized cost, except for the excess of outstanding cheques over cash and amounts payable under the stock appreciation rights plan, which are recorded at fair value. Other liabilities consist of other financial liabilities and other liabilities items. Other financial liabilities include other amounts on deposit, the loyalty, stabilization and development fund, the excess of outstanding cheques over cash, deposits for taxes, amounts due to reinsurers in the life and health insurance and property and casualty insurance segments, deposits in trust, and liabilities related to derivative financial instruments. Other liabilities items comprise amounts payable under the stock appreciation rights plan and deferred revenues. The fair value of accrued liabilities and other liabilities approximates their carrying amount due to their short-term maturities.
Long-term debt
Long-term debt is classified under other liabilities and recorded at amortized cost using the effective interest method. Long-term debt comprises a debenture, a construction loan and a mortgage loan.
Revenue recognition
Life and health insurance and annuity premiums are recorded in full as revenues as they fall due under existing policies.
Premiums written for property and casualty insurance are recorded in revenues over the term of each policy on a pro rata basis.
Dividends are recognized when shareholders become entitled to receive the payment, i.e., on the ex-dividend date. Interest income from debt securities and loans are recognized on an accrual basis. Dividends received and interest income are included in gross investment income. Rental income from investment properties is recognized on an accrual basis and reported under investment income.

2011 ANNUAL REPORT I NOTES TO CONSOLIDATED FINANCIAL STATEMENTS LA CAPITALE CIVIL SERVICE MUTUAL
29
Stock appreciation rights plan
The stock appreciation rights plan is valued using the Black-Scholes model, which is based mainly on the risk-free interest rate, the expected return volatility on La Capital Financial Group Inc. stock and the average expected life of stock appreciation rights.
Stock appreciation rights plan expense is charged to income for the year when the return on shares is earned under the plan of La Capital Financial Group Inc. Accrued plan expense is reported under other liabilities.
Derivative financial instruments
The Mutual uses derivative financial instruments to manage interest rate risk. In connection with asset-liability matching and to hedge against interest rate risk related to mortgage loans that have been or are being securitized, the Mutual uses interest rate [reverse] repurchase agreements. Derivative financial instruments are recognized at fair value, and changes in fair value are recognized in income. Any gains or losses realized on these derivatives offset the losses or gains recognized on the pool of CMB securitized mortgage loans as a result of changes in interest rates.
Foreign currency translation
The Canadian dollar is the Mutual’s functional currency. Transactions in foreign currencies carried out by the Mutual are translated at the exchange rate in effect on the transaction date. At each reporting date, monetary items are translated at the rates in effect at year-end while non-monetary items are translated at historical exchange rates. Translation gains and losses are included in income for the year.
Changes in accounting policies
IAS 24, Related Party Disclosures
IAS 24 has been amended to simplify the definition of a related party and thus reduce certain inconsistencies. Adopted retroactively by the Mutual during its fiscal year beginning on January 1, 2011, this change had no impact on the Mutual’s consolidated financial statements.
IAS 32, Financial Instruments: Presentation
Revised IAS 32 amends the classification criteria between a financial liability and an equity instrument by allowing certain financial instruments, that include a contractual obligation for the issuing entity to deliver a pro rata share of its net assets to another entity only upon liquidation, to be classified as equity instruments provided they have certain features. The classification criterion is also revised to reflect rights, options and warrants denominated in a foreign currency. The Mutual adopted these changes in its fiscal year beginning on January 1, 2011 and they had no impact on its consolidated financial statements.
IFRIC 14 (IAS 19), The Limit on a Defined Benefit Asset, Minimum Funding Requirements and Their Interaction
IFRIC 14 has been amended to remove an unintended consequence arising from its application. Prior to this amendment, an entity was not permitted to recognize an asset for prepayments of future anticipated contributions in some circumstances where there was a minimum funding requirement. The amendment corrects this issue and allows the recognition of an asset in these circumstances. Adopted retroactively by the Mutual during its fiscal year beginning on January 1, 2011, this change had no impact on the Mutual’s consolidated financial statements.
Improvements to IFRS in 2010
These improvements gave rise to a certain number of changes in disclosure requirements pertaining to the Mutual’s management policies. The changes emphasized disclosure requirements in IFRS 7 while amending other IFRS. The Mutual adopted the improvements in its fiscal year beginning on January 1, 2011 and they had no impact on its consolidated financial statements.
Future accounting policy changes
IFRS 9, Financial Instruments
The IASB has issued IFRS 9, Financial Instruments. This standard represents the first of a three-phase project aimed at replacing IAS 39, Financial Instruments: Recognition and Measurement. This standard applies to the classification and measurement of financial assets and liabilities. The standard is effective for annual periods beginning on or after January 1, 2015 with earlier adoption permitted. The Mutual is currently assessing the impact of changes in this standard on its consolidated financial statements.
IFRS 10, Consolidated Financial Statements; IFRS 11, Joint Arrangements; IFRS 12, Disclosure of Interests in Other Entities
In May 2011, the IASB published three new standards that affect the consolidation of financial statements: IFRS 10, Consolidated Financial Statements, IFRS 11, Joint Arrangements which replaces IAS 31, Interests in Joint Ventures and SIC-13, Jointly Controlled Entities–Non-Monetary Contributions by Venturers and IFRS 12, Disclosure of Interests in Other Entities. Two other standards were amended at the same time: IAS 27, Consolidated and Separate Financial Statements and IAS 28, Investments in Associates and Joint Ventures. These standards will apply to financial statements for annual periods beginning on or after January 1, 2013. Early adoption is permitted, however, they must be adopted at the same time as IFRS 10, IFRS 11 and IFRS 12 as well as the revised version of IAS 27 and IAS 28. The Mutual is currently assessing the impact of the adoption of these new standards on its consolidated financial statements.
These new standards carry forward the existing principles governing how control is determined to identify whether or not an entity must be included in the financial statements of another entity. The standard provides additional guidance for cases where control is difficult to determine.

2011 ANNUAL REPORT I NOTES TO CONSOLIDATED FINANCIAL STATEMENTS LA CAPITALE CIVIL SERVICE MUTUAL
30
2) SIGNIFICANT ACCOUNTING POLICIES [Cont’d]
Future accounting policy changes [Cont’d]
IFRS 11, Joint Arrangements; IAS 27, Consolidated and Separate Financial Statements; IAS 28, Investments in Associates and Joint Ventures
A joint arrangement is a joint operation whereby an entity has rights and obligations over specific assets and liabilities, or a joint venture whereby an entity holds rights to the net assets of the entity. For a joint operation, the entity must recognize its share of the assets, liabilities, revenues and expenses of the joint operations. For a joint venture, the entity must recognize its interest according to the equity method described in IAS 28, Investments in Associates and Joint Ventures.
IFRS 12, Disclosure of Interests in Other Entities
IFRS 12 is a new comprehensive standard that sets out the disclosure requirements for all types of interests in other entities, including joint ventures, associates, structured entities and other off-balance sheet entities.
IFRS 13, Fair Value Measurement
In May 2011, the IASB issued IFRS 13, Fair Value Measurement. This standard brings further clarification on fair value measurement and disclosures on measuring fair value. The standard is effective for annual periods beginning on or after January 1, 2013 with earlier adoption permitted. The Mutual is currently assessing the impact of changes in this standard on its consolidated financial statements.
IAS 1, Presentation of Financial Statements
On June 16, 2011, the IASB published an amendment to IAS 1, Presentation of Financial Statements, requiring all other comprehensive income items that will be reversed through income to be grouped together in the statement of comprehensive income. The amendment does not affect the amounts that must be recognized in other comprehensive income or the timing of the reversal of these items. The standard is effective for annual periods beginning on or after July 1, 2012 with earlier adoption permitted. The Mutual is currently assessing the impact of these changes on its consolidated financial statements.
IAS 19, Employee Benefits
On June 16, 2011, the IASB published amendments to IAS 19, Employee Benefits. The revised IAS 19 aims to improve employee benefit disclosures and eliminates options for deferring the recognition of actuarial differences by requiring the recognition of such differences in other comprehensive income as they occur. The standard is effective for annual periods beginning on or after January 1, 2013 with earlier adoption permitted. The Mutual is currently assessing the impact of these changes on its consolidated financial statements.
IASB projects
On July 30, 2010, the IASB issued the Exposure Draft on IFRS 4, Insurance Contracts, Phase II, on the valuation and recognition of insurance contracts. The comments period ended on November 30, 2010. Phase II of the standard is not expected to take effect before 2015. Under the IASB’s proposed accounting method for recognizing insurance contracts, insurance liabilities and their matching assets are measured separately. Consequently, these proposals could lead to a substantial increase in insurance contract liabilities and required capital on adoption as well as high volatility of results.
3) SIGNIFICANT JUDGMENTS, ESTIMATES AND ASSUMPTIONS
In preparing these financial statements, management is required to make judgements, estimates and assumptions that affect the amounts reported in the consolidated financial statements and accompanying notes. Actual results may differ from management’s best estimates.
Judgments
In the process of applying the Mutual’s accounting policies, management has made the following judgments that have the most significant effect on the amounts recognized in the financial statements:
Classification of insurance contracts
Insurance contracts are contracts under which the Mutual accepts significant insurance risk from another party (the policyholder) by agreeing to compensate the policyholder if a specific uncertain future event (the insured event) adversely affects the policyholder. Insurance risk is significant if an insured event can require an insurer to pay significant additional benefits under any scenario, except for scenarios that lack commercial substance. The Mutual determines whether there is significant risk by analyzing the features of each type of contract. Once a contract has been classified as an insurance contract, it remains an insurance contract for the remainder of its lifetime, even if the insurance risk reduces significantly during this period.
Loan securitization
As mentioned in note 2, the Mutual securitizes pools of mortgage loans periodically by selling them to trusts. Judgment is required to determine whether these transfers meet the conditions for the derecognition of the financial assets in question. For instance, since the Mutual retains a portion of the future interest paid by the borrower whose mortgage loan has been sold, it must assess to what extent the contractual rights over the cash flows, the risks and rewards of ownership and control over the financial asset have been substantially transferred to a third party.
Classification of properties
The Mutual classifies its properties as investment properties when the proportion of own-use is considered insignificant. This is determined by comparing the rental space occupied for the Mutual’s own purposes with the total rental space. The Mutual classifies properties as own-use properties when the rental space used for its own purposes is significant and then applies the appropriate accounting policies.

2011 ANNUAL REPORT I NOTES TO CONSOLIDATED FINANCIAL STATEMENTS LA CAPITALE CIVIL SERVICE MUTUAL
31
Estimates and assumptions
In the process of applying the accounting policies, management has made the following estimates and assumptions that have the most significant effect on the amounts recognized in the financial statements:
Fair value of financial instruments
Where the fair values of financial assets and financial liabilities reported on the statement of financial position cannot be derived from markets considered active, they are determined using a variety of valuation techniques based on the use of discounted cash flow models. The inputs to these models are derived from observable market data, where possible, but where observable market data is not available, judgment is required to establish liquidity risk, credit risk and the degree of volatility. Changes in assumptions about these factors could affect the fair value of financial assets and liabilities reported in the financial statements.
Fair value of investment properties
The Mutual accounts for its investment properties at fair value and recognizes any changes in fair value through the statement of income. The Mutual relies on fair value valuations prepared by chartered appraisers or Mutual personnel as at the reporting date, i.e. December 31. They use valuation techniques based on discounted future cash flows from rental space, taking into account the lack of comparative market data for comparable properties.
The fair value of investment properties is very sensitive to the rate of return and to the vacancy rate of properties. The main assumptions made to determine the fair value of investment properties are described in note 5.
Impairment of non-financial assets
Non-financial assets such as property and equipment, intangible assets and goodwill are tested for impairment annually or when there are indications of potential impairment. Impairment tests consist in comparing the carrying amount of the asset or CGU in question with its recoverable amount. In most cases, the recoverable amount corresponds to the value in use. To determine the value in use of an asset or a CGU, several assumptions must be made, including the estimation of future cash flows that the Mutual expects to receive and the discount rate.
Future cash flows are determined by making financial projections over five-year periods, excluding any significant restructuring to the investment project that could influence the performance of the asset or the CGU being tested for impairment.
The determined recoverable amount is sensitive to the discount rate used for the discounted cash flow model and to the extrapolated growth rate.
Income taxes
The computation of current and deferred taxes is based on several factors including the interpretation of tax regulations in the jurisdictions in question, assessments regarding the recovery of deferred tax assets and how the assets and liabilities are expected to be recovered. The recovery of deferred tax assets depends, among other factors, on the expected future earnings from the Mutual’s operations and the tax planning strategies developed. The Mutual establishes a provision for income tax it considers reasonable and which is based on the weighted estimate of the possible results from the adopted tax positions. When establishing the provision, the Mutual takes into consideration previous adjustments made by tax authorities, interpretation bulletins and recent rulings rendered in the relevant jurisdictions.
Employee future benefits
The defined benefit obligation and expense is calculated using several demographic and financial actuarial assumptions. The main assumptions include the discount rate, the rate of increase in future compensation, the expected return from plan assets and the growth rate of retiree healthcare costs. These assumptions are described in note 20.
Life and health insurance contract liabilities
The establishment of actuarial liabilities, the related reinsurers’ share, the provisions for benefits incurred and the provisions for dividends and experience rating refunds depends on various actuarial assumptions including the mortality rate, morbidity rate, investment return, policy management costs, deferred taxes, policy lapses and participating policyholder dividends and the margin for adverse deviation. These assumptions are described in note 15.
Property and casualty insurance contract liabilities
The provision for claims and loss adjustment expenses and the related reinsurers’ share are estimates subject to variability during the year. These variations are due to events affecting the ultimate settlement of claims, but which have not yet occurred and may not occur for some time. These variations may also be caused by additional information regarding the claims, by changes in court interpretations of policies, or by significant differences in claim severity and frequency relative to historical trends. The estimates are based on the experience of the Mutual’s subsidiaries. These assumptions are described in note 16.
Stock appreciation rights plan
The stock appreciation rights plan is established using the Black-Scholes model as at the date the rights are granted. The fair value estimate of rights established by the model is sensitive to the volatility and the rate of return. These assumptions are described in note 17.

2011 ANNUAL REPORT I NOTES TO CONSOLIDATED FINANCIAL STATEMENTS LA CAPITALE CIVIL SERVICE MUTUAL
32
4) TRANSITION TO IFRS
As a publicly accountable enterprise as defined by the Canadian Institute of Chartered Accountants, the Mutual adopted International Financial Reporting Standards (“IFRS”) for the fiscal year starting January 1, 2011. Prior to the adoption of IFRS, the Mutual prepared its financial statements according to Canadian generally accepted accounting principles. Under IFRS 1, First-time Adoption of International Financial Reporting Standards, the Mutual applied the new accounting standards retrospectively, excluding the optional exemptions and the mandatory exceptions explained below. The Mutual has prepared an opening statement of financial position as at January 1, 2010. The Mutual’s transactions as of this date have been accounted for using the adopted accounting standards and comparative information has been restated.
IFRS 1 exemption elections
In preparing the opening statement of financial position as at January 1, 2010, the Mutual applied the following exemptions retrospectively:
Business combinations
IFRS 1 allows first-time adopters to choose the date at which IFRS 3, Business Combinations is applied but this must be no later than the IFRS adoption date, i.e., January 1, 2010. The Mutual has elected to adopt IFRS 3 as of the IFRS transition date, i.e., January 1, 2010.
Insurance contracts
IFRS 1 allows first-time adopters to apply the transitional requirements of IFRS 4, Insurance Contracts. The Mutual has elected to maintain the accounting policies used under the previous accounting standards, namely Canadian generally accepted accounting principles, to account for insurance contracts. IFRS 1 also allows the Mutual to disclose information on claims development for the past five years only.
Use of fair value as deemed cost
IFRS 1 allows, on an individual basis, the use of fair value as deemed cost in the opening statement of financial position. This election may be used for property and equipment and intangible assets that are traded on an active market. The Mutual continues to use the cost for property and equipment, except for own-use properties, and for intangible assets. The Mutual has elected to use fair value as deemed cost for own-use properties.
Employee future benefits
IFRS 1 allows first-time adopters to use the corridor method, which involves the non-recognition of a portion of the actuarial gains or losses retrospectively. First-time adopters may also elect to recognize all unamortized cumulative actuarial gains or losses in the retained earnings opening balance as at the transition date. The Mutual elected to recognize, in the consolidated retained earnings opening balance, all unamortized cumulative actuarial gains and losses as at the transition date relating to future employee benefits.
Designation of previously recognized financial instruments
IFRS 1 allows first-time adopters to designate any financial asset or liability at fair value through profit or loss provided that the conditions set out in IAS 39, Financial Instruments: Recognition and Measurement are met. The Mutual has elected not to re-designate its financial instruments.
Mandatory exceptions
In preparing its opening statement of financial position, the Mutual complied with the following mandatory exceptions from retrospective application in accordance with IFRS 1:
Estimates
The Mutual did not use subsequent information to establish or revise estimates as at the transition date.
The estimates made by the Mutual in accordance with IFRS as at the transition date and for the presented comparative year are consistent with the estimates made under GAAP at the same date.
Derecognition of financial assets and liabilities
The Mutual did not retrospectively account for mortgage loans securitized under the CMB and NhA MBS programs as at January 1, 2010.

2011 ANNUAL REPORT I NOTES TO CONSOLIDATED FINANCIAL STATEMENTS LA CAPITALE CIVIL SERVICE MUTUAL
33
Reconciliation of consolidated equity
The following table shows the reconciliation of equity reported under Canadian GAAP to equity reported under IFRS.
As at December 31, 2010 As at January 1, 2010
Equity under GAAP $587,659 $524,673
Impact on participating policyholders’ surplus:Total adjustments related to non-controlling interests [1 to 7] $621 $744
Impact on retained earnings:Investment properties [1] $2,666 $1,559 Own-use properties [2] 1,192 1,224Net deferred gains on properties [3] 2,083 2,314Employee future benefits [4] (32,424) (36,619)Actuarial liabilities [5] (971) (990)Stock appreciation rights plan [6] (1,685) (1,680)Income taxes related to IFRS adjustments [7] 7,982 9,520Transfer to participating policyholders (621) (744)Reclassification to non-controlling interests 3,179 3,863Appreciation in property held by the joint venture 5,219 5,253
$(13,380) $(16,300)
Effect of non-controlling interests:Reclassification of non-controlling interests under IFRS presentation $131,359 $117,192Total adjustments related to non-controlling interests [1 to 7] (3,179) (3,863)Increase in non-controlling interests 1,901 —
$130,081 $113,329
Equity under IFRS $704,981 $622,446
Reconciliation of comprehensive income
The following table shows the reconciliation of comprehensive income reported under Canadian GAAP to comprehensive income reported under IFRS.
For the year ended December 31, 2010
Comprehensive income under Canadian GAAP $62,986Reclassification of non-controlling interests to net income under IFRS presentation 13,151Reclassification of non-controlling interests to other comprehensive income under
IFRS presentation 3,439$79,576
Impact on net income:Investment properties [1] $1,107Own-use properties [2] (66)Net deferred gains on properties [3] (231)Employee future benefits [4] 4,195Actuarial liabilities [5] 19Stock appreciation rights plan [6] (5)Income taxes related to IFRS adjustments [7] (1,538)
$3,481
Comprehensive income under IFRS $83,057
The details regarding adjustments to equity and to the statement of comprehensive income are provided below.
[1] Investment properties Under the previous accounting standards, the Mutual accounted for the properties held by life and health insurance companies at fair value using
the moving average method, whereby the carrying amount was restated every year by an amount equal to 10% of the difference between the fair value and the carrying amount, which was then recognized under investment income. Investment properties held by the other companies were recorded at amortized cost. In accordance with IFRS, properties held for generating capital gains or rental income were classified as investment properties and reported at fair value.

2011 ANNUAL REPORT I NOTES TO CONSOLIDATED FINANCIAL STATEMENTS LA CAPITALE CIVIL SERVICE MUTUAL
34
4) TRANSITION TO IFRS [Cont’d]
Reconciliation of comprehensive income [Cont’d]
[2] Own-use properties Under the previous accounting standards, the Mutual accounted for own-use properties held by life and health insurance companies at fair value
using the moving average method, whereby the carrying amount was restated every year by an amount equal to 10% of the difference between the fair value and the carrying amount, which was then recognized under investment income. Own-use properties held by the other companies were recorded at amortized cost. In accordance with IFRS, these properties were accounted for at fair value at the transition date and subsequently at amortized cost and reported under property and equipment. Equity was adjusted for the difference between fair value and the carrying amount of own-use properties.
[3] Deferred net gains on properties Canadian GAAP allowed life and health insurance companies to defer and amortize capital gains and losses on their properties but this treatment
is not permitted under IFRS. The write-off of this amount had an impact on retained earnings.
[4] Employee future benefits The Mutual elected to recognize all unamortized cumulative actuarial gains and losses in the consolidated retained earnings opening balance. The
Mutual previously applied the corridor method whereby a portion of the actuarial gains and losses was not recognized. The Mutual also recognized the minimum funding requirement as at January 1, 2010, generating an impact on comprehensive income as at December 31, 2010.
[5] Actuarial liabilities The Mutual used the CALM to calculate actuarial liabilities. The change in fair value of assets backing life and health insurance contract liabilities
had an impact on this calculation. Accordingly, actuarial liabilities increased and retained earnings decreased by same amount due to the change in fair value of properties and a portion of the deferred net gains on properties. The actuarial liabilities were also increased by an amount relating to the impact of the discounting of adjusted deferred taxes at the transition date.
[6] Stock appreciation rights plan The Mutual made changes to the stock appreciation rights plan using the Black-Scholes model to estimate the fair value of the rights instead of
the intrinsic value method as under the previous accounting standard. A decrease in retained earnings was recognized accordingly.
[7] Income taxes related to IFRS adjustments The Mutual has computed the income tax effect of the above accounting adjustments.
Reconciliation of the consolidated statement of financial position
The following table shows the reconciliation of the financial position as at the transition date of January 1, 2010.
As at December 31, 2009 Canadian GAAP
Reclassification under IFRS
Effects of transition to IFRS
As at January 1, 2010 IFRS
ASSETSInvestments
Cash and cash equivalents [8] $84,209 $ — $(147) $84,062Bonds 1,505,836 — — 1,505,836Stocks 411,256 — — 411,256Mortgage loans [8] 476,256 1,582 12,378 490,216Investment income [8 and 9] 203,537 (36,456) (17,362) 149,719Policy loans 26,775 — — 26,775Other investments [8] 25,418 5,244 12,128 42,790
$2,733,287 $(29,630) $6,997 $2,710,654Premiums receivable 316,250 — — 316,250Reinsurance assets [11] — 134,450 — 134,450Income taxes receivable — 6,729 53 6,782Deferred taxes [16] 18,312 — 360 18,672Deferred premium acquisition costs [9] — 40,366 — 40,366Other assets [8, 9 and 12] 189,806 (114,844) 381 75,343Property and equipment [9] — 55,434 1,224 56,658Intangible assets 58,022 413 — 58,435Goodwill 101,140 — — 101,140
$3,416,817 $92,918 $9,015 $3,518,750

2011 ANNUAL REPORT I NOTES TO CONSOLIDATED FINANCIAL STATEMENTS LA CAPITALE CIVIL SERVICE MUTUAL
35
As at December 31, 2009 Canadian GAAP
Reclassification under IFRS
Effects of transition to IFRS
As at January 1, 2010 IFRS
LIABILITIESLife and health insurance contract liabilities
Actuarial liabilities [9 and 11] $1,736,963 $111,495 $990 $1,849,448Provisions for benefits incurred 24,031 4 — 24,035Provisions for dividends and experience
rating refunds 18,226 — — 18,226Policyholder amounts on deposit 46,303 64 — 46,367
$1,825,523 $111,563 $990 $1,938,076
Property and casualty insurance contract liabilitiesUnearned premiums $409,140 $ — $ — $409,140Provision for claims and loss adjustment
expenses 279,456 — — 279,456$688,596 $ — $ — $688,596
$2,514,119 $111,563 $990 $2,626,672Accrued liabilities [8] 165,656 (53,565) (155) 111,936Other liabilities [8 and 13] 48,315 26,122 1,680 76,117Income taxes payable — 19,566 — 19,566Deferred taxes [16] 37,548 — (9,107) 28,441Employee future benefits [12] — (10,768) 37,340 26,572Long-term debt 7,000 — — 7,000Deferred net gains [10] 2,314 — (2,314) —
$2,774,952 $92,918 $28,434 $2,896,304
Non-controlling interests [15] $117,192 ($117,192) $ — $ —
EQUITYRetained earnings [8, 9, 10, 12, 13, 14 and 16] $389,248 $ — $(16,300) $372,948Accumulated other comprehensive income 6,825 — — 6,825
$396,073 $ — $(16,300) $379,773Participating policyholders’ account 128,600 — 744 129,344Non-controlling interests [15] — 117,192 (3,863) 113,329
$524,673 $117,192 $(19,419) $622,446
TOTAL LIABILITIES AND EQUITY $3,416,817 $92,918 $9,015 $3,518,750
[8] Following the adoption of IFRS, the Mutual uses the equity method instead of the proportionate consolidation method to account for the investment in one of its joint ventures. As a result, mortgage loans granted by the Mutual and secured by property belonging to the joint venture are no longer eliminated.
[9] Under the previous accounting standards, the Mutual accounted for the properties held by life and health insurance companies at fair value using the moving average method, whereby the carrying amount was restated every year by an amount equal to 10% of the difference between the fair value and the carrying amount, which was then recognized under investment income. Investment properties held by the other companies were recorded at amortized cost. Under IFRS, the Mutual first classified its properties under investment properties and property and equipment as specified in note 3. The fair value of properties held for investment purposes includes leasehold improvements, deferred commissions and lease acquisition expenses that were previously included under other assets. Property and equipment was reclassified from other assets to property and equipment. Deferred premium acquisition costs were reclassified from other assets and reported separately. Commissions and lease acquisition expenses were also reclassified from other assets to property and equipment. Following the application of IFRS, the carrying amount of investment properties and own-use properties recorded under property and equipment were adjusted by amounts of $1,559 and $1,224, respectively.
The Mutual used the CALM to calculate actuarial liabilities. The change in fair value of assets backing life and health insurance contract liabilities had an impact on this calculation. Accordingly, actuarial liabilities increased by $186 and retained earnings decreased by same amount due to the change in fair value of properties and a portion of the deferred net gains on properties.
[10] Realized gains and losses on the disposal of investment properties held by life and health insurance companies were previously deferred and amortized on a declining balance basis at an annual rate of 10%. This treatment is no longer permitted under IFRS and the gains and losses must be recognized in income for the year in which they are realized. The cumulative balance of deferred net gains was included under retained earnings in order to be written off at the transition date.
[11] Reinsurance premiums were previously reported as deductions from insurance and annuity premiums in the statement of income and from life and health insurance policy liabilities in the balance sheet. In accordance with applicable IFRS, these balances are now reported separately.
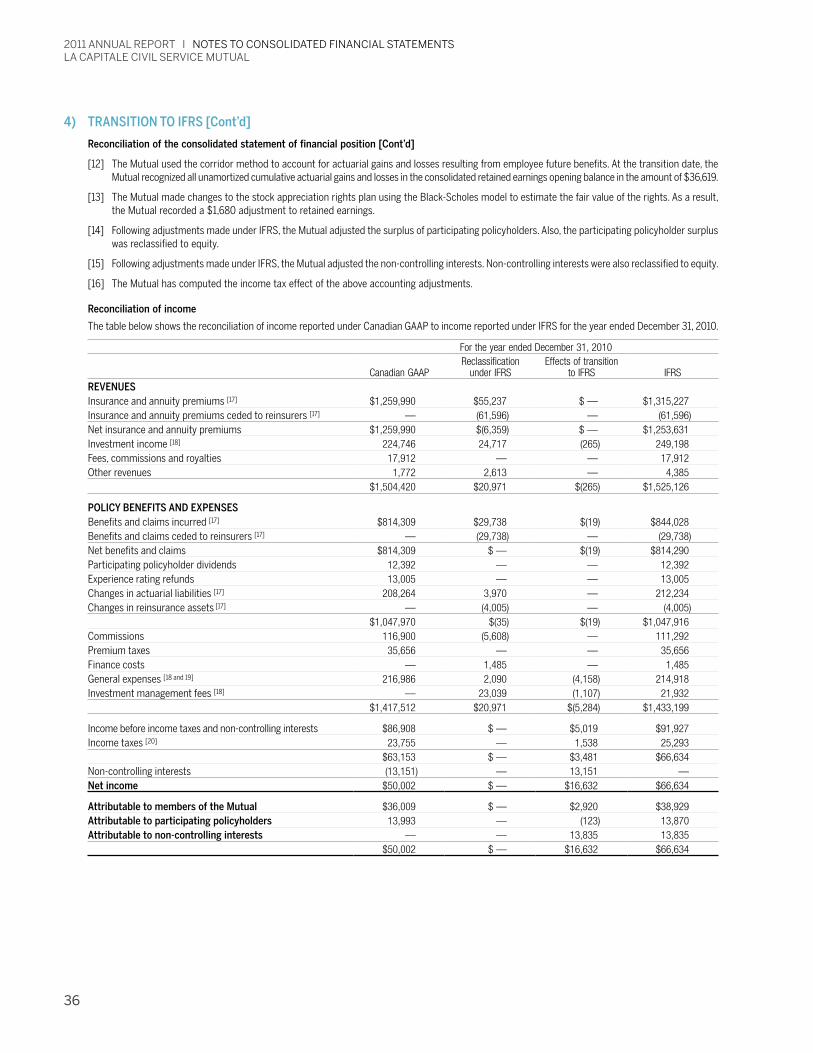
2011 ANNUAL REPORT I NOTES TO CONSOLIDATED FINANCIAL STATEMENTS LA CAPITALE CIVIL SERVICE MUTUAL
36
4) TRANSITION TO IFRS [Cont’d]
Reconciliation of the consolidated statement of financial position [Cont’d]
[12] The Mutual used the corridor method to account for actuarial gains and losses resulting from employee future benefits. At the transition date, the Mutual recognized all unamortized cumulative actuarial gains and losses in the consolidated retained earnings opening balance in the amount of $36,619.
[13] The Mutual made changes to the stock appreciation rights plan using the Black-Scholes model to estimate the fair value of the rights. As a result, the Mutual recorded a $1,680 adjustment to retained earnings.
[14] Following adjustments made under IFRS, the Mutual adjusted the surplus of participating policyholders. Also, the participating policyholder surplus was reclassified to equity.
[15] Following adjustments made under IFRS, the Mutual adjusted the non-controlling interests. Non-controlling interests were also reclassified to equity.
[16] The Mutual has computed the income tax effect of the above accounting adjustments.
Reconciliation of income
The table below shows the reconciliation of income reported under Canadian GAAP to income reported under IFRS for the year ended December 31, 2010.
For the year ended December 31, 2010
Canadian GAAPReclassification
under IFRSEffects of transition
to IFRS IFRSREVENUESInsurance and annuity premiums [17] $1,259,990 $55,237 $ — $1,315,227Insurance and annuity premiums ceded to reinsurers [17] — (61,596) — (61,596)Net insurance and annuity premiums $1,259,990 $(6,359) $ — $1,253,631Investment income [18] 224,746 24,717 (265) 249,198Fees, commissions and royalties 17,912 — — 17,912Other revenues 1,772 2,613 — 4,385
$1,504,420 $20,971 $(265) $1,525,126
POLICY BENEFITS AND EXPENSESBenefits and claims incurred [17] $814,309 $29,738 $(19) $844,028Benefits and claims ceded to reinsurers [17] — (29,738) — (29,738)Net benefits and claims $814,309 $ — $(19) $814,290Participating policyholder dividends 12,392 — — 12,392Experience rating refunds 13,005 — — 13,005Changes in actuarial liabilities [17] 208,264 3,970 — 212,234Changes in reinsurance assets [17] — (4,005) — (4,005)
$1,047,970 $(35) $(19) $1,047,916Commissions 116,900 (5,608) — 111,292Premium taxes 35,656 — — 35,656Finance costs — 1,485 — 1,485General expenses [18 and 19] 216,986 2,090 (4,158) 214,918Investment management fees [18] — 23,039 (1,107) 21,932
$1,417,512 $20,971 $(5,284) $1,433,199
Income before income taxes and non-controlling interests $86,908 $ — $5,019 $91,927Income taxes [20] 23,755 — 1,538 25,293
$63,153 $ — $3,481 $66,634Non-controlling interests (13,151) — 13,151 —Net income $50,002 $ — $16,632 $66,634
Attributable to members of the Mutual $36,009 $ — $2,920 $38,929Attributable to participating policyholders 13,993 — (123) 13,870Attributable to non-controlling interests — — 13,835 13,835
$50,002 $ — $16,632 $66,634

2011 ANNUAL REPORT I NOTES TO CONSOLIDATED FINANCIAL STATEMENTS LA CAPITALE CIVIL SERVICE MUTUAL
37
[17] Reinsurancepremiumswerepreviouslyreportedasadeductionfrominsuranceandannuitypremiumsandfrombenefitsandclaimsincurred.InaccordancewithapplicableIFRS,thesetransactionsarenowreportedseparately.
[18] Realizedgainsandlossesonpropertiesheldbylifeandhealthinsurancecompanieswerepreviouslydeferredandamortizedonadecliningbalancebasisatanannualrateof10%.ThistreatmentisnolongerpermittedunderIFRSandthegainsandlossesmustberecognizedinincomefortheyearinwhichtheyarerealized.Anamountof$231wasrecognizedinordertowriteoffcumulativegainsfortheyear.
Propertyoperatingcostsandinvestmentmanagementfeeswerereportedundernetinvestmentincome.InaccordancewithIFRS,operatingcostsofown-usepropertywerereclassifiedtogeneralexpensesandinvestmentmanagementfeeswerereportedseparatelyinthestatementofincome.
[19] General expenses increased due to the amortization of own-use properties. The Mutual also recognized the change in the minimum fundingrequirementfollowingtheapplicationofIFRIC14,representinga$3,729decreaseingeneralexpenses.
[20] TheMutualhascomputedtheincometaxeffectoftheaboveaccountingadjustments.
Reconciliation of cash flows
TheMutual’sfirst-timeadoptionofIFRShadnoimpactontotalcashflowsfromoperating,investingandfinancingactivities.
5) INVESTMENTS
Theamountsbelowrepresentthecarryingamountandthefairvalueofinvestments.
Carrying amount and fair value of investments
December 31, 2011
Held for trading
Designated at fair value
through incomeAvailable- for-sale
Loans and receivables Other
Total carrying amount
Total fair value
Cash and cash equivalents $90,995 $ — $ — $ — $ — $90,995 $90,995
BondsGovernmentofCanada $ — $ — $265,349 $ — $ — $265,349 $265,349Provincialgovernments — 958,698 163,668 — — 1,122,366 1,122,366Municipalities,schoolboardsandhospitals — 5,467 1,630 — — 7,097 7,097Corporate — 265,406 133,668 — — 399,074 399,074International — — — — — — —
$ — $1,229,571 $564,315 $ — $ — $1,793,886 $1,793,886
StocksCommonsharesandparticipatingunits $ — $94,107 $204,152 $ — $ — $298,259 $298,259Preferredshares — 165,310 107,485 — — 272,795 272,795Participatingunitsinstockmarketindices — 89,308 11,898 — — 101,206 101,206Participatingunitsinforeigncurrencystock
marketindices — — — — — — —$ — $348,725 $323,535 $ — $ — $672,260 $672,260
Mortgage loansInsured $ — $ — $ — $229,867 $ — $229,867 $235,515Conventional — — — 268,965 — 268,965 275,107
$ — $ — $ — $498,832 $ — $498,832 $510,622
Investment propertiesHeldforinvestment — $ $ — $ — $ — $181,922 $181,922 $181,922
Policy loans $ — $ — — $ $29,775 $ — $29,775 $29,775
Other investmentsPersonalloans $ — $ — $ — $18,129 $ — $18,129 $18,022Otherloans — — — 18,423 — 18,423 18,436Propertiesheldforresale — — — — 1,435 1,435 1,435Investmentsinjointventures — — — — 15,625 15,625 15,625Otherinvestments 99 — 3,316 — 4,474 7,889 7,889
$99 $ — $3,316 $36,552 $21,534 $61,501 $61,407
$91,094 $1,578,296 $891,166 $565,159 $203,456 $3,329,171 $3,340,867

2011 ANNUAL REPORT I NOTES TO CONSOLIDATED FINANCIAL STATEMENTS LA CAPITALE CIVIL SERVICE MUTUAL
38
5) INVESTMENTS [Cont’d]
Carrying amount and fair value of investments [Cont’d]
December 31, 2010
Held for trading
Designated at fair value
through incomeAvailable- for-sale
Loans and receivables Other
Total carrying amount
Total fair value
Cash and cash equivalents $97,593 $ — $ — $ — $ — $97,593 $97,593
BondsGovernmentofCanada $ — $1,843 $207,789 $ — $ — $209,632 $209,632Provincialgovernments — 819,972 185,556 — — 1,005,528 1,005,528Municipalities,schoolboardsandhospitals — 5,659 1,878 — — 7,537 7,537Corporate — 223,765 142,687 — — 366,452 366,452International — — — — — — —
$ — $1,051,239 $537,910 $ — $ — $1,589,149 $1,589,149
StocksCommonsharesandparticipatingunits $ — $53,227 $191,917 $ — $ — $245,144 $245,144Preferredshares — 120,228 99,929 — — 220,157 220,157Participatingunitsinstockmarketindices — 116,908 — — — 116,908 116,908Participatingunitsinforeigncurrencystock
marketindices — 15,652 — — — 15,652 15,652$ — $306,015 $291,846 $ — $ — $597,861 $597,861
Mortgage loansInsured $ — $ — $ — $241,251 $ — $241,251 $249,345Conventional — — — 242,638 — 242,638 251,109
$ — $ — $ — $483,889 $ — $483,889 $500,454
Investment propertiesHeldforinvestment $ — $ — $ — $ — $177,761 $177,761 $177,761
Policy loans $ — $ — $ — $28,409 $ — $28,409 $28,409
Other investmentsPersonalloans $ — $ — $ — $16,375 $ — $16,375 $16,313Otherloans — — — 10,995 — 10,995 10,787Propertiesheldforresale — — — — 1,803 1,803 1,803Investmentsinjointventures — — — — 15,693 15,693 15,693Otherinvestments 66 — 2,653 — — 2,719 2,719
$66 $ — $2,653 $27,370 $17,496 $47,585 $47,315
$97,659 $1,357,254 $832,409 $539,668 $195,257 $3,022,247 $3,038,542

2011 ANNUAL REPORT I NOTES TO CONSOLIDATED FINANCIAL STATEMENTS LA CAPITALE CIVIL SERVICE MUTUAL
39
January 1, 2010
Held for trading
Designated at fair value
through incomeAvailable- for-sale
Loans and receivables Other
Total carrying amount
Total fair value
Cash and cash equivalents $84,062 $ — $ — $ — $ — $84,062 $84,062
BondsGovernmentofCanada $ — $1,771 $186,694 $ — $ — $188,465 $188,465Provincialgovernments — 783,592 194,211 — — 977,803 977,803Municipalities,schoolboardsandhospitals — 6,000 9,019 — — 15,019 15,019Corporate — 186,172 131,037 — — 317,209 317,209International — — 7,340 — — 7,340 7,340
$ — $977,535 $528,301 $ — $ — $1,505,836 $1,505,836
StocksCommonsharesandparticipatingunits $ — $27,188 $167,874 $ — $ — $195,062 $195,062Preferredshares — 38,101 58,587 — — 96,688 96,688Participatingunitsinstockmarketindices — 104,074 — — — 104,074 104,074Participatingunitsinforeigncurrencystock
marketindices — 15,432 — — — 15,432 15,432$ — $184,795 $226,461 $ — $ — $411,256 $411,256
Mortgage loansInsured $ — $ — $ — $275,754 $ — $275,754 $285,108Conventional — — — 214,462 — 214,462 222,884
$ — $ — $ — $490,216 $ — $490,216 $507,992
Investment propertiesHeldforinvestment $ — $ — $ — $ — $149,719 $149,719 $149,719
Policy loans $ — $ — $ — $26,775 $ — $26,775 $26,775
Other investmentsPersonalloans $ — $ — $ — $16,224 $ — $16,224 $16,148Otherloans — — — 3,393 — 3,393 3,384Propertiesheldforresale — — — — 5,037 5,037 5,037Investmentsinjointventures — — — — 15,394 15,394 15,394Otherinvestments — — 2,637 — 105 2,742 2,749
$ — $ — $2,637 $19,617 $20,536 $42,790 $42,712
$84,062 $1,162,330 $757,399 $536,608 $170,255 $2,710,654 $2,728,352

2011 ANNUAL REPORT I NOTES TO CONSOLIDATED FINANCIAL STATEMENTS LA CAPITALE CIVIL SERVICE MUTUAL
40
5) INVESTMENTS [Cont’d]
The table below shows a reconciliation of opening and closing balances of investments according to their classification.
Reconciliation of investments according to their classification
Held for trading
Designated at fair value through
incomeAvailable- for-sale
Loans and receivables Other1 Total
Balance as at January 1, 2010 $84,062 $1,162,330 $757,399 $536,608 $170,255 $2,710,654Purchases 115,738 269,836 655,692 195,659 33,483 1,270,408Amortization of discount or premium — 38,863 (1,156) — — 37,707Share of income of joint ventures — — — — 585 585Maturities (47,593) (5,421) (72,809) (121,727) — (247,550)Disposals (54,614) (205,739) (540,046) (70,632) (8,654) (879,685)Changes in fair value – statement of income 63 97,368 10,343 — — 107,774Changes in fair value – accumulated other
comprehensive income — — 23,147 — — 23,147Change in allowance for impairment losses — — — 46 — 46Write-off — — — — — —Change in foreign currencies — 17 (161) — — (144)Other 3 — — (286) (412) (695)Balance as at December 31, 2010 $97,659 $1,357,254 $832,409 $539,668 $195,257 $3,022,247
Purchases 190,294 273,592 865,946 257,912 12,542 1,600,286Amortization of discount or premium — 38,399 (1,652) (21) — 36,726Share of income of joint ventures — — — — 227 227Maturities (97,173) (2,575) (40,400) (133,389) — (273,537)Disposals (99,722) (210,306) (784,256) (97,395) (4,774) (1,196,453)Changes in fair value – statement of income 36 122,489 18,997 — 204 141,726Changes in fair value – accumulated other
comprehensive income — — 122 5 — 127Change in allowance for impairment losses — 27 — 16 — 43Write-off — — — (616) — (616)Change in foreign currencies — (584) — — — (584)Other — — — (1,021) — (1,021)Balance as at December 31, 2011 $91,094 $1,578,296 $891,166 $565,159 $203,456 $3,329,171
1. The Other item comprises investment properties, properties held for resale, investments in the joint ventures and other investments in private companies.
Credit risk
Bonds by credit quality
The following table provides data on the Mutual’s credit and concentration risk.
Fair valueCredit rating December 31, 2011 December 31, 2010 January 1, 2010AAA $280,178 $227,893 $209,640AA 353,179 332,647 310,566A 1,129,436 1,011,177 976,801BBB 30,578 16,929 7,887B — — 472Bond Fund 515 503 470
$1,793,886 $1,589,149 $1,505,836
The life and health insurance companies limit their corporate bond investments to 35% of their bond portfolio with a maximum per sector or issuer, based on the specific features of the Canadian market.

2011 ANNUAL REPORT I NOTES TO CONSOLIDATED FINANCIAL STATEMENTS LA CAPITALE CIVIL SERVICE MUTUAL
41
Preferred shares by credit quality
The following table provides data on the Mutual’s credit and concentration risk.
Fair valueCredit rating December 31, 2011 December 31, 2010 January 1, 2010P1 $198,248 $164,894 $70,129P2 74,547 55,263 25,792P3 — — 767
$272,795 $220,157 $96,688
The life and health insurance companies mainly limit their investment in a company or group of related companies to 2% of the combined assets of La Capitale Civil Service Insurer Inc. and La Capitale Insurance and Financial Services Inc.
The property and casualty insurance companies limit their investments in one or more entities of a related group to a maximum of 10% of equity.
Mortgage loans by property class
The following table shows the carrying amount and fair value of mortgage loans by property class.
December 31, 2011 December 31, 2010Carrying amount Fair value CMHC secured Carrying amount Fair value CMHC secured
Residential $433,829 $444,830 $188,047 $409,964 $424,634 $194,814Other 65,003 65,792 41,820 73,925 75,820 46,437
$498,832 $510,622 $229,867 $483,889 $500,454 $241,251
January 1, 2010Carrying amount Fair value CMHC secured
Residential $410,806 $426,888 $227,255Other 79,410 81,104 48,499
$490,216 $507,992 $275,754
The carrying amount of mortgage loans secured by the CMhC represented 46.08% of the total carrying amount of the mortgage loan portfolio as at December 31, 2011 [December 31, 2010: 49.86%] [January 1, 2010: 56.25%].
The Mutual limits its investment to $600 for a new borrower and $800 for a related group of borrowers for new loans.
Impaired loans and allowance for losses
Impaired loans
A loan is deemed impaired when the counterparty has failed to make a payment by the contractual due date.
December 31, 2011
30-59 days in arrears
60-89 days in arrears
90 days or more in arrears or in foreclosure Total
Insured mortgage loans $1,891 $269 $1,473 $3,633Conventional mortgage loans 229 — — 229Personal loans 1 29 36 66
$2,121 $298 $1,509 $3,928
December 31, 2010
30-59 days in arrears
60-89 days in arrears
90 days or more in arrears or in foreclosure Total
Insured mortgage loans $1,048 $841 $595 $2,484Conventional mortgage loans 475 32 — 507Personal loans 38 — 74 112
$1,561 $873 $669 $3,103
January 1, 2010
30-59 days in arrears
60-89 days in arrears
90 days or more in arrears or in foreclosure Total
Insured mortgage loans $1,745 $1,060 $977 $3,782Conventional mortgage loans 612 — — 612Personal loans 26 — 68 94
$2,383 $1,060 $1,045 $4,488

2011 ANNUAL REPORT I NOTES TO CONSOLIDATED FINANCIAL STATEMENTS LA CAPITALE CIVIL SERVICE MUTUAL
42
5) INVESTMENTS [Cont’d]
Credit risk [Cont’d]
Impaired loans and allowance for losses [Cont’d]
Allowance for losses
The changes made to the allowance for losses are as follows:
Bonds Mortgage loans Personal loans TotalBalance as at January 1, 2011 $284 $ — $107 $391Increase in allowance for losses — 34 80 114Write-off of allowance for losses — (19) (68) (87)Recovery of allowance for losses — (15) (28) (43)Balance as at December 31, 2011 $284 $ — $91 $375
Bonds Mortgage loans Personal loans TotalBalance as at January 1, 2010 $284 $44 $110 $438Increase in allowance for losses — — 53 53Write-off of allowance for losses — — (11) (11)Recovery of allowance for losses — (44) (45) (89)Balance as at December 31, 2010 $284 $ — $107 $391
Interest rate risk
The following table provides information on the maturity dates of the Mutual’s investments with interest rate risk exposure.
Carrying amount
Fixed rate December 31, 2011
Variable rateMaturing in
under 1 yearMaturing in 1 to 5 years
Maturing in 6 to 10 years
Maturing in over 10 years
No specific maturity
Total carrying amount
BondsGovernment of Canada $16,599 $155,731 $84,630 $5,809 $2,580 $ — $265,349Provincial governments 12,987 14,486 49,281 266,760 778,852 — 1,122,366Municipalities, school boards
and hospitals — — 5,178 112 1,807 — 7,097Corporate 78,996 5,795 72,275 73,215 168,793 — 399,074International — — — — — — —
$108,582 $176,012 $211,364 $345,896 $952,032 $ — $1,793,886
StocksPreferred shares $ — $51,697 $73,289 $6,919 $ — $140,890 $272,795
Mortgage loansInsured $346 $71,648 $122,878 $33,209 $1,786 $ — $229,867Conventional 33,018 78,601 139,134 18,212 — — 268,965
$33,364 $150,249 $262,012 $51,421 $1,786 $ — $498,832
Policy loans $ — $ — $ — $ — $119 $29,656 $29,775
Other investmentsPersonal loans $13,625 $1,277 $2,401 $826 $ — $ — $18,129Other loans 1,808 — 2,489 8,213 1,774 4,139 18,423
$15,433 $1,277 $4,890 $9,039 $1,774 $4,139 $36,552
$157,379 $379,235 $551,555 $413,275 $955,711 $174,685 $2,631,840

2011 ANNUAL REPORT I NOTES TO CONSOLIDATED FINANCIAL STATEMENTS LA CAPITALE CIVIL SERVICE MUTUAL
43
Fixed rate December 31, 2010
Variable rateMaturing in
under 1 yearMaturing in 1 to 5 years
Maturing in 6 to 10 years
Maturing in over 10 years
No specific maturity
Total carrying amount
BondsGovernment of Canada $10,679 $132,847 $44,327 $11,048 $10,731 $ — $209,632Provincial governments 55,752 1,688 35,200 252,563 660,325 — 1,005,528Municipalities, school boards
and hospitals — 1,057 4,750 336 1,394 — 7,537Corporate 86,603 11,458 62,701 82,328 122,906 456 366,452International — — — — — — —
$153,034 $147,050 $146,978 $346,275 $795,356 $456 $1,589,149
StocksPreferred shares $ — $19,789 $115,209 $1,796 $ — $83,363 $220,157
Mortgage loansInsured $339 $62,020 $139,342 $37,732 $1,818 $ — $241,251Conventional 27,246 51,296 147,417 16,679 — — 242,638
$27,585 $113,316 $286,759 $54,411 $1,818 $ — $483,889
Policy loans $ — $ — $ — $ — $ — $28,409 $28,409
Other investmentsPersonal loans $12,383 $582 $2,565 $845 $ — $ — $16,375Other loans — — 664 7,135 2,575 621 10,995
$12,383 $582 $3,229 $7,980 $2,575 $621 $27,370
$193,002 $280,737 $552,175 $410,462 $799,749 $112,849 $2,348,974
Fixed rate January 1, 2010
Variable rateMaturing in
under 1 yearMaturing in 1 to 5 years
Maturing in 6 to 10 years
Maturing in over 10 years
No specific maturity
Total carrying amount
BondsGovernment of Canada $47,832 $41,575 $60,662 $ — $38,396 $ — $188,465Provincial governments 74,162 2,382 28,793 185,683 686,783 — 977,803Municipalities, school boards
and hospitals — 7,013 5,638 1,159 1,209 — 15,019Corporate 79,598 8,683 81,686 67,636 79,136 470 317,209International — — — — 7,340 — 7,340
$201,592 $59,653 $176,779 $254,478 $812,864 $470 $1,505,836
StocksPreferred shares $ — $23,173 $45,547 $1,653 $ — $26,315 $96,688
Mortgage loansInsured $1,052 $75,654 $157,180 $40,020 $1,848 $ — $275,754Conventional 24,250 51,900 122,587 15,649 76 — 214,462
$25,302 $127,554 $279,767 $55,669 $1,924 $ — $490,216
Policy loans $ — $ — $ — $ — $ — $26,775 $26,775
Other investmentsPersonal loans $11,818 $545 $2,887 $974 $ — $ — $16,224Other loans — — 353 2,570 — 470 3,393
$11,818 $545 $3,240 $3,544 $ — $470 $19,617
$238,712 $210,925 $505,333 $315,344 $814,788 $54,030 $2,139,132
For bonds, the effective interest rate ranged from 0.78% to 7.02% [December 31, 2010: 0.04%–6.86%] [January 1, 2010: 0.46%–11.71%]; for mortgage loans, the rate ranged from 0.69% to 10.63% [December 31, 2010: 1.49%–10.63%] [January 1, 2010: 1.99%–10.63%]; and for policy loans, it ranged from 6.00% to 6.57% [December 31, 2010: 6.15%–6.83%] [January 1, 2010: 4.69%–5.05%], while the effective dividend rate on preferred shares ranged from 3.17%–6.15% [December 31, 2010: 3.72%–6.05%] [January 1, 2010: 4.45%–7.41%].

2011 ANNUAL REPORT I NOTES TO CONSOLIDATED FINANCIAL STATEMENTS LA CAPITALE CIVIL SERVICE MUTUAL
44
5) INVESTMENTS [Cont’d]
Securities lending
The Mutual engages in securities lending to generate additional income. Certain securities from its portfolio are loaned to other institutions for short periods. The asset custodian guarantees the replacement of loaned securities in the event of counterparty default. Moreover, collateral representing a minimum of 102% of the fair market value of the loaned securities is pledged by the borrower and held in escrow by the asset custodian until the underlying securities have been returned to the Mutual. The fair value of loaned securities is monitored on a daily basis with additional collateral obtained or refunded as market values fluctuate. Accordingly, the Mutual benefits from two levels of protection in the event of default. As at December 31, 2011, the Mutual had loaned securities, which are included in investments, with a carrying amount of approximately $205,603 [December 31, 2010: $248,741] [January 1, 2010: $137,235].
Investment properties
2011 2010Balance as at January 1 $177,761 $149,719Purchases 1,740 —Business acquisitions [note 24] — 21,033Subsequent capital expenditures 2,421 7,009Balance as at December 31 $181,922 $177,761
Investment properties are recorded at fair value as determined by independent external appraisers or Mutual personnel.
The fair value of investment properties was not determined using observable market data given the specific features of the properties and the lack of comparable data. To determine fair value, the Mutual used a valuation model applicable to the industry. The main assumptions used are as follows:
December 31, 2011 December 31, 2010 January 1, 2010Rate of return 7.50%–9.50% 7.70%–9.50% 7.21%–9.50%Overall discount rate 6.75%–8.00% 6.95%–8.00% 7.21%–8.00%Growth rate
Rent 1.11%–2.70% 1.11%–2.70% 1.11%–2.70%Operating expenses 2.00%–3.00% 2.00%–3.00% 2.00%–3.00%
Vacancy rate 0.23%–5.76% 0.23%–5.76% 0.23%–5.76%
Rental income from investment properties in the amount of $23,878 is reported under investment income [2010: $19,386]. The direct operating costs of investment properties generating rental income amounted to $13,165 for the year [2010: $13,463] and are reported under investment management fees.
Under emphyteutic lease rights to two investment properties granted by a third party, the properties will be left without compensation to the third party at the end of the emphyteutic lease periods, that is, in December 2050 and May 2082. The carrying amount of assets related to emphyteutic lease rights was $42,742 [December 31, 2010: $42,779] [January 1, 2010: $42,662].
Other investments
Investments in joint ventures
The Mutual holds investments in joint ventures.
Its shares in the assets, liabilities, revenues and expenses of joint ventures are as follows:
December 31, 2011 December 31, 2010 January 1, 2010Statement of financial positionTotal assets $29,856 $29,640 $29,620Total liabilities 14,231 13,947 14,226Net assets $15,625 $15,693 $15,394
Statement of incomeNet revenues $5,370 $5,124Total expenses 5,264 4,660Total net income for the year $106 $464
Impact of return on initial cash contribution 121 121Share of income for the year $227 $585
The fiscal year-end of joint ventures is December 31.

2011 ANNUAL REPORT I NOTES TO CONSOLIDATED FINANCIAL STATEMENTS LA CAPITALE CIVIL SERVICE MUTUAL
45
6) REINSURANCE ASSETS
To reduce the risk related to insurance claims and benefits, the insurance companies have entered into reinsurance agreements for policies whose insured and coverage amounts exceed certain maximums as well as reinsurance agreements enabling them to share certain risks with reinsurers on a pro rata basis. Reinsurance is purchased primarily from registered insurance and reinsurance companies. In addition, the insurance and reinsurance companies share insurance risks among themselves. Reinsurance does not discharge the ceding company of its insurance contract liabilities.
Failure of reinsurers to honour their obligations could result in losses to these companies. The companies have adopted a review process to verify the solvency of the companies to which they cede. The companies have no knowledge of any information leading them to believe that a reinsurer with which they currently do business is insolvent; consequently, no provision for bad debts has been recorded. Further, business is spread across a number of reinsurers to reduce reinsurance concentration and coverage risk.
December 31, 2011 December 31, 2010 January 1, 2010Reinsurance assetsLife and health insurance [note 15] $132,557 $115,500 $111,495Property and casualty insurance [note 16] 26,856 28,138 22,955
$159,413 $143,638 $134,450
The following table shows the effect of external ceded reinsurance on the statement of income.
Life and health insurance Property and casualty insurance Total2011 2010 2011 2010 2011 2010
Reduction:In insurance and annuity premiums acquired $(37,646) $(37,712) $(24,215) $(20,890) $(61,861) $(58,602)In benefits and claims incurred 24,145 19,139 12,378 10,599 36,523 29,738In changes in actuarial liabilities 17,057 4,005 — — 17,057 4,005In commission expense 6,975 6,092 1,748 1,358 8,723 7,450Favourable (unfavourable) effect before
income taxes $10,531 $(8,476) $(10,089) $(8,933) $442 $(17,409)
7) INCOME TAXES
The actual provision for income taxes differs from the provision established using the combined statutory federal and provincial rate for the following reasons:
2011 2010Provision for income taxes based on the combined statutory federal
and provincial rate $22,979 28.40% $27,486 29.90%Change in income taxes resulting from the following:
Non-deductible items (non-taxable) (5,941) (7.34) (4,310) (4.69)Different tax rates for loss carryback (1,836) (2.27) — —Future income taxes arising from a change in tax rate (1,141) (1.41) 550 0.59Other (374) (0.47) 124 0.14
$13,687 16.91% $23,850 25.94%
Income taxes on investment income 1,521 1.88 1,443 1.57
Income taxes and effective rates $15,208 18.79% $25,293 27.51%
The income tax expense reported in the statement of income is calculated as follows:
2011 2010Current $4,669 $22,987Deferred 10,539 2,306
$15,208 $25,293

2011 ANNUAL REPORT I NOTES TO CONSOLIDATED FINANCIAL STATEMENTS LA CAPITALE CIVIL SERVICE MUTUAL
46
7) INCOME TAXES [Cont’d]
2011 2010Income tax expense reported in the statement of income
attributable to:Participating policyholders $4,073 $5,606Members of the Mutual 7,240 15,544Non-controlling interests 3,895 4,143
$15,208 $25,293
2011 2010Total income tax expense reported in other comprehensive
incomeCurrent taxes (recovery) $(1,005) $5,982Deferred taxes 1,013 742
$8 $6,724
2011 2010Income tax expense reported in other comprehensive income
attributable to:Participating policyholders $(339) $1,612Members of the Mutual 50 3,975Non-controlling interests 297 1,137
$8 $6,724
The tax consequences of the temporary differences that generate deferred income tax assets or liabilities are as follows:
December 31, 2011 December 31, 2010 January 1, 2010Deferred tax assetActuarial liabilities $33,054 $22,923 $34,773Provision for claims and loss adjustment 3,531 3,931 3,774Other liabilities 9,340 5,936 3,615Employee future benefits 1,924 3,726 7,306Unused tax losses 14,280 6,695 6,328Other 6,197 6,326 8,952
$68,326 $49,537 $64,748
Deferred tax liabilityBonds $40,246 $12,780 $26,284Investment properties 12,548 11,585 10,160Policy loans 8,001 7,650 7,244Other investments 1,363 1,196 1,148Employee future benefits 3,182 — —Property and equipment — — 2,155Intangible assets 8,785 8,844 7,874Deferred net tax gains 11,656 12,894 15,479Other 7,229 7,521 4,173
$93,010 $62,470 $74,517
Deferred net tax liability $24,684 $12,933 $9,769
December 31, 2011 December 31, 2010 January 1, 2010Reported as:Deferred tax asset $12,831 $16,490 $18,672
Deferred tax liability $37,515 $29,423 $28,441
The Mutual has accumulated tax losses from the operations of its U.S. subsidiary in the amount of $13,251 that can be netted against future taxes payable. The accumulated tax losses will expire between 2019 and 2030. The deferred income tax asset related to the recovery of U.S. tax losses has not been accounted for by the Mutual as it is not probable that the subsidiary will have future taxable income against which the accumulated tax losses can be used.

2011 ANNUAL REPORT I NOTES TO CONSOLIDATED FINANCIAL STATEMENTS LA CAPITALE CIVIL SERVICE MUTUAL
47
8) DEFERRED PREMIUM ACQUISITION COSTS
Balance as at January 1, 2010 $40,366Deferred premium acquisition costs 83,861Amortization (72,023)Balance as at December 31, 2010 $52,204
Deferred premium acquisition costs 81,927Amortization (91,366)Balance as at December 31, 2011 $42,765
9) OTHER ASSETS
Other assets consist of the following:
December 31, 2011 December 31, 2010 January 1, 2010Other financial assetsRetained interests – securitization [note 13] $5,346 $5,956 $10,657Investment income receivable 9,066 7,667 7,865Cash in trust 857 529 2,373Amounts due from reinsurers –
life and health insurance segment 7,088 5,179 5,172Amounts due from reinsurers –
property and casualty insurance segment 4,172 6,648 5,099Subrogation [note 16] 13,106 12,312 11,248Other receivables 23,243 16,682 24,929
$62,878 $54,973 $67,343Other assetPrepaid expenses 8,503 7,982 8,000
$71,381 $62,955 $75,343
10) PROPERTY AND EQUIPMENT
Cost
LandOwn-use properties
Properties under construction
Furniture, automotive equipment and other
Computer hardware
Leasehold improvements Total
Balance as at January 1, 2010 $11,008 $30,733 $3,179 $18,508 $31,398 $6,572 $101,398Purchases 394 — 14,662 1,032 4,634 1,250 21,972Capital expenditures — 305 — — — — 305Disposals — (21) — (88) (1,096) (710) (1,915)Other — — — — (234) (91) (325)Balance as at December 31, 2010 $11,402 $31,017 $17,841 $19,452 $34,702 $7,021 $121,435
Purchases (5) — 34,495 758 2,491 1,040 38,779Capital expenditures — 10 — 103 76 11 200Disposals — — — (307) (380) (62) (749)Other — — — (40) — — (40)Balance as at December 31, 2011 $11,397 $31,027 $52,336 $19,966 $36,889 $8,010 $159,625

2011 ANNUAL REPORT I NOTES TO CONSOLIDATED FINANCIAL STATEMENTS LA CAPITALE CIVIL SERVICE MUTUAL
48
10) PROPERTY AND EQUIPMENT [Cont’d]
Accumulated amortization and impairment losses
Own-use properties
Properties under construction
Furniture, automotive equipment and other
Computer hardware
Leasehold improvements Total
Balance as at January 1, 2010 $ — $ — $13,127 $26,108 $5,505 $44,740Amortization 814 — 982 3,492 506 5,794Disposals — — (78) (1,088) (700) (1,866)Other — — — (24) (90) (114)Balance as at December 31, 2010 $814 $ — $14,031 $28,488 $5,221 $48,554
Amortization 797 — 886 3,692 727 6,102Disposals — — (225) (374) (62) (661)Other — — (40) — — (40)Balance as at December 31, 2011 $1,611 $ — $14,652 $31,806 $5,886 $53,955
Net carrying amount
LandOwn-use properties
Properties under construction
Furniture, automotive equipment and other
Computer hardware
Leasehold improvements Total
December 31, 2011 $11,397 $29,416 $52,336 $5,314 $5,083 $2,124 $105,670December 31, 2010 $11,402 $30,203 $17,841 $5,421 $6,214 $1,800 $72,881January 1, 2010 $11,008 $30,733 $3,179 $5,381 $5,290 $1,067 $56,658
11) INTANGIBLE ASSETS
Intangible assets are detailed as follows:
Cost
TrademarksClients and
distribution networksPurchased software
Internally developed software
Software under development Total
Balance as at January 1, 2010 $3,239 $45,255 $10,393 $14,334 $18,266 $91,487Purchases — 971 2,621 69 750 4,411Internally developed software — — — 5,542 7,770 13,312Disposals — — (70) — — (70)Other — — 5,596 5,443 (11,470) (431)Balance as at December 31, 2010 $3,239 $46,226 $18,540 $25,388 $15,316 $108,709
Purchases — 21 82 121 3,334 3,558Internally developed software — — — — 8,298 8,298Disposals — (1,199) (1) (27) — (1,227)Other — (18) 929 459 (1,393) (23)Balance as at December 31, 2011 $3,239 $45,030 $19,550 $25,941 $25,555 $119,315
Accumulated amortization and impairment losses
TrademarksClients and
distribution networksPurchased software
Internally developed software
Software under development Total
Balance as at January 1, 2010 $ — $16,892 $5,682 $10,478 $ — $33,052Amortization — 5,384 2,596 1,741 — 9,721Disposals — — — — — —Other — — (14) — — (14)Balance as at December 31, 2010 $ — $22,276 $8,264 $12,219 $ — $42,759
Amortization — 5,306 1,941 1,823 — 9,070Disposals — (117) — (28) — (145)Other — — — 62 — 62Balance as at December 31, 2011 $ — $27,465 $10,205 $14,076 $ — $51,746

2011 ANNUAL REPORT I NOTES TO CONSOLIDATED FINANCIAL STATEMENTS LA CAPITALE CIVIL SERVICE MUTUAL
49
Net carrying amount
TrademarksClients and
distribution networksPurchased software
Internally developed software
Software under development Total
December 31, 2011 $3,239 $17,565 $9,345 $11,865 $25,555 $67,569December 31, 2010 $3,239 $23,950 $10,276 $13,169 $15,316 $65,950January 1, 2010 $3,239 $28,363 $4,711 $3,856 $18,266 $58,435
Note 12 shows how trademarks are attributed to CGUs.
12) GOODWILL
The carrying amount of goodwill is as follows:
Carrying amount
December 31, 2011 December 31, 2010 January 1, 2010Cost $101,140 $101,140 $101,140Accumulated impairment losses — — —
$101,140 $101,140 $101,140
For the purposes of the annual impairment test, goodwill, trademarks, the client base and distribution networks have been attributed to individual CGUs. Individual CGUs are combined within the Mutual’s operating segments as presented in note 27.
These assets have been attributed to the segments and measured using the following significant assumptions:
GoodwillTrademarks
[note 11]
Clients and distribution networks
[note 11]
Assumptions
Pre-tax discount rate
Rate of increase in future
compensationLife and health insuranceDecember 31, 2011 $55,883 $1,339 $6,746 13.30% 4.00%December 31, 2010 $55,883 $1,339 $9,052 14.60% 4.00%January 1, 2010 $55,883 $1,339 $10,385 13.40% 4.00%
Property and casualty insuranceDecember 31, 2011 $45,257 $1,900 $10,819 14.10% 4.00%December 31, 2010 $45,257 $1,900 $14,898 13.80% 4.00%January 1, 2010 $45,257 $1,900 $17,978 13.70% 4.00%
TotalDecember 31, 2011 $101,140 $3,239 $17,565December 31, 2010 $101,140 $3,239 $23,950January 1, 2010 $101,140 $3,239 $28,363
The recoverable amount of a CGU is based on its value in use and is estimated using a discounted future cash flow model.
These cash flows are derived from budgets approved by management and cover a five-year period. Management has based its projects on an in-depth analysis of markets and projects under implementation in CGUs. The assumptions are based on revenue growth rates, terminal value growth rates, the marketing of new products, inflation rate for costs, operating synergies, and discount and tax rates. Management believes that a 1% change in a key assumption used to determine a recoverable amount would not have any impact on the impairment of goodwill and trademarks.

2011 ANNUAL REPORT I NOTES TO CONSOLIDATED FINANCIAL STATEMENTS LA CAPITALE CIVIL SERVICE MUTUAL
50
13) SECURITIZATION
During the year, the Mutual securitized residential mortgage loans. The following table shows aggregate balances related to securitization.
December 31, 2011 December 31, 2010 January 1, 2010Retained interests reported under other assetsNhA MBS $4,165 $2,055 $1,427CMB 1,181 3,901 9,230
$5,346 $5,956 $10,657
Securitized and derecognized mortgage loansNhA MBS $130,203 $75,497 $47,970CMB 101,503 221,132 354,794
$231,706 $296,629 $402,764
Reinvestment assetsGov’t. of Canada bonds and Treasury bills
NhA MBS $ — $ — $ —CMB 131,520 273,131 285,394
Cash in trustNhA MBS — — —CMB 6,912 9,522 14,548
$138,432 $282,653 $299,942
Derecognized mortgage bonds in trustNhA MBS $130,121 $75,453 $47,927CMB 239,334 501,981 652,034
$369,455 $577,434 $699,961
Mortgage loans over 90 days due secured by CMHCNhA MBS $ — $223 $465CMB 838 1,777 3,134
$838 $2,000 $3,599
Securitization transactions
December 31, 2011 December 31, 2010NHA MBS CMB Total NHA MBS CMB Total
Proceeds from new securitization transactions $78,077 $ — $78,077 $49,867 $ — $49,867Premiums (discounts) related to transactions 71 — 71 (355) — (355)Net proceeds $78,148 $ — $78,148 $49,512 $ — $49,512
Pre-tax gains $126 $ — $126 $491 $ — $491
Cash flows from retained interests in securitization operations and related financial instruments $5,424 $(3,873) $1,551 $4,296 $1,475 $5,771
Net results from all securitization operations $3,684 $(2,631) $1,053 $1,997 $(917) $1,080
There were no credit losses in respect of these loans in 2011 and 2010.
Key assumptions
The key assumptions used to determine the value of the loans sold and retained interests at the securitization date are as follows:
December 31, 2011 December 31, 2010 January 1, 2010Prepayment rate 23.90% 23.82% 22.86%Excess spread 2.21% 1.38% 1.19%Discount rate 1.79% 2.33% 1.22%

2011 ANNUAL REPORT I NOTES TO CONSOLIDATED FINANCIAL STATEMENTS LA CAPITALE CIVIL SERVICE MUTUAL
51
As at December 31, 2011, the sensitivity of the current fair value of retained interests to 10% and 20% adverse changes in the key assumptions was as follows:
Sensitivity of key assumptions to adverse changes
December 31, 2011 December 31, 2010 January 1, 2010
AssumptionImpact on fair value Assumption
Impact on fair value Assumption
Impact on fair value
Prepayment rateImpact on fair value of 10% adverse change 26.29% $(205) 26.20% $(199) 25.14% $(216)Impact on fair value of 20% adverse change 28.68% $(405) 28.59% $(397) 27.43% $(430)
Excess spread (net of credit losses)Impact on fair value of 10% adverse change 2.01% $(580) 1.25% $(674) 1.07% $(999)Impact on fair value of 20% adverse change 1.84% $(1,064) 1.15% $(1,236) 0.95% $(1,997)
Discount rateImpact on fair value of 10% adverse change 1.97% $(10) 2.57% $(7) 1.34% $(9)Impact on fair value of 20% adverse change 2.14% $(20) 2.80% $(14) 1.46% $(18)
These sensitivities are hypothetical and should be used with caution. As shown by the tabular figures, the effect on fair value of a 10% adverse change generally cannot be extrapolated because the relationship between the change in assumption and the change in fair value may not be linear. Also, in this table, the impact of a change in a particular assumption on the fair value of retained interests is calculated without changing any other assumption; generally, changes in one given factor could result in changes in another, which may magnify or counteract the sensitivities.
14) CREDIT FACILITIES
As at December 31, 2011, the Mutual had lines of credit totalling $24,000 [December 31, 2010: $14,000] [January 1, 2010: $14,000] of which a $10,000 amount bears interest at the prime rate and the remaining $14,000 bears interest mainly at the prime rate plus 0.25% or at the bankers’ acceptance rate plus 125 basis points, depending on use.
The Mutual also has a $20,000 demand bridge loan [December 31, 2010: $20,000] [January 1, 2010: $20,000] bearing interest at the bankers’ acceptance rate plus 110 basis points or at prime plus 0.25%, based on its use. The loan is collateralized by bond holdings whose fair value must cover 105% of the amount drawn.
The Mutual also has a $10,000 credit facility for the issuance of letters of credit at a cost of 0.625% of the dollar amount [December 31, 2010: $0] [January 1, 2010: $0]
The credit facilities were undrawn as at December 31, 2011 and 2010 and January 1, 2010.
15) LIFE AND HEALTH INSURANCE CONTRACT LIABILITIES
The Boards of Directors name the Appointed Actuary, who is responsible for the valuation of life and health insurance contract liabilities in accordance with the standards of practice of the Canadian Institute of Actuaries and for expressing an opinion regarding their adequacy to meet all policyholder obligations at the statement of financial position date. In addition, the Appointed Actuary is required each year to prepare a report for the Boards of Directors on the capital adequacy of the life and health insurance companies.
As at December 31, life insurance contract liabilities and the assets backing such liabilities are summarized as follows:
December 31, 2011
Life and health insurance contract liabilities ParticipatingNon-
participatingTotal before
reinsurance cededReinsurance
ceded Net totalIndividualLife and health insurance $712,688 $571,251 $1,283,939 $68,436 $1,215,503 Annuities 1,449 748,675 750,124 — 750,124
GroupLife and health insurance — 420,214 420,214 64,121 356,093Annuities — 3,382 3,382 — 3,382
$714,137 $1,743,522 $2,457,659 $132,557 $2,325,102

2011 ANNUAL REPORT I NOTES TO CONSOLIDATED FINANCIAL STATEMENTS LA CAPITALE CIVIL SERVICE MUTUAL
52
15) LIFE AND HEALTH INSURANCE CONTRACT LIABILITIES [Cont’d]
December 31, 2010
ParticipatingNon-
participatingTotal before
reinsurance cededReinsurance
ceded Net totalIndividualLife and health insurance $631,951 $461,569 $1,093,520 $56,732 $1,036,788Annuities 1,593 696,495 698,088 — 698,088
GroupLife and health insurance — 368,310 368,310 58,768 309,542Annuities — 2,009 2,009 — 2,009
$633,544 $1,528,383 $2,161,927 $115,500 $2,046,427
January 1, 2010
ParticipatingNon-
participatingTotal before
reinsurance cededReinsurance
ceded Net totalIndividualLife and health insurance $578,428 $405,468 $983,896 $53,536 $930,360Annuities 1,951 630,450 632,401 — 632,401
GroupLife and health insurance — 319,804 319,804 57,959 261,845Annuities — 1,975 1,975 — 1,975
$580,379 $1,357,697 $1,938,076 $111,495 $1,826,581
December 31, 2011
Assets backing life and health insurance policy liabilities
Individual GroupLife and health
insurance AnnuitiesLife and health
insurance Annuities TotalParticipatingBonds $523,762 $1,056 $ — $ — $524,818Stocks 12,324 25 — — 12,349Mortgage loans 9,928 20 — — 9,948Investment properties 77,939 157 — — 78,096Policy loans 27,366 55 — — 27,421Own-use properties 53,888 109 — — 53,997Other 13,501 27 — — 13,528
$718,708 $1,449 $ — $ — $720,157Non-participatingBonds $422,642 $129,385 $112,018 $1,077 $665,122Stocks 20,296 268,543 47,085 453 336,377Mortgage loans 297 315,454 108,572 1,044 425,367Investment properties 31,446 8,768 — — 40,214Policy loans 2,235 — — — 2,235Own-use properties 9,358 132 — — 9,490Other 10,521 26,393 88,418 808 126,140
$496,795 $748,675 $356,093 $3,382 $1,604,945
$1,215,503 $750,124 $356,093 $3,382 $2,325,102
Reinsurance ceded 68,436 — 64,121 — 132,557
Total before reinsurance ceded $1,283,939 $750,124 $420,214 $3,382 $2,457,659

2011 ANNUAL REPORT I NOTES TO CONSOLIDATED FINANCIAL STATEMENTS LA CAPITALE CIVIL SERVICE MUTUAL
53
December 31, 2010
Assets backing life and health insurance policy liabilities
Individual GroupLife and health
insurance AnnuitiesLife and health
insurance Annuities TotalParticipatingBonds $450,984 $1,128 $ — $ — $452,112Stocks 12,040 30 — — 12,070Mortgage loans 10,425 26 — — 10,451Investment properties 77,512 194 — — 77,706Policy loans 26,244 65 — — 26,309Own-use properties 26,525 66 — — 26,591Other 33,630 84 — — 33,714
$637,360 $1,593 $ — $ — $638,953Non-participatingBonds $339,708 $87,790 $119,724 $786 $548,008Stocks 16,926 252,308 24,550 161 293,945Mortgage loans 269 333,667 88,762 582 423,280Investment properties 29,971 6,023 — — 35,994Policy loans 1,988 — — — 1,988Own-use properties 9,539 139 — — 9,678Other 1,027 16,568 76,506 480 94,581
$399,428 $696,495 $309,542 $2,009 $1,407,474
$1,036,788 $698,088 $309,542 $2,009 $2,046,427
Reinsurance ceded 56,732 — 58,768 — 115 500
Total before reinsurance ceded $1,093,520 $698,088 $368,310 $2,009 $2,161,927
January 1, 2010Individual Group
Life and health insurance Annuities
Life and health insurance Annuities Total
ParticipatingBonds $444,744 $1,517 $ — $ — $446,261Stocks 9,611 32 — — 9,643Mortgage loans 11,516 39 — — 11,555Investment properties 74,308 224 — — 74,532Policy loans 24,848 83 — — 24,931Own-use properties 18,542 56 — — 18,598Other — — — — —
$583,569 $1,951 $ — $ — $585,520Non-participatingBonds $308,032 $86,426 $105,257 $960 $500,675Stocks 6,989 168,163 — — 175,152Mortgage loans 296 356,194 100,563 700 457,753Investment properties 22,059 2,890 68 — 25,017Policy loans 1,739 — — — 1,739Own-use properties 459 — — — 459Other 7,217 16,777 55,957 315 80,266
$346,791 $630,450 $261,845 $1,975 $1,241,061
$930,360 $632,401 $261,845 $1,975 $1,826,581
Reinsurance ceded 53,536 — 57,959 — 111,495
Total before reinsurance ceded $983,896 $632,401 $319,804 $1,975 $1,938,076
The estimated fair value of assets backing liabilities was $2,337,039 [December 31, 2010: $2,052,369] [January 1, 2010: $1,843,599].

2011 ANNUAL REPORT I NOTES TO CONSOLIDATED FINANCIAL STATEMENTS LA CAPITALE CIVIL SERVICE MUTUAL
54
15) LIFE AND HEALTH INSURANCE CONTRACT LIABILITIES [Cont’d]
ASSUMPTIONS
In computing life and health insurance contract liabilities, the assumptions were determined using the Appointed Actuary’s best estimates at the time of valuation as to contract terms regarding numerous variables, such as mortality, morbidity, investment return, contract management expenses, deferred taxes, policy lapses and participating policyholder dividends. Assumptions are periodically reviewed and reflect the most recent experience, as well as current life and health insurance company data. In certain cases, industry data are used. The actuary then factors margins for adverse deviations into these best estimates that take into account the risks incurred by life and health insurance companies to determine the final assumptions used.
The following methods were used to determine the most significant assumptions:
Mortality and morbidity
For individual life insurance mortality, the assumption stems from a combination of the most recent experience of life and health insurance companies and recent industry experience published by the Canadian Institute of Actuaries. The assumption differs based on the risk of tobacco use, classification at selection, as well as the age of insureds.
For group life insurance mortality, the assumption is based on industry experience.
For annuity mortality, the assumption is derived from the most recent industry data published by the Canadian Institute of Actuaries adjusted to reflect the business of life and health insurance companies. Moreover, the assumption used incorporates an improvement with regard to the current mortality level.
With regard to morbidity, the assumption is based on industry morbidity tables, which are modified to reflect the recent experience of the life and health insurance companies. The assumptions are different based on the duration since the onset of disability, age and sex.
A 2% increase in life insurance mortality and a 2% decrease in annuity mortality for the all the insureds of life and health insurance companies coupled with a 5% increase in claim incidence and a decrease in claim termination rates would result in an increase in life and health insurance contract liabilities and decrease in net income of the Mutual amounting to $24,370 [2010: $27,345].
Return on investments
The life and health insurance companies hold assets backing the life and health insurance contract liabilities. The expected rates of return for these assets are estimated based on current economic prospects, the investment policy of the companies and anticipated cash flows by business line. Given the economic outlook as at December 31, 2011, the yield curve by duration of Canadian Treasury bills ranges from 0.83% to 2.49% [2010: 0.97%–3.56%].
No assets backing life and health insurance contract liabilities are classified as available for sale: for accounting purposes, this matches investment income to changes in actuarial liabilities recognized in the statement of income. As for life and health insurance contract liabilities other than actuarial liabilities, the accounting mismatch is low.
To reflect interest rate risk, consisting of the financial loss that may arise from fluctuations in interest rates, the companies match each group of assets to the life and health insurance contract liabilities they back. This matching, which consists in managing spreads in maturities between assets and liabilities as well as expected net cash flows, minimizes potential losses related to interest rate risk.
An immediate 1% decline over the entire yield curve would result in a $24,523 decrease in net income [2010: $6,101]. An immediate 1% rise over the entire yield curve would result in a $19,934 increase in net income [2010: $7,531].
The companies manage credit risk through detailed credit and underwriting policies, and by placing aggregate limits on each issuer in their investment portfolios. An allowance for impaired loans was established and set off against the value of these loans. Moreover, actuarial liabilities include an amount to cover any potential payment defaults in respect of assets currently held by the companies. Potential payment defaults are factored in by reducing the expected rate of return of the asset. The reduction in rate of return is based on the risk of payment default for each asset class.
Contract maintenance expenses
Contract maintenance expenses are determined using internal cost allocation analyses of the individual life and health insurance companies, based on the actual or budgeted overhead costs for the following fiscal year. These expenses are indexed to inflation for the coming years and thus take into account the anticipated business growth of the life and health insurance companies as well as economic conditions.
An immediate 5% increase in contract management expenses would result in a $5,101 decrease in net income [2010: $4,351].
Deferred taxes
Actuarial liabilities include amounts reflecting the interest generating nature of the assets backing the deferred tax liabilities recorded in the statement of financial position. Actuarial liabilities as at December 31, 2011 were reduced by $7,720 [2010: $8,151] as a result of the impact of this discounting, which is carried out only for deferred tax liabilities related to life and health insurance contract liabilities.
Policy lapses
Assumptions regarding policy lapses are based on an analysis of the recent experience of life and health insurance companies for each business line.
A 10% deterioration in policy lapse assumptions would result in a $15,855 decrease in net income [2010: $12,906].
Participating policyholder dividends
Actuarial liabilities include amounts relating to regular future dividends to be paid to policyholders. The dividend scales are in keeping with policyholders’ reasonable expectations and the assumptions used in measuring actuarial liabilities.

2011 ANNUAL REPORT I NOTES TO CONSOLIDATED FINANCIAL STATEMENTS LA CAPITALE CIVIL SERVICE MUTUAL
55
Margins for adverse deviations
The basic assumptions used to determine life and health insurance contract liabilities are the best estimates as to a range of possible results. Each assumption must include an additional margin for adverse deviations in order to recognize the uncertainty regarding the preparation of best estimates and to take into account potential policy liability deterioration. These margins provide better assurance that life and health insurance contract liabilities are adequate to cover future policy benefit payments.
The Canadian Institute of Actuaries prescribes minimum standards for determining the margin in the interest rate assumption. The margins in other assumptions must fall within a range prescribed by the Canadian Institute of Actuaries and are determined based on the risk profile of the insurance companies.
CHANGE IN ACTUARIAL LIABILITIES AND REINSURANCE ASSETS
Actuarial liabilities2011 2010
Balance, beginning of year $2,061,682 $1,849,448
Normal changes $266,821 $213,391Other changes related to assumptions 11,958 (1,157)Changes in actuarial liabilities $278,779 $212,234
Balance, end of year $2,340,461 $2,061,682
In 2011, the main changes made to actuarial assumptions concern morbidity and interest rates.
Reinsurance assets2011 2010
Balance, beginning of year $115,500 $111,495Change 17,057 4,005Balance, end of year $132,557 $115,500
16) PROPERTY AND CASUALTY INSURANCE CONTRACT LIABILITIES
Actuarial liabilities are established to reflect estimated total property and casualty insurance contract liabilities as at the consolidated statement of financial position date, including claims incurred but not reported. The ultimate cost of these liabilities will vary from the best estimate for a variety of reasons, including obtaining additional information with respect to the facts and circumstances of the claims incurred. There was no premium deficiency as at the statement of financial position date.
Unearned premiums
The following table details unearned premiums per business line.
December 31, 2011Unearned premiums
Reinsurance assumed Subtotal
Reinsurance ceded
Net unearned premiums
Personal insuranceAutomobile:
Civil liability $114,071 $ — $114,071 $ — $114,071Accident 17,340 — 17,340 — 17,340Other 158,555 6,500 165,055 — 165,055
Property 125,663 — 125,663 — 125,663Civil liability 24 — 24 — 24Other 3,068 — 3,068 — 3,068
$418,721 $6,500 $425,221 $ — $425,221Commercial insuranceAutomobile:
Civil liability $5,857 $ — $5,857 $ — $5,857Accident 1,104 — 1,104 — 1,104Other 5,155 — 5,155 — 5,155
Property 28,214 — 28,214 1,267 26,947Civil liability 21,291 — 21,291 — 21,291Other 6,294 43 6,337 1,976 4,361
$67,915 $43 $67,958 $3,243 $64,715
Balance, end of year $486,636 $6,543 $493,179 $3,243 $489,936

2011 ANNUAL REPORT I NOTES TO CONSOLIDATED FINANCIAL STATEMENTS LA CAPITALE CIVIL SERVICE MUTUAL
56
16) PROPERTY AND CASUALTY INSURANCE CONTRACT LIABILITIES [Cont’d]
Unearned premiums [Cont’d]
December 31, 2010Unearned premiums
Reinsurance assumed Subtotal
Reinsurance ceded
Net unearned premiums
Personal insuranceAutomobile:
Civil liability $107,733 $ — $107,733 $ — $107,733Accident 21,703 — 21,703 — 21,703Other 148,310 2,467 150,777 — 150,777
Property 112,220 — 112,220 — 112,220Civil liability 33 — 33 — 33Other 2,654 — 2,654 — 2,654
$392,653 $2,467 $395,120 $ — $395,120Commercial insuranceAutomobile:
Civil liability $5,027 $ — $5,027 $ — $5,027Accident 997 — 997 — 997Other 4,092 — 4,092 — 4,092
Property 24,708 — 24,708 1,097 23,611Civil liability 25,717 — 25,717 — 25,717Other 6,448 — 6,448 1,900 4,548
$66,989 $ — $66,989 $2,997 $63,992
Balance, end of year $459,642 $2,467 $462,109 $2,997 $459,112
January 1, 2010Unearned premiums
Reinsurance assumed Subtotal
Reinsurance ceded
Net unearned premiums
Personal insuranceAutomobile:
Civil liability $100,368 $ — $100,368 $ — $100,368Accident 18,243 — 18,243 — 18,243Other 128,955 — 128,955 — 128,955
Property 101,599 — 101,599 23 101,576Civil liability 53 — 53 — 53Other 2,792 — 2,792 — 2,792
$352,010 $ — $352,010 $23 $351,987Commercial insuranceAutomobile:
Civil liability $4,584 $ — $4,584 $ — $4,584Accident 813 — 813 — 813Other 3,869 — 3,869 25 3,844
Property 19,831 — 19,831 891 18,940Civil liability 22,771 — 22,771 — 22,771Other 5,262 — 5,262 1,358 3,904
$57,130 $ — $57,130 $2,274 $54,856
Balance, end of year $409,140 $ — $409,140 $2,297 $406,843
Change in provision for unearned premiums
2011Unearned premiums
Reinsurance assumed Subtotal
Reinsurance ceded
Net unearned premiums
Balance, beginning of year $459,642 $2,467 $462,109 $2,997 $459,112Premiums written during the year 743,497 13,664 757,161 25,379 731,782Premiums earned during the year (716,503) (9,588) (726,091) (25,133) (700,958)Balance, end of year $486,636 $6,543 $493,179 $3,243 $489,936

2011 ANNUAL REPORT I NOTES TO CONSOLIDATED FINANCIAL STATEMENTS LA CAPITALE CIVIL SERVICE MUTUAL
57
2010Unearned premiums
Reinsurance assumed Subtotal
Reinsurance ceded
Net unearned premiums
Balance, beginning of year $409,140 $ — $409,140 $2,297 $406,843Premiums written during the year 720,744 2,504 723,248 23,884 699,364Premiums earned during the year (670,242) (37) (670,279) (23,184) (647,095)Balance, end of year $459,642 $2,467 $462,109 $2,997 $459,112
Provision for claims and loss adjustment expenses
The following table details net provision for claims and loss adjustment experience by business line.
December 31, 2011Gross provision for claims and
loss adjustment expenses
Reinsurance assumed Subtotal
Reinsurance ceded Subrogation
Net provision for claims and loss
adjustment expenses
Personal insuranceAutomobile:
Civil liability $94,591 $ — $94,591 $2,087 $1,565 $90,939Accident 72,132 — 72,132 6,046 320 65,766Other 15,603 310 15,913 96 1,097 14,720
Property 59,251 — 59,251 5,542 6,068 47,641Civil liability 1,261 — 1,261 — — 1,261Other 2,788 — 2,788 — — 2,788
$245,626 $310 $245,936 $13,771 $9,050 $223,115Commercial insuranceAutomobile:
Civil liability $8,478 $ — $8,478 $ — $16 $8,462Accident 3,599 — 3,599 — — 3,599Other 610 — 610 32 53 525
Property 20,377 — 20,377 2,320 815 17,242Civil liability 9,304 — 9,304 — — 9,304Other 14,149 — 14,149 7,490 3,172 3,487
$56,517 $ — $56,517 $9,842 $4,056 $42,619
Balance, end of year $302,143 $310 $302,453 $23,613 $13,106 $265,734
December 31, 2010Gross provision for claims and
loss adjustment expenses
Reinsurance assumed Subtotal
Reinsurance ceded Subrogation
Net provision for claims and loss
adjustment expenses
Personal insuranceAutomobile:
Civil liability $91,443 $ — $91,443 $2,263 $1,833 $87,347Accident 95,461 — 95,461 6,303 100 89,058Other 16,069 14 16,083 88 1,246 14,749
Property 55,439 — 55,439 4,276 5,524 45,639Civil liability 1,494 — 1,494 447 — 1,047Other 3,118 — 3,118 780 — 2,338
$263,024 $14 $263,038 $14,157 $8,703 $240,178Commercial insuranceAutomobile:
Civil liability $7,221 $ — $7,221 $66 $8 $7,147Accident 3,993 — 3,993 8 6 3,979Other 486 — 486 64 6 416
Property 16,763 — 16,763 2,648 682 13,433Civil liability 7,574 — 7,574 — 1 7,573Other 15,873 — 15,873 8,198 2,906 4,769
$51,910 $ — $51,910 $10,984 $3,609 $37,317
Balance, end of year $314,934 $14 $314,948 $25,141 $12,312 $277,495

2011 ANNUAL REPORT I NOTES TO CONSOLIDATED FINANCIAL STATEMENTS LA CAPITALE CIVIL SERVICE MUTUAL
58
16) PROPERTY AND CASUALTY INSURANCE CONTRACT LIABILITIES [Cont’d]
Provision for claims and loss adjustment expenses [Cont’d]
January 1, 2010Gross provision for claims and
loss adjustment expenses
Reinsurance assumed Subtotal
Reinsurance ceded Subrogation
Net provision for claims and loss
adjustment expenses
Personal insuranceAutomobile:
Civil liability $96,971 $ — $96,971 $1,680 $1,516 $93,755Accident 72,166 — 72,166 5,580 27 66,559Other 16,499 — 16,499 — 927 15,572
Property 52,130 — 52,130 3,773 5,481 42,876Civil liability 1,858 — 1,858 163 — 1,695Other 2,855 — 2,855 422 — 2,433
$242,479 $ — $242,479 $11,618 $7,951 $222,910Commercial insuranceAutomobile:
Civil liability $3,143 $ — $3,143 $ — $11 $3,132Accident 2,792 — 2,792 — — 2,792Other 576 — 576 — 7 569
Property 11,249 — 11,249 538 1,219 9,492Civil liability 7,674 — 7,674 — — 7,674Other 11,543 — 11,543 8,502 2,060 981
$36,977 $ — $36,977 $9,040 $3,297 $24,640
Balance, end of year $279,456 $ — $279,456 $20,658 $11,248 $247,550
Reinsurance assets are detailed as follows:
Reinsurance ceded December 31, 2011 December 31, 2010 January 1, 2010Provision for unearned premiums $3,243 $2,997 $2,297Provision for claims and loss adjustment
expenses 23,613 25,141 20,658$26,856 $28,138 $22,955
Changes in provision for claims and loss adjustment expenses
The following table summarizes the changes in the provision for claims and loss adjustment expenses of property and casualty insurance companies for the year.
2011Gross provision for claims and
loss adjustment expenses
Reinsurance assumed Subtotal
Reinsurance ceded Subrogation
Net provision for claims and loss
adjustment expenses
Balance, beginning of year $314,934 $14 $314,948 $25,141 $12,312 $277,495
Current year claims $451,515 $337 $451,852 $12,509 $10,227 $429,116Prior year unfavourable (favourable) claims
development 2,633 (12) 2,621 (766) 4,487 (1,100)Increase (decrease) due to changes in discount rate 2,476 — 2,476 635 (42) 1,883Total claims incurred $456,624 $325 $456,949 $12,378 $14,672 $429,899
Claims paid $469,415 $29 $469,444 $13,906 $13,878 $441,660
Balance, end of year $302,143 $310 $302,453 $23,613 $13,106 $265,734

2011 ANNUAL REPORT I NOTES TO CONSOLIDATED FINANCIAL STATEMENTS LA CAPITALE CIVIL SERVICE MUTUAL
59
2010Gross provision for claims and
loss adjustment expenses
Reinsurance assumed Subtotal
Reinsurance ceded Subrogation
Net provision for claims and loss
adjustment expenses
Balance, beginning of year $279,456 $ — $279,456 $20,658 $11,248 $247,550
Current year claims $445,160 $14 $445,174 $11,689 $10,301 $423,184Prior year unfavourable (favourable) claims
development 7,878 — 7,878 (158) 1,587 6,449Increase (decrease) due to changes in discount rate 772 — 772 (932) (128) 1,832Total claims incurred $453,810 $14 $453,824 $10,599 $11,760 $431,465
Claims paid $418,332 $ — $418,332 $6,116 $10,696 $401,520
Balance, end of year $314,934 $14 $314,948 $25,141 $12,312 $277,495
Effect of time value of money and provision for adverse deviation
The following table shows the effect of the time value of money and the provision for adverse deviation on the carrying amount of the net provision for claims and loss adjustment expenses.
December 31, 2011Gross provision for claims and
loss adjustment expenses
Reinsurance assumed Subtotal
Reinsurance ceded Subrogation
Net provision for claims and loss
adjustment expenses
Undiscounted value $294,633 $310 $294,943 $24,100 $12,456 $258,387Effect of time value of money using a rate of 3.86% (19,293) — (19,293) (1,473) (48) (17,772)Provision for adverse deviations 26,803 — 26,803 986 698 25,119Carrying amount $302,143 $310 $302,453 $23,613 $13,106 $265,734
December 31, 2010Gross provision for claims and
loss adjustment expenses
Reinsurance assumed Subtotal
Reinsurance ceded Subrogation
Net provision for claims and loss
adjustment expenses
Undiscounted value $309,900 $14 $309,914 $27,136 $11,622 $271,156Effect of time value of money using a rate of 4.41% (22,017) — (22,017) (2,754) (88) (19,175)Provision for adverse deviations 27,051 — 27,051 759 778 25,514Carrying amount $314,934 $14 $314,948 $25,141 $12,312 $277,495
January 1, 2010Gross provision for claims and
loss adjustment expenses
Reinsurance assumed Subtotal
Reinsurance ceded Subrogation
Net provision for claims and loss
adjustment expenses
Undiscounted value $275,194 $ — $275,194 $21,722 $10,429 $243,043Effect of time value of money using a rate of 4.17% (18,174) — (18,174) (1,540) (105) (16,529)Provision for adverse deviations 22,436 — 22,436 476 924 21,036Carrying amount $279,456 $ — $279,456 $20,658 $11,248 $247,550
Since the time value of money is considered when determining the provision for claims and loss adjustment expenses, an increase or decrease in the discount rate would result in a decrease or increase in the provision for claims and loss adjustment expense, respectively. A 1% change in the discount rate would have a $4,900 impact on the fair value of the provision for claims and loss adjustment expenses as at December 31, 2011 [December 31, 2010: $4,900] [January 1, 2010: $4,300].
Reinsurance
In the normal course of business, property and casualty insurance companies seek to reduce the loss that may result from catastrophes or other events that give rise to unfavourable underwriting results by reinsuring certain levels of risk with other insurers.
The companies carried out reinsurance transactions in respect of new policies issued and policies renewed in fiscal 2011 and 2010, as well as the related claims incurred.

2011 ANNUAL REPORT I NOTES TO CONSOLIDATED FINANCIAL STATEMENTS LA CAPITALE CIVIL SERVICE MUTUAL
60
16) PROPERTY AND CASUALTY INSURANCE CONTRACT LIABILITIES [Cont’d]
Reinsurance [Cont’d]
The following table shows the companies’ net retentions and coverage limits by nature of risk.
December 31, 2011 December 31, 2010 January 1, 2010Single risk lossesNet retentions:
Property:– Personal insurance $2,000 $1,500 $1,500– Commercial insurance $1,000 $750 $750Civil liability $1,750 $1,500 $1,500
Multiple risks and catastrophesNet retentions $5,000 $5,000 $5,000Coverage limits $310,000 $285,000 $260,000
Gross claims development
Year of accident2007 and thereafter 20081 2009 2010 2011 Total
Estimated amount of undiscounted claims and loss adjustment expenses before external reinsurance
At end of accident year $278,151 $477,996 $365,529 $407,719 $391,806
Revised estimates1 year later $277,213 $498,322 $373,300 $394,2812 years later $277,380 $505,753 $377,2243 years later $274,936 $512,4934 years later $276,168Current estimates $276,168 $512,493 $377,224 $394,281 $391,806 $1,951,972
Claims paid during prior periodsAt end of accident year $213,714 $269,616 $263,633 $267,904 $277,8791 year later $256,549 $381,338 $335,066 $347,4482 years later $262,629 $420,852 $350,9853 years later $266,330 $452,1304 years later $268,074Current cumulative payments $268,074 $452,130 $350,985 $347,448 $277,879 $1,696,516
Provision for claims and loss adjustment expenses after external reinsurance $8,094 $60,363 $26,239 $46,833 $113,927 $255,456
Provision for internal expenses and risk pooling arrangement 17,432Effect of time value of money and provision for adverse
deviation 7,510Subrogation 22,055Gross provision for claims and loss adjustment
expenses $302,453
Excess (insufficiency) of initial provision relative to re-estimated final cost as at December 31, 2011Amount $1,983 $(34,497) $(11,695) $13,438Percentage 0.7% (7.2)% (3.2)% 3.3%
The amounts relating to Unica Insurance Inc. are included as of its acquisition by La Capitale General Insurance Inc. on September 30, 2008.
1. The operations of Unica Insurance Inc. were integrated in September 2008. The total liability for net claims include an amount of $174,677 for all accident years related to Unica Insurance Inc.

2011 ANNUAL REPORT I NOTES TO CONSOLIDATED FINANCIAL STATEMENTS LA CAPITALE CIVIL SERVICE MUTUAL
61
Net claims development
Year of accident2007 and thereafter 20081 2009 2010 2011 Total
Estimated amount of undiscounted claims and loss adjustment expenses after external reinsurance
At end of accident year $273,853 $464, 245 $363,222 $397,328 $380,403
Revised estimates1 year later $273,043 $483,402 $366,331 $382,7902 years later $273,227 $489,671 $368,2993 years later $270,705 $497,4654 years later $272,004Current estimates $272,004 $497,465 $368,299 $382,790 $380,403 $1,900,961
Claims paid during prior periodsAt end of accident year $212,644 $264,422 $259,014 $265,656 $273,0211 year later $255,729 $370,686 $327,561 $338,1202 years later $261,820 $409,055 $341,5543 years later $265,418 $440,5144 years later $267,135Current cumulative payments $267,135 $440,514 $341,554 $338,120 $273,021 $1,660,344
Provision for claims and loss adjustment expenses after external reinsurance $4,869 $59,951 $26,745 $44,670 $107,382 $240,617
Provision for internal expenses and risk pooling arrangement 17,770Effect of time value of money and provision for adverse
deviation 7,347Net provision for claims and loss adjustment expenses $265,734
Excess (insufficiency) of initial provision relative to re-estimated final cost as at December 31, 2011Amount $1,849 $(33,220) $(5,077) $14,538Percentage 0.7% (7.2)% (1.4)% 3.7%
The amounts relating to Unica Insurance Inc. are included as of its acquisition by La Capitale General Insurance Inc. on September 30, 2008.
1. The operations of Unica Insurance Inc. were integrated in September 2008. The total liability for net claims include an amount of $166,766 for all accident years related to Unica Insurance Inc.
17) OTHER LIABILITIES
Other liabilities consist of the following:
December 31, 2011 December 31, 2010 January 1, 2010Other financial liabilitiesOther amounts on deposit $43,425 $37,842 $24,479Loyalty, stabilization and development fund 35,513 25,044 14,269Excess of outstanding cheques over cash 2,345 5,051 —Deposits for taxes 4,450 4,952 5,606Amounts due to reinsurers – life and health insurance segment 6,315 5,336 4,259Amounts due to reinsurers – property and casualty insurance segment 1,175 1,755 290Deposits in trust 857 529 2,373Liabilities related to derivative financial instruments [note 21] 3,619 5,756 8,344Other 165 — —
$97,864 $86,265 $59,620
Other liabilitiesStock appreciation rights plan payable $13,422 $12,564 $14,820Deferred revenues 832 1,097 1,677
$14,254 $13,661 $16,497
$112,118 $99,926 $76,117

2011 ANNUAL REPORT I NOTES TO CONSOLIDATED FINANCIAL STATEMENTS LA CAPITALE CIVIL SERVICE MUTUAL
62
17) OTHER LIABILITIES [Cont’d]
The Mutual offers a stock appreciation rights plan to certain officers. Under this plan, participants are entitled to receive cash compensation based on the increase in value of the shares of La Capitale Financial Group Inc. relative to the initial value as defined under the plan. The rights must be exercised when participants leave the position, which renders them eligible for the plan. The accumulated amounts are payable under terms that vary according to the participant’s departure type (transfer, retirement, permanent disability, death or voluntary termination) over a maximum term of four years following the year of departure.
Plan expense for the year amounted to $1,016 [2010: $831].
The fair value of stock appreciation rights is estimated at the grant dates using the Black- Scholes method. The model uses the following key assumptions:
December 31, 2011 December 31, 2010 January 1, 2010Risk-free interest rate 1.54% 2.54% 3.11%Expected volatility of dividend yield 6.86% 6.91% 7.13%Average expected life of rights 5.53 years 6.48 years 7.29 years
18) LONG-TERM DEBT
December 31, 2011 December 31, 2010 January 1, 2010Subordinated debenture maturing on September 29, 2016 and bearing
interest at a rate of 4.93% [2010: 6.36%] per annum payable semi-annually $7,000 $7,000 $7,000
Interim bridge financing demand loan with an authorized maximum amount of $15,500 for completion of the construction project, bearing interest at prime plus 1.50% secured by a $20,000 general immovable hypothec and converted into a term loan on in September 2011 [note 24] — 15,174 —
Borrowing bearing interest at the bankers’ acceptance rate plus 2.40%, totalling 5.15%, secured by a $20,000 first immovable hypothec, renewable in 2016 and maturing in 2016 16,939 — —
$23,939 $22,174 $7,000
The maturities for long-term debt are as follows:
Mortgage loan Debenture TotalCurrent portion $344 $ — $344Portion from 1 to 5 years 16,595 7,000 23,595
$16,939 $7,000 $23,939
The interest on long-term debt amounted to $1,391 [2010: $445].
The subordinated debenture, constituting an unsecured direct claim on the Mutual, is subordinated to the rights of policyholders and other creditors of the Mutual. Repayment of the subordinated debenture in whole or in part is subject to approval by the Autorité des marchés financiers.
The fair values of the debenture, the construction loan and the mortgage loan classified under other liabilities are estimated using a valuation model based on market prices for instruments with similar terms. These fair values may fluctuate depending on interest rates and credit risks associated with such financial instruments.
December 31, 2011 December 31, 2010 January 1, 2010Fair valueSubordinated debenture $7,135 $7,353 $7,410Construction loan — 15,174 —Mortgage loan 17,143 — —
$24,278 $22,527 $7,410

2011 ANNUAL REPORT I NOTES TO CONSOLIDATED FINANCIAL STATEMENTS LA CAPITALE CIVIL SERVICE MUTUAL
63
19) CAPITAL MANAGEMENT
The Mutual’s capital management objectives are as follows:
– Ensure capital preservation, development and growth.
– Meet the requirements of the authorities that regulate the operations of its insurance subsidiaries.
To meet its objectives, the Mutual has implemented sound business and financial practices with respect to capital management. The policies and procedures described in these practices enable the Mutual and its subsidiaries to support its strategic directions and its performance goals while meeting their set capital adequacy target.
The Mutual and its subsidiaries regularly review capital using various tools including the Dynamic Capital Adequacy Testing and capital position monitoring reports. These documents are reviewed and approved each year by the Boards of Directors.
The Mutual and its subsidiaries have set capital targets which exceed capital requirements under regulatory authority guidelines. As at January 1, 2010, December 31, 2010 and 2011, the Mutual and its subsidiaries were in compliance with the applicable capital requirements of regulatory authorities.
The key capital items are detailed as follows:
December 31, 2011 December 31, 2010 January 1, 2010Long-term debt $23,939 $22,174 $7,000Retained earnings attributable to members 450,518 413,196 372,948Accumulated other comprehensive income attributable to members 16,464 16,049 6,825Participating policyholders’ account 157,728 145,655 129,344Non-controlling interests 143,955 130,081 113,329
$792,604 $727,155 $629,446
In 2011 and 2010, items resulting in an increase in capital consisted of net income and changes in available-for-sale financial instruments.
20) EMPLOYEE FUTURE BENEFITS
The Mutual has four defined benefit plans providing pension benefits to most of its employees as well as defined contribution plans. The defined benefit plans are based on years of service and use final average earnings or annually indexed pension credits. Pension benefits are increased based on the consumer price index up to a maximum of 3% each year. These plans are funded. Furthermore, the Mutual has additional unfunded plans for senior management.
Other future benefits include retirees’ contributory health insurance plans for which employee contributions are adjusted annually, life insurance plans and celebration costs and retirements. These plans are unfunded.
The defined contribution plans were set up in 2002 and 2011. The expense for these plans in 2011 totalled $957 [2010: $135].
Information related to the pension plans and other future benefits is as follows:
Pension plans Employee future benefitsDecember 31, 2011 December 31, 2010 December 31, 2011 December 31, 2010
Defined benefit obligationBalance, beginning of year $260,755 $212,582 $13,537 $11,223Employee contributions 6,854 6,388 — —Current service costs 10,892 7,175 1,270 794Transfers 108 49 — —Interest expense 15,189 13,997 840 601Actuarial losses 31,359 25,951 997 1,802Benefits paid (10,345) (5,387) (723) (883)Impact of changes in assumptions 72 — — —Balance, end of year $314,884 $260,755 $15,921 $13,537
The defined benefit obligation is detailed as follows:
Pension plans Employee future benefitsDecember 31, 2011 December 31, 2010 December 31, 2011 December 31, 2010
Funded plans $308,579 $254,229 $ — $ —Unfunded plans 6,305 6,526 15,921 13,537
$314,884 $260,755 $15,921 $13,537

2011 ANNUAL REPORT I NOTES TO CONSOLIDATED FINANCIAL STATEMENTS LA CAPITALE CIVIL SERVICE MUTUAL
64
20) EMPLOYEE FUTURE BENEFITS [Cont’d]
Pension plans Employee future benefitsDecember 31, 2011 December 31, 2010 December 31, 2011 December 31, 2010
Net assetsFair value, beginning of year $237,794 $201,109 $ — $ —Actual return on plan assets 1,507 13,888 — —Employer contributions 25,923 21,747 — —Employee contributions 6,854 6,388 — —Transfers 108 49 — —Benefits paid (10,345) (5,387) — —Fair value, end of year $261,841 $237,794 $ — $ —
Pension plans Employee future benefitsDecember 31,
2011December 31,
2010January 1,
2010December 31,
2011December 31,
2010January 1,
2010Funded status – Net deficit $(53,043) $(22,961) $(11,473) $(15,921) $(13,537) $(11,223)Unamortized net actuarial loss 71,019 25,452 — 2,757 1,802 —Impact of asset value ceiling test — (123) (147) — — —Minimum funding liability — — 3,729 — — —Defined benefit asset (liability) $17,976 $2,368 $(15,349) $(13,164) $(11,735) $(11,223)
Pension plan assets were measured as at December 31, 2011 and the defined benefit obligation was measured as at December 31, 2011.
Pension plan assets do not include securities of the Mutual and its subsidiaries.
The following table shows the allocation of assets at fair value by main asset class:
Pension plansDecember 31, 2011 December 31, 2010 January 1, 2010
Asset classesStocks 57% 57% 62%Bonds 42 42 37Other 1 1 1
100% 100% 100%
The following table summarizes the weighted average actuarial assumptions used to calculate defined benefit obligation and expense:
Pension plans Employee future benefitsDecember 31,
2011December 31,
2010January 1,
2010December 31,
2011December 31,
2010January 1,
2010To determine defined benefit obligationDiscount rate 5.25% 5.70% 6.50% 5.25% 5.70% 6.50%Rate of increase in future compensation 3.50% 3.50% 3.50% 3.50% 3.50% 3.50%
To determine defined benefit expenseDiscount rate 5.70% 6.50% 7.50% 5.70% 6.50% 7.50%Expected rate of return on plan assets 6.50% 6.50% 6.50% —% —% —%Rate of increase in future compensation 3.50% 3.50% 3.50% 3.50% 3.50% 3.50%
December 31, 2011
Assumed health care cost trend ratesEmployee future benefits
Drugs Health Dental OtherInitial health care cost trend rates 7.00% 3.00% 3.70% 5.00%Cost trend rate declines to 3.00% 3.00% 3.00% 3.00%Number of years required to stabilize rates 15 years — 15 years 15 years
December 31, 2010Employee future benefits
Drugs Health Dental OtherInitial health care cost trend rates 7.00% 3.00% 3.70% 5.00%Cost trend rate declines to 3.00% 3.00% 3.00% 3.00%Number of years required to stabilize rates 15 years — 15 years 15 years

2011 ANNUAL REPORT I NOTES TO CONSOLIDATED FINANCIAL STATEMENTS LA CAPITALE CIVIL SERVICE MUTUAL
65
January 1, 2010Employee future benefits
Drugs Health Dental OtherInitial health care cost trend rates 7.00% 3.00% 3.70% 5.00%Cost trend rate declines to 3.00% 3.00% 3.00% 3.00%Number of years required to stabilize rates 15 years — 15 years 15 years
The expected rate of return on plan assets is based on a weighted average of expected rates from the various asset classes comprising the plans. Return expectations for the various classes are based on an analysis of historical returns and the expected market returns as of the date the liability is established.
The Mutual’s net expense in respect of employee pension plans and other employee future benefits is as follows:
Pension plans Employee future benefits2011 2010 2011 2010
Current service costs $10,892 $7,175 $1,270 $794Interest 15,189 13,996 840 601Expected return on plan assets (16,328) (13,714) — —Amortization of actuarial net loss 651 324 42 —Change in asset value ceiling test (88) (22) — —Change in minimum funding liability — (3,729) — —Net expense $10,316 $4,030 $2,152 $1,395
The net employee future benefit expense is included under general expenses.
historical experience adjustments were as follows:
2011 2010Pension plansPresent value of defined benefit obligation $314,884 $260,755Fair value of plan assets 261,841 237,794Deficit $(53,043) $(22,961)
Adjustments related to plan liability experience $(31,359) $(25,951)
Adjustments related to plan asset experience $(14,821) $174
Employee future benefitsPresent value of defined benefit obligation $15,921 $13,537Fair value of plan assets — —Deficit $(15,921) $(13,537)
Adjustments related to other future benefit liability experience $(997) $(1,802)
The dates of the most recent and the next required actuarial valuations for funding purposes are as follows:
Most recent valuation Next valuationManagers and related staff plan December 31, 2010 December 31, 2011Employee plan December 31, 2010 December 31, 2011Senior management plan December 31, 2010 December 31, 2011Board members plan December 31, 2010 December 31, 2011
Sensitivity analysis
The assumption regarding the increase in health care costs has an impact on the amounts reported for other future benefits. A one-percentage-point increase or decrease in the health care cost trend rate would have the following impact for 2011:
Increase DecreaseTotal service costs and interest expense $274 $(211)Defined benefit obligation $2,506 $(1,942)

2011 ANNUAL REPORT I NOTES TO CONSOLIDATED FINANCIAL STATEMENTS LA CAPITALE CIVIL SERVICE MUTUAL
66
21) DERIVATIVE FINANCIAL INSTRUMENTS
The Mutual uses interest rate contracts including interest rate [reverse] repurchase agreements, as well as swaps, in the normal course of its risk management.
The following table shows the notional amounts of these derivative financial instruments and their related fair values.
Interest rate contractsDecember 31, 2011 December 31, 2010 January 1, 2010
Notional amount by maturityUnder 1 year $242,603 $386,947 $374,0531–3 years 77,531 239,334 501,981
$320,134 $626,281 $876,034
Reported as: Assets at fair value $99 $66 $ —
Liabilities at fair value [note 17] $3,619 $5,756 $8,344
The notional amount is the amount to which the rate or price is applied to determine the amounts to be exchanged periodically.
The fair value recognized in other liabilities is the estimated amount that the Mutual would be required to pay at the end of the year to close out its positions.
In light of the high probability of interest rate movements related to securitization transactions, the Mutual is exposed to interest rate risk, which is hedged using swaps. A 1% increase in the interest rate would result in a $764 increase [December 31, 2010: $1,878] [January 1, 2010: $3,675] in the fair value of swaps, which are measured using valuation techniques based in large part on non-observable market inputs. A 1% decrease in the interest rate would result in a $781 decrease [December 31, 2010: $1,935] [January 1, 2010: $3,818] in the fair value of swaps.
22) INVESTMENT INCOME
2011
Held for trading
Designated at fair value through
incomeAvailable- for-sale
Loans and receivables Other Total
Cash and cash equivalentsInterest $3,726 $ — $ — $ — $ — $3,726
BondsInterest — 53,072 15,170 — — 68,242Realized gains — — 14,541 — — 14,541Change in fair value — 136,867 — — — 136,867
StocksDividends — 12,698 12,410 — — 25,108Realized gains — — 4,456 — — 4,456Change in fair value — (14,378) — — — (14,378)
Mortgage loansInterest — — — 26,589 — 26,589Realized gains — — — — — —
Investment propertiesRental income — — — — 23,878 23,878
Policy loans — — — 1,855 — 1,855
Other investmentsInterest 4 43 — 1,627 (9) 1,665Change in fair value 1,346 — — — — 1,346Share of income of joint ventures — — — — 227 227
Other — — — — 135 135$5,076 $188,302 $46,577 $30,071 $24,231 $294,257

2011 ANNUAL REPORT I NOTES TO CONSOLIDATED FINANCIAL STATEMENTS LA CAPITALE CIVIL SERVICE MUTUAL
67
2010
Held for trading
Designated at fair value through
incomeAvailable- for-sale
Loans and receivables Other Total
Cash and cash equivalentsInterest $3,777 $ — $ — $ — $ — $3,777
BondsInterest — 51,965 15,772 — — 67,737Realized gains — — 9,597 — — 9,597Change in fair value — 76,618 — — — 76,618
StocksDividends — 8,426 9,908 — — 18,334Realized gains — — 746 — — 746Change in fair value — 20,750 — — — 20,750
Mortgage loansInterest — — — 26,360 — 26,360Realized gains — — — 38 — 38
Investment propertiesRental income — — — — 19,386 19,386
Policy loans — — — 1,588 — 1,588
Other investmentsInterest — 137 — 1,088 (175) 1,050Change in fair value 2,609 — — — — 2,609Share of income of joint ventures — — — — 585 585
Other — — — — 23 23$6,386 $157,896 $36,023 $29,074 $19,819 $249,198
23) LEASES
As lessee
As at December 31, 2011, the Mutual is committed under leases and service contracts expiring at various dates through 2022.
Future minimum payments under non-cancellable operating leases are as follows:
2011 2010Under 1 year $3,233 $3,2491–5 years 6,865 7,112Over 5 years 4,508 5,418
$14,606 $15,779
These leases have terms ranging from one to eleven years and may include a renewal option at expiry.
Lease payments recognized as lease expense for the year consisted of $3,462 in minimum payments [2010: $3,347].
As lessor
Operating leases pertain to the rental of properties held by the Mutual. These leases have terms ranging from one to 25 years and may include a renewal option at expiry. There is no purchase option available under current lease terms.
Future rent payments receivable under non-cancellable leases are as follows:
2011 2010Under 1 year $20,552 $20,0491–5 years 59,864 61,563Over 5 years 75,000 86,812
$155,416 $168,424

2011 ANNUAL REPORT I NOTES TO CONSOLIDATED FINANCIAL STATEMENTS LA CAPITALE CIVIL SERVICE MUTUAL
68
24) BUSINESS ACQUISITION
On December 6, 2010, the Mutual acquired 70% of the partnership units of a limited partnership for a cash consideration of $4,436. No goodwill or intangible assets were recognized under this transaction. This partnership operates and manages a rental building for persons with reduced autonomy.
The consolidated financial statements include the results of this partnership as of its acquisition date.
The final allocation based on the fair value of the net assets acquired at the acquisition date is as follows.
2010Assets acquiredCash and cash equivalents $344Investment properties 21,033Property and equipment 205Other assets 545
$22,127
Liabilities assumedAccrued liabilities $616Long-term debt 15,174
$15,790
$6,337Non-controlling interests (1,901)Net assets acquired $4,436
25) COMMITMENTS
Investment commitments
In the normal course of the Mutual’s business, various outstanding contractual commitments related to residential loan offers are not reflected in the consolidated financial statements and may not be fulfilled.
Expiring in45 days 46–365 days 2013 and thereafter$4,893 $11,713 —
Structured settlements
The Mutual has entered into annuity contracts with several Canadian life and health insurance companies to provide for fixed and periodic benefit payments to beneficiaries. Under these agreements, the Mutual has ceded its commitments to the beneficiaries of annuity contracts; however, it remains exposed to credit risk to the extent that the life and health insurance companies might not be able to meet their financial obligations to these beneficiaries. To reduce its exposure to this credit risk, the Mutual has purchased annuity contracts from insurance companies with excellent credit ratings. The residual credit risk assumed by the Mutual is the credit risk related to the Canadian life and health insurance companies with which it does business. This residual credit risk is mitigated by the protection provided by ASSURIS to life and health insurance policyholders.
As at December 31, 2011, none of the insurance companies from which the Mutual had acquired annuity contracts were in default and accordingly, no provision for credit risk was recorded in the financial statements. Exposure to credit risk is evaluated as total purchases of annuity contracts that are not provided for as a liability of the Mutual, which amounted to $14,619 [2010: $11,878] over a maximum period of 52 years [2010: 52 years]. The risk-adjusted balance is determined by applying the standard measures of counterparty risk defined by the regulatory authority to the credit equivalent amount. The Mutual’s management considers the risk of financial default by the insurance companies with which it does business to be very low.
Other
The Mutual acquired emphyteutic lease rights on April 5, 1989 and August 6, 1990 in respect of the land on which a building and real estate complex are located, expiring on December 31, 2050 and May 31, 2082. As at December 31, 2011, annual lease payments totalled $297 [2010: $288] indexed at 3% per annum until December 31, 2020 and a fixed amount of $74 until May 31, 2022. Subsequently, annual lease payments will be adjusted on December 31, 2020 and May 31, 2022, respectively, based on the value of the land and the average yield of Quebec long-term savings bonds. Total commitments amount to $3,014 from 2012 to 2020 [$3,303 from 2011 to 2020] and $767 from 2012 to 2022 [$841 from 2011 to 2022].
Commitments as at December 31, 2011 relating to the construction of the new head office amounted to $15,839 [2010: $13,379].
The Mutual is also committed to subscribe, on demand, an amount of $3,800 for class A units of a mutual fund at the price of $1 per unit.
26) CONTINGENCIESThe Mutual is involved in certain legal claims arising in the normal course of business. Management believes that the Mutual has set aside sufficient provisions to cover potential losses in relation to such lawsuits.

2011 ANNUAL REPORT I NOTES TO CONSOLIDATED FINANCIAL STATEMENTS LA CAPITALE CIVIL SERVICE MUTUAL
69
27) SEGMENTED INFORMATIONThe Mutual’s operations consist primarily of two segments: life and health insurance, and property and casualty insurance. The Mutual conducts business primarily in Canada.
2011 2010Life and health
insuranceProperty and
casualty insurance TotalLife and health
insuranceProperty and
casualty insurance TotalRevenuesInsurance and annuity premiums $690,300 $726,337 $1,416,637 $644,249 $670,978 $1,315,227Insurance and annuity premiums ceded
to reinsurers (37,646) (25,379) (63,025) (37,712) (23,884) (61,596)Net insurance and annuity premiums $652,654 $700,958 $1,353,612 $606,537 $647,094 $1,253,631Investment income 256,261 37,769 294,030 217,704 30,909 248,613Share of income of joint ventures 23 204 227 391 194 585Other 17,791 1,162 18,953 20,062 2,235 22,297
$926,729 $740,093 $1,666,822 $844,694 $680,432 $1,525,126
Policy benefits and expensesBenefits and claims incurred $431,465 $442,277 $873,742 $401,964 $442,064 $844,028Benefits and claims ceded to reinsurers (24,145) (12,378) (36,523) (19,139) (10,599) (29,738)Net benefits and claims $407,320 $429,899 $837,219 $382,825 $431,465 $814,290Participating policyholder dividends 12,969 — 12,969 12,392 — 12,392Experience rating refunds 15,616 — 15,616 13,005 — 13,005Changes in actuarial liabilities 278,779 — 278,779 212,234 — 212,234Changes in reinsurance assets (17,057) — (17,057) (4,005) — (4,005)
$697,627 $429,899 $1,127,526 $616,451 $431,465 $1,047,916Operating expenses 188,636 254,575 443,211 168,655 201,113 369,768Amortization 5,907 9,265 15,172 5,878 9,637 15,515
$892,170 $693,739 $1,585,909 $790,984 $642,215 $1,433,199Income before income taxes $34,559 $46,354 $80,913 $53,710 $38,217 $91,927Income taxes 3,918 11,290 15,208 14,466 10,827 25,293Net income $30,641 $35,064 $65,705 $39,244 $27,390 $66,634
December 31, 2011 December 31, 2010Life and health
insuranceProperty and
casualty insurance TotalLife and health
insuranceProperty and
casualty insurance TotalASSETSInvestments $2,655,287 $673,884 $3,329,171 $2,394,566 $627,681 $3,022,247Deferred taxes 4,388 8,443 12,831 6,033 10,457 16,490Other assets 229,929 463,222 693,151 189,347 445,836 635,183Employee future benefits 13,081 4,895 17,976 2,368 — 2,368Property and equipment 70,067 35,603 105,670 42,899 29,982 72,881Intangible assets 40,480 27,089 67,569 33,511 32,439 65,950Goodwill 60,336 40,804 101,140 60,336 40,804 101,140
$3,073,568 $1,253,940 $4,327,508 $2,729,060 $1,187,199 $3,916,259
LIABILITIESLife and health insurance contract liabilities $2,457,659 $ — $2,457,659 $2,161,927 $ — $2,161,927Property and casualty insurance contract
liabilities — 795,632 795,632 — 777,057 777,057$2,457,659 $795,632 $3,253,291 $2,161,927 $777,057 $2,938,984
Accrued liabilities 61,305 56,022 117,327 57,680 50,393 108,073Other liabilities 64,730 48,877 113,607 58,682 42,207 100,889Deferred taxes 36,022 1,493 37,515 27,131 2,292 29,423Employee future benefits 7,424 5,740 13,164 4,276 7,459 11,735Debt (31,061) 55,000 23,939 (32,826) 55,000 22,174
$2,596,079 $962,764 $3,558,843 $2,276,870 $934,408 $3,211,278
EQUITY $477,489 $291,176 $768,665 $452,190 $252,791 $704,981
LIABILITIES AND EQUITY $3,073,568 $1,253,940 $4,327,508 $2,729,060 $1,187,199 $3,916,259

2011 ANNUAL REPORT I NOTES TO CONSOLIDATED FINANCIAL STATEMENTS LA CAPITALE CIVIL SERVICE MUTUAL
70
27) SEGMENTED INFORMATION [Cont’d]
January 1, 2010Life and health
insuranceProperty and
casualty insurance TotalASSETSInvestments $2,156,462 $554,192 $2,710,654Deferred taxes 5,418 13,254 18,672Other assets 187,561 385,630 573,191Employee future benefits — — —Property and equipment 33,312 23,346 56,658Intangible assets 27,215 31,220 58,435Goodwill 60,336 40,804 101,140
$2,470,304 $1,048,446 $3,518,750
LIABILITIESLife and health insurance contract liabilities $1,938,076 $ — $1,938,076Property and casualty insurance contract
liabilities — 688,596 688,596$1,938,076 $688,596 $2,626,672
Accrued liabilities 69,488 42,448 111,936Other liabilities 63,976 31,707 95,683Deferred taxes 25,546 2,895 28,441Employee future benefits 13,437 13,135 26,572Debt (48,000) 55,000 7,000
$2,062,523 $833,781 $2,896,304
EQUITY $407,781 $214,665 $622,446
LIABILITIES AND EQUITY $2,470,304 $1,048,446 $3,518,750
28) RELATED PARTY INFORMATION
These financial statements include the financial statements of La Capitale Civil Service Mutual and the subsidiaries and joint ventures listed below:
Subsidiary Joint venturesLa Capitale Financial Group Inc. Société Bon Pasteur (s.e.n.c.)La Capitale Civil Service Insurer Inc. Promutuel Life Inc.La Capitale Insurance and Financial Services Inc. Groupe Cloutier Employee Benefits Inc.Penncorp Life Insurance CompanyLa Capitale General Insurance Inc.L’Unique General Insurance Inc.Unica Insurance Inc. (formerly York Fire & Casualty
Insurance Company)La Capitale MFQ Real Estate Management Inc.La Capitale Financial Services Inc.AGA Financial Group Inc.La Capitale Participations inc.3602214 Canada Inc.Immo-Beauport S.E.C.ValorInvest société en commandite

2011 ANNUAL REPORT I NOTES TO CONSOLIDATED FINANCIAL STATEMENTS LA CAPITALE CIVIL SERVICE MUTUAL
71
Transactions with related entities
The main transactions carried out with the joint ventures relate to the distribution of financial products and to various administrative services.
Joint ventures2011 2010
TransactionsFees, commissions and royalties and other revenues $1,936 $1,810Investment income $1,849 $1,946General expenses $1,469 $1,471
All transactions were carried out at fair value.
Compensation of executive officers
The accumulated compensation of senior executive officers for the year is as follows:
2011 2010Short-term employee benefits $19,679 $19,723Post-employment benefits $4,532 $99Termination benefits $ — $210
29) MANAGEMENT OF FINANCIAL INSTRUMENT AND INSURANCE CONTRACT RISK
Principles and responsibilities of risk management
The guiding principle of risk management is to identify, understand and report the Mutual’s risk exposures to its various stakeholders. A variety of policies have been implemented and approved by the Board of Directors with various committees in place to monitor risk exposures. These policies are reviewed on an annual basis.
The Board of Directors is responsible for establishing the Mutual’s level of risk tolerance and for implementing the policies required to ensure monitoring and understanding of the risk it assumes. The Board of Directors is also responsible for governance. The Audit Committees of the insurance companies are responsible for liaising between the Boards of Directors and the various committees involved in the Mutual’s risk management. The Internal Audit function, which reports to the Audit Committee, is responsible for assessing compliance with the policies.
The Risk Management Advisory Committee, the Regulatory Compliance Committee and the Investment Committee report to senior management, which liaises with the Board of Directors and the Audit Committees of the insurance companies.
The risk management policy falls under the purview of the Risk Management Committee. Coordinated by the Office of the Executive Vice-President, Financial Affairs, Real Estate and IT Infrastructure, this policy provides a framework for the Mutual’s key risks, consisting of insurance risks, financial risks, operational risks and strategic risks.
The Mutual monitors insurance risks pertaining to product design and pricing, as well as to underwriting and liabilities. Financial risks consisting of market, exchange rate, credit, real estate, liquidity and capital management risks are measured and managed. For operational risks, standards designed to limit the risks of administrative deficiencies are set out and followed. Strategic risk exposures are managed by the implementation and stringent monitoring of a strategic plan, as well as by monitoring the Mutual’s business.
The financial stability of the Mutual’s insurance subsidiaries is validated annually by dynamic capital adequacy testing (“DCAT”) conducted by the Appointed Actuaries, which includes a formal opinion as to the financial soundness of the Mutual’s insurance subsidiaries.
Insurance risks–Life and health insurance
By selling insurance contracts to its insureds, the Mutual assumes insurance risks. Risk arises when an insured event materializes differently than anticipated. Such variances are minimized through selection, pricing and reinsurance.
The Mutual’s life and health insurance risk is not concentrated in a single region or product. The catastrophe reinsurance treaty makes it possible to manage the risk concentration of group business. An analysis is conducted each year to review concentration levels and adjust the required catastrophe treaty coverage.
Measuring the actuarial liabilities associated with insurance contracts is complex and requires the use of several assumptions and valuation methods. The most sensitive assumptions for the Mutual pertain to mortality, morbidity and the economic environment. During the first annual DCAT, sensitivity tests were conducted to better identify the Mutual’s exposure to volatility and provide a basis to establish mitigation techniques.
The Mutual is also exposed to credit and liquidity risks under risk transfers to its different reinsurers. To mitigate this risk, the Mutual carefully diversifies the reinsurers with which it does business. The Mutual also reviews the financial strength of its reinsurers annually or more often as necessary and does not do business with reinsurers with credit ratings lower than A–.
Cash outflows related to life and health insurance contract liabilities net of reinsurance are illustrated as follows:

2011 ANNUAL REPORT I NOTES TO CONSOLIDATED FINANCIAL STATEMENTS LA CAPITALE CIVIL SERVICE MUTUAL
72
29) MANAGEMENT OF FINANCIAL INSTRUMENT AND INSURANCE CONTRACT RISK [Cont’d]
Insurance risks–Life and health insurance [Cont’d]
2012 2013 2014 2015 20162017 and thereafter Total
Life and health – Individual $(9,982) $(4,659) $5,489 $15,754 $25,264 $1,183,637 $1,215,503Annuities – Individual 126,619 83,642 106,651 123,827 90,280 219,105 750,124Life and health – Group 116,997 54,811 33,858 25,284 20,818 104,325 356,093Annuities – Group 162 189 218 245 245 2,323 3,382
$233,796 $133,983 $146,216 $165,110 $136,607 $1,509,390 $2,325,102
Insurance risks–Property and casualty insurance
The Mutual identified the following risks that may have a material effect on its bottom line, such as the risk of a significant rise in claim frequency and severity, the risk of multiple catastrophes combined with reinsurer payment defaults, the risk of a change in premium volume in a soft market with significant premium reductions, the risk of adverse development of claims reserves for long-tail business classes.
Underwriting standards are set out and applied by the Mutual. These standards provide for diversified risk selection in line with the Mutual’s objectives. Together, contract terms and conditions and rates appropriately reflect the inherent risks in the policies written.
The use of reinsurance plays a key role managing the Mutual’s risks and exposures. Various excess of loss catastrophe treaties by risk and by event are in place to limit the adverse income effect of major claims, on both a separate and cumulative basis, on occurrence of a catastrophic event.
Use of other types of reinsurance (optional or treaty for given business line) is also possible to manage specifically identified risks.
A 10% increase in the average cost or frequency of claims would result in a decrease in net income of $49,254.
Financial risks
Market risk is defined as the risk that fluctuations in market prices of financial instruments arising from stock market or interest rate changes will result in a loss.
The Investment Committee is responsible for monitoring the investment policy, which is reviewed annually. The Board of Directors approves amendments, if any. Investment policy limits are set prudently to mitigate the Mutual’s exposure to risk. The yield spread risk between assets and liabilities is limited as the portfolios are managed according to the matching principle.
The use of derivative financial instruments for hedging purposes is permitted under the investment policy as part of a prudent management framework. No derivative products are used to create speculative market exposure. The Investment Committee plays a key role with respect to the understanding of derivative product strategies by senior management and the Board of Directors.
A stock market downturn reduces the management fees generated by the insurer from market-linked insurance policies. As these liabilities are fully matched, lower management fees could, in such situations, increase the insurer’s cost to guarantee capital. Furthermore, a market downturn has a direct impact on the value of marketable securities invested in the Mutual’s surplus.
A 10% stock market downturn as at December 31, 2011 would result in a $12,839 decrease [2010: $11,215] in the Mutual’s after-tax comprehensive income. A 10% stock market upturn as at December 31, 2011 would have the opposite effect, resulting in a $12,839 increase [2010: $11,208] in the Mutual’s after-tax comprehensive income.
An immediate rise in interest rates would have an unfavourable short-term impact on surplus portfolios invested in bonds but would make it possible, over the long term, to match premium inflows at more attractive interest rates. A decrease in interest rates would have the opposite effect.
A 1% rise in interest rates as at December 31, 2011 would result in a $14,655 decline [2010: $15,373] in the Mutual’s after-tax comprehensive income. A 1% decline in interest rates as at December 31, 2011 would result in a $14,804 increase [2010: $15,704] in the Mutual’s after-tax comprehensive income.
Fair value hierarchy
The following table classifies fair value measurements of financial assets and financial liabilities using a fair value hierarchy that reflects the significance of the inputs used in making the measurements. The fair value hierarchy has the following levels:
Level 1: Quoted prices (unadjusted) in active markets for identical assets or liabilities.Level 2: Inputs observable for the asset or liability, either directly (i.e., prices) or indirectly (i.e., derived from prices).Level 3: Inputs for the asset or liability that are not based on observable market data.

2011 ANNUAL REPORT I NOTES TO CONSOLIDATED FINANCIAL STATEMENTS LA CAPITALE CIVIL SERVICE MUTUAL
73
December 31, 2011Level 1 Level 2 Level 3 Total
FINANCIAL ASSETSCash and cash equivalents $90,995 $ — $ — $90,995
BondsGovernment of Canada $ — $265,349 $ — $265,349Provincial governments — 1,122,366 — 1,122,366Municipalities, school boards and hospitals — 7,097 — 7,097Corporate — 398,559 515 399,074International — — — —
$ — $1,793,371 $515 $1,793,886
StocksCommon shares and participating units $298,259 $ — $ — $298,259Preferred shares 272,795 — — 272,795Participating units in stock market indices 101,206 — — 101,206Participating units in foreign currency stock market
indices — — — —$672,260 $ — $ — $672,260
Other investmentsDerivative financial instruments $ — $99 $ — $99Other investments — — 3,375 3,375
$ — $99 $3,375 $3,474
Other assetsCash in trust $857 $ — $ — $857Retained interests — — 5,346 5,346
$857 $ — $5,346 $6,203
$764,112 $1,793,470 $9,236 $2,566,818
FINANCIAL LIABILITIESOther liabilitiesExcess of outstanding cheques over cash $2,345 $ — $ — $2,345Liabilities related to derivative financial instruments — — 3,619 3,619
$2,345 $ — $3,619 $5,964

2011 ANNUAL REPORT I NOTES TO CONSOLIDATED FINANCIAL STATEMENTS LA CAPITALE CIVIL SERVICE MUTUAL
74
29) MANAGEMENT OF FINANCIAL INSTRUMENT AND INSURANCE CONTRACT RISK [Cont’d]
Principles and responsibilities of risk management [Cont’d]
Financial risks [Cont’d]
Fair value hierarchy [Cont’d]
December 31, 2010Level 1 Level 2 Level 3 Total
FINANCIAL ASSETSCash and cash equivalents $97,593 $ — $ — $97,593
BondsGovernment of Canada $ — $209,632 $ — $209,632Provincial governments — 1,005,528 — 1,005,528Municipalities, school boards and hospitals — 7,537 — 7,537Corporate — 365,949 503 366,452International — — — —
$ — $1,588,646 $503 $1,589,149
StocksCommon shares and participating units $245,144 $ — $ — $245,144Preferred shares 220,157 — — 220,157Participating units in stock market indices 116,908 — — 116,908Participating units in foreign currency stock market
indices 15,652 — — 15,652$597,861 $ — $ — $597,861
Other investmentsDerivative financial instruments $ — $66 $ — $66Other investments — — — —
$ — $66 $ — $66
Other assetsCash in trust $529 $ — $ — $529Retained interests — — 5,956 5,956
$529 $ — $5,956 $6,485
$695,983 $1,588,712 $6,459 $2,291,154
FINANCIAL LIABILITIESOther liabilitiesExcess of outstanding cheques over cash $5,051 $ — $ — $5,051Liabilities related to derivative financial instruments — — 5,756 5,756
$5,051 — $ $5,756 $10,807

2011 ANNUAL REPORT I NOTES TO CONSOLIDATED FINANCIAL STATEMENTS LA CAPITALE CIVIL SERVICE MUTUAL
75
January 1, 2010Level 1 Level 2 Level 3 Total
FINANCIAL ASSETSCash and cash equivalents $84,062 $ — $ — $84,062
BondsGovernment of Canada $ — $188,465 $ — $188,465Provincial governments — 977,803 — 977,803Municipalities, school boards and hospitals — 15,019 — 15,019Corporate — 316,739 470 317,209International — 7,340 — 7,340
$ — $1,505,366 $470 $1,505,836
StocksCommon shares and participating units $195,062 $ — $ — $195,062Preferred shares 96,688 — — 96,688Participating units in stock market indices 104,074 — — 104,074Participating units in foreign currency stock market
indices 15,432 — — 15,432$411,256 $ — $ — $411,256
Other investmentsDerivative financial instruments $ — $ — $ — $ —Other investments — — — —
$ — $ — $ — $ —
Other assetsCash in trust $2,373 $ — $ — $2,373Retained interests — — 10,657 10,657
$2,373 $ — $10,657 $13,030
$497,691 $1,505,366 $11,127 $2,014,184
FINANCIAL LIABILITIESOther liabilitiesExcess of outstanding cheques over cash $ — $ — $ — $ —Liabilities related to derivative financial instruments — 1,003 7,341 8,344
$ — $1,003 $7,341 $8,344
Changes in Level 3 financial instruments measured at fair value
The table below reconciles opening and closing balances for level 3 fair value measurements.
Corporate bondsOther
investmentsRetained interests –
Securitization
Liabilities related to derivative financial
instrumentsBalance as at January 1, 2011 $503 $ — $5,956 $5,756Gains and losses recognized in income — — (4,083) (2,137)Unrealized gains and losses recognized in other
comprehensive income 11 — — —Issuances — — 3,473 —Purchases 5 3,375 — —Sales (4) — — —Transfers to Level 3 — — — —Balance as at December 31, 2011 $515 $3,375 $5,346 $3,619

2011 ANNUAL REPORT I NOTES TO CONSOLIDATED FINANCIAL STATEMENTS LA CAPITALE CIVIL SERVICE MUTUAL
76
29) MANAGEMENT OF FINANCIAL INSTRUMENT AND INSURANCE CONTRACT RISK [Cont’d]
Principles and responsibilities of risk management [Cont’d]
Financial risks [Cont’d]
Changes in Level 3 financial instruments measured at fair value [Cont’d]
Corporate bondsOther
investmentsRetained interests –
Securitization
Liabilities related to derivative financial
instrumentsBalance as at January 1, 2010 $470 $ — $10,657 $7,341Gains and losses recognized in income (13) — (6,769) (1,585)Unrealized gains and losses recognized in other
comprehensive income — — — —Issuances — — 2,068 —Purchases — — — —Sales — — — —Transfers to Level 3 46 — — —Balance as at December 31, 2010 $503 $ — $5,956 $5,756
Foreign exchange risk is the unfavourable impact of a currency mismatch between assets and liabilities or the difference between foreign currency income and expenses.
Where the Mutual is exposed to foreign currency insurance contract liabilities, investments are made in these currencies for policy liability matching purposes. Other foreign currency investments are hedged in whole or in part with derivative products to convert exposure to foreign currencies into Canadian dollars.
Given the performance of foreign currency matching and since the Mutual’s foreign currency income and expenses are insignificant, foreign currency fluctuations had little impact on the Mutual’s bottom line.
Credit risk is the risk of financial loss, despite realization of principal or collateral security or property, resulting from the failure of a debtor to honour its obligations to the Mutual.
Credit risk management is the process of controlling the impact of credit risk-related events on the Mutual and consists in identifying, understanding and quantifying the risk of loss and taking appropriate measures.
Credit risk may also arise when there is a concentration of investments involving one or more entities with similar characteristics. The Mutual’s investment policy aims to reduce this risk by ensuring sound diversification.
The Mutual is exposed to credit risk on mortgage, personal and commercial loans as well as on corporate bonds and term preferred shares held in its portfolios, to counterparty risk on derivative products and to risk related to its reinsurers. The Mutual considers counterparty default risk when measuring the fair value of derivative financial instruments. Strict monitoring of credit risk is performed with respect to mortgage, personal and commercial loans. Corporate bonds and preferred shares are managed to ensure a diversified, low-risk portfolio by maintaining minimum DBRS credit ratings of “BBB” on bonds and “P2” on preferred shares to limit default concentration risk. Derivative product counterparties have minimum DBRS credit ratings of “AA” for reinsurance counterparties, and credit and credit quality ratings are verified annually or when warranted by market events.
To manage the risk of potential credit losses, the Mutual maintains specific allowances for impaired mortgage and personal loans and real estate held for resale. When credit risk exposure arises on a loan and the Mutual is uncertain of principal or interest recovery, the loan is deemed impaired. Specifically, a loan that is more than 90 days past due or in foreclosure proceedings is deemed impaired. The allowance reduces the value of the asset to reflect the amount the Mutual believes it can recover.
Another allowance is established for actuarial liabilities to safeguard the Mutual against potential credit losses.
The Mutual’s maximum credit risk exposure for its financial instruments is equal to the carrying amount of cash and cash equivalents, bonds, term preferred shares, mortgage loans, policy loans, other investments, premiums receivable, reinsurance assets and other receivables included in other assets totalling $3,375,017 [December 31, 2010: $3,037,960] [January 1, 2010: $2,648,478].
Except for loans for which there are non-provisioned amounts past due discussed in note 5, there are no significant financial assets past due that have not been provisioned.
Real estate risk is the possibility of incurring significant financial losses subsequent to an inaccurate appraisal or a potential decline in value of real estate acquired for investment purposes, held subsequent to a loan default or pledged as collateral for a loan receivable. Real estate risk also includes the possibility of deterioration in cash flows provided by real estate operations as a result, for instance, of increased vacancy or physical degradation requiring major maintenance.
The Mutual’s real estate inventory is used primarily to match long-term insurance liabilities. A portion of the real estate inventory is used for the Mutual’s own purposes, which significantly reduces vacancy risk.
The portion of the Mutual’s investment portfolio allocated to real estate is limited in relation to total assets, and individual property yields are monitored by the Investment Committee.
Changes in the real estate properties have no significant impact on the Mutual’s results since the properties are mostly matched to the Mutual’s business lines and the results are thereby offset by the insurance contract liability reserves.

2011 ANNUAL REPORT I NOTES TO CONSOLIDATED FINANCIAL STATEMENTS LA CAPITALE CIVIL SERVICE MUTUAL
77
Liquidity risk is the risk that the Mutual will fail to honour its financial obligations, anticipated or otherwise, when due.
The Mutual relies on asset-liability matching to generate the funds required to honour its obligations when they fall due. Effective cash management minimizes the cost of raising funds and honouring financial obligations. Moreover, nearly 100% of the Mutual’s bonds are readily marketable, further underpinning the Mutual’s cash resources. Lastly, the Mutual can avail itself of credit facilities to meet unexpected cash requirements.
The Mutual’s maximum liquidity risk exposure for its financial instruments and insurance contracts is detailed by contractual maturity as follows:
2012 2013 2014 2015 20162017 and thereafter
No specific maturity Total
Provision for claims and loss adjustment expenses $152,140 $47,930 $30,287 $20,408 $14,637 $37,051 $ — $302,453
Accrued liabilities 117,327 — — — — — — 117,327Other liabilities 20,749 3,420 2,324 234 593 5,860 78,938 112,118Long-term debt 344 361 389 410 22,435 — — 23,939
$290,560 $51,711 $33,000 $21,052 $37,665 $42,911 $78,938 $555,837


Company profiles

2011 annUal reporT i Company profiles la CapiTale CiVil serViCe mUTUal
80
Company profiles
Life and Health Insurance and Financial Services Sector
la CapiTale CiVil serViCe insUrer
la Capitale Civil service insurer has provided value-added financial products to ensure the economic well-being of Quebec’s public service employees for over 70 years. Clients benefit from the unique expertise la Capitale Civil service insurer has developed in life and health insurance, savings and investments, and mortgage loans. its teams of specialists design attractive, flexible financial solutions that are tailored to clients’ needs. and, to simplify the payment of premiums, it also offers the exclusive payroll Deduction privilege to some 600,000 public service employees working in 900 institutions across Quebec’s public and parapublic sectors.
PRODUCTS AND SERVICES OFFERED § life insurance
§ Disability insurance
§ Critical illness insurance
§ long term care insurance
§ savings and investments
§ mortgage loans
§ payroll Deduction privilege
la CapiTale insUranCe anD finanCial serViCes
established in 1989, la Capitale insurance and financial services is a subsidiary of la Capitale Civil service insurer. it provides group insurance products directly to the Quebec public service and serves groups in the private sector in partnership with selected financial services firms. it also offers insurance products and financial services to clients outside the Quebec public service. la Capitale insurance and financial services is renowned for its personalized service and the innovative approach it takes to serving group insurance plan members, specifically with regard to workplace attendance management and prevention initiatives, such as the Good for you! health and wellness program.
PRODUCTS AND SERVICES OFFERED § life, health and disability insurance
§ Critical illness, dental care and vision care insurance
§ Travel and trip cancellation insurance
§ Credit insurance
§ employee assistance program
§ Home care and assistance services
§ Health insurance claims profile
§ Workplace attendance management
§ online administrative services
§ Health spending account
§ Cap medical assistance
pennCorp life insUranCe Company
With its Head office in mississauga, ontario, penncorp life insurance Company specializes in simplified, individual disability insurance and financial solutions that fit the unique needs of Canada’s self-employed, skilled tradespeople and other individuals who do not have easy access to traditional insurance and financial products. penncorp has a network of 282 career agents with branch offices and field representatives in every province. in addition, penncorp counts on an independent distribution channel across Canada.
PRODUCTS AND SERVICES OFFERED § short and long term disability insurance
§ long term care insurance
§ Hospital care insurance
§ Critical illness and cancer insurance
§ life insurance
§ annuities and savings products

2011 annUal reporT i Company profiles la CapiTale CiVil serViCe mUTUal
81
la CapiTale finanCial serViCes
la Capitale financial services is a financial services firm that offers insurance, investment and savings products to Quebec public service employees and is dedicated to providing them with the best financial protection available, thanks to its unique financial planning tools. The firm is represented by 156 financial security advisors who serve Quebec public service employees in their workplaces.
PRODUCTS AND SERVICES OFFERED § Term, permanent and universal life insurance
§ Health, long term care and critical illness insurance
§ registered and non-registered investment products (e.g. rrsp, resp, Tfsa)
§ investment and segregated funds
§ referrals for car, home and legal access insurance and mortgage loans
§ financial situation evaluation
§ personalized financial planning
promUTUel life
Through its network of mutual associations with a number of points of service across Quebec, promutuel life, a joint venture in which la Capitale financial Group holds a 50% interest, distributes a range of individual life and health insurance products and annuities that are designed and administered by la Capitale.
aGa finanCial GroUp
aGa financial Group specializes in providing consulting and administration services for company insurance and pension plans. it is renowned across Quebec for its group insurance claims management and payment practices.
PRODUCTS AND SERVICES OFFERED § Group insurance and annuity plan brokerage
§ Consulting and administration services for group insurance and company pension plans
la CapiTale mfQ real esTaTe manaGemenT
This subsidiary is responsible for implementing the Group’s real estate strategy and managing its real estate holdings. With assets totalling $370 million, including commercial mortgage loans, commercial and residential buildings, office space and retirement homes, la Capitale mfQ real estate management owns approximately 1.6 million square feet of property and manages some 354 rental units, in 12 buildings across Quebec and ontario.
PRODUCTS AND SERVICES OFFERED § real estate management
§ Commercial mortgage loan management
§ Green buildings
§ Quality rental management services

2011 annUal reporT i Company profiles la CapiTale CiVil serViCe mUTUal
82
la Capitale Civil service insurer
la Capitale insurance and financial services
Senior Management
Steven Ross, C. Adm.President and Chief Operating Officer
Corporate Actuarial
France Déziel, FSA, FCIA, CAVice-President and Appointed Actuary
Guy Harvey, ASASenior Director
Information Technology
Francine LandryVice-President
Maxime Morin, BASSenior Director, e-Business, Quality and Corporate Solutions
Raymond St-GelaisSenior Director, IT DevelopmentIndividual Insurance
Lyne GroleauSenior Director, IT DevelopmentGroup Insurance
Group Insurance Sector
Éric Marcoux, FSA, FCIAExecutive Vice-President
Richard Fecteau, FSA, FCIAVice-President, Actuarial and Underwriting
Jacques TardifVice-President, Sales and Marketing
Martin Bédard Senior Director, Pan-Canadian Business Development and Credit Insurance
Patrick Bolduc, ASA, FLMI, ACSSenior Director, Operational Performance
Chantal Brisson, BASenior Director, Claims
Pierre J. IsabelleSenior Director, Contract Management
Individual Insurance and Financial Services Sector
Michel Lafrance, FSA, FCIAVice-President, Product Development and Marketing
Christian Dufour, FSA, FCIAVice-President, Administration and Customer Service
Dany LeBœuf, FLMI, FLHC, ALHC, ACS, UND, AIAASenior Director, Administration and Customer Relations
Eli Pichelli, MBA, CLUVice-President, Sales – Advisor Network
Ghassan BarakatRegional Director South-West Regional Financial Centre
Frédéric Dancause, CLU, F. Pl.Regional DirectorEast Regional Financial Centre
Alain Legault, MBARegional DirectorNorth-West Regional Financial Centre
Pierre Maltais, BBA, RLURegional DirectorSaguenay – Lac-Saint-Jean – North Shore Financial Centre
Raymond Rivest, BA, CLU, F. Pl.Vice-President, Sales – General Agent Channel
aGa financial GroupClément St-LaurentExecutive Vice-President and Chief Executive Officer
Manon LabrècheVice-President, Private Management
Suzanne FortinVice-President, Administration of Sales and Marketing
Marie-Josée CoiteuxVice-President, Administration and Human Resources
penncorp life insurance CompanySteven Ross, C. Adm.President and Chief Operating Officer
Scott HuntVice-President, Administration and Customer Service
Eli Pichelli, MBA, CLUVice-President, Sales – Advisor Network
Stephen ColeRegional Vice-President, Sales
Neil BrownAssistant Vice-President, Finance
Cristine Y. ChanAssistant Vice-President, Human Resources and Shared Services
Mark TurkiewiczAssistant Vice-President, Claims
Chris KitagawaAssistant Vice-President, Underwriting, Contract Management and Agency Services
OFFICerS – LIFe And HeALTH InSurAnCe And FInAnCIAL ServICeS SeCTOr

2011 annUal reporT i Company profiles la CapiTale CiVil serViCe mUTUal
83
Property and Casualty Insurance Sector
la CapiTale General insUranCe
la Capitale General insurance is one of the leading home and auto insurance companies in Quebec. it distributes its products directly through a network of 19 branch offices. la Capitale General insurance also invests in ways to further assist its clients. That is why it has rounded out its line of products by creating the Cap priority assistance program—a complimentary service that provides clients with exclusive roadside and legal assistance.
PRODUCTS AND SERVICES OFFERED(DIRECT DISTRIBUTION)
§ automobile insurance
§ recreational vehicle insurance (motorcycles, snowmobiles, aTVs, boats, motorhomes, travel trailers and stationary trailers)
§ Home insurance
§ legal access insurance
§ professional liability insurance
§ insurance for private companies and the self-employed
§ income replacement protection
§ automobile dealerships
§ Travel insurance
§ Cap roadside assistance
§ Cap legal access assistance
l’UniQUe General insUranCe
l’Unique General insurance was acquired by la Capitale General insurance in october 2004. it continues to be independently managed and distributes its products through a network of 314 independent brokerage firms. l’Unique’s Head office is located in Quebec City and the company has a branch office in montreal. in 2005, l’Unique acquired orleans General insurance Company, a company specialized in surety products. l’Unique is now able to offer its brokers a diverse line of products for individuals and businesses, along with a complete line of contract and commercial bonding services. l’Unique is renowned as the leading small business insurer in Quebec.
PRODUCTS AND SERVICES OFFERED(BROKER DISTRIBUTION)
§ automobile insurance
§ recreational vehicle insurance (motorcycles, snowmobiles, aTVs and motorhomes)
§ Home insurance
§ Commercial insurance
§ legal access insurance
§ surety products
§ Credit insurance
§ l’Unique roadside assistance
§ l’Unique Home assistance
UniCa insUranCe
Unica was acquired by la Capitale General insurance in september 2008. With 178 employees at its head office in mississauga, ontario, Unica is a personal lines home and auto insurer that also has a commercial lines component. it continues to operate independently by offering its products and services through some 128 independent brokerage firms in ontario.
PRODUCTS AND SERVICES OFFERED(BROKER DISTRIBUTION)
§ automobile insurance
§ Home insurance
§ Commercial insurance

2011 annUal reporT i Company profiles la CapiTale CiVil serViCe mUTUal
84
la Capitale General insuranceSenior Management
Constance LemieuxPresident and Chief Operating Officer
Sales and Client retention
Marie-Claude Dulac, FCIPVice-President
Céline Daigle, LLBSenior Director, Legal Access Insurance
Hélène CaronSenior Director, Sales and Client Retention
Kathleen Gendron, FCIPSenior Director, Client Retention
Estelle ThériaultSenior Director, Branch Office Network
Claims
Pierre Legault, CIPVice-President
Hubert Auclair, LLBSenior Director, Legal Affairs and Specialized Risks
Isabelle Circé, BBA, FCIP Senior Director, Claims, Client Contact Centres
Business development
Sylvain Simard, BBA, CIPVice-President
Sylvie Chartrand, RLU, F. Pl.Senior Director, Public Sector Development – Property and Casualty Insurance
Michel DuvalSenior Director, Affiliated Agents and Business Partners
Michel Talbot, FCIPSenior Director, Commercial Insurance
Yves WatierSenior Director, Business Development and Marketing
Actuarial, Insurance and Business Intelligence
François Dumas, FCIA, FCASVice-President
Isabelle Gingras, FCIA, FCAS Senior Director, Ratemaking, Insurance and Products – Quebec
Isabelle Périgny, FCIA, FCASSenior Director, Corporate Actuarial and Business Intelligence
Christian Fournier, FCIA, FCASSenior Director, Ratemaking – Rest of Canada
Marketing and e-Commerce
Éric Champagne, Eng., MBAVice-President
Information Technology
Richard GagnéVice-President
Liette LabrieSenior Director, Corporate Systems Development
Jean BouléSenior Director, General Insurance Systems Development – Direct Channel
Jean-Pierre BoutetSenior Director, Quality Assurance and Development Support
l’Unique General insuranceSenior Management
Mario CussonPresident and Chief Operating Officer
Surety Lines
Gaétan Boudreau, Eng., MBAVice-President
Jean-Eudes Boudreau, MBASenior Director, Sales and Development
Sales and development
Yves Gagnon, BA, CIPVice-President
Jean-Philippe Keable, FCIA, FCAS Senior Director, Personal Lines Insurance
Commercial Insurance
Bruno Perrino, BAVice-President
Guy Ferland, FCIPSenior Director
Claims
Richard Consigny, FCIPSenior Director
Finance
André Boucher, CMASenior Director, Finance and Administrative Services
Information Technology
Michel LévesqueSenior Director, General Insurance Systems Development – Brokerage Channel
Unica insuranceSenior Management
Martin Delage, BA, CHRPPresident and Chief Operating Officer
Surety Lines
Neville Harriman, BA, FIIC, ARMSenior Director
Operations
Dave Smiley, CA, FCIPVice-President
Jim Cutler, FCIP, CRMAssistant Vice-President, Commercial Lines
Carolyn Andreacchi, BASAssistant Vice-President, Personal Lines
Chris Weston, MBAAssistant Vice-President, Business Development
Nancy Covel, CIP, ABCAssistant Vice-President, Marketing and Communications
Steve Lewicki, BES, CIPAssistant Vice-President, Claims
Finance
Katherine Evans, CA, CPAVice-President
Legal Services and Legal Counsel
Mark H. Fonseca, BA, LLBSenior Director
OFFICerS – PrOPerTy And CASuALTy InSurAnCe SeCTOr

2011 annUal reporT i Company profiles la CapiTale CiVil serViCe mUTUal
85
Senior Management
Robert St-DenisPresident and Chief Operating Officer
Human resources and Organizational development
Shirley Brown, BA, CHRPVice-President
Geneviève Drouin, MSc, CHRPSenior Director, Human Resources
Linda Gaboury, BA, CHRPSenior Director, Total Compensation
Corporate Affairs
Marie-Josée GuéretteExecutive Vice-President
Legal Affairs and Corporate Secretary
Pierre Marc Bellavance, LLMVice-President and Corporate Secretary
Finance, real estate and Technological Infrastructure
Marthe Lacroix, FCIA, FCASExecutive Vice-President
Finance
Lucie Garneau, CAVice-President
Annie Larochelle, CASenior Director, Financial Disclosure and International Standards
Johanne Gauthier, CGASenior Director, Analytical Accounting, Processes and Account Collection Services
Hélène Myrand, CASenior Director, Finance
Financial Management
John Kirouac, CAVice-President
Juliano Faleschini, BBA, C. App., C. Adm.Senior Director, Real Estate Management
Sylvie L. BeaudoinSenior Director, Material Resources
Technological Infrastructure
Eric Eustache, Eng., MScVice-President
Carl Bélanger, Eng. MBASenior Director, Technological Operations
René MoisanSenior Director, Systems Evolution
Investments
Michel Lévesque, FSA, FCIA, CFAVice-President
SenIOr MAnAGeMenT OF LA CAPITALe FInAnCIAL GrOuPThese divisions serve both the Life and Health Insurance and Financial Services, and Property and Casualty Insurance sectors.

2011 annUal reporT i Company profiles la CapiTale CiVil serViCe mUTUal
86
la Capitale Civil service insurer625 saint-amable st Quebec QC G1r 2G5 418 643-3884 or 1 800 463-5549
la Capitale insurance and financial servicesDelta 3 Building 2875 laurier Blvd suite 400 Quebec QC G1V 2m2 418 644-4200 or 1 800 463-4856
Points of Service
Quebec CityDelta 3 Building 2875 Laurier Blvd Suite 400 Quebec QC G1V 2M2 418 644-4180 or 1 800 363-9683
Montreal425 De Maisonneuve Blvd W Suite 820 Montreal QC H3A 3G5 514 873-2402 or 1 888 899-4959
la Capitale financial servicesdivision Office425 De maisonneuve Blvd W suite 870 montreal QC H3a 3G5 514 873-9368 or 1 866 279-9394
east regional Financial CentreDelta 1 Building 2875 laurier Blvd suite 650 Quebec QC G1V 2m2 418 644-0038 or 1 866 279-9396
Saguenay – Lac-Saint-Jean – north Shore regional Financial Centre874 de l’Université Blvd e suite 320 saguenay QC G7H 6B9 418 615-0694 or 1 800 713-8271
South-West regional Financial Centre7055 Taschereau Blvd suite 300 Brossard QC J4Z 1a7 514 864-4189 or 1 866 279-7384
Sherbrooke Financial Centre2100 King st W suite 020 sherbrooke QC J1J 2e8 514 820-3585 or 1 800 713-8236
north-West regional Financial Centre3080 le Carrefour Blvdsuite 520 laval QC H7T 2r5514 873-9364 or 1 866 279-0489
Trois-rivières Financial Centrele Trifluvien Building4450 Des forges Blvdsuite 240Trois-rivières QC G8y 1W5819 374-3539 or 1 866 318-8016
penncorp life insurance CompanyHead Office7150 Derrycrest Drive mississauga on l5W 0e5 905 795-2300 or 1 800 268-2835
regional Branch Offices
AlbertA
Calgary12111 40th street sesuite 137Calgary aB T2Z 4e6403 252-7757 or 1 800 267-0192
british ColumbiA
Surrey13889 104th avesuite 300surrey BC V3T 1W8604 589-1381
mAnitobA
Winnipeg2140 pembina HwyUnit BWinnipeg mB r3T 6a7204 985-1580 or 1 800 670-1911
mAritimes
Atlantic Canada1550 Bedford Highwaysuite 700Bedford ns B4a 1e6902 835-9203 or 1 800 835-9203
la Capitale financial Group points of serviceHead Office625 saint-amable stQuebec QC G1r 2G5418 643-3884 or 1 800 463-5549
Life and Health Insurance and Financial Services Sector

2011 annUal reporT i Company profiles la CapiTale CiVil serViCe mUTUal
87
ontArio
Barrie431 Huronia roadsuite 2Barrie on l4n 9B3705 728-5580 or 1 800 268-5168
London4026 meadowbrook Drivesuite 129london on n6l 1C7519 652-0255 or 1 800 934-6128
Ottawa1165 Beaverwood roadmanotick on K4m 1a4613 692-3590
Peel/dufferin7045 edwards Blvdmississauga on l5s 1X2905 565-9996
South West 36 Hiscott st st. Catharines on l2r 1C8905 696-8477 or 1 888 918-5045
Thunder Bay 36 east arthur stsuite 301Thunder Bay on p7e 5H7807 473-0005
Toronto1260 eglinton ave emississauga on l4W 1K8905 696-8477 or 1 888 918-5045
Toronto (recruiting and development Office)89 Galaxy Blvdsuite 21Toronto on m9W 6a4416 213-9506 or 1 877 665 8660
QuebeC
Laval500 saint-martin Blvd Wsuite 450laval QC H7m 3y2514 798-6511
Montérégie7005 Taschereau Blvdsuite 305Brossard QC J4Z 1a7450 443-8585 or 1 855 443-8585
Quebec City2875 laurier Blvdsuite 250Quebec QC G1V 2m2418 687-2058 or 1 800 463-4632
Saguenay 3875 Harvey BlvdJonquière QC G7X 0a6418 615-0727
sAskAtChewAn
Saskatoon2345 avenue C northsuite 5saskatoon sK s7l 5Z5306 955-3000 or 1 800 955-3250
regina4401 albert stsuite 5regina sK s4s 6B6
aGa financial GroupHead Office4150 sainte-Catherine st Wsuite 490Westmount QC H3Z 2W8514 935-5444 or 1 800 363-6217
QuebecDelta 1 Building2875 laurier Blvdsuite 700Quebec QC G1V 2m2418 658-3188 or 1 877 330-3357
la Capitale mfQ real estate management625 saint-amable stQuebec QC G1r 2G5418 644-4267 or 1 800 463-5549

2011 annUal reporT i Company profiles la CapiTale CiVil serViCe mUTUal
88
la Capitale General insuranceHead OfficeHector-fabre Building525 rené-lévesque Blvd e6th floor, po Box 17100Quebec QC G1K 9e2418 266-9525
regional Branch Offices
Anjou7333 place des roseraiessuite 200anjou QC H1m 2X6514 906-1700
Baie-Comeau337 lasalle Blvdsuite 203Baie-Comeau QC G4Z 2Z1418 294-6300
Blainville28 Côte saint-louis Wsuite 208Blainville QC J7C 1B8514 906-1700
Brossard7055 Taschereau Blvdsuite 300Brossard QC J4Z 1a7514 906-1700
drummondville350 saint-Jean stsuite 120Drummondville QC J2B 5l4819 475-1799
Gatineau290 saint-Joseph Blvdsuite 201Gatineau QC J8y 3y3819 420-1700
Granby400 principale st suite 301Granby QC J2G 2W6450 777-1750
Laval3030 le Carrefour Blvdsuite 101laval QC H7T 2p5514 906-1700
Longueuilplace agropur101 roland-Therrien Blvdsuite 260longueuil QC J4H 4B9514 906-1700
Montreal425 De maisonneuve Blvd Wsuite 500montreal QC H3a 3G5514 906-1700
Pointe-Claire755 saint-Jean Blvdsuite 140pointe-Claire QC H9r 5m9514 906-1700
QuebecDelta 3 Building2875 laurier Blvdsuite 400Quebec QC G1V 2m2418 266-1700
rimouski287 pierre-saindon stsuite 505rimouski QC G5l 9a7418 724-0777
rouyn-noranda170 principale averouyn-noranda QC J9X 4p7819 764-2700
Saguenay (Chicoutimi)874 de l’Université Blvd esuite 320saguenay QC G7H 6B9418 698-5900
Saint-Georges9012 lacroix Blvdsaint-Georges QC G5y 5p4418 227-5461
Sept-Îles802 De Quen avesept-Îles QC G4r 2s2418 968-0044
Sherbrooke2100 King st Wsuite 250sherbrooke QC J1J 2e8819 822-0060
Trois-rivièresle Trifluvien Building4450 Des forges Blvdsuite 200Trois-rivières QC G8y 1W5819 374-3050
l’Unique General insuranceHead Office925 Grande-allée Wsuite 240Quebec QC G1s 1C1418 683-2711 or 1 800 463-4800
Montreal425 De maisonneuve Blvd Wsuite 750montreal QC H3a 3G5514 768-0707 or 1 877 768-0707
Unica insuranceHead Office7150 Derrycrest Drivemississauga on l5W 0e5905 677-9777 or 1 800 676-0967
Property and Casualty Insurance Sector


for information about la Capitale,
please call 418 643-3884 or 1 800 463-5549,
or visit our website at lacapitale.com.
la Capitale is proud to abide by “green” principles in its various business lines.
please recycle this document after use.
This annual report is printed on sfi® Certified paper made with elemental Chlorine free (eCf) virgin fibre content manufactured under alkaline (acid-free) conditions for increased longevity and performance.