2011-02-28 Brait Multi Strategy Fund Overview
2
Brait Multi Strategy Fund Fund Overview 28 February 2011 Lourens Pretorius – CEO: Brait Capital Management Tel: +27 21 673 7830 Email: [email protected] Rob Coombe – COO: Brait Capital Management Tel: +27 21 673 7818 Email: [email protected] Client Administration Tel: +27 21 673 7821 Email: [email protected] page 1 of 2 Investment Proposition The Brait Multi Strategy Fund aims to deliver annualised returns, net of fees that exceed ZAR cash returns by 15% over rolling 3-year cycles. Emphasis is placed on achieving the return objective independent of the performance of the markets or any particular asset class. The Fund Manager pursues alpha across multiple underlying disciplines that employ diverse investment strategies. Each discipline is managed by a focused investment professional, who collectively make up the Brait Capital Management investment team. As a result the Fund benefits from an expanded opportunity set whilst maintaining the benefits associated with specialisation within a particular niche. A dynamic risk allocation process across underlying disciplines drives efficient capital utilisation, while exposure to multiple strategies of varying time frames ensures diversification of alpha streams. The Fund currently focuses exclusively on South African investment opportunities and employs a wide range of instruments across the equity, fixed income and currency asset classes. Fund Manager Brait is a listed investment group established in 1991 specialising in the structuring and management of alternative assets. Brait’s product set includes hedge funds, fund of hedge funds, private equity funds and mezzanine debt funds. Brait Capital Management, a division of Brait, manages ZAR2.1 billion (USD300 million) in hedge fund products. Commentary The fund delivered positive performance of 2.54% for the month of February. All strategies contributed to returns. The Fixed Income and Fixed Income volatility strategies largely recovered the losses of January with bond yield curve steepening, increase in implied volatility and positive alpha from trading being the major contributors. We continue to believe the extent of tightening implied by the forward curve is excessive, yet recognize “crowded positioning on the received side as a risk for further upside in implied rates. To this extent we prefer maintaining a long volatility bias and expressing received positioning through options i.e limiting downside and enabling us to hold positions through volatility. Despite rising interest rate expectations, developed markets continued to out-perform EM’s in February. In contrast to EM’s the inflation risk for DM’s appears muted given high unemployment and structural pressure on wage rates. The equity bull market is in the process of maturing from a “risk on/risk off” or beta-driven market, to a more differentiated environment with wider performance disparities between sectors and individual stocks. The equity macro discipline benefited from exposure to the energy sector, normally a winner at this point in the market and economic cycle anyway, but of course further boosted near–term by the escalation of MENA political issues, and resultant risks to crude oil supply. On the equity fundamental side we benefitted from being tactically long positioned in retailers for a bounce albeit that this was partly offset by adding resource exposure too early at the close of the month. Key Terms Fund Inception Date: 01 October 2006 Net Asset Value (ZAR)* 1,245,120,656 Status: Open Fund Currency: ZAR Domicile: South Africa Liquidity: Monthly Notice: 1 Calendar Month Manager: Brait SA Ltd Auditor: Deloitte & Touche Administrator: Maitland Fund Services Prime Brokers: RMB Prime and Cadiz Securities *Master fund and segregated mandates Net Performance Record Date Jan Feb Mar Apr May Jun Jul Aug Sep Oct Nov Dec Year 2006 - - - - - - - - - -3.84% 0.95% -2.26% -5.12% 2007 1.78% 2.66% 2.69% -2.08% 4.31% 8.69% 3.21% -3.49% -1.44% -7.40% 1.95% 0.50% 10.95% 2008 1.81% 3.86% 2.21% 2.02% 4.87% 2.32% -1.54% -0.19% 1.95% 2.50% 6.16% 0.12% 29.15% 2009 2.10% -1.95% 5.45% 3.19% -0.65% 1.14% 2.72% 2.83% 0.66% 0.90% 6.11% 0.95% 25.80% 2010 2.96% -0.41% 2.04% 3.26% 1.34% 1.23% 0.83% 4.05% -0.20% 4.83% -1.63% -0.11% 19.55% 2011 -2.79% 2.54% -0.31% 90 110 130 150 170 190 210 Oct/06 Nov/06 Jan/07 Mar/07 May/07 Jul/07 Sep/07 Nov/07 Jan/08 Mar/08 May/08 Jul/08 Sep/08 Nov/08 Jan/09 Mar/09 May/09 Jul/09 Sep/09 Nov/09 Jan/10 Mar/10 May/10 Jul/10 Sep/10 Nov/10 Jan/11 Cumulative Performance Cumulative Return vs Cash - Since Inception Brait Multi Strategy Cash
Transcript of 2011-02-28 Brait Multi Strategy Fund Overview

Brait Multi Strategy Fund
Fund Overview 28 February 2011
Lourens Pretorius – CEO: Brait Capital Management Tel: +27 21 673 7830 Email: [email protected]
Rob Coombe – COO: Brait Capital Management Tel: +27 21 673 7818 Email: [email protected]
Client Administration Tel: +27 21 673 7821 Email: [email protected]
page 1 of 2
Investment Proposition
The Brait Multi Strategy Fund aims to deliver annualised returns, net of fees that exceed ZAR cash returns by 15% over rolling 3-year cycles. Emphasis is placed on achieving the return objective independent of the performance of the markets or any particular asset class. The Fund Manager pursues alpha across multiple underlying disciplines that employ diverse investment strategies. Each discipline is managed by a focused investment professional, who collectively make up the Brait Capital Management investment team. As a result the Fund benefits from an expanded opportunity set whilst maintaining the benefits associated with specialisation within a particular niche. A dynamic risk allocation process across underlying disciplines drives efficient capital utilisation, while exposure to multiple strategies of varying time frames ensures diversification of alpha streams. The Fund currently focuses exclusively on South African investment opportunities and employs a wide range of instruments across the equity, fixed income and currency asset classes.
Fund Manager
Brait is a listed investment group established in 1991 specialising in the structuring and management of alternative assets. Brait’s product set includes hedge funds, fund of hedge funds, private equity funds and mezzanine debt funds. Brait Capital Management, a division of Brait, manages ZAR2.1 billion (USD300 million) in hedge fund products.
Commentary
The fund delivered positive performance of 2.54% for the month of February. All strategies contributed to returns. The Fixed Income and Fixed Income volatility strategies largely recovered the losses of January with bond yield curve steepening, increase in implied volatility and positive alpha from trading being the major contributors. We continue to believe the extent of tightening implied by the forward curve is excessive, yet recognize “crowded positioning on the received side as a risk for further upside in implied rates. To this extent we prefer maintaining a long volatility bias and expressing received positioning through options i.e limiting downside and enabling us to hold positions through volatility. Despite rising interest rate expectations, developed markets continued to out-perform EM’s in February. In contrast to EM’s the inflation risk for DM’s appears muted given high unemployment and structural pressure on wage rates. The equity bull market is in the process of maturing from a “risk on/risk off” or beta-driven market, to a more differentiated environment with wider performance disparities between sectors and individual stocks. The equity macro discipline benefited from exposure to the energy sector, normally a winner at this point in the market and economic cycle anyway, but of course further boosted near–term by the escalation of MENA political issues, and resultant risks to crude oil supply. On the equity fundamental side we benefitted from being tactically long positioned in retailers for a bounce albeit that this was partly offset by adding resource exposure too early at the close of the month.
Key Terms
Fund Inception Date: 01 October 2006
Net Asset Value (ZAR)* 1,245,120,656
Status: Open
Fund Currency: ZAR
Domicile: South Africa
Liquidity: Monthly
Notice: 1 Calendar Month
Manager: Brait SA Ltd
Auditor: Deloitte & Touche
Administrator: Maitland Fund Services
Prime Brokers: RMB Prime and Cadiz Securities
*Master fund and segregated mandates
Net Performance Record
Date Jan Feb Mar Apr May Jun Jul Aug Sep Oct Nov Dec Year
2006 - - - - - - - - - -3.84% 0.95% -2.26% -5.12%
2007 1.78% 2.66% 2.69% -2.08% 4.31% 8.69% 3.21% -3.49% -1.44% -7.40% 1.95% 0.50% 10.95%
2008 1.81% 3.86% 2.21% 2.02% 4.87% 2.32% -1.54% -0.19% 1.95% 2.50% 6.16% 0.12% 29.15%
2009 2.10% -1.95% 5.45% 3.19% -0.65% 1.14% 2.72% 2.83% 0.66% 0.90% 6.11% 0.95% 25.80%
2010 2.96% -0.41% 2.04% 3.26% 1.34% 1.23% 0.83% 4.05% -0.20% 4.83% -1.63% -0.11% 19.55%
2011 -2.79% 2.54%
-0.31%
90
110
130
150
170
190
210
Oct/
06
Nov/0
6
Jan/0
7
Mar/
07
May/0
7
Jul/07
Sep/0
7
Nov/0
7
Jan/0
8
Mar/
08
May/0
8
Jul/08
Sep/0
8
Nov/0
8
Jan/0
9
Mar/
09
May/0
9
Jul/09
Sep/0
9
Nov/0
9
Jan/1
0
Mar/
10
May/1
0
Jul/10
Sep/1
0
Nov/1
0
Jan/1
1
Cum
ula
tive P
erf
orm
ance
Cumulative Return vs Cash - Since Inception
Brait Multi Strategy
Cash
Brait Multi Strategy Fund
Fund Overview 28 February 2011
h
This Fund Overview is for information purposes only, and does not constitute either an offer or a recommendation to buy or sell any of the stocks mentioned or the fund itself. It is a private publication intended for private circulation, and outlines the fund structure and past performance. The value of all investments can go down as well as up, and the past is not necessarily a guide to future performance. Brait South Africa Limited is an approved Discretionary Financial Service Provider under the Financial Advisory and Intermediary Services Act (FSP Reg. No. 820) However, the Brait Multi Strategy Fund, along with all other hedge funds in South Africa, is unregulated by the Financial Services Board.
page 2 of 2
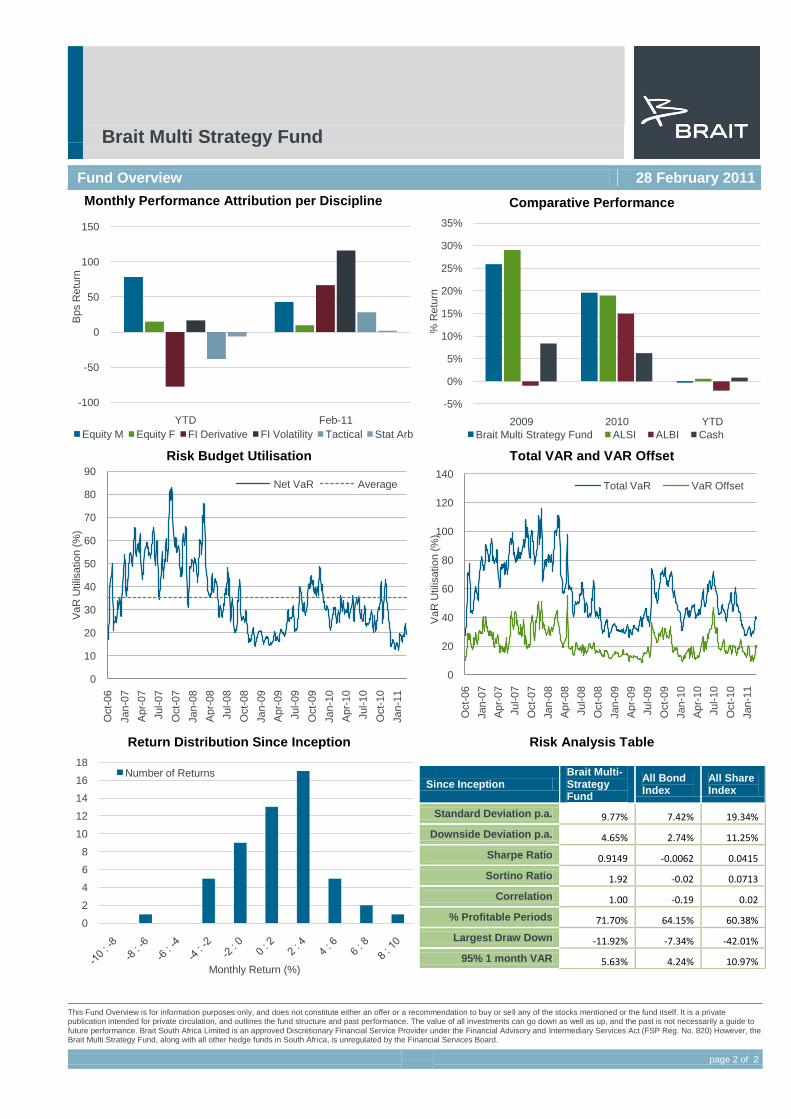
Monthly Performance Attribution per Discipline Comparative Performance
Risk Budget Utilisation Total VAR and VAR Offset
Return Distribution Since Inception Risk Analysis Table
Since Inception Brait Multi- Strategy Fund
All Bond Index
All Share Index
Standard Deviation p.a. 9.77% 7.42% 19.34%
Downside Deviation p.a. 4.65% 2.74% 11.25%
Sharpe Ratio 0.9149 -0.0062 0.0415
Sortino Ratio 1.92 -0.02 0.0713
Correlation 1.00 -0.19 0.02
% Profitable Periods 71.70% 64.15% 60.38%
Largest Draw Down -11.92% -7.34% -42.01%
95% 1 month VAR 5.63% 4.24% 10.97%
-100
-50
0
50
100
150
YTD Feb-11
Bps R
etu
rn
Equity M Equity F FI Derivative FI Volatility Tactical Stat Arb
-5%
0%
5%
10%
15%
20%
25%
30%
35%
2009 2010 YTD%
Retu
rnBrait Multi Strategy Fund ALSI ALBI Cash
0
10
20
30
40
50
60
70
80
90
Oct-
06
Jan-0
7
Apr-
07
Jul-07
Oct-
07
Jan-0
8
Apr-
08
Jul-08
Oct-
08
Jan-0
9
Apr-
09
Jul-09
Oct-
09
Jan-1
0
Apr-
10
Jul-10
Oct-
10
Jan-1
1
VaR
Utilis
atio
n (
%)
Net VaR Average
0
20
40
60
80
100
120
140O
ct-
06
Jan-0
7
Apr-
07
Jul-07
Oct-
07
Jan-0
8
Apr-
08
Jul-08
Oct-
08
Jan-0
9
Apr-
09
Jul-09
Oct-
09
Jan-1
0
Apr-
10
Jul-10
Oct-
10
Jan-1
1
VaR
Utilis
atio
n (
%)
Total VaR VaR Offset
0
2
4
6
8
10
12
14
16
18
Monthly Return (%)
Number of Returns