2010 VHA Facility Quality and Safety Report · 2010 VHA Facility Quality and Safety ... This is the...
205
2010 VHA Facility Quality and Safety Report Department of Veterans Affairs Veterans Health Administration October 2010 1
Transcript of 2010 VHA Facility Quality and Safety Report · 2010 VHA Facility Quality and Safety ... This is the...

2010 VHA Facility
Quality and Safety Report
Department of Veterans Affairs Veterans Health Administration
October 2010
1

Table of Contents Table of Contents 2
Executive Summary 5
Introduction 7
Part 1. VHA Facility Quality and Safety Data 9
Section 1: Infrastructure 9
Available In-House Services: 9 Hospital Services 10 Hospital Accreditation Status 11 Hospital and Facility Services 12
Section 2: Effective Care 13
Outpatient Care Composites 13 Hospital Processes of Care Composites 18 Risk Adjusted Disease Mortality 20 30 day Unadjusted Readmission Rates 20 Surgical Quality 21
Section 3: Equitable Care 22
Gender 22 Age 22 Satisfaction with Care by Race/Ethnicity 23 Urban vs. Rural (See Tables 1.3 and 1.4) 24 Table 1.4.g. How Well Doctors/Nurses Communicate 33
Section 4: Safe Care 34
Health Care-Associated Infections 34 Other 35 Root Cause Analyses (RCAs) 36
Section 5: Timely Care 37
Access to Care 37 Section 6: Patient Centered Care 37
Section 7. Efficient Care 40
Ambulatory Care Sensitive Conditions Hospitalizations 40 Results 42
Conclusions 43
Part 2: Adverse Event and Close Call Reporting in the Veterans Health Administration
2
FY06 to FY09 45

Introduction 45
Section 1: Overview and Event Types and Locations Associated with Root Cause Analyses Submitted FY06 to FY09 47
Primary Analysis and Categorization (PAC) Data by Setting and VISN 52 Section 2: Timeliness and Number of Root Cause Analyses Submitted FY06 to FY09 63
Section 3: RCAs Possessing “Strong Strings” 68
Section 4: Information on Reports That Were Not the Subject of Single Case RCAs 69
Part 3: VHA Facility Quality & Safety Data Tables 74
Section 1: Infrastructure 74
Available In-House Services: 74 Hospital Services 80 Hospital Services (continued) 88 Hospital Accreditation Status 97 Hospital and Facility Services 103 Hospital and Facility Services (continued) 112
Section 2: Effective Care 121
Outpatient Care Composites and Hospital Processes of Care Composites 121 Risk Adjusted Disease Mortality and Surgical Quality 126
Section 3: Equitable Care 132
Gender Composites 132 Age Composites 137 Satisfaction by Race 143
Section 4: Safe Care 148
Health Care-Associated Infections 148 Other 154 Root Cause Analyses (RCAs) 159
Section 5: Timely Care 165
Access to Care 165 Section 6: Patient Centered Care 171
Section 7. Efficient Care 179
Ambulatory Care Sensitive Conditions Hospitalizations 179 Part 4: Data Definitions 185
3
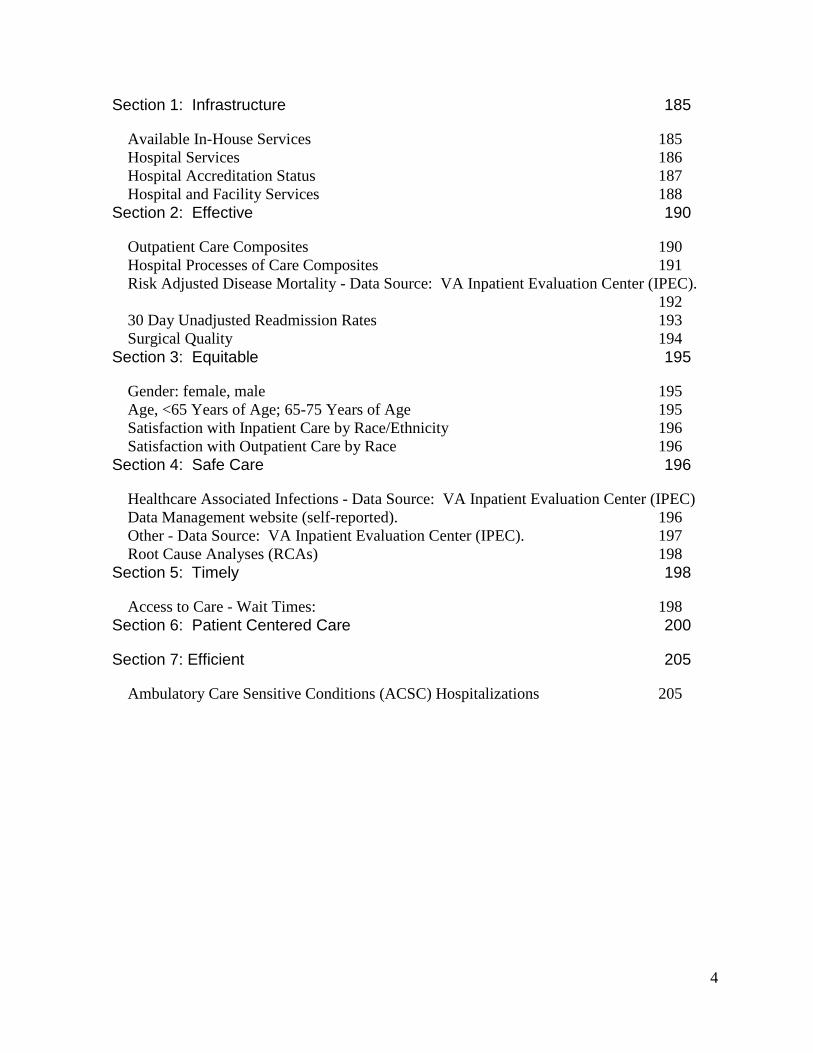
Section 1: Infrastructure 185
Available In-House Services 185 Hospital Services 186 Hospital Accreditation Status 187 Hospital and Facility Services 188
Section 2: Effective 190
Outpatient Care Composites 190 Hospital Processes of Care Composites 191 Risk Adjusted Disease Mortality - Data Source: VA Inpatient Evaluation Center (IPEC). 192 30 Day Unadjusted Readmission Rates 193 Surgical Quality 194
Section 3: Equitable 195
Gender: female, male 195 Age, <65 Years of Age; 65-75 Years of Age 195 Satisfaction with Inpatient Care by Race/Ethnicity 196 Satisfaction with Outpatient Care by Race 196
Section 4: Safe Care 196
Healthcare Associated Infections - Data Source: VA Inpatient Evaluation Center (IPEC) Data Management website (self-reported). 196 Other - Data Source: VA Inpatient Evaluation Center (IPEC). 197 Root Cause Analyses (RCAs) 198
Section 5: Timely 198
Access to Care - Wait Times: 198 Section 6: Patient Centered Care 200
Section 7: Efficient 205
Ambulatory Care Sensitive Conditions (ACSC) Hospitalizations 205
4

Executive Summary The Veterans Health Administration (VHA) is committed to providing the highest quality and safest health care for Veterans. VHA has established a wide array of innovative and comprehensive programs to measure, analyze, improve and report on all aspects of health care quality and patient safety. This is the third annual VHA facility quality and safety report.
VA issued its first facility-level report on quality and safety in 2008. The 2008 and 2009 reports are available at: (http://www1.va.gov/health/HospitalReportCard.asp
5
), and data files that comprise the report can be accessed through http://www.data.gov/. The 2010 report of VHA’s quality and safety data presents information related to the care provided in outpatient and hospital settings, the staffing of each Department of Veterans Affairs medical facility, the quality of inpatient and outpatient health care provided to all Veterans and to certain patient populations, the medical center accreditation status, patient satisfaction and selected patient outcomes for FY09. This information has been compiled from multiple sources throughout VHA. This report is greatly expanded from previous reports and includes new metrics such as medical and surgical outcomes data and a detailed analysis of VA’s safety reports from its rich patient safety reporting system. The Facility Quality and Safety Report is organized to provide information organized according the six domains that the Institute of Medicine established for defining quality in health care: Effective, Equitable, Safe, Timely, Patient-centered, and Efficient.
The highlights of the 2010 report are as follows: · During FY09 in VHA there were :
- 485,774 acute medical/surgical and 81,634 mental health hospital discharges;
- 62,686,340 outpatient visits made by 5,447,889 individual Veterans to VA facilities;
- 12,462 full-time and 2,837 part-time physicians; · All eligible VHA facilities and programs were accredited by The Joint Commission
(TJC); All VHA laboratories were accredited by either the College of American Pathologists (CAP) or TJC. Over 200 VHA programs were accredited by the Commission on Accreditation of Rehabilitation Facilities (CARF).
· VHA facilities provided high quality outpatient medical care as measured by its performance on the Healthcare Effectiveness Data and Information Set (HEDIS) and favorable comparisons with national external benchmarks.
· Based upon disease-specific composites for inpatient care processes using Joint Commission ORYX® measures, VHA compares quite favorably to other accredited organizations.
· 30 day unadjusted all-cause readmission rates averaged 12.7 percent across the VA healthcare system.
· The rates of hospital-acquired infections in VA hospitals were generally low compared to national averages reported by the Centers for Disease control, with many facilities reporting rates that are as good or better as the top 10 percent of reporting hospitals in the U.S.

· Both rural and urban-dwelling Veterans report satisfaction with outpatient care that is equivalent, and the quality of outpatient care remains high regardless of where Veterans reside.
· Overall, provision of gender-specific care to women, e.g., screening for breast and cervical cancer, substantially exceeded that in other settings including commercial managed care systems, Medicare and Medicaid.
Despite ongoing efforts to reduce barriers to access and ensure the same high quality care for all Veteran groups, certain health disparities persist within the VHA health care system:
· Veteran patients over age 65 receive slightly higher quality of outpatient care than younger Veterans, especially for preventive services.
· Outpatient quality scores for women Veterans were lower than those for men for many measures, such as control of LDL cholesterol control, rates of vaccination, colorectal cancer screening, and screening for depression.
· African-American Veterans across VA were less satisfied with inpatient and outpatient health care than White Veterans. It cannot be determined from the available data whether the differences in Veterans’ perceptions of their health care reflect actual differences in quality.
The analysis of adverse event and close call reporting in VHA (FY06 to FY09) demonstrates:
· A significant improvement in the timeliness of root cause analyses (RCAs) (43.6 percent were submitted in 45 or fewer days in FY06, 96.9 percent in FY09).
· An increase in the number of RCAs submitted from FY06 (1,024) to FY09 (1,316).
· An increase in the percent of RCAs including strong actions from FY06 (42.6 percent) to FY09 (74.7 percent).
The overall results provided in this report are favorable in comparison with the overall performance of the U.S. health care system. VHA continues to be committed to identifying and addressing potential disparities in quality and satisfaction among women and racial/ethnic minorities, a problem which has also been noted throughout the U.S.health care system and proven difficult to correct.
6

Introduction The Veterans Health Administration (VHA) is the largest integrated health care system in the U.S. In fiscal year (FY) 2009, within its budget of $42.7 billion, VHA delivered clinical services to 5.4 million out of 7.8 million enrolled Veterans. VHA operated a wide range of facilities and programs including 153 hospitals, 901 hospital and community-based independent clinics, 135 nursing homes, 225 Readjustment Counseling Centers, and 47 domiciliaries. This report summarizes performance data for clinical quality and patient safety for all VA facilities. Where two or more hospital divisionsoperate as an integrated health care system under a single leadership team, those facilities are combined, so a total of 139 separate facilities are listed in this report.
7
1
Facilities are categorized according to complexity level which is determined on the basis of the characteristics of the patient population, clinical services offered, educational and research missions and administrative complexity. Facilities are classified into three levels with Level 1 representing the most complex facilities, Level 2 moderately complex facilities, and Level 3 the least complex facilities. Level 1 is further subdivided into categories 1a - 1c.
The first section of the report describes the infrastructure of VHA facilities and locally available services across the continuum of Veteran care needs.
The next six sections are organized around the Institute of Medicine’s (IOM) six dimensions defining health care quality. According to the IOM,2 health care should be:
· Effective—providing services based on scientific knowledge to all who could benefit and refraining from providing services to those not likely to benefit (avoiding underuse and overuse).
· Equitable—providing care that does not vary in quality because of personal characteristics such as gender, ethnicity, geographic location, and socioeconomic status.
1 The following hospitals are reported with their parent facility [designated in brackets]: Brockton/West Roxbury [VA Boston HEALTH CARE SYSTEM], Castle Point [VA Hudson Valley HEALTH CARE SYSTEM], Lincoln [Nebraska/Western Iowa HEALTH CARE SYSTEM], Lyons [VA New Jersey HEALTH CARE SYSTEM], Miles City [VA Montana HEALTH CARE SYSTEM], Murfreesboro [VA Tennessee Valley HEALTH CARE SYSTEM], Sepulveda [VA Greater Los Angeles HEALTH CARE SYSTEM], Tuskegee [Central Alabama Veterans HEALTH CARE SYSTEM], Leavenworth [VA Eastern Kansas HEALTH CARE SYSTEM], Los Angeles OPC [VA Greater Los Angeles HEALTH CARE SYSTEM], Grand Island [Nebraska/W. Iowa HEALTH CARE SYSTEM], Lake City [N. Florida/ S. Georgia HEALTH CARE SYSTEM], and Knoxville [VA Central Iowa HEALTH CARE SYSTEM]. The Manila VAMC reports no quality data. 2 Institute of Medicine. Crossing the Quality Chasm. National Academy Press: Washington, D.C., 2001.

· Safe—avoiding injuries to patients from the care that is intended to help them.
· Timely—reducing waits and sometimes harmful delays for both those who receive and those who give care.
· Patient-centered—providing care that is respectful of and responsive to individual patient preferences, needs, and values and ensuring that patient values guide all clinical decisions.
· Efficient—avoiding waste of equipment, supplies, ideas, and energy.
Following presentation of quality and safety data organized by the six IOM dimensions, there is a detailed analysis of adverse event and close call reporting in the Veterans Health Administration for FY06 TO FY09.
8

Part 1. VHA Facility Quality and Safety Data
Part 1 references the data tables displayed in Part 3 of this report. The data are organized by data elements defined in columns and facilities defined in rows. The columns referenced in this narrative correspond to the data elements found in the data tables.
Section 1: Infrastructure
Available In-House Services:
Eighty nine percent of VHA facilities provide in-house acute medical and surgical services, and 79 percent provide acute inpatient psychiatric services. Eighty four percent (117 of 139) have intensive care units, 83 percent have emergency departments, and 85 percent have community living centers (formerly designated as nursing home care units).
9
3
In 2004, Public Law 108-422 and Public Law 108-447 directed VA to establish specialized interdisciplinary rehabilitation programs to handle the complex medical, psychological, rehabilitation, and prosthetic needs of Veterans with complex trauma associated with combat injury. The changing nature of combat (e.g., increased prevalence of blast-related as opposed to gunshot-related injury) as well as improved battlefield casualty care has resulted in a growing proportion of Veterans who have polytrauma, a combination of injuries that include brain injury, limb loss, impaired vision, hearing loss, and psychological sequelae including post-traumatic stress injury. VA implemented the requirements of these public laws by developing a Polytrauma System of Care (PSC) for severely injured Veterans. The components of the PSC include:
· Four regional Polytrauma/Traumatic Brain Injury (TBI) Rehabilitation Centers(PRC) provide acute comprehensive medical and rehabilitation care for complex and severe polytraumatic injuries. They maintain a full staff of dedicated rehabilitation professionals and consultants from other specialties related to polytrauma. The PRCs serve as resources for other facilities in the PSC, develop research and educational programs and provide system-wide consultation to assist implementation of best practice models of care.
· The 22 Polytrauma Rehabilitation Network Sites (PNS) have dedicated interdisciplinary teams to manage the post-acute sequelae of polytrauma and to coordinate life-long rehabilitation services for patients within each Veterans Integrated Service Network (VISN). These sites provide a high level of expert care, a full range of clinical and ancillary services, and serve as resources for
3 VA provides institutional long-term care services through three mechanisms: 132 VA owned and operated Community Living Centers (CLCs), services purchased under contract with over 2500 Community Nursing Homes, and 122 State Veterans Homes located in 48 states and Puerto Rico.

other facilities within their network which manage Veterans with severe and lasting injuries that return to their VISN area.
· The 82 Polytrauma Support Clinic Teams (PSCT) are local teams of providers with rehabilitation expertise that deliver follow up services in consultation with regional and network specialists. They assist in management of stable polytrauma sequelae through direct care, consultation, and the use of tele-rehabilitation technologies, as needed. The PSCT also provides second-level comprehensive evaluation of patients who screen positive for possible TBI.
· The remaining 48 VA facilities that do not have the necessary services to provide specialized care have a designated Polytrauma Point of Contact (PPOC) who is knowledgeable of the PSC, and ensures that patients are referred to a facility capable of providing the level of services required. They commonly refer to the PNS and PSCT within their VISN, and may also utilize fee-basis contracting to local civilian rehabilitation resources.
Hospital Services
Unique Patients: This is the total number of unique patients at the national or facility level who received care from VA in a VA or Non VA setting (VA Care, Non-VA Care, Home Dialysis, Observation Beds, and Pharmacy Only file sources) during FY09. In FY09, the Veterans Health Administration provided health care services to 5,447,889 unique patients.
VHA had a total of 485,774 Acute Inpatient Medical/Surgical hospital discharges in FY09 with an average system-wide length of stay of 5.4 days. The rate of discharges per 1000 facility unique patients was 89.2 and the rate of bed days of care per 1000 unique patients was 479.4. The average number of facility discharges was 3,918 with a range of 70 to 12,139.
VHA had a total of 81,634 Acute Inpatient Psychiatry hospital discharges in FY09 with an average system-wide length of stay of 9.5 days. The rate of discharges per 1000 unique patients was 15 and the rate of bed days of care per 1000 unique patients was 142.5. The average number of facility discharges was 742 with a range of 39 to 2,281.
In FY09, VHA performed 408,789 outpatient endoscopy procedures in-house. Of the five endoscopy procedure types reported, 53 percent (214,955) were colonoscopies, 26percent (104,976) upper GI procedures, 15 percent (62,519) ENT Endoscopies, 4 percent (16,321) sigmoidoscopies and 2 percent (10,018) bronchoscopies. On average, facilities performed 1,666 colonoscopies (range 9 to 7,478), 820 Upper GI procedures (range 5 to 2,374), 574 ENT endoscopies (range 9 to 2,106), 127 sigmoidoscopies (range 5 to 1,523), and 87 bronchoscopies (range 7 to 397).
10
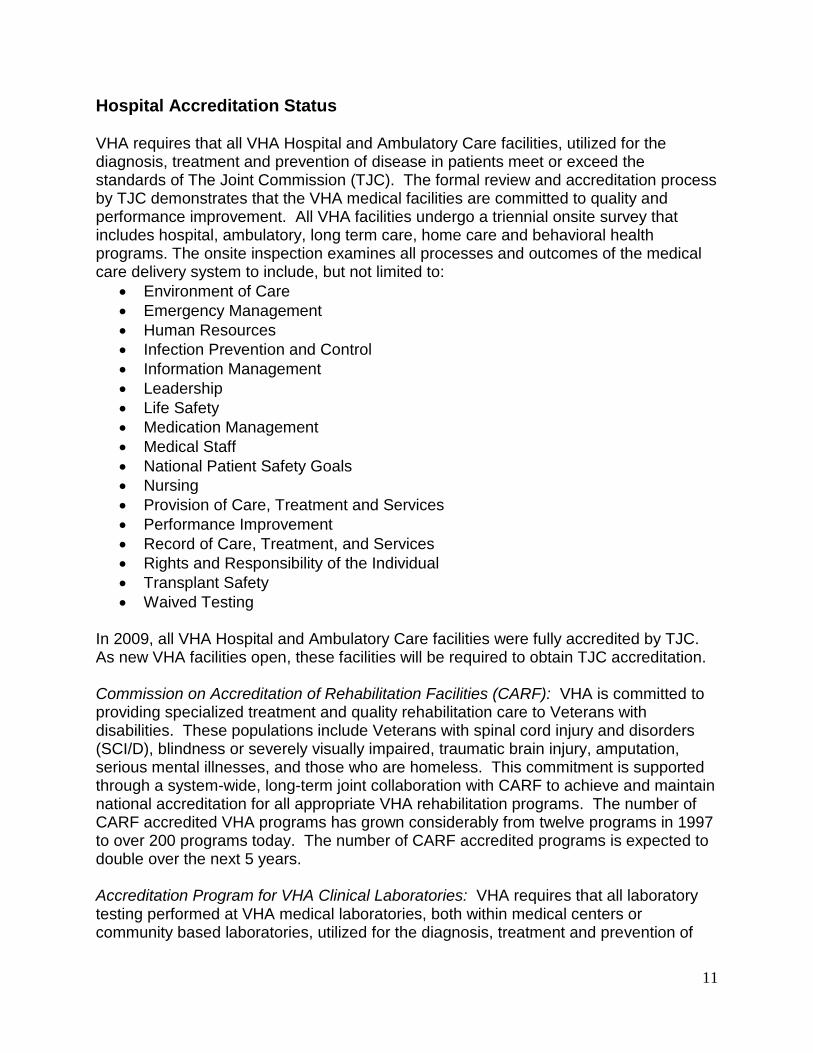
Hospital Accreditation Status
VHA requires that all VHA Hospital and Ambulatory Care facilities, utilized for the diagnosis, treatment and prevention of disease in patients meet or exceed the standards of The Joint Commission (TJC). The formal review and accreditation process by TJC demonstrates that the VHA medical facilities are committed to quality and performance improvement. All VHA facilities undergo a triennial onsite survey that includes hospital, ambulatory, long term care, home care and behavioral health programs. The onsite inspection examines all processes and outcomes of the medical care delivery system to include, but not limited to:
· Environment of Care · Emergency Management · Human Resources · Infection Prevention and Control · Information Management · Leadership · Life Safety · Medication Management · Medical Staff · National Patient Safety Goals · Nursing · Provision of Care, Treatment and Services · Performance Improvement · Record of Care, Treatment, and Services · Rights and Responsibility of the Individual · Transplant Safety · Waived Testing
In 2009, all VHA Hospital and Ambulatory Care facilities were fully accredited by TJC. As new VHA facilities open, these facilities will be required to obtain TJC accreditation.
Commission on Accreditation of Rehabilitation Facilities (CARF): VHA is committed to providing specialized treatment and quality rehabilitation care to Veterans with disabilities. These populations include Veterans with spinal cord injury and disorders (SCI/D), blindness or severely visually impaired, traumatic brain injury, amputation, serious mental illnesses, and those who are homeless. This commitment is supported through a system-wide, long-term joint collaboration with CARF to achieve and maintain national accreditation for all appropriate VHA rehabilitation programs. The number of CARF accredited VHA programs has grown considerably from twelve programs in 1997 to over 200 programs today. The number of CARF accredited programs is expected to double over the next 5 years.
Accreditation Program for VHA Clinical Laboratories: VHA requires that all laboratory testing performed at VHA medical laboratories, both within medical centers or community based laboratories, utilized for the diagnosis, treatment and prevention of
11

disease in patients, meet or exceed the requirements of the Clinical Laboratory Improvement Amendments (CLIA) of 1988. All laboratory testing, regardless of location, is subject to onsite inspection and accreditation by a nationally recognized accreditation body, either CAP or TJC. These accrediting bodies perform a comprehensive review which involves a biennial onsite examination of processes and outcomes of medical laboratory operations including:
· Patient Test Management · Leadership · Personnel Standards · Quality Assurance · Quality Control · Proficiency Testing · Safety
Hospital and Facility Services
In FY09, there were 62,686,340 outpatient visits in VHA. The average number of visits to a VA facility was 450,836. Total outpatient visits to a VA facility ranged from 113,184 (Sheridan, Wyoming) to 1,331,446 (Cleveland, Ohio).
VHA employed 12,462 full-time and 2,837 part-time physicians FTEE (Full-Time Employee Equivalents) in FY09. Nationally, there were 2.8 staff physician FTEE per 1,000 unique patients.
12
4
Hours per Patient Day (HPPD) data (also known as NHPPD - Nursing Hours per Patient Day) are an industry standard that measures the average hours of direct nursing care that patients receive per inpatient day. Data in this report are estimates that are derived from employment files and VHA’s Decision Support System (DSS), and dependent upon accurate mapping of labor to specific patient wards. Although comparative data is available from external sources (Labor Management Institute and National Database Nursing Quality Indicators), it is important to note that VHA data includes all worked hours mapped to a ward – e.g. both direct and indirect care.
The facility total loss rate reflects any loss, retirement, death, termination, voluntary separation or transfer that removes employee from the selected facility. This report gives the facility total loss rate for:
· Registered Nurse (occupation code 0610) · Practical Nurse (LPN) (occupation code 0620) · Nursing Assistant (occupation code 0621)
4 This number excludes medical residents and other trainees, physicians who provide occasional services without compensation, and contracted physicians.

Table 1.1 reports comparison data for non-VA facilities by region, hospital ownership and bed size for registered nurses. These self-reported data were collected by Nursing Data Solutions, Inc., from July 2008 through June 2009, and represent only 123 hospitals, a 5.6 percent response rate to their solicitation. Comparisons are only approximate because of the small sample size and self reported nature of data collection, but do provide some insight into variables that may affect turnover. Table 1.1: Benchmark Staff Turnover Rates
13
REGION Percent TOTAL RN TURNOVER
Percent FULL/PART TIME RN TURNOVER
North East 11.0 8.4 North Central 15.5 10.8 South East 13.4 12.3 South Central 17.6 15.3 West 17.8 15.2
OWNERSHIP Percent TOTAL RN TURNOVER
Percent FULL/PART TIME RN TURNOVER
For-Profit – Acute Care 20.6 13.8 Non-Government/Non-Profit – Acute Care
12.7 9.5
Government – Acute Care 13.3 17.5
BED SIZE Percent TOTAL RN TURNOVER
Percent FULL/PART TIME RN TURNOVER
<200 beds 12.2 10.6 200 – 349 beds 13.7 13.1 350 – 500 beds 20.1 14.1 >500 beds 12.0 9.1
NATIONAL AVERAGE Percent TOTAL RN TURNOVER
Percent FULL/PART TIME RN TURNOVER
14.2 10.6 VHA AVERAGE 7.5 (unavailable)
Section 2: Effective Care
Outpatient Care Composites
The National Committee on Quality Assurance (NCQA) publishes the Healthcare Effectiveness Data and Information Set (HEDIS), a recognized tool used by the majority of U.S. health plans to measure performance on important evidence-based dimensions of care and service. VHA uses a subset of measures applicable to the VA population from the HEDIS measures, and collects data on performance using a random sample of patient records that are analyzed and abstracted by trained personnel as part of VHA’s

External Peer Review Program (EPRP). In this section, quality performance is reported by dimensions of care (diabetes; prevention and screening for cancer; cardiovascular care; immunization; and smoking cessation) with composite scores for each dimension calculated using an “opportunities model” approach.
14
5 Comparisons between facilities using these metrics should be interpreted cautiously as many factors can account for variations in scores such as differences across facilities in Veterans’ clinical and socio-economic conditions.
· Diabetes Mellitus: The percentage of patients 18 to 75 years of age with diabetes (type 1 and type 2) who had each of the following:
o HbA1c testing. o poorly controlled HbA1c >9 o LDL-C screening. o LDL-C controlled to less than 100 mg/dL. o Patients receiving any retinal screening during the report period, or a
documented refusal of a diabetic eye exam. o Patients who have received nephropathy screening. o Diabetic blood pressure <140/90: the percentage of hypertensive adults
ages 18 to 85 whose blood pressure was controlled to or below 140/90 mmHg during the past year. Both systolic and diastolic pressure readings must be at or under this threshold for blood pressure to be considered controlled.
· Prevention And Screening For Cancer: o Breast Cancer Screening: The percentage of women between 50 and 69
years old who had at least one mammogram in the past 2 years. o Cervical Cancer Screening: The percentage of women aged 21 to 64
enrolled in a health plan that had at least one Pap test in the past 3 years. o Colorectal cancer screening: The percentage of adults 50 to 80 years of
age who have had appropriate screening for colorectal cancer.
· Cardiovascular Care: o Cholesterol Management: The percentage of patients 18-75 years of age
with a diagnosis of ischemic vascular disease (IVD) who received LDL-C screening and whose LDL-C concentration was controlled to <100mg/dL.
o Blood Pressure: The percentage of hypertensive adults ages 18 to 85 whose blood pressure was controlled to less than 140/90 mmHg during the past year. Both systolic and diastolic pressure readings must be at or under this threshold for blood pressure to be considered controlled.
5 The opportunities model assumes that each Veteran needs and has the opportunity to receive one or more processes of care, but not all Veterans need the same care. Composite measures that use this model summarize the proportion of appropriate care that is delivered. The denominator for an opportunities model composite is the sum of opportunities (across all Veterans) to receive appropriate care across a set of individual process measures. The numerator is the sum of the components of appropriate care that are actually delivered. See Agency for Healthcare Quality and Research, National Healthcare Quality Report 2008, http://www.ahrq.gov/qual/nhqr08/Chap1.htm (accessed June 30, 2010).

· Immunizations: o Influenza: The percentage of adults 50 years of age or older who received
an influenza vaccination during the most recent flu season.
· Smoking Cessation Measures: o The percentage of current smokers 18 or older who received advice to quit
smoking from their practitioner within the past year. o The percentage of current smokers 18 or older whose practitioner
discussed or recommended smoking cessation medications with them over the past year.
o The percentage of current smokers 18 or older whose practitioner discussed or recommended smoking cessation methods or strategies with them over the past year.
Table 1.2, External Comparisons, displays comparative system level information about outpatient performance on individual HEDIS metrics. In making comparisons, caution is warranted due to significant differences in the way VHA abstracts clinical data and defines eligible patient. In private (non-VA) health care settings, HEDIS data are collected on an annual basis for all enrollees, primarily from billing data. VHA collects the HEDIS outpatient measures on a monthly basis through medical chart abstraction, only for those Veterans who have been seen at least twice in a 24-month period.
15

Table 1.2: External HEDIS Comparisons for 2008/2009
16
Clinical Indictor
VA Average Percent 2009 (1)
VA Average Percent 2008(1)
HEDIS Commercial
2008(2)
HEDIS Medicare
2008(2)
HEDIS Medicaid
2008(2) Breast Cancer Screening 87 87 70 68 51
Cervical Cancer Screening 92 92 80 n/a 66 Cholesterol Management for Patients
with Cardiovascular Conditions: LDL-C Control (<100 mg/dL) 67 66 60 57 40
Cholesterol Management for Patients with Cardiovascular Conditions: LDL-C
Screening 96 94 89 89 80
Colorectal Cancer Screening 80 79 59 53 n/a
Comprehensive Diabetes Care - Blood Pressure Control (<140/90) 80 78 66 60 57
Comprehensive Diabetes Care - Eye Exams 88 86 57 61 53
Comprehensive Diabetes Care - HbA1c Testing 98 97 89 88 81
Comprehensive Diabetes Care - LDL-C Controlled (LDL-C<100 mg/dL) 69 68 46 49 34
Comprehensive Diabetes Care - LDL-C Screening 96 95 85 86 74
Comprehensive Diabetes Care - Medical Attention for Nephropathy 95 93 82 88 77
Comprehensive Diabetes Care - Poor HbA1c Control 16 16 28 29 45
Controlling High Blood Pressure - Total 77 75 63 59 56
Flu Shots for Adults (50-64) 69 69 50 n/a n/a Medical Assistance with Smoking
Cessation - Advising Smokers To Quit (3) 96 89 77 n/a 69 Medical Assistance with Smoking
Cessation - Discussing Medications(3) 90 84 54 n/a 41 Medical Assistance with Smoking
Cessation - Discussing Strategies (3) 96 92 50 n/a 41
Flu Shots for Adults (65 and older) (4) (5) 83 84 n/a 71 n/a Immunizations: Pneumococcal (note
patients age groups) (4) (5) 95 (all ages)
94 (all ages) n/a 67 n/a
Due to population differences, and methodology variations not all HEDIS measures are comparable to VA measures – therefore this is not a comprehensive list of indicators but this comparison does contain those indicators that are closely aligned in content and methodology. (1) VA comparison data is obtained by abstracting medical record data using similar methodologies to matched HEDIS methods. (2) HEDIS data were obtained from the 2009 “State of Health Care Quality Report” available on the NCQA website: http://www.ncqa.org/ (3) HEDIS is obtained by survey; VA is obtained by medical record abstraction (4) BRFSS reports are available on the CDC website: http://www.cdc.gov/

(5) BRFSS survey scores are median scores. VA scores are averages obtained by medical record abstraction.
17

Hospital Processes of Care Composites
Of the 139 facilities listed in this report, 124 hospitals offer inpatient acute care services and thus report hospital processes of care using The Joint Commission ORYX® measures of inpatient quality.
18
6 Within VHA, there are four applicable core measurement sets: Acute Myocardial Infarction, Congestive Heart Failure, Community Acquired Pneumonia and the Surgical Care Improvement Project (SCIP).7 Summary scores in the form of composite metrics are created by combining the individual measures within each core set using the “opportunities model” approach described previously for Outpatient Care Composites.
· Acute Myocardial Infarction (AMI). The percent of AMI patients:o Without aspirin contraindications who received aspirin within 24 hours
of arriving at the hospital. o Without aspirin contraindications who are prescribed aspirin at hospital
discharge. o With left ventricular systolic dysfunction and without both angiotensin
converting enzyme inhibitor (ACEI) and angiotensin receptor blocker (ARB) contraindications who are prescribed an ACEI or ARB at hospital discharge.
o With a history of smoking cigarettes who are given smoking cessation advice or counseling during hospital stay.
o Without beta blocker contraindications who are prescribed a beta blocker at hospital discharge.
o Without beta blocker contraindications who received a beta blocker within 24 hours after hospital arrival.
o Receiving thrombolytic therapy during the hospital stay and having a time from hospital arrival to thrombolysis of 30 minutes or less.
o Receiving primary percutaneous coronary intervention (PCI) during the hospital stay with a time from hospital arrival to PCI of 90 minutes or less.
o With documentation of low-density lipoprotein cholesterol (LDL-C) level in the hospital record or documentation that LDL-C testing was done during the hospital stay or is planned for after discharge.
o With elevated low-density lipoprotein cholesterol (LDL-C ≥ 130 mg/dL or narrative equivalent) who are prescribed a lipid-lowering medication at hospital discharge.
o Median time from, time of arrival to the hospital to administration of a thrombolytic agent. This measure applies in cases where an electrocardiogram, performed closest to time of arrival, shows a
6 The following facilities do not offer acute care inpatient services: Honolulu, Anchorage, Bedford, Butler, Canandaigua, Manchester, New Orleans, Northampton, St. Cloud, Orlando, Tuscaloosa, Walla Walla, White City, El Paso, and Columbus. 7 For further information consult: http://www.jointcommission.org/accreditationprograms/hospitals/oryx/.

specific electrocardiogram pattern, referred to as an ST elevation or LBBB, indicating that a patient is having a myocardial infarction or heart attack.
· Heart Failure (HF). The percent of HF patients: o Discharged home with written discharge instructions or educational
material given to patient or caregiver at discharge or during the hospital stay addressing all of the following: activity level, diet, discharge medications, follow-up appointment, weight monitoring, and what to do if symptoms worsen.
o With documentation in the hospital record that left ventricular function (LVF) was assessed before arrival, during hospitalization, or is planned for after discharge.
o With left ventricular systolic dysfunction (LVSD) and without both angiotensin converting enzyme inhibitor (ACEI) and angiotensin receptor blocker (ARB) contraindications who are prescribed an ACEI or ARB at hospital discharge.
o With a history of smoking cigarettes who are given smoking cessation advice or counseling during hospital stay.
· Pneumonia. The percent of pneumonia patients: o Who had an assessment of arterial oxygenation by arterial blood gas
measurement or pulse oximetry within 24 hours of arriving at the hospital.
o Age 65 and older who were screened for pneumococcal vaccine status and were administered the vaccine prior to discharge, if indicated.
o Transferred or admitted to the ICU within 24 hours of hospital arrival, who had blood cultures performed within 24 hours prior to or 24 hours after hospital arrival.
o Whose initial emergency room blood culture specimen was collected prior to first hospital dose of antibiotics.
o With a history of smoking cigarettes who are given smoking cessation advice or counseling during hospital stay.
o Who receive their first dose of antibiotics within 6 hours after arrival at the hospital.
o Who receive an initial antibiotic regimen during the first 24 hours that is consistent with current guidelines.
o Age 50 years and older, hospitalized during October, November, December, January, or February who were screened for influenza vaccine status and were vaccinated prior to discharge, if indicated.
· Surgical Care Improvement Project (SCIP): o Surgical patients who received prophylactic antibiotics within 1 hour
prior to surgical incision. o Prophylactic antibiotic selection for surgical patients.
19

o Surgical patients whose prophylactic antibiotics were discontinued within 24 hours after surgery end time.
o Cardiac surgery patients with controlled blood glucose at 6 a.m. on the morning following surgery.
o Surgery patients with appropriate hair removal. o Patients on beta-blocker therapy prior to admission who received a
beta-blocker during the perioperative period. o Surgery patients with recommended venous thromboembolism
prophylaxis ordered. o Surgery patients who received appropriate venous thromboembolism
prophylaxis within 24 hours prior to surgery to 24 hours after surgery.
VHA compares quite favorably to other organizations on hospital processes of care, with most facilities scoring at or above 90 across all core measurement sets. Beginning in March 2010, VHA performance on core hospital process of care measures has been reported on the Center for Medicare and Medicaid Service’s Hospital Compare Web site, http://www.hospitalcompare.hhs.gov/
20
.
Risk Adjusted Disease Mortality
Hospital-specific, risk-standardized rates of mortality within 30 days of discharge are reported for patients hospitalized with a principal diagnosis of heart attack, heart failure, and pneumonia. For each condition, the risk-standardized (also known as "adjusted" or "risk-adjusted") hospital mortality rate are calculated using mathematical models that use administrative data to adjust for differences in patient characteristics that affect expected mortality rates.8 With risk adjustment, mortality rates can be used to compare performance among hospitals. The mortality measures for heart attack, heart failure, and pneumonia have been endorsed by the National Quality Forum (NQF).9
30 day Unadjusted Readmission Rates
Reducing hospital readmissions has been an area of focus for VHA as a way to improve quality and reduce costs. A readmission is defined as a patient who has had a recent hospital stay and needs to re-enter the hospital again within 30 days. These rates are not adjusted for patient characteristics that affected expected admission rates, so comparisons among hospitals should be interpreted with caution.
8 Ross J, et al. Use of administrative claims models to assess 30 day mortality among Veterans Health Administration hospitals. Medical Care 2010; 48: 652-658.
9 http://www.qualityforum.org/Home.aspx

All-Cause Readmissions: All cause readmission is an unplanned readmission to a hospital after a previous hospital stay. Readmissions may or may not be related to the previous visit, and not all readmissions may be preventable. The percentage of patients readmitted within 30 days for any cause in VA ranged from 0 to 17.7 percent with a facility mean of 12.7 percent.
Congestive Heart Failure (CHF) Readmission: A CHF readmission is defined by patients who had an initial hospitalization for CHF and were readmitted at least once to acute care in the hospital within 30 days following discharge for CHF. Of the individual hospital-level all cause readmission rates calculated for 124 VA facilities, the unadjusted readmission rate for congestive heart failure (CHF) was higher than the VA National Average (20.2 percent) at 12 facilities and significantly lower than the VA National Average at 10 facilities.
Veterans admitted to VHA facilities may have different characteristics than other patients, making comparisons with other health systems difficult. Previously reported 30 day readmission rates among Medicare fee-for-service patients have averaged approximately 20 percent.
21
10
Surgical Quality
VA’s Surgical Quality Improvement Program (VASQIP) monitors major surgical procedures performed at VHA facilities and tracks risk adjusted surgical complications (morbidity) and mortality rates. The following patient data is collected at each facility by a specially trained nurse and entered into the VA’s electronic health record: detailed preoperative patient characteristics including chart-abstracted medical conditions, functional status, recent laboratory tests, information about the surgical procedure performed, and 30-day outcomes data. A surgical procedure is classified as major if the health of the patient and the risk of the surgical procedure create any significant morbidity or mortality within 30 days after the surgical procedure.
The VASQIP program analyzes this patient data using mathematical models to predict an individual patient’s expected outcome based on the patient’s preoperative characteristics and the type and nature of the surgical procedure. Overall patient outcomes for major surgical procedures are expressed by comparing observed rates of mortality and morbidity to the expected rates for those patients undergoing the procedure as observed-to-expected (O/E) ratios. For example, if, based on patient characteristics, a facility expected 5 deaths following major surgery, but only 4 patients died, the O/E ratio would be reported as 0.8.
10 Jencks SF et al. Rehospitalizations among patients in the Medicare fee-for-service program. N Engl J Med 2009; 360:1418-1428.

Listed in columns BS and BT are VA medical centers performing more than 400 major surgical procedures in FY09 and the associated O/E ratios for morbidity and mortality. As reference for this period, VASQIP analyzed 125,955 major surgical procedures performed at 123 VA medical centers. The overall 30-day unadjusted mortality and morbidity rates were 1.31 percent and 8.53 percent, respectively.
Section 3: Equitable Care
Gender
This section compares the outpatient care received by men and women Veterans using HEDIS outpatient composites across VHA facilities. It is important to note that only 5 percent of users of the VHA health care system are women. Although the External Peer Review Program uses a special augmented sample of 30,000 women aged 40 to 69 to increase the precision of the estimates of each quality measure, small sample sizes may limit the ability to compare scores for men and women for some VHA sites. Facility results are only reported if there are 30 or more women in the composite denominator.
The quality of care provided to women is considerably higher in VA health care than the private sector for many gender-specific and gender-neutral measures. For example, VA provides recommended prevention and screening services, such as mammography and cervical cancer screening, to female Veterans at higher rates than commercial health plans. Despite these positive results, there is a consistent gap in the quality of care for several measures between men and women. LDL cholesterol control for at risk and non-risk populations continues to compare less favorably for female Veterans than for male Veterans. In addition, prevention measures including vaccination, colorectal and depression screening continue to be lower for women Veterans, although there is considerable variation in the magnitude of these differences across VISNs and facilities.
Such gender-related gaps in care have also been recognized in private sector health care systems. VHA has been striving to understand and close those gaps for female Veterans by specifically examining patient factors, provider factors and systemic organizational factors that might impact the care provided to female Veterans.
Age
This section compares patients age 65 and older to patients under age 65 on the outpatient HEDIS composites. Comparisons of the quality of outpatient care for different age groups indicate that Veterans aged 65 or older receive slightly higher levels of recommended services than Veterans younger than 65, particularly for preventive health services.
22

Satisfaction with Care by Race/Ethnicity
This section provides a comparison among race/ethnicity groups on self-reported overall patient satisfaction in the inpatient and outpatient care settings. Facility overall satisfaction scores were obtained from FY09 Survey of Health Experiences of Patients (SHEP) (See Section 6 for a description of SHEP survey procedures). Veterans were classified as White, Black, or other minority group based upon their self response to the following two SHEP questions: 1) Are you of Spanish, Hispanic or Latino origin or descent? ; and 2) What is your race? (Mark all that apply: White (Caucasian), Black or African American, Asian, Native Hawaiian or Pacific Islander, American Indian or Alaska Native). The latter three race categories were collapsed into Other Minority Group due to small numbers at individual facilities. Veterans who provided a positive response to the Hispanic/Latino ethnicity question were classified as Other Minority Group, regardless of their response to the race question. Facility results are not presented if less than 30 African Americans responded. Because of overall small numbers in the Other Minority Groups, comparisons are made only between Whites and African Americans.
Facility patient satisfaction scores for inpatient and outpatient were slightly higher for Whites compared with African American Veterans. The average facility inpatient satisfaction score was 62 percent for Whites versus 60 percent for African Americans. The average facility outpatient satisfaction score was 59 percent for Whites versus 54 percent for African Americans.
The differences in satisfaction scores reported by African American and White Veterans are concerning and are continuing to be investigated by VHA. Possible explanations encompass a wide variety of factors that may include real or perceived discrimination, trust in medical care providers, ethnic concordance between patient and provider, medical knowledge, expectations regarding the medical encounters, religious beliefs, and geographic factors. There are also methodological challenges in measuring patient satisfaction across race and ethnic groups. For example, global ratings of satisfaction (i.e., 0 to 10 scale) can be susceptible to differences in expectations across race and ethnic groups.
23
11 12 Higher expectations for health care may result in less positive evaluations of care. A final challenge is the low survey response rate for African Americans that can undermine the representativeness of the results for this sub-population.
11 Elliott, M. N., Haviland, A. M., Kanouse, D. E., Hambarsoomian, K., & Hays, R. D. (2009). Adjusting for subgroup differences in extreme response tendency when rating health care: Impact on disparity estimates. Health Services Research, 44, 542-561.
12 Weech-Maldonado, R. W., Elliott, M. N., Oluwole, T., Schiller, C., & Hays, R. D. (2008). Survey response style and differential use of CAHPS rating scales by Hispanics. Medical Care, 46, 963-968.

Urban vs. Rural (See Tables 1.3 and 1.4)
The special needs of Veterans who live in rural areas and have to travel further to receive health care is a top priority for the VHA. In this section, determination of Urban versus Rural residence was based on the Veteran’s reported home address. Urban areas were defined by U.S. Census as urbanized areas; rural areas are all other areas excluded in U.S. Census defined as urbanized areas. Clinical data were obtained from the External Peer Review Program (EPRP) outpatient samples in FY09. National and VISN weighted scores were calculated for the outpatient quality of care clinical composites. Facility level scores were not calculated because facilities may not be wholly urban or wholly rural based on geographic location. Differences of +/- 5 points are viewed as clinically significant. No adjustments were made for patient characteristics.
In FY09, 59 percent of VHA enrolled patients lived in urban areas while 41 percent lived in rural areas. There was significant variation across Veterans Integrated Service Networks (VISNs) in the proportion of patients residing in rural areas (9 percent to 59 percent) who were seen in the outpatient setting. VISNs 9, 15, and 23 had a high proportion of rural patients (59 percent overall). Low proportions of rural patients were observed in VISNs 3 (10 percent), 8 (23 percent), and 22 (14 percent). There were no clinically significant differences at the national level for any of the outpatient quality of care composites between patients residing in rural and urban areas. At the VISN level, most of the outpatient composite score differences between rural and urban patients were within four percentage points (see Table 1.3), a difference judged to have little clinical significance. Ischemic heart composite scores were lower for urban patients in VISN 3 (-8 percent) and VISN 5 (-6 percent). Tobacco composite scores were higher for urban patients in VISN3 (5 percent).
In additional analyses, we used FY09 Survey of Health Experiences of Patients (SHEP) outpatient data to examine the Consumer Assessment of Healthcare Providers and Systems (CAHPS) composite and reporting measure satisfaction scores for patients living in urban or rural areas (see Table 1.4). There were no clinically significant differences at the national level in the scores for any of the outpatient CAHPS composites and reporting satisfaction measures for patients residing in rural or urban areas, although there is a slight trend towards higher satisfaction among rural Veterans. Within the 21 VISNs, Overall Quality scores showed no significant differences for 16 VISNs, were significantly higher for rural patients in four VISNs, and significantly lower for rural patients in one VISN. The Provider Wait Time and Getting Care Quickly measures had significantly higher scores for rural patients within 7 VISNs. The Getting Needed Care measure had significantly lower scores for rural patients within 5 VISNs. In VISNs 5 and 22 there was also a trend toward higher scores for rural patients in 5 of the 7 outpatient measures.
24

In summary, satisfaction with VHA ambulatory care is similar among Veterans residing in urban and rural areas. With few exceptions, individual VISNs show either similar, or slightly higher, satisfaction of rural compared with urban Veterans. Additional analysis will be conducted to determine whether factors known to influence patient satisfaction such as age, education, or health status, play a role in understanding patterns of quality for patients residing in rural and urban areas.
25

Table 1.3: Outpatient Care Composites in Percentages, Urban vs. Rural
26
Populations
Diabetes Mellitus Urban
Diabetes Mellitus
Rural Prevention
Urban Prevention
Rural
Ischemic Heart Dz
Urban
Ischemic Heart Dz
Rural Tobacco Urban
Tobacco Rural
Behavioral Health
Screening Urban
Behavioral Health
Screening Rural
National 87.2 87.6 85.8 86.4 79.4 79.9 93.7 93.8 95.8 96.1 VA New England Health Care System - VISN 1 88.1 87.1 88.1 87.8 81.8 80.2 96 94 96.6 96.6 VA Healthcare Network Upstate New York - VISN 2 87.7 86.4 86.6 87.2 78.5 78.6 98.4 97 94.9 96.1 VA NY/NJ Veterans Healthcare Network - VISN 3 87.1 89.3 85.1 85.4 78.2 85.7 93.6 88.6 95.7 95.5 VA Healthcare - VISN 4 88.9 88.2 87.2 86.6 81 82.7 93 95.7 95.9 97.1 VA Capitol Health Care Network - VISN 5 86.1 89.3 86.1 85 77.4 83.5 94.8 96.1 97.2 97.2 VA Mid-Atlantic Health Care Network - VISN 6 86.9 87.3 90.2 90 79.3 78 97.2 95.9 96.3 96.4 VA Southeast Network - VISN 7 87.5 88.9 86.6 87.5 79.8 80.4 95.8 96.9 95 95.8 VA Sunshine Healthcare Network - VISN 8 87.6 89.8 86.1 86.7 79.6 82.2 92.9 96.8 97.4 96.8 VA Mid South Healthcare Network - VISN 9 87.5 86.7 84.3 84.8 79.4 78.5 90.2 91.9 94.1 91.8 VA Health Care System of Ohio - VISN 10 88 87 87.4 86.7 78.8 80.8 93.8 95.1 96.9 97.6 Veterans In Partnership - VISN 11 86.7 88.4 84.7 85.5 79.2 80.6 92.4 93.3 96.2 97.1 The Great Lakes Health Care System - VISN 12 88.3 91.3 84.5 87.3 83.4 85.8 95.9 94.4 97.1 97.5 VA Heartland Network - VISN 15 86.1 87.1 82.6 85.8 78.4 78.1 95.8 96 94.5 97.5 South Central VA Health Care Network - VISN 16 86.5 87.3 85.5 86.3 79.2 81.2 94.2 90.6 96 96.2 VA Heart of Texas Health Care Network - VISN 17 87.6 88.3 87.9 87.5 79.2 80.9 92.5 88.8 96.6 97.3 VA Southwest Health Care Network - VISN 18 86.6 85.4 86.8 85.3 79.1 78.1 89.7 92.8 93.6 95.4 Rocky Mountain Network - VISN 19 87.1 87.1 84 85.2 81 77 93.1 93.6 96.1 94.4 Northwest Network - VISN 20 87.1 86.6 82.7 83.9 78.7 76.4 92.9 90.8 94 95.6 Sierra Pacific Network - VISN 21 86.8 84.8 85.8 84.7 80.3 82.1 92.6 91.2 96.6 96.9 Desert Pacific Healthcare Network - VISN 22 85.4 84.8 82.4 82.1 76.6 71.3 92.2 93.1 92.9 91.3 VA Midwest Health Care Network - VISN 23 87.7 87.6 87.7 87.3 77.5 76.7 94.8 96.1 97 97.5

Table 1.4. FY09 Outpatient SHEP Scores, Urban vs. Rural All scores are cumulative from October 2008 through September 2009 except those marked with *. Scores marked with a * are cumulative from April 2009 through September 2009. Definitions of Urban and Rural were obtained from 10A5. % Pos are the percent of patients who responded positively to the given metric. N is the number responding to the composite or reporting measures not in the total patient population.
Table 1.4.a. Overall Rating of Health Care
27
Reporting Level Urban % Pos
Urban N
Rural % Pos
Rural N
National 57.5 42087 57.8 57495 VISN1 64.7 3345 62.1 2544 VISN2 66.8 1236 62.5 2829 VISN3 60.9 3352 60.5 682 VISN4 63.8 3286 65.5 4063 VISN5 55.9 976 65.1 992 VISN6 52 1082 56.8 1967 VISN7 58.4 1965 57.1 2777 VISN8 63.7 4076 59.1 2171 VISN9 52.6 1478 53.1 4016 VISN10 58.3 2054 59.1 2420 VISN11 51.4 1703 62.7 2320 VISN12 59.2 2173 61.5 2753 VISN15 60.9 1295 54.7 4575 VISN16 51.2 1805 53.6 3902 VISN17 52.8 1376 60.5 2199 VISN18 51.2 1637 48.7 3582 VISN19 53.3 1507 54.5 3549 VISN20 52.6 1542 53 2551 VISN21 62.2 2152 62.7 1763 VISN22 52.4 2785 62.6 664 VISN23 61.1 1262 60.6 5176

Table 1.4.b. Overall Rating of Specialist
28
Reporting Level Urban % Pos
Urban N
Rural % Pos
Rural N
National 61.7 40416 62.6 49481 VISN1 66.8 2910 67.5 2288 VISN2 67.6 989 65.7 2389 VISN3 62.8 3160 62.2 667 VISN4 66 2581 67.5 3044 VISN5 51.8 1015 62.5 865 VISN6 58 1154 64.7 1997 VISN7 62.5 1910 64.6 2490 VISN8 67.8 4035 63.4 2174 VISN9 62.6 1412 57.1 3658 VISN10 61.4 2003 60.5 2190 VISN11 59 1585 68.5 1823 VISN12 61.5 1920 62.6 1950 VISN15 57.4 1244 62.3 3668 VISN16 58.7 1765 58.1 3618 VISN17 55.4 1386 62.8 1994 VISN18 59.4 1632 57.6 3279 VISN19 59.1 1550 60.1 2908 VISN20 61.3 1465 64.7 2191 VISN21 64.4 2486 65.7 1800 VISN22 57.5 3120 60.2 690 VISN23 61.9 1094 62.7 3798

Table 1.4.c. Overall Rating of Personal Doctor/Nurse
29
Reporting Level Urban % Pos
Urban N
Rural % Pos
Rural N
National 65.9 70435 66.1 88715 VISN1 69.6 5598 71 4067 VISN2 67.7 1936 69.7 4141 VISN3 73.1 5854 63 1101 VISN4 72.2 5313 74.1 5958 VISN5 68.5 1692 75.4 1723 VISN6 64.3 1799 63.3 3242 VISN7 66 3190 66.2 4286 VISN8 69.6 6903 65.6 3513 VISN9 62.1 2463 64.3 6052 VISN10 64.7 3590 63.9 3634 VISN11 61.2 2808 68.2 3494 VISN12 68.1 3622 70.8 4174 VISN15 64.3 2214 63.3 6858 VISN16 63.9 2950 62.1 6313 VISN17 58.4 2219 68.8 3393 VISN18 59.8 2690 63.7 5639 VISN19 66.3 2646 61.4 5528 VISN20 63 2475 57.7 3890 VISN21 66 3812 69 2938 VISN22 61.7 4629 72.3 1103 VISN23 68.4 2032 70.1 7668

Table 1.4.d. Provider Wait Time (20 Minutes or less)
30
Reporting Level Urban % Pos
Urban N
Rural % Pos
Rural N
National 77.3 91828 81.4 123318 VISN1 84.7 7155 89.8 5473 VISN2 89.4 2635 90.2 6174 VISN3 76.5 7342 76.9 1467 VISN4 84.1 7180 88.6 8740 VISN5 72.8 2144 79.7 2275 VISN6 75.2 2372 82.7 4351 VISN7 77.7 4302 75.9 5835 VISN8 70.2 9040 78.6 4719 VISN9 76.3 3140 76 8270 VISN10 85.3 4543 88.1 5131 VISN11 76.4 3795 85.3 4857 VISN12 76.2 4719 88.1 5943 VISN15 80.4 2914 83.3 9948 VISN16 69 3913 73.9 8614 VISN17 69.8 2969 70.9 4674 VISN18 77.3 3456 80 7882 VISN19 82.5 3237 85.7 7503 VISN20 86.6 3290 83.2 5290 VISN21 85.4 4703 83.7 3780 VISN22 73.7 6285 87.2 1489 VISN23 84.5 2694 86.9 10903

Table 1.4.e. Getting Care Quickly
31
Reporting Level
Urban % Pos
Urban N
Rural % Pos
Rural N
National 76.1 17268 78.3 22262 VISN1 90.8 1209 83.9 935 VISN2 91.8 452 82.5 1063 VISN3 81.7 1310 84.4 267 VISN4 81.4 1149 90.4 1381 VISN5 77.1 435 78.1 354 VISN6 69.6 475 77 819 VISN7 75.9 855 75.4 1112 VISN8 78.8 1583 78.7 875 VISN9 75.4 638 73.3 1616 VISN10 75 827 84.6 902 VISN11 77 665 81.8 900 VISN12 77.7 849 87.5 963 VISN15 77 537 77.8 1708 VISN16 71.7 780 69.3 1551 VISN17 60.6 631 78.7 950 VISN18 74.7 735 72.4 1536 VISN19 73.9 699 79.8 1434 VISN20 82.7 738 76.7 1070 VISN21 83.9 980 79.8 735 VISN22 64.8 1234 80.6 301 VISN23 81.7 491 85.7 1796

Table 1.4.f. Getting Needed Care
32
Reporting Level Urban % Pos
Urban N
Rural % Pos
Rural N
National 80.1 24300 81.1 31890 VISN1 90 1770 88.4 1351 VISN2 91.4 664 86.1 1541 VISN3 84.6 1886 74.7 420 VISN4 85.2 1658 89.5 2051 VISN5 76.5 592 82 526 VISN6 72.3 656 76.4 1140 VISN7 74.6 1176 73.9 1564 VISN8 81.8 2348 77.9 1272 VISN9 80.9 816 78.4 2197 VISN10 82.7 1200 89.3 1411 VISN11 83.9 984 85.7 1323 VISN12 85.3 1226 84.7 1415 VISN15 74.7 714 84 2435 VISN16 72.4 1059 76.1 2156 VISN17 76.9 851 77.7 1310 VISN18 77.1 1009 80.8 2106 VISN19 76.5 942 82.8 2049 VISN20 81.9 938 84.7 1491 VISN21 85.4 1387 82.9 1078 VISN22 74.3 1759 82.4 411 VISN23 84.4 671 85.6 2649

Table 1.4.g. How Well Doctors/Nurses Communicate
33
Reporting Level Urban % Pos
Urban N
Rural % Pos
Rural N
National 91.6 71184 92.1 89669 VISN1 94.7 5661 95.4 4108 VISN2 93.3 1955 95.2 4194 VISN3 95.3 5910 95.3 1115 VISN4 93.7 5379 95.7 6035 VISN5 90.6 1730 96.4 1734 VISN6 89.5 1820 91.1 3287 VISN7 92.4 3229 90.3 4327 VISN8 92.3 6979 89.4 3544 VISN9 90.2 2470 91.2 6116 VISN10 92.6 3629 92.2 3665 VISN11 90.8 2854 93.6 3561 VISN12 92 3645 94.3 4228 VISN15 90.9 2228 91.6 6902 VISN16 89.6 2981 90.8 6377 VISN17 83.8 2251 90.6 3433 VISN18 89.9 2709 90.8 5690 VISN19 92.5 2663 93.6 5608 VISN20 92.6 2501 90.3 3929 VISN21 92.9 3863 93.3 2963 VISN22 90.2 4672 93.5 1119 VISN23 94.1 2057 94.7 7739

Section 4: Safe Care
Health Care-Associated Infections
The rates of health care-associated occurrences for ventilator associated pneumonia, central line blood stream infections and Methicillin Resistant Staph Aureus in VA hospitals were generally low. One of the most serious and preventable is pneumonia occurring in Veterans who require mechanical ventilation. The rates of ventilator-associated pneumonia in VA ranged from 0 to 14.8 per 1000 days of mechanical ventilation with pooled mean of 2.3 for medical/surgical intensive care units (ICUs). Thirty-five facilities had no ventilator associated pneumonias during FY09. By way of comparison, the Centers for Disease Control (CDC) reported for 2006-2008 a pooled mean rate of ventilator-associated pneumonia of 2.9 among medical/surgical major teaching ICUs with the 10th percentile of 0.0 and 90th percentile of 5.6.
34
13
Intravascular catheters are indispensable in modern-day medical practice, particularly in ICUs, but their use puts patients at risk for local and systemic infectious complications. The use of central lines (catheters that terminate at or close to the heart or in one of the great vessels) is particularly common in the ICU. The incidence of central line associated bloodstream infections varies considerably by type of catheter, frequency of catheter manipulation, and patient-related factors (e.g., underlying disease and acuity of illness). The rates for of central line associated bloodstream infections in VA hospitals were generally quite low ranging from 0 to 27.8 per 1000 days of line placement with a pooled mean of 1.8. Thirty-five facilities had no central line associated bloodstream infections. By way of comparison, the National Healthcare Safety Network (NHSN) indicates that infection rates in 2006-2008 from a select group of medical major teaching ICUs in private sector hospitals that self-report, range from a 10th percentile of 1.1 to a 90th percentile of 5.2 per 1000 line days (median = 2.3).13
Methicillin-Resistant Staphylococcus Aureus (MRSA). Healthcare-associated infections with MRSA can cause significant mortality and morbidity for hospitalized patients. After a successful demonstration project to reduce MRSA healthcare-associated infections at the VA Pittsburgh Healthcare System, VHA has undertaken an MRSA Prevention Initiative to reduce healthcare-associated infections with MRSA system-wide. This initiative includes performing active surveillance screening on persons admitted to hospital for acute medical care and during subsequent transfers and discharges, as appropriate, to identify patients who may be colonized with MRSA. Based on this initiative, VA is reporting health care-associated infection with MRSA in both the ICU and non-ICU acute care settings. Additionally, as a performance measure to assess compliance with active surveillance screening, data are collected on the number of opportunities for screening which are completed.
13 Edwards, J.R., Peterson, K.D., Mu, Y., et al. (2009). National Healthcare Safety Network (NHSN) report: Data summary for 2006 through 2008, issued December 2009. Am J Infect Control 37: 783-805.

From the time of full implementation of the MRSA Initiative in October 2007 through June 2009, monthly rates of MRSA health care-associated infections have decreased 76 percent in the ICU setting and have decreased 28 percent in the non-ICU acute care setting. The mean baseline rate for 2009 for ICU MRSA healthcare-associated infections was 0.6 infections/1,000 bed days of care, and for the non-ICU acute care setting, this rate was 0.35 infections/1,000 bed days of care. Twenty-six facilities had no cases of MRSA infections (including Acute Care and ICU). There are no similar nationwide data currently available against which VA can compare itself. Similarly, no nationwide data are available against which VA can compare itself for compliance with active surveillance screening in a program for MRSA Prevention.
Other
ICU Risk Adjusted Length of Stay. Although intensive hospital care is potentially life-saving, prolonged ICU care is expensive and may expose Veterans to complications such as healthcare associated infections. Thus, one measure of quality health care is to ensure a patient’s length of stay in the ICU is appropriate for the patient’s needs. To assist in tracking the appropriate length of treatment in the ICU, VHA calculates an Observed Minus Expected Length of Stay (OMELOS), which is a risk adjusted measure of appropriate ICU utilization that accounts for characteristics of the individual patient such as age, diagnoses, and laboratory values that determine need for more intensive treatment. An OMELOS less than 0 indicates that on average, Veterans in that ICU stay for a period that is shorter than what is expected based on their risk, while an OMELOS greater than 0 indicates the opposite. Values for OMELOS across the VHA system ranged from -1.60 to -1.49, with a facility mean of - 0.12.
Insulin Induced Hypoglycemia. The parameters for optimal glucose control have been studied in literature for several years. Recent studies in the critical care population identified severe hypoglycemia (low blood glucose) as a significant risk of intensive glucose control. The VA reports the proportion of patient days which include a measured blood glucose concentration <45mg/dl or <60mg/dl for Veterans receiving hypoglycemic agents. Only a small number of sites exceed the mean of 3.2 for <60mg/dl and 1.1 mean for <45mg/dl.
Hospital Acquired Pressure Ulcer Rate. Pressure ulcer prevention is an important patient safety goal. According to the Institute for Healthcare Improvement (IHI), 1 million people develop pressure ulcers annually, while approximately 60,000 acute care patients die from related complications. The Institute for Healthcare Improvement (IHI) recommends measurement of pressure ulcer incidence
35
as an outcome measure, using either 100 patient admissions or 1,000 patient days as the denominator. The IHI Mentor Hospital Registry lists hospital acquired pressure ulcer incidence rates ranging from 1.14 percent to 5.07 percent. When reviewing comparative data, it is important to ensure that the incidence rate is reviewed (many health care facilities use prevalence as a measure for hospital acquired pressure ulcers).14 14 http://www.ihi.org/IHI/Programs/Campaign/mentor_registry_pu.htm

Root Cause Analyses (RCAs)
Root Cause Analysis (RCAs), an important process for ensuring the delivery of safe care, involves identifying the basic or contributing causal factors to adverse events or close calls
36
15. RCAs have the following characteristics:
· The review is interdisciplinary in nature with involvement of those closest to the process.
· The analysis focuses primarily on systems and processes rather than individual performance.
· The analysis digs deeper by asking what and why until all aspects of the process are reviewed and all contributing factors are identified (progressing from looking at special causes to common causes).
· The analysis identifies changes that could be made in systems and processes through either redesign or development of new processes or systems that would improve performance and reduce the risk of event or close call recurrence.
Timely RCAs help assure that actions in response to adverse events and close calls are implemented rapidly. RCAs completed in ≤ 45 days is the percentage of RCA reports that were completed within the required 45-day analysis period, starting from the event aware date and ending on the date the facility director signs off on the completed RCA.Forty-five days for completion of an RCA is a Joint Commission standard for sentinel events and also a requirement included in the VHA Patient Safety Improvement Handbook. From FY06 to date great progress has been made in the timeliness of RCAs, even as the overall number of RCAs submitted has increased (Table 1.5). RCAs constitute only about 1.3 percent of all reported adverse events and close calls so an increase in RCAs does not necessarily represent an increase or decrease in adverse events or overall patient harm. Table 1.5: Root Cause Analysis Timeliness and Volume Trends, FY06-FY09
RCA Parameter FY06 FY07 FY08 FY09 Mean RCA Duration (Date Aware - Date Signed) 75 66 46 42 Percent RCAs Completed Within 45 Days 44.5 51.2 85.4 95.7 Percent RCAs Completed Within 46 to 90 Days 32.7 30.6 9.8 3.2 Percent RCAs Completed Within >90 Days 22.8 18.1 4.8 1.1 Total Number of RCAs Submitted 1024 1224 1472 1314
15 http://www.patientsafety.gov/glossary.html

Section 5: Timely Care
Access to Care
Wait times for Completed Appointments. This is a measure of the actual wait time looking back from the date the appointment is completed. During FY09, wait time for a “new” patient (defined as a patient not seen within the last 24 months at that facility for a specific type of clinical service) was measured as the number of days the patient waited on the electronic wait list to be given an appointment, or the number of days from the date the appointment was created until the date of the completed appointment, whichever number is greater. Wait times for “established” patients (all other patients) were measured as the number of days individual patients waited between the desired date for the appointment and the date of the completed appointment. In the event of an appointment being cancelled by the clinic, the wait time for the rescheduled appointment included all wait time for the cancelled appointment, added on to that of the rescheduled appointment. All facilities in FY09 reported greater than 90 percent of requested appointments were completed in 30 days or less for both primary and specialty care.
Section 6: Patient Centered Care
Beginning in FY09, the Survey of Healthcare Experiences of Patients (SHEP) began the two year transition from a proprietary survey with few available external benchmarks to a new public-domain survey instrument, the Consumer Assessment of Healthcare Providers and Systems (CAHPS). The CAHPS program (https://www.cahps.ahrq.gov/default.asp
37
) is a public-private initiative to develop standardized surveys of patient experiences with inpatient and outpatient care. Due to the administration of new surveys using CAHPS protocol, the results for FY09 cannot be compared with SHEP results from prior years.
We report FY09 hospital results for the CAHPS standardized composites and reporting measures (see list below). Composites are aggregation of two or more individual questions, and reporting measures are based on a single question.16
16 Further detail on the calculation of CAHPS composites is available in Description of Data Elements, Part 4 of this report.

38
Inpatient Composite and Reporting Measures
Outpatient Composite and Reporting Measures
· Overall Rating of Hospital · Communication with Nurses · Communication with Doctors · Communication about Medication · Nursing Services · Discharge Information · Pain Control · Cleanliness of the Hospital
Environment · Quietness of the Hospital Environment · Willingness to recommend Hospital
· Outpatient Satisfaction (Overall Rating of Healthcare)
· Getting Needed Care · Getting Care Quickly · How Well Doctors/Nurses
Communicate · Rating of Personal Doctor/Nurse
Composites and reporting scores are calculated as the weighted percentages of survey responses. Inpatient results use population weights to reflect the numbers of patients at each facility, bedsections and other categories such as age and gender. Also, inpatient scores exclude responses from Psychiatry bedsection. Outpatient results use population weights to reflect the numbers of patients at each facility or clinic and other categories such as age, gender and patient type (primary care new and established, non-primary care). Outpatient scores for Overall Rating of Healthcare, Getting Needed Care, and Getting Care Quickly reflects data collected from April 2009 through September 2009.17
The FY09 SHEP scores presented in this report include additional adjustments to account for a change in survey protocol to align the hospital CAHPS methodology to the requirements for public reporting on the CMS Hospital Compare Web site. This allows the results presented in this report to be compared to future updates.
Survey Sampling:
Outpatient Sampling - All patients who had received provider-based ambulatory care in a given month and who had not been selected for participation in a previous SHEP survey in the past 12 months were eligible. All sites providing such care were included. Samples of patients were drawn at each of these sites. At each site, a fixed number of patients were randomly selected from each of three pools—New Primary Care, Established Primary Care, and Specialty Care patients—in order to ensure sufficient representation of each of these three groups. In particular, 15 patients per group per site per month were sampled, for a total of 45 patients per site per month. (In cases where there were fewer than 15 patients per group to draw from, these numbers were adjusted, with the goal of still sampling 45 individuals per site.) A survey is mailed to selected patients early in the second calendar month following their outpatient visit. 17 Outpatient data collected between October 2008 and March 2009 were determined to be untrendable due to the presence of a “skip pattern” in the questionnaire that resulted in patients failing to complete a response for several key survey items

Inpatient Sampling - All patients who had received provider-based inpatient care in a given month and who had not been selected for participation in a previous SHEP survey in the past 12 months were eligible. All sites providing such care were included. Samples of patients were drawn at each of these sites. Sample sizes were customized for each site based on past performance, previous response rates, and the number of eligible patients at that particular site. A survey is mailed to selected patients early in the second calendar month following their discharge from inpatient care.
Survey Administration. SHEP employs a modified version of the methodology described by Dillman for the administration of mail surveys.
39
18 Veterans selected for the survey are sent a pre-survey notification letter explaining the nature and goals of the upcoming survey and encouraging the Veteran to participate. One week later the questionnaire is mailed to everyone in the sample. Thank you/reminder postcards are sent to the entire sample one week later. Data collection remains open for three weeks after the postcard is mailed.
Because the facility results provided in this report were unadjusted CAHPS scores, we caution conducting comparisons across hospitals. Self-reported patient satisfaction depends on both on patient expectation, the actual quality of the actual care received, and the perception of that quality relative to expectation. Important factors influencing perceptions of care include age, gender, education, and health status. Other non-patient factors that can affect hospitals scores include mode of administration (e.g., mail vs. telephone) and geographic region.
Although VA administers patient satisfaction surveys using standardized CAHPS surveys and administration protocol, external benchmarking of VA performance is also imperfect due to challenges of adjusting for differences in case-mix and other factors. In Tables 1.6 and 1.7, we provide the unadjusted VA national scores and the scores from the outpatient national CAHPS data base and the CMS Hospital Compare Web site. As mentioned previously, the inclusion of VA data in Hospital Compare will create adjusted scores for all VA hospitals and will permit a fair comparison of performance between VA and non-VA hospitals.
18 Dillman, D. A. Mail and telephone surveys: The total design method. New York: Wiley, 1978.

Table 1.6: Unadjusted CAHPS Comparisons (Outpatient)
40
Outpatient CAHPS Composites and Reporting Measures
VA FY09 Commercial1 2009
Medicare2 2009
Getting Needed Care 80 86 90 Getting Care Quickly 77 87 87 Doctor/Nurse Communication 92 94 94 Rating of Personal Dr/Nurse 66 63 74 Rating of Specialist 62 62 69 Rating of Overall Healthcare 57 48 57 1 Commercial results based on surveys collected from September 2008 thru June 2009; 405 health plans 2 Medicare survey data were collected from February 2009 thru June 2009; 405 health plans
Table 1.7: Unadjusted CAHPS Comparisons (Inpatient) Inpatient HCAHPS Composites and Reporting Measures
VA FY09 Hospital Compare1
Communication with Nurses 92 94 Communication with Doctors 92 95 Communication About Medications 77 78 Responsiveness of Hospital Staff 83 89 Cleanliness of Hospital Environment
91 90
Quietness of Hospital Environment 85 88 Pain Management 88 92 Discharge Information 81 81 Rating of Hospital 63 65 Willingness to Recommend 66 68 1 Results taken from CMS Hospital Compare website and based on surveys collected from June 08 to July 09
Section 7. Efficient Care
Ambulatory Care Sensitive Conditions Hospitalizations
Hospitalizations due to ambulatory care sensitive conditions (ACSCs) such as hypertension, CHF and pneumonia are believed to be potentially avoidable or preventable if ambulatory care is provided in a timely and effective manner. The Agency for Healthcare Research and Quality (AHRQ) and the Institute of Medicine have endorsed ACSC rates as Preventive Quality Indicators (PQI),19 furthermore, the Centers for Medicare and Medicaid Services (CMS) have conducted studies evaluating ACSC hospitalizations among Medicare Fee-for-Service Beneficiaries. The 12 ACSC Conditions that apply to Veterans are: 19 http://www.qualityindicators.ahrq.gov/
Adult Asthma Angina without Procedure Bacterial PneumoniaChronic Bronchitis Chronic Obstructive Pulmonary Disease (COPD) Congestive Heart Failure Dehydration Diabetes Mellitus Diabetes Mellitus Lower Limb Peripheral Vascular Disease Hypertension Perforated Appendix Urinary Tract Infection
All 12 ACSC Conditions: Hospitalizations per 1000 ACSC Patients: This is the rate of ACSC hospitalizations per 1000 unique ACSC patients during Fiscal Year 2009. A total of 130 ICD-9 diagnosis codes associated with the 12 ACSCs listed previously were used to identify all patients with any of the ACSCs (see code detail at http://www.qualityindicators.ahrq.gov/pqi_download.htm
41
) in any position in the inpatient, outpatient, and Fee/Contract files. Avoidable or ACSC hospitalizations were identified by matching these 130 ICD-9 codes to the principal diagnosis in the inpatient main files (certain CHF and pneumonia admissions are excluded according to AHRQ’s algorithm). ACSC patients and hospitalizations were then assigned to facilities by their assignment to an associated Primary Care Provider (PCP).
Congestive Heart Failure (CHF): Hospitalizations per 1000 CHF ACSC Patients: This is the rate of CHF ACSC hospitalizations per 1000 unique CHF ACSC patients during Fiscal Year 2009. A total of 25 ICD-9 diagnosis codes associated with the CHF ACSCs were used to identify all patients with any of the ACSCs (see code detail at http://www.qualityindicators.ahrq.gov/pqi_download.htm ) in any position in the inpatient, outpatient, and Fee/Contract files. Avoidable or ACSC hospitalizations were identified by matching these 25 ICD-9 codes to the principal diagnosis in the inpatient main files (certain CHF admissions are excluded according to AHRQ’s algorithm). CHF ACSC patients and hospitalizations were then assigned to facilities by their assignment to an associated Primary Care Provider (PCP).
Pneumonia: Hospitalizations per 1000 Pneumonia ACSC Patients: This is the rate of bacterial pneumonia ACSC hospitalizations per 1000 unique bacterial pneumonia ACSC patients during Fiscal Year 2009. A total of 12 ICD-9 diagnosis codes associated with the bacterial pneumonia ACSCs were used to identify all patients with any of the ACSCs (see code detail at http://www.qualityindicators.ahrq.gov/pqi_download.htm) in any position in the inpatient, outpatient, and Fee/Contract files. Avoidable or ACSC hospitalizations were identified by matching these 12 ICD-9 codes to the principal diagnosis in the inpatient main files (certain pneumonia admissions are excluded according to the AHRQ’s algorithm). Bacterial Pneumonia ACSC patients and hospitalizations were then assigned to facilities by their assignment to an associated Primary Care Provider (PCP).

Note: ACSC hospitalizations with “admission source” equal to “research” and all ACSC hospitalizations resulting in death are excluded from the count of hospitalizations in the reported ACSC rates.
When benchmarking to other organizations, it is important to understand the definition of population used in the denominator. For many organizations, calculating the population (i.e. Heart Failure, Pneumonia, etc.) is difficult, if not impossible and, therefore, they will frequently utilize the total population in the denominator. The use of the total population in the denominator will produce lower hospitalization rates than those included in the VHA analysis. Additionally, the lack of Medicare, Medicaid, and/or Private Insurance diagnosis and hospitalization data (numerator and denominator) may not provide an accurate accounting of ACSC rates in patients who may rely on both VHA and Medicare for their healthcare.
Results
All 12 Ambulatory Care Sensitive Conditions (ACSC): VHA provided health care to 5,447,889 unique patients in Fiscal Year 2009. Of these patients, 57 percent (3,101,457) were identified as having one or more of the 12 ACSC conditions. Hospitalizations in the ACSC population represented 14 percent (95,507 of 693,483) of the total hospital admissions to a VA or Non-VA facility. The average number of ACSC admissions was 687 with a range of 73 to 2,391. The system-wide rate of ACSC Admissions per 1,000 ACSC Patients was 30.8. Hospitalization rates for the 139 individual VHA facilities varied substantially with a range of 7.8 to 71.2; however, reported rates are not risk-adjusted. When VHA data were adjusted for patient risk and other variables, 47 percent (66 of 139) of VHA facilities were found to have higher than expected ACSC admission rates and 53 percent (73 of 139) lower than expected rates.
Geographic variation in raw VISN rates also exists, with the highest rate around 37.0 in the South Central and Midwest parts of the country, where VISN 9 and VISN 15 facilities are located, and the lowest rates of 21.4 and 24.4 in the West North Central (VISN 23) and New England States (VISN 1) respectively.
Congestive Heart Failure (CHF): 4 percent of VHA patients (212,293 of 5,447,889) were identified as having a Congestive Heart Failure (CHF) condition. Hospitalizations in the CHF population represented 4 percent (25,024 of 693,483) of the total hospital admissions to a VA or Non-VA facility. The average number of CHF admissions was 180 with a range of 16 to 776. The system-wide rate of CHF Admissions per 1,000 CHF patients was 117.9. Hospitalization rates for the 139 individual VHA facilities varied greatly from 21.0 to 334.2; however, reported rates are not adjusted for patient factors that may influence risk of admission. When VHA data were adjusted for patient risk and other variables, 47 percent (66 of 139) of VHA facilities were found to have higher than expected CHF admission rates and 53 percent (73 of 139) lower than expected rates.
42

Geographic variation in raw VISN rates exists with the highest rate of 160.3 in the South Atlantic part of the country (VISN 5) and the lowest rate of 72.5 in the West North Central (VISN 23).
Pneumonia: 1.3 percent of Veterans (72,799 of 5,447,889) were identified with a Pneumonia condition. Hospitalizations in the Pneumonia population represented 2.7percent (18,459 of 693,483) of the total hospital admissions to a VA or Non-VA facility (FY09). The average number of Pneumonia admissions was 133 with a range of 13 to 392. The system-wide rate of Pneumonia Admissions per 1,000 Pneumonia patients was 253.6. Hospitalization rates for the 139 individual VHA facilities varied greatly from 103.4 to 479.2; however, reported rates are adjusted for patient factors that may influence risk of admission. When VHA data were adjusted for patient risk and other variables, 53.2 percent (74 of 139) of VHA facilities were found to have higher than expected Pneumonia admission rates and 46.8 percent (65 of 139) lower than expected rates.
Geographic variation in raw VISN rates exists, with the highest rate of 301.0 in the Mid-Atlantic States (VISN 3), and the lowest rate of 208.8 in the Northwestern states (VISN 20).
Conclusions
VHA has been an early adopter of performance measurement and improvement within an integrated health system. As a publicly funded health care system, VHA has a special responsibility to maintain the trust of the Veterans we serve and the public at large through reporting and transparency. With this report, VHA sets a new standard in reporting quality measures reflecting the structure, processes and outcomes of care. We are not aware of any U.S. health care system that reports similarly detailed information at the facility level.
The data presented in this report show that overall, VHA has made great strides in improving the quality and safety of its health care services, and compares quite favorably to available external benchmarks. Nonetheless, the report identifies continued challenges, including persistent variation in performance by region and facility, and continued disparities in the quality of care received by important groups of patients including women and African-American Veterans. VHA is strongly committed to reversing these trends. The challenges of regional variation in quality and disparity by gender, race, and ethnicity are persistent problems in the larger U.S. health system as well.
43
20 VHA has been in the forefront of documenting the existence of racial disparities in health care, understanding the mechanisms producing these disparities
20 AHRQ, 2009 National Healthcare Quality and Disparity Reports, http://www.ahrq.gov/qual/qrdr09.htm

and developing interventions to reduce disparities,
44
21 including the work of the Center for Health Equity Research and Promotion (CHERP), established in 2001.
VHA continues to expand the scope of quality and performance measurement, and to use those findings to identify areas for continued improvement. VHA’s relentless commitment to self-examination and improvement is critical to meeting our mission, which is to serve and honor the men and women who are America’s Veterans.
21 Department of Veterans Affairs, Racial and Ethnic Disparities in the VA Healthcare System, www.hsrd.research.va.gov/publications/esp/RacialDisparities-2007.pdf

Part 2: Adverse Event and Close Call Reporting in the Veterans Health Administration FY06 to FY09
Introduction
In 1999, the VA National Center for Patient Safety (NCPS) was established to lead the effort to improve the safety of patients cared for in the VA health system. One of the mechanisms that NCPS employs is the collection of reports of adverse events and close calls occurring at VA Medical Centers (VAMCs). Every year since 1999, the number of reports to NCPS has increased, with nearly 400,000 being received during Fiscal Years (FY) 2006 to 2009. Most of the reports document events that caused little or no harm to patients, but may be used to identify and elucidate the same problems that sometimes cause serious harm to patients.
Much of VA’s patient safety program has focused on performing in-depth local reviews of individual adverse events through the root cause analysis (RCA) process, or in-depth local reviews of sets of adverse events and close calls on a single major category through aggregated reviews (ARs) and then utilizing this information to guide actions that will prevent harm to our patients in the future. NCPS staff has sorted RCAs as occurring in over 50 different categories, while ARs have been confined to almost entirely the four categories (falls, medications, missing patients, and suicide-related behaviors) identified at the outset of the program as occurring frequently. For FY06 to FY09, about 1.3 percent of all reports were the subject of dedicated single-case RCAs and about 70 percent of reports were in the four areas referenced above, with falls constituting about 43 percent of all reports. The five most frequent topics of RCAs were falls, delay in treatment/diagnosis/surgery (inpatient), “high alert” adverse drug events, unexpected death (Other Than Suicide), and outpatient suicide. In the period from FY06 to FY09, there was a large increase in the number of reports related to suicide and suicide attempts, with the number of RCAs on outpatient suicides going from 36 in FY06 to 138 in FY08, and the number of reports of suicide-related incidents (includingattempts and gestures) submitted for potential AR going from 2,910 in FY06 to 6,489 in FY08. During this time, many other organizations in VHA in addition to NCPS and local patient safety programs were increasing their work on suicide prevention, with NCPS’s efforts focusing especially on eliminating vulnerabilities to suicide in the inpatient environment of care. In FY09, the VHA Office of Patient Care Services Mental Health Group and the suicide prevention coordinators working with them at the VAMC level took on increasing and primary responsibilities in the area of suicide prevention.
Prior to an RCA being conducted, each incident to be reported is scored on a scale from 1 to 3 using the “safety assessment code” (SAC) developed by NCPS, with events scored 3, being the most harmful or potentially harmful. Overall, 44 percent of RCAs were scored as 3 and 56 percent scored 1 or 2, but the ratios within different categories varied widely. For example, there were slightly more hospital-acquired infections scored 3 than 1 or 2 combined, but for RCAs on missing patients there were more than 10 RCAs scored 1 or 2 for every RCA scored 3. Each RCA contains one or more
45

actions that must be implemented to try to prevent the occurrence or recurrence of similar events. The mean number of actions designed to reduce or prevent the likelihood of similar future events per RCA is about three. Patient safety staff at the VAMC is required to report back to NCPS regarding the effectiveness of RCA actions. Overall, 84 percent of actions were rated as having made the situation better, 15.7 percent rated as about the same, and 0.3 percent rated as worse. This data, while clearly having the weakness of being self-reported, suggests that the core imperative to “do no harm” is likely being met as VAMC staff work to improve patient safety.
The categories of RCAs reported vary widely by health care setting. For example, the most frequent category of RCA in long-term care settings is falls, while for OR, ER, and ICU settings the most frequent is the category of “delay in treatment/diagnosis/ surgery." The frequency of reports in the latter category suggests that further study of this group of RCAs is needed, and that it may be appropriate to subdivide this category into more specific subcategories. The work of other VHA groups studying tort claims related to misdiagnosis and related topics may be helpful in this effort. Preliminary NCPS work in this category has already begun with an "RCA Topic Summary" recently being completed on this topic. RCA Topic Summaries have been prepared on 33 different topics ranging from adverse events related to anticoagulation therapy, to home fires associated with oxygen use, to cleaning and sterilization of surgical instruments.
The Joint Commission and VHA both require that RCAs be completed within 45 days, and NCPS tracks RCA timeliness. Working with the Office of the Deputy Under Secretary for Health for Operations and Management to provide performance data to VAMC leaders, the rate of on-time RCAs went from 45 percent in FY06 to 96 percent in FY09. RCAs submitted after more than 90 days has gone from 23 percent in FY06 to 1.1 percent in FY09. In addition to tracking the timeliness of RCAs, NCPS staff assesses the quality of RCAs in terms of the actions contained in the RCAs, and their connections to quantifiable action measures and management concurrence. Data from FY06 to FY09 has shown steady improvement in this aspect of RCA quality.
The number of RCAs completed at VHA facilities and reported to NCPS, although small in comparison to the total number of incidents reported, is greater than the number submitted to some other organizations, and should be understood in context. For example, The Joint Commission, which collects data on “sentinel events” only, received approximately 3,000 RCAs for the period from FY06 to FY08. The state of Minnesota received less than 800 reports for the five-year period from FY03 to FY08; it confines reporting of adverse events to occurrences of 28 types of serious reportable events (sometimes called “Never” events). Pennsylvania has cast a wider net, and has made some reporting mandatory; it received reports of 8,645 “Serious Events” and 211,229 “Incidents” for FY08. These three non-VA cases suggest that when the topics and criteria for reporting are strictly limited, then there will be few reports submitted, and when topics are unconstrained and there is a mandate for reporting, then many reports will be submitted. The correlation between the number of reports submitted to a health care facility or system and the facility’s or system’s safety has not been established and should not be assumed to be related (directly or inversely) to the number of events or RCAs reported.
46

VHA has encouraged reporting not for the sake of accumulating reports, but primarily for identifying problems that need to be addressed at the local level, and in some cases nationally through responses such as patient safety alerts, new purchasing decisions, and new practices or policies. The data presented in this report for FY06 to FY09 suggest that facility-level VHA staff believe that the actions they have designed and implemented as part of the RCAs performed in response to adverse events and close calls have been effective. The data compiled by NCPS also shows reporting continuing to increase, timeliness of RCAs improving, and the assessed quality of RCAs submitted by VAMCs increasing.
Section 1: Overview and Event Types and Locations Associated with Root Cause Analyses Submitted FY06 to FY09
To improve patient safety within the VA health care system – a system that provides comprehensive health care services to about 6 million Veterans across the United States through over 150 VA Medical Centers (VAMCs) within 21 geographically defined integrated service networks – in 1999, the VA established the National Center for Patient Safety (NCPS). To allow facility, network and VHA-wide learning about adverse events, NCPS developed a standardized method for “root cause analysis” (RCA) of adverse events and close calls. Each VAMC supports a full-time patient safety manager that is responsible for implementing the patient safety program, a major focus of which is performing RCAs.
NCPS defines adverse events as “untoward incidents, therapeutic misadventures, iatrogenic injuries or other adverse occurrences directly associated with care or services provided within the jurisdiction of a medical center, outpatient clinic or other facility.” Adverse events may result from acts of commission or omission (e.g., administration of the wrong medication, failure to make a timely diagnosis or institute the appropriate therapeutic intervention, adverse reactions or negative outcomes of treatment, etc.).
Adverse events and close calls reported to NCPS are termed “safety reports,” and are scored by the facility patient safety manager along two scales: Harm (from catastrophic to minor) and Probability (from frequent to remote). Each event is coded both for the actual harm caused, and the potential harm that could have been caused. Harm and probability are combined to get a score from 1 to 3 called the safety assessment code (SAC). Safety reports receiving the highest priority score of 3 on the SAC (“SAC 3s”) must be reviewed using the RCA process. Events scoring 1 or 2 may also be the subject of an RCA, at the discretion of facility management. RCAs may be performed on actual adverse events (those that cause harm) or on “close calls” (also known as “near misses”) where harm was avoided. More information is available in the VHA “National Patient Safety Improvement Handbook” (see: http://www1.va.gov/VHAPUBLICATIONS/ViewPublication.asp?pub_ID=1695
47
). An RCA includes an initial summary of the event, a final understanding of the event, including contributing factors and causes identified by the RCA team, and a specific action plan for addressing the causes. Each action plan is specified, with a timeline for implementation together with a description of how, when and by what parties the

accomplishment of the corrective actions will be evaluated; all RCAs are signed by the director of the facility from which the RCA was submitted. RCAs are conducted by interdisciplinary facility teams organized by the VAMC’s patient safety manager. A recent NCPS analysis of the membership of RCA teams indicated that nurses were present on at least 80 percent of RCA teams, physicians - at least 35 percent, pharmacists – at least 22 percent, and social workers and mental health professionals – at least 22 percent.
Single case RCA reports are submitted to the NCPS throughout the year as they occur, while Aggregate Reviews (ARs) of four types of events (adverse drug events, falls, missing patients, and suicidal behaviors) have been submitted each year, one per quarter, for events in these four areas that score 1 or 2 on the SAC matrix. ARs may cover a few or a few dozen adverse events or close calls, and allow for the review team to look for recurring problems at the VAMC level. Table 2.1 provides a summary of the total number of adverse events and close calls reported for FY06 to FY09. Overall, of 389,398 reports, 70.1 percent were on one of the four AR topics, and 1.3 percent was the subject of dedicated RCAs. Of the 5,037 adverse events and close calls that were the subject of RCAs, only about a third (1,741 or 34.6 percent) were for events with an actual SAC score of 3. The large majority of RCAs (3,296 or 65.6 percent) were performed on events with actual SAC scores of 1 or 2. Table 2.1. All Reports of Adverse Events and Close Calls, FY06 to FY09
48
FY06 FY07 FY08 FY09 TOTAL 1,024 1,224 1,473 1,316 5,037 RCAs 1.3% 1.4% 1.4% 1.2% 1.3% 20,038 25,214 30,682 35,273 111,207 Safety Reports 25.0% 28.1% 28.3% 31.8% 28.6% 59,220 63,256 76,266 74,412 273,154
Safety Reports on Any of Four Aggregated Review Topics 73.8% 70.5% 70.3% 67.0% 70.1% TOTAL 80,282 89,694 108,421 111,001 389,398
The safety assessment code (SAC) scores for the adverse events and close calls reported from FY06 to FY09 are shown in Table 2.2. The approximately 600 events that received a SAC score of 3 but were not the subject of individual RCAs were included in ARs.

Table 2.2. Safety Assessment Code (SAC) Scores for All Reports of Adverse Events and Close Calls, FY06 to FY09
49
SAC Score FY06 FY07 FY08 FY09 TOTAL 72,177 79,426 96,257 99,042 346,902
1 89.9% 88.6% 88.8% 89.2% 89.1% 7,630 9,763 11,404 11,348 40,145
2 9.5% 10.9% 10.5% 10.2% 10.3% 475 505 760 611 2,351
3 0.6% 0.6% 0.7% 0.6% 0.6% TOTAL 80,282 89,694 108,421 111,001 389,398
When an RCA is submitted to NCPS, it is coded into one of over 50 categories by an analyst according to several criteria, including the event type and the activity or process associated with the event. Major event types have been defined since 2000 according to the NCPS primary analysis and categorization (PAC) glossary and have been used to code all RCAs. A single event may be coded under more than one PAC event type, so the event types should not be understood as constituting a true taxonomy of mutually exclusive events types. Approximately 20 percent of RCAs are coded with two or more categories. For example, a single RCA might be coded both for “Delay in Treatment/Diagnosis/ Surgery” as well as for “Communication of Abnormal Result.” The PAC codes were designed to be useful for follow-up at the national, network, and local level. When a facility patient safety manager or network patient safety officer, or a member of the NCPS staff is working to understand the causes of a type of adverse event, or the actions that have been implemented at VAMCs in the past to try to prevent adverse events in that category, the PAC categories facilitate the rapid identification of RCAs previously submitted in a particular category.
Summary VHA-wide data on the PAC codes most frequently assigned to RCAs is provided below in Table 2.3. In the period from FY06 to FY08 there was a large increase in the number of reports related to suicide and suicide attempts, with the number of RCAs on outpatient suicides going from 36 in FY06 to 138 in FY08, and the number of reports of suicide-related incidents (includes attempts and gestures) submitted for potential AR going from 2,910 to 6,489.* During this time, many other organizations in the VHA in addition to NCPS and local patient safety programs were increasing the attention on suicide prevention, with NCPS’s efforts focusing especially on eliminating vulnerabilities to suicide in the inpatient environment of care. In FY09, the VHA Office of Patient Care Services Mental Health Group and the suicide prevention coordinators working with them at the VAMC level took on increasing and primary responsibilities in the area of suicide prevention, including receiving the majority of event reports related to suicidal behaviors and outpatient suicides.
* Not all outpatient suicides are the subject of RCAs, so the numbers in Table 2.3 (36, 84, 132, and 125) should not be misunderstood as representing the number of VA outpatient suicides in FY06 to FY09. Thus, these cited numbers (2910 to 6489) are not reflected in Table 2.3.

Table 2.14 provides a glossary of the definitions of the PAC categories used in Tables 2.3 through 2.13. The definitions for the 25 PAC categories appearing in Tables 2.3 to 2.13 are provided. Table 2.3. Ten PAC Codes Most Frequently Assigned to RCAs
50
PAC Code FY06 FY07 FY08 FY09 TOTAL Fall 152 191 197 161 701 Delay in Treatment/Diagnosis/Surgery (Inpatient) 138 157 168 134 597 High Alert ADEs 95 118 102 85 400 Unexpected Death (Other Than Suicide) 61 83 148 93 385 Outpatient Suicide 36 84 138 125 383 Misidentification 65 68 88 90 311 Missing Patient 59 67 95 84 305 Communication of Abnormal Results 27 44 61 67 199 Hospital Acquired Infections 40 41 51 41 173 Inpatient Para-Suicide 28 32 55 39 154 All Other Events (47 TOTAL) 534 604 612 526 2276 Total (FY06 to FY09) 1,235 1,489 1,715 1,445 5,884
The information in Tables 2.3 through 2.13 are drawn from the PAC codes for all individual RCAs submitted from FY06 through FY09 (5,037), and 5,884 PAC codes associated with those RCAs (RCA cases may have multiple PAC codes).
Table 2.4 provides information on the SAC scores associated with the RCAs summarized in Table 2.3. It is clear from the variation in SAC scores that the locally-assessed severity and likelihood of recurrence of events associated with different types of events varies, i.e., that some reported event types, when receiving single case RCAs, tend to have higher SAC scores than others.

Table 2.4. SAC Scores for RCAs Associated With the Ten PAC Codes Most Frequently Assigned to RCAs (FY06 to FY09)
51
PAC Code
SAC score of 1 or 2 - N
SAC score of 1 or 2 - %
SAC score
of 3 - n
SAC score of 3 -
%
Total Event
Codes - n Fall 271 38.7% 430 61.3% 701 Delay in Treatment/Diagnosis/Surgery (Inpatient) 413 69.2% 184 30.8% 597 High Alert ADEs 294 73.5% 106 26.5% 400
Unexpected Death (Other Than Suicide) 49 12.7% 336 87.3% 385 Outpatient Suicide 16 4.2% 367 95.8% 383 Misidentification 288 92.6% 23 7.4% 311 Missing Patient 279 91.5% 26 8.5% 305 Communication of Abnormal Results 165 82.9% 34 17.1% 199 Hospital Acquired Infections 85 49.1% 88 50.9% 173 Inpatient Para-Suicide 150 97.4% 4 2.6% 154 Total 2,010 55.7% 1,598 44.3% 3,608
As stated above, RCAs include action plans, and part of the local follow-up on each RCA is to report back to NCPS after implementation of the actions to provide an assessment or perception of the effectiveness of the actions. Table 2.5 provides the number of actions associated with the RCAs associated with the data in Table 2.3, as well as effectiveness data reported by the submitting facility. This data, while clearly having the weakness of being self-reported, suggests that the core imperative to “do no harm” is likely being met as VAMC staff work to improve patient safety.
RCAs constitute about 1.3 percent of all adverse events and close calls reported in VHA. Overall, these counts of PAC event codings provide data on the individual adverse events that were studied in most depth by VAMCs. Approximately 43 percent of all events reported to NCPS were falls, and virtually all of these were included in an AR or the subject of an individual RCA. Those adverse events and close calls that were not the subject of an individual RCA or included in an AR were not reviewed in-depth at the VAMC level by an official VHA patient safety process, but may have received an informal ad hoc or other type of review at the facility or network level.

Table 2.5. Actions Associated With RCAs: Quantity and Effectiveness (FY06 to FY09) The data below are counts of PAC codes for all reports that were submitted of adverse events and close calls and which VAMC staff selected to receive RCA — these counts do not represent the number of adverse events that occurred, or the adverse events that most frequently occurred.
52
Event Count
Worsen
Worse%
Same n
Same%
Better n
Better%
Total Actions
Fall 701 10 0.5% 381 19.5% 1,563 80.0% 1,954
Delay in Treatment/Diagnosis/ Surgery (Inpatient) 597 3 0.1% 263 13.1% 1,741 86.7% 2,007 High Alert ADEs 400 6 0.5% 194 15.8% 1,029 83.7% 1,229
Unexpected Death (Other Than Suicide) 385 3 0.2% 242 16.3% 1,241 83.5% 1,486 Outpatient Suicide 383 4 0.3% 218 17.8% 1,003 81.9% 1,225 Misidentification 311 1 0.1% 150 13.5% 958 86.4% 1,109 Missing Patient 305 2 0.2% 165 14.2% 998 85.7% 1,165 Communication of Abnormal Results 199 2 0.4% 73 15.6% 393 84.0% 468 Hospital Acquired Infections 173 2 0.3% 74 12.4% 519 87.2% 595 Inpatient Para-Suicide 154 2 0.3% 95 15.6% 512 84.1% 609 Total 3,608 35 0.3% 1,855 15.7% 9,957 84.0% 11,847
For the events that were not studied in-depth using RCA or AR, NCPS received a brief summary of the initial understanding of the event (a safety report) and other basic facts such as the date of the event. These reports are not PAC coded by NCPS staff. In an attempt to better understand the categories of events reported via safety reports only, NCPS personnel randomly selected 2,000 of the 75,913 safety reports received from FY06 to FY08 and used natural language processing software to categorize them based on the way the RCAs had been categorized by NCPS staff, i.e., the software coded the safety reports based on the way experienced people coded the RCAs. Only the categories shown in Table 2.4 that were not also categories associated with ARs were categorized with the software. The findings were as follows: Delay in treatment/diagnosis/surgery was a PAC category associated with 9.5 percent of the safety reports, misidentification was associated with 3.8 percent, communication of abnormal result was associated with 3.1 percent, and hospital-acquired infection was associated with 2.1 percent. This method, if extrapolated, suggests that approximately 14,000 of the 75,913 safety reports received from FY06 to FY08 were relevant to these four categories. Section 4 of this report contains more information on the number of events that were reported but not the subject of single-case RCAs.
Primary Analysis and Categorization (PAC) Data by Setting and VISN
The following eight tables provide the PAC codes most frequently assigned to events coded as associated with different care settings or locations. Tables 2.6 through 2.11

primarily pertain to VHA inpatient care settings. Tables 12 and 13 pertain to other care settings. The categories of RCAs reported vary widely by health care setting. For example, the most frequent category of RCA in long-term care settings is falls (see Table 2.7), while for OR, ER, and ICU settings the most frequent is the category of “delay in treatment/diagnosis/ surgery" (see Tables 2.8 to 2.10). The frequency of reports in this wide-ranging category suggests that further study of this group of RCAs is needed, and that it may be appropriate to subdivide this category into more specific subcategories. The work of other VHA groups studying tort claims related to misdiagnosis and related topics may be helpful in this effort. Preliminary NCPS work in this area has already begun, with an "RCA topic summary" recently being completed on this topic. RCA topic summaries have been prepared on 33 different topics ranging from adverse events related to anticoagulation therapy, to home fires associated with oxygen use, to cleaning and sterilization of surgical instruments. RCA topic summaries are available to all VA staff via the NCPS intranet site. Summary data on the PAC codes most frequently assigned to RCAs from all 21 VISNs is provided in Tables 2.15 to 2.19. The listing of the 10 most frequently assigned PAC codes in these tables is based on the list in Table 2.3 rather than the 10 most frequently assigned PAC codes for each VISN or for each year. Table 2.6. Ten PAC Codes Most Frequently Assigned to RCAs Coded as Associated With Any and All Inpatient Hospital Care Settings The data below are counts of PAC codes for all reports that were submitted of adverse events and close calls and which VAMC staff selected to receive RCA — these counts do not represent the number of adverse events that occurred, or the adverse events that most frequently occurred.
53
FY06 FY07 FY08 FY09 TOTAL Fall 147 180 178 144 649 Delay in Treatment/Diagnosis/Surgery (Inpatient) 138 157 168 134 597 Unexpected Death (Other Than Suicide) 56 76 126 77 335 High Alert ADEs 73 95 74 61 303 Missing Patient 56 62 80 68 266 Misidentification 50 55 71 74 250 Communication of Abnormal Results 25 31 47 57 160 Hospital Acquired Infections 37 38 49 35 159 Inpatient Para-Suicide 25 32 53 39 149 Retained Objects During Surgeries/Procedures 26 37 17 28 108 All Other Events (45 TOTAL) 417 437 417 338 1609 1,050 1,200 1,280 1,055 4,585
Table 2.7. Ten PAC Codes Most Frequently Assigned to RCAs Coded as Associated With a Long-Term Care Setting (e.g., community living center, nursing home, skilled-care facility, foster care, hospice, Alzheimer’s, geriatric, palliative,

extended, geriatric extended care unit, life support/ventilator unit, transitional care unit, respite care, etc.) The data below are counts of PAC codes for all reports that were submitted of adverse events and close calls and which VAMC staff selected to receive RCA — these counts do not represent the number of adverse events that occurred, or the adverse events that most frequently occurred.
54
FY06 FY07 FY08 FY09 TOTAL Fall 55 49 64 38 206 Unexpected Death (Other Than Suicide) 6 8 14 11 39 Missing Patient 9 11 12 6 38 Delay in Treatment/Diagnosis/Surgery (Inpatient) 13 9 8 7 37 High Alert ADEs 9 11 7 7 34 Assault 6 7 5 1 19 Hospital Acquired Infections 6 3 4 5 18 Fire 6 2 2 4 14 Other - ADL-Activities of Daily Life 2 6 5 1 14 Misidentification 5 3 2 3 13 All Other Events (27 TOTAL) 24 16 34 18 92
141 125 157 101 524
Table 2.8. Ten PAC Codes Most Frequently Assigned to RCAs Coded as Associated with an Operating Room Setting (considered inpatient unless “same day surgery” or “outpatient surgery” is mentioned - then event is double coded with outpatient) The data below are counts of PAC codes for all reports that were submitted of adverse events and close calls and which VAMC staff selected to receive RCA — these counts do not represent the number of adverse events that occurred, or the adverse events that most frequently occurred.
FY06 FY07 FY08 FY09 TOTAL Delay in Treatment/Diagnosis/Surgery (Inpatient) 16 24 29 24 93
Retained Objects During Surgeries/Procedures 22 21 19 20 82 Incorrect Surgery 26 17 13 17 73 Other - Surgeries 25 18 11 8 62 Unexpected Death (Other Than Suicide) 9 11 27 12 59 Hospital Acquired Infections 11 5 17 10 43 Other - Medical Device 10 11 3 8 32 Misidentification 7 5 8 6 26 Other - Supply Service Activities 4 5 2 4 15 Fire 7 1 4 2 14 All Other Events (24 TOTAL) 31 23 24 25 103
168 141 157 136 602

Table 2.9. Ten PAC Codes Most Frequently Assigned to RCAs Coded as Associated With an Emergency Room or Urgent Care Setting The data below are counts of PAC codes for all reports that were submitted of adverse events and close calls and which VAMC staff selected to receive RCA — these counts do not represent the number of adverse events that occurred, or the adverse events that most frequently occurred.
55
FY06 FY07 FY08 FY09 TOTAL Delay in Treatment/Diagnosis/Surgery (Inpatient) 22 17 21 15 75 Missing Patient 8 14 18 16 56 Misidentification 7 5 9 11 32 Unexpected Death (Other Than Suicide) 5 8 9 6 28 Inpatient Para-Suicide 4 8 7 5 24 High Alert ADEs 5 4 4 3 16 Assault 1 3 5 4 13 Outpatient Para-Suicide 2 3 3 4 12 Communication of Abnormal Results 2 2 3 3 10 Fall 2 2 2 4 10 All Other Events (28 TOTAL) 12 15 23 25 75 70 81 104 96 351
Table 2.10. Ten PAC Codes Most Frequently Assigned to RCAs Coded as Associated With an Intensive Care Unit or Similar Setting The data below are counts of PAC codes for all reports that were submitted of adverse events and close calls and which VAMC staff selected to receive RCA — these counts do not represent the number of adverse events that occurred, or the adverse events that most frequently occurred.
FY06 FY07 FY08 FY09 TOTAL Delay in Treatment/Diagnosis/Surgery (Inpatient) 25 27 21 11 84 Unexpected Death (Other Than Suicide) 14 15 18 13 60 High Alert ADEs 6 11 9 4 30 Hospital Acquired Infections 10 7 8 4 29 Fall 6 6 5 5 22 Other - Medical Device 3 9 3 5 20 Intubations 5 5 6 1 17 Misidentification 3 3 6 4 16 Communication of Abnormal Results 2 3 5 5 15 IV Pump/PCA Pump 2 3 7 3 15 All Other Events (30 TOTAL) 33 35 24 12 104 109 124 112 67 412

Table 2.11. Ten PAC Codes Most Frequently Assigned to RCAs Coded as Associated with an Area Designated for Psychiatric Treatment/Assessment (i.e. psychiatric ward, locked areas, seclusion rooms, behavioral health units, etc.) The data below are counts of PAC codes for all reports that were submitted of adverse events and close calls and which VAMC staff selected to receive RCA — these counts do not represent the number of adverse events that occurred, or the adverse events that most frequently occurred.
56
FY06 FY07 FY08 FY09 TOTAL Inpatient Para-Suicide 11 15 29 18 73 Missing Patient 18 14 22 17 71 Assault 8 13 11 4 36 Fall 4 8 14 6 32 Delay in Treatment/Diagnosis/Surgery (Inpatient) 2 4 6 4 16 High Alert ADEs 4 6 1 3 14 Unexpected Death (Other Than Suicide) 2 3 6 3 14 Alcohol/Substance Abuse 3 4 2 4 13 Inpatient Suicide 3 2 4 3 12 Outpatient Para-Suicide 1 3 2 5 11 All Other Events (23 TOTAL) 14 29 15 11 69 70 101 112 78 361
Table 2.12. Ten PAC Codes Most Frequently Assigned to RCAs Coded as Associated with Outpatient Care Provided in a VHA Facility (patients not admitted for traditional overnight care) The data below are counts of PAC codes for all reports that were submitted of adverse events and close calls and which VAMC staff selected to receive RCA — these counts do not represent the number of adverse events that occurred, or the adverse events that most frequently occurred.
FY06 FY07 FY08 FY09 TOTAL Delay in Treatment/Diagnosis/Surgery (Outpatient) 25 33 39 30 127 High Alert ADEs 21 18 20 15 74 Misidentification 15 14 16 13 58 Communication of Abnormal Results 3 15 13 10 41 Missing Patient 6 4 11 11 32 Fall 8 7 6 8 29 Unexpected Death (Other Than Suicide) 6 6 9 7 28 Other - Medication Use Process 4 3 7 10 24 Incorrect Surgery 10 1 6 5 22 Outpatient Para-Suicide 4 3 8 6 21 All Other Events (36 TOTAL) 36 58 38 43 175 138 162 173 158 631

Table 2.13. Ten PAC Codes Most Frequently Assigned to RCAs Coded as Associated With the Home or a Similar Environment Outside of a Health Care Facility The data below are counts of PAC codes for all reports that were submitted of adverse events and close calls and which VAMC staff selected to receive RCA — these counts do not represent the number of adverse events that occurred, or the adverse events that most frequently occurred.
57
FY06 FY07 FY08 FY09 TOTAL Outpatient Suicide 29 71 131 115 346 Outpatient Para-Suicide 7 11 33 31 82 Oxygen 7 17 18 12 54 Fire 7 17 17 11 52 High Alert ADEs 4 5 12 9 30 Unexpected Death (Other Than Suicide) 0 2 15 9 26 Fall 0 5 12 8 25 Pain Management 2 3 8 8 21 Delay in Treatment/Diagnosis/Surgery (Other) 3 0 11 2 16 Missing Patient 2 5 4 5 16 All Other Events (21 TOTAL) 18 16 23 25 82 79 152 284 235 750

Table 2.14. PAC Glossary Descriptions of the PAC Codes Listed in Tables 2.3 Through 2.13
58
Glossary of PAC Categories Appearing in Lists of PAC Categories Most Frequently Coded for RCAs Submitted for FY06 to FY09 Alcohol/Substance Abuse Explicit mention of, or reference to, the patient’s misuse/abuse of
alcohol and/or drugs in a VHA facility or on facility grounds, or specific/implied indication of substance contraband.
Assault Explicit mention of, or reference to, patient-on-patient, or patient-on-staff altercation.
Communication of Abnormal Results
Explicit mention of, or reference to, the timeliness or inaccuracy in reporting abnormal results between providers and/or patients. (Often double coded with delay in treatment/diagnosis/surgery.)
Unexpected Death (Other Than Suicide)
Explicit mention of, or reference to, a patient death where the clinical picture did not reflect the imminent death of the patient.
Delay in Treatment/Diagnosis/ Surgery (Inpatient)
Explicit mention of, or reference to, a delay in some aspect of the patient’s care. (Note: This includes any manner of delay, from delays of minutes to hours to delays of weeks or months.) Delay in Treatment/Diagnosis/
Surgery (Other) Delay in Treatment/Diagnosis/ Surgery (Outpatient) Fall Explicit mention of sudden, unintentional downward displacement of
body to the floor or other object, excluding those resulting from violence or other purposeful act.
Fire Explicit mention of, or reference to, the following: a fire occurring; smell or sight of smoke; or, mention of issues with or activation of the fire alarm or suppression systems (i.e., sprinklers). If oxygen is involved, double code with oxygen.
High Alert Adverse Drug Events (ADEs)
Explicit mention of drugs that bear a heightened risk of causing significant harm with more devastating consequences to patients. Note: A “high alert” medication refers to Institute for Safe Medication Practices and/or Joint Commission listings.
Hospital Acquired Infections Encompasses infections that do not originate from patient's original admitting diagnosis such as VRE, MRSA, Legionella, Clostridium difficile, surgical infection, or the spread of disease via patients, staff or visitors.
Incorrect Surgery Explicit mention of surgery or invasive procedure done on the wrong side, wrong site, wrong patient, or procedure was done incorrectly or unnecessarily.
Inpatient Para-Suicide Explicit mention of any suicidal behavior with or without physical injury and short of death, including the full-range of known or reported attempts, gestures, and threats. (Explicit mention of, or reference to, the para-suicide patient currently residing in an inpatient facility.)
Intubations Explicit mention of, or reference to, the placement of a tube into a patient’s trachea or the intubation process itself.
IV Pump/PCA Pump Explicit mention of, or reference, to the use of IV pumps or medication related events that resulted from the use of IV pumps, including patient controlled analgesia (PCA) pumps.
Misidentification Explicit mention of patient receiving treatment or procedure (therapeutic, diagnostic, or medication) intended for another patient because they were not accurately identified. Includes the misidentification of laboratory or other specimens.

59
Missing Patient Patient is absent from a patient care area without the knowledge and permission of staff for any length of time, even if patient is found or returns on his own.
Other - Activities of Daily Life* (ADLs)
Explicit mention of, or reference to, eating, washing, showering, bathing, teeth brushing, dressing, sleeping in bed, toileting, locomotion, mobility, smoking, etc.
Other - Medical Device* Explicit mention of, or reference to, device or object used to diagnose, deliver or electronically monitor patient care (e.g. telemetry, tourniquet, ventilators, IV pumps, AEDs; and, single use devices, such as catheters, oxygen tubing; or, other patient care devices such as, restraints, hip pads, special beds, etc.).
Other - Supply Service Activities*
Explicit mention of, or reference to, supply service activities (e.g., supply procurement distribution (SPD), sterilization, central supply).
Other – Surgeries* Explicit mention of, or reference to, a procedure performed in operating room.
Outpatient Para-Suicide Explicit mention of any suicidal behavior with or without physical injury and short of death, including the full-range of known or reported attempts, gestures, and threats. Denoted in question five of the RCA. (Explicit mention of, or reference to, the para-suicide patient as currently an outpatient.)
Outpatient Suicide Explicit mention of, or reference to, an outpatient suicide, or the act of taking one’s life outside a facility when the enrolled patient has received hospital or clinic care services from VA.
Oxygen Explicit mention of or reference to the use of O2 that led to an adverse event, such as O2 tank running out, O2 fires (often double coded with fire category).
Pain Management Mention of or reference that pain is an element of the patient’s condition, with or without treatment.
Retained Objects During Surgeries/Procedures
Explicit mention of, or reference to, items left on/in patients during surgery or procedures, such as sponges, needles, instruments, tourniquets, pick lines, heparin locks, guide wires, etc.
* RCAs coded as “other” were those for which no PAC “selected event” category could be applied to the event. In these cases the PAC “activity or process” that was coded as associated with the reported RCA is provided instead.

Table 2.15. FY06 to FY09 Summary, by VISN, of PAC Codes Most Frequently Associated With RCAs Submitted to NCPS
60
Rank Event Total 1 2 3 4 5 6 7 8 9 10 11 12 15 16 17 18 19 20 21 22 23
1 Fall 701 23 14 17 63 23 66 66 97 20 13 36 22 22 48 38 35 10 27 16 13 32
2 Delay in Treatment/Diagnosis/Surgery (Inpatient) 597 21 9 39 24 35 30 50 48 16 21 23 27 15 43 26 28 34 28 25 21 34
3 High Alert ADEs 400 26 11 23 41 4 29 16 24 14 6 41 23 14 33 20 13 6 15 9 9 23
4 Unexpected Death (Other Than Suicide) 385 18 13 14 21 7 7 26 60 11 23 19 11 8 32 28 9 12 5 19 25 17
5 Outpatient Suicide 383 16 11 11 23 6 25 45 15 19 14 26 8 13 26 17 24 14 32 7 14 17
6 Misidentification 311 12 2 28 10 7 23 18 33 13 15 12 17 13 13 16 14 7 15 16 9 18
7 Missing Patient 305 14 11 18 27 16 7 31 20 10 8 25 11 11 29 3 5 7 9 16 12 15
8 Communication of Abnormal Results 199 4 5 14 15 9 5 7 15 7 7 5 7 7 21 11 13 9 14 7 8 9
9 Hospital Acquired Infections 173 10 1 8 8 5 5 8 20 4 7 7 5 14 19 4 3 15 6 5 11 8
10 Inpatient Para-Suicide 154 7 12 9 4 1 15 10 13 6 4 13 5 1 10 6 10 3 4 7 8 6
3608 151 89 181 236 113 212 277 345 120 118 207 136 118 274 169 154 117 155 127 130 179
Table 2.16. FY06 Summary, by VISN, of PAC Codes Most Frequently Associated With RCAs Submitted to NCPS Rank Event Total 1 2 3 4 5 6 7 8 9 10 11 12 15 16 17 18 19 20 21 22 23
1 Fall 152 7 3 7 27 0 11 12 19 7 3 6 6 9 6 3 10 0 6 3 2 5
2 Delay in Treatment/Diagnosis/Surgery (Inpatient) 138 8 1 8 3 9 7 8 25 5 4 5 2 1 6 6 5 5 8 8 5 9
3 High Alert ADEs 95 8 2 12 12 0 4 1 10 1 1 5 3 3 9 5 3 3 1 2 1 9
4 Unexpected Death (Other Than Suicide) 61 5 1 1 1 4 0 5 6 0 8 1 2 0 7 3 2 3 1 4 7 0
5 Outpatient Suicide 36 3 1 1 3 1 3 3 1 4 1 1 0 0 7 0 3 1 0 0 0 3
6 Misidentification 65 0 0 7 2 3 3 5 11 1 3 1 1 5 3 4 4 0 1 5 4 2
7 Missing Patient 59 4 3 6 5 2 2 4 6 1 2 3 1 1 5 0 3 1 2 2 4 2
8 Communication of Abnormal Results 27 2 0 0 1 2 1 0 5 0 0 1 1 0 1 3 1 1 5 1 2 0
9 Hospital Acquired Infections 40 4 1 1 2 1 1 0 3 0 1 2 3 6 6 1 0 3 1 2 0 2
10 Inpatient Para-Suicide 28 2 6 0 0 0 4 0 2 2 1 2 1 0 3 1 1 0 0 1 1 1
701 43 18 43 56 22 36 38 88 21 24 27 20 25 53 26 32 17 25 28 26 33

Table 2.17. FY07 Summary, by VISN, of PAC Codes Most Frequently Associated With RCAs Submitted to NCPS
61
Rank Event Total 1 2 3 4 5 6 7 8 9 10 11 12 15 16 17 18 19 20 21 22 23
1 Fall 191 7 4 4 9 4 15 23 32 6 3 4 7 3 16 16 7 3 6 4 6 12
2 Delay in Treatment/Diagnosis/Surgery (Inpatient) 157 8 3 13 8 6 8 8 8 5 6 6 12 4 12 10 7 8 6 4 5 10
3 High Alert ADEs 118 8 3 7 8 1 6 8 10 1 2 12 10 3 9 9 2 1 6 2 2 8
4 Unexpected Death (Other Than Suicide) 83 4 2 2 8 0 3 5 11 1 6 4 3 3 5 9 3 2 0 3 6 3
5 Outpatient Suicide 84 4 6 4 5 3 11 4 0 1 5 1 3 3 5 6 6 4 1 1 4 7
6 Misidentification 68 4 1 4 3 3 6 4 6 5 5 2 4 4 0 5 1 0 4 4 2 1
7 Missing Patient 67 2 3 2 4 4 3 2 5 5 1 6 4 1 7 0 0 2 2 5 3 6
8 Communication of Abnormal Results 44 0 3 8 5 0 2 0 3 1 2 3 1 1 2 2 2 0 3 3 0 3
9 Hospital Acquired Infections 41 1 0 5 4 0 1 2 4 1 2 1 0 0 5 1 1 1 2 2 6 2
10 Inpatient Para-Suicide 32 0 0 3 0 1 2 3 5 0 0 3 2 0 1 0 7 0 1 1 0 3
885 38 25 52 54 22 57 59 84 26 32 42 46 22 62 58 36 21 31 29 34 55
Table 2.18. FY08 Summary, by VISN, of PAC Codes Most Frequently Associated With RCAs Submitted to NCPS
Rank Event Total 1 2 3 4 5 6 7 8 9 10 11 12 15 16 17 18 19 20 21 22 23
1 Fall 197 6 4 4 20 12 19 19 20 2 3 11 7 4 16 11 9 4 9 6 2 9
2 Delay in Treatment/Diagnosis/Surgery (Inpatient) 168 4 4 9 9 13 10 16 6 6 7 8 6 5 10 7 12 10 8 6 6 6
3 High Alert ADEs 102 6 2 2 13 1 5 3 2 5 1 13 5 4 12 5 6 1 7 2 3 4
4 Unexpected Death (Other Than Suicide) 148 9 3 7 6 2 3 10 21 7 5 10 1 3 16 9 2 5 2 8 9 10
5 Outpatient Suicide 138 4 2 2 11 0 4 14 4 10 7 14 1 5 9 7 9 6 14 4 5 6
6 Misidentification 88 4 1 8 1 0 5 3 7 5 6 6 8 3 5 4 4 1 6 2 1 8
7 Missing Patient 95 4 3 7 10 6 1 16 3 2 2 9 2 6 6 1 1 1 2 5 4 4
8 Communication of Abnormal Results 61 1 0 2 7 5 2 2 1 3 3 1 5 3 8 2 6 1 3 1 4 1
9 Hospital Acquired Infections 51 5 0 1 2 1 2 0 7 3 1 2 2 2 7 2 2 8 2 0 1 1
10 Inpatient Para-Suicide 55 3 5 2 3 0 4 3 4 3 2 5 1 0 3 2 1 3 2 3 6 0
1103 46 24 44 82 40 55 86 75 46 37 79 38 35 92 50 52 40 55 37 41 49

Table 2.19. FY09 Summary, by VISN, of PAC Codes Most Frequently Associated With RCAs Submitted to NCPS
62
Rank Event Total 1 2 3 4 5 6 7 8 9 10 11 12 15 16 17 18 19 20 21 22 23
1 Fall 161 3 3 2 7 7 21 12 26 5 4 15 2 6 10 8 9 3 6 3 3 6
2 Delay in Treatment/Diagnosis/Surgery (Inpatient) 134 1 1 9 4 7 5 18 9 0 4 4 7 5 15 3 4 11 6 7 5 9
3 High Alert ADEs 85 4 4 2 8 2 14 4 2 7 2 11 5 4 3 1 2 1 1 3 3 2 4 Unexpected Death (Other Than Suicide) 93 0 7 4 6 1 1 6 22 3 4 4 5 2 4 7 2 2 2 4 3 4 5 Outpatient Suicide 125 5 2 4 4 2 7 24 10 4 1 10 4 5 5 4 6 3 17 2 5 1 6 Misidentification 90 4 0 9 4 1 9 6 9 2 1 3 4 1 5 3 5 6 4 5 2 7
7 Missing Patient 84 4 2 3 8 4 1 9 6 2 3 7 4 3 11 2 1 3 3 4 1 3 8 Communication of Abnormal Results 67 1 2 4 2 2 0 5 6 3 2 0 0 3 10 4 4 7 3 2 2 5 9 Hospital Acquired Infections 41 0 0 1 0 3 1 6 6 0 3 2 0 6 1 0 0 3 1 1 4 3 10 Inpatient Para-Suicide 39 2 1 4 1 0 5 4 2 1 1 3 1 1 3 3 1 0 1 2 1 2
919 24 22 42 44 29 64 94 98 27 25 59 32 36 67 35 34 39 44 33 29 42
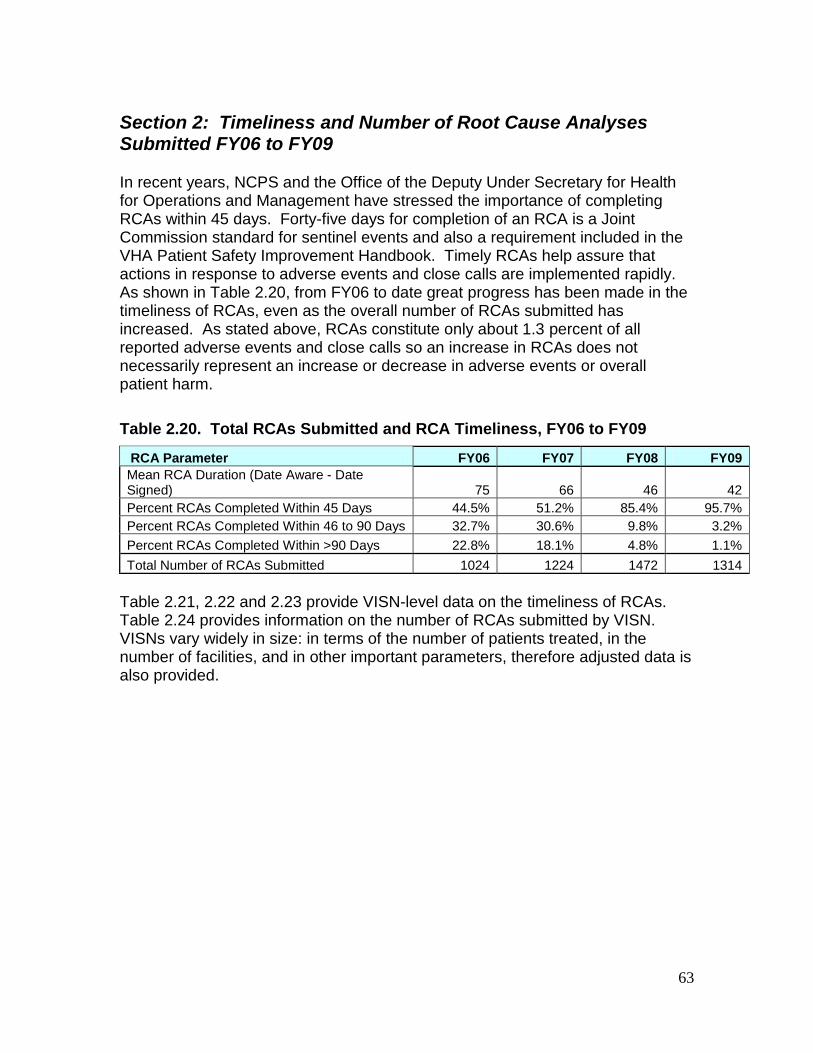
Section 2: Timeliness and Number of Root Cause Analyses Submitted FY06 to FY09
In recent years, NCPS and the Office of the Deputy Under Secretary for Health for Operations and Management have stressed the importance of completing RCAs within 45 days. Forty-five days for completion of an RCA is a Joint Commission standard for sentinel events and also a requirement included in the VHA Patient Safety Improvement Handbook. Timely RCAs help assure that actions in response to adverse events and close calls are implemented rapidly. As shown in Table 2.20, from FY06 to date great progress has been made in the timeliness of RCAs, even as the overall number of RCAs submitted has increased. As stated above, RCAs constitute only about 1.3 percent of all reported adverse events and close calls so an increase in RCAs does not necessarily represent an increase or decrease in adverse events or overall patient harm.
Table 2.20. Total RCAs Submitted and RCA Timeliness, FY06 to FY09
63
RCA Parameter FY06 FY07 FY08 FY09 Mean RCA Duration (Date Aware - Date Signed) 75 66 46 42 Percent RCAs Completed Within 45 Days 44.5% 51.2% 85.4% 95.7% Percent RCAs Completed Within 46 to 90 Days 32.7% 30.6% 9.8% 3.2% Percent RCAs Completed Within >90 Days 22.8% 18.1% 4.8% 1.1% Total Number of RCAs Submitted 1024 1224 1472 1314
Table 2.21, 2.22 and 2.23 provide VISN-level data on the timeliness of RCAs. Table 2.24 provides information on the number of RCAs submitted by VISN. VISNs vary widely in size: in terms of the number of patients treated, in the number of facilities, and in other important parameters, therefore adjusted data is also provided.
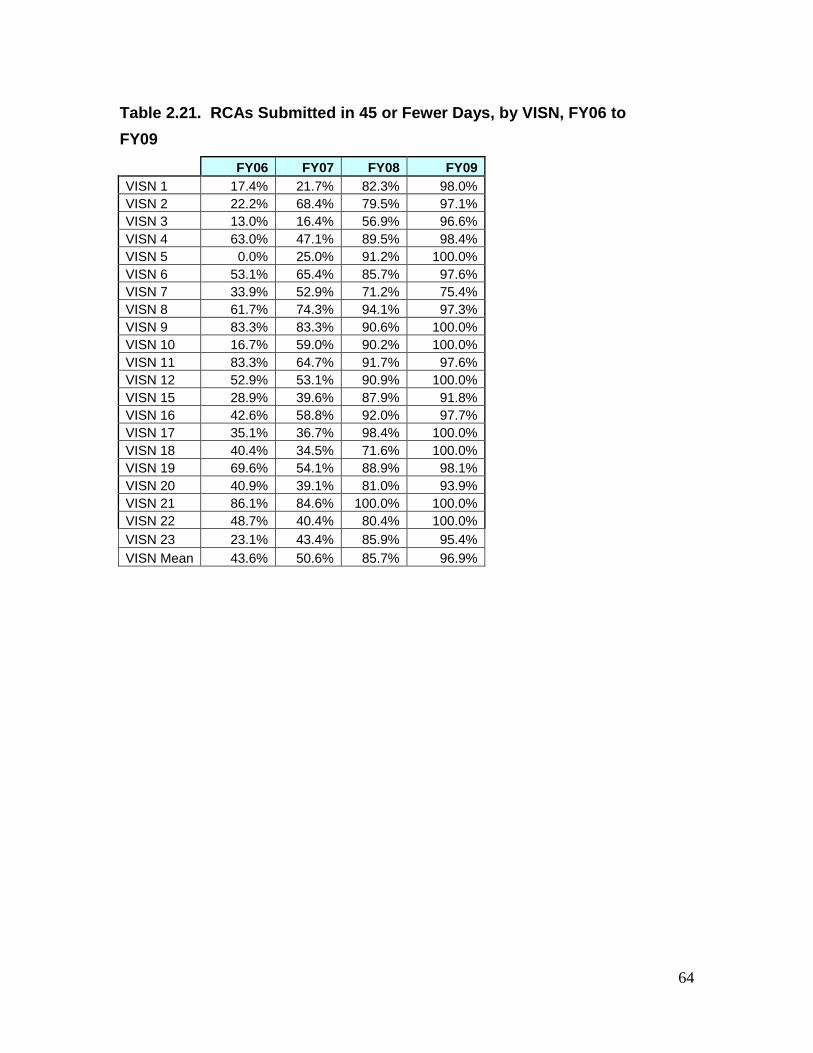
Table 2.21. RCAs Submitted in 45 or Fewer Days, by VISN, FY06 to FY09
64
FY06 FY07 FY08 FY09 VISN 1 17.4% 21.7% 82.3% 98.0% VISN 2 22.2% 68.4% 79.5% 97.1% VISN 3 13.0% 16.4% 56.9% 96.6% VISN 4 63.0% 47.1% 89.5% 98.4% VISN 5 0.0% 25.0% 91.2% 100.0% VISN 6 53.1% 65.4% 85.7% 97.6% VISN 7 33.9% 52.9% 71.2% 75.4% VISN 8 61.7% 74.3% 94.1% 97.3% VISN 9 83.3% 83.3% 90.6% 100.0% VISN 10 16.7% 59.0% 90.2% 100.0% VISN 11 83.3% 64.7% 91.7% 97.6% VISN 12 52.9% 53.1% 90.9% 100.0% VISN 15 28.9% 39.6% 87.9% 91.8% VISN 16 42.6% 58.8% 92.0% 97.7% VISN 17 35.1% 36.7% 98.4% 100.0% VISN 18 40.4% 34.5% 71.6% 100.0% VISN 19 69.6% 54.1% 88.9% 98.1% VISN 20 40.9% 39.1% 81.0% 93.9% VISN 21 86.1% 84.6% 100.0% 100.0% VISN 22 48.7% 40.4% 80.4% 100.0% VISN 23 23.1% 43.4% 85.9% 95.4% VISN Mean 43.6% 50.6% 85.7% 96.9%

Table 2.22. RCAs Submitted in 46 to 90 Days, by VISN, FY06 to FY09
65
FY06 FY07 FY08 FY09 VISN 1 47.8% 23.9% 12.9% 2.0% VISN 2 22.2% 15.8% 15.4% 2.9% VISN 3 68.8% 63.0% 33.8% 3.4% VISN 4 23.5% 28.6% 4.7% 1.6% VISN 5 65.2% 40.6% 7.0% 0.0% VISN 6 40.8% 28.4% 12.9% 2.4% VISN 7 30.5% 27.6% 16.7% 16.4% VISN 8 18.8% 18.6% 4.0% 2.7% VISN 9 8.3% 9.5% 1.9% 0.0% VISN 10 38.9% 28.2% 9.8% 0.0% VISN 11 16.7% 23.5% 8.3% 2.4% VISN 12 32.4% 40.6% 4.5% 0.0% VISN 15 31.6% 20.8% 5.2% 0.0% VISN 16 39.3% 32.5% 7.1% 2.3% VISN 17 24.3% 40.0% 1.6% 0.0% VISN 18 19.3% 25.5% 16.4% 0.0% VISN 19 26.1% 37.8% 5.6% 1.9% VISN 20 38.6% 41.3% 13.1% 4.5% VISN 21 13.9% 15.4% 0.0% 0.0% VISN 22 38.5% 46.8% 13.7% 0.0% VISN 23 46.2% 30.3% 9.9% 4.6% VISN Mean 32.9% 30.4% 9.7% 2.3%

Table 2.23. RCAs Submitted in More Than 90 Days, by VISN, FY06 to FY09
66
FY06 FY07 FY08 FY09 VISN 1 34.8% 54.3% 4.8% 0.0% VISN 2 55.6% 15.8% 5.1% 0.0% VISN 3 18.2% 20.5% 9.2% 0.0% VISN 4 13.6% 24.3% 5.8% 0.0% VISN 5 34.8% 34.4% 1.8% 0.0% VISN 6 6.1% 6.2% 1.4% 0.0% VISN 7 35.6% 19.5% 12.1% 8.2% VISN 8 19.5% 7.1% 2.0% 0.0% VISN 9 8.3% 7.1% 7.5% 0.0% VISN 10 44.4% 12.8% 0.0% 0.0% VISN 11 0.0% 11.8% 0.0% 0.0% VISN 12 14.7% 6.3% 4.5% 0.0% VISN 15 39.5% 39.6% 6.9% 8.2% VISN 16 18.0% 8.8% 0.9% 0.0% VISN 17 40.5% 23.3% 0.0% 0.0% VISN 18 40.4% 40.0% 11.9% 0.0% VISN 19 4.3% 8.1% 5.6% 0.0% VISN 20 20.5% 19.6% 6.0% 1.5% VISN 21 0.0% 0.0% 0.0% 0.0% VISN 22 12.8% 12.8% 5.9% 0.0% VISN 23 30.8% 26.3% 4.2% 0.0% VISN Mean 23.4% 19.0% 4.6% 0.9%

Table 2.24. RCAs Submitted by Each VISN, FY06 to FY09, Unadjusted and Adjusted for 10,000 Unique Patients The data below are counts of reports that VAMC staff selected to receive RCAs, and should not be misunderstood as representing the number of adverse events and close calls that occurred in each VISN.
67
FY06
FY06 (Adjusted
for 10,000
Unique Patients)
FY 2007
FY07 (Adjusted
for 10,000
Unique Patients) FY08
FY08 (Adjusted
for 10,000
Unique Patients) FY09
FY09 (Adjusted
for 10,000
Unique Patients)
VISN 1 46 1.91 46 1.88 62 2.57 49 2.01 VISN 2 27 1.98 38 2.82 39 2.88 34 2.48 VISN 3 77 4.01 73 3.90 65 3.55 59 3.20 VISN 4 81 2.64 70 2.29 86 2.81 62 2.01 VISN 5 23 1.73 32 2.40 57 4.27 50 3.58 VISN 6 49 1.79 81 2.89 70 2.44 85 2.81 VISN 7 59 1.92 87 2.76 132 4.01 122 3.54 VISN 8 133 2.52 113 2.16 102 1.95 111 2.09 VISN 9 36 1.37 42 1.59 53 1.96 38 1.36 VISN 10 36 1.87 39 1.99 41 2.06 38 1.85 VISN 11 36 1.54 51 2.14 84 3.47 82 3.25 VISN 12 34 1.39 64 2.59 66 2.64 47 1.87 VISN 15 38 1.62 48 2.03 58 2.48 49 2.07 VISN 16 61 1.36 80 1.77 112 2.45 88 1.87 VISN 17 37 1.47 60 2.33 64 2.45 49 1.83 VISN 18 57 2.32 55 2.25 67 2.70 58 2.27 VISN 19 23 1.48 37 2.31 54 3.30 52 3.02 VISN 20 44 1.98 46 2.05 84 3.62 67 2.75 VISN 21 36 1.53 39 1.62 55 2.19 61 2.35 VISN 22 39 1.47 47 1.78 51 1.88 49 1.73 VISN 23 52 1.85 76 2.65 71 2.44 66 2.21 VHA Total
(Unadjusted) and VHA Rate (Adjusted) 1,024 1.97 1,224 2.34 1,473 2.78 1,316 2.42

Section 3: RCAs Possessing “Strong Strings”
An RCA is considered as having a "strong string" if it possesses: 1) An action with “stronger” or “intermediate” strength; 2) A quantifiable outcome measure; 3) Management concurrence (on the stronger or intermediate action). Stronger or intermediate actions are defined by NCPS criteria as being more effective in preventing the recurrence of similar events. For example, eliminating use of a device associated with adverse events and replacing it with a safer one is a “stronger” action, while providing training on the original problematic device would be considered a “weaker” action. Table 2.25 shows the VISN and VHA-wide performance in this area from FY06 to FY09. For all time periods there is wide variation in the absolute and relative performance.
Table 2.25. RCAs Scored as Possessing “Strong Strings”*, by VISN, FY06 to FY09
68
FY06 FY07 FY08 FY09 VISN 1 47.8% 37.8% 54.1% 83.7% VISN 2 15.4% 18.4% 56.4% 88.2% VISN 3 36.8% 37.3% 37.5% 65.5% VISN 4 45.6% 50.7% 45.3% 61.3% VISN 5 47.8% 21.9% 50.9% 53.1% VISN 6 54.2% 51.3% 52.9% 61.2% VISN 7 34.6% 41.0% 59.5% 67.8% VISN 8 30.0% 35.8% 52.1% 78.2% VISN 9 33.3% 43.9% 25.5% 94.7% VISN 10 60.0% 47.4% 51.2% 81.1% VISN 11 42.4% 44.0% 53.0% 81.5% VISN 12 40.6% 42.2% 67.7% 78.7% VISN 15 40.5% 55.3% 37.5% 60.4% VISN 16 41.4% 47.4% 55.2% 85.7% VISN 17 22.2% 35.6% 65.1% 91.8% VISN 18 36.8% 48.1% 44.6% 77.6% VISN 19 33.3% 54.1% 47.2% 73.1% VISN 20 70.5% 73.9% 69.9% 59.1% VISN 21 60.0% 41.7% 38.5% 66.7% VISN 22 61.1% 64.3% 50.0% 71.4% VISN 23 39.2% 34.7% 54.3% 87.5% VISN Mean 42.6% 44.1% 50.9% 74.7%
"Strong string" defined as any action with stronger or intermediate strength, a quantifiable outcome measure and management concurrence.

Section 4: Information on Reports That Were Not the Subject of Single Case RCAs
Over 98 percent of events reported at the local level in VHA, and therefore to NCPS, are not the subject of single case RCAs. Most events fall in one of the four event types identified by NCPS in 1999 as frequently reported event types in VHA: Falls, adverse drug events, missing patients, and suicidal behaviors or suicides (see Table 2.14 for definitions of these and other event types). These events, when not receiving a single-case RCA are grouped at the VAMC level and reviewed annually as ARs, one each quarter. Table 2.26 provides data on the number of adverse events and close calls associated with VHA ARs.
Table 2.26. Reports of Adverse Events and Close Calls in Aggregated Review Categories FY06 to FY09
69
FY06 FY07 FY08 FY09 TOTAL Percent Fall 36,721 40,773 46,142 44,884 168,520 61.7%
Missing Patients 1,529 1,540 1,632 1,502 6,203 2.3% Medication 18,050 17,814 22,000 22,372 80,236 29.4%
Suicidal Behavior and Outpatient Suicide 2,910 3,135 6,489 5,655 18,189 6.7%
TOTAL 59,210 63,262 76,263 74,413 273,148
Table 2.27 provides raw and adjusted data on the number of reports submitted on AR topics. Table 2.28 provides raw and adjusted data on safety reports (not subject to RCA or AR). As stated earlier, in an attempt to better understand the categories of events reported via safety reports only, NCPS personnel randomly selected 2,000 of the 75,913 safety reports received from FY06 to FY08 and used natural language processing software to categorize them based on the way the RCAs had been categorized by NCPS staff, i.e., the software coded the safety reports based on the way experienced people coded the RCAs. Only the categories most frequently associated with RCAs that were not also categories associated with ARs were categorized with the software. The findings were as follows: Delay in treatment/diagnosis/surgery was a PAC category associated with 9.5 percent of the safety reports, misidentification was associated with 3.8 percent, communication of abnormal result was associated with 3.1 percent, and hospital-acquired infection was associated with 2.1 percent. This method, if extrapolated, suggests that approximately 14,000 of the 75,913 safety reports received from FY06 to FY08 were relevant to these four categories.
Table 2.29 shows that even for the most frequently PAC coded event types that are the subject of RCAs, that a much greater number of adverse events and close calls are reviewed by the AR process than the RCA process. The ratio of reports leading to RCA to reports included in AR ranges from about 1:20 to nearly 1:300. This should not be misunderstood as a small number of serious

adverse events being reviewed in-depth. VA has emphasized the reporting of close calls in addition to adverse events and many reports of falls, missing patients, medication events, and suicidal behaviors are associated with no harm to the patient. Table 2.27. Aggregated Reviews Submitted by Each VISN, FY06 to FY09, Unadjusted and Adjusted for 10,000 Unique Patients The data below are counts of reports that VAMC staff selected to receive RCAs, and should not be misunderstood as representing the number of adverse events and close calls that occurred in each VISN.
70
FY06
FY06 (Adjusted for 10,000 Unique
Patients) FY07
FY07 Adjusted for 10,000 Unique
Patients) FY08
FY08 (Adjusted for 10,000 Unique
Patients) FY09
FY09 (Adjusted for 10,000 Unique
Patients) VISN 1 3,138 130.14 3,240 132.44 3,911 162.25 3,946 162.03 VISN 2 2,660 194.98 2,373 176.40 3,010 222.56 3,017 220.11 VISN 3 2,497 129.91 2,620 139.88 3,088 168.44 3,076 166.87 VISN 4 3,725 121.45 4,666 152.37 4,410 144.06 4,734 153.11 VISN 5 1,772 133.56 2,393 179.25 2,229 166.87 2,346 168.01 VISN 6 1,700 62.19 2,232 79.50 3,244 112.86 3,262 107.90 VISN 7 3,483 113.57 3,092 97.93 5,704 173.37 4,539 131.67 VISN 8 2,058 39.05 3,228 61.64 4,759 91.07 3,681 69.18 VISN 9 3,875 147.72 3,771 142.67 3,378 124.99 3,084 110.64
VISN 10 2,553 132.57 2,565 130.78 2,915 146.54 2,320 112.73 VISN 11 874 37.27 1,102 46.31 2,078 85.92 3,775 149.40 VISN 12 1,959 80.01 2,072 83.72 3,066 122.52 3,012 119.98 VISN 15 4,642 197.68 3,312 140.40 4,331 184.83 4,246 179.63 VISN 16 3,211 71.44 3,815 84.34 4,633 101.21 3,856 82.07 VISN 17 2,853 113.66 4,060 157.38 3,874 148.55 4,187 156.48 VISN 18 3,177 129.41 2,392 97.68 3,077 123.95 3,452 135.18 VISN 19 2,648 170.63 2,290 143.10 3,595 219.90 3,221 187.35 VISN 20 2,456 110.69 2,592 115.41 3,112 134.11 3,279 134.61 VISN 21 3,642 154.59 3,450 143.27 3,682 146.71 3,316 127.76 VISN 22 1,866 70.24 2,382 89.98 1,956 71.96 3,134 110.52 VISN 23 4,431 157.47 5,609 195.93 6,214 213.93 4,929 165.33 VHA Total
(Unadjusted) and VHA Rate (Adjusted) 59,220 114.11 63,256 120.86 76,266 143.91 74,412 136.58

Table 2.28. Safety Reports Submitted by Each VISN, FY06 to FY09, Unadjusted and Adjusted for 10,000 Unique Patients The data below are counts of reports that VAMC staff selected to receive RCAs, and should not be misunderstood as representing the number of adverse events and close calls that occurred in each VISN.
71
FY06
FY06 (Adjusted for 10,000
Unique Patients) FY07
FY07 (Adjusted for 10,000
Unique Patients) FY08
FY08 (Adjusted for 10,000
Unique Patients) FY09
FY09 (Adjusted for 10,000
Unique Patients)
VISN 1 1,195 49.56 1,378 56.33 1,314 54.51 2,222 91.24 VISN 2 1,144 83.86 869 64.60 1,204 89.02 1,369 99.88 VISN 3 1,231 64.05 954 50.93 1,662 90.66 1,740 94.39 VISN 4 1,142 37.23 1,902 62.11 2,330 76.12 2,887 93.38 VISN 5 430 32.41 485 36.33 442 33.09 247 17.69 VISN 6 455 16.64 802 28.57 1,068 37.16 1,727 57.12 VISN 7 480 15.65 1,449 45.89 1,148 34.89 1,388 40.27 VISN 8 837 15.88 1,812 34.60 2,939 56.24 2,629 49.41 VISN 9 1,779 67.82 1,776 67.19 1,500 55.50 1,369 49.11
VISN 10 422 21.91 386 19.68 737 37.05 887 43.10 VISN 11 674 28.74 680 28.58 1,191 49.25 1,868 73.93 VISN 12 480 19.61 501 20.24 740 29.57 682 27.17 VISN 15 1,206 51.36 1,298 55.02 1,661 70.89 2,230 94.34 VISN 16 868 19.31 2,063 45.61 1,881 41.09 1,708 36.35 VISN 17 1,067 42.51 1,990 77.14 2,365 90.69 2,863 107.00 VISN 18 1,386 56.46 977 39.90 1,653 66.59 1,450 56.78 VISN 19 763 49.17 618 38.62 1,067 65.27 1,180 68.64 VISN 20 1,076 48.50 1,007 44.84 1,095 47.19 1,098 45.07 VISN 21 359 15.24 142 5.90 440 17.53 742 28.59 VISN 22 1,274 47.96 1,843 69.62 1,591 58.53 2,370 83.58 VISN 23 1,770 62.90 2,282 79.71 2,654 91.37 2,617 87.78 VHA Total
(Unadjusted) and VHA Rate (Adjusted) 20,038 38.61 25,214 48.18 30,682 57.89 35,273 64.74

Table 2.29. Aggregated Reviews and RCAs Submitted for Four Event Types
72
FY06 AR
FY06 RCA
FY07 AR
FY07 RCA
FY08 AR
FY08 RCA
FY09 AR
FY09 RCA
Total Reported Events
Fall 36,721 152 40,773 191 46,142 197 44,884 161 169,221 Missing Patients 1,529 59 1,540 67 1,632 95 1,502 84 6,508
Medication 18,050 125 17,814 170 22,000 164 22,372 160 80,855 Suicidal Behavior
and Outpatient Suicide 2,910 89 3,135 149 6,489 250 5,655 212 18,889 TOTAL 59,210 425 63,262 577 76,263 706 74,413 617 275,473
The number of RCAs completed at VHA facilities and reported to NCPS, although small in comparison to the total number of adverse events and close calls reported is greater than the number of events submitted to some other notable organizations. For example, the Joint Commission, which collects data on “sentinel events” only, received and accepted 3,054 RCAs for the period from FY06 to FY09 from the entire United States health care system (see http://www.jointcommission.org/NR/rdonlyres/377FF7E7-F565-4D61-9FD2-593CA688135B/0/SE_Stats_31_Dec_2009.pdf). By not limiting the incidents that can be studied in-depth using the RCA process, and by encouraging the reporting of adverse events and close calls VHA NCPS received over 5,000 RCAs from VAMCs during the same time. The state of Minnesota (with a population of about 5.2 million residents) confines reporting of adverse events to occurrences of 28 types of serious reportable events (sometimes called “Never Events”) identified by the National Quality Forum, and received less than 800 reports for the five-year period from 2003 to 2008 (see http://www.health.state.mn.us/patientsafety/publications/09aheeval.pdf). The state of Pennsylvania (population 12.5 million) has established a much lower threshold for reporting than Minnesota, and made reporting “mandatory” in some instances. Summary data from Pennsylvania for the year 2008 alone showed that 8,645 “serious events” were reported and that 211,229 “incidents” other than serious events were reported (see http://patientsafetyauthority.org/PatientSafetyAuthority/Documents/annual_report_2008.pdf). In Pennsylvania, the total number of reports per month has increased since 2004, from around 10,000 per month to 17,000 per month, with no trend to indicate that the number of reported serious events is either increasing or decreasing overall, or as a fraction of all reports.
The Joint Commission, Minnesota and Pennsylvania data are provided above only to put the VA data in context. These three cases suggest that when the topics and criteria for reporting are strictly limited then there will be few reports received, and when the topics are unconstrained and there is a legal mandate for reporting, then many reports will be received. The correlation between the number of reports submitted by and the safety of a health care facility or system has not been established and should not be assumed to be related (directly or

inversely) to the number of events or RCAs reported. VA leaders and policies have encouraged reporting to NCPS not for the sake of accumulating reports, but primarily for identifying problems that need to be addressed. The data presented earlier in Table 2.4, suggest that facility-level VHA staff believe that the actions that they have designed and implemented as part of the RCAs performed in response to adverse events and close calls have been effective.
73

Part 3: VHA Facility Quality & Safety Data Tables
Section 1: Infrastructure
Available In-House Services:
74
Facility Name
Acut
e M
ed/S
urg
Acut
e M
enta
l H
ealth
Inte
nsiv
e C
are
Uni
t
Emer
genc
y D
ept
Spin
al C
ord
Inju
ry &
D
isor
ders
Uni
t
Poly
traum
a sy
stem
Livi
ng C
ente
rC
omm
unity
C
omm
Com
mun
ity
Livi
ng C
ente
r
VA Connecticut Health Care System, West Haven, CT Yes Yes Yes Yes No PSCT Yes
Edith N Rogers Memorial Veterans Hospital, Bedford, Ma No Yes No No No PPOC Yes
VA Boston Health Care System, W Roxbury, Brockton, Jamaica Plains, MA Yes Yes Yes Yes Yes PNS Yes
Northampton VAMC, MA No Yes No No No PSCT Yes
Togus VAMC, Augusta, ME Yes Yes Yes Yes No PSCT Yes
Manchester VAMC, NH No No No No No PPOC Yes
Providence VAMC, RI Yes Yes Yes Yes No PPOC No
White River Junction VAMC, VT Yes Yes Yes Yes No PSCT No
Samuel S. Stratton VAMC, Albany, NY Yes Yes Yes Yes No PSCT Yes
VA Western New York Health Care System Buffalo, Batavia, NY Yes Yes Yes Yes No PSCT Yes
Bath VAMC, NY Yes No Yes Yes No PSCT Yes
Canandaigua VAMC, NY No No No No No PSCT Yes
Syracuse VAMC, NY Yes Yes Yes Yes No PNS Yes
VA New Jersey Health Care System, East Orange, NJ Yes Yes Yes Yes Yes PSCT Yes
James J. Peters VAMC, Bronx, NY Yes Yes Yes Yes Yes PNS Yes
VA New York Harbor Health Care System, Manhattan, Brooklyn, NY Yes Yes Yes Yes No PSCT Yes
VA Hudson Valley Health Care System, Montrose, Castle Point, NY Yes Yes No No No PSCT Yes
Northport VAMC, NY Yes Yes Yes Yes No PSCT Yes
Wilmington VAMC, DE Yes No Yes Yes No PSCT Yes

75
James E. Van Zandt VAMC, Altoona, PA Yes No Yes Yes No PSCT Yes
Butler VAMC, PA No No No No No PSCT Yes
Coatesville VAMC, PA Yes Yes No No No PSCT Yes
Erie VAMC, PA Yes No Yes Yes No PSCT Yes
Lebanon VAMC, PA Yes Yes Yes Yes No PSCT Yes
Philadelphia VAMC, PA Yes Yes Yes Yes No PNS Yes
VA Pittsburgh Health Care System, PA Yes Yes Yes Yes No PSCT Yes
Wilkes-Barre VAMC, PA Yes Yes Yes Yes No PSCT Yes
Louis A. Johnson VAMC, Clarksburg, WV Yes Yes Yes Yes No PPOC Yes
Washington DC VAMC, DC Yes Yes Yes Yes No PNS Yes
VA Maryland Health Care System, Perry Pt, Baltimore, MD Yes Yes Yes Yes No PSCT Yes
Martinsburg VAMC, WV Yes Yes Yes Yes No PSCT Yes
Asheville VAMC, NC Yes Yes Yes Yes No PPOC Yes
Durham VAMC, NC Yes Yes Yes Yes No PSCT Yes
Fayetteville VAMC, NC Yes Yes Yes Yes No PPOC Yes
W.G. (Bill) Hefner VAMC, Salisbury, NC Yes Yes Yes Yes No PSCT Yes
Hampton VAMC, VA Yes Yes Yes Yes No PSCT Yes
Hunter Holmes McGuire VAMC, Richmond, VA Yes Yes Yes Yes Yes PRC/ PNS Yes
Salem VAMC, VA Yes Yes Yes Yes No PPOC Yes
Beckley VAMC, WV Yes No Yes Yes No PPOC Yes
Birmingham VAMC, AL Yes No Yes Yes No PSCT No
Central Alabama Veterans Health Care System, Tuskegee, Montgomery, AL Yes Yes Yes Yes No NA Yes
Tuscaloosa VAMC, AL No Yes No No No PSCT Yes
Atlanta VAMC, GA Yes Yes Yes Yes No PNS Yes
Charlie Norwood VAMC, Augusta, GA Yes Yes Yes Yes Yes NA Yes
Carl Vinson VAMC, Dublin, GA Yes No Yes Yes No PPOC Yes

76
Ralph H. Johnson VAMC, Charleston, SC Yes Yes Yes Yes No PSCT Yes
Wm. Jennings Bryan Dorn VAMC, Columbia, SC Yes Yes Yes Yes No PSCT Yes
Bay Pines VA Health Care System, FL Yes Yes Yes Yes No PSCT Yes
N. Florida/S. Georgia Veterans Health Care System Gainesville, Lake City Yes Yes Yes Yes No PSCT Yes
Miami VA Health Care System, FL Yes Yes Yes Yes Yes PSCT Yes
Orlando VAMC, FL No No No No No PPOC Yes
James A. Haley VAMC, Tampa, FL Yes Yes Yes Yes Yes PRC/ PNS Yes
West Palm Beach VAMC, FL Yes Yes Yes Yes No PSCT Yes
VA Caribbean Health Care System, San Juan, PR Yes Yes Yes Yes Yes PNS Yes
Lexington VAMC, KY Yes Yes Yes Yes No PNS Yes
Louisville VAMC, KY Yes Yes Yes Yes No PSCT No
Memphis VAMC, TN Yes Yes Yes Yes Yes PSCT No
Mountain Home VAMC, TN Yes Yes Yes Yes No PSCT Yes
Tennessee Valley Health Care System, Nashville, Murfreesboro, TN Yes Yes Yes Yes No PSCT Yes
Huntington VAMC, WV Yes No Yes Yes No PSCT No
Chillicothe VAMC, OH Yes Yes Yes No No PPOC Yes
Cincinnati VAMC, OH Yes Yes Yes Yes No PSCT Yes
Louis Stokes VAMC, Cleveland, Brecksville, OH Yes Yes Yes Yes Yes PNS Yes
Chalmers P. Wylie Outpt Clinic, Columbus, OH No No No No No PPOC No
Dayton VAMC, OH Yes Yes Yes Yes No PSCT Yes
VA Illiana Health Care System, Danville, IL Yes Yes Yes Yes No PSCT Yes
VA Northern Indiana Health Care System, Marion, Ft Wayne, IN Yes Yes Yes Yes No PPOC Yes
Richard L. Roudebush VAMC, Indianapolis, IN Yes Yes Yes Yes No PNS No
VA Ann Arbor Health Care System, MI Yes Yes Yes Yes No PSCT Yes
Battle Creek VAMC, MI Yes Yes No No No PPOC Yes

77
John D. Dingell VAMC, Detroit, MI Yes Yes Yes Yes No PSCT Yes
Aleda E. Lutz VAMC, Saginaw, MI Yes No Yes Yes No PPOC Yes
Jessie Brown VAMC, Chicago, IL Yes Yes Yes Yes No PSCT Yes
Edward Hines Jr. VA Hospital, Hines, IL Yes Yes Yes Yes Yes PNS Yes
North Chicago VAMC, IL Yes Yes Yes Yes No PSCT Yes
Iron Mountain VAMC, MI Yes No Yes Yes No PPOC Yes
William S. Middleton Memorial Veterans Hospital, Madison, WI Yes Yes Yes Yes No PSCT No
Clement J. Zablocki VAMC, Milwaukee, WI Yes Yes Yes Yes Yes PSCT Yes
Tomah VAMC, WI Yes Yes No No No PSCT Yes
VA Eastern Kansas Health Care System, Topeka, Leavenworth, KS Yes Yes Yes Yes No PPOC Yes
Robert J. Dole VAMC, Wichita, KS Yes No Yes Yes No PSCT Yes
Harry S. Truman VAMC, Columbia, MO Yes Yes Yes Yes No PPOC Yes
Kansas City VAMC, MO Yes Yes Yes Yes No PSCT No
Marion VAMC, IL Yes No Yes Yes No PPOC Yes
John J. Pershing VAMC, Poplar Bluff, MO Yes No No No No PPOC Yes
St Louis VAMC, St Louis, Jefferson Barracks, MO Yes Yes Yes Yes Yes PNS Yes
Fayetteville VAMC, AR Yes Yes Yes Yes No PSCT No
Central Arkansas Veterans Health Care System, Little Rock, N Little Rock, AR Yes Yes Yes Yes No PSCT Yes
Alexandria VAMC, LA Yes Yes Yes Yes No PSCT Yes
New Orleans VAMC, LA No No No No No PPOC No
Overton Brooks VAMC, Shreveport, LA Yes Yes Yes Yes No PSCT No Gulf Coast Veterans Health Care System, Biloxi, MS Yes Yes Yes Yes No PSCT Yes
G.V. Montgomery VAMC, Jackson, MS Yes Yes Yes Yes No PSCT Yes
Muskogee VAMC, OK Yes Yes Yes Yes No PSCT No
Oklahoma City VAMC, OK Yes Yes Yes Yes No PSCT Yes
Michael E. DeBakey VAMC, Houston, TX Yes Yes Yes Yes Yes PNS Yes
VA North Texas Health Care System, Dallas, TX Yes Yes Yes Yes Yes PNS Yes
South Texas Veterans Health Care System, San Antonio, Kerrville, TX Yes Yes Yes Yes Yes PSCT Yes
Central Texas Veterans Health Care System, Temple, Waco, Marlin, TX Yes Yes Yes Yes No PSCT Yes

78
Carl T. Hayden VAMC, Phoenix, AZ Yes Yes Yes Yes No PSCT Yes No. Arizona VA Health Care System, Prescott, AZ Yes No Yes Yes No PPOC Yes
So. Arizona VA Health Care System, Tucson, AZ Yes Yes Yes Yes No PNS Yes New Mexico Health Care System, Albuquerque, NM Yes Yes Yes Yes Yes PSCT Yes
Amarillo VA Health Care System, TX Yes No Yes Yes No PPOC Yes West Texas VA Health Care System, Big Spring, TX Yes No No No No PPOC Yes
El Paso VA Health Care System, TX No No No No No PPOC No VA Eastern Colorado Health Care System, Denver, Pueblo, CO Yes Yes Yes Yes No PNS Yes
Grand Junction VAMC, CO Yes Yes Yes Yes No PSCT Yes VA Montana Health Care System, Fort Harrison, MT Yes No Yes Yes No PPOC Yes
VA Salt Lake City Health Care System, UT Yes Yes Yes Yes No PSCT No
Cheyenne VAMC, WY Yes No Yes Yes No PPOC Yes
Sheridan VAMC, WY Yes Yes No No PPOC Yes Alaska VA Health Care System and Regional Office, Anchorage, AK No No No No No PPOC No
Boise VAMC, ID Yes Yes Yes Yes No PSCT Yes
Portland VAMC, OR Yes Yes Yes Yes No PSCT Yes
VA Roseburg Health Care System, OR Yes Yes Yes Yes No PPOC Yes
Southern Oregon Rehab Center & Clinics, White City, OR No No No No No PPOC No
VA Puget Sound Health Care System, Seattle, American Lake, WA Yes Yes Yes Yes Yes PNS Yes
Spokane VAMC, WA Yes Yes Yes Yes No PPOC Yes
Jonathan M. Wainwright Memorial VA Medical Center, Walla Walla, WA No No No No No PPOC No
VA Central California Health Care System, Fresno, CA Yes Yes Yes Yes No PPOC Yes
VA Northern California Health Care System, Martinez, Sacramento, CA Yes Yes Yes Yes No PSCT Yes
VA Palo Alto Health Care System, Palo Alto, Menlo Pk, Livermore, CA Yes Yes Yes Yes Yes PRC/
PNS Yes
San Francisco VAMC, CA Yes Yes Yes Yes No PSCT Yes
VA Pacific Islands Health Care System, Honolulu, HI No Yes No No No PPOC Yes
VA Sierra Nevada Health Care System, Reno, NV Yes Yes Yes Yes No PPOC Yes
VA Loma Linda Health Care System, CA Yes Yes Yes Yes No PSCT Yes

79
VA Long Beach Health Care System, CA Yes Yes Yes Yes Yes PSCT Yes
VA Greater Los Angeles Health Care System, CA Yes Yes Yes Yes No PNS Yes
VA San Diego Health Care System, CA Yes Yes Yes Yes Yes PSCT Yes
VA Southern Nevada Health Care System, Las Vegas, NV Yes No Yes Yes No PPOC No
VA Nebraska Western Iowa Health Care System, Omaha, Grand Is, Lincoln, NE Yes Yes Yes Yes No PPOC Yes
VA Central Iowa Health Care System, Des Moines, Knoxville, IA Yes Yes Yes Yes No PPOC Yes
Iowa City VAMC, IA Yes Yes Yes Yes No PSCT No
Minneapolis VAMC, MN Yes Yes Yes Yes Yes PRC/ PNS Yes
St. Cloud VAMC, MN No Yes No No No PSCT Yes
Fargo VAMC, ND Yes Yes Yes Yes No PPOC Yes
VA Black Hills Health Care System, Ft Meade, Hot Springs, SD Yes Yes Yes Yes No PSCT Yes
Sioux Falls VAMC, SD Yes Yes Yes Yes No PSCT Yes

Hospital Services
80
Facility Name
Faci
lity
Uni
que
Pat
ient
s
Med
Sur
g H
ospi
tal
Dis
char
ges
Med
Sur
g H
ospi
tal
Dis
char
ges
Med
Sur
g LO
S
Bed
Day
s of
Car
e
Men
tal H
ealth
Hos
pita
l D
isch
arge
s
Uni
que
Men
tal H
ealth
H
ospi
tal D
isch
arge
s
Men
tal H
ealth
LO
S
Men
tal H
ealth
Bed
Day
s of
C
are
VA Connecticut Health Care System, West Haven, CT 56,162 3,886 69.2 7.2 496.5 786 14.0 14.3 200.1
Edith N Rogers Memorial Veterans Hospital, Bedford, Ma 18,295 NA NA NA NA 171 9.3 3.4 31.6
VA Boston Health Care System, W Roxbury, Brockton, Jamaica Plains, MA 61,902 6,261 101.1 6.3 632.2 2,281 36.8 17.2 633.1
Northampton VAMC, MA 14,691 NA NA NA NA 268 18.2 6.0 108.6
Togus VAMC, Augusta, ME 39,544 1,814 45.9 6.0 273.2 39 1.0 5.4 5.3
Manchester VAMC, NH 22,411 NA NA NA NA NA NA NA NA
Providence VAMC, RI 32,313 2,759 85.4 5.1 437.0 412 12.8 9.9 125.8
White River Junction VAMC, VT 24,228 2,051 84.7 5.5 467.5 290 12.0 9.9 118.0
Samuel S. Stratton VAMC, Albany, NY 43,178 2,136 49.5 6.4 314.5 452 10.5 9.8 102.9
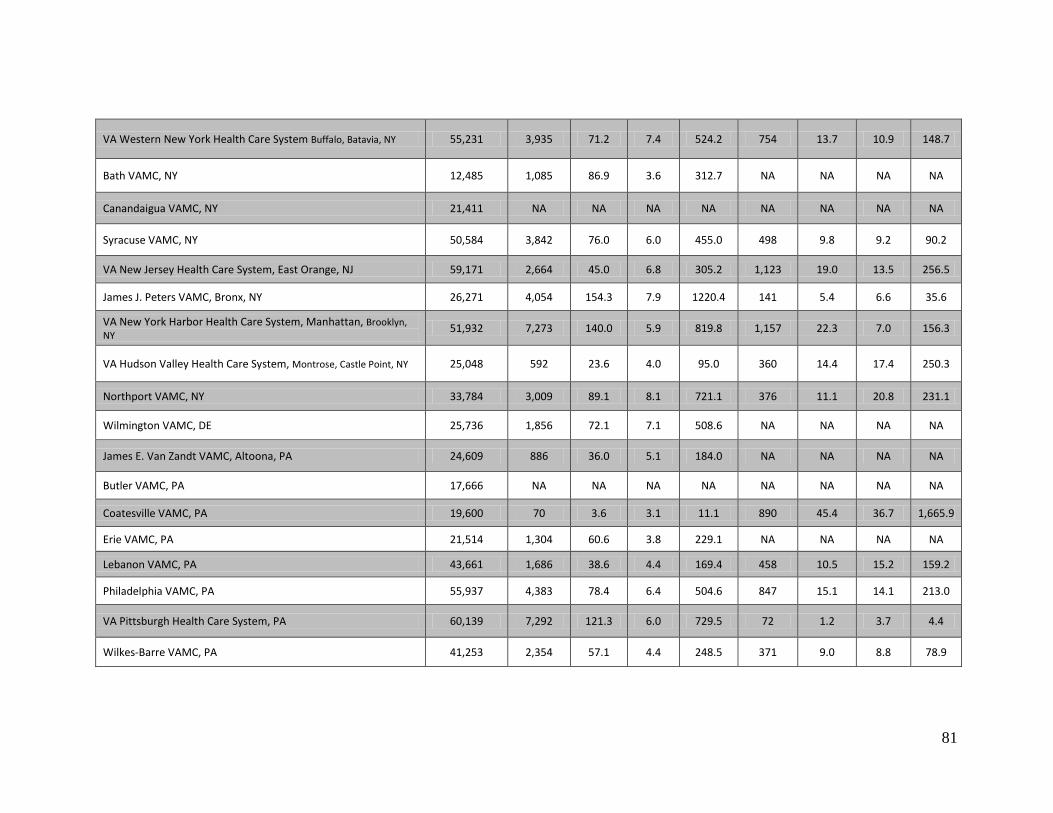
81
VA Western New York Health Care System Buffalo, Batavia, NY 55,231 3,935 71.2 7.4 524.2 754 13.7 10.9 148.7
Bath VAMC, NY 12,485 1,085 86.9 3.6 312.7 NA NA NA NA
Canandaigua VAMC, NY 21,411 NA NA NA NA NA NA NA NA
Syracuse VAMC, NY 50,584 3,842 76.0 6.0 455.0 498 9.8 9.2 90.2
VA New Jersey Health Care System, East Orange, NJ 59,171 2,664 45.0 6.8 305.2 1,123 19.0 13.5 256.5
James J. Peters VAMC, Bronx, NY 26,271 4,054 154.3 7.9 1220.4 141 5.4 6.6 35.6
VA New York Harbor Health Care System, Manhattan, Brooklyn, NY 51,932 7,273 140.0 5.9 819.8 1,157 22.3 7.0 156.3
VA Hudson Valley Health Care System, Montrose, Castle Point, NY 25,048 592 23.6 4.0 95.0 360 14.4 17.4 250.3
Northport VAMC, NY 33,784 3,009 89.1 8.1 721.1 376 11.1 20.8 231.1
Wilmington VAMC, DE 25,736 1,856 72.1 7.1 508.6 NA NA NA NA
James E. Van Zandt VAMC, Altoona, PA 24,609 886 36.0 5.1 184.0 NA NA NA NA
Butler VAMC, PA 17,666 NA NA NA NA NA NA NA NA
Coatesville VAMC, PA 19,600 70 3.6 3.1 11.1 890 45.4 36.7 1,665.9
Erie VAMC, PA 21,514 1,304 60.6 3.8 229.1 NA NA NA NA
Lebanon VAMC, PA 43,661 1,686 38.6 4.4 169.4 458 10.5 15.2 159.2
Philadelphia VAMC, PA 55,937 4,383 78.4 6.4 504.6 847 15.1 14.1 213.0
VA Pittsburgh Health Care System, PA 60,139 7,292 121.3 6.0 729.5 72 1.2 3.7 4.4
Wilkes-Barre VAMC, PA 41,253 2,354 57.1 4.4 248.5 371 9.0 8.8 78.9

82
Louis A. Johnson VAMC, Clarksburg, WV 20,947 2,393 114.2 5.2 598.5 297 14.2 7.3 102.8
Washington DC VAMC, DC 59,526 4,673 78.5 5.6 440.5 874 14.7 8.7 127.9
VA Maryland Health Care System, Perry Pt, Baltimore, MD 53,249 5,885 110.5 5.2 578.6 92 1.7 3.6 6.2
Martinsburg VAMC, WV 32,921 2,227 67.6 5.6 381.1 821 24.9 4.6 115.8
Asheville VAMC, NC 33,232 4,210 126.7 6.1 778.4 635 19.1 8.9 169.4
Durham VAMC, NC 51,880 5,245 101.1 6.0 602.3 1,071 20.6 8.5 175.1
Fayetteville VAMC, NC 46,509 1,997 42.9 4.7 202.2 854 18.4 6.8 124.7
W.G. (Bill) Hefner VAMC, Salisbury, NC 77,685 1,180 15.2 7.5 113.5 607 7.8 10.5 82.1
Hampton VAMC, VA 35,176 1,425 40.5 8.1 328.0 976 27.7 9.2 254.2
Hunter Holmes McGuire VAMC, Richmond, VA 43,845 5,215 118.9 5.4 638.8 663 15.1 7.4 111.4
Salem VAMC, VA 34,848 4,065 116.6 5.3 621.2 769 22.1 11.2 247.7
Beckley VAMC, WV 13,574 1,707 125.8 6.4 803.1 NA NA NA NA
Birmingham VAMC, AL 55,554 5,031 90.6 4.7 425.2 NA NA NA NA
Central Alabama Veterans Health Care System, Tuskegee, Montgomery, AL 40,553 966 23.8 8.8 210.3 959 23.6 10.7 252.1
Tuscaloosa VAMC, AL 15,502 NA NA NA NA 427 27.5 14.9 410.3
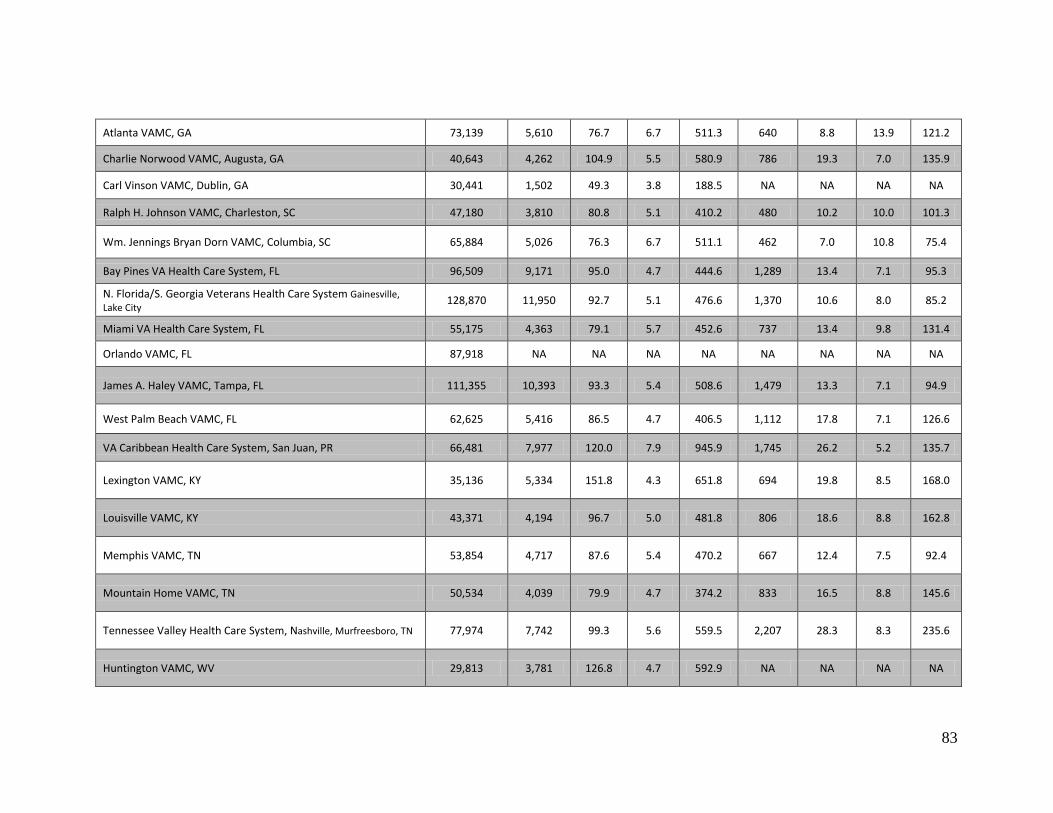
83
Atlanta VAMC, GA 73,139 5,610 76.7 6.7 511.3 640 8.8 13.9 121.2
Charlie Norwood VAMC, Augusta, GA 40,643 4,262 104.9 5.5 580.9 786 19.3 7.0 135.9
Carl Vinson VAMC, Dublin, GA 30,441 1,502 49.3 3.8 188.5 NA NA NA NA
Ralph H. Johnson VAMC, Charleston, SC 47,180 3,810 80.8 5.1 410.2 480 10.2 10.0 101.3
Wm. Jennings Bryan Dorn VAMC, Columbia, SC 65,884 5,026 76.3 6.7 511.1 462 7.0 10.8 75.4
Bay Pines VA Health Care System, FL 96,509 9,171 95.0 4.7 444.6 1,289 13.4 7.1 95.3
N. Florida/S. Georgia Veterans Health Care System Gainesville, Lake City 128,870 11,950 92.7 5.1 476.6 1,370 10.6 8.0 85.2
Miami VA Health Care System, FL 55,175 4,363 79.1 5.7 452.6 737 13.4 9.8 131.4
Orlando VAMC, FL 87,918 NA NA NA NA NA NA NA NA
James A. Haley VAMC, Tampa, FL 111,355 10,393 93.3 5.4 508.6 1,479 13.3 7.1 94.9
West Palm Beach VAMC, FL 62,625 5,416 86.5 4.7 406.5 1,112 17.8 7.1 126.6
VA Caribbean Health Care System, San Juan, PR 66,481 7,977 120.0 7.9 945.9 1,745 26.2 5.2 135.7
Lexington VAMC, KY 35,136 5,334 151.8 4.3 651.8 694 19.8 8.5 168.0
Louisville VAMC, KY 43,371 4,194 96.7 5.0 481.8 806 18.6 8.8 162.8
Memphis VAMC, TN 53,854 4,717 87.6 5.4 470.2 667 12.4 7.5 92.4
Mountain Home VAMC, TN 50,534 4,039 79.9 4.7 374.2 833 16.5 8.8 145.6
Tennessee Valley Health Care System, Nashville, Murfreesboro, TN 77,974 7,742 99.3 5.6 559.5 2,207 28.3 8.3 235.6
Huntington VAMC, WV 29,813 3,781 126.8 4.7 592.9 NA NA NA NA

84
Chillicothe VAMC, OH 20,184 1,990 98.6 4.5 441.3 1,167 57.8 7.7 444.1
Cincinnati VAMC, OH 35,327 4,748 134.4 4.5 604.6 770 21.8 8.2 179.0
Louis Stokes VAMC, Cleveland, Brecksville, OH 97,146 7,340 75.6 5.9 444.5 1,122 11.5 12.1 140.3
Chalmers P. Wylie Outpt Clinic, Columbus, OH 32,681 NA NA NA NA NA NA NA NA
Dayton VAMC, OH 36,253 4,259 117.5 4.5 524.2 775 21.4 8.2 175.5
VA Illiana Health Care System, Danville, IL 31,920 2,384 74.7 3.5 263.0 46 1.4 3.0 4.3
VA Northern Indiana Health Care System, Marion, Ft Wayne, IN 40,794 1,587 38.9 5.4 211.8 366 9.0 16.1 144.5
Richard L. Roudebush VAMC, Indianapolis, IN 54,511 7,517 137.9 4.9 680.3 565 10.4 7.1 73.4
VA Ann Arbor Health Care System, MI 49,227 4,605 93.5 5.4 502.3 517 10.5 11.0 115.1
Battle Creek VAMC, MI 36,520 366 10.0 6.8 68.4 273 7.5 4.6 34.6
John D. Dingell VAMC, Detroit, MI 42,396 3,479 82.1 5.2 426.9 1,125 26.5 7.6 201.9
Aleda E. Lutz VAMC, Saginaw, MI 27,919 781 28.0 2.8 77.2 NA NA NA NA
Jessie Brown VAMC, Chicago, IL 42,039 5,451 129.7 4.7 614.5 1,190 28.3 9.4 267.2
Edward Hines Jr. VA Hospital, Hines, IL 56,947 5,658 99.4 5.1 511.1 814 14.3 8.3 118.6
North Chicago VAMC, IL 34,644 2,285 66.0 3.9 260.3 936 27.0 5.0 135.3
Iron Mountain VAMC, MI 19,065 985 51.7 3.5 181.4 NA NA NA NA
William S. Middleton Memorial Veterans Hospital, Madison, WI 37,223 3,354 90.1 6.0 542.0 646 17.4 6.7 116.0

85
Clement J. Zablocki VAMC, Milwaukee, WI 59,188 5,475 92.5 4.9 451.2 1,332 22.5 4.8 107.9
Tomah VAMC, WI 24,653 596 24.2 3.4 81.4 329 13.3 5.2 69.0
VA Eastern Kansas Health Care System, Topeka, Leavenworth, KS 36,467 2,835 77.7 4.1 317.0 851 23.3 7.8 181.9
Robert J. Dole VAMC, Wichita, KS 27,930 2,002 71.7 4.2 302.5 NA NA NA NA
Harry S. Truman VAMC, Columbia, MO 31,947 3,061 95.8 4.7 451.4 333 10.4 6.7 69.7
Kansas City VAMC, MO 42,963 5,228 121.7 4.7 572.7 1,184 27.6 5.3 145.2
Marion VAMC, IL 44,043 2,999 68.1 4.5 305.1 NA NA NA NA
John J. Pershing VAMC, Poplar Bluff, MO 18,913 1,392 73.6 3.7 270.7 NA NA NA NA
St Louis VAMC, St Louis, Jefferson Barracks, MO 52,748 6,354 120.5 4.5 542.3 1,628 30.9 8.5 263.0
Fayetteville VAMC, AR 50,131 3,641 72.6 4.5 326.8 756 15.1 6.3 95.4
Central Arkansas Veterans Health Care System, Little Rock, N Little Rock, AR 74,828 9,441 126.2 5.8 733.5 894 11.9 4.4 52.5
Alexandria VAMC, LA 28,707 1,483 51.7 7.3 378.5 534 18.6 10.9 203.0
New Orleans VAMC, LA 35,078 NA NA NA NA NA NA NA NA
Overton Brooks VAMC, Shreveport, LA 37,935 5,017 132.3 5.2 686.0 715 18.8 6.9 129.5
Gulf Coast Veterans Health Care System, Biloxi, MS 57,230 1,739 30.4 5.7 172.1 561 9.8 10.4 102.0
G.V. Montgomery VAMC, Jackson, MS 44,689 4,553 101.9 5.3 539.9 744 16.6 8.1 134.8
Muskogee VAMC, OK 34,671 3,494 100.8 4.7 478.2 599 17.3 6.6 113.5
Oklahoma City VAMC, OK 52,983 4,950 93.4 6.3 588.2 844 15.9 7.7 123.4
Michael E. DeBakey VAMC, Houston, TX 88,433 10,149 114.8 6.0 691.7 1,677 19.0 9.3 176.9
VA North Texas Health Care System, Dallas, TX 104,975 12,139 115.6 4.9 566.2 1,024 9.8 10.4 101.3

86
South Texas Veterans Health Care System, San Antonio, Kerrville, TX 92,352 7,539 81.6 6.3 515.2 1,323 14.3 6.7 96.0
Central Texas Veterans Health Care System, Temple, Waco, Marlin, TX 80,821 5,344 66.1 6.8 448.3 1,421 17.6 14.9 261.8
Carl T. Hayden VAMC, Phoenix, AZ 76,271 5,010 65.7 5.2 340.7 1,311 17.2 7.8 133.9
No. Arizona VA Health Care System, Prescott, AZ 24,237 1,593 65.7 5.1 338.2 NA NA NA NA
So. Arizona VA Health Care System, Tucson, AZ 50,655 6,454 127.4 4.8 607.4 1,224 24.2 7.3 176.1
New Mexico Health Care System, Albuquerque, NM 57,014 5,492 96.3 5.2 496.1 568 10.0 12.1 121.0
Amarillo VA Health Care System, TX 25,536 2,294 89.8 4.6 416.9 NA NA NA NA
West Texas VA Health Care System, Big Spring, TX 17,613 546 31.0 3.0 92.9 NA NA NA NA
El Paso VA Health Care System, TX 25,634 NA NA NA NA NA NA NA NA
VA Eastern Colorado Health Care System, Denver, Pueblo, CO 63,980 4,218 65.9 4.8 318.3 799 12.5 14.7 183.1
Grand Junction VAMC, CO 11,801 1,220 103.4 3.6 370.4 325 27.5 4.4 120.5
VA Montana Health Care System, Fort Harrison, MT 32,296 2,110 65.3 4.5 296.6 NA NA NA NA
VA Salt Lake City Health Care System, UT 46,199 4,616 99.9 4.0 404.3 646 14.0 9.4 130.8
Cheyenne VAMC, WY 17,366 1,104 63.6 4.8 305.3 NA NA NA NA
Sheridan VAMC, WY 12,565 318 25.3 3.6 92.2 55 4.4 13.9 60.7
Alaska VA Health Care System and Regional Office, Anchorage, AK 16,008 NA NA NA NA NA NA NA NA
Boise VAMC, ID 24,187 2,490 102.9 4.1 424.2 358 14.8 8.8 129.9
Portland VAMC, OR 68,454 8,154 119.1 5.2 614.6 810 11.8 7.7 90.5
VA Roseburg Health Care System, OR 27,160 1,741 64.1 4.0 254.3 445 16.4 7.3 120.1
Southern Oregon Rehab Center & Clinics, White City, OR 15,604 NA NA NA NA NA NA NA NA

87
VA Puget Sound Health Care System, Seattle, American Lake, WA 74,049 5,750 77.7 5.7 445.4 1,535 20.7 9.5 197.1
Spokane VAMC, WA 26,192 1,516 57.9 4.5 258.7 288 11.0 9.3 101.8
Jonathan M. Wainwright Memorial VA Medical Center, Walla Walla, WA 16,536 NA NA NA NA NA NA NA NA
VA Central California Health Care System, Fresno, CA 25,558 2,637 103.2 4.9 510.7 639 25.0 5.6 140.6
VA Northern California Health Care System, Martinez, Sacramento, CA 78,115 3,742 47.9 3.5 167.5 180 2.3 7.2 16.6
VA Palo Alto Health Care System, Palo Alto, Menlo Pk, Livermore, CA 61,530 4,376 71.1 6.1 437.3 1,367 22.2 17.0 377.7
San Francisco VAMC, CA 55,242 4,397 79.6 5.9 473.4 315 5.7 12.3 70.2
VA Pacific Islands Health Care System, Honolulu, HI 24,344 NA NA NA NA 265 10.9 11.9 129.7
VA Sierra Nevada Health Care System, Reno, NV 27,605 3,135 113.6 4.7 528.2 591 21.4 6.2 132.9
VA Loma Linda Health Care System, CA 61,369 6,491 105.8 5.5 578.5 1,126 18.3 6.8 124.5
VA Long Beach Health Care System, CA 45,944 4,735 103.1 5.7 591.5 596 13.0 13.0 169.0
VA Greater Los Angeles Health Care System, CA 80,343 5,842 72.7 6.1 441.2 758 9.4 14.8 139.6
VA San Diego Health Care System, CA 64,842 5,387 83.1 5.1 420.3 1,113 17.2 17.9 308.1
VA Southern Nevada Health Care System, Las Vegas, NV 42,797 2,435 56.9 5.3 301.9 NA NA NA NA
VA Nebraska Western Iowa Health Care System, Omaha, Grand Is, Lincoln, NE 48,901 4,491 91.8 4.3 397.6 523 10.7 5.7 61.0
VA Central Iowa Health Care System, Des Moines, Knoxville, IA 33,692 2,253 66.9 4.4 297.5 337 10.0 6.5 64.9
Iowa City VAMC, IA 45,727 2,914 63.7 4.5 289.9 572 12.5 5.5 68.9

88
Minneapolis VAMC, MN 86,421 6,911 80.0 4.7 373.0 520 6.0 6.6 39.6
St. Cloud VAMC, MN 34,387 NA NA NA NA 686 19.9 4.9 98.1
Fargo VAMC, ND 29,921 1,401 46.8 5.2 242.9 218 7.3 7.2 52.4
VA Black Hills Health Care System, Ft Meade, Hot Springs, SD 20,965 1,300 62.0 4.1 255.4 258 12.3 7.8 96.1
Sioux Falls VAMC, SD 27,120 1,780 65.6 4.0 263.2 43 1.6 6.1 9.7
Hospital Services (continued)
Facility NameU
pper
GI
Col
onos
copy
Sigm
oido
scop
y
Bron
chos
copy
ENT
End
osco
py
Tota
l Out
patie
nt v
isits
VA Connecticut Health Care System, West Haven, CT 1,121 2,171 95 71 658 605,056
Edith N Rogers Memorial Veterans Hospital, Bedford, Ma NA NA NA NA NA 203,505
VA Boston Health Care System, W Roxbury, Brockton, Jamaica Plains, MA 815 1,594 164 273 1,194 684,091
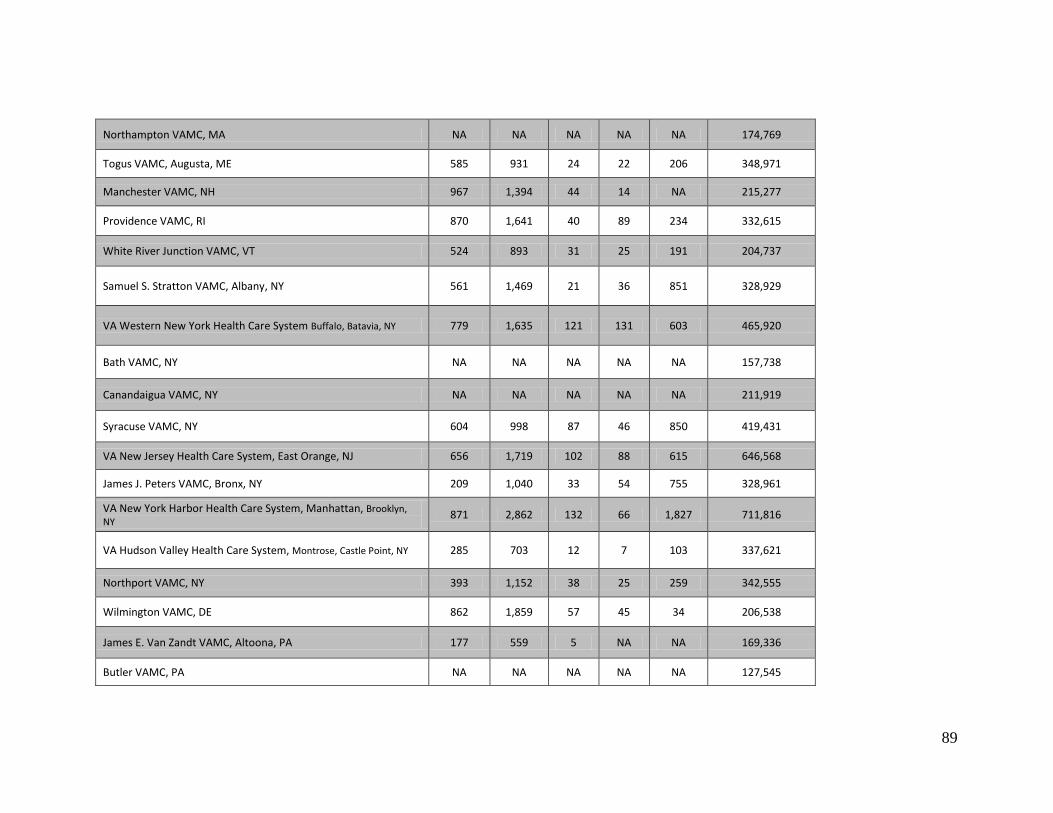
89
Northampton VAMC, MA NA NA NA NA NA 174,769
Togus VAMC, Augusta, ME 585 931 24 22 206 348,971
Manchester VAMC, NH 967 1,394 44 14 NA 215,277
Providence VAMC, RI 870 1,641 40 89 234 332,615
White River Junction VAMC, VT 524 893 31 25 191 204,737
Samuel S. Stratton VAMC, Albany, NY 561 1,469 21 36 851 328,929
VA Western New York Health Care System Buffalo, Batavia, NY 779 1,635 121 131 603 465,920
Bath VAMC, NY NA NA NA NA NA 157,738
Canandaigua VAMC, NY NA NA NA NA NA 211,919
Syracuse VAMC, NY 604 998 87 46 850 419,431
VA New Jersey Health Care System, East Orange, NJ 656 1,719 102 88 615 646,568
James J. Peters VAMC, Bronx, NY 209 1,040 33 54 755 328,961
VA New York Harbor Health Care System, Manhattan, Brooklyn, NY 871 2,862 132 66 1,827 711,816
VA Hudson Valley Health Care System, Montrose, Castle Point, NY 285 703 12 7 103 337,621
Northport VAMC, NY 393 1,152 38 25 259 342,555
Wilmington VAMC, DE 862 1,859 57 45 34 206,538
James E. Van Zandt VAMC, Altoona, PA 177 559 5 NA NA 169,336
Butler VAMC, PA NA NA NA NA NA 127,545

90
Coatesville VAMC, PA NA NA NA NA NA 175,777
Erie VAMC, PA 144 714 8 16 129 243,396
Lebanon VAMC, PA 1,106 3,186 44 42 433 439,743
Philadelphia VAMC, PA 428 663 140 53 2,106 486,263
VA Pittsburgh Health Care System, PA 1,336 2,177 97 119 1,136 538,469
Wilkes-Barre VAMC, PA 238 671 5 32 NA 369,879
Louis A. Johnson VAMC, Clarksburg, WV 550 1,115 21 31 134 233,275
Washington DC VAMC, DC 1,227 2,291 74 47 801 595,659
VA Maryland Health Care System, Perry Pt, Baltimore, MD 651 1,713 113 58 420 631,676
Martinsburg VAMC, WV 930 1,403 74 44 90 380,102
Asheville VAMC, NC 805 1,218 29 94 367 316,846
Durham VAMC, NC 1,013 1,867 116 195 1,541 472,003
Fayetteville VAMC, NC 1,196 3,665 41 NA NA 362,932
W.G. (Bill) Hefner VAMC, Salisbury, NC 1,372 2,208 42 43 166 572,869
Hampton VAMC, VA 375 1,209 65 22 37 401,248
Hunter Holmes McGuire VAMC, Richmond, VA 1,319 1,493 219 79 617 444,721

91
Salem VAMC, VA 692 1,767 36 49 121 353,728
Beckley VAMC, WV 477 782 11 35 87 147,658
Birmingham VAMC, AL 758 2,159 38 139 649 566,217
Central Alabama Veterans Health Care System, Tuskegee, Montgomery, AL 232 791 44 44 NA 383,113
Tuscaloosa VAMC, AL NA NA NA NA NA 172,928
Atlanta VAMC, GA 1,101 2,764 147 230 1,281 826,081
Charlie Norwood VAMC, Augusta, GA 594 1,678 34 32 742 419,269
Carl Vinson VAMC, Dublin, GA 371 1,303 17 NA NA 237,554
Ralph H. Johnson VAMC, Charleston, SC 806 1,458 47 197 1,337 575,223
Wm. Jennings Bryan Dorn VAMC, Columbia, SC 806 2,930 59 49 390 754,148
Bay Pines VA Health Care System, FL 1,390 3,842 89 121 1,134 1,207,961
N. Florida/S. Georgia Veterans Health Care System Gainesville, Lake City 2,374 7,478 1,523 397 708 1,264,605
Miami VA Health Care System, FL 835 1,522 120 96 197 659,974
Orlando VAMC, FL 788 2,688 91 9 615 896,888
James A. Haley VAMC, Tampa, FL 2,049 3,960 235 146 1,558 1,014,547
West Palm Beach VAMC, FL 1,771 2,676 50 102 124 609,301
VA Caribbean Health Care System, San Juan, PR 1,196 1,775 67 56 1,135 913,800
Lexington VAMC, KY 690 1,788 91 94 116 398,572

92
Louisville VAMC, KY 1,143 2,023 82 95 309 484,324
Memphis VAMC, TN 1,132 1,228 58 113 177 577,156
Mountain Home VAMC, TN 736 1,632 60 135 185 555,186
Tennessee Valley Health Care System, Nashville, Murfreesboro, TN 1,339 3,161 224 217 800 713,855
Huntington VAMC, WV 612 1,595 75 86 98 308,873
Chillicothe VAMC, OH 29 70 79 10 9 285,621
Cincinnati VAMC, OH 802 1,392 226 119 521 438,617
Louis Stokes VAMC, Cleveland, Brecksville, OH 1,296 1,861 156 261 1,338 1,331,446
Chalmers P. Wylie Outpt Clinic, Columbus, OH 422 1,108 22 28 99 354,573
Dayton VAMC, OH 953 1,385 48 23 355 390,605
VA Illiana Health Care System, Danville, IL 292 535 44 11 NA 274,622
VA Northern Indiana Health Care System, Marion, Ft Wayne, IN 567 1,012 12 28 149 290,051
Richard L. Roudebush VAMC, Indianapolis, IN 1,917 2,967 47 161 1,387 494,318
VA Ann Arbor Health Care System, MI 1,514 2,708 98 209 712 389,840
Battle Creek VAMC, MI NA NA 118 NA NA 344,382
John D. Dingell VAMC, Detroit, MI 803 1,394 68 82 305 421,615

93
Aleda E. Lutz VAMC, Saginaw, MI 285 607 24 19 NA 247,788
Jessie Brown VAMC, Chicago, IL 911 2,480 201 109 339 510,498
Edward Hines Jr. VA Hospital, Hines, IL 908 1,673 31 102 657 643,883
North Chicago VAMC, IL 362 779 23 24 57 254,905
Iron Mountain VAMC, MI 144 428 11 NA NA 154,663
William S. Middleton Memorial Veterans Hospital, Madison, WI 672 852 278 147 196 288,883
Clement J. Zablocki VAMC, Milwaukee, WI 857 1,979 87 102 965 630,465
Tomah VAMC, WI NA NA NA NA NA 172,237
VA Eastern Kansas Health Care System, Topeka, Leavenworth, KS 879 1,772 71 29 14 399,273
Robert J. Dole VAMC, Wichita, KS 664 1,326 39 18 276 238,784
Harry S. Truman VAMC, Columbia, MO 842 1,440 37 147 377 331,085
Kansas City VAMC, MO 1,213 1,605 69 114 1,121 458,618
Marion VAMC, IL 1,786 647 37 22 45 385,604
John J. Pershing VAMC, Poplar Bluff, MO 157 707 8 NA NA 167,761
St Louis VAMC, St Louis, Jefferson Barracks, MO 823 2,926 129 43 1,430 573,693
Fayetteville VAMC, AR 1,378 2,072 47 72 NA 483,330
Central Arkansas Veterans Health Care System, Little Rock, N Little Rock, AR 1,468 3,151 89 219 844 692,333
Alexandria VAMC, LA 216 709 27 24 184 222,166
New Orleans VAMC, LA 5 9 NA NA 631 378,262
Overton Brooks VAMC, Shreveport, LA 1,015 2,067 109 157 772 379,833

94
Gulf Coast Veterans Health Care System, Biloxi, MS 397 945 27 77 706 513,084
G.V. Montgomery VAMC, Jackson, MS 402 1,134 65 131 864 424,417
Muskogee VAMC, OK 501 1,816 51 117 198 344,433
Oklahoma City VAMC, OK 942 1,340 60 99 768 461,314
Michael E. DeBakey VAMC, Houston, TX 1,654 2,523 467 256 729 983,468
VA North Texas Health Care System, Dallas, TX 1,617 2,098 242 88 1,633 1,177,605
South Texas Veterans Health Care System, San Antonio, Kerrville, TX 1,399 3,620 460 119 233 1,065,925
Central Texas Veterans Health Care System, Temple, Waco, Marlin, TX 862 1,520 101 127 535 961,082
Carl T. Hayden VAMC, Phoenix, AZ 1,563 3,723 255 63 887 688,447
No. Arizona VA Health Care System, Prescott, AZ 97 554 11 NA NA 251,025
So. Arizona VA Health Care System, Tucson, AZ 1,202 1,716 47 90 274 622,880
New Mexico Health Care System, Albuquerque, NM 1,111 2,416 178 41 398 586,519
Amarillo VA Health Care System, TX 710 1,142 32 62 14 224,127
West Texas VA Health Care System, Big Spring, TX 127 481 9 NA NA 150,737
El Paso VA Health Care System, TX NA 1,311 15 NA NA 270,822
VA Eastern Colorado Health Care System, Denver, Pueblo, CO 1,315 2,108 312 258 708 644,026
Grand Junction VAMC, CO 390 925 11 17 116 127,220
VA Montana Health Care System, Fort Harrison, MT 565 1,625 79 35 120 282,355
VA Salt Lake City Health Care System, UT 886 1,730 6 31 425 496,287
Cheyenne VAMC, WY 200 699 27 30 153 179,630
Sheridan VAMC, WY 171 583 16 NA 19 113,184

95
Alaska VA Health Care System and Regional Office, Anchorage, AK 6 497 15 NA NA 142,246
Boise VAMC, ID 911 1,417 54 86 149 287,334
Portland VAMC, OR 1,383 3,214 193 150 1,921 633,944
VA Roseburg Health Care System, OR 891 1,743 59 56 276 237,147
Southern Oregon Rehab Center & Clinics, White City, OR NA NA NA NA NA 195,629
VA Puget Sound Health Care System, Seattle, American Lake, WA 1,358 2,386 140 140 559 805,449
Spokane VAMC, WA 1,087 1,712 33 16 NA 262,626
Jonathan M. Wainwright Memorial VA Medical Center, Walla Walla, WA 411 462 5 NA NA 149,258
VA Central California Health Care System, Fresno, CA 796 1,446 46 28 NA 297,617
VA Northern California Health Care System, Martinez, Sacramento, CA 1,577 3,211 122 104 551 823,621
VA Palo Alto Health Care System, Palo Alto, Menlo Pk, Livermore, CA 1,146 2,808 127 76 1,598 634,053
San Francisco VAMC, CA 821 1,493 76 93 505 459,265
VA Pacific Islands Health Care System, Honolulu, HI 373 1,161 19 NA NA 175,102
VA Sierra Nevada Health Care System, Reno, NV 483 1,014 13 19 31 303,365
VA Loma Linda Health Care System, CA 1,580 1,063 1,439 96 215 591,340
VA Long Beach Health Care System, CA 937 1,669 1,315 97 662 547,731
VA Greater Los Angeles Health Care System, CA 698 1,254 138 226 803 1,168,249

96
VA San Diego Health Care System, CA 994 1,657 1,031 52 890 680,990
VA Southern Nevada Health Care System, Las Vegas, NV 35 62 9 66 275 459,760
VA Nebraska Western Iowa Health Care System, Omaha, Grand Is, Lincoln, NE 767 1,434 776 83 622 439,482
VA Central Iowa Health Care System, Des Moines, Knoxville, IA 410 1,091 38 67 44 305,305
Iowa City VAMC, IA 662 1,343 37 87 1,007 323,959
Minneapolis VAMC, MN 1,407 2,534 509 141 1,776 685,826
St. Cloud VAMC, MN 432 1,069 13 NA NA 281,376
Fargo VAMC, ND 554 1,520 42 32 356 198,976
VA Black Hills Health Care System, Ft Meade, Hot Springs, SD 288 1,103 28 18 19 216,992
Sioux Falls VAMC, SD 817 1,709 46 55 577 231,573
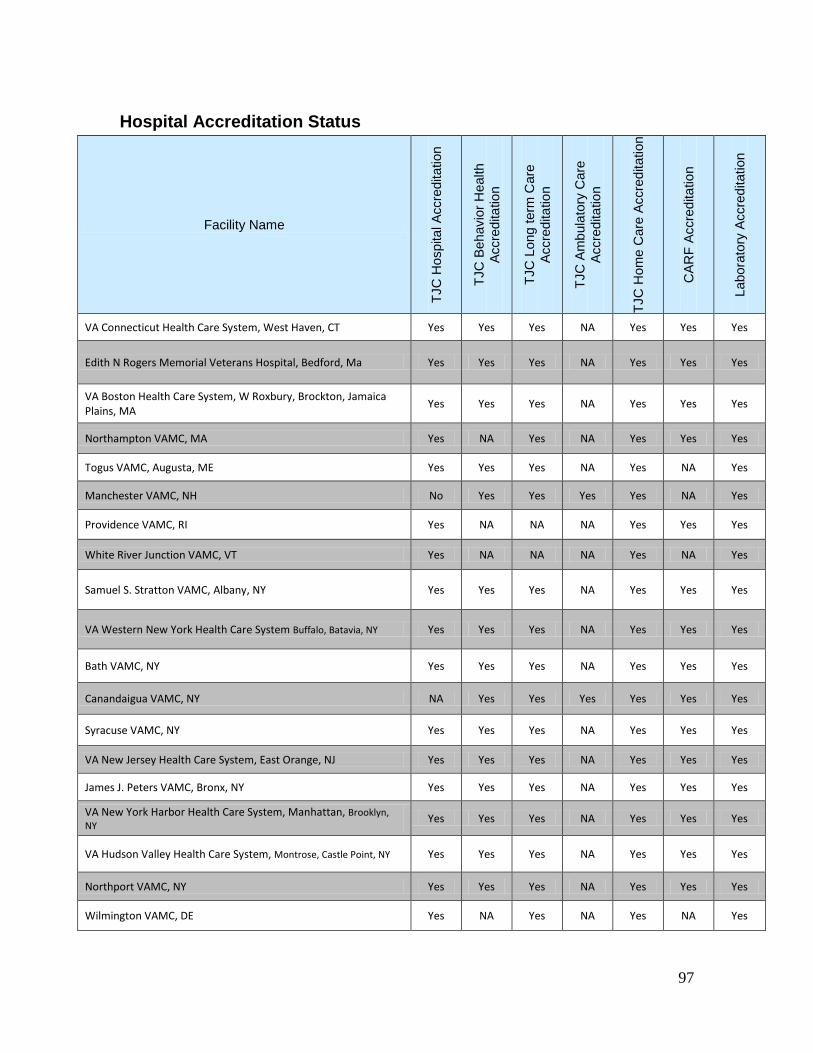
Hospital Accreditation Status
97
Facility Name
TJC
Hos
pita
l Acc
redi
tatio
n
TJC
Beh
avio
r Hea
lth
Accr
edita
tion
TJC
Lon
g te
rm C
are
Accr
edita
tion
TJC
Am
bula
tory
Car
e Ac
cred
itatio
n
TJC
Hom
e C
are
Accr
edita
tion
CAR
F Ac
cred
itatio
n
Labo
rato
ry A
ccre
dita
tion
VA Connecticut Health Care System, West Haven, CT Yes Yes Yes NA Yes Yes Yes
Edith N Rogers Memorial Veterans Hospital, Bedford, Ma Yes Yes Yes NA Yes Yes Yes
VA Boston Health Care System, W Roxbury, Brockton, Jamaica Plains, MA Yes Yes Yes NA Yes Yes Yes
Northampton VAMC, MA Yes NA Yes NA Yes Yes Yes
Togus VAMC, Augusta, ME Yes Yes Yes NA Yes NA Yes
Manchester VAMC, NH No Yes Yes Yes Yes NA Yes
Providence VAMC, RI Yes NA NA NA Yes Yes Yes
White River Junction VAMC, VT Yes NA NA NA Yes NA Yes
Samuel S. Stratton VAMC, Albany, NY Yes Yes Yes NA Yes Yes Yes
VA Western New York Health Care System Buffalo, Batavia, NY Yes Yes Yes NA Yes Yes Yes
Bath VAMC, NY Yes Yes Yes NA Yes Yes Yes
Canandaigua VAMC, NY NA Yes Yes Yes Yes Yes Yes
Syracuse VAMC, NY Yes Yes Yes NA Yes Yes Yes
VA New Jersey Health Care System, East Orange, NJ Yes Yes Yes NA Yes Yes Yes
James J. Peters VAMC, Bronx, NY Yes Yes Yes NA Yes Yes Yes
VA New York Harbor Health Care System, Manhattan, Brooklyn, NY Yes Yes Yes NA Yes Yes Yes
VA Hudson Valley Health Care System, Montrose, Castle Point, NY Yes Yes Yes NA Yes Yes Yes
Northport VAMC, NY Yes Yes Yes NA Yes Yes Yes
Wilmington VAMC, DE Yes NA Yes NA Yes NA Yes

98
James E. Van Zandt VAMC, Altoona, PA Yes Yes Yes NA Yes NA Yes
Butler VAMC, PA NA Yes Yes Yes Yes Yes Yes
Coatesville VAMC, PA Yes Yes Yes NA Yes Yes Yes
Erie VAMC, PA Yes Yes Yes NA Yes NA Yes
Lebanon VAMC, PA Yes Yes Yes NA Yes Yes Yes
Philadelphia VAMC, PA Yes Yes Yes NA Yes Yes Yes
VA Pittsburgh Health Care System, PA Yes Yes Yes NA Yes Yes Yes
Wilkes-Barre VAMC, PA Yes Yes Yes NA Yes Yes Yes
Louis A. Johnson VAMC, Clarksburg, WV Yes Yes Yes NA Yes NA Yes
Washington DC VAMC, DC Yes Yes Yes NA Yes Yes Yes
VA Maryland Health Care System, Perry Pt, Baltimore, MD Yes Yes Yes NA Yes Yes Yes
Martinsburg VAMC, WV Yes Yes Yes NA Yes Yes Yes
Asheville VAMC, NC Yes Yes Yes NA Yes Yes Yes
Durham VAMC, NC Yes Yes Yes NA Yes NA Yes
Fayetteville VAMC, NC Yes NA Yes NA Yes NA Yes
W.G. (Bill) Hefner VAMC, Salisbury, NC Yes Yes Yes NA Yes Yes Yes
Hampton VAMC, VA Yes Yes Yes NA Yes Yes Yes
Hunter Holmes McGuire VAMC, Richmond, VA Yes Yes Yes NA Yes Yes Yes
Salem VAMC, VA Yes Yes Yes NA Yes NA Yes
Beckley VAMC, WV Yes NA Yes NA Yes NA Yes
Birmingham VAMC, AL Yes Yes Yes NA Yes Yes Yes
Central Alabama Veterans Health Care System, Tuskegee, Montgomery, AL Yes Yes Yes NA Yes Yes Yes
Tuscaloosa VAMC, AL Yes Yes Yes NA Yes Yes Yes
Atlanta VAMC, GA Yes Yes Yes NA Yes Yes Yes
Charlie Norwood VAMC, Augusta, GA Yes Yes Yes NA Yes Yes Yes
Carl Vinson VAMC, Dublin, GA Yes Yes Yes NA Yes Yes Yes

99
Ralph H. Johnson VAMC, Charleston, SC Yes Yes Yes NA Yes NA Yes
Wm. Jennings Bryan Dorn VAMC, Columbia, SC Yes Yes Yes NA Yes Yes Yes
Bay Pines VA Health Care System, FL Yes Yes Yes NA Yes Yes Yes
N. Florida/S. Georgia Veterans Health Care System Gainesville, Lake City Yes Yes Yes NA Yes Yes Yes
Miami VA Health Care System, FL Yes Yes Yes NA Yes Yes Yes
Orlando VAMC, FL NA Yes Yes Yes Yes NA Yes
James A. Haley VAMC, Tampa, FL Yes Yes Yes NA Yes Yes Yes
West Palm Beach VAMC, FL Yes Yes Yes NA Yes Yes Yes
VA Caribbean Health Care System, San Juan, PR Yes Yes Yes NA Yes Yes Yes
Lexington VAMC, KY Yes Yes Yes NA Yes NA Yes
Louisville VAMC, KY Yes Yes NA NA Yes Yes Yes
Memphis VAMC, TN Yes Yes Yes NA Yes Yes Yes
Mountain Home VAMC, TN Yes Yes Yes NA Yes Yes Yes
Tennessee Valley Health Care System, Nashville, Murfreesboro, TN Yes Yes Yes NA Yes NA Yes
Huntington VAMC, WV Yes Yes NA NA Yes NA Yes
Chillicothe VAMC, OH Yes Yes Yes NA Yes Yes Yes
Cincinnati VAMC, OH Yes Yes Yes NA Yes Yes Yes
Louis Stokes VAMC, Cleveland, Brecksville, OH Yes Yes Yes NA Yes Yes Yes
Chalmers P. Wylie Outpt Clinic, Columbus, OH NA Yes NA Yes Yes Yes Yes
Dayton VAMC, OH Yes Yes Yes NA Yes Yes Yes
VA Illiana Health Care System, Danville, IL Yes Yes Yes NA Yes Yes Yes
VA Northern Indiana Health Care System, Marion, Ft Wayne, IN Yes Yes Yes NA Yes NA Yes
Richard L. Roudebush VAMC, Indianapolis, IN Yes Yes NA NA Yes Yes Yes
VA Ann Arbor Health Care System, MI Yes Yes Yes NA Yes Yes Yes
Battle Creek VAMC, MI Yes Yes Yes NA Yes Yes Yes

100
John D. Dingell VAMC, Detroit, MI Yes Yes Yes NA Yes Yes Yes
Aleda E. Lutz VAMC, Saginaw, MI Yes Yes Yes NA Yes NA Yes
Jessie Brown VAMC, Chicago, IL Yes Yes NA NA Yes Yes Yes
Edward Hines Jr. VA Hospital, Hines, IL Yes Yes Yes NA Yes Yes Yes
North Chicago VAMC, IL Yes Yes Yes NA Yes Yes Yes
Iron Mountain VAMC, MI Yes NA Yes NA Yes NA Yes
William S. Middleton Memorial Veterans Hospital, Madison, WI Yes Yes Yes NA Yes Yes Yes
Clement J. Zablocki VAMC, Milwaukee, WI Yes Yes Yes NA Yes Yes Yes
Tomah VAMC, WI Yes Yes Yes NA Yes Yes Yes
VA Eastern Kansas Health Care System, Topeka, Leavenworth, KS Yes Yes Yes NA Yes NA Yes
Robert J. Dole VAMC, Wichita, KS Yes NA Yes NA Yes NA Yes
Harry S. Truman VAMC, Columbia, MO Yes Yes Yes NA Yes NA Yes
Kansas City VAMC, MO Yes Yes NA NA Yes NA Yes
Marion VAMC, IL Yes Yes Yes NA Yes NA Yes
John J. Pershing VAMC, Poplar Bluff, MO Yes NA Yes NA Yes NA Yes
St Louis VAMC, St Louis, Jefferson Barracks, MO Yes Yes Yes NA Yes Yes Yes
Fayetteville VAMC, AR Yes NA NA NA Yes NA Yes
Central Arkansas Veterans Health Care System, Little Rock, N Little Rock, AR Yes Yes Yes NA Yes Yes Yes
Alexandria VAMC, LA Yes NA Yes NA Yes NA Yes
New Orleans VAMC, LA NA Yes NA Yes Yes NA Yes
Overton Brooks VAMC, Shreveport, LA Yes NA NA NA Yes Yes Yes
Gulf Coast Veterans Health Care System, Biloxi, MS Yes Yes Yes NA Yes Yes Yes
G.V. Montgomery VAMC, Jackson, MS Yes NA Yes NA Yes Yes Yes
Muskogee VAMC, OK Yes NA NA NA Yes NA Yes
Oklahoma City VAMC, OK Yes Yes Yes NA Yes Yes Yes
Michael E. DeBakey VAMC, Houston, TX Yes Yes Yes NA Yes Yes Yes
VA North Texas Health Care System, Dallas, TX Yes Yes Yes NA Yes Yes Yes
South Texas Veterans Health Care System, San Antonio, Kerrville, TX Yes Yes Yes NA Yes Yes Yes
Central Texas Veterans Health Care System, Temple, Waco, Marlin, TX Yes Yes Yes NA Yes Yes Yes
Carl T. Hayden VAMC, Phoenix, AZ Yes Yes Yes NA Yes Yes Yes

101
No. Arizona VA Health Care System, Prescott, AZ Yes Yes Yes NA Yes NA Yes
So. Arizona VA Health Care System, Tucson, AZ Yes Yes Yes NA Yes Yes Yes
New Mexico Health Care System, Albuquerque, NM Yes Yes Yes NA Yes Yes Yes
Amarillo VA Health Care System, TX Yes NA Yes NA Yes NA Yes
West Texas VA Health Care System, Big Spring, TX Yes Yes Yes NA Yes NA Yes
El Paso VA Health Care System, TX NA Yes NA Yes Yes NA Yes
VA Eastern Colorado Health Care System, Denver, Pueblo, CO Yes Yes Yes NA Yes Yes Yes
Grand Junction VAMC, CO Yes Yes Yes NA Yes NA Yes
VA Montana Health Care System, Fort Harrison, MT Yes Yes Yes NA Yes NA Yes
VA Salt Lake City Health Care System, UT Yes Yes NA NA Yes Yes Yes
Cheyenne VAMC, WY Yes Yes Yes NA Yes NA Yes
Sheridan VAMC, WY Yes Yes Yes NA Yes NA Yes
Alaska VA Health Care System and Regional Office, Anchorage, AK NA Yes NA Yes Yes Yes Yes
Boise VAMC, ID Yes Yes Yes NA Yes NA Yes
Portland VAMC, OR Yes Yes Yes NA Yes Yes Yes
VA Roseburg Health Care System, OR Yes Yes Yes NA Yes Yes Yes
Southern Oregon Rehab Center & Clinics, White City, OR NA Yes NA Yes Yes Yes Yes
VA Puget Sound Health Care System, Seattle, American Lake, WA Yes Yes Yes NA Yes Yes Yes
Spokane VAMC, WA Yes Yes Yes NA Yes NA Yes
Jonathan M. Wainwright Memorial VA Medical Center, Walla Walla, WA NA Yes Yes Yes Yes NA Yes
VA Central California Health Care System, Fresno, CA Yes Yes Yes NA Yes NA Yes
VA Northern California Health Care System, Martinez, Sacramento, CA Yes Yes Yes NA Yes NA Yes
VA Palo Alto Health Care System, Palo Alto, Menlo Pk, Livermore, CA Yes Yes Yes NA Yes Yes Yes
San Francisco VAMC, CA Yes Yes Yes NA Yes Yes Yes
VA Pacific Islands Health Care System, Honolulu, HI NA Yes Yes Yes Yes NA Yes
VA Sierra Nevada Health Care System, Reno, NV Yes Yes Yes NA Yes NA Yes
VA Loma Linda Health Care System, CA Yes Yes Yes NA Yes Yes Yes
VA Long Beach Health Care System, CA Yes Yes Yes NA Yes Yes Yes
VA Greater Los Angeles Health Care System, CA Yes Yes Yes NA Yes Yes Yes

102
VA San Diego Health Care System, CA Yes Yes Yes NA Yes Yes Yes
VA Southern Nevada Health Care System, Las Vegas, NV NA Yes NA Yes Yes NA Yes
VA Nebraska Western Iowa Health Care System, Omaha, Grand Is, Lincoln, NE Yes Yes Yes NA Yes NA Yes
VA Central Iowa Health Care System, Des Moines, Knoxville, IA Yes Yes Yes NA Yes Yes Yes
Iowa City VAMC, IA Yes Yes NA NA Yes NA Yes
Minneapolis VAMC, MN Yes Yes Yes NA Yes Yes Yes
St. Cloud VAMC, MN Yes Yes Yes NA Yes Yes Yes
Fargo VAMC, ND Yes Yes Yes NA Yes NA Yes
VA Black Hills Health Care System, Ft Meade, Hot Springs, SD Yes Yes Yes NA Yes Yes Yes
Sioux Falls VAMC, SD Yes Yes Yes NA Yes NA Yes

103
Hospital and Facility Services
Facility Name
Phys
icia
n
Full-
time
FTE
E
Phys
icia
n Pa
rt-tim
e FT
EE
Phy
sici
an F
TEE
Crit
ical
Car
e U
nits
R
egis
tere
d N
urse
s
Crit
ical
Car
e U
nits
- LP
Ns
Crit
ical
Car
e U
nits
N
ursi
ng A
ssis
tant
s
Med
ical
Uni
ts
R
egis
tere
d N
urse
s
Med
ical
Uni
ts -
LPN
s
Med
ical
Uni
ts
Nur
sing
Ass
ista
nts
Surg
ical
Uni
ts
Reg
iste
red
Nur
ses
Surg
ical
Uni
ts -
LPN
s
Surg
ical
Uni
ts
Nur
sing
Ass
ista
nts
Mix
ed M
ed/S
urg
Reg
iste
red
Nur
ses
Mix
ed M
ed/S
urg
- LPN
s
Mix
ed M
ed/S
urg
N
ursi
ng A
ssis
tant
s
VA Connecticut Health Care System, West Haven, CT 108.9 76.5 3.3 20.11 0.00 1.48 NA NA NA NA NA NA 5.57 1.23 2.66
Edith N Rogers Memorial Veterans Hospital, Bedford, Ma 40.9 3.0 2.4 NA NA NA NA NA NA NA NA NA NA NA NA
VA Boston Health Care System, W Roxbury, Brockton, Jamaica Plains, MA 197.0 38.4 3.8 NA NA NA NA NA NA NA NA NA NA NA NA
Northampton VAMC, MA 26.7 1.8 1.9 NA NA NA NA NA NA NA NA NA NA NA NA
Togus VAMC, Augusta, ME 74.1 7.5 2.1 19.32 0.00 0.20 5.96 0.84 2.07 NA NA NA 5.59 1.65 2.95
Manchester VAMC, NH 34.7 1.9 1.6 NA NA NA NA NA NA NA NA NA NA NA NA
Providence VAMC, RI 60.9 19.7 2.5 15.27 0.00 0.53 NA NA NA NA NA NA 7.34 0.79 1.77
White River Junction VAMC, VT 55.1 9.0 2.6 24.17 0.00 0.38 NA NA NA NA NA NA 5.42 2.75 0.61

104
Samuel S. Stratton VAMC, Albany, NY 70.1 20.0 2.1 20.96 0.00 2.04 5.56 1.75 2.03 NA NA NA 4.44 1.41 2.84
VA Western New York Health Care System Buffalo, Batavia, NY 83.5 29.6 2.0 17.41 0.00 1.84 4.30 3.62 1.00 4.58 3.04 0.37 NA NA NA
Bath VAMC, NY 13.4 0.3 1.1 56.98 0.00 0.00 3.84 2.35 2.28 NA NA NA NA NA NA
Canandaigua VAMC, NY 24.5 6.8 1.5 NA NA NA NA NA NA NA NA NA NA NA NA
Syracuse VAMC, NY 74.3 18.3 1.8 19.37 0.02 0.20 4.82 4.40 0.20 NA NA NA 6.52 5.29 0.28
VA New Jersey Health Care System, East Orange, NJ 177.5 21.0 3.4 19.37 0.00 0.78 6.35 0.66 3.10 5.22 0.57 2.27 NA NA NA
James J. Peters VAMC, Bronx, NY 107.5 29.9 5.2 14.50 0.00 0.48 3.52 1.81 3.04 4.08 0.37 3.65 NA NA NA
VA New York Harbor Health Care System, Manhattan, Brooklyn, NY 205.5 41.1 4.7 16.99 0.00 0.82 4.85 0.27 1.32 5.47 0.74 1.59 5.40 0.05 2.10
VA Hudson Valley Health Care System, Montrose, Castle Point, NY 70.2 6.3 3.1 NA NA NA NA NA NA NA NA NA 6.21 0.40 4.33
Northport VAMC, NY 99.5 9.9 3.2 20.35 0.00 1.59 4.20 1.68 1.82 NA NA NA 4.18 1.79 1.70
Wilmington VAMC, DE 44.1 7.2 2.0 22.26 0.00 0.00 6.96 4.09 0.45 NA NA NA 7.23 3.12 1.41
James E. Van Zandt VAMC, Altoona, PA 27.5 NA 1.1 15.82 0.00 0.00 NA NA NA NA NA NA 4.99 4.52 0.00
Butler VAMC, PA 18.7 0.1 1.1 NA NA NA NA NA NA NA NA NA NA NA NA
Coatesville VAMC, PA 36.7 0.1 1.9 NA NA NA 4.12 2.93 1.67 NA NA NA NA NA NA
Erie VAMC, PA 29.9 3.0 1.5 59.75 0.00 0.22 NA NA NA NA NA NA 4.58 3.75 0.08
Lebanon VAMC, PA 70.3 5.3 1.7 13.17 2.68 0.12 NA NA NA NA NA NA 4.96 4.41 0.00
Philadelphia VAMC, PA 90.6 67.6 2.8 12.32 0.00 0.00 4.71 1.27 -0.05 10.37 3.40 0.00 2.61 0.82 0.00
VA Pittsburgh Health Care System, PA 116.1 43.5 2.7 12.33 0.00 0.62 7.61 0.00 0.31 10.39 0.00 1.33 NA NA NA

105
Wilkes-Barre VAMC, PA 77.2 +3.8 2.0 9.88 0.54 1.73 4.60 1.51 0.41 NA NA NA NA NA NA
Louis A. Johnson VAMC, Clarksburg, WV 45.2 3.0 2.3 10.04 0.19 0.00 NA NA NA NA NA NA 2.55 3.58 0.79
Washington DC VAMC, DC 158.4 17.7 3.0 17.54 0.00 0.51 4.78 1.35 1.81 5.33 1.70 1.39 NA NA NA
VA Maryland Health Care System, Perry Pt, Baltimore, MD 87.6 66.2 2.9 14.75 0.00 0.51 5.26 0.45 0.08 4.74 0.50 0.03 5.30 1.04 1.64
Martinsburg VAMC, WV 77.0 0.6 2.4 16.26 0.00 0.00 3.17 1.47 1.30 NA NA NA NA NA NA
Asheville VAMC, NC 85.6 6.9 2.8 17.44 0.00 0.56 4.62 2.08 1.05 NA NA NA 5.43 1.79 1.13
Durham VAMC, NC 63.9 85.1 2.9 16.79 0.22 0.00 6.00 1.41 2.27 NA NA NA 7.27 0.54 2.81
Fayetteville VAMC, NC 74.0 2.8 1.7 23.04 0.00 0.00 NA NA NA NA NA NA NA NA NA
W.G. (Bill) Hefner VAMC, Salisbury, NC 139.7 8.4 1.9 24.20 0.00 2.35 NA NA NA NA NA NA NA NA NA
Hampton VAMC, VA 92.7 3.4 2.7 16.63 3.06 0.39 NA NA NA NA NA NA 6.98 4.58 1.26
Hunter Holmes McGuire VAMC, Richmond, VA 114.5 34.1 3.4 16.94 0.00 0.00 7.25 3.62 2.19 8.46 2.10 1.51 NA NA NA
Salem VAMC, VA 87.4 8.9 2.8 20.22 0.00 0.07 5.40 2.22 1.46 4.11 1.05 1.75 NA NA NA
Beckley VAMC, WV 28.6 0.9 2.2 36.21 0.00 0.00 NA NA NA NA NA NA 5.98 1.89 1.30
Birmingham VAMC, AL 82.1 45.3 2.3 21.79 0.97 0.06 5.57 4.43 2.19 7.17 1.95 2.60 NA NA NA
Central Alabama Veterans Health Care System, Tuskegee, Montgomery, AL 64.8 1.8 1.6 35.46 0.00 0.00 2.90 2.66 1.35 NA NA NA NA NA NA

106
Tuscaloosa VAMC, AL 24.5 1.0 1.6 NA NA NA NA NA NA NA NA NA NA NA NA
Atlanta VAMC, GA 182.3 54.5 3.2 16.01 0.00 0.00 6.05 1.59 2.76 2.95 0.92 2.20 NA NA NA
Charlie Norwood VAMC, Augusta, GA 97.6 19.6 2.9 20.46 0.00 0.52 5.13 4.34 0.36 5.18 4.21 1.06 5.58 3.91 2.03
Carl Vinson VAMC, Dublin, GA 35.4 1.7 1.2 29.23 0.00 0.00 NA NA NA NA NA NA 3.96 3.85 3.44
Ralph H. Johnson VAMC, Charleston, SC 82.4 31.8 2.4 18.45 0.00 0.25 8.17 1.73 1.33 6.85 1.63 0.67 NA NA NA
Wm. Jennings Bryan Dorn VAMC, Columbia, SC 116.0 8.8 1.9 19.03 0.00 0.41 5.12 0.74 2.05 5.22 1.00 1.60 NA NA NA
Bay Pines VA Health Care System, FL 256.1 8.0 2.7 14.34 0.03 0.00 4.16 1.38 0.40 4.09 2.18 0.90 NA NA NA
N. Florida/S. Georgia Veterans Health Care System Gainesville, Lake City 259.9 40.5 2.3 19.81 0.20 1.70 6.72 1.16 3.15 7.40 1.28 2.79 NA NA NA
Miami VA Health Care System, FL 153.9 25.1 3.2 19.49 0.00 0.00 3.25 1.55 2.20 NA NA NA 5.16 0.72 2.93
Orlando VAMC, FL 141.3 4.5 1.7 NA NA NA NA NA NA NA NA NA NA NA NA
James A. Haley VAMC, Tampa, FL 273.6 41.9 2.8 17.31 0.00 1.18 4.63 1.78 1.97 NA NA NA 5.94 1.30 1.94
West Palm Beach VAMC, FL 154.2 6.8 2.6 17.86 0.00 0.00 0.14 0.02 -0.13 NA NA NA 33.66 0.03 23.83
VA Caribbean Health Care System, San Juan, PR 239.4 41.5 4.2 18.91 0.76 0.19 4.07 2.52 0.11 3.56 2.58 0.22 3.61 2.16 0.41
Lexington VAMC, KY 68.0 33.3 2.9 18.20 0.00 4.10 NA NA NA NA NA NA 3.92 1.78 2.16
Louisville VAMC, KY 94.4 26.3 2.8 15.59 0.00 1.17 5.20 1.85 2.27 4.02 2.32 1.90 5.54 1.45 1.36
Memphis VAMC, TN 113.0 21.0 2.5 17.35 0.00 0.00 2.87 1.82 2.30 3.66 2.09 2.72 NA NA NA
Mountain Home VAMC, TN 110.4 14.8 2.5 15.32 0.00 0.21 3.76 2.44 2.07 4.32 2.28 1.57 NA NA NA
Tennessee Valley Health Care System, Nashville, Murfreesboro, TN 132.5 76.2 2.7 22.20 0.39 0.00 4.57 2.64 1.13 NA NA NA 8.37 2.74 1.57
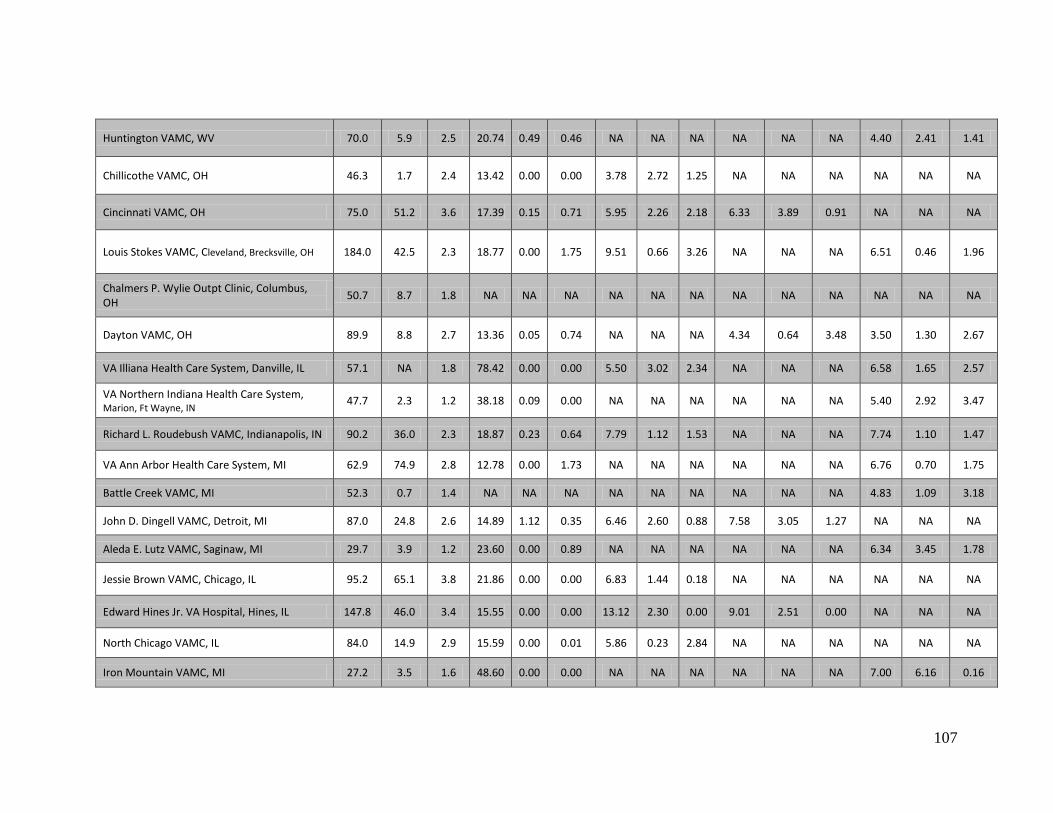
107
Huntington VAMC, WV 70.0 5.9 2.5 20.74 0.49 0.46 NA NA NA NA NA NA 4.40 2.41 1.41
Chillicothe VAMC, OH 46.3 1.7 2.4 13.42 0.00 0.00 3.78 2.72 1.25 NA NA NA NA NA NA
Cincinnati VAMC, OH 75.0 51.2 3.6 17.39 0.15 0.71 5.95 2.26 2.18 6.33 3.89 0.91 NA NA NA
Louis Stokes VAMC, Cleveland, Brecksville, OH 184.0 42.5 2.3 18.77 0.00 1.75 9.51 0.66 3.26 NA NA NA 6.51 0.46 1.96
Chalmers P. Wylie Outpt Clinic, Columbus, OH 50.7 8.7 1.8 NA NA NA NA NA NA NA NA NA NA NA NA
Dayton VAMC, OH 89.9 8.8 2.7 13.36 0.05 0.74 NA NA NA 4.34 0.64 3.48 3.50 1.30 2.67
VA Illiana Health Care System, Danville, IL 57.1 NA 1.8 78.42 0.00 0.00 5.50 3.02 2.34 NA NA NA 6.58 1.65 2.57
VA Northern Indiana Health Care System, Marion, Ft Wayne, IN 47.7 2.3 1.2 38.18 0.09 0.00 NA NA NA NA NA NA 5.40 2.92 3.47
Richard L. Roudebush VAMC, Indianapolis, IN 90.2 36.0 2.3 18.87 0.23 0.64 7.79 1.12 1.53 NA NA NA 7.74 1.10 1.47
VA Ann Arbor Health Care System, MI 62.9 74.9 2.8 12.78 0.00 1.73 NA NA NA NA NA NA 6.76 0.70 1.75
Battle Creek VAMC, MI 52.3 0.7 1.4 NA NA NA NA NA NA NA NA NA 4.83 1.09 3.18
John D. Dingell VAMC, Detroit, MI 87.0 24.8 2.6 14.89 1.12 0.35 6.46 2.60 0.88 7.58 3.05 1.27 NA NA NA
Aleda E. Lutz VAMC, Saginaw, MI 29.7 3.9 1.2 23.60 0.00 0.89 NA NA NA NA NA NA 6.34 3.45 1.78
Jessie Brown VAMC, Chicago, IL 95.2 65.1 3.8 21.86 0.00 0.00 6.83 1.44 0.18 NA NA NA NA NA NA
Edward Hines Jr. VA Hospital, Hines, IL 147.8 46.0 3.4 15.55 0.00 0.00 13.12 2.30 0.00 9.01 2.51 0.00 NA NA NA
North Chicago VAMC, IL 84.0 14.9 2.9 15.59 0.00 0.01 5.86 0.23 2.84 NA NA NA NA NA NA
Iron Mountain VAMC, MI 27.2 3.5 1.6 48.60 0.00 0.00 NA NA NA NA NA NA 7.00 6.16 0.16

108
William S. Middleton Memorial Veterans Hospital, Madison, WI 44.4 42.3 2.3 19.36 0.26 0.37 NA NA NA NA NA NA 8.30 0.39 1.72
Clement J. Zablocki VAMC, Milwaukee, WI 79.3 77.4 2.6 19.74 0.00 1.75 NA NA NA NA NA NA 7.88 1.45 2.88
Tomah VAMC, WI 25.7 4.6 1.2 NA NA NA 7.83 0.56 4.22 NA NA NA NA NA NA
VA Eastern Kansas Health Care System, Topeka, Leavenworth, KS 77.8 4.1 2.2 28.95 0.00 0.25 NA NA NA NA NA NA 6.05 4.78 1.30
Robert J. Dole VAMC, Wichita, KS 44.4 3.8 1.7 21.23 0.16 0.30 NA NA NA NA NA NA 6.30 3.17 1.90
Harry S. Truman VAMC, Columbia, MO 57.0 11.9 2.2 25.62 0.00 0.69 5.24 3.04 1.60 NA NA NA 7.76 4.45 1.19
Kansas City VAMC, MO 86.4 8.0 2.2 20.61 0.00 0.00 5.66 2.72 1.03 4.39 1.54 0.49 6.64 4.72 0.19
Marion VAMC, IL 53.6 3.6 1.3 28.45 0.23 0.23 7.04 4.97 0.92 NA NA NA NA NA NA
John J. Pershing VAMC, Poplar Bluff, MO 24.6 0.2 1.3 NA NA NA 4.96 3.39 0.14 NA NA NA NA NA NA
St Louis VAMC, St Louis, Jefferson Barracks, MO 118.8 37.4 3.0 16.35 0.00 0.12 4.33 1.69 2.88 4.40 0.94 2.67 NA NA NA
Fayetteville VAMC, AR 81.2 3.5 1.7 21.37 0.00 0.00 NA NA NA NA NA NA 5.55 1.05 3.34
Central Arkansas Veterans Health Care System, Little Rock, N Little Rock, AR 163.1 44.2 2.8 16.72 0.05 1.51 5.15 2.87 1.42 NA NA NA 3.34 2.10 1.80
Alexandria VAMC, LA 52.9 4.1 2.0 27.13 0.79 0.00 8.04 3.04 0.48 NA NA NA 7.61 2.75 0.32
New Orleans VAMC, LA 53.9 28.7 2.4 NA NA NA NA NA NA NA NA NA NA NA NA
Overton Brooks VAMC, Shreveport, LA 94.3 5.4 2.6 18.40 0.00 1.33 5.33 1.58 1.63 NA NA NA 16.74 0.00 13.33
Gulf Coast Veterans Health Care System, Biloxi, MS 110.8 2.5 2.0 20.43 0.00 0.46 NA NA NA NA NA NA 6.43 2.80 3.07
G.V. Montgomery VAMC, Jackson, MS 99.0 17.9 2.6 16.04 0.00 0.00 4.57 1.62 3.38 5.54 2.03 4.20 NA NA NA
Muskogee VAMC, OK 65.9 4.4 2.0 17.05 0.25 0.10 4.32 2.68 2.29 4.50 3.21 1.93 NA NA NA
Oklahoma City VAMC, OK 93.4 33.5 2.4 17.22 0.00 0.60 3.13 2.03 1.54 4.49 2.93 1.21 NA NA NA
Michael E. DeBakey VAMC, Houston, TX 199.5 42.9 2.7 15.98 0.00 0.57 4.41 1.73 1.59 4.62 1.96 0.94 NA NA NA

109
VA North Texas Health Care System, Dallas, TX 244.8 22.6 2.5 19.04 0.04 2.11 4.70 2.09 1.76 4.30 2.33 2.04 NA NA NA
South Texas Veterans Health Care System, San Antonio, Kerrville, TX 151.5 68.1 2.4 19.82 0.34 2.01 5.49 3.25 0.61 5.26 2.65 0.28 NA NA NA
Central Texas Veterans Health Care System, Temple, Waco, Marlin, TX 184.4 12.7 2.4 17.86 0.00 0.35 4.48 2.36 1.11 NA NA NA 4.69 2.31 1.19
Carl T. Hayden VAMC, Phoenix, AZ 149.4 11.8 2.1 24.48 0.00 2.29 6.81 1.52 3.45 7.16 2.51 3.70 12.62 0.00 8.30
No. Arizona VA Health Care System, Prescott, AZ 30.4 2.8 1.4 35.00 0.00 2.76 7.00 0.77 1.81 NA NA NA NA NA NA
So. Arizona VA Health Care System, Tucson, AZ 109.4 16.8 2.5 25.37 0.00 1.61 5.88 0.01 3.27 6.62 0.00 3.39 NA NA NA
New Mexico Health Care System, Albuquerque, NM 135.2 19.2 2.7 11.20 0.00 0.16 6.78 1.29 3.04 NA NA NA 4.08 1.09 3.56
Amarillo VA Health Care System, TX 40.3 7.5 1.9 18.51 0.01 1.13 NA NA NA NA NA NA 5.55 2.59 2.92
West Texas VA Health Care System, Big Spring, TX 22.2 0.5 1.3 NA NA NA 7.06 5.95 2.77 NA NA NA NA NA NA
El Paso VA Health Care System, TX 42.9 1.4 1.7 NA NA NA NA NA NA NA NA NA NA NA NA
VA Eastern Colorado Health Care System, Denver, Pueblo, CO 125.6 34.0 2.5 23.17 0.17 0.39 5.95 1.57 2.42 7.74 0.71 0.56 NA NA NA
Grand Junction VAMC, CO 22.7 2.9 2.2 28.62 0.00 0.00 NA NA NA NA NA NA 6.55 4.48 0.00
VA Montana Health Care System, Fort Harrison, MT 50.3 6.2 1.8 NA NA NA NA NA NA NA NA NA 7.37 4.27 1.52
VA Salt Lake City Health Care System, UT 55.3 50.0 2.3 16.71 0.00 0.31 8.69 1.20 0.92 7.94 0.08 0.71 NA NA NA
Cheyenne VAMC, WY 26.9 2.3 1.7 20.54 0.00 0.60 NA NA NA NA NA NA 6.85 0.41 3.14
Sheridan VAMC, WY 20.2 0.9 1.7 NA NA NA NA NA NA NA NA NA 5.85 1.54 2.19
Alaska VA Health Care System and Regional Office, Anchorage, AK 29.7 NA 1.9 NA NA NA NA NA NA NA NA NA NA NA NA
Boise VAMC, ID 49.7 3.0 2.2 15.30 0.03 2.25 NA NA NA NA NA NA 5.36 1.47 2.46
Portland VAMC, OR 158.4 39.5 2.9 18.22 0.00 1.52 5.60 0.21 2.09 6.42 0.10 2.12 5.74 0.00 2.15

110
VA Roseburg Health Care System, OR 37.1 2.5 1.5 18.38 0.00 0.75 NA NA NA NA NA NA 7.99 0.15 1.80
Southern Oregon Rehab Center & Clinics, White City, OR 14.9 4.1 1.2 NA NA NA 3.53 2.25 1.91 NA NA NA NA NA NA
VA Puget Sound Health Care System, Seattle, American Lake, WA 168.4 31.5 2.7 20.79 0.28 1.10 6.29 2.24 1.51 6.01 1.73 1.04 NA NA NA
Spokane VAMC, WA 39.7 3.6 1.7 10.03 0.03 0.53 NA NA NA NA NA NA 5.11 2.03 1.06
Jonathan M. Wainwright Memorial VA Medical Center, Walla Walla, WA 12.3 1.0 0.8 NA NA NA NA NA NA NA NA NA NA NA NA
VA Central California Health Care System, Fresno, CA 73.5 3.4 3.0 12.00 0.94 2.45 5.31 0.74 3.42 NA NA NA NA NA NA
VA Northern California Health Care System, Martinez, Sacramento, CA 153.2 41.0 2.5 17.09 0.00 -0.03 NA NA NA NA NA NA 5.38 1.60 2.75
VA Palo Alto Health Care System, Palo Alto, Menlo Pk, Livermore, CA 223.2 36.4 4.2 19.61 0.00 1.24 NA NA NA NA NA NA 6.88 0.70 2.47
San Francisco VAMC, CA 107.9 54.7 2.9 16.54 0.01 1.86 6.80 0.87 2.07 NA NA NA 6.97 0.50 2.23
VA Pacific Islands Health Care System, Honolulu, HI 56.2 0.8 2.3 NA NA NA NA NA NA NA NA NA NA NA NA
VA Sierra Nevada Health Care System, Reno, NV 63.0 2.9 2.4 15.44 0.00 0.00 NA NA NA NA NA NA 9.84 1.18 3.01
VA Loma Linda Health Care System, CA 120.0 35.2 2.5 19.19 1.09 0.04 6.28 2.09 0.45 4.48 1.32 0.33 NA NA NA
VA Long Beach Health Care System, CA 113.2 32.3 3.2 11.24 0.22 0.00 10.94 3.75 3.63 6.16 0.63 1.80 NA NA NA
VA Greater Los Angeles Health Care System, CA 276.7 53.4 4.1 17.31 3.84 3.13 5.41 3.57 2.05 9.82 3.46 2.43 NA NA NA
VA San Diego Health Care System, CA 88.0 97.2 2.9 31.91 0.01 1.64 10.33 0.00 0.00 NA NA NA 11.52 2.86 0.66
VA Southern Nevada Health Care System, Las Vegas, NV 111.4 6.1 2.7 18.01 0.00 0.00 NA NA NA NA NA NA 5.08 0.75 1.28
VA Nebraska Western Iowa Health Care System, Omaha, Grand Is, Lincoln, NE 43.9 39.9 1.7 29.58 1.02 0.56 NA NA NA NA NA NA 8.83 1.38 1.51

111
VA Central Iowa Health Care System, Des Moines, Knoxville, IA 50.4 4.3 1.6 16.62 0.68 1.33 NA NA NA NA NA NA 6.42 1.98 2.22
Iowa City VAMC, IA 36.9 52.9 2.0 25.45 0.07 -0.01 8.31 1.12 0.98 6.74 2.98 0.85 95.03 11.95 0.00
Minneapolis VAMC, MN 168.9 25.6 2.3 23.15 0.54 3.04 9.35 1.01 2.55 8.26 0.55 2.13 NA NA NA
St. Cloud VAMC, MN 29.1 4.5 1.0 NA NA NA NA NA NA NA NA NA NA NA NA
Fargo VAMC, ND 49.8 4.8 1.8 33.16 2.70 0.97 6.06 3.66 0.07 NA NA NA 12.74 6.78 0.01
VA Black Hills Health Care System, Ft Meade, Hot Springs, SD 36.7 2.9 1.9 33.00 0.00 0.00 10.03 0.94 0.10 NA NA NA 8.74 3.89 1.61
Sioux Falls VAMC, SD 41.4 2.6 1.6 22.42 0.00 0.31 8.48 3.44 1.14 8.29 2.94 0.16 NA NA NA

Hospital and Facility Services (continued)
112
Facility Name
Acut
e M
enta
l Hea
lth -
RN
s
Acut
e M
enta
l Hea
lth -
LPN
s
Acut
e M
enta
l Hea
lth
N
ursi
ng A
ssis
tant
s
SCI/D
Uni
ts -
Reg
iste
red
Nur
ses
SCI/D
Uni
ts -
LPN
s
SCI/D
Uni
ts
Nur
sing
Ass
ista
nts
CLC
s R
egis
tere
d N
urse
s
CLC
s L
PNs
CLC
s N
ursi
ng A
ssis
tant
s
Turn
over
R
egis
tere
d N
urse
s
Turn
over
LPN
s
Turn
over
N
ursi
ng A
ssis
tant
s
VA Connecticut Health Care System, West Haven, CT 3.24 0.00 2.52 NA NA NA 2.86 1.42 3.03 0.05 0.11 0.11
Edith N Rogers Memorial Veterans Hospital, Bedford, Ma 1.95 0.92 1.72 NA NA NA 1.65 1.06 2.27 0.05 0.09 0.08
VA Boston Health Care System, W Roxbury, Brockton, Jamaica Plains, MA NA NA NA 10.59 1.64 0.19 NA NA NA 0.03 0.08 0.07
Northampton VAMC, MA NA NA NA NA NA NA 1.62 0.76 2.85 0.08 0.04 0.02
Togus VAMC, Augusta, ME 5.92 0.68 2.89 NA NA NA 2.18 0.52 3.55 0.10 0.05 0.09
Manchester VAMC, NH NA NA NA NA NA NA 2.30 1.12 2.56 0.06 0.16 0.24
Providence VAMC, RI 4.40 1.53 1.41 NA NA NA NA NA NA 0.11 0.20 0.10
White River Junction VAMC, VT 5.06 1.41 0.52 NA NA NA NA NA NA 0.09 0.10 0.00
Samuel S. Stratton VAMC, Albany, NY 5.95 1.95 5.15 NA NA NA 2.54 2.30 3.19 0.06 0.09 0.21
VA Western New York Health Care System Buffalo, Batavia, NY 2.94 3.29 2.40 NA NA NA 1.53 1.80 2.08 0.09 0.13 0.19

113
Bath VAMC, NY NA NA NA NA NA NA 1.06 1.34 1.74 0.04 0.07 0.08
Canandaigua VAMC, NY NA NA NA NA NA NA 2.37 2.73 6.04 0.03 0.08 0.13
Syracuse VAMC, NY NA NA NA NA NA NA 1.66 1.93 0.40 0.05 0.10 0.21
VA New Jersey Health Care System, East Orange, NJ 2.72 0.23 3.90 6.79 2.36 0.00 1.79 0.39 2.53 0.05 0.14 0.08
James J. Peters VAMC, Bronx, NY 2.08 0.33 3.28 3.21 1.33 5.31 1.04 1.21 2.48 0.10 0.03 0.16
VA New York Harbor Health Care System, Manhattan, Brooklyn, NY 3.61 0.37 2.48 NA NA NA 1.25 0.81 2.97 0.05 0.11 0.05
VA Hudson Valley Health Care System, Montrose, Castle Point, NY 3.74 0.49 4.42 NA NA NA 1.80 1.24 2.59 0.11 0.13 0.05
Northport VAMC, NY 3.15 0.81 3.64 NA NA NA 1.48 1.12 2.95 0.03 0.01 0.09
Wilmington VAMC, DE NA NA NA NA NA NA 1.28 1.41 0.55 0.09 0.04 0.27
James E. Van Zandt VAMC, Altoona, PA NA NA NA NA NA NA 1.42 3.07 0.07 0.03 0.05 1.00
Butler VAMC, PA NA NA NA NA NA NA 1.63 2.17 1.24 0.03 0.15 0.29
Coatesville VAMC, PA 1.84 1.72 1.90 NA NA NA 1.46 1.92 2.45 0.15 0.09 0.08
Erie VAMC, PA NA NA NA NA NA NA 1.58 2.58 1.63 0.10 0.06 0.00
Lebanon VAMC, PA 2.76 0.84 3.91 NA NA NA 1.26 2.02 2.45 0.09 0.08 0.17
Philadelphia VAMC, PA 3.68 1.11 0.31 NA NA NA 1.90 2.13 1.07 0.08 0.07 0.11
VA Pittsburgh Health Care System, PA 3.01 0.00 4.32 NA NA NA 1.96 1.78 2.81 0.05 0.10 0.14
Wilkes-Barre VAMC, PA 4.87 1.44 6.53 NA NA NA 1.20 1.25 2.08 0.09 0.07 0.16
Louis A. Johnson VAMC, Clarksburg, WV 5.10 4.36 0.00 NA NA NA 1.48 2.39 1.68 0.08 0.06 0.17
Washington DC VAMC, DC 3.39 0.92 1.52 NA NA NA 1.31 1.36 2.16 0.04 0.08 0.14

114
VA Maryland Health Care System, Perry Pt, Baltimore, MD 4.43 1.51 0.00 NA NA NA 1.31 0.68 2.93 0.08 0.09 0.07
Martinsburg VAMC, WV 5.91 3.49 1.42 NA NA NA 2.06 1.42 1.97 0.10 0.10 0.02
Asheville VAMC, NC 4.71 2.03 1.23 NA NA NA 1.85 1.42 2.29 0.08 0.12 0.10
Durham VAMC, NC 4.69 1.79 1.67 NA NA NA 2.14 1.05 2.06 0.08 0.14 0.13
Fayetteville VAMC, NC 4.77 1.29 3.69 NA NA NA 1.66 1.85 2.35 0.15 0.29 0.16
W.G. (Bill) Hefner VAMC, Salisbury, NC NA NA NA NA NA NA NA NA NA NA NA NA
Hampton VAMC, VA 3.81 0.90 2.66 NA NA NA 1.88 1.93 2.54 0.07 0.14 0.18
Hunter Holmes McGuire VAMC, Richmond, VA 6.24 2.06 2.41 5.05 2.43 1.86 2.43 1.84 2.65 0.07 0.05 0.07
Salem VAMC, VA 3.84 0.88 3.17 NA NA NA 1.86 1.53 2.80 0.10 0.06 0.05
Beckley VAMC, WV NA NA NA NA NA NA NA NA NA 0.07 0.14 0.28
Birmingham VAMC, AL NA NA NA NA NA NA NA NA NA 0.07 0.09 0.13
Central Alabama Veterans Health Care System, Tuskegee, Montgomery, AL 2.29 1.39 2.56 NA NA NA 1.01 2.08 3.00 0.08 0.07 0.06
Tuscaloosa VAMC, AL 2.24 1.50 4.01 NA NA NA 1.41 1.73 2.88 0.07 0.04 0.14
Atlanta VAMC, GA 5.79 0.91 1.02 NA NA NA 2.52 1.42 2.17 0.05 0.09 0.06
Charlie Norwood VAMC, Augusta, GA NA NA NA 4.07 2.71 0.25 1.74 2.03 0.87 0.06 0.07 0.12
Carl Vinson VAMC, Dublin, GA NA NA NA NA NA NA 1.04 1.55 2.93 0.06 0.09 0.07
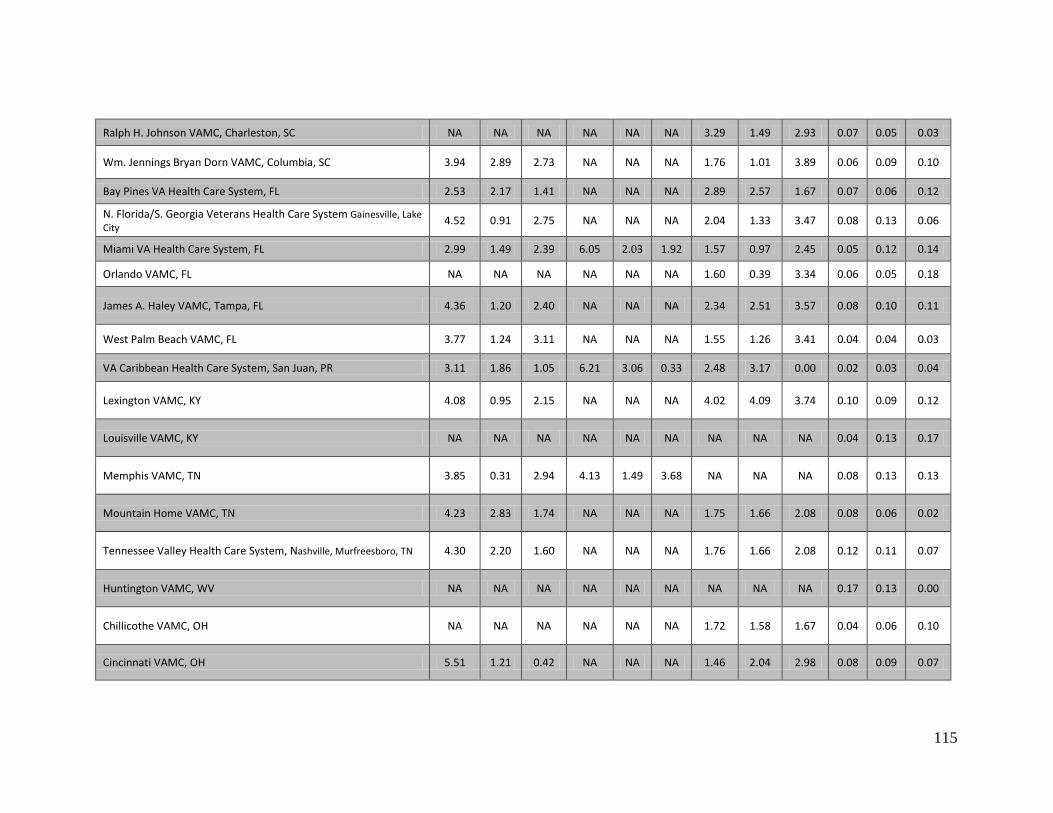
115
Ralph H. Johnson VAMC, Charleston, SC NA NA NA NA NA NA 3.29 1.49 2.93 0.07 0.05 0.03
Wm. Jennings Bryan Dorn VAMC, Columbia, SC 3.94 2.89 2.73 NA NA NA 1.76 1.01 3.89 0.06 0.09 0.10
Bay Pines VA Health Care System, FL 2.53 2.17 1.41 NA NA NA 2.89 2.57 1.67 0.07 0.06 0.12
N. Florida/S. Georgia Veterans Health Care System Gainesville, Lake City 4.52 0.91 2.75 NA NA NA 2.04 1.33 3.47 0.08 0.13 0.06
Miami VA Health Care System, FL 2.99 1.49 2.39 6.05 2.03 1.92 1.57 0.97 2.45 0.05 0.12 0.14
Orlando VAMC, FL NA NA NA NA NA NA 1.60 0.39 3.34 0.06 0.05 0.18
James A. Haley VAMC, Tampa, FL 4.36 1.20 2.40 NA NA NA 2.34 2.51 3.57 0.08 0.10 0.11
West Palm Beach VAMC, FL 3.77 1.24 3.11 NA NA NA 1.55 1.26 3.41 0.04 0.04 0.03
VA Caribbean Health Care System, San Juan, PR 3.11 1.86 1.05 6.21 3.06 0.33 2.48 3.17 0.00 0.02 0.03 0.04
Lexington VAMC, KY 4.08 0.95 2.15 NA NA NA 4.02 4.09 3.74 0.10 0.09 0.12
Louisville VAMC, KY NA NA NA NA NA NA NA NA NA 0.04 0.13 0.17
Memphis VAMC, TN 3.85 0.31 2.94 4.13 1.49 3.68 NA NA NA 0.08 0.13 0.13
Mountain Home VAMC, TN 4.23 2.83 1.74 NA NA NA 1.75 1.66 2.08 0.08 0.06 0.02
Tennessee Valley Health Care System, Nashville, Murfreesboro, TN 4.30 2.20 1.60 NA NA NA 1.76 1.66 2.08 0.12 0.11 0.07
Huntington VAMC, WV NA NA NA NA NA NA NA NA NA 0.17 0.13 0.00
Chillicothe VAMC, OH NA NA NA NA NA NA 1.72 1.58 1.67 0.04 0.06 0.10
Cincinnati VAMC, OH 5.51 1.21 0.42 NA NA NA 1.46 2.04 2.98 0.08 0.09 0.07

116
Louis Stokes VAMC, Cleveland, Brecksville, OH 7.32 2.19 2.59 5.13 1.28 2.85 2.07 1.18 1.35 0.05 0.08 0.07
Chalmers P. Wylie Outpt Clinic, Columbus, OH NA NA NA NA NA NA NA NA NA 0.11 0.09 NA
Dayton VAMC, OH 4.24 2.68 2.44 NA NA NA 1.77 0.91 3.47 0.05 0.09 0.07
VA Illiana Health Care System, Danville, IL NA NA NA NA NA NA 1.67 1.25 3.36 0.06 0.05 0.11
VA Northern Indiana Health Care System, Marion, Ft Wayne, IN 3.04 1.75 6.74 NA NA NA 1.90 1.64 2.73 0.05 0.11 0.07
Richard L. Roudebush VAMC, Indianapolis, IN 6.03 1.30 0.44 NA NA NA NA NA NA 0.06 0.07 0.07
VA Ann Arbor Health Care System, MI 4.86 0.38 3.50 NA NA NA 3.39 1.09 1.93 0.05 0.00 0.11
Battle Creek VAMC, MI 1.63 0.38 1.13 NA NA NA 2.45 0.62 3.25 0.09 0.10 0.12
John D. Dingell VAMC, Detroit, MI 4.59 2.00 2.59 NA NA NA 2.97 1.84 1.72 0.07 0.07 0.10
Aleda E. Lutz VAMC, Saginaw, MI NA NA NA NA NA NA 3.23 1.62 2.45 0.06 0.09 0.10
Jessie Brown VAMC, Chicago, IL 3.38 1.72 0.00 NA NA NA 1.68 0.00 0.00 0.04 0.06 0.00
Edward Hines Jr. VA Hospital, Hines, IL NA NA NA 4.83 1.64 0.51 2.68 1.27 1.55 0.07 0.15 0.11
North Chicago VAMC, IL 4.98 0.71 4.70 NA NA NA 2.02 0.48 2.37 0.07 0.12 0.13
Iron Mountain VAMC, MI NA NA NA NA NA NA 2.48 1.70 2.80 0.05 0.09 0.00
William S. Middleton Memorial Veterans Hospital, Madison, WI 4.29 1.96 0.33 NA NA NA NA NA NA 0.01 0.12 0.23
Clement J. Zablocki VAMC, Milwaukee, WI 2.52 2.05 3.61 4.34 4.50 1.82 2.52 2.05 3.61 0.07 0.07 0.24
Tomah VAMC, WI 4.52 0.47 9.30 NA NA NA 1.95 0.71 3.86 0.10 0.05 0.07

117
VA Eastern Kansas Health Care System, Topeka, Leavenworth, KS 4.37 2.04 1.38 NA NA NA 2.45 2.47 1.44 0.10 0.12 0.13
Robert J. Dole VAMC, Wichita, KS NA NA NA NA NA NA 1.89 0.90 1.82 0.06 0.05 0.23
Harry S. Truman VAMC, Columbia, MO 8.83 5.02 0.89 NA NA NA 2.10 3.11 0.56 0.09 0.08 0.22
Kansas City VAMC, MO 5.10 1.46 0.13 NA NA NA NA NA NA 0.10 0.10 0.15
Marion VAMC, IL NA NA NA NA NA NA 1.72 1.44 2.18 0.08 0.07 0.06
John J. Pershing VAMC, Poplar Bluff, MO NA NA NA NA NA NA 2.58 2.93 0.55 0.08 0.07 0.00
St Louis VAMC, St Louis, Jefferson Barracks, MO 3.68 1.54 2.83 3.20 1.49 3.83 3.30 1.17 2.39 0.10 0.15 0.17
Fayetteville VAMC, AR 6.22 1.64 2.38 NA NA NA NA NA NA 0.07 0.31 0.10
Central Arkansas Veterans Health Care System, Little Rock, N Little Rock, AR 4.79 4.82 1.27 NA NA NA 1.76 1.99 1.96 0.09 0.11 0.04
Alexandria VAMC, LA 3.73 3.79 2.87 NA NA NA 1.45 1.32 2.21 0.10 0.09 0.03
New Orleans VAMC, LA NA NA NA NA NA NA NA NA NA 0.08 0.09 NA
Overton Brooks VAMC, Shreveport, LA 4.67 2.75 0.92 NA NA NA NA NA NA 0.08 0.07 0.17
Gulf Coast Veterans Health Care System, Biloxi, MS NA NA NA NA NA NA 1.26 0.85 2.36 0.08 0.09 0.01
G.V. Montgomery VAMC, Jackson, MS 3.23 1.58 2.64 NA NA NA 1.26 0.85 2.36 0.09 0.09 0.04
Muskogee VAMC, OK 4.85 3.24 2.56 NA NA NA NA NA NA 0.10 0.21 0.27
Oklahoma City VAMC, OK 6.04 1.60 0.26 NA NA NA 13.52 11.45 3.71 0.09 0.21 0.30
Michael E. DeBakey VAMC, Houston, TX 3.18 1.20 1.71 7.01 2.01 7.06 3.48 3.31 0.43 1.78 1.09 1.83
VA North Texas Health Care System, Dallas, TX 3.77 1.99 3.51 5.90 3.29 2.38 1.30 1.96 1.80 0.08 0.13 0.08
South Texas Veterans Health Care System, San Antonio, Kerrville, TX 8.93 0.00 5.92 6.16 3.08 1.58 2.32 2.48 1.32 0.08 0.15 0.13
Central Texas Veterans Health Care System, Temple, Waco, Marlin, TX 5.67 0.59 3.99 NA NA NA 2.66 1.21 3.27 0.07 0.11 0.13
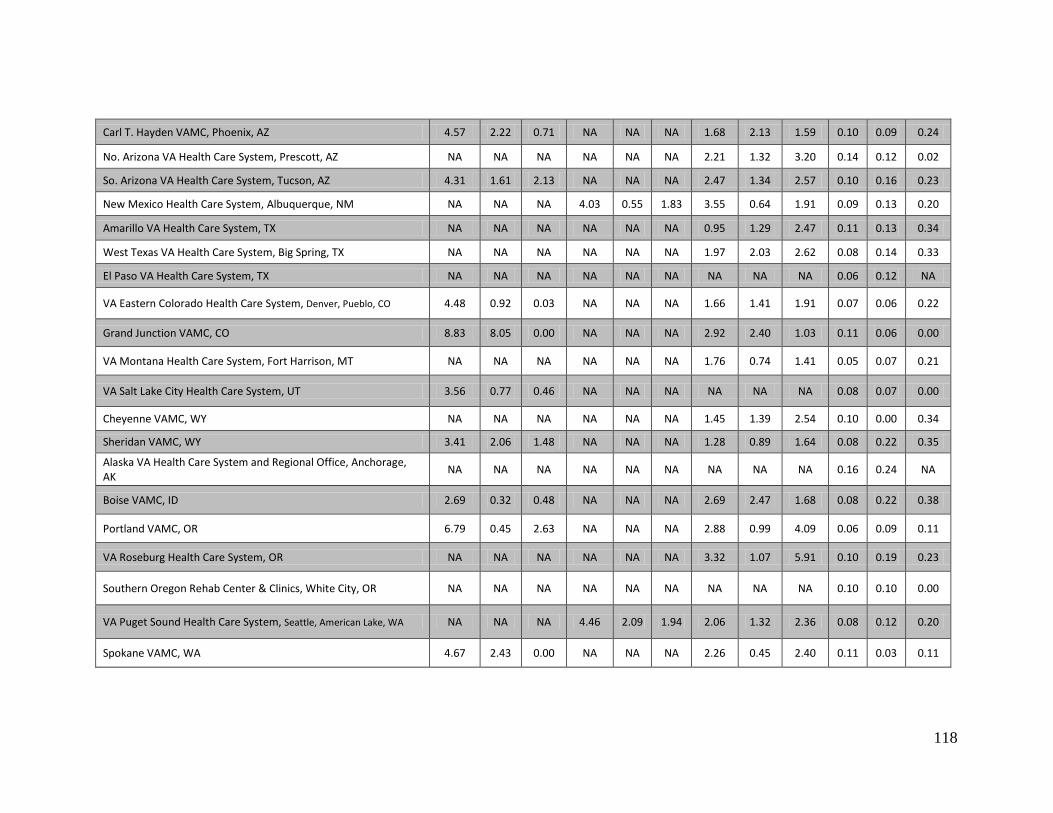
118
Carl T. Hayden VAMC, Phoenix, AZ 4.57 2.22 0.71 NA NA NA 1.68 2.13 1.59 0.10 0.09 0.24
No. Arizona VA Health Care System, Prescott, AZ NA NA NA NA NA NA 2.21 1.32 3.20 0.14 0.12 0.02
So. Arizona VA Health Care System, Tucson, AZ 4.31 1.61 2.13 NA NA NA 2.47 1.34 2.57 0.10 0.16 0.23
New Mexico Health Care System, Albuquerque, NM NA NA NA 4.03 0.55 1.83 3.55 0.64 1.91 0.09 0.13 0.20
Amarillo VA Health Care System, TX NA NA NA NA NA NA 0.95 1.29 2.47 0.11 0.13 0.34
West Texas VA Health Care System, Big Spring, TX NA NA NA NA NA NA 1.97 2.03 2.62 0.08 0.14 0.33
El Paso VA Health Care System, TX NA NA NA NA NA NA NA NA NA 0.06 0.12 NA
VA Eastern Colorado Health Care System, Denver, Pueblo, CO 4.48 0.92 0.03 NA NA NA 1.66 1.41 1.91 0.07 0.06 0.22
Grand Junction VAMC, CO 8.83 8.05 0.00 NA NA NA 2.92 2.40 1.03 0.11 0.06 0.00
VA Montana Health Care System, Fort Harrison, MT NA NA NA NA NA NA 1.76 0.74 1.41 0.05 0.07 0.21
VA Salt Lake City Health Care System, UT 3.56 0.77 0.46 NA NA NA NA NA NA 0.08 0.07 0.00
Cheyenne VAMC, WY NA NA NA NA NA NA 1.45 1.39 2.54 0.10 0.00 0.34
Sheridan VAMC, WY 3.41 2.06 1.48 NA NA NA 1.28 0.89 1.64 0.08 0.22 0.35
Alaska VA Health Care System and Regional Office, Anchorage, AK NA NA NA NA NA NA NA NA NA 0.16 0.24 NA
Boise VAMC, ID 2.69 0.32 0.48 NA NA NA 2.69 2.47 1.68 0.08 0.22 0.38
Portland VAMC, OR 6.79 0.45 2.63 NA NA NA 2.88 0.99 4.09 0.06 0.09 0.11
VA Roseburg Health Care System, OR NA NA NA NA NA NA 3.32 1.07 5.91 0.10 0.19 0.23
Southern Oregon Rehab Center & Clinics, White City, OR NA NA NA NA NA NA NA NA NA 0.10 0.10 0.00
VA Puget Sound Health Care System, Seattle, American Lake, WA NA NA NA 4.46 2.09 1.94 2.06 1.32 2.36 0.08 0.12 0.20
Spokane VAMC, WA 4.67 2.43 0.00 NA NA NA 2.26 0.45 2.40 0.11 0.03 0.11

119
Jonathan M. Wainwright Memorial VA Medical Center, Walla Walla, WA NA NA NA NA NA NA NA NA NA 0.14 0.20 0.32
VA Central California Health Care System, Fresno, CA 5.63 0.99 0.95 NA NA NA 1.36 1.56 2.45 0.08 0.08 0.15
VA Northern California Health Care System, Martinez, Sacramento, CA 8.99 4.29 0.00 NA NA NA 1.68 1.67 2.32 0.05 0.06 0.04
VA Palo Alto Health Care System, Palo Alto, Menlo Pk, Livermore, CA 4.77 2.55 3.92 6.95 3.21 1.56 1.56 1.54 1.92 0.06 0.02 0.05
San Francisco VAMC, CA 4.82 2.07 2.21 NA NA NA 1.68 0.95 2.86 0.10 0.07 0.04
VA Pacific Islands Health Care System, Honolulu, HI 4.84 2.97 2.79 NA NA NA 1.59 0.50 2.13 0.08 0.22 0.03
VA Sierra Nevada Health Care System, Reno, NV 4.45 1.47 0.00 NA NA NA 2.16 0.97 2.26 0.14 0.16 0.19
VA Loma Linda Health Care System, CA 5.57 4.20 0.33 NA NA NA 2.55 2.07 3.75 0.10 0.10 0.07
VA Long Beach Health Care System, CA 5.81 4.88 1.86 6.51 4.47 1.82 1.20 2.94 4.11 0.12 0.05 0.12
VA Greater Los Angeles Health Care System, CA 7.97 3.51 4.32 NA NA NA 2.99 1.94 2.53 0.08 0.10 0.08
VA San Diego Health Care System, CA 5.89 1.82 0.37 5.81 4.29 0.34 3.53 5.50 0.05 0.06 0.11 0.15
VA Southern Nevada Health Care System, Las Vegas, NV 6.25 3.24 0.54 NA NA NA NA NA NA 0.10 0.17 0.08
VA Nebraska Western Iowa Health Care System, Omaha, Grand Is, Lincoln, NE 6.12 1.72 2.16 NA NA NA 2.34 1.14 2.52 0.08 0.12 0.09
VA Central Iowa Health Care System, Des Moines, Knoxville, IA NA NA NA NA NA NA 1.75 1.79 2.19 0.08 0.10 0.13
Iowa City VAMC, IA 10.05 2.33 0.51 NA NA NA NA NA NA 0.05 0.08 0.25
Minneapolis VAMC, MN NA NA NA 10.49 2.65 2.03 5.88 2.63 2.40 0.07 0.05 0.12
St. Cloud VAMC, MN 7.91 6.07 1.08 NA NA NA 1.65 1.83 1.59 0.06 0.08 0.06
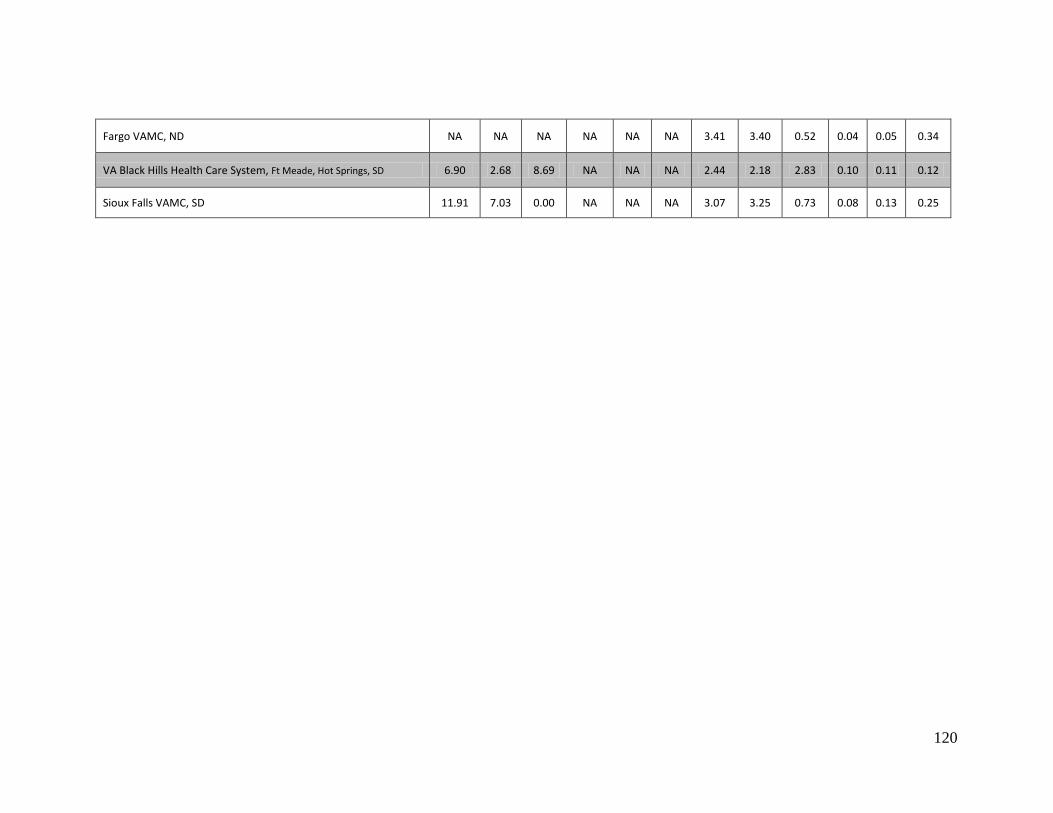
120
Fargo VAMC, ND NA NA NA NA NA NA 3.41 3.40 0.52 0.04 0.05 0.34
VA Black Hills Health Care System, Ft Meade, Hot Springs, SD 6.90 2.68 8.69 NA NA NA 2.44 2.18 2.83 0.10 0.11 0.12
Sioux Falls VAMC, SD 11.91 7.03 0.00 NA NA NA 3.07 3.25 0.73 0.08 0.13 0.25

Section 2: Effective Care
Outpatient Care Composites and Hospital Processes of Care Composites
121
Facility Name
Dia
bete
s M
ellit
us
Prev
entio
n
Isch
emic
Hea
rt D
z
Toba
cco
Beha
vior
al H
ealth
Scr
eeni
ng
Acut
e M
yoca
rdia
l Inf
arct
ion
Con
gest
ive
Hea
rt Fa
ilure
Com
mun
ity A
cqui
red
Pneu
mon
ia
SCIP
VA Connecticut Health Care System, West Haven, CT 84.8 86.8 81.4 97.6 96.7 89.1 98.2 94.3 96.6
Edith N Rogers Memorial Veterans Hospital, Bedford, Ma 88.8 84.1 83.3 94.8 96.1 NA NA NA NA
VA Boston Health Care System, W Roxbury, Brockton, Jamaica Plains, MA 90.8 91.6 81.9 100.0 98.3 96.0 99.6 97.0 99.3
Northampton VAMC, MA 89.1 88.0 80.9 94.8 96.9 NA NA NA NA
Togus VAMC, Augusta, ME 87.5 88.1 79.6 94.0 96.9 77.4 94.7 92.7 96.8
Manchester VAMC, NH 89.9 93.2 81.9 93.2 97.7 NA NA NA NA
Providence VAMC, RI 88.8 85.8 83.3 92.3 93.6 93.4 97.1 96.0 98.0
White River Junction VAMC, VT 84.7 84.1 77.6 90.7 95.1 88.1 96.1 95.1 97.5
Samuel S. Stratton VAMC, Albany, NY 87.8 85.9 75.4 96.6 93.4 96.5 97.6 97.3 98.1
VA Western New York Health Care System Buffalo, Batavia, NY 86.1 88.3 78.1 95.8 95.6 95.7 94.4 93.6 97.6
Bath VAMC, NY 85.9 88.4 77.8 99.4 97.7 NA 98.4 97.1 NA
Canandaigua VAMC, NY 86.2 89.3 75.0 100.0 95.5 NA NA NA NA
Syracuse VAMC, NY 88.0 85.0 82.1 98.1 96.7 94.8 98.3 99.1 96.4
VA New Jersey Health Care System, East Orange, NJ 86.8 84.0 80.0 96.4 94.8 NA 95.7 95.8 95.7
James J. Peters VAMC, Bronx, NY 86.2 86.4 68.9 89.3 91.0 91.9 96.3 95.4 95.2
VA New York Harbor Health Care System, Manhattan, Brooklyn, NY 87.0 84.0 79.4 90.1 96.0 95.7 97.5 94.2 97.4
VA Hudson Valley Health Care System, Montrose, Castle Point, NY 89.7 88.5 84.2 97.4 97.4 NA 98.3 96.6 NA

122
Northport VAMC, NY 87.2 85.6 77.7 94.4 98.6 98.7 94.8 94.4 96.8
Wilmington VAMC, DE 87.2 88.0 79.1 97.5 98.0 NA 94.2 94.4 98.9
James E. Van Zandt VAMC, Altoona, PA 90.4 86.6 83.7 98.0 96.7 94.7 100.0 98.7 NA
Butler VAMC, PA 87.6 86.4 83.1 94.6 98.4 NA NA NA NA
Coatesville VAMC, PA 89.1 90.0 83.5 100.0 97.9 NA NA NA NA
Erie VAMC, PA 88.0 87.0 79.5 99.7 99.3 87.1 93.8 95.1 99.5
Lebanon VAMC, PA 88.3 88.3 77.8 94.8 98.4 89.7 98.5 92.4 97.1
Philadelphia VAMC, PA 88.0 84.6 77.5 90.8 93.9 89.6 95.7 96.2 94.6
VA Pittsburgh Health Care System, PA 89.5 87.7 84.5 92.3 95.6 96.2 97.2 97.2 98.1
Wilkes-Barre VAMC, PA 89.0 87.1 85.8 87.2 94.1 93.5 99.5 97.6 92.9
Louis A. Johnson VAMC, Clarksburg, WV 89.4 86.1 84.9 96.6 96.1 94.5 99.2 94.8 94.0
Washington DC VAMC, DC 86.6 90.1 80.6 96.5 98.4 94.9 97.6 95.5 97.7
VA Maryland Health Care System, Perry Pt, Baltimore, MD 86.7 82.6 76.0 93.7 96.4 93.8 96.3 95.9 95.9
Martinsburg VAMC, WV 88.6 85.6 83.1 96.1 96.8 86.5 93.7 92.9 97.6
Asheville VAMC, NC 89.1 89.5 76.6 90.4 97.3 93.6 94.5 96.4 98.0
Durham VAMC, NC 84.2 88.3 72.8 97.1 97.7 96.7 99.2 95.2 97.3
Fayetteville VAMC, NC 85.2 90.8 74.5 99.7 95.4 NA 99.7 97.7 96.9
W.G. (Bill) Hefner VAMC, Salisbury, NC 88.9 91.9 83.0 96.6 95.0 NA 97.6 98.5 97.3
Hampton VAMC, VA 86.6 91.0 79.0 96.4 96.2 NA 100.0 98.0 99.5
Hunter Holmes McGuire VAMC, Richmond, VA 87.9 92.1 78.3 99.4 95.7 92.6 94.4 95.3 96.3
Salem VAMC, VA 88.5 87.7 82.7 94.3 96.8 96.8 95.7 94.4 99.4
Beckley VAMC, WV 87.4 85.6 80.4 98.0 98.2 NA 96.9 95.9 95.2
Birmingham VAMC, AL 89.3 86.5 84.8 95.2 96.1 96.9 99.1 97.5 97.8
Central Alabama Veterans Health Care System, Tuskegee, Montgomery, AL 86.6 84.2 79.4 99.5 97.5 NA 98.1 94.9 NA
Tuscaloosa VAMC, AL 87.9 89.3 83.6 99.5 96.6 NA NA NA NA

123
Atlanta VAMC, GA 88.1 86.4 80.4 94.8 94.0 97.4 99.5 98.6 97.4
Charlie Norwood VAMC, Augusta, GA 89.4 82.5 84.1 94.2 92.8 93.9 98.9 96.0 94.4
Carl Vinson VAMC, Dublin, GA 88.0 87.3 80.3 92.0 97.2 94.3 98.0 98.8 97.7
Ralph H. Johnson VAMC, Charleston, SC 86.7 88.0 78.6 98.3 97.0 93.2 98.8 97.9 97.3
Wm. Jennings Bryan Dorn VAMC, Columbia, SC 88.9 90.8 70.7 99.5 93.2 90.0 100.0 99.1 98.4
Bay Pines VA Health Care System, FL 87.9 83.9 79.8 92.5 96.8 95.7 99.1 95.0 97.6
N. Florida/S. Georgia Veterans Health Care System Gainesville, Lake City 89.0 88.2 79.5 96.5 98.3 94.1 98.3 97.5 98.1
Miami VA Health Care System, FL 83.7 82.9 76.5 89.9 95.6 88.5 95.7 99.2 96.0
Orlando VAMC, FL 87.9 79.9 82.3 93.8 95.9 NA NA NA NA
James A. Haley VAMC, Tampa, FL 89.0 87.2 78.6 92.3 97.9 95.0 98.8 97.5 96.3
West Palm Beach VAMC, FL 92.7 92.3 88.0 100.0 99.5 95.5 96.9 96.6 95.5
VA Caribbean Health Care System, San Juan, PR 86.7 88.8 79.5 88.7 96.0 93.7 97.0 92.6 97.5
Lexington VAMC, KY 86.3 87.4 77.2 90.7 97.6 91.7 98.3 96.9 97.2
Louisville VAMC, KY 86.1 85.3 83.3 90.0 96.6 95.2 97.9 96.9 95.5
Memphis VAMC, TN 89.1 81.4 79.8 83.0 95.8 95.0 98.0 95.8 96.7
Mountain Home VAMC, TN 87.4 88.0 76.2 96.8 96.1 97.3 98.6 96.3 98.4
Tennessee Valley Health Care System, Nashville, Murfreesboro, TN 84.6 80.8 76.9 91.5 91.9 95.1 97.4 94.7 96.3
Huntington VAMC, WV 90.4 88.7 81.5 94.4 73.6 92.1 95.5 95.4 99.5
Chillicothe VAMC, OH 88.3 87.0 80.6 95.2 97.2 95.1 98.9 97.7 NA
Cincinnati VAMC, OH 89.8 87.2 80.4 95.1 97.8 97.1 98.9 97.6 99.2
Louis Stokes VAMC, Cleveland, Brecksville, OH 87.4 88.3 80.2 92.3 97.5 97.8 100.0 96.6 97.5
Chalmers P. Wylie Outpt Clinic, Columbus, OH 86.3 85.1 76.9 97.9 95.6 NA NA NA NA
Dayton VAMC, OH 87.1 85.0 79.5 95.0 97.0 91.6 95.2 94.2 97.6
VA Illiana Health Care System, Danville, IL 86.1 88.9 79.6 94.3 97.0 90.5 96.3 92.8 96.8
VA Northern Indiana Health Care System, Marion, Ft Wayne, IN 86.8 83.1 76.6 97.4 98.1 NA 91.4 93.5 NA
Richard L. Roudebush VAMC, Indianapolis, IN 89.6 86.6 85.9 89.3 96.4 95.6 98.7 95.0 99.0

124
VA Ann Arbor Health Care System, MI 85.8 85.4 75.7 86.7 92.7 93.6 96.5 93.0 96.5
Battle Creek VAMC, MI 87.8 80.1 81.8 98.6 97.0 NA 98.8 95.2 NA
John D. Dingell VAMC, Detroit, MI 84.7 82.6 75.2 89.7 96.8 100.0 98.1 98.9 97.2
Aleda E. Lutz VAMC, Saginaw, MI 90.4 88.6 83.1 95.7 98.7 NA 100.0 97.2 NA
Jessie Brown VAMC, Chicago, IL 87.4 80.2 83.4 97.9 97.0 93.7 99.9 94.6 97.8
Edward Hines Jr. VA Hospital, Hines, IL 89.6 86.1 82.2 92.9 98.1 97.3 98.9 95.8 99.0
North Chicago VAMC, IL 91.1 91.2 86.7 95.3 99.2 100.0 99.1 99.2 99.0
Iron Mountain VAMC, MI 90.8 91.5 87.3 91.9 96.2 NA 94.1 96.7 NA
William S. Middleton Memorial Veterans Hospital, Madison, WI 88.8 90.8 86.5 97.4 98.1 95.8 97.5 98.3 98.0
Clement J. Zablocki VAMC, Milwaukee, WI 89.1 79.9 84.4 94.7 95.1 93.7 98.0 96.4 97.9
Tomah VAMC, WI 90.8 89.4 80.9 98.4 98.6 NA 92.9 98.7 NA
VA Eastern Kansas Health Care System, Topeka, Leavenworth, KS 86.9 88.3 80.1 98.1 97.2 94.1 98.3 97.3 97.6
Robert J. Dole VAMC, Wichita, KS 91.2 82.5 83.5 97.6 98.0 92.3 100.0 96.7 99.6
Harry S. Truman VAMC, Columbia, MO 85.2 87.3 71.3 100.0 98.2 94.3 99.4 97.3 97.9
Kansas City VAMC, MO 88.6 87.2 82.9 94.4 96.5 93.9 92.8 97.4 96.9
Marion VAMC, IL 84.1 85.2 74.9 96.0 96.8 71.0 98.5 95.3 NA
John J. Pershing VAMC, Poplar Bluff, MO 86.9 86.0 78.9 92.8 97.9 91.6 98.2 95.3 NA
St Louis VAMC, St Louis, Jefferson Barracks, MO 86.3 77.2 77.6 94.2 92.1 95.4 96.0 96.8 94.1
Fayetteville VAMC, AR 87.5 87.7 81.0 93.8 98.7 88.1 97.2 97.3 94.9
Central Arkansas Veterans Health Care System, Little Rock, N Little Rock, AR 87.6 83.1 79.2 78.2 96.9 90.8 92.1 95.1 95.6
Alexandria VAMC, LA 90.5 89.8 84.4 93.4 97.0 93.7 97.9 98.7 98.6
New Orleans VAMC, LA 88.4 88.6 82.9 96.8 98.5 NA NA NA NA
Overton Brooks VAMC, Shreveport, LA 85.2 87.7 82.1 90.6 93.7 97.6 97.5 97.1 95.0
Gulf Coast Veterans Health Care System, Biloxi, MS 89.9 89.8 82.7 100.0 97.1 100.0 99.3 92.9 99.1
G.V. Montgomery VAMC, Jackson, MS 84.2 87.6 79.1 89.1 98.2 97.2 99.1 96.1 99.9
Muskogee VAMC, OK 85.4 85.1 80.5 94.3 95.1 93.6 97.2 96.4 97.0
Oklahoma City VAMC, OK 88.2 80.1 79.9 99.8 87.4 91.9 99.3 95.3 97.4
Michael E. DeBakey VAMC, Houston, TX 85.2 84.1 77.7 92.1 97.6 94.2 94.2 95.2 94.3
VA North Texas Health Care System, Dallas, TX 88.2 84.7 82.3 90.4 96.2 97.3 98.3 95.2 97.5
South Texas Veterans Health Care System, San Antonio, Kerrville, TX 87.7 90.3 80.1 94.3 97.4 96.9 98.9 97.8 95.4

125
Central Texas Veterans Health Care System, Temple, Waco, Marlin, TX 87.4 89.1 75.8 88.1 97.3 89.2 96.1 95.1 96.9
Carl T. Hayden VAMC, Phoenix, AZ 83.1 86.6 77.2 84.9 91.6 94.9 99.4 98.3 97.1
No. Arizona VA Health Care System, Prescott, AZ 85.0 87.1 73.6 97.3 98.2 95.4 94.6 97.7 NA
So. Arizona VA Health Care System, Tucson, AZ 90.1 89.4 82.1 96.9 98.0 95.6 99.2 97.7 98.0
New Mexico Health Care System, Albuquerque, NM 88.0 83.2 81.6 89.6 91.6 92.8 92.4 95.8 97.2
Amarillo VA Health Care System, TX 84.9 85.1 74.1 92.9 94.5 96.2 91.5 96.0 97.9
West Texas VA Health Care System, Big Spring, TX 82.0 83.4 74.5 99.7 99.4 NA 90.7 100.0 NA
El Paso VA Health Care System, TX 85.9 87.2 78.2 88.9 93.3 NA NA NA NA
VA Eastern Colorado Health Care System, Denver, Pueblo, CO 86.8 84.0 80.8 93.1 94.7 93.3 93.6 95.3 95.5
Grand Junction VAMC, CO 86.9 85.5 81.0 97.8 96.8 NA 98.7 95.6 98.1
VA Montana Health Care System, Fort Harrison, MT 87.0 85.6 75.8 94.8 97.1 86.0 97.8 97.5 97.6
VA Salt Lake City Health Care System, UT 87.8 83.4 80.3 91.6 94.1 94.8 96.8 94.5 96.5
Cheyenne VAMC, WY 87.0 84.7 80.6 88.6 97.7 NA 82.8 87.1 98.6
Sheridan VAMC, WY 87.4 86.7 73.4 92.5 92.9 NA 100.0 96.5 NA
Alaska VA Health Care System and Regional Office, Anchorage, AK 88.9 89.8 81.5 96.9 98.2 NA NA NA NA
Boise VAMC, ID 90.4 88.3 75.4 91.0 96.8 97.7 98.9 99.0 98.4
Portland VAMC, OR 89.5 83.3 79.6 93.6 94.3 96.4 95.8 97.2 96.1
VA Roseburg Health Care System, OR 84.0 79.2 72.1 91.9 95.9 93.9 99.5 93.9 NA
Southern Oregon Rehab Center & Clinics, White City, OR 88.0 84.0 80.5 91.3 95.7 NA NA NA NA
VA Puget Sound Health Care System, Seattle, American Lake, WA 84.0 79.0 78.3 91.4 91.8 94.4 94.3 91.0 98.0
Spokane VAMC, WA 87.3 87.6 75.7 89.7 96.9 85.4 95.3 98.8 93.0
Jonathan M. Wainwright Memorial VA Medical Center, Walla Walla, WA 86.9 88.1 75.5 92.6 96.1 NA NA NA NA
VA Central California Health Care System, Fresno, CA 86.5 89.2 79.1 99.4 97.5 96.8 100.0 99.3 98.8
VA Northern California Health Care System, Martinez, Sacramento, CA 85.4 85.9 82.4 86.4 96.6 88.6 97.7 95.7 95.7
VA Palo Alto Health Care System, Palo Alto, Menlo Pk, Livermore, CA 85.8 86.6 79.3 98.9 96.0 94.2 96.8 97.6 97.3
San Francisco VAMC, CA 85.8 81.1 80.6 96.9 95.8 94.7 93.3 96.4 97.6
VA Pacific Islands Health Care System, Honolulu, HI 85.0 83.2 77.7 87.1 97.9 NA NA NA NA
VA Sierra Nevada Health Care System, Reno, NV 87.9 85.8 81.3 84.7 97.7 96.3 97.9 96.1 98.4
VA Loma Linda Health Care System, CA 84.0 81.1 72.8 92.5 90.6 95.7 99.6 96.5 98.7

126
VA Long Beach Health Care System, CA 87.6 85.9 85.2 96.4 94.3 94.7 93.6 96.1 95.2
VA Greater Los Angeles Health Care System, CA 82.7 80.3 71.6 87.2 90.5 87.8 93.4 90.9 97.9
VA San Diego Health Care System, CA 87.7 86.1 78.1 96.8 93.8 96.3 99.8 96.2 98.6
VA Southern Nevada Health Care System, Las Vegas, NV 86.9 81.2 77.2 94.2 96.5 NA 95.9 94.7 97.6
VA Nebraska Western Iowa Health Care System, Omaha, Grand Is, Lincoln, NE 91.4 90.4 81.3 98.0 99.6 93.9 99.7 99.0 98.2
VA Central Iowa Health Care System, Des Moines, Knoxville, IA 85.9 85.5 74.7 97.5 94.6 91.7 97.9 98.8 97.2
Iowa City VAMC, IA 87.6 84.0 75.1 91.7 97.2 95.3 98.8 94.4 97.9
Minneapolis VAMC, MN 87.1 89.1 75.1 96.7 96.1 95.0 96.7 98.4 97.2
St. Cloud VAMC, MN 87.5 88.8 82.4 92.6 99.3 NA NA NA NA
Fargo VAMC, ND 86.7 81.5 72.2 95.4 96.3 86.4 97.7 93.5 98.7
VA Black Hills Health Care System, Ft Meade, Hot Springs, SD 86.4 89.5 78.4 99.0 98.5 NA 92.1 95.3 NA
Sioux Falls VAMC, SD 86.0 88.2 76.3 92.3 97.5 78.7 97.4 99.0 98.3
Risk Adjusted Disease Mortality and Surgical Quality
Facility Name
Acut
e M
yoca
rdia
l Inf
arct
ion
Con
gest
ive
Hea
rt Fa
ilure
Pneu
mon
ia
All C
ause
Con
gest
ive
Hea
rt Fa
ilure
O:E
Mor
talit
y
O:E
Mor
bidi
tyVA Connecticut Health Care System, West Haven, CT 14.24 9.19 14.10 13.35 18.49 0.66 0.85
Edith N Rogers Memorial Veterans Hospital, Bedford, Ma NA NA NA NA NA NA NA
VA Boston Health Care System, W Roxbury, Brockton, Jamaica Plains, MA 12.26 7.32 12.86 14.17 25.29 0.73 0.97
Northampton VAMC, MA NA NA NA NA NA NA NA
Togus VAMC, Augusta, ME 13.33 8.98 13.95 10.46 16.33 0.73 0.56
Manchester VAMC, NH NA NA NA NA NA NA NA

127
Providence VAMC, RI 13.07 8.98 16.92 14.90 33.56 1.24 1.01
White River Junction VAMC, VT 12.71 10.02 14.52 13.79 17.44 0.76 1.15
Samuel S. Stratton VAMC, Albany, NY 14.87 13.78 17.73 13.91 37.80 1.27 0.72
VA Western New York Health Care System Buffalo, Batavia, NY 14.44 11.06 19.60 14.54 16.32 1.03 1.15
Bath VAMC, NY 14.04 10.70 16.95 12.35 33.33 NA NA
Canandaigua VAMC, NY NA NA NA NA NA NA NA
Syracuse VAMC, NY 12.79 11.67 14.40 15.33 26.52 0.84 0.96
VA New Jersey Health Care System, East Orange, NJ 13.03 9.55 15.65 16.90 26.50 1.00 1.00
James J. Peters VAMC, Bronx, NY 12.42 10.18 12.74 15.69 27.68 0.83 0.77
VA New York Harbor Health Care System, Manhattan, Brooklyn, NY 11.06 8.07 11.25 15.99 23.53 1.05 1.07
VA Hudson Valley Health Care System, Montrose, Castle Point, NY 12.98 7.77 14.66 12.42 13.16 NA NA
Northport VAMC, NY 14.54 8.64 15.02 14.84 22.39 1.10 1.17
Wilmington VAMC, DE 13.80 9.34 13.33 14.50 25.26 0.92 0.73
James E. Van Zandt VAMC, Altoona, PA 13.15 13.86 17.78 10.50 16.67 NA NA
Butler VAMC, PA NA NA NA NA NA NA NA
Coatesville VAMC, PA NA 9.66 16.62 5.56 50.00 NA NA
Erie VAMC, PA 14.03 9.95 13.60 11.62 12.70 NA NA
Lebanon VAMC, PA 14.92 10.52 15.60 11.95 18.84 0.26 1.21
Philadelphia VAMC, PA 12.91 7.70 16.13 11.88 19.50 1.20 1.20
VA Pittsburgh Health Care System, PA 13.79 9.83 14.49 15.59 24.51 1.41 1.20
Wilkes-Barre VAMC, PA 13.50 10.57 19.06 15.60 28.93 NA NA
Louis A. Johnson VAMC, Clarksburg, WV 14.36 9.95 14.85 12.79 22.94 NA NA
Washington DC VAMC, DC 12.65 9.75 14.93 13.71 21.76 1.08 0.95
VA Maryland Health Care System, Perry Pt, Baltimore, MD 12.41 8.68 12.50 13.91 23.25 0.79 1.08
Martinsburg VAMC, WV 13.70 9.75 12.89 12.73 24.14 1.13 1.15
Asheville VAMC, NC 13.03 12.16 15.51 12.96 18.26 1.41 0.94

128
Durham VAMC, NC 14.54 9.55 17.04 13.09 18.59 1.02 0.94
Fayetteville VAMC, NC 12.90 9.22 13.10 10.19 16.11 NA NA
W.G. (Bill) Hefner VAMC, Salisbury, NC 13.38 10.10 16.92 8.79 13.95 0.00 0.51
Hampton VAMC, VA 13.38 9.32 14.78 11.88 18.18 1.88 0.80
Hunter Holmes McGuire VAMC, Richmond, VA 14.91 10.67 16.07 14.24 23.74 0.98 1.13
Salem VAMC, VA 13.62 9.30 14.69 16.12 22.78 0.44 1.21
Beckley VAMC, WV 12.94 9.39 15.06 15.97 18.18 NA NA
Birmingham VAMC, AL 13.99 11.36 16.54 13.90 20.54 1.14 1.13
Central Alabama Veterans Health Care System, Tuskegee, Montgomery, AL 13.92 12.80 13.68 7.58 14.63 NA NA
Tuscaloosa VAMC, AL NA NA NA NA NA NA NA
Atlanta VAMC, GA 15.15 9.77 17.88 12.66 14.77 1.72 0.87
Charlie Norwood VAMC, Augusta, GA 14.50 11.14 21.94 13.46 25.32 1.30 1.15
Carl Vinson VAMC, Dublin, GA 13.14 11.36 16.90 12.12 23.81 NA NA
Ralph H. Johnson VAMC, Charleston, SC 13.82 9.82 15.11 13.54 19.75 1.45 0.84
Wm. Jennings Bryan Dorn VAMC, Columbia, SC 13.65 9.79 15.44 14.41 22.11 0.84 1.05
Bay Pines VA Health Care System, FL 14.76 10.30 16.52 13.73 23.53 1.13 0.83
N. Florida/S. Georgia Veterans Health Care System Gainesville, Lake City 14.03 9.10 13.46 15.77 23.87 0.88 1.48
Miami VA Health Care System, FL 12.70 7.56 14.43 14.82 22.13 1.39 1.01
Orlando VAMC, FL NA NA NA NA NA NA NA
James A. Haley VAMC, Tampa, FL 12.62 8.13 15.51 15.70 26.65 1.02 1.23
West Palm Beach VAMC, FL 13.55 8.34 13.37 8.26 14.76 1.38 0.87
VA Caribbean Health Care System, San Juan, PR 13.91 11.13 18.88 16.88 25.72 1.57 1.27
Lexington VAMC, KY 13.74 11.18 19.72 16.78 28.62 1.06 0.94
Louisville VAMC, KY 14.59 10.50 18.89 10.94 19.49 0.86 1.01
Memphis VAMC, TN 17.55 12.71 16.66 14.64 19.10 1.16 1.01

129
Mountain Home VAMC, TN 13.83 10.61 16.31 13.09 17.84 1.40 1.20
Tennessee Valley Health Care System, Nashville, Murfreesboro, TN 12.61 10.28 15.45 15.26 20.61 1.09 1.12
Huntington VAMC, WV 12.78 10.13 13.69 13.42 18.24 1.55 1.44
Chillicothe VAMC, OH 12.79 9.09 13.12 13.73 19.84 NA NA
Cincinnati VAMC, OH 13.51 9.26 16.28 16.29 30.81 1.31 1.13
Louis Stokes VAMC, Cleveland, Brecksville, OH 12.75 9.79 15.92 15.98 21.28 0.67 0.95
Chalmers P. Wylie Outpt Clinic, Columbus, OH NA NA NA NA NA NA NA
Dayton VAMC, OH 12.62 8.45 12.95 14.75 18.24 1.47 0.98
VA Illiana Health Care System, Danville, IL 15.68 9.11 13.86 14.36 19.67 1.30 0.73
VA Northern Indiana Health Care System, Marion, Ft Wayne, IN 13.13 10.55 14.41 13.17 20.39 NA NA
Richard L. Roudebush VAMC, Indianapolis, IN 14.44 9.42 13.84 16.26 27.16 1.02 1.12
VA Ann Arbor Health Care System, MI 11.46 9.74 14.46 14.39 12.75 1.10 1.21
Battle Creek VAMC, MI 13.29 11.34 14.44 8.68 12.90 NA NA
John D. Dingell VAMC, Detroit, MI 13.22 9.42 16.24 14.37 20.81 1.66 0.72
Aleda E. Lutz VAMC, Saginaw, MI 13.21 11.55 16.04 14.06 21.74 NA NA
Jessie Brown VAMC, Chicago, IL 12.39 8.16 14.32 16.84 22.51 1.24 1.32
Edward Hines Jr. VA Hospital, Hines, IL 13.74 9.51 15.32 16.73 22.62 1.13 1.10
North Chicago VAMC, IL 12.85 11.17 17.55 11.85 20.31 1.06 0.36
Iron Mountain VAMC, MI 12.43 10.09 14.44 12.43 18.75 NA NA
William S. Middleton Memorial Veterans Hospital, Madison, WI 12.71 11.04 14.52 14.39 18.30 0.64 1.23
Clement J. Zablocki VAMC, Milwaukee, WI 11.73 8.60 11.26 15.15 18.90 0.93 0.70
Tomah VAMC, WI 12.99 10.70 15.18 14.08 19.23 NA NA
VA Eastern Kansas Health Care System, Topeka, Leavenworth, KS 13.78 9.68 15.89 14.22 18.18 NA NA
Robert J. Dole VAMC, Wichita, KS 13.26 9.72 16.49 12.88 26.32 1.70 0.73
Harry S. Truman VAMC, Columbia, MO 12.57 10.63 15.11 13.52 24.00 1.33 1.25
Kansas City VAMC, MO 13.33 9.73 13.49 14.98 25.28 1.91 0.98

130
Marion VAMC, IL 14.10 11.43 15.11 16.14 26.01 NA NA
John J. Pershing VAMC, Poplar Bluff, MO 13.99 11.92 15.08 14.77 20.19 NA NA
St Louis VAMC, St Louis, Jefferson Barracks, MO 12.67 6.61 15.09 14.72 26.59 1.85 0.99
Fayetteville VAMC, AR 12.67 8.37 14.82 13.46 18.67 1.40 0.76
Central Arkansas Veterans Health Care System, Little Rock, N Little Rock, AR 13.25 9.96 15.27 14.71 22.49 0.66 0.91
Alexandria VAMC, LA 11.77 9.68 16.37 13.24 19.51 NA NA
New Orleans VAMC, LA NA NA NA NA NA NA NA
Overton Brooks VAMC, Shreveport, LA 13.99 10.52 15.20 15.64 22.38 1.24 0.85
Gulf Coast Veterans Health Care System, Biloxi, MS 12.67 8.18 15.12 9.51 8.82 0.91 1.39
G.V. Montgomery VAMC, Jackson, MS 16.52 12.34 21.41 15.22 21.13 0.82 0.72
Muskogee VAMC, OK 11.66 9.24 13.69 13.53 26.01 0.93 0.51
Oklahoma City VAMC, OK 13.79 8.73 16.96 13.78 22.95 0.77 1.11
Michael E. DeBakey VAMC, Houston, TX 13.82 9.51 17.43 14.02 22.54 0.55 1.05
VA North Texas Health Care System, Dallas, TX 13.65 10.13 14.81 14.99 23.29 1.08 1.12
South Texas Veterans Health Care System, San Antonio, Kerrville, TX 11.82 9.95 14.38 12.58 19.13 0.53 1.21
Central Texas Veterans Health Care System, Temple, Waco, Marlin, TX 13.67 9.98 14.11 11.68 17.70 0.60 0.87
Carl T. Hayden VAMC, Phoenix, AZ 13.96 8.11 15.06 12.32 24.00 1.21 1.38
No. Arizona VA Health Care System, Prescott, AZ 12.14 12.94 14.96 13.83 17.39 NA NA
So. Arizona VA Health Care System, Tucson, AZ 13.02 10.78 13.64 15.16 23.53 0.84 0.73
New Mexico Health Care System, Albuquerque, NM 10.89 11.44 14.96 12.95 25.25 1.11 0.87
Amarillo VA Health Care System, TX 14.35 10.41 20.76 11.24 14.94 1.12 0.97
West Texas VA Health Care System, Big Spring, TX 13.71 9.29 16.86 10.40 18.75 NA NA
El Paso VA Health Care System, TX NA NA NA NA NA NA NA
VA Eastern Colorado Health Care System, Denver, Pueblo, CO 14.24 11.50 12.32 12.27 14.02 1.45 1.00
Grand Junction VAMC, CO 13.22 9.63 11.78 8.77 10.42 0.42 0.57
VA Montana Health Care System, Fort Harrison, MT 12.90 10.79 12.74 17.61 16.67 0.10 0.45
VA Salt Lake City Health Care System, UT 13.55 8.31 14.20 14.46 24.11 0.75 0.82
Cheyenne VAMC, WY 13.19 9.34 13.19 9.12 22.50 0.84 0.51
Sheridan VAMC, WY 13.01 9.75 14.10 14.93 30.77 NA NA
Alaska VA Health Care System and Regional Office, Anchorage, AK NA NA NA NA NA NA NA
Boise VAMC, ID 13.77 9.26 13.72 12.89 27.27 1.08 0.81

131
Portland VAMC, OR 11.53 7.79 10.84 14.10 16.28 0.94 0.81
VA Roseburg Health Care System, OR 14.54 9.42 14.55 9.77 20.62 NA NA
Southern Oregon Rehab Center & Clinics, White City, OR NA NA NA NA NA NA NA
VA Puget Sound Health Care System, Seattle, American Lake, WA 13.55 10.60 14.10 13.77 13.07 1.07 1.13
Spokane VAMC, WA 12.70 8.94 13.03 8.89 10.53 0.00 0.64
Jonathan M. Wainwright Memorial VA Medical Center, Walla Walla, WA NA NA NA NA NA NA NA
VA Central California Health Care System, Fresno, CA 12.86 11.29 18.79 14.29 26.53 0.97 1.10
VA Northern California Health Care System, Martinez, Sacramento, CA 11.17 9.88 12.95 10.83 18.24 0.87 0.95
VA Palo Alto Health Care System, Palo Alto, Menlo Pk, Livermore, CA 12.87 8.09 15.89 11.76 15.66 1.00 0.94
San Francisco VAMC, CA 11.69 8.37 12.32 13.88 21.74 0.78 0.93
VA Pacific Islands Health Care System, Honolulu, HI NA NA NA NA NA NA NA
VA Sierra Nevada Health Care System, Reno, NV 13.06 11.15 14.46 12.87 12.75 1.15 1.03
VA Loma Linda Health Care System, CA 16.45 12.24 18.73 12.90 15.79 0.83 0.84
VA Long Beach Health Care System, CA 12.33 7.65 14.52 15.70 25.13 0.69 1.25
VA Greater Los Angeles Health Care System, CA 12.49 6.75 16.90 13.92 19.82 0.73 0.75
VA San Diego Health Care System, CA 13.13 5.53 15.02 13.96 22.76 1.29 0.86
VA Southern Nevada Health Care System, Las Vegas, NV 12.61 8.28 12.63 9.98 12.50 0.92 0.97
VA Nebraska Western Iowa Health Care System, Omaha, Grand Is, Lincoln, NE 15.39 11.14 14.85 14.96 25.68 1.23 1.01
VA Central Iowa Health Care System, Des Moines, Knoxville, IA 14.14 8.55 15.89 13.91 21.43 2.10 1.13
Iowa City VAMC, IA 11.24 10.95 15.32 12.86 23.02 1.57 0.93
Minneapolis VAMC, MN 12.18 7.74 11.22 12.52 18.29 0.66 1.03
St. Cloud VAMC, MN NA NA NA NA NA NA NA
Fargo VAMC, ND 12.38 8.57 13.33 10.34 12.90 0.74 0.85
VA Black Hills Health Care System, Ft Meade, Hot Springs, SD 12.69 9.15 13.00 10.35 6.12 0.00 0.47
Sioux Falls VAMC, SD 14.06 9.58 17.04 11.89 26.67 0.39 1.31

Section 3: Equitable Care
Gender Composites
132
Facility Name
Dia
bete
s M
ellit
us -
Fem
ale
Dia
bete
s M
ellit
us -
Mal
e
Prev
entio
n - F
emal
e
Prev
entio
n - M
ale
Isch
emic
Hea
rt D
z - F
emal
e
Isch
emic
Hea
rt D
z - M
ale
Toba
cco
- Fem
ale
Toba
cco
- Mal
e
Beha
vior
al H
ealth
Scr
eeni
ng -
Fem
ale
Beha
vior
al H
ealth
Scr
eeni
ng -
Mal
e
VA Connecticut Health Care System, West Haven, CT 84.9 84.8 77.4 86.6 76.6 81.5 89.8 97.5 92.7 96.8
Edith N Rogers Memorial Veterans Hospital, Bedford, Ma 82.5 89.1 74.8 85.4 95.3 83.2 93.5 94.7 95.5 96.1
VA Boston Health Care System, W Roxbury, Brockton, Jamaica Plains, MA 83.2 90.9 91.6 91.7 84.6 81.9 96.0 100 96.5 98.4
Northampton VAMC, MA 85.9 89.1 79.1 86.2 76.8 80.7 94.3 95.4 95.4 97.1
Togus VAMC, Augusta, ME 87.7 87.5 85.2 88.1 72.3 79.5 96.3 94.2 97.7 97.1
Manchester VAMC, NH 89.0 89.9 90.5 93.0 75.5 81.7 99.0 93.9 95.8 97.9
Providence VAMC, RI 88.8 89.2 83.5 85.9 85.0 83.1 93.0 91.8 90.5 93.7
White River Junction VAMC, VT 80.4 84.8 72.9 82.5 62.5 78.0 85.4 91.2 90.3 95.2
Samuel S. Stratton VAMC, Albany, NY 82.4 88.0 80.3 84.5 71.6 75.4 93.3 97.0 88.5 93.6
VA Western New York Health Care System Buffalo, Batavia, NY 78.6 86.1 84.4 87.7 72.8 78.1 97.1 95.7 95.4 95.4
Bath VAMC, NY 81.6 86.1 87.4 88.2 78.8 77.7 100 99.3 97 97.6
Canandaigua VAMC, NY 78.5 86.1 88.2 89.0 74.6 74.3 100.0 100.0 95.1 95.7
Syracuse VAMC, NY 83.0 88.4 82.7 84.0 72.2 81.9 94.9 99.1 90.1 97.0
VA New Jersey Health Care System, East Orange, NJ 80.9 86.8 79.3 82.3 68.8 80.0 93.8 97.6 90.1 95.0
James J. Peters VAMC, Bronx, NY 80.37 86.02 76.28 86.7 61.09 69.45 76 90.1 81.57 91.18
VA New York Harbor Health Care System, Manhattan, Brooklyn, NY 85.5 86.9 73.5 83.5 79.4 79.5 79.6 89.9 88.0 96.0
VA Hudson Valley Health Care System, Montrose, Castle Point, NY 82.3 89.7 80.9 87.6 71.0 84.4 90.0 97.4 94.2 97.4
Northport VAMC, NY 83.6 87.3 76.2 83.6 72.2 77.9 91.8 94.2 96.7 98.6

133
Wilmington VAMC, DE 82.9 87.7 80.3 87.7 79.2 79.5 94.5 98.7 96.7 98.0
James E. Van Zandt VAMC, Altoona, PA 82.3 90.6 79.1 86.4 76.9 83.9 98.5 98.7 94.0 97.1
Butler VAMC, PA 83.4 87.7 79.0 86.2 83.6 83.4 95.5 94.4 94.8 98.4
Coatesville VAMC, PA 72.8 89.3 78.5 89.2 66.1 83.5 93.3 100 95.8 97.9
Erie VAMC, PA 80.8 88.3 83.7 87.0 78.6 79.4 98.7 99.7 99.7 99.2
Lebanon VAMC, PA 85.0 88.2 80.3 88.5 68.0 77.7 83.8 94.9 92.2 98.5
Philadelphia VAMC, PA 76.4 88.4 73.3 82.1 62.7 77.7 84.6 90.1 87.9 93.7
VA Pittsburgh Health Care System, PA 78.0 89.4 77.0 85.1 71.8 84.0 81.2 93.7 93.2 96.3
Wilkes-Barre VAMC, PA 86.9 88.9 77.3 85.7 75.5 86.1 95.1 87.2 94.2 94.8
Louis A. Johnson VAMC, Clarksburg, WV 83.2 89.4 81.2 86.1 77.6 84.8 90.2 97.1 95.8 96.1
Washington DC VAMC, DC 85.4 86.9 87.0 89.7 77.4 81.1 97.3 96.5 95.2 98.4
VA Maryland Health Care System, Perry Pt, Baltimore, MD 79.8 86.9 72.7 82.2 66.1 76.1 87.1 94.2 93.2 96.4
Martinsburg VAMC, WV 89.9 88.7 83.5 83.9 80.1 83.1 95.8 95.7 89.9 96.8
Asheville VAMC, NC 81.7 89.4 88.4 89.6 74.2 76.8 96.5 90.8 96.1 97.3
Durham VAMC, NC 82.9 84.1 86.3 87.4 75.7 73.2 97.8 96.9 94.9 97.8
Fayetteville VAMC, NC 82.0 86.2 86.6 91.5 84.3 74.0 97.6 99.6 91.9 95.6
W.G. (Bill) Hefner VAMC, Salisbury, NC 87.2 88.9 87.7 91.5 79.8 82.9 94.5 96.3 94.7 94.9
Hampton VAMC, VA 78.2 86.6 89.2 88.2 65.8 79.7 93.5 96.4 93.8 96
Hunter Holmes McGuire VAMC, Richmond, VA 85.7 87.8 89.2 90.5 76.9 78.2 93.4 99.3 95.3 95.5
Salem VAMC, VA 86.2 88.4 80.1 86.6 78.1 83.0 96.1 94.9 96 97.0
Beckley VAMC, WV 85.7 87.5 78.6 84.9 85.2 80.2 91.3 97.9 98.7 98.4
Birmingham VAMC, AL 83.4 89.4 78.7 85.4 77.7 84.9 91.0 94.7 92.6 96.0
Central Alabama Veterans Health Care System, Tuskegee, Montgomery, AL 79.5 86.8 75.0 82.8 74.7 79.8 97.5 99.4 95.6 97.8
Tuscaloosa VAMC, AL 87.1 88.2 77.4 89.1 79.4 83.7 98.7 99.5 97 96.5
Atlanta VAMC, GA 82.7 88.1 78.4 85.2 75.7 80.1 99.5 94.1 88.8 93.9
Charlie Norwood VAMC, Augusta, GA 82.2 89.8 69.7 81.8 74.1 84.4 94.1 93.8 86.9 93.2

134
Carl Vinson VAMC, Dublin, GA 87.8 88.2 78.3 85.6 79.5 81.1 87.5 91.7 97.3 97.0
Ralph H. Johnson VAMC, Charleston, SC 80.3 86.8 83.0 87.4 79.0 78.6 98.1 99.4 95.9 97.2
Wm. Jennings Bryan Dorn VAMC, Columbia, SC 87.7 89.0 88.1 89.5 73.0 71.3 98.7 99.5 87.2 93.3
Bay Pines VA Health Care System, FL 85.0 88.0 74.1 81.6 72.2 79.7 91.8 93.0 93.8 96.8
N. Florida/S. Georgia Veterans Health Care System Gainesville, Lake City 83.3 89.1 84.7 85.5 73.5 79.7 97.4 96.3 95.9 98.4
Miami VA Health Care System, FL 80.7 83.8 76.7 81.0 65.2 76.9 90.4 90.7 95.2 96.0
Orlando VAMC, FL 84.3 88.6 75.3 76.4 74.6 82.3 88.7 93.1 95.6 95.8
James A. Haley VAMC, Tampa, FL 88.5 89.1 81.5 84.6 77.1 79.6 91.4 91.6 96.9 97.7
West Palm Beach VAMC, FL 85.9 92.7 85.7 91.1 76.5 87.9 99.1 100.0 96.9 99.5
VA Caribbean Health Care System, San Juan, PR 86.2 86.8 88.1 87.8 73.9 79.7 91.0 88.5 96.3 96.1
Lexington VAMC, KY 82.7 86.7 78.2 87.0 66.9 76.9 90.5 90.3 94.5 97.7
Louisville VAMC, KY 76.4 86.3 80.9 85.1 70.4 83.9 89.8 90.1 93.8 96.7
Memphis VAMC, TN 81.2 89.2 69.1 78.4 72.1 80.0 83.7 83.6 96.6 95.4
Mountain Home VAMC, TN 74.7 87.8 76.5 87.0 79.9 76.4 93.9 96.7 95.9 96.0
Tennessee Valley Health Care System, Nashville, Murfreesboro, TN 76.4 85.2 70.6 79.6 66.8 77.4 80.0 91.5 90.4 92.2
Huntington VAMC, WV 84.4 90.3 86.0 89.6 72.6 81.4 97.1 94.9 63.0 74.0
Chillicothe VAMC, OH 82.1 88.4 80.3 85.5 77.4 80.6 93.8 95.0 94.4 97.3
Cincinnati VAMC, OH 88.9 89.9 82.7 85.4 78.2 80.3 95.4 94.9 94.9 98.0
Louis Stokes VAMC, Cleveland, Brecksville, OH 84.6 87.3 81.0 87.4 72.6 80.3 84.6 92.0 94.4 97.4
Chalmers P. Wylie Outpt Clinic, Columbus, OH 85.0 86.4 82.6 82.4 67.4 77.2 98.3 97.8 93.3 96.0
Dayton VAMC, OH 84.0 87.4 77.2 84.0 74.1 79.6 93.0 94.7 94.2 97.0
VA Illiana Health Care System, Danville, IL 79.9 86.1 79.4 86.4 72.5 79.4 89.3 94.5 94.9 97.0
VA Northern Indiana Health Care System, Marion, Ft Wayne, IN 81.6 87.0 76.9 82.4 77.4 76.4 96.0 97.4 95.6 98.1
Richard L. Roudebush VAMC, Indianapolis, IN 83.4 89.7 84.1 85.3 76.2 85.8 90.5 88.7 95.1 96.4
VA Ann Arbor Health Care System, MI 83.1 86.0 81.0 84.1 77.2 75.7 85.4 86.1 90.1 93.3

135
Battle Creek VAMC, MI 78.8 87.8 73.3 78.9 75.3 82.1 98.5 98.6 94.2 96.9
John D. Dingell VAMC, Detroit, MI 88.3 84.5 75.4 79.9 79.0 75.2 87.8 89.4 95.1 96.7
Aleda E. Lutz VAMC, Saginaw, MI 84.2 90.4 77.9 86.1 80.4 83.4 90.2 95.8 94.4 98.7
Jessie Brown VAMC, Chicago, IL 86.1 87.6 69.6 76.2 77.9 83.5 92.6 97.8 97.3 96.9
Edward Hines Jr. VA Hospital, Hines, IL 88.6 89.6 79.6 85.7 75.9 82.2 93.0 92.6 94.1 98.1
North Chicago VAMC, IL 87.9 91.2 88.7 90.8 81.2 86.6 85.2 95.2 97.0 99.3
Iron Mountain VAMC, MI 88.4 90.9 80.4 89.8 67.6 87.4 89.2 91.8 95.1 96.2
William S. Middleton Memorial Veterans Hospital, Madison, WI 87.6 89.0 84.9 89.8 71.8 87.4 93.5 97.3 97.1 98.3
Clement J. Zablocki VAMC, Milwaukee, WI 85.1 89.1 65.5 76.7 76.1 84.6 88.3 94.2 90.9 95.0
Tomah VAMC, WI 89.2 91.4 84.4 88.6 77.2 81.6 99.1 98.4 98.0 98.6
VA Eastern Kansas Health Care System, Topeka, Leavenworth, KS 85.4 86.9 86.3 89.3 81.3 80.1 93.3 97.9 94.8 97.2
Robert J. Dole VAMC, Wichita, KS 86.4 91.2 72.2 79.3 80.4 83.4 94.3 98.0 97.6 97.9
Harry S. Truman VAMC, Columbia, MO 84.4 85.4 83.1 87.7 71.0 71.6 100.0 100.0 96.3 98.2
Kansas City VAMC, MO 83.5 88.7 77.0 87.7 75.0 84.1 95.9 94.2 96.0 96.4
Marion VAMC, IL 77.6 84.2 79.9 87.3 71.6 74.7 90.2 95.8 93.7 96.9
John J. Pershing VAMC, Poplar Bluff, MO 76.8 87.0 83.1 85.0 72.7 78.9 94.4 92.4 94.9 98.1
St Louis VAMC, St Louis, Jefferson Barracks, MO 84.3 86.3 69.5 73.4 67.9 77.3 93.3 93.9 91.4 92.0
Fayetteville VAMC, AR 80.1 87.6 83.7 87.6 67.6 81.1 90.1 94.2 97.3 98.8
Central Arkansas Veterans Health Care System, Little Rock, N Little Rock, AR 75.0 87.9 77.2 81.2 62.0 79.3 73.1 77.9 96.3 96.8
Alexandria VAMC, LA 84.4 90.5 86.5 88.3 80.9 84.7 97.4 92.9 98.7 97.0
New Orleans VAMC, LA 84.8 88.2 81.4 87.5 82.2 82.8 97.3 96.6 98.0 98.6
Overton Brooks VAMC, Shreveport, LA 88.5 85.0 86.8 86.9 72.8 81.9 93.9 90.2 85.5 94.4 Gulf Coast Veterans Health Care System, Biloxi, MS 83.3 90.1 85.7 89.1 78.5 83.0 99.1 100.0 95 97.2
G.V. Montgomery VAMC, Jackson, MS 77.3 84.7 69.9 85.7 79.4 79.3 77.3 88.9 95.0 98.3
Muskogee VAMC, OK 85.2 85.4 78.0 83.8 78.2 80.7 97.2 94.2 93.7 95.1
Oklahoma City VAMC, OK 84.3 88.4 72.5 78.0 72.9 80.3 99.6 99.7 82.0 87.1
Michael E. DeBakey VAMC, Houston, TX 81.7 85.5 79.2 83.2 75.4 77.8 89.1 91.9 97.6 97.6
VA North Texas Health Care System, Dallas, TX 86.4 88.2 77.1 84.0 77.1 82.6 85.3 91.7 91.2 96.2
South Texas Veterans Health Care System, San Antonio, Kerrville, TX 80.5 88.1 88.0 89.0 79.0 80.9 92.4 93.9 97.6 97.3
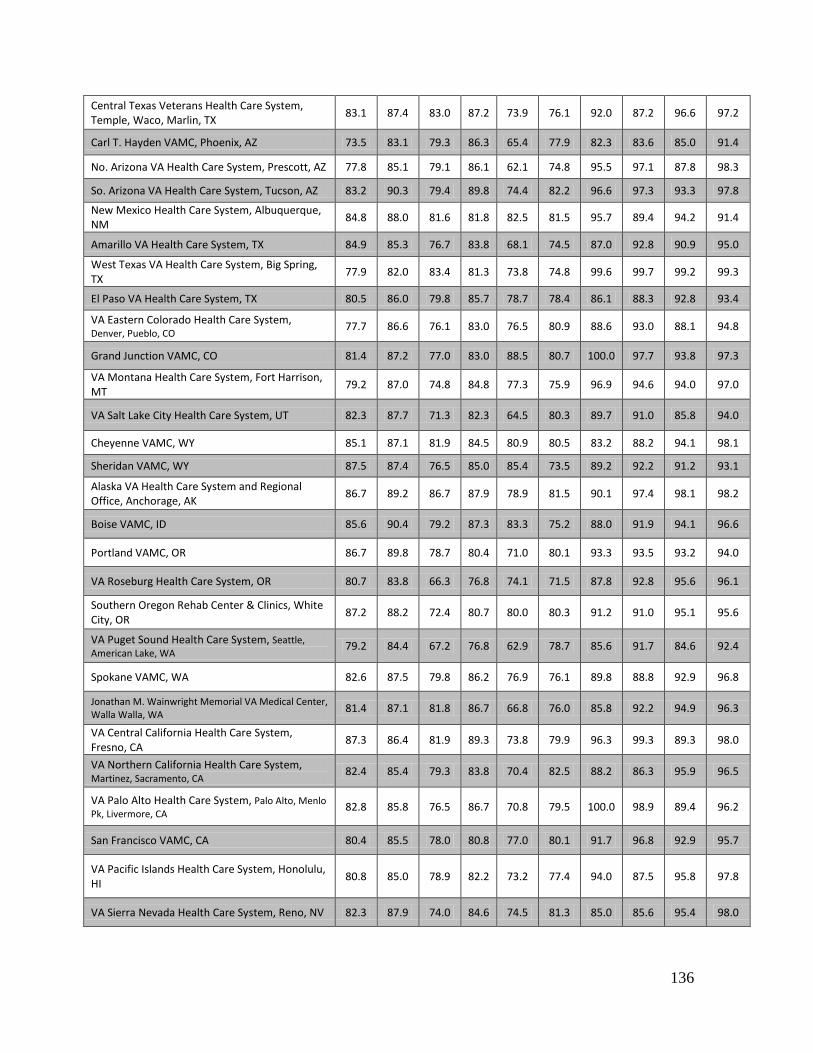
136
Central Texas Veterans Health Care System, Temple, Waco, Marlin, TX 83.1 87.4 83.0 87.2 73.9 76.1 92.0 87.2 96.6 97.2
Carl T. Hayden VAMC, Phoenix, AZ 73.5 83.1 79.3 86.3 65.4 77.9 82.3 83.6 85.0 91.4
No. Arizona VA Health Care System, Prescott, AZ 77.8 85.1 79.1 86.1 62.1 74.8 95.5 97.1 87.8 98.3
So. Arizona VA Health Care System, Tucson, AZ 83.2 90.3 79.4 89.8 74.4 82.2 96.6 97.3 93.3 97.8
New Mexico Health Care System, Albuquerque, NM 84.8 88.0 81.6 81.8 82.5 81.5 95.7 89.4 94.2 91.4
Amarillo VA Health Care System, TX 84.9 85.3 76.7 83.8 68.1 74.5 87.0 92.8 90.9 95.0
West Texas VA Health Care System, Big Spring, TX 77.9 82.0 83.4 81.3 73.8 74.8 99.6 99.7 99.2 99.3
El Paso VA Health Care System, TX 80.5 86.0 79.8 85.7 78.7 78.4 86.1 88.3 92.8 93.4
VA Eastern Colorado Health Care System, Denver, Pueblo, CO 77.7 86.6 76.1 83.0 76.5 80.9 88.6 93.0 88.1 94.8
Grand Junction VAMC, CO 81.4 87.2 77.0 83.0 88.5 80.7 100.0 97.7 93.8 97.3
VA Montana Health Care System, Fort Harrison, MT 79.2 87.0 74.8 84.8 77.3 75.9 96.9 94.6 94.0 97.0
VA Salt Lake City Health Care System, UT 82.3 87.7 71.3 82.3 64.5 80.3 89.7 91.0 85.8 94.0
Cheyenne VAMC, WY 85.1 87.1 81.9 84.5 80.9 80.5 83.2 88.2 94.1 98.1
Sheridan VAMC, WY 87.5 87.4 76.5 85.0 85.4 73.5 89.2 92.2 91.2 93.1
Alaska VA Health Care System and Regional Office, Anchorage, AK 86.7 89.2 86.7 87.9 78.9 81.5 90.1 97.4 98.1 98.2
Boise VAMC, ID 85.6 90.4 79.2 87.3 83.3 75.2 88.0 91.9 94.1 96.6
Portland VAMC, OR 86.7 89.8 78.7 80.4 71.0 80.1 93.3 93.5 93.2 94.0
VA Roseburg Health Care System, OR 80.7 83.8 66.3 76.8 74.1 71.5 87.8 92.8 95.6 96.1
Southern Oregon Rehab Center & Clinics, White City, OR 87.2 88.2 72.4 80.7 80.0 80.3 91.2 91.0 95.1 95.6
VA Puget Sound Health Care System, Seattle, American Lake, WA 79.2 84.4 67.2 76.8 62.9 78.7 85.6 91.7 84.6 92.4
Spokane VAMC, WA 82.6 87.5 79.8 86.2 76.9 76.1 89.8 88.8 92.9 96.8
Jonathan M. Wainwright Memorial VA Medical Center, Walla Walla, WA 81.4 87.1 81.8 86.7 66.8 76.0 85.8 92.2 94.9 96.3
VA Central California Health Care System, Fresno, CA 87.3 86.4 81.9 89.3 73.8 79.9 96.3 99.3 89.3 98.0
VA Northern California Health Care System, Martinez, Sacramento, CA 82.4 85.4 79.3 83.8 70.4 82.5 88.2 86.3 95.9 96.5
VA Palo Alto Health Care System, Palo Alto, Menlo Pk, Livermore, CA 82.8 85.8 76.5 86.7 70.8 79.5 100.0 98.9 89.4 96.2
San Francisco VAMC, CA 80.4 85.5 78.0 80.8 77.0 80.1 91.7 96.8 92.9 95.7
VA Pacific Islands Health Care System, Honolulu, HI 80.8 85.0 78.9 82.2 73.2 77.4 94.0 87.5 95.8 97.8
VA Sierra Nevada Health Care System, Reno, NV 82.3 87.9 74.0 84.6 74.5 81.3 85.0 85.6 95.4 98.0

137
VA Loma Linda Health Care System, CA 74.6 84.3 78.3 80.5 69.9 73.3 92.3 92.3 90.1 90.6
VA Long Beach Health Care System, CA 80.9 87.5 80.8 84.6 77.4 85.1 95.9 96.3 94.0 94.4
VA Greater Los Angeles Health Care System, CA 84.0 82.4 79.8 76.7 70.3 71.6 83.2 87.8 90.0 90.9
VA San Diego Health Care System, CA 88.7 87.6 81.0 85.7 74.7 78.2 82.3 96.6 92.8 94.0
VA Southern Nevada Health Care System, Las Vegas, NV 84.4 86.7 77.9 78.7 76.4 77.2 95.7 93.7 97.0 96.6
VA Nebraska Western Iowa Health Care System, Omaha, Grand Is, Lincoln, NE 86.5 91.6 86.8 89.8 75.0 81.4 96.2 98.2 96.8 99.6
VA Central Iowa Health Care System, Des Moines, Knoxville, IA 82.3 85.8 76.7 86.0 70.8 74.9 92.2 97.4 95.7 94.6
Iowa City VAMC, IA 81.0 87.7 77.1 81.6 78.8 75.3 93.5 91.7 95.6 97.1
Minneapolis VAMC, MN 80.7 87.2 81.6 89.3 73.7 75.0 93.3 97.7 93.5 96.5
St. Cloud VAMC, MN 87.4 87.5 79.2 87.2 70.2 82.3 92.5 92.1 93.7 99.3
Fargo VAMC, ND 76.2 86.7 73.1 81.6 73.6 72.1 93.9 95.2 93.7 96.5
VA Black Hills Health Care System, Ft Meade, Hot Springs, SD 82.4 86.5 84.4 88.0 77.5 78.1 93.3 98.9 98.3 98.6
Sioux Falls VAMC, SD 81.0 86.0 82.1 87.0 66.7 76.5 89.4 92.2 95.9 97.5
Age Composites
Facility Name
Dia
bete
s M
ellit
us -
<65
year
s
Dia
bete
s M
ellit
us -
65-7
5 ye
ars
Prev
entio
n - <
65 y
ears
Prev
entio
n - 6
5-75
yea
rs
Isch
emic
Hea
rt D
z - <
65
year
s
Isch
emic
Hea
rt D
z - 6
5-75
ye
ars
Toba
cco
- <65
yea
rs
Toba
cco
- 65-
75 y
ears
Beha
vior
al H
ealth
Scr
eeni
ng -
<65
year
s
Beha
vior
al H
ealth
Scr
eeni
ng -
65-7
5 ye
ars
VA Connecticut Health Care System, West Haven, CT 85.0 84.6 81.2 87.0 80.3 83.4 98.3 94.4 95.6 97.3
Edith N Rogers Memorial Veterans Hospital, Bedford, Ma 86.9 91.3 80.2 92.8 87.8 85.1 94.3 97.0 93.9 100
VA Boston Health Care System, W Roxbury, Brockton, Jamaica Plains, MA 90.0 91.8 90.9 89.7 79.3 85.3 100 100 97.4 98.0
Northampton VAMC, MA 87.6 92.2 81.9 91.9 84.3 80.0 96.5 92.9 96.6 97.3
Togus VAMC, Augusta, ME 86.5 89.9 86.1 90.2 76.5 84.2 94.8 88.1 96.0 97.1

138
Manchester VAMC, NH 88.5 91.5 92.4 93.1 77.8 84.8 94.2 100 96.2 98.6
Providence VAMC, RI 88.4 89.4 84.4 85.9 81.0 83.5 94.0 94.4 92.7 97.1
White River Junction VAMC, VT 84.4 85.2 74.3 87.2 77.6 77.8 93.3 91.7 94.1 96.4
Samuel S. Stratton VAMC, Albany, NY 86.5 89.5 80.7 87.1 72.6 77.6 97.1 94.4 90.7 94
VA Western New York Health Care System Buffalo, Batavia, NY 85.5 86.9 82.1 90.9 76.5 80.0 96.3 91.1 95.0 94.6
Bath VAMC, NY 85.9 85.9 85.9 89.8 73.3 81.2 99.2 100 97.2 97.7
Canandaigua VAMC, NY 84.7 89.4 86.7 91.4 73.5 77.4 100 100 94.3 96
Syracuse VAMC, NY 86.9 90.0 80.1 88.9 83.7 80.6 98.7 95.8 96.6 97.8
VA New Jersey Health Care System, East Orange, NJ 84.2 90.7 77.0 82.9 75.1 83.3 96.1 97.2 91.2 96.4
James J. Peters VAMC, Bronx, NY 84.1 89.4 83.8 88.1 72.6 67.0 90.5 85.4 90.6 90.0
VA New York Harbor Health Care System, Manhattan, Brooklyn, NY 87.1 86.8 78.6 82.7 78.6 84.2 90.9 85.7 94.4 98.9
VA Hudson Valley Health Care System, Montrose, Castle Point, NY 88.9 90.7 84.9 88.1 80.5 88.3 98.2 90.9 96.7 97.5
Northport VAMC, NY 84.9 90.2 77.3 82.7 76.1 80.7 NA NA 98.3 99.0
Wilmington VAMC, DE 86.2 88.5 82.7 91.1 78.0 79.0 96.8 100 97.5 98.6
James E. Van Zandt VAMC, Altoona, PA 89.2 92.2 82.0 87.4 81.5 87.3 97.9 96.6 96.0 96.4
Butler VAMC, PA 87.2 87.9 80.0 87.9 79.7 85.9 94.7 97.9 98.8 98
Coatesville VAMC, PA 88.3 90.0 81.7 94.2 77.7 87.6 100 100 96.2 98.0
Erie VAMC, PA 87.8 88.3 78.4 89.6 77.4 81.7 99.6 100 99.7 99
Lebanon VAMC, PA 86.0 91.9 83.2 91.2 74.6 81.3 94.3 95.7 97.2 100
Philadelphia VAMC, PA 87.0 89.5 72.6 89.7 73.8 82.5 92.3 82.2 92.4 95.8
VA Pittsburgh Health Care System, PA 90.0 88.8 79.5 87.3 83.2 85.2 93.7 91.3 91.8 98.5
Wilkes-Barre VAMC, PA 88.7 89.4 80.2 88.0 81.6 88.3 87.7 82.5 94.0 94.7
Louis A. Johnson VAMC, Clarksburg, WV 88.4 90.5 84.0 87.2 81.8 89.3 97.4 93.0 96.0 97.0
Washington DC VAMC, DC 85.4 90.3 89.0 89.2 79.5 83.6 96.5 95.2 98.2 98.1
VA Maryland Health Care System, Perry Pt, Baltimore, MD 84.6 91.2 74.2 88.5 71.9 80.6 93.0 97.2 95.5 95.3
Martinsburg VAMC, WV 87.9 89.6 80.6 85.6 81.9 84.9 96.7 94.1 96.5 97.7
Asheville VAMC, NC 88.6 90.0 88.0 90.8 75.1 79.1 91.4 89.3 97.5 96.0

139
Durham VAMC, NC 82.9 88.0 85.6 90.4 69.7 84.1 96.7 100.0 97.1 100.0
Fayetteville VAMC, NC 84.4 87.3 90.1 93.3 76.6 71.8 NA NA 94 97.2
W.G. (Bill) Hefner VAMC, Salisbury, NC 87.7 91.3 90.2 92.2 81.0 86.8 97.4 97.9 95.0 95.0
Hampton VAMC, VA 85.1 89.5 87.9 90.9 76.2 83.0 96.5 97.4 96 98
Hunter Holmes McGuire VAMC, Richmond, VA 87.7 88.2 90.5 91.3 76.7 79.2 99.2 100.0 95.1 95.8
Salem VAMC, VA 89.3 87.3 82.1 90.8 82.1 84.3 93.6 97.9 96.1 96
Beckley VAMC, WV 86.3 89.1 81.8 87.3 79.6 81.9 97.8 98.9 97.5 98.4
Birmingham VAMC, AL 88.9 90.1 84.0 88.2 82.7 89.7 95.3 97.8 96.3 96.8
Central Alabama Veterans Health Care System, Tuskegee, Montgomery, AL 85.5 89.4 80.4 85.8 76.5 85.1 99.4 100 96.4 99
Tuscaloosa VAMC, AL 87.2 89.9 86.7 92.8 80.5 87.8 99.4 100 96.6 96.2
Atlanta VAMC, GA 87.1 91.0 83.7 86.3 79.9 80.1 94.1 98.0 92.0 97.1
Charlie Norwood VAMC, Augusta, GA 87.7 92.5 77.2 84.0 83.5 85.8 93.9 96.3 91.3 96.8
Carl Vinson VAMC, Dublin, GA 88.3 87.3 82.6 87.6 77.4 85.1 91.4 95.7 96.9 96.3
Ralph H. Johnson VAMC, Charleston, SC 86.3 87.8 87.3 86.4 76.3 84.0 98.4 100.0 97.3 96.3
Wm. Jennings Bryan Dorn VAMC, Columbia, SC 88.9 89.1 88.6 90.1 66.0 79.8 99.4 100.0 91.0 97.5
Bay Pines VA Health Care System, FL 87.0 89.3 75.8 81.4 79.6 80.8 91.0 97.9 96.5 96.9
N. Florida/S. Georgia Veterans Health Care System Gainesville, Lake City 89.1 88.9 82.9 89.2 78.7 82.1 97.1 96.5 97.5 99.0
Miami VA Health Care System, FL 83.4 84.3 76.7 84.1 75.1 82.2 88.6 94.9 94.5 94.4
Orlando VAMC, FL 86.1 91.0 69.5 84.5 78.3 88.1 93.0 97.0 94.2 97.7
James A. Haley VAMC, Tampa, FL 88.0 90.9 79.7 88.8 79.8 79.9 93.9 87.3 97.1 99.6
West Palm Beach VAMC, FL 91.4 94.4 87.8 92.4 84.6 89.8 100 100.0 99 100.0
VA Caribbean Health Care System, San Juan, PR 84.3 89.0 84.8 88.7 76.8 85.0 NA NA 93.8 98.8
Lexington VAMC, KY 84.7 89.4 86.4 86.6 78.2 78.2 90.4 93.7 96.7 98.1
Louisville VAMC, KY 84.2 89.0 81.4 87.4 80.2 87.2 93.6 83.3 95.6 98.1
Memphis VAMC, TN 89.2 89.0 73.5 81.6 79.2 83.0 81.7 85.5 95.7 95.1

140
Mountain Home VAMC, TN 86.5 89.2 84.5 89.6 75.1 77.9 97.4 92.4 97.0 94.8
Tennessee Valley Health Care System, Nashville, Murfreesboro, TN 84.3 85.2 75.1 82.9 75.7 80.4 91.6 92.9 90.2 94.1
Huntington VAMC, WV 89.8 91.2 87.9 90.1 81.9 82.3 94.8 90.5 75.0 72
Chillicothe VAMC, OH 87.7 89.8 83.0 88.5 79.1 82.5 95.5 93.7 97.2 96.5
Cincinnati VAMC, OH 89.1 91.7 84.9 84.8 78.8 84.8 95.5 91.1 97.5 98.7
Louis Stokes VAMC, Cleveland, Brecksville, OH 86.0 90.6 83.7 88.6 80.2 81.1 93.4 88.2 97.5 97.0
Chalmers P. Wylie Outpt Clinic, Columbus, OH 84.7 89.1 78.5 83.8 76.0 78.4 97.3 100.0 95.5 97.6
Dayton VAMC, OH 86.6 88.5 81.3 85.8 76.7 83.7 94.4 98.0 96.5 99.5
VA Illiana Health Care System, Danville, IL 87.2 84.2 81.7 92.8 78.8 79.3 94.6 90.2 95.8 99.0
VA Northern Indiana Health Care System, Marion, Ft Wayne, IN 86.4 87.5 74.7 87.2 74.2 76.4 97.3 97.2 96.8 99.2
Richard L. Roudebush VAMC, Indianapolis, IN 89.4 90.1 82.9 86.1 83.9 90.1 88.1 98.3 95.2 98.3
VA Ann Arbor Health Care System, MI 84.8 88.1 79.3 90.0 75.8 76.9 88.2 82.4 92.2 94.0
Battle Creek VAMC, MI 86.9 89.5 73.0 83.3 81.1 84.7 98.3 100.0 96.2 96.6
John D. Dingell VAMC, Detroit, MI 82.6 89.7 76.4 82.9 74.2 77.9 91.3 86.1 96.8 97.1
Aleda E. Lutz VAMC, Saginaw, MI 89.4 92.0 82.2 91.5 81.7 84.4 95.9 93.7 97.8 100.0
Jessie Brown VAMC, Chicago, IL 86.9 88.3 70.3 82.2 82.5 86.0 98.4 100.0 96.6 99.1
Edward Hines Jr. VA Hospital, Hines, IL 87.9 92.0 82.7 86.0 79.2 83.9 93.1 90.0 97.0 98.5
North Chicago VAMC, IL 90.6 92.1 87.8 90.7 86.2 87.7 97.1 84.4 99.2 99.1
Iron Mountain VAMC, MI 89.2 92.8 85.7 90.9 85.3 89.5 91.4 93.9 93.1 99.1
William S. Middleton Memorial Veterans Hospital, Madison, WI 87.2 91.5 88.1 90.6 84.0 88.5 98.2 92.3 97.1 99.5
Clement J. Zablocki VAMC, Milwaukee, WI 87.7 91.8 70.4 79.6 82.6 87.1 95.6 92.9 96.4 92.0
Tomah VAMC, WI 89.7 92.5 85.6 90.8 81.2 81.8 98.0 100.0 98.7 97.9
VA Eastern Kansas Health Care System, Topeka, Leavenworth, KS 85.8 89.2 88.0 89.7 77.1 82.4 99.4 90.0 96.0 98.3
Robert J. Dole VAMC, Wichita, KS 90.6 92.0 74.2 84.6 80.9 86.5 97.3 100.0 98.0 98.3
Harry S. Truman VAMC, Columbia, MO 84.1 86.8 84.3 90.0 68.5 77.5 100 100.0 97.7 98.5
Kansas City VAMC, MO 87.5 90.3 81.8 89.5 82.9 80.6 94.9 88.2 94.2 98.7

141
Marion VAMC, IL 82.7 86.2 83.3 90.2 73.1 74.9 96.7 94.7 96.2 97.3
John J. Pershing VAMC, Poplar Bluff, MO 87.1 86.2 80.3 89.1 81.3 75.3 93.2 93.1 98.2 97.4
St Louis VAMC, St Louis, Jefferson Barracks, MO 84.3 91.2 67.1 83.3 75.9 80.8 93.4 100.0 90.5 91.7
Fayetteville VAMC, AR 86.2 89.6 85.6 87.8 79.3 84.7 93.9 91.7 98.6 98.5
Central Arkansas Veterans Health Care System, Little Rock, N Little Rock, AR 87.4 88.1 78.0 82.5 80.4 80.4 78.7 74.7 95.4 98.6
Alexandria VAMC, LA 90.2 91.0 87.5 86.8 84.4 85.1 94.1 90.9 97.9 96.7
New Orleans VAMC, LA 88.0 89.4 84.4 90.4 83.6 81.4 97.7 97.8 98.5 100
Overton Brooks VAMC, Shreveport, LA 85.1 85.3 83.9 89.1 81.5 83.9 89.4 95.7 92.2 97.7
Gulf Coast Veterans Health Care System, Biloxi, MS 88.8 92.3 88.3 90.5 79.4 88.4 100 100.0 96.7 99
G.V. Montgomery VAMC, Jackson, MS 82.7 86.8 82.7 86.8 76.3 85.0 90.5 84.2 97.8 98.2
Muskogee VAMC, OK 83.9 88.4 78.8 89.3 79.1 81.7 93.2 100.0 94.2 97.6
Oklahoma City VAMC, OK 88.4 87.8 73.1 82.3 77.8 84.1 100 98.2 87.6 88.6
Michael E. DeBakey VAMC, Houston, TX 84.6 86.4 80.3 85.7 76.6 78.7 91.9 90.7 97.6 98.7
VA North Texas Health Care System, Dallas, TX 86.8 90.5 80.5 85.2 80.2 85.9 90.2 90.9 94.5 98.7
South Texas Veterans Health Care System, San Antonio, Kerrville, TX 87.1 89.2 87.0 92.2 77.8 83.9 94.0 100.0 97.0 97.7
Central Texas Veterans Health Care System, Temple, Waco, Marlin, TX 87.8 86.6 85.1 87.4 75.4 76.4 90.8 82.5 97.5 97.7
Carl T. Hayden VAMC, Phoenix, AZ 80.9 87.4 82.6 89.4 75.0 81.7 83.7 91.3 91.4 90.8
No. Arizona VA Health Care System, Prescott, AZ 85.2 84.7 84.7 86.6 73.3 75.0 97.0 97.4 98.2 97.7
So. Arizona VA Health Care System, Tucson, AZ 88.9 91.9 86.1 94.3 82.8 82.4 96.2 100.0 97.0 98.0
New Mexico Health Care System, Albuquerque, NM 87.6 88.6 77.0 84.7 81.8 81.4 87.7 100.0 90.1 92.7
Amarillo VA Health Care System, TX 83.1 87.9 81.2 83.1 67.6 82.5 92.2 92.8 94.7 94.1
West Texas VA Health Care System, Big Spring, TX 81.1 83.7 77.7 85.7 76.1 77.5 99.7 100.0 99.1 99.6
El Paso VA Health Care System, TX 86.1 85.5 82.3 89.4 78.9 77.6 88.2 96.7 93.0 93.6
VA Eastern Colorado Health Care System, Denver, Pueblo, CO 85.6 89.6 80.0 86.6 80.1 84.2 94.4 88.9 94.1 98.0
Grand Junction VAMC, CO 85.4 88.9 78.8 84.1 77.5 83.9 98.8 93.0 96.2 97
VA Montana Health Care System, Fort Harrison, MT 87.0 86.9 81.8 86.9 73.6 79.8 94.2 98.4 97.0 94.6
VA Salt Lake City Health Care System, UT 86.6 89.6 77.6 87.7 77.2 83.0 NA NA 93.6 94.0
Cheyenne VAMC, WY 86.1 88.7 81.9 88.1 75.8 88.3 NA NA 96.3 100
Sheridan VAMC, WY 87.0 88.1 80.8 88.5 74.3 71.3 93.7 89.4 91.0 95.9
Alaska VA Health Care System and Regional Office, Anchorage, AK 88.7 89.6 87.7 88.6 78.5 86.9 96.3 100.0 97.9 99.4

142
Boise VAMC, ID 89.8 91.3 84.6 88.5 71.7 77.8 90.9 90.0 96.8 96.5
Portland VAMC, OR 88.1 91.9 76.4 86.3 79.3 80.4 94.2 98.4 93.9 97.4
VA Roseburg Health Care System, OR 82.1 87.2 71.2 83.4 72.9 70.8 90.9 95.8 94.5 97.7
Southern Oregon Rehab Center & Clinics, White City, OR 87.1 89.9 78.7 84.3 82.7 78.3 92.9 92.6 95.5 95.7
VA Puget Sound Health Care System, Seattle, American Lake, WA 83.3 85.3 71.7 80.4 76.3 81.6 91.4 88.9 91.2 95.1
Spokane VAMC, WA 86.9 88.2 85.8 86.1 76.2 77.1 89.2 93.3 96.5 97.4
Jonathan M. Wainwright Memorial VA Medical Center, Walla Walla, WA 86.4 87.6 83.0 89.3 73.7 76.6 91.9 95.2 95.3 96.3
VA Central California Health Care System, Fresno, CA 85.2 89.2 87.6 88.2 74.0 85.6 99.2 100.0 97.6 97.4
VA Northern California Health Care System, Martinez, Sacramento, CA 83.8 88.0 80.2 88.5 80.5 87.2 89.3 74.4 96.0 98.3
VA Palo Alto Health Care System, Palo Alto, Menlo Pk, Livermore, CA 83.6 90.3 84.0 88.6 79.6 82.2 98.6 100.0 95.0 98.9
San Francisco VAMC, CA 85.1 87.3 76.8 84.7 80.2 79.0 96.6 100.0 97.1 93.8
VA Pacific Islands Health Care System, Honolulu, HI 85.2 84.1 80.0 83.7 77.5 75.5 85.7 100.0 98.3 97.4
VA Sierra Nevada Health Care System, Reno, NV 86.8 89.8 83.1 86.7 80.1 84.7 85.3 89.5 97.7 97.4
VA Loma Linda Health Care System, CA 82.6 87.2 77.4 81.7 69.6 80.2 92.0 100.0 89.4 94.5
VA Long Beach Health Care System, CA 86.8 89.0 83.0 85.4 85.5 85.4 96.7 93.3 94.2 95
VA Greater Los Angeles Health Care System, CA 81.6 84.3 72.0 80.0 69.2 74.3 NA NA 88.2 92.4
VA San Diego Health Care System, CA 87.1 88.8 84.2 87.2 75.4 83.8 NA NA 91.5 96.8
VA Southern Nevada Health Care System, Las Vegas, NV 86.7 87.4 71.7 84.9 74.9 78.6 94.5 96.0 96.6 97.1
VA Nebraska Western Iowa Health Care System, Omaha, Grand Is, Lincoln, NE 90.6 92.5 89.1 86.0 78.7 83.1 97.6 100.0 99.3 100.0
VA Central Iowa Health Care System, Des Moines, Knoxville, IA 83.4 89.7 80.9 86.3 76.3 75.8 97.6 95.6 93.6 96.4
Iowa City VAMC, IA 87.0 88.5 76.1 85.4 75.8 75.4 91.6 96.8 96.4 98.6
Minneapolis VAMC, MN 87.2 86.8 84.7 93.0 73.0 80.0 96.4 100.0 95.4 97.1
St. Cloud VAMC, MN 86.2 89.4 86.0 87.1 80.5 85.4 92.6 93.8 99.6 98.5
Fargo VAMC, ND 86.5 87.0 77.9 81.5 71.3 72.2 95.7 91.7 94.5 98.7
VA Black Hills Health Care System, Ft Meade, Hot Springs, SD 86.0 86.9 87.5 86.2 73.5 84.1 100 100 98.7 98.3
Sioux Falls VAMC, SD 85.0 87.6 84.5 88.0 74.0 78.4 92.2 89.6 96.8 98.2

Satisfaction by Race
143
Facility
Satis
fact
ion
with
inpa
tient
ca
re -
Whi
te
Satis
fact
ion
with
inpa
tient
ca
re -
Afric
an A
mer
ican
Satis
fact
ion
with
inpa
tient
ca
re -
Oth
er
Satis
fact
ion
with
out
patie
nt
care
- W
hite
Satis
fact
ion
with
out
patie
nt
care
- Af
rican
Am
eric
an
Satis
fact
ion
with
out
patie
nt
care
- O
ther
VA Connecticut Health Care System, West Haven, CT 58.9 54.3 50.8 67.4 55.9 44.2
Edith N Rogers Memorial Veterans Hospital, Bedford, Ma NA NA NA NA NA NA
VA Boston Health Care System, W Roxbury, Brockton, Jamaica Plains, MA 71.6 67.6 NA 62.3 21.0 48.2
Northampton VAMC, MA NA NA NA NA NA NA
Togus VAMC, Augusta, ME NA NA NA NA NA NA
Manchester VAMC, NH NA NA NA NA NA NA
Providence VAMC, RI NA NA NA NA NA NA
White River Junction VAMC, VT NA NA NA NA NA NA
Samuel S. Stratton VAMC, Albany, NY NA NA NA 60.3 95.4 19.7
VA Western New York Health Care System Buffalo, Batavia, NY 61.4 49.4 NA NA NA NA
Bath VAMC, NY NA NA NA NA NA NA
Canandaigua VAMC, NY NA NA NA NA NA NA
Syracuse VAMC, NY NA NA NA NA NA NA
VA New Jersey Health Care System, East Orange, NJ 60.1 62.0 60.9 55.2 49.1 68.3
James J. Peters VAMC, Bronx, NY 63 62 75 86 50 56
VA New York Harbor Health Care System, Manhattan, Brooklyn, NY 61.6 61.3 67.0 59.3 69.9 59.5
VA Hudson Valley Health Care System, Montrose, Castle Point, NY NA NA NA NA NA NA
Northport VAMC, NY NA NA NA NA NA NA
Wilmington VAMC, DE 75.5 52.8 NA 62.3 69.2 30.7
James E. Van Zandt VAMC, Altoona, PA NA NA NA NA NA NA

144
Butler VAMC, PA NA NA NA NA NA NA
Coatesville VAMC, PA NA NA NA NA NA NA
Erie VAMC, PA NA NA NA NA NA NA
Lebanon VAMC, PA NA NA NA NA NA NA
Philadelphia VAMC, PA 56.9 54.1 63.5 62.4 24.6 NA
VA Pittsburgh Health Care System, PA 70.2 66.4 NA 67.5 55.8 83.4
Wilkes-Barre VAMC, PA NA NA NA NA NA NA
Louis A. Johnson VAMC, Clarksburg, WV NA NA NA NA NA NA
Washington DC VAMC, DC 59.9 57.8 NA 36.3 62.0 NA
VA Maryland Health Care System, Perry Pt, Baltimore, MD 54.5 58.6 NA 65.3 69.3 19.0
Martinsburg VAMC, WV NA NA NA 61.7 29.5 NA
Asheville VAMC, NC NA NA NA NA NA NA
Durham VAMC, NC 65.1 62.3 66.0 70.1 52.0 NA
Fayetteville VAMC, NC 48.1 51.5 NA 39.3 39.8 79.4
W.G. (Bill) Hefner VAMC, Salisbury, NC 53.3 49.8 NA 58.6 63.8 NA
Hampton VAMC, VA 72 52 NA 34 62 NA
Hunter Holmes McGuire VAMC, Richmond, VA 61.9 63.6 55.3 51.4 51.1 NA
Salem VAMC, VA 65 61 NA 64 38 NA
Beckley VAMC, WV NA NA NA NA NA NA
Birmingham VAMC, AL 68.1 75.5 63.6 57.4 78.4 40.2
Central Alabama Veterans Health Care System, Tuskegee, Montgomery, AL 49.1 48.8 NA 47.2 48.6 43.1
Tuscaloosa VAMC, AL NA NA NA 47.7 62.6 NA
Atlanta VAMC, GA 60.5 54.1 58.7 60.9 50.2 92.5
Charlie Norwood VAMC, Augusta, GA 62.6 68.0 67.6 67.3 59.5 NA
Carl Vinson VAMC, Dublin, GA 63.7 64.5 NA 51.5 69.9 NA
Ralph H. Johnson VAMC, Charleston, SC 62.3 65.1 66.9 56.1 52.2 NA

145
Wm. Jennings Bryan Dorn VAMC, Columbia, SC 67 68 60 62 46 35
Bay Pines VA Health Care System, FL NA NA NA 60.0 44.3 22.0
N. Florida/S. Georgia Veterans Health Care System Gainesville, Lake City 62.1 60.1 52.1 67.2 54.6 45.0
Miami VA Health Care System, FL 58.8 56.9 61.3 60.5 52.2 73.1
Orlando VAMC, FL NA NA NA 68.8 60.6 65.8
James A. Haley VAMC, Tampa, FL 62.4 68.0 77.2 NA NA NA
West Palm Beach VAMC, FL 68 76 72 NA NA NA
VA Caribbean Health Care System, San Juan, PR NA NA NA NA 66.2 68.1
Lexington VAMC, KY 62.5 55.7 61.2 NA NA NA
Louisville VAMC, KY 64.0 47.1 NA 60.9 35.4 84.0
Memphis VAMC, TN 50.7 59.7 50.0 54.9 36.7 60.6
Mountain Home VAMC, TN NA NA NA NA NA NA
Tennessee Valley Health Care System, Nashville, Murfreesboro, TN 60.5 54.8 58.9 53.8 41.5 19.2
Huntington VAMC, WV NA NA NA NA NA NA
Chillicothe VAMC, OH NA NA NA NA NA NA
Cincinnati VAMC, OH 61.9 66.8 47.7 58.5 55.5 NA
Louis Stokes VAMC, Cleveland, Brecksville, OH 62.3 54.7 48.6 65.5 44.8 70.1
Chalmers P. Wylie Outpt Clinic, Columbus, OH NA NA NA NA NA NA
Dayton VAMC, OH 51.0 41.6 NA 54.9 33.2 NA
VA Illiana Health Care System, Danville, IL NA NA NA 59.2 56.3 NA
VA Northern Indiana Health Care System, Marion, Ft Wayne, IN NA NA NA NA NA NA
Richard L. Roudebush VAMC, Indianapolis, IN 75.2 56.5 63.5 NA NA NA
VA Ann Arbor Health Care System, MI 77.5 87.0 NA 51.5 72.1 NA
Battle Creek VAMC, MI NA NA NA 57.5 68.8 NA
John D. Dingell VAMC, Detroit, MI 52.6 65.0 NA 52.5 52.0 NA

146
Aleda E. Lutz VAMC, Saginaw, MI NA NA NA NA NA NA
Jessie Brown VAMC, Chicago, IL 66.1 64.9 68.1 60.2 56.5 73.3
Edward Hines Jr. VA Hospital, Hines, IL 56.2 57.1 44.3 67.0 69.3 54.3
North Chicago VAMC, IL NA NA NA NA NA NA
Iron Mountain VAMC, MI NA NA NA NA NA NA
William S. Middleton Memorial Veterans Hospital, Madison, WI NA NA NA NA NA NA
Clement J. Zablocki VAMC, Milwaukee, WI 64.2 60.6 61.4 NA NA NA
Tomah VAMC, WI NA NA NA NA NA NA
VA Eastern Kansas Health Care System, Topeka, Leavenworth, KS NA NA NA 57.0 49.5 54.6
Robert J. Dole VAMC, Wichita, KS NA NA NA NA NA NA
Harry S. Truman VAMC, Columbia, MO NA NA NA NA NA NA
Kansas City VAMC, MO 63.7 52.8 NA 59.4 36.3 85.2
Marion VAMC, IL NA NA NA 51.7 72.4 60.2
John J. Pershing VAMC, Poplar Bluff, MO NA NA NA NA NA NA
St Louis VAMC, St Louis, Jefferson Barracks, MO 43.9 52.6 33.7 59.6 66.5 NA
Fayetteville VAMC, AR NA NA NA NA NA NA
Central Arkansas Veterans Health Care System, Little Rock, N Little Rock, AR 60.3 61.6 61.3 52.4 33.9 64.2
Alexandria VAMC, LA 68.3 57.4 NA 67.2 71.0 NA
New Orleans VAMC, LA NA NA NA 68.3 55.0 NA
Overton Brooks VAMC, Shreveport, LA 62.1 59.6 60.9 56.5 60.2 NA
Gulf Coast Veterans Health Care System, Biloxi, MS 74.1 71.9 NA 60.8 39.4 NA
G.V. Montgomery VAMC, Jackson, MS 67.8 68.8 NA 55.2 49.7 NA
Muskogee VAMC, OK NA NA NA NA NA NA
Oklahoma City VAMC, OK 56.7 57.1 55.1 37.5 40.2 57.1
Michael E. DeBakey VAMC, Houston, TX 60.4 62.2 71.3 44.2 19.6 43.8
VA North Texas Health Care System, Dallas, TX 51.5 37.9 51.1 62.6 16.3 59.9
South Texas Veterans Health Care System, San Antonio, Kerrville, TX 58.6 58.4 69.3 60.5 49.5 63.7
Central Texas Veterans Health Care System, Temple, Waco, Marlin, TX 64.1 57.9 70.2 62.2 73.8 32.0
Carl T. Hayden VAMC, Phoenix, AZ NA NA NA NA NA NA
No. Arizona VA Health Care System, Prescott, AZ NA NA NA NA NA NA

147
So. Arizona VA Health Care System, Tucson, AZ NA NA NA 46.1 84.6 67.9
New Mexico Health Care System, Albuquerque, NM NA NA NA NA NA NA
Amarillo VA Health Care System, TX NA NA NA NA NA NA
West Texas VA Health Care System, Big Spring, TX NA NA NA NA NA NA
El Paso VA Health Care System, TX NA NA NA NA NA NA
VA Eastern Colorado Health Care System, Denver, Pueblo, CO 51.9 44.9 57.2 43.7 50.4 50.4
Grand Junction VAMC, CO NA NA NA NA NA NA
VA Montana Health Care System, Fort Harrison, MT NA NA NA NA NA NA
VA Salt Lake City Health Care System, UT NA NA NA NA NA NA
Cheyenne VAMC, WY NA NA NA NA NA NA
Sheridan VAMC, WY NA NA NA NA NA NA
Alaska VA Health Care System and Regional Office, Anchorage, AK NA NA NA NA NA NA
Boise VAMC, ID NA NA NA NA NA NA
Portland VAMC, OR NA NA NA NA NA NA
VA Roseburg Health Care System, OR NA NA NA NA NA NA
Southern Oregon Rehab Center & Clinics, White City, OR NA NA NA NA NA NA
VA Puget Sound Health Care System, Seattle, American Lake, WA 52.5 64.1 54.5 54.7 70.9 34.3
Spokane VAMC, WA NA NA NA NA NA NA
Jonathan M. Wainwright Memorial VA Medical Center, Walla Walla, WA NA NA NA NA NA NA
VA Central California Health Care System, Fresno, CA NA NA NA NA NA NA
VA Northern California Health Care System, Martinez, Sacramento, CA 72.0 70.8 62.9 60.8 41.0 49.7
VA Palo Alto Health Care System, Palo Alto, Menlo Pk, Livermore, CA 69.4 71.6 66.7 69.2 66.1 66.0
San Francisco VAMC, CA 64.6 65.7 67.5 67.9 83.6 67.5
VA Pacific Islands Health Care System, Honolulu, HI NA NA NA NA NA NA
VA Sierra Nevada Health Care System, Reno, NV NA NA NA NA NA NA
VA Loma Linda Health Care System, CA 64.3 71.8 73.1 61.7 49.5 40.3
VA Long Beach Health Care System, CA 57.9 63.8 63.6 68.8 85.5 21.9
VA Greater Los Angeles Health Care System, CA 62.0 56.6 65.8 52.3 52.6 38.7

148
VA San Diego Health Care System, CA 61.6 59.7 67.3 69.6 56.7 55.2
VA Southern Nevada Health Care System, Las Vegas, NV 58.8 59.3 66.2 67.4 40.5 37.3
VA Nebraska Western Iowa Health Care System, Omaha, Grand Is, Lincoln, NE 62.0 59.3 NA NA NA NA
VA Central Iowa Health Care System, Des Moines, Knoxville, IA NA NA NA NA NA NA
Iowa City VAMC, IA NA NA NA NA NA NA
Minneapolis VAMC, MN NA NA NA NA NA NA
St. Cloud VAMC, MN NA NA NA NA NA NA
Fargo VAMC, ND NA NA NA NA NA NA
VA Black Hills Health Care System, Ft Meade, Hot Springs, SD NA NA NA NA NA NA
Sioux Falls VAMC, SD NA NA NA NA NA NA
Section 4: Safe Care
Health Care-Associated Infections
Facility
Vent
ilato
r Ass
ocia
ted
Pneu
mon
ia
Cen
tral L
ine
Asso
c.
Bact
erem
ia
ICU
MR
SA
Acut
e C
are
MR
SA
ICU
MR
SA S
cree
ning
Rat
e
Acut
e C
are
MR
SA
Scre
enin
g R
ate
VA Connecticut Health Care System, West Haven, CT 2.25 1.51 1.49 0.47 92.0% 94.0%
Edith N Rogers Memorial Veterans Hospital, Bedford, Ma NA NA NA NA NA NA
VA Boston Health Care System, W Roxbury, Brockton, Jamaica Plains, MA 4.24 2.70 0.91 0.49 93.0% 94.0%
Northampton VAMC, MA NA NA NA NA NA NA
Togus VAMC, Augusta, ME 2.44 0.00 0.00 0.11 91.0% 92.0%
Manchester VAMC, NH NA NA NA NA NA NA
Providence VAMC, RI 1.73 4.46 1.05 0.67 76.0% 78.0%

149
White River Junction VAMC, VT 1.78 1.72 1.59 0.39 93.0% 95.0%
Samuel S. Stratton VAMC, Albany, NY 6.91 1.38 0.00 0.27 99.0% 97.0%
VA Western New York Health Care System Buffalo, Batavia, NY 6.34 3.70 1.25 0.77 96.0% 91.0%
Bath VAMC, NY 0.00 NA 0.00 0.00 88.0% 93.0%
Canandaigua VAMC, NY NA NA NA NA NA NA
Syracuse VAMC, NY 6.90 2.97 0.75 0.46 88.0% 94.0%
VA New Jersey Health Care System, East Orange, NJ 4.85 0.99 0.67 0.37 99.0% 99.0%
James J. Peters VAMC, Bronx, NY 1.83 1.59 0.61 0.33 95.0% 94.0%
VA New York Harbor Health Care System, Manhattan, Brooklyn, NY 0.91 0.42 0.30 0.00 96.0% 91.0%
VA Hudson Valley Health Care System, Montrose, Castle Point, NY NA NA NA 0.00 NA 95.0%
Northport VAMC, NY 0.83 1.79 1.39 0.36 96.0% 91.0%
Wilmington VAMC, DE 1.28 1.44 0.61 0.53 93.0% 94.0%
James E. Van Zandt VAMC, Altoona, PA 0.00 0.00 0.00 0.00 99.0% 97.0%
Butler VAMC, PA NA NA NA NA NA NA
Coatesville VAMC, PA NA NA NA NA NA NA
Erie VAMC, PA 0.00 0.00 2.20 0.00 97.0% 99.0%
Lebanon VAMC, PA 14.29 0.00 0.00 0.00 98.0% 99.0%
Philadelphia VAMC, PA 1.15 6.57 0.55 0.13 95.0% 96.0%
VA Pittsburgh Health Care System, PA 4.75 2.53 0.27 0.16 93.0% 90.0%
Wilkes-Barre VAMC, PA 0.00 0.00 0.26 0.14 98.0% 98.0%
Louis A. Johnson VAMC, Clarksburg, WV 0.00 0.00 0.00 0.00 96.0% 98.0%
Washington DC VAMC, DC 2.43 1.04 1.07 0.28 98.0% 98.0%
VA Maryland Health Care System, Perry Pt, Baltimore, MD 6.78 3.11 1.25 0.65 96.0% 90.0%
Martinsburg VAMC, WV 2.99 0.00 1.09 0.46 94.0% 90.0%
Asheville VAMC, NC 2.44 2.39 0.56 0.20 91.0% 89.0%
Durham VAMC, NC 9.55 2.47 0.71 0.28 95.0% 94.0%

150
Fayetteville VAMC, NC 12.05 0.00 0.00 0.00 97.0% 94.0%
W.G. (Bill) Hefner VAMC, Salisbury, NC 0.00 0.00 0.00 0.53 99.0% 96.0%
Hampton VAMC, VA 3.01 2.94 0.00 0.00 96.0% 96.0%
Hunter Holmes McGuire VAMC, Richmond, VA 4.07 3.19 0.00 0.02 98.0% 96.0%
Salem VAMC, VA 11.24 4.66 1.80 0.73 98.0% 98.0%
Beckley VAMC, WV 0.00 0.00 0.00 0.10 92.0% 91.0%
Birmingham VAMC, AL 3.62 1.04 0.83 0.54 94.0% 95.0%
Central Alabama Veterans Health Care System, Tuskegee, Montgomery, AL 0.00 0.00 0.00 0.00 97.0% 95.0%
Tuscaloosa VAMC, AL NA NA NA NA NA NA
Atlanta VAMC, GA 1.49 2.23 0.58 0.49 97.0% 96.0%
Charlie Norwood VAMC, Augusta, GA 4.62 2.37 1.48 0.89 93.0% 90.0%
Carl Vinson VAMC, Dublin, GA 0.00 11.90 0.00 0.00 98.0% 97.0%
Ralph H. Johnson VAMC, Charleston, SC 1.39 1.02 1.54 0.32 94.0% 94.0%
Wm. Jennings Bryan Dorn VAMC, Columbia, SC 3.54 0.56 0.48 0.18 91.0% 95.0%
Bay Pines VA Health Care System, FL 3.02 1.08 0.64 0.05 97.0% 96.0%
N. Florida/S. Georgia Veterans Health Care System Gainesville, Lake City 0.82 2.27 0.59 0.21 97.0% 95.0%
Miami VA Health Care System, FL 3.36 4.49 1.04 0.42 97.0% 97.0%
Orlando VAMC, FL NA NA NA NA NA NA
James A. Haley VAMC, Tampa, FL 3.75 0.63 2.19 1.38 88.0% 85.0%
West Palm Beach VAMC, FL 0.90 1.16 0.29 0.04 92.0% 92.0%
VA Caribbean Health Care System, San Juan, PR 1.16 0.27 0.26 0.03 96.0% 91.0%
Lexington VAMC, KY 4.38 1.04 0.62 0.29 89.0% 94.0%
Louisville VAMC, KY 0.83 0.49 0.45 0.72 83.0% 88.0%
Memphis VAMC, TN 6.70 0.81 1.95 0.57 84.0% 72.0%
Mountain Home VAMC, TN 1.20 1.59 0.21 0.27 96.0% 94.0%
Tennessee Valley Health Care System, Nashville, Murfreesboro, TN 1.54 1.43 0.42 0.25 86.0% 86.0%

151
Huntington VAMC, WV 0.00 0.65 0.00 0.00 95.0% 95.0%
Chillicothe VAMC, OH 0.00 0.00 0.00 0.00 89.0% 89.0%
Cincinnati VAMC, OH 6.13 2.13 1.01 0.52 93.0% 93.0%
Louis Stokes VAMC, Cleveland, Brecksville, OH 1.19 0.81 0.29 0.22 94.0% 90.0%
Chalmers P. Wylie Outpt Clinic, Columbus, OH NA NA NA NA NA NA
Dayton VAMC, OH 2.59 2.71 0.37 0.06 86.0% 92.0%
VA Illiana Health Care System, Danville, IL 0.00 0.00 0.00 1.50 99.0% 97.0%
VA Northern Indiana Health Care System, Marion, Ft Wayne, IN 0.00 NA 1.49 0.39 91.0% 96.0%
Richard L. Roudebush VAMC, Indianapolis, IN 3.29 1.71 0.51 0.29 94.0% 94.0%
VA Ann Arbor Health Care System, MI 3.95 1.44 1.44 0.05 92.0% 94.0%
Battle Creek VAMC, MI NA NA NA 0.15 NA 89.0%
John D. Dingell VAMC, Detroit, MI 0.87 2.46 1.22 0.07 93.0% 92.0%
Aleda E. Lutz VAMC, Saginaw, MI 0.00 0.00 1.19 0.00 97.0% 96.0%
Jessie Brown VAMC, Chicago, IL 3.20 2.94 0.24 0.09 89.0% 85.0%
Edward Hines Jr. VA Hospital, Hines, IL 0.47 0.81 0.23 0.38 98.0% 97.0%
North Chicago VAMC, IL 3.42 0.00 0.00 0.14 99.0% 98.0%
Iron Mountain VAMC, MI 0.00 0.00 0.00 0.00 98.0% 99.0%
William S. Middleton Memorial Veterans Hospital, Madison, WI 4.19 0.42 0.59 0.23 97.0% 96.0%
Clement J. Zablocki VAMC, Milwaukee, WI 2.18 0.37 0.00 0.31 94.0% 95.0%
Tomah VAMC, WI NA NA NA 0.00 NA 92.0%
VA Eastern Kansas Health Care System, Topeka, Leavenworth, KS 4.59 0.00 0.00 0.18 99.0% 96.0%
Robert J. Dole VAMC, Wichita, KS 0.00 0.00 0.70 0.78 97.0% 95.0%
Harry S. Truman VAMC, Columbia, MO 1.75 0.59 0.00 0.00 97.0% 95.0%
Kansas City VAMC, MO 1.38 3.50 0.47 0.05 93.0% 95.0%
Marion VAMC, IL 5.03 0.00 0.00 0.00 95.0% 93.0%
John J. Pershing VAMC, Poplar Bluff, MO NA NA NA 0.39 NA 93.0%
St Louis VAMC, St Louis, Jefferson Barracks, MO 3.82 11.90 0.48 0.19 92.0% 83.0%

152
Fayetteville VAMC, AR 0.00 0.00 0.00 0.00 96.0% 96.0%
Central Arkansas Veterans Health Care System, Little Rock, N Little Rock, AR 0.73 1.35 0.61 0.33 95.0% 93.0%
Alexandria VAMC, LA 0.00 0.00 0.00 0.32 92.0% 95.0%
New Orleans VAMC, LA NA NA NA NA NA NA
Overton Brooks VAMC, Shreveport, LA 1.10 3.54 0.89 0.24 94.0% 96.0%
Gulf Coast Veterans Health Care System, Biloxi, MS 0.00 0.00 0.00 0.11 95.0% 91.0%
G.V. Montgomery VAMC, Jackson, MS 0.69 3.18 0.80 0.35 97.0% 97.0%
Muskogee VAMC, OK 3.52 3.83 0.74 0.05 96.0% 96.0%
Oklahoma City VAMC, OK 5.02 2.77 0.45 0.20 91.0% 91.0%
Michael E. DeBakey VAMC, Houston, TX 3.55 0.99 2.24 0.59 94.0% 91.0%
VA North Texas Health Care System, Dallas, TX 0.60 0.87 0.68 0.13 91.0% 92.0%
South Texas Veterans Health Care System, San Antonio, Kerrville, TX 3.54 1.62 0.98 0.16 96.0% 92.0%
Central Texas Veterans Health Care System, Temple, Waco, Marlin, TX 0.83 1.10 0.74 0.09 91.0% 94.0%
Carl T. Hayden VAMC, Phoenix, AZ 2.23 1.28 0.29 0.36 100.0% 99.0%
No. Arizona VA Health Care System, Prescott, AZ 0.00 0.00 0.74 0.44 96.0% 96.0%
So. Arizona VA Health Care System, Tucson, AZ 2.63 1.97 0.23 0.19 90.0% 96.0%
New Mexico Health Care System, Albuquerque, NM 1.91 0.90 0.00 0.12 92.0% 89.0%
Amarillo VA Health Care System, TX 1.62 2.13 0.35 0.25 97.0% 97.0%
West Texas VA Health Care System, Big Spring, TX NA NA NA 0.57 NA 95.0%
El Paso VA Health Care System, TX NA NA NA NA NA NA
VA Eastern Colorado Health Care System, Denver, Pueblo, CO 0.97 1.06 0.17 0.10 98.0% 96.0%
Grand Junction VAMC, CO 0.00 0.00 0.00 0.48 96.0% 96.0%
VA Montana Health Care System, Fort Harrison, MT 0.00 0.00 1.37 0.34 93.0% 87.0%
VA Salt Lake City Health Care System, UT 2.22 1.93 0.00 0.19 99.0% 95.0%
Cheyenne VAMC, WY 0.00 2.53 1.05 0.00 89.0% 93.0%
Sheridan VAMC, WY NA NA NA 0.00 NA 98.0%
Alaska VA Health Care System and Regional Office, Anchorage, AK NA NA NA NA NA NA
Boise VAMC, ID 0.00 0.00 0.69 1.03 97.0% 98.0%
Portland VAMC, OR 1.65 1.26 0.27 0.12 95.0% 96.0%
VA Roseburg Health Care System, OR 6.80 0.00 0.00 0.00 91.0% 85.0%
Southern Oregon Rehab Center & Clinics, White City, OR NA NA NA NA NA NA

153
VA Puget Sound Health Care System, Seattle, American Lake, WA 2.30 0.22 1.07 0.75 68.0% 60.0%
Spokane VAMC, WA 0.00 3.15 0.00 0.00 92.0% 95.0%
Jonathan M. Wainwright Memorial VA Medical Center, Walla Walla, WA NA NA NA NA NA NA
VA Central California Health Care System, Fresno, CA 0.00 0.00 0.55 0.97 95.0% 97.0%
VA Northern California Health Care System, Martinez, Sacramento, CA 0.00 4.41 0.81 0.19 97.0% 98.0%
VA Palo Alto Health Care System, Palo Alto, Menlo Pk, Livermore, CA 2.63 2.82 0.44 0.53 95.0% 95.0%
San Francisco VAMC, CA 0.77 1.59 0.90 0.99 93.0% 87.0%
VA Pacific Islands Health Care System, Honolulu, HI NA NA NA NA NA NA
VA Sierra Nevada Health Care System, Reno, NV 2.10 1.08 0.00 0.00 95.0% 94.0%
VA Loma Linda Health Care System, CA 5.12 2.13 0.66 0.54 99.0% 97.0%
VA Long Beach Health Care System, CA 1.07 2.52 1.12 0.92 92.0% 93.0%
VA Greater Los Angeles Health Care System, CA 0.68 1.10 0.22 0.00 91.0% 89.0%
VA San Diego Health Care System, CA 1.73 1.68 0.83 0.44 99.0% 98.0%
VA Southern Nevada Health Care System, Las Vegas, NV NA NA 0.00 0.00 94.0% 88.0%
VA Nebraska Western Iowa Health Care System, Omaha, Grand Is, Lincoln, NE 0.79 2.01 1.12 0.48 88.0% 88.0%
VA Central Iowa Health Care System, Des Moines, Knoxville, IA 0.00 0.00 0.00 0.00 94.0% 91.0%
Iowa City VAMC, IA 5.46 0.91 0.00 0.00 64.0% 69.0%
Minneapolis VAMC, MN 7.46 1.16 0.47 0.65 95.0% 95.0%
St. Cloud VAMC, MN NA NA NA NA NA NA
Fargo VAMC, ND 0.00 0.00 0.00 0.30 93.0% 96.0%
VA Black Hills Health Care System, Ft Meade, Hot Springs, SD 0.00 0.00 0.00 0.00 96.0% 93.0%
Sioux Falls VAMC, SD 0.00 4.93 1.68 0.00 96.0% 95.0%

Other
154
Facility
ICU
risk
adj
uste
d Le
ngth
of
Stay
% IC
U p
atie
nt d
ays
with
blo
od
suga
r <45
mg/
dl
% IC
U p
atie
nt d
ays
with
blo
od
suga
r <60
mg/
dl
Hos
pita
l Acq
uire
d Pr
essu
re
Ulc
ers
VA Connecticut Health Care System, West Haven, CT 0.44 2.60 6.60 4.4
Edith N Rogers Memorial Veterans Hospital, Bedford, Ma NA NA NA NA
VA Boston Health Care System, W Roxbury, Brockton, Jamaica Plains, MA 0.18 1.50 3.30 3.2
Northampton VAMC, MA NA NA NA NA
Togus VAMC, Augusta, ME 0.63 1.40 3.40 2.3
Manchester VAMC, NH NA NA NA NA
Providence VAMC, RI 0.31 2.40 5.40 1.6
White River Junction VAMC, VT -0.14 0.30 2.50 3.3
Samuel S. Stratton VAMC, Albany, NY -0.61 1.10 3.30 3.8
VA Western New York Health Care System Buffalo, Batavia, NY -0.24 1.40 3.80 4.4
Bath VAMC, NY -0.85 0.00 1.40 1.6
Canandaigua VAMC, NY NA NA NA NA
Syracuse VAMC, NY 0.96 0.90 3.20 4.8
VA New Jersey Health Care System, East Orange, NJ -0.04 1.90 4.40 3.9
James J. Peters VAMC, Bronx, NY 0.42 1.50 2.80 3.1
VA New York Harbor Health Care System, Manhattan, Brooklyn, NY 0.22 1.30 3.70 2.9
VA Hudson Valley Health Care System, Montrose, Castle Point, NY NA NA NA 2.0
Northport VAMC, NY 0.33 1.20 3.00 1.8
Wilmington VAMC, DE -0.06 1.50 3.30 2.7
James E. Van Zandt VAMC, Altoona, PA -1.52 0.00 0.00 1.7

155
Butler VAMC, PA NA NA NA NA
Coatesville VAMC, PA NA NA NA 4.4
Erie VAMC, PA -0.98 1.70 3.20 4.4
Lebanon VAMC, PA 0.41 0.60 2.20 3.5
Philadelphia VAMC, PA 1.3 1.60 4.10 3.8
VA Pittsburgh Health Care System, PA 0.92 0.60 2.50 5.2
Wilkes-Barre VAMC, PA -0.2 1.40 4.00 3.7
Louis A. Johnson VAMC, Clarksburg, WV 0.61 1.00 1.80 4.4
Washington DC VAMC, DC -0.34 2.00 3.60 0.5
VA Maryland Health Care System, Perry Pt, Baltimore, MD 0.65 1.40 3.80 5.7
Martinsburg VAMC, WV 0.36 1.10 2.20 0.8
Asheville VAMC, NC -0.17 1.10 3.00 2.5
Durham VAMC, NC -0.02 1.20 3.70 4.7
Fayetteville VAMC, NC 0.6 1.40 2.60 1.8
W.G. (Bill) Hefner VAMC, Salisbury, NC 0.37 1.70 3.60 4.2
Hampton VAMC, VA 0.44 1.90 3.70 1.9
Hunter Holmes McGuire VAMC, Richmond, VA 0.25 1.00 3.10 2.2
Salem VAMC, VA -0.11 0.90 2.60 3.4
Beckley VAMC, WV 0.02 0.80 1.80 2.0
Birmingham VAMC, AL 0.06 2.10 4.40 5.3
Central Alabama Veterans Health Care System, Tuskegee, Montgomery, AL 1.55 1.30 2.60 1.8
Tuscaloosa VAMC, AL NA NA NA NA
Atlanta VAMC, GA 0.41 2.10 4.90 1.8
Charlie Norwood VAMC, Augusta, GA 0.56 1.20 2.70 3.1
Carl Vinson VAMC, Dublin, GA -0.65 1.40 10.10 2.8
Ralph H. Johnson VAMC, Charleston, SC -0.07 0.70 2.60 1.7

156
Wm. Jennings Bryan Dorn VAMC, Columbia, SC 0.3 1.30 4.00 2.7
Bay Pines VA Health Care System, FL -1.01 1.40 3.60 2.7
N. Florida/S. Georgia Veterans Health Care System Gainesville, Lake City 0.25 1.10 3.90 3.7
Miami VA Health Care System, FL 0.35 1.20 3.60 4.4
Orlando VAMC, FL NA NA NA NA
James A. Haley VAMC, Tampa, FL 0.71 0.80 3.40 3.7
West Palm Beach VAMC, FL -0.61 0.60 2.00 4.2
VA Caribbean Health Care System, San Juan, PR -0.49 1.50 3.80 4.5
Lexington VAMC, KY 0.34 0.70 2.50 7.6
Louisville VAMC, KY 0.07 1.50 5.00 4.8
Memphis VAMC, TN 0.03 3.10 6.50 3.5
Mountain Home VAMC, TN -0.91 1.30 2.90 5.1
Tennessee Valley Health Care System, Nashville, Murfreesboro, TN -0.02 1.60 3.90 2.9
Huntington VAMC, WV -0.95 1.50 4.90 1.8
Chillicothe VAMC, OH NA 0.60 2.60 1.4
Cincinnati VAMC, OH -0.05 1.10 3.70 7.0
Louis Stokes VAMC, Cleveland, Brecksville, OH -0.76 1.10 3.50 3.5
Chalmers P. Wylie Outpt Clinic, Columbus, OH NA NA NA NA
Dayton VAMC, OH -0.58 0.60 1.60 4.8
VA Illiana Health Care System, Danville, IL -1.19 1.60 3.70 3.0
VA Northern Indiana Health Care System, Marion, Ft Wayne, IN -0.12 0.00 0.70 1.2
Richard L. Roudebush VAMC, Indianapolis, IN -0.61 3.00 7.10 4.3
VA Ann Arbor Health Care System, MI 1.01 0.50 2.00 5.9
Battle Creek VAMC, MI NA NA NA 3.8
John D. Dingell VAMC, Detroit, MI 0.77 0.30 2.40 5.8

157
Aleda E. Lutz VAMC, Saginaw, MI -1.77 0.00 0.00 2.9
Jessie Brown VAMC, Chicago, IL -0.14 0.40 1.40 3.7
Edward Hines Jr. VA Hospital, Hines, IL 0.2 1.20 3.90 6.8
North Chicago VAMC, IL -0.08 0.90 4.10 1.4
Iron Mountain VAMC, MI -0.48 0.00 0.00 0.7
William S. Middleton Memorial Veterans Hospital, Madison, WI -0.24 1.00 3.70 4.7
Clement J. Zablocki VAMC, Milwaukee, WI -0.77 0.40 1.10 3.1
Tomah VAMC, WI NA NA NA 1.1
VA Eastern Kansas Health Care System, Topeka, Leavenworth, KS -0.04 1.30 3.00 2.9
Robert J. Dole VAMC, Wichita, KS -0.22 1.00 3.20 3.2
Harry S. Truman VAMC, Columbia, MO -0.44 0.70 1.90 5.9
Kansas City VAMC, MO 0.06 2.00 5.80 3.8
Marion VAMC, IL 0.24 1.20 2.70 1.4
John J. Pershing VAMC, Poplar Bluff, MO NA NA NA 1.1
St Louis VAMC, St Louis, Jefferson Barracks, MO 0.84 1.70 4.80 3.8
Fayetteville VAMC, AR -0.63 1.10 3.60 2.4
Central Arkansas Veterans Health Care System, Little Rock, N Little Rock, AR -0.14 1.20 2.80 2.8
Alexandria VAMC, LA -0.4 1.90 6.10 2.4
New Orleans VAMC, LA NA NA NA NA
Overton Brooks VAMC, Shreveport, LA 0.3 0.30 2.70 2.5
Gulf Coast Veterans Health Care System, Biloxi, MS -0.49 1.50 2.60 5.1
G.V. Montgomery VAMC, Jackson, MS -0.33 0.60 2.10 4.1
Muskogee VAMC, OK -0.28 1.10 2.60 4.0
Oklahoma City VAMC, OK 0.22 1.80 5.50 3.6
Michael E. DeBakey VAMC, Houston, TX -0.39 0.40 1.20 4.5
VA North Texas Health Care System, Dallas, TX 0.54 1.20 3.20 2.6
South Texas Veterans Health Care System, San Antonio, Kerrville, TX 0.09 1.80 4.30 3.1
Central Texas Veterans Health Care System, Temple, Waco, Marlin, TX -0.67 0.40 1.00 3.2
Carl T. Hayden VAMC, Phoenix, AZ -0.14 1.70 4.40 3.9
No. Arizona VA Health Care System, Prescott, AZ 0.56 0.00 2.80 4.4

158
So. Arizona VA Health Care System, Tucson, AZ -0.21 2.10 4.90 5.2
New Mexico Health Care System, Albuquerque, NM 0.41 1.00 3.00 3.2
Amarillo VA Health Care System, TX -0.34 1.10 2.40 1.9
West Texas VA Health Care System, Big Spring, TX NA NA NA 1.8
El Paso VA Health Care System, TX NA NA NA NA
VA Eastern Colorado Health Care System, Denver, Pueblo, CO 0.18 0.70 2.50 2.8
Grand Junction VAMC, CO -0.45 0.00 0.80 4.7
VA Montana Health Care System, Fort Harrison, MT -0.87 0.30 1.50 1.3
VA Salt Lake City Health Care System, UT -0.52 1.60 4.00 1.8
Cheyenne VAMC, WY 0.44 1.40 2.70 0.3
Sheridan VAMC, WY NA NA NA 0.6
Alaska VA Health Care System and Regional Office, Anchorage, AK NA NA NA NA
Boise VAMC, ID -0.91 0.90 2.20 4.9
Portland VAMC, OR -0.55 0.80 3.30 4.5
VA Roseburg Health Care System, OR -0.35 0.00 0.70 1.6
Southern Oregon Rehab Center & Clinics, White City, OR NA NA NA NA
VA Puget Sound Health Care System, Seattle, American Lake, WA -0.11 1.20 3.60 4.0
Spokane VAMC, WA -1.36 1.20 2.80 2.3
Jonathan M. Wainwright Memorial VA Medical Center, Walla Walla, WA NA NA NA NA
VA Central California Health Care System, Fresno, CA 0.02 1.20 5.50 5.6
VA Northern California Health Care System, Martinez, Sacramento, CA 0.28 0.70 2.90 4.3
VA Palo Alto Health Care System, Palo Alto, Menlo Pk, Livermore, CA -0.86 0.50 2.40 3.4
San Francisco VAMC, CA -0.96 1.10 1.90 4.0
VA Pacific Islands Health Care System, Honolulu, HI NA NA NA 0.0
VA Sierra Nevada Health Care System, Reno, NV -0.66 1.50 3.00 4.0
VA Loma Linda Health Care System, CA -0.45 2.20 6.20 6.1
VA Long Beach Health Care System, CA -0.51 1.10 3.10 4.3
VA Greater Los Angeles Health Care System, CA -0.45 2.10 4.50 4.7

159
VA San Diego Health Care System, CA -0.51 0.90 4.50 0.5
VA Southern Nevada Health Care System, Las Vegas, NV NA NA NA 2.7
VA Nebraska Western Iowa Health Care System, Omaha, Grand Is, Lincoln, NE 0.42 0.60 3.60 3.1
VA Central Iowa Health Care System, Des Moines, Knoxville, IA -0.15 1.20 3.70 1.5
Iowa City VAMC, IA -0.32 0.70 1.70 4.5
Minneapolis VAMC, MN -1.21 0.60 1.90 2.3
St. Cloud VAMC, MN NA NA NA NA
Fargo VAMC, ND -0.40 0.30 0.60 2.0
VA Black Hills Health Care System, Ft Meade, Hot Springs, SD -0.33 0.00 1.70 4.1
Sioux Falls VAMC, SD -1.05 0.90 2.10 3.8
Root Cause Analyses (RCAs)
Facility
RC
As c
ompl
ete
in ≤
45 d
RC
A O
utco
me
Mea
sure
s R
epor
ted
VA Connecticut Health Care System, West Haven, CT 100 4
Edith N Rogers Memorial Veterans Hospital, Bedford, Ma 100 41
VA Boston Health Care System, W Roxbury, Brockton, Jamaica Plains, MA 100 100
Northampton VAMC, MA 100 100
Togus VAMC, Augusta, ME 100 8
Manchester VAMC, NH 92 81
Providence VAMC, RI 100 89
White River Junction VAMC, VT 100 34
Samuel S. Stratton VAMC, Albany, NY 100 100

160
VA Western New York Health Care System Buffalo, Batavia, NY 93 64
Bath VAMC, NY 100 95
Canandaigua VAMC, NY 100 100
Syracuse VAMC, NY 100 100
VA New Jersey Health Care System, East Orange, NJ 100 84
James J. Peters VAMC, Bronx, NY 100 56
VA New York Harbor Health Care System, Manhattan, Brooklyn, NY 100 52
VA Hudson Valley Health Care System, Montrose, Castle Point, NY 86 100
Northport VAMC, NY 92 87
Wilmington VAMC, DE 100 100
James E. Van Zandt VAMC, Altoona, PA 100 94
Butler VAMC, PA 100 100
Coatesville VAMC, PA 100 98
Erie VAMC, PA 100 100
Lebanon VAMC, PA 100 100
Philadelphia VAMC, PA 80 100
VA Pittsburgh Health Care System, PA 100 99
Wilkes-Barre VAMC, PA 100 100
Louis A. Johnson VAMC, Clarksburg, WV 100 98
Washington DC VAMC, DC 100 100
VA Maryland Health Care System, Perry Pt, Baltimore, MD 100 100
Martinsburg VAMC, WV 100 100
Asheville VAMC, NC 100 0
Durham VAMC, NC 100 88
Fayetteville VAMC, NC 100 35
W.G. (Bill) Hefner VAMC, Salisbury, NC 93 97

161
Hampton VAMC, VA 100 67
Hunter Holmes McGuire VAMC, Richmond, VA 100 77
Salem VAMC, VA 100 100
Beckley VAMC, WV 91 100
Birmingham VAMC, AL 45 86
Central Alabama Veterans Health Care System, Tuskegee, Montgomery, AL 90 48
Tuscaloosa VAMC, AL 77 100
Atlanta VAMC, GA 100 100
Charlie Norwood VAMC, Augusta, GA 100 100
Carl Vinson VAMC, Dublin, GA 62 80
Ralph H. Johnson VAMC, Charleston, SC 82 100
Wm. Jennings Bryan Dorn VAMC, Columbia, SC 42 93
Bay Pines VA Health Care System, FL 100 100
N. Florida/S. Georgia Veterans Health Care System Gainesville, Lake City 100 83
Miami VA Health Care System, FL 100 100
Orlando VAMC, FL 83 100
James A. Haley VAMC, Tampa, FL 89 100
West Palm Beach VAMC, FL 100 100
VA Caribbean Health Care System, San Juan, PR 100 69
Lexington VAMC, KY 100 100
Louisville VAMC, KY 100 100
Memphis VAMC, TN 100 100
Mountain Home VAMC, TN 100 100
Tennessee Valley Health Care System, Nashville, Murfreesboro, TN 100 100
Huntington VAMC, WV 100 100
Chillicothe VAMC, OH 100 100

162
Cincinnati VAMC, OH 100 100
Louis Stokes VAMC, Cleveland, Brecksville, OH 100 97
Chalmers P. Wylie Outpt Clinic, Columbus, OH 100 100
Dayton VAMC, OH 100 75
VA Illiana Health Care System, Danville, IL 100 100
VA Northern Indiana Health Care System, Marion, Ft Wayne, IN 100 100
Richard L. Roudebush VAMC, Indianapolis, IN 82 100
VA Ann Arbor Health Care System, MI 100 100
Battle Creek VAMC, MI 100 100
John D. Dingell VAMC, Detroit, MI 100 100
Aleda E. Lutz VAMC, Saginaw, MI 100 100
Jessie Brown VAMC, Chicago, IL 100 100
Edward Hines Jr. VA Hospital, Hines, IL 100 100
North Chicago VAMC, IL 100 45
Iron Mountain VAMC, MI 100 100
William S. Middleton Memorial Veterans Hospital, Madison, WI 100 97
Clement J. Zablocki VAMC, Milwaukee, WI 100 97
Tomah VAMC, WI 100 94
VA Eastern Kansas Health Care System, Topeka, Leavenworth, KS 100 97
Robert J. Dole VAMC, Wichita, KS 100 83
Harry S. Truman VAMC, Columbia, MO 100 100
Kansas City VAMC, MO 100 100
Marion VAMC, IL 100 98
John J. Pershing VAMC, Poplar Bluff, MO 100 72
St Louis VAMC, St Louis, Jefferson Barracks, MO 60 56
Fayetteville VAMC, AR 100 100
Central Arkansas Veterans Health Care System, Little Rock, N Little Rock, AR 90 100
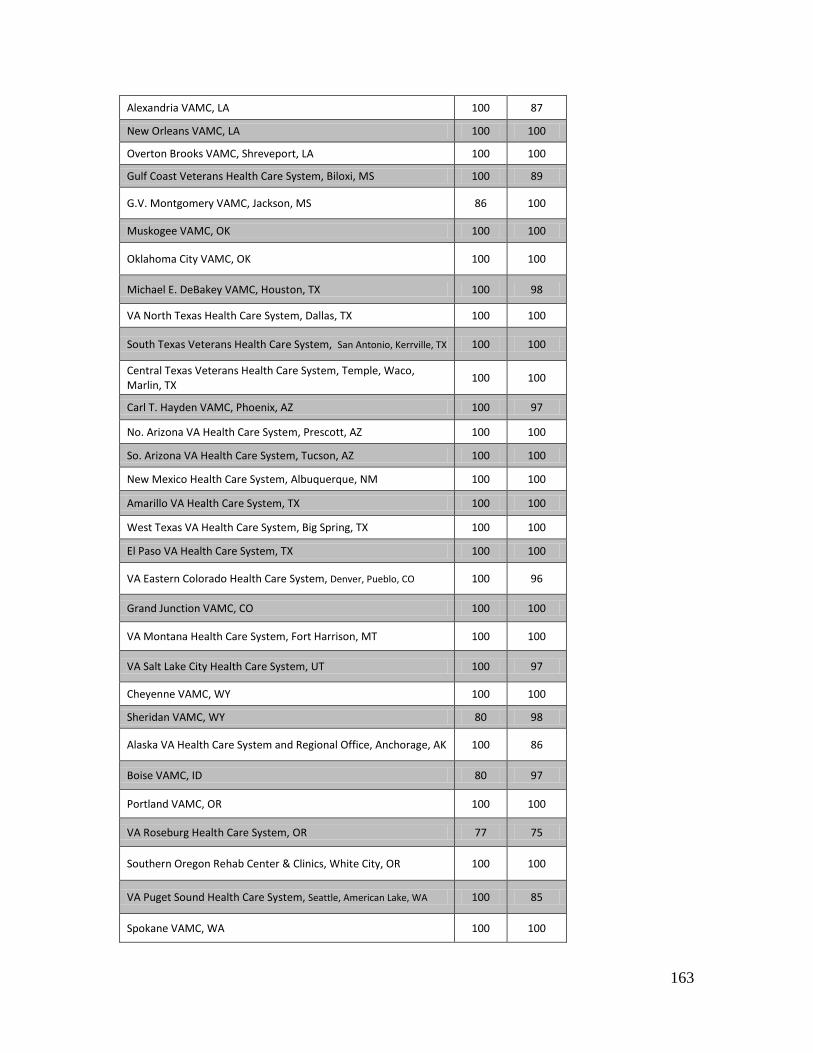
163
Alexandria VAMC, LA 100 87
New Orleans VAMC, LA 100 100
Overton Brooks VAMC, Shreveport, LA 100 100
Gulf Coast Veterans Health Care System, Biloxi, MS 100 89
G.V. Montgomery VAMC, Jackson, MS 86 100
Muskogee VAMC, OK 100 100
Oklahoma City VAMC, OK 100 100
Michael E. DeBakey VAMC, Houston, TX 100 98
VA North Texas Health Care System, Dallas, TX 100 100
South Texas Veterans Health Care System, San Antonio, Kerrville, TX 100 100
Central Texas Veterans Health Care System, Temple, Waco, Marlin, TX 100 100
Carl T. Hayden VAMC, Phoenix, AZ 100 97
No. Arizona VA Health Care System, Prescott, AZ 100 100
So. Arizona VA Health Care System, Tucson, AZ 100 100
New Mexico Health Care System, Albuquerque, NM 100 100
Amarillo VA Health Care System, TX 100 100
West Texas VA Health Care System, Big Spring, TX 100 100
El Paso VA Health Care System, TX 100 100
VA Eastern Colorado Health Care System, Denver, Pueblo, CO 100 96
Grand Junction VAMC, CO 100 100
VA Montana Health Care System, Fort Harrison, MT 100 100
VA Salt Lake City Health Care System, UT 100 97
Cheyenne VAMC, WY 100 100
Sheridan VAMC, WY 80 98
Alaska VA Health Care System and Regional Office, Anchorage, AK 100 86
Boise VAMC, ID 80 97
Portland VAMC, OR 100 100
VA Roseburg Health Care System, OR 77 75
Southern Oregon Rehab Center & Clinics, White City, OR 100 100
VA Puget Sound Health Care System, Seattle, American Lake, WA 100 85
Spokane VAMC, WA 100 100

164
Jonathan M. Wainwright Memorial VA Medical Center, Walla Walla, WA 100 100
VA Central California Health Care System, Fresno, CA 100 100
VA Northern California Health Care System, Martinez, Sacramento, CA 100 98
VA Palo Alto Health Care System, Palo Alto, Menlo Pk, Livermore, CA 100 100
San Francisco VAMC, CA 100 100
VA Pacific Islands Health Care System, Honolulu, HI 100 100
VA Sierra Nevada Health Care System, Reno, NV 100 100
VA Loma Linda Health Care System, CA 100 100
VA Long Beach Health Care System, CA 100 100
VA Greater Los Angeles Health Care System, CA 100 100
VA San Diego Health Care System, CA 100 100
VA Southern Nevada Health Care System, Las Vegas, NV 100 91
VA Nebraska Western Iowa Health Care System, Omaha, Grand Is, Lincoln, NE 100 100
VA Central Iowa Health Care System, Des Moines, Knoxville, IA 100 95
Iowa City VAMC, IA 80 88
Minneapolis VAMC, MN 100 100
St. Cloud VAMC, MN 100 100
Fargo VAMC, ND 100 100
VA Black Hills Health Care System, Ft Meade, Hot Springs, SD 100 77
Sioux Falls VAMC, SD 85 100

Section 5: Timely Care
Access to Care
165
Facility
Prim
ary
Car
e Pt
s se
en w
/in
30d
% C
ompl
eted
in 3
0 da
ys o
r le
ss
Spec
ialty
Car
e Pt
s se
en w
/in
30d
% C
ompl
eted
in 3
0 da
ys o
r le
ss
VA Connecticut Health Care System, West Haven, CT 100,366 99.6% 217,375 98.1%
Edith N Rogers Memorial Veterans Hospital, Bedford, Ma 28,732 98.7% 50,459 98.7%
VA Boston Health Care System, W Roxbury, Brockton, Jamaica Plains, MA 102,094 99.2% 289,469 98.4%
Northampton VAMC, MA 37,387 99.3% 64,892 98.4%
Togus VAMC, Augusta, ME 75,345 99.6% 130,465 98.7%
Manchester VAMC, NH 46,778 99.7% 92,677 98.9%
Providence VAMC, RI 67,630 99.4% 130,368 99.1%
White River Junction VAMC, VT 58,234 99.6% 82,597 98.4%
Samuel S. Stratton VAMC, Albany, NY 68,923 99.6% 121,609 97.6%
VA Western New York Health Care System Buffalo, Batavia, NY 83,236 99.1% 180,129 98.5%
Bath VAMC, NY 25,615 99.4% 41,461 99.0%
Canandaigua VAMC, NY 42,887 99.2% 77,603 98.0%
Syracuse VAMC, NY 93,478 99.5% 145,583 97.9%
VA New Jersey Health Care System, East Orange, NJ 115,550 99.9% 266,554 96.3%
James J. Peters VAMC, Bronx, NY 30,615 97.1% 176,366 96.6%
VA New York Harbor Health Care System, Manhattan, Brooklyn, NY 99,491 99.4% 353,597 99.1%
VA Hudson Valley Health Care System, Montrose, Castle Point, NY 54,546 98.7% 130,279 97.7%
Northport VAMC, NY 55,420 98.3% 176,167 98.0%

166
Wilmington VAMC, DE 40,701 98.9% 91,167 97.4%
James E. Van Zandt VAMC, Altoona, PA 51,889 99.7% 55,168 98.3%
Butler VAMC, PA 28,917 99.7% 38,518 99.5%
Coatesville VAMC, PA 30,677 99.5% 61,178 98.0%
Erie VAMC, PA 63,282 99.8% 66,863 99.2%
Lebanon VAMC, PA 86,250 99.4% 138,767 97.7%
Philadelphia VAMC, PA 101,180 98.4% 251,111 98.2%
VA Pittsburgh Health Care System, PA 90,588 99.1% 188,017 98.0%
Wilkes-Barre VAMC, PA 77,615 99.5% 158,633 98.7%
Louis A. Johnson VAMC, Clarksburg, WV 56,881 99.7% 87,168 99.0%
Washington DC VAMC, DC 86,978 98.7% 242,669 96.9%
VA Maryland Health Care System, Perry Pt, Baltimore, MD 97,206 98.7% 256,294 98.3%
Martinsburg VAMC, WV 90,620 99.3% 104,094 97.7%
Asheville VAMC, NC 62,471 99.7% 115,950 97.4%
Durham VAMC, NC 100,750 98.7% 182,882 97.8%
Fayetteville VAMC, NC 106,642 99.5% 114,039 96.7%
W.G. (Bill) Hefner VAMC, Salisbury, NC 147,087 99.8% 203,155 98.7%
Hampton VAMC, VA 53,456 97.5% 113,084 96.7%
Hunter Holmes McGuire VAMC, Richmond, VA 85,981 99.7% 183,645 99.0%
Salem VAMC, VA 80,835 99.6% 144,261 98.8%
Beckley VAMC, WV 26,056 93.8% 54,716 95.9%
Birmingham VAMC, AL 113,770 99.8% 184,570 98.4%
Central Alabama Veterans Health Care System, Tuskegee, Montgomery, AL 81,975 98.8% 138,388 96.7%
Tuscaloosa VAMC, AL 27,259 99.3% 60,355 99.5%
Atlanta VAMC, GA 153,628 99.8% 276,669 98.2%
Charlie Norwood VAMC, Augusta, GA 54,860 99.8% 129,673 98.6%

167
Carl Vinson VAMC, Dublin, GA 61,207 98.9% 77,154 96.3%
Ralph H. Johnson VAMC, Charleston, SC 91,960 99.9% 141,745 96.2%
Wm. Jennings Bryan Dorn VAMC, Columbia, SC 139,838 98.7% 238,371 98.0%
Bay Pines VA Health Care System, FL 221,962 99.7% 337,901 98.7%
N. Florida/S. Georgia Veterans Health Care System Gainesville, Lake City 218,301 99.1% 387,509 98.4%
Miami VA Health Care System, FL 102,913 99.0% 253,456 97.2%
Orlando VAMC, FL 187,542 98.9% 273,995 97.6%
James A. Haley VAMC, Tampa, FL 156,201 99.5% 352,557 97.3%
West Palm Beach VAMC, FL 137,657 99.7% 250,488 98.9%
VA Caribbean Health Care System, San Juan, PR 213,500 95.9% 316,684 98.7%
Lexington VAMC, KY 77,072 99.5% 125,512 98.0%
Louisville VAMC, KY 98,431 99.7% 159,246 98.5%
Memphis VAMC, TN 109,657 99.1% 209,039 97.6%
Mountain Home VAMC, TN 115,020 98.6% 187,222 97.5%
Tennessee Valley Health Care System, Nashville, Murfreesboro, TN 148,564 95.3% 288,331 95.3%
Huntington VAMC, WV 65,957 99.8% 119,069 99.1%
Chillicothe VAMC, OH 62,281 99.6% 68,844 98.5%
Cincinnati VAMC, OH 75,048 99.5% 178,720 98.8%
Louis Stokes VAMC, Cleveland, Brecksville, OH 279,768 99.9% 379,178 99.1%
Chalmers P. Wylie Outpt Clinic, Columbus, OH 72,042 99.4% 155,992 97.9%
Dayton VAMC, OH 71,570 99.4% 135,080 98.4%
VA Illiana Health Care System, Danville, IL 66,870 99.5% 95,937 97.4%
VA Northern Indiana Health Care System, Marion, Ft Wayne, IN 76,866 98.1% 90,209 96.5%
Richard L. Roudebush VAMC, Indianapolis, IN 102,460 99.1% 165,955 97.5%
VA Ann Arbor Health Care System, MI 71,310 98.6% 157,469 97.1%

168
Battle Creek VAMC, MI 74,960 99.5% 110,264 96.1%
John D. Dingell VAMC, Detroit, MI 60,514 98.6% 171,553 98.2%
Aleda E. Lutz VAMC, Saginaw, MI 62,335 99.9% 89,362 99.4%
Jessie Brown VAMC, Chicago, IL 101,334 99.7% 221,636 99.3%
Edward Hines Jr. VA Hospital, Hines, IL 100,545 99.5% 202,772 99.5%
North Chicago VAMC, IL 53,590 99.9% 130,915 99.7%
Iron Mountain VAMC, MI 43,450 99.2% 41,144 96.4%
William S. Middleton Memorial Veterans Hospital, Madison, WI 52,192 99.8% 116,854 99.0%
Clement J. Zablocki VAMC, Milwaukee, WI 136,506 99.8% 242,630 97.5%
Tomah VAMC, WI 52,081 99.5% 48,132 97.2%
VA Eastern Kansas Health Care System, Topeka, Leavenworth, KS 78,170 99.3% 115,732 97.0%
Robert J. Dole VAMC, Wichita, KS 44,772 99.3% 78,556 98.5%
Harry S. Truman VAMC, Columbia, MO 63,916 99.7% 111,524 98.6%
Kansas City VAMC, MO 88,655 99.7% 154,891 97.9%
Marion VAMC, IL 89,043 91.6% 118,656 94.5%
John J. Pershing VAMC, Poplar Bluff, MO 52,348 98.1% 39,755 94.8%
St Louis VAMC, St Louis, Jefferson Barracks, MO 117,347 98.5% 192,021 97.7%
Fayetteville VAMC, AR 103,544 99.8% 136,116 99.6%
Central Arkansas Veterans Health Care System, Little Rock, N Little Rock, AR 106,059 99.5% 233,957 98.1%
Alexandria VAMC, LA 61,348 99.7% 83,512 97.7%
New Orleans VAMC, LA 62,931 96.2% 138,861 96.0%
Overton Brooks VAMC, Shreveport, LA 78,603 99.0% 126,844 98.4%
Gulf Coast Veterans Health Care System, Biloxi, MS 148,217 99.6% 225,187 96.7%
G.V. Montgomery VAMC, Jackson, MS 101,956 99.8% 133,920 98.6%
Muskogee VAMC, OK 65,657 98.4% 112,462 97.2%
Oklahoma City VAMC, OK 109,141 99.5% 185,013 98.4%
Michael E. DeBakey VAMC, Houston, TX 215,782 99.7% 311,819 97.7%
VA North Texas Health Care System, Dallas, TX 237,310 99.7% 397,430 98.3%
South Texas Veterans Health Care System, San Antonio, Kerrville, TX 243,976 99.8% 284,902 98.6%
Central Texas Veterans Health Care System, Temple, Waco, Marlin, TX 187,969 99.7% 288,666 97.4%

169
Carl T. Hayden VAMC, Phoenix, AZ 123,335 92.6% 203,169 95.0%
No. Arizona VA Health Care System, Prescott, AZ 53,305 94.2% 56,194 94.4%
So. Arizona VA Health Care System, Tucson, AZ 100,926 989.0% 192,618 97.7%
New Mexico Health Care System, Albuquerque, NM 133,601 99.5% 152,396 97.0%
Amarillo VA Health Care System, TX 57,618 98.8% 77,759 98.5%
West Texas VA Health Care System, Big Spring, TX 39,514 98.3% 29,300 98.2%
El Paso VA Health Care System, TX 66,462 98.5% 100,862 95.6%
VA Eastern Colorado Health Care System, Denver, Pueblo, CO 100,249 98.5% 239,504 98.5%
Grand Junction VAMC, CO 23,874 99.8% 45,446 99.4%
VA Montana Health Care System, Fort Harrison, MT 76,624 98.9% 59,666 96.6%
VA Salt Lake City Health Care System, UT 72,948 97.3% 130,319 97.0%
Cheyenne VAMC, WY 41,900 97.5% 63,511 96.0%
Sheridan VAMC, WY 23,167 99.4% 17,574 98.7%
Alaska VA Health Care System and Regional Office, Anchorage, AK 32,616 99.7% 41,424 99.1%
Boise VAMC, ID 52,148 99.7% 76,843 98.4%
Portland VAMC, OR 82,085 98.5% 209,108 96.9%
VA Roseburg Health Care System, OR 42,440 98.9% 63,024 97.5%
Southern Oregon Rehab Center & Clinics, White City, OR 21,600 99.1% 50,501 98.4%
VA Puget Sound Health Care System, Seattle, American Lake, WA 140,555 98.9% 271,083 97.7%
Spokane VAMC, WA 49,529 98.0% 77,300 94.8%
Jonathan M. Wainwright Memorial VA Medical Center, Walla Walla, WA 35,099 98.7% 18,348 96.4%
VA Central California Health Care System, Fresno, CA 67,284 99.2% 99,085 98.2%
VA Northern California Health Care System, Martinez, Sacramento, CA 145,546 99.6% 318,340 97.2%
VA Palo Alto Health Care System, Palo Alto, Menlo Pk, Livermore, CA 109,113 91.8% 211,853 96.4%
San Francisco VAMC, CA 64,675 98.9% 146,500 97.7%
VA Pacific Islands Health Care System, Honolulu, HI 43,684 97.5% 65,021 97.4%
VA Sierra Nevada Health Care System, Reno, NV 60,643 100.0% 78,319 98.1%
VA Loma Linda Health Care System, CA 107,812 99.8% 243,692 97.1%
VA Long Beach Health Care System, CA 88,572 99.8% 216,614 98.3%

170
VA Greater Los Angeles Health Care System, CA 221,904 99.2% 382,221 98.5%
VA San Diego Health Care System, CA 110,946 99.7% 265,556 97.5%
VA Southern Nevada Health Care System, Las Vegas, NV 127,422 99.7% 144,599 97.0%
VA Nebraska Western Iowa Health Care System, Omaha, Grand Is, Lincoln, NE 93,800 99.6% 153,604 98.2%
VA Central Iowa Health Care System, Des Moines, Knoxville, IA 54,682 98.9% 93,570 98.8%
Iowa City VAMC, IA 66,568 99.4% 119,318 95.6%
Minneapolis VAMC, MN 140,964 99.2% 298,285 97.1%
St. Cloud VAMC, MN 56,538 97.8% 95,379 96.4%
Fargo VAMC, ND 54,439 99.2% 59,380 90.9%
VA Black Hills Health Care System, Ft Meade, Hot Springs, SD 40,940 98.8% 59,902 97.6%
Sioux Falls VAMC, SD 51,242 99.1% 73,570 96.9%

Section 6: Patient Centered Care
171
Facility Name
Ove
rall
Rat
ing
of H
ospi
tal
Com
mun
icat
ion
with
Nur
ses
Com
mun
icat
ion
with
Doc
tors
Com
mun
icat
ion
abou
t M
edic
atio
n
Nur
sing
Ser
vice
s
Dis
char
ge In
form
atio
n
Pain
Con
trol
Cle
anlin
ess
of th
e H
ospi
tal
Envi
ronm
ent
Qui
etne
ss o
f the
Hos
pita
l En
viro
nmen
tW
illin
gnes
s to
Rec
omm
end
Hos
pita
l
Ove
rall
satis
fact
ion
Get
ting
Nee
ded
Car
e
Get
ting
Car
e Q
uick
ly
How
wel
l Doc
tors
& N
urse
s C
omm
unic
ate
Rat
ing
of P
erso
nal
Doc
tor/N
urse
VA Connecticut Health Care System, West Haven, CT 59.4 91.1 94.4 71.4 82.5 82.2 85.3 89.5 73.6 62.4 60.4 87.3 95.9 95.0 73.8
Edith N Rogers Memorial Veterans Hospital, Bedford, Ma NA NA NA NA NA NA NA NA NA NA 73.5 93.9 94.8 95.4 80.5
VA Boston Health Care System, W Roxbury, Brockton, Jamaica Plains, MA 72.1 95.8 94.2 80.4 91.0 86.4 91.4 94.5 87.5 72.3 55.8 95.1 96.8 95.5 72.4
Northampton VAMC, MA NA NA NA NA NA NA NA NA NA NA 59.2 87.4 87.2 94.4 71.9
Togus VAMC, Augusta, ME 68.0 96.0 96.3 83.4 93.1 83.9 92.3 96.4 90.3 66.4 63.6 92.5 89.0 96.4 76.8
Manchester VAMC, NH NA NA NA NA NA NA NA NA NA NA 54.0 95.3 91.7 94.2 75.5
Providence VAMC, RI 70.3 95.1 93.4 83.2 87.0 88.3 91.0 93.4 83.3 67.2 63.0 90.8 97.5 91.0 74.4
White River Junction VAMC, VT 71.7 95.4 93.4 89.0 88.6 88.0 92.6 95.0 87.8 78.2 51.6 84.6 84.6 94.0 73.3
Samuel S. Stratton VAMC, Albany, NY 71.9 96.3 95.6 84.3 93.6 86.0 92.9 96.3 87.0 76.9 56.5 91.0 86.9 91.4 71.9
VA Western New York Health Care System Buffalo, Batavia, NY 59.8 93.4 89.5 73.5 78.7 83.3 90.5 92.1 81.2 61.7 59.4 88.8 89.1 94.8 68.8

172
Bath VAMC, NY 61.8 96.2 96.1 80.5 86.4 90.2 91.3 98.2 91.7 65.0 43.6 91.4 92.0 92.6 71.2
Canandaigua VAMC, NY NA NA NA NA NA NA NA NA NA NA 58.0 88.9 89.3 92.0 73.5
Syracuse VAMC, NY 72.9 96.5 92.8 80.1 90.2 85.7 93.7 93.0 87.7 74.2 64.3 89.8 95.7 94.7 77.1
VA New Jersey Health Care System, East Orange, NJ 62.0 94.5 96.1 82.8 88.2 82.4 91.0 92.4 86.9 60.4 50.2 84.5 90.0 94.5 78.9
James J. Peters VAMC, Bronx, NY 67.4 91.8 93.5 77.3 80.0 80.5 87.4 91.6 88.1 66.3 60.2 81.2 72.7 91.6 67.8
VA New York Harbor Health Care System, Manhattan, Brooklyn, NY 64.3 90.0 91.9 74.1 75.4 76.9 84.5 90.3 83.5 66.5 57.9 83.1 91.4 95.0 77.3
VA Hudson Valley Health Care System, Montrose, Castle Point, NY 62.5 85.0 91.3 72.1 78.7 83.3 83.6 93.9 83.9 67.2 57.9 87.5 91.3 95.2 71.5
Northport VAMC, NY 66.8 93.9 92.5 71.9 84.3 79.6 86.0 96.1 87.5 70.8 60.4 89.2 81.0 96.7 83.9
Wilmington VAMC, DE 73.1 95.9 95.8 87.0 91.5 87.6 89.7 94.2 86.9 77.5 53.5 77.7 68.1 92.4 78.1
James E. Van Zandt VAMC, Altoona, PA 82.0 96.8 97.1 84.6 96.8 88.7 92.7 97.9 94.6 75.0 66.9 91.8 95.3 95.8 79.4
Butler VAMC, PA NA NA NA NA NA NA NA NA NA NA 66.1 90.8 96.4 92.8 73.5
Coatesville VAMC, PA NA NA NA NA NA NA NA NA NA NA 60.9 88.8 86.0 94.4 76.2
Erie VAMC, PA 83.5 97.7 95.7 82.8 95.9 89.4 93.2 95.6 95.2 80.6 64.8 97.8 100.0 93.7 74.7
Lebanon VAMC, PA 84.5 98.2 96.2 89.3 97.2 88.6 96.6 97.9 91.2 83.6 59.7 81.0 83.1 91.5 75.7
Philadelphia VAMC, PA 57.9 90.6 91.8 79.0 86.1 78.7 86.5 89.3 87.5 54.8 46.9 82.6 85.1 93.0 76.5
VA Pittsburgh Health Care System, PA 71.2 96.4 95.8 82.0 89.7 87.9 93.8 96.1 87.6 73.1 62.2 92.2 94.8 95.7 77.4
Wilkes-Barre VAMC, PA 70.0 95.4 94.6 79.0 92.2 86.6 90.4 96.4 86.8 70.3 63.6 94.1 93.8 94.2 76.0
Louis A. Johnson VAMC, Clarksburg, WV 67.1 96.4 93.5 80.4 88.1 86.7 92.3 94.3 88.1 74.2 61.9 92.9 96.2 96.3 84.9
Washington DC VAMC, DC 59.2 85.5 92.1 73.6 68.0 79.9 83.5 86.0 78.7 51.4 46.2 70.0 73.8 93.1 79.3

173
VA Maryland Health Care System, Perry Pt, Baltimore, MD 57.0 90.5 94.2 77.2 77.8 82.0 89.1 87.7 86.1 59.1 58.9 84.7 85.7 89.1 73.6
Martinsburg VAMC, WV 66.5 93.8 93.2 79.5 86.6 82.5 90.6 91.8 84.1 67.6 53.8 87.4 90.3 93.6 69.7
Asheville VAMC, NC 67.2 96.2 94.1 79.6 90.5 84.2 93.1 89.5 83.5 78.0 65.7 86.7 91.9 92.8 75.5
Durham VAMC, NC 65.7 95.3 94.5 84.7 85.3 86.7 92.0 90.1 86.0 71.0 60.4 83.6 84.3 90.7 69.5
Fayetteville VAMC, NC 52.0 92.0 85.0 73.8 84.6 71.9 89.5 85.5 86.8 55.0 42.2 65.7 71.3 86.7 64.7
W.G. (Bill) Hefner VAMC, Salisbury, NC 53.9 95.6 96.6 79.5 89.6 86.3 91.2 90.7 84.5 57.5 51.5 68.0 69.0 87.9 66.7
Hampton VAMC, VA 60.8 92.3 94.2 79.8 82.4 83.4 85.9 93.2 91.2 60.6 36.1 81.3 71.5 91.3 68.3
Hunter Holmes McGuire VAMC, Richmond, VA 63.8 92.6 93.1 78.4 82.7 83.7 87.9 88.0 80.9 67.6 46.6 78.0 79.3 90.5 72.2
Salem VAMC, VA 66.0 92.2 87.6 73.3 84.3 79.0 88.2 92.0 86.2 68.1 57.1 76.7 90.9 92.8 64.5
Beckley VAMC, WV 65.1 93.4 92.7 78.9 87.8 80.7 91.0 94.4 91.0 66.8 34.1 70.3 79.6 88.2 62.4
Birmingham VAMC, AL 73.3 94.7 95.7 78.7 87.1 82.1 90.8 92.1 90.9 73.7 57.3 83.2 83.6 91.5 68.3
Central Alabama Veterans Health Care System, Tuskegee, Montgomery, AL 51.2 88.8 86.8 69.4 71.3 76.7 84.5 88.9 88.8 57.4 43.2 68.3 75.1 88.1 64.2
Tuscaloosa VAMC, AL NA NA NA NA NA NA NA NA NA NA 48.8 90.6 83.0 92.7 75.2
Atlanta VAMC, GA 61.4 90.0 94.3 71.7 79.1 76.1 87.4 90.4 84.4 62.4 55.7 66.0 72.0 90.9 74.7
Charlie Norwood VAMC, Augusta, GA 67.4 92.7 94.8 79.7 82.4 80.8 88.6 90.2 82.2 67.4 58.9 80.3 89.7 92.4 74.8
Carl Vinson VAMC, Dublin, GA 64.6 94.4 93.0 75.4 88.0 78.5 86.4 95.6 84.2 66.5 57.4 81.7 86.7 90.3 72.0
Ralph H. Johnson VAMC, Charleston, SC 67.4 95.0 94.8 81.3 87.5 83.7 92.6 91.8 90.3 68.7 48.8 75.6 85.3 90.7 67.7
Wm. Jennings Bryan Dorn VAMC, Columbia, SC 70.0 95.4 94.9 85.1 85.4 82.9 94.4 94.1 93.7 72.1 50.2 79.5 82.0 91.3 68.6

174
Bay Pines VA Health Care System, FL 72.8 93.4 90.6 75.8 82.8 79.3 89.4 90.3 80.3 74.4 52.2 83.4 87.5 93.2 72.8
N. Florida/S. Georgia Veterans Health Care System Gainesville, Lake City 62.6 94.3 93.6 79.4 86.0 84.6 91.3 90.6 78.7 69.7 56.7 79.8 84.4 89.0 71.3
Miami VA Health Care System, FL 59.7 91.4 92.9 76.5 82.4 81.1 88.5 91.6 89.5 64.0 56.2 75.3 84.7 93.5 70.1
Orlando VAMC, FL NA NA NA NA NA NA NA NA NA NA 62.3 80.6 81.2 89.7 72.8
James A. Haley VAMC, Tampa, FL 66.4 92.6 93.1 73.2 82.1 86.2 86.9 88.7 79.2 69.8 57.2 87.7 85.8 91.5 70.5
West Palm Beach VAMC, FL 70.3 91.8 90.5 73.1 82.9 79.8 87.1 91.4 84.8 77.9 50.9 87.8 88.8 88.0 73.1
VA Caribbean Health Care System, San Juan, PR 70.7 90.7 94.2 68.7 77.8 78.3 85.8 96.9 88.0 72.6 62.6 80.3 74.5 91.6 78.1
Lexington VAMC, KY 64.3 92.9 93.3 79.8 82.5 80.3 88.3 89.6 78.9 65.6 66.5 83.7 84.2 93.7 76.9
Louisville VAMC, KY 63.2 92.6 92.5 79.3 85.9 83.5 86.7 87.4 87.2 64.1 54.3 81.4 81.3 91.7 71.4
Memphis VAMC, TN 56.5 87.3 90.3 71.2 73.3 73.2 83.4 85.6 84.3 62.4 43.8 83.6 81.7 87.2 63.3
Mountain Home VAMC, TN 68.1 95.2 93.7 75.3 84.9 81.7 85.9 93.4 89.0 73.3 47.0 77.4 71.6 87.5 66.4
Tennessee Valley Health Care System, Nashville, Murfreesboro, TN 61.8 93.0 93.1 75.7 85.7 81.3 87.4 90.4 84.3 65.2 46.3 82.9 85.0 92.0 65.5
Huntington VAMC, WV 65.7 93.0 92.0 77.4 83.6 82.7 88.3 92.3 84.6 65.0 38.4 78.1 69.4 92.1 67.6
Chillicothe VAMC, OH 63.0 93.3 88.5 74.4 83.6 77.3 84.8 95.3 93.0 66.5 40.8 80.2 75.9 88.5 60.8
Cincinnati VAMC, OH 64.2 93.0 93.2 76.8 83.7 84.3 90.6 93.2 87.2 65.2 54.3 88.4 78.6 92.0 73.3
Louis Stokes VAMC, Cleveland, Brecksville, OH 62.1 91.4 90.0 74.3 77.6 82.0 86.8 91.5 88.4 62.4 58.4 83.8 86.7 93.0 73.3

175
Chalmers P. Wylie Outpt Clinic, Columbus, OH NA NA NA NA NA NA NA NA NA NA 55.8 90.5 81.5 91.2 60.6
Dayton VAMC, OH 52.4 90.6 92.6 75.2 77.9 81.5 84.3 86.2 79.7 58.7 46.2 91.8 85.7 91.9 61.5
VA Illiana Health Care System, Danville, IL 61.8 96.8 92.1 82.3 93.5 82.3 92.2 93.8 87.7 61.7 53.8 87.5 84.4 90.9 66.7
VA Northern Indiana Health Care System, Marion, Ft Wayne, IN 59.0 94.6 88.6 75.7 93.1 78.1 90.0 96.2 87.9 61.1 44.8 85.2 85.0 90.1 64.2
Richard L. Roudebush VAMC, Indianapolis, IN 75.2 94.5 92.7 81.1 91.0 83.7 93.2 95.6 88.4 75.7 52.5 80.2 81.2 91.6 69.9
VA Ann Arbor Health Care System, MI 81.2 97.0 94.6 84.9 94.9 89.0 97.1 95.9 90.8 81.1 50.0 84.6 87.3 91.0 69.6
Battle Creek VAMC, MI 51.9 89.8 81.7 71.4 84.7 77.5 81.4 91.7 82.9 52.2 52.9 85.9 81.5 90.9 67.3
John D. Dingell VAMC, Detroit, MI 63.2 91.9 93.3 74.7 81.5 80.0 88.2 91.2 90.2 63.5 46.0 91.8 75.9 90.9 68.4
Aleda E. Lutz VAMC, Saginaw, MI 82.0 96.4 94.7 84.0 93.6 83.4 94.5 94.8 99.3 77.7 58.1 86.1 94.7 94.1 69.5
Jessie Brown VAMC, Chicago, IL 68.3 92.5 95.1 75.0 78.4 83.6 90.5 93.5 86.0 67.3 54.6 81.5 76.7 88.2 70.8
Edward Hines Jr. VA Hospital, Hines, IL 58.1 91.7 92.9 72.0 80.5 78.8 91.2 88.1 83.5 62.2 62.0 89.6 86.5 94.8 80.2
North Chicago VAMC, IL 64.2 91.9 90.2 76.7 85.6 78.0 89.3 91.1 88.5 65.4 50.6 86.2 95.5 91.7 71.0
Iron Mountain VAMC, MI 77.9 98.6 95.5 78.4 93.8 82.8 91.2 99.3 93.5 77.6 53.5 80.0 86.0 92.1 71.4
William S. Middleton Memorial Veterans Hospital, Madison, WI 74.5 96.6 94.1 84.4 92.7 85.8 93.8 97.6 91.1 81.0 61.3 89.1 97.3 93.4 70.9
Clement J. Zablocki VAMC, Milwaukee, WI 66.1 95.0 95.0 80.6 86.7 80.9 91.5 92.0 89.3 67.7 49.3 86.8 80.7 92.5 73.0
Tomah VAMC, WI 65.6 95.1 95.2 80.0 95.7 81.5 92.5 96.8 90.4 73.4 53.2 90.9 88.8 93.6 66.7
VA Eastern Kansas Health Care System, Topeka, Leavenworth, KS 67.1 94.8 91.7 80.0 92.8 83.8 93.1 97.5 93.4 67.7 52.2 87.1 83.7 87.5 71.4
Robert J. Dole VAMC, Wichita, KS 62.1 90.3 89.3 75.4 83.9 77.4 90.5 86.6 86.7 62.1 52.3 76.5 87.2 91.1 64.5

176
Harry S. Truman VAMC, Columbia, MO 63.6 93.3 90.3 75.1 87.2 82.5 88.7 93.3 88.4 69.3 60.6 92.4 93.7 93.7 73.5
Kansas City VAMC, MO 63.9 94.6 91.8 76.1 85.6 82.6 87.8 92.8 84.4 67.0 53.3 76.1 76.3 90.1 70.9
Marion VAMC, IL 62.1 94.9 90.8 80.1 91.0 81.2 90.1 97.8 87.9 67.2 48.3 78.6 79.1 90.9 65.1
John J. Pershing VAMC, Poplar Bluff, MO 57.2 93.3 86.2 74.4 87.8 72.7 87.4 92.4 90.9 57.6 40.2 77.5 79.4 88.3 57.8
St Louis VAMC, St Louis, Jefferson Barracks, MO 47.2 86.6 92.9 74.0 75.0 77.2 84.4 85.8 79.5 46.9 55.3 84.5 83.4 92.3 68.8
Fayetteville VAMC, AR 68.2 93.4 91.9 76.0 87.7 76.5 89.7 94.4 86.3 72.9 60.9 83.7 88.2 90.1 68.3
Central Arkansas Veterans Health Care System, Little Rock, N Little Rock, AR 63.1 91.9 91.4 78.6 83.7 83.7 87.4 90.0 82.9 70.4 47.0 85.3 88.1 92.0 70.4
Alexandria VAMC, LA 68.3 97.3 95.9 85.0 93.2 85.1 94.0 92.5 95.3 69.6 65.0 84.4 74.1 92.5 69.6
New Orleans VAMC, LA NA NA NA NA NA NA NA NA NA NA 57.0 77.4 81.6 90.1 75.5
Overton Brooks VAMC, Shreveport, LA 62.8 94.7 89.9 79.5 84.7 76.5 85.5 89.6 86.7 67.2 54.2 77.0 83.1 91.8 73.1
Gulf Coast Veterans Health Care System, Biloxi, MS 74.6 94.0 93.7 83.4 83.9 87.2 90.1 94.4 90.4 75.3 53.2 84.7 74.9 92.0 72.5
G.V. Montgomery VAMC, Jackson, MS 70.3 93.2 94.3 80.7 82.2 77.5 90.6 88.8 84.4 71.5 46.4 69.4 81.9 93.9 67.0
Muskogee VAMC, OK 73.4 94.9 92.2 79.7 87.1 80.4 90.9 94.0 89.8 75.6 54.5 83.1 83.7 89.6 66.3
Oklahoma City VAMC, OK 58.3 92.3 91.0 73.7 87.6 81.1 90.9 89.9 83.4 59.6 35.1 61.2 56.8 85.3 65.6
Michael E. DeBakey VAMC, Houston, TX 64.8 90.8 93.4 73.6 77.4 76.3 87.4 88.4 86.9 66.8 33.6 66.1 67.1 86.2 58.7
VA North Texas Health Care System, Dallas, TX 50.5 88.3 91.7 73.2 77.3 80.8 86.3 89.9 84.2 54.4 44.3 75.2 61.4 82.3 64.7
South Texas Veterans Health Care System, San Antonio, Kerrville, TX 64.5 91.6 93.4 76.9 82.5 80.9 89.3 88.4 78.9 67.6 55.2 81.0 78.2 90.5 72.6
Central Texas Veterans Health Care System, Temple, Waco, Marlin, TX 66.5 94.4 95.2 81.5 85.9 82.9 90.5 89.3 85.6 68.8 51.6 75.2 74.6 85.0 61.8
Carl T. Hayden VAMC, Phoenix, AZ 62.9 94.4 92.9 80.2 87.1 83.9 92.5 89.0 84.6 68.4 40.1 85.5 79.5 90.6 64.6
No. Arizona VA Health Care System, Prescott, AZ 69.7 95.1 91.6 75.8 90.1 75.4 92.4 91.1 87.3 73.0 52.3 84.8 82.8 88.1 69.2
So. Arizona VA Health Care System, Tucson, AZ 72.5 95.4 93.0 82.5 88.2 80.2 92.1 92.1 84.8 78.0 47.7 79.0 85.3 89.7 63.0

177
New Mexico Health Care System, Albuquerque, NM 64.7 90.6 92.7 75.1 82.3 82.5 87.4 89.7 84.5 67.6 46.6 73.2 72.3 91.2 70.2
Amarillo VA Health Care System, TX 72.6 95.8 93.5 79.4 92.1 86.7 93.9 95.9 88.1 77.1 58.0 87.7 85.5 91.9 68.2
West Texas VA Health Care System, Big Spring, TX 70.9 98.3 90.2 87.0 92.3 84.6 92.5 97.2 95.9 76.5 47.2 76.3 80.6 89.8 65.3
El Paso VA Health Care System, TX NA NA NA NA NA NA NA NA NA NA 43.5 80.0 73.6 86.9 65.0
VA Eastern Colorado Health Care System, Denver, Pueblo, CO 53.8 94.4 91.8 78.4 87.6 82.4 87.7 91.6 81.8 60.8 40.2 75.2 77.3 90.7 66.5
Grand Junction VAMC, CO 82.2 98.1 96.8 94.6 88.3 89.3 99.6 92.6 85.6 89.2 55.0 90.8 90.2 94.2 73.9
VA Montana Health Care System, Fort Harrison, MT 78.9 97.9 98.6 90.3 94.0 87.1 95.9 98.3 94.2 83.9 55.3 85.2 86.6 91.7 69.4
VA Salt Lake City Health Care System, UT 67.8 96.3 94.0 83.1 89.2 83.8 93.0 91.8 86.9 73.4 50.6 77.2 76.4 94.1 67.8
Cheyenne VAMC, WY 69.3 96.5 97.1 88.2 92.4 83.9 93.2 96.6 92.3 73.8 62.0 89.7 86.4 94.9 73.1
Sheridan VAMC, WY 61.2 97.5 95.5 82.9 89.9 76.8 93.6 96.6 88.3 68.0 57.7 88.0 86.7 94.9 72.6
Alaska VA Health Care System and Regional Office, Anchorage, AK NA NA NA NA NA NA NA NA NA NA 50.3 91.3 87.6 94.1 77.2
Boise VAMC, ID 69.5 96.2 94.6 83.0 90.0 83.8 89.5 95.3 87.0 75.2 51.8 90.3 97.1 95.4 68.8
Portland VAMC, OR 62.1 94.0 93.6 82.6 87.0 81.6 89.4 89.8 79.4 70.0 46.1 86.1 89.5 88.7 62.3
VA Roseburg Health Care System, OR 65.8 96.7 91.9 82.3 90.0 79.1 90.8 95.9 90.7 66.2 43.5 68.5 62.3 89.7 64.1
Southern Oregon Rehab Center & Clinics, White City, OR NA NA NA NA NA NA NA NA NA NA 51.0 77.8 92.9 93.5 63.0
VA Puget Sound Health Care System, Seattle, American Lake, WA 54.8 92.9 93.9 79.0 86.0 84.4 88.9 89.5 81.0 60.8 48.0 86.3 82.4 93.2 67.9
Spokane VAMC, WA 72.5 95.4 92.8 86.3 92.2 81.4 96.2 95.5 91.0 70.6 45.5 73.6 85.2 85.6 55.8
Jonathan M. Wainwright Memorial VA Medical Center, Walla Walla, WA NA NA NA NA NA NA NA NA NA NA 51.3 85.7 77.6 88.2 59.0
VA Central California Health Care System, Fresno, CA 67.5 92.1 93.2 77.3 84.1 80.3 89.2 93.1 83.6 73.7 49.1 89.3 91.3 90.9 58.7
VA Northern California Health Care System, Martinez, Sacramento, CA 70.6 93.0 93.0 77.1 87.3 79.6 89.8 96.7 84.1 72.6 51.2 83.8 87.8 90.6 66.4

178
VA Palo Alto Health Care System, Palo Alto, Menlo Pk, Livermore, CA 70.0 93.9 94.4 78.6 87.1 81.1 92.9 91.9 83.0 78.9 64.5 92.4 90.3 94.8 78.1
San Francisco VAMC, CA 65.4 93.4 94.4 80.0 87.8 82.0 92.6 96.0 82.9 75.6 63.4 89.8 90.6 94.9 79.0
VA Pacific Islands Health Care System, Honolulu, HI NA NA NA NA NA NA NA NA NA NA 64.3 78.5 85.7 93.2 79.0
VA Sierra Nevada Health Care System, Reno, NV 69.7 94.3 92.4 80.6 88.7 80.7 93.7 94.5 81.7 75.4 59.3 77.8 79.8 92.9 77.9
VA Loma Linda Health Care System, CA 69.5 91.4 92.6 76.8 84.5 78.2 90.7 94.6 81.9 77.0 51.9 83.7 81.9 92.7 66.4
VA Long Beach Health Care System, CA 62.0 92.7 94.3 73.5 81.8 77.7 91.8 89.7 81.9 67.9 43.6 86.1 51.6 88.9 59.6
VA Greater Los Angeles Health Care System, CA 63.3 91.6 91.4 76.8 85.9 79.5 86.1 91.2 80.6 70.3 45.5 72.3 76.6 87.6 67.7
VA San Diego Health Care System, CA 64.8 94.1 94.6 81.9 87.5 85.4 91.5 88.7 78.8 71.5 59.1 76.3 76.2 93.7 73.0
VA Southern Nevada Health Care System, Las Vegas, NV 62.3 91.8 93.8 83.6 82.2 83.3 87.4 87.8 82.6 69.4 55.7 79.6 82.6 92.1 77.9
VA Nebraska Western Iowa Health Care System, Omaha, Grand Is, Lincoln, NE 62.2 92.9 89.0 77.3 88.8 80.2 90.1 93.2 89.2 63.1 54.7 88.1 87.5 94.2 69.2
VA Central Iowa Health Care System, Des Moines, Knoxville, IA 64.8 93.1 94.3 78.1 87.5 86.3 88.1 94.9 86.3 66.0 66.2 87.0 95.5 93.4 77.6
Iowa City VAMC, IA 67.0 95.7 94.7 84.3 92.2 84.5 93.5 93.1 87.9 72.4 59.1 86.5 90.7 94.0 73.6
Minneapolis VAMC, MN 70.2 97.0 94.3 81.3 88.4 89.0 91.1 96.0 88.9 75.6 42.9 85.0 80.7 92.9 68.2
St. Cloud VAMC, MN NA NA NA NA NA NA NA NA NA NA 54.8 73.5 88.9 89.5 77.5
Fargo VAMC, ND 76.6 96.7 95.4 93.0 94.7 85.8 96.1 95.8 93.7 81.7 58.8 86.2 94.2 94.5 75.1
VA Black Hills Health Care System, Ft Meade, Hot Springs, SD 77.9 96.0 94.9 88.1 92.0 83.5 93.4 97.8 93.6 77.0 60.0 84.7 85.5 93.5 73.9
Sioux Falls VAMC, SD 63.8 95.5 91.1 82.4 91.3 83.4 93.8 92.4 91.2 66.3 60.1 90.3 92.4 96.9 75.8
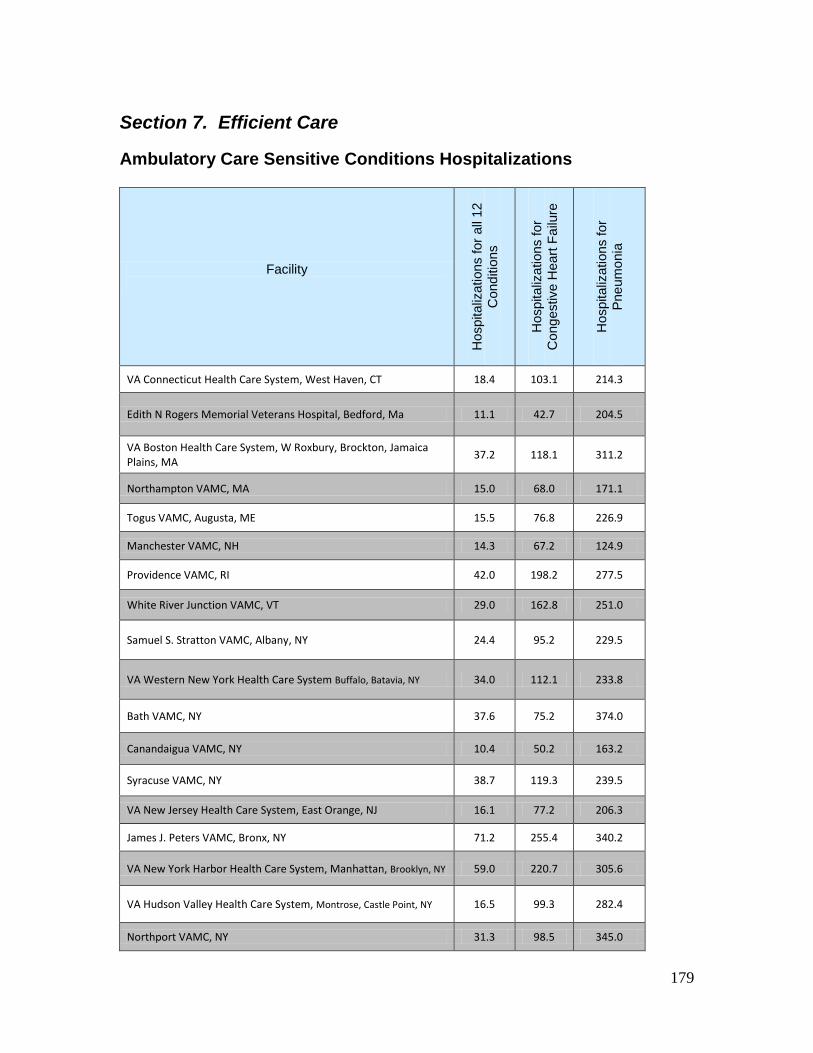
Section 7. Efficient Care
Ambulatory Care Sensitive Conditions Hospitalizations
179
Facility
Hos
pita
lizat
ions
for a
ll 12
C
ondi
tions
Hos
pita
lizat
ions
for
Con
gest
ive
Hea
rt Fa
ilure
Hos
pita
lizat
ions
for
Pneu
mon
ia
VA Connecticut Health Care System, West Haven, CT 18.4 103.1 214.3
Edith N Rogers Memorial Veterans Hospital, Bedford, Ma 11.1 42.7 204.5
VA Boston Health Care System, W Roxbury, Brockton, Jamaica Plains, MA 37.2 118.1 311.2
Northampton VAMC, MA 15.0 68.0 171.1
Togus VAMC, Augusta, ME 15.5 76.8 226.9
Manchester VAMC, NH 14.3 67.2 124.9
Providence VAMC, RI 42.0 198.2 277.5
White River Junction VAMC, VT 29.0 162.8 251.0
Samuel S. Stratton VAMC, Albany, NY 24.4 95.2 229.5
VA Western New York Health Care System Buffalo, Batavia, NY 34.0 112.1 233.8
Bath VAMC, NY 37.6 75.2 374.0
Canandaigua VAMC, NY 10.4 50.2 163.2
Syracuse VAMC, NY 38.7 119.3 239.5
VA New Jersey Health Care System, East Orange, NJ 16.1 77.2 206.3
James J. Peters VAMC, Bronx, NY 71.2 255.4 340.2
VA New York Harbor Health Care System, Manhattan, Brooklyn, NY 59.0 220.7 305.6
VA Hudson Valley Health Care System, Montrose, Castle Point, NY 16.5 99.3 282.4
Northport VAMC, NY 31.3 98.5 345.0
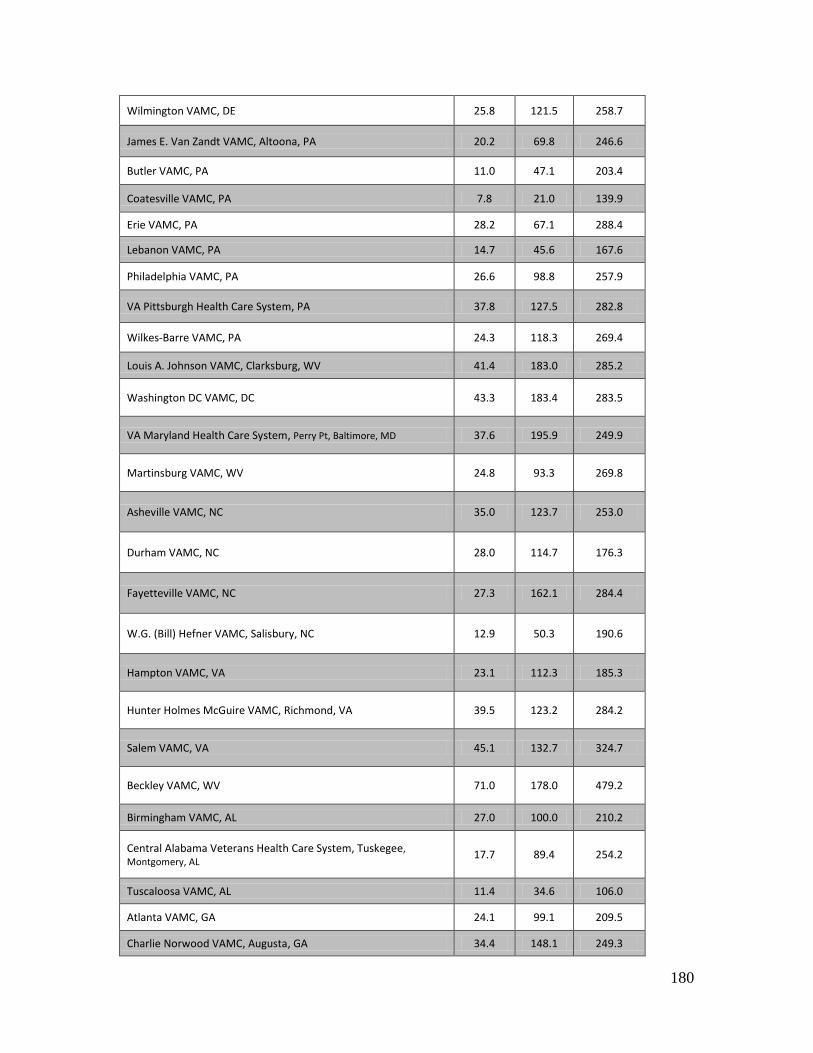
180
Wilmington VAMC, DE 25.8 121.5 258.7
James E. Van Zandt VAMC, Altoona, PA 20.2 69.8 246.6
Butler VAMC, PA 11.0 47.1 203.4
Coatesville VAMC, PA 7.8 21.0 139.9
Erie VAMC, PA 28.2 67.1 288.4
Lebanon VAMC, PA 14.7 45.6 167.6
Philadelphia VAMC, PA 26.6 98.8 257.9
VA Pittsburgh Health Care System, PA 37.8 127.5 282.8
Wilkes-Barre VAMC, PA 24.3 118.3 269.4
Louis A. Johnson VAMC, Clarksburg, WV 41.4 183.0 285.2
Washington DC VAMC, DC 43.3 183.4 283.5
VA Maryland Health Care System, Perry Pt, Baltimore, MD 37.6 195.9 249.9
Martinsburg VAMC, WV 24.8 93.3 269.8
Asheville VAMC, NC 35.0 123.7 253.0
Durham VAMC, NC 28.0 114.7 176.3
Fayetteville VAMC, NC 27.3 162.1 284.4
W.G. (Bill) Hefner VAMC, Salisbury, NC 12.9 50.3 190.6
Hampton VAMC, VA 23.1 112.3 185.3
Hunter Holmes McGuire VAMC, Richmond, VA 39.5 123.2 284.2
Salem VAMC, VA 45.1 132.7 324.7
Beckley VAMC, WV 71.0 178.0 479.2
Birmingham VAMC, AL 27.0 100.0 210.2
Central Alabama Veterans Health Care System, Tuskegee, Montgomery, AL 17.7 89.4 254.2
Tuscaloosa VAMC, AL 11.4 34.6 106.0
Atlanta VAMC, GA 24.1 99.1 209.5
Charlie Norwood VAMC, Augusta, GA 34.4 148.1 249.3
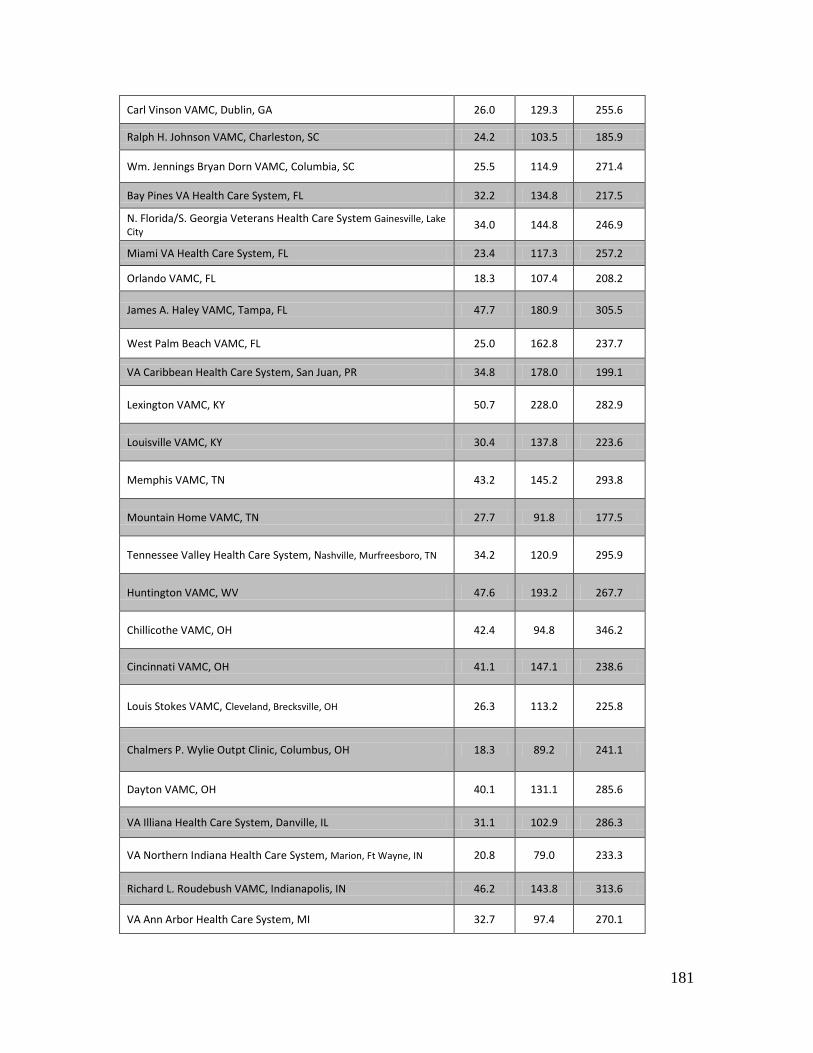
181
Carl Vinson VAMC, Dublin, GA 26.0 129.3 255.6
Ralph H. Johnson VAMC, Charleston, SC 24.2 103.5 185.9
Wm. Jennings Bryan Dorn VAMC, Columbia, SC 25.5 114.9 271.4
Bay Pines VA Health Care System, FL 32.2 134.8 217.5
N. Florida/S. Georgia Veterans Health Care System Gainesville, Lake City 34.0 144.8 246.9
Miami VA Health Care System, FL 23.4 117.3 257.2
Orlando VAMC, FL 18.3 107.4 208.2
James A. Haley VAMC, Tampa, FL 47.7 180.9 305.5
West Palm Beach VAMC, FL 25.0 162.8 237.7
VA Caribbean Health Care System, San Juan, PR 34.8 178.0 199.1
Lexington VAMC, KY 50.7 228.0 282.9
Louisville VAMC, KY 30.4 137.8 223.6
Memphis VAMC, TN 43.2 145.2 293.8
Mountain Home VAMC, TN 27.7 91.8 177.5
Tennessee Valley Health Care System, Nashville, Murfreesboro, TN 34.2 120.9 295.9
Huntington VAMC, WV 47.6 193.2 267.7
Chillicothe VAMC, OH 42.4 94.8 346.2
Cincinnati VAMC, OH 41.1 147.1 238.6
Louis Stokes VAMC, Cleveland, Brecksville, OH 26.3 113.2 225.8
Chalmers P. Wylie Outpt Clinic, Columbus, OH 18.3 89.2 241.1
Dayton VAMC, OH 40.1 131.1 285.6
VA Illiana Health Care System, Danville, IL 31.1 102.9 286.3
VA Northern Indiana Health Care System, Marion, Ft Wayne, IN 20.8 79.0 233.3
Richard L. Roudebush VAMC, Indianapolis, IN 46.2 143.8 313.6
VA Ann Arbor Health Care System, MI 32.7 97.4 270.1

182
Battle Creek VAMC, MI 18.2 59.2 278.4
John D. Dingell VAMC, Detroit, MI 32.5 119.4 295.3
Aleda E. Lutz VAMC, Saginaw, MI 19.9 62.6 140.1
Jessie Brown VAMC, Chicago, IL 45.6 193.5 261.8
Edward Hines Jr. VA Hospital, Hines, IL 35.2 108.8 345.5
North Chicago VAMC, IL 26.2 86.7 156.0
Iron Mountain VAMC, MI 24.7 99.4 163.3
William S. Middleton Memorial Veterans Hospital, Madison, WI 27.8 129.3 276.2
Clement J. Zablocki VAMC, Milwaukee, WI 30.2 124.0 244.1
Tomah VAMC, WI 15.3 60.0 232.9
VA Eastern Kansas Health Care System, Topeka, Leavenworth, KS 31.4 78.8 286.8
Robert J. Dole VAMC, Wichita, KS 20.2 64.3 262.3
Harry S. Truman VAMC, Columbia, MO 30.4 135.8 278.7
Kansas City VAMC, MO 39.6 146.7 281.8
Marion VAMC, IL 42.8 107.5 332.6
John J. Pershing VAMC, Poplar Bluff, MO 41.1 198.3 269.5
St Louis VAMC, St Louis, Jefferson Barracks, MO 46.1 169.8 273.5
Fayetteville VAMC, AR 29.9 66.4 321.4
Central Arkansas Veterans Health Care System, Little Rock, N Little Rock, AR 49.8 126.7 343.6
Alexandria VAMC, LA 21.9 110.5 269.8
New Orleans VAMC, LA 15.7 77.8 158.1
Overton Brooks VAMC, Shreveport, LA 43.0 97.9 283.2
Gulf Coast Veterans Health Care System, Biloxi, MS 14.6 97.2 232.7
G.V. Montgomery VAMC, Jackson, MS 32.2 99.5 253.0
Muskogee VAMC, OK 47.9 147.8 303.1
Oklahoma City VAMC, OK 37.7 67.8 339.6
Michael E. DeBakey VAMC, Houston, TX 39.4 173.2 258.9
VA North Texas Health Care System, Dallas, TX 38.9 150.9 274.7
South Texas Veterans Health Care System, San Antonio, Kerrville, TX 27.1 113.2 301.5
Central Texas Veterans Health Care System, Temple, Waco, Marlin, TX 31.2 97.7 258.9

183
Carl T. Hayden VAMC, Phoenix, AZ 32.2 131.3 244.2
No. Arizona VA Health Care System, Prescott, AZ 27.1 67.0 234.6
So. Arizona VA Health Care System, Tucson, AZ 43.6 143.5 254.9
New Mexico Health Care System, Albuquerque, NM 40.6 161.0 225.4
Amarillo VA Health Care System, TX 30.2 94.5 239.4
West Texas VA Health Care System, Big Spring, TX 21.7 67.2 240.9
El Paso VA Health Care System, TX 18.6 97.8 289.8
VA Eastern Colorado Health Care System, Denver, Pueblo, CO 27.0 102.7 260.6
Grand Junction VAMC, CO 52.0 178.8 334.6
VA Montana Health Care System, Fort Harrison, MT 28.7 100.8 237.4
VA Salt Lake City Health Care System, UT 35.8 89.4 249.0
Cheyenne VAMC, WY 34.8 152.8 325.2
Sheridan VAMC, WY 28.4 83.6 235.0
Alaska VA Health Care System and Regional Office, Anchorage, AK 55.3 334.2 250.8
Boise VAMC, ID 33.5 122.8 277.5
Portland VAMC, OR 44.6 162.3 225.1
VA Roseburg Health Care System, OR 37.1 170.0 226.8
Southern Oregon Rehab Center & Clinics, White City, OR 13.8 59.7 172.7
VA Puget Sound Health Care System, Seattle, American Lake, WA 28.0 111.2 174.7
Spokane VAMC, WA 25.8 130.9 156.6
Jonathan M. Wainwright Memorial VA Medical Center, Walla Walla, WA 10.1 32.3 116.7
VA Central California Health Care System, Fresno, CA 37.2 114.7 295.4
VA Northern California Health Care System, Martinez, Sacramento, CA 27.2 104.2 253.4
VA Palo Alto Health Care System, Palo Alto, Menlo Pk, Livermore, CA 27.2 113.8 171.7
San Francisco VAMC, CA 32.2 114.0 257.1
VA Pacific Islands Health Care System, Honolulu, HI 24.8 153.3 150.8
VA Sierra Nevada Health Care System, Reno, NV 33.4 105.7 211.1
VA Loma Linda Health Care System, CA 32.4 95.1 271.9
VA Long Beach Health Care System, CA 41.0 188.8 232.2

184
VA Greater Los Angeles Health Care System, CA 30.8 175.6 277.6
VA San Diego Health Care System, CA 31.1 140.9 199.0
VA Southern Nevada Health Care System, Las Vegas, NV 32.0 127.5 202.7
VA Nebraska Western Iowa Health Care System, Omaha, Grand Is, Lincoln, NE 28.5 93.6 279.4
VA Central Iowa Health Care System, Des Moines, Knoxville, IA 18.0 64.6 281.8
Iowa City VAMC, IA 19.0 87.8 273.4
Minneapolis VAMC, MN 25.1 83.5 215.9
St. Cloud VAMC, MN 10.3 40.3 103.4
Fargo VAMC, ND 15.1 54.9 169.7
VA Black Hills Health Care System, Ft Meade, Hot Springs, SD 30.7 67.2 247.7
Sioux Falls VAMC, SD 22.5 57.8 307.7

Part 4: Data Definitions
Section 1: Infrastructure
Available In-House Services
185
Measure Name Description of Data Elements
Acute Med/Surg Acute Inpatient: Medical/Surgical: A facility is designated as having acute medicine or surgery in-house services available if the number of discharges from acute medicine or surgery discharging bed sections in a VA hospital setting is greater than 10.
Acute Mental Health Acute Inpatient Mental Health: A facility is designated as having acute mental health in-house services available if the number of discharges from acute psychiatry discharging bed sections in a VA Hospital setting is greater than 10.
Intensive Care Unit
Intensive Care Unit: A facility is designated as having an intensive care unit based on the national VA ICU survey. Medical centers and VISNs need to meet established ICU criteria that would establish their level of care from Highly complex (level 1) to Basic (level 4). Updates to the level of ICU care can be made anytime during the year in collaboration with the National Program Director for Pulmonary/Critical Care and the Health Analysis Information Group (HAIG). (ICU Levels: 1-Complex, 2-Complex, 3-Moderate or 4-Basic based on the results of the FY 2007-2008 HAIG ICU Level Survey updated January 16, 2009).
Emergency Dept
Emergency Room Department: A facility is designated as having an emergency department available if there is outpatient encounter workload recorded using primary or secondary Decision Support System (DSS - VA’s Managerial Cost Accounting System) Identifier of 130-Emergency Department.
Spinal Cord Injury & Disorders Unit
A facility is designated as having a specialty spinal cord injury & disorders unit.
Polytrauma Services
PRC: Polytrauma/Traumatic Brain Injury (TBI) Rehabilitation Centers that provide acute comprehensive medical and rehabilitation care for complex and severe polytraumatic injuries. PNS: Polytrauma Rehabilitation Network Sites have dedicated interdisciplinary teams to manage the post-acute sequelae of polytrauma and to coordinate life-long rehabilitation services for patients within their VISN. PSCT: Polytrauma Support Clinic Teams are local teams of providers with rehabilitation expertise who deliver follow up services in consultation with regional and network specialists. PPOC: Polytrauma Point of Contact facilities do not provide specialized care but have a designated PPOC who is knowledgeable of the PSC, and ensures that patients are referred to a facility capable of providing the level of services

186
required.
Community Living Center
A facility is designated as having VA community living centers available if there are bed days of care in the non-acute nursing home care unit treating specialties in a VA nursing home setting.
Hospital Services Measure Name Description of Data Elements
Unique Patients Unique Patients: This is the total number of unique patients at the national and facility level who received care in a VA or Non-VA setting (VA Care, Non-VA Care, Home Dialysis, Observation Beds, and Pharmacy Only file sources) during the reported timeframe.
Med Surg Hospital Discharges
Med Surg Hospital Discharges: These data are the number of hospital discharges from the acute medicine or surgery discharging bed section specialties in a VA Inpatient setting. It does not include patients discharged from a medicine or surgery observation stay.
Med Surg Hospital Discharges per 1,000
Uniques
Med Surg Hospital Discharges per 1,000 Unique Pts: The rate of acute medicine and surgery VA hospital discharges per 1000 unique patients is calculated for comparative purposes. Total facility unique patients include patients treated in both VA and Non-VA settings (VA Care, Non-VA Care, Home Dialysis, Observation Beds, and Pharmacy Only file sources).
Med Surg ALOS Med Surg LOS: These data are the VA hospital average length of stay for patients who were discharged from acute medicine or surgery bed sections. It does not include patients discharged from observation beds.
Med Surg Bed Days Of Care (BDOC) Per
1,000 Uniques
Med Surg Bed Days of Care Per 1,000 Uniques: These data are the VA hospital total length of stay (bed days of care) for patients who were discharged from an acute medicine or surgery bed section (excluding observation patients). The rate of acute medicine and surgery VA hospital bed days of care per 1000 unique patients is calculated for comparative purposes. Total facility uniques includes patients treated in both VA and Non-VA settings (VA Care, Non-VA Care, Home Dialysis, Observation Beds, and Pharmacy Only file sources).
Mental Health Hospital Discharges
Mental Health Hospital Discharges: These data are the number of hospital discharges from the acute psychiatry discharging bed section specialties in a VA Inpatient setting. It does not include patients who were discharged from psychiatry observation.

187
Mental Health Hospital Discharges per 1,000
Uniques
Mental Health Hospital Discharges per 1,000 Uniques: The rate of acute mental health VA hospital discharges per 1000 unique patients is calculated for comparative purposes. Total facility uniques includes patients treated in both VA and Non-VA settings (VA Care, Non-VA Care, Home Dialysis, Observation Beds, and Pharmacy Only file sources).
Mental Health ALOS Mental Health ALOS: These data are the VA hospital average length of stay for patients who were discharged from an acute psychiatry bed section. It does not include patients discharged from an observation bed.
Mental Health Bed Days Of Care (BDOC)
Per 1,000 Uniques
Mental Health Bed Days of Care Per 1,000 Uniques: These data are the VA hospital total length of stay (bed days of care) for patients who were discharged from an acute psychiatry bed section (excluding observation patients). The rate of acute psychiatry VA hospital bed days of care per 1000 unique patients is calculated for comparative purposes. Total facility uniques includes patients treated in both VA and Non-VA settings (VA Care, Non-VA Care, Home Dialysis, Observation Beds, and Pharmacy Only file sources).
Outpatient Procedures: Endoscopy Data was obtained from the FY2009 National Patient Care Database (NPCD) outpatient encounter file. All encounters containing a CPT procedure code for one of these types of endoscopies were included in the counts [list of CPT codes used available upon request]. This data displays the counts for five types of endoscopic procedures performed at VA facilities during FY 2009. These procedures were performed by VA salaried, fee and contract providers on VA premises. Procedures paid for by VA but performed offsite (community fee) are not included in these counts. Data is only limited by the accuracy of the CPT codes provided on the encounter record.
Measure Name Description of Data Elements Upper GI
Colonoscopy Sigmoidoscopy Bronchoscopy
ENT Endoscopy
Hospital Accreditation Status Measure Name Description of Data Elements
TJC Hospital The Joint Commission Full Accreditation surveys occur on a 3-year cycle which includes a review of multiple applicable programs: e.g., Long Term Care, Hospital, Ambulatory, Behavioral Health, and Home Care programs). The Data is compiled from The Joint
TJC Behavior Health TJC Long Term Care

188
TJC Ambulatory Care Commission Survey reports and reflect the accreditation status as of 2009. TJC Home Care
CARF Accreditation Commission on Accreditation of Rehabilitation Facilities (CARF) accredits specialized treatment facilities for Veterans with spinal cord injury, blindness, traumatic brain injury, serious mental illnesses, and others.
CAP Accreditation Laboratories
Report from Pathology & Laboratory Medicine Service, FY-09. Approximately 250 VA laboratories are accredited by the College of American Pathologists (CAP), The Joint Commission (TJC) or COLA.
Hospital and Facility Services Measure Name Description of Data Elements
Outpatient Visits
Total Outpatient Visits: An outpatient "visit" is used for the purpose of reporting services provided to a Veteran and/or patient in a 24-hour period; for example, the visit of a Veteran to one or more clinics or units within one calendar day at the facility level, including the station number and the suffix identifiers. One visit is one person seen in one day at one station (sta3) or substation (sta6) even if the Veteran has multiple appointments at that same facility on that day.
MD Full-time FTE MD Full-time FTE: This is the staffing of full-time physician FTE (Full Time Equivalent) in VA budget object code 1081 (Physicians-Full Time). This does not include medical residents, trainees, physicians in a without compensation status, or contract physicians.
MD Part-time FTE MD Part-time FTE: This is the staffing of part-time physician FTE (Full Time Equivalent) in VA budget object code 1082 (Physicians-Part Time). This does not include medical residents, trainees, physicians in a without compensation status, or contract physicians.
MD FTE per 1,000 Uniques
MD FTE per 1,000 Uniques: This is the staffing rate of full and part-time physician FTE (Full Time Equivalent) in VA budget object code 1081(Physicians-Full Time) and 1082 (Physicians-Part Time) per 1,000 total facility unique patients. This does not include medical residents, trainees, physicians in a without compensation status, or contract physicians.

189
HPPD data
The HPPD data is obtained from the DSS Nursing Hours/Costs by Ward and Ward Day of Care report. Total Ward Days: the Source data is the DSS NDE WARD and the DSS ALB NDE PAID file. The Ward Hours of Care include the admission and discharge days in the report. Total Patient Ward Hours: The total Hours of actual occupancy time of patients on the selected ward. For example: a patient is on WARD X from 3am until 8am they are credited with 5 ward hours of care on WARD X. if same patient transferred at 8 am to WARD Z and remains there until midnight they will be credited with 19 ward hours on WARD Z. Total Ward Days: Calculation = Total Patient Ward Hours/24. The admission day is counted; the discharge day is counted. If a patient is admitted and discharged in the same day, then the ward hours of care (which is the actual time the patient spent on the unit) is in the ward hours count. Patients with Ward Hours of Care assigned to a MAS observation beds on a regular inpatient ward will be included in the report.
***The HPPD data has not been manipulated or changed from what appears in the DSS HPPD report. Facilities with data that appears significantly skewed (high or low) have been notified and advised to review the data with their local DSS Manager(s) to ensure that labor mapping and ward mapping (“C-Ward tables”) is correct. Additional report definitions and information may be viewed by accessing the DSS report. https://vssc.med.va.gov/dss_ssl/NURSEINP.asp Total Hours per Ward Day: Calculation = Total Nursing Hours/Total Ward Days. RN: Calculation = RN Total Nursing Hours/Total Ward Days. LPN: Calculation = LPN Total Nursing Hours/Total Ward Days. NA: Calculation = NA Total Nursing Hours/Total Ward Days.
Critical Care Units - RNs
Clusters: E8 - Med/Surg ICU Combined; E6 - Cardiac Care Unit; E5 - Neuro ICU; E4 - Medical ICU 2; E3 - Medical ICU 1; E2 - Telemetry ICU; E1 - Surg ICU
Critical Care Units - LPNs
Critical Care Units - Nursing Assistants
(NAs) Medical Units - RNs FT - Ward Neuro; FN - Wards Mixed Med/Int. Med 2; FM - Wards Mixed Med/Int. Med 1; ES -
Ward Gen Med/Acute 4; EP - Wards - Infectious Disease; EO - Wards Rheumatology/Dermatology; EN - Wards Oncology; EM - Ward Gen Med/Acute 3; EL - Ward Gen Med/Acute 2; EK - Ward Gen Med/Acute 1
Medical Units - LPNs
Medical Units - NAs Surgical Units - RNs F5 - Ward Neuro/Neuro Surgery; F4 - Wards Neurosurgery; F3 - Wards - Surgery 3; F2 -

190
Surgical Units - LPNs Wards - Surgery 2; F1 - Wards - Surgery 1 Surgical Units - NAs
Mixed Med/Surg - RNs FL - Ward Mixed Med/Surg/Int. Med 2; FK - Ward Mixed Med/Surg/Int. Med 1; FJ - Wards Mixed Med/Surg/PSI 2; FI - Wards Mixed Med/Surg/PSI 1; FH - Wards Mixed Med/Surg 4; FG - Wards Mixed Med/Surg 3; FF - Wards Mixed Med/Surg 2; FE - Wards Mixed Med/Surg 1
Mixed Med/Surg - LPNs
Mixed Med/Surg - NAs Acute Mental Health -
RNs HM - Wards Psychiatry Acute 4; HL - Wards Psychiatry Acute 3; H6 - Wards Psychiatry Acute 2; H5 - Wards Psychiatry Acute 1; H4 - Wards Psychiatry Mixed Detox 2; H3 - Wards Psychiatry Mixed Detox 1 Acute Mental Health -
LPNs Acute Mental Health -
NAs SCI/D Units - RNs GO - Wards SCI – Surgery; GN - Wards SCI - Ventilator 2 (only); GM - Wards SCI - Ventilator
1 (only); GL - Wards SCI Routine 2; GK - Wards SCI Routine 1 SCI/D Units -LPNs SCI/D Units - NAs
CLCs - RNs G8 - Wards - NHCU Ventilator 2; G7 - Wards - NHCU Ventilator 1; G6 - Wards - Routine NHCU 6; G5 - Wards - Routine NHCU 5; G4 - Wards - Routine NHCU 4; G3 - Wards - Routine NHCU 3; G2 - Wards - Routine NHCU 2; G1 - Wards - Routine NHCU 1
CLCs - LPNs CLCs - NAs
Turnover - RNs The report reflects the Facility total loss rate for Registered Nurse (occupation code 0610) Practical Nurse (LPN/LVN - occupation code 0620) and Nursing Assistant (occupation code 0621) Facility Total Loss Rate – Any loss, retirement, death, termination, voluntary separation or transfer that removes employee from the selected Facility.
Turnover - LPNs
Turnover - NAs
Section 2: Effective
Outpatient Care Composites Measure Name Description of Data Elements
Outpatient Composites: Diabetes
Mellitus
Measures in the Diabetic Composite: DM - Outpatients - HbA1 > 9 or not done (poor control) in past year (HEDIS); DM - Outpatients - LDL-C < 100 (HEDIS); DM - Outpatients - BP LE 140/90; DM - Outpatients - Retinal exam, timely by disease (HEDIS); DM - Outpatients - LDL-C measured (HEDIS) w/ 1 yr review; DM - Outpatients - Renal Testing (HEDIS); DM - Outpatients - HbA1c Annual

191
Outpatient Composites: Prevention
CA - Women age 50-69 screened for Breast Cancer (HEDIS); CA - Women age 21-64 screened for Cervical Cancer in the past 3 yrs (HEDIS); CA - Pts receiving appropriate Colorectal Cancer Screening (HEDIS); P-Immunizations - Pneumococcal Outpatients – Nexus; Immunizations - Outpatients - Influenza ages 50-64 - Nexus Clinics (HEDIS); Immunizations - Outpatients - Influenza ages GE 65 (HEDIS); Mov- Outpatients screened for Obesity
Outpatient Composites: Ischemic
Heart Dz
HTN - Outpatients diagnosis HTN & BP LT 140/90 (HEDIS); AMI - Outpatients LDL-C measured (HEDIS); AMI - Outpatients LDL-C LT 100 (HEDIS)
Outpatient Composites: Tobacco
Tobacco - Outpatients - Pts using tobacco in past yr who have been offered meds; Tobacco- Outpatients - Pts using tobacco in past yr provided w/ counseling on how to quit; Tobacco - Outpatients - Pts using tobacco in past yr offered referral to cessation program
Outpatient Composites:
Behavioral Health Screening
SUD- Outpatients screened annually for Alcohol Misuse; PTSD- Outpatients screened at required intervals for PTSD using the PC-PTSD; MDD- Outpatients screened annually for depression using the PQ2 or PQ9
Hospital Processes of Care Composites Measure Name Description of Data Elements
ORYX Inpatient Composites: Acute
Myocardial Infarction
AMI - Inpatient -ASA w/in 24 hours of admission; AMI - Tobacco - Inpatient Counseling – AMI; AMI - Inpatient –timely reperfusion (VA Measure); AMI - Inpatient -LVEF LT 40 on ACEI or ARB at discharge; AMI - Inpatient -Beta blockers w/in 24 hrs after admission; AMI - Inpatient - LDL - Cholesterol Assessment; AMI - Inpatient - Lipid Lowering Therapy f/ at Risk Pts GE 130; AMI - Inpatient -ASA at discharge; AMI - Inpatient -Beta blockers at discharge; AMI - Inpatient -EKG Timely (VA Measure)
ORYX Inpatient Composites:
Congestive Heart Failure (HF)
HF - Inpatient - LVF assessed or planned at discharge; HF - Inpatient - LVEF LT 40 on ACEI or ARB specific at discharge; HF - Inpatient -Tobacco - Inpatient Counseling – HF; HF - Inpatient - Discharge instructions f/ diet/wt/meds
ORYX Inpatient Composites:
Community acquired pneumonia (CAP)
CAP - Inpatient - O2 Assess in 24 Hours of Arrival; CAP - Inpatient - Appropriate initial antibiotic f/ immunocompromised pt in ICU; CAP - Inpatient - Appropriate initial antibiotic f/ immunocompromised pt Non-ICU; CAP - Inpatient - Influenza vaccination; CAP - Inpatient - Blood Cultures w/in 24 hrs of arrival - Inpatient ICU; CAP - Inpatient - Blood cultures perform in ED prior to 1st antibiotic; CAP - Inpatient - Initial antibiotic w/in 6 hrs of arrival; CAP - Inpatient - pneumococcal screen & or vaccination; CAP –Inpatient- Tobacco - Inpatient Counseling
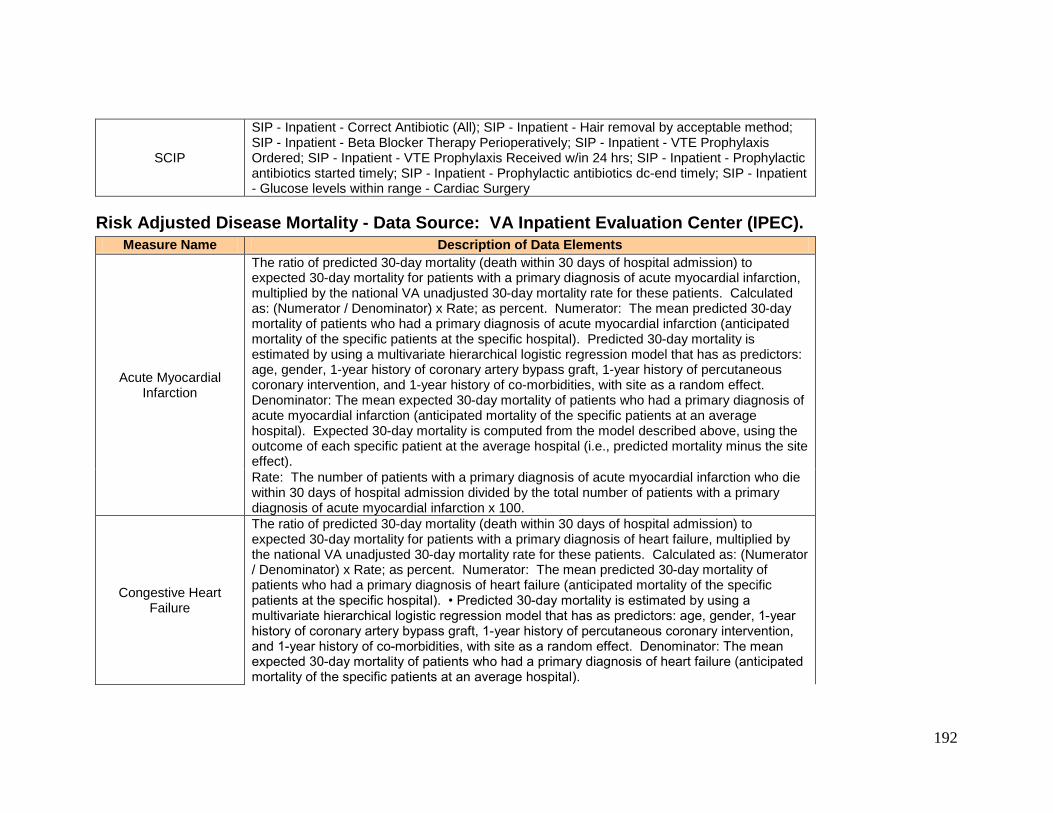
192
SCIP
SIP - Inpatient - Correct Antibiotic (All); SIP - Inpatient - Hair removal by acceptable method; SIP - Inpatient - Beta Blocker Therapy Perioperatively; SIP - Inpatient - VTE Prophylaxis Ordered; SIP - Inpatient - VTE Prophylaxis Received w/in 24 hrs; SIP - Inpatient - Prophylactic antibiotics started timely; SIP - Inpatient - Prophylactic antibiotics dc-end timely; SIP - Inpatient - Glucose levels within range - Cardiac Surgery
Risk Adjusted Disease Mortality - Data Source: VA Inpatient Evaluation Center (IPEC). Measure Name Description of Data Elements
Acute Myocardial Infarction
The ratio of predicted 30-day mortality (death within 30 days of hospital admission) to expected 30-day mortality for patients with a primary diagnosis of acute myocardial infarction, multiplied by the national VA unadjusted 30-day mortality rate for these patients. Calculated as: (Numerator / Denominator) x Rate; as percent. Numerator: The mean predicted 30-day mortality of patients who had a primary diagnosis of acute myocardial infarction (anticipated mortality of the specific patients at the specific hospital). Predicted 30-day mortality is estimated by using a multivariate hierarchical logistic regression model that has as predictors: age, gender, 1-year history of coronary artery bypass graft, 1-year history of percutaneous coronary intervention, and 1-year history of co-morbidities, with site as a random effect. Denominator: The mean expected 30-day mortality of patients who had a primary diagnosis of acute myocardial infarction (anticipated mortality of the specific patients at an average hospital). Expected 30-day mortality is computed from the model described above, using the outcome of each specific patient at the average hospital (i.e., predicted mortality minus the site effect). Rate: The number of patients with a primary diagnosis of acute myocardial infarction who die within 30 days of hospital admission divided by the total number of patients with a primary diagnosis of acute myocardial infarction x 100.
Congestive Heart Failure
The ratio of predicted 30-day mortality (death within 30 days of hospital admission) to expected 30-day mortality for patients with a primary diagnosis of heart failure, multiplied by the national VA unadjusted 30-day mortality rate for these patients. Calculated as: (Numerator / Denominator) x Rate; as percent. Numerator: The mean predicted 30-day mortality of patients who had a primary diagnosis of heart failure (anticipated mortality of the specific patients at the specific hospital). • Predicted 30-day mortality is estimated by using a multivariate hierarchical logistic regression model that has as predictors: age, gender, 1-year history of coronary artery bypass graft, 1-year history of percutaneous coronary intervention, and 1-year history of co-morbidities, with site as a random effect. Denominator: The mean expected 30-day mortality of patients who had a primary diagnosis of heart failure (anticipated mortality of the specific patients at an average hospital).
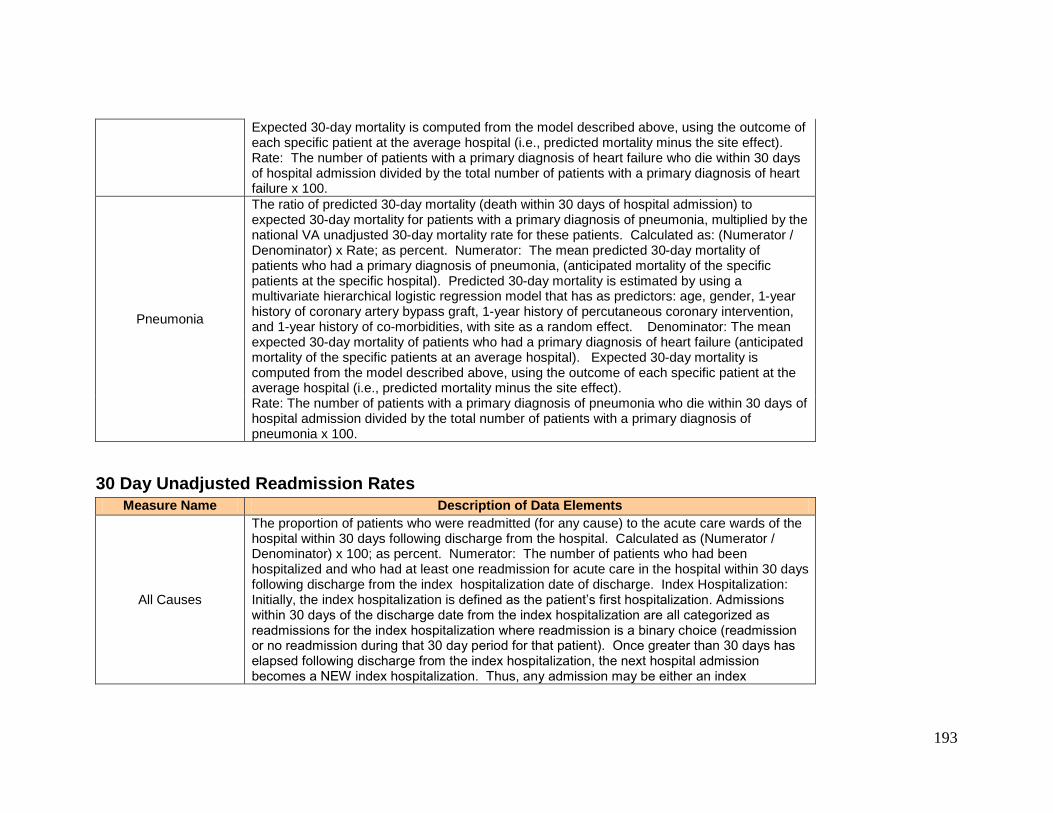
193
Expected 30-day mortality is computed from the model described above, using the outcome of each specific patient at the average hospital (i.e., predicted mortality minus the site effect). Rate: The number of patients with a primary diagnosis of heart failure who die within 30 days of hospital admission divided by the total number of patients with a primary diagnosis of heart failure x 100.
Pneumonia
The ratio of predicted 30-day mortality (death within 30 days of hospital admission) to expected 30-day mortality for patients with a primary diagnosis of pneumonia, multiplied by the national VA unadjusted 30-day mortality rate for these patients. Calculated as: (Numerator / Denominator) x Rate; as percent. Numerator: The mean predicted 30-day mortality of patients who had a primary diagnosis of pneumonia, (anticipated mortality of the specific patients at the specific hospital). Predicted 30-day mortality is estimated by using a multivariate hierarchical logistic regression model that has as predictors: age, gender, 1-year history of coronary artery bypass graft, 1-year history of percutaneous coronary intervention, and 1-year history of co-morbidities, with site as a random effect. Denominator: The mean expected 30-day mortality of patients who had a primary diagnosis of heart failure (anticipated mortality of the specific patients at an average hospital). Expected 30-day mortality is computed from the model described above, using the outcome of each specific patient at the average hospital (i.e., predicted mortality minus the site effect). Rate: The number of patients with a primary diagnosis of pneumonia who die within 30 days of hospital admission divided by the total number of patients with a primary diagnosis of pneumonia x 100.
30 Day Unadjusted Readmission Rates Measure Name Description of Data Elements
All Causes
The proportion of patients who were readmitted (for any cause) to the acute care wards of the hospital within 30 days following discharge from the hospital. Calculated as (Numerator / Denominator) x 100; as percent. Numerator: The number of patients who had been hospitalized and who had at least one readmission for acute care in the hospital within 30 days following discharge from the index hospitalization date of discharge. Index Hospitalization: Initially, the index hospitalization is defined as the patient’s first hospitalization. Admissions within 30 days of the discharge date from the index hospitalization are all categorized as readmissions for the index hospitalization where readmission is a binary choice (readmission or no readmission during that 30 day period for that patient). Once greater than 30 days has elapsed following discharge from the index hospitalization, the next hospital admission becomes a NEW index hospitalization. Thus, any admission may be either an index
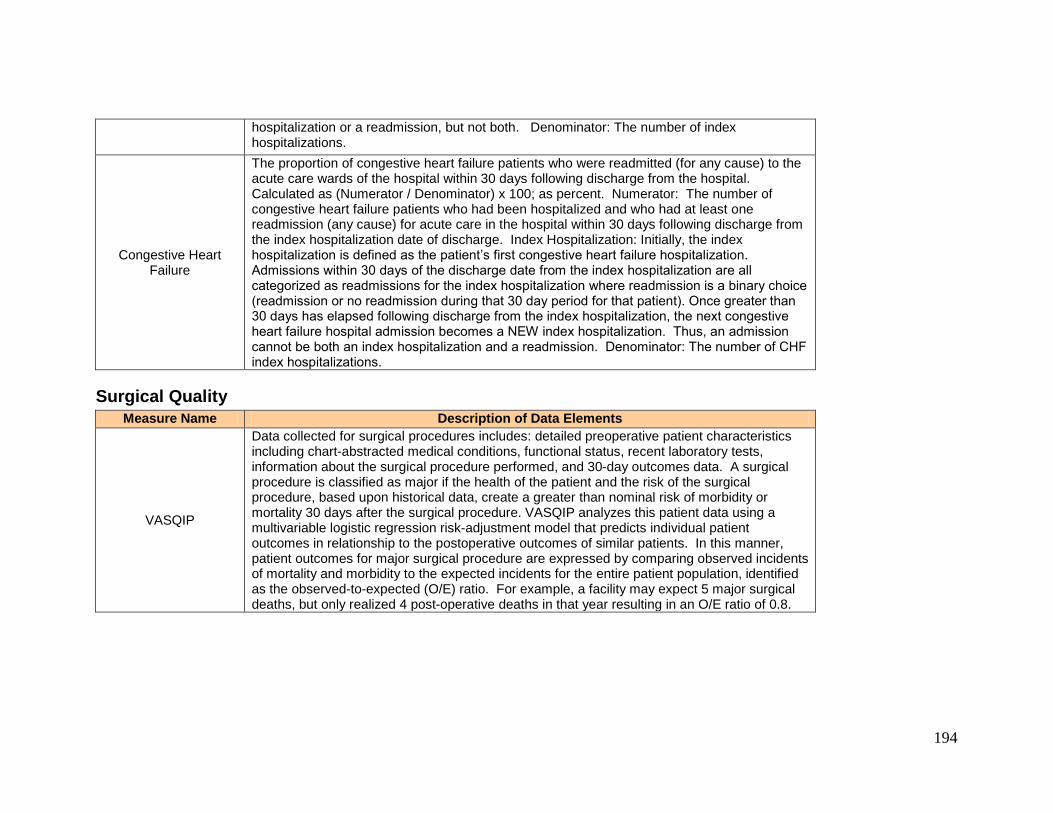
194
hospitalization or a readmission, but not both. Denominator: The number of index hospitalizations.
Congestive Heart Failure
The proportion of congestive heart failure patients who were readmitted (for any cause) to the acute care wards of the hospital within 30 days following discharge from the hospital. Calculated as (Numerator / Denominator) x 100; as percent. Numerator: The number of congestive heart failure patients who had been hospitalized and who had at least one readmission (any cause) for acute care in the hospital within 30 days following discharge from the index hospitalization date of discharge. Index Hospitalization: Initially, the index hospitalization is defined as the patient’s first congestive heart failure hospitalization. Admissions within 30 days of the discharge date from the index hospitalization are all categorized as readmissions for the index hospitalization where readmission is a binary choice (readmission or no readmission during that 30 day period for that patient). Once greater than 30 days has elapsed following discharge from the index hospitalization, the next congestive heart failure hospital admission becomes a NEW index hospitalization. Thus, an admission cannot be both an index hospitalization and a readmission. Denominator: The number of CHF index hospitalizations.
Surgical Quality Measure Name Description of Data Elements
VASQIP
Data collected for surgical procedures includes: detailed preoperative patient characteristics including chart-abstracted medical conditions, functional status, recent laboratory tests, information about the surgical procedure performed, and 30-day outcomes data. A surgical procedure is classified as major if the health of the patient and the risk of the surgical procedure, based upon historical data, create a greater than nominal risk of morbidity or mortality 30 days after the surgical procedure. VASQIP analyzes this patient data using a multivariable logistic regression risk-adjustment model that predicts individual patient outcomes in relationship to the postoperative outcomes of similar patients. In this manner, patient outcomes for major surgical procedure are expressed by comparing observed incidents of mortality and morbidity to the expected incidents for the entire patient population, identified as the observed-to-expected (O/E) ratio. For example, a facility may expect 5 major surgical deaths, but only realized 4 post-operative deaths in that year resulting in an O/E ratio of 0.8.

Section 3: Equitable
Gender: female, male Data source: External Peer Review Program (EPRP) outpatient samples in FY2009; includes women oversamples. Scores are weighted. Diabetes Composite: Diabetes measure HbA1 GT 9 or not done (poor control) in past year (DMG23H) is reversed to reflect higher performance is better. Stratified results are not shown if at least one of the Gender categories has less than 30 cases for a given composite. Prevention Composite excludes preventive measures specific to women (Breast Cancer and Cervical Cancer screenings).
195
Measure Name Description of Data Elements Diabetes Mellitus
Prevention Ischemic Heart
Disease Tobacco
Behavioral Health Screening
Age, <65 Years of Age; 65-75 Years of Age Data source: External Peer Review Program (EPRP) outpatient samples in FY2009; includes individuals with ages <=75. Scores are weighted. Diabetes Composite: Diabetes measure HbA1 GT 9 or not done (poor control) in past year (DMG23H) is reversed to reflect higher performance is better. Stratified results are not shown if a least one of the Age categories has less than 30 cases for a given composite. Prevention Composite excludes preventive measures specific to women (Breast Cancer and Cervical Cancer screenings).
Measure Name Description of Data Elements Diabetes Mellitus
Prevention Ischemic Heart
Disease Tobacco
Behavioral Health Screening

Satisfaction with Inpatient Care by Race/Ethnicity
196
Measure Name Description of Data Elements White
African American Other
Satisfaction with Outpatient Care by Race Measure Name Description of Data Elements
White African American
Other
Section 4: Safe Care
Healthcare Associated Infections - Data Source: VA Inpatient Evaluation Center (IPEC) Data Management website (self-reported).
Measure Name Description of Data Elements
Ventilator Associated Pneumonia
Ventilator Associated Pneumonia (VAP) Infection Rate = (numerator/denominator) x 100. Numerator: The number of VAP infections (ICU). Denominator: The number of ventilator days.
Central Line Associated Bacteremia
Central Line Associated Bloodstream (CLAB) Infection Rate = (numerator/denominator) x 100. Numerator: The number of central line infections. Denominator: The number of central line days.
ICU MRSA MRSA ICU Infection Rate (numerator/denominator) x 100. Numerator: Total number of MRSA infections (culture positive). Denominator: Bed days of care.
Acute Care MRSA MRSA Infection Rate (Acute care ward) = (numerator/denominator) x 100. Numerator: Total number of MRSA infections (culture positive). Denominator: Bed days of care.

197
ICU MRSA Screening Rate
MRSA Composite Screening Rate (ICU only) = (numerator/denominator) x 100. Numerator: Total number of indicated nasal screens for MRSA performed timely. Denominator: Total number of indicated nasal screens for MRSA. Timely Swab: Nasal screening must be completed within 24 hours upon admission or transfer in to the unit (24 hours reflects prior to or after arrival on the unit) AND on exit from the unit.
Acute Care MRSA Screen Rate
MRSA Composite Screening Rate (Acute care wards) = (numerator/denominator) x 100. Numerator: Total number of indicated nasal screens for MRSA performed timely. Denominator: Total number of indicated nasal screens for MRSA. Timely Swab: Nasal screening must be completed within 24 hours upon admission or transfer in to the unit (24 hours reflects prior to or after arrival on the unit) AND on exit from the unit.
Other - Data Source: VA Inpatient Evaluation Center (IPEC). Measure Name Description of Data Elements
ICU Risk Adjusted Length of Stay
ICU Risk Adjusted Length of Stay (OMELOS): OMELOS is “observed minus expected length of stay” and is risk adjusted by the IPEC. The average observed patient-level unit length of stay minus expected patient-level unit length of stay for ICU stays at a given facility. If the OMELOS is less than zero, then observed unit length of stay is less than expected. If the OMELOS is greater than zero, then the observed unit length of stay is greater than expected.
Insulin Induced Hypoglycemia -
BS<45 mg/dl
Insulin Induced Hypoglycemia BS<45 mg/dl: The percentage of patient-days in the ICU, for patients with orders written for insulin or other hypoglycemic agents, with any glucose measurements less than or equal to 45 mg/dL. Calculated as (numerator / denominator) x 100; as percent. Numerator: The total number of ICU patient-days, for patients with orders written for insulin or other hypoglycemic agents (VA Drug Class HS501 or HS502) between 8 hours before hospital admission (e.g., orders written in the ED) and unit discharge, with any glucose measurements less than or equal to 45 mg/dL. Denominator: The total number of ICU patient-days for patients with orders written for insulin or other hypoglycemic agents (VA Drug Class HS501 or HS502) between 8 hours before hospital admission (e.g., orders written in the ED) and unit discharge.
Insulin Induced Hypoglycemia -
BS<60 mg/dl
Insulin Induced Hypoglycemia BS<60 mg/dl: The percentage of patient-days in the ICU, for patients with orders written for insulin or other hypoglycemic agents, with any glucose measurements less than or equal to 60 mg/dL. Calculated as (numerator / denominator) x 100; as percent. Numerator: The total number of ICU patient-days, for patients with orders written for insulin or other hypoglycemic agents (VA Drug Class HS501 or HS502) between 8 hours before hospital admission (e.g., orders written in the ED) and unit discharge, with any glucose measurements less than or equal to 60 mg/dL. Denominator: The total number of ICU
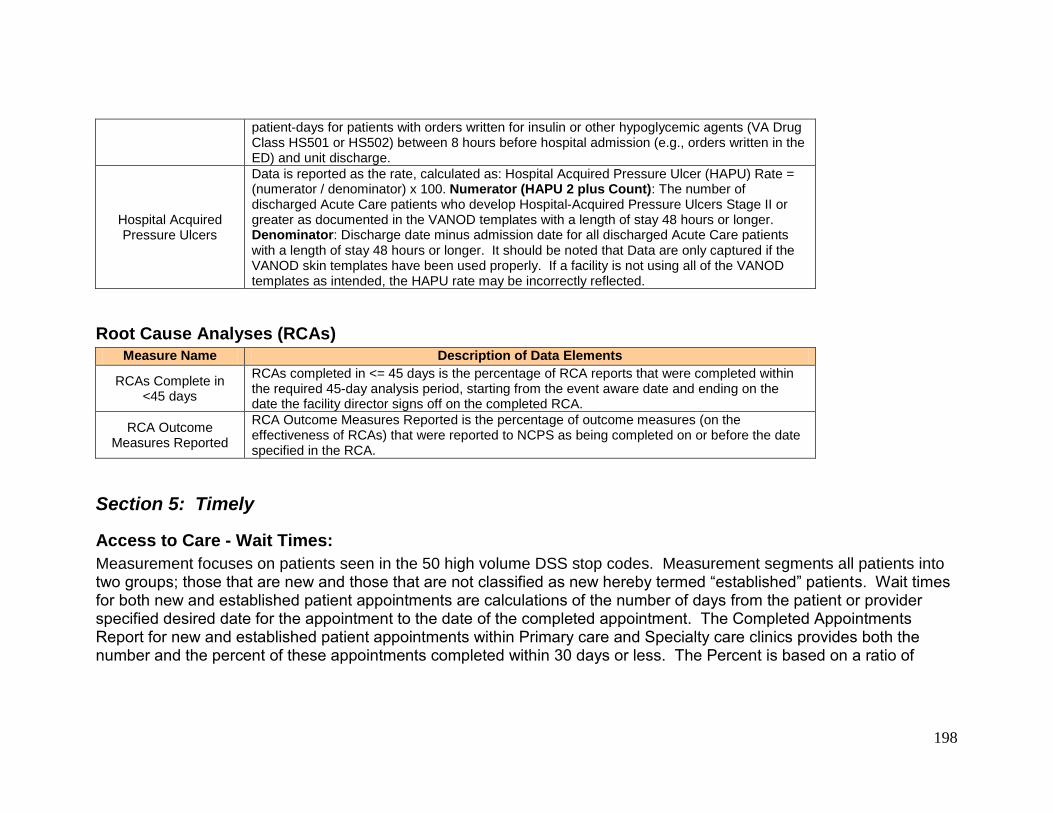
198
patient-days for patients with orders written for insulin or other hypoglycemic agents (VA Drug Class HS501 or HS502) between 8 hours before hospital admission (e.g., orders written in the ED) and unit discharge.
Hospital Acquired Pressure Ulcers
Data is reported as the rate, calculated as: Hospital Acquired Pressure Ulcer (HAPU) Rate = (numerator / denominator) x 100. Numerator (HAPU 2 plus Count): The number of discharged Acute Care patients who develop Hospital-Acquired Pressure Ulcers Stage II or greater as documented in the VANOD templates with a length of stay 48 hours or longer. Denominator: Discharge date minus admission date for all discharged Acute Care patients with a length of stay 48 hours or longer. It should be noted that Data are only captured if the VANOD skin templates have been used properly. If a facility is not using all of the VANOD templates as intended, the HAPU rate may be incorrectly reflected.
Root Cause Analyses (RCAs) Measure Name Description of Data Elements
RCAs Complete in <45 days
RCAs completed in <= 45 days is the percentage of RCA reports that were completed within the required 45-day analysis period, starting from the event aware date and ending on the date the facility director signs off on the completed RCA.
RCA Outcome Measures Reported
RCA Outcome Measures Reported is the percentage of outcome measures (on the effectiveness of RCAs) that were reported to NCPS as being completed on or before the date specified in the RCA.
Section 5: Timely
Access to Care - Wait Times: Measurement focuses on patients seen in the 50 high volume DSS stop codes. Measurement segments all patients into two groups; those that are new and those that are not classified as new hereby termed “established” patients. Wait times for both new and established patient appointments are calculations of the number of days from the patient or provider specified desired date for the appointment to the date of the completed appointment. The Completed Appointments Report for new and established patient appointments within Primary care and Specialty care clinics provides both the number and the percent of these appointments completed within 30 days or less. The Percent is based on a ratio of

appointments 30 days & under divided by all completed appointments. Data Sources: The Patient Appointment package in VISTA, which is commonly referred to as PAIT, is the main data source for this report.
199
Measure Name Description of Data Elements Primary Care patients seen within 30 days
Percentage completed in 30 days or less
Specialty Care patients seen within
30 days Percentage completed
in 30 days or less

Section 6: Patient Centered Care (Source for data is SHEP survey data for inpatient and outpatient care.)
200
Measure Name Description of Data Elements
Overall rating of hospital
Please answer the following questions about your stay at the hospital named on the cover. Do not include any other hospital stays in your answer. Question 21. Using any number from 0 to 10, where 0 is the worst hospital possible and 10 is the best hospital possible, what number would you use to rate this hospital during your stay? Question 21 has the following response scale: 0, 1, 2, 3, 4, 5, 6, 7, 8, 9, 10. The reporting measure is calculated as the percentage of responses that fall in the top two categories (9, 10).
Communication with Nurses
Question 1. During this hospital stay, how often did nurses treat you with courtesy and respect?Question 2. During this hospital stay, how often did nurses listen carefully to you?Question 3. During this hospital stay, how often did nurses explain things in a way you could understand? Questions 1, 2, and 3 have the following response scale: Never, Sometimes, Usually, Always.The score on each item is calculated as the percentage of responses that fall in the top two categories (Usually, Always).Communication with Nurses is then calculated as the average of the site's scores on the three items.
Communication with Doctors
Question 5. During this hospital stay, how often did doctors treat you with courtesy and respect? Question 6. During this hospital stay, how often did doctors listen carefully to you? Question 7. During this hospital stay, how often did doctors explain things in a way you could understand? Questions 5, 6, and 7 have the following response scale: Never, Sometimes, Usually, Always. The score on each item is calculated as the percentage of responses that fall in the top two categories (Usually, Always). Communication with Doctors is then calculated as the average of the site's scores on the three items.

201
Communication about medications
Question 16. Before giving you any new medicine, how often did hospital staff tell you what the medicine was for? Question 17. Before giving you any new medicine, how often did hospital staff describe possible side effects in a way you could understand? Filter: Question 15. During this hospital stay, were you given any medicine that you had not taken before? [Response options: Yes, No] Responses to Questions 16 and 17 were used only if response to Question 15 was 'Yes' or blank. Questions 16 and 17 have the following response scale: Never, Sometimes, Usually, Always. The score on each item is calculated as the percentage of responses that fall in the top two categories (Usually, Always). Communication about Medication is then calculated as the average of the site's scores on the two items.
Nursing Services
Question 4. During this hospital stay, after you pressed the call button, how often did you get help as soon as you wanted it? Question 11. How often did you get help in getting to the bathroom or in using a bedpan as soon as you wanted? Filter: Question 10. During this hospital stay, did you need help from nurses or other hospital staff in getting to the bathroom or in using a bedpan? [Response options: Yes, No] Responses to Question 11 were used only if response to Question 10 was 'Yes' or blank. Question 4 has the following response scale: Never, Sometimes, Usually, Always, I never pressed the call button. The score on Question 4 is calculated as the percentage of responses that fall in the top two categories (Usually, Always); responses of 'I never pressed the call button' are excluded from the denominator in the calculation of this percentage. Question 11 has the following response scale: Never, Sometimes, Usually, Always. The score on Question 11 is calculated as the percentage of responses that fall in the top two categories (Usually, Always). Nursing Services is then calculated as the average of the site's scores on the two items.

202
Discharge Information
Question 19. During this hospital stay, did doctors, nurses or other hospital staff talk with you about whether you would have the help you needed when you left the hospital?Question 20. During this hospital stay, did you get information in writing about what symptoms or health problems to look out for after you left the hospital? Filter: Question 18. After you left the hospital, did you go directly to your own home, to someone else’s home, or to another health facility?[Response options: Own home, Someone else’s home, Another health facility]Responses to Questions 19 and 20 were used only if response to Question 18 was 'Own home,' 'Someone else's home,' or blank.Questions 19 and 20 have the following response scale: Yes, No.The score on each item is calculated as the percentage of 'Yes' responses.Discharge Information is then calculated as the average of the site's scores on the two items.
Pain Control
Question 13. During this hospital stay, how often was your pain well controlled? Question 14. During this hospital stay, how often did the hospital staff do everything they could to help you with your pain? Filter: Question 12. During this hospital stay, did you need medicine for pain? [Response options: Yes, No] Responses to Questions 13 and 14 were used only if response to Question 12 was 'Yes' or blank. Questions 13 and 14 have the following response scale: Never, Sometimes, Usually, Always. The score on each item is calculated as the percentage of responses that fall in the top two categories (Usually, Always). Pain Control is then calculated as the average of the site's scores on the two items.
Cleanliness of Hospital Environment
Question 8. During this hospital stay, how often were your room and bathroom kept clean? Question 8 has the following response scale: Never, Sometimes, Usually, Always. The reporting measure is calculated as the percentage of responses that fall in the top two categories (Usually, Always).
Quietness of Hospital Environment
Question 9. During this hospital stay, how often was the area around your room quiet at night? Question 9 has the following response scale: Never, Sometimes, Usually, Always. The reporting measure is calculated as the percentage of responses that fall in the top two categories (Usually, Always).
Willingness to Recommend Hospital
Question 22. Would you recommend this hospital to your friends and family? Question 22 has the following response scale: Definitely no, Probably no, Probably yes, Definitely yes. The reporting measure is calculated as the percentage of responses in the top category (Definitely yes).

203
Overall Satisfaction
Question 45. Using any number from 0 to 10, where 0 is the worst health care possible and 10 is the best health care possible, what number would you use to rate all your health care in the last 12 months? Question 45 has the following response scale: 0, 1, 2, 3, 4, 5, 6, 7, 8, 9, 10. The reporting measure is calculated as the percentage of responses that fall in the top two categories (9, 10).
Getting Needed Care
Question 47. In the past 12 months, how often was it easy to get the care, tests or treatment you thought you needed through VA?Filter: Question 46. In the past 12 months, did you try to get any care, tests or treatment through VA? [Response options: Yes, No]Response to Question 47 was used only if response to Question 46 was 'yes' or blank.Question 49. In the last 12 months, how often was it easy to get appointments with specialists?Filter: Question 48. Specialists are doctors like surgeons, heart doctors, allergy doctors, skin doctors, and other doctors who specialize in one area of health care. In the last 12 months, did you try to make any appointments to see a specialist? [Response options: Yes, No]Response to Question 49 was used only if response to Question 48 was 'yes' or blank. Questions 47 and 49 have the following response scale: Never, Sometimes, Usually, Always.The score on each item is calculated as the percentage of responses that fall in the top two categories (Usually, Always). Getting Needed Care is then calculated as the average of the site's scores on the two items.
Getting Care Quickly
Question 31. In the last 12 months, when you needed care right away, how often did you get care as soon as you thought you needed? Filter: Question 30. In the last 12 months, did you have an illness, injury, or condition that needed care right away in a clinic, emergency room, or doctor’s office? [Response options: Yes, No] Response to Question 31 was used only if response to Question 30 was 'yes' or blank.
Question 35. In the past 12 months, not counting the times you needed care right away, how often did you get an appointment as soon as you thought you needed? Filter: Question 34. In the last 12 months, not counting the times you needed care right away, did you make any appointments for your health care at a doctor’s office or clinic? [Response options: Yes, No] Response to Question 35 was used only if response to Question 34 was 'yes' or blank. Questions 31 and 35 have the following response scale: Never, Sometimes, Usually, Always. The score on each item is calculated as the percentage of responses that fall in the top two categories (Usually, Always). Getting Care Quickly is then calculated as the average of the site's scores on the two items.
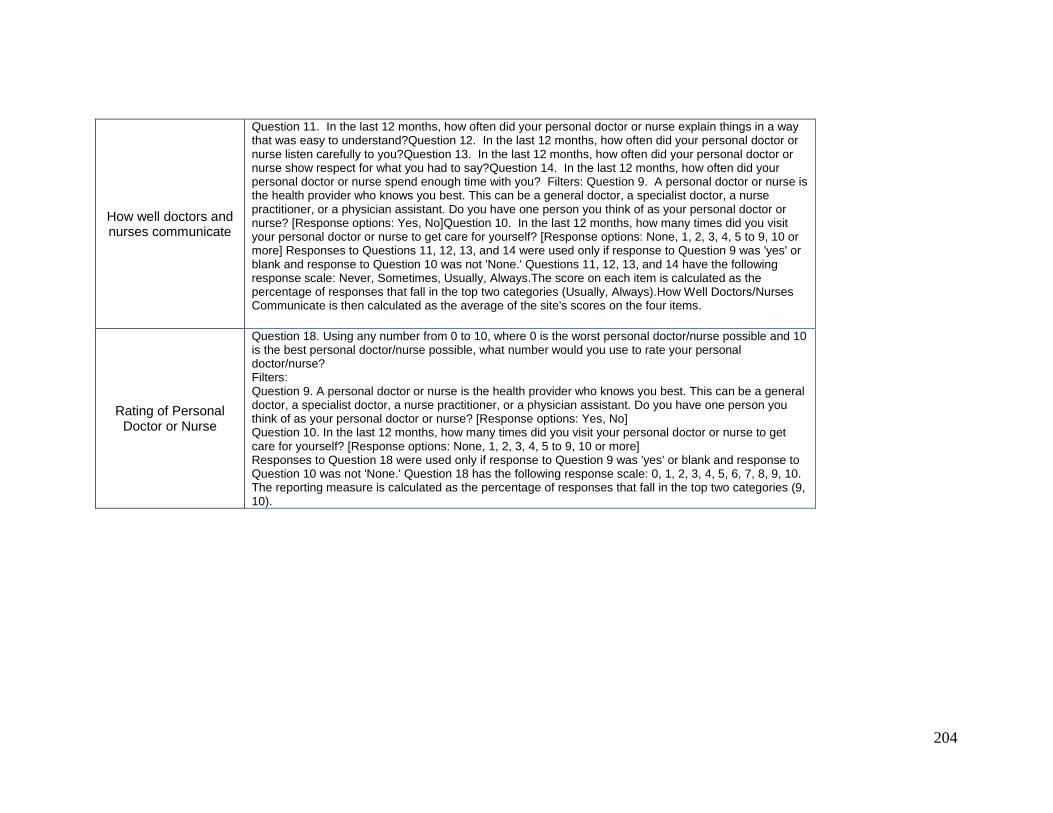
204
How well doctors and nurses communicate
Question 11. In the last 12 months, how often did your personal doctor or nurse explain things in a way that was easy to understand?Question 12. In the last 12 months, how often did your personal doctor or nurse listen carefully to you?Question 13. In the last 12 months, how often did your personal doctor or nurse show respect for what you had to say?Question 14. In the last 12 months, how often did your personal doctor or nurse spend enough time with you? Filters: Question 9. A personal doctor or nurse is the health provider who knows you best. This can be a general doctor, a specialist doctor, a nurse practitioner, or a physician assistant. Do you have one person you think of as your personal doctor or nurse? [Response options: Yes, No]Question 10. In the last 12 months, how many times did you visit your personal doctor or nurse to get care for yourself? [Response options: None, 1, 2, 3, 4, 5 to 9, 10 or more] Responses to Questions 11, 12, 13, and 14 were used only if response to Question 9 was 'yes' or blank and response to Question 10 was not 'None.' Questions 11, 12, 13, and 14 have the following response scale: Never, Sometimes, Usually, Always.The score on each item is calculated as the percentage of responses that fall in the top two categories (Usually, Always).How Well Doctors/Nurses Communicate is then calculated as the average of the site's scores on the four items.
Rating of Personal Doctor or Nurse
Question 18. Using any number from 0 to 10, where 0 is the worst personal doctor/nurse possible and 10 is the best personal doctor/nurse possible, what number would you use to rate your personal doctor/nurse? Filters: Question 9. A personal doctor or nurse is the health provider who knows you best. This can be a general doctor, a specialist doctor, a nurse practitioner, or a physician assistant. Do you have one person you think of as your personal doctor or nurse? [Response options: Yes, No] Question 10. In the last 12 months, how many times did you visit your personal doctor or nurse to get care for yourself? [Response options: None, 1, 2, 3, 4, 5 to 9, 10 or more] Responses to Question 18 were used only if response to Question 9 was 'yes' or blank and response to Question 10 was not 'None.' Question 18 has the following response scale: 0, 1, 2, 3, 4, 5, 6, 7, 8, 9, 10. The reporting measure is calculated as the percentage of responses that fall in the top two categories (9, 10).

Section 7: Efficient
Ambulatory Care Sensitive Conditions (ACSC) Hospitalizations
205
Measure Name Description of Data Elements
All 12 Conditions # per 1000 ACSC
Patients
All 12 ACSC Conditions: Hospitalizations per 1000 ACSC Patients: This is the rate of ACSC hospitalizations per 1000 unique ACSC patients during Fiscal Year 2009. A total of 130 ICD-9 diagnosis codes associated with the 12 ACSCs listed previously were used to identify all patients with any of the ACSCs (see code detail at http://www.qualityindicators.ahrq.gov/pqi_download.htm ) in any position in the inpatient, outpatient, and Fee/Contract files. Avoidable or ACSC hospitalizations were identified by matching these 130 ICD-9 codes to the principal diagnosis in the inpatient main files (certain CHF and pneumonia admissions are excluded according to AHRQ's algorithm). ACSC patients and hospitalizations were then assigned to facilities by their assignment to an associated Primary Care Provider (PCP).
Congestive Heart Failure (CHF) # per 1000 CHF Patients
Congestive Heart Failure (CHF): Hospitalizations per 1000 CHF ACSC Patients: This is the rate of CHF ACSC hospitalizations per 1000 unique CHF ACSC patients during Fiscal Year 2009. A total of 25 ICD-9 diagnosis codes associated with the CHF ACSCs were used to identify all patients with any of the ACSCs (see code detail at http://www.qualityindicators.ahrq.gov/pqi_download.htm ) in any position in the inpatient, outpatient, and Fee/Contract files. Avoidable or ACSC hospitalizations were identified by matching these 25 ICD-9 codes to the principal diagnosis in the inpatient main files (certain CHF admissions are excluded according to AHRQ's algorithm). CHF ACSC patients and hospitalizations were then assigned to facilities by their assignment to an associated Primary Care Provider (PCP).
Pneumonia # per 1000 Pneumonia
Patients
Pneumonia: Hospitalizations per 1000 Pneumonia ACSC Patients: This is the rate of bacterial pneumonia ACSC hospitalizations per 1000 unique bacterial pneumonia ACSC patients during Fiscal Year 2009. A total of 12 ICD-9 diagnosis codes associated with the bacterial pneumonia ACSCs were used to identify all patients with any of the ACSCs (see code detail at http://www.qualityindicators.ahrq.gov/pqi_download.htm) in any position in the inpatient, outpatient, and Fee/Contract files. Avoidable or ACSC hospitalizations were identified by matching these 12 ICD-9 codes to the principal diagnosis in the inpatient main files (certain pneumonia admissions are excluded according to the AHRQ's algorithm). Bacterial Pneumonia ACSC patients and hospitalizations were then assigned to facilities by their assignment to an associated Primary Care Provider (PCP).