Aurora Loan Services v Weisblum Respondents Brief 22 Oct 2010
171 october/december 2015
Self-ascribed indigenous respondents in the 2010 Mexican census: Ethnic ... / G. VÁZQUEZ y M. F. QUEZADA
Abstract
More than 15 million people ascribed themselves as indigenous in the 2010 Mexican popula-tion and housing census; this represents 15% of total national population that year. This figure increased almost threefold during the 2000-2010 period, and it became the highest indigenous population censual volume since 1930. The present article discusses explanations for the pheno-menon, such as the revitalization of ethnicity, the different ways to formulate census questions, censual quality, and demographic growth. The body of evidence suggests that the wording of the relevant question in the 2010 census, which referred the ethnic issue to “culture”, turned out to be more permissive for the population to ascribe themselves as indigenous, and therefore its volume was overestimated.
Keywords: indigenous people, indigenous language speakers, ethnic belonging, cultural belon-ging, census.
Resumen
A partir de los resultados del censo mexicano de población y vivienda de 2010, la población autoadscrita como indígena sumó más de 15 millones, es decir, representó 15 por ciento de la po-blación nacional de ese año. Esta cifra casi se triplicó en el periodo 2000-2010 y se convirtió en el volumen censal más alto de la población indígena desde 1930. En el presente artículo se discuten distintas explicaciones posibles al fenómeno, como son la revitalización de lo étnico, las diferen-tes formulaciones de las preguntas censales, la calidad censal y el crecimiento demográfico. El cúmulo de la evidencia apunta a que fue la formulación de la pregunta del 2010, que al referir la condición étnica a la “cultura”, resultó más permisiva para que la población se autoadscribiera como indígena y sobreestimó su volumen.
Palabras clave: Indígenas, hablantes de lengua indígena, pertenencia étnica, pertenencia a una cultura, censos.
Germán VÁZQUEZ SANDRIN y María Félix QUEZADA
Universidad Autonoma del Estado de Hidalgo
Self-ascribed indigenous respondents in the 2010 Mexican census: Ethnic revitalization or censual over-
estimation?

172
Papeles de POBLACIÓN No. 86 CIEAP/UAEM
IntroductIon
T he number of people over five years old who reported themsel-ves as belonging to an indigenous group in the survey carried out in the context of the 2000 Mexican census was more than five
million; ten years later, this number increased to more than 15 million. This represents a 2.8-fold increase in one decade. The annual average growth rates during the intercensal period was 10.7 percent, which is equivalent to saying that the self-ascribed population doubles every 7.5 years. The per-centage of people over five years of age from the total national population who ascribed themselves as indigenous increased from six to 15% from 2000 to 2010. This is the highest volume of indigenous population registe-red in a Mexican census since 1930. As described by the authors, there are four elements that could explain the unusually rapid population increase: I) ethnicity was revitalized during the period, ii) the permissive effect of the question as formulated in 2010 referring to an indigenous “culture”, iii) the quality of the 2000 and 2010 censuses data, and iv) demographic growth.
The aim of the present article is to point out the differences in indi-genous population counting as a result of the self-ascription questions in the 2000 and 2010 censuses. Our hypothesis is that phrasing differences between the 2010 question and the 2000 question explain much of the in-crease in the figures, rather than an ethnic revitalization process as propo-sed by Fernández (2011). The question about self-adscription used in the extended questionnaire changed significantly between the 2000 and 2010 censuses. In 2000, referring to each person over five years of age in the household, respondents were asked: Is (NAME) is Nahuatl, Maya, Zapo-tec, Mixtec, or belongs to another indigenous group? In 2010, the extended questionnaire included the following question referred to people over three years of age: Based on (NAME)’s culture, does he or she consider himself or herself as indigenous?
The present study sets forth from the premise that the different phra-sing of the census questions, designed to identify indigenous population, does not a priori invalidate the comparability of their results because both questions have exactly the same purpose: to measure the individual’s self-ascription or sense of belonging. Indeed, one of the intentions of the pre-sent article is to demonstrate that the word “culture” resulted in ethnic overstatement, which can be verified only by contrasting both questions (ethnic belonging in 2000 and ethnic self-ascription in 2010).

173 october/december 2015
Self-ascribed indigenous respondents in the 2010 Mexican census: Ethnic ... / G. VÁZQUEZ y M. F. QUEZADA
The document is divided in five parts. The first part examines the re-vitalization of indigenous identity and manifestations of ethnic revival in Mexico from 2000 to 2010 as factors that can in fact explain the increased percentage of Mexican population who ascribed themselves as part of an indigenous culture as reported by the 2010 census extended questionnaire. The second part analyzes total population trends of indigenous belonging obtained through the different questions used in the most recent censuses in Latin America. The third part presents the results of a quality evalua-tion focused on the 2000 and 2010 Mexican censuses using three indices: United Nations, Whipple, and Myers-Briggs. The fourth section presents sociodemographic characteristics of the 2000 and 2010 censuses popula-tions; it was found that the characteristics of people surveyed in 2000 are closer to those of indigenous language speakers (ILS) than those surveyed in 2010.
revItalIzatIon of ethnIcIty In MexIco
Patricia Fernandez (2011) indicates that the 2010 census results showed a high proportion (58.3 percent) of people who declared themselves to be indigenous but failed to speak an indigenous language, which suggested that the country was in the midst of a period of ethnic revitalization. That statement provided grounds to investigate if Mexico was indeed in such process, or rather, conceptual issues concerning the censual question were involved in the explanation behind the high proportion of self-ascribed indigenous people indicated by the author.
In Mexico, there were two phenomena that could have been playing an important role in reappraising the indigenous world: i) the recognition of indigenous peoples’ rights and ii) the Zapatista movement. This is in line with Alicia Barabas (2004: 2), who pointed out the existence of ethnic linguistic and cultural revitalization processes taking place among ethnic groups throughout the country—especially in urban contexts and built upon a new dignity of being indigenous—occurring after the emergence of the Zapatista movement in Chiapas. This seemed to be a revision of hundreds of years of internalization of the stigma associated with indige-nous identities and cultures by non-indigenous society and accepted by the victims of the process. According to Barabas, the enactment of state laws favorable for indigenous peoples and the establishment of funding for recognized ethnic groups were also behind the identity resurgence (2004).

174
Papeles de POBLACIÓN No. 86 CIEAP/UAEM
the acknowledgeMent of IndIgenous peoples’ rIghts
One of the first international norms adopted by the Mexican government concerning indigenous rights was the Indigenous and Tribal Peoples Con-vention in Independent Countries published by the International Labor Or-ganization (ILO Convention 169, or C169). The convention represented a legal instrument on indigenous matters and provided a definition of the indigenous individual (Carbonell, 2004). Additionally, according to Ben-goa, the Convention asserted the concept of indigenous peoples as the most adequate to deal with indigenous issues at the international level and was a turning point in the way to reflect on indigenous peoples because the groups’ awareness of themselves was highlighted in determining whether they are indigenous or not (2007: 274).
The Convention was approved by the Mexican congress in July 1990 and published in the Official Journal of the Federation on August 3. Fi-nally, the President of the Republic ratified the C169 on August 13. Fo-llowing the ratification, the fourth article of the national constitution was amended on January 28 1992, and the country was officially proclaimed as a multicultural nation. However, in accordance with Burguette and Gómez (2008), the reform was not regulated, it was applied only in part, and not all local constitutions were amended in acknowledgement of the multicultural nature of the federal entities. On the other hand, the Federal District and federal criminal codes were modified to include customary law in cases in which the indicted person had indigenous origins. Finally, indigenous language court interpreters were approved.
The Zapatista Army of National Liberation (EZLN) emerged in Chiapas in 1994. In February 1996, Ernesto Zedillo’s administration signed the San Andrés Larráinzar agreements. These agreements became a constitutional amendment proposal centered on indigenous culture and rights drafted by the Commission for Concord and Pacification (COCOPA)1. COCOPA’s project was approved by the EZLN, but the executive power reformed the proposal and the EZLN walked away from the negotiations. Vicente Fox, Mexican president at the time, sent the COCOPA initiative to congress in December 2000, where it was further modified. Congress approved the so-called indigenous act in July 2001, and the EZLN accused the govern-ment of “treason”. The constitutional amendments were published in the Official Journal of the Federation on August 14 2001. The ethnic theme was abrogated from the fourth article and it was included and extended in
1 Plural parliamentary commission created in December 2004.

175 october/december 2015
Self-ascribed indigenous respondents in the 2010 Mexican census: Ethnic ... / G. VÁZQUEZ y M. F. QUEZADA
the second article. Additionally, a second and third paragraphs were inclu-ded in the first article, a sixth paragraph was added to article 18, and a last paragraph was added to the third fraction of article 115. The second article reproduces the definition of indigenous peoples included in ILO’s C169 and adds a definition of indigenous community. Fraction A of the second article recognizes and gives indigenous communities the right to self-de-termination and autonomy concerning their social organization practices, and fraction B establishes the promotion of public policy focused on indi-genous peoples as a function of federal, state, and municipal governments.
Criticism of the constitutional recognition of indigenous rights inclu-des the relevant regulation being left to local congresses and autonomy being applied only at the municipal level. This reform served the State to advance its institutions in the framework of neoliberal policies (Burguete & Gomez, 2008; Valladares, 2003). Additionally, López Bárcenas points out that placing indigenous peoples and communities at the same hierar-chical level was a mistake: indigenous peoples should have been better recognized as the subject of law before the State and indigenous communi-ties as public right entities belonging to indigenous peoples. Additionally, the author writes that the definition of community can be limited because there are communities settled in more than one territory, for instance mi-grant communities, although they make up a single social unit (2000: 219). Another demand concerns the ethnic common law basis establishing that indigenous peoples recognize their own authorities; the author proposes the recognition of peoples’ own authorities but not necessarily based on customs and practices, which could lead to a “petrification” of social chan-ge in indigenous communities (2000: 219).
From July to October 2001, municipalities in the states of Oaxaca, Chiapas, Guerrero, Morelos, Veracruz, Michoacán, Jalisco, Puebla, Ta-basco, Hidalgo, and Tlaxcala presented 330 constitutional disputes against amendments to articles 1, 2, 4, 18, and 115, which were ruled as inadmissi-ble by the Supreme Court of Justice of the Nation (SCJN) on September 6 2002. According to Valdivia (2009), at the end of the period from 1990 to 2007 only 17 states reformed their constitutions to include the indigenous matter rulings; 12 of these states acknowledged the multicultural composi-tion of the nation textually and 10 approved a specific regulation on indi-genous matters: Oaxaca (1998), Chiapas (1999), Campeche (2000), State of Mexico (2002), San Luís Potosí (September 2003), Nayarit (December 2004), Jalisco (January 2007), Michoacán (March 2007), Durango (July 2007), and Baja California (October 2007).

176
Papeles de POBLACIÓN No. 86 CIEAP/UAEM
Besides the C169, another important international instrument is the United Nations Declaration on Indigenous Peoples Rights, adopted by the United Nations General Assembly on September 13 20072. This de-claration was published by the Mexican government through the National Commission for the Development of Indigenous Peoples (CDI) in 2008 and 2009. The government thus declared its support to this international instrument expected to work on the benefit of indigenous peoples (CDI, 2009: 12).
C169 set a precedent for legal reformations, whereas the debate bet-ween indigenous peoples’ collective and individual rights remained un-resolved in the UN Declaration. As stated by Díaz Polanco (2006), these reformations in indigenous matters by the Mexican government were not satisfactory for the peoples, and they are hardly the basis of a democra-tic and multi-ethnic state. Consequently, in view of the dissatisfaction of Mexican indigenous peoples and the EZLN with the changes, the idea that this process of recognition of rights resulted in a revival of the indigenous identity or a widespread revitalization of ethnicity clearly shown by cen-sual data cannot be sustained, especially after the limitations of the so-called indigenous law and the resolution of the Supreme Court in regard to the constitutional disputes.
The Zapatista Army of National Liberation and the peak of the indi-genous movement
Several authors (Otero, 2004; Díaz Polanco, 2006; Carrasco et al. 2007; Harvey, 2011) agree that the peak of the indigenous movement was the emergence of the EZLN, which became one of the best known indigenous resistance movements around the world and captured international atten-tion due to its distinctive call to civil society and its use of information and communication technologies (the internet and other media).
Carrasco et al. (2007: 135-136) differentiate three phases of the EZLN as an organization. The first phase, from 1984 to 1994, was characterized by the accumulation of social and political forces among the indigenous people in Ocosingo and self-organization activities around the plan to raise a guerrilla army capable of facing the government; thus, the EZLN began along classic guerrilla formation lines, acting in almost complete secrecy. The second phase took place from 1994 to 2001, and its characteristic mo-ments were:
2 Countries voting against this declaration were the United States, Canada, Australia, and New Zealand.

177 october/december 2015
Self-ascribed indigenous respondents in the 2010 Mexican census: Ethnic ... / G. VÁZQUEZ y M. F. QUEZADA
• A transformation of its ideological platform as a result of political suc-cess and the sympathies of many sectors of the Mexican society and abroad; for the authors, the EZLN’s success was due to its base of indigenous people and its being the first guerrilla war on the internet.
• Between 1994 and the first months of 2001, the indigenous cause was the central axis of the fight, which resulted in a Zapatista demons-tration including indigenous representatives and the presence of the army’s commanders in the Mexican Congress on March 28 2001.
The final period began in 2001 and was characterized by the inexistence of negotiations throughout the Vicente Fox administration. Additionally, there was a political and ideological recomposition within the EZLN in which the government’s legitimacy and democracy were not recognized (Carrasco et al., 2007), the ties between the Democratic Revolution Par-ty (PRD) and the EZLN were cut, and the army developed a number of alternative political strategies, such as the Caracoles, Good Government Meetings, and The Other Campaign3.
According to Harvey (2011), the Caracoles and the Good Government Meetings represented attempts to build democracy based on everyday life within communities and a legitimate and effective way to address conflict among the supporters of political parties, indigenous groups, and Zapatista groups and to address disputes peacefully as an alternative to the official political system. For its part, The Other Campaign opened the door to the possibility of doing politics independent from political parties and the po-litical system in different parts of the country and around the world. For by Díaz Polanco (2006: 167), the Caracoles and the Good Government Meetings represented a valid and legitimate form of civil disobedience opposing the lack of recognition of essential rights of indigenous people associated with autonomy.
The Vicente Fox and Felipe Calderón administrations failed to make concrete proposals to avoid a confrontation with the EZLN. The issue of the indigenous began to fade during Vicente Fox’s government, charac-terized by its developmental approach to ethnicity (Díaz Polanco, 2006). With Calderón’s government, the issue was reduced to policies aimed at reducing policy and the EZLN stopped negotiations with the government because there were no points of convergence between the parts in order to carry on with the negotiations (Carrasco et al., 2007). As a summary, for
3 Sixth Declaration of The Lacandon Jungle, see: http://palabra.ezln.org.mx/

178
Papeles de POBLACIÓN No. 86 CIEAP/UAEM
Díaz Polanco (2006), the indigenous movement has been characterized by the following elements:
• A state of internal fracture and scattering worsened by the lack of their own clear political strategy.
• Its peak corresponds to the years between the Zapatista uprising and the San Andrés agreements (1994-1996). Two achievements of the pe-riod were the negotiation and dialogue processes, which gave rise to considerable reflective and organizational effervescence and the ap-pearance of two national organizations: the National Indigenous Plural Assembly for Autonomy (ANIPA) and the National Indigenous Con-gress (CNI).
• Contradictions resulting in acute splitting began in 1997. The result has been the decay of national organizations and the lack of an acti-ve aggregate national organization capable of mobilizing its members toward short and medium term political program.
• The national presence of the movement has depended on sporadic calls by the EZLN, but such summons have lacked initiative and an effecti-ve, timely, and sustained response to “each blow” by the state.
• Scattered local and regional movements without a national leaders-hip regarding different popular initiatives of various kinds which have emerged over the past years.
• The revindication of the San Andrés agreements by the COCOPA as the minimum level of indigenous demand has been a beacon for the movement, but the discourse may be at risk of losing inspirational qua-lities over time (Díaz Polanco, 2006: 32).
As stated above these lines, the highlight of the indigenous movement took place during the mid and late 1990s. The movement began to fade after 2000, and the EZLN disappeared from the national stage and has op-ted for a strategy of “silence”. Carrasco et al. (2007) note that the effect of The Other Campaign was less significant than expected, and the EZLN’s demonstrations in recent years have also been silent (for instance on its twentieth anniversary and demonstrations in support of the students di-sappeared from Ayotzinapa, Guerrero, in September 2014). Moreover, the Subcomandante Marcos ceased to be the spokesperson of the EZLN. As pointed out by Hernández (2014), its last appearance and farewell marks the end of an era in the Zapatista struggle. Nevertheless, there are efforts in place in different states in the country to recover and revitalize indigenous

179 october/december 2015
Self-ascribed indigenous respondents in the 2010 Mexican census: Ethnic ... / G. VÁZQUEZ y M. F. QUEZADA
languages and re-ethnization processes4. Additionally, the awareness pro-vided by the EZLN to the world is undeniable. Unfortunately, these efforts were not significant enough to change the trends of indigenous population in the 2010 census.
Trends of indigenous belonging in recent censuses in Latin America
In 2010, Mexico became the country with the largest number of people who considered themselves to be indigenous in all Latin America. Since 2000, when a relevant question was first included in the expanded census questionnaire, Mexico had been the country with the largest number of self-ascribed indigenous people in Latin America, but that year the figure was only slightly higher than in Guatemala in 2002 (Table 1). However, in 2010, the figure was larger than in the rest of Latin American countries (with census data available) combined (Table 1). In total, there are approxi-mately 27.7 million self-ascribed indigenous people in 13 Latin American countries; 54% of those people were from Mexico.
Ten of these countries included questions on ethnic self-ascription, and their published results from the previous two censuses show an increased proportion of self-ascribed indigenous people in six of them (Colombia, Costa Rica, Ecuador, Mexico, Panama, and Venezuela), a decreased pro-portion in three of them (Argentina, Bolivia, and Chile), and the same pro-portion in Brazil. The country where the proportion increased the most was Mexico (8.8%), and the country where the proportion decreased the most was Bolivia (21%) (Table 2).
One of the reasons why proportions of self-ascribed indigenous people can vary between countries or in the same country from one census to another is the formulation of the question. Specialized literature has poin-ted out the existence of certain phrasings that can elicit positive reactions. For example, the case of the 2010 Mexican census using the word “cultu-re”; questions using that word may have led to an exaggerated adhesion to the indigenous cause out of sympathy, whereas direct questions about “be-longing” to indigenous peoples and which specific people could produce negative reactions —due to prejudices or a need to deny one’s identity—and result in underreporting (Peyser & Chackiel, 1999).
In order to verify these assertions against the existing censual infor-mation up to date, the following paragraphs present an analysis of ques-tions included in the last two censuses published in Latin America. We will firstly analyze the six countries in which the proportion increased, and secondly the three countries where it decreased.4 Bartolomé (2006) has developed an interesting reflection around the re-ethnicization process.

180
Papeles de POBLACIÓN No. 86 CIEAP/UAEM
Table
1. Se
lf-asc
ribed
indig
enou
s pop
ulatio
n by c
ountr
y, ab
solute
value
s, 199
2-201
2 Ce
nsus
year
Arge
ntina
Bo
livia
Brasi
l Ch
ile
Colom
bia
Costa
Rica
Ec
uado
r Gu
atema
la Ho
ndura
s Me
xico
Pana
má
Parag
uay
Vene
zuela
19
92
99
8 385
19
93
532 2
33
2000
1
117 7
46
73
4 128
63 87
6
5 25
9 022
28
5 229
2001
3 14
5 775
830 4
18
42
7 943
506 3
41
2002
692 1
92
4 61
0 440
88 52
9
2005
1
392 6
23
20
10
955 0
32
81
7 963
1
018 1
76
15
053 9
95
417 5
59
20
11
10
4 143
72
5 128
2012
2 80
6 592
Sourc
e: Ad
apted
from
censu
s info
rmati
on fr
om ea
ch co
untry
.

181 october/december 2015
Self-ascribed indigenous respondents in the 2010 Mexican census: Ethnic ... / G. VÁZQUEZ y M. F. QUEZADA
Tabl
e 2.
Per
cent
ages
of s
elf-
ascr
ibed
indi
geno
us p
opul
atio
n by
cou
ntry
, rel
ativ
e va
lues
, 199
2-20
12
Cen
sus
year
A
rgen
tina
Bol
ivia
B
rasi
l C
hile
C
olom
bia
Cos
ta R
ica
Ecua
dor
Mex
ico
Pana
má
Ven
ezue
la
1992
10.3
19
93
1.6
20
00
3.1
0.
4
1.
7
6.1
10.1
2001
62.0
6.
8
2.
3 20
02
4.
6
20
05
3.4
20
10
2.4
0.
4
7.0
14.9
12
.3
20
11
2.
4
2.7
2012
41.0
So
urce
: Ada
pted
from
cen
sus i
nfor
mat
ion
from
eac
h co
untry
.

182
Papeles de POBLACIÓN No. 86 CIEAP/UAEM
As can be appreciated in tables 3 and 4, in three out of the six countries where the proportion of self-ascribed indigenous population increased bet-ween one census and the next it was because the second census included the word “culture” in the phrasing of the question, but not in the corres-ponding question in the first census. The word “culture” was included in the first census but not in the second only in the case of Costa Rica, where the proportion of indigenous people did not increase5. On the other hand, the word culture appeared in the relevant question in the first census and not in the second in one of the three countries where the proportion of self-ascribed indigenous population decreased from one census to the next.
This evidence is consistent with observations by specialists in that ques-tions referred to culture produce a sympathy that can result in an oversta-tement of indigenous belonging; nevertheless, it is of course not the only cause of increased or decreased statement.
QualIty evaluatIon of 2000 and 2010 MexIcan censuses
One way to assess the quality of a census questions consists in using eva-luation techniques based on declared age, such as Whipple, Myers, and United Nations indices. Age is associated with the rest of demographic phenomena, so the accuracy with which age is declared is a representative measure of overall statistical quality.
These three indices were applied to ethnical self-ascription questions (see above) included in 2000 and 2010 Mexican censuses. It is important to highlight that, in both cases, the data correspond to a sample of approxima-tely 10 percent of the national population; therefore, as opposed to the cen-sus, these sources can introduce both sampling and “non-sampling” errors in calculations. These errors are also expected to affect age surveying, which adds up to the acceptable or unacceptable quality of the census.
Whipple, Myers, and United Nations indices were first applied to cen-sus data (United Nations, 1955: 40), and they are widely used to evaluate survey quality (Estrella, 1993; Pardeshi, 2010; Borkotoky, 2014). Conse-quently, using these techniques can be expected to yield reliable results.
5 Although this country registered an increase of indigenous population from 2000 to 2011, data from the University of Costa Rica digital atlas of indigenous peoples shows that only 75% of the total number of self-ascribed indigenous people identified themselves as part of one of the eight indigenous peoples of the country. Therefore, some of the people who considered themselves indigenous in that census year were not necessarily part of an indigenous people. See: http://www.pueblosindigenas.odd.ucr.ac.cr/index.php/etnias/etnias descripciongeneral?view=archive

183 october/december 2015
Self-ascribed indigenous respondents in the 2010 Mexican census: Ethnic ... / G. VÁZQUEZ y M. F. QUEZADA
Tabl
e 3.
Cou
ntrie
s whe
re th
e pr
opor
tion
of p
opul
atio
n se
lf-as
crib
ed a
s ind
igen
ous i
ncre
ased
C
ount
ry
Yea
r C
ensu
s que
stio
n C
olom
bia
1993
D
o yo
u be
long
to a
ny e
thni
c gr
oup,
indi
geno
us g
roup
, or b
lack
co
mm
unity
? C
olom
bia
2005
B
ased
on
your
cul
ture
, peo
ple,
or …
phy
sica
l tra
its, d
o yo
u re
cogn
ize
your
self
as: .
..?
Cos
ta R
ica
2000
D
o yo
u be
long
to c
ultu
re...
C
osta
Ric
a 20
10
Doe
s (na
me)
con
side
r the
mse
lves
...
Ecua
dor
2000
D
o yo
u se
e yo
urse
lf as
: ind
igen
ous,
blac
k (A
fro-
Ecua
doria
n),
mix
ed b
reed
, mul
atto
, whi
te, o
r oth
er?
Ecua
dor
2010
H
ow d
oes (
nam
e) id
entif
y th
emse
lves
acc
ordi
ng to
thei
r cul
ture
of
belo
ngin
g?
Mex
ico
2000
Is
(nam
e) N
ahua
tl, M
aya,
Zap
otec
, Mix
tec,
or b
elon
gs to
ano
ther
in
dige
nous
gro
up?
Mex
ico
2010
B
ased
on
(nam
e)'s
cultu
re, d
oes h
e or
she
cons
ider
them
selv
es
indi
geno
us?
Pana
ma
2000
A
re th
ere
any
indi
geno
us p
erso
ns li
ving
her
e?
Pana
ma
2010
A
re th
ere
any
indi
geno
us p
erso
ns li
ving
her
e?
Ven
ezue
la
2000
D
o yo
u be
long
to a
n in
dige
nous
peo
ple?
Ven
ezue
la
2011
D
o yo
u be
long
to a
n in
dige
nous
peo
ple
or e
thni
c gr
oup?
So
urce
: Ada
pted
from
cen
sus i
nfor
mat
ion
from
eac
h co
untry
.

184
Papeles de POBLACIÓN No. 86 CIEAP/UAEM
Tabl
e 4.
Cou
ntrie
s whe
re th
e pr
opor
tion
of p
opul
atio
n se
lf-as
crib
ed a
s ind
igen
ous d
ecre
ased
C
ount
ry
Yea
r C
ensu
s que
stio
n
Arg
entin
a 20
00
Is th
ere
any
pers
on li
ving
in th
is h
ome
who
reco
gniz
e th
emse
lves
as a
de
scen
dant
or a
s par
t of a
n in
dige
nous
peo
ple?
Arg
entin
a 20
10
Are
any
of t
he p
eopl
e liv
ing
in th
is h
ome
indi
geno
us o
r des
cend
ants
of
indi
geno
us p
eopl
es (o
rigin
al o
r abo
rigin
al)?
Bol
ivia
20
00
(Doc
umen
t not
ava
ilabl
e)
Bol
ivia
20
12
As B
oliv
ian,
do
you
belo
ng to
an
orig
inal
agr
icul
ture
indi
geno
us p
eopl
e or
Afr
o-B
oliv
ian?
Chi
le
1992
If
you
are
Chi
lean
, do
you
cons
ider
you
rsel
f as p
art o
f any
of t
he
follo
win
g cu
lture
s?
Chi
le
2010
D
o yo
u be
long
to a
ny o
f the
follo
win
g or
igin
al o
r ind
igen
ous p
eopl
es?
Sour
ce: A
dapt
ed fr
om c
ensu
s inf
orm
atio
n fr
om e
ach
coun
try.

185 october/december 2015
Self-ascribed indigenous respondents in the 2010 Mexican census: Ethnic ... / G. VÁZQUEZ y M. F. QUEZADA
Additionally, as indicated as the purpose of the present study, the inten-tion was to determine whether the quality of the data could have affected the variation in self-ascribed indigenous people found by the second cen-sus.
Whipple’s index measures the attraction of one or two digits in ages. Its interpretation is as follows: between 100 and 105, it points out very accu-rate data; from 105 to 110, the data are relatively accurate; from 110 to 125 data are approximate, from 125 to 175 data are unreliable, and 175 or more represents very unreliable data. The Myers-Briggs type indicator measures each individual digit’s attraction or repulsion, as well as the overall level of attraction obtained by adding the absolute values of the individual indices for the 10 digits. It is interpreted as follows: indices between zero and five are low; between 5.1 and 15, intermediate; between 15.1 and 30, high, and higher than 30.1, very high. Additionally, the United Nations index lacks accuracy in declared age and digit preference, and it presents a differen-tial omission of individuals taking place at certain ages and, consequently, irregularities in age and sex data. Indices higher than 40 indicate inaccurate information, 40 to 20 indicates intermediate quality, and an index below 20 indicates that the data is satisfactory (Pimienta & Vera, 1999). Higher values reflect poor data quality in all three indices.
Whipple’s index showed that women’s declaration is slightly worse than men’s declaration, and age declaration is poor in both cases of affirmati-ve answer (ascribes self as indigenous) and unspecified response, whereas the level is similar in the case of negative answers and overall figures. Myers-Briggs type indicator showed a concentration of declaration around certain digits at high levels in both affirmative and negative answer, and intermediate in unspecified answers and overall figures. Finally, the United Nations index indicated intermediate levels for the affirmative answer and not specified answer and satisfactory levels for the negative answer and unspecified answer.
For the 2010 census, Whipple’s index evinced that women’s age de-claration is slightly better than in the case of men, and the quality of such declaration is approximate in all cases, except in the case of unspecified answers, where it is bad. The Myers-Briggs index showed that preference for a digit in age declaration is intermediate in all categories. Finally, the United Nations index revealed satisfactory levels in all cases. It should be highlighted that the unspecified response quality for the 2010 census question is significantly worse than in the case of affirmative answers, ne-gative answers, and overall figures, which makes sense given that inaccu-

186
Papeles de POBLACIÓN No. 86 CIEAP/UAEM
rate answers when the respondent is unable to provide an answer should belong to that category, leaving the affirmative and negative answer then the respondent knows the answer accurately. In general, the quality of age declaration for the question about self-adscription improved from the 2000 to the 2010 Mexican census (Table 5).
characterIstIcs of IndIgenous populatIon In 2000 and 2010 censuses
This section characterizes the populations censed in 2000 and 2010 with the purpose of providing an at least partial explanation to the remarkable differences between the two populations.
The variables used for analysis were population by age, population by sex, overall fertility rate, indigenous language speaker, size of community of regular residence, state of residence, absolute migration, average schoo-ling, and kinship with head of household.
Only population of five years of age or older were considered in order to enable a comparison of values for population self-ascribed as indigenous between the 2000 and 2010 censuses. The 2010 census includes these data for children aged three and four, but they are not considered in this study.
Population by age and sex
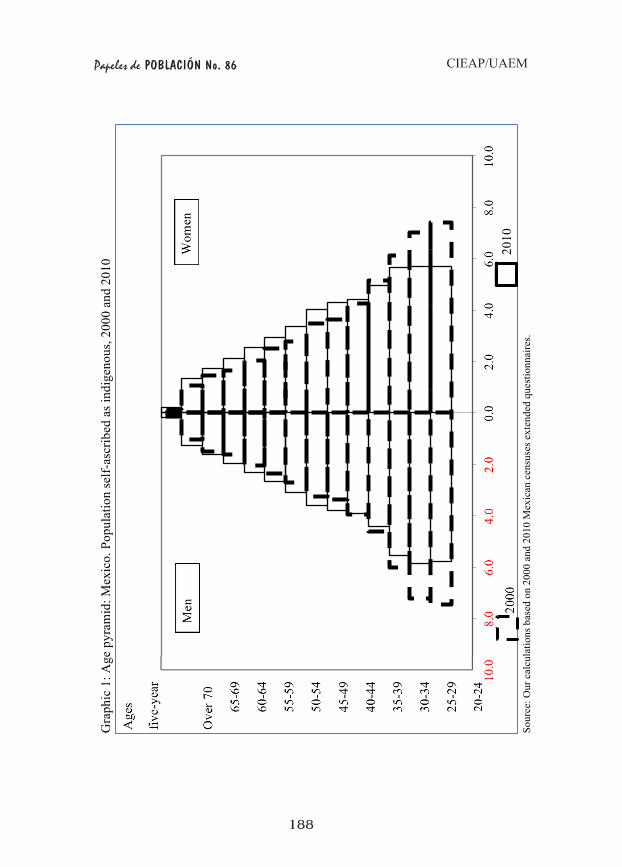
The distribution of population self-ascribed as indigenous reported by the expanded 2000 questionnaire presents certain differences with respect to the 2010 census; these differences can be explained in part by the pro-gress of demographic transition among this population sector. Graphic 1 shows the proportional distribution of self-ascribed population by five-year groups by age and sex for both censuses. Three observations were made: I) the youngest five-year age groups for both sexes (5-9, 10-14, 15-19 y 20- 14) were larger in 2000 than in 2010; ii) there are no significant differences in the 25-29 group between censuses for either sex, and iii) an inverted relationship can be observed in all groups from 30-34 to 70 and older for both sexes. In other words, the proportion of people censed in 2000 is smaller than in 2010; these data are consistent with the combined effect of decreased rates of fertility in this population sector over the past decades and increased mortality at all ages, which increases the survival of adult populations. Thus, there is no evidence that the differences between self-adscription questions in the 2000 and 2010 censuses had a significant effect on the selection of population by age and sex.

187 october/december 2015
Self-ascribed indigenous respondents in the 2010 Mexican census: Ethnic ... / G. VÁZQUEZ y M. F. QUEZADA
Tabl
e 5.
Qua
lity
indi
ces o
f cen
sus r
espo
nses
to th
e et
hnic
self-
adsc
riptio
n qu
estio
n, 2
000
and
2010
In
dex
used
Whi
pple
’s in
dex
Mye
rs-B
riggs
inde
x U
nite
d N
atio
ns in
dex
2000
Man
W
oman
B
oth
gend
ers
Bot
h ge
nder
s B
elon
gs
Inde
x Su
mm
ary
144.
4 14
5.0
15.2
21
.0%
Doe
s not
bel
ong
Leve
l In
dex
Sum
mar
y B
ad 1
18.0
B
ad 1
19.0
H
igh
26.1
In
term
edia
te
11.7
%
Uns
peci
fied
Leve
l In
dex
Sum
mar
y A
ppro
xim
ate
125.
4 A
ppro
xim
ate
126.
6 H
igh
9.6
Satis
fact
ory
23.3
%
Tota
l Le
vel
Inde
x Su
mm
ary
Bad
119
.7
Bad
120
.6
Inte
rmed
iate
8.
6 In
term
edia
te
11.7
%
Le
vel
App
roxi
mat
e A
ppro
xim
ate
Inte
rmed
iate
Sa
tisfa
ctor
y In
dex
used
Whi
pple
’s in
dex
Mye
rs-B
riggs
inde
x in
dica
tor
Uni
ted
Nat
ions
inde
x
2010
Man
W
oman
B
oth
gend
ers
Bot
h ge
nder
s B
elon
gs
Inde
x Su
mm
ary
124.
3 12
2.1
9.1
14.2
%
Doe
s not
bel
ong
Leve
l In
dex
Sum
mar
y A
ppro
xim
ate
115.
5 A
ppro
xim
ate
114.
4 In
term
edia
te
6.5
Satis
fact
ory
12.3
%
Uns
peci
fied
Leve
l In
dex
Sum
mar
y A
ppro
xim
ate
137.
7 A
ppro
xim
ate
129.
3 In
term
edia
te
12.7
Sa
tisfa
ctor
y 21
.1%
Tota
l Le
vel
Inde
x Su
mm
ary
Bad
118
.2
Bad
116
.9
Inte
rmed
iate
7.
4 In
term
edia
te
11.8
%
Le
vel
App
roxi
mat
e A
ppro
xim
ate
Inte
rmed
iate
Sa
tisfa
ctor
y So
urce
: Our
cal
cula
tions
bas
ed o
n 20
00 a
nd 2
010
Mex
ican
cen
suse
s dat
a.
188
Papeles de POBLACIÓN No. 86 CIEAP/UAEM
Gra
phic
1: A
ge p
yram
id: M
exic
o. P
opul
atio
n se
lf-as
crib
ed a
s ind
igen
ous,
2000
and
201
0
So
urce
: Our
cal
cula
tions
bas
ed o
n 20
00 a
nd 2
010
Mex
ican
cen
suse
s ext
ende
d qu
estio
nnai
res.
Men
W
omen
Age
s
five-
year
Ove
r 70
65-6
9
60-6
4
55-5
9
50-5
4
45-4
9
40-4
4
35-3
9
30-3
4
25-2
9
20-2
4 10.0
8.
0 6.
0 4.
0 2.
0 0.
0 2.
0 4.
0 6.
0 8.
0 10
.0
2000
20
10

189 october/december 2015
Self-ascribed indigenous respondents in the 2010 Mexican census: Ethnic ... / G. VÁZQUEZ y M. F. QUEZADA
Graphic 2 shows population pyramids for national population in 2000 and 2010. These pyramids are the basis for an analysis focused on self-as-cribed population: the 25-29 population group remains similar from 2000 to 2010, but the 30-34 group changes, and more significantly, the reduction in 2010 in groups 5-9, 10-14, and 15-19 is not as important for national population as it is for self-ascribed population.
To quantify differences, the 2000 value from the age pyramid was sub-tracted from the 2010 value for each age group, and the data are presented by sex.
In Graphic 3, each bar represents the difference in percentage between the 2000 population and the 2010 population for each age group, and the same is done for national male population and self-ascribed population so that they can be compared. It showcases that the reduction in age groups 5-9 and 10-14 is higher for self-ascribed population than for national po-pulation by one percentage point, and such trend is the same for women (Graphic 4). In the 353.8-39 group and older, the differences (negative in this case) between 2000 and 2010 are small and there are no clear differen-ces between self-ascribed population and general population. Therefore, although the important changes in self-ascribed population age and sex distribution between 2000 and 2010 share the national trend of demogra-phic transition, the reduction in values in the youngest five-year age groups (5-9 and 10-14) is much larger than in the rest of the country.
Overall fertility rate
The overall fertility rate of women self-ascribed as indigenous in 2000 was 4.1 children per woman, whereas the rate for total population was 2.8. In 2010, the overall fertility rate of women self-ascribed as indigenous was 2.8 children per woman, whereas the rate was 2.3 for the whole country. Therefore, indigenous women’s overall fertility rate value decreased 1.3 points between 2000 and 2010, and the value for the national population in general decreased 0.5 points. As can be appreciated, the decrease of fertility among women self-ascribed as indigenous from 2000 to 2010 was very sharp and much higher than the decrease in the rate for the general population.
Indigenous language speaker
The combined analysis of indigenous language speakers and self-ascrip-tion as belonging to an ethnic group allowed us to explore the composition of the self-ascribed population and compare these variables.

190
Papeles de POBLACIÓN No. 86 CIEAP/UAEM
Gra
phic
2: A
ge p
yram
id: M
exic
o. P
opul
atio
n se
lf-as
crib
ed a
s ind
igen
ous,
2000
and
201
0
So
urce
: Our
cal
cula
tions
bas
ed o
n 20
00 a
nd 2
010
Mex
ican
cen
suse
s ext
ende
d qu
estio
nnai
res.
Men
W
omen
Five
-yea
r age
s
Ove
r 70
65-6
9
60-6
4
55-5
9
50-5
4
45-4
9
40-4
4
35-3
9
30-3
4
25-2
9
20-2
4
8.0
6.0
4.0
2.0
0.0
2.0
4.0
6.0
8.0
2000
Cen
sus
2010
Cen
sus

191 october/december 2015
Self-ascribed indigenous respondents in the 2010 Mexican census: Ethnic ... / G. VÁZQUEZ y M. F. QUEZADA
Gra
phic
3: D
iffer
ence
s in
per
cent
ages
bet
wee
n 20
00 a
nd 2
010
age
pyra
mid
s by
age
gro
up fo
r tot
al p
opul
atio
n an
d se
lf-as
crib
ed p
opul
atio
n. M
en
So
urce
: Our
cal
cula
tions
bas
ed o
n 20
00 a
nd 2
010
Mex
ican
cen
suse
s ext
ende
d qu
estio
nnai
res.
2
1.
1
0.
0
-
-5-
9 10
-14
15-
19
20-2
4 2
5-29
30
-34
35-
39
40-4
4 4
5-49
50
-54
55-
59
60-6
4 6
5-69
70
and
Tota
l Se
lf-as
crib
ed

192
Papeles de POBLACIÓN No. 86 CIEAP/UAEM
Gra
phic
4: D
iffer
ence
s in
per
cent
ages
bet
wee
n 20
00 a
nd 2
010
age
pyra
mid
s by
age
gro
up fo
r tot
al p
opul
atio
n an
d se
lf-as
crib
ed p
opul
atio
n. W
omen
So
urce
: Our
cal
cula
tions
bas
ed o
n 20
00 a
nd 2
010
Mex
ican
cen
suse
s ext
ende
d qu
estio
nnai
res.
2
1.
1
0.
0
-
-15-
9 10
-14
15-
19
20-2
4 2
5-29
30
-34
35-
39
40-4
4 4
5-49
50
-54
55-
59
60-6
4 6
5-69
70
an
d
Tota
l Se
lf-as
crib
ed

193 october/december 2015
Self-ascribed indigenous respondents in the 2010 Mexican census: Ethnic ... / G. VÁZQUEZ y M. F. QUEZADA
As could be expected, a large number of self-ascribed people are not ILS because the well-known process by which people stop speaking an in-digenous language does not necessarily translate into a loss of indigenous identity; additionally, the proportion near 100 percent of ILS who belong to an ethnic group reflects congruence. These two criteria, together with the small number of unspecified responses enable a comparison of the cer-tainty of data from 2000 and 2010.
As shown in Table 6, the proportion of people who do not speak an indigenous language but belong to an ethnic group increased disproportio-nately despite: it soared from 1.3 percent in 2000 to 8.6 percent in 2000. Although a decrease in the use of indigenous languages could be expec-ted to be faster than the loss of indigenous identity, an almost seven-fold increase in ten years appears clearly excessive. On the other hand, ILS population who did not ascribe themselves as indigenous decreased from 2.3 percent in 2000 to 0.4 percent in 2010; the latter figure seems more coherent, and it would be so as close as zero as it were. Finally, unspecified ILS responses among self-ascribed respondents or combinations of this variable decreased from 2.8 to 0.9 percent from 2000 to 2010. This result is plausible and translates into better data quality.
Size of community of regular residence
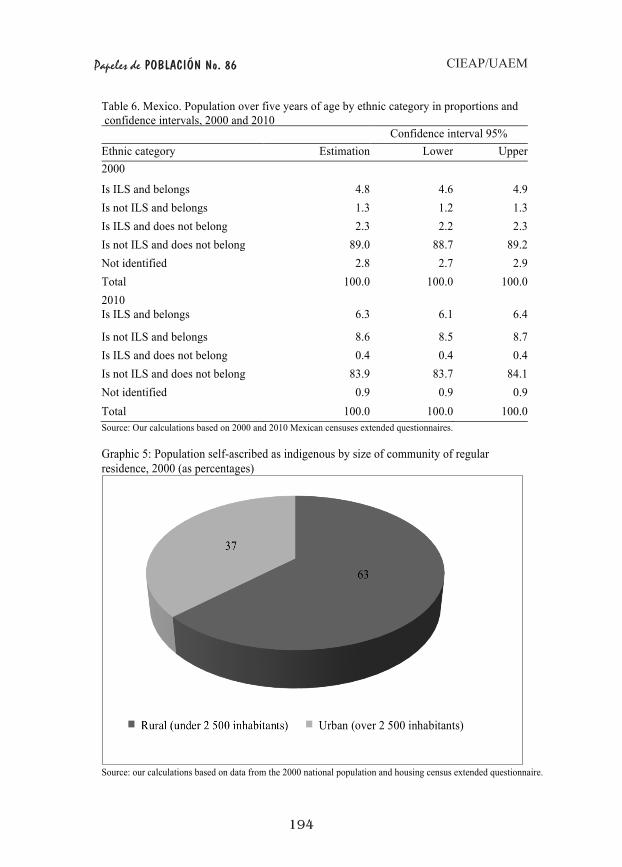
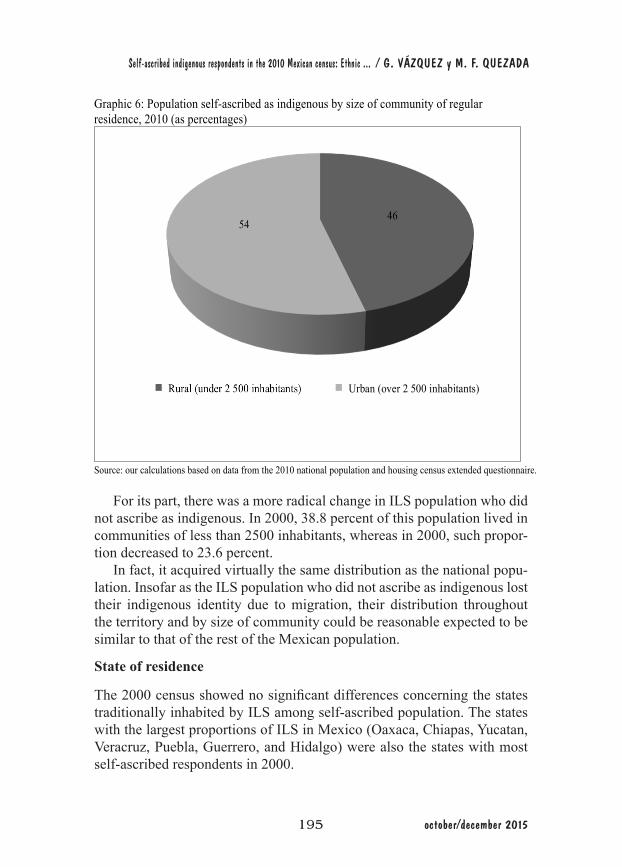
The association between size of community of regular residence and self-ascription in 2000 and 2010 can be appreciated in graphic 5, and graphic 6 shows an important decrease in the proportion of population living in rural areas, which went from more than half (63 percent) to less than half (46 percent) in ten years.
Again, the attention is on the two categories previously analyzed: popu-lation who are not ILS but self-ascribed as indigenous and ILS population who do not consider themselves as indigenous. As shown in Tables 7a and 7b, non-ILS population who ascribed themselves as indigenous living in communities of less than 2 500 inhabitants went from 40.5 to 33.8 percent from 2000 to 2010. The growing trend of urban population is foreseeable; however, the variation among self-ascribed ILS population was 6.7 per-cent, whereas it was of one percent among total national population. This reflects that the population that increased almost eight times is, for the most part, urban.
An alternative interpretation is that the permissive effect of the 2010 question resulted in self-ascribed ILS population being distributed in rural and urban areas resembling the national population distribution.
194
Papeles de POBLACIÓN No. 86 CIEAP/UAEM
Table 6. Mexico. Population over five years of age by ethnic category in proportions and confidence intervals, 2000 and 2010 Confidence interval 95% Ethnic category Estimation Lower Upper 2000
Is ILS and belongs 4.8 4.6 4.9 Is not ILS and belongs 1.3 1.2 1.3 Is ILS and does not belong 2.3 2.2 2.3 Is not ILS and does not belong 89.0 88.7 89.2 Not identified 2.8 2.7 2.9 Total 100.0 100.0 100.0 2010 Is ILS and belongs
6.3
6.1
6.4
Is not ILS and belongs 8.6 8.5 8.7 Is ILS and does not belong 0.4 0.4 0.4 Is not ILS and does not belong 83.9 83.7 84.1 Not identified 0.9 0.9 0.9 Total 100.0 100.0 100.0 Source: Our calculations based on 2000 and 2010 Mexican censuses extended questionnaires. Graphic 5: Population self-ascribed as indigenous by size of community of regular residence, 2000 (as percentages)
Source: our calculations based on data from the 2000 national population and housing census extended questionnaire.
37
63
Rural (under 2 500 inhabitants) Urban (over 2 500 inhabitants)
195 october/december 2015
Self-ascribed indigenous respondents in the 2010 Mexican census: Ethnic ... / G. VÁZQUEZ y M. F. QUEZADA
Graphic 6: Population self-ascribed as indigenous by size of community of regular residence, 2010 (as percentages)
Source: our calculations based on data from the 2010 national population and housing census extended questionnaire.
54 46
Rural (under 2 500 inhabitants) Urban (over 2 500 inhabitants)
For its part, there was a more radical change in ILS population who did not ascribe as indigenous. In 2000, 38.8 percent of this population lived in communities of less than 2500 inhabitants, whereas in 2000, such propor-tion decreased to 23.6 percent.
In fact, it acquired virtually the same distribution as the national popu-lation. Insofar as the ILS population who did not ascribe as indigenous lost their indigenous identity due to migration, their distribution throughout the territory and by size of community could be reasonable expected to be similar to that of the rest of the Mexican population.
State of residence
The 2000 census showed no significant differences concerning the states traditionally inhabited by ILS among self-ascribed population. The states with the largest proportions of ILS in Mexico (Oaxaca, Chiapas, Yucatan, Veracruz, Puebla, Guerrero, and Hidalgo) were also the states with most self-ascribed respondents in 2000.

196
Papeles de POBLACIÓN No. 86 CIEAP/UAEM
Tabl
e 7a
. Per
cent
age
dist
ribut
ion
of p
opul
atio
n ov
er fi
ve y
ears
of a
ge b
y et
hnic
cat
egor
y ac
cord
ing
to si
ze o
f co
mm
unity
of r
egul
ar re
side
nce,
200
0.
Size
of c
omm
unity
Es
timat
ion
and
conf
iden
ce
inte
rval
: 95%
Is
ILS
and
belo
ngs
Is n
ot IL
S an
d be
long
s Is IL
S an
d do
es
not b
elon
g Is
not
ILS
and
does
not
bel
ong U
nspe
cifie
d
Tota
l Le
ss th
an 2
500
in
habi
tant
s Es
timat
ion
68.6
40
.5
38.8
21
.2
23.1
24
.2
Lo
wer
67
.5
38.8
36
.7
20.7
20
.7
23.7
Upp
er
69.7
42
.2
41.0
21
.7
25.6
24
.6
2 50
0 to
14
999
inha
bita
nts
Estim
atio
n 20
.3
25.1
21
.2
12.9
16
.7
13.7
Lo
wer
19
.4
24.0
20
.3
12.7
15
.8
13.5
Upp
er
21.1
26
.3
22.1
13
.0
17.6
13
.8
15 0
00 to
99
999
inha
bita
nts
Estim
atio
n 5.
4 13
.9
10.6
14
.2
11.0
13
.6
Lo
wer
5.
1 13
.1
10.1
14
.0
10.4
13
.5
U
pper
5.
7 14
.8
11.2
14
.4
11.5
13
.8
100
000
and
mor
e in
habi
tant
s Es
timat
ion
5.7
20.5
29
.4
51.7
49
.3
48.6
Lo
wer
5.
5 19
.5
28.3
51
.4
47.5
48
.2
U
pper
6.
0 21
.4
30.5
52
.1
51.1
48
.9
Tota
l Es
timat
ion
100.
0 10
0.0
100.
0 10
0.0
100.
0 10
0.0
Lo
wer
10
0.0
100.
0 10
0.0
100.
0 10
0.0
100.
0
Upp
er
100.
0 10
0.0
100.
0 10
0.0
100.
0 10
0.0
Sour
ce: O
ur c
alcu
latio
ns b
ased
on
2000
and
201
0 M
exic
an c
ensu
ses e
xten
ded
ques
tionn
aire
s.

197 october/december 2015
Self-ascribed indigenous respondents in the 2010 Mexican census: Ethnic ... / G. VÁZQUEZ y M. F. QUEZADA
Table 7b. Percentage distribution of population over five years of age by ethnic category according to size of community of regular residence, 2010.0 Size of community
Estimation and confidence
interval: 95% Is ILS and
belongs Is not ILS
and belongs
Is ILS and does not
belong
Is not ILS and does
not belong Unspecified
Total Less than 2 500 inhabitants
Estimation 62.8 33.8 23.6 19.2 13.7 23.2
Lower 61.8 32.8 22.0 18.8 12.9 22.8 Upper 63.8 34.8 25.2 19.6 14.7 23.5 2 500 to 14 999 inhabitants
Estimation 20.0 21.2 15.5 13.0 8.5 14.1
Lower 19.3 20.6 14.7 12.8 7.9 13.9 Upper 20.7 21.8 16.4 13.3 9.1 14.4 15 000 to 99 999 inhabitants
Estimation 6.8 16.4 15.8 15.1 11.2 14.6
Lower 6.4 15.8 14.9 14.8 10.2 14.4 Upper 7.2 17.0 16.9 15.3 12.2 14.9 100 000 or more inhabitants
Estimation 10.4 28.6 45.1 52.7 66.7 48.1
Lower 10.1 28.1 43.9 52.4 65.5 47.8 Upper 10.7 29.1 46.2 53.0 67.8 48.4 Total Estimation 100.0 100.0 100.0 100.0 100.0 100.0 Lower 100.0 100.0 100.0 100.0 100.0 100.0 Upper 100.0 100.0 100.0 100.0 100.0 100.0 Source: Our calculations based on 2000 and 2010 Mexican censuses extended questionnaires.
Similarly, in 2010, self-ascribed population was surveyed in the states
with largest proportions of ILS in the country, but the State of Mexico is surprisingly the state with most self-ascribed population (Tables 8a and 8b).
Whereas the percentage of self-ascribed population in the State of Mexico was 3.8 in 2000 and was the eight place in the country, its self-ascribed population increased to 10.3 percent in 2010, which represents a 2.7-fold increase in 10 years. However, there were more ILS surveyed in the states of Chiapas, Oaxaca, Veracruz, Puebla, Yucatán, and Guerrero than in the State of Mexico A trend associating states with self-ascribed population with states with ILS could be expected.

198
Papeles de POBLACIÓN No. 86 CIEAP/UAEM
Table 8a. Proportion of self-ascribed indigenous population and confidence interval, 2000 and 2010 2000
Estimation and confidence 2010
Estimation and confidence State Interval: 95% Expected State Interval: 95% Expected Oaxaca Estimation 23.6 Oaxaca Estimation 13.2
Lower 22.8 Lower 12.8 Upper 24.5 Upper 13.6 Chiapas Estimation 13.5 Mexico Estimation 10.3 Lower 12.2 Lower 9.8 Upper 14.9 Upper 10.8 Yucatan Estimation 9.3 Veracruz Estimation 9.2 Lower 8.8 Lower 8.7 Upper 9.9 Upper 9.7 Veracruz Estimation 9.2 Chiapas Estimation 9.1 Lower 8.3 Lower 8.5 Upper 10.2 Upper 9.8 Puebla Estimation 7.1 Puebla Estimation 8.7 Lower 6.4 Lower 8.3 Upper 7.8 Upper 9.1 Guerrero Estimation 6.4 Yucatan Estimation 7.4 Lower 5.9 Lower 7.1 Upper 6.9 Upper 7.7 Hidalgo Estimation 5.2 Hidalgo Estimation 4.8 Lower 4.7 Lower 4.5 Upper 5.8 Upper 5.2 Mexico Estimation 3.8 Guerrero Estimation 4.5 Lower 3.5 Lower 4.2 Upper 4.2 Upper 4.8 San Luis Potosi Estimation 3.8 Michoacan Estimation 3.8
Lower 3.1 Lower 3.6 Upper 4.5 Upper 4.0 Quintana Roo Estimation 3.3 San Luis
Potosi Estimation 3.0
Lower 3.0 Lower 2.6 Upper 3.7 Upper 3.4 Michoacan Estimation 2.6 Federal
District Estimation 2.8
Lower 2.3 Lower 2.8 Upper 2.9 Upper 2.9
Source: Our calculations based on 2000 and 2010 Mexican censuses extended questionnaires.
199 october/december 2015
Self-ascribed indigenous respondents in the 2010 Mexican census: Ethnic ... / G. VÁZQUEZ y M. F. QUEZADA
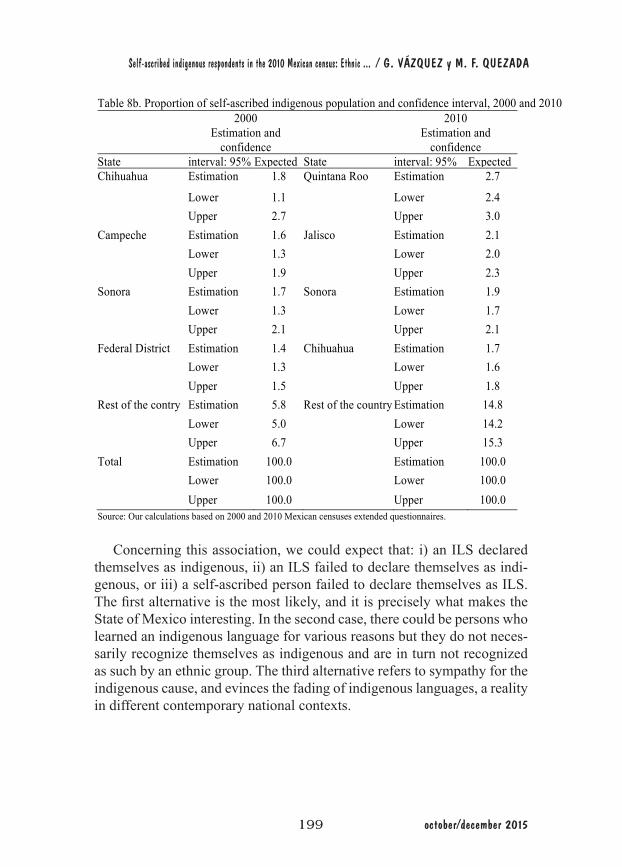
Table 8b. Proportion of self-ascribed indigenous population and confidence interval, 2000 and 2010 2000
Estimation and confidence
2010 Estimation and
confidence State interval: 95% Expected State interval: 95% Expected Chihuahua Estimation 1.8 Quintana Roo Estimation 2.7
Lower 1.1 Lower 2.4 Upper 2.7 Upper 3.0 Campeche Estimation 1.6 Jalisco Estimation 2.1 Lower 1.3 Lower 2.0 Upper 1.9 Upper 2.3 Sonora Estimation 1.7 Sonora Estimation 1.9 Lower 1.3 Lower 1.7 Upper 2.1 Upper 2.1 Federal District Estimation 1.4 Chihuahua Estimation 1.7 Lower 1.3 Lower 1.6 Upper 1.5 Upper 1.8 Rest of the contry country
Estimation 5.8 Rest of the country Estimation 14.8 Lower 5.0 Lower 14.2 Upper 6.7 Upper 15.3 Total Estimation 100.0 Estimation 100.0 Lower 100.0 Lower 100.0 Upper 100.0 Upper 100.0 Source: Our calculations based on 2000 and 2010 Mexican censuses extended questionnaires.
Concerning this association, we could expect that: i) an ILS declared themselves as indigenous, ii) an ILS failed to declare themselves as indi-genous, or iii) a self-ascribed person failed to declare themselves as ILS. The first alternative is the most likely, and it is precisely what makes the State of Mexico interesting. In the second case, there could be persons who learned an indigenous language for various reasons but they do not neces-sarily recognize themselves as indigenous and are in turn not recognized as such by an ethnic group. The third alternative refers to sympathy for the indigenous cause, and evinces the fading of indigenous languages, a reality in different contemporary national contexts.

200
Papeles de POBLACIÓN No. 86 CIEAP/UAEM
Absolute migration
Absolute migration refers to people who were born in a state or country di-fferent from the state where they lived during the census, and non-absolute migrants are people who were born in the same state in which they were surveyed. There are important changes between 2000 and 2010 concerning absolute migration and the self-ascription question. In 2000, people born in a different state accounted for eight percent of self-ascribed respondents and 21 percent of non-indigenous population; in 2010, these proportions were of 14 and 20 percent. This shows that absolute migration increased almost twice for self-ascribed population, whereas it decreased one percent among total population over five years of age.
Indigenous population is known to preserve their identity and traditio-nal behavior when they remain in rural areas; migration and schooling are also documented factors associated with a gradual decrease in many eth-nic practices and behaviors ultimately leading to utter loss of indigenous identity. ILS population who did not ascribe themselves as indigenous can be interpreted as a category of indigenous identity loss. It is composed of people who learned an indigenous language, which entails an autochtho-nous language as mother tongue and rearing by an indigenous social and family core that reflects the person’s belonging to such group; however, those individuals do not identify themselves as belonging to an indigenous group or culture. Tables 9a and 9b show that the proportion of absolute migrants in the non-self-ascribed ILS category is indeed the highest among all other ethnic categories both in 2000 and in 2010, although in the latter, it increased 37.9 percent, that is, 16.2 percent more than its value in 2000. Such a sharp increase in absolute migration among non-self-ascribed ILS can be due to the effect of the question about belonging to an indigenous culture in 2010, which is less restrictive; ILS who respond negatively to that question are much more prone to have migrated and abandoned ethnic belonging for a non-indigenous identity. Oppositely, self-ascribed ILS, as a traditional indigenous population, presents a lower proportion of absolute migrants in both censuses. However, that figure was also affected by the openness of the 2010 question, which can be deduced from the 3.4 percent increase of people born in a different state in 2010 with respect to 2000 values.

201 october/december 2015
Self-ascribed indigenous respondents in the 2010 Mexican census: Ethnic ... / G. VÁZQUEZ y M. F. QUEZADA
Table 9a. Distribution of population over five years of age by ethnic category and place of birth and confidence intervals, 2000
Birth place Estimation and
confidence interval: 95%
Is ILS and belongs
Is not ILS and belongs
Is ILS and does not
belong
Is not ILS and does
not belong 2000 Was born in the same state Estimation 92.1 85.9 77.5 78.4
Lower 91.4 85.3 76.6 78.2
Upper 92.8 86.4 78.4 78.5 Was born in a different Estimation 7.3 13.5 21.6 20.8
Lower 6.6 13 20.8 20.7
Upper 8 14.1 22.5 21 Was born abroad Estimation 0.6 0.6 0.9 0.8
Lower 0.5 0.5 0.7 0.8
Upper 0.6 0.6 1.1 0.9 Total Estimation 100.00 100.00 100.00 100.00
Lower 100.00 100.00 100.00 100.00 Upper 100.00 100.00 100.00 100.00 Source: Our calculations based on 2000 and 2010 Mexican censuses extended questionnaires. Table 9b. Distribution of population over five years of age by ethnic category and place of birth and confidence intervals, 2010
Birth place Estimation and
confidence interval: 95%
Is ILS and belongs
Is not ILS and belongs
Is ILS and does not
belong
Is not ILS and does
not belong 2010 Was born in the same state Estimation 89 82.5 61.4 78.7
Lower 88.7 82.2 60.4 78.6
Upper 89.4 82.8 62.3 78.9 Was born in a different Estimation 10.7 17.1 37.9 20.3
Lower 10.4 16.8 36.9 20.2
Upper 11.1 17.4 38.8 20.5 Was born abroad Estimation 0.2 0.4 0.8 1.00
Lower 0.2 0.4 0.7 1.00
Upper 0.3 0.4 0.9 1.00 Total Estimation 100.00 100.00 100.00 100.00
Lower 100.00 100.00 100.00 100.00 Upper 100.00 100.00 100.00 100.00 Source: Our calculations based on 2000 and 2010 Mexican censuses extended questionnaires.

202
Papeles de POBLACIÓN No. 86 CIEAP/UAEM
Average schooling
With respect to average schooling achieved, represented as the number of completed school years, the relevant question in 2000 indicated an average of 3.9 for self-ascribed population and 6.6 for general population, whereas the 2010 question indicated 5.8 years for self-ascribed population and 7.7 for general population. The 2.9 difference between both censuses decrea-sed to 1.9 in 2010.
As shown in Table 10, all ethnic categories constructed by combining ILS and self-adscription increased the number of completed school years, even in unspecified answers. This shows that schooling figures are not very helpful to find differences derived from self-adscription questions in 2000 and 2010. However, it should be mentioned that non-ascribed ILS popula-tion increased its average schooling by two years between 2000 and 2010. Although the value is below the national average, it is much higher than other ILS, that is, those who ascribe themselves as indigenous.
Kinship with head of household
Tables 11a and 11b present information not readily available in demogra-phic studies. We will open a parenthesis for a brief discussion on these data before carrying on to the description of the remaining categories. In the first place, the proportion of heads of household among the total national population in the country increased from 26 to 28 percent from 2000 to 2010. This may be due to the increase in single-person households where the only member is by definition the head. Another interesting fact is the decline in the proportion of household head’s children as compared to the general population, which decreased from 44 to 40 percent from 2000 to 2010, which was probably an effect of lower fertility rates. Finally, house-hold head’s grandchildren proportion increased from three to five percent from 2000 to 2010, which reflects increased life expectancy among house-hold heads, which increases the probability of intergenerational bonding, but also indicates that more people decide to live in the grandparents’ hou-se, and more children cared for by their grandparents.
We will now resume our analysis focused on the effect of the different phrasing used in the 2010 self-ascription question using Table 11b. The category of non-ILS people who ascribed themselves as indigenous based on “culture” (2010 question) presents a distribution by kinship with head of household closer to the national proportion than to that of ILS who as-cribed themselves as indigenous based on ethnic “group” (2000 question).

203 october/december 2015
Self-ascribed indigenous respondents in the 2010 Mexican census: Ethnic ... / G. VÁZQUEZ y M. F. QUEZADA
Table 10. Average years of schooling and distribution for population over five years by ethnic category and confidence intervals, 2000 and 2010 Years
Is ILS and belongs
Is not ILS and belongs
Is ILS and does not
belong
Is not ILS and does not belong Unspecified
Total
2000 Estimation 3.5 5.5 4.6 6.7 5.3 6.4
Lower 3.46 5.47 4.58 6.63 5.26 6.39 Higher 2010 3.53 5.58 4.70 6.67 5.37 6.43
Estimation 4.5 6.7 6.6 7.7 7.7 7.4 Lower 4.48 6.65 6.53 7.68 7.61 7.39 Upper 4.54 6.71 6.72 7.71 7.74 7.42 Source: Our calculations based on 2000 and 2010 Mexican censuses extended questionnaires.
In 2000, non-ILS who considered themselves part of an indigenous group were overrepresented by head of household’s children (nine points above total) and slightly by grandchildren (1.5 percent above total). The trend changed in 2010 with self-ascription referred to indigenous “cultu-re”. The proportion of self-ascribed non-ILS is barely three percent over the total concerning head of household’s children and is practically the same for grandchildren. In fact, the proportions in this category are very similar to those of the national population in the 2010 census, which ap-pears to be an effect of the non-restrictive nature of the question using the word “culture”.
Finally, the population composed of household heads who speak an indigenous language and does not ascribe themselves as indigenous was overrepresented in 2000 as well as in 2010; however, this surplus increased significantly from 11 percent in 2000 to 18.5 percent in 2010. Such increa-se is explained by the proportional decrease in the number of children who speak an indigenous language who did not ascribe themselves as indige-nous in 2010 with respect to 2000. Such a particular configuration is con-sistent with that of a population living in single-person households where the inhabitant is automatically the head, due to migration, long distance to their homeland, and discrimination, these people decide not to ascribe themselves as indigenous despite their speaking an indigenous language.

204
Papeles de POBLACIÓN No. 86 CIEAP/UAEM
Table 11a. Distribution of population over five years of age who ascribed themselves to an indigenous ethnic group/culture by kinship with head of household and confidence intervals, 2000
Kinship with head
Estimation and confidence interval:
95% Is ILS and
belongs Is not ILS
and belongs Is ILS and
belongs Is not ILS
and belongs 2000 Head Estimation 27.9 20.5 37.2 26.3 Lower 27.6 20.2 36.7 26.3 Upper 28.1 20.8 37.7 26.4 Spouse or partner Estimation 21.0 14.6 23.4 19.6 Lower 20.8 14.4 23.2 19.6 Upper 21.1 14.8 23.7 19.7 Son or daughter Estimation 40.7 53.2 26.8 43.7 Lower 40.3 52.7 26.0 43.6 Upper 41.1 53.7 27.5 43.8 Grandchild Estimation 2.5 4.9 1.5 3.4 Lower 2.4 4.7 1.5 3.4 Upper 2.6 5.2 1.6 3.4 Daughter-in-law or son-in-law
Estimation 2.0 1.9 1.5 1.7
Lower 1.9 1.8 1.5 1.7 Upper 2.0 2.0 1.6 1.7 Mother or Father Estimation 1.3 0.5 2.0 0.7 Lower 1.2 0.5 1.9 0.7 Upper 1.3 0.5 2.1 0.7 Mother-in-law or Father-in-law
Estimation 0.5 0.2 0.9 0.4
Lower 0.4 0.2 0.9 0.4 Upper 0.5 0.2 1.0 0.4 Other kinship Estimation 3.4 3.4 4.5 3.5 Lower 3.3 3.2 4.3 3.4 Upper 3.5 3.5 4.6 3.5 No kinship Estimation 0.9 0.8 2.2 0.7 Lower 0.9 0.7 2.1 0.7 Upper 1.0 0.9 2.4 0.7 Total Estimation 100.0 100.0 100.0 100.0 Lower 100.0 100.0 100.0 100.0 Upper 100.0 100.0 100.0 100.0 Source: Our calculations based on 2000 and 2010 Mexican censuses extended questionnaires.

205 october/december 2015
Self-ascribed indigenous respondents in the 2010 Mexican census: Ethnic ... / G. VÁZQUEZ y M. F. QUEZADA
Table 11b. Distribution of population over five years of age who ascribed themselves to an indigenous ethnic group/culture by kinship with head of household and confidence intervals, 2010
Kinship with head
Estimation and confidence interval:
95% Is ILS and
belongs Is not ILS
and belongs
Is ILS and
belongs Is not ILS
and belongs 2010
Head Estimation 32.0 26.5 46.8 28.2 Lower 31.7 26.3 46.1 28.1 Upper 32.3 26.6 47.4 28.2 Spouse or partner Estimation 22.6 18.8 22.9 19.6
Lower 22.5 18.7 22.5 19.6 Upper 22.8 18.9 23.2 19.6 Son or daughter Estimation 34.3 42.7 17.1 40.0
Lower 33.9 42.5 16.3 39.9 Upper 34.7 42.9 17.8 40.0 Grandchild Estimation 2.5 4.9 1.5 4.7
Lower 2.4 4.8 1.4 4.6 Upper 2.6 5.0 1.7 4.7 Daughter-in-law or son-in-law
Estimation 2.3 2.6 2.1 2.4
Lower 2.3 2.6 2.0 2.4 Upper 2.4 2.6 2.3 2.5 Mother or Father Estimation 1.6 0.7 1.8 0.7
Lower 1.6 0.6 1.7 0.7 Upper 1.7 0.7 2.0 0.7 Mother-in-law or Father-in-law
Estimation 0.6 0.3 0.8 0.4
Lower 0.6 0.3 0.7 0.4 Upper 0.6 0.3 0.8 0.4 Other kinship Estimation 3.0 2.9 3.5 3.2
Lower 2.9 2.8 3.4 3.1 Upper 3.0 2.9 3.7 3.2
No kinship Estimation 0.7 0.4 3.0 0.5 Lower 0.6 0.4 2.8 0.5 Upper 0.7 0.4 3.2 0.5
Total Estimation 100.0 100.0 100.0 100.0 Lower 100.0 100.0 100.0 100.0 Upper 100.0 100.0 100.0 100.0 Source: Our calculations based on 2000 and 2010 Mexican censuses extended questionnaires.
206
Papeles de POBLACIÓN No. 86 CIEAP/UAEM
conclusIons
The present study presents evidence that ethnic markers used in censu-ses and surveys in Latin America include phrases that can elicit positive reactions, such as those referring to “culture”; moreover, these questions result in overstatement due to the respondents support of the indigenous cause (Peyser & Chakiel, 1999). This becomes evident from the analysis of census results between 1992 and 2012 in which the question on ethnic self-ascription was first expressed using the word “culture”, and in the next year, the ethnic self-ascription question was formulated changing the noun to “peoples” or “ethnic group”, among others. As a result, in three of the six countries in which the proportion of self-ascribed indigenous popula-tion increased from one census to the next; in the second census, the word “culture” was used in the question but not in the previous census. On the other hand, only in one of the three countries where the proportion of self-ascribed indigenous population decreased between censuses was the word “culture” included in the first census question but not in the second.
The contrast of figures for people who declared belonging to an indi-genous group/culture from the 2000 and 2010 Mexican censuses shows cumulative evidence consistent with the hypothesis that the phrasing of the question as formulated in 2010 explains the resulting increase of indi-genous population from 5.3 million in 2000 to 15 million in 2010. In this regard, we may ask what the main cause of such a spectacular increase in self-ascribed population was. Results of census quality evaluation techni-ques (Whipple’s index, Myers-Briggs type indicator, and United Nations index) indicate that the quality of the 2000 census is not better than the quality of the 2010 census. As the reason behind the increase, demographic growth should be necessarily associated with high fertility rates; however, overall fertility rates for self-ascribed population in 2010 are much lower than those of the 2000 census (2.8 and 4.1 children per woman, respecti-vely). Therefore, demographic growth cannot explain the increase.
There are two remaining explanations: the openness of the new ques-tion and a revitalization of ethnicity. It is necessary to recognize that both possibilities are, to a certain extent, intertwined, because the overstatement based on support for the indigenous cause found by Peyser & Chackiel (1999) when using “culture” as referent of ethnic identity would be impos-sible without the acceptance of such culture by part of the Mexican society.
The evidence obtained from the analysis of both Mexican censuses could be used to prove either explanation. Based on the analysis of data
207 october/december 2015
Self-ascribed indigenous respondents in the 2010 Mexican census: Ethnic ... / G. VÁZQUEZ y M. F. QUEZADA
from the 2000 and 2010 censuses, we conclude that the sociodemographic characteristics of the population who ascribed themselves as indigenous in 2010 is less similar to the ILS population, and to the population of in-digenous peoples in general, than those surveyed in 2000. Most of the 9.8 million additional people above five years of age who ascribed themsel-ves as indigenous in 2010 are also in the non-ILS category. Self-ascribed respondents were mostly rural in 2000, whereas they were predominantly urban in 2010; the proportion of absolute migration increased almost twice among self-ascribed respondents, whereas it decreased by one percent in 2000, and the increase in schooling for self-ascribed respondents was al-most twice as much as the corresponding increase among general national population over five years of age.
A detailed analysis of self-ascription presenting the condition of ILS allows for the confirmation of the permissive effect of the question. Almost the entire ILS respondents who ascribed themselves as indigenous (68 per-cent in 2000 and 94 percent in 2010) became more urban, migrated more, and had more schooling, whereas ILS who did not ascribe as indigenous became a very small group of people who have lost their indigenous iden-tity (or do not desire to ascribe to an indigenous culture) because they live in single-person households, mainly in urban areas, and their accumulated schooling is higher than that of the rest of ILS. Non ILS population who as-cribed themselves as indigenous in 2010 is more similar to the general na-tional population in all analyzed aspects: schooling, size of community of regular residence, kinship with head of household, and absolute migration.
In sum, questions about ethnic self-adscription in 2000 and 2010 are di-fferent and represent different populations; therefore, they are technically not comparable. The first refers to population who belong to an indigenous group and the second to an indigenous culture. This conclusion needs to consider the following premises:
• Although both questions share the purpose of quantifying indigenous population by self-ascription, the difference between them is the refe-rent of belonging.
• A basic census data comparability criteria for any user is being able to contrast the data as if they were equivalent. In fact, this is an element of quality for these sources.
• There are few visible studies in Mexico pointing out the differences between these questions and the resulting populations.

208
Papeles de POBLACIÓN No. 86 CIEAP/UAEM
On the other hand, the results of the present study are the starting point of a discussion on which one is the most adequate question, what is the purpose of quantifying indigenous belonging and who should quantify it, the utility of such information for indigenous peoples themselves, and the determinants of this subjective vision represented by ethnic self-adscrip-tion.
The presence of an indigenous culture in Mexico may lead to the idea that Mexicans should consider themselves indigenous. Nevertheless, the analysis of census data was insufficient to determine which of the two pos-sible explanations on the abrupt increase of self-ascribed indigenous popu-lation is true: the openness of the question or a revitalization of ethnicity. In both cases, expecting the 2010 self-ascribed population’s characteristics to be closer to the general national population than the 2000 self-ascribed population’s is valid. Ethnic revitalization was ruled out as an explana-tion after analyzing Mexican history during the 2000’s. Between 2001 and 2010, the social context was characterized by the EZLN’s withdrawal to their original regions and its scarce presence in the national arena, and the Mexican society forgot gradually about the indigenous cause. Therefore, asserting the existence of such revitalization during the period is clearly implausible. Consequently, we conclude that the spectacular increase of self-ascribed indigenous population in 2010 with respect to 2000 is mainly due to an overestimation resulting from the formulation of the census ques-tion, which included the word “culture” as the referent for indigenous be-longing.
The inclusion of the question focused on self-ascription represents a step forward in censual ethnic identification, and it adheres to the defini-tion of indigenous person in the ILO Convention 169. However, given its subjective nature, its results can be expected to change over time because it is exposed to the effects of public opinion on indigenous issues and indivi-dual decisions on whether they should ascribe themselves as indigenous or not. On the other hand, the phrasing used in the question is especially deli-cate: a change in a single word was able to completely disrupt the resulting population. To date, no empirical parameters are able of determining how well constructed or misleading the question is. Further research in this re-gard is needed. Additionally, during censuses, surveyors should ask this question in an appropriately: each member of the family should be asked directly whether they are indigenous or not, not only one person in the household. This question should be asked individually so that each person can decide for themselves on their ethnic identity. Although the initiative
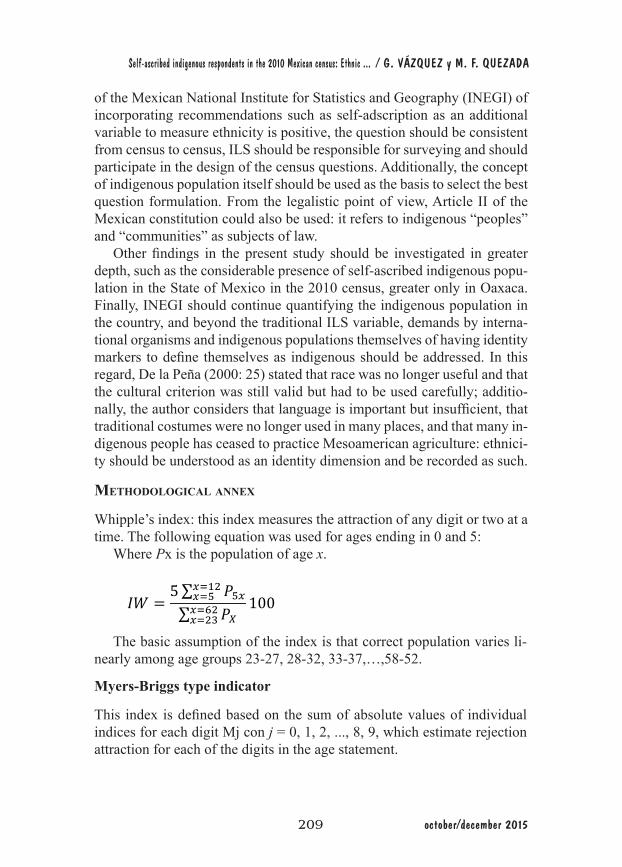
209 october/december 2015
Self-ascribed indigenous respondents in the 2010 Mexican census: Ethnic ... / G. VÁZQUEZ y M. F. QUEZADA
of the Mexican National Institute for Statistics and Geography (INEGI) of incorporating recommendations such as self-adscription as an additional variable to measure ethnicity is positive, the question should be consistent from census to census, ILS should be responsible for surveying and should participate in the design of the census questions. Additionally, the concept of indigenous population itself should be used as the basis to select the best question formulation. From the legalistic point of view, Article II of the Mexican constitution could also be used: it refers to indigenous “peoples” and “communities” as subjects of law.
Other findings in the present study should be investigated in greater depth, such as the considerable presence of self-ascribed indigenous popu-lation in the State of Mexico in the 2010 census, greater only in Oaxaca. Finally, INEGI should continue quantifying the indigenous population in the country, and beyond the traditional ILS variable, demands by interna-tional organisms and indigenous populations themselves of having identity markers to define themselves as indigenous should be addressed. In this regard, De la Peña (2000: 25) stated that race was no longer useful and that the cultural criterion was still valid but had to be used carefully; additio-nally, the author considers that language is important but insufficient, that traditional costumes were no longer used in many places, and that many in-digenous people has ceased to practice Mesoamerican agriculture: ethnici-ty should be understood as an identity dimension and be recorded as such.
MethodologIcal annex
Whipple’s index: this index measures the attraction of any digit or two at a time. The following equation was used for ages ending in 0 and 5:
Where Px is the population of age x.
𝐼𝐼𝐼𝐼 =5 𝑃𝑃!!!!!"
!!!
𝑃𝑃!!!!"!!!"
100
The basic assumption of the index is that correct population varies li-nearly among age groups 23-27, 28-32, 33-37,…,58-52.
Myers-Briggs type indicator
This index is defined based on the sum of absolute values of individual indices for each digit Mj con j = 0, 1, 2, ..., 8, 9, which estimate rejection attraction for each of the digits in the age statement.

210
Papeles de POBLACIÓN No. 86 CIEAP/UAEM
Whereaj = j + 1 for j: 0,…,9a’j = 9 – 1 for j: 0,…,9Pj = Σ i ≥ 1 P10i + j Number of people who declared an age ending in digit j
in the population over 10 years.P’j = Σ i ≥1 P10i + j Number of people who declared an age ending in digit
j in the population over 20 yearsVj = Σ i ≥1 V10i + j Real number of individuals with age ending in digit j in
the population over 10 years.V’j = Σ i ≥1 V10i + j Real number of individuals with age ending in digit j
in the population over 20 years.Ranges to classify concentration in reference to digit preference: 0 and
5, low; between 5.1 and 15, intermediate; between 15.1 and 30, high; and 30.1 and over, very high.
United Nations index: INU = 3 * RS + PDCH + PDCM
Where RS is sex regularity index and PDCH and PDCM represent avera-ge deviations from 100 of male and female populations, respectively.
𝐼𝐼! = 𝑀𝑀!
!
!!!
𝑀𝑀! =𝑎𝑎! − 𝑃𝑃! − 𝑎𝑎!!𝑃𝑃!! + (𝑎𝑎! 𝑉𝑉! − 𝑎𝑎!!𝑉𝑉!!)
𝑎𝑎!𝑃𝑃! − 𝑎𝑎!!𝑃𝑃!!!!!!
∗ 100
𝑃𝑃𝑃𝑃𝑃𝑃! =
2𝑃𝑃 !! !(!"!!)!
𝑃𝑃 !!!! !(!!)! + 𝑃𝑃 !!!! !(!!!!)
! − 1!"!!!
13
𝑃𝑃𝑃𝑃𝑃𝑃! =
2𝑃𝑃 !! !(!"!!)!
𝑃𝑃 !!!! !(!!)! + 𝑃𝑃 !!!! !(!!!!)
! − 1!"!!!
13
𝑅𝑅𝑅𝑅 =
𝑃𝑃 !! !(!!!!)!
𝑃𝑃 !! !(!!!!)! −
𝑃𝑃 !!!! !(!!!!)!
𝑃𝑃 !!!! !(!!!!)!
13 ∗ 100

211 october/december 2015
Self-ascribed indigenous respondents in the 2010 Mexican census: Ethnic ... / G. VÁZQUEZ y M. F. QUEZADA
Given its lack of precise limits, its interpretation is based on experience, which indicated that indices of 40 and over indicate poor information, from 40 to 20 information is of intermediate quality, and information is satisfac-tory at levels under 20.
Values from both censuses were calculated using data from the non-weighted sample.
BARABAS, Alicia, 2004, “Un acercamiento a las identidades de los pueblos indi-os de Oaxaca”, en Amérique Latine Histoire et Mémoire. Les Cahiers ALHIM, 10 consultado: 5 de octubre de 2010, disponible en http://alhim.revues.org/105BARTOLOMÉ, Miguel Alberto, 2006, Gente de costumbre y gente de razón. Las identidades étnicas en México, siglo XXI, México.BENGOA, José, 2007, La emergencia indígena en América Latina, Fondo de Cul-tura Económica, Chile.BORKOTOKY K., Unisa S., 2014, “Indicators to examine quality of large scale survey data: an example through district level household and facility survey”, dis-ponible en Plos one, mar 5;9(3), en e90113. doi: 10.1371/journal.pone.0090113 BURGUETE, Araceli y Miguel GÓMEZ, 2008, “Multiculturalismo y gobierno permitido en San Juan Cancuc, Chiapas: tensiones intracomunitarias por el re-conocimiento de autoridades tradicionales”, en Xochitl LEYVA, Araceli BUR-GUETE y Shannon SPEED (coords.), Gobernar (en) la diversidad: experiencias indígenas desde América Latina. Hacia la investigación de Co-labor, Centro de Investigaciones y Estudios Superiores en Antropología Social, Facultad Latinoa-mericana de Ciencias Sociales, México.CARBONELL, Miguel, 2004, Multiculturalismo Constitucional, consultado el 15 de enero de 2011 disponible en http://www.juridicas.unam.mx/publica/librev/rev/derycul/cont/13/ens/ens3.pdfCARRASCO, Tania, Manaut BENÍTEZ y Raúl Armando RODRÍGUEZ, 2007, “La crisis de Chiapas: negociaciones, democracia y gobernabilidad”, en Liminar. Estudios Sociales y Humanísticos, vol. 5, núm. 2. CDI, 2009, Declaración de las Naciones Unidas sobre los Derechos de los Pueblos Indígenas, Comisión Nacional Para el Desarrollo de los Pue-blos Indígenas, fecha de consulta 15/10/2013, disponible en línea en http://www.cdi.gob.mx/dmdocuments/declaracion_onu_pueblos_indigenas.pdf, México.DE LA PEÑA, Guillermo, 2000, “¿Un concepto operativo de lo indio?”, en Esta-do del desarrollo Económico y social de los pueblos indígenas de México, 1996-1997, Tomo 1, Instituto Nacional Indigenista, PNUD, México.
BIBlIographIcal references

212
Papeles de POBLACIÓN No. 86 CIEAP/UAEM
DÍAZ POLANCO, Héctor, 2006, El Laberinto de la identidad, Coordinación de Humanidades, Programa México Nación Multicultural, Universidad Nacional Au-tónoma de México, México.ESTRELLA VALENZUELA, Gabriel, 1993, “Migración internacional legal des-de la frontera norte de México”, en Estudios Demográficos y Urbanos, vol. 8, núm. 3 (24).FERNÁNDEZ, Patricia, 2011, “Las identidades étnicas en México”, en Este País Tendencia y opiniones, disponible en http://estepais.com/site/?p=33528GÓMEZ, Magdalena, 2013, “EZLN: veinte años”, en La Jornada, 24 de diciem-bre, México.HARVEY, Neil, 2011, “Más allá de la hegemonía. El zapatismo y la otra política”, Ponencia presentada en la Conferencia de Raza, etnicidad de pueblos indígenas de América Latina y El Caribe, Universidad de California, 3-5 de noviembre, San Diego.HERNÁNDEZ NAVARRO, Luís, 2014, “La ceremonia del adiós del Sub Mar-cos”, en La Jornada, 5 de octubre, México.LÓPEZ BÁRCENAS, Francisco, 2004, “La lucha por la autonomía indígena en México: un reto al pluralismo”, en Aída HERNÁNDEZ, Paz SARRELA y María Teresa SIERRA (coords.), Los indígenas en tiempos del Pan: neoindigenismo, legalidad e identidad, CIESAS, Miguel Ángel Porrúa, México.UNITED NATIONS, 1955, Manuals on methods of estimating population MA-NUAL II Methods of Appraisal of Quality of Basic Data for Population Estimates, United Nations Publications, Nueva York.OTERO, Gerardo, 2004, ¿Adiós al campesinado? Democracia y formación po-lítica de las clases en el México rural, Miguel Ángel Porrúa/UAZ/Simon Fraser University. México.PARDESHI, Geeta, 2010, “Age heaping and accuracy of age data collected during a community survey in the Yavatmal District, Maharashtra”, en Indian Journal of Community Medicine, 35(3).PEYSER, Alexia y Juan CHACKIEL, 1999, La identificación de poblaciones in-dígenas en los censos de América, Latina”, América Latina: aspectos conceptua-les de los censos de 2000, CEPAL, Serie Manuales, Santiago de Chile.PIMIENTA LASTRA, Rodrigo y María VERA BOLAÑOS, 1999, La declaración de la edad. Un análisis comparativo de su calidad en los censos generales de po-blación y vivienda, El Colegio Mexiquense, Toluca.VALDÉS, Luz María, 2003, “Comentarios y reflexión acerca de la identificación de la población indígena en los censos mexicanos”, en François LARTIGUE y André QUESNEL (coord.), Las dinámicas de la población indígena. Cuestiones y debates actuales en México, CIESAS, Porrúa, México.VALDIVIA, María Teresa, 2009, “Políticas y reformas en materia indígena, 1990-2007”, en Argumentos, vol. 22 núm, 59, disponible en línea, fecha de consulta 30/10/2013, en http://www.redalyc.org/articulo.oa?id=59511412005

213 october/december 2015
Self-ascribed indigenous respondents in the 2010 Mexican census: Ethnic ... / G. VÁZQUEZ y M. F. QUEZADA
VALLADARES, Laura, 2003, “Democracia y derechos indios en México: la ciu-dadanía multicultural como modelo de paz”, en Revista Mexicana de Ciencias Políticas y Sociales, vol. 46, núms. 188-189.
currIcular InforMatIon of the authors
Germán Vázquez SandrinEs Doctor en Estudios de las Sociedades Latinoamericanas, especialidad en Demografía, por la Université de la Sorbonne Nouvelle (Paris III) Pa-ris, Francia. Maestro en Población por la Facultad Latinoamericana de Ciencias Sociales (FLACSO)- México y Licenciado en Sociología por la UNAM, ENEP Acatlán, México. Actualmente es profesor investigador de tiempo completo titular “C” de la Universidad Autónoma del Estado de Hidalgo (UAEH) y miembro del Sistema Nacional de Investigadores nivel 1. Es coordinador de la Maestría en Estudios de Población de la UAEH. Participa en asociaciones científicas tales como la Red Mexicana de Estu-dios sobre Poblaciones Indígenas, de la cual es el coordinador general y la Sociedad Mexicana de Demografía (SOMEDE). Entre sus libros publica-dos destaca Fecundidad indígena, en coedición de la UAEH y la editorial Miguel Ángel Porrúa.Dirección electrónica: [email protected]
María Félix Quezada RamírezEs hablante y perteneciente otomí. Doctora en Estudios del Desarrollo por la Universidad Autónoma de Zacatecas, Maestra en Demografía por el Colegio de la Frontera Norte y Licenciada en Sociología por la Uni-versidad Autónoma Metropolitana Unidad Xochimilco. Actualmente es profesora-investigadora de la Universidad Autónoma del Estado de Hi-dalgo (UAEH), miembro del Sistema Nacional de Investigadores Nivel I. Entre sus publicaciones más recientes sobresalen: Catálogo de pueblos y comunidades indígenas del Estado de Hidalgo, Universidad Autónoma del Estado de Hidalgo, 2013 (como coautora). Sus líneas de investigación son la Demografía étnica, la migración indígena y el desarrollo indígena. Asimismo, funge como responsable del Doctorado en Estudios de Pobla-ción de la UAEH. Dirección electrónica: [email protected]
Article received on 18 november 2014 and accepted on 22 april 2015.