2010 IOR/EOR Global Market Overview; The Economic Potential of Existing Unconventional Resources and...
27
2010 IOR/EOR Global Market Overview; Economic Potential of Existing Unconventional Resources and Marginal Fi © Infield Systems Ltd. 2012 201 2 Kader Dicko – Senior Analyst
-
Upload
erik-sweetland -
Category
Documents
-
view
221 -
download
1
Transcript of 2010 IOR/EOR Global Market Overview; The Economic Potential of Existing Unconventional Resources and...

2010
IOR/EOR Global Market Overview; The Economic Potential of Existing Unconventional Resources and Marginal Fields
© Infield Systems Ltd. 2012
2012
Kader Dicko – Senior Analyst

Infield Systems – www.infield.com
© Infield Systems Ltd. 2011 2© Infield Systems Ltd. 2012
Established over 20 years ago – specialist firm in the offshore energy sector (data and market Analysis)
Please visit us at OTC – Booth 8851 (Free Maps)

© Infield Systems Ltd. 2012
Contents
Global Macro Overview
IOR/EOR Global Overview - “Extending the project lifetime of mature fields”
Conclusions
3
© Infield Systems Ltd. 2012 4
Global Macro Overview

© Infield Systems Ltd. 2012 5
Despite Slowdown, Emerging Economies Will Continue to Drive Demand
Source: IEA
•China and India are leading the pack (~50% of the global growth)

© Infield Systems Ltd. 2012 6
Supply is Struggling to Keep Pace with Global Demand
Forecast
-100
-80
-60
-40
-20
0
20
40
60
80
100
-5
-4
-3
-2
-1
1
2
3
4
5
2009-Q1 2010-Q1 2011-Q1 2012-Q1 2013-Q1
World oil consumption (left axis)
Non-OPEC production (left axis)
WTI crude oil price (right axis)
Source: Short-Term Energy Outlook, April 2012
millions of barrels per day dollars per barrelChange from previous year
Source: EIA

© Infield Systems Ltd. 2012 7
Depleting Reserves in Mature Basins (North Sea)

© Infield Systems Ltd. 2012
Depleting Reserves in Mature Basins (North Sea)
8
0.00
0.50
1.00
1.50
2.00
2.50
3.00
3.50
4.00
4.50
5.00
1971 1991 2011
Tot
al P
rodu
ctio
n (m
illio
n bo
epd)
Oil Natural Gas
NGL Condensate
UKCS Production
Norway Production
Norway Production 2011
• Oil Production Y-O-Y Decline: 7%
• Gas Production Y-O-Y Decline: 5%
• Oil Production peaked in 2000 and Gas in 2010
UKCS Production 2011
• Oil Production Y-O-Y Decline: 18%
• Gas Production Y-O-Y Decline: 22%
• Oil Production peaked in 1999 and Gas in 2000
Source: NPD (Norway) and DECC (UK)

© Infield Systems Ltd. 2012
Depleting Reserves in Mature Basins (GoM)
9
Field Depletion in the Gulf of Mexico

© Infield Systems Ltd. 2012 10
Remaining Reserves in Harder to Reach Places - Deepwater
Hydrocarbon Field Discoveries, Water Depth and Reserve Size
Average size of discoveries decreases with depth, more fields will have to be developed as a result
1,000 metres

© Infield Systems Ltd. 2012 11
Remaining Reserves in Harder to Reach Places – Arctic Circle
© Infield Systems Ltd. 2012
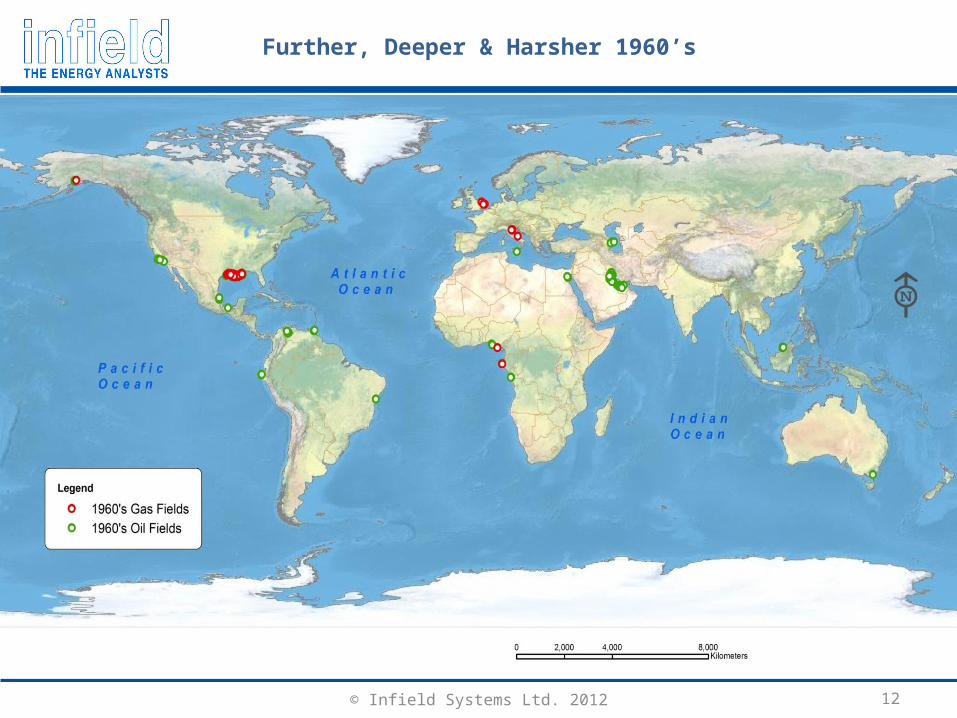
Further, Deeper & Harsher 1960’s
12
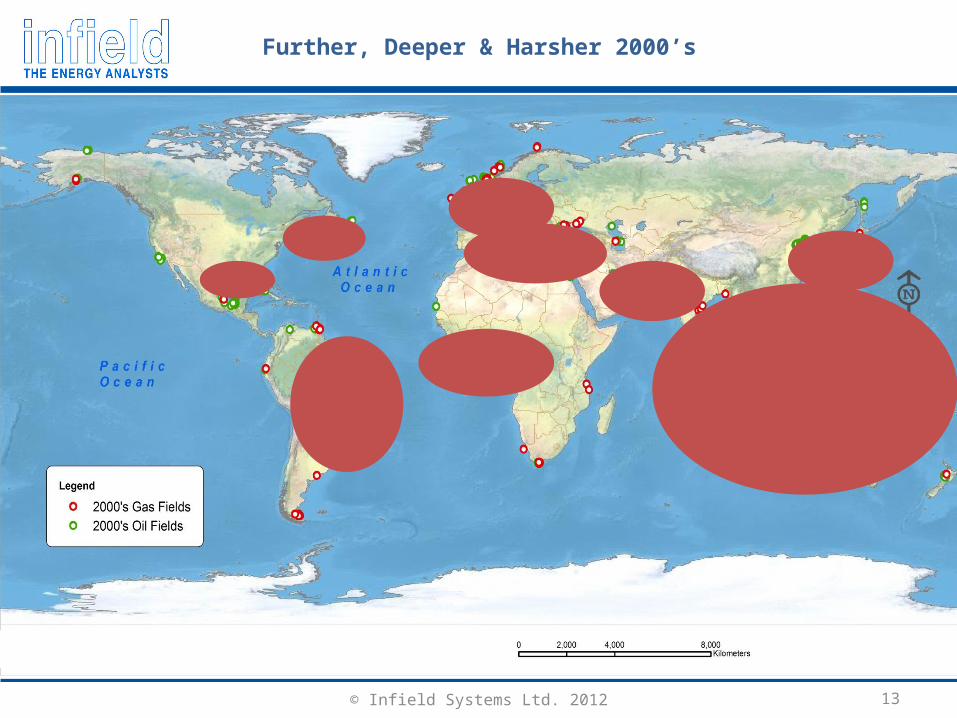
© Infield Systems Ltd. 2012 13
Further, Deeper & Harsher 2000’s

© Infield Systems Ltd. 2012 14
Frontier and Emerging Regions
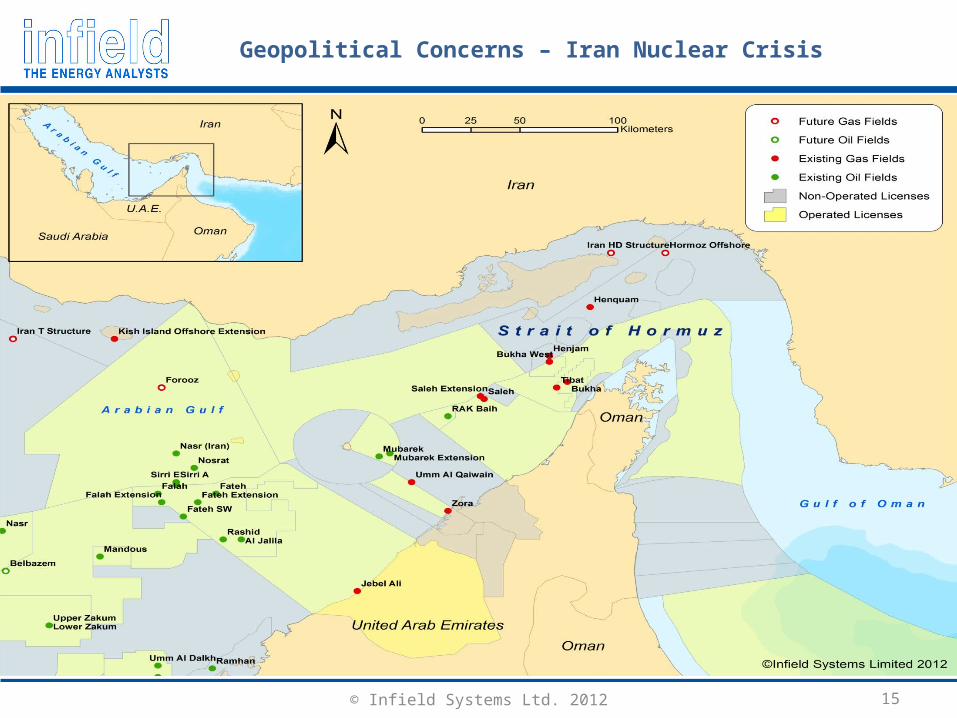
© Infield Systems Ltd. 2012 15
Geopolitical Concerns – Iran Nuclear Crisis

Geopolitical Concerns – The Receipt from The Arab Spring
© Infield Systems Ltd. 2011 16© Infield Systems Ltd. 2012
•Countries in the table now require an additional ~U$20-30/bbl to balance the books
•Saudi Arabia is looking for $90-100/bbl, up from $70/bbl previously to pay for its promised social welfare schemes
Country Costs to GDP Costs to Public Finances Total CostsLibya US$7.67bn US$6.49bn US$14.2bnSyria US$6.07bn US$21.22bn US$27.3bnEgypt US$4.27bn US$5.52bn US$9.79bnTunisia US$2.03bn US$0.49bn US$2.52bnBahrain US$0.39bn US$0.69bn US$1.09bnYemen US$0.12bn US$0.12bn US$0.98bnSub-Totals US$20.56bn US$35.28bn US$55.84bn

© Infield Systems Ltd. 2012 17
0
20
40
60
80
100
120
140
160
JAN MAY SEP JAN MAY SEP JAN MAY SEP JAN MAY SEP JAN MAY SEP JAN MAY SEP JAN MAY SEP JAN MAY SEP JAN MAY SEP JAN MAY SEP JAN
$/b
arre
l
Brent WTI
2002 2003 2004 2005 2006 2007 2008 2009 2010 2011 2012 2013 2014
Brent and WTI Oil Prices
Oil Price Volatility and Spread Between WTI and Brent
Narrower Spread
Oil price premiums maintained by the “Iranian nuclear crisis”
© Infield Systems Ltd. 2012 18
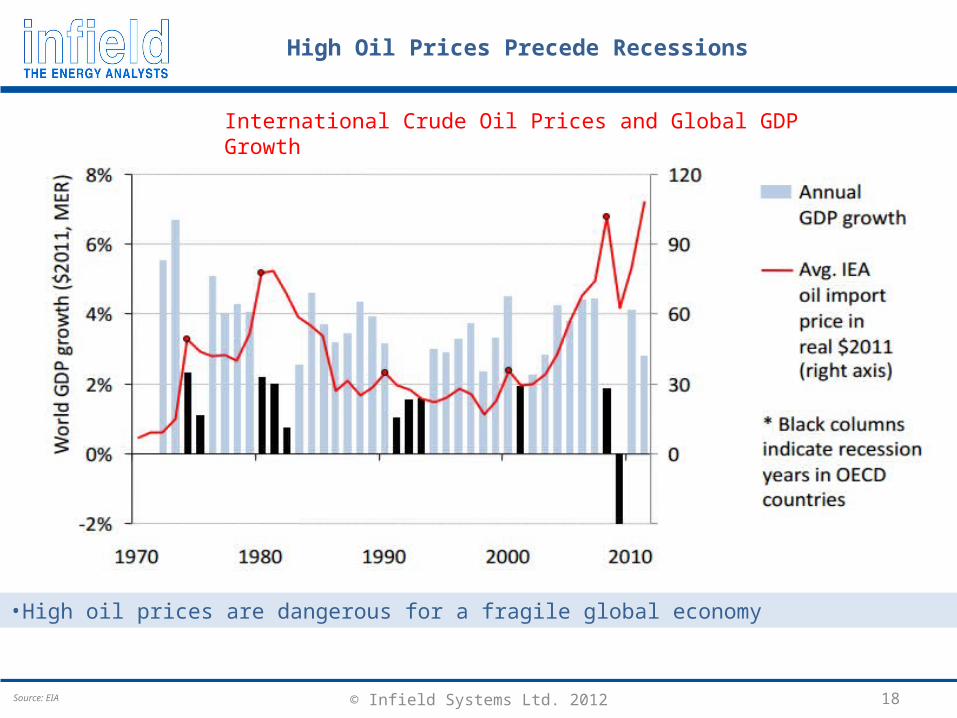
High Oil Prices Precede Recessions
Source: EIA
International Crude Oil Prices and Global GDP Growth
•High oil prices are dangerous for a fragile global economy

© Infield Systems Ltd. 2012
Global Offshore Capex 2012-2016 – Healthy Capex Going Forward
19
Global Offshore Capex: US$539bn
Australasia:US$43bn
Latin America:US$90bn
North America:US$65bn
Asia:US$92bn
Europe:US$99bn Middle East:US$54bn
Shallow58%
Deep21%
Ultradeep21%
Shallow83%
Deep13%
Ultradeep4%
Shallow85%
Deep15%
Ultradeep56%Shallow
24%
Deep20%
Shallow82%
Deep14%
Ultradeep4%
Deep47%
Shallow33%
Ultradeep20%
Ultradeep52%
Deep26%
Shallow22%
Shallow91%
Ultradeep7%
Deep2%
Shallow <500m, Deep 500m<X<1,499m, Ultra Deep>1,499m
Global Offshore Capex includes Detailed Engineering, Development Drilling, Installation, Procurement and Construction
Africa:US$96bn

© Infield Systems Ltd. 2012 20
IOR/EOR Global Overview“Extending the project lifetime of
mature fields”
© Infield Systems Ltd. 2011 21© Infield Systems Ltd. 2012
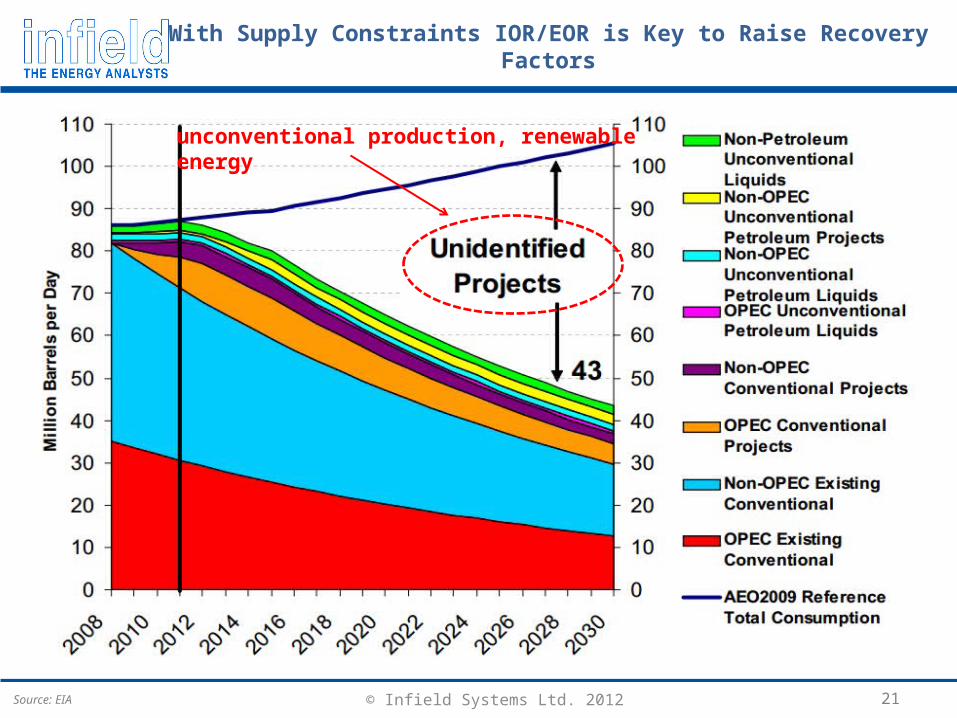
With Supply Constraints IOR/EOR is Key to Raise Recovery Factors
unconventional production, renewableenergy
Source: EIA

© Infield Systems Ltd. 2012 22
IOR/EOR More Relevant Than Ever – Why?
Approximately 70% of global oil production originates from mature fields (approximately 35% of the oil in place is recoverable through conventional production methods)
No more easy oil plays (geologically complex reservoirs in deeper, more remote and/or harsh environments)
Most EOR projects are onshore, however with recent advances in technology, offshore projects now offer considerable opportunities
Higher oil prices improve the project economics of IOR/EOR applications, mostly offshore
EOR not restricted to brownfield projects, increasing applications for greenfield projects (e.g. heavy oil)
Conventional Recovery Enhanced Recovery
IOR (improved oil recovery)
Primary Recovery
e.g. natural flow, artificial lift
Secondary Recovery
e.g. waterflood, artificial pressure
maintenance (WAG)
EOR (enhanced oil recovery)
Tertiary Recovery
e.g. Thermal, polymer, solvent

© Infield Systems Ltd. 2012 23
Major IOR/EOR Challenges Offshore
•Environmental challenges (e.g. pressure, weather)
•Geological constraints (e.g. lithology of the reservoir)
•Cost (e.g. higher cost base for infrastructures offshore compared to onshore)
•Increased logistics and maintenance (e.g. remoteness, access to injectants)
•Risk management (e.g. geologic carbon sequestration leakage risk)
Mostly Water and Gas injections methods used offshore
Statoil Tordis - IOR Subsea Module
Source: Picture courtesy of Statoil

© Infield Systems Ltd. 2012 24
Global Subsea Well Injections 2012-2020
Subsea Completions (unit) by Injectants 2012-2020 Subsea Completions (unit) by Regions 2012-2020
Global Subsea Completions Capex (US$m) 2012-2020
0
20
40
60
80
100
120
140
160
180
200
2012 2013 2014 2015 2016 2017 2018 2019 2020
Africa Latin AmericaEurope North AmericaAsia AustralasiaMiddle East & Caspian Sea
Un
its
0
1,000
2,000
3,000
4,000
5,000
6,000
7,000
8,000
9,000
2012 2013 2014 2015 2016 2017 2018 2019 2020
Development Drilling Procurement And Construction
Installation Detailed Engineering
US
$m
0
20
40
60
80
100
120
140
160
180
200
2012 2013 2014 2015 2016 2017 2018 2019 2020
Water Gas CO2 WAG
Un
its
© Infield Systems Ltd. 2012 25
Conclusions
For now, IOR/EOR applications are mostly used onshore, but great potential offshore
High oil prices support the sanctioning of more IOR/EOR applications offshore, although environmental limitations are still a major concern
The development (through technology and innovation) of IOR/EOR applications is crucial to fill the growing gap between declining global oil production and emerging economies oil consumption

© Infield Systems Ltd. 2012 26
Questions????
Thank You

© Infield Systems Ltd. 2012 27
The information contained in this document is believed to be accurate, but no representation or warranty, express or implied, is made by Infield Systems Limited as to the completeness, accuracy or fairness of any information contained in it, and we do not accept any responsibility in relation to such information whether fact, opinion or conclusion that the reader may draw. The views expressed are those of the individual contributors and do not represent those of the publishers.
Some of the statements contained in this document are forward-looking statements. Forward looking statements include but are not limited to, statements concerning estimates of recoverable hydrocarbons, expected hydrocarbon prices, expected costs, numbers of development units, statements relating to the continued advancement of the industry’s projects and other statements which are not historical facts. When used in this document, and in other published information of the Company, the words such as "could," "estimate," "expect," "intend," "may," "potential," "should," and similar expressions are forward-looking statements. Although the Company believes that its expectations reflected in the forward-looking statements are reasonable, such statements involve risk and uncertainties and no assurance can be given that actual results will be consistent with these forward-looking statements. Various factors could cause actual results to differ from these forward-looking statements including the potential for the industry’s projects to experience technical or mechanical problems or changes in financial decisions, geological conditions in the reservoir may not result in a commercial level of oil and gas production, changes in product prices and other risks not anticipated by the Company. Since forward-looking statements address future events and conditions, by their very nature, they involve inherent risks and uncertainties.
Forward Looking Disclaimer