2010 GUIDE TO SHarepoint
13
2010 GUIDE TO SHAREPOINT By Andrew J. Brust & Brien M. Posey Microsoft PowerPivot: Making Excel Analytics Work Going with the Flow: Using workflows in SharePoint 2010 is a good way to automate complex business processes 1 8
Transcript of 2010 GUIDE TO SHarepoint

2010 GUIDE TO SHarepoint
By Andrew J. Brust & Brien M. Posey
Microsoft powerpivot:Making Excel Analytics Work
Going with the Flow:Using workflows inSharePoint 2010 is a good way to automatecomplex business processes
18
| redmondmag.com | Redmond | September 2010 | 1IMAGE FROM SHUTTERSTOCK
Microsoft PowerPivot:Making Excel Analytics Work
A new component in SQL Server 2008 R2 gives users the autonomy to set up business intelligence functionality in Excel without taking control of the process away from IT.
PowerPivot is Microsoft’s new self-service business intelligence (BI) product that seeks to make peace between IT and Excel users. PowerPivot is a component of SQL Server 2008 R2 that works with
Excel 2010 and SharePoint Server 2010. It tries to do the heretofore unachievable: Provide power users with real BI capabilities that harness the data-analysis functionality of Excel, without the dangers and control issues that are normally part of the equation.
In the realm of IT, the use of Excel as a data-analysis tool is a near certainty. No matter how much IT—and, indeed, BI—professionals wish this phenom-enon would go away, the reality is that it probably never will. Yes, data management in a spreadsheet carries with it inefficiencies and risk, but users are comfortable with Excel.
Spreadmarts: Good and evilUser autonomy isn’t a bad thing, but chaos is. The question with Excel in many organizations is whether users can use the software as a modeling and analysis tool but avoid using it to create “spreadmart” solutions—spreadsheet-hosted data marts.
To answer that question, let’s enumerate the problems spreadmart solutions typically introduce.
Spreadmarts are suboptimal and sometimes down-right dangerous for a number of reasons:
• Once data is imported into spreadsheets, it’s typically never refreshed or updated, leading to stale, obsolete reports and analyses or burdensome and error-prone manual updates.
By Andrew J. Brust

2 | September 2010 | Redmond | redmondmag.com |
• Spreadmart “deployment” is typically achieved though e-mail attachment; this is both inefficient and insecure.
• Each user gets a private copy of the spreadmart, along with the ability to modify its data, possibly leading to publication of incorrect results and the liabilities associated with them.
• Should the spreadmart’s queries be modified beyond their initial configuration, performance can be sorely lacking. Excel is a decent database client, but it’s not a database engine—and it’s definitely not an online analytical processing (OLAP) or BI engine.
• If someone in a business unit designs a good spreadsheet-based analytics solution, it may become popular and even crucial to the business, requiring redesign using formal BI technology. But if IT doesn’t know about this user-generated solution, it can’t intervene for proper implementation.
enter powerpivotIn designing PowerPivot, Microsoft sought to address each of these issues. On the client, PowerPivot is a free down-loadable add-in to Excel 2010 that allows users to import data from a dizzying array of sources. It allows data to be modeled, but not modified, and can then push that data to Excel for analysis using PivotTables, PivotCharts and Slicers (a filtering UI feature new to Excel 2010). This analysis is made possible by a true BI engine, running on the desktop and providing incredibly fast query response on data sets that can contain millions of rows.
But PowerPivot is not a client-only solution, and its server component is where typical spreadmart risk is mitigated. For example, PowerPivot solutions are published to SharePoint 2010 rather than via e-mail. This lets other users view and interact with them in the browser, where the solutions are still fully interactive and served by a SharePoint-managed server version of the desktop engine. Better yet, once PowerPivot solutions are published to SharePoint, their constituent data sources can be refreshed on a scheduled basis. Moreover, IT can monitor usage of these solutions and determine if one or more of them has popularity that’s catapulting it past the PowerPivot scale.
Building the ModelThe PowerPivot workflow starts on the client. With the add-in installed, a PowerPivot tab is added to the Excel Ribbon interface. The leftmost button on that Ribbon tab opens the PowerPivot window, a sort of Microsoft Query on steroids, where data can be imported and modeled. Data sources include specialized options for major databases and data ware-house products, ATOM data feeds, flat files, spreadsheets and more. Figure 1 shows the Connect to a Data Source screen of the PowerPivot Table Import Wizard, which lists all external data source options.
If you look carefully at Figure 1, you’ll notice one or two unlikely options. First of all, Analysis Services OLAP cubes can be used as a data source; this provides an excellent way to bring authoritative master data (like customer names, sales divisions and more) into a PowerPivot model. Second, Reporting Services (SSRS) reports, provided they were done with the SQL Server 2008 R2 version of SSRS, can be used
as data sources as well. This is useful for two reasons. First, spreadmart makers use reports as data sources all the time; PowerPivot allows them to continue to do so but ensures that the reports can function as refreshable data sources instead of sources for static, cut-and-pasted data. Second, because SSRS can connect to data sources that other Microsoft BI tools can’t connect to—including SAP NetWeaver BI (also known as SAP BW) and Hyperion Essbase—PowerPivot gains coveted connectivity to those data sources as well.
Further inspection of Figure 1 reveals that PowerPivot can import data from any database that has an Object Linking and Embedding database provider or Open Database Connectivity (ODBC) driver available. The SQL generated by PowerPivot to query those databases may not be as opti-mized as it would be for databases that are explicitly listed as
Figure 1. PowerPivot lets users import data from almost any database, plus OLAP cubes, flat files, spreadsheets and OData feeds.
PowerPivot
Who is Mimosa Systems? Mimosa Systems enables enterprises to efficiently manage their unstructured and semi-structured information, while reducing
business process costs and risk. As the recognized visionary in enterprise content archiving, Mimosa is driving innovation in the industry and is continually delivering cutting-edge solutions to address the evolving needs of customers around archiving, retention, ediscovery and backup. SharePoint Archiving with Mimosa Systems:Protect your Organization from Costly Growth and Possible eDiscovery NightmaresAccording to an Enterprise Storage Group research article, around one in three (33%) North American and Western European organizations are currently using SharePoint and an additional 13% plan to do so in the near future. In fact, SharePoint is the fastest growing server product for Microsoft today. With fast growth and rapid adoption come many challenges, as nearly one quarter (25%) of early adopters believe the backup process is more challenging for SharePoint than for other applications. With most mailboxes and file shares blocked with storage limits, SharePoint is rapidly becoming the next dumping ground in organizations and special care needs to be taken to prevent excessive growth. In addition to the increased use of SharePoint as a dumping ground by users, the rapid growth of document libraries is also caused by the lack of deduplication of content within SharePoint.
It is apparent that organizations are still confused about the difference between backup and archiving since more than half (54%) of those archiving SharePoint are using traditional backup applications to do so—which is the wrong approach to solve this growing problem. Archiving, as in moving content from expensive SharePoint document libraries to cheaper storage, makes sense from a cost and growth management perspective. It allows for the content to still be accessible for the end user, while reducing the cost associated with large SharePoint farms. By implementing an archiving strategy organizations also gain the benefit of improved backup and recovery times, and assistance with complying with regulations and policies that can be hard to track and support. These increasingly stricter compliance policies affect all content in an organization and the inevitable eDiscovery requests that will come not only require email content to be handed over, but also content residing inside SharePoint farms. For more information please visit www.mimosasystems.com/spbackup to get a copy of our new whitepaper, “Backup and Recovery Challenges with SharePoint.”
Mimosa Systems: Next Generation Archiving Solutions
ADVERTISEMENT
REDMOND VENDOR PROFILERVP
For more information please visit:www.mimosasystems.com/spbackup

4 | Month 2010 | Redmond | redmondmag.com |4 | June 2010 | Redmond | redmondmag.com |
compatible, but the data is nonetheless retrievable. PowerPivot can also use as a data source any Excel spread-sheet region formatted as a table, and it can be linked dynamically so that if the content of the table is updated, the PowerPivot model is automatically updated as well. PowerPivot can even import data from the Windows clip-board. And, not insignificantly, the “Other Feeds” option is compatible with any data source using Microsoft ATOM-based Open Data Protocol (OData) format.
Once tables are imported into the PowerPivot client, it’s possible to define relationships between them. For tables that emanate from the same data source, these relation-ships are often defined automatically by PowerPivot itself. Where heterogeneous data sources are concerned, the relationships (meaning the data columns in each of two tables that can be used to associate those tables’ data) can
be specified through a simple dialog box, or can later be generated automatically in Excel.
Additionally, columns can be added to any table using an Excel-like formula language called Data Analysis Expressions (DAX). These formulas can perform anything from simple arithmetic operations in other columns in the table to com-plex statistical functions over a range of data filtered on values in a related table. What this all means is that sophisticated analytics can be crafted by power users who are already com-fortable using Excel formulas in an advanced manner. What’s also important is that using DAX formulas in PowerPivot models is completely optional.
the Model’s architectureGoing through the workflow of importing and relating various data tables and building calculations on their data in new columns produces the PowerPivot model. This model is then queried from Excel to render aggregations and drill-down detail. For example, if you imported a table with sales data in it, as well as reference data tables with geographic and time data, this could allow you to build PivotTables and charts in
Excel that would permit you to see sales aggregated by year and country, with the ability to drill down any year into calendar quarters and any country into states, provinces and cities.
If the process of importing data from numerous external sources and then performing optimized drill-down analysis of that data sounds familiar, it should: This is what SQL Server Analysis Services and OLAP make possible. And the good news is that PowerPivot is Analysis Services, albeit a special version with a new storage engine (which we’ll discuss shortly). So, users get an industry-standard technology but need not be aware of esoteric OLAP concepts such as cubes, measures, dimensions and aggregations. The beauty of PowerPivot is that users think they’re just importing tables and building a “model,” but it turns out that model is an Analysis Services cube. And that means that it can be queried, managed and updated in a rigorous way—it’s not just a spreadsheet.
Although PowerPivot is based on Analysis Services technology, it uses a radically different storage technology than the multidimensional OLAP storage used by the full Analysis Services product. Instead of storing things multidimensionally, PowerPivot stores data in a columnar fashion, so all values for a given column or field are adjacent to each other. This pro-vides high rates of compression, because values in the same column tend to be relatively close, or even identical, in value. This compression in turn allows the entire cube to be loaded into memory, which provides for incredibly fast query
performance, without the need for typical Analysis Services optimizations like partitioning or pre-calculated aggregations.
Using the ModelOnce the model is built, the PowerPivot user simply clicks a button on the PowerPivot client application Ribbon, which creates a data source in the spreadsheet (pointing to its own embedded PowerPivot model), and then generates empty PivotTable and chart objects that are bound to that data source. Rather than the standard PivotTable field list, the user sees one that, instead of listing measures, dimensions and other Analysis Services objects, enumerates a simple list of all the model’s tables with each of their columns indented beneath them. From here, the user can drag columns into the Values, Row Labels, Column Labels and Report Filter areas just as they could with a conventional PivotTable.
People who build a lot of PivotTables know that use of Report Filters can make PivotTables very compelling to consumers of information. The problem, however, is that the filter UI, a drop-down check list, is less than user-friendly. In response to this, Excel 2010 introduced a new feature called Slicers, which allows column values to be displayed in
Figure 2. PowerPivot analysis in Excel.
4 | September 2010 | Redmond | redmondmag.com |
PowerPivot

6 | September 2010 | Redmond | redmondmag.com |
expanded, attractive lists that ride up the side—and along the top—of the PivotTables and charts in a spreadsheet. Creating Slicers is achieved by simply dragging columns into the Slicers Vertical and Slicers Horizontal areas in the PowerPivot Task Pane. Slicers are an Excel feature designed by the Analysis Services team for use with PowerPivot models, but they can, in fact, be used with non-PowerPivot PivotTables as well.
By default, if your PowerPivot spreadsheet contains both a PivotTable and chart—even if they have different content—the Slicers will affect both. Slicers are also contextual: If making a selection in one renders invalid certain values in another, then those other values will gray out. For example, imagine that in our PowerPivot model we have no data for France in the year 2005. Selecting 2005 in a year Slicer would disable the selec-tion of France in another Slicer built on country (and vice-versa). Figure 2 (p. 4) depicts a spreadsheet built on a PowerPivot model.
Client, Yes, but Server tooHaving such power on the desktop PC is great, but the real value of PowerPivot is realized when spreadsheets containing its models, along with the PivotTables and charts built atop those models, are published to SharePoint. Once deployed to SharePoint, PowerPivot models can actually be viewed in the browser, and users doing so retain the ability to perform drill downs and make filter selections with Slicers. This is done using only AJAX Web technology—no plug-ins, ActiveX or Java components are used.
But the server story benefits IT as much as it does users. Once a PowerPivot solution is published to SharePoint, IT can schedule refreshes of its data sources and monitor usage and server health metrics in a very precise way using the PowerPivot IT dashboard, shown in Figure 3. This way, IT can actually have insight into how these solutions may be performing and affecting operation of the SharePoint farm. (Performance over time is visualized in the top chart in Figure 3.) Because the server component of PowerPivot—which is invoked when users browse PowerPivot spreadsheets in the browser—is a SharePoint-managed service, instances of it can be spun up or shut down, depending on demand.
Finally, PowerPivot solutions whose popularity grows continuously can be identified proactively—spreadsheet usage over time is visualized in the bubble chart on the bottom of Figure 3—thus allowing IT to select those cubes
for more formal implementation, using the full version of Analysis Services, by BI professionals when required.
to Use or not to Use?PowerPivot solves almost every major problem associated with typical spreadmart solutions. It gives users a powerful
columnar, in-memory BI engine to do real analytics in a self-service manner. It keeps the source data locked down. It allows collaboration and sharing using a central server, rather than e-mail, thereby providing security and scalability, enabling the data to be refreshed, and allowing IT to manage performance and have insight into which user-generated BI solutions are meeting company needs. The self-service and reliable nature of PowerPivot eases delivery and backlog burdens on IT, and the SharePoint integration gives IT the control, management and monitoring capabilities that nor-mally accompany self-service solutions.
All this gives PowerPivot the potential to change the BI game significantly. End users will have greater capabilities, which they will be empowered to implement. IT, mean-while, can meet its responsibility to manage performance and stability, and to ensure that data is properly and cen-trally managed.
Andrew J. Brust ([email protected]) is chief of new technology at consultancy twentysix New York, as well as a Microsoft regional director and MVP. He is co-author of “Programming Microsoft SQL Server 2008” (Microsoft Press, 2008) and a contributing editor to Redmond sister publication Visual Studio Magazine, where he contributes his Redmond Review column (tinyurl.com/27mkc8p) and the Redmond Diary blog (tinyurl.com/y8kwtyn).
Figure 3. The PowerPivot IT dashboard, with performance chart above and spreadsheet usage statistics below.
PowerPivot

As far back as Microsoft Office SharePoint Server (MOSS) 2007, Microsoft sought to resolve this problem with SharePoint workflows, which are essentially approval-routing mechanisms. Suppose someone in your marketing department came up with a new advertisement. They wouldn’t just send the advertisement directly to an ad agency. There’s a whole chain of requisite internal approvals.
The ad would have to go to an edi-tor, through the company’s legal department, and possibly to a senior executive before it’s ever sent to the outside world. The problem with such approval requirements is that people are busy. Tasks like this can slip through the cracks. Any number of human errors could derail the approv-al routing process.
SharePoint workflows are designed to automate such processes. You can even design a workflow to send a reminder or automatically contact a manager when someone neglects a task.
Workflows played a prominent role in MOSS 2007, but as great as they were, they tended to be a bit rigid. For the most part, administrators were forced to work within the confines of the Share-Point GUI when creating workflows.
Microsoft has built much more flexi-bility into the process of creating work-flows in SharePoint 2010. Although
you can still use the SharePoint GUI to associate a workflow with a list or library, you’ll have to create the work-flow outside of SharePoint (unless you use one of the built-in workflows).
Consequently, Microsoft gives you several different tools for creating workflows. If you’re a professional developer, your tool of choice will
likely be Visual Studio 2010. If you’re not into writing code, you’ll be better off using Visio 2010 and SharePoint Designer 2010.
Venturing Forth with VisioThe thought of using Visio 2010 to create SharePoint workflows seemed a bit strange at first. Visio is widely used for creating network diagrams, but most wouldn’t consider it a devel-opment tool. However, one of the primary features of Visio is creating
flowcharts, so it makes perfect sense. Anyone who’s taken an introductory computer programming class knows one of the first lessons is how to create a flowchart. That’s because creating a flowchart is often the first step in writing a program. Because Share-Point workflows are really nothing more than simple programs, is it really such a stretch to use an application that’s designed to create flowcharts to facilitate the creation of SharePoint workflows?
Before using Visio 2010 to create a SharePoint workflow, there are two important things you need to know. First, you won’t be using Visio 2010 to create the workflow in its final form. Instead, you’ll use Visio to
create a reusable workflow template you can then import into SharePoint Designer where you’ll complete the workflow. Second, this will only work if you have Visio 2010 Premium. The Standard and Professional editions of Visio 2010 don’t include any Share-Point-specific features.
Developing a WorkflowTo create a workflow, open Visio 2010 and select the File tab. When you do, you’ll be prompted as to what type of diagram you want to create. Choose
By Brien Posey
Going with the Flow
Many of the applications organizations use today automate complex business processes. Auto-mating electronic processes, like automatically
routing an e-mail to the correct recipient, is fairly straight-forward. It’s much more difficult to automate processes involving manual interaction.
MAGAZINE practicalapp Content provided by TechNet Magazine, Microsoft’s premier publication for IT Professionals
Using workflows in Sharepoint 2010 is a good way to automate complex business processes.
Microsoft has built much more flexibility into the process of creating workflows in SharePoint 2010.
8 | September 2010 | Redmond | redmondmag.com |
WITH IDERA TOOLS FOR SHAREPOINT, YOU CAN…Migrate Data From SharePoint 2003 to 2007 to 2010
Find Out Who Has Access to What Recover
Sites
Recover Documents Even When SharePoint is Down Delete Dead
Accounts Find Out
How Permissi
oint Content
Across Multiple Backup Sets
Alert On Failed Backup Jobs
Reorganize Data
Compare and Deploy Sites
Recover List and List Items
Monitor Server Performance
Tag Content Intelligently Balance
Backup Jobs Across Servers
TOOLS FOR SHAREPOINT
WWW.IDERA.COM
DOWNLOAD A FREE TRIAL NOW!idera.com/SharePointTools
DO IT ALL!
Untitled-1 1 7/16/10 11:36 AM
10 | September 2010 | Redmond | redmondmag.com |
the Flowchart option, then double-click the Microsoft SharePoint Work-flow option.
At this point, you’ll be taken to the main Visio screen. Here you can actu-ally begin developing your workflow. If you’ve never used Visio, you’ll have to get used to the process of creat-ing a workflow. The left side of the screen contains several collections of icons. These icons are grouped into collections of Actions, Conditions and Workflow Terminators. Drag the icons onto the Visio drawing and arrange them in such a way that facili-tates your workflow.
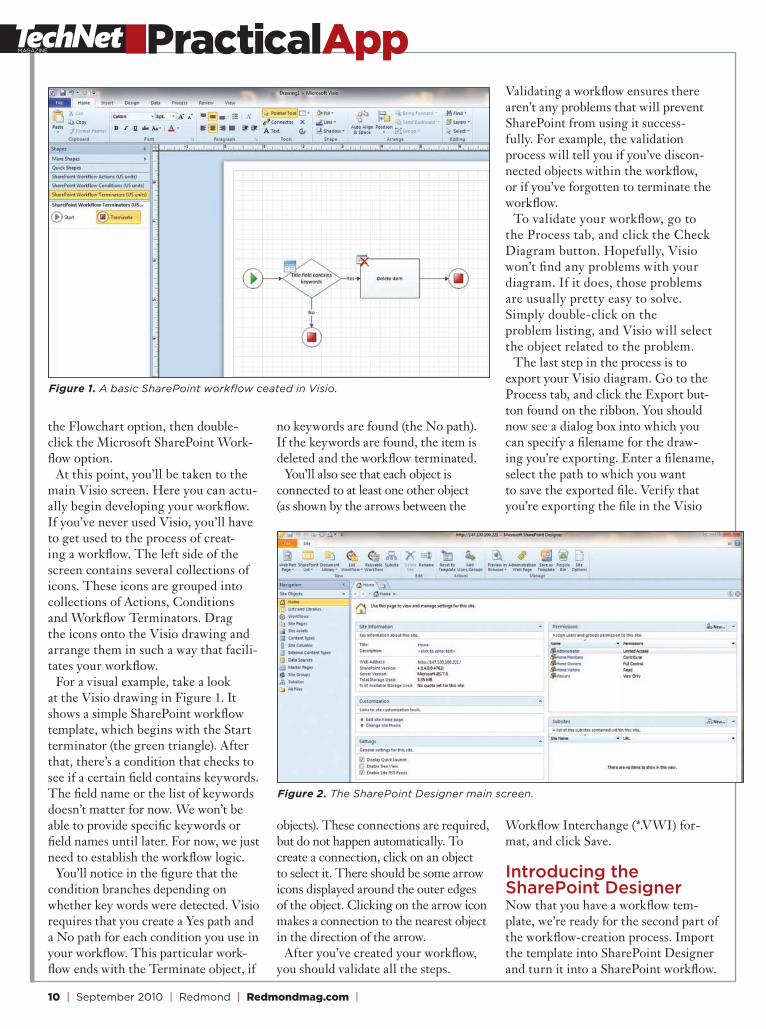
For a visual example, take a look at the Visio drawing in Figure 1. It shows a simple SharePoint workflow template, which begins with the Start terminator (the green triangle). After that, there’s a condition that checks to see if a certain field contains keywords. The field name or the list of keywords doesn’t matter for now. We won’t be able to provide specific keywords or field names until later. For now, we just need to establish the workflow logic.
You’ll notice in the figure that the condition branches depending on whether key words were detected. Visio requires that you create a Yes path and a No path for each condition you use in your workflow. This particular work-flow ends with the Terminate object, if
no keywords are found (the No path). If the keywords are found, the item is deleted and the workflow terminated.
You’ll also see that each object is connected to at least one other object (as shown by the arrows between the
objects). These connections are required, but do not happen automatically. To create a connection, click on an object to select it. There should be some arrow icons displayed around the outer edges of the object. Clicking on the arrow icon makes a connection to the nearest object in the direction of the arrow.
After you’ve created your workflow, you should validate all the steps.
Validating a workflow ensures there aren’t any problems that will prevent SharePoint from using it success-fully. For example, the validation process will tell you if you’ve discon-nected objects within the workflow, or if you’ve forgotten to terminate the workflow.
To validate your workflow, go to the Process tab, and click the Check Diagram button. Hopefully, Visio won’t find any problems with your diagram. If it does, those problems are usually pretty easy to solve. Simply double-click on the problem listing, and Visio will select the object related to the problem.
The last step in the process is to export your Visio diagram. Go to the Process tab, and click the Export but-ton found on the ribbon. You should now see a dialog box into which you can specify a filename for the draw-ing you’re exporting. Enter a filename, select the path to which you want to save the exported file. Verify that you’re exporting the file in the Visio
Workflow Interchange (*.VWI) for-mat, and click Save.
Introducing the SharePoint DesignerNow that you have a workflow tem-plate, we’re ready for the second part of the workflow-creation process. Import the template into SharePoint Designer and turn it into a SharePoint workflow.
MAGAZINE practicalapp
Figure 1. A basic SharePoint workflow ceated in Visio.
Figure 2. The SharePoint Designer main screen.

| redmondmag.com | Redmond | September 2010 | 11
SharePoint Designer 2010 designs and customizes SharePoint sites, which are actually designed to be highly customizable. However, there’s only so much customization you can do from within the SharePoint Web interface. The SharePoint Designer takes SharePoint site customization to the next level.
SharePoint Designer is available for free (download the 32-bit version at tinyurl.com/2ex9o45; the 64-bit at tinyurl.com/26takrs).
Using SharePoint DesignerOnce you’ve downloaded and installed the SharePoint Designer, open it and attach it to the SharePoint site you want to modify. To do so, launch the SharePoint Designer, and then click the Open Site button.
You’ll be prompted to specify the site you want to open. Enter your SharePoint site URL and click the Open button. When you do, you’ll be taken to the main SharePoint Designer screen, shown in Figure 2.
You’ll notice that the list of Site Objects on the left side of the screen contains an object called Workflows. When you click on the Workflows object, you will see a listing for the three built-in workflows.
The built-in workflows are nice, but we need to import the workflow tem-plate we created in Visio 2010. To do so, click the Import from Visio button
located on the Workflows ribbon. You’ll be prompted to select a Visio drawing to import. Click the Browse button, and then select the draw-ing that you created earlier and click Open, followed by Next.
At this point, you’ll see a screen prompting you to name the workflow you’re importing. You’re also asked whether you want to import the work-flow as a list workflow or a reusable workflow. The difference is that a list workflow is bound to a specific compo-nent, whereas a reusable workflow can be used on the fly.
Upon making your selection, click Finish and the workflow will be imported. Once the import process is finished, you will be taken to the Workflow Editor, shown in Figure 3.
The Visio template created here is quite simple and doesn’t contain any specific logic. In other words, there’s a conditional statement within the tem-plate that looks for specific keywords, but we never told Visio what those keywords were.
Now we have the opportunity to add specifics to our template. In the case of the example workflow, click on the Keyword hyperlink and specify the actual keywords you want to check.
Once you’ve finished filling in the necessary elements within the work-flow template, click the Save icon. Now, if you click on the Workflows object within the list of Site Objects, you should see your newly created
workflow listed among the built-in workflows.
Click on the listing for your newly created workflow, and you will be taken to a tab for that workflow. Click on the Show Workflow Visualizations on Status Page check box, then click on the Publish button, located on the Workflow Settings ribbon.
Some Final Prep WorkBefore you can use the workflow you’ve just created, you’ll have to do a bit of configuration work on your SharePoint server. Specifically, you must verify that the Visio Web Access feature and the Visio Graphics Service are both active.
To do so, open your SharePoint site and choose the Site Settings command from the Site Actions menu. When the Site Settings page is loaded, click on the Manage Site Collection Features link. Make sure the SharePoint Server Enterprise Site Collection Feature is active. If it isn’t, then click the corre-sponding Activate button.
Next, open the SharePoint 2010 Central Administration console, and click on the Manage Services on Server link (located in the System Settings section). Now, verify that Visio Graphics Service is running. If it isn’t, then click on the Corresponding Start button.
The final step in the process is to associate the workflow you’ve created with a list or a library. To do so, simply open your Web browser and navigate to your SharePoint document library, and then click on the Library tab. When you do, you’ll see a ribbon corresponding to the document library. Click on the Workflow Settings button, followed by the Add a Workflow link. You’ll now have the opportunity to add your workflow to the document library.
Your new workflow is stored and ready for you to use or share with your colleagues. Brien Posey, MVP, is a freelance techni-cal author with thousands of articles and dozens of books to his credit. You can visit Posey’s Web site at brienposey.com.
Figure 3. The Workflow Editor allows you to make changes to your workflow.