(2010) Dangerous Disparities
35
Dangerous Disparities: The Rise in High Cost FHA Lending July 2010 Jordan Ash, Community Research for Action
-
Upload
jordan-ash -
Category
Documents
-
view
217 -
download
0
Transcript of (2010) Dangerous Disparities

8/17/2019 (2010) Dangerous Disparities
http://slidepdf.com/reader/full/2010-dangerous-disparities 1/35
DangerousDisparities:The Rise in
High CostFHA Lending
July 2010
Jordan Ash,Community Research for Action

8/17/2019 (2010) Dangerous Disparities
http://slidepdf.com/reader/full/2010-dangerous-disparities 2/35
2010 Report
2
Introduction and Summary of Findings 3
The Increase in FHA Lending 7
High-Cost FHA Loans 9
Disparities in High-Cost FHA Loans 10
High Cost FHA Loans and Big Banks 17
FHA Loans and Risk-Based Pricing 21
New FHA Changes 24
Conclusion and Recommendations 25
Appendices 27
Table of Contents

8/17/2019 (2010) Dangerous Disparities
http://slidepdf.com/reader/full/2010-dangerous-disparities 3/35
2010 Report
3
The Federal Housing Administration (FHA) was created at a time that in many waysresembled our current economic situation. As Federal Reserve Chairman Ben Bernankeexplained:
The housing sector, like the rest of the economy was profoundly affectedby the Great Depression. When Franklin Roosevelt took office in 1933,almost 10 percent of all homes were in foreclosure, constructionemployment had fallen by half from its late 1920s peak, and a bankingsystem near collapse was providing little new credit1.
In order to stimulate more mortgage lending and help lenders offer more attractive terms, theFHA provided a federally backed insurance system that would compensate lenders for theirlosses if homeowners defaulted on their loans.
FHA insurance has allowed lenders to make FHA loans with more flexible underwritingguidelines. Until very recently, FHA loans did not use credit scores. Borrowers had to havea good payment history on their bills, but their actual score was irrelevant.
The Federal Housing Administration (FHA) insures mortgages that meet FHA requirements
and that are made by FHA-approved lenders. If a homeowner defaults on an FHA mortgage,the insurance will pay the mortgage servicer so that the servicer does not incur any losses.
Tax-payers are not on the hook for the cost of protecting the banks and servicers againstlosses on FHA loans. The cost of the FHA insurance is paid by the homeowners as part oftheir mortgages, and typically homeowners have to pay the insurance until their remainingloan amount is seventy-eight percent of the value of the value of their home. (The premiumsthat homeowners pay fund not only the lender claims for losses but also the administrativecosts of the FHA.)
FHA loans have played an important and valuable role in helping boost homeownership inunderserved communities. By accepting modest down payments and not relying on creditscores, FHA loans have helped many families who otherwise would not have been able torealize their dream of home ownership. Seventy-nine percent of FHA purchase loans made
1 Ben Bernanke, speech at the Federal Reserve Bank of Kansas City Economic Symposium, (Jackson Hole, WY),August 31, 2007.
Introduction and Summary of Findings

8/17/2019 (2010) Dangerous Disparities
http://slidepdf.com/reader/full/2010-dangerous-disparities 4/35
2010 Report
4
last year were to first-time homebuyers, and thirty-two percent were made to minority first-time buyers2.
However, the program has a checkered past. From its inception until the passage of the FairHousing Act in 1968, the FHA openly engaged in redlining, The FHA had an explicit policy
that it would not insure mortgages made in minority or integrated neighborhoods. Sincelenders would not make loans without the insurance that protected them in case of default,this policy had the effect of denying credit to entire communities.
In the 1990’s the U.S. Department of Housing and Urban Development (HUD), whichoversees the FHA, uncovered a substantial amount of abuse in the FHA program by lendersand sellers seeking to take advantage of first-time homebuyers and using FHA loans to carryout property flipping scams.
More recently, FHA loans were used by sellers, especially homebuilders, with down
payment assistance programs that the IRS called “scams.” In these programs, the sellercontributed the amount of the down payment to a supposed non-profit group which“laundered” the money and then passed it on as a grant to the buyer. Loans with this type ofdown-payment assistance have defaulted at three times the rate of other FHA loans, but thelenders do not incur any losses since the loans were backed by HUD3.
In our current crisis, the FHA finds itself in a situation reminiscent of its origins during theDepression. As conventional mortgage lending has declined sharply over the last few years,FHA lending has been a major pillar propping up the ailing economy and preventing an evenmore devastating housing crash. There has been a huge increase in government-backed FHA
lending, both in the number of FHA loans made as well as the share of the overall mortgagemarket that FHA loans account for.
• Lenders made approximately 840,000 FHA purchase loans in 2008, almostthree times more than they made in 20064.
•In 2006 FHA loans made up less than 5% of the home purchase market. Now, just a few years later, FHA loans account for almost 30% of all home purchases5 and 40% of the purchases of newly constructed homes6.
2 U.S. Department of Housing and Urban Development, Federal Housing Administration Annual Management
Report: Fiscal Year2009.3 James Sterngold, “Reviving Down-Payment Assistance Program Faces FHA Opposition”, Business Week,
January 21, 2010.4 U.S. Department of Housing and Urban Development, “FHA-Insured Single-Family Mortgage Originations andMarket Share Report 2009 Q-3,” February 4, 2010.5 “FHA-Insured Single-Family Mortgage Originations”6 ,” U.S. Department of Housing and Urban Development, “FHA Single Family Activity in the Home PurchaseMarket through November 2009, February 23, 2010.

8/17/2019 (2010) Dangerous Disparities
http://slidepdf.com/reader/full/2010-dangerous-disparities 5/35
2010 Report
5
FHA mortgages are even more central to minority homeownership.
• In 2008, 51% of African-American homebuyers and 45% of Latinohomebuyers used an FHA loan to buy their home, compared to 27% of whitehomebuyers. In 2005, FHA loans had been used by just 9% of African-
American homebuyers and 5% of Latino homebuyers7.
With the increased role that FHA loans are playing in the mortgage market now, and theways that the program has been abused in the past, it’s more important than ever to makesure that FHA loans are meeting responsible lending standards.
One particular area of concern is the evidence indicating that African-Americans, Latinos,
and homebuyers in lower income and minority neighborhoods are paying higher rateson their FHA loans. Because of the nature of FHA lending, this disparity cannot justifiablybe attributed to the risk factors of different borrowers.
As the public awareness of the problems caused by subprime lending grew over the lastdecade, so too did the recognition of the racial disparities in the subprime market. Numerousstudies found that African-American and Latino borrowers received high-priced subprimemortgages far more frequently than whites did.
Mortgage lenders said they charged borrowers of color higher rates because they had worsecredit, but the Center for Responsible Lending found that African-American and Latinoswere a third more likely than whites to get a high-priced loan even when they were equallyqualified and had the same credit scores.8
In 2008 for the first time, a large number of FHA loans were classified as High-Cost9.
• In 2008 one out of every nine FHA purchase loans (11.6%) were consideredHigh-Cost; whereas in 2007 just one out of every forty (2.6%) was High-Cost.
African-Americans, Latinos, and homebuyers in lower income and minority neighborhoodswere significantly more likely to be given a High-Cost FHA loan. Nationally:
7
Shaun Donovan, Secretary of Housing and Urban Development, speech at the National Action NetworkReverend Dr. William A. Jones Memorial Luncheon, April 16, 2010, and Graciela Aponte, National Council ofLa Raza, “The Impact of FHA Reform on Latino and Other Underserved Communities”, testimony before theU.S. House Committee on Financial Services, March 11, 2010.8 Debbie Gruenstein Bocian, Keith S. Ernst, and Wei Li, “Unfair Lending: The Effect of Race and Ethnicity on thePrice of Subprime Mortgages,” May 31, 2006.9 The Home Mortgage Disclosure Act (HMDA) requires mortgage lenders to report information regarding theirhigh cost, or subprime, loans. High cost loans are defined by the Federal Reserve as having an annual percentagerate (APR) at least three percentage points higher than the rate on Treasury Security of the same length. Onaverage for 2008, this meant APRs above 7.25%.

8/17/2019 (2010) Dangerous Disparities
http://slidepdf.com/reader/full/2010-dangerous-disparities 6/35
2010 Report
6
• Homebuyers in low and moderate income neighborhoods were twice as likelyas homebuyers in upper-income neighborhoods to receive a High-Cost FHAmortgage10.
•Homebuyers in minority neighborhoods were one and half times more likelythan homebuyers in predominantly white neighborhoods to receive a High-CostFHA loan11.
• African-Americans and Latinos were one and a half times more likely thanwhites to receive a High-Cost loan when buying a house with an FHA mortgage.
In this report we examine the increase in originations of FHA home purchase loans, thepercentage of FHA purchase loans that were designated High-Cost, and the racial,geographic, and economic disparities in which homebuyers were more likely to receive a
High-Cost FHA loan.
We review these categories nationally and for the thirty largest individual metropolitanareas, looking at the aggregate of all mortgage lenders, as well as specifically for the fourlargest banks in the country, which are also the nation’s four largest mortgage lenders.
10 Low and moderate income neighborhoods are defined as census tracts in which the median income is less than80% of the Area Median Income (AMI). Upper income neighborhoods are census tracts in which the medianincome is above 120% of the AMI.11 Minority neighborhoods are defined as census tracts in which minority residents make up more than half of thepopulation. White neighborhoods are census tracts in which white residents make up at least 80% of thepopulation.

8/17/2019 (2010) Dangerous Disparities
http://slidepdf.com/reader/full/2010-dangerous-disparities 7/35
2010 Report
7
NATIONAL
The mortgage market has undergone significant changes over the last few years. There hasbeen a huge increase both in the number of FHA purchase loans originated and in the shareof the overall mortgage market that FHA loans account for.
The collapse of the subprime industry, the disappearance of the private securitization market,and greater restrictions imposed by private mortgage insurance companies resulted in a largedrop in conventional lending12.
• The number of conventional purchase loans fell from 3.9 million in 2006 to 2.9
million in 2007 and then to 1.5 million in 2008
13
.
As a result, more lenders turned to FHA loans, which could still be made easily since theywere backed by HUD. The Economic Stimulus Act of 2008 spurred additional FHA lendingby raising the size limits for FHA-insured loans in areas of the country with high housingprices14.
• The number of FHA purchase loans nationally almost tripled from less than300,000 in 2006 to over 840,000 in 200815.
• In 2006 FHA loans made up less than 5% of all purchase mortgages made inthe United States. Two years later FHA loans accounted for 24% of the purchasemortgage market, and this figure has continued to grow. In 2009, FHA loansmade up almost 30% all purchase mortgages16.
• In 2006 FHA loans made up less than 6% of all mortgages used to buy newhomes. By 2008 this had shot up to 27% and kept rising to almost 40% in200917.
12
Conventional loans are mortgage loans other than those insured or guaranteed by a government agency such asthe FHA, the VA (Veterans Administration), or the Rural Development Services (formerly know as FarmersHome Administration, or FmHA).13 Home Mortgage Disclosure Act (HMDA) data14 Robert B. Avery, Neil Bhutta, Kenneth P. Brevoort, Glenn B. Canner, and Christa N. Gibbs, “The 2008 HMDAData: The Mortgage Market During a Turbulent Year”, Board of Governors of the Federal Reserve System,September 23, 2009.15 FHA-Insured Single-Family Mortgage Originations”16 Ibid17 “FHA Single Family Activity in the Home Purchase Market”
The Increase in FHA Lending

8/17/2019 (2010) Dangerous Disparities
http://slidepdf.com/reader/full/2010-dangerous-disparities 8/35
2010 Report
8
Percentage of All Purchase Mortgages that are FHA Loans18
INDIVUDAL METROPOLITAN AREAS
FHA’s increased role in the mortgage market can also be seen in individualmetropolitan areas. From 2007 to 2008 the number of FHA purchase originationsincreased in all of the thirty largest metropolitan areas, and the number doubled intwenty-eight of the thirty metro areas.
The largest increases were in California, which has historically had low levels of FHAlending, primarily due to an FHA maximum loan limit that was far below the prices ofmuch of California’s housing stock. The number of FHA purchase originations
increased by over 1,000% in six of the thirty metropolitan areas,
The five metro areas with the largest percentage increase in the number of FHApurchase loans originated were: =San Francisco, CA (37,000% increase); Los Angeles,CA (3,524%); San Diego, CA (2,694%); Sacramento, CA (1,646%); and Riverside-SanBernardino, CA (1,462%).
Metropolitan Statistical Area Number of FHA
Originations in 2007
Number of FHA
Originations in 2008
San Francisco, CA 1 371
Los Angeles, CA 277 10,039Riverside-San Bernardino, CA 1,260 19,690
San Diego, CA 171 4,777
Sacramento, CA 459 8,013
The increase in FHA lending for each of the thirty largest metropolitan areas is listed in
Appendix A.
18 “FHA-Insured Single-Family Mortgage Originations”

8/17/2019 (2010) Dangerous Disparities
http://slidepdf.com/reader/full/2010-dangerous-disparities 9/35
2010 Report
9
In response to the growing concern about predatory lending and discriminatory pricing, the
Federal Reserve Board issued new guidelines for the Home Mortgage Disclosure Act(HMDA). Starting in 2004, lenders had to report loans that had a high rate, and thus wereconsidered subprime.
High Cost loans were defined in the HMDA guidelines as first mortgages with an AnnualPercentage Rate (APR) at least three percentage points above the rate on comparable U.S.Treasury securities. From 2005 through 2007 this meant an average APR close to 8%, while30-year fixed rate mortgages averaged around 6%. In 2008 on average, the threshold forwhether a mortgage was High Cost was an APR above 7.25%
As shown in the chart below, High Cost subprime loans were mostly limited to conventionalmortgages. The conventional market used “risk-based pricing”, which in theory meant thatlenders charged higher rates to compensate for the greater risk of certain borrowers. Incontrast, with FHA loans borrowers either qualified or they didn’t. Lenders were notsupposed to charge higher rates based on the risk – because the lender in fact assumes no riskon a borrower whose loan is underwritten by the FHA.
However, in 2008 for the first time there were a significant number of FHA loans that wereHigh-Cost. One out of every nine FHA purchase loans was High-Cost.
Percentage of Purchase Loans That Were High CostType of Loan 2004 2005 2006 2007 2008
Conventional 11.6% 24.6% 25.4% 14.1% 7.3%
FHA 1.6% 1.2% 2.6% 4.3% 11.6%
According to researchers at the Federal Reserve, the increase in High Cost FHA loans wasnot due to lenders charging higher rates than they previously had, but instead to several otherfactors, such as: using the rate on Treasury securities as a baseline threshold; the change inthe relationship between short-term and longer-term yields; and FHA insurance andguarantee fees19.
However, the Fed’s rationale would not explain the racial, economic, and geographicdisparities in terms of which homebuyers paid the higher rates, which will be examined ingreater detail below.
19 Avery, Bhutta, Brevoort, Canner, and Gibbs. The Federal Reserve Board changed its guidelines in 2008 so thatfor loans made in 2010 and after, whether or not a loan was High-Cost would be determined by a comparison tothe rate for prime mortgages found in Freddie Mac’s Prime Mortgage Market Survey, instead of Treasury rates.
High-Cost FHA Loans

8/17/2019 (2010) Dangerous Disparities
http://slidepdf.com/reader/full/2010-dangerous-disparities 10/35
2010 Report
10
The racial, economic, and geographic disparities in High Cost FHA loans have been presentsince the HMDA rule change went into effect in 2004. These disparities have received littleattention previously because of the small number of FHA loans made, relative to conventionalloans, and because of the relatively small percentage of FHA loans that were considered HighCost, compared to the much larger percentage of conventional loans. Now that FHA loans areplaying a much bigger role in the mortgage market and the percentage of FHA loansconsidered High Cost has increased, this disparity demands attention.
Unlike with conventional loans, these disparities cannot be explained by lender claims thatsome borrowers were charged more due to differences in credit or other circumstances thatposed a greater risk. FHA loans do not use the same type of risk-based pricing as conventionalsubprime loans used. Generally, a borrower’s credit is either good enough to get an FHA loanor it’s not.
GEOGRAPHIC DISPARITIES
While the greater percentage of FHA loans that were High Cost increased in all 30 of thelargest metropolitan areas between 2007 and 2008, the percentages varied widely. Thepercentages in 2008 ranged from 3% in Portland, Oregon to 25% in Detroit, Michigan.
Areas with the Highest Percentage of High Cost FHA Loans in 2008
Metropolitan Statistical Area 2008 2007Detroit, MI 25% 16%
New York, NY 21% 18%
Los Angeles, CA 17% 3%
San Francisco, CA 17% 0%
Miami, FL 17% 6%
Areas with the Lowest Percentage of High Cost FHA Loans in 2008
Metropolitan Statistical Area 2008 2007
Denver, CO 7% 1%
Washington, DC 7% 3%
Seattle, WA 6% 1%
Minneapolis, MN 5% 1%
Portland, OR 3% 1%
The percentages of FHA loans in 2008 and 2007 that were High Cost in each of the thirty
largest metropolitan areas are listed in Appendix B.
Disparities in High Cost FHA Loans
8/17/2019 (2010) Dangerous Disparities
http://slidepdf.com/reader/full/2010-dangerous-disparities 11/35
2010 Report
11
ECONOMIC DISPARITIES
NATIONAL
The racial, economic, and geographic disparities in High Cost FHA loans have been present
since the HMDA rule change went into effect in 2004. These disparities have received littleattention previously because of the small number of FHA loans made, relative to conventionalloans, and because of the relatively small percentage of FHA loans that were considered HighCost, compared to the much larger percentage of conventional loans. Now that FHA loans areplaying a much bigger role in the mortgage market and the percentage of FHA loansconsidered High Cost has increased, this disparity demands attention.
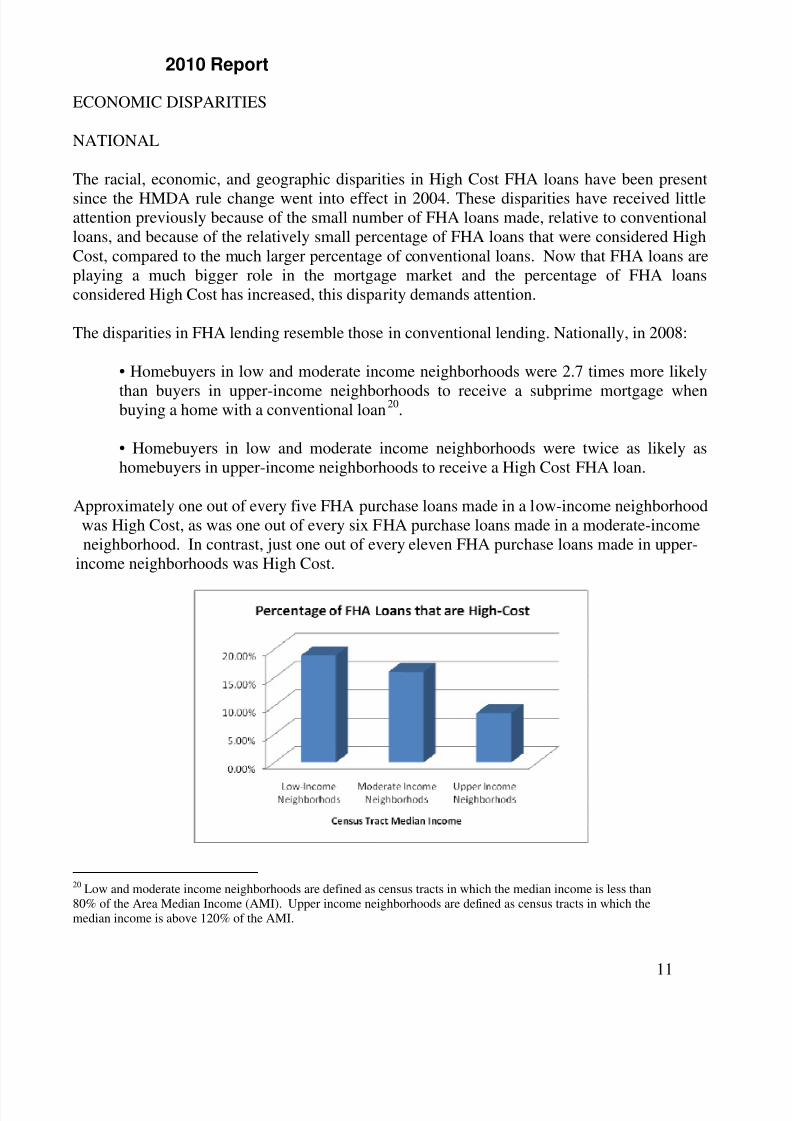
The disparities in FHA lending resemble those in conventional lending. Nationally, in 2008:
• Homebuyers in low and moderate income neighborhoods were 2.7 times more likely
than buyers in upper-income neighborhoods to receive a subprime mortgage whenbuying a home with a conventional loan20.
• Homebuyers in low and moderate income neighborhoods were twice as likely ashomebuyers in upper-income neighborhoods to receive a High Cost FHA loan.
Approximately one out of every five FHA purchase loans made in a low-income neighborhoodwas High Cost, as was one out of every six FHA purchase loans made in a moderate-incomeneighborhood. In contrast, just one out of every eleven FHA purchase loans made in upper-
income neighborhoods was High Cost.
20 Low and moderate income neighborhoods are defined as census tracts in which the median income is less than80% of the Area Median Income (AMI). Upper income neighborhoods are defined as census tracts in which themedian income is above 120% of the AMI.

8/17/2019 (2010) Dangerous Disparities
http://slidepdf.com/reader/full/2010-dangerous-disparities 12/35
2010 Report
12
INDIVUDAL METROPOLITAN AREAS
Low-income Neighborhoods21
Homebuyers in low-income neighborhoods were more likely than buyers in upper income
neighborhoods to receive a High Cost FHA loan in all but two of the thirty largestmetropolitan areas in the country. In five of the metropolitan areas examined buyers in
low-income neighborhoods were over 3.5 times more likely than buyers in upper
income neighborhoods to receive a High-Cost FHA loan: Orlando, FL (5.4 times morelikely); Kansas City, MO (5.1 times); Minneapolis-St. Paul, MN (4.3); St. Louis, MO (3.8),and Philadelphia, PA (3.7).
Percentage of FHA Loans That Were High Cost in 2008
Metropolitan Statistical Area
Upper Income
Neighborhoods
Low Income
Neighborhoods
Orlando, FL 7.5% 40.0%Kansas City, MO 5.9% 29.6%
Minneapolis, MN 3.4% 14.6%
St. Louis MO 8.5% 32.0%
Philadelphia, PA 7.2% 26.6%
The only three metropolitan areas in which buyers in low-income neighborhoods were lesslikely than buyers in upper-income neighborhoods to receive a High Cost FHA loan wereSan Diego, CA, Seattle, WA, and Las Vegas, NV.
Low and Moderate Income Neighborhoods22
In all of the thirty largest metropolitan areas buyers in low and moderate incomeneighborhoods were more likely than buyers in upper income neighborhoods to receive aHigh Cost FHA loan. The five metro areas with the greatest disparity between buyers in lowand moderate income neighborhoods and buyers in upper income neighborhoods were: SanAntonio, TX (3.7 times more likely) Kansas City, MO (3.5 times); Philadelphia, PA (2.9);Denver, CO (2.9), and Sacramento, CA (2.6)
21 Low- income neighborhoods are defined as census tracts in which the median income is less than 50% of theArea Median Income (AMI). Upper income neighborhoods are defined as census tracts in which the medianincome is above 120% of the AMI.22 Low and moderate income neighborhoods are defined as census tracts in which the median income is less than80% of the Area Median Income (AMI). Upper income neighborhoods are defined as census tracts in which themedian income is above 120% of the AMI.

8/17/2019 (2010) Dangerous Disparities
http://slidepdf.com/reader/full/2010-dangerous-disparities 13/35
2010 Report
13
Percentage of FHA Loans That Were High Cost in 2008
Metropolitan Statistical Area
Upper Income
Neighborhoods
Low and Moderate Income
Neighborhoods
San Antonio, TX 6.8% 25.1%
Kansas City, MO 5.8% 20.6%Philadelphia, PA 7.2% 21.2%
Denver, CO 3.8% 11.0%
Sacramento, CA 6.0% 15.5%
The percentages of FHA loans that were High Cost in low, moderate, and upper income
neighborhoods in each of the thirty largest metropolitan areas are listed in Appendix C.

8/17/2019 (2010) Dangerous Disparities
http://slidepdf.com/reader/full/2010-dangerous-disparities 14/35
2010 Report
14
RACIAL AND ETHNIC DISPARITIES
Minority Neighborhoods23
NATIONAL
Nationally, homebuyers in minority neighborhoods were one and half times more likely
than homebuyers in predominantly white neighborhoods to receive a High Cost loanwhen buying a house with an FHA mortgage. Approximately one out of every six FHApurchase loans made in a minority neighborhood was High Cost, compared to just one out ofevery ten FHA purchase loans made in white neighborhoods.
INDIVIDUAL METROPOLITAN AREAS
In all but two of the thirty largest metropolitan areas buyers in minority neighborhoods
were more likely than buyers in predominantly white neighborhoods to receive a High
Cost FHA loan. The five metro areas in which buyers in minority neighborhoods were themost likely compared to buyers in white neighborhoods to receive a High Cost FHA loanwere: Minneapolis, MN (3.6 times more likely); Denver, CO (2.9 times); Philadelphia, PA(2.5); Dallas, TX (2.4); and Baltimore, MD (2.1).
Percentage of FHA Purchase Loans That Were High Cost in 2008
Metropolitan Statistical Area White Neighborhoods Minority Neighborhoods
Minneapolis, MN 4.2% 15.0%
Denver, CO 3.8% 11.0%
Philadelphia, PA 9.2% 23.4%
Dallas, TX 10.8% 25.7%Baltimore, MD 6.8% 14.2%
The only two metropolitan areas in which buyers in minority neighborhoods were less likelythan buyers in white neighborhoods to receive a High Cost FHA loan were San Francisco,CA and Tampa, FL.
The percentage of FHA loans that are High Cost in minority and white neighborhoods in
each of the thirty largest metropolitan areas is listed in Appendix D.
23 Minority neighborhoods are defined as census tracts in which minority residents make up more than half of thepopulation. White neighborhoods are defined as neighborhoods in which white residents make up at least 80% ofthe population.

8/17/2019 (2010) Dangerous Disparities
http://slidepdf.com/reader/full/2010-dangerous-disparities 15/35
2010 Report
15
Borrower Race and Ethnicity
NATIONAL
In 2008, African-Americans and Latinos were one and a half times more likely than
whites to receive a High Cost loan when buying a house with an FHA mortgage. Over15% of the FHA purchase loans made to African-American and Latino homebuyers wereHigh Cost, compared to just 10% of the FHA purchase loans made to white buyers.
Individual Metropolitan Areas
AFRICAN-AMERICAN HOMEBUYERS
African-American homebuyers were more likely than white buyers to receive a High CostFHA loan in twenty-eight of the thirty largest metropolitan areas in the country. In the five
metropolitan areas with the greatest disparity, African-Americans were at least twice aslikely as whites to receive a high cost loan when buying a house with an FHA mortgage:Minneapolis-St. Paul, MN (2.6 times more likely); San Francisco, CA (2.6); Riverside-SanBernardino, CA (2.6), Philadelphia, PA (2.4); and Chicago, IL (2.1).
Percentage of FHA Purchase Mortgages that were High Cost in 2008
Metropolitan Area White African-American
Minneapolis-St. Paul, MN 4.2% 15.5%
San Francisco , CA 17.5% 45.5%
Riverside-San Bernardino, CA 11.5% 30.1%
Philadelphia, PA 8.7% 20.9%
Chicago, IL 11.8% 24.6%
African-American buyers were less likely than whites to receive a High Cost FHA loan in just two of the metropolitan areas covered in this report: Tampa, FL and Portland, OR.
Percentage of FHA Purchase Mortgages that are High Cost in 2008
Metropolitan Area White African-American
Tampa, FL 9.5% 9.2%
Portland, OR 3.5% 1.2%
LATINO HOMEBUYERS
Latino homebuyers were more likely than white buyers to receive a High Cost FHA
loan in twenty-seven of the thirty largest metropolitan areas in the country. The fivemetropolitan areas examined with the greatest disparity between Latino and whitehomebuyers were: Washington, DC (2.6 times more likely); Philadelphia, PA (2.5 times);Denver, CO (2.4); San Antonio, TX (2.2); and Las Vegas, NV.

8/17/2019 (2010) Dangerous Disparities
http://slidepdf.com/reader/full/2010-dangerous-disparities 16/35
2010 Report
16
Percentage of FHA Purchase Mortgages that are High Cost 2008
Metropolitan Area White Latino
Washington, DC 4.8% 12.6%
Philadelphia, PA 8.7% 22.1%
Denver, CO 5.7% 13.5%
San Antonio, TX 7.7% 16.6%Las Vegas, NV 7.3% 16.4%
Latino buyers were less likely than white buyers to receive a High Cost FHA loan in justthree of the metropolitan areas covered in this report: Cincinnati, OH; Portland, OR; andTampa, FL.
Percentage of FHA Purchase Mortgages that are High Cost 2008
Metropolitan Area White Latino
Portland, OR 3.5% 2.4%
Tampa, FL 9.5% 9.3%
Cincinnati, OH 9.6% 7.4%
The percentages of FHA loans that were High-Cost for African-American, Latino, and
white homebuyers in each of the thirty largest metropolitan areas are listed in Appendix
E.
8/17/2019 (2010) Dangerous Disparities
http://slidepdf.com/reader/full/2010-dangerous-disparities 17/35
2010 Report
17
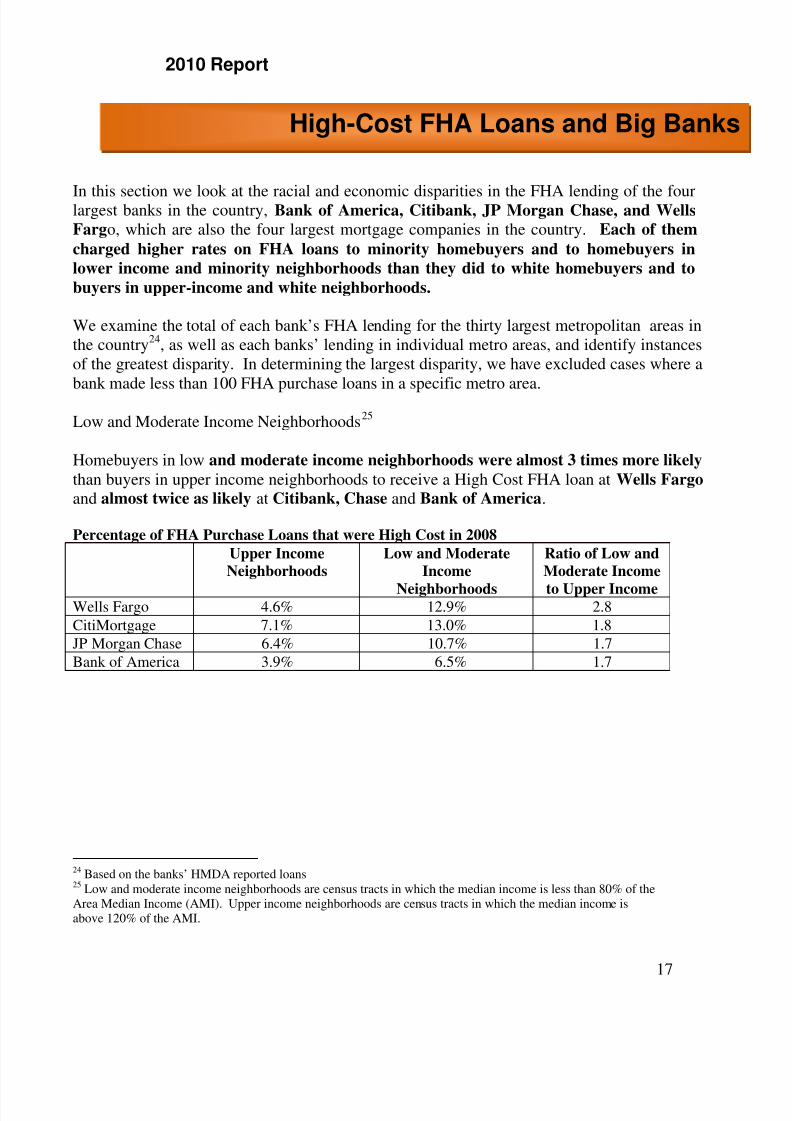
In this section we look at the racial and economic disparities in the FHA lending of the fourlargest banks in the country, Bank of America, Citibank, JP Morgan Chase, and Wells
Fargo, which are also the four largest mortgage companies in the country. Each of them
charged higher rates on FHA loans to minority homebuyers and to homebuyers in
lower income and minority neighborhoods than they did to white homebuyers and to
buyers in upper-income and white neighborhoods.
We examine the total of each bank’s FHA lending for the thirty largest metropolitan areas inthe country24, as well as each banks’ lending in individual metro areas, and identify instancesof the greatest disparity. In determining the largest disparity, we have excluded cases where abank made less than 100 FHA purchase loans in a specific metro area.
Low and Moderate Income Neighborhoods25
Homebuyers in low and moderate income neighborhoods were almost 3 times more likely than buyers in upper income neighborhoods to receive a High Cost FHA loan at Wells Fargo and almost twice as likely at Citibank, Chase and Bank of America.
Percentage of FHA Purchase Loans that were High Cost in 2008
Upper Income
Neighborhoods
Low and Moderate
Income
Neighborhoods
Ratio of Low and
Moderate Income
to Upper IncomeWells Fargo 4.6% 12.9% 2.8
CitiMortgage 7.1% 13.0% 1.8
JP Morgan Chase 6.4% 10.7% 1.7
Bank of America 3.9% 6.5% 1.7
24 Based on the banks’ HMDA reported loans25 Low and moderate income neighborhoods are census tracts in which the median income is less than 80% of theArea Median Income (AMI). Upper income neighborhoods are census tracts in which the median income isabove 120% of the AMI.
High-Cost FHA Loans and Big Banks

8/17/2019 (2010) Dangerous Disparities
http://slidepdf.com/reader/full/2010-dangerous-disparities 18/35
2010 Report
18
Greatest Disparity between Low–to-Moderate Income and Upper Income Neighborhoods
Bank Metro
Area
Percentage of FHA Purchase Loans
that were High-Cost in 2008 Ratio of Low and
Moderate Income
to Upper IncomeUpper Income
Neighborhoods
Low and
Moderate Income
NeighborhoodsBank of America Atlanta, GA 0.5% 4.7% 10.3
Wells Fargo San Antonio, TX 2.0% 18.9% 9.7
Wells Fargo Dallas, TX 1.9% 15.2% 7.9
Bank of America Sacramento, CA 1.5% 8.6% 5.9
Chase Riverside, CA 2.6% 14.3% 5.5
The disparities between the percentages of FHA loans that are High Cost in low and
moderate income neighborhoods compared to upper income neighborhoods in each of the
thirty largest metropolitan areas by each of the four largest banks are listed in Appendix F.
Minority Neighborhoods26
Homebuyers in minority neighborhoods were more than twice as likely as buyers in whiteneighborhoods to receive a High Cost FHA loan at Wells Fargo and Citibank, over one anda half times more likely at Bank of America, and slightly more likely at Chase.
Percentage of FHA Purchase Loans that were High Cost in 2008
White
Neighborhoods
Minority
Neighborhoods
Ratio of Minority to
White Neighborhoods
Wells Fargo 5.7% 13.4% 2.3
CitiMortgage 6.8% 12.4% 1.8Bank of America 4.2% 6.8% 1.6
JP Morgan Chase 7.8% 10.2% 1.3
Greatest Disparity between Minority and White Neighborhoods
Bank Metro Area
Percentage of FHA Purchase Loans
that were High Cost in 2008
Ratio of
Minority to
White
NeighborhoodsWhite
Neighborhoods
Minority
Neighborhoods
Bank of America Las Vegas, NV 0.7% 5.6% 7.7
Wells Fargo Minneapolis, MN 3.2% 19.8% 6.2
Wells Fargo Denver, CO 1.8% 10.3% 5.8Bank of America Phoenix, AZ 1.2% 5.1% 4.3
Bank of America Dallas, TX 2.4% 9.7% 4.0
26 Minority neighborhoods are census tracts in which people of color make up more than half of the population.White neighborhoods are census tracts in which people of color make up less than 20% of the population.

8/17/2019 (2010) Dangerous Disparities
http://slidepdf.com/reader/full/2010-dangerous-disparities 19/35
2010 Report
19
The disparities between the percentages of FHA loans that are High Cost in minority
neighborhoods compared to white neighborhoods in each of the thirty largest metropolitan
areas by each of the four largest banks are listed in Appendix G.
Race and Ethnicity
African-American homebuyers were more than twice as likely as white homebuyers toreceive a High Cost FHA loan at Wells Fargo and Citibank, but only slightly more likely atChase and Bank of America.
Percentage of FHA Loans that were High Cost in 2008
Bank White Homebuyers African-American
Homebuyers
Ratio of African-
American to White
Wells Fargo 5.8% 13.6% 2.3
CitiMortgage 7.1% 15.6% 2.2
JP Morgan Chase 7.7% 9.8% 1.3
Bank of America 4.3% 5.1% 1.2
Greatest Disparity between African-American Homebuyers and White Homebuyers
Bank Metro Area
Percentage of FHA Purchase Loans
that were High Cost in 2008
Ratio of
African-
American to
WhiteWhite
Homebuyers
African-American
Homebuyers
Bank of America Sacramento, CA 0.9% 10.5% 11.3
JP Morgan Chase Los Angeles, CA 5.9% 23.1% 3.9
Wells Fargo Chicago, IL 8.0% 30.4% 3.8
Bank of America Philadelphia, PA 3.7% 13.0% 3.5Wells Fargo Philadelphia, PA 5.3% 18.3% 3.4
The disparities between the percentages of FHA loans that are High-Cost made to African-
American and white homebuyers in each of the thirty largest metropolitan areas by each of
the four largest banks are listed in Appendix H.
Latino homebuyers were two times more likely than white buyers to receive a High CostFHA loan at Wells Fargo, 1.5 times more likely at Bank of America and Citibank, andslightly more likely at Chase.
Percentage of FHA Loans that were High Cost in 2008Bank White Homebuyers Latino Homebuyers Ratio of Latino to
White
Wells Fargo 5.8% 11.4% 2.0
Bank of America 4.3% 6.5% 1.5
CitiMortgage 7.1% 10.9% 1.5
JP Morgan Chase 7.7% 9.5% 1.2

8/17/2019 (2010) Dangerous Disparities
http://slidepdf.com/reader/full/2010-dangerous-disparities 20/35
2010 Report
20
Greatest Disparity between Latino and White Homebuyers
Bank Metro Area
White
Homebuyers
Latino
Homebuyers
Ratio of Latino
to White
Wells Fargo Denver, CO 3.50% 13.81% 4.0JP Morgan Chase Denver, CO 3.47% 12.50% 3.6
Bank of America Sacramento, CA 0.93% 3.13% 3.3
JP Morgan Chase San Diego, CA 6.25% 20.00% 3.2
The disparities between the percentages of FHA loans that are High Cost made to Latino
and white homebuyers in each of the thirty largest metropolitan areas by each of the four
largest banks are listed in Appendix I.

8/17/2019 (2010) Dangerous Disparities
http://slidepdf.com/reader/full/2010-dangerous-disparities 21/35
2010 Report
21
CONVENTIONAL MORTGAGES
FHA loans have never had the kind of risk-based pricing on interest rates that characterizedthe conventional subprime lending market.
The rate sheets of New Century Mortgage, which was the second largest subprime lender inthe country until it went bankrupt, demonstrate the range of interest rates that conventionallenders charged based on credit and other underwriting criteria.
New Century Rate Sheet27
Credit Score Number of Late Mortgage or Rent
Payments in Last 12 Months
Interest Rate on a 30 year
Mortgage
700 or above 0 6.3%525 -549 3 9.5%
New Century’s rate sheets, like those of other subprime lenders, listed numerous risk factors, inaddition to credit scores and late housing payments that increased or decreased the borrower’sinterest rate, including:
• Loan to Value: e.g., New Century charged a borrower with a 95% Loan-to-Value(LTV) 50 basis points (0.5%) higher than a borrower with a 90% LTV.
• Loan Amount: e.g., New Century charged 100 basis points (1.00%) more than the
base rate for a loan less than $75,000 and 25 basis points (0.25%) less than the baserate for a loan above $300,000.
• Income Documentation: e.g., New Century charged borrowers 100 basis points(1.00%) more on their rate if it was a stated income loan without pay stubs or taxreturns
FHA MORTGAGES
FHA loans do not have differences in the interest rates based on risk factors, and thereforethe rate disparities discussed in this report cannot be due to underwriting criteria.
Unlike with conventional loans, the LTV and the size of the loan don’t affect the interest ratea borrower gets. FHA did not allow reduced documentation loans, and a borrower’s creditwas either good enough for an FHA loan or it wasn’t. There is no mechanism in FHA loansto charge borrowers higher interest rates to compensate for the risk. If a borrower with a
27 New Century Mortgage Rate Sheet, March 30, 2007, for Southern California
Risk-Based Pricin

8/17/2019 (2010) Dangerous Disparities
http://slidepdf.com/reader/full/2010-dangerous-disparities 22/35
2010 Report
22
700 credit score and a borrower with a 500 credit score go for an FHA loan to the samelender on the same day, they should get the same interest rate.
In 2008, for the first time, and for just a brief three month period, HUD utilized risk-basedpricing for its mortgage insurance. As HUD stated just prior to the system’s introduction:
“While the conventional market regularly uses risk-based premiums to priceinsurance risk, FHA, to date, continues to charge a one-size-fits-all premium tomortgagees28.”
From January 1, 2001 until July 14, 2008, all FHA loans had a 1.5% upfront mortgageinsurance premium (UMIP), and all 30 year FHA loans had a .50% annual mortgageinsurance premium29.
Example: A $200,000 FHA loan had:
• A UMIP of $3,000 (1.5% of the loan amount) added onto the loan
• An annual premium of $1,000 (.50% of the loan amount) that would bepaid in monthly installments along with the mortgage.
Beginning July14, 2008, the UMIP amount was lowered to 1.25% for homebuyers whorepresented the least risk (those with a credit score of at least 680 or a down payment of atleast 10%), it was raised to 2.25% for all others30.
Example: A $200,000 FHA loan had a UMIP of either:
• $2,500 (1.25% of the loan amount for low risk borrowers); or
• $4,500 (2.25% of the loan amount for all other borrowers)
HUD also changed how it calculated the annual premium at that time. For FHA loans with a30-year term and a Loan-to-Value (LTV) above 95% there would be a higher annualpremium than before – 0.55%. If the loan had an LTV less than or equal to 95%, the annualpremium would be the same as before 0.50%31.
Example: A $200,000 FHA loan had an annual premium that would be paid inmonthly installments along with the mortgage, of either:
28 Federal Register , Vol. 73, No. 93, May 13, 2008, p.2770529 U.S. Department of Housing and Urban Development, “HUD Mortgagee Letter 2000-38”, October 27, 200030 U.S. Department of Housing and Urban Development, “HUD Mortgagee Letter 2008-16”, June 11, 200831 Ibid

8/17/2019 (2010) Dangerous Disparities
http://slidepdf.com/reader/full/2010-dangerous-disparities 23/35
2010 Report
23
• $1,000 (.50% of the loan); or
•$1,100 (.55% of the loan)
FHA’s foray into risk-based premiums was short-lived. It lasted just two and a half months.
Starting October 1, 2008, all 30-year FHA loans had a UMIP of 1.75% regardless of theborrower’s credit score or down payment amount32.
Example: A $200,000 FHA loan had a UMIP of $3,500 (1.75% of the loan) thatwould be added onto the loan
As noted above, the rate disparities shown in this report cannot be explained by differences incredit or other underwriting criteria since FHA loans do not use risk-based pricing in settingthe interest rates and , except for a two and a half month period in 2008, do not use risk-basedpricing in setting the insurance premiums.
Even during the period from July 14, 2008 until October 1, 2008, the price differential due tothe risk assessment system was minimal.
For example, on a $200,000 loan at a 6% interest rate (the average rate for an FHA mortgagein August 2008), the low risk borrower would pay $54 less a month and have an APR just 30basis points (.30%) lower.
UMIP AnnualPremium
Interest Rate MonthlyPayment
APR
Low RiskBorrower
$2,500 $1,000 6% $1,297 6.63%
High RiskBorrower
$4,500 $1,500 6% $1,351 6.93%
This small difference, not even in effect for a full quarter of 2008, cannot explain the ratedisparities in FHA loans.
32 U.S. Department of Housing and Urban Development, “HUD Mortgagee Letter 2008-22,” September 4, 2008
8/17/2019 (2010) Dangerous Disparities
http://slidepdf.com/reader/full/2010-dangerous-disparities 24/35
2010 Report
24
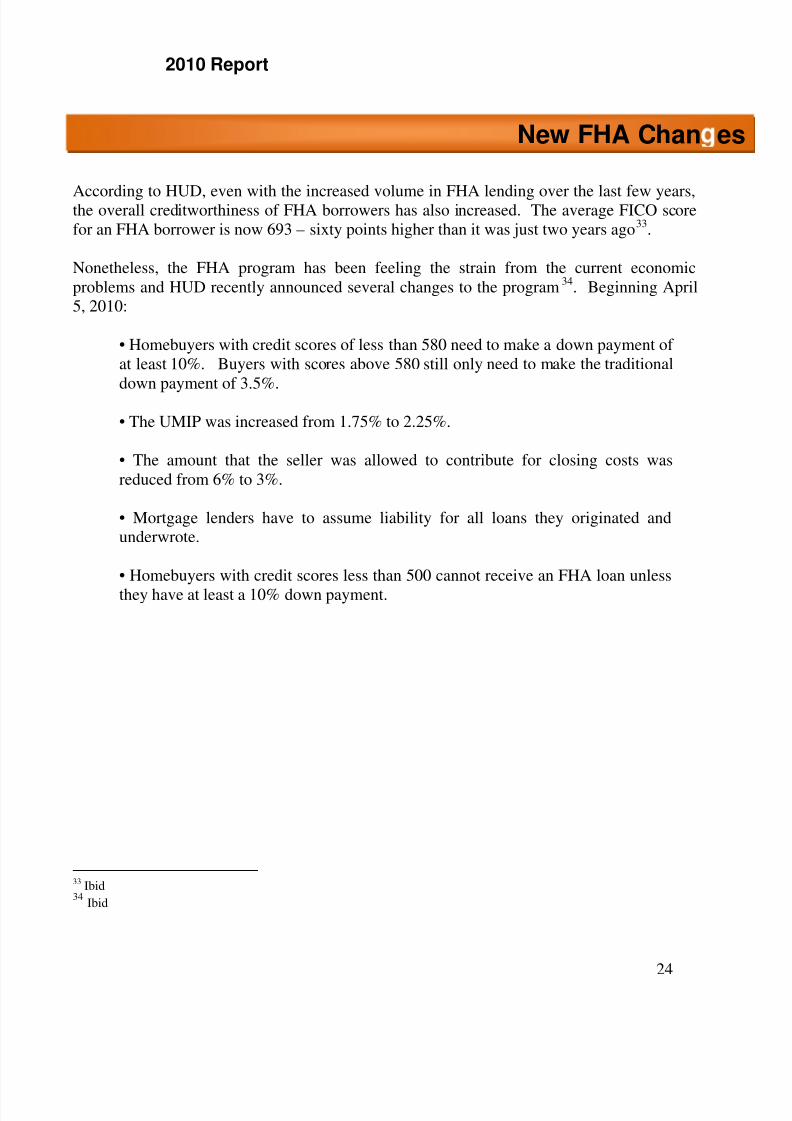
According to HUD, even with the increased volume in FHA lending over the last few years,the overall creditworthiness of FHA borrowers has also increased. The average FICO scorefor an FHA borrower is now 693 – sixty points higher than it was just two years ago33.
Nonetheless, the FHA program has been feeling the strain from the current economicproblems and HUD recently announced several changes to the program34. Beginning April5, 2010:
• Homebuyers with credit scores of less than 580 need to make a down payment ofat least 10%. Buyers with scores above 580 still only need to make the traditionaldown payment of 3.5%.
• The UMIP was increased from 1.75% to 2.25%.
• The amount that the seller was allowed to contribute for closing costs wasreduced from 6% to 3%.
• Mortgage lenders have to assume liability for all loans they originated andunderwrote.
• Homebuyers with credit scores less than 500 cannot receive an FHA loan unless
they have at least a 10% down payment.
33 Ibid34 Ibid
New FHA Chan es

8/17/2019 (2010) Dangerous Disparities
http://slidepdf.com/reader/full/2010-dangerous-disparities 25/35
2010 Report
25
The FHA views its role today as similar to how it helped the nation out of the Great
Depression.
I would hate to think of where the housing market and the economy would bewithout FHA. There would have been hundreds of thousands more foreclosureswithout our efforts. And because we provided liquidity at a time when it wasdesperately needed, we may have saved hundreds of thousands more homeownersand the many industries involved in the housing market, especially homebuildersand those who service new homes with furniture and appliances35.
The increasing importance of FHA lending to the American economy makes it especially
urgent that the unexplained disparities in the rates charged to different borrowers beexamined and that unfair practices be corrected.
Banks should investigate the pricing disparities at their institution presented in this reportand should implement measures to ensure that homebuyers do not receive higher ratesbecause of where they live or the color of their skin.
Legislators and regulators should adopt the recommendations of the National Commissionon Fair Housing and Equal Opportunity, including reviving the President’s Fair HousingCouncil to provide strong federal leadership that coordinates fair housing policy acrossagencies.
Congress should:
Strengthen the Community Reinvestment Act (CRA) by passing the CRAModernization Act of 2009, H.R. 1479, which would require CRA exams toconsider lending to minorities in addition to low and moderate incomeneighborhoods. The bill would also enhance the CRA rating system and requirebanks that receive low ratings to develop public improvement plans.
Expand the Community Development Financial Institution (CDFI) Fund’s Financial
Education and Counseling pilot program to provide more one-on-one financialcounseling.
35 David H. Stevens, Assistant Secretary for Housing and FHA Commissioner, speech at the Standard and Poor’s
Housing Conference, Feb. 11, 2010.
Conclusion and Recommendations

8/17/2019 (2010) Dangerous Disparities
http://slidepdf.com/reader/full/2010-dangerous-disparities 26/35
2010 Report
26
Increase funding for HUD’s Fair Housing Initiatives Program (FHIP), allowingthe program to expand activities to combat housing discrimination througheducation, outreach, and enforcement. Such efforts are desperately needed torespond to the tremendous extra costs current lending patterns impose oncommunities of color.
The Federal Reserve should amend the Home Mortgage Disclosure Act (HMDA) to requirelenders to disclose more pricing and underwriting data, such as credit scores, loan-to-valueratios, and downpayment amounts.
HUD should:
Re-institute a discount in the FHA mortgage insurance premium for borrowerswho complete a homeownership counseling program from a HUD-approvedorganization. HUD should also pay counseling organizations directly for
providing this service.
Implement a strict policy that FHA-approved lenders must offer borrowers themost advantageous loan they qualify for.
Better enforce fair housing laws by examining aggregate lending data moreclosely when considering individual fair housing complaints and by not wastingtime and effort determining whether a complainant has standing to bring anadministrative complaint.
HUD and the Justice Department should:
Collect and analyze the data necessary to determine if the pricing disparitiespresented in this report are due to borrowers’ race and ethnicity or theneighborhood where they live.
Conduct paired testing in which similarly situated white and non-whiteapplicants approach selected lenders about FHA loans.
Revoke the privilege of originating FHA-backed loans for any lenders found inviolation of the Fair Housing Act.

8/17/2019 (2010) Dangerous Disparities
http://slidepdf.com/reader/full/2010-dangerous-disparities 27/35
2010 Report
27
Appendix A
Metropolitan Statistical Area
Number ofFHA
Originations in
2007
Number of FHAOriginations in
2008 Increase from
2007-2008
UNITED STATES 255,524 734,839 188%
Atlanta, GA 9,711 21,783 124%
Baltimore, MD 2,359 7,703 227%
Boston, MA 328 2,446 646%
Chicago, IL 3,255 12,972 299%
Cincinnati, OH 2,631 6,876 161%
Cleveland, OH 1,932 6,004 211%
Dallas, TX 8,764 15,498 77%Denver, CO 3,794 13,486 252%
Houston, TX 8,172 19,362 137%
Detroit, MI 1,356 4,305 218%
Kansas City, MO 2,567 7,601 196%
Las Vegas, NV 1,166 12,483 971%
Los Angeles, CA 277 10,039 3,500%
Miami, FL 748 2,263 202%
Minneapolis, MN 2,072 11,591 459%
New York, NY 891 4,138 365%
Orlando, FL 1,259 6,105 385%
Philadelphia, PA 2,968 8,593 190%Phoenix, AZ 4,029 22,373 455%
Pittsburgh, PA 2,698 5,279 96%
Portland, OR 824 4,684 469%
Riverside-San Bernardino, CA 1,260 19,690 1,463%
Sacramento, CA 459 8,013 1,646%
San Antonio, TX 4,344 7,076 63%
San Diego, CA 171 4,777 2,694%
San Francisco, CA 1 371 37,000%
Seattle, WA 621 4,789 671%
St. Louis, MO 2,812 8,676 209%
Tampa, FL 1,744 6,956 299%
Washington, DC 1,564 17,212 1,001%
A endices

8/17/2019 (2010) Dangerous Disparities
http://slidepdf.com/reader/full/2010-dangerous-disparities 28/35
2010 Report
28
Appendix B
Percentage of FHA Loans that were High-Cost
Metropolitan Statistical Area 2008 2007
UNITED STATES 12% 4%
Atlanta, GA 8% 4%Baltimore, MD 9% 5%
Boston, MA 13% 2%
Chicago, IL 15% 6%
Cincinnati, OH 10% 3%
Cleveland, OH 14% 8%
Dallas, TX 16% 7%
Denver, CO 7% 1%
Detroit, MI 25% 16%
Houston, TX 16% 5%
Kansas City, MO 12% 4%
Las Vegas, NV 10% 1%
Los Angeles, CA 17% 3%
Miami, FL 17% 6%
Minneapolis, MN 5% 1%
New York, NY 21% 18%
Orlando, FL 9% 2%
Philadelphia, PA 14% 5%
Phoenix, AZ 9% 1%
Pittsburgh, PA 14% 3%
Portland, OR 3% 1%
Riverside-San Bernardino, CA 15% 2%Sacramento, CA 9% 1%
San Antonio, TX 12% 5%
San Diego, CA 10% 0%
San Francisco, CA 17% 0%
Seattle, WA 6% 1%
St. Louis MO 15% 5%
Tampa, FL 9% 2%
Washington, DC 7% 3%

8/17/2019 (2010) Dangerous Disparities
http://slidepdf.com/reader/full/2010-dangerous-disparities 29/35
2010 Report
29
Appendix C
Percentage of FHA Purchase Loans that were High Cost 2008
MetropolitanStatistical Area
Upper
Income
CensusTracts
Low
Income
CensusTracts
Ratio of Low
Income to
Upper IncomeCensus Tracts
Low and
Moderate
Income CensusTracts
Ratio of Low
and Moderate
Income toUpper Income
Census Tracts
UNITED STATES 8.7% 18.9% 2.2 16.0% 1.8
Atlanta, GA 5.7% 11.4% 2.0 10.3% 1.8
Baltimore, MD 6.0% 18.3% 3.1 13.4% 2.2
Boston, MA 11.8% 14.4% 1.2 15.7% 1.3
Chicago, IL 11.1% 24.4% 2.2 25.2% 2.3
Cincinnati, OH 7.0% 19.4% 2.8 13.4% 1.9
Cleveland, OH 10.2% 27.2% 2.7 21.1% 2.1
Dallas, TX 11.2% 24.2% 2.2 26.5% 2.4
Denver, CO 3.8% 7.8% 2.0 11.0% 2.9Detroit, MI 18.9% 34.0% 1.8 37.8% 2.0
Houston, TX 12.6% 26.7% 2.1 23.5% 1.9
Kansas City, MO 5.9% 29.6% 5.1 20.6% 3.5
Las Vegas, NV 7.7% 0.0% 0.0 18.6% 2.4
Los Angeles, CA 14.3% 21.9% 1.5 21.7% 1.5
Miami, FL 13.8% 20.4% 1.5 22.5% 1.6
Minneapolis, MN 3.4% 14.6% 4.3 7.5% 2.2
New York, NY 17.0% 27.0% 1.6 24.7% 1.5
Orlando, FL 7.5% 40.0% 5.4 11.6% 1.5
Philadelphia, PA 7.2% 26.6% 3.7 21.2% 2.9
Phoenix, AZ 5.2% 11.6% 2.2 12.7% 2.4Pittsburgh, PA 9.0% 19.4% 2.2 19.3% 2.1
Portland, OR 3.6% 7.5% 2.1 4.4% 1.2
Riverside-SanBernardino, CA
12.0% 17.4% 1.5 20.0% 1.7
Sacramento, CA 6.0% 17.0% 2.8 15.5% 2.6
San Antonio, TX 6.8% 15.6% 2.3 25.1% 3.7
San Diego, CA 10.1% 9.2% 0.9 11.6% 1.1
San Francisco, CA 14.5% 30.1% 2.1 23.4% 1.6
Seattle, WA 5.6% 4.4% 0.8 5.7% 1.0
St. Louis, MO 8.5% 32.0% 3.8 21.4% 2.5
Tampa, FL 7.0% 18.0% 2.6 12.8% 1.8
Washington, DC 5.7% 10.4% 1.8 8.6% 1.5
8/17/2019 (2010) Dangerous Disparities
http://slidepdf.com/reader/full/2010-dangerous-disparities 30/35
2010 Report
30
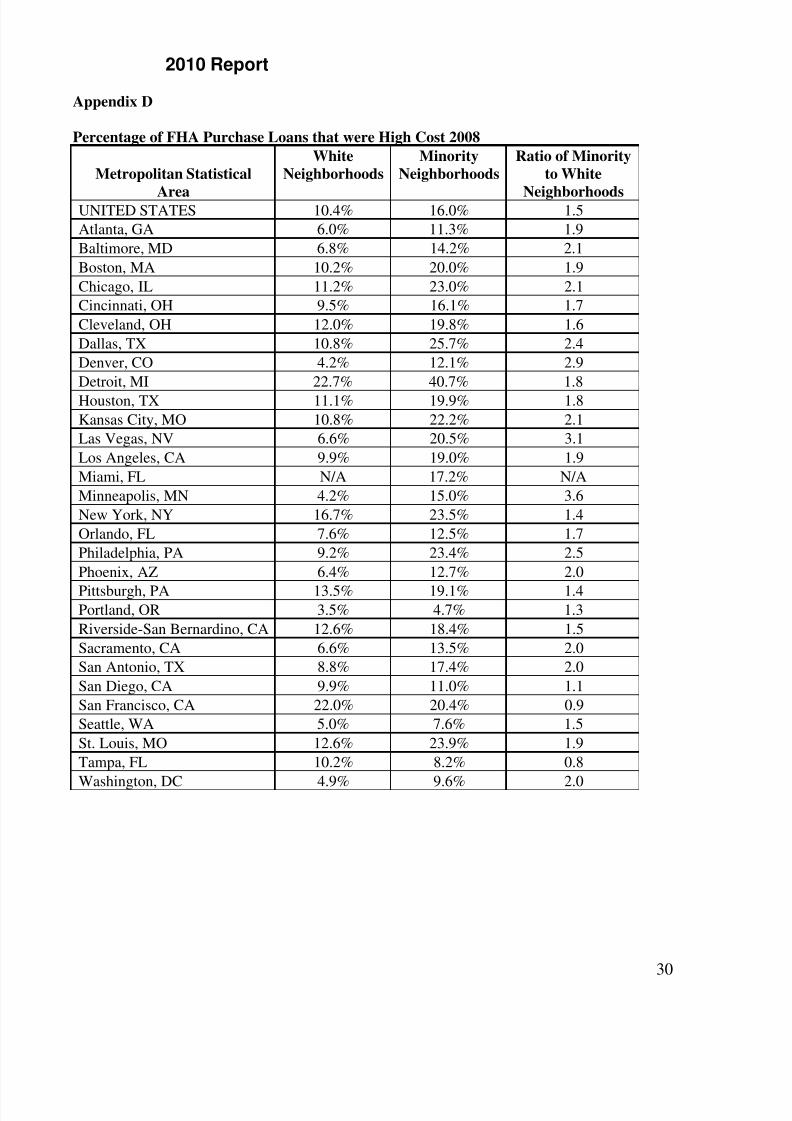
Appendix D
Percentage of FHA Purchase Loans that were High Cost 2008
Metropolitan Statistical
Area
White
Neighborhoods
Minority
Neighborhoods
Ratio of Minority
to White
NeighborhoodsUNITED STATES 10.4% 16.0% 1.5
Atlanta, GA 6.0% 11.3% 1.9
Baltimore, MD 6.8% 14.2% 2.1
Boston, MA 10.2% 20.0% 1.9
Chicago, IL 11.2% 23.0% 2.1
Cincinnati, OH 9.5% 16.1% 1.7
Cleveland, OH 12.0% 19.8% 1.6
Dallas, TX 10.8% 25.7% 2.4
Denver, CO 4.2% 12.1% 2.9
Detroit, MI 22.7% 40.7% 1.8
Houston, TX 11.1% 19.9% 1.8
Kansas City, MO 10.8% 22.2% 2.1
Las Vegas, NV 6.6% 20.5% 3.1
Los Angeles, CA 9.9% 19.0% 1.9
Miami, FL N/A 17.2% N/A
Minneapolis, MN 4.2% 15.0% 3.6
New York, NY 16.7% 23.5% 1.4
Orlando, FL 7.6% 12.5% 1.7
Philadelphia, PA 9.2% 23.4% 2.5
Phoenix, AZ 6.4% 12.7% 2.0
Pittsburgh, PA 13.5% 19.1% 1.4Portland, OR 3.5% 4.7% 1.3
Riverside-San Bernardino, CA 12.6% 18.4% 1.5
Sacramento, CA 6.6% 13.5% 2.0
San Antonio, TX 8.8% 17.4% 2.0
San Diego, CA 9.9% 11.0% 1.1
San Francisco, CA 22.0% 20.4% 0.9
Seattle, WA 5.0% 7.6% 1.5
St. Louis, MO 12.6% 23.9% 1.9
Tampa, FL 10.2% 8.2% 0.8
Washington, DC 4.9% 9.6% 2.0

8/17/2019 (2010) Dangerous Disparities
http://slidepdf.com/reader/full/2010-dangerous-disparities 31/35
2010 Report
31
Appendix E
Percentage of FHA Purchase Loans That Were High-Cost in 2008
Metropolitan Statistical Area White African-
American
African-
American to
White Ratio
Latino Latino to
White RatioUNITED STATES 10.3% 15.5% 1.5 15.4% 1.5
Atlanta, GA 6.0% 10.3% 1.7 12.2% 2.0
Baltimore, MD 6.3% 12.9% 2.1 12.6% 2.0
Boston, MA 11.8% 17.6% 1.5 12.3% 1.0
Chicago, IL 11.8% 24.6% 2.1 18.6% 1.6
Cincinnati, OH 9.6% 16.5% 1.7 7.4% 0.8
Cleveland, OH 12.2% 16.1% 1.3 22.2% 1.8
Dallas, TX 12.0% 24.5% 2.0 21.8% 1.8
Denver, CO 5.7% 8.3% 1.4 13.5% 2.4
Detroit, MI 23.1% 33.1% 1.4 24.2% 1.1
Houston, TX 14.4% 19.4% 1.4 18.4% 1.3
Kansas City, MO 11.4% 18.8% 1.7 11.9% 1.0
Las Vegas, NV 7.3% 8.1% 1.1 16.4% 2.2
Los Angeles, CA 14.1% 18.5% 1.3 20.1% 1.4
Miami, FL 16.3% 21.4% 1.3 16.6% 1.0
Minneapolis, MN 4.2% 10.9% 2.6 7.3% 1.7
New York, NY 16.0% 26.3% 1.7 22.9% 1.4
Orlando, FL 7.7% 13.6% 1.8 11.8% 1.5
Philadelphia, PA 8.7% 20.9% 2.4 22.1% 2.5
Phoenix, AZ 7.5% 8.6% 1.1 14.5% 1.9
Pittsburgh, PA 12.7% 18.5% 1.5 18.8% 1.5Portland, OR 3.5% 1.2% 0.3 2.4% 0.7
Riverside-San Bernardino, CA 11.5% 30.1% 2.6 19.4% 1.7
Sacramento, CA 7.5% 12.8% 1.7 12.3% 1.7
San Antonio, TX 7.7% 14.5% 1.9 16.6% 2.2
San Diego, CA 9.4% 10.6% 1.1 11.9% 1.3
San Francisco, CA 17.5% 45.5% 2.6 23.5% 1.3
Seattle, WA 5.3% 7.4% 1.4 8.3% 1.6
St. Louis, MO 12.7% 23.9% 1.9 19.8% 1.6
Tampa, FL 9.5% 9.2% 1.0 9.3% 1.0
Washington, DC 4.8% 9.3% 1.9 12.6% 2.6
8/17/2019 (2010) Dangerous Disparities
http://slidepdf.com/reader/full/2010-dangerous-disparities 32/35
2010 Report
32
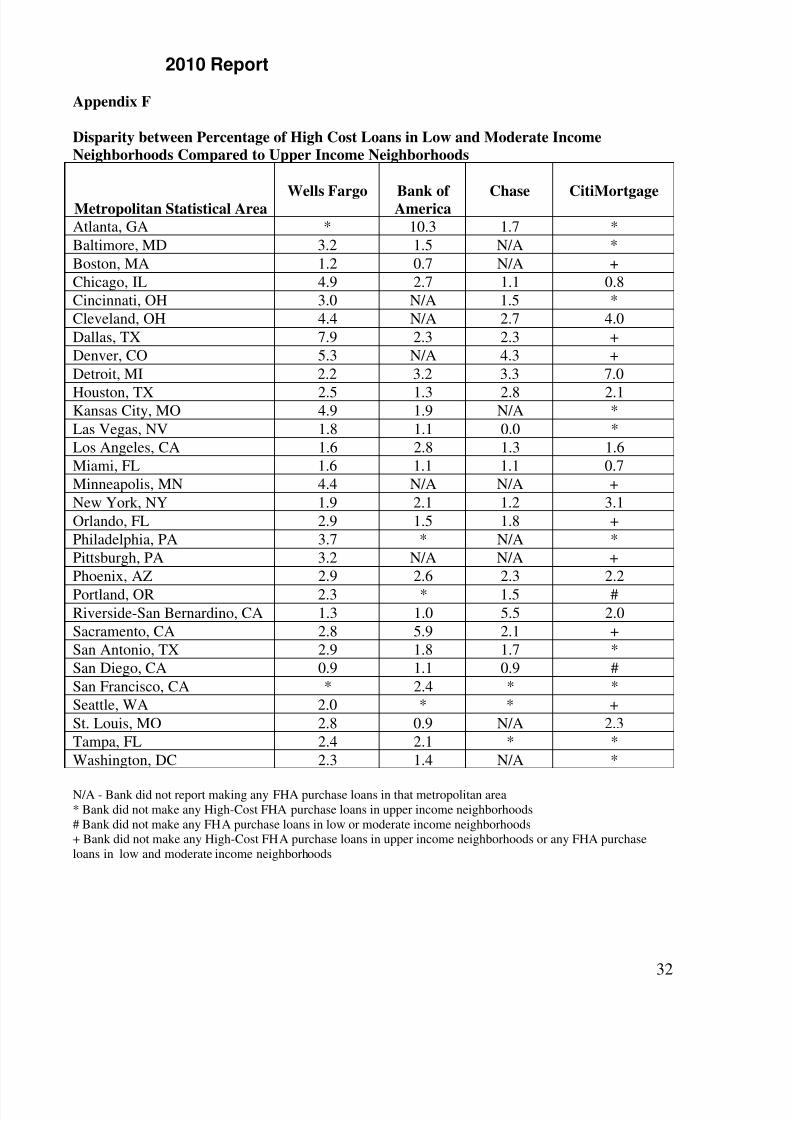
Appendix F
Disparity between Percentage of High Cost Loans in Low and Moderate Income
Neighborhoods Compared to Upper Income Neighborhoods
Metropolitan Statistical Area Wells Fargo Bank ofAmerica Chase CitiMortgage
Atlanta, GA * 10.3 1.7 *
Baltimore, MD 3.2 1.5 N/A *
Boston, MA 1.2 0.7 N/A +
Chicago, IL 4.9 2.7 1.1 0.8
Cincinnati, OH 3.0 N/A 1.5 *
Cleveland, OH 4.4 N/A 2.7 4.0
Dallas, TX 7.9 2.3 2.3 +
Denver, CO 5.3 N/A 4.3 +
Detroit, MI 2.2 3.2 3.3 7.0
Houston, TX 2.5 1.3 2.8 2.1Kansas City, MO 4.9 1.9 N/A *
Las Vegas, NV 1.8 1.1 0.0 *
Los Angeles, CA 1.6 2.8 1.3 1.6
Miami, FL 1.6 1.1 1.1 0.7
Minneapolis, MN 4.4 N/A N/A +
New York, NY 1.9 2.1 1.2 3.1
Orlando, FL 2.9 1.5 1.8 +
Philadelphia, PA 3.7 * N/A *
Pittsburgh, PA 3.2 N/A N/A +
Phoenix, AZ 2.9 2.6 2.3 2.2
Portland, OR 2.3 * 1.5 #Riverside-San Bernardino, CA 1.3 1.0 5.5 2.0
Sacramento, CA 2.8 5.9 2.1 +
San Antonio, TX 2.9 1.8 1.7 *
San Diego, CA 0.9 1.1 0.9 #
San Francisco, CA * 2.4 * *
Seattle, WA 2.0 * * +
St. Louis, MO 2.8 0.9 N/A 2.3
Tampa, FL 2.4 2.1 * *
Washington, DC 2.3 1.4 N/A *
N/A - Bank did not report making any FHA purchase loans in that metropolitan area* Bank did not make any High-Cost FHA purchase loans in upper income neighborhoods# Bank did not make any FHA purchase loans in low or moderate income neighborhoods+ Bank did not make any High-Cost FHA purchase loans in upper income neighborhoods or any FHA purchaseloans in low and moderate income neighborhoods

8/17/2019 (2010) Dangerous Disparities
http://slidepdf.com/reader/full/2010-dangerous-disparities 33/35
2010 Report
33
Appendix G
Disparity between Percentage of High Cost Purchase Loans in Minority Neighborhoods
Compared to White Neighborhoods in 2008
Metropolitan Statistical Area
Wells
Fargo
Bank of
America
Chase CitiMortgage
Atlanta, GA * 2.3 1.0 *
Baltimore, MD 3.4 1.5 N/A *
Boston, MA 1.7 1.1 N/A *
Chicago, IL 3.9 1.5 1.4 2.0
Cincinnati, OH 1.4 N/A 1.8 0.0
Cleveland, OH 2.6 N/A 1.3 5.7
Dallas, TX 2.8 4.0 1.3 *
Denver, CO 5.8 N/A 3.5 0.0
Detroit, MI 1.2 2.5 3.7 6.3
Houston, TX 2.4 1.2 1.7 0.0
Kansas City, MO 2.6 0.6 N/A 0.0Las Vegas, NV 3.6 7.7 0.0 *
Los Angeles, CA 1.1 * 0.9 *
Miami, FL * # * *
Minneapolis, MN 6.2 N/A N/A 0.0
New York, NY 1.1 * 0.7 2.0
Orlando, FL 1.9 0.6 2.3 *
Philadelphia, PA 3.5 * N/A 3.0
Phoenix, AZ 2.6 4.3 1.4 *
Pittsburgh, PA 3.0 N/A N/A +
Portland, OR 0.0 # # #
Riverside-San Bernardino, CA 2.3 * * *Sacramento, CA 1.1 1.2 0.4 +
San Antonio, TX 3.3 # 0.5 *
San Diego, CA 0.9 0.4 1.1 1.5
San Francisco, CA * 0.7 * *
Seattle, WA 1.6 * 0.0 +
St. Louis, MO 1.8 2.3 N/A #
Tampa, FL 1.1 1.5 0.0 1.3
Washington, DC 1.9 0.3 N/A 1.7
N/A - Bank did not report making any FHA purchase loans in that metropolitan area* Bank did not make any High-Cost FHA purchase loans in white neighborhoods# Bank did not make any FHA purchase loans made in minority neighborhoods+ Bank did not make any High-Cost FHA purchase loans in white neighborhoods or any FHA purchase loans inminority neighborhoods

8/17/2019 (2010) Dangerous Disparities
http://slidepdf.com/reader/full/2010-dangerous-disparities 34/35
2010 Report
34
Appendix H
Disparity between Percentage of High Cost Loans to African-Americans Compared to
Whites in 2008
Metropolitan Statistical Area WellsFargo Bank ofAmerica Chase CitiMortgage
Atlanta, GA 0.0 2.1 1.5 *
Baltimore, MD 2.3 0.8 2.3 *
Boston, MA 1.1 0.5 N/A +
Chicago, IL 3.8 1.5 1.0 1.8
Cincinnati, OH 1.7 N/A 1.4 11.2
Cleveland, OH 2.5 N/A 1.1 1.7
Dallas, TX 2.3 0.5 1.2 *
Denver, CO 0.6 N/A 0.0 0.0
Detroit, MI 1.4 2.9 1.5 1.9
Houston, TX 1.7 1.0 1.6 0.8Kansas City, MO 1.3 0.0 N/A 0.0
Las Vegas, NV 0.0 1.1 0.0 7.0
Los Angeles, CA 1.4 3.1 3.9 0.0
Miami, FL 1.6 0.8 1.0 *
Minneapolis, MN 2.4 N/A N/A 0.0
New York, NY 2.3 0.9 1.6 0.7
Orlando, FL 0.8 1.2 0.9 *
Philadelphia, PA 3.4 3.5 N/A +
Phoenix, AZ 1.1 1.6 3.4 0.0
Pittsburgh, PA 2.8 N/A N/A +
Portland, OR 0.0 0.0 0.0 #Riverside-San Bernardino, CA 1.2 2.1 1.8 *
Sacramento, CA 1.0 11.3 0.0 0.0
San Antonio, TX 2.9 0.0 1.6 *
San Diego, CA 0.0 0.0 0.0 *
San Francisco, CA 30.0 7.8 + 0.0
Seattle, WA 1.8 0.0 0.0 +
St. Louis, MO 1.7 0.7 N/A #
Tampa, FL 0.8 1.0 0.0 0.0
Washington, DC 1.2 0.9 N/A *
N/A - Bank did not report making any FHA purchase loans in that metropolitan area* Ban k did not make any High-Cost FHA purchase loans made to whites# Bank did not make any FHA purchase loans to African-Americans+ Bank did not make any High-Cost FHA purchase loans to whites or any FHA purchase loans toAfrican-Americans

8/17/2019 (2010) Dangerous Disparities
http://slidepdf.com/reader/full/2010-dangerous-disparities 35/35
2010 Report
Appendix I
Disparity between Percentage of High Cost Loans to Latinos Compared to Whites in 2008
Metropolitan Statistical Area
Wells
Fargo
Bank of
America Chase CitiMortgage
Atlanta, GA # 2.1 0.0 *
Baltimore, MD 2.4 0.0 N/A *
Boston, MA 0.5 0.7 N/A *
Chicago, IL 2.8 0.6 1.0 1.8
Cincinnati, OH 0.0 N/A 0.0 0.0
Cleveland, OH 1.3 N/A 0.0 #
Dallas, TX 2.4 1.7 1.1 *
Detroit, MI 2.2 0.0 2.6 #
Denver, CO 4.0 N/A 3.6 0.0
Houston, TX 1.8 0.9 1.5 0.0
Kansas City, MO 1.1 1.7 N/A 0.0Las Vegas, NV 1.9 1.6 1.6 0.0
Los Angeles, CA 2.2 2.2 2.4 0.0
Miami, FL 1.3 0.9 0.7 *
Minneapolis, MN 1.4 N/A N/A 0.0
New York, NY 1.6 0.3 0.4 0.7
Orlando, FL 1.2 1.0 1.2 +
Philadelphia, PA 2.4 1.4 N/A *
Phoenix, AZ 2.3 1.8 1.1 0.0
Pittsburgh, PA 0.0 N/A N/A +
Portland, OR 2.0 0.0 0.0 #
Riverside-San Bernardino, CA 1.6 0.9 2.9 *Sacramento, CA 0.8 3.3 1.6 #
San Antonio, TX 2.6 0.6 0.6 *
San Diego, CA 1.1 1.3 3.2 *
San Francisco, CA 3.3 1.1 * #
Seattle, WA 0.0 0.0 0.0 +
St. Louis, MO 0.7 0.0 N/A 0.0
Tampa, FL 1.0 1.4 2.7 2.1
Washington, DC 2.0 1.8 N/A *
N/A - Bank did not report making any FHA purchase loans in that metropolitan area* Ban k did not make any High-Cost FHA purchase loans made to whites# Bank did not make any FHA purchase loans to Latinos+ Bank did not make any High-Cost FHA purchase loans to whites or any FHA purchase loans to Latinos