2010 Community Satisfaction Survey Report
112
Blue Mountains City Council Community Survey 2010 Prepared for Prepared by IRIS Research March 2010 Insight for Business & Government IRIS Research ABN 16 002 278 793 The University of Wollongong Innovation Campus, Level 1, iC Cental, Squires Way, North Wollongong 2500 Postal address: Northfields Ave, Wollongong, NSW 2522, Telephone: (02) 4285 4446, Fax: (02)4285 4448 Net: http://www.iris.org.au Email: [email protected]
Transcript of 2010 Community Satisfaction Survey Report

Blue Mountains City Council Community Survey 2010
Prepared for
Prepared by
IRIS Research
March 2010
I n s i g h t f o r B u s i n e s s & G o v e r n m e n t
IRIS Research ABN 16 002 278 793 The University of Wollongong Innovation Campus, Level 1, iC Cental, Squires Way, North Wollongong 2500
Postal address: Northfields Ave, Wollongong, NSW 2522, Telephone: (02) 4285 4446, Fax: (02)4285 4448 Net: http://www.iris.org.au Email: [email protected]

Blue Mountains City Council - Community Survey 2010 i
TABLE OF CONTENTS
EXECUTIVE SUMMARY ........................................................................................ III
1 INTRODUCTION ............................................................................................. 11.1 BACKGROUND ............................................................................................................................. 11.2 STUDY OBJECTIVES ....................................................................................................................... 21.3 ATTITUDE MEASUREMENT ............................................................................................................... 21.4 DATA ANALYSIS ........................................................................................................................... 31.5 COMPARING RESULTS .................................................................................................................. 4
1.5.1 Previous Surveys ............................................................................................................41.6 MEASURING PERCEPTIONS OF PERFORMANCE ............................................................................... 51.7 SURVEY RESPONSE ........................................................................................................................ 6
SURVEY RESULTS ................................................................................................... 7
2 INDIVIDUAL COUNCIL SERVICES & FACILITIES ............................................ 82.1 IMPORTANCE RATINGS ................................................................................................................. 9
2.1.1 Overview of Key Direction Areas ................................................................................92.1.2 Looking After the Environment ..................................................................................112.1.3 Using Land for Living ...................................................................................................162.1.4 Moving Around ...........................................................................................................202.1.5 Looking After People ..................................................................................................242.1.6 Sustainable Economy .................................................................................................31
2.2 SATISFACTION RATINGS .............................................................................................................. 342.2.1 Overview of Key Direction Areas ..............................................................................342.2.2 Looking After the Environment ..................................................................................362.2.3 Using Land for Living ...................................................................................................422.2.4 Moving Around ...........................................................................................................462.2.5 Looking After People ..................................................................................................502.2.6 Sustainable Economy .................................................................................................56
3 PRIORITISING SERVICES & FACILITIES ........................................................ 593.1 QUADRANT ANALYSIS ................................................................................................................. 593.2 GAP ANALYSIS .......................................................................................................................... 633.3 PRIORITIES FOR IMPROVEMENT .................................................................................................... 66
4 OVERALL SATISFACTION & VALUE ............................................................. 674.1 OVERALL SATISFACTION ............................................................................................................. 67

Blue Mountains City Council - Community Survey 2010 ii
4.1.1 Satisfaction Rating ......................................................................................................674.1.2 Reasons for Satisfaction/Dissatisfaction with Council Performance .....................70
4.2 VALUE FOR MONEY .................................................................................................................... 72
5 PLANNING PRIORITIES ................................................................................ 745.1 CITY-WIDE PLANNING PRIORITIES ................................................................................................ 745.2 LOCAL PLANNING PRIORITIES ...................................................................................................... 775.3 FUNDING PRIORITIES ................................................................................................................... 79
6 STAFF PERFORMANCE ................................................................................ 826.1 INTERACTION WITH COUNCIL STAFF ............................................................................................. 826.2 STAFF CUSTOMER SERVICE MEASURES ......................................................................................... 83
7 COUNCILLOR PERFORMANCE ................................................................... 857.1 DEALINGS WITH COUNCILLORS ................................................................................................... 857.2 OVERALL SATISFACTION WITH COUNCILLORS ............................................................................... 86
8 OTHER GENERAL THEMES ........................................................................... 888.1 COMMUNITY VALUES ................................................................................................................. 888.2 ENVIRONMENTALLY SUSTAINABLE LIVING ...................................................................................... 898.3 COMMUNITY SAFETY & CONNECTEDNESS .................................................................................... 90
APPENDIX 1: SURVEY METHODOLOGY ......................................................... 93SAMPLE DESIGN ...................................................................................................................................... 93DATA COLLECTION .................................................................................................................................. 94RESPONSE ............................................................................................................................................... 94WEIGHTING ADJUSTMENT ......................................................................................................................... 95SURVEY ACCURACY ................................................................................................................................ 95
APPENDIX 2: IMPORTANCE & SATISFACTION RATINGS ............................... 96
APPENDIX 3: QUESTIONNAIRE ..................................................................... 101

Blue Mountains City Council - Community Survey 2010 iii
EXECUTIVE SUMMARY
This report presents the results of the Blue Mountains City Council Community Survey 2010.
IRIS Research was commissioned by Council to conduct a comprehensive telephone
survey of residents of the Blue Mountains Council area to gauge community perceptions
of the delivery of Council services and facilities, as well as better understand what the
community considers to be the priorities for Council action and funding.
INDIVIDUAL SERVICES & FACILITIES [PGS 8-66]
Protection from bushfires and emergencies (4.87) was rated as the service or facility that
residents of the Blue Mountains place greatest importance on, followed by clean, safe
and healthy living environments (4.83) and garbage collection (4.78).
Meanwhile, when it came to the actual delivery of these services and facilities, it was
garbage collection (4.43) that residents were most satisfied with. Wheelie Bin curbside
recycling service (4.37) and Rural Fire Service and SES buildings (3.93) rounded out the
top three.
The services and facilities that were identified as not meeting resident expectations in
both quadrant analysis and gap analysis are listed below. This is a good confirmation that
these areas should be given priority.
- Generating local employment opportunities
- Advocacy for services & facilities for young people
- Public toilets
- Advocacy for facilities & services for people with disability
- Stormwater Infrastructure
- Footpaths - Weed control
OVERALL SATISFACTION [PGS 67-73]
Overall, 38.5% of residents were satisfied with the performance of Blue Mountains
Council, which is more than double the 18.1% that were dissatisfied. A mean satisfaction

Blue Mountains City Council - Community Survey 2010 iv
score of 3.23 was achieved for Council’s overall performance, which is on par with the
results prior to the 2009 survey.
The main reason for dissatisfaction with Council’s overall performance was poor
allocation of funds and/or no value for money.
Resident perception of the value received for rates dollar spend has continued to
improve, with the mean satisfaction score rising to 3.34 out of 5. Around two in five
respondents provided a ‘high’ score of 4 or higher.
PLANNING PRIORITIES [PGS 74-78]
As in the previous survey, respondents were asked to nominate the major issue of
concern to them, both for the Blue Mountains as a whole and for their local area.
Road maintenance was by far the number one local neighbourhood priority, with 20.8%
of residents identifying it as a major issue of concern. Another 7.0% nominated
backburning and other fire prevention measures, while 6.5% indicated there needs to be
more beautification of the area (including improved maintenance and cleanliness).
At the city-wide level, 10.9% of residents identified road maintenance as the top priority
for Council action. Backburning and other fire prevention measures and developments
to retain the village atmosphere and character (controlled developments) were both
nominated by 8.2% of residents.
FUNDING PRIORITIES [PGS 79-81]
SES buildings and Rural Fire Stations was identified by nearly four out of five Blue
Mountains residents as a ‘high’ priority, resulting in a mean score of 7.94 out of 10.
Other assets funding options to score highly included roads and footpaths (7.76),
stormwater infrastructure (7.47) and waste management facilities (7.43).
STAFF PERFORMANCE [PGS 82-84]
57.4% of residents surveyed indicated that they have interacted with Council staff in the
last twelve months. Over two thirds (69.5%) of residents that have had recent contact

Blue Mountains City Council - Community Survey 2010 v
provided a ‘high’ satisfaction rating, resulting in a mean of 3.81 out of 5. This is the highest
score since the original survey measure in 2000.
COUNCILLOR PERFORMANCE [PGS 85-87]
12.2% of residents indicated that they have had a dealing with at least one of their
elected Councillors in the last twelve months.
Satisfaction with Councillor performance has slipped, with the mean score down from
3.21 in 2009 to 2.88 in 2010.
COMMUNITY VALUES [PG 88]
Nearly a quarter of residents (22.1%) identified the natural environment and bushlands as
the thing they value most about living in the Blue Mountains. The top three was
unchanged from 2009, with peacefulness and tranquillity (15.8%) and fresh air (13.0%)
rounding out the top of the list.
ENVIRONMENTALLY SUSTAINABLE LIVING [PG 89]
Nearly all Blue Mountains residents indicated that they recycle paper, plastics, glass and
metals (99.2%). Around three quarters (72.6%) conserve water by recycling it, using water
efficient fixtures or water tanks, while 59.7% maintain a compost heap or worm farm. This
year’s survey showed that fewer residents were purchasing green power.
COMMUNITY SAFETY & CONNECTEDNESS [PGS 90-92]
Nine in ten residents agree that they generally feel safe in their neighbourhood, resulting
in a mean score of 4.47. Most feel that they are in good health (4.47) and that their
neighbourhood is a friendly place to live (4.34). Encouragingly, many know someone in
their area (outside immediate family) that they can to turn to in a time of crisis (4.35).

Blue Mountains City Council - Community Survey 2010 1
1 INTRODUCTION
1.1 BACKGROUND
This study was commissioned by Blue Mountains City Council (BMCC) as the eighth in a
series of surveys aimed at monitoring community satisfaction with the quality and level of
services provided by Council. The broad goals of the study were to measure Council’s
performance against benchmarks set in the 2000 benchmarking survey (also conducted
by IRIS) and to provide up-to-date insights into satisfaction with services and community
issues of importance. The design used for this survey represents the specific needs of
BMCC management and permits examination of movement in importance and
satisfaction on a number of broad areas of Council performance.
The study was designed to permit measurement of differences in resident attitudes
between each of the five Community Planning Areas (CPAs) used by Council, as shown
in Table 1.1.
Table 1.1 Blue Mountains City Council Community Planning Areas
CPA Localities
Area 1 Blackheath, Megalong Valley, the Mounts
Area 2 Medlow Bath, Katoomba, Leura, Wentworth Falls
Area 3 Bullaburra, Lawson, Hazelbrook, Woodford, Linden
Area 4 Faulconbridge, Springwood, Winmalee, Valley Heights
Area 5 Warrimoo, Blaxland, Mt Riverview, Glenbrook, Lapstone

Blue Mountains City Council - Community Survey 2010 2
1.2 STUDY OBJECTIVES
The specific objectives for the Community Survey were to:
Measure the importance of and satisfaction with services and facilities provided by
Council;
Measure perceived performance of Council staff;
Where appropriate, measure performance against previous surveys in the series;
Identify current major issues of concern at the local and citywide levels;
Identify priorities for action and funding over the next 5-10 years.
1.3 ATTITUDE MEASUREMENT
The three separate attitude scales used in this survey are shown below: they are used by
survey respondents to rate importance, satisfaction and agreement. In the first section of
the survey, a series of 50 Council services and facilities were read out to respondents. For
each, respondents were asked to give both an importance and satisfaction rating.
Results from these ratings form the basis of much of the analysis in this report.
Importance scale Satisfaction scale Agreement Scale 1 … Not at all important 1 … Very dissatisfied 1… Strongly disagree 2 … 2 … 2… 3 … 3 … 3… 4 … 4 … 4… 5 … Very important 5 … Very satisfied 5… Strongly agree
For all rating scales, those respondents who could not provide a rating, either because
the question did not apply to them or they had no opinion, were coded as a non-
response (i.e. 6 = ‘can’t say’).
It should be noted that one section of this year’s report – Section 5: Funding Priorities –
utilises an 11-point scale to measure the priority place on various asset funding options. In
this case, 0 represents the minimum value (i.e. ‘very low priority’) with 10 representing the
maximum (i.e. ‘very high priority’). The non-response code on this scale is 11.

Blue Mountains City Council - Community Survey 2010 3
1.4 DATA ANALYSIS
Results have been presented in a standardised way in this report. Rating scale results
have generally been presented in two basic forms. Firstly, the numeric values recorded
for each attribute have been converted into an overall mean score out of five. To derive
the mean score for an attribute, all respondents' answers are 'averaged' to produce an
overall rating that conveniently expresses the result of scale items in a single numeric
figure. The mean score makes data interpretation considerably easier when comparing
multiple services and facilities.
On the whole, a mean score is a good measure of the overall agreement, importance or
satisfaction measured in the sample group. However, two services with the same mean
score could have vastly different dispersions of opinion, leading to a gap in any
interpretation of results. This potential problem can be avoided by considering the
collapsed frequency distribution tables presented in this report, which serve to highlight
possible differences between seemingly similar mean scores. Hence, in this report the
results have also been summarised into collapsed frequency distributions as shown in the
table below.
Table 1-1 Reporting collapsed frequency distributions – 5 point scale
Scale Type
Scale Values
1-2 3 4-5
Importance Low Medium High
Satisfaction Low Medium High
Agreement Disagree Neutral Agree
Table 1-2 Reporting collapsed frequency distributions – 11 point scale
Scale Type
Scale Values
0-3 4-6 7-10
Priority Low Medium High

Blue Mountains City Council - Community Survey 2010 4
Analysis of the survey results was carried out by IRIS using SPSS statistical analysis software.
Frequency counts, cross tabulations and charts have been used to present basic
descriptive results in most sections of the report. Other statistical procedures were used to
conduct significance tests. Where proportions have been reported for groups of
respondents (e.g. males 65% vs. females 75%) Pearson’s Chi-Square was the test statistic
used to determine whether group results were indeed significantly different. When
comparing mean scores for interval data (e.g. Ward A = 5.40, Ward B = 5.60 & Ward C =
5.80) analysis of variance (ANOVA) was the primary statistical test used to investigate
whether results were significantly different. Where more than two groups were being
compared, post-hoc tests were applied: Bonferroni (equal variance assumed) and
Games-Howel (equal variance not assumed). Post-hoc tests highlight exactly which
groups have differing results where more than two groups are being compared.
1.5 COMPARING RESULTS
1.5.1 Previous Surveys
Where possible, results from the 2010 survey have been compared with previous survey
results. While overall the questionnaire employed in 2010 was very similar to those used in
previous years, it should be noted that a number of questions were rephrased this year to
better align with other Council planning instruments, including the City Vision. This can
affect comparisons between the ratings given for these services and facilities in 2009 and
2010.

Blue Mountains City Council - Community Survey 2010 5
1.6 MEASURING PERCEPTIONS OF PERFORMANCE
To gain true insight into how Council is performing relative to resident expectations, the
best approach is to use a ‘top down’ analytical approach. As Figure 1-1 illustrates, the
IRIS analytical framework is logical and sequential: first overall performance metrics (big
picture); then specific aspects of Council performance in delivering key services
(operational); and finally, advanced analytical techniques to uncover key drivers
(diagnostic).
Figure 1-1 Performance Measurement – the IRIS Analytical Framework
1. Overall Performance Overall Satisfaction with Council
Satisfaction Ratings for 50 Key Services & Facilities
Satisfaction Ratings for Council Staff & Administrator
2. Performance in Key Service Areas
3. Key Driver Analysis - Identifying opportunities to improve specific services
- Modelling to predict service areas that have greatest impact on overall satisfaction. - Qualitative analysis to understand reasons for dissatisfaction with Council.
Level 1: The customer service
metric that matters most!
Level 2: Drilling down to
individual facility & service ratings
Level 3: Advanced analysis to
uncover underlying
drivers of resident
satisfaction
Blue Mountains City Council - Community Survey 2010 6
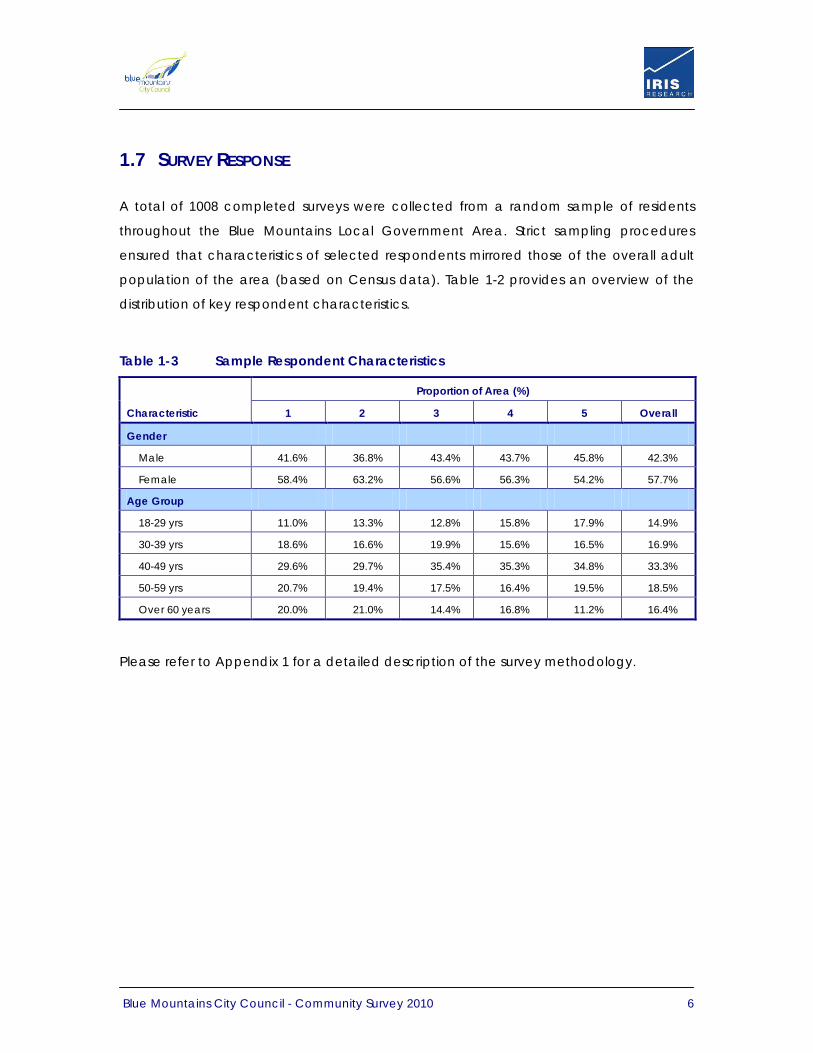
1.7 SURVEY RESPONSE
A total of 1008 completed surveys were collected from a random sample of residents
throughout the Blue Mountains Local Government Area. Strict sampling procedures
ensured that characteristics of selected respondents mirrored those of the overall adult
population of the area (based on Census data). Table 1-2 provides an overview of the
distribution of key respondent characteristics.
Table 1-3 Sample Respondent Characteristics
Proportion of Area (%)
Characteristic 1 2 3 4 5 Overall
Gender
Male 41.6% 36.8% 43.4% 43.7% 45.8% 42.3%
Female 58.4% 63.2% 56.6% 56.3% 54.2% 57.7%
Age Group
18-29 yrs 11.0% 13.3% 12.8% 15.8% 17.9% 14.9%
30-39 yrs 18.6% 16.6% 19.9% 15.6% 16.5% 16.9%
40-49 yrs 29.6% 29.7% 35.4% 35.3% 34.8% 33.3%
50-59 yrs 20.7% 19.4% 17.5% 16.4% 19.5% 18.5%
Over 60 years 20.0% 21.0% 14.4% 16.8% 11.2% 16.4%
Please refer to Appendix 1 for a detailed description of the survey methodology.
Blue Mountains City Council - Community Survey 2010 7
SURVEY RESULTS

Blue Mountains City Council - Community Survey 2010 8
2 INDIVIDUAL COUNCIL SERVICES & FACILITIES
This section presents the results for Question 1 (see questionnaire in Appendix 3), which
asked respondents to rate the importance of 50 key services and facilities provided by
BMCC, and then to rate their satisfaction with Council's provision of these services and
facilities.
In 2010 services and facilities were grouped under headings relating to Key Directions as
set out in the City Vision. This differs from previous years in which the individual services
and facilities were grouped under nine key service areas which were derived in survey
planning workshops held between Council management and IRIS. In all, there were five
Key Directions:
1. Looking after the Environment (eg. bush regeneration, garbage collection, etc) 2. Using Land for Living (eg. residential development, parking, town centre, etc) 3. Moving Around (eg. roads, footpaths, lighting public areas, etc) 4. Looking after People (eg. daycare, bushfire protection, sportsgrounds, etc) 5. Sustainable Economy (eg. employment, tourism, arts, etc)
Ratings have been analysed at two levels: a) key service area level, as displayed above;
& b) individual service or facility level. At the key service area level, composite scores
have been derived for each area by calculating the mean score for all services and
facilities rated under that heading.
Due to the change in the overall groupings of the individual services and facilities in 2010,
trend comparisons at the Key Direction level are not possible as they were in previous
years for the key service areas.
Section 2.1 presents the results in terms of the importance placed on the services and
facilities by residents. Section 2.2 assesses Council performance in terms of resident
satisfaction with the provision of these services and facilities. Finally, Section 3.0 attempts
to prioritise these services and facilities, giving Council actionable information that can
be used to allocate resources and make informed policy decisions.

Blue Mountains City Council - Community Survey 2010 9
2.1 IMPORTANCE RATINGS
Respondents were asked to rate the importance of each of the 50 Council services and
facilities on a scale of 1 to 5, where 1 = ‘not important’ and 5 = ‘very important’. Section
2.1.1 provides an overview of the key service areas, whilst sections 2.1.2 to 2.1.6 give a
more detailed account of importance ratings for individual services and facilities. A more
detailed summary of ratings for each service is provided in the appendix.
2.1.1 Overview of Key Direction Areas
2.1.1.1 Overall Analysis
Table 2-1 Importance Ratings for Overall Key Directions
Service / facility (rank order)
Importance Rating (%) Mean
Score (out of 5) N/R Low
(1-2) Medium
(3) High (4-5)
Looking After the Environment 0.0% 1.3% 18.1% 80.6% 4.38
Looking After People 0.0% 1.7% 20.5% 77.8% 4.35
Using Land for Living 0.0% 2.6% 23.3% 74.1% 4.26
Sustainable Economy 0.4% 3.6% 23.0% 73.0% 4.24
Moving Around 0.0% 2.4% 27.3% 70.3% 4.22
• Looking After the Environment was rated as the most important Key Direction by the
Blue Mountain’s community in 2010, with a mean score of 4.38 out of 5. This is
consistent with last year’s survey in which the Key Service Area of Environmental
Management was ranked first.
Key results:
• Coming in at a close second was Looking After People, with a mean score of 4.35.
• Moving around was ranked the least important Key Direction, however its mean
score of 4.22 is not far behind that of the top scoring Key Direction.
• In all, at least 7 out of 10 residents provided a ‘high’ importance rating (that is, a
score of 4 or 5) for each of the Key Directions covered in this survey.

Blue Mountains City Council - Community Survey 2010 10
2.1.1.2 Planning Area Analysis
Figure 2-1 Planning Area comparison of Mean Importance of Key Directions (n=1008)
3.50
4.00
4.50
5.00
Mea
n sc
ore
(out
of 5
)
Looking After the Environment 4.30 4.39 4.41 4.37 4.37 4.38Using Land for Living 4.24 4.33 4.26 4.22 4.23 4.26Moving Around 4.18 4.23 4.29 4.22 4.17 4.22Looking After People 4.38 4.36 4.44 4.35 4.28 4.35Sustainable Economy 4.22 4.34 4.25 4.22 4.18 4.24
1 2 3 4 5 Overall
• There were no statistically significant differences between the Planning Areas when it
came to the average importance placed on each of the Key Directions.
Key results:

Blue Mountains City Council - Community Survey 2010 11
2.1.2 Looking After the Environment
The first Key Direction dealt with in the 2010 survey was ‘Looking After the Environment’
The following section of this report deals with the individual services and facilities falling
under this banner.
2.1.2.1 Distribution of Results
Table 2-2 Importance Ratings for Looking After the Environmen
Service / facility (rank order)
t Importance Rating
(%) Mean Score (out of
5) N/R Low (1-2)
Medium (3)
High (4-5)
Environmental Management
Clean creeks & waterways 0.8% 1.5% 5.7% 92.0% 4.58
Protection of natural bushland. 0.2% 3.2% 16.2% 80.4% 4.29
Weed control 1.2% 6.1% 12.2% 80.4% 4.27
Bush regeneration 1.3% 6.8% 14.6% 77.3% 4.18
Resource Management
Garbage collection 0.0% 0.3% 3.2% 96.4% 4.78
Wheelie Bin curbside recycling service 0.1% 1.6% 2.6% 95.6% 4.75
Waste Management Facilities 4.1% 4.2% 7.2% 84.5% 4.46
Annual bulky waste pickup 2.0% 6.1% 14.1% 77.9% 4.24
Curbside chipping of green waste 3.4% 8.7% 18.6% 69.2% 4.05
Construction materials recovery and recycling service 14.2% 9.3% 14.5% 62.1% 4.00
Water Resource Management Stormwater Infrastructure 3.6% 3.7% 9.3% 83.5% 4.46
• All the services falling within the Looking After the Environment Key Direction received
a ‘high’ mean importance score of 4 or higher out of 5.
Key results:
• Garbage collection and the wheelie bin curbside recycling service were ranked as
the services Blue Mountains residents place the greatest importance on within this
Key Direction, with means of 4.78 and 4.75 respectively.
• These were ranked third and fifth overall out of all 50 service and facilities.
• Meanwhile, curbside chipping of green waste and the construction materials
recovery and recycling service, which also fall under ‘Resource Management’ were
ranked least important.

Blue Mountains City Council - Community Survey 2010 12
• Residents placed particularly high importance on clean creeks and waterways (4.58)
while waste management facilities and stormwater infrastructure were not far
behind, both scoring importance means of 4.46.
• Further statistical testing revealed a number of significant differences between
demographic groupings:
- Of all the items within this Key Direction, females placed higher
importance on seven: protection of natural bushland (4.43), clean creeks
and waterways (4.65), bush regeneration (4.32), wheelie bin curbside
recycling service (4.80), annual bulky waste pickup (4.33), curbside
chipping of green waste (4.15) and stormwater infrastructure (4.53).
- Blue Mountains youth (16-24 years) provided statistically lower importance
scores for all of the above services and facilities than the older age
groups, except in the case of wheelie bin curbside recycling service in
which all age brackets gave very similar ratings.

Blue Mountains City Council - Community Survey 2010 13
2.1.2.2 Trend Analysis
Figure 2-2a Trend in Importance Ratings for Looking After the Environment
3.0
3.5
4.0
4.5
5.0M
ean
scor
e (o
ut o
f 5)
Protection of natural bushland. 4.73 4.53 4.66 4.62 4.64 4.67 4.60 4.29Clean creeks & waterways 4.85 4.74 4.81 4.73 4.72 4.77 4.80 4.58Bush regeneration 4.52 4.34 4.41 4.38 4.44 4.47 4.40 4.19Weed control 4.42 4.17 4.42 4.36 4.26 4.36 4.30 4.27
2000 2002 2003 2004 2006 2007 2009 2010
(n=1008)
Figure 2-2b Trend in Importance Ratings for Looking After the Environment
3.0
3.5
4.0
4.5
5.0
Mea
n sc
ore
(out
of 5
)
Garbage collection 4.69 4.71 4.77 4.82 4.75 4.80 4.80 4.79Wheelie Bin recycling service 4.39 4.56 4.62 4.64 4.71 4.68 4.70 4.75Construction materials recovery 3.78 4.01 4.09 4.11 4.10 4.01Annual bulky waste pickup 4.20 4.19 4.30 4.32 4.29 4.30 4.23Curbside green waste chipping 3.99 4.07 4.10 4.13 4.14 4.20 4.05Waste Management Facilities 4.46Stormwater Infrastructure 4.46
2000 2002 2003 2004 2006 2007 2009 2010
(n=1008)

Blue Mountains City Council - Community Survey 2010 14
• There appears to have been a drop off in the importance residents place on services
falling under the banner of ‘Environmental Management’. While still achieving ‘high’
mean scores, protection of natural bushland, clean creeks and waterways, and bush
regeneration all reported declines from their 2009 scores.
Key results:
• Otherwise, there has been little movement in importance ratings for the individual
services and facilities within this Key Direction over the last few years.
2.1.2.3 Planning Area Analysis
Figure 2-2c Planning Area Importance Ratings for Looking After the Environment
3
3.5
4
4.5
5
Mea
n sc
ore
(out
of 5
)
Protection of natural bushland. 4.2 4.41 4.28 4.18 4.32Clean creeks & waterways 4.5 4.63 4.64 4.58 4.54Bush regeneration 4.11 4.23 4.24 4.21 4.11Weed control 4.32 4.25 4.36 4.28 4.23
1 2 3 4 5

Blue Mountains City Council - Community Survey 2010 15
Figure 2-2d Planning Area Importance Ratings for Looking After the Environment
3
3.5
4
4.5
5
Mea
n sc
ore
(out
of 5
)
Garbage collection 4.73 4.79 4.69 4.81 4.80Wheelie Bin recycling service 4.64 4.78 4.73 4.75 4.76Construction materials recovery 3.93 3.99 3.93 3.99 4.07Annual bulky waste pickup 4.25 4.16 4.31 4.32 4.17Curbside green waste chipping 3.94 3.86 4.24 4.10 4.13Waste Management Facilities 4.35 4.49 4.43 4.42 4.49Stormwater Infrastructure 4.37 4.56 4.52 4.41 4.41
1 2 3 4 5
• The only statistically significant difference in importance ratings for items in the Key
Direction of Looking After the Environment was that residents of Planning Area 3
(4.24) were more likely to provide a higher score for curbside chipping of green waste
than residents of Planning Area 2 (3.86).
Key results:

Blue Mountains City Council - Community Survey 2010 16
2.1.3 Using Land for Living
The next Key Direction dealt with was ‘Using Land for Living’. This section of the report
looks into the individual services and facilities within this Key Direction.
2.1.3.1 Distribution of Results
Table 2-3 Importance Ratings for Using Land for Living
Service / facility (rank order)
Importance Rating
(%) Mean Score (out of
5) N/R Low (1-2)
Medium (3)
High (4-5)
Land Use Management
Managing residential development 3.7% 3.1% 10.3% 83.0% 4.41
Protection of heritage values & buildings 0.6% 5.9% 14.1% 79.4% 4.22
Enhancing the built environment 3.1% 5.3% 19.6% 72.0% 4.06
Town Centres
Litter control 0.4% 1.7% 6.4% 91.5% 4.52
Town centre & village atmosphere 0.5% 2.4% 8.5% 88.6% 4.44
Parking for shoppers 0.5% 2.2% 10.7% 86.5% 4.43
Public toilets 0.5% 4.4% 12.1% 82.9% 4.36
Street cleaning 1.7% 6.3% 18.0% 74.0% 4.10
Burial & Ashes Placement Cemeteries and ashes placement sites. 9.1% 15.7% 18.9% 56.3% 3.70
• Litter control was rated by Blue Mountains residents as the most important service
within the Key Direction of Using Land for Living, recording a ‘high’ mean score of
4.52 out of 5.
Key results:
• In general, the items falling within the sub-group of ‘Town Centres’ rated quite highly,
with town centre and village atmosphere registering an importance mean of 4.44
and parking for shoppers following at 4.43.
• Managing residential development was the ‘Land Use Management’ item that
residents placed greatest satisfaction on, with a mean score of 4.41.
• Cemeteries and ashes placement sites was the only service or facility within this Key
Direction to not achieve a ‘high’ mean rating. Its importance score of 3.70 places it in
the ‘medium’ range.

Blue Mountains City Council - Community Survey 2010 17
• A number of statistically significant variations were identified within demographic
groupings:
- Females placed significantly higher importance on all items within the Key
Direction of Using Land for Living than males, except in the case of street
cleaning for which there was no difference between the sexes.
- 16-24 year olds again were more likely to provide lower importance
ratings for all of the above services and facilities.
- Residents in the 25-34 years age bracket joined the local youth in
providing significantly lower importance ratings when it came to
managing residential development (4.16) and cemeteries and ashes
placement sites (3.10).

Blue Mountains City Council - Community Survey 2010 18
2.1.3.2 Trend Analysis
Figure 2-3a Trend in Importance Ratings for Using Land for Living
3.0
3.5
4.0
4.5
5.0
Mea
n sc
ore
(out
of 5
)
Managing residential development 4.45 4.40 4.49 4.44 4.33 4.32 4.30 4.41Protection of heritage values &buildings
4.33 4.11 4.33 4.32 4.24 4.26 4.20 4.22
Enhancing the built environment 4.09 3.97 4.09 4.00 4.05 3.98 3.90 4.06Public toilets 4.43 4.32 4.33 4.40 4.37 4.49 4.40 4.36Litter control 4.80 4.55 4.69 4.59 4.52 4.58 4.60 4.52Street cleaning 4.64 4.08 4.26 4.13 4.01 4.14 4.20 4.10Town centre & village atmosphere 4.40 4.19 4.38 4.33 4.39 4.52 4.40 4.44Parking for shoppers 4.50 4.41 4.55 4.44 4.34 4.49 4.60 4.43Cemeteries and ashes placement sites. 3.70
2000 2002 2003 2004 2006 2007 2009 2010
(n=1008)
• There were minimal changes in the importance scores for the individual services and
facilities measured in this Key Direction since the last survey.
Key results:
• The most notable increase was for enhancing the built environment, up from 3.90 to
4.06.
• Parking for shoppers reported the largest fall although this was relatively small, down
from 4.60 to 4.43.

Blue Mountains City Council - Community Survey 2010 19
2.1.3.3 Planning Area Analysis
Figure 2-3b Planning Area Importance Ratings for Using Land for Living
3
3.5
4
4.5
5
Mea
n sc
ore
(out
of 5
)
Managing residential development 4.36 4.47 4.38 4.40 4.38Protection of heritage values &buildings
4.14 4.33 4.09 4.22 4.22
Enhancing the built environment 4.04 4.16 4.02 3.89 4.16Public toilets 4.41 4.39 4.48 4.31 4.31Litter control 4.55 4.56 4.52 4.53 4.47Street cleaning 4.00 4.22 4.11 4.00 4.10Town centre & village atmosphere 4.55 4.54 4.37 4.38 4.43Parking for shoppers 4.31 4.51 4.45 4.50 4.31Cemeteries and ashes placement sites. 3.72 3.72 3.85 3.68 3.62
1 2 3 4 5
• Residents of the five local Planning Areas were fairly consistent in how they rated the
importance they place on the individual services and facilities within the Key
Direction of Using Land for Living, with no significant differences uncovered.
Key results:

Blue Mountains City Council - Community Survey 2010 20
2.1.4 Moving Around
Moving Around was the third Key Direction dealt with in this survey. Importance ratings
for items within this Key Direction are detailed below.
2.1.4.1 Distribution of Results
Table 2-4 Importance Ratings for Moving Around
Service / facility (rank order)
Importance Rating
(%) Mean Score (out of
5) N/R Low (1-2)
Medium (3)
High (4-5)
Transport & Public Access
Sealed roads 0.4% 3.0% 9.3% 87.4% 4.47
Pedestrian access generally around shopping centres & community facilities. 0.1% 1.5% 7.9% 90.5% 4.47
Lighting of public areas. 1.4% 2.9% 10.1% 85.6% 4.47
Footpaths 0.2% 3.3% 9.2% 87.2% 4.42
Carparks 1.2% 3.3% 15.0% 80.5% 4.27
Commuter parking 2.6% 8.7% 11.5% 77.1% 4.17
Bus shelters 3.4% 13.1% 17.8% 65.7% 3.86
Cycle ways 4.0% 15.9% 18.0% 62.1% 3.74
Unsealed roads 8.3% 17.6% 30.7% 43.4% 3.42
Traffic Management Traffic Safety 0.2% 0.5% 3.2% 96.2% 4.77
• Traffic safety was by far the most important item within this Key Direction, with a mean
score of 4.77 out of 5. It was given a ‘high’ score by 96.2% of residents.
Key results:
• Sealed roads, pedestrian access generally around shopping centres and community
facilities, and lighting of public areas all recorded mean importance scores of 4.47,
with around 9 in 10 residents providing ‘high’ ratings.
• There were three ‘Transport & Public Access’ items that attained mean scores in the
‘medium’ range, those being bus shelters (3.86), cycle ways (3.74) and unsealed
roads (3.42).
• Statistical testing uncovered a number of significant differences:
- Females continued to provide higher importance ratings for items in this
Key Direction, except for footpaths which is the one service/facility where
there was no notable difference between the sexes.

Blue Mountains City Council - Community Survey 2010 21
- Senior residents (65 years or older) placed significantly more importance
on bus shelters (4.31) than those of the other age brackets surveyed.
- People in the 65+ years age group also rated carparks as more important
than residents aged 16-49 years.
- Local youth (16-24 years) generally provided significantly lower scores for
all other items, with 25-34 year olds joining them when it came to
pedestrian access generally around shopping centres and community
facilities (4.40), lighting of public areas (4.31) and commuter parking
(3.90).

Blue Mountains City Council - Community Survey 2010 22
2.1.4.2 Trend Analysis
Figure 2-4a Trend in Importance Ratings for Moving Around
3.0
3.5
4.0
4.5
5.0
Mea
n sc
ore
(out
of 5
)
Sealed roads 4.53 4.47 4.53 4.52 4.44 4.55 4.60 4.47Unsealed roads 3.87 3.90 3.92 3.93 3.74 3.96 3.90 3.42Bus shelters 3.68 3.45 3.63 3.63 3.61 3.78 3.70 3.86Pedestrian access 4.50 4.41 4.47 4.48 4.44 4.49 4.50 4.47Lighting of public areas. 4.53 4.41 4.54 4.43 4.29 4.46 4.50 4.47Footpaths 4.44 4.35 4.53 4.47 4.43 4.49 4.50 4.42Cycle ways 3.74Carparks 4.28Commuter parking 4.03 3.87 4.08 4.01 3.83 4.06 4.10 4.17Traffic Safety 4.77
2000 2002 2003 2004 2006 2007 2009 2010
(n=1008)
• Overall there was little change in the importance residents place on the Moving
Around services and facilities between this survey and the last.
Key results:
• A slight increase in importance was reported for bus shelters, up from 3.70 to 3.86.
• There was, however, a significant decline in the mean importance rating for unsealed
roads with the mean score falling from 3.90 to 3.42.

Blue Mountains City Council - Community Survey 2010 23
2.1.4.3 Planning Area Analysis
Figure 2-4b Planning Area Importance Ratings for Moving Around
3
3.5
4
4.5
5
Mea
n sc
ore
(out
of 5
)
Sealed roads 4.37 4.41 4.54 4.54 4.45Unsealed roads 3.57 3.42 3.57 3.40 3.33Bus shelters 3.93 3.97 3.98 3.84 3.70Pedestrian access 4.51 4.49 4.53 4.43 4.46Lighting of public areas. 4.47 4.51 4.45 4.42 4.49Footpaths 4.42 4.39 4.48 4.44 4.40Cycle ways 3.60 3.65 3.84 3.82 3.74Carparks 4.11 4.38 4.39 4.28 4.15Commuter parking 3.98 4.12 4.28 4.20 4.17Traffic Safety 4.77 4.80 4.80 4.78 4.71
1 2 3 4 5
• Most items within this Key Direction reported strong similarities between local Planning
Areas.
Key results:
• The only statistically significant difference was that residents of Planning Areas 2 (4.38)
and 3 (4.39) were more likely to provide higher importance ratings for carparks than
those of Planning Area 1 (4.11).

Blue Mountains City Council - Community Survey 2010 24
2.1.5 Looking After People
Respondents were next asked to rate the importance they place on services and
facilities that have to do with Looking After People. This subsection of the report analyses
this.
2.1.5.1 Distribution of Results
Table 2-5 Importance Ratings for Looking After People
Service / facility (rank order)
Importance Rating (%)
Mean Score (out of
5) N/R Low (1-2)
Medium (3)
High (4-5)
Child Care
Family Day Care Services 13.4% 18.6% 8.5% 59.5% 3.82
Community Safety
Protection from bushfires and emergencies 0.2% 0.1% 1.8% 97.8% 4.87
Rural Fire Service and SES buildings 1.6% 1.3% 3.4% 93.7% 4.70
Community Development
Advocacy for facilities & services for people with a disability 4.7% 4.4% 5.5% 85.4% 4.48
Advocacy for services and facilities for older people 3.8% 4.8% 8.4% 82.9% 4.39
Advocacy for services and facilities for young people 5.6% 5.1% 7.9% 81.4% 4.38
Advocacy for services & facilities for children & families 6.9% 6.3% 10.1% 76.6% 4.29
Community centres & community halls 2.2% 5.5% 17.2% 75.1% 4.10
Sport & Recreation
Parks & playgrounds. 1.4% 3.3% 6.0% 89.4% 4.48
Council lookouts and walking trails. 2.2% 3.7% 13.0% 81.1% 4.29
Ovals & sporting grounds. 1.7% 6.7% 9.3% 82.3% 4.27
Swimming pools. 1.6% 5.3% 13.5% 79.5% 4.23
Environmental Heath & Regulation
Clean, safe and healthy living environments 0.8% 0.3% 2.5% 96.4% 4.83
Library & Information
Library services 2.4% 7.8% 11.5% 78.3% 4.21
Library buildings 5.3% 5.7% 17.7% 71.3% 4.11
Hours of operation of the library service 7.5% 9.2% 16.7% 66.6% 4.01
• Blue Mountains predictably regard ‘Community Safety’ with ‘high’ importance.
Protection from bushfires and emergencies achieved the highest mean importance
score out of all 50 items measured, at 4.87 out of 5. Rural Fire Service and SES building
was close behind at 4.70.
Key results:

Blue Mountains City Council - Community Survey 2010 25
• Locals also place great importance on clean, safe and healthy living environments,
with this item registering a mean score of 4.83. Nearly all of those surveyed gave it a
‘high’ rating.
• Advocacy for services and facilities for disadvantaged groups within the community
is also considered quite important, particularly when it comes to people with a
disability (4.48), older people (4.39) and young people (4.38).
• In the area of ‘Sports and Recreation’ residents highly value parks and playgrounds,
which recorded a mean importance score of 4.48 out of 5.
• Family day care services was the only item to attain a mean score in the ‘medium’
range, at 3.82.
• The following statistically significant differences in importance scores were discovered
through further analysis:
- Females were more likely to provide higher importance ratings for all of
the ‘Community Development’, ‘Sport & Recreation’, ‘Environmental
Heath & Regulation’, and ‘Library & Information’ items measured in this
survey than males, except in the case of ovals and sportsgrounds in which
there was no statistical difference.
- Females (4.73) also had a tendency to place greater importance on Rural
Fire Services & State Emergency Service buildings than males (4.65).
- Young adults (25-34 years) generally provided lower importance ratings
for protection from bushfires and emergencies (4.79) and Rural Fire
Services & State Emergency Service buildings (4.55) than senior residents
aged 65 years or older (4.96 and 4.81 respectively).
- Blue Mountains youth (16-24 years) were significantly more likely to place
lower importance on advocacy for services & facilities for children &
families (4.04), advocacy for services and facilities for young people
(4.16), community centres & community halls (3.66), ovals & sporting
grounds (3.94), swimming pools (3.97) and parks and playgrounds (4.12)
than older residents.

Blue Mountains City Council - Community Survey 2010 26
- Residents aged 50-64 years (4.62) and 65+ years (4.66) tend to place
greater importance on advocacy for service and facilities for older
people than younger residents.
- Seniors (65 years or older) were also significantly more likely to provide
higher importance scores for advocacy for service and facilities for
people with a disability (4.71), library services (4.53), hours of operation of
the library service (4.42) and library buildings (4.44) than residents aged 16-
49 years.

Blue Mountains City Council - Community Survey 2010 27
2.1.5.2 Trend Analysis
Figure 2-5a Trend in Importance Ratings for Looking After People
3.0
3.5
4.0
4.5
5.0
Mea
n sc
ore
(out
of 5
)
Family Day Care Services 3.71 3.56 3.93 3.90 3.82Protection - bushfires & emergencies 4.87Rural Fire Service and SES buildings 4.70Advocacy - children & families 4.22 4.06 4.35 4.11 4.07 4.30 4.30 4.29Advocacy - young people 4.38 4.10 4.37 4.22 4.06 4.27 4.30 4.38Advocacy - older people 4.42 4.19 4.41 4.31 4.23 4.36 4.40 4.39Advocacy - people with a disability 4.46 4.24 4.43 4.26 4.17 4.38 4.40 4.48Community centres & community halls 3.64 3.91 3.59 3.92 3.96 3.82 3.90 4.10
2000 2002 2003 2004 2006 2007 2009 2010
(n=1008)
Figure 2-5b Trend in Importance Ratings for Looking After People
3.0
3.5
4.0
4.5
5.0
Mea
n sc
ore
(out
of 5
)
Ovals & sporting grounds. 3.22 3.89 3.30 4.06 4.12 3.53 3.70 4.27Swimming pools. 3.79 3.90 3.93 4.05 3.92 3.68 3.70 4.23Parks & playgrounds. 4.13 4.31 4.12 4.26 4.31 4.02 4.10 4.48Council lookouts and walking trails. 4.09 4.15 4.07 4.15 4.20 4.02 4.00 4.29Clean, safe, healthy living environments 4.83Library services 4.13 4.15 4.17 4.23 4.17 4.09 4.20 4.21Hours of operation of the library service 3.94 3.84 3.88 3.78 3.90 4.01Library buildings 4.11
2000 2002 2003 2004 2006 2007 2009 2010
(n=1008)

Blue Mountains City Council - Community Survey 2010 28
• There were a number of notable increases in the importance Blue Mountains
residents place on services and facilities within the Key Direction of Looking After
People since last year.
Key results:
• Community centres and halls (3.90 to 4.10), ovals and sporting grounds (3.70 to 4.27),
and swimming pools (3.70 to 4.23) all moved out of the ‘medium’ range in 2009 to the
‘high’ range in 2010.
• The importance placed on parks and playgrounds also increased significantly, with
the mean score for this item rising from 4.10 to 4.48, while the importance score for
Council lookouts and walking trails grew from 4.00 to 4.29.

Blue Mountains City Council - Community Survey 2010 29
2.1.5.3 Planning Area Analysis
Figure 2-5c Planning Area Importance Ratings for Looking After People
3
3.5
4
4.5
5
Mea
n sc
ore
(out
of 5
)
Family Day Care Services 3.78 3.78 4.12 3.8 3.74Protection - bushfires & emergencies 4.86 4.88 4.92 4.89 4.8Rural Fire Service and SES buildings 4.70 4.66 4.79 4.67 4.72Advocacy - children & families 4.23 4.26 4.44 4.29 4.26Advocacy - young people 4.27 4.41 4.51 4.38 4.33Advocacy - older people 4.47 4.47 4.57 4.33 4.25Advocacy - people with a disability 4.53 4.55 4.55 4.4 4.46Community centres & community halls 4.38 4.07 4.21 4.11 3.99
1 2 3 4 5
Figure 2-5d Planning Area Importance Ratings for Looking After People
3
3.5
4
4.5
5
Mea
n sc
ore
(out
of 5
)
Ovals & sporting grounds. 4.23 4.01 4.34 4.41 4.34Swimming pools. 4.17 4.11 4.33 4.3 4.23Parks & playgrounds. 4.55 4.44 4.52 4.48 4.47Council lookouts and walking trails. 4.45 4.46 4.35 4.16 4.19Clean, safe, healthy living environments 4.85 4.81 4.83 4.84 4.83Library services 4.29 4.3 4.28 4.21 4.05Hours of operation of the library service 4.08 4.16 4.05 4.00 3.83Library buildings 4.02 4.28 4.16 4.13 3.90
1 2 3 4 5

Blue Mountains City Council - Community Survey 2010 30
• There were a number of statistically significant differences across the local Planning
Areas when it came to the level of importance placed on services and facilities
within this Key Direction.
Key results:
• Residents of Planning Area 3 (4.92) had a tendency to place greater importance on
protection from bushfires and emergencies than those of Planning Area 5 (4.80).
• This was also the case when it came to advocacy for services and facilities for older
people (4.57 and 4.25 respectively).
• Meanwhile, residents of Planning Area 2 generally provided higher importance scores
for hours of operation of the library services (4.16) and library buildings (4.28) than
residents of Planning Area 5 (3.83 and 3.90 respectively).
• Planning Area 1 had a significantly higher mean importance rating for community
centres and community halls (4.38) than Planning Areas 2 (4.07) and 5 (3.99).
• Significantly higher importance scores were generally provided by Planning Areas 3
(4.34), 4 (4.41) and 5 (4.34) for ovals and sportsgrounds than by Planning Area 2
(4.01).
• Residents of Planning Areas 1 (4.45) and 2 (4.46) had a tendency to place greater
importance of Council lookouts and walking trails than residents of Planning Areas 4
(4.16) and 5 (4.19).

Blue Mountains City Council - Community Survey 2010 31
2.1.6 Sustainable Economy
Sustainable Economy was the last of the Key Directions residents were asked about as
part of this survey. There were four services and facilities that residents were asked to
rate, as shown below.
2.1.6.1 Distribution of Results
Table 2-6 Importance Ratings for Sustainable Economy
Service / facility (rank order)
Importance Rating
(%) Mean Score (out of
5) N/R Low (1-2)
Medium (3)
High (4-5)
Economic Development
Generating local employment opportunities 2.2% 2.4% 5.3% 90.1% 4.59
Tourism Promotion
Tourism promotion 0.6% 6.0% 15.2% 78.2% 4.20
Visitor Information Centres 2.0% 5.2% 16.7% 76.1% 4.19
Cultural & Arts Facilities
Cultural & Arts facilities 3.2% 6.8% 21.6% 68.4% 3.98
• Three of the four Sustainable Economy items achieved ‘high’ mean scores of 4 or
higher.
Key results:
• Generating local employment opportunities was rated as the most important service
within this Key Direction, with a mean score of 4.59 out of 5.
• Tourism promotion and Visitor Information Centres rated almost identically, recording
importance means of 4.20 and 4.19 respectively.
• Cultural and arts facilities just slipped into the ‘medium’ range, registering a mean of
3.98 out of 5.
• Significant differences in mean importance were recorded for the following
demographic groups:
- Females placed greater importance on generating local employment
opportunities (4.64) and cultural and arts facilities (4.13) than males (4.53
and 3.77 respectively).

Blue Mountains City Council - Community Survey 2010 32
- Local youth (16-24 years) were significantly more likely to provide a higher
importance score for generating local employment opportunities (4.73)
than seniors/retirees (4.42).
- Meanwhile, it was the youth that were least likely to provide a high
importance rating for the other three items in this Key Direction.
2.1.6.2 Trend Analysis
Figure 2-6a Trend in Importance Ratings for Sustainable Economy
3.0
3.5
4.0
4.5
5.0
Mea
n sc
ore
(out
of 5
)
Generating local employmentopportunities
4.57 4.32 4.52 4.36 4.28 4.51 4.60 4.59
Tourism promotion 3.97 4.10 4.20Visitor Information Centres 4.19Cultural & Arts facilities 3.51 3.60 3.98
2000 2002 2003 2004 2006 2007 2009 2010
(n=1008)
• The only significant change in importance within this Key Direction occurred for
cultural and arts facilities. The mean score for this item rose from 3.60 in 2009 to 3.98
this year.
Key results:

Blue Mountains City Council - Community Survey 2010 33
2.1.6.3 Planning Area Analysis
Figure 2-6b Planning Area Importance Ratings for Sustainable Economy
3
3.5
4
4.5
5
Mea
n sc
ore
(out
of 5
)
Generating local employmentopportunities
4.54 4.65 4.63 4.59 4.54
Tourism promotion 4.19 4.26 4.27 4.17 4.13Visitor Information Centres 4.18 4.32 4.12 4.15 4.16Cultural & Arts facilities 3.97 4.12 4.00 3.95 3.86
1 2 3 4 5
• The variation in importance between local Planning Areas was minimal and not
significant.
Key results:

Blue Mountains City Council - Community Survey 2010 34
2.2 SATISFACTION RATINGS
Respondents were asked to rate their satisfaction with the delivery of each of the 50
Council services and facilities on a scale of 1 to 5, where 1 = ‘very dissatisfied’ and 5 =
‘very satisfied’. Section 2.2.1 provides an overview of the Key Directions, whilst sections
2.2.2 to 2.2.10 give a more detailed account of satisfaction ratings for individual services
and facilities. A more detailed summary of ratings for each service is provided in the
appendix.
2.2.1 Overview of Key Direction Areas
2.2.1.1 Analysis
Table 2-7 Satisfaction Ratings for Overall Key Directions
Service / facility (rank order)
Satisfaction Rating (%) Mean
Score (out of 5) N/R Low
(1-2) Medium
(3) High (4-5)
Looking After the Environment 0.0% 11.2% 59.0% 29.8% 3.66
Looking After People 0.0% 16.5% 58.9% 24.6% 3.56
Sustainable Economy 1.3% 24.9% 50.6% 23.2% 3.33
Using Land for Living 0.0% 29.3% 56.7% 14.1% 3.27
Moving Around 0.0% 33.9% 52.6% 13.5% 3.23
• In addition to being rated as most important, the Key Direction of Looking After the
Environment achieved the highest overall mean satisfaction rating of 3.66 out of a
possible 5.
Key results:
• Each of the five Key Directions recorded overall satisfaction means within the
‘medium’ range, with Moving Around the lowest at 3.23. Just 13.5% of residents
provided ‘high’ satisfaction scores for items within this Key Direction.

Blue Mountains City Council - Community Survey 2010 35
Figure 2-7 Planning Area comparison of Mean Satisfaction of Key Directions (n=1008)
2.50
3.00
3.50
4.00
Mea
n s
core
(out
of 5
)
Looking After the Environment 3.65 3.74 3.65 3.65 3.61 3.66Using Land for Living 3.15 3.27 3.16 3.33 3.32 3.27Moving Around 3.06 3.20 3.09 3.31 3.30 3.23Looking After People 3.48 3.56 3.55 3.58 3.57 3.56Sustainable Economy 3.15 3.21 3.31 3.39 3.44 3.33
1 2 3 4 5 Overall
• A number of differences were noticed when it came to the level of satisfaction with
these Key Directions between the five local Planning Areas.
Key results:
• Planning Areas 4(3.31) and 5 (3.30) displayed greater levels of satisfaction with the
Moving Around services and facilities than Planning Areas 1 (3.06) and 3 (3.09).
• Residents of Planning Areas 4 (3.39) and 5 (3.44) had a tendency to be more satisfied
with the Sustainable Economy services and facilities than residents of Planning Area 1
(3.15).

Blue Mountains City Council - Community Survey 2010 36
2.2.2 Looking After the Environment
As was the case when it came to importance, residents were first asked to rate their level
of satisfaction with the services and facilities within the Key Direction of Looking After the
Environment. This subsection of the report analyses those responses.
2.2.2.1 Distribution of Results
Table 2-8 Satisfaction Ratings for Looking After the Environmen
Service / facility (rank order)
t Satisfaction Rating
(%) Mean Score (out of
5) N/R Low (1-2)
Medium (3)
High (4-5)
Environmental Management
Bush regeneration 11.0% 9.9% 33.4% 45.6% 3.53
Protection of natural bushland. 8.6% 11.1% 35.4% 44.9% 3.49
Clean creeks & waterways 14.7% 14.0% 31.5% 39.8% 3.40
Weed control 9.9% 28.6% 37.3% 24.1% 2.93
Resource Management
Garbage collection 0.0% 3.7% 9.0% 87.3% 4.43
Wheelie Bin curbside recycling service 0.6% 5.8% 10.1% 83.5% 4.37
Waste Management Facilities 12.7% 7.3% 22.0% 58.0% 3.89
Annual bulky waste pickup 6.3% 14.6% 24.6% 54.5% 3.69
Curbside chipping of green waste 10.4% 12.5% 24.5% 52.5% 3.68
Construction materials recovery and recycling service 9.5% 26.9% 33.8% 29.8% 3.55
Storm Resource Management Stormwater Infrastructure 10.7% 26.8% 32.1% 30.3% 3.04
• Two services within the Key Direction of Looking After the Environment achieved
‘high’ mean satisfaction scores. Garbage collection recorded a mean of 4.43 out of
5, while the wheelie bin curbside recycling service was close behind at 4.37.
Key results:
• It was the services and facilities falling under the banner of ‘Resource Management’
that rated most highly.
• Bush regeneration was the highest scoring of the ‘Environmental Management’ items,
with a satisfaction mean of 3.53.
• At the same time, weed control was the lowest ranking item within this Key Direction
at a ‘low’ 2.93.

Blue Mountains City Council - Community Survey 2010 37
• Nearly one third of residents provided a ‘high’ satisfaction rating for stormwater
infrastructure, resulting in a mean score of 3.04.
• Further statistical testing revealed a number of significant differences in satisfaction
ratings between the following demographic groupings:
- Females (3.65) were more likely to be satisfied with the construction
materials recovery and recycling service than males (3.43).
- Senior residents (65 years and older) displayed higher levels of satisfaction
with garbage collection (4.68), the construction materials recovery and
recycling service (3.77) and curbside chipping of green waste (3.91) than
younger residents.
- Senior residents (4.54) were joined by those aged 35-49 years (4.39) in
providing higher satisfaction for the wheelie bin curbside recycling service
than local youth (4.11).
- Young adults in the 25-34 years age bracket (4.11) were significantly more
likely to be satisfied with waste management facilities than 16-24 year olds
(3.71).

Blue Mountains City Council - Community Survey 2010 38
2.2.2.2 Trend Analysis
Figure 2-8a Trend in Satisfaction Ratings for Looking After the Environment
2.5
3.0
3.5
4.0
4.5
Mea
n sc
ore
(out
of 5
)
Protection of natural bushland. 3.47 3.37 3.50 3.17 3.32 3.42 3.60 3.49Clean creeks & waterways 2.81 3.06 3.09 2.89 2.99 3.10 3.20 3.40Bush regeneration 3.22 3.31 3.30 3.24 3.31 3.40 3.40 3.53Weed control 2.63 2.80 2.78 2.69 2.83 2.89 2.90 2.93
2000 2002 2003 2004 2006 2007 2009 2010
(n=1008)
Figure 2-8b Trend in Satisfaction Ratings for Looking After the Environment
2.5
3.0
3.5
4.0
4.5
5.0
Mea
n sc
ore
(out
of 5
)
Garbage collection 3.03 4.37 4.27 4.37 4.34 4.32 4.50 4.43Wheelie Bin recycling service 3.15 3.88 3.80 3.91 3.94 3.72 4.40 4.37Construction materials recovery 3.35 3.31 3.37 3.34 3.40 3.55Annual bulky waste pickup 3.34 3.57 3.58 3.73 3.39 3.60 3.69Curbside green waste chipping 3.24 3.58 3.61 3.66 3.47 3.50 3.68Waste Management Facilities 3.89Stormwater Infrastructure 3.04
2000 2002 2003 2004 2006 2007 2009 2010
(n=1008)

Blue Mountains City Council - Community Survey 2010 39
• A few notable improvements in satisfaction ratings were recorded since last year.
Key results:
• Satisfaction with bush regeneration rose from 3.40 to 3.53.
• Satisfaction with the construction materials recovery and recycling service was up
from 3.40 to 3.55.
• Satisfaction with the curbside chipping of green waste increased from 3.50 to 3.68.

Blue Mountains City Council - Community Survey 2010 40
2.2.2.3 Planning Area Analysis
Figure 2-8b Planning Area Satisfaction Ratings for Looking After the Environment
2.5
3
3.5
4
4.5
Mea
n sc
ore
(out
of 5
)
Protection of natural bushland. 3.32 3.56 3.5 3.49 3.46Clean creeks & waterways 3.44 3.43 3.41 3.48 3.26Bush regeneration 3.46 3.64 3.54 3.55 3.43Weed control 3.00 3.02 2.9 2.84 2.93
1 2 3 4 5
Figure 2-2d Planning Area Satisfaction Ratings for Looking After the Environment
2.5
3
3.5
4
4.5
5
Mea
n sc
ore
(out
of 5
)
Garbage collection 4.41 4.53 4.37 4.36 4.43Wheelie Bin' curbside recycling service 4.39 4.41 4.37 4.28 4.41Construction materials recovery andrecycling service
3.53 3.64 3.36 3.52 3.59
Annual bulky waste pickup 3.66 3.84 3.72 3.77 3.44Curbside chipping of green waste 3.67 3.76 3.8 3.68 3.56Waste Management Facilities 3.78 3.99 3.85 3.87 3.87Stormwater Infrastructure 3.18 3.04 2.92 3.08 3.03
1 2 3 4 5

Blue Mountains City Council - Community Survey 2010 41
• The satisfaction ratings for items within this Key Direction were extremely similar across
the five local Planning Areas.
Key results:
• The only notable exception was that Planning Areas 2 (3.84) and 4 (3.77) were
significantly more likely to provide a higher satisfaction rating for the annual bulky
waste pick up service than Planning Area 5 (3.44).

Blue Mountains City Council - Community Survey 2010 42
2.2.3 Using Land for Living
The second Key Direction that residents were asked to address was Using Land for Living.
The satisfaction ratings that were given to these items are explored below.
2.2.3.1 Distribution of Results
Table 2-3 Satisfaction Ratings for Using Land for Living
Service / facility (rank order)
Satisfaction Rating
(%) Mean Score (out of
5) N/R Low (1-2)
Medium (3)
High (4-5)
Land Use Management
Protection of heritage values & buildings 6.1% 14.3% 35.2% 44.4% 3.43
Enhancing the built environment 18.6% 41.7% 33.2% 6.5% 3.19
Managing residential development 10.0% 21.6% 39.1% 29.3% 3.11
Town Centres
Litter control 1.2% 16.9% 33.5% 48.3% 3.41
Town centre & village atmosphere 1.8% 16.8% 35.4% 46.0% 3.41
Street cleaning 3.8% 16.2% 34.8% 45.2% 3.38
Parking for shoppers 1.4% 22.9% 36.3% 39.3% 3.22
Public toilets 4.2% 37.7% 35.3% 22.8% 2.76
Burial & Ashes Placement
Cemeteries and ashes placement sites. 31.5% 6.0% 26.7% 35.8% 3.60
• Services and facilities within this Key Direction were generally placed at the lower end
of the ‘medium’ range.
Key results:
• Cemeteries and ashes placement sites achieved the highest ranking of the Using
Land for Living items, with a mean satisfaction score of 3.60 out of 5.
• Protection of heritage values and buildings registered a mean score of 3.43, while
litter control, and town centre and village atmosphere both recorded satisfaction
ratings of 3.41.
• Public toilets was the only item to attain a satisfaction score in the ‘low’ range, at 2.76
out of 5.
• A number of statistically significant differences were revealed through further analysis:
- The only notable difference between the sexes was that males (2.94) had
a tendency to be more satisfied with public toilets than females (2.63).

Blue Mountains City Council - Community Survey 2010 43
- Blue Mountains youth (16-24 year olds) generally provided higher
satisfaction ratings when it came to managing residential development
(3.28), protection of heritage values (3.61), enhancing the built
environment (3.51) and street cleaning (3.45) than some of the older age
groups.
- Residents aged 25-34 years joined the local youth in displaying high levels
of satisfaction with the protection of heritage values (3.53).
- This age group (3.68) was also significantly more likely to be satisfied with
litter control than both 16-24 year olds (3.23) and 50-64 year olds (3.22)
- Seniors (65+ years) had a tendency to be more satisfied with public toilets
(3.07) than the local youth (2.55).

Blue Mountains City Council - Community Survey 2010 44
2.2.3.2 Trend Analysis
Figure 2-9a Trend in Satisfaction Ratings for Using Land for Living
2.5
3.0
3.5
4.0
4.5
Mea
n sc
ore
(out
of 5
)
Managing residential development 2.74 2.72 2.70 2.59 2.70 2.81 3.00 3.11Protection of heritage values &buildings
3.36 3.32 3.25 3.22 3.20 3.27 3.40 3.43
Enhancing the built environment 3.07 3.00 3.11 2.96 2.97 3.01 3.10 3.19Public toilets 2.62 2.79 2.83 2.69 2.76 2.80 2.90 2.76Litter control 4.19 3.24 3.39 3.32 3.38 3.26 3.40 3.41Street cleaning 3.51 3.26 3.36 3.33 3.38 3.23 3.30 3.38Town centre & village atmosphere 3.28 3.21 3.25 3.23 3.21 3.26 3.50 3.41Parking for shoppers 3.08 3.02 3.23 3.04 3.20 3.10 3.10 3.22Cemeteries and ashes placement sites. 3.60
2000 2002 2003 2004 2006 2007 2009 2010
(n=1008)
• Year on year comparisons revealed little change in satisfaction for the items falling
under the Using Land for Living banner.
Key results:
• Satisfaction with managing residential development rose slightly, from 3.00 in 2009 to
3.11 in 2010.
• A decline of similar magnitude was recorded for public toilets, down from 2.90 to
2.76.

Blue Mountains City Council - Community Survey 2010 45
2.2.3.3 Planning Area Analysis
Figure 2-9b Planning Area Satisfaction Ratings for Using Land for Living
2.5
3
3.5
4
4.5
Mea
n sc
ore
(out
of 5
)
Managing residential development 3.09 3.2 3.17 3.08 3.04Protection of heritage values &buildings
3.27 3.47 3.36 3.45 3.48
Enhancing the built environment 3.08 3.19 3.13 3.25 3.20Public toilets 2.71 2.81 2.55 2.75 2.83Litter control 3.26 3.42 3.26 3.51 3.40Street cleaning 3.36 3.49 3.18 3.40 3.37Town centre & village atmosphere 3.32 3.41 3.27 3.43 3.48Parking for shoppers 2.87 2.94 3.05 3.39 3.50Cemeteries and ashes placement sites. 3.54 3.56 3.58 3.67 3.60
1 2 3 4 5
• On the whole, residents across the five Planning Areas provided very similar
satisfaction ratings in the area of Using Land for Living, although there were two
exceptions.
Key results:
• Residents of Planning Area 2 (3.49) had a tendency to be more satisfied with street
cleaning that those of Planning Area 3 (3.18).
• Both Planning Areas 4 (3.39) and 5 (3.50) displayed higher levels of satisfaction than
the other three Planning Areas when it came to parking for shoppers.

Blue Mountains City Council - Community Survey 2010 46
2.2.4 Moving Around
Residents were next given the opportunity to consider their satisfaction with services and
facilities falling under the banner of Moving Around. The results are discussed in this
subsection of the report.
2.2.4.1 Distribution of Results
Table 2-10 Satisfaction Ratings for Moving Aroun
Service / facility (rank order)
d Satisfaction Rating
(%) Mean Score (out of
5) N/R Low (1-2)
Medium (3)
High (4-5)
Transport & Public Access
Pedestrian access generally around shopping centres & community facilities. 0.8% 11.5% 27.5% 60.2% 3.68
Lighting of public areas. 4.1% 13.8% 36.2% 45.9% 3.44
Bus shelters 12.4% 16.8% 37.2% 33.6% 3.26
Carparks 2.3% 17.3% 44.8% 35.6% 3.26
Commuter parking 7.4% 18.7% 41.1% 32.8% 3.21
Sealed roads 1.2% 24.4% 36.0% 38.4% 3.18
Footpaths 0.3% 32.5% 30.5% 36.7% 3.05
Unsealed roads 17.5% 19.4% 42.3% 20.8% 2.99
Cycle ways 12.9% 35.5% 32.9% 18.7% 2.74
Traffic Management Traffic Safety 1.4% 16.4% 36.9% 45.4% 3.36
• All but two of the services and facilities measured within the Key Direction of Moving
Around attained mean satisfaction scores in the ‘medium’ range.
Key results:
• Pedestrian access generally around shopping centres and community facilities
recorded the highest level of satisfaction within this Key Direction at 3.68 out of 5.
• Lighting of public areas achieved a mean satisfaction score of 3.44, while traffic
safety – which was rated as the most important item within this Key Direction –
achieved a mean satisfaction score of 3.36.
• ‘Low’ levels of satisfaction were recorded for unsealed roads (2.99) and cycle ways
(2.74).

Blue Mountains City Council - Community Survey 2010 47
• Statistical testing showed that there were significant differences between the
following groups:
- Males (3.29) were generally more satisfied with commuter parking than
females (3.16).
- Blue Mountains youth (16-24 years) had a tendency to be more satisfied
when it came to pedestrian access generally around shopping centres
and community facilities (3.91) and carparks (3.49) than residents in the
50-64 years age bracket (3.50 and 3.15 respectively).
- 16-24 year olds also displayed higher levels of satisfaction with sealed
roads (3.26), footpaths (3.53), cycle ways (3.13) and traffic safety (3.66)
than most of the older age groups.
- Young adults aged 25-34 years also joined the youth in providing
significantly higher satisfaction ratings for cycle ways (3.01).

Blue Mountains City Council - Community Survey 2010 48
2.2.4.2 Trend Analysis
Figure 2-10a Trend in Satisfaction Ratings for Moving Around
2.5
3.0
3.5
4.0
4.5
Mea
n sc
ore
(out
of 5
)
Sealed roads 2.79 2.83 2.90 2.80 2.88 2.87 2.90 3.18Unsealed roads 2.75 2.83 2.88 2.78 2.90 2.88 3.00 2.99Bus shelters 3.11 3.07 3.15 3.16 3.16 3.02 3.20 3.26Pedestrian access 3.62 3.53 3.59 3.52 3.47 3.49 3.60 3.68Lighting of public areas. 3.25 3.16 3.29 3.21 3.17 3.17 3.20 3.44Footpaths 3.60 3.43 3.54 3.42 3.35 3.45 3.50 3.05Cycle ways 2.74Carparks 3.26Commuter parking 3.43 3.35 3.47 3.22 3.26 3.23 3.20 3.21Traffic Safety 3.36
2000 2002 2003 2004 2006 2007 2009 2010
(n=1008)
• There were some particularly large changes in satisfaction with items measured under
the banner of Moving Around.
Key results:
• Satisfaction with the lighting of public areas rose from a mean of 3.20 in 2009 to 3.44
this year, while satisfaction with sealed roads moved from the ‘low’ range (2.90) to
the ‘medium’ range (3.18) over the same period.
• Meanwhile, the mean satisfaction rating for footpaths plummeted over the last
twelve months to 3.05, down from 3.50.

Blue Mountains City Council - Community Survey 2010 49
2.2.4.3 Planning Area Analysis
Figure 2-10b Planning Area Satisfaction Ratings for Moving Around
2.5
3
3.5
4
4.5
Mea
n sc
ore
(out
of 5
)
Sealed roads 3.21 3.26 3.04 3.05 3.32Unsealed roads 2.85 2.89 2.97 3.09 3.07Bus shelters 3.25 3.32 3.20 3.25 3.24Pedestrian access 3.34 3.65 3.54 3.77 3.80Lighting of public areas. 3.22 3.45 3.34 3.49 3.50Footpaths 2.95 3.13 2.78 3.13 3.06Cycle ways 2.61 2.80 2.58 2.83 2.69Carparks 2.97 3.08 3.27 3.35 3.44Commuter parking 3.04 3.05 2.96 3.52 3.22Traffic Safety 3.04 3.27 3.22 3.52 3.46
1 2 3 4 5
• There were quite a few statistically significant differences in the level of satisfaction
with services and facilities between residents of the local Planning Areas.
Key results:
• Planning Areas 2 (3.65), 4 (3.77) and 5 (3.80) had a tendency to be more satisfied with
pedestrian access generally around shopping centres and community facilities than
Planning Area 1 (3.34).
• Residents of Planning Area 2 (2.80) and 4 (2.83) displayed higher levels of satisfaction
with local cycle ways than those of Planning Area 3 (2.58).
• Planning Areas 3 (3.27), 4 (3.35) and 5 (3.44) were more likely to be satisfied with
carparks.
• Planning Area 4 (3.52) was most satisfied with commuter parking.
• Residents of Planning Areas 4 (3.52) and 5 (3.46) had a tendency to be more satisfied
with traffic safety than residents of Planning Areas 1 (3.04) and 3 (3.22).

Blue Mountains City Council - Community Survey 2010 50
2.2.5 Looking After People
Residents were next asked to rate their level of satisfaction with the delivery of services
and facilities within the Key Direction of Looking After People. The results are shown
below.
2.2.5.1 Distribution of Results
Table 2-11 Satisfaction Ratings for Looking After People
Service / facility (rank order)
Satisfaction Rating
(%) Mean Score (out of
5) N/R Low (1-2)
Medium (3)
High (4-5)
Child Care
Family Day Care Services 41.5% 5.5% 23.9% 29.1% 3.56
Community Safety
Rural Fire Service and SES buildings 10.4% 5.8% 21.0% 62.8% 3.93
Protection from bushfires and emergencies 5.6% 15.3% 23.7% 55.4% 3.64
Community Development
Community centres & community halls 9.9% 13.1% 37.4% 39.6% 3.38
Advocacy for services & facilities for children & families 24.9% 11.4% 36.2% 17.4% 3.29
Advocacy for services and facilities for older people 23.1% 13.8% 34.6% 28.4% 3.26
Advocacy for facilities & services for people with a disability 25.2% 20.8% 33.7% 20.4% 2.99
Advocacy for services and facilities for young people 21.7% 27.5% 37.0% 13.8% 2.78
Sports & Recreation
Swimming pools. 6.2% 7.9% 25.6% 60.3% 3.82
Council lookouts and walking trails. 6.1% 8.7% 28.3% 56.9% 3.69
Ovals & sporting grounds. 8.2% 8.9% 30.2% 52.7% 3.63
Parks & playgrounds. 4.9% 15.3% 28.2% 51.7% 3.51
Environmental Health & Regulation Clean, safe and healthy living environments 2.3% 3.7% 29.6% 64.4% 3.82
Library & Information Library services 7.9% 6.5% 26.5% 59.1% 3.85
Hours of operation of the library service 15.9% 9.1% 29.9% 45.2% 3.64
Library buildings 11.5% 10.2% 30.4% 47.8% 3.61
• Of the 16 items measured in the Key Direction of Looking After People, the mean
satisfaction score for two fell in the ‘low’ range, with the others all in the ‘medium’
range.
Key results:

Blue Mountains City Council - Community Survey 2010 51
• Of these services and facilities, Rural Fire Service and SES buildings achieved the
highest satisfaction rating. 62.8% of residents gave it a ‘high’ score, resulting in a
mean of 3.93 out of 5.
• Library services recorded a mean satisfaction score of 3.85 this year, with swimming
pools, and clean, safe and healthy living environments not far behind at 3.82.
• ‘Low’ mean scores were received by advocacy for facilities & services for people
with a disability (2.99) and advocacy for services and facilities for young people
(2.78).
• Various significant difference were identified when the demographic groups were
looked at more closely:
- Male residents displayed a higher level of satisfaction with advocacy for
services and facilities for people with a disability (3.12) as well as parks and
playgrounds (3.63) than females (2.89 and 3.42 respectively).
- Meanwhile, females (3.75) had a tendency to be more satisfied with
Council lookouts and walking trails than males (3.61)
- Local youth (16-24 year olds) generally provided higher satisfaction ratings
for protection from bushfires and emergencies (3.92), advocacy for young
people (3.04), advocacy for older people (3.52), advocacy for people
with a disability (3.31) and library buildings (3.80).
- Seniors (65 years and older) joined the local youth in displaying higher
levels of satisfaction with advocacy for services and facilities for older
people (3.52) and library buildings (3.81).
- Seniors (3.54) had a tendency to be more satisfied with community
centres and community halls than residents aged 50-64 years (3.18).
- Seniors also provided significantly higher satisfaction ratings for library
services (4.07) and hours of operation of the library service (3.84) than
residents in the 35-49 years age group (3.80 and 3.53 respectively).

Blue Mountains City Council - Community Survey 2010 52
2.2.5.2 Trend Analysis
Figure 2-11a Trend in Satisfaction Ratings for Looking After People
2.0
2.5
3.0
3.5
4.0
4.5
Mea
n sc
ore
(out
of 5
)
Family Day Care Services 3.30 3.10 3.20 3.40 3.56Protection - bushfires & emergencies 3.64Rural Fire Service and SES buildings 3.93Advocacy - children & families 3.10 3.20 3.20 3.10 3.10 3.10 3.30 3.29Advocacy - young people 2.40 2.80 2.70 2.80 2.70 2.70 2.90 2.78Advocacy - older people 3.20 3.30 3.20 3.20 3.20 3.10 3.30 3.26Advocacy - people with a disability 2.90 3.20 3.10 3.10 3.00 3.00 3.00 2.99Community centres & community halls 3.37 3.41 3.39 3.40 3.40 3.25 3.40 3.38
2000 2002 2003 2004 2006 2007 2009 2010
(n=1008)
Figure 2-11b Trend in Satisfaction Ratings for Looking After People
2.5
3.0
3.5
4.0
4.5
Mea
n sc
ore
(out
of 5
)
Ovals & sporting grounds. 3.24 3.49 3.23 3.36 3.33 3.25 3.50 3.63Swimming pools. 3.37 3.27 2.89 3.44 3.66 3.64 3.70 3.82Parks & playgrounds. 3.38 3.53 3.34 3.45 3.32 3.28 3.50 3.51Council lookouts and walking trails. 3.75 3.74 3.64 3.67 3.57 3.54 3.60 3.69Clean, safe, healthy living environments 3.82Library services 3.59 3.76 3.77 3.74 3.69 3.66 3.70 3.85Hours of operation of the library service 3.53 3.54 3.63 3.48 3.60 3.64Library buildings 3.61
2000 2002 2003 2004 2006 2007 2009 2010
(n=1008)

Blue Mountains City Council - Community Survey 2010 53
• There was very little movement in the level of satisfaction with the items in this Key
Direction over the last twelve months.
Key results:
• Mean satisfaction with family day care services rose marginally since 2009, from 3.40
to 3.56.

Blue Mountains City Council - Community Survey 2010 54
2.2.5.3 Planning Area Analysis
Figure 2-11c Planning Area Satisfaction Ratings for
2.5
3
3.5
4
4.5
Mea
n sc
ore
(out
of 5
)
Family Day Care Services 3.43 3.59 3.63 3.59 3.48Protection - bushfires & emergencies 3.54 3.68 3.68 3.54 3.71Rural Fire Service and SES buildings 3.70 4.04 4.06 3.88 3.87Advocacy - children & families 3.34 3.29 3.32 3.31 3.22Advocacy - young people 2.52 2.78 2.81 2.79 2.84Advocacy - older people 3.04 3.20 3.20 3.41 3.25Advocacy - people with a disability 2.83 2.94 2.91 3.10 3.03Community centres & community halls 3.56 3.33 3.44 3.37 3.36
1 2 3 4 5
Looking After People
Figure 2-11d Planning Area Satisfaction Ratings for Looking After People
2.5
3
3.5
4
4.5
Mea
n sc
ore
(out
of 5
)
Ovals & sporting grounds. 3.59 3.68 3.56 3.6 3.67Swimming pools. 3.55 3.77 3.99 3.87 3.82Parks & playgrounds. 3.77 3.62 3.59 3.26 3.56Council lookouts and walking trails. 3.75 3.79 3.67 3.65 3.61Clean, safe, healthy living environments 3.78 3.85 3.75 3.88 3.78Library services 3.85 3.86 3.72 3.98 3.75Hours of operation of the library service 3.32 3.71 3.49 3.72 3.66Library buildings 3.46 3.47 3.56 3.75 3.65
1 2 3 4 5

Blue Mountains City Council - Community Survey 2010 55
• Further testing uncovered a number of statistically significant differences in
satisfaction between residents of the five Planning Areas.
Key results:
• Planning Areas 2 (4.04) and 3 (4.06) provided higher satisfaction ratings for Rural Fire
Service and SES buildings than Planning Area 1 (3.54).
• Residents of Planning Area 4 (3.41) were significantly more satisfied with advocacy for
services and facilities for older people than residents of Planning Area 1 (3.04).
• Residents of Planning Areas 3 (3.99) and 4 (3.87) had a tendency to be more satisfied
with swimming pools than residents of Planning Area 1 (3.55).
• Satisfaction with parks and playgrounds was significantly lower among residents of
Planning Area 4 (3.26) when compared to the other Planning Areas.
• Planning Areas 2 (3.71), 4 (3.72) and 5 (3.66) were more likely to be satisfied with hours
of operation of the library service than Planning Area 1 (3.32).

Blue Mountains City Council - Community Survey 2010 56
2.2.6 Sustainable Economy
Lastly, residents indicated how satisfied they were with services and facilities that
promote a Sustainable Economy. The responses to these questions are explored below.
2.2.6.1 Distribution of Results
Table 2-12 Satisfaction Ratings for Sustainable Economy
Service / facility (rank order)
Satisfaction Rating
(%) Mean Score (out of
5) N/R Low (1-2)
Medium (3)
High (4-5)
Economic Development
Generating local employment opportunities 16.3% 27.2% 37.1% 19.4% 2.85
Tourism Promotion
Visitor Information Centres 6.5% 9.1% 31.9% 52.5% 3.66
Tourism promotion 6.4% 13.3% 34.1% 46.2% 3.47
Cultural Development
Cultural & Arts facilities 8.2% 16.9% 39.1% 35.8% 3.25
• It was the items falling under the banner of ‘Tourism Promotion’ that residents were
most satisfied with in this Key Direction.
Key results:
• Visitor Information Centres received a mean score of 3.66 out of 5, while tourism
promotion attained a satisfaction rating of 3.47.
• Overall there was a ‘low’ level of satisfaction amongst Blue Mountains residents with
Council’s efforts in generating local employment opportunities, resulting in a mean
score of 2.85.
• Further statistical testing identified a number of significant differences based on
gender and age:
- Males (2.93) had a tendency to be more satisfied with generating local
employment opportunities than females (2.79).
- Females (3.54), on the other hand, were significantly more satisfied with
tourism promotion than males (3.38).
- Residents in the 25-49 years (3.75) and 65+ years (3.74) age brackets
displayed higher levels of satisfaction with Visitor Information Centres than
the local youth (3.38).

Blue Mountains City Council - Community Survey 2010 57
2.2.6.2 Trend Analysis
Figure 2-12a Trend in Satisfaction Ratings for Sustainable Economy
2.5
3.0
3.5
4.0
4.5M
ean
scor
e (o
ut o
f 5)
Generating local employmentopportunities
2.54 2.66 2.69 2.74 2.75 2.81 2.90 2.85
Tourism promotion 3.44 3.50 3.47Visitor Information Centres 3.57Cultural & Arts facilities 3.08 3.10 3.25
1 2 3 4 5 6 7 8
(n=1008)
• Satisfaction with items within the Key Direction of Sustainable Economy remained
relatively flat since the 2009 survey.
Key results:
• Cultural and arts facilities achieved a slight increase in satisfaction, from 3.10 to 3.25
over that period.

Blue Mountains City Council - Community Survey 2010 58
2.2.6.3 Planning Area Analysis
Figure 2-12b Planning Area Satisfaction Ratings for Sustainable Economy
2.5
3
3.5
4
4.5
Mea
n sc
ore
(out
of 5
)
Generating local employmentopportunities
2.64 2.66 2.77 2.93 3.09
Tourism promotion 3.41 3.45 3.51 3.53 3.42Visitor Information Centres 3.41 3.52 3.53 3.72 3.85Cultural & Arts facilities 3.05 3.16 3.41 3.30 3.26
1 2 3 4 5
• There were some very notable differences in the level of satisfaction with these items
between local Planning Areas.
Key results:
• Residents of Planning Area 5 had a tendency to be more satisfied with generating
local employment opportunities (3.09) and Visitor Information Centres (3.85) than
those of Planning Areas 1, 2 and 3.
• Planning Area 3 (3.41) displayed a significantly higher level of satisfaction with cultural
and arts facilities than Planning Area 1 (3.05).

Blue Mountains City Council - Community Survey 2010 59
3 Prioritising Services & Facilities
Given the range of services and facilities Council has to manage, it can often be a
difficult task to prioritise. The sheer number of services and facilities under management
can diffuse focus and distract attention away from the areas of critical importance to
improving resident satisfaction. This section of the report aims to identify the key drivers of
resident satisfaction via a deeper analysis of the importance and satisfaction scores
presented in the previous section.
3.1 QUADRANT ANALYSIS
Quadrant analysis is a useful way of simultaneously analysing the stated importance a
service holds for residents against their satisfaction with the provision of that service. To
do this, mean satisfaction scores are plotted against mean importance scores for each
Council service or facility. In order to form the quadrants (or opportunity matrix) that
separate higher and lower level priority services combined mean importance and
satisfaction scores were calculated for the entire set of 50 Council services and facilities.
Table 3-1 Quadrant Analysis Mean Scores
Mean score (out of 5) 2009 2010
Importance score 4.24 4.18
Satisfaction score 3.36 3.09
Thus, for example, services or facilities found to have a mean importance score that is
significantly less than the overall mean of 4.18 were classified as having ‘lower’
importance. Conversely, services or facilities found to have a mean importance score
that is significantly greater than 4.18 were classified as having ‘higher’ importance.

Blue Mountains City Council - Community Survey 2010 60
The results of the quadrant analysis are displayed in Table 3.1.2. Each quadrant has a
specific interpretation:
1. The upper right quadrant (high importance and high satisfaction) represents current
Council service strengths.
2. The upper left quadrant (high importance but relatively lower satisfaction) denotes
services where satisfaction should be improved.
3. The lower left quadrant (relatively lower importance and relatively lower satisfaction)
represents lower priority services.
4. The lower right quadrant (relatively lower importance and high satisfaction) is often
interpreted as representing ‘overkill’ services where effort exceeds expectations.
The attributes in the upper left quadrant are all candidates for immediate attention.
Residents placed a high importance on these attributes but also reported relatively lower
satisfaction.

Blue Mountains City Council - Community Survey 2010 61
Figure 3-1 Quadrant Analysis
Protect bushland
Clean creeks
Bush regenWeed contro
Garbage collection
Curbside recycling
Construction materials recover
Bulky waste
Chipping green wast
Waste Mgmt FacilitiesStormwater Infrastructur
Residential developmen
Built environmen
Public toilets
Litter control
Street cleaning
AtmosphereShop parking
Cemeteries & ashes site
Sealed roads
Unsealed roads
Bus shelters
Pedestrian accessLighting
Footpaths
Cycle ways
Carparks
Commuter parking
Traffic Safety
Family Day Care
Bushfires & emergencie
RFS & SES building
Advocacy children & familie
Advocacy young people Advocacy older people
Advocacy people with disabili
Ovals & grounds
Swimming pools
Parks & playgrounds
Lookouts & walking trails
Living environments
Library services
Library hours of operatio
Library building
Local employmen
Tourism promotionHeritage
Visitor Info
Cultural & Arts facilitie
Community centres & hal
3.4
3.6
3.8
4.0
4.2
4.4
4.6
4.8
5.0
2.7 2.9 3.1 3.3 3.5 3.7 3.9 4.1 4.3 4.5
Impo
rtanc
e Ra
ting
Satisfaction Rating

Blue Mountains City Council - Community Survey 2010 62
• Service areas where Council is performing well (high importance/high satisfaction)
are:
Key results:
Protect bushland
Clean creeks
Bush regeneration
Garbage collection
Curbside recycling
Annual bulky waste
Waste Mgmt Facilities
Residential development
Heritage
Litter control
Atmosphere
Shop parking
Sealed roads
Pedestrian access
Lighting
Carparks
Traffic Safety
Bushfires & emergencies
RFS & SES buildings
Advocacy children & families
Advocacy older people
Ovals & grounds
Swimming pools
Parks & playgrounds
Lookouts & walking trails.
Living environments
Library services
Tourism promotion Visitor Information Centres
• Priority service areas for improvement (high importance/low satisfaction) are
Weed control
Stormwater Infrastructure
Public toilets
Footpaths
Advocacy young people
Advocacy people with disability
Local employment

Blue Mountains City Council - Community Survey 2010 63
3.2 GAP ANALYSIS
Despite its usefulness, quadrant analysis is not a complete priority assessment tool. For
example, it does not explicitly identify the gaps between importance and satisfaction. It
is possible that a large gap could exist between importance and satisfaction, even
though a service or facility appeared in the ‘high importance and high satisfaction’
quadrant.
Consequently, gap analysis was used as the second component in analysing the results.
Gap measures were calculated by subtracting the mean importance score from the
mean satisfaction score for each attribute. Usually, the larger the gap between
importance and satisfaction, the larger the gap between Council’s performance in
provision of a service and residents’ expectations.
Gap scores are presented in Table 3.2.1. The table ranks services and facilities from
highest gaps to lowest gaps. Statistical testing was used to help categorise services as
high, medium and lower priority for improvement. Those services with a gap score that
was found to be significantly above the overall mean gap score (µ=0.9198) were given
top priority (i.e. a rating of 1). Services with a gap score statistically equal to the overall
mean gap score were given second priority (rating of 2). Services with a gap score that
was found to be significantly below the overall mean gap score were given third priority
(rating of 3).

Blue Mountains City Council - Community Survey 2010 64
Table 3-2 Gap Analysis
Service Mean Gap (out of 5)
Priority Rank
Change 09-10
Generating local employment opportunities 1.80
1
Higher than
average gap scores
- Advocacy for services and facilities for young people 1.70 - Public toilets 1.64 - Advocacy for facilities and services for people with a disability 1.57 - Stormwater Infrastructure 1.45 na Traffic Safety 1.42 na Weed control 1.41 - Footpaths 1.37 ↑ (2) Managing residential development 1.33 - Sealed roads 1.30 - Protection from bushfires and emergencies 1.23 na Parking for shoppers 1.22 - Advocacy for services and facilities for older people 1.20 - Clean creeks & waterways 1.20 - Cycle ways 1.13 Litter control 1.12 - Advocacy for services and facilities for children and families 1.08 - Town centre & village atmosphere 1.05 ↑ (2) Lighting of public areas 1.03 - Carparks 1.02 na Parks & playgrounds 1.00 ↑ (3) Clean, safe and healthy living environments 1.00
Commuter parking 1.00 2 Average
gap score
-
Enhancing the built environment 0.90 -
Protection of natural bushland 0.81
3
Lower than average
gap scores
↓ (1) Protection of heritage values & buildings 0.80 - Pedestrian access generally around shopping centres and community facilities 0.79 ↓ (2) Community centres & community halls 0.79 - Rural Fire Service and State Emergency Service buildings 0.78 na Tourism promotion 0.78 - Cultural & Arts facilities 0.76 - Street cleaning 0.72 - Ovals & sporting grounds 0.71 - Bus shelters 0.71 - Bush regeneration 0.66 ↓ (2) Waste Management Facilities 0.63 Council lookouts and walking trails 0.62 - Construction materials recovery and recycling service 0.60 - Annual bulky waste pickup 0.60 - Visitor Information Centres 0.56 na Library buildings 0.55 na Family Day Care Services 0.54 - Unsealed roads 0.52 ↓ (2) Hours of operation of the library service 0.48 - Swimming pools 0.45 - Curbside chipping of green waste 0.44 - Library services 0.42 - Wheelie Bin curbside recycling service 0.39 - Garbage collection 0.35 - Cemeteries and ashes placement sites 0.18 na

Blue Mountains City Council - Community Survey 2010 65
• The gap analysis indicated that resident expectations are furthest from being met in
the following areas:
Key results:
- Generating local employment opportunities - Advocacy for services and facilities for young people - Public toilets - Advocacy for facilities and services for people with a disability - Stormwater Infrastructure - Traffic Safety - Weed control - Footpaths - Managing residential development - Sealed roads - Protection from bushfires and emergencies - Parking for shoppers - Advocacy for services and facilities for older people - Clean creeks & waterways - Cycle ways - Litter control - Advocacy for services and facilities for children and families - Town centre & village atmosphere - Lighting of public areas - Carparks - Parks & playgrounds - Clean, safe and healthy living environments.
• Based on the gap analysis, service areas where perceptions of Council's
performance appear to have improved (in relative terms) since the 2009 survey were:
- Footpaths - Town centre & village atmosphere - Parks & playgrounds.
• Service areas where perceptions of Council's performance appear to have
deteriorated (in relative terms) since the 2009 survey were:
- Protection of natural bushland - Pedestrian access generally around shopping centres and community facilities - Bush regeneration - Unsealed roads.

Blue Mountains City Council - Community Survey 2010 66
3.3 PRIORITIES FOR IMPROVEMENT
Table 3.3 outlines the services and facilities that were identified as not meeting resident
expectations in either quadrant analysis or gap analysis. If a service or facility has a tick in
both the quadrant analysis box and the gap analysis box, it is a good confirmation and
this area should be given priority.
Table 3-3 Gap Analysis
Identified as not meeting resident expectations in …
Quadrant Analysis
(Higher importance / lower satisfaction)
Gap Analysis (Above average gap between importance
& satisfaction)
Generating local employment opportunities
Advocacy for services & facilities for young people
Public toilets
Advocacy for facilities & services for people with disability
Stormwater Infrastructure
Footpaths
Weed control
Traffic Safety
Managing residential development
Sealed roads
Protection from bushfires & emergencies
Parking for shoppers
Advocacy for services & facilities for older people
Clean creeks & waterways
Cycle ways
Litter control
Advocacy for services & facilities for children & families
Town centre & village atmosphere
Lighting of public areas
Carparks
Parks & playgrounds
Clean, safe & healthy living environments

Blue Mountains City Council - Community Survey 2010 67
4 Overall Satisfaction & Value
4.1 OVERALL SATISFACTION
4.1.1 Satisfaction Rating
At the end of the first section of the survey, respondents were asked to rate the overall
performance of Blue Mountains City Council. The results are provided in the following
figures and tables.
Figure 4-1 Overall Satisfaction with Council Performance 2010 (n=1008)
0%
5%
10%
15%
20%
25%
30%
35%
40%
45%
50%
1 Very Dissatisfied
2 3 4 5 Very Satisfied
6 Non Response
Perc
ent
2010 2009
Figure 4-2 Overall Satisfaction with Council Performance – Mean Scores (n=1008)
2.603.10 3.24 3.18 3.10 3.23 3.16 3.36 3.23
1.0
2.0
3.0
4.0
5.0
1996 2000 2002 2003 2004 2006 2007 2009 2010
Mea
n (o
ut o
f 5)
Mean = 3.23

Blue Mountains City Council - Community Survey 2010 68
Figure 4-3 Overall Satisfaction with Council Performance 2000-2010 (n=1008)
0%
10%
20%
30%
40%
50%
60%
70%
80%
90%
100%
Satisfied (4-5) 32% 42% 38% 35% 39% 38% 50% 39%Neutral (3) 46% 38% 43% 45% 44% 42% 36% 44%Dissatisfied (1-2) 23% 19% 19% 20% 17% 20% 14% 18%
2000 2002 2003 2004 2006 2007 2009 2010
Mean (out of 5) 3.1 3.2 3.2 3.1 3.2 3.2 3.4 3.2

Blue Mountains City Council - Community Survey 2010 69
Table 4-1 Overall Satisfaction by Age & Sex
Survey Year Dissatisfied
(1-2) Neutral
(3) Satisfied
(4-5) Mean
(1-5 scale) O
vera
ll 2000 23% 46% 32% 3.1 2002 19% 38% 42% 3.2 2003 19% 43% 38% 3.2 2004 20% 45% 35% 3.1 2006 17% 44% 39% 3.2 2007 20% 42% 38% 3.2 2009 14% 36% 50% 3.4 2010 18% 44% 39% 3.2
Sex
Male
2002 23% 36% 41% 3.2 2003 21% 39% 40% 3.1 2004 23% 44% 34% 3.1 2006 17% 44% 39% 3.2 2007 23% 39% 38% 3.1 2009 16% 31% 53% 3.4 2010 20% 41% 39% 3.2
Female
2002 16% 41% 43% 3.3 2003 17% 46% 37% 3.2 2004 18% 46% 36% 3.2 2006 18% 44% 39% 3.2 2007 19% 44% 38% 3.2 2009 12% 41% 47% 3.4 2010 17% 45% 38% 3.3
Age
16-24 years
2002 6% 43% 51% 3.5 2003 12% 35% 52% 3.4 2004 15% 53% 32% 3.2 2006 6% 40% 54% 3.5 2007 16% 40% 45% 3.3 2009 2% 25% 73% 3.8 2010 9% 49% 42% 3.4
25-34 years
2002 14% 43% 43% 3.3 2003 19% 46% 35% 3.1 2004 26% 45% 29% 3.0 2006 20% 44% 35% 3.1 2007 16% 44% 40% 3.2 2009 16% 36% 47% 3.3 2010 18% 43% 39% 3.3
35-49 years
2002 26% 30% 45% 3.2 2003 22% 45% 33% 3.1 2004 20% 48% 32% 3.1 2006 22% 44% 34% 3.1 2007 24% 41% 35% 3.1 2009 14% 38% 48% 3.3 2010 18% 45% 37% 3.2
50-64 years
2002 22% 49% 29% 3.1 2003 25% 46% 30% 3.0 2004 21% 39% 40% 3.1 2006 17% 46% 37% 3.2 2007 22% 43% 34% 3.1 2009 19% 41% 40% 3.2 2010 24% 46% 31% 3.1
65+ years
2002 18% 33% 49% 3.3 2003 9% 38% 54% 3.5 2004 17% 41% 42% 3.2 2006 13% 43% 43% 3.4 2007 21% 40% 39% 3.2 2009 18% 37% 46% 3.3
2010 19% 34% 47% 3.3

Blue Mountains City Council - Community Survey 2010 70
• Overall, 38.5% of residents were satisfied with the performance of Blue Mountains
Council, which is more than double the 18.1% that were dissatisfied.
Key results:
• This is a significant fall from the 49.7% reported last year.
• A mean satisfaction score of 3.23 was achieved for Council’s overall performance,
which is on par with the results prior to the 2009 survey.
• Further statistical testing revealed that residents in the 50-64 years age bracket (3.07)
were significantly less likely to be satisfied with Council’s overall performance than the
region’s youth (16-24 years) who had a mean score of 3.40.
4.1.2 Reasons for Satisfaction/Dissatisfaction with Council Performance
In an attempt to uncover the sources of satisfaction and dissatisfaction with Council
performance, an open-ended question was asked of all respondents They were asked to
briefly explain the main reason behind the rating they gave Council for its overall
performance. These were subsequently classified into common themes where possible,
and are displayed below under the groupings of low, medium and high satisfcation.
Table 4-2 Reasons for Satisfaction/Dissatisfaction with Council Performance
Reason (Rank Order) Count Percent LOW SATISFACTION (1-2) Poor allocation of funds/no value for money 28 16.1% Slow/no/poor responses 18 10.0% Better curbs/guttering/drains/footpaths/trees/lighting 16 8.8% Bureaucracy/councillors 13 7.5% Inadequately maintained outdoor areas 12 6.6% Poor road maintenance 11 5.9% Poor building approval process 10 5.8% Lower Blue Mountains neglected 10 5.7% Poor customer service 7 4.1% Need improved environment/recycling 7 3.9% Lack of communication 6 3.5% Poor youth services/facilities 6 3.2% Insufficient waste collection 4 2.5% Neglecting residents 4 2.3% Fire management/hazard reduction insufficient 4 2.3% Negative comment about tourism 2 1.3% Fighting/comment about news 2 1.0% Other 15 8.3% NA 2 1.2% Total 177 100.0%

Blue Mountains City Council - Community Survey 2010 71
MEDIUM SATISFACTION (3) General comment that they could be doing better 44 10.4% Poor allocation of funds/no value for money 27 6.3% Can't say/don't know 26 6.1% Better curbs/guttering/drains/footpaths/trees/lighting 24 5.7% Poor building approval process 21 4.8% Inadequately maintained outdoor areas 19 4.5% Poor road maintenance 19 4.4% Slow/no/poor responses 16 3.8% I am happy/no problems 14 3.4% Need improved environment/recycling 10 2.4% Fighting/comment about news 9 2.1% Poor youth services/facilities 8 1.8% Lower Blue Mountains neglected 7 1.7% Fire management/hazard reduction insufficient 7 1.7% Poor customer service 6 1.5% Good facilities/services 7 1.5% Comment about dog/neighbour 6 1.5% Bureaucracy/councillors 6 1.3% Negative comment about tourism 5 1.1% Insufficient waste collection 3 0.6% Good communication 2 0.4% Good customer service 1 0.2% Positive comment about tourism 1 0.2% More for disabled 1 0.25 More for children 0 0.1% Other 33 7.8% NA 86 20.2% Total 427 100.%
HIGH SATISFACTION (4-5) I am happy/no problems 145 38.5% Good customer service 33 8.7% Good facilities/services 21 5.6% Well maintained 17 4.5% Fast responses 11 2.9% General comment that they could be doing better 10 2.6% Value for money/no wasting money 9 2.3% Slow/no/poor responses 7 1.9% Poor allocation of funds/no value for money 7 1.8% Inadequately maintained outdoor areas 6 1.6% Good environmental action 5 1.2% Poor road maintenance 4 1.1% Better curbs/guttering/drains/footpaths/trees/lighting 3 0.8% Poor youth services/facilities 3 0.7% Good waste collection 3 0.7% Lack of communication 2 0.6% Good communication 2 0.6% Insufficient waste collection 2 0.5% Poor building approval process 2 0.5% More for children 2 0.4% Other 23 5.8% NA 62 16.5% Total 378 100.0%

Blue Mountains City Council - Community Survey 2010 72
4.2 VALUE FOR MONEY
2010 marked the fourth year that residents were asked about their perceptions of the
overall value they receive for their rate dollar.
Figure 4-4 Value for Rates 2010 (n=1008)
0%
5%
10%
15%
20%
25%
30%
35%
40%
45%
50%
1 Very Dissatisfied
2 3 4 5 Very Satisfied
6 Non Response
Perc
ent
2010 2009
Figure 4-5 Value for Rates – Mean Scores (n=1008)
3.11 3.003.22 3.34
1.0
2.0
3.0
4.0
5.0
2006 2007 2009 2010
Mea
n (o
ut o
f 5)
Mean = 3.34

Blue Mountains City Council - Community Survey 2010 73
Figure 4-6 Value for Rates 2000-2010 (n=1008)
0%
10%
20%
30%
40%
50%
60%
70%
80%
90%
100%
Satisfied (4-5) 32% 29% 38% 43%Neutral (3) 47% 46% 44% 41%Dissatisfied (1-2) 21% 25% 18% 16%
2006 2007 2009 2010
Mean (out of 5) 3.1 3.0 3.2 3.3
• Resident perception of the value received for rates dollar spend has continued to
improve, with the mean satisfaction score rising to 3.34 out of 5.
Key results:
• Around two in five respondents provided a ‘high’ score of 4 or higher.
• Further analysis revealed that Blue Mountains youth (3.54) were more likely to agree
that they received value for their rates spend than persons in the 25-34 years age
bracket (3.22).

Blue Mountains City Council - Community Survey 2010 74
5 PLANNING PRIORITIES
As in the previous survey, respondents were asked to nominate the major issue of
concern to them, both for the Blue Mountains as a whole and for their local area. This
section provides a summary of the major issues mentioned by respondents.
5.1 CITY-WIDE PLANNING PRIORITIES
Respondents were first asked to identify any action areas that they believe to be priority
if Council plans to make the Blue Mountains as a whole a better place in the future.
Responses are listed under common themes in Table 5-1 below.

Blue Mountains City Council - Community Survey 2010 75
Table 5-1 City-Wide Priorities For Action (n=1008)
Priority for Action (rank order) Percent Road maintenance and upgrades including kerb, guttering and footpaths 10.9%
Backburning and other fire prevention measures 8.2%
Developments to retain the village atmosphere and character / controlled developments 8.2%
Attracting tourism 8.0%
The environment 6.2%
Beautification of the area/ maintenance & cleanliness of area & facilities (eg Katoomba) 6.2%
Balance between environment and development 4.1%
Employment opportunities / economic development 3.9%
Facilities for the youth 3.9%
Traffic management 3.5%
More public transport and improvements to current system 3.3%
Crime and vandalism 2.5%
Parks, playgrounds, sports and recreation facilities / open spaces 2.2%
Retail and commercial development 1.9%
Better communication and consultation with the community 1.8%
Improve waste management services & facilities / more frequent bulky waste collection 1.6%
Maintaining bush trails and national parks 1.6%
More accountability with rate money / better value 1.5%
Cycleways 1.3%
More parking 1.3%
Facilities, services and access for older and disabled people 1.3%
The arts and cultural facilities / community centres 1.2%
Improving public toilets 1.2%
Looking after and listening to residents 0.9%
Educational facilities, such as schools and higher education 0.8%
Improving stormwater run off 0.7%
Keeping / building community spirit 0.7%
Libraries and greater funding for them 0.5%
Bus Shelters 0.4%
Health care facilities 0.4%
Other 2.6%
Don't know/ Non response 16.0%

Blue Mountains City Council - Community Survey 2010 76
Table 5-2 City-Wide Priorities For Action by Planning Area (n=1008)
Priority for Action (overall rank order) Planning Area (%)
1 2 3 4 5 Road maintenance and upgrades including kerb, guttering and footpaths 8.5% 13.2% 10.9% 12.2% 7.9% Backburning and other fire prevention measures 9.4% 5.9% 6.9% 9.2% 9.9% Developments to retain the village atmosphere and character / controlled developments 9.3% 8.2% 7.4% 9.7% 6.7% Attracting tourism 7.6% 7.8% 6.7% 8.3% 8.7% The environment 7.5% 5.5% 5.1% 5.8% 7.4% Beautification of the area / maintenance and cleanliness of area and facilities (eg Katoomba) 8.3% 9.2% 5.7% 4.0% 5.1% Balance between environment and development 1.4% 5.1% 4.9% 3.4% 4.1% Employment opportunities / economic development 3.1% 4.2% 4.5% 3.0% 4.8% Facilities for the youth 4.6% 2.6% 6.2% 2.2% 5.6% Traffic management 8.4% 2.3% 2.2% 3.4% 4.1% More public transport and improvements to current system 4.2% 1.7% 2.4% 7.1% 0.9% Crime and vandalism 1.0% 1.9% 3.1% 2.7% 2.9% Parks, playgrounds, sports and recreation facilities / open spaces 0.6% 0.3% 1.2% 2.4% 4.8% Retail and commercial development 1.0% 4.8% 2.4% 1.1% 0.0% Better communication and consultation with the community 2.7% 1.1% 1.4% 1.9% 2.4% Improving waste management services and facilities / more frequent bulky waste collection 0.6% 1.9% 1.8% 0.0% 3.2% Maintaining bush trails and national parks 0.6% 0.6% 2.2% 1.8% 2.4% More accountability with rate money / better value 0.9% 0.4% 1.5% 1.8% 2.4% Cycleways 2.6% 0.6% 2.2% 1.6% 0.9% More parking 1.0% 0.7% 1.2% 1.9% 1.4% Facilities, services and access for older and disabled people 1.3% 2.1% 0.3% 0.2% 2.1% The arts and cultural facilities / community centres 1.0% 1.2% 0.7% 1.4% 1.4% Improving public toilets 1.6% 2.6% 0.0% 0.0% 1.6% Looking after and listening to residents 3.5% 0.0% 1.3% 0.4% 1.4% Educational facilities, such as schools and higher education 0.0% 2.1% 0.0% 0.0% 1.0% Improving stormwater run off 0.0% 1.8% 0.5% 0.5% 0.0% Keeping / building community spirit 0.0% 0.4% 0.9% 0.5% 1.2% Libraries and greater funding for them 1.4% 0.0% 0.5% 1.2% 0.0% Bus Shelters 0.0% 0.0% 0.5% 1.1% 0.0% Health care facilities 0.0% 0.7% 0.0% 0.5% 0.2% Other 2.4% 2.9% 0.5% 3.6% 2.2% Don’t know/ Non response 12.7% 17.4% 19.9% 16.2% 13.5%

Blue Mountains City Council - Community Survey 2010 77
5.2 LOCAL PLANNING PRIORITIES
Respondents were then asked to identify any action areas that they believe to be priority
if Council plans to make their local area a better place in the future.
Table 5-3 Local Priorities For Action (n=1008)
Priority for Action (rank order) Percent Road maintenance and upgrades including kerb, guttering and footpaths 20.8%
Backburning and other fire prevention measures 7.0%
Beautification of the area / maintenance and cleanliness of area and facilities (eg Katoomba) 6.5%
More parking 6.1%
Developments to retain the village atmosphere and character / controlled developments 6.0%
Traffic management 5.9%
Facilities for the youth 5.8%
Parks, playgrounds, sports and recreation facilities / open spaces 4.7%
Retail and commercial development 4.4%
Crime and vandalism 4.0%
Improving waste management services and facilities / more frequent bulky waste collection 3.3%
The environment 3.2%
Employment opportunities / economic development 3.0%
Improving stormwater run off 2.8%
More street signs / road safety 2.7%
More public transport and improvements to current system 2.5%
The arts and cultural facilities / community centres 2.4%
Attracting tourism 1.9%
Maintaining bush trails and national parks 1.4%
Balance between environment and development 1.2%
Cycleways 1.0%
Facilities, services and access for older and disabled people 0.9%
Improving public toilets 0.8%
Keeping / building community spirit 0.6%
Looking after and listening to residents 0.6%
More accountability with rate money / better value 0.5%
Day care centre 0.5%
Facilities for children 0.4%
Libraries and greater funding for them 0.3%
Better communication and consultation with the community 0.2%
Health care facilities 0.2%
Grass and weeds 0.2%
Bus Shelters 0.1%
Pedestrian awareness 0.1%
Other 2.4%
Don't know 9.3%

Blue Mountains City Council - Community Survey 2010 78
Table 5-4 Local Priorities For Action by Planning Area (n=1008)
Priority for Action (overall rank order) Planning Area (%)
1 2 3 4 5 Road maintenance and upgrades including kerb, guttering and footpaths 18.1% 12.4% 29.2% 21.3% 25.0% Backburning and other fire prevention measures 5.2% 4.1% 10.0% 6.6% 9.4% Beautification of the area / maintenance and cleanliness of area and facilities for instance Katoomba 5.0% 10.0% 2.2% 6.2% 5.9% More parking 4.6% 12.7% 6.1% 2.8% 3.4% Developments to retain the village atmosphere and character / controlled developments 5.5% 3.6% 2.7% 12.7% 3.0% Traffic management 9.1% 7.7% 3.4% 7.0% 3.1% Facilities for the youth 8.3% 4.4% 1.3% 5.5% 9.2% Parks, playgrounds, sports and recreation facilities / open spaces 1.5% 1.8% 4.9% 5.9% 7.2% Retail and commercial development 0.8% 4.4% 10.9% 4.9% 1.7% Crime and vandalism 2.3% 3.3% 4.6% 2.3% 7.0% Improving waste management services and facilities / more frequent bulky waste collection 2.7% 2.9% 0.5% 3.3% 5.3% The environment 3.5% 2.8% 1.4% 3.7% 3.9% Employment opportunities / economic development 2.4% 4.8% 1.9% 2.1% 3.0% Improving stormwater run off 0.8% 4.8% 5.2% 2.6% 0.5% More street signs / road safety 3.8% 1.8% 3.9% 3.6% 1.7% More public transport and improvements to current system 3.3% 2.1% 0.6% 2.6% 3.5% The arts and cultural facilities / community centres 5.2% 2.2% 0.7% 2.1% 3.1% Attracting tourism 4.0% 5.0% 0.0% 0.0% 1.3% Maintaining bush trails and national parks 4.4% 0.9% 1.4% 0.0% 2.5% Balance between environment and development 0.8% 0.8% 0.7% 1.4% 1.6% Cycleways 0.0% 0.8% 0.7% 1.7% 0.9% Facilities, services and access for older and disabled people 0.4% 1.8% 0.0% 0.5% 1.1% Improving public toilets 2.4% 1.2% 1.4% 0.0% 0.6% Keeping / building community spirit 1.0% 0.3% 0.5% 0.0% 1.5% Looking after and listening to residents 0.0% 0.0% 0.7% 0.2% 0.0% More accountability with rate money / better value 0.0% 0.0% 0.0% 0.9% 0.5% Day care centre 0.9% 0.4% 0.5% 0.0% 1.0% Facilities for children 0.0% 0.0% 2.1% 0.5% 0.0% Libraries and greater funding for them 1.4% 1.8% 0.5% 0.2% 0.0% Better communication and consultation with the community 0.9% 0.0% 0.0% 0.4% 0.0% Health care facilities 0.0% 0.0% 0.0% 0.5% 0.2% Grass and weeds 0.4% 0.6% 0.0% 0.2% 0.3% Bus Shelters 0.0% 0.0% 0.7% 0.0% 0.0% Pedestrian awareness 1.0% 0.3% 0.0% 0.0% 0.0% Other 2.7% 3.8% 0.9% 2.7% 1.2% Don’t know/ Non response 7.1% 10.3% 9.9% 9.9% 8.0%

Blue Mountains City Council - Community Survey 2010 79
5.3 FUNDING PRIORITIES
This year residents were also asked to rate the priority they place on a number of asset
funding alternatives. The tables below show the response of residents, both overall and
by Planning Area.
Table 5-5 Overall Funding Priorities
Asset (rank order)
Priority Rating (%)
Mean Score
(out of 10) N/R Low (1-2)
Medium (3)
High (4-5)
SES buildings and Rural Fire Stations 0.6% 3.3% 17.1% 78.9% 7.94
Roads and footpaths 0.2% 4.4% 19.4% 76.0% 7.76
Stormwater infrastructure 1.4% 3.4% 25.4% 69.8% 7.47
Waste management facilities 0.5% 3.4% 27.3% 68.8% 7.43
Parks and sportsgrounds 0.6% 5.1% 34.1% 60.2% 6.94
Car parks 0.3% 7.4% 40.8% 51.5% 6.54
Community buildings and public halls 0.8% 7.8% 41.8% 49.6% 6.41
Library buildings 1.3% 9.6% 41.0% 48.1% 6.28
Cycle ways 0.7% 18.1% 34.8% 46.4% 5.95
Swimming pools 0.9% 15.2% 44.3% 39.6% 5.92
Table 5-6 Planning Area Funding Priorities
Asset (overall rank order)
Planning Area (Mean Score out of 10)
1 2 3 4 5
SES buildings and Rural Fire Stations 7.82 7.83 8.12 7.95 8.00
Roads and footpaths 7.65 7.44 8.02 7.89 7.85
Stormwater infrastructure 7.22 7.67 7.58 7.34 7.42
Waste management facilities 7.26 7.35 7.50 7.53 7.40
Parks and sportsgrounds 6.91 6.58 6.96 7.11 7.12
Car parks 6.45 6.86 6.65 6.55 6.19
Community buildings and public halls 6.59 6.31 6.31 6.53 6.38
Library buildings 6.32 6.58 6.41 6.13 6.06
Cycle ways 5.55 5.79 5.98 6.08 6.09
Swimming pools 5.80 5.58 6.24 5.98 6.05

Blue Mountains City Council - Community Survey 2010 80
Figure 5-1 Planning area funding priorities (n=1008)
5.0
6.0
7.0
8.0
9.0
Mea
n sc
ore
(out
of 1
0)
SES buildings & Rural Fire Stations 7.8 7.8 8.1 8.0 8.0 7.9Roads & footpaths 7.7 7.4 8.0 7.9 7.9 7.8Stormwater infrastructure 7.2 7.7 7.6 7.3 7.4 7.5Waste management facilities 7.3 7.4 7.5 7.5 7.4 7.4Parks & sportsgrounds 6.9 6.6 7.0 7.1 7.1 6.9Car parks 6.5 6.9 6.7 6.6 6.2 6.5Community buildings & public halls 6.6 6.3 6.3 6.5 6.4 6.4Library buildings 6.3 6.6 6.4 6.1 6.1 6.3Cycle ways 5.6 5.8 6.0 6.1 6.1 6.0Swimming pools 5.8 5.6 6.2 6.0 6.1 5.9
1 2 3 4 5 Overall
• SES buildings and Rural Fire Stations was identified by Blue Mountains residents as the
main funding priority for the area. Nearly four out of five residents gave it a ‘high’
priority rating, resulting in a mean score of 7.94 out of 10.
Key results:
• Other assets funding options to score highly included roads and footpaths (7.76),
stormwater infrastructure (7.47) and waste management facilities (7.43).
• A number of statistically significant differences were identified through further
analysis:
- Females were more likely to provide a higher priority score for the asset
funding items, except in the case of parks and sportsgrounds in which
there was no significant difference between the sexes.
- Blue Mountains youth (16-24 years) placed lower priority on funding for
cycle ways (5.54) and swimming pools (5.46) than residents aged 25-34
years (6.39 and 6.23 respectively).

Blue Mountains City Council - Community Survey 2010 81
- 16-24 year olds (7.14) also placed less priority on funding for roads and
footpaths than persons aged 35-49 years (8.10) and 65+ years (7.85), and
lower priority on parks and sportsgrounds (6.63) than those in the 25-34
years (7.14), 35-49 years (7.28) and 65+ years (6.93) age brackets.
- Residents in all age brackets from 35 years onwards rated stormwater
infrastructure higher than the local youth did (6.63).
- Meanwhile, residents aged 35-49 years (7.70) and 65 years or older (7.69)
had a tendency to place higher priority on funding for waste
management facilities than those in the 25-34 years age group (6.82).
- Planning Area 2 provided lower priority ratings for roads and footpaths
(7.44) and swimming pools (5.58) than Planning Area 3 (8.02 and 6.24
respectively).
- Planning Area 2 also recorded a lower priority rating for parks and
sportsgrounds (6.58) than Planning Areas 4 (7.11) and 5 (7.12).
- However, residents of Planning Area 2 regarded car parks (6.86) as a
higher funding priority than those of Planning Area 5 (6.19).

Blue Mountains City Council - Community Survey 2010 82
6 STAFF PERFORMANCE
The survey also sought to measure resident perceptions of, and satisfaction with, Council
staff performance. It should be noted that this year’s survey only sought to measure
satisfaction with the Council staff by residents that have had recent interaction.
6.1 INTERACTION WITH COUNCIL STAFF
Respondents were first asked whether or not they had an interaction with Council staff at
any time during the past 12 months. Table 6.1 shows the result for this question.
Table 6-1 Recent Interaction with Council Staff
Survey Year Base Yes No
2000 1032 60% 40%
2002 515 64% 36%
2003 508 64% 36%
2004 504 57% 43%
2006 505 62% 38%
2007 1012 57% 43%
2009 757 57% 43%
2010 1008 57% 43%
• 57.4% of residents surveyed indicated that they have interacted with Council staff in
the last twelve months.
Key results:
• This is exactly on par with the results of the previous two waves of the survey.
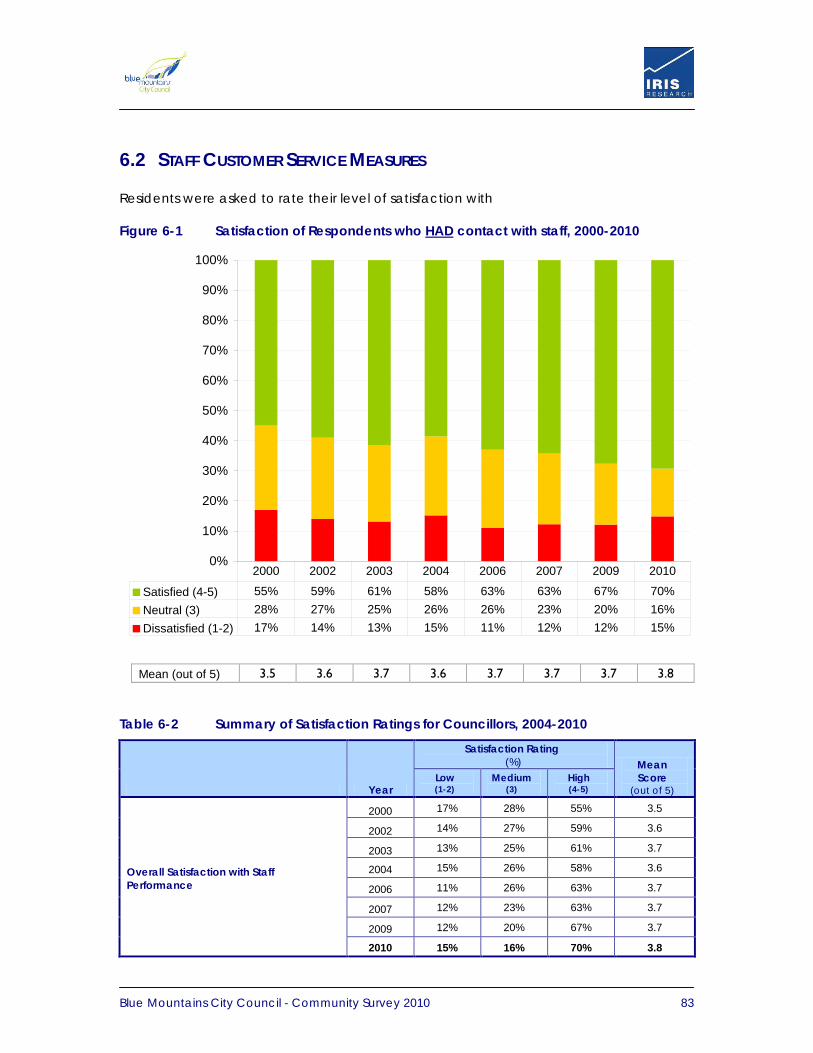
Blue Mountains City Council - Community Survey 2010 83
6.2 STAFF CUSTOMER SERVICE MEASURES
Residents were asked to rate their level of satisfaction with
Figure 6-1 Satisfaction of Respondents who HAD
0%
10%
20%
30%
40%
50%
60%
70%
80%
90%
100%
Satisfied (4-5) 55% 59% 61% 58% 63% 63% 67% 70%Neutral (3) 28% 27% 25% 26% 26% 23% 20% 16%Dissatisfied (1-2) 17% 14% 13% 15% 11% 12% 12% 15%
2000 2002 2003 2004 2006 2007 2009 2010
contact with staff, 2000-2010
Mean (out of 5) 3.5 3.6 3.7 3.6 3.7 3.7 3.7 3.8
Table 6-2 Summary of Satisfaction Ratings for Councillors, 2004-2010
Year
Satisfaction Rating (%) Mean
Score (out of 5)
Low (1-2)
Medium (3)
High (4-5)
Overall Satisfaction with Staff Performance
2000 17% 28% 55% 3.5
2002 14% 27% 59% 3.6
2003 13% 25% 61% 3.7
2004 15% 26% 58% 3.6
2006 11% 26% 63% 3.7
2007 12% 23% 63% 3.7
2009 12% 20% 67% 3.7
2010 15% 16% 70% 3.8

Blue Mountains City Council - Community Survey 2010 84
• Satisfaction with Council staff has continued to grow amongst residents that have
recently interacted with them.
Key results:
• Over two thirds (69.5%) of residents that have had recent contact provided a ‘high’
satisfaction rating, resulting in a mean of 3.81 out of 5.
• This is the highest score since the original survey measure in 2000.
• Residents of Planning Area 3 (4.06) were significantly more likely to provide a higher
satisfaction rating than those of Planning Area 5 (3.64).

Blue Mountains City Council - Community Survey 2010 85
7 COUNCILLOR PERFORMANCE
2010 marks the fifth wave of the project in which respondents were asked to respond to
issues regarding their dealings and views on Councillors.
7.1 DEALINGS WITH COUNCILLORS
Respondents were first asked whether or not they had any dealings with elected
Councillors at any time during the past 12 months. Table 7.1 shows the result for this
question.
Table 7-1 Dealings with Elected Councillors
Survey Year Base Yes No
2004 504 16% 84%
2006 505 13% 87%
2007 1012 11% 89%
2009 757 10% 90%
2010 1008 12% 87%
• In this wave of the survey, 12.2% of residents indicated that they have had a dealing
with at least one of their elected Councillors in the last twelve months.
Key results:
• This is up slightly on last year’s result, but still lower than was reported when this
question was first introduced in 2004.

Blue Mountains City Council - Community Survey 2010 86
7.2 OVERALL SATISFACTION WITH COUNCILLORS
Respondents that indicated they had dealings with their elected Councillors during the
past 12 months were asked to rate their level of satisfaction with the overall performance
of Councillors.
Figure 7-1 Satisfaction with elected Council representative, 2004- 2010
0%
10%
20%
30%
40%
50%
60%
70%
80%
90%
100%
Satisfied (4-5) 22% 27% 30% 34% 31%Neutral (3) 49% 49% 49% 50% 27%Dissatisfied (1-2) 26% 24% 21% 16% 37%
2004 2006 2007 2009 2010
Table 7-2 Summary of Satisfaction Ratings for Councillors, 2004-2010
Year
Satisfaction Rating (%) Mean
Score (out of 5) N/R Low
(1-2) Medium
(3) High (4-5)
Overall Satisfaction with Councillor Performance
2004 3% 26% 49% 22% 2.9
2006 3% 23% 48% 26% 3.0
2007 8% 19% 45% 28% 3.1
2009 11% 14% 44% 31% 3.2
2010 5% 37% 27% 31% 2.9

Blue Mountains City Council - Community Survey 2010 87
• Satisfaction with Councillor performance has slipped, with the mean score down
from 3.21 in 2009 to 2.88 in 2010.
Key results:
• While there was no change in the proportion of residents providing ‘high’ satisfaction
ratings (31%), the proportion indicating a ‘low’ level of satisfaction increased from
14.0% to 36.8% over the last twelve months.
• Further statistical testing uncovered no significant differences in satisfaction with
overall Councillor performance between the various sexes, ages and Planning Areas.

Blue Mountains City Council - Community Survey 2010 88
8 OTHER GENERAL THEMES
2009 marks the second year in which respondents were asked to respond to a number of
questions regarding what they value about the Blue Mountains, and their perceptions
about living in the area.
8.1 COMMUNITY VALUES
Again, respondents were asked what they value most about living in the Blue Mountains.
Table 8-1 Community Values
Response (rank order) Count Percent
Natural environment/ bush/ mountains/ flora & fauna 223 22.1%
Peaceful/ quiet/ tranquil 159 15.8%
Fresh air 131 13.0%
Small community/ community spirit 95 9.4%
Atmosphere (eg village, rural) 74 7.3%
Lifestyle 42 4.2%
Beauty/ scenery 39 3.9%
Away from city/ limited development/ no overcrowding 37 3.7%
The people 27 2.7%
Safe place to live 26 2.5%
Heritage/ National Park 22 2.2%
Climate 21 2.1%
Clean & healthy place to live 21 2.1%
Location - close to city, facilities and bush 19 1.9%
Open space 15 1.5%
Close to family/ Great place to raise kids 12 1.2%
Great place to live 8 0.8%
Activities available (eg bushwalking) 6 0.6%
Parks & ovals 1 0.1%
Other 11 1.1%
Non response 18 1.8%
• Nearly a quarter of residents (22.1%) identified the natural environment and
bushlands as the thing they value most about living in the Blue Mountains.
Key results:
• The top three was unchanged from 2009, with peacefulness and tranquillity (15.8%)
and fresh air (13.0%) rounding out the top of the list.
• Residents love the sense of community (9.4%) and the village atmosphere (7.3%).

Blue Mountains City Council - Community Survey 2010 89
8.2 ENVIRONMENTALLY SUSTAINABLE LIVING
This section of the report looks at the community friendly actions that residents
consciously partake in on a daily basis that helps maintain and protect the environment.
Table 8-2 Community friendly actions by residents
Action (rank order)
Planning Area (%) Overall (%) 1 2 3 4 5
Recycle paper, plastics, glass and metals 100.0% 99.3% 98.5% 99.1% 99.4% 99.2% Conserve water by recycling water or using water efficient fixtures or use water from a water tank 80.9% 63.8% 76.9% 74.0% 75.3% 72.6%
Maintain a compost heap or worm farm 60.7% 60.8% 59.4% 58.4% 59.9% 59.7%
Use non-car transport for local trips 55.6% 61.7% 52.7% 50.5% 66.7% 58.2%
Maintain a vegetable garden 50.3% 45.1% 53.1% 46.0% 46.2% 47.1%
Purchase green energy (green power) 29.6% 25.5% 26.1% 16.8% 21.1% 22.4%
• Nearly all Blue Mountains residents indicated that they recycle paper, plastics, glass
and metals (99.2%).
Key results:
• Around three quarters (72.6%) conserve water by recycling it, using water efficient
fixtures or water tanks. Residents of Planning Area 1 (80.9%) were more likely to
engage in water conservation measures than residents of Planning Area 1 (63.8%).
• Three in five residents maintain a compost heap or worm farm (59.7%).
• The proportion using non-car transport for local trips rose from 46.1% in 2009 to 58.2%
this year, with Planning Area 5 more likely to do this (66.7%).
• Nearly half of the residents surveyed said that they maintain a vegetable garden
(47.1%).
• This year’s survey showed that fewer residents were purchasing green power, down
from 26.5% to 22.4%. Planning Area 4 (16.8%) was far less likely to purchase green
energy than Planning Area 1 (29.6%).

Blue Mountains City Council - Community Survey 2010 90
8.3 COMMUNITY SAFETY & CONNECTEDNESS
Respondents were asked to indicate their level of agreement with a number of
statements about how they perceive their neighbourhood and the Blue Mountains as a
place to live. They were asked to rate their level of agreement on a 5 point scale, where
1 means ‘strongly disagree’ and 5 means ‘strongly agree’. The results are presented in
Tables 8.3.1 and 8.3.2.
Table 8-3 Community Perceptions
Statement (rank order)
Agreement Rating (%)
Mean Score (out of
5) N/R Low (1-2)
Medium (3)
High (4-5)
I feel that I am generally safe in my neighbourhood 0.0% 2.4% 7.2% 90.4% 4.47
I am in good health 0.1% 3.1% 7.0% 89.8% 4.47 I have someone in my area outside my immediate family to turn to in a time of crisis 0.1% 8.2% 7.4% 84.3% 4.35
My neighbourhood is a friendly place to live 0.1% 3.5% 9.8% 86.6% 4.34
I feel I belong to the community I live in 0.0% 5.3% 14.5% 80.2% 4.18
I like the way my neighbourhood looks 0.0% 8.8% 16.6% 74.6% 4.03
My town/village is child friendly 5.8% 6.9% 19.5% 67.8% 3.96
I make a contribution to the community I live in 0.2% 13.3% 28.0% 58.5% 3.68
Table 8-4 Community Perceptions by Planning Area
Action (rank order)
Planning Area (%) Overall (%) 1 2 3 4 5
I feel that I am generally safe in my neighbourhood 4.42 4.52 4.47 4.57 4.32 4.47
I am in good health 4.42 4.41 4.49 4.44 4.57 4.47 I have someone in my area outside my immediate family to turn to in a time of crisis 4.39 4.30 4.26 4.38 4.39 4.35
My neighbourhood is a friendly place to live 4.46 4.22 4.31 4.41 4.37 4.34
I feel I belong to the community I live in 4.29 4.07 4.19 4.28 4.14 4.18
I like the way my neighbourhood looks 4.23 4.13 3.80 4.09 3.92 4.03
My town/village is child friendly 3.98 3.90 3.77 4.08 3.99 3.96
I make a contribution to the community I live in 3.88 3.81 3.77 3.63 3.50 3.68

Blue Mountains City Council - Community Survey 2010 91
• Six of the eight statements about community connectedness dealt with in this survey
achieved ‘high’ agreement ratings of 4 or more out of 5.
Key results:
• Nine in ten residents agree that they generally feel safe in their neighbourhood,
resulting in a mean score of 4.47.
- Residents of Planning Area 2 (4.52) were more likely to agree with this
statement than those in Planning Area 5 (4.32), although all achieved
quite ‘high’ scores.
• Similarly, 89.8% of residents provided a ‘high’ agreement rating for the statement ‘I
am in good health’, also resulting in a mean of 4.47.
• Most residents in all Planning Areas have someone local outside their immediate
family to turn to in a time of crisis (4.35).
• A mean agreement score of 4.34 was recorded for the statement ‘My
neighbourhood is a friendly place to live’.
- Planning Areas 1 (4.46) and 4 (4.41) provided higher mean scores than
Planning Area 2 (4.22).
• Four in eight Blue Mountains residents feel that they belong in the local community
(4.18).
• Three quarters of Blue Mountains residents agreed that they like the way their
neighbourhood looks, leading to a mean score of 4.03.
- Residents of Planning Areas 1 (4.23) and 2 (4.13) were far more likely to be
happy with the appearance of their neighbourhood than Planning Areas
3 (3.80) and 5 (3.92).
• Two thirds of residents agreed that their town/village is a child-friendly place (3.96),
although Planning Area 4 (4.08) displayed a much higher level of agreement than
Planning Area 3 (3.77).
• Nearly three in five residents indicated that they contribute to their local community,
resulting in a mean agreement score of 3.68.
- Residents of Planning Areas 1 (3.88) appeared to contribute more greatly
than those of Planning Area 5 (3.50).

Blue Mountains City Council - Community Survey 2010 92
• Further statistical testing revealed that:
- Females are significantly more likely to agree with the above statements
about community connectedness, with the exclusion of ‘I feel that I am
generally safe in my neighbourhood’ and ‘My neighbourhood is friendly
place to live’ in which there were no differences between males and
females.
- Blue Mountains youth (16-24 years) had a lower tendency to agree that
they feel safe in their neighbourhood (4.27) than residents aged 35-49
years (4.52) and 65 years or older (4.60).
- All groups provided a significantly higher agreement rating than local
youth when it came to the statements ‘I feel I belong to the community I
live in’ (3.83) and ‘I make a contribution to the community I live in’ (3.01).
- Predictably, residents aged 49 years and younger were more likely to feel
that they were in good health than those aged 50 years or older.
- Residents in the 65+ years age bracket had a greater propensity to agree
that their town/village was child friendly (4.19) than those in the 35-49
years age bracket (3.85).
- Similarly, older residents (65 years and older) were significantly more likely
to like the way their neighbourhood looks (4.24) than younger residents in
the 16-24 years (3.90) and 25-34 years (3.84) age groups.

Blue Mountains City Council - Community Survey 2010 93
APPENDIX 1: Survey Methodology
Sample Design
A telephone-based survey aiming to secure a response from approximately 1000
residents from throughout the Blue Mountains LGA was used. The survey unit was
permanent residents of the Blue Mountains Council area. Respondents also had to be
aged 16 years or older to qualify for an interview. The 2006 Census was used to establish
quotas to ensure a good distribution of response by age and sex.
The sample base for the survey was the electronic White Pages. This sample is known to
be sub optimal, as the churn of telephone numbers due to people moving and new
numbers being added as dwellings are occupied affects about 12% to 15% of possible
numbers. Furthermore, from previous research we know that the proportion of silent
numbers is increasing and can be as high as 25-30% in some areas. To deal with these
issues, IRIS uses a technique that starts with the population of numbers listed in the
telephone book and adds new and unlisted numbers using the ‘half open’ method. In
this method, all numbers were incremented by five to create new numbers in the ‘gaps’
between the listed numbers. The resultant universe of numbers was then de-duplicated
to remove any numbers that may be repeated. This process was replicated five times to
create a new theoretical universe of telephone numbers. This provided the opportunity
for all potential numbers to be selected in the sample. This equal and known opportunity
for selection is the first criterion of good random sampling.
Once the potential universe of numbers had been generated, a computer program was
used to randomise the database. Following this, a sequential sample (eg. every 110th
number) was extracted from the database. The sample was geographically stratified
and evenly distributed within strata. This process gave a very even distribution of
potential numbers across the whole survey area and within the three survey sub areas.
Every household therefore had an equal and known chance of selection and every part
of the survey area received a fair proportional representation in the final sample drawn.

Blue Mountains City Council - Community Survey 2010 94
Data Collection
During the survey process, the person from the selected household who had the most
recent birthday was interviewed. This method eliminated respondent self-selection bias
and is considered an important step in random sample surveys. If the selected person
was not at home, call-backs were scheduled for a later time or day. Unanswered
numbers were retried five times throughout the period of the survey. These procedures
ensure a good sampling process from the sample frame used. Interviews were
conducted on weekday evenings between 4.30 p.m. and 8.30 p.m.
Following the close of the main survey period, additional interviews were conducted,
according to need, in those age groups that were under represented. During this part of
the sampling process, a quota sampling procedure was employed to ensure that
adequate numbers in all age groups were selected for interview. This eliminated the
need for heavily weighting the survey data. Non-private numbers and faxes reached
during the selection process were excluded from the sample. The survey was
implemented under IQCA quality guidelines. Interviews were conducted using our
computer-aided telephone interviewing (CATI) system. Continuous interviewer
monitoring was used and post interview validations were conducted within five days of
the close of the survey.
Response At the end of the survey period, 1008 completed interviews had been collected. Table 0-
1 shows that a completion rate of 72% was achieved.
Table 0-1 Survey Response Outcomes
Response sequence Outcome
Completed Interviews 1008
Refusals & terminated interviews 390
Valid contacts (Excludes disqualified – businesses, out of area, under 16yrs etc) 1398
Completion rate 72.1%
Given the level of response to the survey and the fact that it represents a very good
random cross-section of the area the findings presented in this report provide a good
basis for gauging community opinion.

Blue Mountains City Council - Community Survey 2010 95
WEIGHTING ADJUSTMENT
The final results have been weighted by the age and area distribution of the population,
as this provides the most accurate reflection of overall resident opinions. The proportions
and frequency counts in this report are based on a combination of an area weighting
and an age weighting. Using weighted results means that, whilst large enough sub-
samples have been achieved to make statistically valid comparisons between sub-
groups (i.e. n~200 for each area), all sub-groups will contribute to the total sample result
in proportion to their characteristics.
SURVEY ACCURACY
When analysing results for the entire sample, the maximum error rate will be about ±3.2%
at the 95% confidence level, assuming a proportional response of 50%. Put another way,
we can be confident that if the survey were to be repeated there would be a 95%
chance that the new result would lie within ±3.2% of the result achieved in this survey.

Blue Mountains City Council - Community Survey 2010 96
APPENDIX 2: Importance & Satisfaction Ratings
IMPORTANCE RATINGS BMCC Overall
Service / facility (rank order)
Importance Rating (%) Mean Score
(out of 5) N/R Low Med High
Protection from bushfires and emergencies 0.2% 0.1% 1.8% 97.8% 4.87 Clean, safe and healthy living environments 0.8% 0.3% 2.5% 96.4% 4.83 Garbage collection 0.0% 0.3% 3.2% 96.4% 4.78 Traffic Safety 0.2% 0.5% 3.2% 96.2% 4.77 Wheelie Bin' curbside recycling service 0.1% 1.6% 2.6% 95.6% 4.75 Rural Fire Service and SES buildings 1.6% 1.3% 3.4% 93.7% 4.70 Generating local employment opportunities 2.2% 2.4% 5.3% 90.1% 4.59 Clean creeks & waterways 0.8% 1.5% 5.7% 92.0% 4.58 Litter control 0.4% 1.7% 6.4% 91.5% 4.52 Advocacy for facilities & services for people with a disability 4.7% 4.4% 5.5% 85.4% 4.48
Parks & playgrounds. 1.4% 3.3% 6.0% 89.4% 4.48 Sealed roads 0.4% 3.0% 9.3% 87.4% 4.47 Pedestrian access generally around shopping centres and community facilities. 0.1% 1.5% 7.9% 90.5% 4.47
Lighting of public areas. 1.4% 2.9% 10.1% 85.6% 4.47 Stormwater Infrastructure 3.6% 3.7% 9.3% 83.5% 4.46 Waste Management Facilities 4.1% 4.2% 7.2% 84.5% 4.46 Town centre & village atmosphere 0.5% 2.4% 8.5% 88.6% 4.44 Parking for shoppers 0.5% 2.2% 10.7% 86.5% 4.43 Footpaths 0.2% 3.3% 9.2% 87.2% 4.42 Managing residential development 3.7% 3.1% 10.3% 83.0% 4.41 Advocacy for services and facilities for older people 3.8% 4.8% 8.4% 82.9% 4.39 Advocacy for services and facilities for young people 5.6% 5.1% 7.9% 81.4% 4.38 Public toilets 0.5% 4.4% 12.1% 82.9% 4.36 Protection of natural bushland. 0.2% 3.2% 16.2% 80.4% 4.29 Advocacy for services & facilities for children & families 6.9% 6.3% 10.1% 76.6% 4.29 Council lookouts and walking trails. 2.2% 3.7% 13.0% 81.1% 4.29 Weed control 1.2% 6.1% 12.2% 80.4% 4.27 Carparks 1.2% 3.3% 15.0% 80.5% 4.27 Ovals & sporting grounds. 1.7% 6.7% 9.3% 82.3% 4.27 Annual bulky waste pickup 2.0% 6.1% 14.1% 77.9% 4.24 Swimming pools. 1.6% 5.3% 13.5% 79.5% 4.23 Protection of heritage values & buildings 0.6% 5.9% 14.1% 79.4% 4.22 Library services 2.4% 7.8% 11.5% 78.3% 4.21 Tourism promotion 0.6% 6.0% 15.2% 78.2% 4.20 Visitor Information Centres 2.0% 5.2% 16.7% 76.1% 4.19 Bush regeneration 1.3% 6.8% 14.6% 77.3% 4.18 Commuter parking 2.6% 8.7% 11.5% 77.1% 4.17 Library buildings 5.3% 5.7% 17.7% 71.3% 4.11 Street cleaning 1.7% 6.3% 18.0% 74.0% 4.10 Community centres & community halls 2.2% 5.5% 17.2% 75.1% 4.10 Enhancing the built environment 3.1% 5.3% 19.6% 72.0% 4.06 Curbside chipping of green waste 3.4% 8.7% 18.6% 69.2% 4.05 Hours of operation of the library service 7.5% 9.2% 16.7% 66.6% 4.01 Construction materials recovery and recycling service 14.2% 9.3% 14.5% 62.1% 4.00 Cultural & Arts facilities 3.2% 6.8% 21.6% 68.4% 3.98 Bus shelters 3.4% 13.1% 17.8% 65.7% 3.86 Family Day Care Services 13.4% 18.6% 8.5% 59.5% 3.82 Cycle ways 4.0% 15.9% 18.0% 62.1% 3.74 Cemeteries and ashes placement sites. 9.1% 15.7% 18.9% 56.3% 3.70 Unsealed roads 8.3% 17.6% 30.7% 43.4% 3.42

Blue Mountains City Council - Community Survey 2010 97
Planning Areas
Service / facility (overall rank order) Planning Area
1 2 3 4 5 Protection of natural bushland. 4.20 4.41 4.28 4.18 4.32 Clean creeks & waterways 4.50 4.63 4.64 4.58 4.54 Bush regeneration 4.11 4.23 4.24 4.21 4.11 Weed control 4.32 4.25 4.36 4.28 4.23 Garbage collection 4.73 4.79 4.69 4.81 4.80 Wheelie Bin curbside recycling service 4.64 4.78 4.73 4.75 4.76 Construction materials recovery and recycling service 3.93 3.99 3.93 3.99 4.07 Annual bulky waste pickup 4.25 4.16 4.31 4.32 4.17 Curbside chipping of green waste 3.94 3.86 4.24 4.10 4.13 Waste Management Facilities 4.35 4.49 4.43 4.42 4.49 Stormwater Infrastructure 4.37 4.56 4.52 4.41 4.41 Managing residential development 4.36 4.47 4.38 4.40 4.38 Protection of heritage values & buildings 4.14 4.33 4.09 4.22 4.22 Enhancing the built environment 4.04 4.16 4.02 3.89 4.16 Public toilets 4.41 4.39 4.48 4.31 4.31 Litter control 4.55 4.56 4.52 4.53 4.47 Street cleaning 4.00 4.22 4.11 4.00 4.10 Town centre & village atmosphere 4.55 4.54 4.37 4.38 4.43 Parking for shoppers 4.31 4.51 4.45 4.50 4.31 Cemeteries and ashes placement sites. 3.72 3.72 3.85 3.68 3.62 Sealed roads 4.37 4.41 4.54 4.54 4.45 Unsealed roads 3.57 3.42 3.57 3.40 3.33 Bus shelters 3.93 3.97 3.98 3.84 3.70 Pedestrian access generally around shopping centres and community facilities. 4.51 4.49 4.53 4.43 4.46
Lighting of public areas. 4.47 4.51 4.45 4.42 4.49 Footpaths 4.42 4.39 4.48 4.44 4.40 Cycle ways 3.60 3.65 3.84 3.82 3.74 Carparks 4.11 4.38 4.39 4.28 4.15 Commuter parking 3.98 4.12 4.28 4.20 4.17 Traffic Safety 4.77 4.80 4.80 4.78 4.71 Family Day Care Services 3.78 3.78 4.12 3.80 3.74 Protection from bushfires and emergencies 4.86 4.88 4.92 4.89 4.80 Rural Fire Service and SES buildings 4.70 4.66 4.79 4.67 4.72 Advocacy for services & facilities for children & families 4.23 4.26 4.44 4.29 4.26 Advocacy for services and facilities for young people 4.27 4.41 4.51 4.38 4.33 Advocacy for services and facilities for older people 4.47 4.47 4.57 4.33 4.25 Advocacy for facilities & services for people with a disability 4.53 4.55 4.55 4.40 4.46 Community centres & community halls 4.38 4.07 4.21 4.11 3.99 Ovals & sporting grounds. 4.23 4.01 4.34 4.41 4.34 Swimming pools. 4.17 4.11 4.33 4.30 4.23 Parks & playgrounds. 4.55 4.44 4.52 4.48 4.47 Council lookouts and walking trails. 4.45 4.46 4.35 4.16 4.19 Clean, safe and healthy living environments 4.85 4.81 4.83 4.84 4.83 Library services 4.29 4.30 4.28 4.21 4.05 Hours of operation of the library service 4.08 4.16 4.05 4.00 3.83 Library buildings 4.02 4.28 4.16 4.13 3.90 Generating local employment opportunities 4.54 4.65 4.63 4.59 4.54 Tourism promotion 4.19 4.26 4.27 4.17 4.13 Visitor Information Centres 4.18 4.32 4.12 4.15 4.16 Cultural & Arts facilities 3.97 4.12 4.00 3.95 3.86

Blue Mountains City Council - Community Survey 2010 98
SATISFACTION RATINGS
BMCC Overall
Service / facility (rank order)
Satisfaction Rating(%) Mean Score (out of
5) N/R Low Medium High
Garbage collection 0.0% 3.7% 9.0% 87.3% 4.43 Wheelie Bin' curbside recycling service 0.6% 5.8% 10.1% 83.5% 4.37 Rural Fire Service and SES buildings 10.4% 5.8% 21.0% 62.8% 3.93 Waste Management Facilities 12.7% 7.3% 22.0% 58.0% 3.89 Library services 7.9% 6.5% 26.5% 59.1% 3.85 Swimming pools. 6.2% 7.9% 25.6% 60.3% 3.82 Clean, safe and healthy living environments 2.3% 3.7% 29.6% 64.4% 3.82 Annual bulky waste pickup 6.3% 14.6% 24.6% 54.5% 3.69 Council lookouts and walking trails. 6.1% 8.7% 28.3% 56.9% 3.69 Curbside chipping of green waste 10.4% 12.5% 24.5% 52.5% 3.68 Pedestrian access generally around shopping centres and community facilities. 0.8% 11.5% 27.5% 60.2% 3.68
Visitor Information Centres 6.5% 9.1% 31.9% 52.5% 3.66 Protection from bushfires and emergencies 5.6% 15.3% 23.7% 55.4% 3.64 Hours of operation of the library service 15.9% 9.1% 29.9% 45.2% 3.64 Ovals & sporting grounds. 8.2% 8.9% 30.2% 52.7% 3.63 Library buildings 11.5% 10.2% 30.4% 47.8% 3.61 Cemeteries and ashes placement sites. 31.5% 6.0% 26.7% 35.8% 3.60 Family Day Care Services 41.5% 5.5% 23.9% 29.1% 3.56 Construction materials recovery and recycling service 9.5% 26.9% 33.8% 29.8% 3.55 Bush regeneration 11.0% 9.9% 33.4% 45.6% 3.53 Parks & playgrounds. 4.9% 15.3% 28.2% 51.7% 3.51 Protection of natural bushland. 8.6% 11.1% 35.4% 44.9% 3.49 Tourism promotion 6.4% 13.3% 34.1% 46.2% 3.47 Lighting of public areas. 4.1% 13.8% 36.2% 45.9% 3.44 Protection of heritage values & buildings 6.1% 14.3% 35.2% 44.4% 3.43 Litter control 1.2% 16.9% 33.5% 48.3% 3.41 Town centre & village atmosphere 1.8% 16.8% 35.4% 46.0% 3.41 Clean creeks & waterways 14.7% 14.0% 31.5% 39.8% 3.40 Street cleaning 3.8% 16.2% 34.8% 45.2% 3.38 Community centres & community halls 9.9% 13.1% 37.4% 39.6% 3.38 Traffic Safety 1.4% 16.4% 36.9% 45.4% 3.36 Advocacy for services & facilities for children & families 24.9% 11.4% 36.2% 17.4% 3.29 Bus shelters 12.4% 16.8% 37.2% 33.6% 3.26 Carparks 2.3% 17.3% 44.8% 35.6% 3.26 Advocacy for services and facilities for older people 23.1% 13.8% 34.6% 28.4% 3.26 Cultural & Arts facilities 8.2% 16.9% 39.1% 35.8% 3.25 Parking for shoppers 1.4% 22.9% 36.3% 39.3% 3.22 Commuter parking 7.4% 18.7% 41.1% 32.8% 3.21 Enhancing the built environment 18.6% 41.7% 33.2% 6.5% 3.19 Sealed roads 1.2% 24.4% 36.0% 38.4% 3.18 Managing residential development 10.0% 21.6% 39.1% 29.3% 3.11 Footpaths 0.3% 32.5% 30.5% 36.7% 3.05 Stormwater Infrastructure 10.7% 26.8% 32.1% 30.3% 3.04 Unsealed roads 17.5% 19.4% 42.3% 20.8% 2.99 Advocacy for facilities & services for people with a disability 25.2% 20.8% 33.7% 20.4% 2.99
Weed control 9.9% 28.6% 37.3% 24.1% 2.93 Generating local employment opportunities 16.3% 27.2% 37.1% 19.4% 2.85 Advocacy for services and facilities for young people 21.7% 27.5% 37.0% 13.8% 2.78 Public toilets 4.2% 37.7% 35.3% 22.8% 2.76 Cycle ways 12.9% 35.5% 32.9% 18.7% 2.74

Blue Mountains City Council - Community Survey 2010 99
Planning Areas
Service / facility (overall rank order)
Planning Area
1 2 3 4 5 Protection of natural bushland. 3.32 3.56 3.50 3.49 3.46 Clean creeks & waterways 3.44 3.43 3.41 3.48 3.26 Bush regeneration 3.46 3.64 3.54 3.55 3.43 Weed control 3.00 3.02 2.90 2.84 2.93 Garbage collection 4.41 4.53 4.37 4.36 4.43 Wheelie Bin' curbside recycling service 4.39 4.41 4.37 4.28 4.41 Construction materials recovery and recycling service 3.53 3.64 3.36 3.52 3.59 Annual bulky waste pickup 3.66 3.84 3.72 3.77 3.44 Curbside chipping of green waste 3.67 3.76 3.80 3.68 3.56 Waste Management Facilities 3.78 3.99 3.85 3.87 3.87 Stormwater Infrastructure 3.18 3.04 2.92 3.08 3.03 Managing residential development 3.09 3.20 3.17 3.08 3.04 Protection of heritage values & buildings 3.27 3.47 3.36 3.45 3.48 Enhancing the built environment 3.08 3.19 3.13 3.25 3.20 Public toilets 2.71 2.81 2.55 2.75 2.83 Litter control 3.26 3.42 3.26 3.51 3.40 Street cleaning 3.36 3.49 3.18 3.40 3.37 Town centre & village atmosphere 3.32 3.41 3.27 3.43 3.48 Parking for shoppers 2.87 2.94 3.05 3.39 3.50 Cemeteries and ashes placement sites. 3.54 3.56 3.58 3.67 3.60 Sealed roads 3.21 3.26 3.04 3.05 3.32 Unsealed roads 2.85 2.89 2.97 3.09 3.07 Bus shelters 3.25 3.32 3.20 3.25 3.24 Pedestrian access generally around shopping centres and community facilities. 3.34 3.65 3.54 3.77 3.80
Lighting of public areas. 3.22 3.45 3.34 3.49 3.50 Footpaths 2.95 3.13 2.78 3.13 3.06 Cycle ways 2.61 2.80 2.58 2.83 2.69 Carparks 2.97 3.08 3.27 3.35 3.44 Commuter parking 3.04 3.05 2.96 3.52 3.22 Traffic Safety 3.04 3.27 3.22 3.52 3.46 Family Day Care Services 3.43 3.59 3.63 3.59 3.48 Protection from bushfires and emergencies 3.54 3.68 3.68 3.54 3.71 Rural Fire Service and SES buildings 3.70 4.04 4.06 3.88 3.87 Advocacy for services & facilities for children & families 3.34 3.29 3.32 3.31 3.22 Advocacy for services and facilities for young people 2.52 2.78 2.81 2.79 2.84 Advocacy for services and facilities for older people 3.04 3.20 3.20 3.41 3.25 Advocacy for facilities & services for people with a disability 2.83 2.94 2.91 3.10 3.03 Community centres & community halls 3.56 3.33 3.44 3.37 3.36 Ovals & sporting grounds. 3.59 3.68 3.56 3.60 3.67 Swimming pools. 3.55 3.77 3.99 3.87 3.82 Parks & playgrounds. 3.77 3.62 3.59 3.26 3.56 Council lookouts and walking trails. 3.75 3.79 3.67 3.65 3.61 Clean, safe and healthy living environments 3.78 3.85 3.75 3.88 3.78 Library services 3.85 3.86 3.72 3.98 3.75 Hours of operation of the library service 3.32 3.71 3.49 3.72 3.66 Library buildings 3.46 3.47 3.56 3.75 3.65 Generating local employment opportunities 2.64 2.66 2.77 2.93 3.09 Tourism promotion 3.41 3.45 3.51 3.53 3.42 Visitor Information Centres 3.41 3.52 3.53 3.72 3.85 Cultural & Arts facilities 3.05 3.16 3.41 3.30 3.26

Blue Mountains City Council - Community Survey 2010 100
EXPECTATION GAPS
Service / facility (rank order)
Mean Score (out of 5) Difference
(Imp - Sat) Importance Satisfaction Generating local employment opportunities 4.59 2.85 1.74 Public toilets 4.36 2.76 1.60 Advocacy for services & facilities for young people 4.38 2.78 1.60 Advocacy for facilities & services for people with a disability 4.48 2.99 1.49 Stormwater Infrastructure 4.46 3.04 1.41 Traffic Safety 4.77 3.36 1.41 Footpaths 4.42 3.05 1.37 Weed control 4.27 2.93 1.35 Managing residential development 4.41 3.11 1.30 Sealed roads 4.47 3.18 1.28 Protection from bushfires & emergencies 4.87 3.64 1.23 Parking for shoppers 4.43 3.22 1.22 Clean creeks & waterways 4.58 3.40 1.19 Advocacy for services & facilities for older people 4.39 3.26 1.13 Litter control 4.52 3.41 1.12 Town centre & village atmosphere 4.44 3.41 1.04 Lighting of public areas. 4.47 3.44 1.03 Cycle ways 3.74 2.74 1.01 Carparks 4.27 3.26 1.01 Advocacy for services & facilities for children & families 4.29 3.29 1.00 Clean, safe & healthy living environments 4.83 3.82 1.00 Parks & playgrounds. 4.48 3.51 0.96 Commuter parking 4.17 3.21 0.95 Enhancing the built environment 4.06 3.19 0.86 Protection of natural bushland. 4.29 3.49 0.80 Protection of heritage values & buildings 4.22 3.43 0.79 Pedestrian access around shopping centres & community facilities. 4.47 3.68 0.79 Rural Fire Service & SES buildings 4.70 3.93 0.77 Tourism promotion 4.20 3.47 0.73 Cultural & Arts facilities 3.98 3.25 0.73 Community centres & community halls 4.10 3.38 0.72 Street cleaning 4.10 3.38 0.71 Bush regeneration 4.18 3.53 0.65 Ovals & sporting grounds. 4.27 3.63 0.63 Bus shelters 3.86 3.26 0.60 Council lookouts & walking trails. 4.29 3.69 0.60 Waste Management Facilities 4.45 3.89 0.56 Annual bulky waste pickup 4.24 3.69 0.55 Visitor Information Centres 4.19 3.66 0.54 Library buildings 4.11 3.61 0.50 Construction materials recovery & recycling service 4.00 3.55 0.45 Unsealed roads 3.42 2.99 0.43 Swimming pools. 4.23 3.82 0.40 Wheelie Bin' curbside recycling service 4.75 4.37 0.38 Curbside chipping of green waste 4.05 3.68 0.37 Hours of operation of the library service 4.01 3.64 0.37 Library services 4.21 3.85 0.36 Garbage collection 4.78 4.43 0.35 Family Day Care Services 3.82 3.56 0.26 Cemeteries & ashes placement sites. 3.70 3.60 0.10

Blue Mountains City Council - Community Survey 2010 101
APPENDIX 3: Questionnaire
INTRODUCTION Hello, my name is ... from IRIS Research, an opinion research organisation. We are conducting a survey about services and facilities provided by Blue Mountains City Council and we are interested in the views of a person in your household. By answering this survey you will be providing valuable feedback to Blue Mountains City Council so that the needs of residents can be better addressed. May I please speak to the person in that household who had the most recent birthday. Just to give you some background, the information provided by respondents is completely confidential and will help Council to better understand and meet the diverse needs of its residents. SCREENING Before we start, I just have to make sure you qualify for an interview. Firstly, is this household in the Blue Mountains Council area? [IF NOT TERMINATE] And, have you lived in the Blue Mountains Council area for longer than 6 months? [IF NOT TERMINATE] Before we start, I just have to inform you that my supervisor may monitor this call for quality control purposes. SECTION 1 – COUNCIL SERVICES & FACILITIES (IMPORTANCE & SATISFACTION RATINGS) Question 1A In this first section I will read out a list of services and facilities provided by Blue Mountains CityCouncil. For each I will ask you how important the service is to you personally on a scale of 1 to 5. In the scale, a score of 1 means that the service is not at all important and a score of 5 means that the service is very important to you. For each service or facility I will also ask you how satisfied you are with Council's performance. This will involve a scale of 1 to 5, where 1 means you are very dissatisfied and 5 means you are very satisfied.
LOOKING AFTER ENVIRONMENT 1. Protection of natural bushland. 2. Clean creeks & waterways 3. Bush regeneration 4. Weed control 5. Garbage collection 6. Wheelie Bin' curbside recycling service 7. Construction materials recovery and recycling service 8. Annual bulky waste pickup 9. Curbside chipping of green waste 10. Waste Management Facilities 11. Stormwater Infrastructure
Using Land for Living 12. Managing residential development 13. Protection of heritage values & buildings 14. Enhancing the built environment 15. Public toilets 16. Litter control 17. Street cleaning 18. Town centre & village atmosphere 19. Parking for shoppers 20. Cemeteries and ashes placement sites.

Blue Mountains City Council - Community Survey 2010 102
Moving Around 21. Sealed roads 22. Unsealed roads 23. Bus shelters 24. Pedestrian access generally around shopping centres and community facilities. 25. Lighting of public areas. 26. Footpaths 27. Cycle ways 28. Carparks 29. Commuter parking 30. Traffic Safety
Looking After People 31. Family Day Care Services 32. Protection from bushfires and emergencies 33. Rural Fire Service and State Emergency Service buildings 34. Advocacy for services and facilities for children and families 35. Advocacy for services and facilities for young people 36. Advocacy for services and facilities for older people 37. Advocacy for facilities and services for people with a disability 38. Community centres & community halls 39. Ovals & sporting grounds. 40. Swimming pools. 41. Parks & playgrounds. 42. Council lookouts and walking trails. 43. Clean, safe and healthy living environments 44. Library services 45. Hours of operation of the library service 46. Library buildings
Sustainable Economy 47. Generating local employment opportunities 48. Tourism promotion 49. Visitor Information Centres 50. Cultural & Arts facilities
Question 1C Council uses rates paid by residents to provide the services we have just covered. Please tell me whether you think the services provided by Blue Mountains City Council overall are good value for the rate dollar? Use a 1 to 5 scale, where 1 means you think the services provided by Council overall are very poor value for your rate dollar and 5 means they are very good value.
1 Very poor value 2 ... 3 ... 4 ... 5 Very good value 6 CANT SAY
SECTION 2 – COUNCILLOR & STAFF PERFORMANCE Question 2A Now I want to ask you some general questions about Council's staff and overall image. In the past 12 months, have you had any contact with Council staff? 1 Yes 2 No Question 2D How satisfied are you with the overall performance of Council's staff, again on a scale of 1 to 5, where 1=very dissatisfied and 5=very satisfied.

Blue Mountains City Council - Community Survey 2010 103
1 Very dissatisfied 2 . 3 . 4 . 5 Very satisfied 6 CANT SAY / DONT KNOW Question 2N Have you had any dealings with your elected representatives over the last year?
1 Yes 2 No 3 Cant recall
Question 2Q How satisfied are you with the overall performance of Councillors?
1 Very dissatisfied 2 ... 3 ... 4 ... 5 Very satisfied 6 CANT SAY
SECTION 3 – OVERALL SATISFACTION Question 1B We are near the end of the first section about council services and facilities. Given the answers you have just provided, how would you rate your overall satisfaction with Blue Mountains City Council as an organisation? Again, we will use a scale of 1 to 5 where 1=very dissatisfied and 5=very satisfied. 1 Very dissatisfied [ Go to 1C] 2 . [ Go to 1C ] 3 . [ Jump to 1D ] 4 . [ Jump to 1D ] 5 Very satisfied [ Jump to 1D ] 6 CANT SAY / DECLINED [ Jump to 1D ] Question 1B2 In just a few words, what is your main reason for feeling that way?
[80 CHARACTER TEXT BOX] SECTION 4 – PLANNING PRIORITIES FOR THE BLUE MOUNTAINS Question 4B Thinking firstly about your local neighbourhood, what would you say is the most important issue at the moment?
1st
2 Mentioned [80 CHARACTER TEXT BOX]
nd
3 Mentioned [80 CHARACTER TEXT BOX]
rd
Mentioned [80 CHARACTER TEXT BOX]
Question 5B Now for the City of Blue Mountains overall, what do you see as the major issue of concern?

Blue Mountains City Council - Community Survey 2010 104
1st
2 Mentioned [80 CHARACTER TEXT BOX]
nd
3 Mentioned [80 CHARACTER TEXT BOX]
rd
Mentioned [80 CHARACTER TEXT BOX]
Question 5C [PRIORITY ACTION AREAS] The Council has limited funds to provide and maintain all of its existing assets such as roads, parks, libraries and swimming pools. Thinking firstly about the facilities currently available, what funding priority areas should Council have for the next ten years? I would like you to use a scale of 1 to 10, where 1 is low priority area for funding and 10 is a high. PRIORITY SCALE 0 Very Low Priority
1... 2 ...
3 ... 4 ... 5 ... 6... 7... 8... 9,,, 10 Very High Priority
11 CAN’T SAY
a) Roads and footpaths b) Cycleways c) Swimming pools d) Parks and Sportsgrounds e) Stormwater infrastructure f) Waste Management Facilities g) Community buildings and Public Halls h) Library buildings i) Car parks j) State Emergency Services Buildings and Rural Fire Stations.
SECTION 5 – COMMUNITY VALUES I now want to ask you some more general questions about life in the Blue Mountains… Question 4A [COMMUNITY VALUES] What do you value most about living in the Blue Mountains? [250 CHARACTER TEXT BOX – FULLY PROBE] Question 5A How many of the following actions do you make a conscious effort to do in normal day-to-day life? Please give an honest answer. Do you… [MULTIPLE RESPONSE ACCEPTED]
a) recycle paper, plastics, glass and metals b) maintain a compost heap or worm farm c) maintain a vegetable garden d) use non-car transport (bus, train, cycle, walk) for local

Blue Mountains City Council - Community Survey 2010 105
e) conserve water by recycling water or using water efficient fixtures or use water from a water tank f) purchase green energy (green power
Question 5B Now I want to ask you a number of questions about your perceptions of your neighbourhood and the Blue Mountains as a place to live. I am going to read out some statements and I want you to rate them on a scale of 1 to 5, where 1 means you “strongly disagree” with the statement and 5 means you “strongly agree” AGREEMENT SCALE 1Strongly disagree
2 ... 3 ... 4 ... 5 Strongly agree
6 CAN’T SAY
a) “I feel that I am generally safe in my neighbourhood” b) “I feel I belong to the community I live in” c) “My neighbourhood is a friendly place to live.” d) “I make a contribution to the community I live in” e) “My town/village is child friendly” f) “I am in good health” g) “I have someone in my area outside my immediate family to turn to in a time of crisis” h) “I like the way my neighbourhood looks”
Council is interested in finding out what residents' think are the biggest issues currently facing the community. SECTION 6 - RESPONDENT CHARACTERISTICS Variable ( SEX ) Finally, I just have a few brief questions relating to household data to help classify your answers. From your voice, I assume you are a.... 1 Male 2 Female Variable ( AGE ) Please stop me when I read out the age group you are in ... 1 16-24 years 2 25-34 years 3 35-49 years 4 50-64 years 5 65+ years 6 REFUSED Variable ( pcode ) What is the postcode of this residence?

Blue Mountains City Council - Community Survey 2010 106
CONCLUSION That completes our interview. As this is market research, you can be assured that it is carried out in full compliance with the Privacy Act and the information you provided is only used for research purposes. Again, my name is ….and my supervisors name is Judy. If you have any questions about this survey, or would like further information about IRIS Research, you can call our office between 9am and 5pm weekdays on 4229-4777. Thank you for your time. END.