
2010 Brandt Consolidated Plot Book
20
Brandt Research and Development Farm 2010 Results
description
2010 Brandt Consolidated Plot Book
Transcript of 2010 Brandt Consolidated Plot Book

Brandt Research and
Development Farm
2010 Results

August 4
Preface
Brandt is proud to present the 2010 results from our Research and Development Farm in Pleasant Plains. This is the sixth year for the farm and we hope you will again fi nd value in our analysis. Every year when we plan this farm we challenge ourselves to provide informa-tion that is relevant and actionable for you. We design these trials with that singular theme in mind.
This year our corn trials averaged 179.1 bu. /acre over the whole plot while our fi rst year corn averaged 252 bu. /acre. Pretty good numbers for 2010 even in a plot! We are proud of this success, but we want you to know that we do not use extraordinary measures to achieve these yields. We use good management practices that are economi-cally sound and can be utilized by our customers to enhance their profi tability.
Every farm magazine I pick up is loaded with articles about plant populations and row spacing. Brandt has been evaluating these prac-tices on the farm for several years. We continue to fi nd that a plant population of 36,000 is providing the best corn yields. This year we evaluated 20 inch corn and have some key advice on page 10.There are many yield enhancement opportunities within these pages. We have a 5 year average of 20.3 bu. /acre yield increase with fungicide application to corn. Many of our customers have seen these results on their own farms. Fungicides should be a fundamental component of your production strategy. Brandt Trio is performing well and is being recognized across the Midwest as a new and improved way to deliver cost-effective nutrition and stress mitigation with post herbicide applications. Soybean seed treatments have arrived! Check out the results on pages 14 through 16.
Please review the data to draw your own conclusions. Ed Corrigan, Technical Agronomist, has also provided a summary of results for your consideration. We value your feedback, questions and sugges-tions. For economic analysis and return/acre we have used the crop insurance October values for corn at $5.45/bushel and soybeans at $11.63/bushel.
Planning and executing the Brandt Research Farm is a major under-taking and requires work and dedication from our staff. This year we held our annual plot day on August 4 and although it was hotter than blazes, we had a great program and turn out. We want to pay a special tribute to Ed Corrigan who has done much of the design and execution and has been a tremendous asset. We also want to recognize and thank the following employees for the success of the project: Kevin Heideman, Dave Wallner, Pat Schaddel, John Allen, Julie Reynolds, Mark Powell, Steve Clement, Rich Sapp, Chris Becker, Barney Stock, Ross Brockhouse, Glenn Fuchs, Tommy Kimes and Gary Adair.
Finally, several of our customers helped us with equipment, time and expertise. We could not have done it without you. Thanks.
Tim McArdleGeneral Manager
We continue to fi nd that a plant popula-
tion of 36,000 is providing the best corn
yields. (Page 4)
We have a 5 year average of 20.3 bu. /acre
yield increase with fungicide application to
corn. (Page 10)
Soybean seed treatments have arrived!
(Page 16)
Brandt Trio is performing well and is being
recognized across the MIdwest as a new
and improved way to deliver cost-effective
nutrition and stress mitigation with post
herbicide applications. (Pages 6 & 15)
1
There are some real gems here:

Var
iety
, Till
age
and
Pop
ulat
ion
Hyb
rid,
Pop
ulat
ion
and
Crop
R
otat
ion
Bra
ndt
Com
mun
ity
Hyb
rids
Corn
Str
ess
Mit
igat
ion
Hyb
rid,
Crop
R
otat
ion
20
” vs
30
” R
ows
Hyb
rid
Gro
up R
espo
nse
to
Pop
ulat
ion
and
Nit
roge
n
20
” vs
30
” R
ows
Pop
ulat
ion,
Fe
rtili
ty a
nd
Fung
icid
e
Var
iety
, Fu
ngic
ide
and
N-B
oron
®
Var
iety
, P
opul
atio
n an
d Cr
opR
otat
ion
Soyb
ean
Seed
Tr
eatm
ents
Soyb
ean
Stre
ssM
itig
atio
n
2
3
Table of ContentsHybrid Response to Crop Rotation and Population . . . . . . . . . 4
Corn Herbicide Stress Mitigation . . . . . . . . . . . . . . . . . . . . . . . . . 6
Corn Response to Nitrogen and Population . . . . . . . . . . . . . . 8
20 Inch Versus 30 Inch Corn . . . . . . . . . . . . . . . . . . . . . . . . . . .10
Corn Fungicide and N-Boron® Response
to Fertility Treatments . . . . . . . . . . . . . . . . . . . . . . . . . . . . . . . .11
Soybean Tillage System . . . . . . . . . . . . . . . . . . . . . . . . . . . . . . .12
Soybean Fungicide and N-Boron® . . . . . . . . . . . . . . . . . . . . . . .13
Soybean Population and Crop Rotation . . . . . . . . . . . . . . . . . .14
Soybean Herbicide Stress Mitigation . . . . . . . . . . . . . . . . . . . .15
Soybean Seed Treatments . . . . . . . . . . . . . . . . . . . . . . . . . . . . .16
Summary of 2010 Results . . . . . . . . . . . . . . . . . . . . . . . . . . . . .17
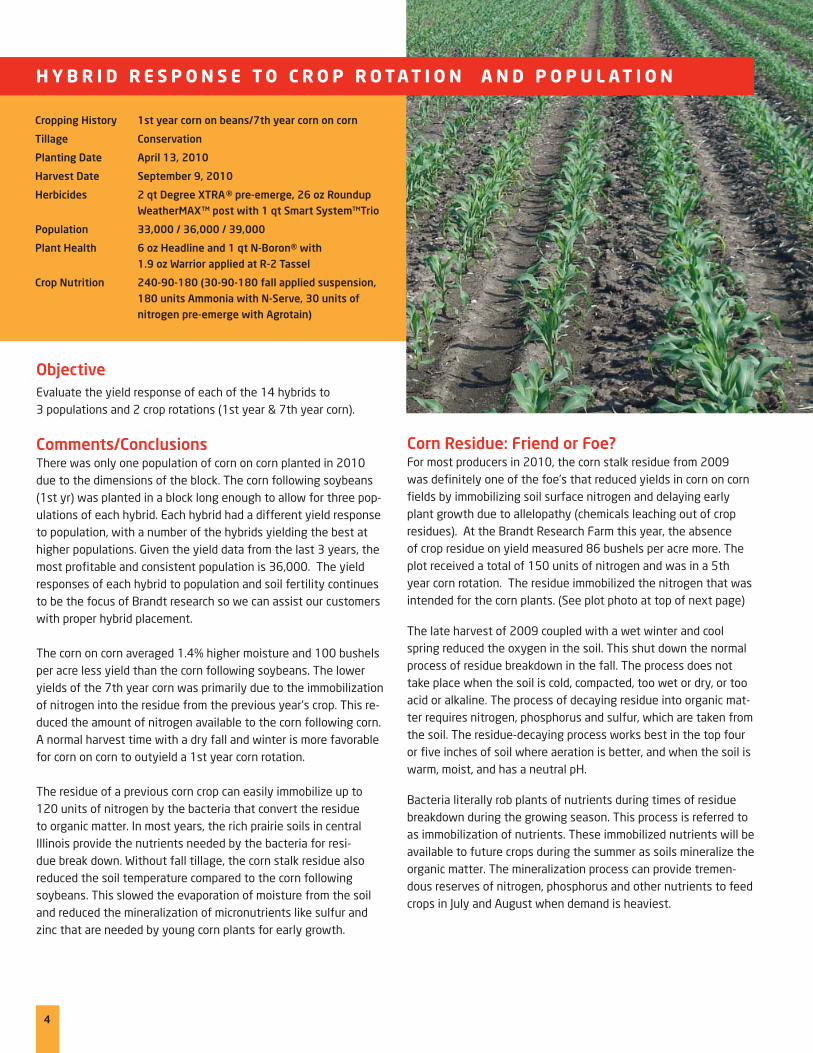
Comments/Conclusions There was only one population of corn on corn planted in 2010 due to the dimensions of the block. The corn following soybeans (1st yr) was planted in a block long enough to allow for three pop-ulations of each hybrid. Each hybrid had a different yield response to population, with a number of the hybrids yielding the best at higher populations. Given the yield data from the last 3 years, the most profi table and consistent population is 36,000. The yield responses of each hybrid to population and soil fertility continues to be the focus of Brandt research so we can assist our customers with proper hybrid placement.
The corn on corn averaged 1.4% higher moisture and 100 bushels per acre less yield than the corn following soybeans. The lower yields of the 7th year corn was primarily due to the immobilization of nitrogen into the residue from the previous year’s crop. This re-duced the amount of nitrogen available to the corn following corn. A normal harvest time with a dry fall and winter is more favorable for corn on corn to outyield a 1st year corn rotation.
The residue of a previous corn crop can easily immobilize up to 120 units of nitrogen by the bacteria that convert the residue to organic matter. In most years, the rich prairie soils in central Illinois provide the nutrients needed by the bacteria for resi-due break down. Without fall tillage, the corn stalk residue also reduced the soil temperature compared to the corn following soybeans. This slowed the evaporation of moisture from the soil and reduced the mineralization of micronutrients like sulfur and zinc that are needed by young corn plants for early growth.
Corn Residue: Friend or Foe? For most producers in 2010, the corn stalk residue from 2009 was defi nitely one of the foe’s that reduced yields in corn on corn fi elds by immobilizing soil surface nitrogen and delaying early plant growth due to allelopathy (chemicals leaching out of crop residues). At the Brandt Research Farm this year, the absence of crop residue on yield measured 86 bushels per acre more. The plot received a total of 150 units of nitrogen and was in a 5th year corn rotation. The residue immobilized the nitrogen that was intended for the corn plants. (See plot photo at top of next page)
The late harvest of 2009 coupled with a wet winter and cool spring reduced the oxygen in the soil. This shut down the normal process of residue breakdown in the fall. The process does not take place when the soil is cold, compacted, too wet or dry, or too acid or alkaline. The process of decaying residue into organic mat-ter requires nitrogen, phosphorus and sulfur, which are taken from the soil. The residue-decaying process works best in the top four or fi ve inches of soil where aeration is better, and when the soil is warm, moist, and has a neutral pH.
Bacteria literally rob plants of nutrients during times of residue breakdown during the growing season. This process is referred to as immobilization of nutrients. These immobilized nutrients will be available to future crops during the summer as soils mineralize the organic matter. The mineralization process can provide tremen-dous reserves of nitrogen, phosphorus and other nutrients to feed crops in July and August when demand is heaviest.
Objective
Evaluate the yield response of each of the 14 hybrids to 3 populations and 2 crop rotations (1st year & 7th year corn).
Cropping History 1st year corn on beans/7th year corn on corn
Tillage Conservation
Planting Date April 13, 2010
Harvest Date September 9, 2010
Herbicides 2 qt Degree XTRA® pre-emerge, 26 oz Roundup
WeatherMAXTM post with 1 qt Smart SystemTMTrio
Population 33,000 / 36,000 / 39,000
Plant Health 6 oz Headline and 1 qt N-Boron® with
1.9 oz Warrior applied at R-2 Tassel
Crop Nutrition 240-90-180 (30-90-180 fall applied suspension,
180 units Ammonia with N-Serve, 30 units of
nitrogen pre-emerge with Agrotain)
H Y B R I D R E S P O N S E T O C R O P R O TAT I O N A N D P O P U L AT I O N
4
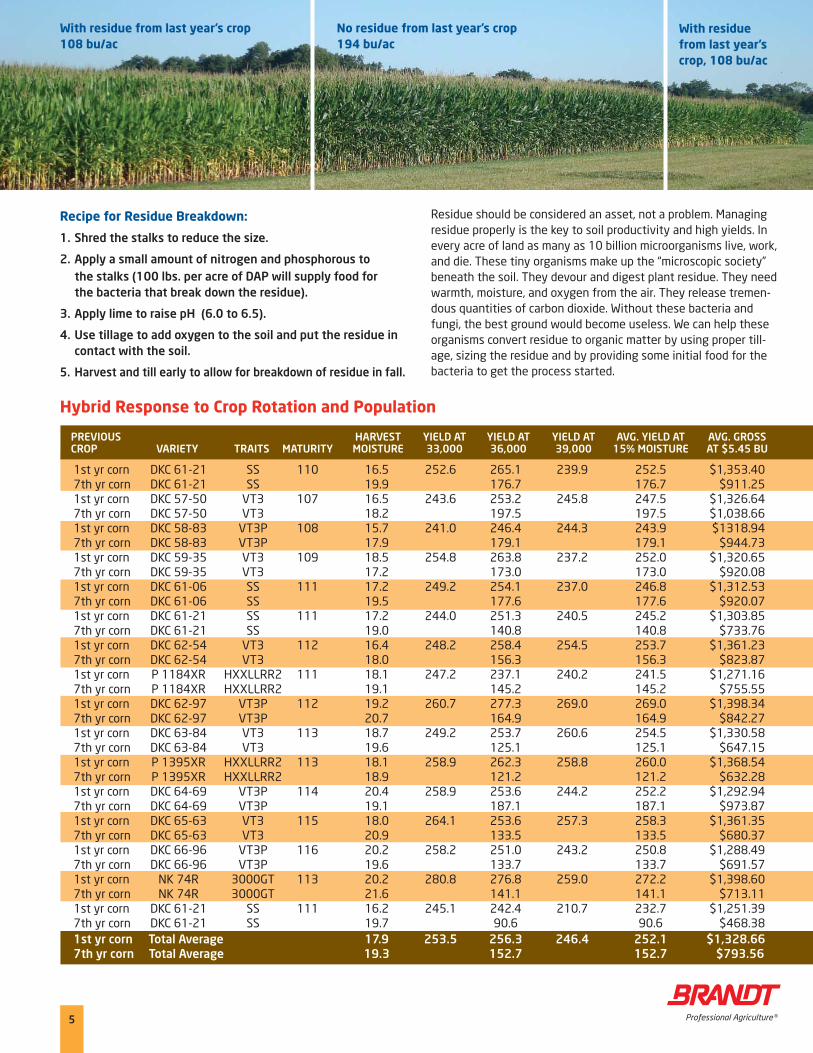
Recipe for Residue Breakdown:
1. Shred the stalks to reduce the size.
2. Apply a small amount of nitrogen and phosphorous to
the stalks (100 lbs. per acre of DAP will supply food for
the bacteria that break down the residue).
3. Apply lime to raise pH (6.0 to 6.5).
4. Use tillage to add oxygen to the soil and put the residue in
contact with the soil.
5. Harvest and till early to allow for breakdown of residue in fall.
Residue should be considered an asset, not a problem. Managing residue properly is the key to soil productivity and high yields. In every acre of land as many as 10 billion microorganisms live, work, and die. These tiny organisms make up the “microscopic society” beneath the soil. They devour and digest plant residue. They need warmth, moisture, and oxygen from the air. They release tremen-dous quantities of carbon dioxide. Without these bacteria and fungi, the best ground would become useless. We can help these organisms convert residue to organic matter by using proper till-age, sizing the residue and by providing some initial food for the bacteria to get the process started.
Hybrid Response to Crop Rotation and Population
With residue from last year’s crop108 bu/ac
No residue from last year’s crop194 bu/ac
With residue from last year’s crop, 108 bu/ac
5
PREVIOUS HARVEST YIELD AT YIELD AT YIELD AT AVG. YIELD AT AVG. GROSSCROP VARIETY TRAITS MATURITY MOISTURE 33,000 36,000 39,000 15% MOISTURE AT $5.45 BU
1st yr corn DKC 61-21 SS 110 16.5 252.6 265.1 239.9 252.5 $1,353.407th yr corn DKC 61-21 SS 19.9 176.7 176.7 $911.251st yr corn DKC 57-50 VT3 107 16.5 243.6 253.2 245.8 247.5 $1,326.647th yr corn DKC 57-50 VT3 18.2 197.5 197.5 $1,038.661st yr corn DKC 58-83 VT3P 108 15.7 241.0 246.4 244.3 243.9 $1318.947th yr corn DKC 58-83 VT3P 17.9 179.1 179.1 $944.731st yr corn DKC 59-35 VT3 109 18.5 254.8 263.8 237.2 252.0 $1,320.657th yr corn DKC 59-35 VT3 17.2 173.0 173.0 $920.081st yr corn DKC 61-06 SS 111 17.2 249.2 254.1 237.0 246.8 $1,312.537th yr corn DKC 61-06 SS 19.5 177.6 177.6 $920.071st yr corn DKC 61-21 SS 111 17.2 244.0 251.3 240.5 245.2 $1,303.857th yr corn DKC 61-21 SS 19.0 140.8 140.8 $733.761st yr corn DKC 62-54 VT3 112 16.4 248.2 258.4 254.5 253.7 $1,361.237th yr corn DKC 62-54 VT3 18.0 156.3 156.3 $823.871st yr corn P 1184XR HXXLLRR2 111 18.1 247.2 237.1 240.2 241.5 $1,271.167th yr corn P 1184XR HXXLLRR2 19.1 145.2 145.2 $755.551st yr corn DKC 62-97 VT3P 112 19.2 260.7 277.3 269.0 269.0 $1,398.347th yr corn DKC 62-97 VT3P 20.7 164.9 164.9 $842.271st yr corn DKC 63-84 VT3 113 18.7 249.2 253.7 260.6 254.5 $1,330.587th yr corn DKC 63-84 VT3 19.6 125.1 125.1 $647.151st yr corn P 1395XR HXXLLRR2 113 18.1 258.9 262.3 258.8 260.0 $1,368.547th yr corn P 1395XR HXXLLRR2 18.9 121.2 121.2 $632.281st yr corn DKC 64-69 VT3P 114 20.4 258.9 253.6 244.2 252.2 $1,292.947th yr corn DKC 64-69 VT3P 19.1 187.1 187.1 $973.871st yr corn DKC 65-63 VT3 115 18.0 264.1 253.6 257.3 258.3 $1,361.357th yr corn DKC 65-63 VT3 20.9 133.5 133.5 $680.371st yr corn DKC 66-96 VT3P 116 20.2 258.2 251.0 243.2 250.8 $1,288.497th yr corn DKC 66-96 VT3P 19.6 133.7 133.7 $691.571st yr corn NK 74R 3000GT 113 20.2 280.8 276.8 259.0 272.2 $1,398.607th yr corn NK 74R 3000GT 21.6 141.1 141.1 $713.111st yr corn DKC 61-21 SS 111 16.2 245.1 242.4 210.7 232.7 $1,251.397th yr corn DKC 61-21 SS 19.7 90.6 90.6 $468.381st yr corn Total Average 17.9 253.5 256.3 246.4 252.1 $1,328.66
7th yr corn Total Average 19.3 152.7 152.7 $793.56
6
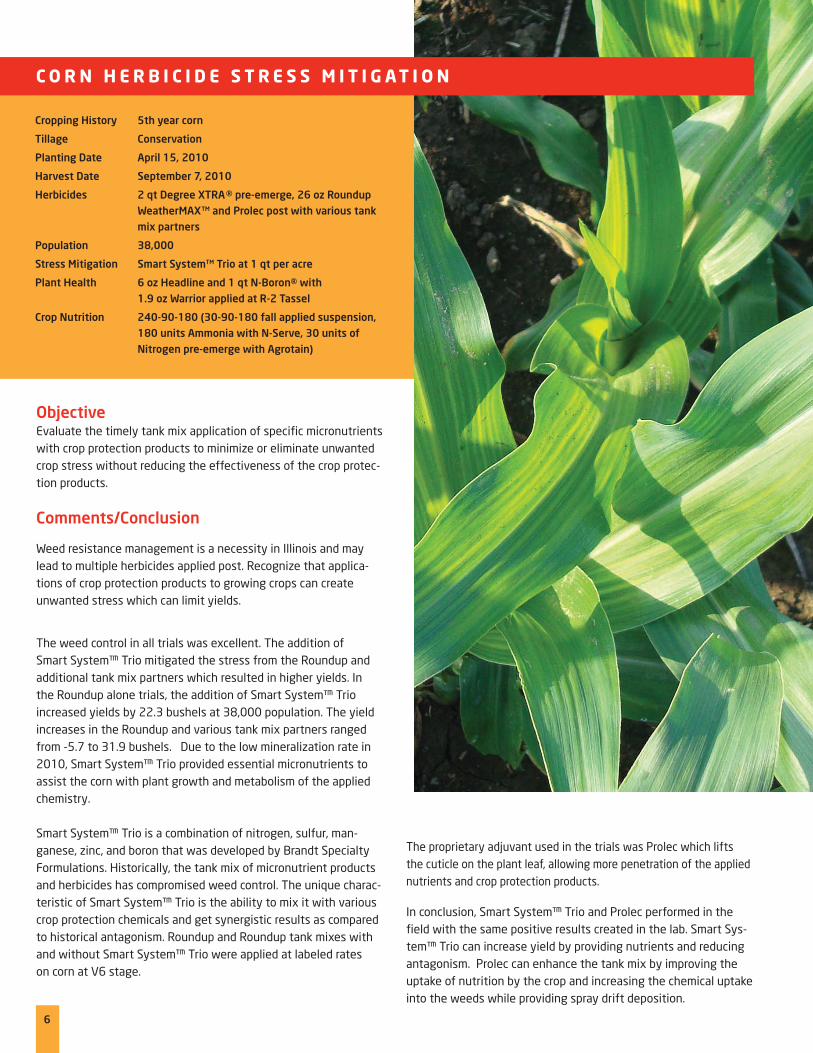
Weed resistance management is a necessity in Illinois and may lead to multiple herbicides applied post. Recognize that applica-tions of crop protection products to growing crops can create unwanted stress which can limit yields.
The weed control in all trials was excellent. The addition of Smart System™ Trio mitigated the stress from the Roundup and additional tank mix partners which resulted in higher yields. In the Roundup alone trials, the addition of Smart System™ Trio increased yields by 22.3 bushels at 38,000 population. The yield increases in the Roundup and various tank mix partners ranged from -5.7 to 31.9 bushels. Due to the low mineralization rate in 2010, Smart System™ Trio provided essential micronutrients to assist the corn with plant growth and metabolism of the applied chemistry.
Smart System™ Trio is a combination of nitrogen, sulfur, man-ganese, zinc, and boron that was developed by Brandt Specialty Formulations. Historically, the tank mix of micronutrient products and herbicides has compromised weed control. The unique charac-teristic of Smart System™ Trio is the ability to mix it with various crop protection chemicals and get synergistic results as compared to historical antagonism. Roundup and Roundup tank mixes with and without Smart System™ Trio were applied at labeled rates on corn at V6 stage.
The proprietary adjuvant used in the trials was Prolec which lifts the cuticle on the plant leaf, allowing more penetration of the applied nutrients and crop protection products.
In conclusion, Smart System™ Trio and Prolec performed in the fi eld with the same positive results created in the lab. Smart Sys-tem™ Trio can increase yield by providing nutrients and reducing antagonism. Prolec can enhance the tank mix by improving the uptake of nutrition by the crop and increasing the chemical uptake into the weeds while providing spray drift deposition.
Objective Evaluate the timely tank mix application of specifi c micronutrients with crop protection products to minimize or eliminate unwanted crop stress without reducing the effectiveness of the crop protec-tion products.
Comments/Conclusion
Cropping History 5th year corn
Tillage Conservation
Planting Date April 15, 2010
Harvest Date September 7, 2010
Herbicides 2 qt Degree XTRA® pre-emerge, 26 oz Roundup
WeatherMAXTM and Prolec post with various tank
mix partners
Population 38,000
Stress Mitigation Smart SystemTM Trio at 1 qt per acre
Plant Health 6 oz Headline and 1 qt N-Boron® with
1.9 oz Warrior applied at R-2 Tassel
Crop Nutrition 240-90-180 (30-90-180 fall applied suspension,
180 units Ammonia with N-Serve, 30 units of
Nitrogen pre-emerge with Agrotain)
C O R N H E R B I C I D E S T R E S S M I T I G AT I O N
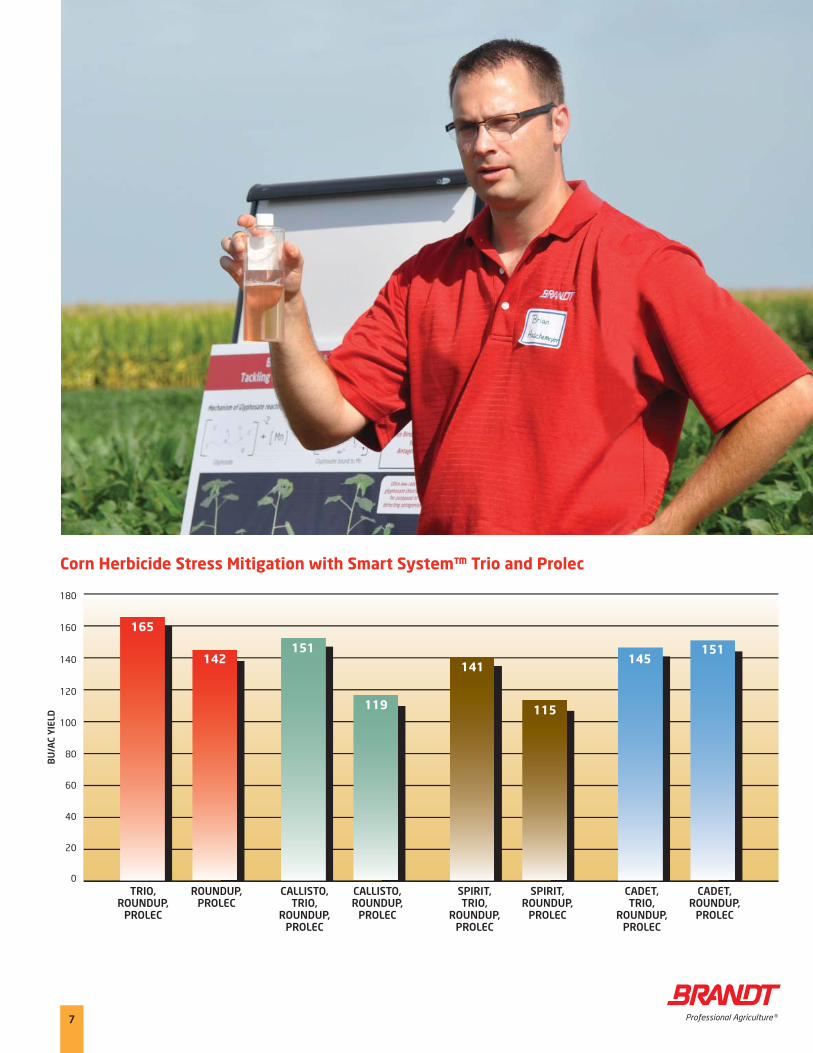
Corn Herbicide Stress Mitigation with Smart System™ Trio and Prolec
180
160
140
120
100
80
60
40
20
0
BU
/AC
YIE
LD
TRIO,ROUNDUP,
PROLEC
ROUNDUP,PROLEC
CALLISTO,TRIO,
ROUNDUP,PROLEC
SPIRIT,TRIO,
ROUNDUP,PROLEC
CADET,TRIO,
ROUNDUP,PROLEC
CALLISTO,ROUNDUP,
PROLEC
SPIRIT,ROUNDUP,
PROLEC
CADET,ROUNDUP,
PROLEC
165
142151
119
141
115
145151
7
180
160
140
120
100
80
60
40
20
0
BU
/AC
YIE
LD
39,000 36,000 33,000 30,000
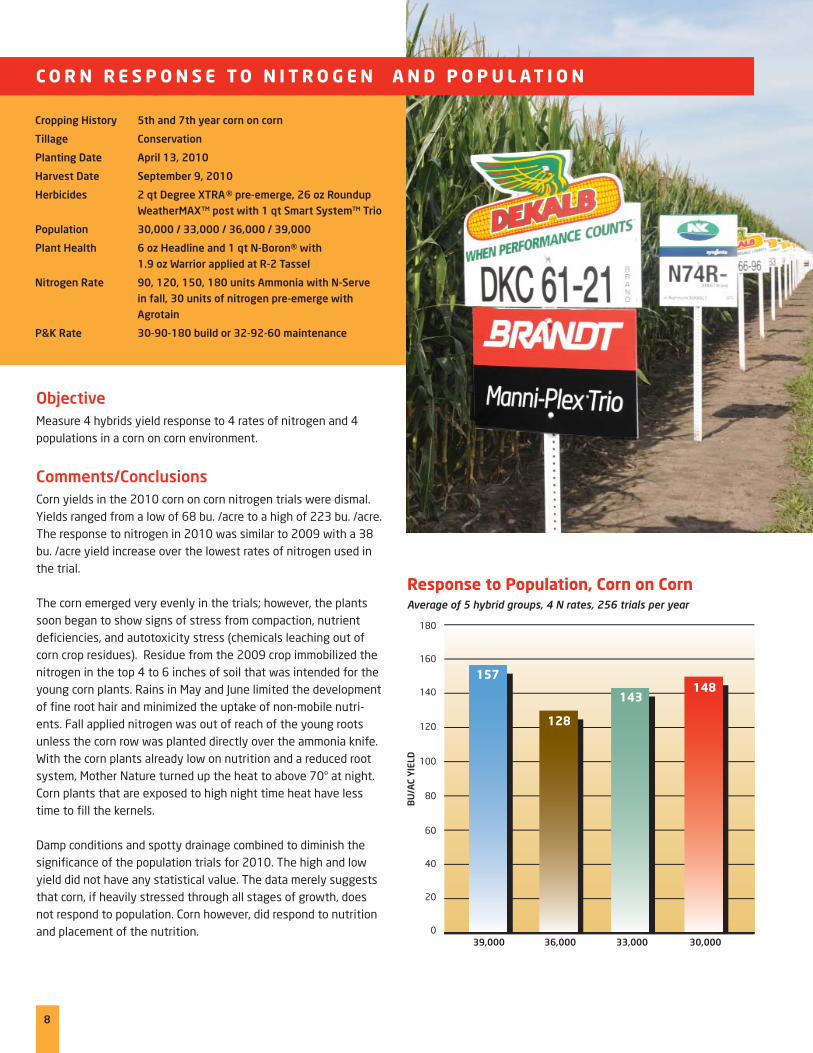
Response to Population, Corn on Corn Average of 5 hybrid groups, 4 N rates, 256 trials per year
8
Comments/Conclusions
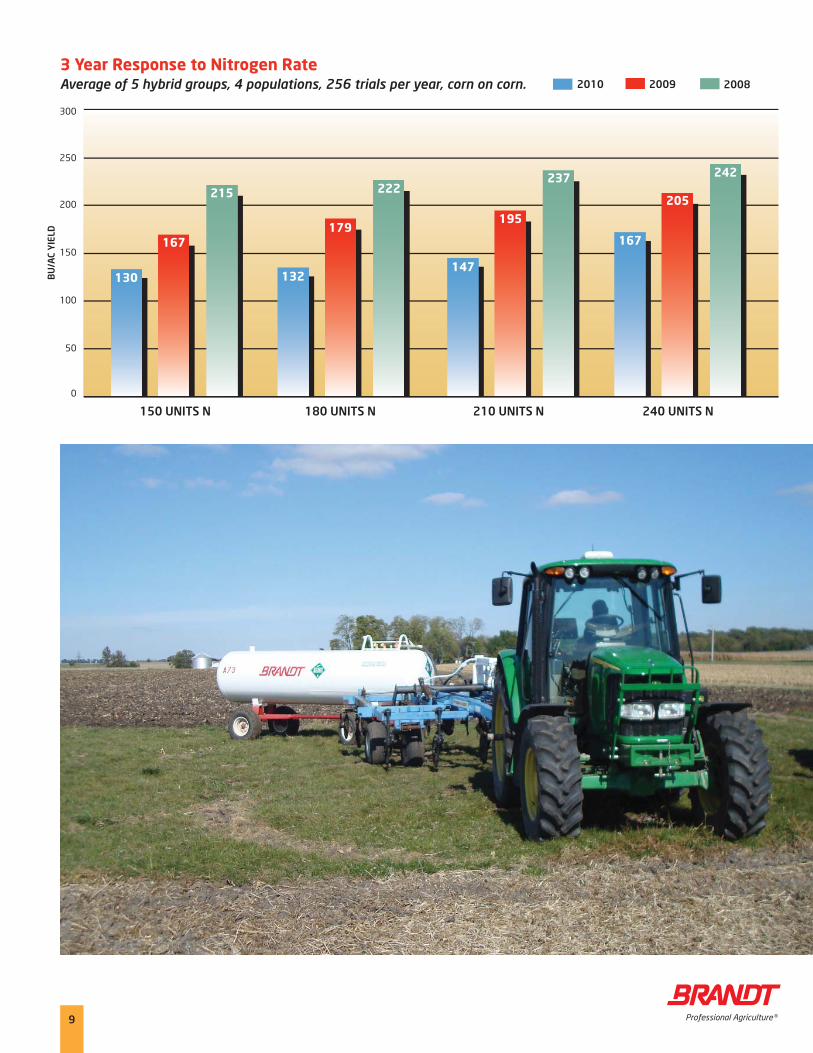
Corn yields in the 2010 corn on corn nitrogen trials were dismal. Yields ranged from a low of 68 bu. /acre to a high of 223 bu. /acre. The response to nitrogen in 2010 was similar to 2009 with a 38 bu. /acre yield increase over the lowest rates of nitrogen used in the trial.
The corn emerged very evenly in the trials; however, the plants soon began to show signs of stress from compaction, nutrient defi ciencies, and autotoxicity stress (chemicals leaching out of corn crop residues). Residue from the 2009 crop immobilized the nitrogen in the top 4 to 6 inches of soil that was intended for the young corn plants. Rains in May and June limited the development of fi ne root hair and minimized the uptake of non-mobile nutri-ents. Fall applied nitrogen was out of reach of the young roots unless the corn row was planted directly over the ammonia knife. With the corn plants already low on nutrition and a reduced root system, Mother Nature turned up the heat to above 70° at night. Corn plants that are exposed to high night time heat have less time to fi ll the kernels.
Damp conditions and spotty drainage combined to diminish the signifi cance of the population trials for 2010. The high and low yield did not have any statistical value. The data merely suggests that corn, if heavily stressed through all stages of growth, does not respond to population. Corn however, did respond to nutrition and placement of the nutrition.
Objective
Measure 4 hybrids yield response to 4 rates of nitrogen and 4 populations in a corn on corn environment.
Cropping History 5th and 7th year corn on corn
Tillage Conservation
Planting Date April 13, 2010
Harvest Date September 9, 2010
Herbicides 2 qt Degree XTRA® pre-emerge, 26 oz Roundup
WeatherMAXTM post with 1 qt Smart SystemTM Trio
Population 30,000 / 33,000 / 36,000 / 39,000
Plant Health 6 oz Headline and 1 qt N-Boron® with
1.9 oz Warrior applied at R-2 Tassel
Nitrogen Rate 90, 120, 150, 180 units Ammonia with N-Serve
in fall, 30 units of nitrogen pre-emerge with
Agrotain
P&K Rate 30-90-180 build or 32-92-60 maintenance
C O R N R E S P O N S E T O N I T R O G E N A N D P O P U L AT I O N
157
128
143148
300
250
200
150
100
50
0
BU
/AC
YIE
LD
150 UNITS N 180 UNITS N 210 UNITS N 240 UNITS N
130 132
179
222
147
195
237
167
205
242
167
215
3 Year Response to Nitrogen RateAverage of 5 hybrid groups, 4 populations, 256 trials per year, corn on corn. 2010 20082009
9
10
Comments/Conclusions
The row width trials were primarily designed to evaluate the yield impact of row width vs. population. As the corn emerged in the trials, an unexpected comparison became evident. The 30” rows were emerging evenly with almost perfect plant spacing while the 20” rows were emerging slower with a lot of variability in the plant spacing. The 30” row planter had been tuned up with preci-sion fi nger units with fl oating Yetter row cleaners. The 20” row was a vacuum planter with rigid mount row cleaners. I feel this gave the 30” rows a clear advantage over the 20” rows by having better seed placement and emergence. Please take this into con-sideration as you view the results.
Statistically, the 20” wide rows were not any better or worse in yield than the 30” wide rows. We did see a better performance of the 20” rows in the higher populations over 39,000 plants per acre. The 20” wide rows clearly did not provide any advantage in yield below the 39,000 population in 2010. This population response to row width plainly points to not investing in nar-row rows unless your populations are north of 39,000 with todays hybrids.
At harvest, all the population trials were standing well. Each hybrid did respond differently to the higher populations with some stalks beginning to break above the ear.
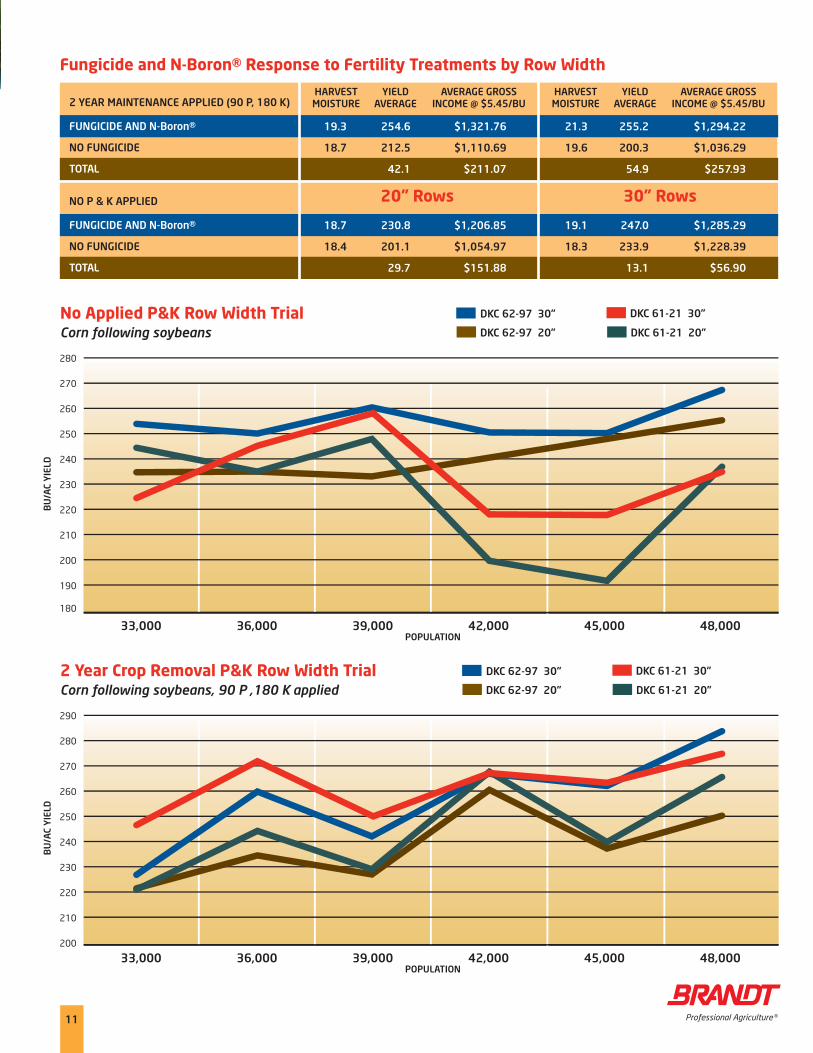
The row width trials did reveal some trends of high populations. To take advantage of the higher populations, you must provide the fertility of phosphorus and potassium to stimulate vegetative growth and reduce nutrient imbalances. The addition of a 2 year maintenance of P & K provided an average of 15 more bushels
per acre when compared to no addition of P & K. This trial was conducted on a soil testing “very high” in P & K and I would expect a larger response on a soil with lower readings.
The response to fungicide and N-Boron® at R2 stage of growth in 2010 turned out to be the management practice that infl uenced corn yields more than all other practices. We measured a 35 bu. /acre average over the 24 trials. This treatment of fungicide and N-Boron® provided a means for the corn plant to deal with the high evening temperatures allowing the corn to fi ll the kernel. The kernels were noticeably larger and the stalks were in much better shape than the untreated corn. There was an average of 48 bu. /acre advantage to fungicide treatment on the trials which had P & K applied. The better balanced fertility of those trials allowed the corn to take full advantage of the stress relief provided by the fungicide and N-Boron®.
Fungicide treatments over the last 5 years of trials to corn have averaged an additonal 20.3 bu. / acre yield at the Research Farm.
Objective
Evaluate the yield response of 20” wide corn rows vs. 30” wide rows. Compare population response, fungicide response to a two year maintenance fertilizer rate vs. none applied.
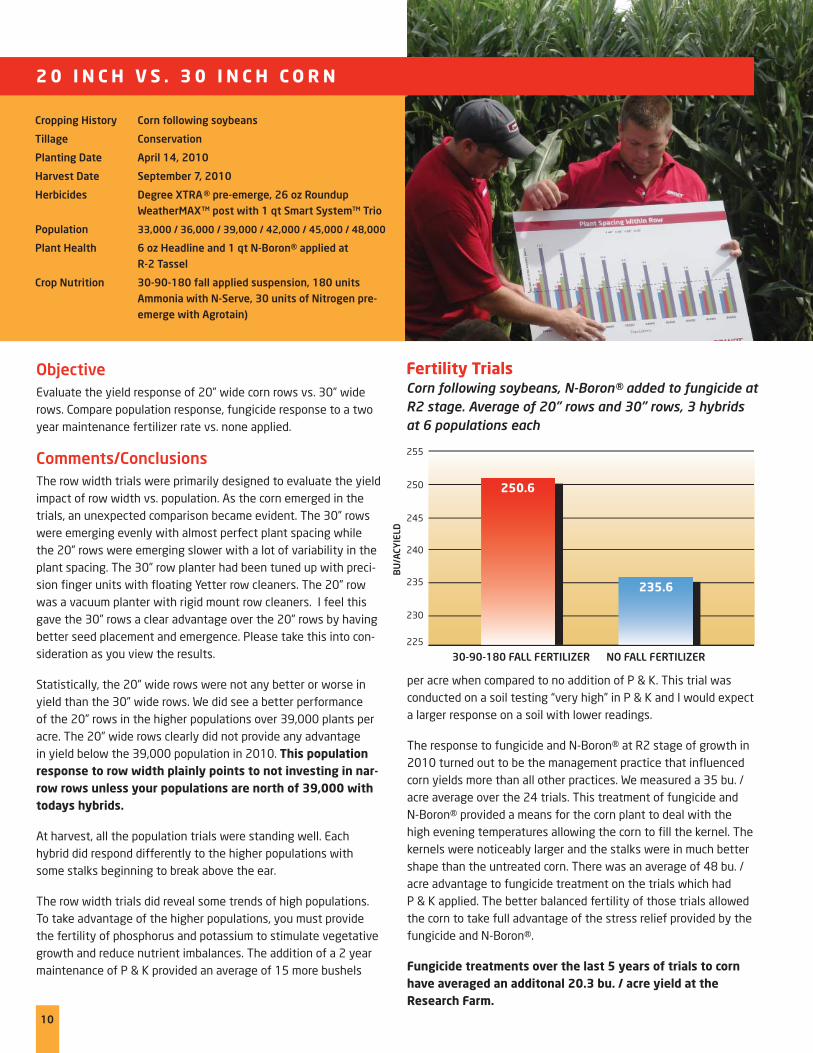
Cropping History Corn following soybeans
Tillage Conservation
Planting Date April 14, 2010
Harvest Date September 7, 2010
Herbicides Degree XTRA® pre-emerge, 26 oz Roundup
WeatherMAXTM post with 1 qt Smart SystemTM Trio
Population 33,000 / 36,000 / 39,000 / 42,000 / 45,000 / 48,000
Plant Health 6 oz Headline and 1 qt N-Boron® applied at
R-2 Tassel
Crop Nutrition 30-90-180 fall applied suspension, 180 units
Ammonia with N-Serve, 30 units of Nitrogen pre-
emerge with Agrotain)
2 0 I N C H V S . 3 0 I N C H C O R N
Fertility TrialsCorn following soybeans, N-Boron® added to fungicide at
R2 stage. Average of 20” rows and 30” rows, 3 hybrids
at 6 populations each
255
250
245
240
235
230
225
BU
/AC
YIE
LD
30-90-180 FALL FERTILIZER NO FALL FERTILIZER
250.6
235.6
280
270
260
250
240
230
220
210
200
190
180
290
280
270
260
250
240
230
220
210
200
BU
/AC
YIE
LD
BU
/AC
YIE
LD
POPULATION
POPULATION
33,000
33,000
36,000
36,000
39,000
39,000
42,000
42,000
45,000
45,000
DKC 62-97 30”
DKC 62-97 20”
DKC 61-21 30”
DKC 61-21 20”
48,000
48,000
No Applied P&K Row Width TrialCorn following soybeans
2 Year Crop Removal P&K Row Width TrialCorn following soybeans, 90 P ,180 K applied
DKC 62-97 30”
DKC 62-97 20”
DKC 61-21 30”
DKC 61-21 20”
11
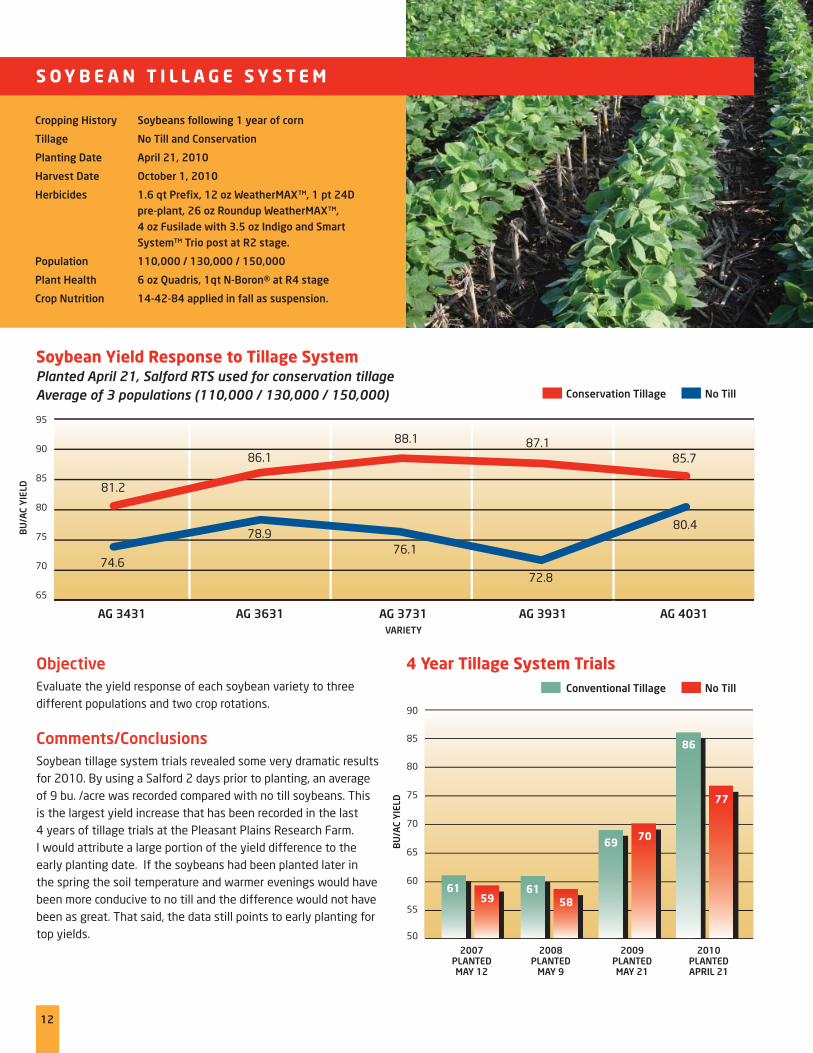
Fungicide and N-Boron® Response to Fertility Treatments by Row Width
2 YEAR MAINTENANCE APPLIED (90 P, 180 K)
FUNGICIDE AND N-Boron®
NO FUNGICIDE
TOTAL
NO P & K APPLIED
FUNGICIDE AND N-Boron®
NO FUNGICIDE
TOTAL
19.3
18.7
18.7
18.4
21.3
19.6
19.1
18.3
HARVEST
MOISTURE
HARVEST
MOISTURE
YIELD
AVERAGE
YIELD
AVERAGE
AVERAGE GROSS
INCOME @ $5.45/BU
AVERAGE GROSS
INCOME @ $5.45/BU
254.6
212.5
42.1
230.8
201.1
29.7
255.2
200.3
54.9
247.0
233.9
13.1
$1,321.76
$1,110.69
$211.07
$1,206.85
$1,054.97
$151.88
$1,294.22
$1,036.29
$257.93
$1,285.29
$1,228.39
$56.90
20” Rows 30” Rows
95
90
85
80
75
70
65
BU
/AC
YIE
LD
VARIETY
AG 3431 AG 3631 AG 3731 AG 3931
Conservation Tillage
Conventional Tillage
No Till
No Till
AG 4031
Soybean Yield Response to Tillage SystemPlanted April 21, Salford RTS used for conservation tillage
Average of 3 populations (110,000 / 130,000 / 150,000)
74.6
78.976.1
72.8
80.4
81.2
86.1
88.1 87.185.7
12
Comments/Conclusions
Soybean tillage system trials revealed some very dramatic results for 2010. By using a Salford 2 days prior to planting, an average of 9 bu. /acre was recorded compared with no till soybeans. This is the largest yield increase that has been recorded in the last 4 years of tillage trials at the Pleasant Plains Research Farm. I would attribute a large portion of the yield difference to the early planting date. If the soybeans had been planted later in the spring the soil temperature and warmer evenings would have been more conducive to no till and the difference would not have been as great. That said, the data still points to early planting for top yields.
Objective
Evaluate the yield response of each soybean variety to three different populations and two crop rotations.
Cropping History Soybeans following 1 year of corn
Tillage No Till and Conservation
Planting Date April 21, 2010
Harvest Date October 1, 2010
Herbicides 1.6 qt Prefi x, 12 oz WeatherMAXTM, 1 pt 24D
pre-plant, 26 oz Roundup WeatherMAXTM,
4 oz Fusilade with 3.5 oz Indigo and Smart
SystemTM Trio post at R2 stage.
Population 110,000 / 130,000 / 150,000
Plant Health 6 oz Quadris, 1qt N-Boron® at R4 stage
Crop Nutrition 14-42-84 applied in fall as suspension.
S O Y B E A N T I L L A G E S Y S T E M
4 Year Tillage System Trials
2007PLANTEDMAY 12
2008PLANTED
MAY 9
2009PLANTEDMAY 21
2010PLANTEDAPRIL 21
90
85
80
75
70
65
60
55
50
BU
/AC
YIE
LD
6159
6158
69 70
86
77

Quadris with N-Boron®No Quadris
95
90
85
80
75
70
65
60
55
50
BU
/AC
YIE
LD
AG 3131 AG 3231 AG 3431 AG 3631 AG 3731 AG 3831 AG 3931 AG 4031 AVERAGE
79
83 83
87
80
84
79
88
79
91
68
80 79
86
81
87
78
86
2010 Soybean Yield Response to Fungicide and N-Boron®Planted April 21, Pleasant Plains, Illinois, applied at R4 growth stage.
Comments/Conclusions
Yield response to fungicide and N-Boron® applications at R4 stage of growth averaged 7.2 bu. /acre across 8 varieties. At $11.63 per bushel soybeans, the fungicide net profi t was $55.74 /ac.
N-Boron® is added to the fungicide treatment primarily to stimu-late the soybeans nitrogen nodules. This increases the production of nitrogen. The fungicide improves the photosynthesis of the soybean as well as regulates the respiration of the soybean for an extended seed fi ll period. The soybean’s nitrogen production and photosynthesis are now operating at a higher rate which improves pod fi ll and yield.
In years of heavy rainfall, the soils ability to provide enough boron is limited due to leaching. Boron is one of the most soluble nutri-ents and moves quickly out of the root zone during rains. Heavy rain events are also when air borne diseases are at a higher risk of infecting soybeans. Additional trials are planned for next year with the addition of molybdenum.
Objective
Evaluate the yield response of each soybean variety to fungicide
and N-Boron®.
Cropping History Soybeans following 3 years of corn
Tillage Conservation
Planting Date April 21, 2010
Harvest Date October 1, 2010
Herbicides 1.6 qt Prefi x, 12 oz WeatherMAXTM, 1 pt 24D
pre-plant, 26 oz Roundup WeatherMAXTM,
4 oz Fusilade with 3.5 oz Indigo and Smart
System® Trio post at R2 stage.
Population 110,000
Plant Health 6 oz Quadris,1 qt N-Boron® at R4 stage
Crop Nutrition 14-42-84 applied in fall as suspension.
S O Y B E A N F U N G I C I D E A N D N - B O R O N ®
13

Comments/Conclusions
All trials were planted in 30” rows. Yield response to lower popula-tions was expected when planting the soybeans in late April. The 130,000 population had the highest yield in 9 out of 16 trials. On average, 1 year rotation showed a larger response to higher popu-lations and an additional 3.2 bu. /acre over the low population.
The wet growing season did not increase the amount of disease that is normally expected by planting in early spring. This was due in part by the good soil conditions in late April. The soybeans
emerged and got a good start before the rains began in early May. Early planted soybeans are able to canopy in late June and this allows the seed fi ll to be extended. Acceleron seed treatment was instrumental in allowing the soybeans to be planted in April. The treatment got the beans out of the ground and fl owering by mid June. The April planting averaged 19 bu. /acre more when compared with the same set of varieties planted June 1 at Pleasant Plains.
Fertilizing the ground prior to soybeans with a maintenance rate of P & K has also been one of the common factors with high yield-ing soybeans the last 3 years. Trials will be established next year at Pleasant Plains to try to measure this response.
Objective
Evaluate the yield response of each soybean variety to three different populations and two crop rotations.
Variety Response to Population and Crop Rotation
Cropping History Soybeans following 1 year and 3 years of corn
Tillage Conservation
Planting Date April 21, 2010
Harvest Date October 1, 2010
Herbicides 1.6 qt Prefi x, 12 oz WeatherMAXTM, 1 pt 24D
pre-plant, 26 oz Roundup WeatherMAXTM,
4 oz Fusilade with 3.5 oz Indigo and Smart
SystemTM Trio post at R2 stage
Population 110,000 / 130,000 / 150,000
Plant Health 6 oz Quadris, 1qt N-Boron® at R4 stage
Crop Nutrition 14-42-84 applied in fall as suspension
S O Y B E A N P O P U L AT I O N A N D C R O P R O TAT I O N
14
PREVIOUS HARVEST YIELD AT YIELD AT YIELD AT AVG. YIELD AT AVG. GROSSCROP VARIETY TRAITS MATURITY MOISTURE 110,000 130,000 150,000 13% MOISTURE AT $11.63 BU
1st yr corn AG3131 RR2Y 3.1 11.6 73.3 77.9 81.2 77.5 $900.823rd yr corn AG3131 RR2Y 11.1 82.5 83.8 81.9 82.7 $962.241st yr corn AG3231 RR2Y 3.2 11.8 85.3 85.0 83.1 84.5 $983.193rd yr corn AG3231 RR2Y 10.9 87.3 87.1 82.4 85.6 $995.631st yr corn AG3431 RR2Y 3.4 11.3 79.3 82.3 82.1 81.2 $944.533rd yr corn AG3431 RR2Y 10.6 84.4 82.4 84.9 83.9 $976.081st yr corn AG3631 RR2Y 3.6 11.6 85.6 86.4 86.2 86.1 $1,000.913rd yr corn AG3631 RR2Y 11.0 87.6 88.0 85.8 85.8 $998.111st yr corn AG3731 RR2Y 3.7 11.3 85.5 89.2 89.7 88.1 $1,024.643rd yr corn AG3731 RR2Y 10.5 90.5 92.9 88.6 88.6 $1,030.261st yr corn AG3831 RR2Y 3.8 11.6 77.9 83.1 85.0 82.0 $953.253rd yr corn AG3831 RR2Y 10.9 79.6 81.6 80.2 80.5 $936.781st yr corn AG3931 RR2Y 3.9 11.4 87.2 87.8 86.4 87.1 $1,012.733rd yr corn AG3931 RR2Y 11.1 85.8 89.4 88.8 88.0 $1,023.351st yr corn AG4031 RR2Y 4.0 11.5 82.0 87.2 87.8 85.7 $996.683rd yr corn AG4031 RR2Y 10.9 87.3 87.9 82.6 85.9 $999.231st yr corn Total Average 11.5 82.0 84.9 85.2 84.0 $976.99
3rd yr corn Total Average 10.9 85.6 86.6 84.4 85.1 $989.62

Cropping History Soybeans following 3 years of corn
Tillage No Till
Planting Date April 21, 2010
Harvest Date October 1, 2010
Herbicides 1.6 pt Prefi x, 12 oz WeatherMAXTM, 1 pt 24D
pre-plant, 26 oz Roundup WeatherMAXTM,
with Prolec post at R2 stage with various tank
mix partners
Population 130,000
Stress Mitigation 1 qt Smart SystemTM Trio at V3 stage
Plant Health 6 oz Quadris with 1.9 oz Warrior at R4 stage
Crop Nutrition 14-42-84 applied in fall as suspension
S O Y B E A N H E R B I C I D E S T R E S S M I T I G AT I O N
95
90
85
80
75
70
65
BU
/AC
YIE
LD
2010 Soybean Yield Response to Stress MitigationAsgrow AG 3803, Planted April 21, Pleasant Plains, Treatments applied at R2 with foliar insecticide and Prolec.
15
Comments/Conclusions Weed pressure and weed resistance is one of the pressing issues that soybean growers face in Illinois. Uses of multiple modes of action are necessary to maintain the value of current herbicides used today. Brandt is very supportive of this process. The addi-tion of a soil applied product is one of the best ways to add an ad-ditional mode of action, however this may not always be an option due to poor weather. These trials were established to investigate the value of stress mitigation products like Smart SystemTM Trio, designed to provide nutrition to the plant without sacrifi cing ef-fi cacy of the herbicide.
The addition of Smart SystemTM Trio to the traditional mix of Roundup and Prolec increased soybean yields by 6.3 bu. /acre when applied at R2 stage of growth. Trio improved the recovery of the soybean from the application of Roundup by providing zinc
to stimulate growth, manganese to improve photosynthesis and plant metabolism, and boron to improve nitrogen nodule production.
As expected, the soybeans trials with the 2nd mode of action added to the traditional Roundup mix reduced the yield 3.7 bu. /acre compared - on average - to the Roundup alone. Additional chemical load has to be broken down and metabolized by the soybean plant. This takes energy away from the production of fl owering and pod fi ll. By adding Trio to the mix, the soybean has additional nutrition available to assist with metabolizing the chemistry. The graph on this page shows how Smart SystemTM Trio improved soybean yield when compared with Roundup plus her-bicide alone. The highest yielding trial was a mixture of Smart
SystemTM Trio, Manni-Plex B Moly, Roundup and Prolec.
In conclusion, the soybean stress mitigation trials proved the signifi cance of Smart SystemTM Trio as a valuable tool to increase yields without sacrifi cing herbicide performance during a post application.
Objective
Measure the stress mitigation of Smart SystemTM Trio, Manni-Plex B Moly, and N-Boron® when included with applications of post herbicides with various modes of action.
AVERAGE:ROUNDUP
ONLY
AVERAGE:ROUNDUP,
HERBICIDES
ROUNDUP,1 QT B MOLY,
1 QT TRIO
ROUNDUP,2 QT TRIO
ROUNDUP,0.5 OZ CLASSIC,
1 QT TRIO
ROUNDUP,0.375 OZ
SYNCHRONY, 1 QT TRIO
ROUNDUP,1.25 PT
FLEXSTAR, 1 QT TRIO
ROUNDUP,8 OZ COBRA,
1 QT TRIO
ROUNDUP,4 OZ
RESOURCE, 1 QT TRIO
ROUNDUP,0.8 OZ CADET,
1 QT TRIO
ROUNDUP,1 QT N-Boron®,
1 QT TRIO
8077
92
87
8082 81 82
8081
85
16
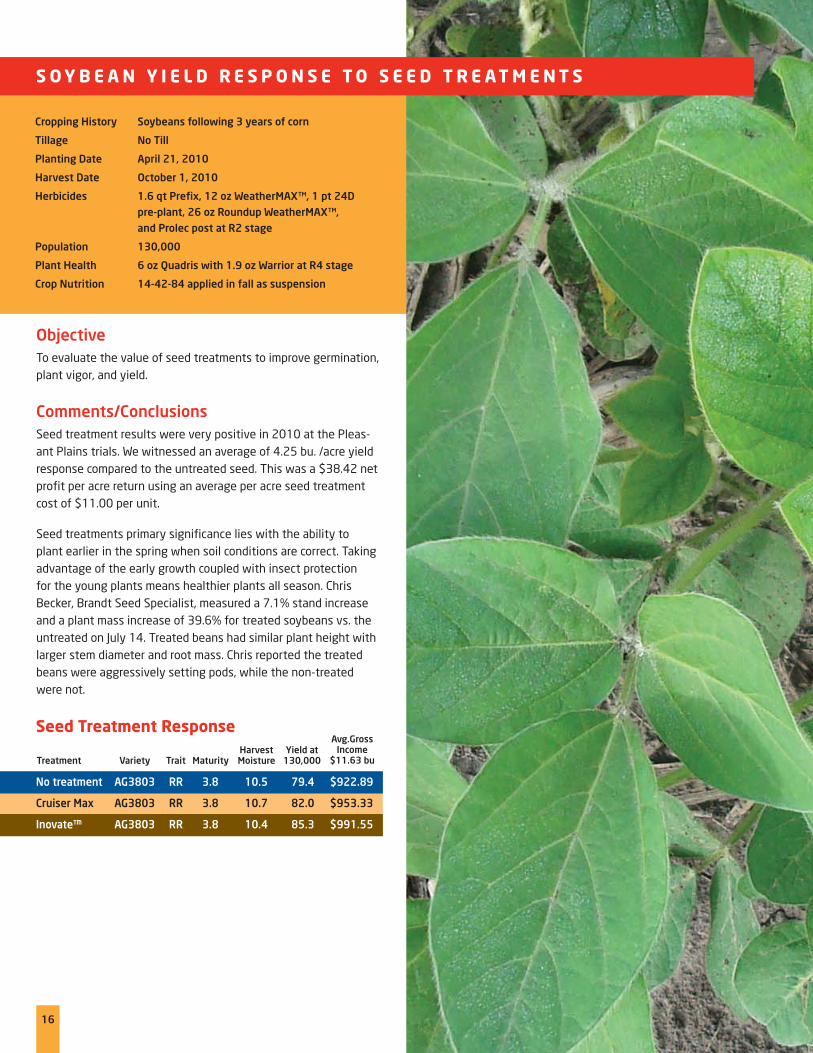
Comments/Conclusions
Seed treatment results were very positive in 2010 at the Pleas-ant Plains trials. We witnessed an average of 4.25 bu. /acre yield response compared to the untreated seed. This was a $38.42 net profi t per acre return using an average per acre seed treatment cost of $11.00 per unit.
Seed treatments primary signifi cance lies with the ability to plant earlier in the spring when soil conditions are correct. Taking advantage of the early growth coupled with insect protection for the young plants means healthier plants all season. Chris Becker, Brandt Seed Specialist, measured a 7.1% stand increase and a plant mass increase of 39.6% for treated soybeans vs. the untreated on July 14. Treated beans had similar plant height with larger stem diameter and root mass. Chris reported the treated beans were aggressively setting pods, while the non-treated were not.
Objective
To evaluate the value of seed treatments to improve germination, plant vigor, and yield.
Cropping History Soybeans following 3 years of corn
Tillage No Till
Planting Date April 21, 2010
Harvest Date October 1, 2010
Herbicides 1.6 qt Prefi x, 12 oz WeatherMAXTM, 1 pt 24D
pre-plant, 26 oz Roundup WeatherMAXTM,
and Prolec post at R2 stage
Population 130,000
Plant Health 6 oz Quadris with 1.9 oz Warrior at R4 stage
Crop Nutrition 14-42-84 applied in fall as suspension
S O Y B E A N Y I E L D R E S P O N S E T O S E E D T R E AT M E N T S
Seed Treatment Response
Treatment Variety Trait MaturityHarvestMoisture
Yield at130,000
No treatment AG3803 RR 3.8 10.5 79.4 $922.89
Cruiser Max AG3803 RR 3.8 10.7 82.0 $953.33
Inovate™ AG3803 RR 3.8 10.4 85.3 $991.55
Avg.Gross Income
$11.63 bu

Summary of 2010 Results
Corn averaged 179.1 bu. /acre over the 468 trials in 2010. The corn trials ranged from a high of 285.7 bu. /acre to a low of 68 bu. /acre.
Crop rotation defi nitely had the biggest impact on yield in 2010 at the Pleasant Plains Research Farm. Corn following soybeans aver-aged 100 bu. /acre more than the corn on corn. A late harvest and wet fall of 2009 did not allow us to get tillage accomplished in the fall. Soils started out in the spring collapsing from the wet winter with very little oxygen and heavy residue on the surface of the corn on corn. In early April, shallow vertical tillage was chosen to reduce the residue size and add oxygen to the soils. Corn was planted the second week of April and had very good emergence and spacing. Lack of soil mineralization in combination with the tight soils and continual rains in May, put a tremendous early season stress on the corn plants and reduced root mass. Next, residue in the corn on corn immobilized a large percent of the nitrogen that was intended for the young corn plants creating additional stress.
The top yield response to corn was led by the profi tablility of fungicide and N-Boron® treatments in 2010. By changing the row width, population, and fertility the response to a fungicide treat-ment reached well into the 50 bu. /acre range. Corn stress mitigation trials continued to demonstrate the value of managing early season corn plant health with the addition of Smart System™ Trio to a post application of herbicide with an average of 18.7 bushels at 38,000 population.
The soybeans were planted on April 21 and averaged 82.7 bu. /acre over the 111 trials.
Early planting, good moisture and warm nights in August combined to produce the highest yielding soybeans ever grown at the Pleas-ant Plains Research Farm. Soybean seed treatments were a very signifi cant part of the decision to plant early and the decision paid off. Compared to a June 1st planting date, the April planted beans averaged 19 bu. /acre more.
The most yield responsive soybean trials started with tillage trials which averaged 9 bu. /acre increase. The second was fungicide and N-Boron® treatments that increased yields by 7.2 bu. /acre. Stress Mitigation Trials using Smart System™ Trio added an additional 3.7 bu. /acre on average and seed treatment trials averaged an additional 4.25 bu. /acre.
You must have good ‘local information’ to have improved farming practices. We value your input and look forward to the opportunity to assist you with your farming operation.
Ed CorriganBrandt Technical Agronomist
Corn following soybeans averaged
100 bu. / acre more than the corn
on corn (p. 4).
Response to a fungicide treatment
reached well into the 50 bu. /ac
range (p. 11).
Compared to a June 1st planting
date, the April planted beans aver-
aged 19 bu. /acre more (p. 14).
17
Highlights of Results:

Retail LocationsAshland 217 476 3438Auburn 217 438 6158Cooksville 309 725 3710Cropsey 309 377 3121Fairbury 815 692 2612Franklin 217 675 2302Galesville 217 489 2141Greenview 217 968 5589Gridley 309 747 2233Lexington 309 365 7201Lincoln 217 735 2571New Berlin 217 488 3125Oakford 217 635 5765Pleasant Plains 217 626 1127Raymond 217 229 3442Towanda 309 728 2294Williamsville 217 566 2113
Brandt Consolidated, Inc.2935 South Koke Mill RoadSpringfi eld, Illinois 62711 USAwww.brandt-inc.com 217 547 5800


