
2010 11 15-19 ASA Meeting Cancun - noise emissions … · Minicargador Mixer Truck ... Microsoft...
27
Comparison of Noise Emissions from in‐situ measurements construction projects in Chile with those from British Standard BS 5228‐1:2009 Author: Max Glisser Christian Gerard 2 nd Pan-American and Iberian Meeting on Acoustics Cancún, México, 15-19 November 2010
Transcript of 2010 11 15-19 ASA Meeting Cancun - noise emissions … · Minicargador Mixer Truck ... Microsoft...
Comparison of Noise Emissions from in‐situ measurements construction projects in Chile
with those from British Standard BS 5228‐1:2009
Author:Max Glisser
Christian Gerard
2nd Pan-American and Iberian Meeting on AcousticsCancún, México, 15-19 November 2010
ABSTRACT
In the current work it is presented a comparison between the SoundPower Levels (Lw) determined considering field measurements done byControl Acústico in construction works and the levels assessed using theBritish Standard BS 5228 “Noise and Vibration Control on Constructionand Open Sites”. The methodology for the assessment of the Sound Power it is shownand, later, it is presented the comparison with the values determinedusing the British Standard.
A big number of Acoustic Impact studies are carried out for projects applyingto the Environmental Impact Evaluation System, which is a mandatoryprocedure for performing any construction Project in Chile. The Noise Consultant is in charge to evaluate these projects, and it is a hardchallenge in order to perform the projects in the better way according someof the following aspects: Revision of the applicable standards; Generation of the scaled cartography, being geo‐referenced for each
area of study; Location of the Noise Sources and the Receivers; Sound Power Level Lw of the involved noise sources.
INTRODUCTION
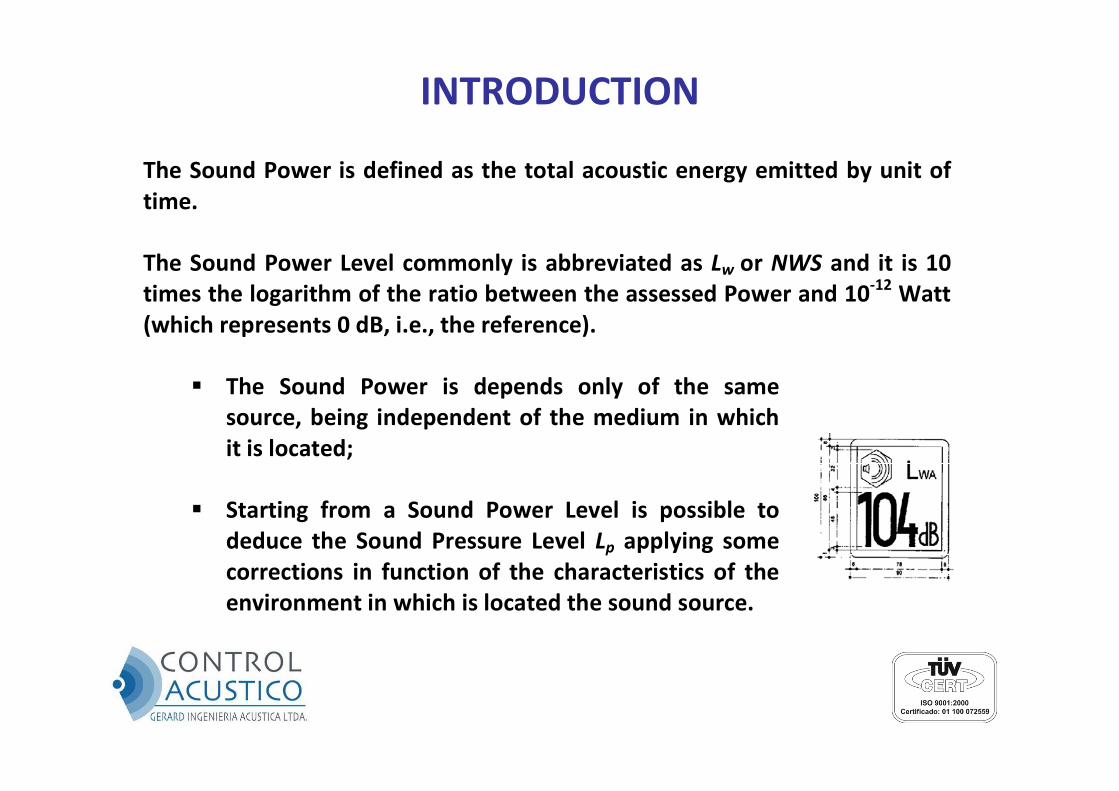
The Sound Power is defined as the total acoustic energy emitted by unit of time. The Sound Power Level commonly is abbreviated as Lw or NWS and it is 10 times the logarithm of the ratio between the assessed Power and 10‐12 Watt (which represents 0 dB, i.e., the reference).
The Sound Power is depends only of the same source, being independent of the medium in which it is located;
Starting from a Sound Power Level is possible to deduce the Sound Pressure Level Lp applying some corrections in function of the characteristics of the environment in which is located the sound source.
INTRODUCTION
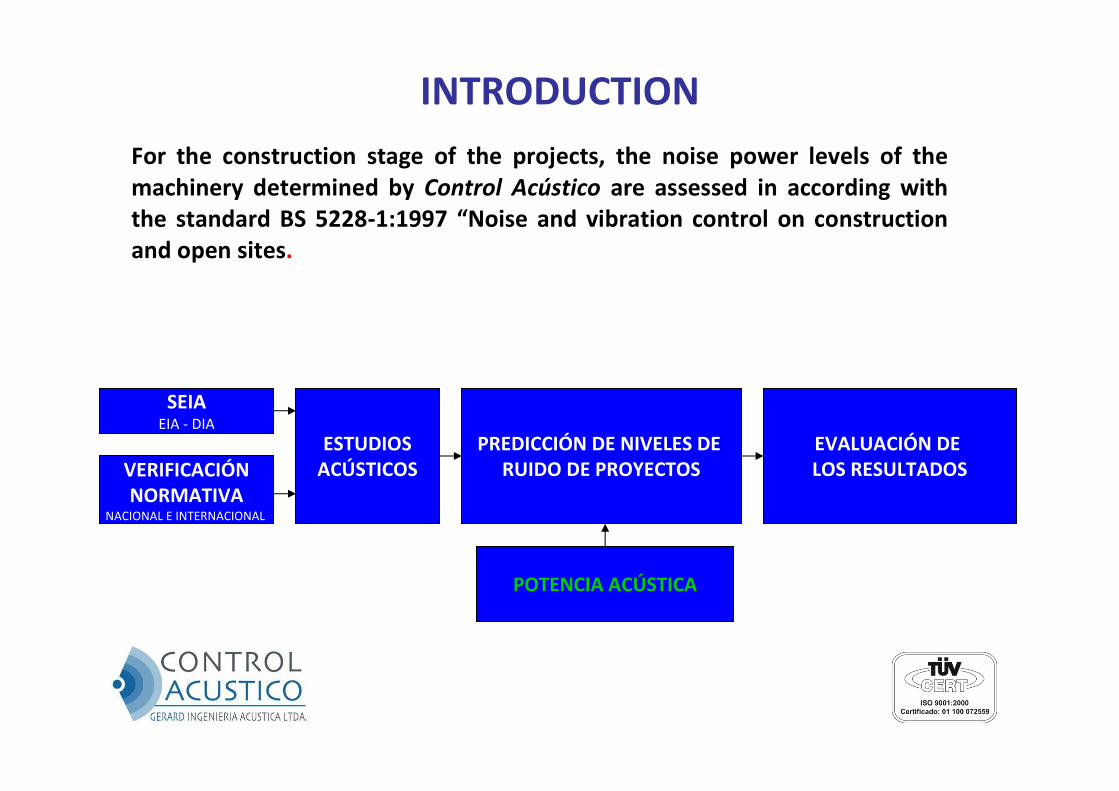
For the construction stage of the projects, the noise power levels of themachinery determined by Control Acústico are assessed in according withthe standard BS 5228‐1:1997 “Noise and vibration control on constructionand open sites.
INTRODUCTION
ESTUDIOSACÚSTICOS
SEIAEIA ‐ DIA
VERIFICACIÓNNORMATIVA
NACIONAL E INTERNACIONAL
EVALUACIÓN DE LOS RESULTADOS
PREDICCIÓN DE NIVELES DE RUIDO DE PROYECTOS
POTENCIA ACÚSTICA
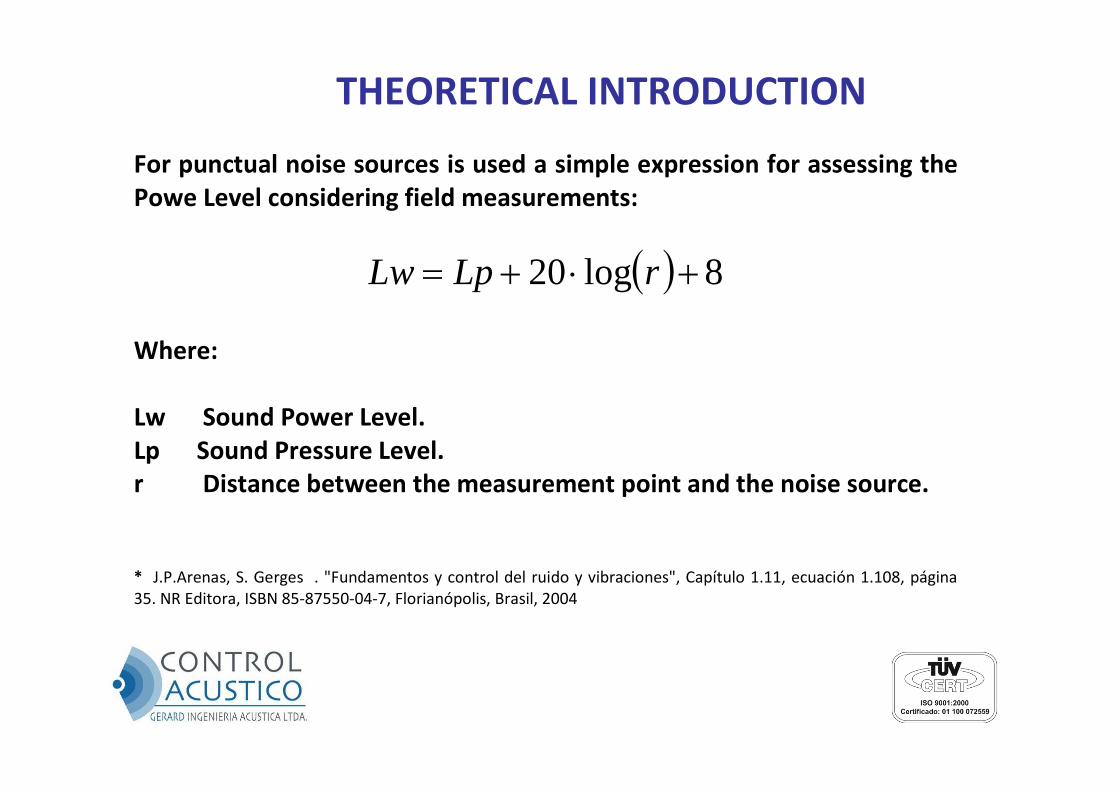
THEORETICAL INTRODUCTION
For punctual noise sources is used a simple expression for assessing thePowe Level considering field measurements:
8log20 rLpLw Where: Lw Sound Power Level. Lp Sound Pressure Level. r Distance between the measurement point and the noise source. * J.P.Arenas, S. Gerges . "Fundamentos y control del ruido y vibraciones", Capítulo 1.11, ecuación 1.108, página35. NR Editora, ISBN 85‐87550‐04‐7, Florianópolis, Brasil, 2004
METHODOLOGY
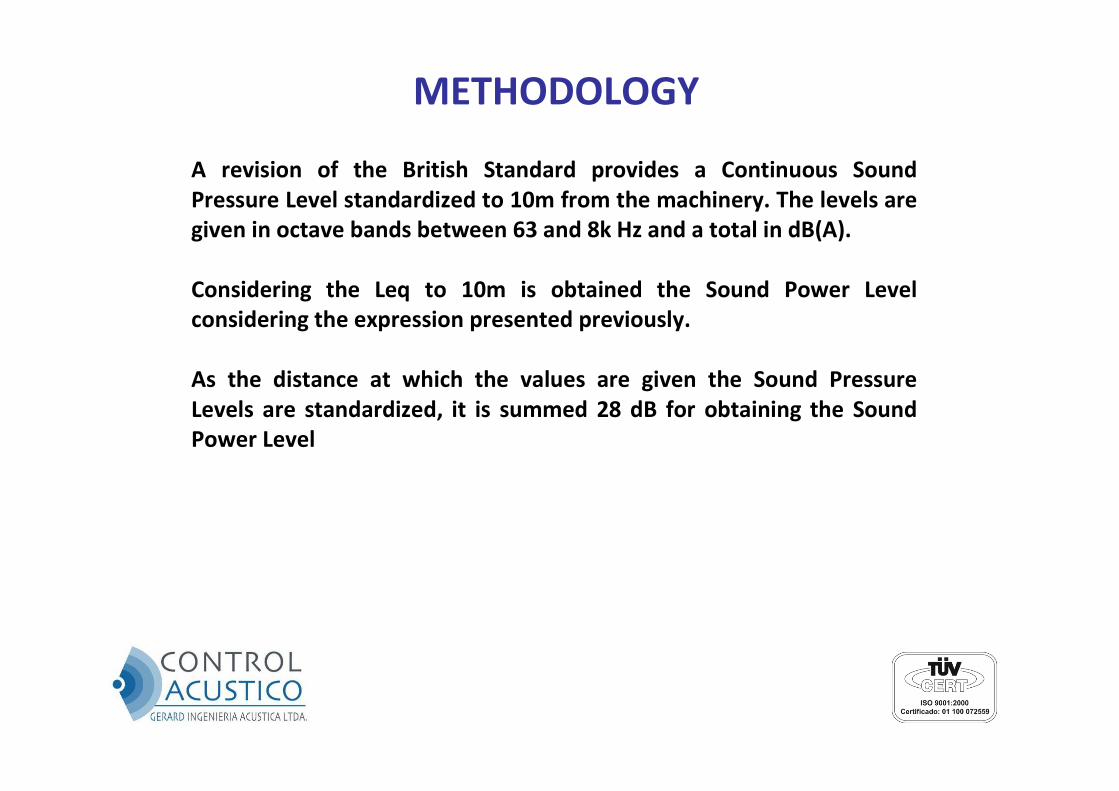
A revision of the British Standard provides a Continuous SoundPressure Level standardized to 10m from the machinery. The levels aregiven in octave bands between 63 and 8k Hz and a total in dB(A). Considering the Leq to 10m is obtained the Sound Power Levelconsidering the expression presented previously. As the distance at which the values are given the Sound PressureLevels are standardized, it is summed 28 dB for obtaining the SoundPower Level
METHODOLOGY
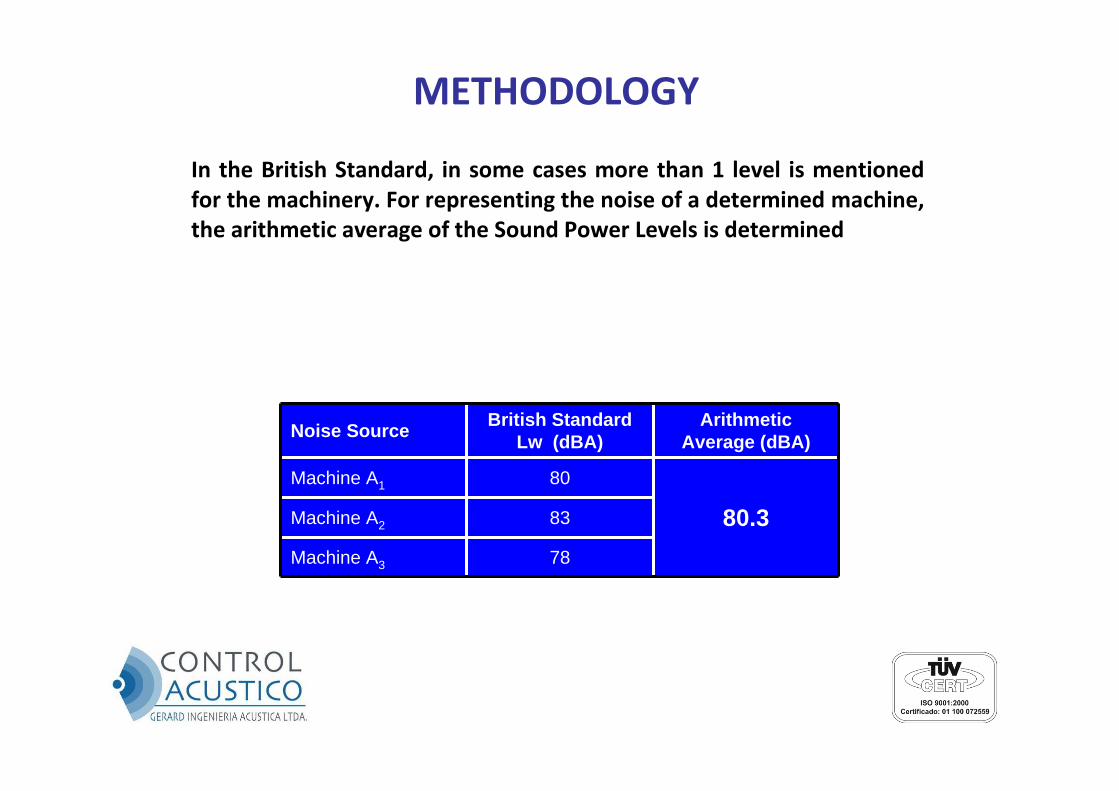
In the British Standard, in some cases more than 1 level is mentionedfor the machinery. For representing the noise of a determined machine,the arithmetic average of the Sound Power Levels is determined
Noise Source British Standard Lw (dBA)
ArithmeticAverage (dBA)
Machine A1 80
80.3Machine A2 83
Machine A3 78
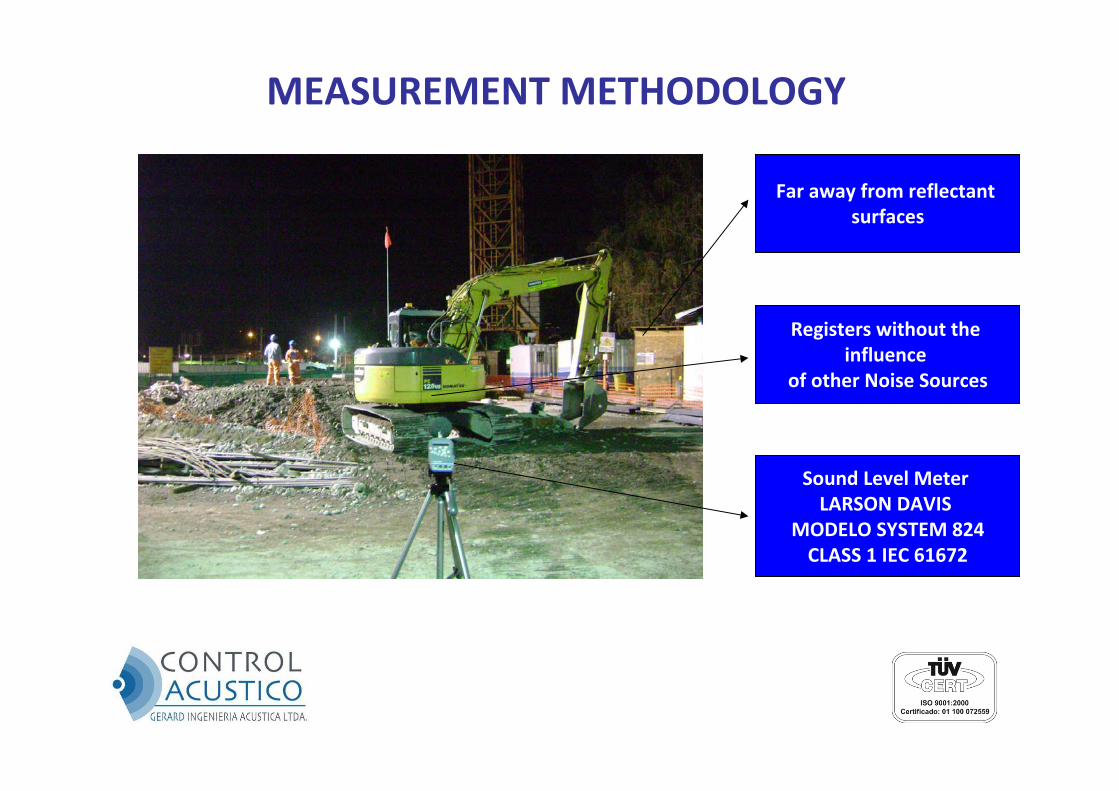
For the field SPL measurements, it was considered the following: Measurement equipment: Sound Level Meter Larson Davis Model
System 824 Class 1 according to the IEC 61672‐1:2002 standard. Evaluated projects: real‐state projects, hydroelectrical projects, and
construction of highways. Measurement conditions: the measurements were done in a point
far away enough from reflective surfaces and without the presenceof a second noise source that it could affect the results.
The measurements were collected between June 2008 and until
September 2009.
MEASUREMENT METHODOLOGY
MEASUREMENT METHODOLOGY
Far away from reflectantsurfaces
Registers without theinfluence
of other Noise Sources
Sound Level Meter LARSON DAVIS
MODELO SYSTEM 824CLASS 1 IEC 61672
EVALUATED EQUIPMENT
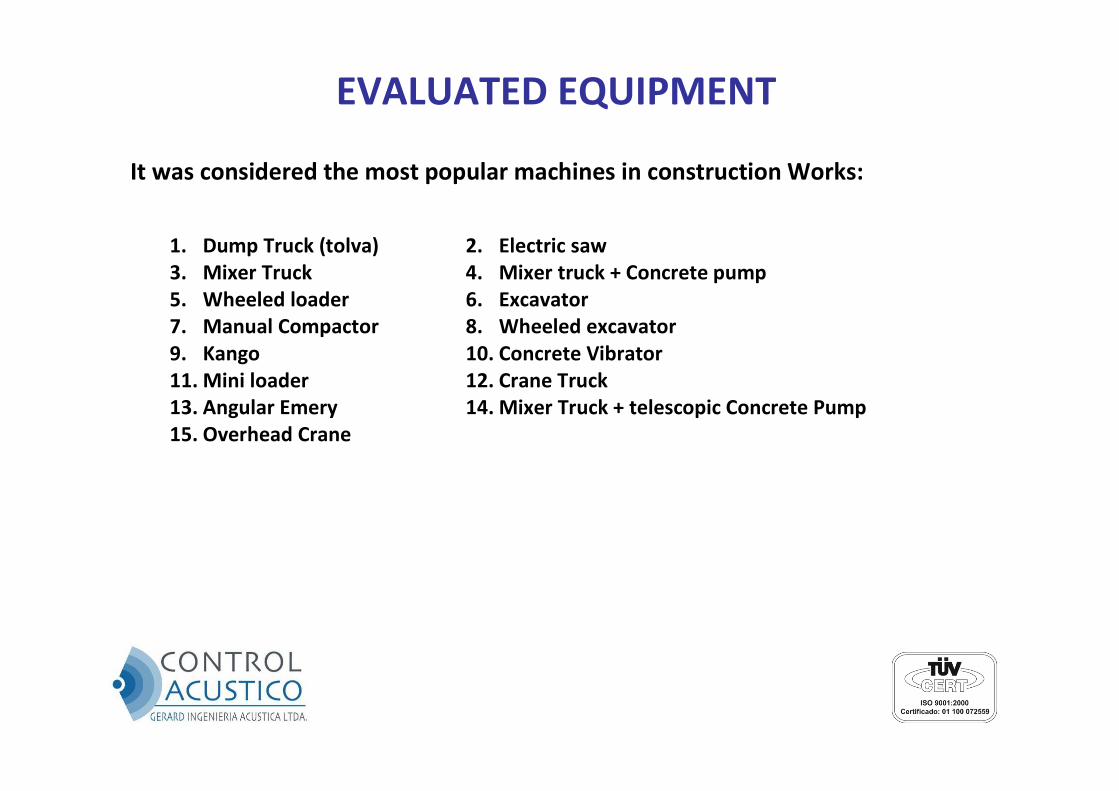
It was considered the most popular machines in construction Works:
1. Dump Truck (tolva) 2. Electric saw 3. Mixer Truck 4. Mixer truck + Concrete pump 5. Wheeled loader 6. Excavator 7. Manual Compactor 8. Wheeled excavator 9. Kango 10. Concrete Vibrator11. Mini loader 12. Crane Truck 13. Angular Emery 14. Mixer Truck + telescopic Concrete Pump 15. Overhead Crane
SOUND POWER OF THE EQUIPMENT
In the following slides are presented the Sound Power Levels fordifferent equipment using the standard and the field measurements:
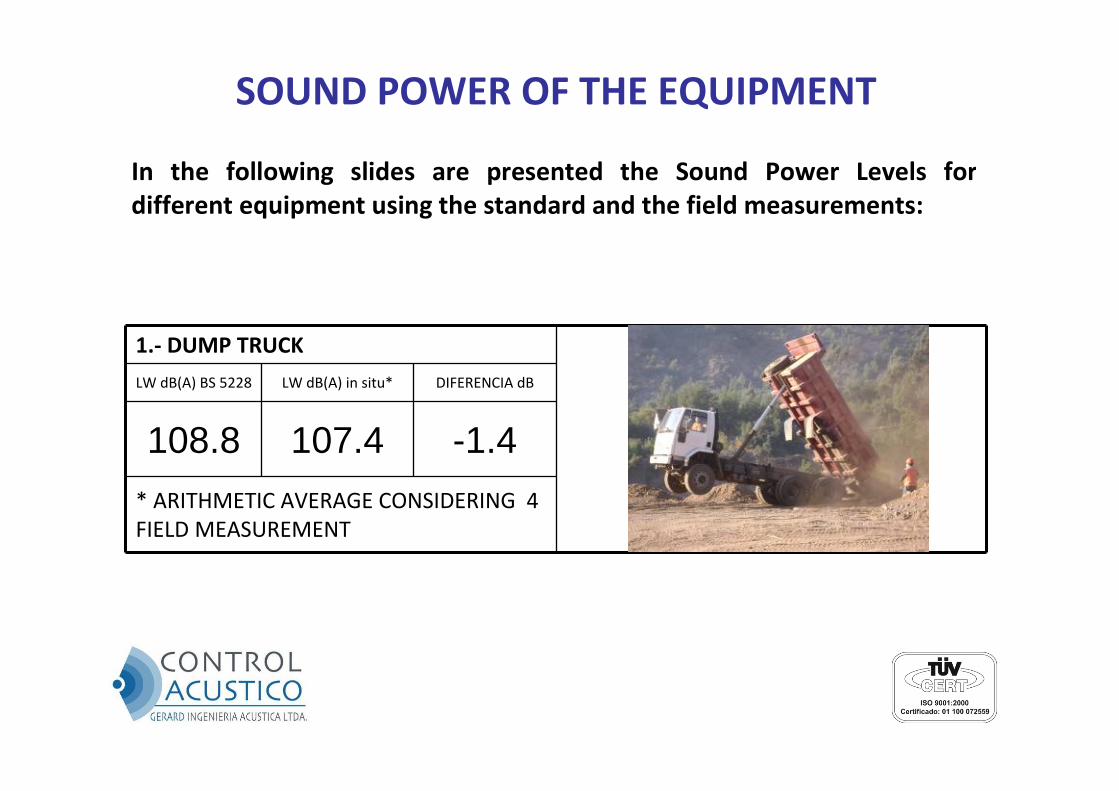
1.‐ DUMP TRUCK
LW dB(A) BS 5228 LW dB(A) in situ* DIFERENCIA dB
108.8 107.4 -1.4* ARITHMETIC AVERAGE CONSIDERING 4 FIELD MEASUREMENT
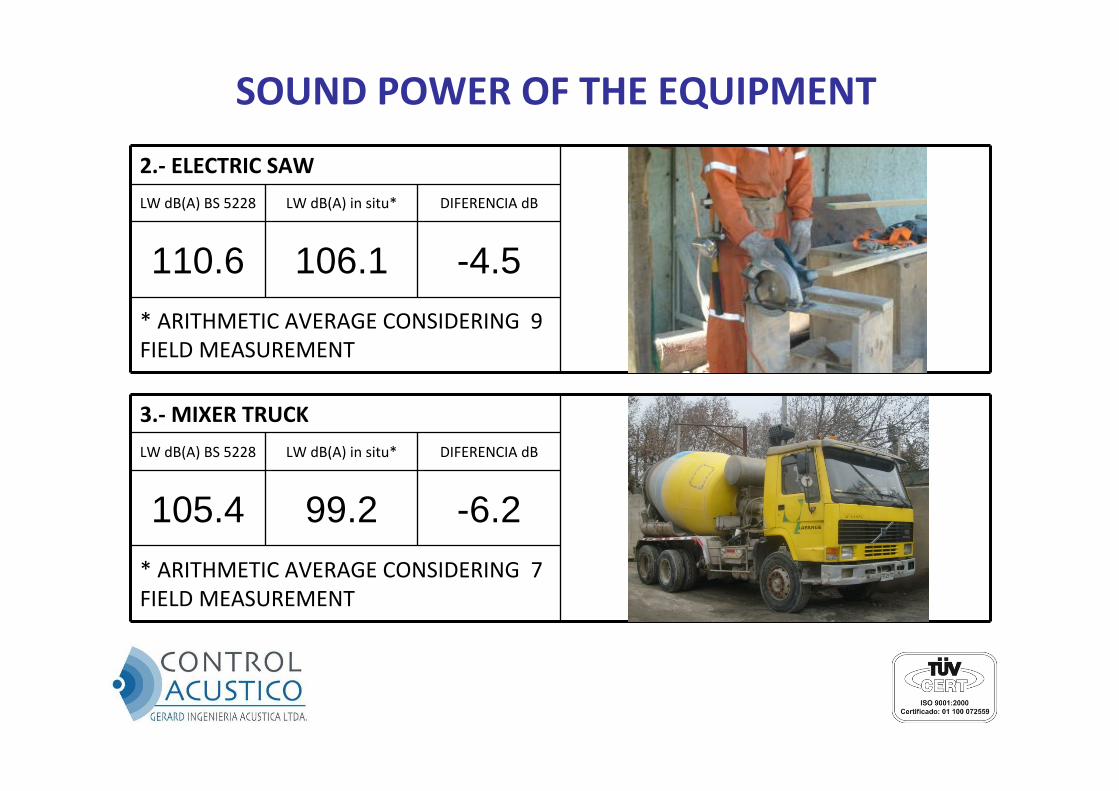
2.‐ ELECTRIC SAW
LW dB(A) BS 5228 LW dB(A) in situ* DIFERENCIA dB
110.6 106.1 -4.5* ARITHMETIC AVERAGE CONSIDERING 9 FIELD MEASUREMENT
3.‐MIXER TRUCK
LW dB(A) BS 5228 LW dB(A) in situ* DIFERENCIA dB
105.4 99.2 -6.2* ARITHMETIC AVERAGE CONSIDERING 7 FIELD MEASUREMENT
SOUND POWER OF THE EQUIPMENT
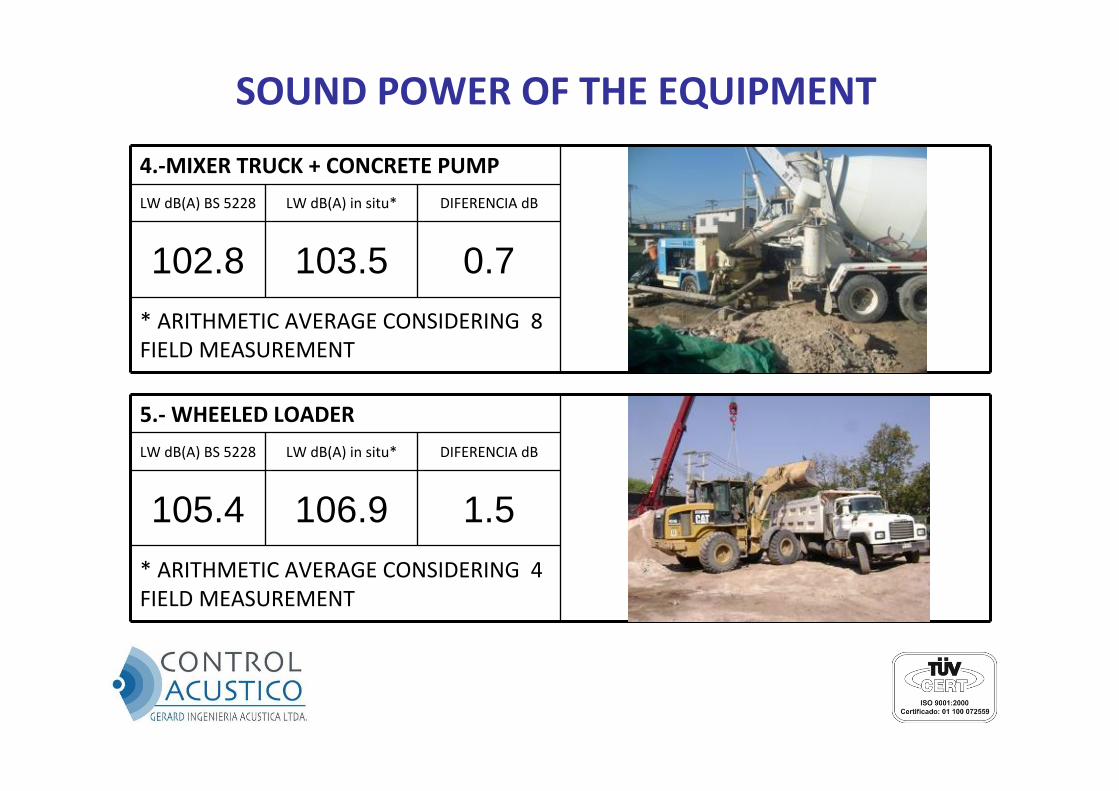
4.‐MIXER TRUCK + CONCRETE PUMP
LW dB(A) BS 5228 LW dB(A) in situ* DIFERENCIA dB
102.8 103.5 0.7* ARITHMETIC AVERAGE CONSIDERING 8 FIELD MEASUREMENT
5.‐WHEELED LOADER
LW dB(A) BS 5228 LW dB(A) in situ* DIFERENCIA dB
105.4 106.9 1.5* ARITHMETIC AVERAGE CONSIDERING 4 FIELD MEASUREMENT
SOUND POWER OF THE EQUIPMENT
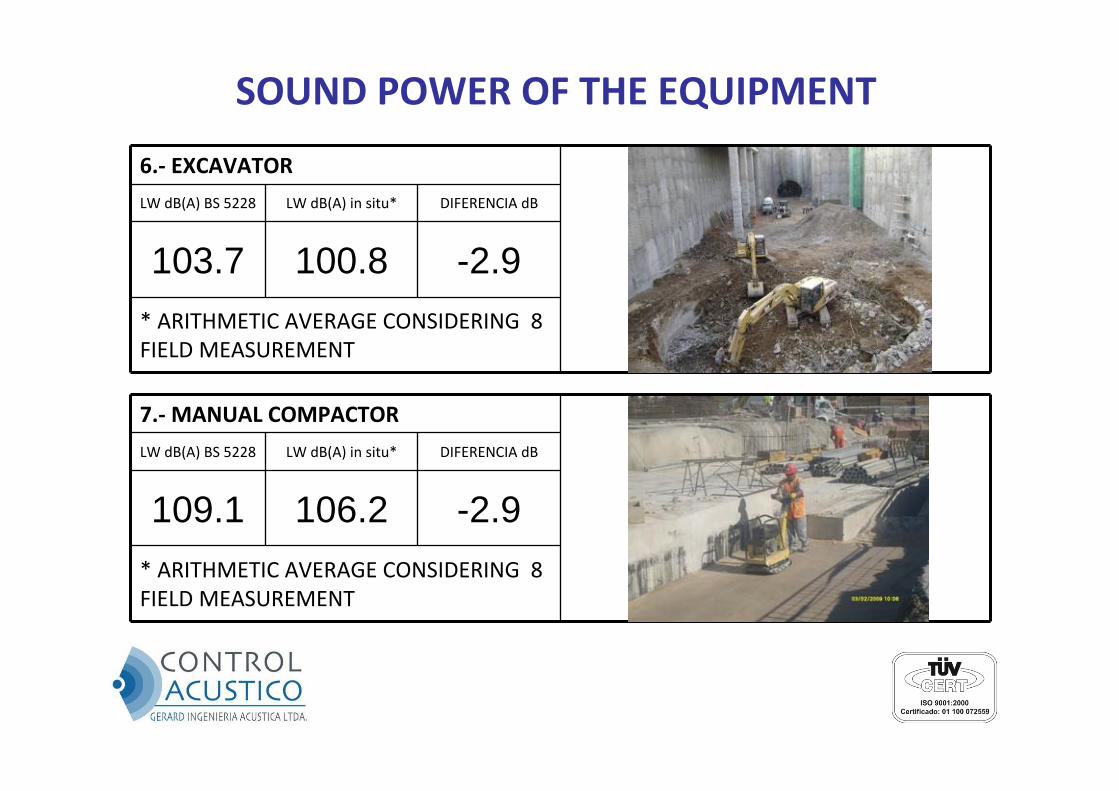
6.‐ EXCAVATOR
LW dB(A) BS 5228 LW dB(A) in situ* DIFERENCIA dB
103.7 100.8 -2.9* ARITHMETIC AVERAGE CONSIDERING 8 FIELD MEASUREMENT
7.‐MANUAL COMPACTOR
LW dB(A) BS 5228 LW dB(A) in situ* DIFERENCIA dB
109.1 106.2 -2.9* ARITHMETIC AVERAGE CONSIDERING 8 FIELD MEASUREMENT
SOUND POWER OF THE EQUIPMENT
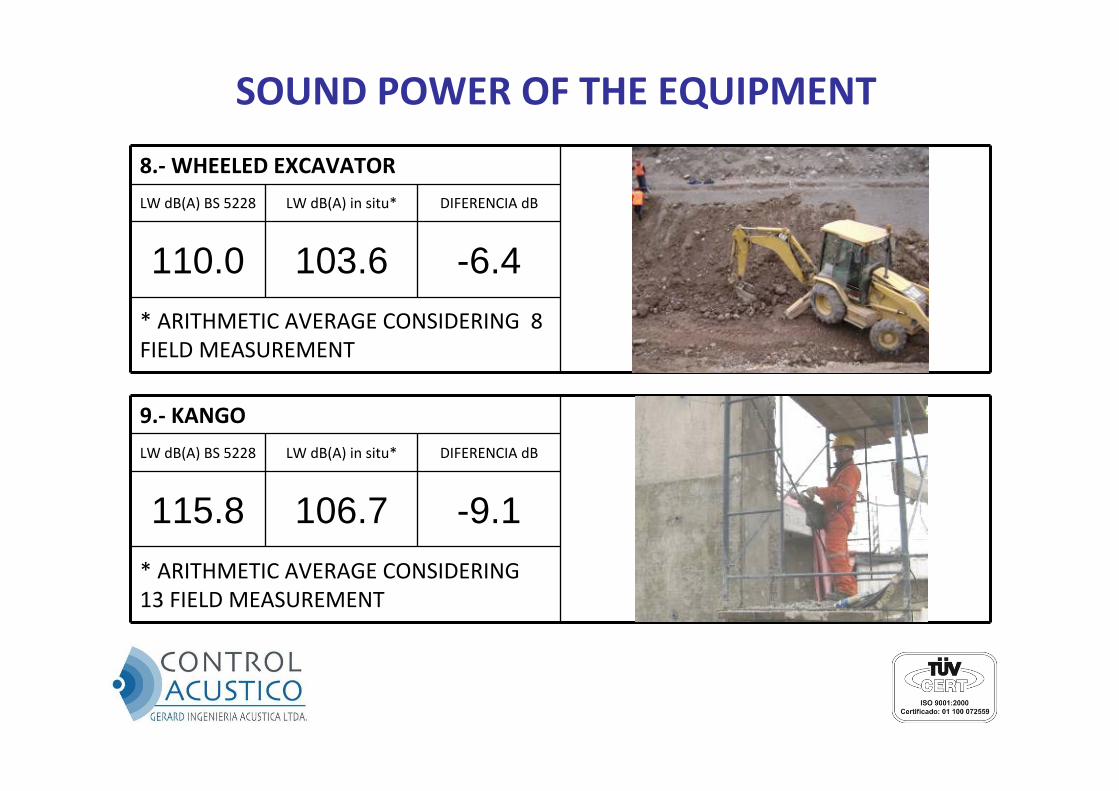
8.‐WHEELED EXCAVATOR
LW dB(A) BS 5228 LW dB(A) in situ* DIFERENCIA dB
110.0 103.6 -6.4* ARITHMETIC AVERAGE CONSIDERING 8 FIELD MEASUREMENT
9.‐ KANGO
LW dB(A) BS 5228 LW dB(A) in situ* DIFERENCIA dB
115.8 106.7 -9.1* ARITHMETIC AVERAGE CONSIDERING 13 FIELD MEASUREMENT
SOUND POWER OF THE EQUIPMENT
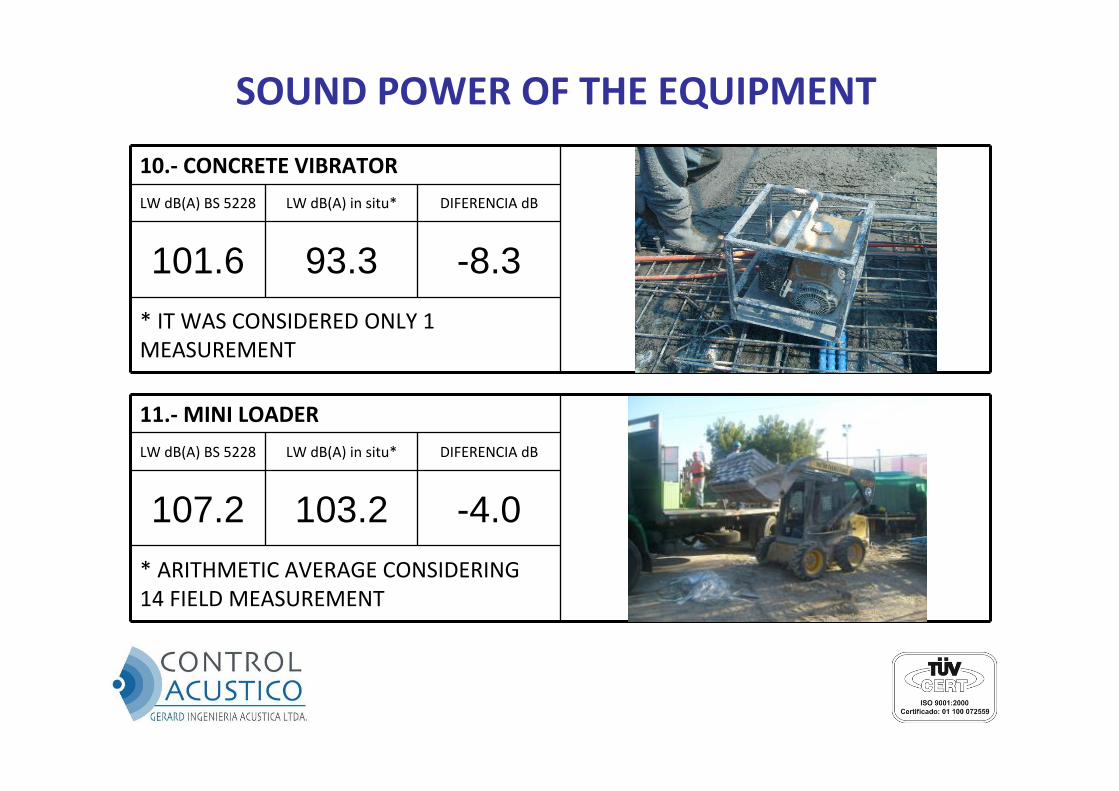
10.‐ CONCRETE VIBRATOR
LW dB(A) BS 5228 LW dB(A) in situ* DIFERENCIA dB
101.6 93.3 -8.3* IT WAS CONSIDERED ONLY 1 MEASUREMENT
11.‐MINI LOADER
LW dB(A) BS 5228 LW dB(A) in situ* DIFERENCIA dB
107.2 103.2 -4.0* ARITHMETIC AVERAGE CONSIDERING 14 FIELD MEASUREMENT
SOUND POWER OF THE EQUIPMENT
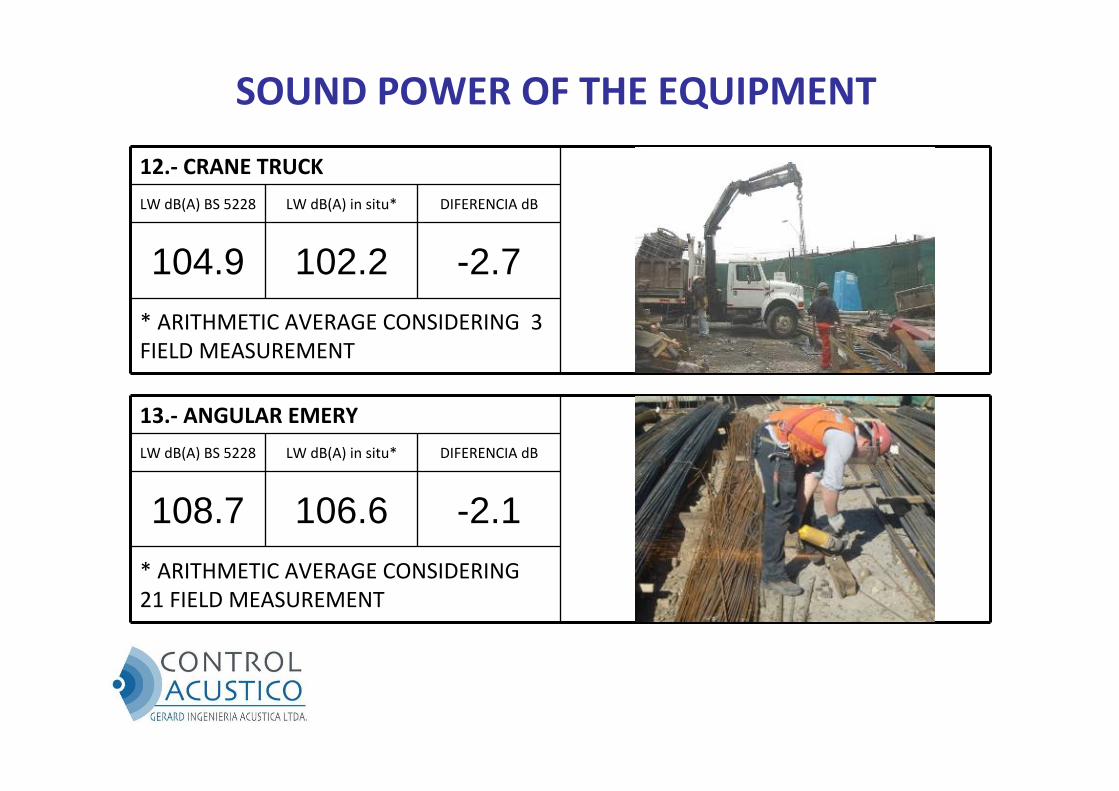
12.‐ CRANE TRUCK
LW dB(A) BS 5228 LW dB(A) in situ* DIFERENCIA dB
104.9 102.2 -2.7* ARITHMETIC AVERAGE CONSIDERING 3 FIELD MEASUREMENT
13.‐ ANGULAR EMERY
LW dB(A) BS 5228 LW dB(A) in situ* DIFERENCIA dB
108.7 106.6 -2.1* ARITHMETIC AVERAGE CONSIDERING 21 FIELD MEASUREMENT
SOUND POWER OF THE EQUIPMENT
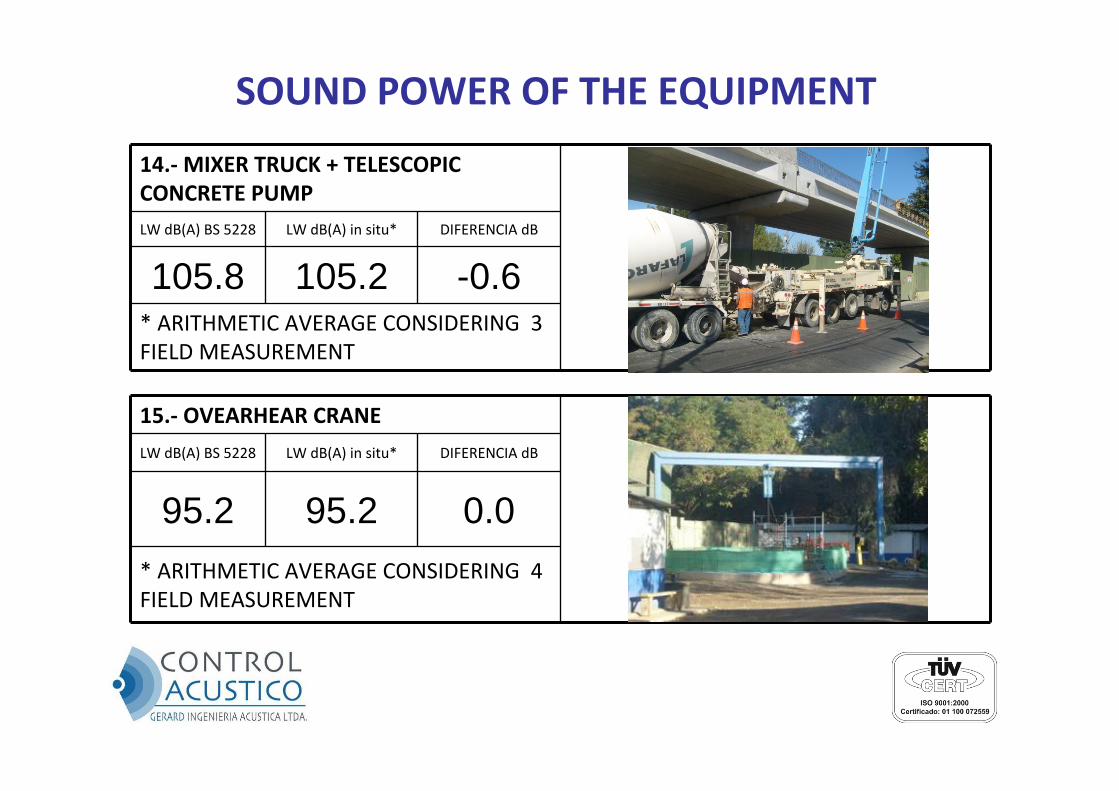
14.‐MIXER TRUCK + TELESCOPIC CONCRETE PUMPLW dB(A) BS 5228 LW dB(A) in situ* DIFERENCIA dB
105.8 105.2 -0.6* ARITHMETIC AVERAGE CONSIDERING 3 FIELD MEASUREMENT
15.‐ OVEARHEAR CRANE
LW dB(A) BS 5228 LW dB(A) in situ* DIFERENCIA dB
95.2 95.2 0.0* ARITHMETIC AVERAGE CONSIDERING 4 FIELD MEASUREMENT
SOUND POWER OF THE EQUIPMENT
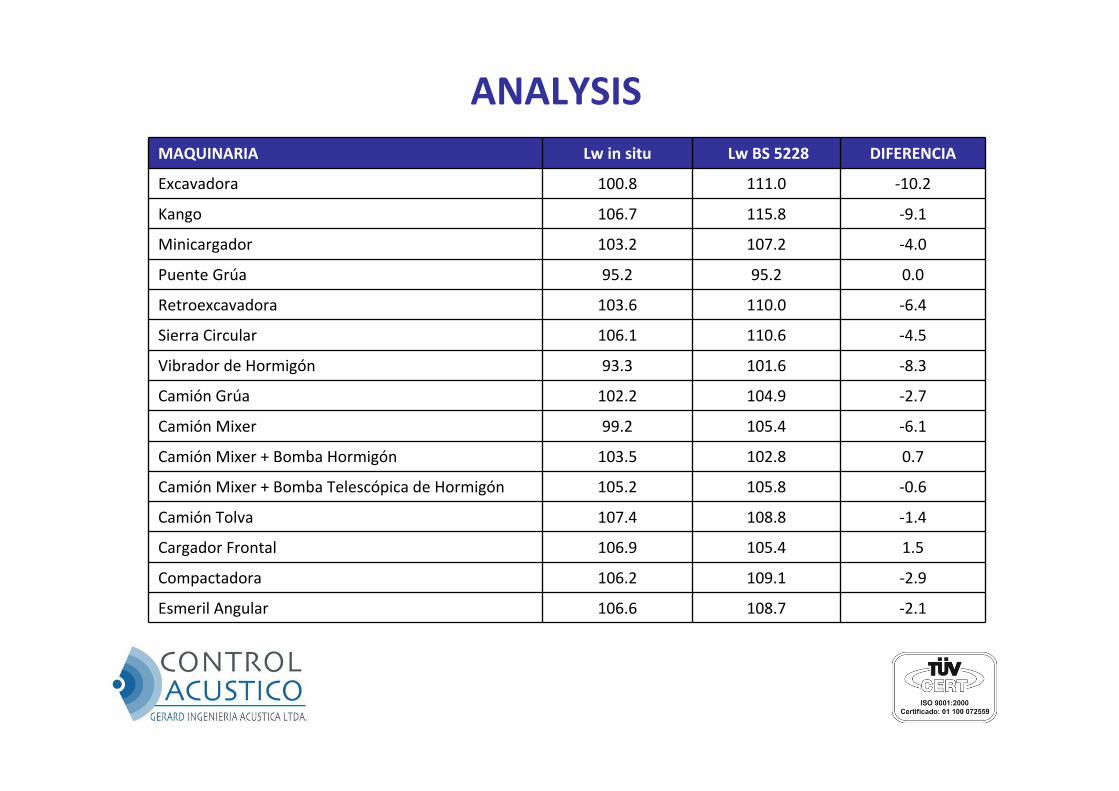
ANALYSISMAQUINARIA Lw in situ Lw BS 5228 DIFERENCIA
Excavadora 100.8 111.0 ‐10.2
Kango 106.7 115.8 ‐9.1
Minicargador 103.2 107.2 ‐4.0
Puente Grúa 95.2 95.2 0.0
Retroexcavadora 103.6 110.0 ‐6.4
Sierra Circular 106.1 110.6 ‐4.5
Vibrador de Hormigón 93.3 101.6 ‐8.3
Camión Grúa 102.2 104.9 ‐2.7
Camión Mixer 99.2 105.4 ‐6.1
Camión Mixer + Bomba Hormigón 103.5 102.8 0.7
Camión Mixer + Bomba Telescópica de Hormigón 105.2 105.8 ‐0.6
Camión Tolva 107.4 108.8 ‐1.4
Cargador Frontal 106.9 105.4 1.5
Compactadora 106.2 109.1 ‐2.9
Esmeril Angular 106.6 108.7 ‐2.1
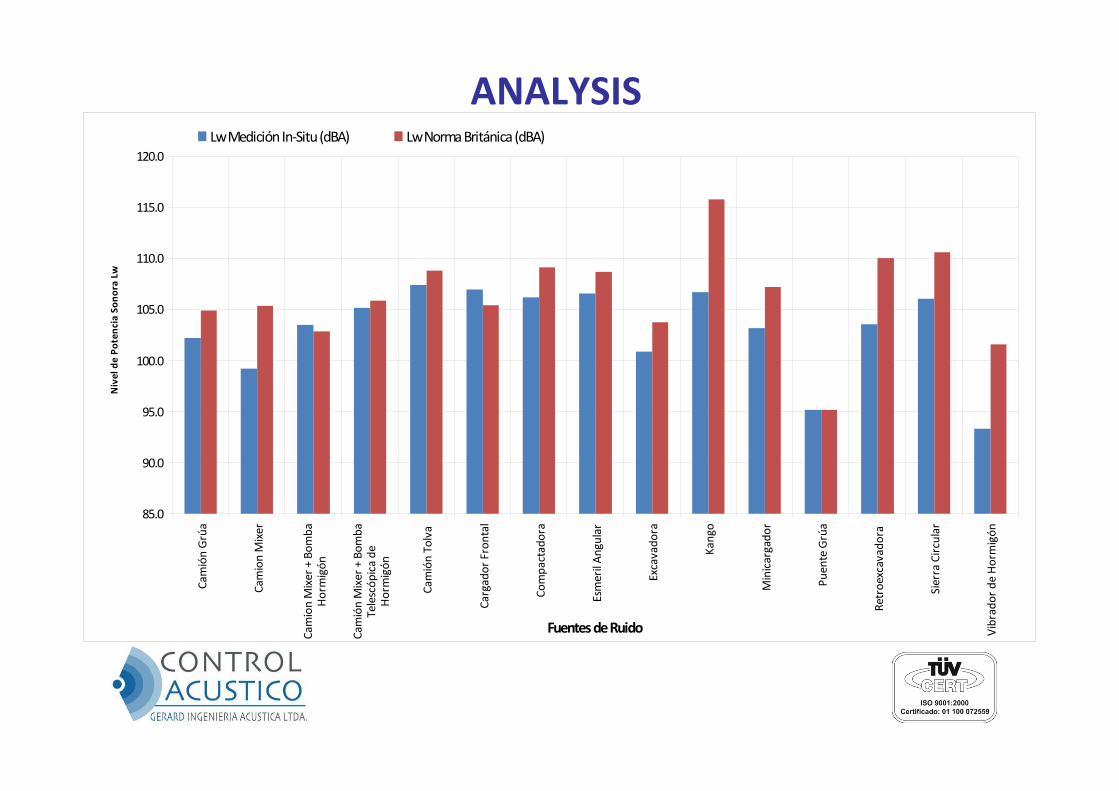
ANALYSIS
85.0
90.0
95.0
100.0
105.0
110.0
115.0
120.0
Camión Grúa
Camion Mixer
Camion Mixer + Bom
baHormigón
Camión Mixer + Bom
baTelescóp
ica de
Hormigón
Camión Tolva
Cargador Frontal
Compactadora
Esmeril Angular
Excavado
ra
Kango
Minicargado
r
Puente Grúa
Retroexcavadora
Sierra Circular
Vibrado
r de
Hormigón
Fuentes de Ruido
Nivel de Po
tencia Son
ora Lw
Lw Medición In‐Situ (dBA) Lw Norma Británica (dBA)
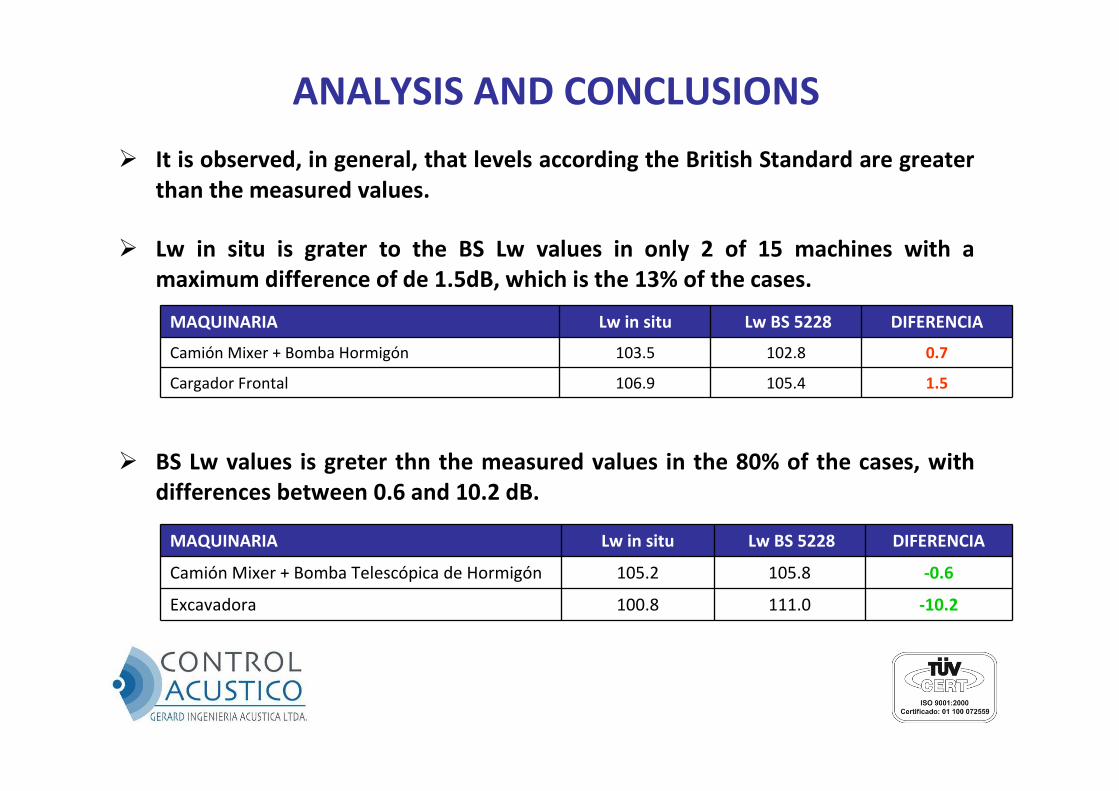
ANALYSIS AND CONCLUSIONS It is observed, in general, that levels according the British Standard are greater
than the measured values.
Lw in situ is grater to the BS Lw values in only 2 of 15 machines with amaximum difference of de 1.5dB, which is the 13% of the cases.
BS Lw values is greter thn the measured values in the 80% of the cases, with
differences between 0.6 and 10.2 dB.
MAQUINARIA Lw in situ Lw BS 5228 DIFERENCIA
Camión Mixer + Bomba Hormigón 103.5 102.8 0.7
Cargador Frontal 106.9 105.4 1.5
MAQUINARIA Lw in situ Lw BS 5228 DIFERENCIA
Camión Mixer + Bomba Telescópica de Hormigón 105.2 105.8 ‐0.6
Excavadora 100.8 111.0 ‐10.2
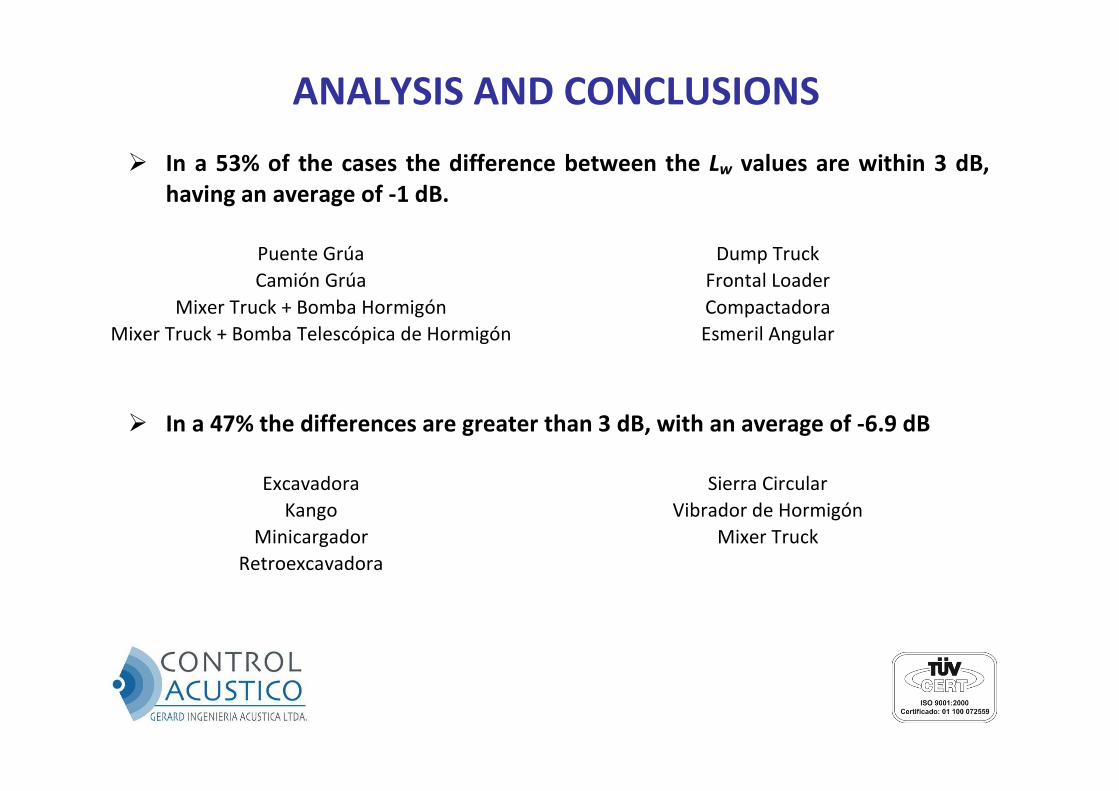
ANALYSIS AND CONCLUSIONS In a 53% of the cases the difference between the Lw values are within 3 dB,
having an average of ‐1 dB.
Puente Grúa Dump Truck Camión Grúa Frontal Loader
Mixer Truck + Bomba Hormigón Compactadora Mixer Truck + Bomba Telescópica de Hormigón Esmeril Angular
In a 47% the differences are greater than 3 dB, with an average of ‐6.9 dB
Excavadora Sierra Circular
Kango Vibrador de Hormigón Minicargador Mixer Truck
Retroexcavadora
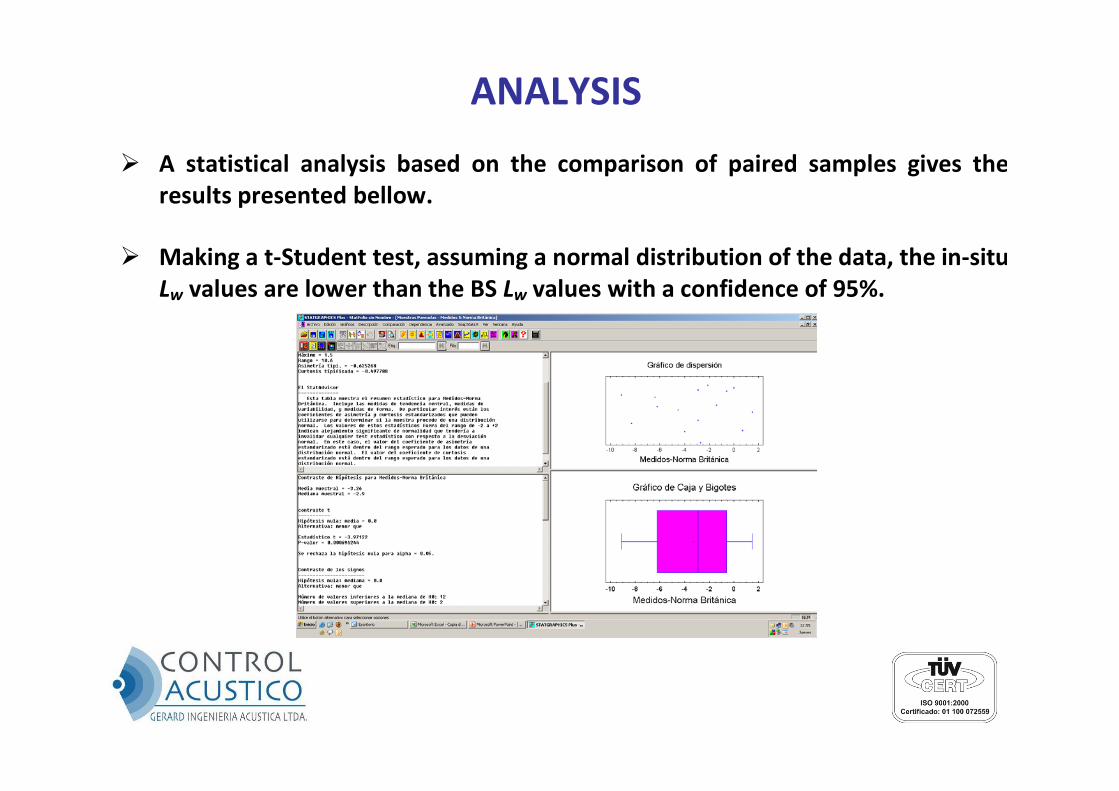
A statistical analysis based on the comparison of paired samples gives theresults presented bellow.
Making a t‐Student test, assuming a normal distribution of the data, the in‐situLw values are lower than the BS Lw values with a confidence of 95%.
ANALYSIS
CONCLUSIONS AND RECOMMENDATIONS
The values used by Control Acústico from the British Standard BS 5228“Noise and vibration control on construction and open sites”considering its revisión (2004), are statistically greater than the valuesmeasured in Chilean construction projects. The British Standard is considered appropriate for representing theSound Power Levels considering a condition of noisy emissions(considering a considerable security factor).
CONCLUSIONS AND RECOMMENDATIONS
It is important to continue with measurements for increasing thecertainty of the analysis: some cases were evaluated with a lowquantity of measurements. It was compared the assessed Lw values in Chilean construction workswith an international databases for comparing their correlations. As future work it would be desirable to perform an octave or one‐thirdoctave band analysis.

Gracias
2nd Pan-American and Iberian Meeting on AcousticsCancún, México, 15-19 November 2010