2010-03-01 Park DuValle Health Center Analysis 2008
28
The Park DuValle Community Health Centers Patient Characteristics in 2008 February 10, 2010 In Touch Information Services 1
-
Upload
margaret-maginnis -
Category
Documents
-
view
31 -
download
1
Transcript of 2010-03-01 Park DuValle Health Center Analysis 2008

The Park DuValle Community Health Centers
Patient Characteristics in 2008
February 10, 2010 In Touch Information Services 1

The Park DuValle Community Health Centers
The Distribution and Characteristics
of Patients in 2008
• Introduction and overview of the research
• Key findings for the general patient population in two geographic areas;
1) Louisville Metro
2) Louisville Metro and surrounding counties
• Key findings for pediatric patients in Louisville Metro and surrounding counties
• Key findings for each Park DuValle Health Center in 2008
• Stand-alone maps, charts and tables for every section of the analysis
• SPSS file of all geocoded patient records with 2000 Census Tracts added
February 10, 2010 In Touch Information Services 2
In the Beginning In the early 1960's, the residents of the Park DuValle community began to voice their concern for the lack of medical services provided to this area. At that time the only health care, other than private physicians, was General Hospital. It was located in the east end of town and public transportation was unavailable after 5:00 p.m. These primarily medically indigent residents began to work with several civic-minded groups to make their dreams a reality. A coalition of residents, led by community activist, the late Vernice Hunter, along with the American Friends Service Committee (AFSC), approached the city government about its concerns. Due to these efforts, several buildings in the Cotter Homes subsidized housing area were designated by the City to house the new Health Care facility. Federal Office of Economic Opportunity funding was secured and in 1968 Dr. Harvey I. Sloane became the Center's first Director and provided direction for this most important and sensitive endeavor. Change of Name In January 1987, the Board of Directors of The Neighborhood Health Center, Inc. elected to change the Center's name. The name "Park DuValle Community Health Center, Inc." was selected because it both described the types of services provided at the Center and its location within the community. Growth and Expansion In 1982, the Neighborhood Health Center was asked to open a satellite location to serve the Rural population in Spencer County, Kentucky. So, in 1984, the Spencer County Rural Health Clinic began operating in Taylorsville , KY. It is now known as Park DuValle at Spencer County . In 1985, the Center joined with Family Health Center-Portland and the Louisville and Jefferson County Board of Health to work jointly on establishing more primary health care services in the community. As a result, The Neighborhood Health Center established two more satellite locations. The Community Health Center of West Louisville opened in 1986 at 26 th & Madison and now operates as Park DuValle at City View near downtown in the newly renovated City View Park complex (formerly the old Village West Mall). The Newburg Primary Care Center was opened in the Newburg area in 1987. It is now operated at a newly remodeled location on Hikes Lane as Park DuValle at Newburg. Since 1968, the main health center of Park DuValle had been located in two converted Cotter Homes apartment buildings. In July 2002, Park DuValle Community Health Center began operating in a newly constructed, state-of-the-art $6 million facility located at 3015 Wilson Ave. among the Park DuValle Hope VI Revitalization Development. The federal government through the U.S. Department of Health and Human Services, continues to support the operation of Park DuValle Community Health Center, Inc. in order to provide high quality health services to patients living in medically underserved communities. The cost of health care provided by Park DuValle Community Health Center is based on your ability to pay and a sliding fee scale continues to be available to income eligible patients. With the new facility at our main location and extended health care services being offered through our three satellite locations, Park DuValle Community Health Center has entered a new era of modern health care service delivery. We are all about caring for our community.
The Park DuValle Community Health Centers
February 10, 2010 In Touch Information Services 3
Introduction:

• The scope of the study includes a descriptive analysis of the distribution and characteristics of patients who accessed the Park DuValle Family Health Centers in 2008.
• The analysis is framed according to two geographic areas;
(1) patients in Louisville Metro,
(2) patients in Louisville Metro and surrounding counties.
• The study examines characteristics of the patient population by age, race, gender and method of payment.
• Analysis focuses on each geographic area and includes an additional examination of the pediatric patient population 0 to 17 years.
Scope of the Study
Overview:
February 10, 2010 In Touch Information Services 4
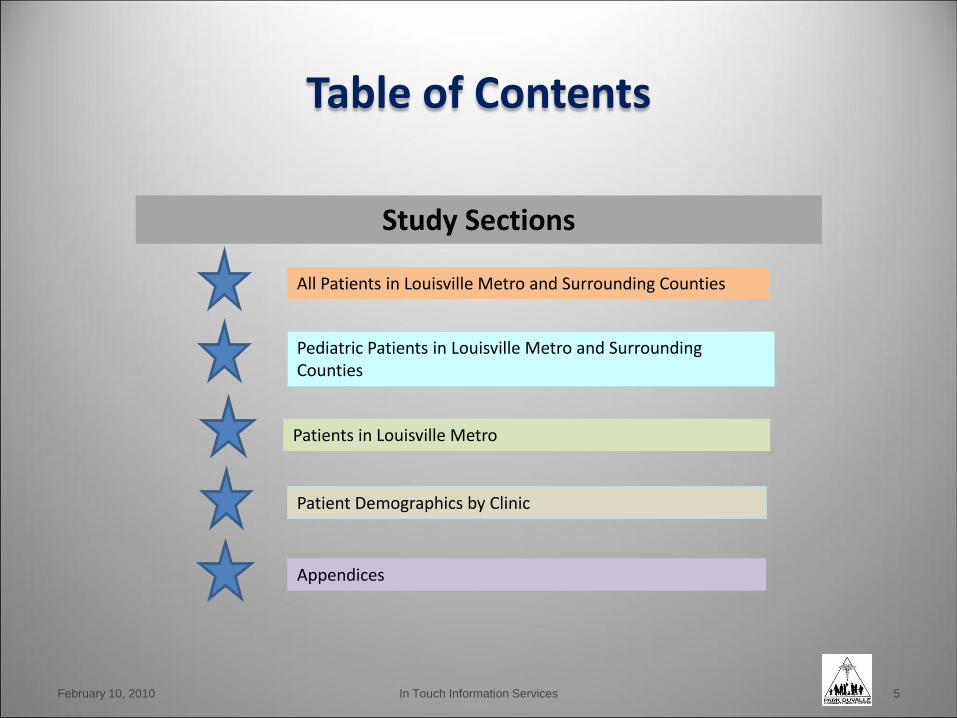
All Patients in Louisville Metro and Surrounding Counties
Patients in Louisville Metro
Pediatric Patients in Louisville Metro and Surrounding Counties
Appendices
Study Sections
Table of Contents
Patient Demographics by Clinic
February 10, 2010 In Touch Information Services 5

Geographic Distribution of All Patients Louisville Metro and Surrounding Counties in 2008; N = 19,370, Average Age = 31
February 10, 2010 In Touch Information Services 6
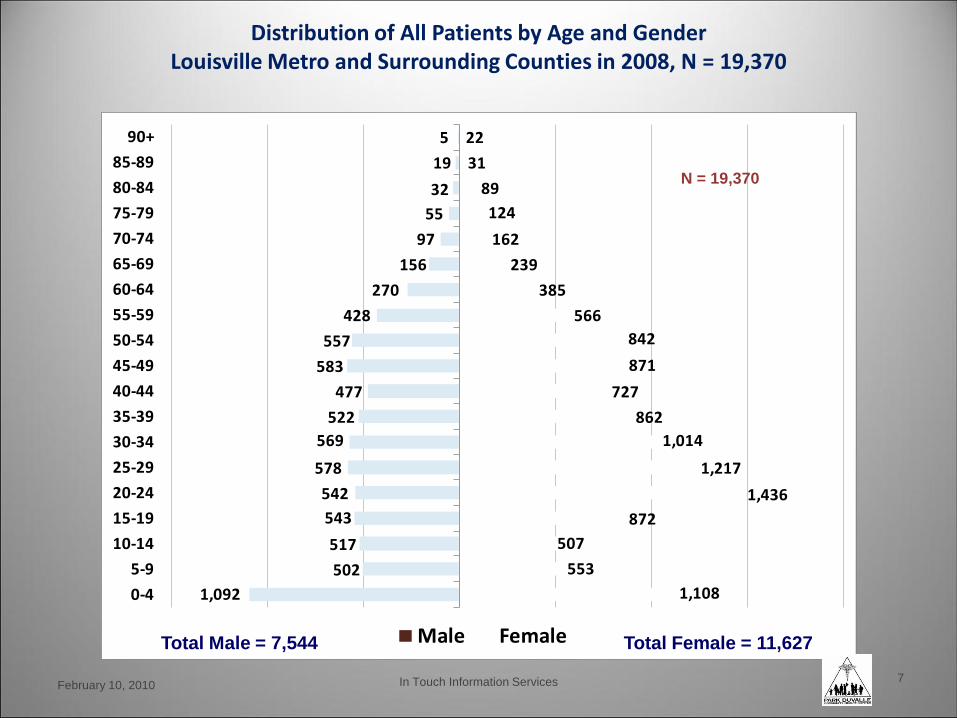
1,092
502
517
543
542
578
569
522
477
583
557
428
270
156
97
55
32
19
5
1,108
553
507
872
1,436
1,217
1,014
862
727
871
842
566
385
239
162
124
89
31
22
0-4
5-9
10-14
15-19
20-24
25-29
30-34
35-39
40-44
45-49
50-54
55-59
60-64
65-69
70-74
75-79
80-84
85-89
90+
Male Female
February 10, 2010 In Touch Information Services 7
Total Male = 7,544 Total Female = 11,627
Distribution of All Patients by Age and Gender Louisville Metro and Surrounding Counties in 2008, N = 19,370
N = 19,370
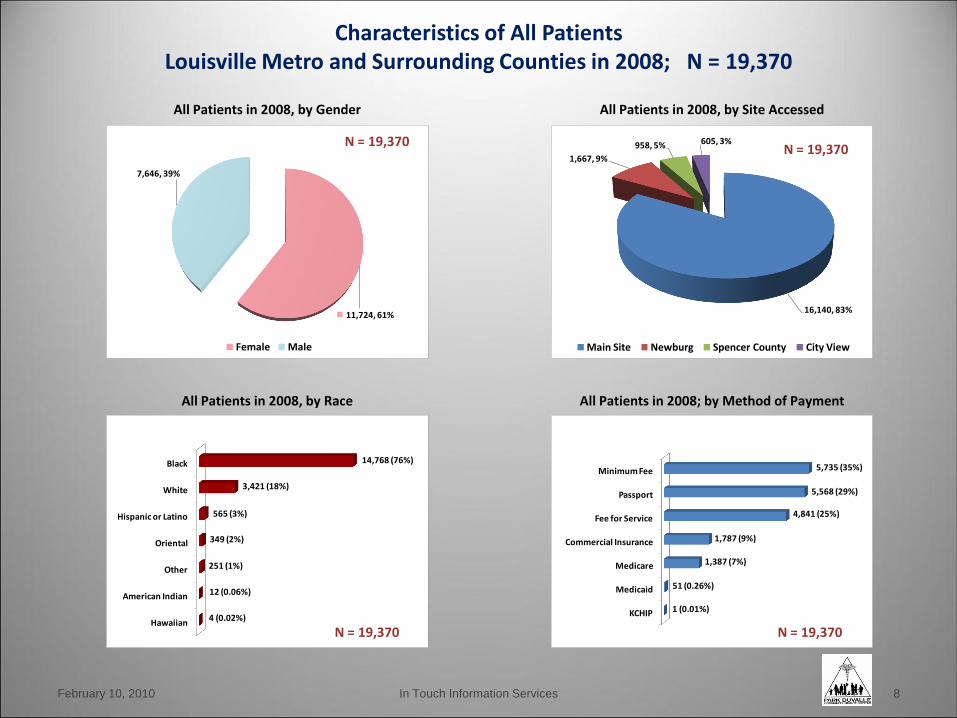
Hawaiian
American Indian
Other
Oriental
Hispanic or Latino
White
Black
4 (0.02%)
12 (0.06%)
251 (1%)
349 (2%)
565 (3%)
3,421 (18%)
14,768 (76%)
11,724, 61%
7,646, 39%
Female Male
Characteristics of All Patients Louisville Metro and Surrounding Counties in 2008; N = 19,370
N = 19,370
All Patients in 2008, by Site Accessed All Patients in 2008, by Gender
All Patients in 2008, by Race All Patients in 2008; by Method of Payment
February 10, 2010 In Touch Information Services 8
N = 19,370
16,140, 83%
1,667, 9%
958, 5% 605, 3%
Main Site Newburg Spencer County City View
N = 19,370
KCHIP
Medicaid
Medicare
Commercial Insurance
Fee for Service
Passport
Minimum Fee
1 (0.01%)
51 (0.26%)
1,387 (7%)
1,787 (9%)
4,841 (25%)
5,568 (29%)
5,735 (35%)
N = 19,370

Geographic Distribution of Pediatric Patients 0 to 17 Years,
Louisville Metro and Surrounding Counties in 2008; N = 5,222 (27% of all patients)
February 10, 2010 In Touch Information Services 9

KCHIP
Medicaid
Medicare
Commercial Insurance
Fee for Service
Minimum Fee
Passport
1 (0.02%)
6 (0.11%)
42 (1%)
360 (7%)
621 (12%)
1,048 (20%)
3,144 (60%)
10
N = 5,222
February 10, 2010 In Touch Information Services
2,680, 51%
2,542, 49%
Female Male
N = 5,222
All Pediatric Patients 2008, by Site Accessed All Pediatric Patients 2008, by Gender
All Pediatric Patients 2008, by Race All Pediatric Patients 2008; by Method of Payment
4,426, 85%
599, 11%157, 3%
40, 1%
Main Site Newburg Spencer County City View
N = 5,222
Hawaiian
American Indian
Oriental
Other
Hispanic or Latino
White
Black
1 (0.02%)
4 (0.08%)
93 (2%)
101 (2%)
158 (3%)
515 (10%)
4,350 (83%)
N = 5,222
Characteristics of Pediatric Patients 0 to 17 Years, Louisville Metro and Surrounding Counties in 2008; N = 5,222 (27% of all patients)
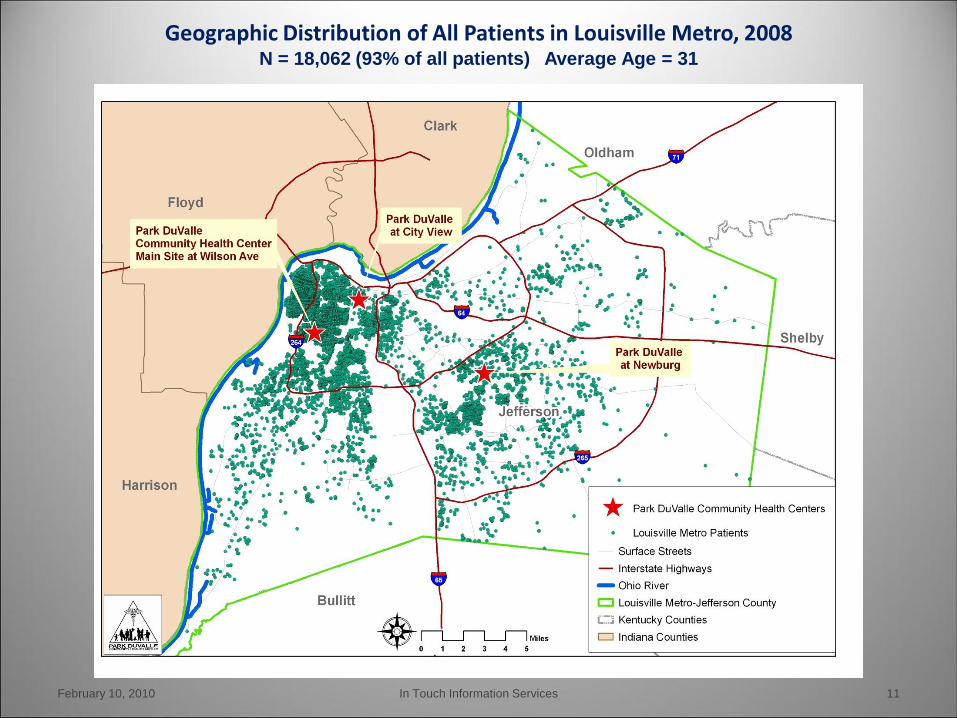
Geographic Distribution of All Patients in Louisville Metro, 2008 N = 18,062 (93% of all patients) Average Age = 31
February 10, 2010 In Touch Information Services 11
0-4
5-9
10-14
15-19
20-24
25-29
30-34
35-39
40-44
45-49
50-54
55-59
60-64
65-69
70-74
75-79
80-84
85-89
90+
1,077
617
482
826
1,360
1,150
941
778
647
796
756
514
328
214
150
115
86
30
21
1,072
587
488
508
512
534
537
481
446
542
513
386
242
135
86
47
31
17
5
MALE FEMALE
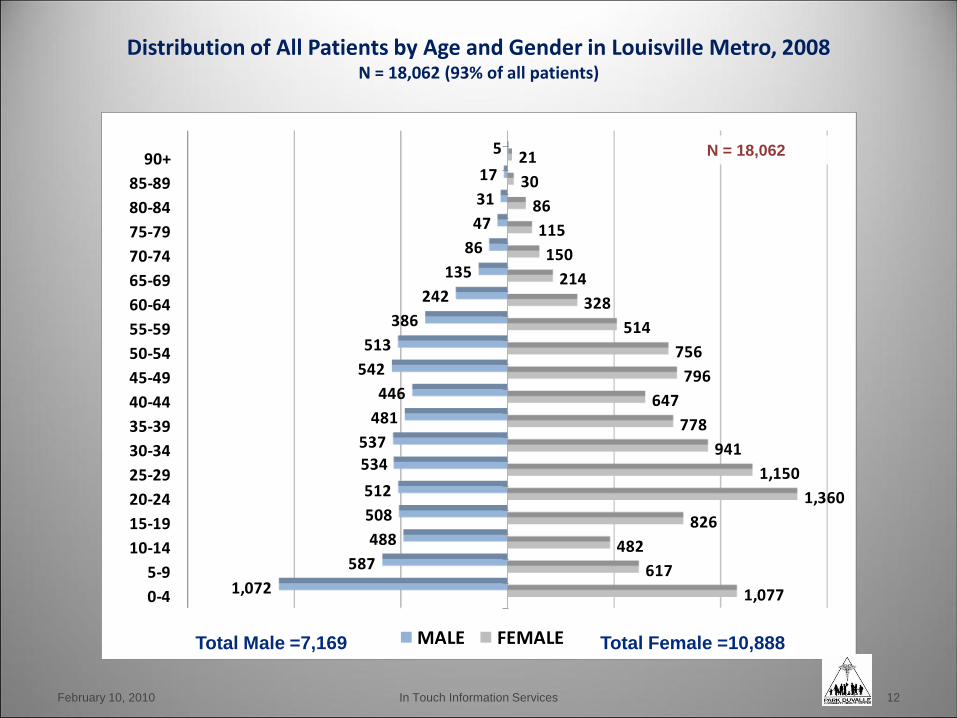
Distribution of All Patients by Age and Gender in Louisville Metro, 2008
N = 18,062 (93% of all patients)
N = 18,062
February 10, 2010 In Touch Information Services 12
Total Male =7,169 Total Female =10,888

KCHIP
Medicaid
Medicare
Commercial Insurance
Fee for Service
Minimum Fee
Passport
1 (0.02%)
6 (0.11%)
42 (1%)
360 (7%)
621 (12%)
1,048 (20%)
3,144 (60%)
15,776, 87%
1,635, 9%581, 3% 70, 1%
Main Site Newburg City View Spencer County
Characteristics of All Patients in Louisville Metro, 2008 N = 18,062 (93% of all patients)
February 10, 2010 In Touch Information Services 13
N = 18,062
N = 18,062
10,893, 60%
7,169, 40%
Female Male
Hawaiian
American Indian
Other
Oriental
Hispanic or Latino
White
Black
3 (0.02%)
12 (0.07%)
223 (1%)
328 (2%)
491 (3%)
2,421 (13%)
14,584 (81%)
All Patients in Louisville Metro 2008, by Site Accessed All Patients in Louisville Metro 2008, by Gender
All Patients in Louisville Metro 2008, by Race All Patients in Louisville Metro 2008; by Method of Payment
N = 18,062
N = 18,062

February 10, 2010 In Touch Information Services 14
Patient Characteristics at Individual Centers
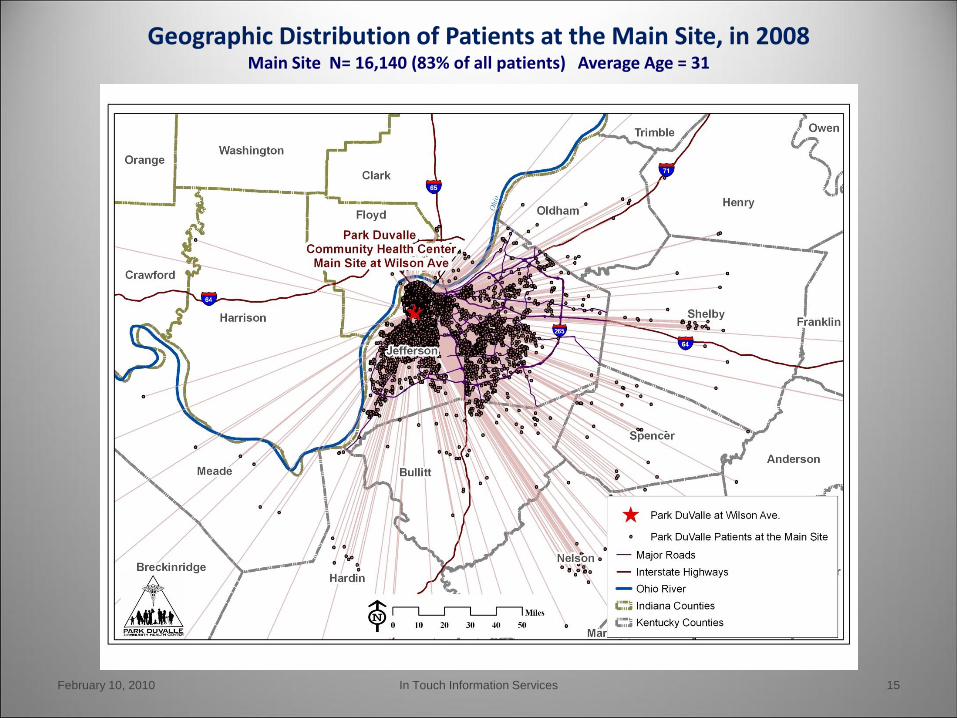
Geographic Distribution of Patients at the Main Site, in 2008 Main Site N= 16,140 (83% of all patients) Average Age = 31
February 10, 2010 In Touch Information Services 15

KCHIP
Medicaid
Medicare
Commercial Insurance
Fee for Service
Passport
Minimum Fee
1 (0.006%)
45 (0.3%)
1,221 (8%)
1,546 (10%)
4,094 (25%)
4,613 (29%)
4,620 (29%)
Characteristics of Patients at the Main Site in 2008; N = 16,140 (83% of all patients) Patients Who Accessed the Park DuValle Community Health Center at Main Site; 2008
N = 16,140
February 10, 2010 In Touch Information Services 16
Patients at the Main Site in 2008, by Age and Gender Patients at the Main Site in 2008, by Gender
Patients at the Main Site in 2008, by Race Patients at the Main Site in 2008; by Method of Payment
9,569, 59%
6,571, 41%
Female Male
Hawaiian
American Indian
Other
Oriental
Hispanic or Latino
White
Black
3 (0.02%)
9 (0.1%)
130 (0.8%)
309 (2%)
408 (3%)
1,914 (12%)
13,367 (83%)
0-4
5-9
10-14
15-19
20-24
25-29
30-34
35-39
40-44
45-49
50-54
55-59
60-64
65-69
70-74
75-79
80-84
85-89
90+
1,022
530
376
701
1,252
1,016
826
668
422
672
646
419
282
197
148
95
80
29
22
1,022
510
387
431
483
519
508
451
405
504
470
358
224
125
84
41
31
16
5
Male Female
N = 16,140 N = 16,140
N = 16,140

February 10, 2010 In Touch Information Services 17
Geographic Distribution of Patients at City View, in 2008 City View N= 605 (3% of all patients) Average Age = 38

February 10, 2010 In Touch Information Services 18
Characteristics of Patients at City View in 2008; N = 605 (3% of all patients)
Patients at City View in 2008, by Age and Gender Patients at City View in 2008, by Gender
Patients at City View in 2008, by Race Patients at City View in 2008; by Method of Payment
0-4
5-9
10-14
15-19
20-24
25-29
30-34
35-39
40-44
45-49
50-54
55-59
60-64
65-69
70-74
75-79
80-84
85-89
90+
55
2
1165
47
4547
3139
4525
14
25
43
1
23
4252423
22
1823
2413
10
3
11
1
Male Female
401, 66%
204, 34%
Female Male
Oriental
Hispanic or Latino
Other
White
Black
2 (0.3%)
10 (2%)
12 (2%)
161 (27%)
420 (69%)
Medicaid
Medicare
Commercial Insurance
Passport
Fee for Service
Minimum Fee
1 (0.2%)
37 (6%)
55 (9%)
107 (18%)
183 (30%)
222 (37%)
N = 605
N = 605
N = 605
N = 605
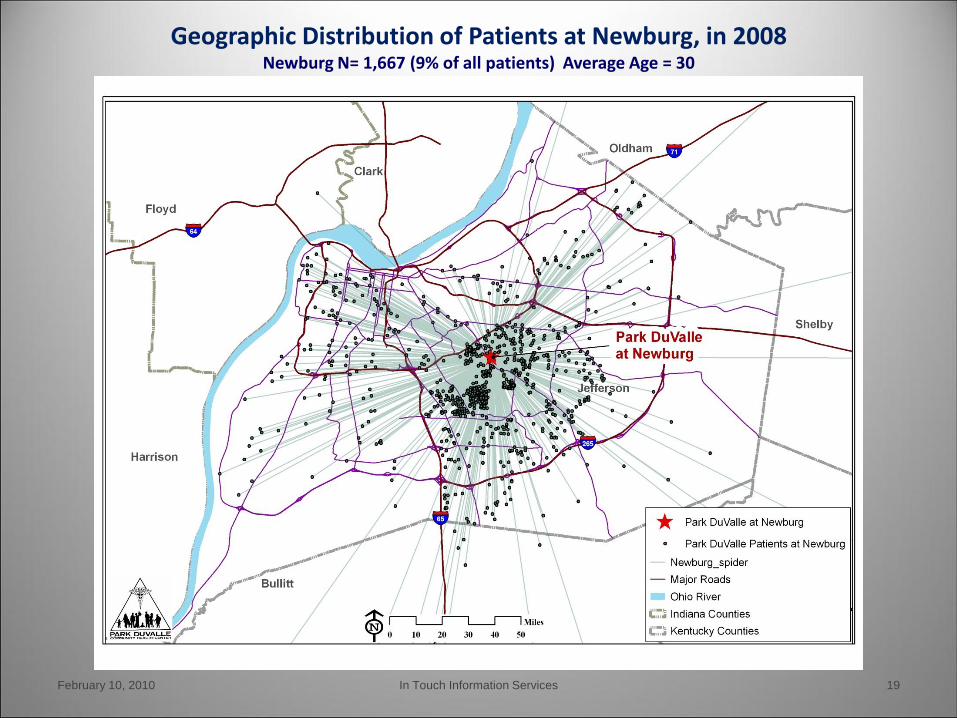
February 10, 2010 In Touch Information Services 19
Geographic Distribution of Patients at Newburg, in 2008 Newburg N= 1,667 (9% of all patients) Average Age = 30
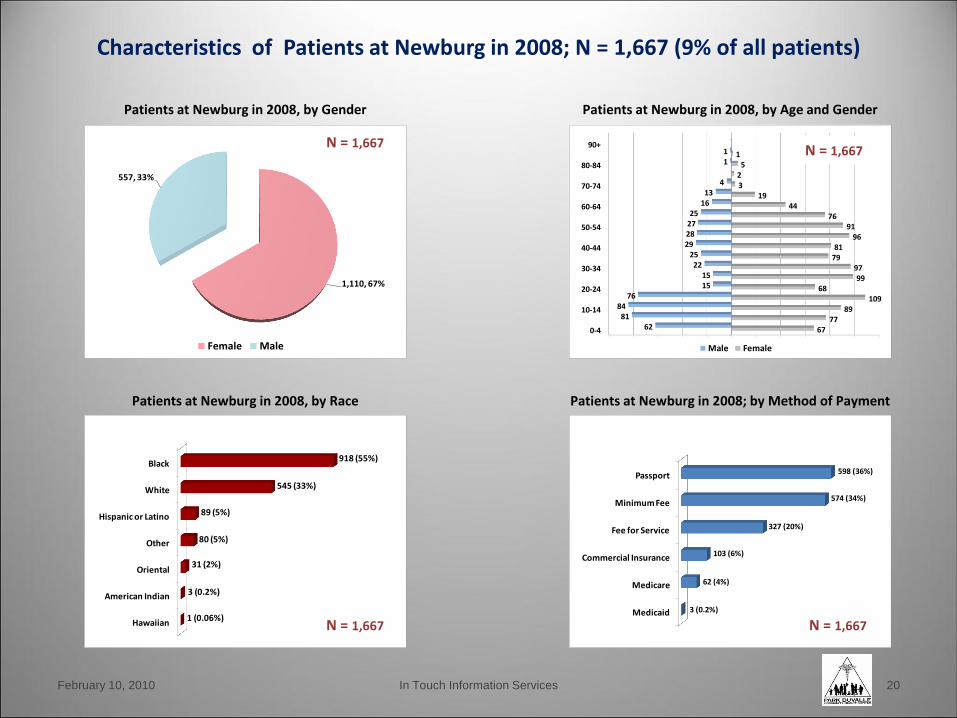
1,110, 67%
557, 33%
Female Male
N = 1,667
February 10, 2010 In Touch Information Services 20
Characteristics of Patients at Newburg in 2008; N = 1,667 (9% of all patients)
Patients at Newburg in 2008, by Age and Gender Patients at Newburg in 2008, by Gender
Patients at Newburg in 2008, by Race Patients at Newburg in 2008; by Method of Payment
Hawaiian
American Indian
Oriental
Other
Hispanic or Latino
White
Black
1 (0.06%)
3 (0.2%)
31 (2%)
80 (5%)
89 (5%)
545 (33%)
918 (55%)
Medicaid
Medicare
Commercial Insurance
Fee for Service
Minimum Fee
Passport
3 (0.2%)
62 (4%)
103 (6%)
327 (20%)
574 (34%)
598 (36%)
0-4
10-14
20-24
30-34
40-44
50-54
60-64
70-74
80-84
90+
6777
89109
6899
977981
9691
7644
19325
1
6281
8476
1515
2225
29282725
1613
4
11
Male Female
N = 1,667
N = 1,667
N = 1,667

February 10, 2010 In Touch Information Services 21
Geographic Distribution of Patients at Spencer County, in 2008 Spencer County N= 958 (5% of all patients) Average Age = 37

Oriental
Other
Hispanic or Latino
Black
White
7 (1%)
29 (3%)
58 (6%)
63 (7%)
801 (84%)
N = 958
February 10, 2010 In Touch Information Services 22
Characteristics of Patients at Spencer County in 2008; N = 958 (5% of all patients)
Patients at Spencer County in 2008, by Age and Gender Patients at Spencer County in 2008, by Gender
Patients at Spencer County in 2008, by Race Patients at Spencer County in 2008; by Method of Payment
0-4
10-14
20-24
30-34
40-44
50-54
60-64
70-74
80-84
90+
1436
2144
5155
4668
6464
6046
4521
6111
711
2130
1920
1624
2528
3632
2015
81
1
Male Female
644, 67%
314, 33%
Female Male
Medicaid
Medicare
Commercial Insurance
Fee for Service
Passport
Minimum Fee
2 (0.2%)
67 (7%)
83 (9%)
237 (25%)
250 (26%)
319 (33%)
N = 958 N = 958
N = 958

February 10, 2010 In Touch Information Services 23
Number of Patients by Census Tract in Kentucky, 2008; N = 16,666 (86% of all patients)
TRACT Count TRACT Count TRACT Count
21111001500 675 21215080200 166 21111005200 75
21111002400 523 21111012802 160 21111012501 73
21111001000 474 21111000300 160 21111011406 73
21111001400 454 21111006500 153 21111003700 73
21111001200 454 21111005100 152 21111000200 71
21111011302 453 21111005900 149 21111011005 69
21111003000 445 21111003900 146 21111011705 66
21111001100 438 21111002300 144 21111003800 66
21111000400 384 21111004302 130 21111002100 66
21111000700 375 21111011404 128 21111012702 63
21111012601 368 21111010901 122 21111011905 63
21111001700 360 21111004900 115 21111004400 63
21111012801 356 21111009000 114 21029020100 62
21111001600 346 21111006200 114 21111004600 56
21111002700 335 21111012405 108 21111012302 55
21111012701 325 21111009104 104 21111005000 55
21111000800 312 21211040300 102 21111011800 54
21111001800 289 21111005600 97 21111012502 53
21111000600 263 21111011301 96 21111007100 52
21111011405 255 21111011101 94 21111011506 51
21111000900 255 21111011003 92 21111009400 51
21111003600 233 21111012603 89 21111006600 48
21111011002 227 21111011004 89 21111012202 47
21111004301 223 21111011505 87 21111011904 47
21111003500 213 21111012503 84 21111010004 47
21215080100 200 21111011509 82 21111004000 45
21111012604 188 21111004500 82 21111011906 44
21111002800 186 21111012703 77 21111010310 44
21111011200 183 21111011105 77 21111011504 43
Kentucky PDV
Patients by
Tract in 2008
Kentucky PDV
Patients by
Tract in 2008
Kentucky PDV
Patients by
Tract in 2008
(sorted by highest number of
patients in tract)
(sorted by highest number of
patients in tract)
(sorted by highest number of
patients in tract)
Appendix A 1
February 10, 2010 In Touch Information Services 24
TRACT Count TRACT Count TRACT Count
21111011704 42 21111012408 21 21111007502 13
21111010404 42 21111010600 21 21111007000 12
21111011510 41 21111010403 21 21029021200 12
21111007602 40 21111010006 21 21111010705 11
21111004100 39 21111010005 21 21111010402 11
21179990300 38 21111006300 21 21111010008 11
21111011106 38 21029020600 21 21111010001 11
21111010311 38 21111012104 20 21111009300 11
21111012204 37 21111009103 20 21111008200 11
21111010902 37 21111008100 20 21111011109 10
21111012203 36 21029021100 20 21111010306 10
21111010101 35 21111012103 19 21111009700 10
21111007700 35 21111005300 19 21111008900 10
21211040400 34 21029020200 19 21111008400 10
21111012301 33 21111012409 18 21103090300 10
21111010702 32 21111011602 18 21029020500 10
21211040200 31 21111012003 17 21029020400 9
21111012406 29 21111011707 17 21179990400 8
21111011907 29 21111011512 17 21111012001 8
21111012407 28 21111011508 17 21111011706 8
21111012107 28 21111011403 17 21111009900 8
21111011102 28 21111006800 17 21111009600 8
21029020700 27 21111012106 15 21111007400 8
21211040500 26 21111011703 15 21111012105 7
21111012002 25 21111007603 15 21111010701 7
21111011110 25 21029020800 15 21111010308 7
21211040100 23 21179990200 14 21111006900 7
21111011511 23 21111010800 14 21111006400 7
21179990100 22 21111007800 14 21029020900 7
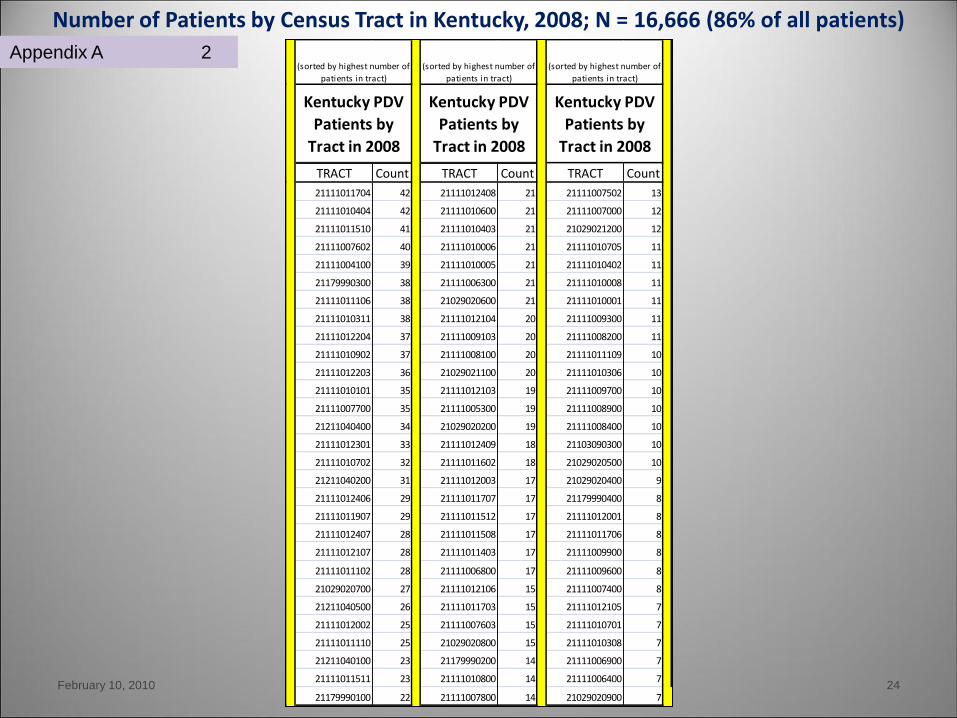
Kentucky PDV
Patients by
Tract in 2008
Kentucky PDV
Patients by
Tract in 2008
Kentucky PDV
Patients by
Tract in 2008
(sorted by highest number of
patients in tract)
(sorted by highest number of
patients in tract)
(sorted by highest number of
patients in tract)
Number of Patients by Census Tract in Kentucky, 2008; N = 16,666 (86% of all patients)
Appendix A 2

February 10, 2010 In Touch Information Services 25
Number of Patients by Census Tract in Kentucky, 2008; N = 16,666 (86% of all patients)
TRACT Count TRACT Count TRACT Count
21111010500 6 21179990600 2 21107970400 1
21111008800 6 21179990500 2 21103090400 1
21185030300 5 21163970300 2 21093001600 1
21111010307 5 21111013100 2 21093000500 1
21111009800 5 21111010706 2 21087990100 1
21111008300 5 21111010309 2 21085950400 1
21029020300 5 21111008700 2 21085950100 1
21185030700 4 21111008500 2 21073070500 1
21185030501 4 21093000600 2 21073070100 1
21111011601 4 21087990200 2 21059000600 1
21111010007 4 21073070200 2 21047200100 1
21111007601 4 21067002301 2 21041950300 1
21163970400 3 21227011200 1 21027960200 1
21111010303 3 21223100200 1 21011970200 1
21111010102 3 21223100100 1 21005950100 1
21111007900 3 21217980500 1 21059000600 1
21111007501 3 21185030601 1 21047200100 1
21093001400 3 21185030400 1 21041950300 1
21093000700 3 21163970500 1 21027960200 1
21093000400 3 21123960100 1 21011970200 1
21093000300 3 21111011901 1 21005950100 1
21093000100 3
21005950400 3
21005950300 3
21229980200 2
21229980100 2
21185030802 2
21179990700 2
(sorted by highest number of
patients in tract)
Kentucky PDV
Patients by
Tract in 2008
(sorted by highest number of
patients in tract)
(sorted by highest
number of patients in
tract)
Kentucky PDV
Patients by
Tract in 2008
Kentucky
PDV Patients
by Tract in
2008
Appendix A 3

Methodology
07/15/2015 In Touch Information Services 26
Appendix B 1
→ link Census Tracts to the final database of PDV patients in
GIS
1
• Exploratory analysis of the original data in SPPS
→ frequencies and descriptives
• Conversion of database for import into GIS
• Creation of two address locators to capture data
• Geocoding of database to two geographic areas
→ geocode and reconcile addresses where possible
→ export and clean the data in Excel, converting for GIS and
rerunning the geocodes
→ examination of the data that did and did not geocode in GIS
and SPSS and Excel
• Exploratory analysis of the geocoded and tract-linked data in GIS
→ export new geocoded data to SPSS and Excel
• Create new map file of Jefferson County only with tract ids added
• Export census tract-appended file to Excel

Methodology
07/15/2015 In Touch Information Services 27
Appendix B 2
• Creation of multiple maps at two geographic levels
→ Maps of patient population in Kentucky and Indiana
All patients in Louisville Metro and surrounding counties
Pediatric patients in Louisville Metro and surrounding counties
Patients in Louisville Metro
→ Maps of patient population in Jefferson County
All patients
→ Export of the data for each sub-group into SPPS
→ Maps of the catchment areas for each PDV site
• Analysis of the sub-group populations in SPSS;
→ Run frequencies and descriptives for each group
→ Export to Excel to create charts and tables
• Creation of PowerPoint Presentation
→ import finished charts and tables
→ import final maps
• Creation of Final Wall Maps
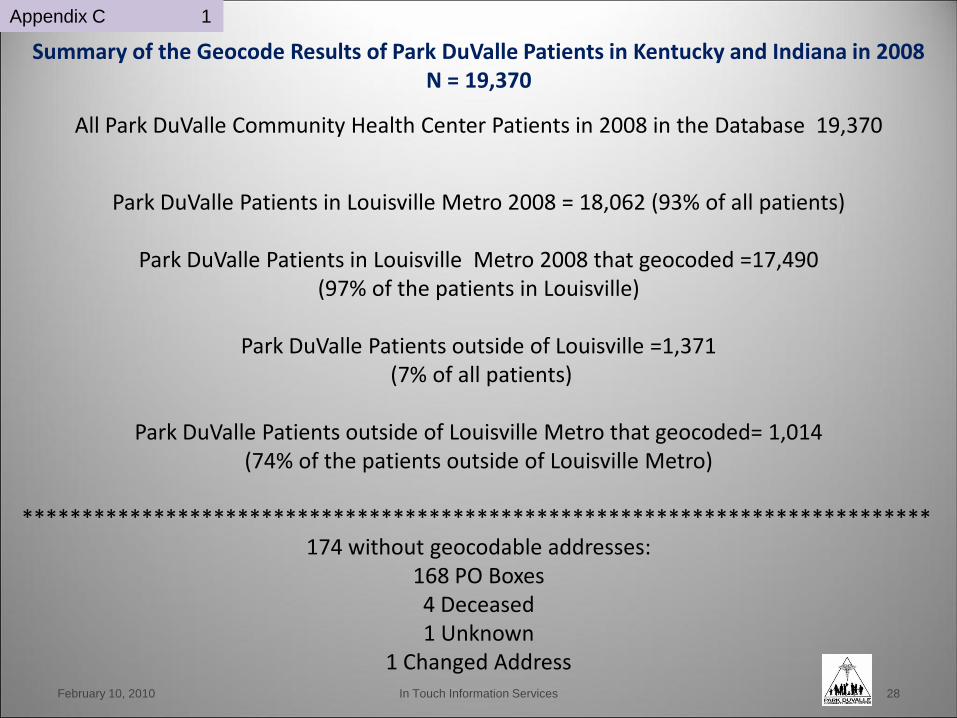
All Park DuValle Community Health Center Patients in 2008 in the Database 19,370
Park DuValle Patients in Louisville Metro 2008 = 18,062 (93% of all patients)
Park DuValle Patients in Louisville Metro 2008 that geocoded =17,490
(97% of the patients in Louisville)
Park DuValle Patients outside of Louisville =1,371 (7% of all patients)
Park DuValle Patients outside of Louisville Metro that geocoded= 1,014
(74% of the patients outside of Louisville Metro)
**************************************************************************** 174 without geocodable addresses:
168 PO Boxes 4 Deceased 1 Unknown
1 Changed Address
Summary of the Geocode Results of Park DuValle Patients in Kentucky and Indiana in 2008 N = 19,370
February 10, 2010 In Touch Information Services 28
Appendix C 1