
200x Low-dose PET Reconstruction using Deep Learning · result than the state-of-the-art methods...
9
200x Low-dose PET Reconstruction using Deep Learning Junshen Xu † , Enhao Gong † , John Pauly and Greg Zaharchuk * Abstract— Positron emission tomography (PET) is widely used in various clinical applications, including cancer diagnosis, heart disease and neuro disorders. The use of radioactive tracer in PET imaging raises concerns due to the risk of radiation exposure. To minimize this potential risk in PET imaging, efforts have been made to reduce the amount of radio- tracer usage. However, lowing dose results in low Signal-to- Noise-Ratio (SNR) and loss of information, both of which will heavily affect clinical diagnosis. Besides, the ill-conditioning of low-dose PET image reconstruction makes it a difficult prob- lem for iterative reconstruction algorithms. Previous methods proposed are typically complicated and slow, yet still cannot yield satisfactory results at significantly low dose. Here, we propose a deep learning method to resolve this issue with an encoder-decoder residual deep network with concatenate skip connections. Experiments shows the proposed method can reconstruct low-dose PET image to a standard-dose quality with only two-hundredth dose. Different cost functions for training model are explored. Multi-slice input strategy is introduced to provide the network with more structural information and make it more robust to noise. Evaluation on ultra-low-dose clinical data shows that the proposed method can achieve better result than the state-of-the-art methods and reconstruct images with comparable quality using only 0.5% of the original regular dose. Index Terms— Deep Learning (DL), Positron emission to- mography (PET), low-dose PET reconstruction, Image en- hancement/restoration, Denoising, Convolution Neural Network (CNN) I. I NTRODUCTION P OSITRON emission tomography (PET) has a wide range of clinical applications, such as cancer diagnosis, tumor detection[1] and early diagnosis of neuro diseases[2], for its ability of cellular level imaging and high specificity. In order to acquire high quality PET image for diagnostic purpose, a standard dose of radioactive tracer should be injected to the subject which will lead to higher risk of radiation exposure damage. Usually, a PET scan or the a scan of PET/MR and PET/CT can expose patients with even more ionizing radiation than a scan using CT along. To minimize such risk, the well-known principle of ALARA (as low as reasonably achievable)[3] is adopted in clinical practice. In addition, lowering injected dose in PET can also result in reduction of imaging costs, shorter imaging time and may improve imaging logistics when fast-decaying tracers are This work was supported in part by —. Dagger indicates equal contribu- tion of the first two authors. Asterisk indicates corresponding author. †Junshen Xu is with the Department of Electrical Engineering,Stanford University, Stanford, CA, 94305, USA and the Department of Engineering Physics, Tsinghua University, Beijing, 100084 China †Enhao Gong and John Pauly is with the Department of Electrical Engineering, Stanford University, Stanford, CA, 94305, USA *Greg Zaharchuk is with the Department of Radiology, Stanford Univer- sity, Stanford, CA, 94305, USA used. However, dose reduction will adversely affect PET image quality with lower Signal-to-Noise-Ratio (SNR), as shown in Fig. 1. Fig. 1. PET images with normal dose and different levels of dose reduction. (a) standard-dose, (b) quarter-dose, (c) twentieth-dose, and (d) two-hundredth-dose. To address this problem, many algorithms were proposed to improve the image quality for low-dose PET image. In general, these algorithms can be categorized into three categories: (1) iterative reconstruction algorithm, (2) image filtering and post-processing, and (3) machine learning. Iterative reconstruction algorithms formulate the low-dose reconstruction problem as a convex optimization problem combining statistical model of the acquired data (i.e., sino- gram or listmode) and the regularization term to suppress noise. Wang et al. [4] proposed an iterative algorithm using a Total Variation (TV) regularization to reduce the noise of synthetic emission phantom with different photon counts. Although Iterative reconstruction algorithms are potentially most accurate since they consider the raw count information directly, they also have three main weaknesses. First, the substantial computational expenses interacting with all the acquired data make most of this kind of methods time- consuming. Second, iterative methods are typically vendor- specific, since different scanners may adopt different geomet- ric configurations, data formats (e.g., time-of-flight (TOF) [5] and depth-of-interaction (DOI) [6]), and data correction procedures, which will significantly affect the raw data. Finally, in these methods, a predefined regularization term is need, which may leads to undesirable over-smoothing, artifacts or hallucinated textures. As for image processing methods, several general-purpose image denoising algorithms, such as nonlocal means (NLM) [7] and block-matching 3D (BM3D) [8], are introduced into PET image denoising [9], [10]. Besides, Bagci et. al. [11] combined singular value thresholding method and Stein’s arXiv:1712.04119v1 [cs.CV] 12 Dec 2017
Transcript of 200x Low-dose PET Reconstruction using Deep Learning · result than the state-of-the-art methods...
200x Low-dose PET Reconstruction using Deep Learning
Junshen Xu†, Enhao Gong†, John Pauly and Greg Zaharchuk∗
Abstract— Positron emission tomography (PET) is widelyused in various clinical applications, including cancer diagnosis,heart disease and neuro disorders. The use of radioactivetracer in PET imaging raises concerns due to the risk ofradiation exposure. To minimize this potential risk in PETimaging, efforts have been made to reduce the amount of radio-tracer usage. However, lowing dose results in low Signal-to-Noise-Ratio (SNR) and loss of information, both of which willheavily affect clinical diagnosis. Besides, the ill-conditioning oflow-dose PET image reconstruction makes it a difficult prob-lem for iterative reconstruction algorithms. Previous methodsproposed are typically complicated and slow, yet still cannotyield satisfactory results at significantly low dose. Here, wepropose a deep learning method to resolve this issue withan encoder-decoder residual deep network with concatenateskip connections. Experiments shows the proposed method canreconstruct low-dose PET image to a standard-dose quality withonly two-hundredth dose. Different cost functions for trainingmodel are explored. Multi-slice input strategy is introducedto provide the network with more structural information andmake it more robust to noise. Evaluation on ultra-low-doseclinical data shows that the proposed method can achieve betterresult than the state-of-the-art methods and reconstruct imageswith comparable quality using only 0.5% of the original regulardose.
Index Terms— Deep Learning (DL), Positron emission to-mography (PET), low-dose PET reconstruction, Image en-hancement/restoration, Denoising, Convolution Neural Network(CNN)
I. INTRODUCTION
POSITRON emission tomography (PET) has a wide rangeof clinical applications, such as cancer diagnosis, tumor
detection[1] and early diagnosis of neuro diseases[2], for itsability of cellular level imaging and high specificity. In orderto acquire high quality PET image for diagnostic purpose,a standard dose of radioactive tracer should be injectedto the subject which will lead to higher risk of radiationexposure damage. Usually, a PET scan or the a scan ofPET/MR and PET/CT can expose patients with even moreionizing radiation than a scan using CT along. To minimizesuch risk, the well-known principle of ALARA (as low asreasonably achievable)[3] is adopted in clinical practice. Inaddition, lowering injected dose in PET can also result inreduction of imaging costs, shorter imaging time and mayimprove imaging logistics when fast-decaying tracers are
This work was supported in part by —. Dagger indicates equal contribu-tion of the first two authors. Asterisk indicates corresponding author.†Junshen Xu is with the Department of Electrical Engineering,Stanford
University, Stanford, CA, 94305, USA and the Department of EngineeringPhysics, Tsinghua University, Beijing, 100084 China†Enhao Gong and John Pauly is with the Department of Electrical
Engineering, Stanford University, Stanford, CA, 94305, USA∗Greg Zaharchuk is with the Department of Radiology, Stanford Univer-
sity, Stanford, CA, 94305, USA
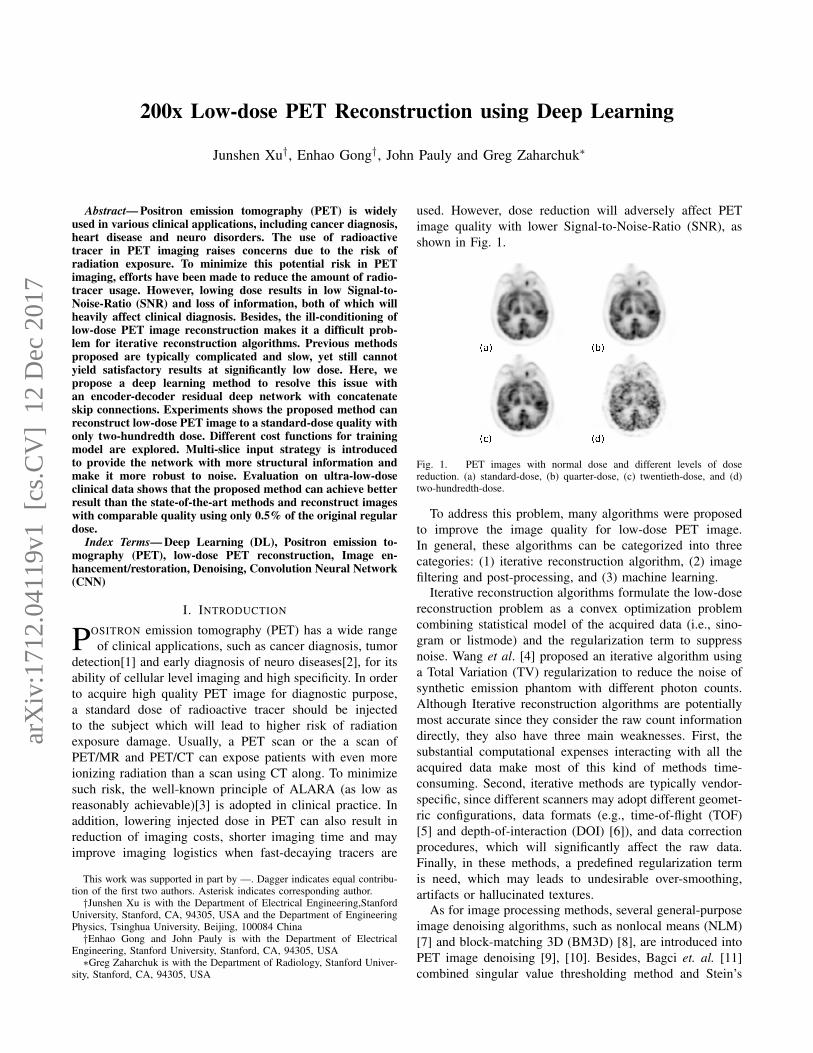
used. However, dose reduction will adversely affect PETimage quality with lower Signal-to-Noise-Ratio (SNR), asshown in Fig. 1.
Fig. 1. PET images with normal dose and different levels of dosereduction. (a) standard-dose, (b) quarter-dose, (c) twentieth-dose, and (d)two-hundredth-dose.
To address this problem, many algorithms were proposedto improve the image quality for low-dose PET image.In general, these algorithms can be categorized into threecategories: (1) iterative reconstruction algorithm, (2) imagefiltering and post-processing, and (3) machine learning.
Iterative reconstruction algorithms formulate the low-dosereconstruction problem as a convex optimization problemcombining statistical model of the acquired data (i.e., sino-gram or listmode) and the regularization term to suppressnoise. Wang et al. [4] proposed an iterative algorithm usinga Total Variation (TV) regularization to reduce the noise ofsynthetic emission phantom with different photon counts.Although Iterative reconstruction algorithms are potentiallymost accurate since they consider the raw count informationdirectly, they also have three main weaknesses. First, thesubstantial computational expenses interacting with all theacquired data make most of this kind of methods time-consuming. Second, iterative methods are typically vendor-specific, since different scanners may adopt different geomet-ric configurations, data formats (e.g., time-of-flight (TOF)[5] and depth-of-interaction (DOI) [6]), and data correctionprocedures, which will significantly affect the raw data.Finally, in these methods, a predefined regularization termis need, which may leads to undesirable over-smoothing,artifacts or hallucinated textures.
As for image processing methods, several general-purposeimage denoising algorithms, such as nonlocal means (NLM)[7] and block-matching 3D (BM3D) [8], are introduced intoPET image denoising [9], [10]. Besides, Bagci et. al. [11]combined singular value thresholding method and Stein’s
arX
iv:1
712.
0411
9v1
[cs
.CV
] 1
2 D
ec 2
017
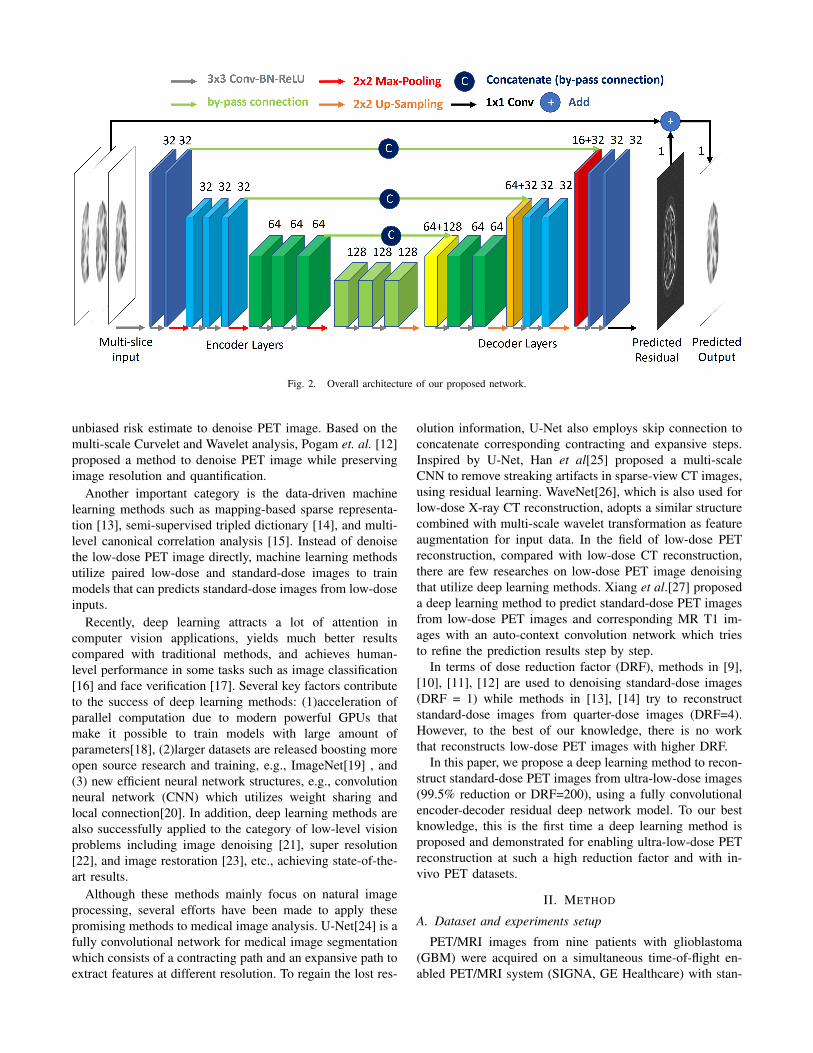
Fig. 2. Overall architecture of our proposed network.
unbiased risk estimate to denoise PET image. Based on themulti-scale Curvelet and Wavelet analysis, Pogam et. al. [12]proposed a method to denoise PET image while preservingimage resolution and quantification.
Another important category is the data-driven machinelearning methods such as mapping-based sparse representa-tion [13], semi-supervised tripled dictionary [14], and multi-level canonical correlation analysis [15]. Instead of denoisethe low-dose PET image directly, machine learning methodsutilize paired low-dose and standard-dose images to trainmodels that can predicts standard-dose images from low-doseinputs.
Recently, deep learning attracts a lot of attention incomputer vision applications, yields much better resultscompared with traditional methods, and achieves human-level performance in some tasks such as image classification[16] and face verification [17]. Several key factors contributeto the success of deep learning methods: (1)acceleration ofparallel computation due to modern powerful GPUs thatmake it possible to train models with large amount ofparameters[18], (2)larger datasets are released boosting moreopen source research and training, e.g., ImageNet[19] , and(3) new efficient neural network structures, e.g., convolutionneural network (CNN) which utilizes weight sharing andlocal connection[20]. In addition, deep learning methods arealso successfully applied to the category of low-level visionproblems including image denoising [21], super resolution[22], and image restoration [23], etc., achieving state-of-the-art results.
Although these methods mainly focus on natural imageprocessing, several efforts have been made to apply thesepromising methods to medical image analysis. U-Net[24] is afully convolutional network for medical image segmentationwhich consists of a contracting path and an expansive path toextract features at different resolution. To regain the lost res-
olution information, U-Net also employs skip connection toconcatenate corresponding contracting and expansive steps.Inspired by U-Net, Han et al[25] proposed a multi-scaleCNN to remove streaking artifacts in sparse-view CT images,using residual learning. WaveNet[26], which is also used forlow-dose X-ray CT reconstruction, adopts a similar structurecombined with multi-scale wavelet transformation as featureaugmentation for input data. In the field of low-dose PETreconstruction, compared with low-dose CT reconstruction,there are few researches on low-dose PET image denoisingthat utilize deep learning methods. Xiang et al.[27] proposeda deep learning method to predict standard-dose PET imagesfrom low-dose PET images and corresponding MR T1 im-ages with an auto-context convolution network which triesto refine the prediction results step by step.
In terms of dose reduction factor (DRF), methods in [9],[10], [11], [12] are used to denoising standard-dose images(DRF = 1) while methods in [13], [14] try to reconstructstandard-dose images from quarter-dose images (DRF=4).However, to the best of our knowledge, there is no workthat reconstructs low-dose PET images with higher DRF.
In this paper, we propose a deep learning method to recon-struct standard-dose PET images from ultra-low-dose images(99.5% reduction or DRF=200), using a fully convolutionalencoder-decoder residual deep network model. To our bestknowledge, this is the first time a deep learning method isproposed and demonstrated for enabling ultra-low-dose PETreconstruction at such a high reduction factor and with in-vivo PET datasets.
II. METHOD
A. Dataset and experiments setup
PET/MRI images from nine patients with glioblastoma(GBM) were acquired on a simultaneous time-of-flight en-abled PET/MRI system (SIGNA, GE Healthcare) with stan-

dard dose of 18F-fluorodeoxyglucose (FDG) (370 MBq).Images were acquired for about 40 min, beginning 45 minafter injection. We stored the raw count listmode datasetsfor each scan and then generate synthesized low-dose rawdata at DRF = 200 by simply randomly selecting 0.5% ofthe count events, spread uniformly over the entire acquisitionperiod. Then we reconstruct PET images from the acquireddata at DRF = 1 (standard full dose) and DRF = 200(target low dose) using standard OSEM methods (28 subsets,2 iterations).
The size of each reconstructed 3D PET data is 256 ×256 × 89. There are slices of air at the top and bottom,which are removed. To avoid over fitting, data augmentationis adopted during the training process to simulate a largerdataset. Before fed into the network, images are randomlyflipped along x and y axes and transposed.
B. Deep Learning based low-dose PET reconstruction
The goal of this work is to train a model to learn toreconstruct from the DRF = 200 image to DRF = 1reconstruction.
1) Network structure: As shown in Fig. 2, the proposedfully convolutional network is based on an encoder-decoderstructure with symmetry concatenate connections betweencorresponding stages, which is inspired by the U-Net struc-ture but modified for image synthesis task instead of segmen-tation task. Specifically, each stage consists of convolutionwith 3×3 kernels, batch normalization, and rectified linearunit (ReLU). The downsampling and upsampling betweenstages are done by 2×2 max pooling and bilinear interpo-lation respectively. By downsampling and then upsamplingthe image, the network can extract the multi-scale and high-level features from the image. The low-dose PET imagereconstruction task is similar to image denoising which iswithin the category of low-level vision problems and aresusceptible to resolution loss if only a encoding-decodingprocedure is used. Therefore, concatenate connections areadded to preserve local information and resolution of theimage.
2) Residual learning: Residual learning[28] is first in-troduced into CNN as a technique to avoid performancedegradation when training very deep CNNs. It shows byseparating the identity and the residual part, the neuralnetwork can be trained more effectively and efficiently.Originally, residual learning is used in image recognitiontask [28] and Zhang et al. [29] proposed DnCNN whichis the first denoising convolution network using residuallearning. It is showed in [25], using persistent homologyanalysis, that the residual manifold of CT artifacts hasa much simpler structure. Our network also employs theresidual learning technique, by adding a residual connectionfrom input to output directly, i.e., instead of learning togenerate standard-dose PET images directly, the networktries to learn the difference between standard-dose imagesoutputs and low-dose images inputs. Our study shows thatresidual learning can also lead to a significant improvement
in network performance for low-dose PET reconstructionproblem.
3) Using multi-slice as input: Using only the low-doseimage as input for the neural network may not provideenough information to reconstruct the standard-dose counter-part. As shown in fig, the noise due to dose reduction cannotbe fully eliminated by the network for the network mayhave insufficient information to distinguish noise from brainstructure. To address this problem, we use multi-slice inputinstead of single-slice input, i.e., adjoining slices are stackedas different input channels. In general, the multi-slice inputscan be regarded as a kind of feature augmentation. Since thestructure of the brain is deterministic, adjoining slices mayshare similar structure while having different noise whichis random. Thus, combining different slices as input canprovide the network with 2.5D structural information thatcan be used to distinguish random noise from the consistentstructure. One example is illustrated in Fig. 3, in the low-dose PET image there is a black noise in the zoomed part,which cannot be eliminated but hallucinated as a structureby the network trained with single-slice input. However, thenetwork trained with three-slice input can achieve betterresults, as shown in Fig. 3(d). Training 2.5D multi-sliceinputs is different from training with 3D convolution net-work since the former solution sues depth-wise operationof 3D convolution which has fewer parameters and higherefficiency.
Fig. 3. Effect of multi-slice input. (a) standard-dose, (b) 200x low-dose,(c) reconstructed result using single-slice input, and (d) reconstructed resultusing multi-slice input (3 slices).
4) Selection of loss functions: The mean squared error(MSE) or L2 loss is still the most popular choice of lossfunction in training networks for image restoration problems,e.g., super resolution or denoising. The use of MSE asloss function is under the assumption of additive whiteGaussian noise, which should be independent of the localfeatures of the image. However, this is not valid for low-dosePET reconstruction in general. Since the intensity of PETimage reflects the activity distribution of tracer in the subjectand the noise results from dose reduction is related to thecounting of each detector, noise and spatial information arenot independent. Besides, the MSE loss may be not suitablefor task related to clinical evaluation for it relates poorly tothe human visual system and produces splotchy artifacts[30].
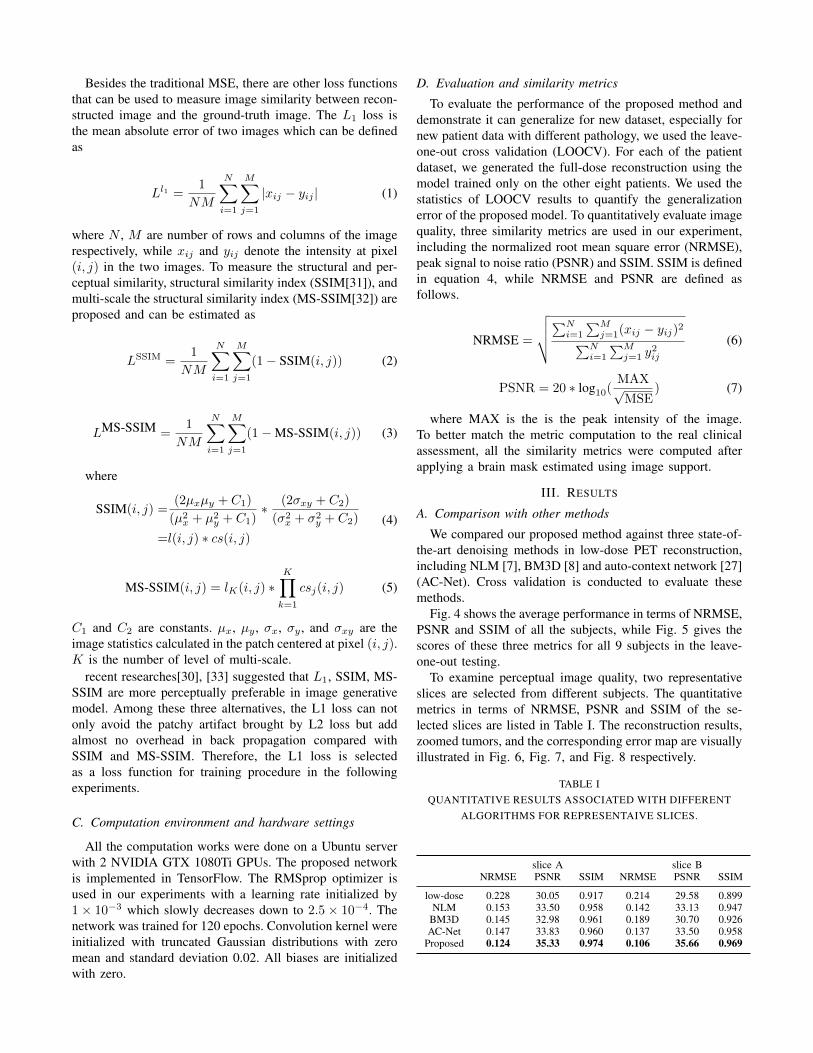
Besides the traditional MSE, there are other loss functionsthat can be used to measure image similarity between recon-structed image and the ground-truth image. The L1 loss isthe mean absolute error of two images which can be definedas
Ll1 =1
NM
N∑i=1
M∑j=1
|xij − yij | (1)
where N , M are number of rows and columns of the imagerespectively, while xij and yij denote the intensity at pixel(i, j) in the two images. To measure the structural and per-ceptual similarity, structural similarity index (SSIM[31]), andmulti-scale the structural similarity index (MS-SSIM[32]) areproposed and can be estimated as
LSSIM =1
NM
N∑i=1
M∑j=1
(1− SSIM(i, j)) (2)
LMS-SSIM =1
NM
N∑i=1
M∑j=1
(1−MS-SSIM(i, j)) (3)
where
SSIM(i, j) =(2µxµy + C1)
(µ2x + µ2
y + C1)∗ (2σxy + C2)
(σ2x + σ2
y + C2)
=l(i, j) ∗ cs(i, j)(4)
MS-SSIM(i, j) = lK(i, j) ∗K∏
k=1
csj(i, j) (5)
C1 and C2 are constants. µx, µy , σx, σy , and σxy are theimage statistics calculated in the patch centered at pixel (i, j).K is the number of level of multi-scale.
recent researches[30], [33] suggested that L1, SSIM, MS-SSIM are more perceptually preferable in image generativemodel. Among these three alternatives, the L1 loss can notonly avoid the patchy artifact brought by L2 loss but addalmost no overhead in back propagation compared withSSIM and MS-SSIM. Therefore, the L1 loss is selectedas a loss function for training procedure in the followingexperiments.
C. Computation environment and hardware settings
All the computation works were done on a Ubuntu serverwith 2 NVIDIA GTX 1080Ti GPUs. The proposed networkis implemented in TensorFlow. The RMSprop optimizer isused in our experiments with a learning rate initialized by1× 10−3 which slowly decreases down to 2.5× 10⁻⁴. Thenetwork was trained for 120 epochs. Convolution kernel wereinitialized with truncated Gaussian distributions with zeromean and standard deviation 0.02. All biases are initializedwith zero.
D. Evaluation and similarity metrics
To evaluate the performance of the proposed method anddemonstrate it can generalize for new dataset, especially fornew patient data with different pathology, we used the leave-one-out cross validation (LOOCV). For each of the patientdataset, we generated the full-dose reconstruction using themodel trained only on the other eight patients. We used thestatistics of LOOCV results to quantify the generalizationerror of the proposed model. To quantitatively evaluate imagequality, three similarity metrics are used in our experiment,including the normalized root mean square error (NRMSE),peak signal to noise ratio (PSNR) and SSIM. SSIM is definedin equation 4, while NRMSE and PSNR are defined asfollows.
NRMSE =
√√√√∑Ni=1
∑Mj=1(xij − yij)2∑N
i=1
∑Mj=1 y
2ij
(6)
PSNR = 20 ∗ log10(MAX√MSE
) (7)
where MAX is the is the peak intensity of the image.To better match the metric computation to the real clinicalassessment, all the similarity metrics were computed afterapplying a brain mask estimated using image support.
III. RESULTS
A. Comparison with other methods
We compared our proposed method against three state-of-the-art denoising methods in low-dose PET reconstruction,including NLM [7], BM3D [8] and auto-context network [27](AC-Net). Cross validation is conducted to evaluate thesemethods.
Fig. 4 shows the average performance in terms of NRMSE,PSNR and SSIM of all the subjects, while Fig. 5 gives thescores of these three metrics for all 9 subjects in the leave-one-out testing.
To examine perceptual image quality, two representativeslices are selected from different subjects. The quantitativemetrics in terms of NRMSE, PSNR and SSIM of the se-lected slices are listed in Table I. The reconstruction results,zoomed tumors, and the corresponding error map are visuallyillustrated in Fig. 6, Fig. 7, and Fig. 8 respectively.
TABLE IQUANTITATIVE RESULTS ASSOCIATED WITH DIFFERENT
ALGORITHMS FOR REPRESENTAIVE SLICES.
slice A slice BNRMSE PSNR SSIM NRMSE PSNR SSIM
low-dose 0.228 30.05 0.917 0.214 29.58 0.899NLM 0.153 33.50 0.958 0.142 33.13 0.947
BM3D 0.145 32.98 0.961 0.189 30.70 0.926AC-Net 0.147 33.83 0.960 0.137 33.50 0.958
Proposed 0.124 35.33 0.974 0.106 35.66 0.969
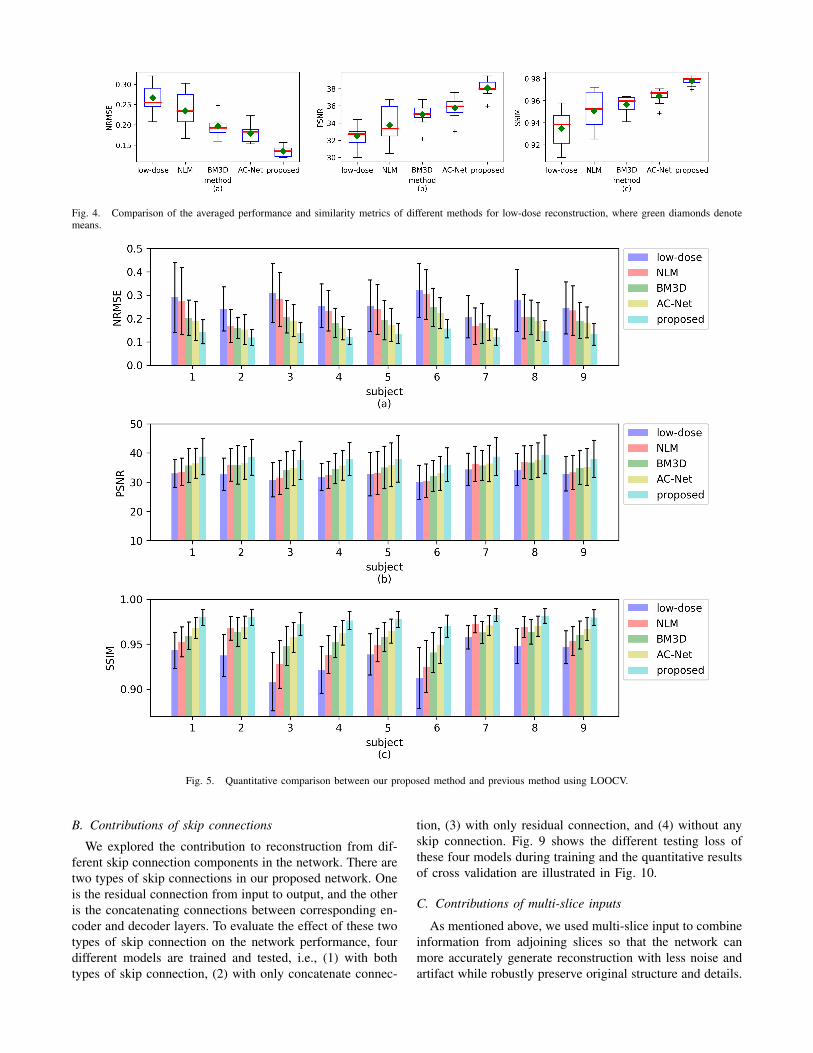
Fig. 4. Comparison of the averaged performance and similarity metrics of different methods for low-dose reconstruction, where green diamonds denotemeans.
Fig. 5. Quantitative comparison between our proposed method and previous method using LOOCV.
B. Contributions of skip connections
We explored the contribution to reconstruction from dif-ferent skip connection components in the network. There aretwo types of skip connections in our proposed network. Oneis the residual connection from input to output, and the otheris the concatenating connections between corresponding en-coder and decoder layers. To evaluate the effect of these twotypes of skip connection on the network performance, fourdifferent models are trained and tested, i.e., (1) with bothtypes of skip connection, (2) with only concatenate connec-
tion, (3) with only residual connection, and (4) without anyskip connection. Fig. 9 shows the different testing loss ofthese four models during training and the quantitative resultsof cross validation are illustrated in Fig. 10.
C. Contributions of multi-slice inputs
As mentioned above, we used multi-slice input to combineinformation from adjoining slices so that the network canmore accurately generate reconstruction with less noise andartifact while robustly preserve original structure and details.

Fig. 6. Results from different methods for comparison. (a) standard-dose, (b) low-dose, (c) NLM, (d)BM3D, (e) AC-Net, and (f) proposed.
Fig. 7. Zoomed part in Fig. 6. (a) standard-dose, (b) low-dose, (c) NLM, (d)BM3D, (e) AC-Net, and (f) proposed.
Fig. 8. Error map of Fig. 6. (a) low-dose, (b) NLM, (c)BM3D, (d) AC-Net, and (e) proposed.
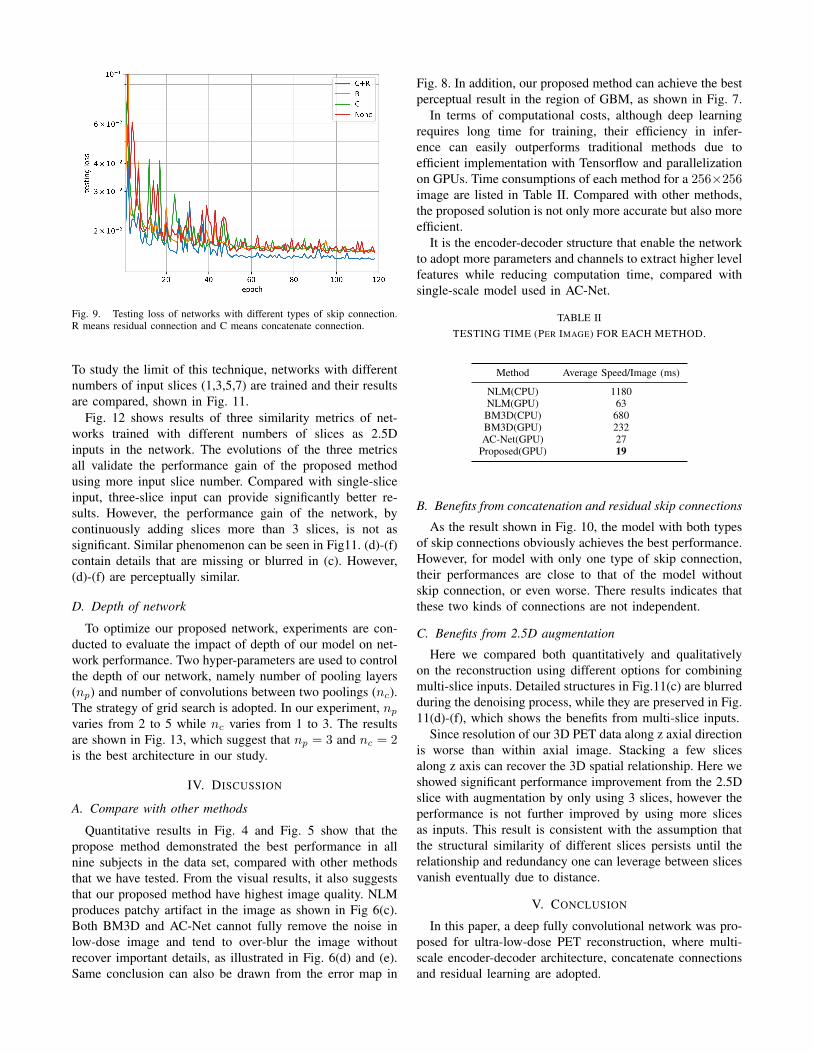
Fig. 9. Testing loss of networks with different types of skip connection.R means residual connection and C means concatenate connection.
To study the limit of this technique, networks with differentnumbers of input slices (1,3,5,7) are trained and their resultsare compared, shown in Fig. 11.
Fig. 12 shows results of three similarity metrics of net-works trained with different numbers of slices as 2.5Dinputs in the network. The evolutions of the three metricsall validate the performance gain of the proposed methodusing more input slice number. Compared with single-sliceinput, three-slice input can provide significantly better re-sults. However, the performance gain of the network, bycontinuously adding slices more than 3 slices, is not assignificant. Similar phenomenon can be seen in Fig11. (d)-(f)contain details that are missing or blurred in (c). However,(d)-(f) are perceptually similar.
D. Depth of network
To optimize our proposed network, experiments are con-ducted to evaluate the impact of depth of our model on net-work performance. Two hyper-parameters are used to controlthe depth of our network, namely number of pooling layers(np) and number of convolutions between two poolings (nc).The strategy of grid search is adopted. In our experiment, npvaries from 2 to 5 while nc varies from 1 to 3. The resultsare shown in Fig. 13, which suggest that np = 3 and nc = 2is the best architecture in our study.
IV. DISCUSSION
A. Compare with other methods
Quantitative results in Fig. 4 and Fig. 5 show that thepropose method demonstrated the best performance in allnine subjects in the data set, compared with other methodsthat we have tested. From the visual results, it also suggeststhat our proposed method have highest image quality. NLMproduces patchy artifact in the image as shown in Fig 6(c).Both BM3D and AC-Net cannot fully remove the noise inlow-dose image and tend to over-blur the image withoutrecover important details, as illustrated in Fig. 6(d) and (e).Same conclusion can also be drawn from the error map in
Fig. 8. In addition, our proposed method can achieve the bestperceptual result in the region of GBM, as shown in Fig. 7.
In terms of computational costs, although deep learningrequires long time for training, their efficiency in infer-ence can easily outperforms traditional methods due toefficient implementation with Tensorflow and parallelizationon GPUs. Time consumptions of each method for a 256×256image are listed in Table II. Compared with other methods,the proposed solution is not only more accurate but also moreefficient.
It is the encoder-decoder structure that enable the networkto adopt more parameters and channels to extract higher levelfeatures while reducing computation time, compared withsingle-scale model used in AC-Net.
TABLE IITESTING TIME (PER IMAGE) FOR EACH METHOD.
Method Average Speed/Image (ms)
NLM(CPU) 1180NLM(GPU) 63
BM3D(CPU) 680BM3D(GPU) 232AC-Net(GPU) 27
Proposed(GPU) 19
B. Benefits from concatenation and residual skip connections
As the result shown in Fig. 10, the model with both typesof skip connections obviously achieves the best performance.However, for model with only one type of skip connection,their performances are close to that of the model withoutskip connection, or even worse. There results indicates thatthese two kinds of connections are not independent.
C. Benefits from 2.5D augmentation
Here we compared both quantitatively and qualitativelyon the reconstruction using different options for combiningmulti-slice inputs. Detailed structures in Fig.11(c) are blurredduring the denoising process, while they are preserved in Fig.11(d)-(f), which shows the benefits from multi-slice inputs.
Since resolution of our 3D PET data along z axial directionis worse than within axial image. Stacking a few slicesalong z axis can recover the 3D spatial relationship. Here weshowed significant performance improvement from the 2.5Dslice with augmentation by only using 3 slices, however theperformance is not further improved by using more slicesas inputs. This result is consistent with the assumption thatthe structural similarity of different slices persists until therelationship and redundancy one can leverage between slicesvanish eventually due to distance.
V. CONCLUSION
In this paper, a deep fully convolutional network was pro-posed for ultra-low-dose PET reconstruction, where multi-scale encoder-decoder architecture, concatenate connectionsand residual learning are adopted.
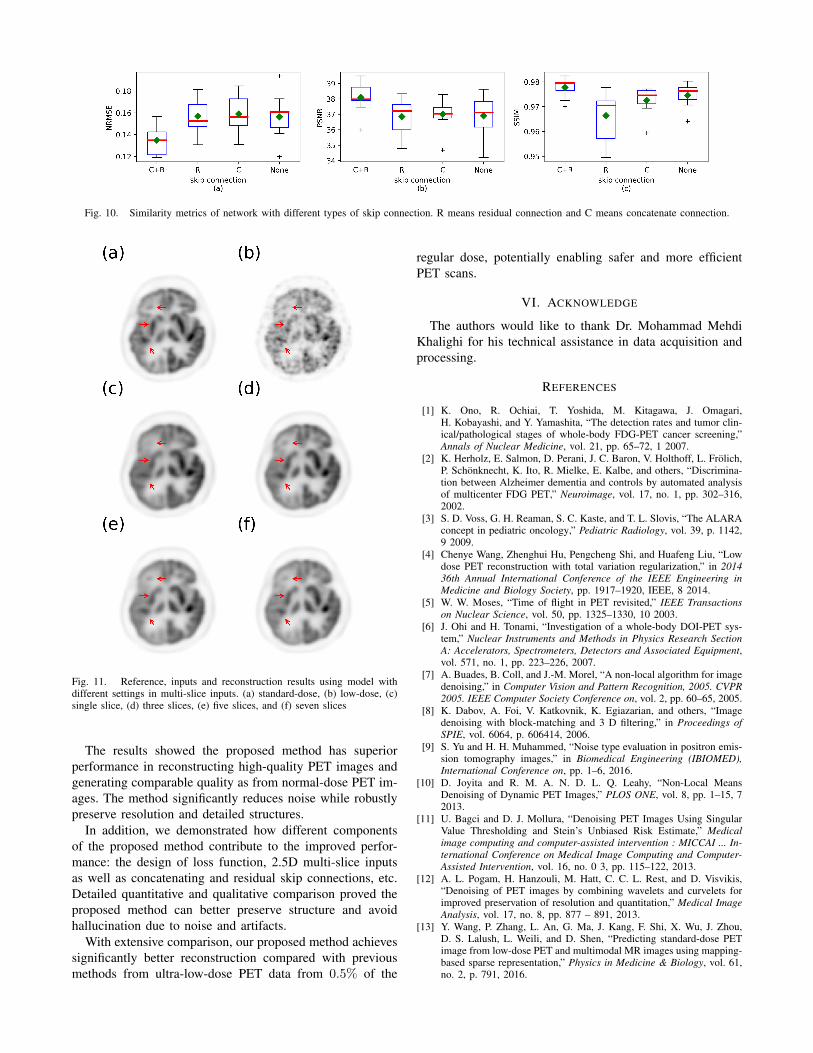
Fig. 10. Similarity metrics of network with different types of skip connection. R means residual connection and C means concatenate connection.
Fig. 11. Reference, inputs and reconstruction results using model withdifferent settings in multi-slice inputs. (a) standard-dose, (b) low-dose, (c)single slice, (d) three slices, (e) five slices, and (f) seven slices
The results showed the proposed method has superiorperformance in reconstructing high-quality PET images andgenerating comparable quality as from normal-dose PET im-ages. The method significantly reduces noise while robustlypreserve resolution and detailed structures.
In addition, we demonstrated how different componentsof the proposed method contribute to the improved perfor-mance: the design of loss function, 2.5D multi-slice inputsas well as concatenating and residual skip connections, etc.Detailed quantitative and qualitative comparison proved theproposed method can better preserve structure and avoidhallucination due to noise and artifacts.
With extensive comparison, our proposed method achievessignificantly better reconstruction compared with previousmethods from ultra-low-dose PET data from 0.5% of the
regular dose, potentially enabling safer and more efficientPET scans.
VI. ACKNOWLEDGE
The authors would like to thank Dr. Mohammad MehdiKhalighi for his technical assistance in data acquisition andprocessing.
REFERENCES
[1] K. Ono, R. Ochiai, T. Yoshida, M. Kitagawa, J. Omagari,H. Kobayashi, and Y. Yamashita, “The detection rates and tumor clin-ical/pathological stages of whole-body FDG-PET cancer screening,”Annals of Nuclear Medicine, vol. 21, pp. 65–72, 1 2007.
[2] K. Herholz, E. Salmon, D. Perani, J. C. Baron, V. Holthoff, L. Frolich,P. Schonknecht, K. Ito, R. Mielke, E. Kalbe, and others, “Discrimina-tion between Alzheimer dementia and controls by automated analysisof multicenter FDG PET,” Neuroimage, vol. 17, no. 1, pp. 302–316,2002.
[3] S. D. Voss, G. H. Reaman, S. C. Kaste, and T. L. Slovis, “The ALARAconcept in pediatric oncology,” Pediatric Radiology, vol. 39, p. 1142,9 2009.
[4] Chenye Wang, Zhenghui Hu, Pengcheng Shi, and Huafeng Liu, “Lowdose PET reconstruction with total variation regularization,” in 201436th Annual International Conference of the IEEE Engineering inMedicine and Biology Society, pp. 1917–1920, IEEE, 8 2014.
[5] W. W. Moses, “Time of flight in PET revisited,” IEEE Transactionson Nuclear Science, vol. 50, pp. 1325–1330, 10 2003.
[6] J. Ohi and H. Tonami, “Investigation of a whole-body DOI-PET sys-tem,” Nuclear Instruments and Methods in Physics Research SectionA: Accelerators, Spectrometers, Detectors and Associated Equipment,vol. 571, no. 1, pp. 223–226, 2007.
[7] A. Buades, B. Coll, and J.-M. Morel, “A non-local algorithm for imagedenoising,” in Computer Vision and Pattern Recognition, 2005. CVPR2005. IEEE Computer Society Conference on, vol. 2, pp. 60–65, 2005.
[8] K. Dabov, A. Foi, V. Katkovnik, K. Egiazarian, and others, “Imagedenoising with block-matching and 3 D filtering,” in Proceedings ofSPIE, vol. 6064, p. 606414, 2006.
[9] S. Yu and H. H. Muhammed, “Noise type evaluation in positron emis-sion tomography images,” in Biomedical Engineering (IBIOMED),International Conference on, pp. 1–6, 2016.
[10] D. Joyita and R. M. A. N. D. L. Q. Leahy, “Non-Local MeansDenoising of Dynamic PET Images,” PLOS ONE, vol. 8, pp. 1–15, 72013.
[11] U. Bagci and D. J. Mollura, “Denoising PET Images Using SingularValue Thresholding and Stein’s Unbiased Risk Estimate,” Medicalimage computing and computer-assisted intervention : MICCAI ... In-ternational Conference on Medical Image Computing and Computer-Assisted Intervention, vol. 16, no. 0 3, pp. 115–122, 2013.
[12] A. L. Pogam, H. Hanzouli, M. Hatt, C. C. L. Rest, and D. Visvikis,“Denoising of PET images by combining wavelets and curvelets forimproved preservation of resolution and quantitation,” Medical ImageAnalysis, vol. 17, no. 8, pp. 877 – 891, 2013.
[13] Y. Wang, P. Zhang, L. An, G. Ma, J. Kang, F. Shi, X. Wu, J. Zhou,D. S. Lalush, L. Weili, and D. Shen, “Predicting standard-dose PETimage from low-dose PET and multimodal MR images using mapping-based sparse representation,” Physics in Medicine & Biology, vol. 61,no. 2, p. 791, 2016.
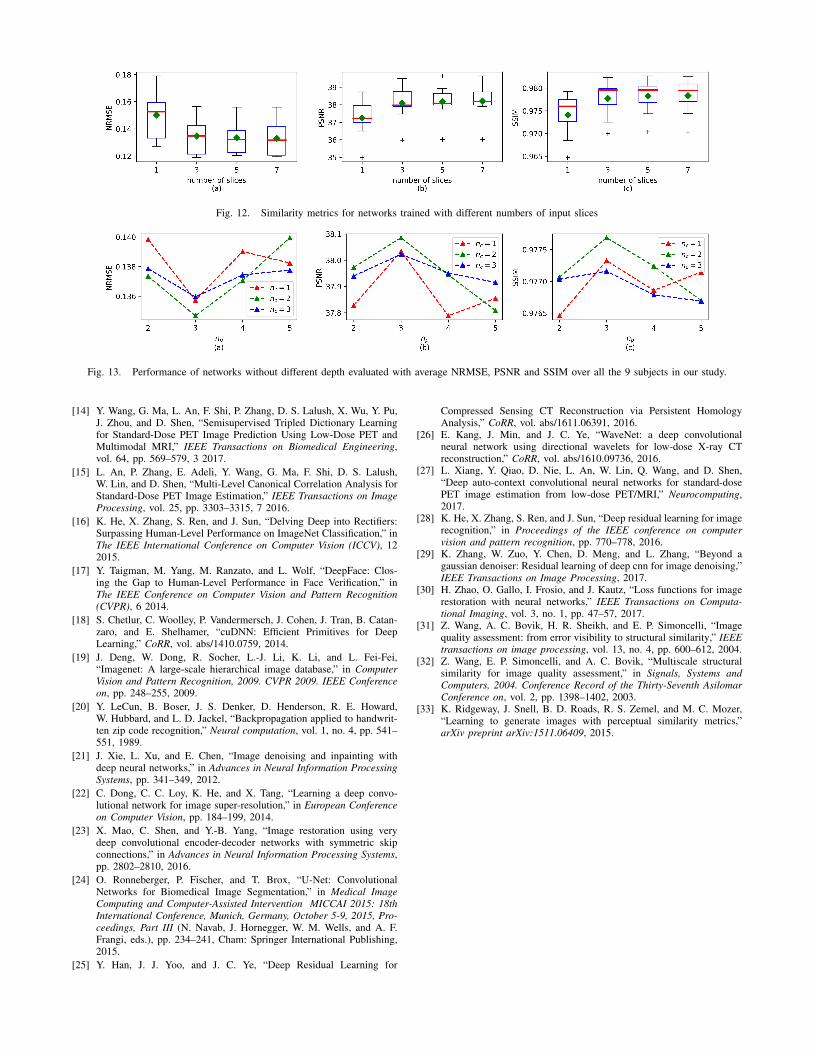
Fig. 12. Similarity metrics for networks trained with different numbers of input slices
Fig. 13. Performance of networks without different depth evaluated with average NRMSE, PSNR and SSIM over all the 9 subjects in our study.
[14] Y. Wang, G. Ma, L. An, F. Shi, P. Zhang, D. S. Lalush, X. Wu, Y. Pu,J. Zhou, and D. Shen, “Semisupervised Tripled Dictionary Learningfor Standard-Dose PET Image Prediction Using Low-Dose PET andMultimodal MRI,” IEEE Transactions on Biomedical Engineering,vol. 64, pp. 569–579, 3 2017.
[15] L. An, P. Zhang, E. Adeli, Y. Wang, G. Ma, F. Shi, D. S. Lalush,W. Lin, and D. Shen, “Multi-Level Canonical Correlation Analysis forStandard-Dose PET Image Estimation,” IEEE Transactions on ImageProcessing, vol. 25, pp. 3303–3315, 7 2016.
[16] K. He, X. Zhang, S. Ren, and J. Sun, “Delving Deep into Rectifiers:Surpassing Human-Level Performance on ImageNet Classification,” inThe IEEE International Conference on Computer Vision (ICCV), 122015.
[17] Y. Taigman, M. Yang, M. Ranzato, and L. Wolf, “DeepFace: Clos-ing the Gap to Human-Level Performance in Face Verification,” inThe IEEE Conference on Computer Vision and Pattern Recognition(CVPR), 6 2014.
[18] S. Chetlur, C. Woolley, P. Vandermersch, J. Cohen, J. Tran, B. Catan-zaro, and E. Shelhamer, “cuDNN: Efficient Primitives for DeepLearning,” CoRR, vol. abs/1410.0759, 2014.
[19] J. Deng, W. Dong, R. Socher, L.-J. Li, K. Li, and L. Fei-Fei,“Imagenet: A large-scale hierarchical image database,” in ComputerVision and Pattern Recognition, 2009. CVPR 2009. IEEE Conferenceon, pp. 248–255, 2009.
[20] Y. LeCun, B. Boser, J. S. Denker, D. Henderson, R. E. Howard,W. Hubbard, and L. D. Jackel, “Backpropagation applied to handwrit-ten zip code recognition,” Neural computation, vol. 1, no. 4, pp. 541–551, 1989.
[21] J. Xie, L. Xu, and E. Chen, “Image denoising and inpainting withdeep neural networks,” in Advances in Neural Information ProcessingSystems, pp. 341–349, 2012.
[22] C. Dong, C. C. Loy, K. He, and X. Tang, “Learning a deep convo-lutional network for image super-resolution,” in European Conferenceon Computer Vision, pp. 184–199, 2014.
[23] X. Mao, C. Shen, and Y.-B. Yang, “Image restoration using verydeep convolutional encoder-decoder networks with symmetric skipconnections,” in Advances in Neural Information Processing Systems,pp. 2802–2810, 2016.
[24] O. Ronneberger, P. Fischer, and T. Brox, “U-Net: ConvolutionalNetworks for Biomedical Image Segmentation,” in Medical ImageComputing and Computer-Assisted Intervention MICCAI 2015: 18thInternational Conference, Munich, Germany, October 5-9, 2015, Pro-ceedings, Part III (N. Navab, J. Hornegger, W. M. Wells, and A. F.Frangi, eds.), pp. 234–241, Cham: Springer International Publishing,2015.
[25] Y. Han, J. J. Yoo, and J. C. Ye, “Deep Residual Learning for
Compressed Sensing CT Reconstruction via Persistent HomologyAnalysis,” CoRR, vol. abs/1611.06391, 2016.
[26] E. Kang, J. Min, and J. C. Ye, “WaveNet: a deep convolutionalneural network using directional wavelets for low-dose X-ray CTreconstruction,” CoRR, vol. abs/1610.09736, 2016.
[27] L. Xiang, Y. Qiao, D. Nie, L. An, W. Lin, Q. Wang, and D. Shen,“Deep auto-context convolutional neural networks for standard-dosePET image estimation from low-dose PET/MRI,” Neurocomputing,2017.
[28] K. He, X. Zhang, S. Ren, and J. Sun, “Deep residual learning for imagerecognition,” in Proceedings of the IEEE conference on computervision and pattern recognition, pp. 770–778, 2016.
[29] K. Zhang, W. Zuo, Y. Chen, D. Meng, and L. Zhang, “Beyond agaussian denoiser: Residual learning of deep cnn for image denoising,”IEEE Transactions on Image Processing, 2017.
[30] H. Zhao, O. Gallo, I. Frosio, and J. Kautz, “Loss functions for imagerestoration with neural networks,” IEEE Transactions on Computa-tional Imaging, vol. 3, no. 1, pp. 47–57, 2017.
[31] Z. Wang, A. C. Bovik, H. R. Sheikh, and E. P. Simoncelli, “Imagequality assessment: from error visibility to structural similarity,” IEEEtransactions on image processing, vol. 13, no. 4, pp. 600–612, 2004.
[32] Z. Wang, E. P. Simoncelli, and A. C. Bovik, “Multiscale structuralsimilarity for image quality assessment,” in Signals, Systems andComputers, 2004. Conference Record of the Thirty-Seventh AsilomarConference on, vol. 2, pp. 1398–1402, 2003.
[33] K. Ridgeway, J. Snell, B. D. Roads, R. S. Zemel, and M. C. Mozer,“Learning to generate images with perceptual similarity metrics,”arXiv preprint arXiv:1511.06409, 2015.


![Motion Correction of Y Dose Maps with PET/MR Imaging · 2017. 1. 30. · accuracy [3]. Clinical SPECT and PET scanners are currently integrated with CT systems to enable localiza-tion](https://static.fdocuments.us/doc/165x107/5ffc5567cc1ce707e669ff8c/motion-correction-of-y-dose-maps-with-petmr-imaging-2017-1-30-accuracy-3.jpg)
![[Result] UPSC CAPF Assistant Commandant (AC) 2012 Result Announced (and PET Tips) « Mrunal](https://static.fdocuments.us/doc/165x107/56d6caf71a28ab30169c9e2a/result-upsc-capf-assistant-commandant-ac-2012-result-announced-and-pet.jpg)


![spiral.imperial.ac.uk · Web viewSeventeen healthy male volunteers received [11C]CIMBI-36 PET scans before and 3 hours after an oral dose of d-amphetamine (0.5 mg/kg). Dynamic PET](https://static.fdocuments.us/doc/165x107/61495146080bfa6260148833/web-view-seventeen-healthy-male-volunteers-received-11ccimbi-36-pet-scans-before.jpg)
