200mm Fabs Still Flexing Muscles - SEMI.ORG | to 2021 3rd update July 2017 Since Nov 2016 made 232...
30
Christian Gregor Dieseldorff 200mm Fabs Still Flexing Muscles Director Industry Research & Analysis, SEMI California
Transcript of 200mm Fabs Still Flexing Muscles - SEMI.ORG | to 2021 3rd update July 2017 Since Nov 2016 made 232...

Christian Gregor Dieseldorff
200mm Fabs Still Flexing Muscles
Director Industry Research & Analysis, SEMI California

Size is Relative
2C.G. Dieseldorff, Industry Research & Statistics Group, Copyright SEMI California

The First 200mm Facilities
IBM’s ASTC R&D/Pilot Development
Building 630, 640, 650 in Hopewell Junction (Fishkill), NY
1990: 64Mbit DRAM Project
Motorola at Oak Hill, Austin, Texas
1st commercial 200mm fab. Construction complete 1990
115K SQF manufacturing space
1991: started with 256K FSRAM
1992: Semiconductor International “Fab of the Year”
Spun off as Freescale in 2004. Since end 2015: NXP
Source: Google Maps
3C.G. Dieseldorff, Industry Research & Statistics Group, Copyright SEMI California

Size is Relative
4C.G. Dieseldorff, Industry Research & Statistics Group, Copyright SEMI California

Growth Drivers
5C.G. Dieseldorff, Industry Research & Statistics Group, Copyright SEMI California
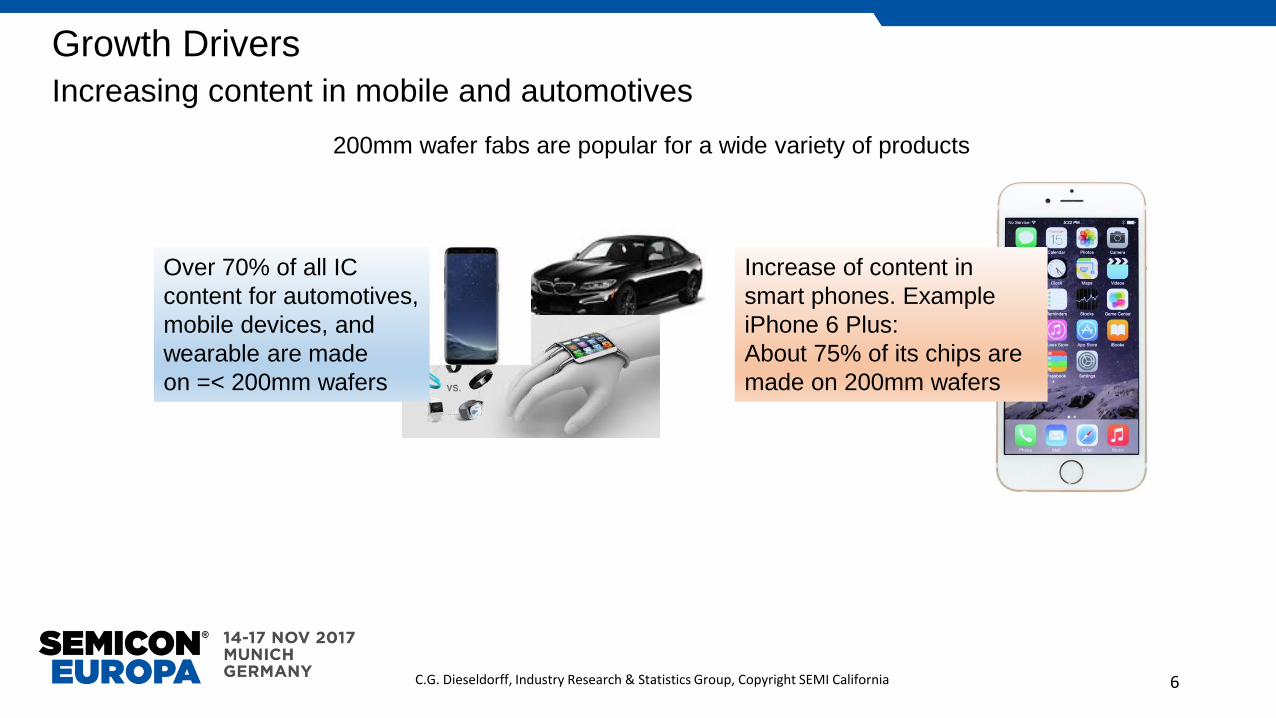
Growth Drivers
Increasing content in mobile and automotives
200mm wafer fabs are popular for a wide variety of products
Increase of content in
smart phones. Example
iPhone 6 Plus:
About 75% of its chips are
made on 200mm wafers
Over 70% of all IC
content for automotives,
mobile devices, and
wearable are made
on =< 200mm wafers
6C.G. Dieseldorff, Industry Research & Statistics Group, Copyright SEMI California

Growth Drivers
Source: Semico Research Corp. Phoenix, Arizona, November 2014
By 2020
25 Billion to 100 Billion
connected devices
Sentiment is 50 Billion
By 2035
275 Billion devices
IOT Applications
7C.G. Dieseldorff, Industry Research & Statistics Group, Copyright SEMI California
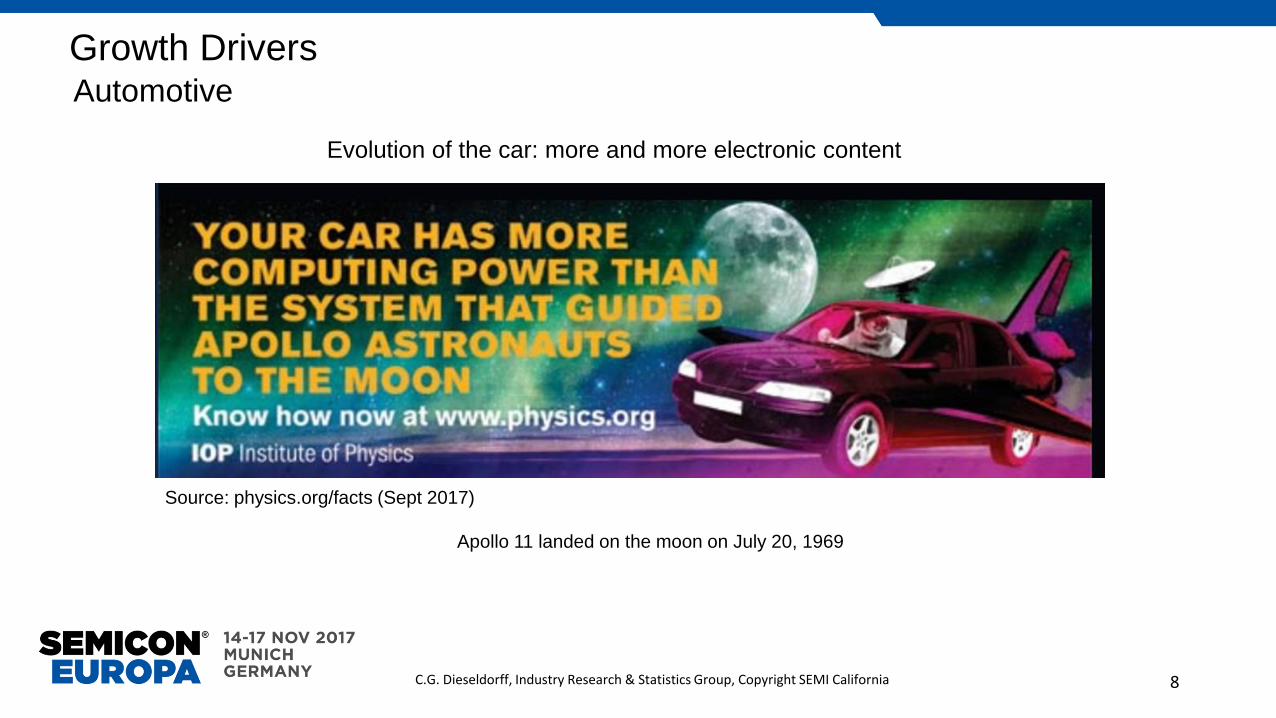
Growth Drivers
Source: physics.org/facts (Sept 2017)
Evolution of the car: more and more electronic content
Apollo 11 landed on the moon on July 20, 1969
Automotive
8C.G. Dieseldorff, Industry Research & Statistics Group, Copyright SEMI California

Growth Drivers
By 2030, automotive electronics
will account for more than half the
cost of a new vehicle
Evolution of the car: ADAS*, autonomous vehicle
More electronic content!
*ADAS: Advanced driver assistance system will allow
the vehicle to think on its own and make decisions
without driver input.
Automotive
9C.G. Dieseldorff, Industry Research & Statistics Group, Copyright SEMI California

Source: Applied Materials, Nanochip July 2015
Growth Drivers
Devices built on 200mm
Certain products find
their sweet spot
10C.G. Dieseldorff, Industry Research & Statistics Group, Copyright SEMI California

Bottleneck
11C.G. Dieseldorff, Industry Research & Statistics Group, Copyright SEMI California

Bottleneck
Contraction of 200mm Fabs
Starting 2008:
companies converted from
200mm to 300mm
200mm Fabs closed
Not closed in 2017: Infineon’s 200mm fab in Newport, Wales was acquired by Neptune 6 in September 2017
12C.G. Dieseldorff, Industry Research & Statistics Group, Copyright SEMI California

Bottleneck
Mergers & Acquisitions (M&A)
Starting 2008:
some companies went
out of business or were
acquired
13C.G. Dieseldorff, Industry Research & Statistics Group, Copyright SEMI California

Bottleneck
Mergers & Acquisitions (M&A)
Since 2015: 36 companies had mergers and acquisitions which involved fabs:
2015: 12 companies
2016: 14 companies
2017: 12 companies
2018: 4 companies
Based on the major product types of the companies involved. Double counting may apply E.g. MEMS/Foundry or Power, Analog/Mixed Signal.
Memory is Spansion
14C.G. Dieseldorff, Industry Research & Statistics Group, Copyright SEMI California

Bottleneck
Old 200mm shell finds new home
Former Hynix Fab in Eugene, found a buyer: New York-based Corning Inc. paid $13.39 million
1.2 Million Square Foot plant. Empty 200mm facility. Built in 1997. Closed since 2008.Changed ownership several times. Last owner Broadcom (Avago) since 2015
Corning makes a range of products, including optical fiber for
communications, cover glass for mobile devices and liquid-crystal
displays for TVs
No immediate plans for fab.
If it will be equipped for 200mm,
is equipment available?
15C.G. Dieseldorff, Industry Research & Statistics Group, Copyright SEMI California

Bottleneck
Availability of refurbished (used) 200mm equipment
Shortage of 200mm equipment has increased in 2015.
No new sources of used 200mm tools
Majority of tools are being absorbed by China.
End of 2015/begin of 2016: 300mm tool supply crossed over 200mm.
16C.G. Dieseldorff, Industry Research & Statistics Group, Copyright SEMI California

Capacity
17C.G. Dieseldorff, Industry Research & Statistics Group, Copyright SEMI California

Outlook to 20213rd update July 2017Since Nov 2016 made 232 changes on 132 facilities
PDF file with 90+ pages of graphs and tables
Excel file covering 2010 to 2021
Quarterly data for capacity, spending, products, nodes
130+ companies
300+ facilities
18C.G. Dieseldorff, Industry Research & Statistics Group, Copyright SEMI California

Landscape
Evaluate the landscape
19C.G. Dieseldorff, Industry Research & Statistics Group, Copyright SEMI California

Fab Count and Capacity
From end 2016 to end of 2021:
about 600K wpm capacity planned
By 2019: capacity is like it was back
in 2007 with ~5.6M wpm (but less fabs)
From begin of 2017 to end 2021:
8 additional fabs/lines will be in
operation
200mm Fabs make a come back
20C.G. Dieseldorff, Industry Research & Statistics Group, Copyright SEMI California
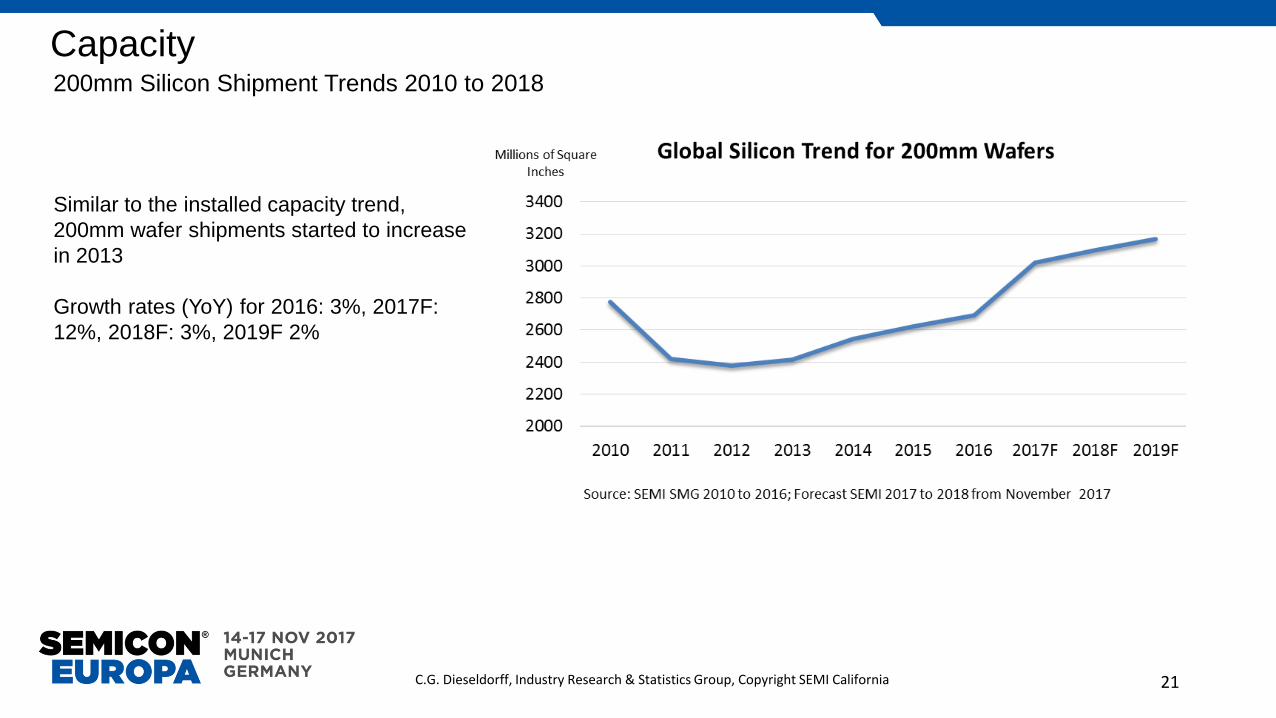
Capacity200mm Silicon Shipment Trends 2010 to 2018
Similar to the installed capacity trend,
200mm wafer shipments started to increase
in 2013
Growth rates (YoY) for 2016: 3%, 2017F:
12%, 2018F: 3%, 2019F 2%
21C.G. Dieseldorff, Industry Research & Statistics Group, Copyright SEMI California

Trends by Region
Company and Fab count
China is adding most 200mm fabs:
From 2015 to 2021: 12 fabs
(excluding EPI, LED, R&D)
22C.G. Dieseldorff, Industry Research & Statistics Group, Copyright SEMI California

Capacity Changes by Product Type
MEMS make a big leap
4Q16 to 4Q21
MEMS 55%
Power 19%
Discrete 15%
Analog 12%
Foundry 11%
Logic 5%
MPU 0%
Other 0%Source: Global 200mm Fab Outlook, Sept 2017, SEMI
Change 200mm Capacity
2017 to 2021
Driven mainly by mobile, wireless, IOT, and automotive, the 200mm market is thriving
CIS in Logic or FoundryDiscrete excludes Power
23C.G. Dieseldorff, Industry Research & Statistics Group, Copyright SEMI California

Capacity Changes by Region
China is adding most capacity
4Q16 to 4Q21
Capacity for following products:
China: Foundry, Analog, Logic, and MEMS
SE Asia: Power
Americas: MEMS and Logic
Change 2017 to 2021China 45%
SE Asia 28%
Americas 11%
Europe & ME 7%
Taiwan 2%
Japan 2%
Korea 0%Source: 200mm Fab Report, Sept 2017, SEMI
24C.G. Dieseldorff, Industry Research & Statistics Group, Copyright SEMI California

Capacity by Process Node
Certain products
found their
“Sweet Spot”
on
200mm wafers
25C.G. Dieseldorff, Industry Research & Statistics Group, Copyright SEMI California

Investments
Fab Equipment SpendingFab Construction
26C.G. Dieseldorff, Industry Research & Statistics Group, Copyright SEMI California

Fab Equipment Spending
From 2017 (including) to 2021: US$13 Billion for equipment
27C.G. Dieseldorff, Industry Research & Statistics Group, Copyright SEMI California

Fab Construction Spending
New Fab Constructions
From 2017 (including) to 2021: almost US$1 Billion for construction
China is starting
construction on 3
new fab projects
from 2017 to 2021
28C.G. Dieseldorff, Industry Research & Statistics Group, Copyright SEMI California

Summary
1. Growing electronic content for mobile, automotive, Industrial, and IoT drive the need for
devices made on 200mm wafers
2. Availability of 200mm equipment is a bottleneck
3. We expect 8 additional Fabs/lines to be in operation from 2017 to 2021
4. From 2017 to 2021, Foundries and Power devices show most capacity added but growth-wise
MEMS devices show largest increase with 55% followed by Power (19%) and Discretes (15%)
5. From 2017 to 2021, China is adding most capacity (45%) followed by SE Asia (28%) and the
Americas (11%)
6. 200mm Fabs make a come back reaching capacities by 2019 like in 2007 and adding new
Fabs
29C.G. Dieseldorff, Industry Research & Statistics Group, Copyright SEMI California

Outlook to 20213rd update July 2017Since Nov 2016 made 232 changes on 132 facilities
PDF file with 90+ pages of graphs and tables
Excel file covering 2010 to 2021
Quarterly data for capacity, spending, products, nodes
130+ companies
300+ facilities
30C.G. Dieseldorff, Industry Research & Statistics Group, Copyright SEMI California


![FREE FLEXING EXPANSION JOINTS]–-–](https://static.fdocuments.us/doc/165x107/6216b4cc41f30646a447da85/free-flexing-expansion-joints-.jpg)