
2009_2010DRAFT
268
ROCHESTER CITY SCHOOL DISTRICT 2009-10 BUDGET BOOK AND DISTRICT PROFILE BOARD OF EDUCATION Malik Evans, President Van Henri White, Vice President Thomas Brennan Melisza Campos Cynthia Elliott Willa Powell Allen Williams Sarah DeLaus, Student Representative SUPERINTENDENT OF SCHOOLS Jean-Claude Brizard CABINET Kim Dyce-Faucette, Chief of Staff Marilynn Patterson-Grant, Deputy Superintendent of Teaching and Learning John Scanlan, Deputy Superintendent of Administration Mary Doyle, Senior Director of School Innovation Ray Giamartino, Chief of Northeast Zone Michele Hancock, Chief of Human Capital Cheryl Holloway, Chief of South Zone Charles Johnson, General Counsel Susan Kaufmann, Chief of Northwest Zone Gladys Pedraza-Burgos, Chief of Youth Development and Family Services Tom Petronio, Chief Communications Officer Jeanette Silvers, Chief Accountability Officer FINANCE TEAM Joyce Martelli, Comptroller Vernon Connors, Budget Director David Adams, Manager of Financial Reporting De Lores Alexander Vickers, Clerical Support Samuel Cordaro, Senior Budget Analyst Colleen Guyett, Budget Analyst Candice Henlyshyn, Senior Budget Analyst Karen Jacobs, Principal Management Analyst Charles Kaye, Senior Management Analyst Glendine Miller, Senior Budget Analyst Elizabeth Spalty, Senior Budget Analyst ACCOUNTABILITY TEAM Gloria Sullivan, Director of Evaluation David Peelle, Administrative Analyst SPECIAL ASSISTANCE Kevin Monaghan, Senior Information Services Business Analyst Lorene Mulhern, Graphic Artist Brenda Smith, Print Shop Manager For additional information regarding the District, please visit www.rcsdk12.org
-
Upload
marybadams -
Category
Documents
-
view
217 -
download
0
Transcript of 2009_2010DRAFT

8/7/2019 2009_2010DRAFT
http://slidepdf.com/reader/full/20092010draft 1/268
ROCHESTER CITY SCHOOL DISTRICT
2009-10 BUDGET BOOK AND DISTRICT PROFILE
BOARD OF EDUCATION
Malik Evans, President
Van Henri White, Vice President
Thomas Brennan
Melisza CamposCynthia Elliott
Willa Powell
Allen Williams
Sarah DeLaus, Student Representative
SUPERINTENDENT OF SCHOOLS
Jean-Claude Brizard
CABINET
Kim Dyce-Faucette, Chief of Staff
Marilynn Patterson-Grant, Deputy Superintendent of Teaching and Learning
John Scanlan, Deputy Superintendent of AdministrationMary Doyle, Senior Director of School Innovation
Ray Giamartino, Chief of Northeast Zone
Michele Hancock, Chief of Human Capital
Cheryl Holloway, Chief of South Zone
Charles Johnson, General Counsel
Susan Kaufmann, Chief of Northwest Zone
Gladys Pedraza-Burgos, Chief of Youth Development and Family Services
Tom Petronio, Chief Communications Officer
Jeanette Silvers, Chief Accountability Officer
FINANCE TEAM
Joyce Martelli, ComptrollerVernon Connors, Budget Director
David Adams, Manager of Financial Reporting
De Lores Alexander Vickers, Clerical Support
Samuel Cordaro, Senior Budget Analyst
Colleen Guyett, Budget Analyst
Candice Henlyshyn, Senior Budget Analyst
Karen Jacobs, Principal Management Analyst
Charles Kaye, Senior Management Analyst
Glendine Miller, Senior Budget Analyst
Elizabeth Spalty, Senior Budget Analyst
ACCOUNTABILITY TEAM
Gloria Sullivan, Director of Evaluation
David Peelle, Administrative Analyst
SPECIAL ASSISTANCE
Kevin Monaghan, Senior Information Services Business Analyst
Lorene Mulhern, Graphic Artist
Brenda Smith, Print Shop Manager
For additional information regarding the District, please visitwww.rcsdk12.org

8/7/2019 2009_2010DRAFT
http://slidepdf.com/reader/full/20092010draft 2/268
BOARD OF
EDUCATION
PROFILES
MALIK EVANS
Malik Evans is serving his second
term as Board President. He is agraduate of Rochester City
Schools and the University of
Rochester. Elected in 2003, Mr.
Evans became the youngest
member ever to sit on the
Rochester Board of Education.He is a Vice President with M &
T Bank and he sits on the boards
of several organizations. A
passionate believer in the powerof education and the importance
of community service, Malik
Evans is a strong role model for
students in the City School
District.
VAN HENRI WHITE
Van Henri White was elected to
the Board of Education in 2007,
and is currently in his second
term as Vice President. Mr. White
was instrumental in drafting and
enacting a Board Policy requiringthe infusion of African/African
American studies in the District’s
K-12 curriculum, the first such
policy to be enacted in New York
State. Mr. White also drafted and
ensured the enactment of the first
of its kind “Responsible Bidder
Policy,” requiring contractors
who have violated EEOC and
Human Rights Laws to prove that
they are in compliance with those
laws before they receiveadditional funds from the District.
Van has worked tirelessly at
improving school safety,
decreasing truancy rates, and
attacking the problem of lead
poisoning. He is an outspoken
advocate for urban education,
continuously working at reversing
student dropout rates and
increasing the District’s
graduation rates.
THOMAS BRENNAN
Thomas Brennan, 51, has served
on three Rochester area elected
public school boards since 1983
(Hilton, 1983-1987; BOCES II,
1990-1994; Rochester, since
2005). For more than thirty years,in both the Rochester and
Washington, D.C. areas, he has
been a journalist, newspaper
publisher, business and public
affairs marketing consultant,
trained crisis counselor, and
certified adult literacy tutor.
MELISZA CAMPOS
Melisza Campos was elected to
the Board of Education in 2007.
She is the Vice President of
Operations and Instruction for the
Dale Carnegie Rochester office.
She is a multi-course certified
Dale Carnegie Master Trainer.
Ms. Campos serves as a voice for
the Latino community as well as
for the Rochester community as a
whole. Her focus as a Board

8/7/2019 2009_2010DRAFT
http://slidepdf.com/reader/full/20092010draft 3/268
Member is on student
achievement, community
engagement and student safety.
Ms. Campos also serves on the
board of the Bivona Child
Advocacy Center and is a
member of Latinas Unidas. She
volunteers for the RochesterHispanic Youth Baseball League
and Ibero American Action
League.
WILLA POWELL
Willa Powell was first elected to
the Board of Education in 1997
and served a four-year term. She
advanced policies strengthening
parent involvement in the District
and ensuring equitable schoolchoice for all parents and
students. She has long been an
advocate for strong leadership in
Rochester schools, accountability
for performance, and support for
student achievement.
Commissioner Powell is a PTO
member at School 23 and the
School of the Arts, and has served
as a PTSA officer at Nathaniel
Rochester Community School
and as a representative to theDistrict Parent Council.
CYNTHIA ELLIOTT
Cynthia Elliott has a passion for
Rochester’s children and families
who are economically andsocially disadvantaged. She is
committed to this population
attaining self-sufficiency.
Commissioner Elliott is Assistant
to the Executive Director of
Baden Street Settlement. She
graduated from Monroe
Community College, received her
Bachelor’s Degree from St. John
Fisher, and two Master’s Degrees,
one from SUNY Brockport and
the other from Fielding Graduate
University. Cynthia is currently
working on a Ph.D in Human and
Organizational Systems.
ALLEN WILLIAMS
Allen Williams was elected to the
Board in 2007. He ran on a platform
of raising student achievement,
increasing parental involvement and
providing financial oversight of the
District’s finances. Mr. Williams
would like to align the District’s
spending with the dual goals of
raising student achievement and
closing the achievement gap. He
brings to the Board nearly 30 years o
financial, accounting, and strategicplanning experience. Commissioner
Williams also serves on the Board of
the Landmark Society of Western
New York, the ARC of Monroe
County and the Urban League of
Rochester Economic Development
Corporation.
SARAH DELAUS
Sarah is an 11th grade student atWilson Commencement
Academy. She has been a
member of the Student
Leadership Congress for several
years and this year serves as its
President. Sarah is also Student
Representative to the Board and,
as such, attends and participates
in all Board of Education
Business Meetings, serving as the
voice of the District’s students.
She has been active in a numberof youth leadership organizations
throughout the City of Rochester,
including the Mayor’s Youth
Advisory Council and Teen
Empowerment. Sarah has served
as a student news anchor for the
District’s Students First television
show. As Sarah looks to the
future, her ambition is to be a
pediatric trauma surgeon.
8/7/2019 2009_2010DRAFT
http://slidepdf.com/reader/full/20092010draft 4/268
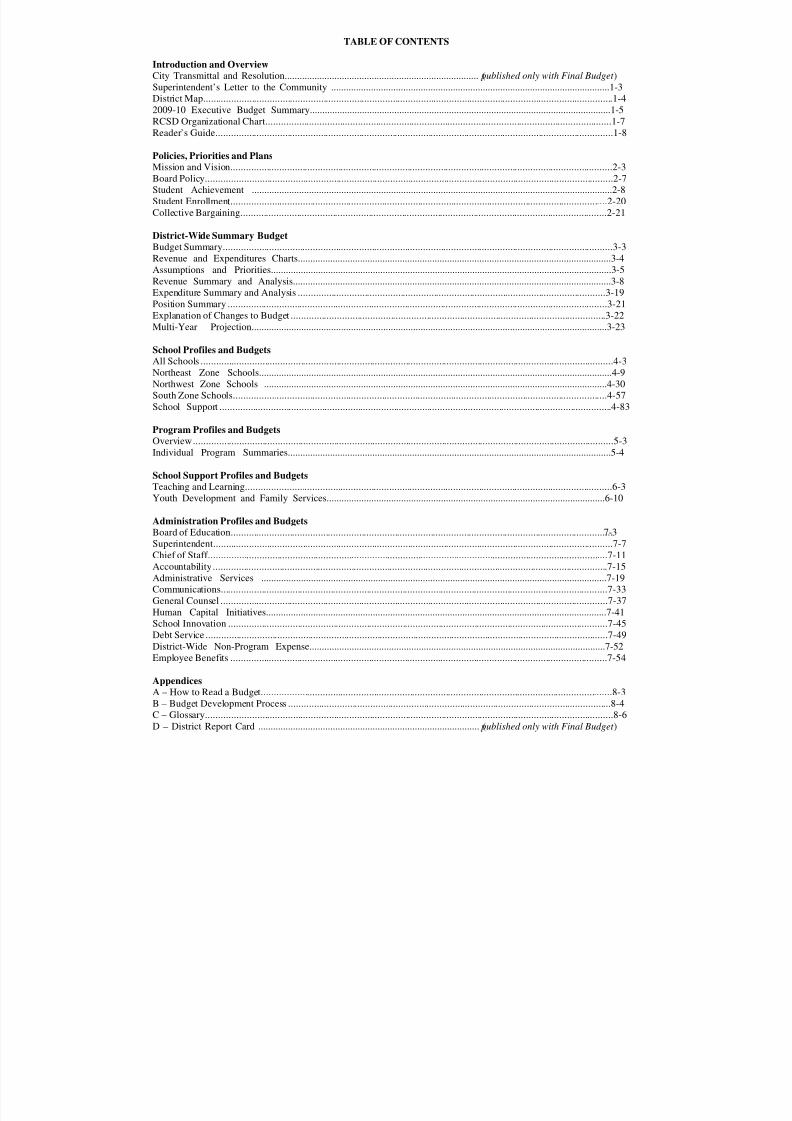
TABLE OF CONTENTS
Introduction and OverviewCity Transmittal and Resolution.............................................................................. (published only with Final Budget )
Superintendent’s Letter to the Community ................................................................................................................1-3
District Map................................................................................................................................................................1-4
2009-10 Executive Budget Summary.........................................................................................................................1-5
RCSD Organizational Chart.......................................................................................................................................1-7
Reader’s Guide...........................................................................................................................................................1-8
Policies, Priorities and PlansMission and Vision.....................................................................................................................................................2-3
Board Policy...............................................................................................................................................................2-7
Student Achievement .................................................................................................................................................2-8
Student Enrollment...................................................................................................................................................2-20
Collective Bargaining...............................................................................................................................................2-21
District-Wide Summary BudgetBudget Summary........................................................................................................................................................3-3
Revenue and Expenditures Charts..............................................................................................................................3-4
Assumptions and Priorities.........................................................................................................................................3-5
Revenue Summary and Analysis................................................................................................................................3-8
Expenditure Summary and Analysis ........................................................................................................................3-19
Position Summary ....................................................................................................................................................3-21Explanation of Changes to Budget ...........................................................................................................................3-22
Multi-Year Projection...............................................................................................................................................3-23
School Profiles and BudgetsAll Schools .................................................................................................................................................................4-3
Northeast Zone Schools..............................................................................................................................................4-9
Northwest Zone Schools ..........................................................................................................................................4-30
South Zone Schools..................................................................................................................................................4-57
School Support .........................................................................................................................................................4-83
Program Profiles and BudgetsOverview....................................................................................................................................................................5-3
Individual Program Summaries..................................................................................................................................5-4
School Support Profiles and BudgetsTeaching and Learning...............................................................................................................................................6-3
Youth Development and Family Services................................................................................................................6-10
Administration Profiles and BudgetsBoard of Education.....................................................................................................................................................7-3
Superintendent............................................................................................................................................................7-7
Chief of Staff............................................................................................................................................................7-11
Accountability..........................................................................................................................................................7-15
Administrative Services ...........................................................................................................................................7-19
Communications.......................................................................................................................................................7-33
General Counsel .......................................................................................................................................................7-37
Human Capital Initiatives.........................................................................................................................................7-41
School Innovation ....................................................................................................................................................7-45
Debt Service .............................................................................................................................................................7-49
District-Wide Non-Program Expense.......................................................................................................................7-52
Employee Benefits ...................................................................................................................................................7-54
AppendicesA – How to Read a Budget.........................................................................................................................................8-3
B – Budget Development Process ..............................................................................................................................8-4
C – Glossary...............................................................................................................................................................8-6
D – District Report Card ......................................................................................... (published only with Final Budget )
8/7/2019 2009_2010DRAFT
http://slidepdf.com/reader/full/20092010draft 5/268
IntroductIon andovervIew
City TransmittalResolutionSuperintendent’s Letter to the Community District Map2009-10 Executive Budget Summary
RCSD Organizational ChartReader’s Guide
Introduction and Overview 2009-10 Draft Budget

8/7/2019 2009_2010DRAFT
http://slidepdf.com/reader/full/20092010draft 6/268

8/7/2019 2009_2010DRAFT
http://slidepdf.com/reader/full/20092010draft 7/268
SUPERINTENDENT’S LETTER TO THE COMMUNITY
This year, the budget we are sharing with you reflects the beginning of a journey, which placesthe Rochester City School District squarely on the course to become one of the nation’s most
effective and well-run urban school districts. We start this journey however, during one of the
most difficult financial periods in the history of our nation, state and city.
In working through what were often grueling budget sessions this year, we were pushed to
prioritize spending and asked ourselves repeatedly – “Does this investment support our primary
‘WHAT’ – the needs of our students?”
This budget aligns dollars with programs that promote and improve language literacy at every
grade level. Additional funding was identified to improve mathematic competency for all
elementary and middle school children. Supported by this elementary educational base, other
dollars were identified to dramatically change the levels of teaching and learning taking place at
our high schools. This focus effectively aligns our limited funding with a citywide priority to
create college-ready students, as measured by progress towards our target of a 75% graduation
rate by 2012.
We discovered that we needed to reshape and resize our central office to become even more of a
“student focused” team for our schools, our families, and our students and to make sure we are
doing our very best by you, the taxpayer. This redesign aligns all work around our instructional
programs. We believe our proposed budget maximizes this focus to more effectively deliver
educational services to all students, using decisions based on sound data and sound financial
practices.
To support our academic work in schools, we are also beginning a multi-year budget redesign that
will give school principals more control of the resources they need to educate the children in their
schools. Their increased control of financial resources will support the principals’ accountability
for closing achievement gaps and advancing the learning of every child, each year they are in our
District schools.
We have an obligation to you to be financially sensible. We will no longer operate our schools
and programs with the anticipation of ever increasing revenue from the state and city. In
developing this budget, we collected input from staff, parents, and the community. This work
helped us identify where we needed to make changes, and how to make these changes in a cost-
neutral fashion, leveraging the larger realignment of existing resources.
We also have an obligation to our students to make sure we continue demonstrated effective work
and maintain innovation and creativity in our initiatives, despite the fiscal challenges we face. We
believe our proposed budget, despite fiscal adversity, continues to help us teach and graduate
student citizens who are ready to take on higher education or a career – or both – and be part of a
globally competitive environment in which they’ll thrive.
Sincerely,
Jean-Claude Brizard
Superintendent
Section 1 Page 3
Introduction and Overview 2009-10 Draft Budget

8/7/2019 2009_2010DRAFT
http://slidepdf.com/reader/full/20092010draft 8/268
Section 1 Page 4
Introduction and Overview 2009-10 Draft Budget

8/7/2019 2009_2010DRAFT
http://slidepdf.com/reader/full/20092010draft 9/268
2009-10 EXECUTIVE SUMMARY
Welcome to the 2009-10 recommended budget for the Rochester City School District. Thispresentation of the budget is the first year of our multi-year comprehensive financial redesignwhich moves the focus of budgeting toward our schools. This redesign will give schoolprincipals more control of their resources to better educate the children in their school. The
increased control of financial resources will support the principal’s accountability for closingthe achievement gaps and advancing the learning of every child in the school. This redesignalso supports our core values of:
Achievement – Improving student achievement through a laser-like focus on teachingand learning with an emphasis on results.
Equity – Equitable distribution of resources based on the needs of schools and students.
Accountability – Use of data to ensure that we hold adults accountable for the successof all students.
You will notice that this year’s budget book has a much larger and more extensive presentation
of the budgets that support schools. This is the beginning of our school and needs-basedbudgeting and the development of transparency around the budgeting process. Moving thefocus to schools will also align our funding to support the Superintendent’s “whats”, theobjectives and goals, that will allow us to advance our efforts to ensure that all students reachtheir fullest potential and attain academic proficiency. These “whats”, our main focus areas,have been identified as increased improvement in ELA proficiency, Math proficiency,graduation rates, and school safety. This focus continues the ongoing efforts of school reform.In developing the budget, the financial plan for carrying out the missions of our schools, weconcentrated on the same objectives and goals.
Developing the budget this year was extremely difficult as we acknowledged the challengingeconomic climate that has decreased our revenue and our resources. Not only are we faced withincreasing costs in most areas, but also a long standing $50 million structural deficit. Programs
and projects have been reviewed with increased scrutiny of students served, outcomes,benchmarking results and dollars spent per student.
Adding to our internal challenges is the impact of the New York State struggle to respond to itsown budget deficit. The Governor of New York has proposed a decrease in educational aid.The approximate amount for our District is a $10.1 decrease from our 2008-09 budget.Although there have been discussions at the State level of “making Districts whole”, it isunknown as to what this means to the Districts. In addition, it is still unknown the amount andthe timing of President Obama’s stimulus package for education. This package does come withconstraints on how dollars can be used. The funding is to be used within Title I and IDEAprogram guidelines and may increase compliance measures within the District. All this will putsignificant pressures on and continue to challenge the District’s ability to maintain what we dotoday and continue to make progress towards our priority focus areas. We continue to support
efforts that will allow our students to reach their fullest potential and attain academicproficiency.
This budget serves as the District’s financial operating plan with the best information that wehave to date. As the State completes its budget process and the stimulus package becomesfinalized, we will amend and update the budget through our normal budget process. Along withthe cuts required to produce a balanced budget, we have developed a priority list of programsthat support the Superintendents “whats” which could be enhanced by additional funding if itbecomes available.
Section 1 Page 5
Introduction and Overview 2009-10 Draft Budget

8/7/2019 2009_2010DRAFT
http://slidepdf.com/reader/full/20092010draft 10/268
FINANCIAL HIGHLIGHTS AND ANALYSIS
The District began the budgeting process with estimated revenue of $686,869,423 which is a$4,468,022 decrease from the 2008-09 amended budget. Although the District is planning foran estimated $10.1M reduction in State funding, the increase in Federal aid has largely offsetthis loss.
With this reduction, the District needed to decrease projected expenditures based on theanticipated increase of prior year’s cost structure. Accounts were analyzed for spendingpatterns and potential reduction opportunities. The 2009-10 budget reflects a number of cuts,touching all areas of the district, from central office to schools. Personnel cuts had the largestimpact on the budget. This was necessary because of reduced revenue and the steady decline inenrollment over the past several years. Large percentage decreases were also taken in spendingcategories with the least amount of impact to students such as travel, out of district, meals,office supplies, professional books and publications, temporary personnel, and membershipfees. Programs that under performed, provided service to a small number of students, or hadextremely high cost per student were also reduced. Additional reductions were taken byeliminating open security and central office positions and deferral of Capital Improvement
projects.
The District also has plans to decrease the cost of health insurance that this year aloneexperienced a 29.4% increases in premiums. Progress is being made to move from communitybased rating to rating based on our own experience.
Programs and services included in 2008-09 will continue in the 2009-10 budget to the extentpossible. When details of the Federal stimulus package are known, the District may buy-back or increase programs or services based on the priority plan developed during the budget process.
.7_BUDGET CONCERNS
Federal Stimulus funding. The Federal government recently passed the Federal StimulusPackage. This funding will be used to enhance the core values of the District in Title I andIDEA programs. The amount that has been used in planning is $17.3M. It is unknown as towhen this money will be received by the District.
State budget will not be finalized before the adoption of the District budget. As previouslynoted, the District is experiencing a decrease in State funding due to the Governor’s ProposedBudget. The uncertain status of the amount of this decrease and whether the funds will bereinstated by legislation or additional Federal funding is unknown. Restoration of State fundingto 2008-09 levels would allow for reinstatement of some programs and services.
Increase in compliance measures. Federal and State funding sources have increased
compliance measures. This increase places additional work on program and office staff. As aresult additional funding will be required to increase staff or to allow for overtime.
CONCLUSION
The 2009-10 District budget has been challenging. In future years the need to continue ourdiligent fiscal management will be necessary to lessen the reliance on our fund balances. Beassured that as we continue to work to enhance our resources and reduce our costs, our focuswill remain on providing the highest education possible for our children.
Section 1 Page 6
Introduction and Overview 2009-10 Draft Budget
8/7/2019 2009_2010DRAFT
http://slidepdf.com/reader/full/20092010draft 11/268
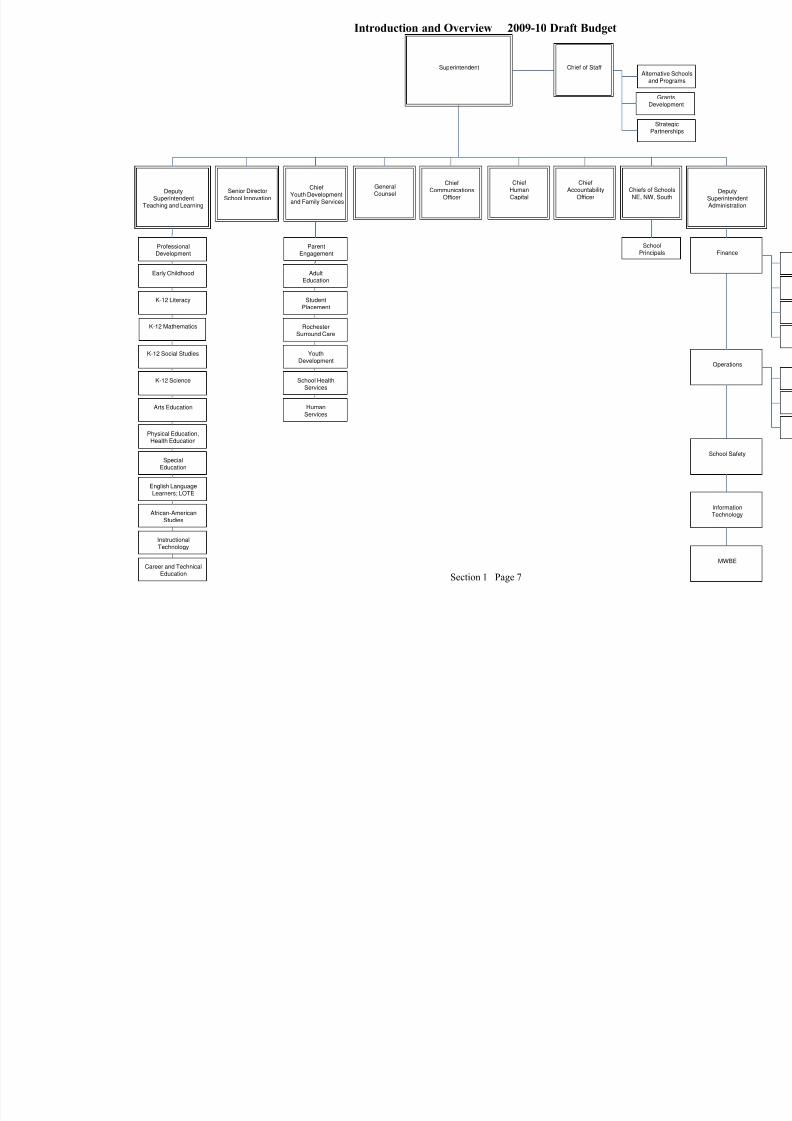
Superintendent Chief of Staff
StrPart
Senior Director
School Innovation
ChiefYouth Developmentand Family Services
GeneralCounsel
ChiefCommunications
OfficerDeputy
SuperintendentTeaching and Learning
ChiefHuman
Capital
ChiefAccountability
Officer
Chiefs of Sch
NE, NW, So
ProfessionalDevelopment
Early Childhood
K-12 Literacy
K-12 Social Studies
K-12 Science
Arts Education
Physical Education,Health Education
SpecialEducation
English LanguageLearners; LOTE
African-AmericanStudies
InstructionalTechnology
Career and TechnicalEducation
ParentEngagement
AdultEducation
StudentPlacement
RochesterSurround Care
YouthDevelopment
School HealthServices
Human
Services
SchoolPrincipal
Alternatand P
GDeve
K-12 Mathematics
Section 1 Page 7
Introduction and Overview 2009-10 Draft Budget
8/7/2019 2009_2010DRAFT
http://slidepdf.com/reader/full/20092010draft 12/268
READER’S GUIDE
Presentation of the Budget
We are pleased to provide you with the 2009-10 Budget for the Rochester City School District.
This is the first year of a multi-year process in which RCSD will be moving to school-based
budgeting. The budget approach is designed to devolve the decisions on how to use variousresources to the individual schools. This approach will give the principals more control and
accountability for the success of their staff and students. During this transition, there will still be
services maintained by the Central Office. In general, these services will be instructional and
operational support. RCSD has submitted a balanced budget for the fiscal year beginning July 1,
2009 and ending June 30, 2010. The budget will be submitted for acceptance by the Mayor and
City Council.
Our presentation of the budget is to provide the reader with a comprehensive and concise guide to
District policies and plans, schools and programs, and the overall operation of the District. The
book is divided into several distinct sections for your ease. The Table of Contents lists each of
these units with subsections listed within the various units.
Profiles are brief and meant to provide a succinct overview. Additional information on individual
schools and programs is available on the District website. As always, we will be pleased to
provide you with more information on various areas of our District.
The 2009-2010 Budget contains comprehensive school budget cost centers for all schools in the
Rochester City School District. In addition, a separate capital fund exists for the District’s
Capital Improvement Program (CIP). The CIP budget document is provided separately to the City
of Rochester.
Budget Documentation
Each section will contain an overview of RCSD’s funding sources and total expenditures.Sections are provided in alignment with the current organizational structure. The first section of
the book will provide you with an overview of the entire District.
You will find information on a particular school within the School Profile section. This section
will include budgets and statistics for each school. Schools are located by their zones and then
numerically for elementary schools and alphabetically for secondary schools.
Information on district-wide programs can be found in the Program Section. Information on
District services, such as Finance or Information Technology, is located in the Administrative
Services Section.
Section 1 Page 8
Introduction and Overview 2009-10 Draft Budget

8/7/2019 2009_2010DRAFT
http://slidepdf.com/reader/full/20092010draft 13/268
Each section will include:
Management Financial Discussion and Analysis (MFDA)
Function overview
Year-to-year comparison information with projected changes by dollar and percentage
A Position Summary is also included in the School, School Support, and Administrative Services
sections which shows the staffing level for the prior year, current year and next year (proposed
2009-10).
The Appendix Section has been expanded this year to aid in your understanding of budgeting and
the budget process.
Additional Budget Information
The complete publication is available in several formats:
A PDF can be found on the website at www.rcsdk12.org;
A printed, bound copy or a CD is available by contacting the Communications Office at
RCSD, 131 West Broad Street, Rochester, New York 14614, 585-262-8363
Section 1 Page 9
Introduction and Overview 2009-10 Draft Budget

8/7/2019 2009_2010DRAFT
http://slidepdf.com/reader/full/20092010draft 14/268
8/7/2019 2009_2010DRAFT
http://slidepdf.com/reader/full/20092010draft 15/268
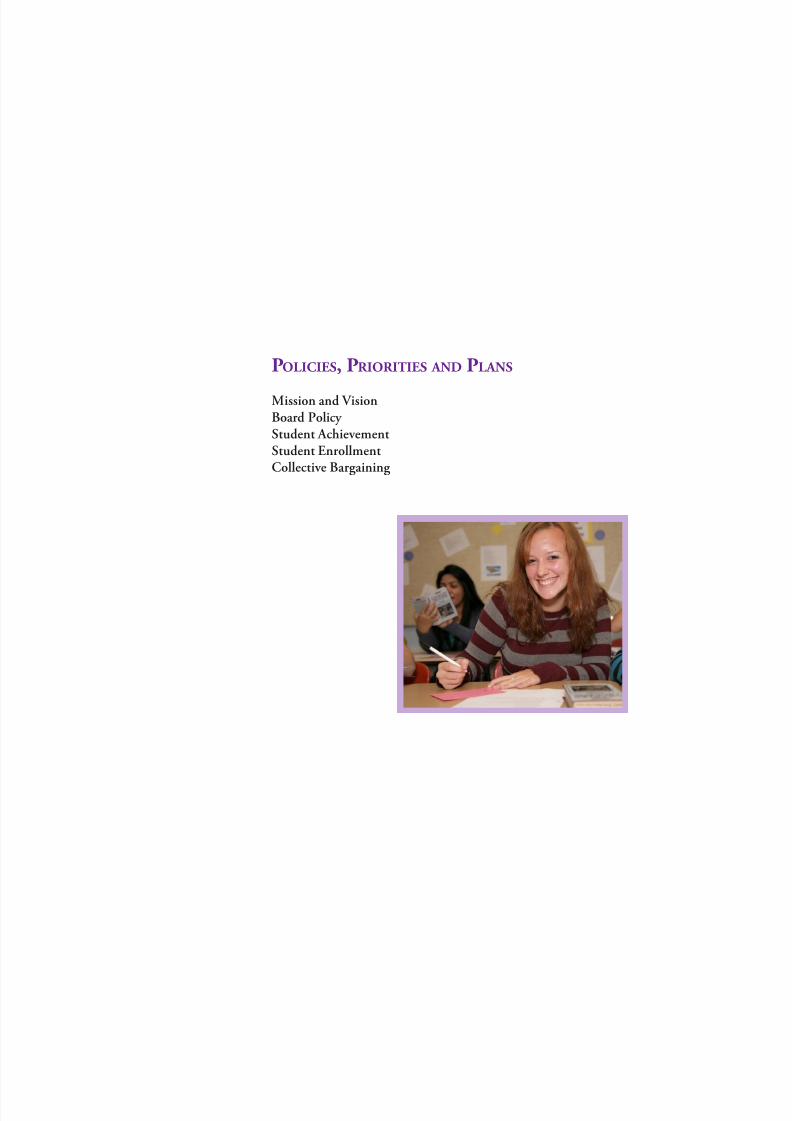
PolIcIes, PrIorItIes and Plans
Mission and VisionBoard Policy Student Achievement
Student EnrollmentCollective Bargaining

8/7/2019 2009_2010DRAFT
http://slidepdf.com/reader/full/20092010draft 16/268
THIS PAGE INTENTIONALLY LEFT BLANK
Section 2 Page 2
Policies, Priorities and Plans 2009-10 Draft Budget
8/7/2019 2009_2010DRAFT
http://slidepdf.com/reader/full/20092010draft 17/268
MISSION AND VISION
Over the last year, the Rochester City School District has started on a new path towards
“Ensuring that every child in Rochester has access to world class content taught by world class
teachers in schools led by world class leaders.” The road to closing achievement gaps and
improving learning in our District began years ago, but our aim is to accelerate our work so that
our students can meet the challenges of an ever-changing global marketplace. As with anyjourney, unplanned and unanticipated forces, such as an overwhelming state budget crisis will
attempt to derail our work. We are prepared and ready to handle all of these challenges and we
must prevail. The sign posts that guide our steps and set our direction are reflected in our Core
Values.
• Achievement – Improving student achievement through a laser-like focus on
teaching and learning with an emphasis on results.
• Equity - Equitable distribution of resources based on the needs of schools and
students.
• Accountability – Use of data to ensure that we hold adults accountable for the
success of all students.
The path that the District is taking can be compared to an aircraft traveling across the country.
Like the aircraft, the district’s journey is a series of corrections to a planned course. These
periodic updates and adjustments ensure that the aircraft maintains its track over the ground and
arrives at its planned destination. As outlined in Lawrence Gonzales’s Deep Survival: Who Lives,
Who Dies, and Why, we plan a flight, we fly the plan but we don’t fall in love with the plan.
Formative information must inform corrections to the plan. Similarly, we have started a process
of periodic assessments to check the success of our students and our course as we work to
improve student learning. We have moved from a summative assessment approach to one that
includes both end-of-year and just-in-time information for schools and teachers.
This year we have established our “flight plan” with a well-defined curriculum and clear academic goals. These goals include school specific performance targets in literacy and
mathematics for all grade levels, as well as secondary graduation targets to deliver post-secondary
ready students to our nation’s colleges and work force.
We have begun to build a highly competent “crew” to manage our plan. We will ensure the
District arrives at the planned destination by selecting and training both administrators and
teachers on the “how” required to increase student learning. We have started strategic reviews of
all of our instructional programs, practices and arrangements to ensure a measurable contribution
to our children’s academic success.
Just as an airline crew monitors progress on the aircraft’s “dashboard” instruments, we are
developing our own dashboard that will allow us to monitor and check our performance in everyclassroom and school within the District. Parents, teachers and students will be able to easily
review academic performance and state assessments. Principals, District staff and community
members will also be able to monitor the operation of the District at the building, zone or District
level.
Section 2 Page 3
Policies, Priorities and Plans 2009-10 Draft Budget
8/7/2019 2009_2010DRAFT
http://slidepdf.com/reader/full/20092010draft 18/268
Finally, using this performance data we will be able to recognize the need for corrections, apply
the appropriate academic interventions and make adjustments to the way we teach our children.
Accountable Budget Book: As a first step on this journey, the Rochester team studied in depth
the budgets of several urban school districts across the country. We learned that other school
boards and communities were receiving budget documents that were revolutionary compared to
our own. Borrowing the best examples from these districts, the finance department developed abasic template that would not only help align our funding with the mission and goals of the
District, but one that would be easier for the public to understand.
It was recognized that the dollars in our budget provide the “fuel” for the academic engine that
moves schools towards their goals. Alignment of the dollars is directed to schools so that
principals have the resources and the accountability to help their students learn, achieve and
succeed.
This change is evident by the creation of a new section of the budget book that provides a budget
and performance snapshot for each of the District’s schools. Now on a single page, readers can
at a glance see student populations, staffing ratios, key academic indicators and top level budget
data. This transparency is a first step towards improving the equitable distribution of resourcesbased on the needs of the students in each school. As the budget was built, questions were asked
to ensure dollars could be mapped to high level priorities (Improvements in Literacy and
Mathematics and increased cohort graduation rates) and the District’s improvement agenda.
Similarly, dollars used to support schools must be spent on projects that increase the effectiveness
of operations and improve student and staff satisfaction and success. With a critical need to
reduce the budget bottom line, we looked at where reallocation of dollars could be made
consistent with the District’s vision and supported by performance outcome data. Investments
were made that supported the strategic use of people, time and money, and delivered
accountability for student results or efficient operations. In the coming years, these decisions will
be made at the school level based on the unique needs of each academic community.
As with schools, operational leadership and managers were asked to reduce the cost of doing
business, eliminate waste in our processes and stop spending that did not directly support
academic goals. Due to the significant reduction in revenue and a long standing structural budget
deficit, departments were asked to plan for operations that were at least 10% below the baseline
2008-2009 budget. We did accomplish closing the structural deficit by reductions in staff levels
as well as a reduction in operating expenses.
Academic performance, student needs and required support levels define the needs. The budget
aligns resources to succeed in each of those needs. Clearly, it is not just how much money is
spent, but how does that expenditure support our desired outcomes. This budget is the just the
first step toward meeting those objectives. We can no longer create a plan to do a little less of
everything, a little less well. We must begin to make decisions that support the strategy, arecentered on priority outcomes and that improve the learning opportunities for every student. We
must fund the “hows” that produce increased results that are orders of magnitude above our
current academic performance.
Section 2 Page 4
Policies, Priorities and Plans 2009-10 Draft Budget

8/7/2019 2009_2010DRAFT
http://slidepdf.com/reader/full/20092010draft 19/268
Board Goals
The Board’s goals provide a framework to align the District work and support the
Superintendents plan for improvement.
Instructional Alignment
-Student Achievement
-Support the work of closing the achievement gap among sub groups
-Increase Post-Secondary Readiness
-Decrease the number of suspensions
-Increase the graduation rate
Operational Excellence
-Advocate and monitor MWBE goals and strategy
-Involvement in oversight in finances and Capital Improvement process
-Advocate District's long range facilities plan as it relates to the facilities Modernization project
-Support the hiring and evaluation of the best qualified staff
Stakeholder Connection & Satisfaction
-Demand a customer focused Culture
-Support the development of the Rochester Surround Care Community Corporation
-Create and sustain partnerships
-Support Parent Participation (school climate surveys)
The three pillars of instructional alignment, operational excellence and stakeholder connection
and satisfaction ensure the District operates effectively and works with community members.
Superintendents Goals
► Goal 1 - Develop a plan for accelerating student achievement that builds on the
successful work of school administrators, teachers, and previous administrations.
► Goal 2 - Ensure effective District governance through positive and productive Board-
Superintendent relationships.
► Goal 3 - Establish public trust and confidence through open and honest communication
and positive relationships among stakeholder groups.
► Goal 4 - Increase organizational effectiveness and efficiency.
► Goal 5 - Establish a clear and definitive strategy to address factual and perceptual issues
related to school safety, security, and climate for all schools.
Section 2 Page 5
Policies, Priorities and Plans 2009-10 Draft Budget
8/7/2019 2009_2010DRAFT
http://slidepdf.com/reader/full/20092010draft 20/268
State Budget Crisis: From early November through the present, the District has been working on
solving the state budget crisis as it applies to the Rochester City School District. Using the lens
of this budget book to examine the organization department by department and school by school,
we focused on creating the foundation for resource alignment and equity.
Collective Bargaining: Finally, this year the Rochester City School District and its collective
bargaining partners will be looking at our agreements and working to create the most effectivework environment in order to deliver the best education for our students. Collective bargaining is
an important but complex process that is defined not only by local agreement, but by state andfederal law. This is important work for everyone concerned, made even more so this year as a
result of the extreme budget pressures and declining revenue the District faces. The results of
that work, however, will have a large impact on our ability to execute this balanced budget and
throughout the district will have implications for our city for years to come.
Conclusion: The journey has commenced and we have seen good progress in our initial stages.
Certainly there will be bumpy times ahead as we work diligently for every Rochester child.
“Where do we want to go and how will we get there?” We will be finalizing the District’s
strategic plan in the coming months. As a team we have packed our bags for this journey and put
our best foot forward, selecting a new superintendent, building this budget book, setting initialgoals and implementing key strategic programs. We must monitor our progress closely but we
will continue the journey.
2p1.21_
Section 2 Page 6
Policies, Priorities and Plans 2009-10 Draft Budget

8/7/2019 2009_2010DRAFT
http://slidepdf.com/reader/full/20092010draft 21/268
ROCHESTER CITY SCHOOL DISTRICT BOARD OF EDUCATION BUDGET POLICIES
BUDGET HEARING (Policy 6120)
The Board of Education will hold a public hearing on the superintendent’s proposed budgetduring the month of April. This hearing will be held at a facility designated by the Clerk to the
Board. Those wishing to address the Board must sign up in advance with the Board office and
will receive two (2) minutes to address the Board. Individuals will be subject to the District’s
Code of Conduct during the meeting. The purpose of this hearing is to provide the Community
with an opportunity to express their interests and concerns on the superintendent’s proposed
budget to the Board prior to the Board’s deliberations, final decisions, and subsequent adoption of
the budget the district will operate under for the following fiscal year.
Approved by the Board of Education, December 19, 2002
BUDGET ADOPTION (Policy 6130)
The Board of Education will adopt the budget proposal for the coming fiscal year at a Special
Meeting of the Board of Education ten days prior to the deadline for submission to the City of
Rochester. Upon adoption, the Administration will transmit the approved budget document to
City Hall for its inclusion in the City of Rochester’s budget submission to City Council in
accordance with statutory and regulatory requirements. The Board will participate in the City
Council of Rochester’s public hearing on the district’s budget as set forth on the City Council
calendar.
Approved by the Board of Education, December 19, 2002
Section 2 Page 7
Policies, Priorities and Plans 2009-10 Draft Budget

8/7/2019 2009_2010DRAFT
http://slidepdf.com/reader/full/20092010draft 22/268
STUDENT ACHIEVEMENT
District Mission Statement
“The mission of the Rochester City School District is to educate each student to the highest levels of
academic performance and to foster each student’s social and emotional development. We partner withfamilies, caregivers, and the Rochester community to prepare students to meet or exceed standards and to
become lifelong learners, productive members of the workforce, and responsible, contributing citizens.”
Background
The Rochester City School has adopted several research-based initiatives to build a foundation of
effective programs to raise student achievement. These initiatives include smaller class sizes and
increased time for student learning through extended day, summer school programs, academic
intervention, and support during the school day. The primary focus is to provide literacy and numeracy
development to help students meet New York State standards in English Language Arts and mathematics.
As a result of this focus, the District has seen improvement in student achievement in ELA andmathematics. From 2005-06 to 2007-08, the District improved from 38.4% to 47% of students attaining
proficient or advanced on the New York State English Language Arts Assessment (NYS ELA). In the
same period, the District improved from 33.1 % to 54.6% of students attaining proficient or advanced on
the New York State Mathematics Assessment (NYS Math). The charts below illustrate overall
performance on the New York State Assessments from 2005-06 to 2007-08 for grades 3-8. The data in
this summary is accurate as of March 1, 2009.
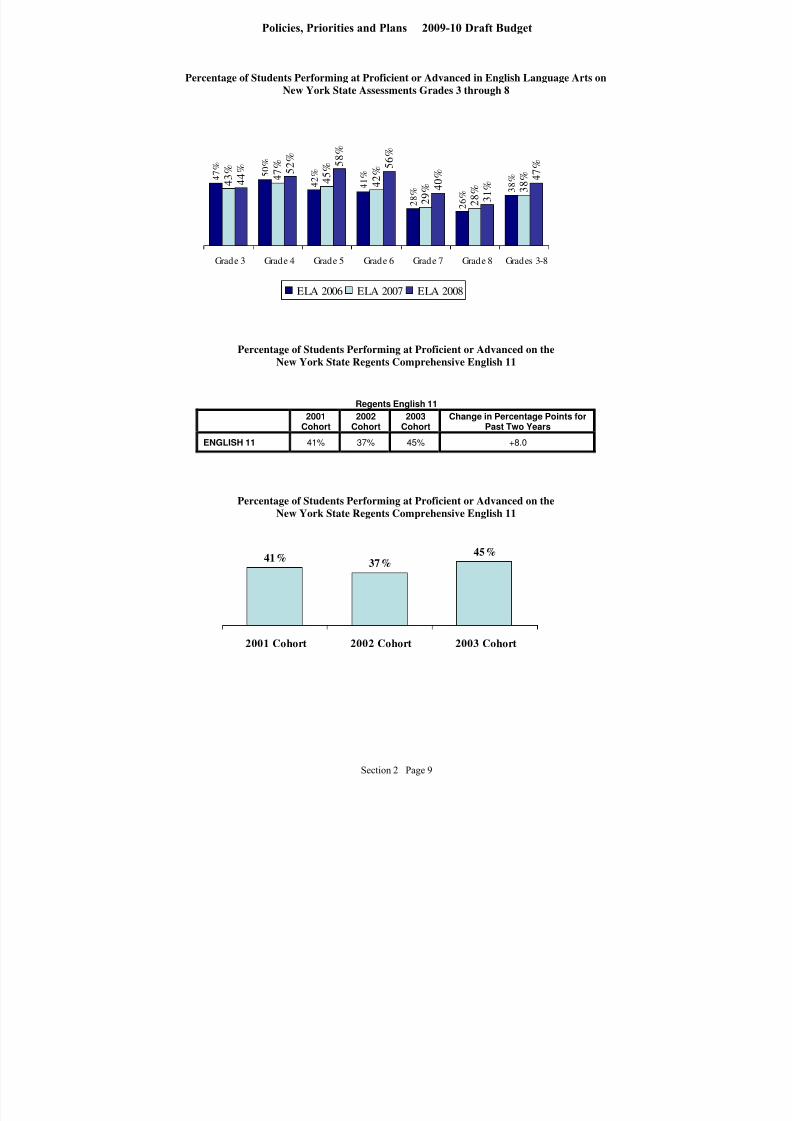
Percentage of Students Performing at Proficient or Advanced in English Language Arts on
New York State Assessments Grades 3 through 8
NYS ELA Grades 3-8
*2005-06 2006-07 2007-08Change in Percentage
Points for Past Two Years
ELA-3 47.3% 43.0% 44.0% +1.0
ELA-4 50.1% 47.4% 52.0% +4.6
ELA-5 41.9% 45.1% 58.0% +12.9
ELA-6 41.3% 42.1% 56.0% +13.9
ELA-7 28.3% 29.0% 40.0% +11.0
ELA-8 26.3% 27.9% 31.0% +3.1
ALL GRADES 3-8 38.4% 38.4% 47.0% +8.6
*off-level testing was approved by New York State for students with disabilities
Section 2 Page 8
Policies, Priorities and Plans 2009-10 Draft Budget
8/7/2019 2009_2010DRAFT
http://slidepdf.com/reader/full/20092010draft 23/268
Percentage of Students Performing at Proficient or Advanced in English Language Arts on
New York State Assessments Grades 3 through 8
47%
50%
42%
41%
28%
26%
38%4
3%
47%
45%
42%
29%
28% 3
8%
44% 5
2%
58%
56%
40%
31%
47%
Grade 3 Grade 4 Grade 5 Grade 6 Grade 7 Grade 8 Grades 3-8
ELA 2006 ELA 2007 ELA 2008
Percentage of Students Performing at Proficient or Advanced on the
New York State Regents Comprehensive English 11
Regents English 11
2001Cohort
2002Cohort
2003Cohort
Change in Percentage Points forPast Two Years
ENGLISH 11 41% 37% 45% +8.0
Percentage of Students Performing at Proficient or Advanced on the
New York State Regents Comprehensive English 11
41%37%
45%
2001 Cohort 2002 Cohort 2003 Cohort
Section 2 Page 9
Policies, Priorities and Plans 2009-10 Draft Budget

8/7/2019 2009_2010DRAFT
http://slidepdf.com/reader/full/20092010draft 24/268
Percentage of Students Performing at Proficient or Advanced in Mathematics on
New York State Mathematics Grades 3 through 8
New York State Mathematics Grades 3-8
*2005-06 2006-07 2007-08Change in Percentage Points for
Past Two Years
Math-3 55.8% 62.3% 70.6% +8.3
Math-4 54.6% 52.0% 62.1% +10.1
Math-5 31.5% 47.4% 59.4% +12.0
Math-6 30.5% 41.0% 56.3% +15.3
Math-7 12.5% 21.9% 48.2% +26.3
Math-8 20.0% 17.9% 33.0% +15.1
ALL GRADES 3-8 33.1% 39.3% 54.6% +15.3
*off-level testing was approved by New York State for students with disabilities
Percentage of Students Performing at Proficient or Advanced in Math on the
New York State Regents Mathematics A
Regents Mathematics A
2001Cohort
2002Cohort
2003Cohort
Change in Percentage Pointsfor Past Two Years
Mathematics A 46% 45% 51% +6.0
Percentage of Students Performing at Proficient or Advanced in Math on the
New York State Regents Mathematics A
46% 45%51%
2001 Cohort 2002 Cohort 2003 Cohort
Section 2 Page 10
Policies, Priorities and Plans 2009-10 Draft Budget

8/7/2019 2009_2010DRAFT
http://slidepdf.com/reader/full/20092010draft 25/268
Percentage of Students Performing at Proficient or Advanced on the
New York State English Language Arts Grades 3-8 by Subgroups
NYS Grade 3 ELA
2005-06 2006-07 2007-08Percentage Points Change for Past Two
Years
All Grade 3 Students 47 43 44 +1
Afr Amr 43 40 42 +2
His/Lat 53 40 42 +2
Asian 76 71 54 -17
White 62 59 57 -2
Female 53 47 47 0
Male 42 39 41 +2
SWD 26 15 15 0
LEP 53 24 25 +1
Econ. Dis. 45 41 42 +1
NYS Grade 3 ELA
0
20
40
6080
100
2005-06 2006-07 2007-08
All Afr Amr His/Lat Asian White Female Male SWD LEP Econo Dis
NYS Grade 4 ELA
2005-06 2006-07 2007-08Percentage Points Change for Past Two
Years
All Grade 4 Students 50 47 52 +5
Afr Amr 47 46 51 +5His/Lat 47 41 49 +8Asian 66 naWhite 69 61 63 +2Female 52 50 57 +7Male 48 45 47 +2SWD 30 13 19 +6LEP 32 20 27 +7Econ. Dis. 47 46 50 +4
NYS Grade 4 ELA
0
20
40
60
80
100
2005-06 2006-07 2007-08
All Afr Amr His/Lat Asian White Female Male SWD LEP Econo Dis
Section 2 Page 11
Policies, Priorities and Plans 2009-10 Draft Budget
8/7/2019 2009_2010DRAFT
http://slidepdf.com/reader/full/20092010draft 26/268
Percentage of Students Performing at Proficient or Advanced on the
New York State English Language Arts Grades 3-8 by Subgroups
NYS Grade 5 ELA
2005-06 2006-07 2007-08 Percentage Points Change for Past Two Years
All Grade 5 Students 42 45 58 +13
Afr Amr 39 43 58 +15His/Lat 40 38 55 +17Asian 69 52 naWhite 59 66 68 +2Female 45 45 61 +16Male 39 45 56 +11SWD 21 14 24 +10LEP 33 16 30 +14Econ. Dis. 39 43 58 +15
NYS Grade 5 ELA
0
20
4060
80
100
2005-06 2006-07 2007-08
All Afr Amr His/Lat Asian White Female Male SWD LEP Econo Dis
NYS Grade 6 ELA
2005-06 2006-07 2007-08Percentage Points Change for Past Two
Years
All Grade 6 Students 41 42 56 +14
Afr Amr 38 41 57 +16
His/Lat 38 35 47 +12Asian 82 60 46 -14White 58 58 70 +12Female 46 44 60 +16Male 37 40 52 +12SWD 17 9 22 +13LEP 19 7 17 +10Econ. Dis. 39 40 55 +15
NYS Grade 6 ELA
0
20
40
60
80
100
2005-06 2006-07 2007-08
All Afr Amr His/Lat Asian White Female Male SWD LEP Econo Dis
Section 2 Page 12
Policies, Priorities and Plans 2009-10 Draft Budget
8/7/2019 2009_2010DRAFT
http://slidepdf.com/reader/full/20092010draft 27/268
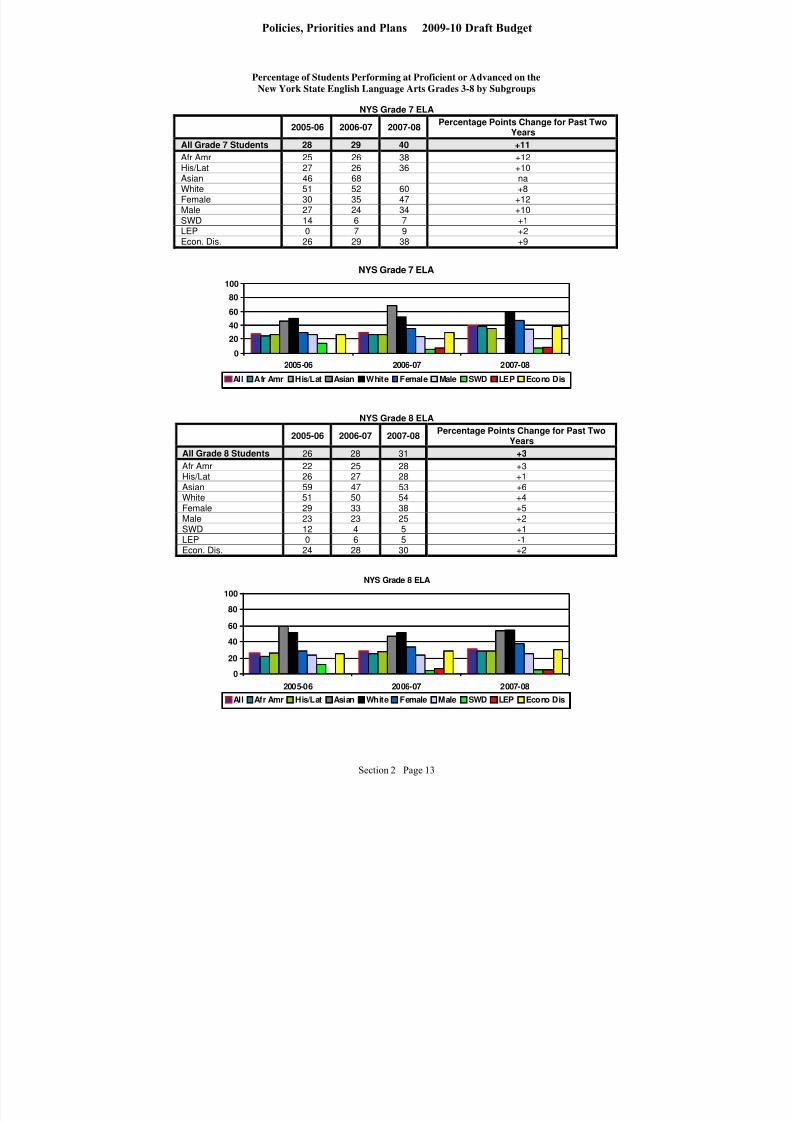
Percentage of Students Performing at Proficient or Advanced on the
New York State English Language Arts Grades 3-8 by Subgroups
NYS Grade 7 ELA
2005-06 2006-07 2007-08Percentage Points Change for Past Two
Years
All Grade 7 Students 28 29 40 +11
Afr Amr 25 26 38 +12His/Lat 27 26 36 +10Asian 46 68 naWhite 51 52 60 +8Female 30 35 47 +12Male 27 24 34 +10SWD 14 6 7 +1LEP 0 7 9 +2Econ. Dis. 26 29 38 +9
NYS Grade 7 ELA
0
20
40
60
80
100
2005-06 2006-07 2007-08
All Afr Amr His/Lat Asian White Female Male SWD LEP Econo Dis
NYS Grade 8 ELA
2005-06 2006-07 2007-08Percentage Points Change for Past Two
Years
All Grade 8 Students 26 28 31 +3Afr Amr 22 25 28 +3His/Lat 26 27 28 +1Asian 59 47 53 +6White 51 50 54 +4Female 29 33 38 +5Male 23 23 25 +2SWD 12 4 5 +1LEP 0 6 5 -1Econ. Dis. 24 28 30 +2
NYS Grade 8 ELA
0
20
40
60
80
100
2005-06 2006-07 2007-08
All Afr Amr His/Lat Asian White Female Male SWD LEP Econo Dis
Section 2 Page 13
Policies, Priorities and Plans 2009-10 Draft Budget

8/7/2019 2009_2010DRAFT
http://slidepdf.com/reader/full/20092010draft 28/268
Percentage of Students Performing at Proficient or Advanced on the
New York State Mathematics Grades 3-8 by Subgroups
NYS Grade 3 Mathematics
2005-06 2006-07 2007-08 Percentage Points Change for Past Two Years
All Grade 3 Students 56 62 71 +9
Afr Amr 52 60 69 +9His/Lat 58 60 70 +10Asian 81 82 70 -12White 67 75 81 +6
Female 57 62 71 +9Male 55 63 70 +7SWD 41 38 47 +9LEP 50 47 57 +10
Econ. Dis. 55 62 70 +8
NYS Grade 3 Mathematics
0
20
40
60
80
100
2005-06 2006-07 2007-08
All Afr Amr His/Lat Asian White Female Male SWD LEP Econo Dis
NYS Grade 4 Mathematics
2005-06 2006-07 2007-08 Percentage Points Change for Past Two Years
All Grade 4 Students 55 52 62 +10
Afr Amr 52 49 60 +11
His/Lat 50 52 61 +9Asian 83 naWhite 73 66 74 +8Female 52 52 62 +10Male 57 52 63 +11SWD 42 22 34 +12LEP 39 32 48 +16Econ. Dis. 53 51 61 +10
NYS Grade 4 Mathematics
0
20
40
60
80
100
2005-06 2006-07 2007-08
All Afr Amr His/Lat Asian White Female Male SWD LEP Econo Dis
Section 2 Page 14
Policies, Priorities and Plans 2009-10 Draft Budget

8/7/2019 2009_2010DRAFT
http://slidepdf.com/reader/full/20092010draft 29/268
Percentage of Students Performing at Proficient or Advanced on the
New York State Mathematics Grades 3-8 by Subgroups
NYS Grade 5 Mathematics
2005-06 2006-07 2007-08 Percentage Points Change for Past Two Years
All Grade 5 Students 31 47 59 +12
Afr Amr 28 45 57 +12His/Lat 29 44 59 +15Asian 53 66 naWhite 50 63 74 +11Female 31 48 57 +9Male 32 47 62 +15SWD 16 22 34 +12LEP 19 31 42 +11Econ. Dis. 29 47 58 +11
NYS Grade 5 Mathematics
0
20
40
60
80
100
2005-06 2006-07 2007-08
All Afr Amr His/Lat Asian White Female Male SWD LEP Econo Dis
NYS Grade 6 Mathematics
2005-06 2006-07 2007-08 Percentage Points Change for Past Two Years
All Grade 6 Students 31 41 56 +15
Afr Amr 27 39 57 +18His/Lat 27 37 48 +11Asian 65 57 63 +6White 51 54 67 +13Female 31 39 57 +18Male 30 43 55 +12SWD 15 17 28 +11LEP 21 15 29 +14Econ. Dis. 28 39 56 +17
Grade 6 Mathematics
0
20
40
60
80
100
2005-06 2006-07 2007-08
All Afr Amr His/Lat Asian White Female Male SWD LEP Econo Dis
Section 2 Page 15
Policies, Priorities and Plans 2009-10 Draft Budget

8/7/2019 2009_2010DRAFT
http://slidepdf.com/reader/full/20092010draft 30/268
Percentage of Students Performing at Proficient or Advanced on the
New York State Mathematics Grades 3-8 by Subgroups
NYS Grade 7 Mathematics
2005-06 2006-07 2007-08 Percentage Points Change for Past Two Years
All Grade 7 Students 13 22 48 +26
Afr Amr 10 18 46 +28His/Lat 9 20 45 +25Asian 46 47 naWhite 33 47 70 +23Female 13 23 49 +26Male 12 21 47 +26SWD 5 5 21 +16LEP 4 9 25 +16Econ. Dis. 11 22 47 +25
NYS Grade 7 Mathematics
0
20
40
60
80
100
2005-06 2006-07 2007-08
All Afr Amr His/Lat Asian White Female Male SWD LEP Econo Dis
NYS Grade 8 Mathematics
2005-06 2006-07 2007-08 Percentage Points Change for Past Two Years
All Grade 8 Students 20 18 33 +15
Afr Amr 16 15 30 +15His/Lat 19 15 27 +12Asian 42 44 48 +4White 41 37 50 +13Female 21 19 32 +13Male 19 17 31 +14SWD 10 4 11 +7LEP 6 6 17 +11Econ. Dis. 19 12 31 +19
NYS Grade 8 Mathematics
0
20
40
60
80
100
2005-06 2006-07 2007-08
All Afr Amr His/Lat Asian White Female Male SWD LEP Econo Dis
Section 2 Page 16
Policies, Priorities and Plans 2009-10 Draft Budget

8/7/2019 2009_2010DRAFT
http://slidepdf.com/reader/full/20092010draft 31/268
Percentage of Students Graduating within 4 Years 2005-2007
(Total Cohorts 2001-2003)
41% 39%45% 48%
0%
10%
20%
30%
40%
50%
2001 2002 2003 2003 through
August
Graduation Rate and Graduation Cohort
The graduation rate is calculated using New York State Education Department’s Total Cohort. The 2003
graduation rate for Total Cohort consists of all students as of August 30, 2007, regardless of their current
grade status, who:
first entered grade 9 (anywhere) during the 2003–04 school year (July 1, 2003 through
June 30, 2004); or
in the case of ungraded students with disabilities, reached their seventeenth birthday
during the 2003–04 school year
AND
whose last enrollment in the school was 5 months or longer (excluding July and August) or,whose last enrollment was less than 5 months but who had a prior enrollment in this school or district
between July 1, 2003 and June 30, 2007 that was 5 months or more. (Source: NYSSIRS Policy Manual
2006-07)
The graduation cohort year is determined by the year a student enters grade 9 for the first time anywhere
in the United States.
It is about every child
The Rochester City School District is dedicated to “ensuring that every child in Rochester has access to
world class content taught by world class teachers in schools led by world class leaders”.
Three Core Values
• Achievement – Improving student achievement through a laser-like focus on teaching and learning
with an emphasis on results.
• Equity - Equitable distribution of resources based on the needs of schools and students.
• Accountability – Use of data to ensure that we hold adults accountable for the success of all students.
Section 2 Page 17
Policies, Priorities and Plans 2009-10 Draft Budget

8/7/2019 2009_2010DRAFT
http://slidepdf.com/reader/full/20092010draft 32/268
Discussion
Overall performance of students in the Rochester City School District is rising. The number of studentswho are graduating from high school in four years has reached a three-year high with a graduation rate of
48% for the 2003 Cohort in 2007 (based on graduates through August of 2007; graduation data for 2008
was not yet released by the New York State Education Department at time of press). Student performance
on high stakes tests at the commencement level also reached the highest levels of performance over threeyears with 45% of students in the 2003 Cohort passing the Regents English Comprehensive Exam and
51% passing the Regents Mathematics A Exam (based on student performance through August of 2007;
high school assessment data for 2008 was not yet released by the New York State Education Department
at time of press).
In 2007-08, student performance in grades 3 through 8 showed significant gains in both English
Language Arts and Mathematics. The achievement of students in grades 3 through 8 increased 9
percentage points yielding 47% of students meeting or exceeding State standards in English Language
Arts. Achievement in grades 3 through 8 mathematics rose to 55% of students meeting or exceeding
standards, representing a 15 percentage point increase from the previous year.
While gains in student performance have been realized, progress has not been fast enough and substantialgaps still exist. For this reason, practices have been put into place for a systematic focus on increasing
achievement across grades P-12:
Six Dream Schools (#8, #45, Global Media Arts, International Finance, Jefferson, and Wilson
Foundation) have been formed to increase student academic achievement and engagement.
A student course credit auditing system named DataCation is being implemented to provide real time
analysis of student progress toward meeting commencement requirements.
Building level supports are under development through the District’s revision of its operational
practices in the secondary education program to assist students who are not on-track for graduating in
four years.
A curriculum and assessment tracking system is in place to insure that all students in grades 5-9 have
the skills necessary to tackle the rigor of high school and meet graduation requirements. Multiple opportunities for credit recovery are available.
Opportunities available for K-12 include but are not limited to the following:
o Summer enrichment programs
o Summer school
o Extended day, before and after school
o Saturday school
o Vacation/break school
o Academic intervention and support during the school day
A community outreach for volunteers in our schools has been issued.
Partnerships with area colleges have been developed to:
o create pathways to higher education
o build capacity for a P-16 education modelo offer opportunities to earn early college credit
Rochester City School District Assessment System: 2008-09
Acuity is a learning-based assessment program for mathematics in grades 3-8. Acuity aligns to New York
State standards and delivers targeted instructional materials to help prepare students for the New York
State Grades 3-8 Annual Assessments that comply with NCLB requirements.
Section 2 Page 18
Policies, Priorities and Plans 2009-10 Draft Budget

8/7/2019 2009_2010DRAFT
http://slidepdf.com/reader/full/20092010draft 33/268
Cumulative Benchmark Assessments are standards-based assessments in English Language Arts and
mathematics given in grades 5-9 four times a year to monitor progress toward meeting grade-level
standards taught through the unified Rochester Curriculum.
Developmental Reading Assessment (DRA) is a set of individually administered criterion-referenced
diagnostic reading assessments administered to students in grades K-6 three times a year.
Dynamic Indicators of Basic Early Literacy Skills (DIBELS) is an assessment for 3 of the 5 Big Ideas of
Early Literacy phonological awareness, alphabetic principle, and fluency with connected text. It is
administered to students in K-3 who participate in the Reading First program.
New York State Assessments are given annually to students in grades 3 through 8. The New York State
Assessments are based on New York State standards, which define what students should learn each year.
The goal is for 90% of students to score at or above the state standard. Students pursuing a New York
State Regents diploma must meet standards on five Regents exams Mathematics, Living Environment,
Global Studies, ELA 11, and US History.
NYSESLAT (New York State English as a Second Language Achievement Test) is a New York Statetest designed to measure the English language proficiency of K-12 students who have been identified as
Limited English Proficient (LEP). LEP/ELL/ program students take the NYSESLAT until they achieve
ELA standards that qualify them to exit the program. Students who have been in the country for less than
12 months only take the NYSESLAT. All other ELL/LEP students take both the NYSESLAT and New
York State ELA Assessments Grades 3-8.
Peabody Picture Vocabulary Test is an individually administered, norm-referenced, wide-range measure
of listening comprehension for spoken words in standard English and a screening test of verbal ability
used in grades K-2.
Scholastic Reading Inventory (SRI) Enterprise Edition provides immediate, actionable data on students'
reading levels and growth over time to help educators differentiate instruction and make meaningfulinterventions.
SUPERA is a Spanish-language achievement test that measures a student’s ELA progress in his/her
primary language. It is a comprehensive assessment with results that are based on the same scale as
English-language results so that a clear picture of student achievement is obtained regardless of the
language of the test.
TerraNova is an assessment used for grades 1-2. It provides extended open-ended tasks for classroom
administration that measure critical skills in Communication Arts and Mathematics.
Section 2 Page 19
Policies, Priorities and Plans 2009-10 Draft Budget

8/7/2019 2009_2010DRAFT
http://slidepdf.com/reader/full/20092010draft 34/268
2004-05
Actual
2005-06
Actual
2006-07
Actual
2007-08
Actual
2008-09
Actual
2009-10
Projected
K 2,373 2,562 2,406 2,437 2,394 2,326
1 2,663 2,732 2,765 2,767 2,768 2,688
2 2,489 2,582 2,451 2,621 2,645 2,639
3 2,343 2,506 2,427 2,420 2,527 2,582
4 2,337 2,317 2,361 2,392 2,378 2,486
5 2,493 2,408 2,199 2,295 2,272 2,251
6 2,791 2,548 2,361 2,198 2,287 2,286
7 3,781 3,607 2,880 2,551 2,271 2,449
8 3,072 2,857 3,000 2,675 2,373 2,022
9 3,443 3,661 3,489 2,863 3,741 2,969
10 2,541 2,617 2,869 3,259 2,773 3,481
11 1,607 1,534 1,729 2,371 1,854 1,91112 1,122 1,449 1,649 1,868 1,849 1,650
Total K-12 33,055 33,380 32,586 32,717 32,132 31,740
ALL RCSD SCHOOLS: Six Year Enrollment Comparison by Grade Level
March 6, 2009
Six Year Enrollment Comparison by Grade Level
Office of Student Equity & Placement
Rochester City Schools Total Enrollment
30,500
31,000
31,500
32,000
32,500
33,000
33,500
34,000
2004-05 Actual 2005-06 Actual 2006-07 Actual 2007-08 Actual 2008-09 Actual 2009-10
Projected
Section 2 Page 20
Policies, Priorities and Plans 2009-10 Draft Budget
8/7/2019 2009_2010DRAFT
http://slidepdf.com/reader/full/20092010draft 35/268
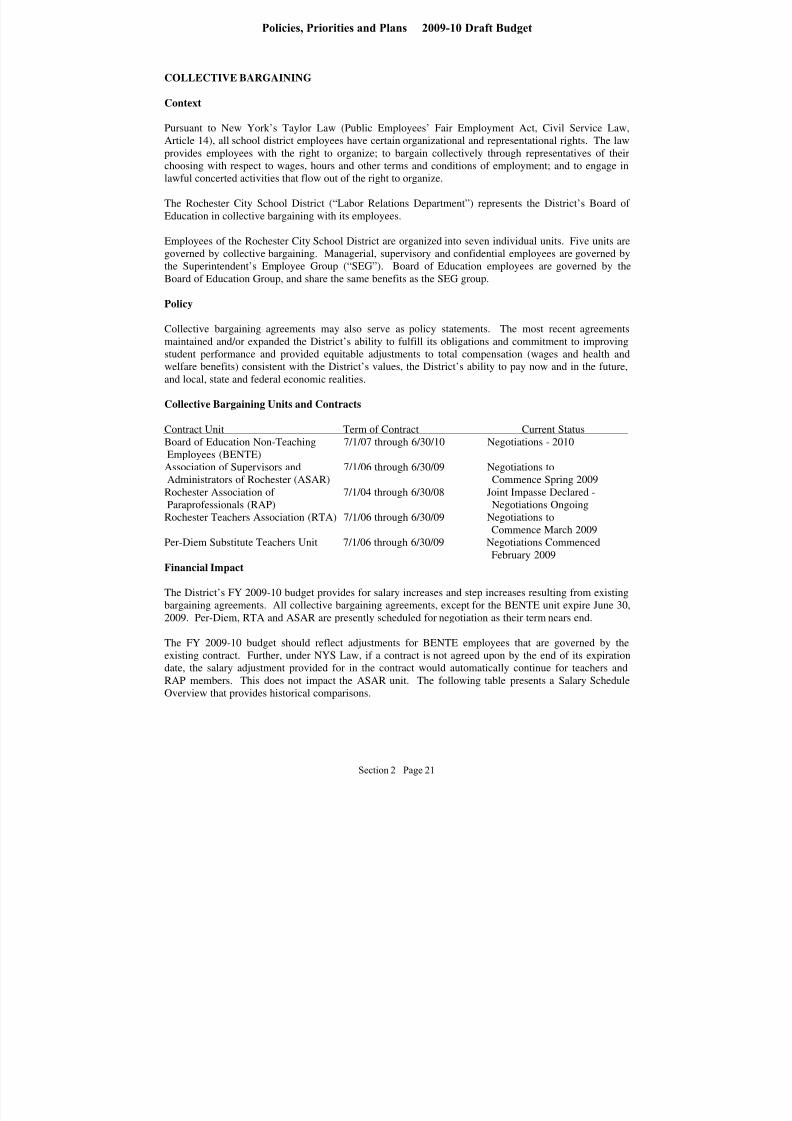
COLLECTIVE BARGAINING
Context
Pursuant to New York’s Taylor Law (Public Employees’ Fair Employment Act, Civil Service Law,
Article 14), all school district employees have certain organizational and representational rights. The law
provides employees with the right to organize; to bargain collectively through representatives of theirchoosing with respect to wages, hours and other terms and conditions of employment; and to engage in
lawful concerted activities that flow out of the right to organize.
The Rochester City School District (“Labor Relations Department”) represents the District’s Board of
Education in collective bargaining with its employees.
Employees of the Rochester City School District are organized into seven individual units. Five units are
governed by collective bargaining. Managerial, supervisory and confidential employees are governed by
the Superintendent’s Employee Group (“SEG”). Board of Education employees are governed by the
Board of Education Group, and share the same benefits as the SEG group.
Policy
Collective bargaining agreements may also serve as policy statements. The most recent agreements
maintained and/or expanded the District’s ability to fulfill its obligations and commitment to improving
student performance and provided equitable adjustments to total compensation (wages and health and
welfare benefits) consistent with the District’s values, the District’s ability to pay now and in the future,
and local, state and federal economic realities.
Collective Bargaining Units and Contracts
Contract Unit Term of Contract Current Status
Board of Education Non-Teaching 7/1/07 through 6/30/10 Negotiations - 2010
Employees (BENTE)Association of Supervisors and 7/1/06 through 6/30/09 Negotiations to
Administrators of Rochester (ASAR) Commence Spring 2009
Rochester Association of 7/1/04 through 6/30/08 Joint Impasse Declared -
Paraprofessionals (RAP) Negotiations Ongoing
Rochester Teachers Association (RTA) 7/1/06 through 6/30/09 Negotiations to
Commence March 2009
Per-Diem Substitute Teachers Unit 7/1/06 through 6/30/09 Negotiations Commenced
February 2009
Financial Impact
The District’s FY 2009-10 budget provides for salary increases and step increases resulting from existing
bargaining agreements. All collective bargaining agreements, except for the BENTE unit expire June 30,2009. Per-Diem, RTA and ASAR are presently scheduled for negotiation as their term nears end.
The FY 2009-10 budget should reflect adjustments for BENTE employees that are governed by the
existing contract. Further, under NYS Law, if a contract is not agreed upon by the end of its expiration
date, the salary adjustment provided for in the contract would automatically continue for teachers and
RAP members. This does not impact the ASAR unit. The following table presents a Salary Schedule
Overview that provides historical comparisons.
Section 2 Page 21
Policies, Priorities and Plans 2009-10 Draft Budget

8/7/2019 2009_2010DRAFT
http://slidepdf.com/reader/full/20092010draft 36/268
SALARY SCHEDULE OVERVIEW
Rochester City School District
Bargaining Unit Salary Increases
Date
Effective
RTA
ASAR
BENTE
RAP
PER
DIEM
SEG
BOE
2005-06 N/A 3.975% 3.95% 3.95% 4.25% 4% N/A
2006-07 4.39% 3.95% 3.95% 3.95% 4.13% 4% 44.8%2007-08 4.39% 3.95% 3.95% 3.95% N/A 4% 3%
2008-09 4.39% 3.95% 3.95% N/A N/A 4% 2.7%
(Average)
Section 2 Page 22
Policies, Priorities and Plans 2009-10 Draft Budget

8/7/2019 2009_2010DRAFT
http://slidepdf.com/reader/full/20092010draft 37/268
dIstrIct-w Ide summary Budget
Budget Summary Revenue and Expenditures ChartsAssumptions and PrioritiesRevenue Summary and AnalysisExpenditure Summary and AnalysisPosition Summary
Explanation of Changes to BudgetMulti-Year Projection

8/7/2019 2009_2010DRAFT
http://slidepdf.com/reader/full/20092010draft 38/268
THIS PAGE INTENTIONALLY LEFT BLANK
Section 3 Page 2
District-Wide Summary Budget 2009-10 Draft Budget
8/7/2019 2009_2010DRAFT
http://slidepdf.com/reader/full/20092010draft 39/268
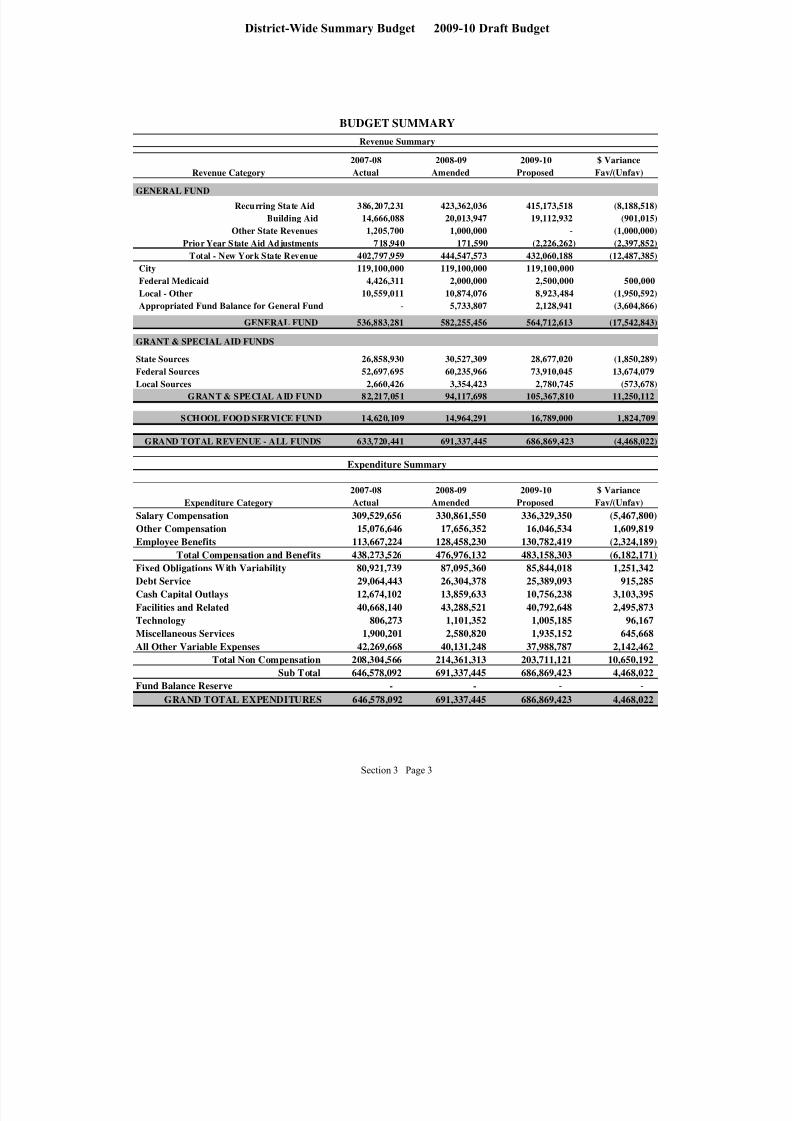
2007-08 2008-09 2009-10 $ Variance
Revenue Category Actual Amended Proposed Fav/(Unfav)
GENERAL FUND
Recurring State Aid 386,207,231 423,362,036 415,173,518 (8,188,518)
Building Aid 14,666,088 20,013,947 19,112,932 (901,015)
Other State Revenues 1,205,700 1,000,000 - (1,000,000)
Prior Year State Aid Adjustments 718,940 171,590 (2,226,262) (2,397,852)
Total - New York State Revenue 402,797,959 444,547,573 432,060,188 (12,487,385)
City 119,100,000 119,100,000 119,100,000
Federal Medicaid 4,426,311 2,000,000 2,500,000 500,000
Local - Other 10,559,011 10,874,076 8,923,484 (1,950,592)
Appropriated Fund Balance for General Fund - 5,733,807 2,128,941 (3,604,866)
GENERAL FUND 536,883,281 582,255,456 564,712,613 (17,542,843)
GRANT & SPECIAL AID FUNDS
State Sources 26,858,930 30,527,309 28,677,020 (1,850,289)
Federal Sources 52,697,695 60,235,966 73,910,045 13,674,079
Local Sources 2,660,426 3,354,423 2,780,745 (573,678)
GRANT & SPECIAL AID FUND 82,217,051 94,117,698 105,367,810 11,250,112
SCHOOL FOOD SERVICE FUND 14,620,109 14,964,291 16,789,000 1,824,709
GRAND TOTAL REVENUE - ALL FUNDS 633,720,441 691,337,445 686,869,423 (4,468,022)
2007-08 2008-09 2009-10 $ Variance
Expenditure Category Actual Amended Proposed Fav/(Unfav)
Salary Compensation 309,529,656 330,861,550 336,329,350 (5,467,800)
Other Compensation 15,076,646 17,656,352 16,046,534 1,609,819
Employee Benefits 113,667,224 128,458,230 130,782,419 (2,324,189)
Total Compensation and Benefits 438,273,526 476,976,132 483,158,303 (6,182,171)
Fixed Obligations With Variability 80,921,739 87,095,360 85,844,018 1,251,342
Debt Service 29,064,443 26,304,378 25,389,093 915,285
Cash Capital Outlays 12,674,102 13,859,633 10,756,238 3,103,395
Facilities and Related 40,668,140 43,288,521 40,792,648 2,495,873 Technology 806,273 1,101,352 1,005,185 96,167
Miscellaneous Services 1,900,201 2,580,820 1,935,152 645,668
All Other Variable Expenses 42,269,668 40,131,248 37,988,787 2,142,462
Total Non Compensation 208,304,566 214,361,313 203,711,121 10,650,192
Sub Total 646,578,092 691,337,445 686,869,423 4,468,022
Fund Balance Reserve - - - -
GRAND TOTAL EXPENDITURES 646,578,092 691,337,445 686,869,423 4,468,022
BUDGET SUMMARY
Revenue Summary
Expenditure Summary
Section 3 Page 3
District-Wide Summary Budget 2009-10 Draft Budget

8/7/2019 2009_2010DRAFT
http://slidepdf.com/reader/full/20092010draft 40/268
City Aid
$119,100,000
17.34%
Medicaid
$2,500,000
0.36%
Other
$8,923,484
1.30%
State Aid
$432,060,188
62.90%
Grants
$105,367,810
15.34%
Fund Balance
$2,128,941
0.31%
Food Service
$16,789,000
2.44%
Revenue Summary - All Funds
Technology
$1,005,185
0.15%
Cash Capital
$10,756,238
1.57%
Facilities
$40,792,648
5.94%
Compensation
$352,375,884
51.30%Variable Expenses
$39,923,938
5.81%
Debt Service
$25,389,093
3.70%
Fixed Obligations
$85,844,018
12.50%
Benefits
$130,782,419
19.04%
Expenditure Summary - All Funds
$686,869,423
$686,869,423
Section 3 Page 4
District-Wide Summary Budget 2009-10 Draft Budget
8/7/2019 2009_2010DRAFT
http://slidepdf.com/reader/full/20092010draft 41/268
Assumptions and Priorities: Factors Related to the Balancing of the 2009-10 Budget
Developing a balanced budget for 2009-10 has been a great challenge for the District this year.With the continual decline of the financial market, the instability of the Federal and Staterevenues, the downturn in the local economy and declining enrollment numbers, RCSD has beenfaced with the task of reducing staff and programs in order to obtain a balanced budget. We havecontinued the work identified by the Superintendent last year and have chosen the fiscally prudent
path to take this opportunity to “right size” the District rather than draw from our alreadydwindling fund balance. At the same time, the District has started a multi-year project of afinancial redesign to enable Principals and schools to strategically manage resources in support of their academic improvement plans.
To begin the budget process, a series of planning assumptions were made. Some were short term,such as assumed revenue amounts for the year. Others were part of a longer term horizon likereduction of the structural deficit over a three-year period. Some of the key assumptions areprovided below. The objective was to build as conservative a plan as possible, not relying on“soft” revenue or “possible” savings. As additional information becomes available, some of theplanning assumptions will prove to be accurate while others will require additional modificationsto the plan. Budget amendments will be presented as we continue to refine the budget and
execute to our plan.
REVENUE
State Funding
The start of the budget process for this year was delayed, not only to establish changes necessaryas part of the first year of the redesign, but also in hopes that the Governor would give someindication of the reduction to education. This information did come in December with asignificant projected revenue reduction. As of the presentation of the draft budget, we still do notknow the final impact on Districts within New York State.
The Governor’s proposed reduction for RCSD is an approximate $13.4 million decrease from our2008-09 amended budget. The impact on funding for Contract for Excellence and the Foundation
Aid four-year spending plan that was enacted last year is still undetermined. Further changes tothe Governor’s Budget will cause amendments to the draft budget presented. Conversation withthe various legislative branches in Albany is not optimistic about the restoration of funds requiredto make Districts “whole”. The District will adjust the adopted budget for changes resulting fromthe actions of the Legislature and the Governor when the final State budget is adopted.
Federal Stimulus Funds
During the planning process, the Federal government announced the possibility of variouseconomic stimulus packages that would give relief to education. The decision by the District, aswell as the intent of the package, is to use stimulus dollars for temporary or one-time issues toavoid dependency upon funds. The 2009 Economic Recovery & Reinvestment Act describesfunding for schools flowing from three separate areas. The first area will be based on funds
flowing through established federal formulas in Title I and IDEA. This funding will flow toDistricts in the next two years. Although the exact details are not clear at this time, it has beenprojected that RCSD will receive approximately $17.3 million through this portion of thepackage. This amount has been included in the 2009-10 budget.
Funds will also flow through the State Stabilization Fund, which will be controlled by thegovernor and existing State funding formulas. This funding is at the discretion of the State andcan be used for education and school construction. State law will govern these funds. New York State has not given any indication as to how or when this money will be given to the Districts.Therefore, the amount was not projected into the budget.
Section 3 Page 5
District-Wide Summary Budget 2009-10 Draft Budget

8/7/2019 2009_2010DRAFT
http://slidepdf.com/reader/full/20092010draft 42/268
The last flow of funding will be available through tax credit bonds for new construction andQualified Zone Academy bonds for renovation and modernization. Under this funding, the 100largest, poorest school districts are guaranteed part of 40% of their state’s bond allocation. Aprovision also states that up to an additional 25 school districts may receive priority status. Dueto the inability to project the amount, no provision was made to include it in the 2009-10 Budgetat this time._
It is important to understand that the proposed Federal stimulus funds will only be for two years,running through 2010-11. Funds are to be used for short-term investments with the potential forlong-term benefits. School districts were cautioned to be careful and avoid expenditures theymay not be able to sustain once the recovery funds are spent. Guidelines have been given forboth the Title I and the IDEA portions of the package. The District will need to track and accountfor the spending of these funds to comply with Federal regulations.
Structural Deficit
As projected in earlier years, RCSD has a structural deficit of approximately $50 million.Although steps have been taken this year to reduce the deficit, it will take additional time to “rightsize” our programs and supporting structure. This process was started during the 2008-09 budgetyear and will continue through the 2010-11 fiscal year. The stimulus package is being used to
support this deficit. Ongoing and unrestricted resources can not continue to cover the costincreases in areas such as continuous salary increases, rising costs of employee benefits(especially health), contractual requirements, fuel, utilities, inflation and any new initiatives. Thereduction in revenues will not allow the District to fully fund its priorities and will causereductions in our educational programs.
Declining Enrollment
Another factor that was taken into consideration during the restructuring of our budget was thedecline in District enrollment. We have experienced this decline for several years and haveprojected a continual decrease in the number of children attending District schools. This willcontinue to have a negative impact on further State funding and will cause correspondingreductions in school staffing. The reduction in school staffing was started in the 2009-10 budget
projection. The projected decrease in teachers and other staff for 2009-10 is approximately 288positions which relates to approximately $21.6 million.
Unappropriated Fund Balance
It was the intent of the Superintendent not to use the unappropriated fund balance to support thestructural deficit. Instead, if possible, restructuring over the next three years will be necessary forreducing the deficit. Restructuring aligns with the initiative to “right-size” the District. Budgetdecisions would be made with the intent to work with the long-term objective of school-basedbudgeting. The 2008-09 General Fund beginning balance of $47,843,997 reflects the endingbalance of the 2007-08 fiscal year. The majority of this balance is committed to specific purposessuch as: workers compensation reserves, insurance reserves, OPEB and the EmploymentPreparation Education (EPE) audit reimbursement. The balance that is available to support on
going programs is $12,481,425. Maintaining an adequate ending balance is required by Statelaw. The allowable unappropriated amount is a reserve of 4% of the following year’s generalfund which is $23.3 million.
EXPENDITURES
In addition to the decline in State funding, the District is required to pay the reimbursement of EPE funds. In prior years, the District requested a waiver for the repayment of the $2.1 millionEPE reimbursement. A decision was made to not request the waiver for this year due to theeconomic climate in State government. This amount will be paid from our appropriated fundbalance.
Section 3 Page 6
District-Wide Summary Budget 2009-10 Draft Budget
8/7/2019 2009_2010DRAFT
http://slidepdf.com/reader/full/20092010draft 43/268
It is the intent of the District to continue most of the 2008-09 programs plus approved changes for2009-10. The assumption was made that compensation increases, for which negotiations havenot been completed, will continue at the stated rate. Alignment of expenditures to support thefour goals of improving ELA scores, Math scores, graduation rates and school safety has beenprovided for in the budget:
Textbook Adoption for Math: $1,205,000
Restructuring of Schools-funding for School #14/#58 and East High: $504,000
District-wide Dashboard and assessment tools: $500,000 Increased work placement and interventions by Hillside: $1,200,000
School Safety-Behavior management and X-ray equipment: More than $200,000
Short Term Fiscal Issues
Health Insurance negotiations: The District continues to look at cost savings for Districthealth care plans. Progress is being made to change from community rating to experiencerating. Changes will mitigate rising insurance costs.
Transportation costs: Earlier in 2008-09, an RFP was successfully completed for thetransportation of our children. This savings has been recognized in our 2009-10 proposedbudget.
Interest Revenue: Reduction is due to declining market conditions._Long Term Fiscal Issues
Collective Bargaining: The District is in negotiations with three of our five bargainingunits. The Rochester Teachers Association and Association of Supervisors andAdministrators of Rochester contracts expire on June 30, 2009. Negotiations continue withRochester Association of Paraprofessionals which expired on June 30, 2008.
Future funding will depend on the recovery of our economic system. Continual reductionswill be passed to Districts if the State continues its structural deficit. The impact will havea negative affect on the growth of our programs.
Some programs, which are currently supported fully or partially by Special Aid or grants,will be underfunded and become reliant upon general funds.
Decreased funding will lead to slightly increased class size, which remains at or belowcontract and state averages.
The Special Education program analysis is complete. A multi-year program redesign andimprovement process has started.
Reimbursement rates in some State and Federal reimbursements are lagging behind actualcost increases.
The cost of textbooks and other instructional supplies continue to increase.
Fuel and utilities costs continue to rise at rates higher than expected.
Double digit increases in employee benefits is anticipated.
The Draft Proposed Budget is balanced and targeted to the needs of our students and allows thecontinued support of the goals of the District and the policies of the Board of Education. We still
face many challenges, both at the State level and within the District itself. New academicinitiatives, academic program flexibility and the collective bargaining process will need to beaddressed as revenue sources are confirmed. This budget is the first glimpse at a fundamentalchange in the strategic management and resourcing of our schools. It addresses tough fiscalrealities while continuing to resource critical education needs.
Sincerely,
Deputy Superintendent of Administration
Section 3 Page 7
District-Wide Summary Budget 2009-10 Draft Budget

8/7/2019 2009_2010DRAFT
http://slidepdf.com/reader/full/20092010draft 44/268
2007-08 2008-09 2009-10 $ Variance
Revenue Category Actual Amended Budget Proposed Budget Fav/(Unfav)
GENERAL FUND
>>>>> STATE <<<<<
Foundation Aid (Comprehensive Operating Aid) 320,835,447 351,317,169 351,317,169 -
Deficit Reduction Assessment - - (13,417,057) (13,417,057)
Special Services Aid 6,692,278 9,708,675 9,994,629 285,954
Special Education - Public High Cost Aid 3,311,884 2,530,723 2,210,544 (320,179)
Special Education - Private Excess Cost Aid 8,813,281 9,516,830 9,378,421 (138,409)
Transportation Aid 41,284,527 44,622,526 48,217,037 3,594,511
Computer Hardware Aid 769,747 786,052 788,036 1,984
Textbook Aid 2,002,883 2,246,761 2,227,806 (18,955)
Software Aid 559,249 559,279 559,279 -
Library Aid 233,331 209,057 209,057 -
Charter School Transitional Aid 1,704,604 1,864,964 3,688,597 1,823,633
Subtotal - Recurring State Aid 386,207,231 423,362,036 415,173,518 (8,188,518)
>>>>> Building Aid <<<<<
Building Aid 14,666,088 20,013,947 19,112,932 (901,015)
Subtotal - Building Aid 14,666,088 20,013,947 19,112,932 (901,015)
>>>>> State - Other State Revenues <<<<<
NYS Legislative Grant 80,700 - - -
After School Program Aid 1,125,000 1,000,000 - (1,000,000)
Subtotal - Other State Revenues 1,205,700 1,000,000 - (1,000,000)
>>>>> State Aid Adjustments <<<<<
Prior Year Aid Advance - Bond Bank 1,479,000 1,479,000 1,479,000 -
Prior Year Aid - $20M Spin Up Loan Payment (667,000) (667,000) (667,000) -
Non-Recurring Prior Year Aid Adjustments 852,567 203,126 - (203,126)
Local Share Deduction for Certain Students (945,627) (843,536) (909,321) (65,785)
Prior Year Aid Adjustment - EPE - - (2,128,941) (2,128,941)
Subtotal - Prior Year State Aid Adjustments 718,940 171,590 (2,226,262) (2,397,852)
Total - New York State Revenue 402,797,959 444,547,573 432,060,188 (12,487,385)
>>>>> CITY <<<<<
City of Rochester Aid 119,100,000 119,100,000 119,100,000 -
Total - City 119,100,000 119,100,000 119,100,000 -
>>>>> Other Revenue Sources <<<<<
Federal - Medicaid 4,426,311 2,000,000 2,500,000 500,000
Subtotal - Other Revenue Sources 4,426,311 2,000,000 2,500,000 500,000
>>>>> Local - Other <<<<<
Indirect Costs 2,322,353 2,239,231 2,531,811 292,580
Nonresident Tuition 692,627 700,000 700,000 -
Health Services Revenue 735,326 650,000 650,000 -
Rental and Use of Buildings 130,122 150,000 150,000 -
Sale of Obsolete Equipment 4,997 25,000 25,000 -
Prior Years Refunds 1,172,819 650,000 650,000 -
E-Rate Revenue 993,932 3,979,816 1,736,644 (2,243,172)
Student and Other Fees 132,138 75,000 75,000 -
Earnings - Capital Fund Investments 1,197,726 525,000 525,000 -
Earnings - General Fund Investments 2,994,731 1,700,000 1,700,000 -
Miscellaneous Revenue 182,240 180,029 180,029 -
Total - Local Other 10,559,011 10,874,076 8,923,484 (1,950,592)
Appropriated Fund Balance for General Fund - 5,733,807 2,128,941 (3,604,866)
GENERAL FUND Revenue 536,883,281 582,255,456 564,712,613 (17,542,843)
REVENUE SUMMARY
Section 3 Page 8
District-Wide Summary Budget 2009-10 Draft Budget

8/7/2019 2009_2010DRAFT
http://slidepdf.com/reader/full/20092010draft 45/268
2007-08 2008-09 2009-10 $ Variance
Revenue Category Actual Amended Budget Proposed Budget Fav/(Unfav)
REVENUE SUMMARY
GRANT & SPECIAL AID FUNDS
>>>>> State Sources <<<<<
Universal Pre-Kindergarten 10,013,159 10,199,591 10,199,591 -
Other State Source Grants 16,845,771 20,327,718 18,477,429 (1,850,289) Total - State Grant Sources 26,858,930 30,527,309 28,677,020 (1,850,289)
>>>>> Federal Sources <<<<<Federal-Recurring 44,427,708 46,759,179 45,824,173 (935,006)
Federal-Competitive 8,269,987 8,666,303 5,629,362 (3,036,941)
Federal-Stimulus - - 17,285,500 17,285,500
Federal-Roll-over - 4,810,484 5,171,010 360,526
Total - Federal Sources 52,697,695 60,235,966 73,910,045 13,674,079
>>>>> Local Sources <<<<< 2,660,426 3,354,423 2,780,745 (573,678)
GRANT & SPECIAL AID FUND Revenue 82,217,051 94,117,698 105,367,810 11,250,112
SCHOOL FOOD SERVICE FUND
NYS Free & Reduced Price Reimbursemen 544,732 568,150 658,130 89,980
Federal Free & Reduced Price Reimbursemen 11,955,311 12,017,500 13,905,450 1,887,950
Federal Surplus Food Revenue 791,243 600,000 795,000 195,000
Summer Food Service Revenue 351,891 320,000 335,000 15,000
Other Cafeteria Sales 976,932 1,458,641 1,032,170 (426,471)
Appropriation from Food Service Fund Balance - - 63,250 63,250
SCHOOL FOOD SERVICE FUND Revenue 14,620,109 14,964,291 16,789,000 1,824,709
GRAND TOTAL REVENUE - ALL FUNDS 633,720,441 691,337,445 686,869,423 (4,468,022)
Section 3 Page 9
District-Wide Summary Budget 2009-10 Draft Budget

8/7/2019 2009_2010DRAFT
http://slidepdf.com/reader/full/20092010draft 46/268
STATE AID TO EDUCATION
General fund State Aid shown below is based on the State of New York State Aid projections included in the
2009-10 Governor’s Budget Proposal.
FOUNDATION AID $351,317,169
Foundation Aid is unrestricted aid to support the District’s general operations such as salaries, benefits, utilities
and other operating costs. Beginning in 2007-08, NYS combined a number of separate aid categories into
Foundation Aid. These aid categories included: Public Excess Cost, Sound Basic Education, Extraordinary
Needs, Limited English Proficiency and several categorical grants.
DEFICIT REDUCTION ASSESSMENT ($13,417,057)
The Governor has proposed a one-time Deficit Reduction Assessment (DRA) in school aid to address the State’s
current fiscal crises. The DRA is applied to all districts based upon pupil need, local wealth measures and tax
effort, and is equal to 3.13% of the Rochester City School District’s total State Aid.
SPECIAL SERVICES AID $9,994,629
This aid supports certain occupational, marketing and business programs, in grades 10-12 and for approved data
processing expenses pursuant to Regulations of the Commissioner.
SPECIAL EDUCATION – PUBLIC HIGH COST AID $2,210,544
Public High Cost Aid is provided for students with disabilities placed in a special education program by the
Committee on Special Education (CSE) in public settings in the Rochester City School District and at BOCES.
This aid is based upon approved costs, attendance and level of service.
SPECIAL EDUCATION – PRIVATE EXCESS COST AID $9,378,421
Excess Cost Aid is provided for students with disabilities placed in a special education program by the
Committee on Special Education (CSE) in private settings such as St. Joseph’s Villa and Crestwood Children’s
Center. This aid is based upon approved costs, attendance and level of service.
TRANSPORTATION AID $48,217,037
This aid provides up to 90% of the District's approved transportation expenses. Non-allowable expenses include:
the transportation of non-handicapped pupils who live 1 1/2 miles or less from the school attended, and
transportation for extra activities such as field trips, athletic trips, etc.
HARDWARE AND TECHNOLOGY AID $788,036
Computer Hardware and Technology Equipment Aid provides funding for the purchase and lease of micro and/or
mini computer equipment; technology equipment; repair of equipment for instructional purposes; and training
and staff development for instructional purposes.
SOFTWARE, TEXTBOOK AID AND LIBRARY MATERIALS $2,996,142
This aid provides funding for the purchase of computer software, textbooks and library material. The amount of
aid is based on a per-pupil dollar amount.
Section 3 Page 10
District-Wide Summary Budget 2009-10 Draft Budget

8/7/2019 2009_2010DRAFT
http://slidepdf.com/reader/full/20092010draft 47/268
CHARTER SCHOOL TRANSITIONAL AID $3,688,597
This aid partially offsets the cost of tuition that the District must provide for students attending Charter Schools.
BUILDING AID $19,112,932
This aid supports expenses associated with the construction of new buildings, additions, and alterations or
modifications of existing buildings. Building aid is provided for projects which have received prior approvalfrom the State Education Department.
STATE AID ADJUSTMENTS ($2,226,262)
This category represents adjustments for prior year aid monies owed to the District, contingency for prior year
aid claims owed to the State, and revenue to offset the District’s debt service under the State’s Prior Year Claims
Financing Program. This category also contains aid deductions for certain resident student placements, including
incarcerated youth detention centers, intermediate residential treatment programs, and State supported schools for
the Blind and Deaf. The State assumes 100% of the tuition costs for these placements.
GRAND TOTAL STATE $432,060,188
REVENUES FROM CITY $119,100,000
The City of Rochester funding includes the State funded STAR program.
MEDICAID REVENUE $2,500,000
The District receives partial reimbursement under Medicaid for support services provided to Medicaid eligible
students with disabilities. The District receives 25% of the approved billable amount per service. The State
recoups 75% of all federal Medicaid monies received by the District.
OTHER LOCAL REVENUES
INDIRECT COSTS $2,531,811
Many grant-funded programs provide revenue to offset overhead costs, which the District incurs in the operation
of grants. Overhead costs include supervision, accounting costs, etc.
NON-RESIDENT TUITION FROM OTHER DISTRICTS $700,000
The District provides tutoring and other education services to non-resident students on a tuition/fee basis. The
largest portion of these revenues is for tutoring services provided to non-resident students at several agencies inthe area.
HEALTH SERVICES REVENUE $650,000
The District provides health services to non-resident students attending private/parochial schools located within
the district boundaries per NYS regulations. The District bills these costs back to the student’s home districts.
Section 3 Page 11
District-Wide Summary Budget 2009-10 Draft Budget
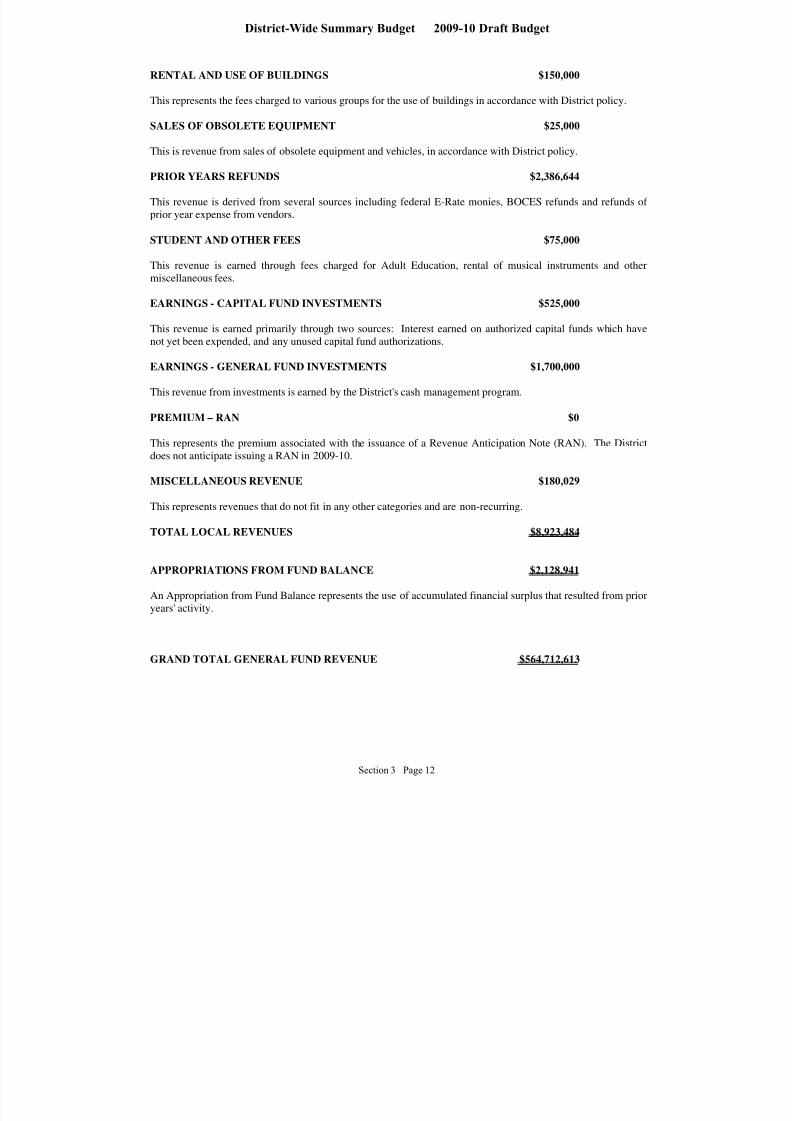
8/7/2019 2009_2010DRAFT
http://slidepdf.com/reader/full/20092010draft 48/268
RENTAL AND USE OF BUILDINGS $150,000
This represents the fees charged to various groups for the use of buildings in accordance with District policy.
SALES OF OBSOLETE EQUIPMENT $25,000
This is revenue from sales of obsolete equipment and vehicles, in accordance with District policy.
PRIOR YEARS REFUNDS $2,386,644
This revenue is derived from several sources including federal E-Rate monies, BOCES refunds and refunds of
prior year expense from vendors.
STUDENT AND OTHER FEES $75,000
This revenue is earned through fees charged for Adult Education, rental of musical instruments and other
miscellaneous fees.
EARNINGS - CAPITAL FUND INVESTMENTS $525,000
This revenue is earned primarily through two sources: Interest earned on authorized capital funds which have
not yet been expended, and any unused capital fund authorizations.
EARNINGS - GENERAL FUND INVESTMENTS $1,700,000
This revenue from investments is earned by the District's cash management program.
PREMIUM – RAN $0
This represents the premium associated with the issuance of a Revenue Anticipation Note (RAN). The District
does not anticipate issuing a RAN in 2009-10.
MISCELLANEOUS REVENUE $180,029
This represents revenues that do not fit in any other categories and are non-recurring.
TOTAL LOCAL REVENUES $8,923,484
APPROPRIATIONS FROM FUND BALANCE $2,128,941
An Appropriation from Fund Balance represents the use of accumulated financial surplus that resulted from prior
years' activity.
GRAND TOTAL GENERAL FUND REVENUE $564,712,613
Section 3 Page 12
District-Wide Summary Budget 2009-10 Draft Budget
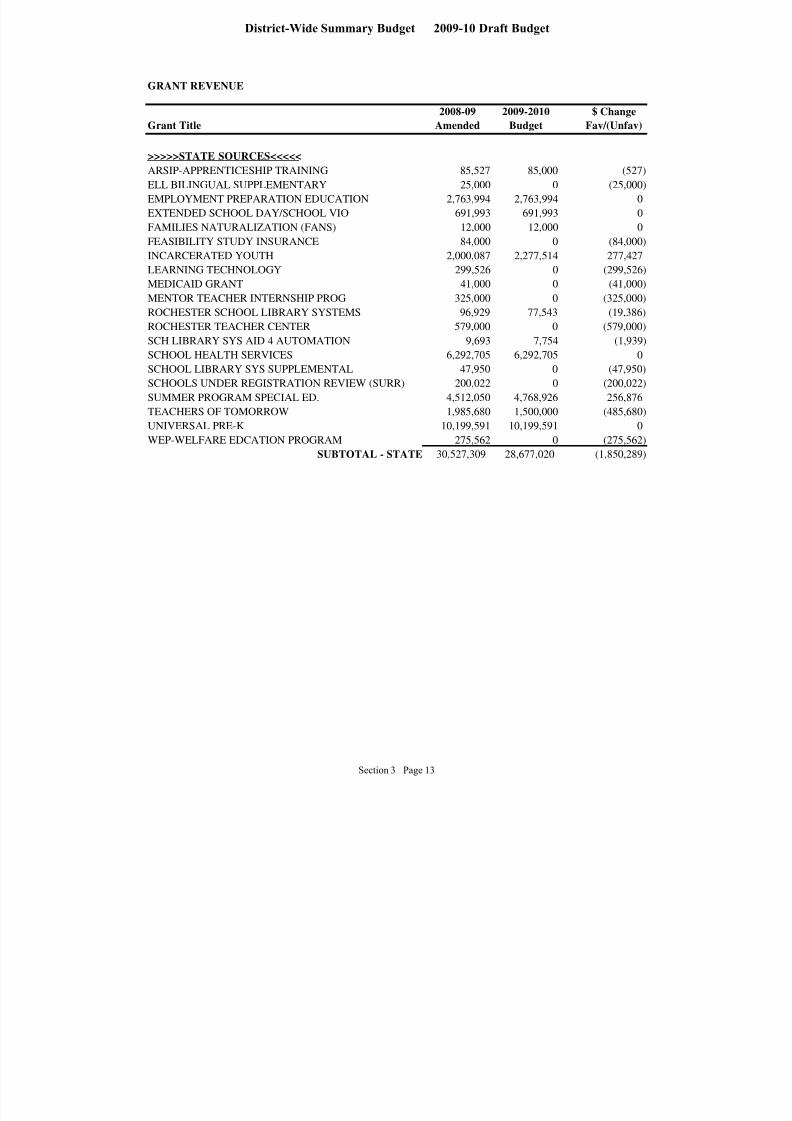
8/7/2019 2009_2010DRAFT
http://slidepdf.com/reader/full/20092010draft 49/268
Grant Title
2008-09
Amended
2009-2010
Budget
$ Change
Fav/(Unfav)
>>>>>STATE SOURCES<<<<<
ARSIP-APPRENTICESHIP TRAINING 85,527 85,000 (527)
ELL BILINGUAL SUPPLEMENTARY 25,000 0 (25,000)
EMPLOYMENT PREPARATION EDUCATION 2,763,994 2,763,994 0
EXTENDED SCHOOL DAY/SCHOOL VIO 691,993 691,993 0
FAMILIES NATURALIZATION (FANS) 12,000 12,000 0
FEASIBILITY STUDY INSURANCE 84,000 0 (84,000)
INCARCERATED YOUTH 2,000,087 2,277,514 277,427
LEARNING TECHNOLOGY 299,526 0 (299,526)
MEDICAID GRANT 41,000 0 (41,000)
MENTOR TEACHER INTERNSHIP PROG 325,000 0 (325,000)ROCHESTER SCHOOL LIBRARY SYSTEMS 96,929 77,543 (19,386)
ROCHESTER TEACHER CENTER 579,000 0 (579,000)
SCH LIBRARY SYS AID 4 AUTOMATION 9,693 7,754 (1,939)
SCHOOL HEALTH SERVICES 6,292,705 6,292,705 0
SCHOOL LIBRARY SYS SUPPLEMENTAL 47,950 0 (47,950)
SCHOOLS UNDER REGISTRATION REVIEW (SURR) 200,022 0 (200,022)
SUMMER PROGRAM SPECIAL ED. 4,512,050 4,768,926 256,876
TEACHERS OF TOMORROW 1,985,680 1,500,000 (485,680)
UNIVERSAL PRE-K 10,199,591 10,199,591 0
WEP-WELFARE EDCATION PROGRAM 275,562 0 (275,562)
SUBTOTAL - STATE 30,527,309 28,677,020 (1,850,289)
GRANT REVENUE
Section 3 Page 13
District-Wide Summary Budget 2009-10 Draft Budget
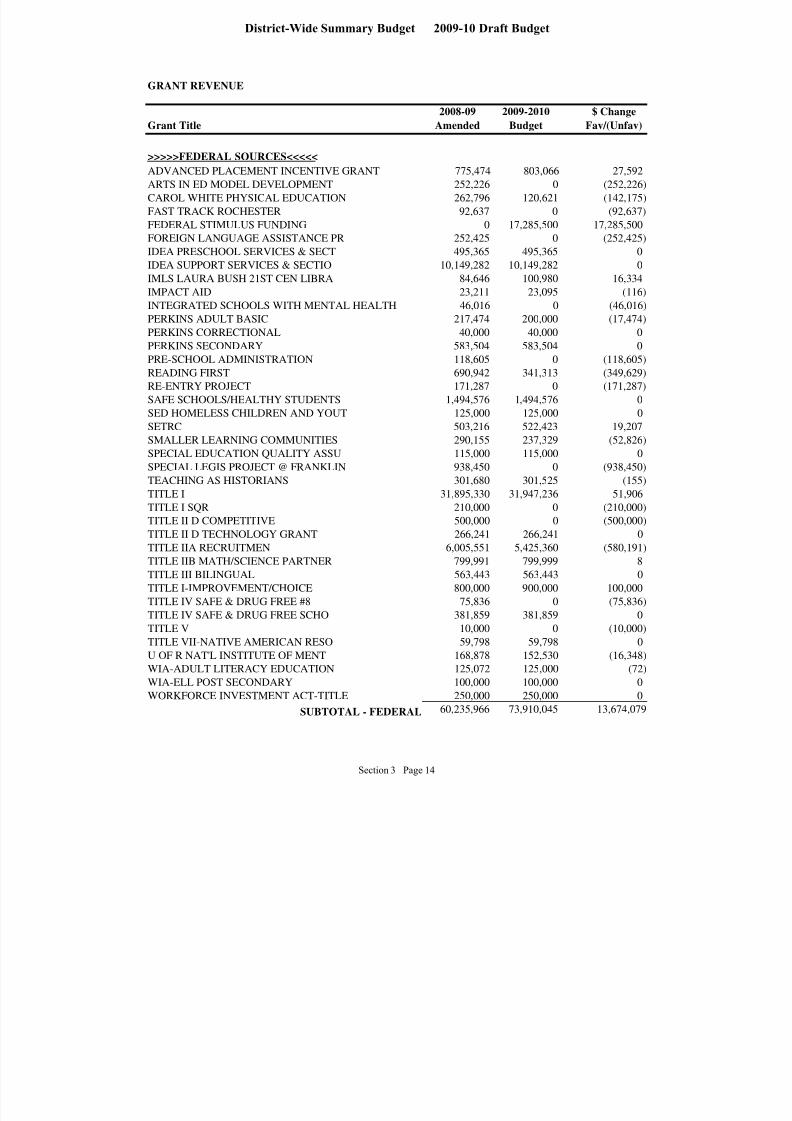
8/7/2019 2009_2010DRAFT
http://slidepdf.com/reader/full/20092010draft 50/268
Grant Title
2008-09
Amended
2009-2010
Budget
$ Change
Fav/(Unfav)
GRANT REVENUE
>>>>>FEDERAL SOURCES<<<<<
ADVANCED PLACEMENT INCENTIVE GRANT 775,474 803,066 27,592
ARTS IN ED MODEL DEVELOPMENT 252,226 0 (252,226)
CAROL WHITE PHYSICAL EDUCATION 262,796 120,621 (142,175)
FAST TRACK ROCHESTER 92,637 0 (92,637)
FEDERAL STIMULUS FUNDING 0 17,285,500 17,285,500
FOREIGN LANGUAGE ASSISTANCE PR 252,425 0 (252,425)
IDEA PRESCHOOL SERVICES & SECT 495,365 495,365 0
IDEA SUPPORT SERVICES & SECTIO 10,149,282 10,149,282 0
IMLS LAURA BUSH 21ST CEN LIBRA 84,646 100,980 16,334
IMPACT AID 23,211 23,095 (116)
INTEGRATED SCHOOLS WITH MENTAL HEALTH 46,016 0 (46,016)PERKINS ADULT BASIC 217,474 200,000 (17,474)
PERKINS CORRECTIONAL 40,000 40,000 0
PERKINS SECONDARY 583,504 583,504 0
PRE-SCHOOL ADMINISTRATION 118,605 0 (118,605)
READING FIRST 690,942 341,313 (349,629)
RE-ENTRY PROJECT 171,287 0 (171,287)
SAFE SCHOOLS/HEALTHY STUDENTS 1,494,576 1,494,576 0
SED HOMELESS CHILDREN AND YOUT 125,000 125,000 0
SETRC 503,216 522,423 19,207
SMALLER LEARNING COMMUNITIES 290,155 237,329 (52,826)
SPECIAL EDUCATION QUALITY ASSU 115,000 115,000 0SPECIAL LEGIS PROJECT @ FRANKLIN 938,450 0 (938,450)
TEACHING AS HISTORIANS 301,680 301,525 (155)
TITLE I 31,895,330 31,947,236 51,906
TITLE I SQR 210,000 0 (210,000)
TITLE II D COMPETITIVE 500,000 0 (500,000)
TITLE II D TECHNOLOGY GRANT 266,241 266,241 0
TITLE IIA RECRUITMEN 6,005,551 5,425,360 (580,191)
TITLE IIB MATH/SCIENCE PARTNER 799,991 799,999 8
TITLE III BILINGUAL 563,443 563,443 0
TITLE I-IMPROVEMENT/CHOICE 800,000 900,000 100,000
TITLE IV SAFE & DRUG FREE #8 75,836 0 (75,836)TITLE IV SAFE & DRUG FREE SCHO 381,859 381,859 0
TITLE V 10,000 0 (10,000)
TITLE VII-NATIVE AMERICAN RESO 59,798 59,798 0
U OF R NAT'L INSTITUTE OF MENT 168,878 152,530 (16,348)
WIA-ADULT LITERACY EDUCATION 125,072 125,000 (72)
WIA-ELL POST SECONDARY 100,000 100,000 0
WORKFORCE INVESTMENT ACT-TITLE 250,000 250,000 0
SUBTOTAL - FEDERAL 60,235,966 73,910,045 13,674,079
Section 3 Page 14
District-Wide Summary Budget 2009-10 Draft Budget

8/7/2019 2009_2010DRAFT
http://slidepdf.com/reader/full/20092010draft 51/268
Grant Title
2008-09
Amended
2009-2010
Budget
$ Change
Fav/(Unfav)
GRANT REVENUE
>>>>>LOCAL SOURCES<<<<<
CFC CUBAN HAITIAN ENTRANTS 30,000 27,544 (2,456)
COHESIVE LEADERSHIP GRANT 135,000 0 (135,000)
COMMUNITY PRE-SCHOOL RELATED S 468,088 468,088 0
CONSUMER CREDIT COUNSELING SVC - STUDENT IN 2,207 0 (2,207)
DANCING WITH THE STARS 5,800 0 (5,800)
ESL STUDENT INTERN 11,616 11,616 0
EXPEDITIONARY LEARNING #58 63,500 62,905 (595)
FOOD SECURITY 30,457 0 (30,457)
GGP - STUDENTS WRITE FOR COMM SVC 15,045 0 (15,045)
GOOD GRADE PAY - SUMMER LAW PREP 18,112 0 (18,112)
GROUP WORKCAMP 35,000 0 (35,000)
GREATER ROCHESTER HEALTH FITNESS STATIONS 10,000 0 (10,000)
HEALTH CARE YOUTH APPRENTICESH 162,000 162,000 0
HOSPITALITY & LODGING CAREER @ JEFFERSON 24,548 0 (24,548)
MONROE COUNTY CAREERS 466,000 466,000 0
MONROE COUNTY TRANSITION SERV 95,000 0 (95,000)
NAZARETH TEACHERS AS LEARNERS 10,000 0 (10,000)
PLAY IT SMART 16,667 0 (16,667)
PRE-SCHOOL ADMINISTRATION/COUNTY 250,450 369,055 118,605
PRE-SCHOOL INTEGRATED/HANDICAPPED 902,268 902,268 0
REEP 131,232 0 (131,232)
SCHOOL #9 & #12 / UNITED WAY 157,700 52,658 (105,042)SPECIAL EDUCATION/ITINERANT TE 132,611 132,611 0
SUMMER LAW PREP (CITY OF ROCHESTER) 20,154 0 (20,154)
THE PRIMARY PROJECT 128,620 99,000 (29,620)
TOSHIBA AMERICA FOUNDATION 518 0 (518)
VIRTUAL ENTERPRISE 27,000 27,000 0
WATER MARSHALL 4,830 0 (4,830)
SUBTOTAL - LOCAL 3,354,423 2,780,745 (573,678)
TOTAL - GRANT REVENUE 94,117,698 105,367,810 11,250,112
Section 3 Page 15
District-Wide Summary Budget 2009-10 Draft Budget

8/7/2019 2009_2010DRAFT
http://slidepdf.com/reader/full/20092010draft 52/268
STATE GRANT REVENUES
UNIVERSAL PRE-KINDERGARTEN $10,199,591
This grant supports the District’s efforts to provide environments and experiences in socialization, early literacy
and motor skill development to all eligible four-year old children, including those with disabilities and children
whose home language is other than English. It also provides aid for the education of three and four-year-old
children from disadvantaged environments and supports the pre-kindergarten program at various District sites.
SCHOOL HEALTH SERVICES $6,292,705
This grant provides reimbursement to the District for the cost of providing nursing services.
SUMMER PROGRAM $4,768,926
State aid supports the District’s Special Education programs during the months of July and August.
EMPLOYMENT PREPARATION EDUCATION AID $2,763,994
This aid supports employment preparation programs such as: adult education, GED preparation, ESOL and
career education for pupils age 21 and older.
INCARCERATED YOUTH $2,277,514
This aid provides funding for instructional services to resident students in the Monroe County Jail.
TEACHERS OF TOMORROW $1,500,000
State grant funds are used to support the recruitment, development and retention of teachers in subject shortage
areas.
EXTENDED SCHOOL DAY/SCHOOL VIOLENCE PREVENTION (ESD/SVP) $691,993
This grant provides resources to ensure that students receive social-emotional skills training and support services
that are proven to prevent violent behavior. Schools also use the funding to implement character education and
bullying prevention strategies to maintain a safe and supportive learning environment.
OTHER STATE GRANT REVENUES $182,297
STATE GRANT REVENUE $28,677,020
Section 3 Page 16
District-Wide Summary Budget 2009-10 Draft Budget

8/7/2019 2009_2010DRAFT
http://slidepdf.com/reader/full/20092010draft 53/268
FEDERAL GRANT REVENUE
CONSOLIDATED APPLICATION (TITLE I, IIA, IID, III, IV) $38,584,139
The NYSED consolidated application includes five grants that are bundled together for the application process
but fund distinctly different programs.
The Title I Basic grant supports academic intervention programs, supplemental educational services, and support
services for economically disadvantaged children - especially those enrolled in schools cited by the State
Education Department as schools in need of improvement. Titles II - IV provide for the recruitment and training
of teachers and administrators; the infusion of technology into instruction; bilingual, LEP and ELL education;
and health and safety programs. The grants are Federal flow through dollars administered by the New York State
Education Department and include:
Title I Basic Improving Academic Achievement for the Disadvantaged
Title IIA Teacher/Principal Recruitment and Training
Title IID Enhancing Education Through Technology
Title III Bilingual, LEP, ELL Programs
Title IV Safe and Drug Free Schools and Communities
FEDERAL STIMULUS FUNDING $17,285,500
The Federal Government is providing additional funding over the next two years through Title I and IDEA
legislation to assist schools under the American Recovery and Reinvestment Act of 2009 (ARRA).
CHILDREN WITH IDENTIFIED EDUCATIONAL DISABILITIES $10,759,647
These grants provide a variety of supplemental aid to students with disabilities ages 3 to 21. Among the largest
grants are the IDEA Section 611 and Section 619 grants. IDEA grants are based upon a State-approved count of
District resident handicapped students. These Pre-school and School-Age grants are designed to help defray the
additional costs to the District for educating handicapped students. Funding is also intended to ensure compliance
with State mandates and guidelines. These grants also support instructional positions including special education
teachers, paraprofessionals, supplies, materials, and purchased services.
SPECIAL EDUCATION TRAINING AND RESOURCE CENTER (SETRC) $522,423
The Special Education Training Resource Center provides training and information to staff involved in educating
children with handicapping conditions, and responds to individual instructional needs of children. These
objectives are accomplished through in-service training, information dissemination, awareness workshops, etc.
READING FIRST $341,313
This grant uses scientifically-based reading research to implement effective professional development, improve
instruction, and modify teaching practices to ensure that all children will read independently and well by the end
of the third grade.
Section 3 Page 17
District-Wide Summary Budget 2009-10 Draft Budget

8/7/2019 2009_2010DRAFT
http://slidepdf.com/reader/full/20092010draft 54/268
WORKFORCE PREPARATION/CAREER AND TECHNICAL EDUCATION $1,258,504
Workforce Preparation activities are designed for moving all students to higher levels of academic and work
standards by developing the skills necessary for success in the workplace, post-secondary education, technical
training and lifelong learning, including obtaining employability skills documented by the Certificate of
Employability and other industry-recognized credentials. Career and Technical Education provide learning
experiences where students become aware of a broad spectrum of careers and develop skills that are applicable
and necessary to personal and career roles. Successful programs will prepare students for employment in specific
career areas or post-secondary study and for life as productive members of society. Federal grants that supportWorkforce Preparation and Career and Technical Education include the The Workforce Investment Act and
Perkins IV Career and Technical Education.
SCHOOL IMPROVEMENT $900,000
LEAs that have Title I schools in need of improvement identified receive an allocation based upon the number of
schools in each category as follows:
Schools in Need of Improvement (SINI) Year 1 and Year 2
Corrective Action Schools (CA) Year 1 and Year 2
Restructured Schools Year 1, Year 2, Year 3 and Year 4 of Implementation
MATH AND SCIENCE PARTNERSHIP TITLE IIB $799,999
This competitive grant provides resources for professional development in Math with partners at the University
of Rochester and Mid-West Regional School Support Center of NYS in order to better evaluate the effectiveness
of math instruction within RCSD.
OTHER FEDERAL GRANT REVENUE $3,458,520
GRAND TOTAL FEDERAL GRANT REVENUE $73,910,045
LOCAL REVENUES
PRESCHOOL SPECIAL EDUCATION - SECTION 441 $1,872,022
Section 4410 provides resources for Preschool Special Education programs and services.
Pre School Integrated/Handicapped
Community Pre-School Related Services
Special Education/Itinerant Teachers (S.E.I.T.)
CPSE Administration
OTHER LOCAL GRANT REVENUE $908,723
GRAND TOTAL LOCAL GRANT REVENUES $2,780,745
GRAND TOTAL - ALL GRANTS $105,367,810
Section 3 Page 18
District-Wide Summary Budget 2009-10 Draft Budget

8/7/2019 2009_2010DRAFT
http://slidepdf.com/reader/full/20092010draft 55/268
2007-2008 2008-2009 2009-2010
Var Bud vs
Amend
Actual Amended Proposed Fav/(Unfav)
EXPENDITURES BY ACCOUNT
Salary Compensation
Teachers' Salaries 194,507,794 207,069,382 208,033,700 (964,318)
Civil Service Salaries 58,970,489 61,953,391 65,945,714 (3,992,323)
Administrator's Salaries 27,411,162 29,084,275 30,193,057 (1,108,782)
Hourly Teachers 14,412,738 17,434,872 15,115,130 2,319,742
Teaching Assistants 3,274,367 3,876,102 4,000,518 (124,416)
Paraprofessionals Salary 10,953,105 11,443,528 13,041,231 (1,597,703)
Sub Total Salary Compensation 309,529,656 330,861,550 336,329,350 (5,467,800)
Other Compensation
Substitute Teacher Cost 9,382,705 11,480,834 11,194,075 286,759
Overtime Non-Instructional Sal 3,736,649 3,865,319 2,674,886 1,190,434
Teachers In Service 1,957,293 2,310,199 2,177,573 132,626
Sub Total Other Compensation 15,076,646 17,656,352 16,046,534 1,609,819
Total Salary and Other Compensation 324,606,302 348,517,902 352,375,884 (3,857,982)
Employee Benefits
Employee Benefits 90,040,564 101,718,279 105,705,019 (3,986,740)
State Employee Retirement 4,699,728 5,455,406 4,855,400 600,006
State Teachers Retirement 18,926,933 21,284,545 20,222,000 1,062,545
Sub Total Employee Benefits 113,667,224 128,458,230 130,782,419 (2,324,189)
Total Compensation and Benefits 438,273,526 476,976,132 483,158,303 (6,182,171)
Fixed Obligations With Variability
Special Education Tuition 28,097,204 26,388,242 26,487,900 (99,658)
Contract Transportation 41,993,353 45,899,012 40,009,711 5,889,301
Charter School Tuition 9,662,024 13,312,457 17,789,758 (4,477,301)
Health Service Other Districts 519,824 599,000 575,000 24,000
Insurance Non-employee 649,335 896,649 981,649 (85,000)
Sub Total Fixed Obligations 80,921,739 87,095,360 85,844,018 1,251,342
Debt Service
Sub Total Debt Service 29,064,443 26,304,378 25,389,093 915,285
Cash Capital Outlays
Cash Capital Expense 6,440,510 6,973,066 6,115,000 858,066
Textbooks 2,843,721 2,823,438 2,415,997 407,441
Equipment Other Than Buses 782,722 1,176,170 854,693 321,477
Equipment Buses 680,947 914,780 - 914,780
Computer Hardware - Instructional 1,042,608 964,785 717,625 247,160
Computer Hardware - Non Instructional 523,000 475,185 396,991 78,194
Library Books 360,594 532,209 255,932 276,277
Sub Total Cash Capital Outlays 12,674,102 13,859,633 10,756,238 3,103,395
Expenditure Summary (All Funds)
Section 3 Page 19
District-Wide Summary Budget 2009-10 Draft Budget
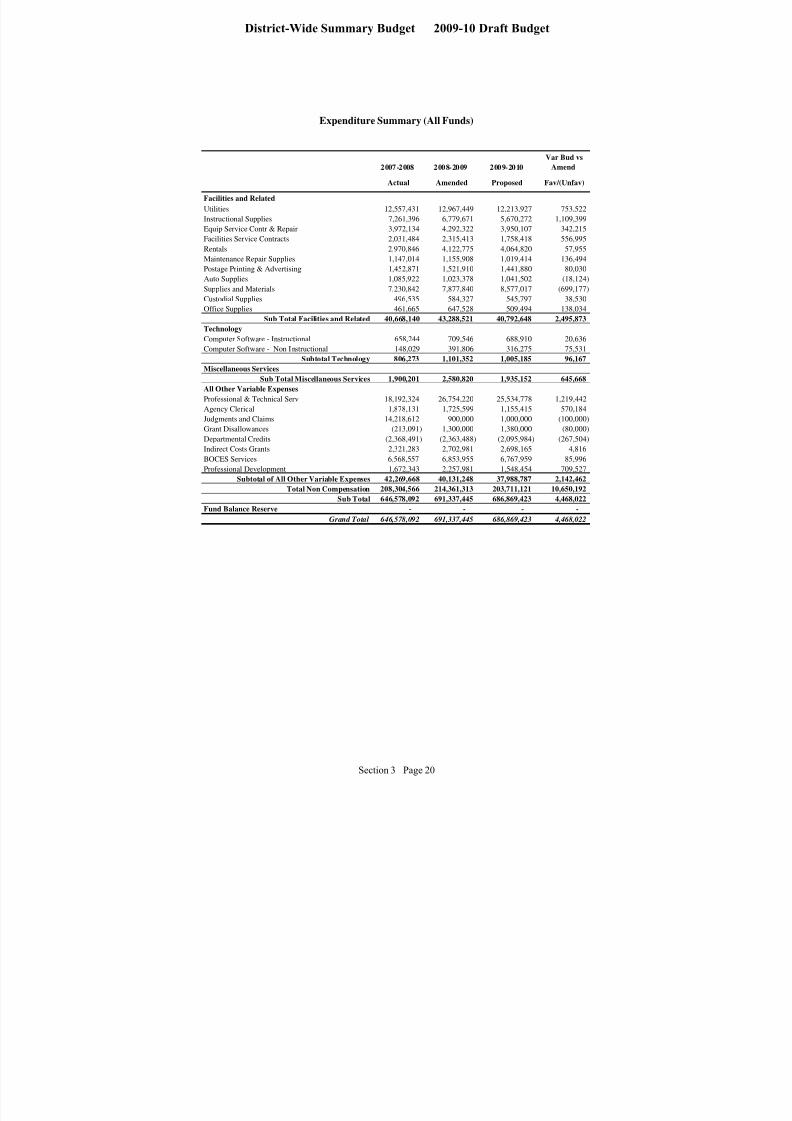
8/7/2019 2009_2010DRAFT
http://slidepdf.com/reader/full/20092010draft 56/268
2007-2008 2008-2009 2009-2010
Var Bud vs
Amend
Actual Amended Proposed Fav/(Unfav)
Expenditure Summary (All Funds)
Facilities and Related
Utilities 12,557,431 12,967,449 12,213,927 753,522
Instructional Supplies 7,261,396 6,779,671 5,670,272 1,109,399
Equip Service Contr & Repair 3,972,134 4,292,322 3,950,107 342,215
Facilities Service Contracts 2,031,484 2,315,413 1,758,418 556,995
Rentals 2,970,846 4,122,775 4,064,820 57,955
Maintenance Repair Supplies 1,147,014 1,155,908 1,019,414 136,494
Postage Printing & Advertising 1,452,871 1,521,910 1,441,880 80,030
Auto Supplies 1,085,922 1,023,378 1,041,502 (18,124)
Supplies and Materials 7,230,842 7,877,840 8,577,017 (699,177)
Custodial Supplies 496,535 584,327 545,797 38,530
Office Supplies 461,665 647,528 509,494 138,034
Sub Total Facilities and Related 40,668,140 43,288,521 40,792,648 2,495,873
Technology
Computer Software - Instructional 658,244 709,546 688,910 20,636
Computer Software - Non Instructional 148,029 391,806 316,275 75,531
Subtotal Technology 806,273 1,101,352 1,005,185 96,167
Miscellaneous Services
Sub Total Miscellaneous Services 1,900,201 2,580,820 1,935,152 645,668
All Other Variable Expenses
Professional & Technical Serv 18,192,324 26,754,220 25,534,778 1,219,442
Agency Clerical 1,878,131 1,725,599 1,155,415 570,184
Judgments and Claims 14,218,612 900,000 1,000,000 (100,000)
Grant Disallowances (213,091) 1,300,000 1,380,000 (80,000)
Departmental Credits (2,368,491) (2,363,488) (2,095,984) (267,504)
Indirect Costs Grants 2,321,283 2,702,981 2,698,165 4,816
BOCES Services 6,568,557 6,853,955 6,767,959 85,996
Professional Development 1,672,343 2,257,981 1,548,454 709,527
Subtotal of All Other Variable Expenses 42,269,668 40,131,248 37,988,787 2,142,462
Total Non Compensation 208,304,566 214,361,313 203,711,121 10,650,192
Sub Total 646,578,092 691,337,445 686,869,423 4,468,022
Fund Balance Reserve - - - -
Grand Total 646,578,092 691,337,445 686,869,423 4,468,022
Section 3 Page 20
District-Wide Summary Budget 2009-10 Draft Budget
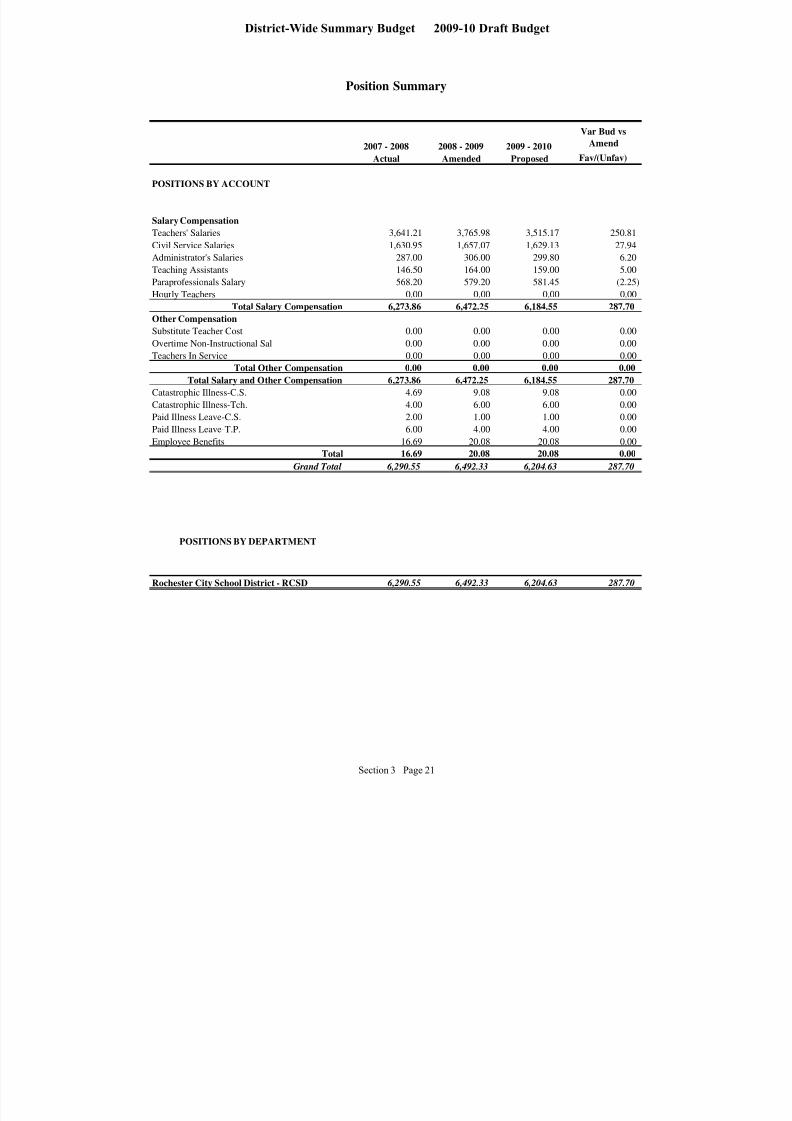
8/7/2019 2009_2010DRAFT
http://slidepdf.com/reader/full/20092010draft 57/268
2007 - 2008 2008 - 2009 2009 - 2010
Var Bud vs
Amend
Actual Amended Proposed Fav/(Unfav)
POSITIONS BY ACCOUNT
Salary Compensation
Teachers' Salaries 3,641.21 3,765.98 3,515.17 250.81
Civil Service Salaries 1,630.95 1,657.07 1,629.13 27.94
Administrator's Salaries 287.00 306.00 299.80 6.20
Teaching Assistants 146.50 164.00 159.00 5.00
Paraprofessionals Salary 568.20 579.20 581.45 (2.25)
Hourly Teachers 0.00 0.00 0.00 0.00
Total Salary Compensation 6,273.86 6,472.25 6,184.55 287.70
Other Compensation
Substitute Teacher Cost 0.00 0.00 0.00 0.00
Overtime Non-Instructional Sal 0.00 0.00 0.00 0.00
Teachers In Service 0.00 0.00 0.00 0.00
Total Other Compensation 0.00 0.00 0.00 0.00
Total Salary and Other Compensation 6,273.86 6,472.25 6,184.55 287.70
Catastrophic Illness-C.S. 4.69 9.08 9.08 0.00
Catastrophic Illness-Tch. 4.00 6.00 6.00 0.00
Paid Illness Leave-C.S. 2.00 1.00 1.00 0.00
Paid Illness Leave-T.P. 6.00 4.00 4.00 0.00
Employee Benefits 16.69 20.08 20.08 0.00
Total 16.69 20.08 20.08 0.00Grand Total 6,290.55 6,492.33 6,204.63 287.70
POSITIONS BY DEPARTMENT
Rochester City School District - RCSD 6,290.55 6,492.33 6,204.63 287.70
Position Summary
Section 3 Page 21
District-Wide Summary Budget 2009-10 Draft Budget
8/7/2019 2009_2010DRAFT
http://slidepdf.com/reader/full/20092010draft 58/268
Explanation of Changes to the Budget
The proposed 2009-10 Rochester City School District Budget decreases to $686.9M from the2008-2009 Amended Budget of $691.3M. This represents a decrease of $4.5M or 0.6%. Theoverall budget decrease was dictated by a reduction in New York State Aid. The 2009-10 Budgetwas balanced by a significant reduction in staff along with district-wide operating budget
reductions.
The District projects Salary and Other Compensation costs to increase to $352.4M in 2009-10from $335.8M in 2008-09. This represents an increase of $3.9M or 1.1%. Contractual salaryincreases that average 3.9% were offset by a reduction of 287.70 FTEs along with savings fromdistrict-wide Substitute Teacher and Overtime cost reductions.
Costs for Employee Benefits continue to rise. Overall, benefit costs increase to $130.8M in 2009-10 from $128.5M in 2008-09. This represents an increase of $2.3M or 1.8%. The overall benefitincrease is relatively modest due to anticipated Health Insurance cost savings related to theDistrict’s move from a community-rated plan to an experience-rated plan. Additional benefit costsavings are expected due to employer contribution rate reductions in the Teachers’ and
Employees’ Retirement Systems.
Fixed Obligations with Variability, which includes Contract Transportation and Charter SchoolTuition, decreases by $1.3M to $85.8M in 2009-10. Contract Transportation decreases by $5.9Mas a result of cost savings from re-bidding the transportation vendor contracts and adjustingelementary school starting times to make more efficient use of the bus fleet. This reduction isoffset by Charter School Tuition, which shows a $4.5M increase to $13.2M. The increase isattributable to projected enrollment growth of 200 students at the existing schools and a 15%Charter School tuition rate increase as determined by the State of New York. The remainingbudgets in this category will increase by a total of $0.1M.
The Debt Service budget will decrease by $0.9M to $25.4M to reflect changes in the District’s
long-term debt schedule. This reduction is due largely to reduced interest payments on existingBonds and Bond Anticipation Notes.
The District anticipates Cash Capital Outlays will decrease by $3.1M to $10.8M in 2009-10. TheEquipment Buses budget was eliminated as a result of the Transportation efficiencies previouslydiscussed, while the remaining categories saw significant reductions as part of the district-wideoperating budget reductions effort.
The balance of the District’s 2009-10 Budget shows a decrease of $5.4M. Once again, almost allof the remaining budget categories experienced reductions as part of the district-wide operatingbudget reductions effort to balance the budget.
Section 3 Page 22
District-Wide Summary Budget 2009-10 Draft Budget

8/7/2019 2009_2010DRAFT
http://slidepdf.com/reader/full/20092010draft 59/268
Multi-Year Projection
OVERVIEW:
The multi-year projection represents a forecast of the District’s revenue and expenditures for the nextthree fiscal years. The projections shown allow the District to begin the planning process to solve foranticipated deficits in future years.
Beginning in 2007-08, New York State committed to a four-year Foundation Aid plan to provideadequate financial support to high needs school districts. As a result, the Rochester City School Districtenjoyed large State Aid increases in 2007-08 and 2008-09. However, given the State’s fiscal situation, theprojected revenues in this analysis reflect aid increases based upon long-term historical averages ratherthan the proposed increases under Foundation Aid. The projected $5 million reduction in Other StateRevenue is due to a lower Transportation Department cost structure, which will result in a correspondingdecrease in Transportation Aid in 2010-11.
ASSUMPTIONS:
Based on historical trend analysis and contractual commitments, the District utilizes the following annualrates of increase to develop the projections:
AssumptionsProjected2010-2011
Projected2011-2012
Projected2012-2013
Revenues:
State Aid Revenue Annual Increase 1.00% 2.00% 3.00%
State Aid Revenue - Other Increase -$5,000,000 3.00% 3.00%
City of Rochester Revenue Increase 0.00% 0.00% 0.00%
All Other General Fund Revenue Increase 0.00% 0.00% 0.00%
Appropriated Fund Balance $2,128,941 $2,128,941 $2,128,941
Grant and Special Aid Fund Increase 0.00% 0.00% 0.00%
Food Services Revenue Increase 2.00% 2.00% 2.00%
Expenditures:
Teacher Salary Increase 4.39% 4.39% 4.39%Civil Service Salary Increase 3.95% 3.95% 3.95%
Administrative Salary Increase 3.95% 3.95% 3.95%
Hourly Teachers Salary Increase 4.00% 4.00% 4.00%
Teaching Assistants Salary Increase 3.95% 3.95% 3.95%
Paraprofessionals Salary Increase 3.95% 3.95% 3.95%
Other Compensation Annual Rate Increase 2.00% 2.00% 2.00%
Benefits Increase 10.50% 10.50% 10.50%
Employee Retirement System % of Payroll 10.60% 10.60% 10.60%
Teachers Retirement System % of Payroll 10.20% 10.20% 10.20%
Charter Schools tuition increase per student 4.00% 4.00% 4.00%
New Charter School students each year 140 60 60
Transportation Contracts incl. impact of Charters 3.50% 3.50% 3.50%
Special Education (Tuition) 4.00% 4.00% 4.00%
Cash Capital per Year $6,115,000 $6,115,000 $6,115,000
Utilities 7.00% 7.00% 7.00%
BOCES Services (SPED Tuition & Nurses) 4.00% 4.00% 4.00%
CPI 3.50% 3.50% 3.50%
No FTE staffing changes
No Facilities Modernization impact
Section 3 Page 23
District-Wide Summary Budget 2009-10 Draft Budget

8/7/2019 2009_2010DRAFT
http://slidepdf.com/reader/full/20092010draft 60/268
Multi-Year Projection
Projected RCSD Deficit
620
640
660
680
700
720
740
760
780
800
820
Proposed
2009-2010
Projected
2010-2011
Projected
2011-2012
Projected
2012-2013
Million
s
To ta l Re ve nue Gra nd To ta l Exp end iture s
Structural
Deficit
Surplus/(Deficit):
0 ($45.6M) ($70.6M) ($94.2M)
CLOSING THE DEFICIT:
Based on the assumptions above, the District projects a deficit situation in future years due to stagnatingrevenue and rising expenses. New York State law mandates that the District maintain a balanced budget.
Revenue
The Rochester City School District is a fiscally dependent school district and therefore cannot levy taxes.The District can impact revenue in the following ways:
Lobbying state government officials to continue funding proposed Foundation Aid increases
Lobbying local government officials to continue their support of the District’s needs
Searching for and securing additional grant funding
Expenses
The District continues to focus on automating operations, partnering with other government entities andbusinesses and cost-cutting initiatives.
Section 3 Page 24
District-Wide Summary Budget 2009-10 Draft Budget

8/7/2019 2009_2010DRAFT
http://slidepdf.com/reader/full/20092010draft 61/268
Multi-Year Projection
Proposed
2009-2010
Projected
2010-2011
Projected
2011-2012
Projected
2012-2013
Revenue:
New York State Foundation Aid 337,900,112 341,279,113 348,104,695 358,547,836
New York State Aid - Other 75,047,144 70,047,144 72,148,558 74,313,015
New York State Building Aid 19,112,932 19,112,932 19,112,932 19,112,932
City of Rochester 119,100,000 119,100,000 119,100,000 119,100,000
Federal-Medicaid 2,500,000 2,500,000 2,500,000 2,500,000
Other Local 8,923,484 8,923,484 8,923,484 8,923,484
Appropriated Fund Balance 2,128,941 2,128,941 2,128,941 2,128,941
Grant and Special Aid Fund 105,367,810 105,367,810 105,367,810 105,367,810
Food Services 16,789,000 17,124,780 17,467,276 17,816,621
Total Revenue 686,869,423 685,584,204 694,853,696 707,810,639
Compensation 352,375,884 366,904,730 382,041,693 397,812,445
Employee Benefits 130,782,419 153,668,415 167,455,045 182,593,233
Total Compensation and Benefits 483,158,303 520,573,145 549,496,738 580,405,678
Fixed Obligations with Variability 85,844,018 89,885,617 93,175,786 96,590,137
Debt Service 25,389,093 25,389,093 25,389,093 25,389,093
Cash Capital Outlays 10,756,238 11,678,235 11,749,573 11,823,408
Facilities and Related 40,792,648 42,505,610 44,308,449 46,206,406
Technology 1,005,185 1,005,185 1,005,185 1,005,185
Other Variable Expenses 39,923,938 40,121,297 40,326,917 40,541,142
Total Non Compensation 203,711,121 210,585,037 215,955,003 221,555,371
Grand Total Expenditures 686,869,423 731,158,182 765,451,741 801,961,049
Total Surplus/(Deficit) (0) (45,573,978) (70,598,045) (94,150,410)
Section 3 Page 25
District-Wide Summary Budget 2009-10 Draft Budget

8/7/2019 2009_2010DRAFT
http://slidepdf.com/reader/full/20092010draft 62/268
THIS PAGE INTENTIONALLY LEFT BLANK
Section 3 Page 26
District-Wide Summary Budget 2009-10 Draft Budget

8/7/2019 2009_2010DRAFT
http://slidepdf.com/reader/full/20092010draft 63/268
school ProfIles and Budgets
All SchoolsNortheast Zone SchoolsNorthwest Zone Schools
South Zone SchoolsSchool Support

8/7/2019 2009_2010DRAFT
http://slidepdf.com/reader/full/20092010draft 64/268
THIS PAGE INTENTIONALLY LEFT BLANK
Section 4 Page 2
School Profiles and Budgets 2009-10 Draft Budget
8/7/2019 2009_2010DRAFT
http://slidepdf.com/reader/full/20092010draft 65/268
ROCHESTER CITY SCHOOL DISTRICT
Northeast Zone-Elementary
No. 6 Dag Hammarskjold
No. 20 Henry Lomb
No. 22 Abraham Lincoln
No. 25 Nathaniel Hawthorne
No. 33 Audubon
No. 36 Henry W. Longfellow
No. 39 Andrew J. Townson
No. 45 Mary McLeod Bethune
No. 50 Helen Barrett Montgomery
No. 52 Frank Fowler Dow
No. 53 Montessori Academy @ Franklin
Northeast Zone-Secondary
BioScience & Health Careers High School @ Franklin
Dr. Freddie Thomas High School
Global Media Arts High School @ Franklin
International Finance & Economic Development Career High School @ Franklin
Northeast College Preparatory High School @ Douglass Campus
Northwest College Preparatory High School @ Douglass Campus
Northeast Zone-Programs
North S.T.A.R. Educational Program Young Mothers & Interim Health Academy
Northwest Zone-Elementary
No. 3 Nathaniel Rochester Community School
No. 5 John Williams
No. 7 Virgil I. Grissom
No. 8 Roberto Clemente
No. 9 Dr. Martin Luther King, Jr.
No. 17 Enrico Fermi
No. 30 General Elwell S. Otis
No. 34 Dr. Louis A. Cerulli
No. 41 Kodak Park No. 42 Abelard Reynolds
No. 43 Theodore Roosevelt
No. 44 Lincoln Park
No. 54 The Flower City School
No. 57 Early Childhood School of Rochester
Section 4 Page 3
School Profiles and Budgets 2009-10 Draft Budget

8/7/2019 2009_2010DRAFT
http://slidepdf.com/reader/full/20092010draft 66/268
Northwest Zone-Secondary
Charlotte High School
John Marshall High School
School of Applied Technology @ Edison
School of Business, Finance & Entrepreneurship @ EdisonSchool of Engineering & Manufacturing @ Edison
School of Imaging & Information Technology @ Edison
Thomas Jefferson High School
South Zone-Elementary
No. 1 Martin B. Anderson
No. 2 Clara Barton
No. 4 George Mather Forbes
No. 12 James P.B. Duffy
No. 14 Chester DeweyNo. 15 The Children’s School of Rochester
No. 16 John Walton Spencer
No. 19 Dr. Charles T. Lunsford
No. 23 Francis Parker
No. 28 Henry Hudson
No. 29 Adlai E. Stevenson
No. 35 Pinnacle
No. 46 Charles Carroll
No. 58 World of Inquiry
South Zone-Secondary
East High School
James Monroe High School
School of the Arts
School Without Walls-Commencement Academy
School Without Walls-Foundation Academy
Wilson Commencement Academy
Wilson Foundation Academy
Section 4 Page 4
School Profiles and Budgets 2009-10 Draft Budget
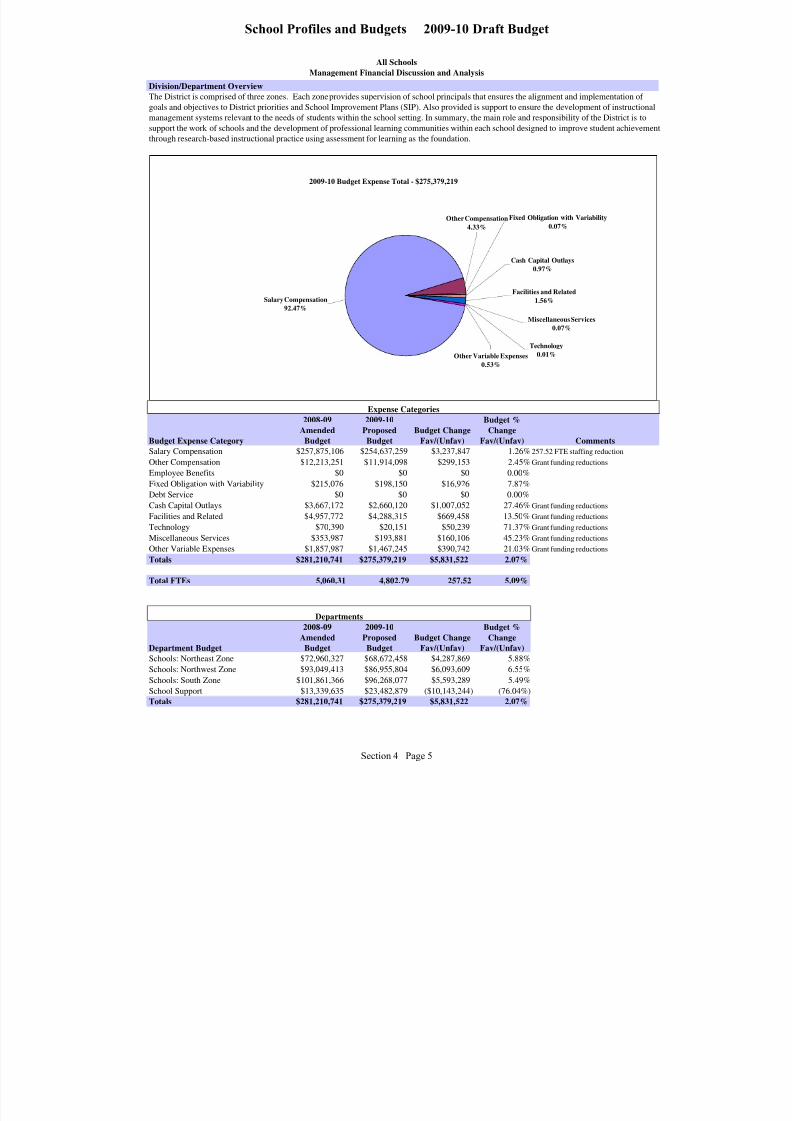
8/7/2019 2009_2010DRAFT
http://slidepdf.com/reader/full/20092010draft 67/268
All Schools
Management Financial Discussion and Analysis
Division/Department Overview
Budget Expense Category
2008-09
Amended
Budget
2009-10
Proposed
Budget
Budget Change
Fav/(Unfav)
Budget %
Change
Fav/(Unfav) Comments
Salary Compensation $257,875,106 $254,637,259 $3,237,847 1.26% 257.52 FTE staffing reductionOther Compensation $12,213,251 $11,914,098 $299,153 2.45% Grant funding reductions
Employee Benefits $0 $0 $0 0.00%
Fixed Obligation with Variability $215,076 $198,150 $16,926 7.87%
Debt Service $0 $0 $0 0.00%
Cash Capital Outlays $3,667,172 $2,660,120 $1,007,052 27.46% Grant funding reductions
Facilities and Related $4,957,772 $4,288,315 $669,458 13.50% Grant funding reductions
Technology $70,390 $20,151 $50,239 71.37% Grant funding reductions
Miscellaneous Services $353,987 $193,881 $160,106 45.23% Grant funding reductions
Other Variable Expenses $1,857,987 $1,467,245 $390,742 21.03% Grant funding reductions
Totals $281,210,741 $275,379,219 $5,831,522 2.07%
Total FTEs 5,060.31 4,802.79 257.52 5.09%
Department Budget
2008-09
Amended
Budget
2009-10
Proposed
Budget
Budget Change
Fav/(Unfav)
Budget %
Change
Fav/(Unfav)
Schools: Northeast Zone $72,960,327 $68,672,458 $4,287,869 5.88%
Schools: Northwest Zone $93,049,413 $86,955,804 $6,093,609 6.55%
Schools: South Zone $101,861,366 $96,268,077 $5,593,289 5.49%
School Support $13,339,635 $23,482,879 ($10,143,244) (76.04%)
Totals $281,210,741 $275,379,219 $5,831,522 2.07%
Expense Categories
Departments
The District is comprised of three zones. Each zone provides supervision of school principals that ensures the alignment and implementation of
goals and objectives to District priorities and School Improvement Plans (SIP). Also provided is support to ensure the development of instructional
management systems relevant to the needs of students within the school setting. In summary, the main role and responsibility of the District is to
support the work of schools and the development of professional learning communities within each school designed to improve student achievement
through research-based instructional practice using assessment for learning as the foundation.
2009-10 Budget Expense Total - $275,379,219
Technology
0.01%
Salary Compensation92.47%
Fixed Obligation with Variability
0.07%Other Compensation
4.33%
Facilities and Related
1.56%
Cash Capital Outlays
0.97%
Miscellaneous Services
0.07%
Other Variable Expenses
0.53%
Section 4 Page 5
School Profiles and Budgets 2009-10 Draft Budget

8/7/2019 2009_2010DRAFT
http://slidepdf.com/reader/full/20092010draft 68/268
All Schools
2007-2008 2008-2009 2009-2010
Var Bud vs
Amend
Actual Amended Proposed Fav/(Unfav)
EXPENDITURES BY ACCOUNT
Salary Compensation
Teachers' Salaries 178,379,718 191,498,769 188,435,010 3,063,759
Civil Service Salaries 20,135,137 22,584,850 23,098,066 (513,216)
Administrator's Salaries 19,802,622 21,056,634 21,609,020 (552,386)
Hourly Teachers 7,535,966 8,156,998 6,182,719 1,974,279
Teaching Assistants 3,257,987 3,716,874 3,726,043 (9,169)
Paraprofessionals Salary 9,693,144 10,860,981 11,586,401 (725,420)
Sub Total Salary Compensation 238,804,575 257,875,106 254,637,259 3,237,847
Other Compensation
Substitute Teacher Cost 8,362,803 10,139,458 10,387,082 (247,624)
Overtime Non-Instructional Sal 1,058,032 1,221,506 1,024,715 196,791
Teachers In Service 744,716 852,287 502,301 349,986
Sub Total Other Compensation 10,165,551 12,213,251 11,914,098 299,153
Total Salary and Other Compensation 248,970,126 270,088,357 266,551,357 3,537,000 Sub Total Employee Benefits - - - -
Total Compensation and Benefits 248,970,126 270,088,357 266,551,357 3,537,000
Fixed Obligations With Variability
Special Education Tuition - 2,110 - 2,110
Contract Transportation 196,953 212,966 198,150 14,816
Charter School Tuition - - - -
Health Service Other Districts - - - -
Insurance Non-employee - - - -
Sub Total Fixed Obligations 196,953 215,076 198,150 16,926
Debt Service
Sub Total Debt Service - - - -
Cash Capital Outlays
Cash Capital Expense - - - -
Textbooks 2,550,158 2,400,212 1,995,409 404,803
Equipment Other Than Buses 298,111 440,439 214,926 225,513 Equipment Buses - - - -
Computer Hardware - Instructional 297,780 178,448 67,625 110,823
Computer Hardware - Non Instructional 146,632 193,970 176,684 17,286
Library Books 184,034 454,103 205,476 248,627
Sub Total Cash Capital Outlays 3,476,716 3,667,172 2,660,120 1,007,052
Expenditure Summary (All Funds)
Section 4 Page 6
School Profiles and Budgets 2009-10 Draft Budget
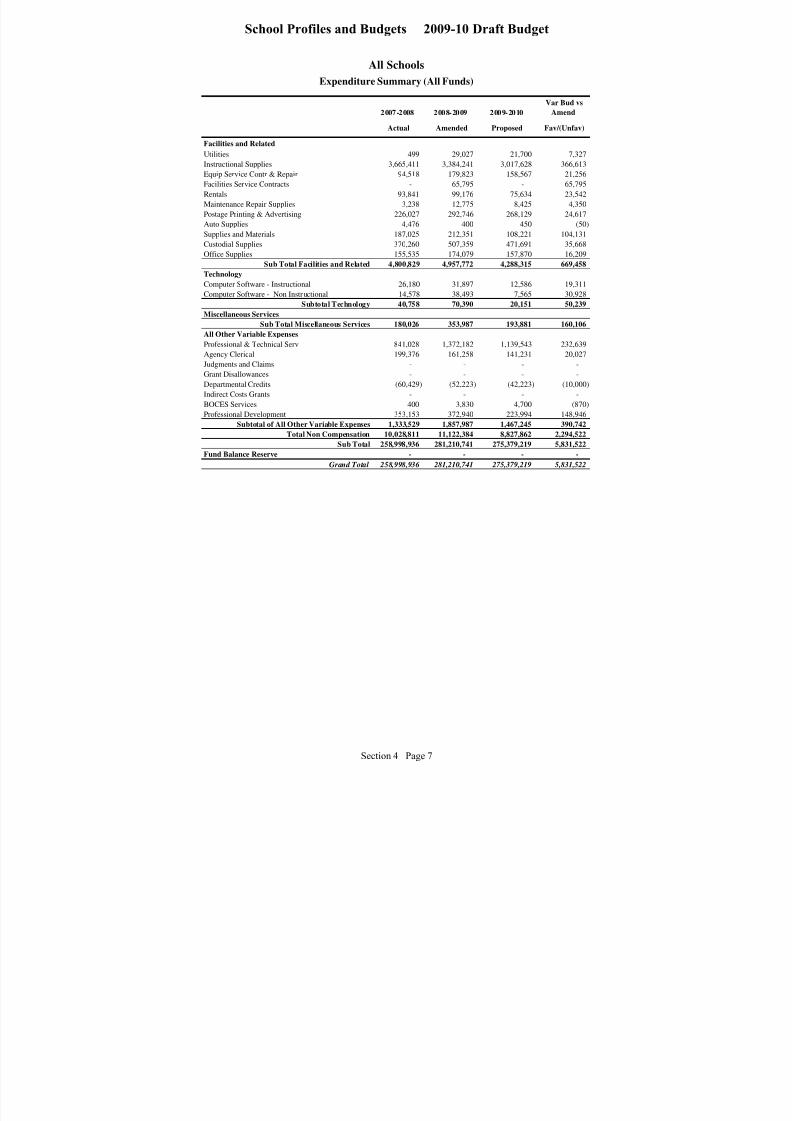
8/7/2019 2009_2010DRAFT
http://slidepdf.com/reader/full/20092010draft 69/268
All Schools
2007-2008 2008-2009 2009-2010
Var Bud vs
Amend
Actual Amended Proposed Fav/(Unfav)
Expenditure Summary (All Funds)
Facilities and Related
Utilities 499 29,027 21,700 7,327
Instructional Supplies 3,665,411 3,384,241 3,017,628 366,613
Equip Service Contr & Repair 94,518 179,823 158,567 21,256
Facilities Service Contracts - 65,795 - 65,795
Rentals 93,841 99,176 75,634 23,542
Maintenance Repair Supplies 3,238 12,775 8,425 4,350
Postage Printing & Advertising 226,027 292,746 268,129 24,617
Auto Supplies 4,476 400 450 (50)
Supplies and Materials 187,025 212,351 108,221 104,131
Custodial Supplies 370,260 507,359 471,691 35,668
Office Supplies 155,535 174,079 157,870 16,209
Sub Total Facilities and Related 4,800,829 4,957,772 4,288,315 669,458
Technology
Computer Software - Instructional 26,180 31,897 12,586 19,311
Computer Software - Non Instructional 14,578 38,493 7,565 30,928
Subtotal Technology 40,758 70,390 20,151 50,239 Miscellaneous Services
Sub Total Miscellaneous Services 180,026 353,987 193,881 160,106
All Other Variable Expenses
Professional & Technical Serv 841,028 1,372,182 1,139,543 232,639
Agency Clerical 199,376 161,258 141,231 20,027
Judgments and Claims - - - -
Grant Disallowances - - - -
Departmental Credits (60,429) (52,223) (42,223) (10,000)
Indirect Costs Grants - - - -
BOCES Services 400 3,830 4,700 (870)
Professional Development 353,153 372,940 223,994 148,946
Subtotal of All Other Variable Expenses 1,333,529 1,857,987 1,467,245 390,742
Total Non Compensation 10,028,811 11,122,384 8,827,862 2,294,522
Sub Total 258,998,936 281,210,741 275,379,219 5,831,522
Fund Balance Reserve - - - - Grand Total 258,998,936 281,210,741 275,379,219 5,831,522
Section 4 Page 7
School Profiles and Budgets 2009-10 Draft Budget
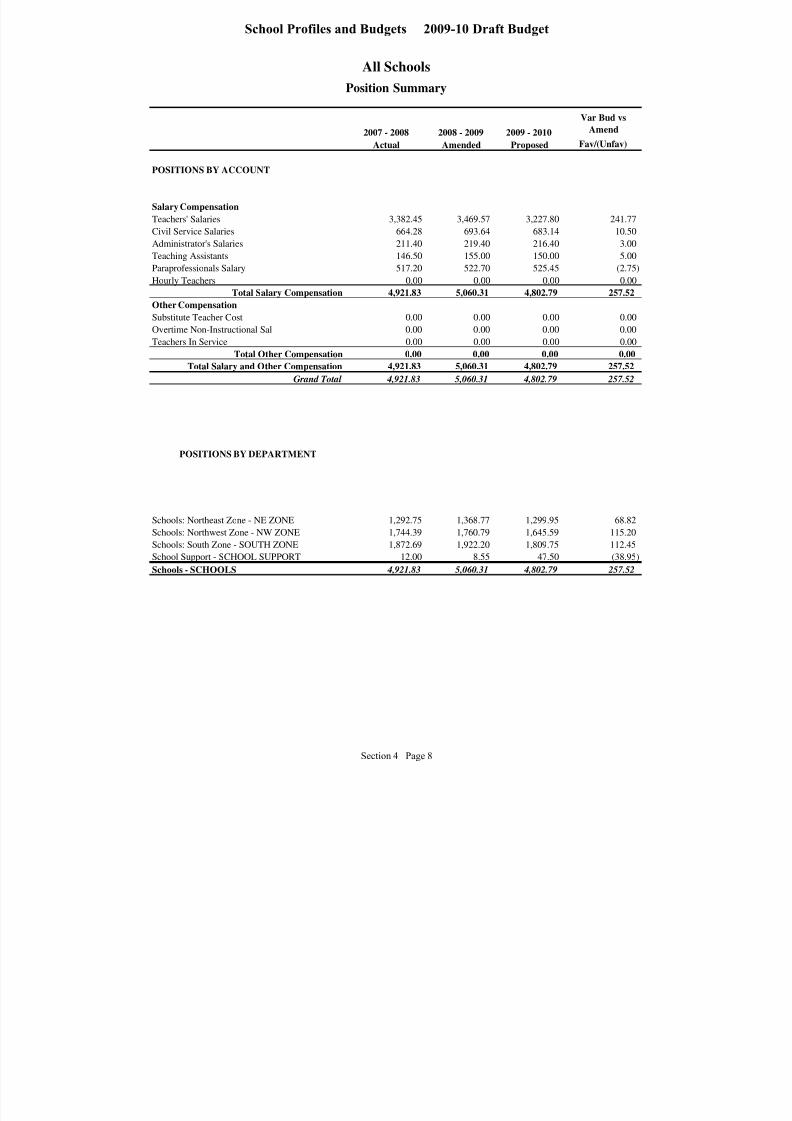
8/7/2019 2009_2010DRAFT
http://slidepdf.com/reader/full/20092010draft 70/268
All Schools
2007 - 2008 2008 - 2009 2009 - 2010
Var Bud vs
Amend
Actual Amended Proposed Fav/(Unfav)
POSITIONS BY ACCOUNT
Salary Compensation
Teachers' Salaries 3,382.45 3,469.57 3,227.80 241.77
Civil Service Salaries 664.28 693.64 683.14 10.50
Administrator's Salaries 211.40 219.40 216.40 3.00
Teaching Assistants 146.50 155.00 150.00 5.00
Paraprofessionals Salary 517.20 522.70 525.45 (2.75)
Hourly Teachers 0.00 0.00 0.00 0.00
Total Salary Compensation 4,921.83 5,060.31 4,802.79 257.52
Other CompensationSubstitute Teacher Cost 0.00 0.00 0.00 0.00
Overtime Non-Instructional Sal 0.00 0.00 0.00 0.00
Teachers In Service 0.00 0.00 0.00 0.00
Total Other Compensation 0.00 0.00 0.00 0.00
Total Salary and Other Compensation 4,921.83 5,060.31 4,802.79 257.52
Grand Total 4,921.83 5,060.31 4,802.79 257.52
POSITIONS BY DEPARTMENT
Schools: Northeast Zone - NE ZONE 1,292.75 1,368.77 1,299.95 68.82
Schools: Northwest Zone - NW ZONE 1,744.39 1,760.79 1,645.59 115.20
Schools: South Zone - SOUTH ZONE 1,872.69 1,922.20 1,809.75 112.45
School Support - SCHOOL SUPPORT 12.00 8.55 47.50 (38.95)
Schools - SCHOOLS 4,921.83 5,060.31 4,802.79 257.52
Position Summary
Section 4 Page 8
School Profiles and Budgets 2009-10 Draft Budget

8/7/2019 2009_2010DRAFT
http://slidepdf.com/reader/full/20092010draft 71/268
6
9
8
22
52
39
50
45
2533
36
4628
8
22
6
20
9
53
NORTHEASTERN
FRANKLIN
DOUGLASS
THOMAS
EAST
Northeast Zone-Elementary
No. 6 Dag Hammarskjold
No. 20 Henry Lomb
No. 22 Abraham Lincoln
No. 25 Nathaniel Hawthorne
No. 33 Audubon
No. 36 Henry W. Longfellow
No. 39 Andrew J. Townson
No. 45 Mary McLeod Bethune
No. 50 Helen Barrett Montgomery
No. 52 Frank Fowler Dow
No. 53 Montessori Academy @ Franklin
Northeast Zone-Secondary
BioScience & Health Careers High School @ Franklin
Dr. Freddie Thomas High School
Global Media Arts High School @ Franklin
International Finance & Economic Development Career High School @ Franklin
Northeast College Preparatory High School @ Douglass Campus
Northwest College Preparatory High School @ Douglass Campus
Northeast Zone-Programs
North S.T.A.R. Educational Program Young Mothers & Interim Health Academy
Section 4 Page 9
School Profiles and Budgets 2009-10 Draft Budget
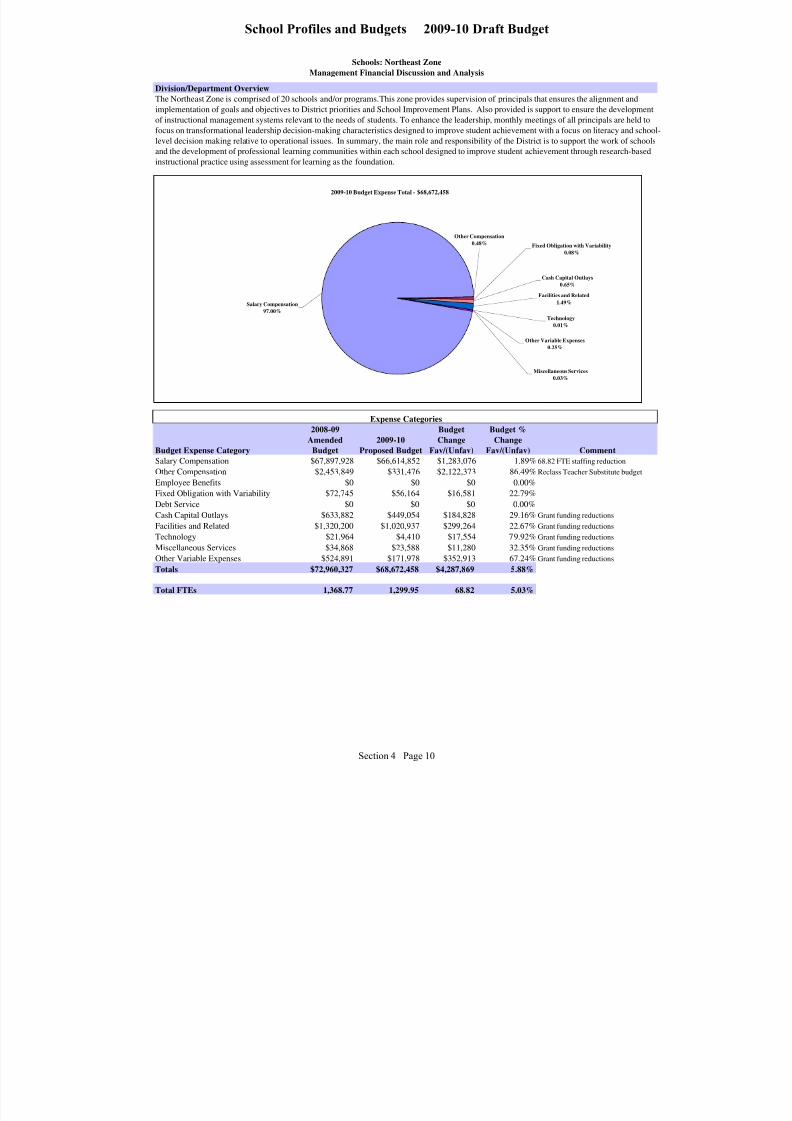
8/7/2019 2009_2010DRAFT
http://slidepdf.com/reader/full/20092010draft 72/268
Schools: Northeast Zone
Management Financial Discussion and Analysis
Division/Department Overview
Budget Expense Category
2008-09
Amended
Budget
2009-10
Proposed Budget
Budget
Change
Fav/(Unfav)
Budget %
Change
Fav/(Unfav) CommentSalary Compensation $67,897,928 $66,614,852 $1,283,076 1.89% 68.82 FTE staffing reduction
Other Compensation $2,453,849 $331,476 $2,122,373 86.49% Reclass Teacher Substitute budget
Employee Benefits $0 $0 $0 0.00%
Fixed Obligation with Variability $72,745 $56,164 $16,581 22.79%
Debt Service $0 $0 $0 0.00%
Cash Capital Outlays $633,882 $449,054 $184,828 29.16% Grant funding reductions
Facilities and Related $1,320,200 $1,020,937 $299,264 22.67% Grant funding reductions
Technology $21,964 $4,410 $17,554 79.92% Grant funding reductions
Miscellaneous Services $34,868 $23,588 $11,280 32.35% Grant funding reductions
Other Variable Expenses $524,891 $171,978 $352,913 67.24% Grant funding reductions
Totals $72,960,327 $68,672,458 $4,287,869 5.88%
Total FTEs 1,368.77 1,299.95 68.82 5.03%
Expense Categories
The Northeast Zone is comprised of 20 schools and/or programs. This zone provides supervision of principals that ensures the alignment and
implementation of goals and objectives to District priorities and School Improvement Plans. Also provided is support to ensure the development
of instructional management systems relevant to the needs of students. To enhance the leadership, monthly meetings of all principals are held to
focus on transformational leadership decision-making characteristics designed to improve student achievement with a focus on literacy and school-
level decision making relative to operational issues. In summary, the main role and responsibility of the District is to support the work of schools
and the development of professional learning communities within each school designed to improve student achievement through research-basedinstructional practice using assessment for learning as the foundation.
2009-10 Budget Expense Total - $68,672,458
Other Variable Expenses
0.25%
Miscellaneous Services
0.03%
Technology
0.01%
Salary Compensation97.00%
Fixed Obligation with Variability
0.08%
Other Compensation
0.48%
Facilities and Related
1.49%
Cash Capital Outlays
0.65%
Section 4 Page 10
School Profiles and Budgets 2009-10 Draft Budget
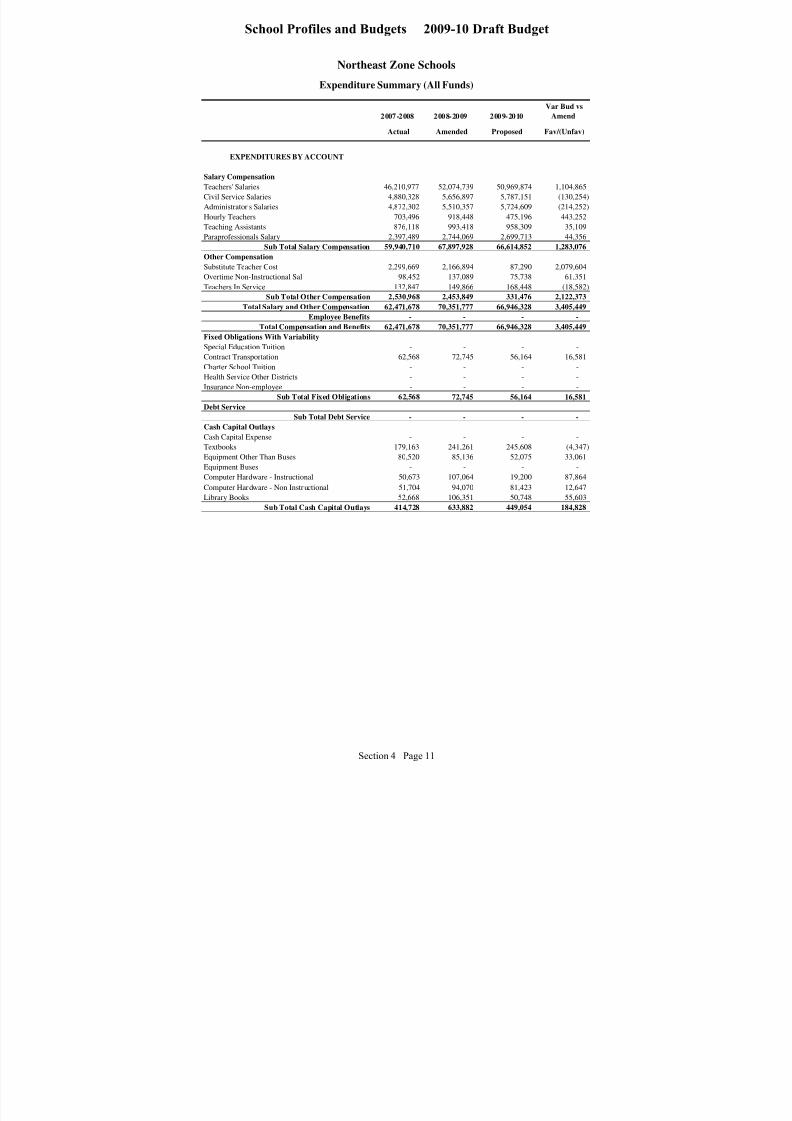
8/7/2019 2009_2010DRAFT
http://slidepdf.com/reader/full/20092010draft 73/268
Northeast Zone Schools
2007-2008 2008-2009 2009-2010
Var Bud vs
Amend
Actual Amended Proposed Fav/(Unfav)
EXPENDITURES BY ACCOUNT
Salary Compensation
Teachers' Salaries 46,210,977 52,074,739 50,969,874 1,104,865
Civil Service Salaries 4,880,328 5,656,897 5,787,151 (130,254)
Administrator's Salaries 4,872,302 5,510,357 5,724,609 (214,252)
Hourly Teachers 703,496 918,448 475,196 443,252
Teaching Assistants 876,118 993,418 958,309 35,109
Paraprofessionals Salary 2,397,489 2,744,069 2,699,713 44,356
Sub Total Salary Compensation 59,940,710 67,897,928 66,614,852 1,283,076
Other Compensation
Substitute Teacher Cost 2,299,669 2,166,894 87,290 2,079,604
Overtime Non-Instructional Sal 98,452 137,089 75,738 61,351
Teachers In Service 132,847 149,866 168,448 (18,582)
Sub Total Other Compensation 2,530,968 2,453,849 331,476 2,122,373
Total Salary and Other Compensation 62,471,678 70,351,777 66,946,328 3,405,449
Employee Benefits - - - -
Total Compensation and Benefits 62,471,678 70,351,777 66,946,328 3,405,449
Fixed Obligations With Variability
Special Education Tuition - - - -
Contract Transportation 62,568 72,745 56,164 16,581
Charter School Tuition - - - -
Health Service Other Districts - - - -
Insurance Non-employee - - - -
Sub Total Fixed Obligations 62,568 72,745 56,164 16,581
Debt Service
Sub Total Debt Service - - - -
Cash Capital Outlays
Cash Capital Expense - - - -
Textbooks 179,163 241,261 245,608 (4,347)
Equipment Other Than Buses 80,520 85,136 52,075 33,061
Equipment Buses - - - -
Computer Hardware - Instructional 50,673 107,064 19,200 87,864
Computer Hardware - Non Instructional 51,704 94,070 81,423 12,647
Library Books 52,668 106,351 50,748 55,603
Sub Total Cash Capital Outlays 414,728 633,882 449,054 184,828
Expenditure Summary (All Funds)
Section 4 Page 11
School Profiles and Budgets 2009-10 Draft Budget
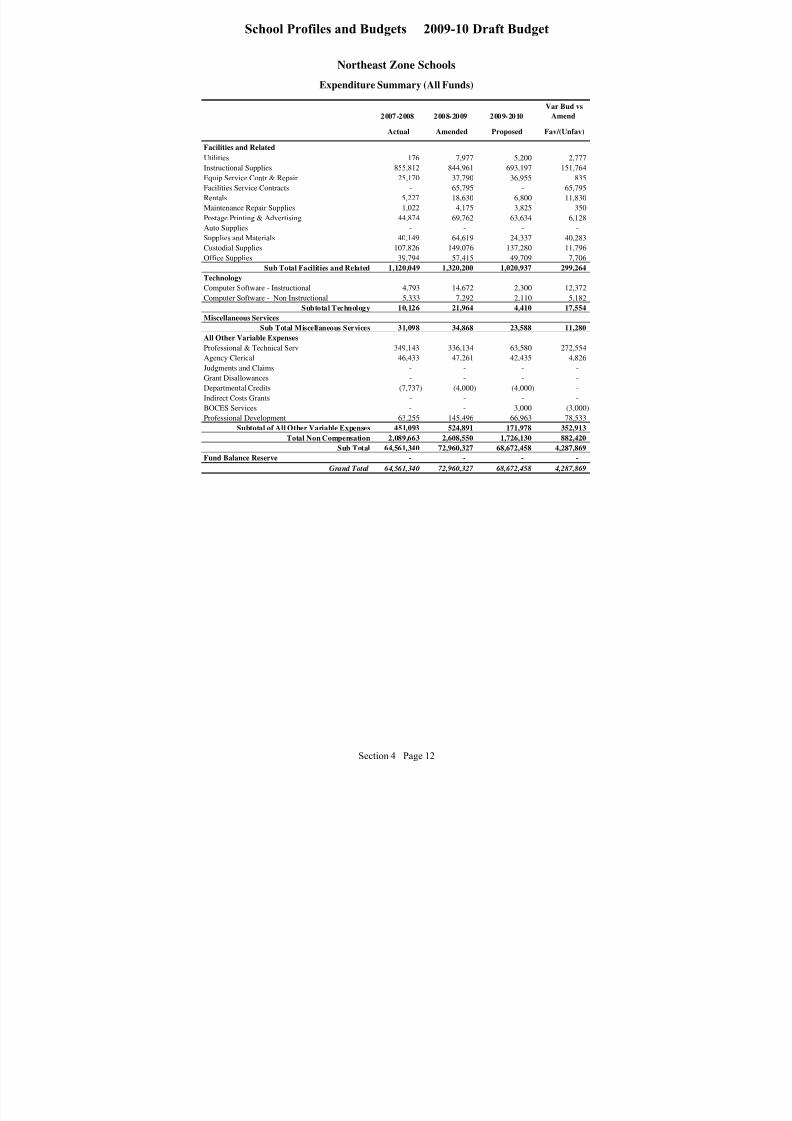
8/7/2019 2009_2010DRAFT
http://slidepdf.com/reader/full/20092010draft 74/268
Northeast Zone Schools
2007-2008 2008-2009 2009-2010
Var Bud vs
Amend
Actual Amended Proposed Fav/(Unfav)
Expenditure Summary (All Funds)
Facilities and Related
Utilities 176 7,977 5,200 2,777
Instructional Supplies 855,812 844,961 693,197 151,764
Equip Service Contr & Repair 25,170 37,790 36,955 835
Facilities Service Contracts - 65,795 - 65,795
Rentals 5,227 18,630 6,800 11,830
Maintenance Repair Supplies 1,022 4,175 3,825 350
Postage Printing & Advertising 44,874 69,762 63,634 6,128
Auto Supplies - - - -
Supplies and Materials 40,149 64,619 24,337 40,283
Custodial Supplies 107,826 149,076 137,280 11,796
Office Supplies 39,794 57,415 49,709 7,706
Sub Total Facilities and Related 1,120,049 1,320,200 1,020,937 299,264
Technology
Computer Software - Instructional 4,793 14,672 2,300 12,372
Computer Software - Non Instructional 5,333 7,292 2,110 5,182
Subtotal Technology 10,126 21,964 4,410 17,554
Miscellaneous Services
Sub Total Miscellaneous Services 31,098 34,868 23,588 11,280
All Other Variable Expenses
Professional & Technical Serv 349,143 336,134 63,580 272,554
Agency Clerical 46,433 47,261 42,435 4,826
Judgments and Claims - - - -
Grant Disallowances - - - -
Departmental Credits (7,737) (4,000) (4,000) -
Indirect Costs Grants - - - -
BOCES Services - - 3,000 (3,000)
Professional Development 63,255 145,496 66,963 78,533
Subtotal of All Other Variable Expenses 451,093 524,891 171,978 352,913
Total Non Compensation 2,089,663 2,608,550 1,726,130 882,420
Sub Total 64,561,340 72,960,327 68,672,458 4,287,869
Fund Balance Reserve - - - -
Grand Total 64,561,340 72,960,327 68,672,458 4,287,869
Section 4 Page 12
School Profiles and Budgets 2009-10 Draft Budget

8/7/2019 2009_2010DRAFT
http://slidepdf.com/reader/full/20092010draft 75/268
Northeast Zone Schools
2007 - 2008 2008 - 2009 2009 - 2010
Var Bud vs
Amend
Actual Amended Proposed Fav/(Unfav)
POSITIONS BY ACCOUNT
Salary Compensation
Teachers' Salaries 908.31 965.17 901.10 64.07
Civil Service Salaries 165.64 174.00 172.00 2.00
Administrator's Salaries 51.40 55.90 55.90 0.00
Teaching Assistants 38.00 40.00 37.00 3.00
Paraprofessionals Salary 129.40 133.70 133.95 (0.25)
Hourly Teachers 0.00 0.00 0.00 0.00
Total Salary Compensation 1,292.75 1,368.77 1,299.95 68.82
Other Compensation
Substitute Teacher Cost 0.00 0.00 0.00 0.00
Overtime Non-Instructional Sal 0.00 0.00 0.00 0.00
Teachers In Service 0.00 0.00 0.00 0.00
Total Other Compensation 0.00 0.00 0.00 0.00
Total Salary and Other Compensation 1,292.75 1,368.77 1,299.95 68.82
Grand Total 1,292.75 1,368.77 1,299.95 68.82
Position Summary
Section 4 Page 13
School Profiles and Budgets 2009-10 Draft Budget

8/7/2019 2009_2010DRAFT
http://slidepdf.com/reader/full/20092010draft 76/268
School: No. 6 Dag Hammarskjold 2008-09 Accountability Status: SINI
(School 6 is a School in Need of Improvement Year 2 for 3-8 Math because they did not make AYP for 3 consecutive years
Address: 595 Upper Falls Blvd. 14605 Miriam Miranda-Jurado, Principal Phone: 546-7780
2009 2010 2008-09 2009-10 (est
Teachers 36.70 32.40 Total Enrollment 329 33
Principals/AP/AD 2.00 2.00 African American 74.2% 74.2%
Other Instructional 7.00 6.00 Asian 0.9% 0.9%
Non-instructional 12.50 12.50 Hispanic 19.5% 19.5%
Total 58.20 52.90 Native American 0.0% 0.0%
White 5.5% 5.5%
Teacher-Pupil Ratio 9 : 1 10.4 : 1 Free & Reduced Lunch 96.0% 96.0%
Other-Staff-Pupil Ratio 15.3 : 1 16.5 : 1 Special Education 20.1% 20.1%
Total-Staff-Pupil Ratio 5.7 : 1 6.4 : 1 English Language Learners 7.3% 7.3%
Attendance (2007-08) 92.2%
Proposed 2009-10 Funding Allocation Grades Served K-6 K-6
0000: General Fund - No Project $ 1,877,906 0200: Title IIA - Tchr & Prin Tr/Rec -
0206: Title I - Kindergarten 48,396 Major Object 2008-09 2009-10
0243: Title I - Eng 4 Spkrs Ot Lang 38,885 Salary Compensation 2,867,592 2,648,407
0250: Title I - Parent Component 31,069 Other Compensation 76,186 17,996
0268: Title I - AIS Services 120,972 Fixed Obligation/Variability 6,000 5,000
0300: Title I - Improvement/Choice 42,612 Cash Capital Outlays 15,900 15,600
0305: IDEA Support Serv & Sec 611 146,874 Facilities and Related 33,545 41,920
0306: Title I SQR Grant - Technology - -
0364: Reading First 26,782 Miscellaneous Services 500 500
0453: Safe Schools/Healthy Stdnts I 5,819 Other Variable Expenses 20,624 12,849
1020: Foundation Aid IPP 44,934 Total, All Objects 3,020,347 2,742,272
1038: Foundation Aid MA 190,452
1045: Foundation Aid CR 43,228
1910: Drop-Out Prevention 20,433 Average Daily Attendance pct:
4501: C4E - Class Size 1,736 Special Population Units Count wt. Uni
4515: C4E - Extended Day Program 19,959 Mobility (applies over 40%)
4517: C4E - Great Beginnings 27,099 Free/Reduced Lunch
4527: C4E - Reading First Local Supp - At Risk
4528: C4E - In-School Suspension 55,116 Special Education
Gifted &Talented
Career & Technical Education
English Language Learners
Total, Special Population Units
Total, Refined Units
Total $ 2,742,272 Basic Allocation
Science Social Studies
GRADE 2007 2008* 2007 2008* 2007 2008* 2007 2008*
1 68.9% 45.5% 26.7% 27.3%
2 44.0% 56.1% 20.0% 46.3%
3 41.2% 53.7% 55.1% 66.7%
4 27.7% 25.5% 27.7% 29.2% 45.7% 58.7%
5 19.5% 33.3% 9.5% 33.3% 41.0% 45.5%
6 17.3% 58.1% 24.0% 55.8%
Students at Risk* 63.6% 55.1% 72.4% 58.0% (Percentages of students in all grades not meeting proficiency)
*Official New York State Education Department statistics for 2007-08 have not yet been released. These numbers are the best District estimate.
Mission: Develop the habits of mind that will allow all students to successfully meet or exceed New York State academic standards
Fiscal Year 2010-11 Allocation Weighting Factors
Budget Allocations by Account
ELA MathStudent Achievement (percentage of students attaining proficiency)*
Student Demographic DataPosition Information (FTEs)
Section 4 Page 14
School Profiles and Budgets 2009-10 Draft Budget

8/7/2019 2009_2010DRAFT
http://slidepdf.com/reader/full/20092010draft 77/268
School: No. 20 Henry Lomb 2008-09 Accountability Status: G
(School 20 is in good standing for the 2008-09 Accountability Year
Address: 54 Oakman St. 14605 D’Onnarae Johnson, Principal Phone: 325-2920
2009 2010 2008-09 2009-10 (est
Teachers 28.10 28.10 Total Enrollment 289 31
Principals/AP/AD 1.00 1.00 African American 64.4% 64.4%
Other Instructional 4.40 4.40 Asian 1.7% 1.7%
Non-instructional 8.50 8.50 Hispanic 28.0% 28.0%
Total 42.00 42.00 Native American 0.3% 0.3%
White 4.5% 4.5%
Teacher-Pupil Ratio 10.3 : 1 11.2 : 1 Free & Reduced Lunch 91.3% 91.3%
Other-Staff-Pupil Ratio 20.8 : 1 22.6 : 1 Special Education 12.1% 12.1%
Total-Staff-Pupil Ratio 6.9 : 1 7.5 : 1 English Language Learners 6.9% 6.9%
Attendance (2007-08) 93.4%
Proposed 2009-10 Funding Allocation Grades Served PreK-6 PreK-6
0000: General Fund - No Project $ 1,354,709 0200: Title IIA - Tchr & Prin Tr/Rec -
0206: Title I - Kindergarten 96,123 Major Object 2008-09 2009-10
0243: Title I - Eng 4 Spkrs Ot Lang 26,782 Salary Compensation 2,174,917 2,234,857
0250: Title I - Parent Component 31,069 Other Compensation 50,420 3,620
0268: Title I - AIS Services 112,853 Fixed Obligation/Variability 2,000 2,000
0305: IDEA Support Serv & Sec 611 44,934 Cash Capital Outlays 17,425 11,600
1020: Foundation Aid IPP 41,130 Facilities and Related 36,017 32,368
1038: Foundation Aid MA 405,435 Technology 200 10
1045: Foundation Aid CR 44,365 Miscellaneous Services 1,500 1,500
1323: School Redesign - Other Variable Expenses 6,000 3,100
4515: C4E - Extended Day Program 15,682 Total, All Objects 2,288,479 2,289,055
4517: C4E - Great Beginnings 24,213
4528: C4E - In-School Suspension 91,760
Average Daily Attendance pct:
Special Population Units Count wt. Uni
Mobility (applies over 40%)
Free/Reduced Lunch
At Risk
Special Education
Gifted &Talented
Career & Technical Education
English Language Learners
Total, Special Population Units
Total, Refined Units
Total $ 2,289,055 Basic Allocation
Science Social Studies
GRADE 2007 2008* 2007 2008* 2007 2008* 2007 2008*
1 61.4% 51.2% 40.9% 53.5%
2 39.0% 37.5% 29.3% 32.5%
3 46.5% 48.9% 65.9% 80.0%
4 47.5% 35.7% 87.2% 73.2% 89.7% 87.8%
5 54.3% 73.5% 55.6% 81.8% 100.0% 91.2%
6 45.5% 80.0% 47.7% 53.1%
Students at Risk* 51.0% 47.4% 46.0% 37.6% (Percentages of students in all grades not meeting proficiency)
*Official New York State Education Department statistics for 2007-08 have not yet been released. These numbers are the best District estimate.
Mission: Structure the learning environment so that 100% of our children perform at a level that meets or exceeds national, state and
District standards and includes the use of technology.
Fiscal Year 2010-11 Allocation Weighting Factors
Budget Allocations by Account
ELA MathStudent Achievement (percentage of students attaining proficiency)*
Student Demographic DataPosition Information (FTEs)
Section 4 Page 15
School Profiles and Budgets 2009-10 Draft Budget

8/7/2019 2009_2010DRAFT
http://slidepdf.com/reader/full/20092010draft 78/268
School: No. 22 Lincoln 2008-09 Accountability Status: SINI
(School 22 is a School in Need of Improvement Year 1 for 3-8 ELA; they made AYP for the 2008-09 School Yea
Address: 27 Zimbrich St. 14621 T’Hani Pantoja, Principal Phone: 467-7160
2009 2010 2008-09 2009-10 (est
Teachers 55.40 50.70 Total Enrollment 465 45
Principals/AP/AD 2.00 2.00 African American 42.6% 42.6
Other Instructional 6.00 5.50 Asian 0.4% 0.4
Non-instructional 16.00 16.00 Hispanic 53.1% 53.1
Total 79.40 74.20 Native American 0.2% 0.2
White 3.2% 3.2
Teacher-Pupil Ratio 8.4 : 1 8.9 : 1 Free & Reduced Lunch 92.7% 92.7
Other-Staff-Pupil Ratio 19.4 : 1 19.2 : 1 Special Education 15.9% 15.9
Total-Staff-Pupil Ratio 5.9 : 1 6.1 : 1 English Language Learners 31.0% 31.0
Attendance (2007-08) 91.1%
Proposed 2009-10 Funding Allocation Grades Served PreK-6 PreK-6
0000: General Fund - No Project $ 3,062,379 0042: Fast Track Rochester -
0199: Title III - Bilingual Educ - Major Object 2008-09 2009-10
0200: Title IIA - Tchr & Prin Tr/Rec - Salary Compensation 3,999,026 3,847,14
0206: Title I - Kindergarten 74,938 Other Compensation 74,104 25,87
0243: Title I - Eng 4 Spkrs Ot Lang 106,524 Fixed Obligation/Variability 1,400 50
0250: Title I - Parent Component 15,252 Cash Capital Outlays 5,600 3,10
0268: Title I - AIS Services 186,941 Facilities and Related 49,118 57,08
0300: Title I - Improvement/Choice 41,777 Technology 300 10
0306: Title I SQR Grant - Miscellaneous Services - 96
0321: U of R / NIMH 31,069 Other Variable Expenses 13,528 16,05
1020: Foundation Aid IPP 103,301 Total, All Objects 4,143,076 3,950,81
1038: Foundation Aid MA -
1045: Foundation Aid CR 46,071
1910: Drop-Out Prevention 50,886 Average Daily Attendance pct:
4501: C4E - Class Size 95,555 Special Population Units Count wt. Un
4515: C4E - Extended Day Program 34,712 Mobility (applies over 40%)
4517: C4E - Great Beginnings 36,604 Free/Reduced Lunch
4518: C4E - On Campus Intervention P 64,808 At Risk
Special Education
Gifted &Talented
Career & Technical Education
English Language Learners
Total, Special Population Units
Total, Refined Units
Total $ 3,950,817 Basic Allocation
Science Social Studies
GRADE 2007 2008* 2007 2008* 2007 2008* 2007 2008*
1 58.3% 49.2% 49.1% 42.9%
2 28.6% 31.9% 30.2% 44.6%
3 29.2% 33.9% 54.3% 56.5%
4 41.7% 59.3% 56.8% 58.7% 61.1% 72.6%
5 26.6% 56.3% 32.4% 36.6% 43.1% 60.6%
6 46.5% 42.0% 29.1% 41.1%
Students at Risk* 61.8% 54.0% 58.0% 53.7% (Percentages of students in all grades not meeting proficiency)
*Official New York State Education Department statistics for 2007-08 have not yet been released. These numbers are the best District estimate.
Mission: Grow a collaborative community of learners, which challenges, empowers, and prepares all of our students to become
productive, responsible, and contributing citizens in a global society.
Fiscal Year 2010-11 Allocation Weighting Factors
Budget Allocations by Account
ELA MathStudent Achievement (percentage of students attaining proficiency)*
Student Demographic DataPosition Information (FTEs)
Section 4 Page 16
School Profiles and Budgets 2009-10 Draft Budget

8/7/2019 2009_2010DRAFT
http://slidepdf.com/reader/full/20092010draft 79/268
School: No. 25 Nathaniel Hawthorne 2008-09 Accountability Status: G
(School 25 is in good standing for the 2008-09 Accountability Year
Address: 965 Goodman St. N. 14609 Deborah Lazio , Principal Phone: 288-3654
2009 2010 2008-09 2009-10 (est
Teachers 44.20 39.23 Total Enrollment 307 31
Principals/AP/AD 2.00 2.00 African American 60.6% 60.6%
Other Instructional 4.60 3.80 Asian 0.7% 0.7%
Non-instructional 7.50 7.50 Hispanic 32.2% 32.2%
Total 58.30 52.53 Native American 0.3% 0.3%
White 4.9% 4.9%
Teacher-Pupil Ratio 6.9 : 1 8.1 : 1 Free & Reduced Lunch 95.1% 95.1%
Other-Staff-Pupil Ratio 21.8 : 1 23.8 : 1 Special Education 35.8% 35.8%
Total-Staff-Pupil Ratio 5.3 : 1 6 : 1 English Language Learners 11.7% 11.7%
Attendance (2007-08) 91.6%
Proposed 2009-10 Funding Allocation Grades Served PreK-6 PreK-6
0000: General Fund - No Project $ 2,359,521 0200: Title IIA - Tchr & Prin Tr/Rec -
0206: Title I - Kindergarten 36,323 Major Object 2008-09 2009-10
0229: Title I - CSRD Support 10,000 Salary Compensation 3,083,965 2,838,590
0250: Title I - Parent Component 28,859 Other Compensation 34,115 -
0268: Title I - AIS Services 164,241 Fixed Obligation/Variability 2,265 2,000
0453: Safe Schools/Healthy Stdnts I 6,050 Cash Capital Outlays 18,296 14,500
1020: Foundation Aid IPP 52,292 Facilities and Related 59,213 51,606
1038: Foundation Aid MA 67,136 Technology - -
1045: Foundation Aid CR 47,238 Miscellaneous Services 700 600
1231: Success For All 21,873 Other Variable Expenses 5,180 5,130
1323: School Redesign - Total, All Objects 3,203,734 2,912,426
1468: Prior Year Expenses -
1910: Drop-Out Prevention 27,840
4515: C4E - Extended Day Program 10,204 Average Daily Attendance pct:
4517: C4E - Great Beginnings 38,676 Special Population Units Count wt. Uni
4528: C4E - In-School Suspension 42,173 Mobility (applies over 40%)
Free/Reduced Lunch
At Risk
Special Education
Gifted &Talented
Career & Technical Education
English Language Learners
Total, Special Population Units
Total, Refined Units
Total $ 2,912,426 Basic Allocation
Science Social Studies
GRADE 2007 2008* 2007 2008* 2007 2008* 2007 2008*
1 54.8% 68.8% 29.0% 70.8%
2 41.9% 53.7% 41.9% 48.1%
3 52.3% 50.0% 83.3% 77.6%
4 45.2% 53.1% 61.0% 74.5% 88.1% 83%
5 71.8% 85.0% 83.3% 89.7% 84.2% 86.8%
6 67.6% 75.0% 72.5% 75.6%
Students at Risk* 44.9% 36.7% 40.2% 28.4% (Percentages of students in all grades not meeting proficiency)
*Official New York State Education Department statistics for 2007-08 have not yet been released. These numbers are the best District estimate.
Mission: Continue our committment to high expectations for all our students while working toward continuous improvement in
educational practices and promoting a positive school environment.
Fiscal Year 2010-11 Allocation Weighting Factors
Budget Allocations by Account
ELA MathStudent Achievement (percentage of students attaining proficiency)*
Student Demographic DataPosition Information (FTEs)
Section 4 Page 17
School Profiles and Budgets 2009-10 Draft Budget
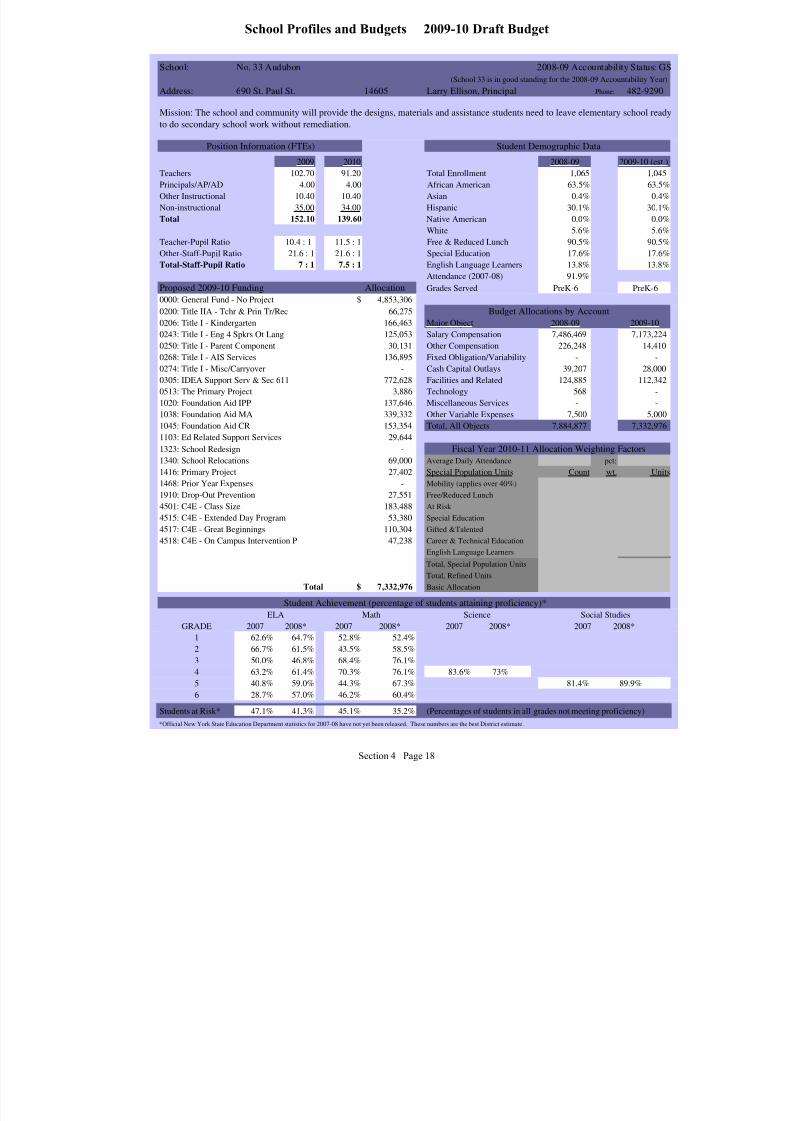
8/7/2019 2009_2010DRAFT
http://slidepdf.com/reader/full/20092010draft 80/268
School: No. 33 Audubon 2008-09 Accountability Status: G
(School 33 is in good standing for the 2008-09 Accountability Yea
Address: 690 St. Paul St. 14605 Larry Ellison, Principal Phone: 482-9290
2009 2010 2008-09 2009-10 (est
Teachers 102.70 91.20 Total Enrollment 1,065 1,04
Principals/AP/AD 4.00 4.00 African American 63.5% 63.5
Other Instructional 10.40 10.40 Asian 0.4% 0.4
Non-instructional 35.00 34.00 Hispanic 30.1% 30.1
Total 152.10 139.60 Native American 0.0% 0.0
White 5.6% 5.6
Teacher-Pupil Ratio 10.4 : 1 11.5 : 1 Free & Reduced Lunch 90.5% 90.5
Other-Staff-Pupil Ratio 21.6 : 1 21.6 : 1 Special Education 17.6% 17.6
Total-Staff-Pupil Ratio 7 : 1 7.5 : 1 English Language Learners 13.8% 13.8
Attendance (2007-08) 91.9%
Proposed 2009-10 Funding Allocation Grades Served PreK-6 PreK-6
0000: General Fund - No Project $ 4,853,306 0200: Title IIA - Tchr & Prin Tr/Rec 66,275
0206: Title I - Kindergarten 166,463 Major Object 2008-09 2009-10
0243: Title I - Eng 4 Spkrs Ot Lang 125,053 Salary Compensation 7,486,469 7,173,22
0250: Title I - Parent Component 30,131 Other Compensation 226,248 14,41
0268: Title I - AIS Services 136,895 Fixed Obligation/Variability - -
0274: Title I - Misc/Carryover - Cash Capital Outlays 39,207 28,00
0305: IDEA Support Serv & Sec 611 772,628 Facilities and Related 124,885 112,34
0513: The Primary Project 3,886 Technology 568 -
1020: Foundation Aid IPP 137,646 Miscellaneous Services - -
1038: Foundation Aid MA 339,332 Other Variable Expenses 7,500 5,00
1045: Foundation Aid CR 153,354 Total, All Objects 7,884,877 7,332,97
1103: Ed Related Support Services 29,644
1323: School Redesign -
1340: School Relocations 69,000 Average Daily Attendance pct:
1416: Primary Project 27,402 Special Population Units Count wt. Un
1468: Prior Year Expenses - Mobility (applies over 40%)
1910: Drop-Out Prevention 27,551 Free/Reduced Lunch
4501: C4E - Class Size 183,488 At Risk
4515: C4E - Extended Day Program 53,380 Special Education
4517: C4E - Great Beginnings 110,304 Gifted &Talented
4518: C4E - On Campus Intervention P 47,238 Career & Technical Education
English Language Learners
Total, Special Population Units
Total, Refined Units
Total $ 7,332,976 Basic Allocation
Science Social Studies
GRADE 2007 2008* 2007 2008* 2007 2008* 2007 2008*
1 62.6% 64.7% 52.8% 52.4%
2 66.7% 61.5% 43.5% 58.5%
3 50.0% 46.8% 68.4% 76.1%
4 63.2% 61.4% 70.3% 76.1% 83.6% 73%
5 40.8% 59.0% 44.3% 67.3% 81.4% 89.9%
6 28.7% 57.0% 46.2% 60.4%
Students at Risk* 47.1% 41.3% 45.1% 35.2% (Percentages of students in all grades not meeting proficiency)
*Official New York State Education Department statistics for 2007-08 have not yet been released. These numbers are the best District estimate.
Mission: The school and community will provide the designs, materials and assistance students need to leave elementary school read
to do secondary school work without remediation.
Fiscal Year 2010-11 Allocation Weighting Factors
Budget Allocations by Account
ELA MathStudent Achievement (percentage of students attaining proficiency)*
Student Demographic DataPosition Information (FTEs)
Section 4 Page 18
School Profiles and Budgets 2009-10 Draft Budget
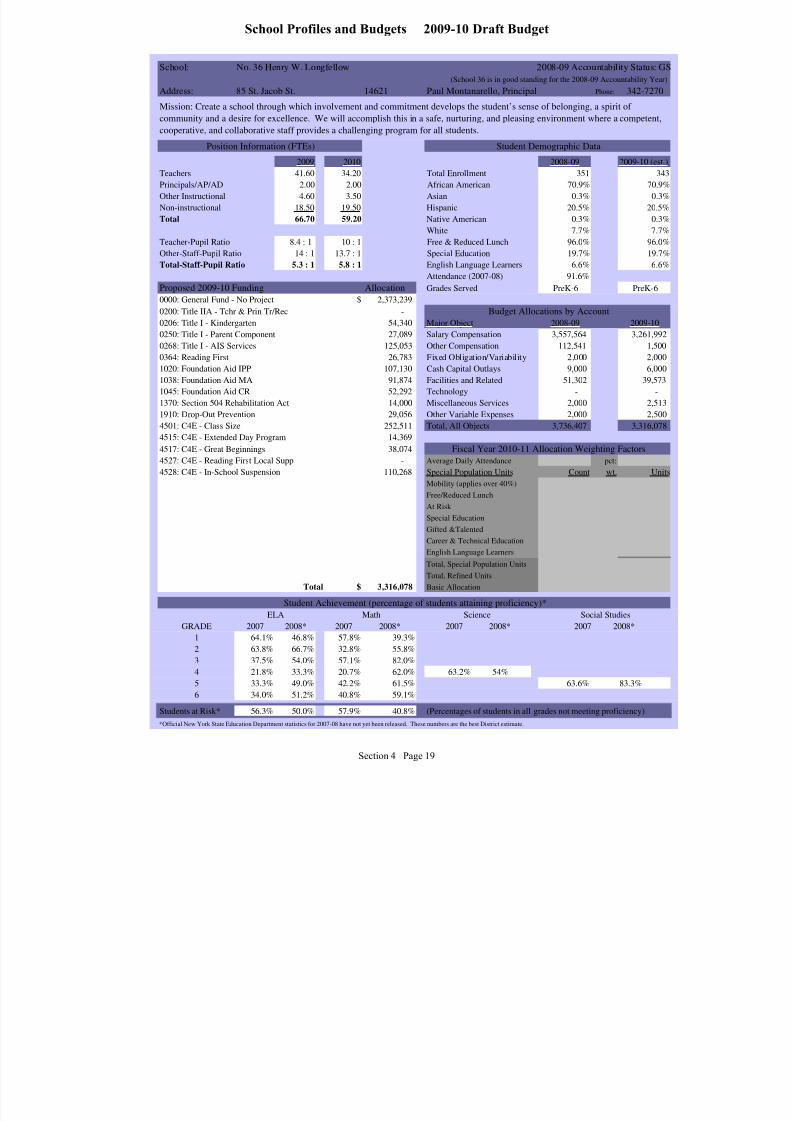
8/7/2019 2009_2010DRAFT
http://slidepdf.com/reader/full/20092010draft 81/268
School: No. 36 Henry W. Longfellow 2008-09 Accountability Status: G
(School 36 is in good standing for the 2008-09 Accountability Yea
Address: 85 St. Jacob St. 14621 Paul Montanarello, Principal Phone: 342-7270
2009 2010 2008-09 2009-10 (est
Teachers 41.60 34.20 Total Enrollment 351 34
Principals/AP/AD 2.00 2.00 African American 70.9% 70.9
Other Instructional 4.60 3.50 Asian 0.3% 0.3
Non-instructional 18.50 19.50 Hispanic 20.5% 20.5
Total 66.70 59.20 Native American 0.3% 0.3
White 7.7% 7.7
Teacher-Pupil Ratio 8.4 : 1 10 : 1 Free & Reduced Lunch 96.0% 96.0
Other-Staff-Pupil Ratio 14 : 1 13.7 : 1 Special Education 19.7% 19.7
Total-Staff-Pupil Ratio 5.3 : 1 5.8 : 1 English Language Learners 6.6% 6.6
Attendance (2007-08) 91.6%
Proposed 2009-10 Funding Allocation Grades Served PreK-6 PreK-6
0000: General Fund - No Project $ 2,373,239 0200: Title IIA - Tchr & Prin Tr/Rec -
0206: Title I - Kindergarten 54,340 Major Object 2008-09 2009-10
0250: Title I - Parent Component 27,089 Salary Compensation 3,557,564 3,261,99
0268: Title I - AIS Services 125,053 Other Compensation 112,541 1,50
0364: Reading First 26,783 Fixed Obligation/Variability 2,000 2,00
1020: Foundation Aid IPP 107,130 Cash Capital Outlays 9,000 6,00
1038: Foundation Aid MA 91,874 Facilities and Related 51,302 39,57
1045: Foundation Aid CR 52,292 Technology - -
1370: Section 504 Rehabilitation Act 14,000 Miscellaneous Services 2,000 2,51
1910: Drop-Out Prevention 29,056 Other Variable Expenses 2,000 2,50
4501: C4E - Class Size 252,511 Total, All Objects 3,736,407 3,316,07
4515: C4E - Extended Day Program 14,369
4517: C4E - Great Beginnings 38,074
4527: C4E - Reading First Local Supp - Average Daily Attendance pct:
4528: C4E - In-School Suspension 110,268 Special Population Units Count wt. Un
Mobility (applies over 40%)
Free/Reduced Lunch
At Risk
Special Education
Gifted &Talented
Career & Technical Education
English Language Learners
Total, Special Population Units
Total, Refined Units
Total $ 3,316,078 Basic Allocation
Science Social Studies
GRADE 2007 2008* 2007 2008* 2007 2008* 2007 2008*
1 64.1% 46.8% 57.8% 39.3%
2 63.8% 66.7% 32.8% 55.8%
3 37.5% 54.0% 57.1% 82.0%
4 21.8% 33.3% 20.7% 62.0% 63.2% 54%
5 33.3% 49.0% 42.2% 61.5% 63.6% 83.3%
6 34.0% 51.2% 40.8% 59.1%
Students at Risk* 56.3% 50.0% 57.9% 40.8% (Percentages of students in all grades not meeting proficiency)
*Official New York State Education Department statistics for 2007-08 have not yet been released. These numbers are the best District estimate.
Mission: Create a school through which involvement and commitment develops the student’s sense of belonging, a spirit of
community and a desire for excellence. We will accomplish this in a safe, nurturing, and pleasing environment where a competent,
cooperative, and collaborative staff provides a challenging program for all students.
Fiscal Year 2010-11 Allocation Weighting Factors
Budget Allocations by Account
ELA MathStudent Achievement (percentage of students attaining proficiency)*
Student Demographic DataPosition Information (FTEs)
Section 4 Page 19
School Profiles and Budgets 2009-10 Draft Budget

8/7/2019 2009_2010DRAFT
http://slidepdf.com/reader/full/20092010draft 82/268
School: No. 39 Andrew J. Townson 2008-09 Accountability Status: G
(School 39 is in good standing for the 2008-09 Accountability Yea
Address: 145 Midland Ave. 14621 Kevin Klein, Principal Phone: 467-8816
2009 2010 2008-09 2009-10 (est
Teachers 51.10 47.40 Total Enrollment 599 6
Principals/AP/AD 2.00 2.00 African American 66.8% 66.8
Other Instructional 2.60 2.20 Asian 0.5% 0.5
Non-instructional 11.50 11.50 Hispanic 23.7% 23.7
Total 67.20 63.10 Native American 0.5% 0.5
White 7.7% 7.7
Teacher-Pupil Ratio 11.7 : 1 12.9 : 1 Free & Reduced Lunch 90.0% 90.0
Other-Staff-Pupil Ratio 37.2 : 1 38.9 : 1 Special Education 14.0% 14.0
Total-Staff-Pupil Ratio 8.9 : 1 9.7 : 1 English Language Learners 8.0% 8.0
Attendance (2007-08) 92.6%
Proposed 2009-10 Funding Allocation Grades Served PreK-6 PreK-6
0000: General Fund - No Project $ 2,409,508 0200: Title IIA - Tchr & Prin Tr/Rec 38,874
0206: Title I - Kindergarten 81,262 Major Object 2008-09 2009-10
0243: Title I - Eng 4 Spkrs Ot Lang 52,292 Salary Compensation 3,457,477 3,333,39
0250: Title I - Parent Component 31,419 Other Compensation 107,620 4,40
0268: Title I - AIS Services 124,027 Fixed Obligation/Variability 3,000 3,00
0305: IDEA Support Serv & Sec 611 78,771 Cash Capital Outlays 25,480 22,60
0347: Mentor Intern Program - Facilities and Related 53,861 51,95
1020: Foundation Aid IPP 27,351 Technology - -
1038: Foundation Aid MA 189,234 Miscellaneous Services 111 -
1045: Foundation Aid CR 43,228 Other Variable Expenses 8,820 3,00
1468: Prior Year Expenses - Total, All Objects 3,656,369 3,418,35
4501: C4E - Class Size 129,693
4515: C4E - Extended Day Program 35,617
4517: C4E - Great Beginnings 88,539 Average Daily Attendance pct:
4518: C4E - On Campus Intervention P 88,539 Special Population Units Count wt. Un
Mobility (applies over 40%)
Free/Reduced Lunch
At Risk
Special Education
Gifted &Talented
Career & Technical Education
English Language Learners
Total, Special Population Units
Total, Refined Units
Total $ 3,418,354 Basic Allocation
Science Social Studies
GRADE 2007 2008* 2007 2008* 2007 2008* 2007 2008*
1 53.2% 57.5% 52.3% 41.1%
2 50.6% 64.3% 50.6% 65.9%
3 36.1% 37.5% 52.1% 60.0%
4 35.4% 45.9% 48.8% 49.4% 62.5% 69.6%
5 41.6% 57.6% 64.5% 53.7% 80.3% 82.1%
6 41.8% 64.2% 34.6% 70.1%
Students at Risk* 56.5% 45.7% 49.4% 44.6% (Percentages of students in all grades not meeting proficiency)
*Official New York State Education Department statistics for 2007-08 have not yet been released. These numbers are the best District estimate.
Mission: We are a diverse community that is a talented, caring, and respectful family. Our role consists of inspiring students to be
motivated, life long learners, who will become productive members of the community. We do this for the children, to ensure a
brighter tomorrow.
Fiscal Year 2010-11 Allocation Weighting Factors
Budget Allocations by Account
ELA MathStudent Achievement (percentage of students attaining proficiency)*
Student Demographic DataPosition Information (FTEs)
Section 4 Page 20
School Profiles and Budgets 2009-10 Draft Budget

8/7/2019 2009_2010DRAFT
http://slidepdf.com/reader/full/20092010draft 83/268
School: No. 45 Mary McLeod Bethune 2008-09 Accountability Status: SINI 5-YR
(School 45 is a School Restructuring (SINI 5) Year 1 for 3-8 ELA because they did not make AYP for six consecutive year
Address: 1445 Clifford Ave. 14621 Shirley Green, Principal Phone: 325-6945
2009 2010 2008-09 2009-10 (est
Teachers 59.00 52.80 Total Enrollment 677 68
Principals/AP/AD 3.50 3.50 African American 66.9% 66.9
Other Instructional 10.90 9.50 Asian 0.7% 0.7
Non-instructional 24.40 24.40 Hispanic 27.2% 27.2
Total 97.80 90.20 Native American 0.4% 0.4
White 4.3% 4.3
Teacher-Pupil Ratio 11.5 : 1 13 : 1 Free & Reduced Lunch 93.4% 93.4
Other-Staff-Pupil Ratio 17.4 : 1 18.4 : 1 Special Education 14.3% 14.3
Total-Staff-Pupil Ratio 6.9 : 1 7.6 : 1 English Language Learners 4.7% 4.7
Attendance (2007-08) 91.1%
Proposed 2009-10 Funding Allocation Grades Served PreK-6 PreK-6
0000: General Fund - No Project $ 3,267,478 0200: Title IIA - Tchr & Prin Tr/Rec -
0206: Title I - Kindergarten 100,137 Major Object 2008-09 2009-10
0250: Title I - Parent Component 16,343 Salary Compensation 4,548,355 4,211,72
0268: Title I - AIS Services 121,159 Other Compensation 115,368 33,91
0300: Title I - Improvement/Choice 42,764 Fixed Obligation/Variability 1,000 1,50
0321: U of R / NIMH 9,432 Cash Capital Outlays 47,686 38,70
0364: Reading First 25,505 Facilities and Related 74,576 94,16
1020: Foundation Aid IPP 83,308 Technology 192 -
1038: Foundation Aid MA 379,321 Miscellaneous Services 215 21
1045: Foundation Aid CR 69,825 Other Variable Expenses 13,500 22,85
1468: Prior Year Expenses - Total, All Objects 4,800,892 4,403,06
1910: Drop-Out Prevention 20,433
4501: C4E - Class Size 1,706
4515: C4E - Extended Day Program 51,028 Average Daily Attendance pct:
4517: C4E - Great Beginnings 46,493 Special Population Units Count wt. Un
4518: C4E - On Campus Intervention P 52,292 Mobility (applies over 40%)
4524: C4E - Dream Schools 115,843 Free/Reduced Lunch
4527: C4E - Reading First Local Supp - At Risk
Special Education
Gifted &Talented
Career & Technical Education
English Language Learners
Total, Special Population Units
Total, Refined Units
Total $ 4,403,067 Basic Allocation
Science Social Studies
GRADE 2007 2008* 2007 2008* 2007 2008* 2007 2008*
1 38.2% 44.4% 28.7% 35.4%
2 39.6% 34.0% 22.8% 28.0%
3 25.0% 30.6% 43.0% 50.0%
4 28.1% 31.3% 28.1% 38.6% 35.4% 42.5%
5 32.3% 36.5% 44.6% 44.7% 49.5% 46.4%
6 31.4% 48.0% 24.3% 48.0%
Students at Risk* 67.4% 62.3% 68.3% 59.1% (Percentages of students in all grades not meeting proficiency)
*Official New York State Education Department statistics for 2007-08 have not yet been released. These numbers are the best District estimate.
Mission: Provide meaningful instruction that is student-centered, culturally relevant, challenging, engaging, and delivered through a
positive emotional exchange. All members of our educational community will be respectful, responsible, safe, present, ready to
achieve excellence, accountable and responsible for teaching and learning.
Fiscal Year 2010-11 Allocation Weighting Factors
Budget Allocations by Account
ELA MathStudent Achievement (percentage of students attaining proficiency)*
Student Demographic DataPosition Information (FTEs)
Section 4 Page 21
School Profiles and Budgets 2009-10 Draft Budget

8/7/2019 2009_2010DRAFT
http://slidepdf.com/reader/full/20092010draft 84/268
School: No. 50 Helen Barrett Montgomery 2008-09 Accountability Status: G
(School 50 is in good standing for the 2008-09 Accountability Yea
Address: 301 Seneca Ave. 14621 Tim O. Mains , Principal Phone: 266-0331
2009 2010 2008-09 2009-10 (est
Teachers 49.40 44.20 Total Enrollment 547 55
Principals/AP/AD 2.00 2.00 African American 49.9% 49.9
Other Instructional 2.80 2.80 Asian 7.7% 7.7
Non-instructional 13.80 13.80 Hispanic 31.4% 31.4
Total 68.00 62.80 Native American 0.4% 0.4
White 10.2% 10.2
Teacher-Pupil Ratio 11.1 : 1 12.5 : 1 Free & Reduced Lunch 88.1% 88.1
Other-Staff-Pupil Ratio 29.4 : 1 29.8 : 1 Special Education 12.8% 12.8
Total-Staff-Pupil Ratio 8 : 1 8.8 : 1 English Language Learners 19.4% 19.4
Attendance (2007-08) 93.5%
Proposed 2009-10 Funding Allocation Grades Served K-6 K-6
0000: General Fund - No Project $ 2,658,087 0200: Title IIA - Tchr & Prin Tr/Rec -
0206: Title I - Kindergarten 44,270 Major Object 2008-09 2009-10
0243: Title I - Eng 4 Spkrs Ot Lang 122,588 Salary Compensation 3,812,343 3,676,58
0250: Title I - Parent Component 14,116 Other Compensation 111,838 3,90
0268: Title I - AIS Services 148,943 Fixed Obligation/Variability 500 50
1020: Foundation Aid IPP 99,302 Cash Capital Outlays 26,100 20,50
1038: Foundation Aid MA 285,709 Facilities and Related 51,919 41,53
1045: Foundation Aid CR 93,105 Technology 600 50
4501: C4E - Class Size 133,656 Miscellaneous Services 3,150 1,30
4515: C4E - Extended Day Program 27,324 Other Variable Expenses 11,000 7,90
4517: C4E - Great Beginnings 72,056 Total, All Objects 4,017,450 3,752,72
4528: C4E - In-School Suspension 53,565
Average Daily Attendance pct:
Special Population Units Count wt. Un
Mobility (applies over 40%)
Free/Reduced Lunch
At Risk
Special Education
Gifted &Talented
Career & Technical Education
English Language Learners
Total, Special Population Units
Total, Refined Units
Total $ 3,752,721 Basic Allocation
Science Social Studies
GRADE 2007 2008* 2007 2008* 2007 2008* 2007 2008*
1 65.8% 60.5% 59.5% 61.7%
2 62.0% 56.8% 55.7% 57.3%
3 42.2% 50.7% 45.8% 76.9%
4 53.2% 60.2% 49.4% 58.1% 67.1% 67.9%
5 50.0% 61.0% 59.3% 59.0% 71.6% 67.9%
6 61.0% 69.9% 59.7% 78.2%
Students at Risk* 44.4% 40.0% 45.2% 34.6% (Percentages of students in all grades not meeting proficiency)
*Official New York State Education Department statistics for 2007-08 have not yet been released. These numbers are the best District estimate.
Mission: Educate all of our students to high levels of academic achievement and social, emotional and physical development; partne
with families, caregivers and the Rochester community; and, prepare all of our students to meet or exceed academic standards and
become life-long learners, productive members of the workforce and responsible, contributing citizens.
Fiscal Year 2010-11 Allocation Weighting Factors
Budget Allocations by Account
ELA MathStudent Achievement (percentage of students attaining proficiency)*
Student Demographic DataPosition Information (FTEs)
Section 4 Page 22
School Profiles and Budgets 2009-10 Draft Budget

8/7/2019 2009_2010DRAFT
http://slidepdf.com/reader/full/20092010draft 85/268
School: No. 52 Frank Fowler Dow 2008-09 Accountability Status: G
(School 52 is in good standing for the 2008-09 Accountability Year
Address: 100 Farmington Rd. 14609 Denise Rainey, Principal Phone: 482-9614
2009 2010 2008-09 2009-10 (est
Teachers 24.82 24.92 Total Enrollment 305 30
Principals/AP/AD 2.00 2.00 African American 54.8% 54.8%
Other Instructional 3.10 3.10 Asian 1.3% 1.3%
Non-instructional 6.50 6.75 Hispanic 12.8% 12.8%
Total 36.42 36.77 Native American 0.3% 0.3%
White 29.8% 29.8%
Teacher-Pupil Ratio 12.3 : 1 12.1 : 1 Free & Reduced Lunch 73.4% 73.4%
Other-Staff-Pupil Ratio 26.3 : 1 25.5 : 1 Special Education 10.5% 10.5%
Total-Staff-Pupil Ratio 8.4 : 1 8.2 : 1 English Language Learners 4.6% 4.6%
Attendance (2007-08) 93.6%
Proposed 2009-10 Funding Allocation Grades Served PreK-6 PreK-6
0000: General Fund - No Project $ 1,498,335 0200: Title IIA - Tchr & Prin Tr/Rec -
0206: Title I - Kindergarten 50,148 Major Object 2008-09 2009-10
0243: Title I - Eng 4 Spkrs Ot Lang 17,274 Salary Compensation 1,939,866 1,992,894
0250: Title I - Parent Component 13,578 Other Compensation 65,419 12,583
0268: Title I - AIS Services 173,970 Fixed Obligation/Variability - -
1038: Foundation Aid MA 146,681 Cash Capital Outlays 15,391 9,000
1045: Foundation Aid CR 44,365 Facilities and Related 39,178 31,420
1468: Prior Year Expenses - Technology - -
4515: C4E - Extended Day Program 15,128 Miscellaneous Services 400 400
4517: C4E - Great Beginnings 26,510 Other Variable Expenses 4,000 4,500
4528: C4E - In-School Suspension 64,808 Total, All Objects 2,064,254 2,050,797
Average Daily Attendance pct:
Special Population Units Count wt. Uni
Mobility (applies over 40%)
Free/Reduced Lunch
At Risk
Special Education
Gifted &Talented
Career & Technical Education
English Language Learners
Total, Special Population Units
Total, Refined Units
Total $ 2,050,797 Basic Allocation
Science Social Studies
GRADE 2007 2008* 2007 2008* 2007 2008* 2007 2008*
1 69.6% 53.5% 60.9% 60.5%
2 83.3% 84.2% 85.7% 86.8%
3 42.2% 73.3% 77.8% 93.3%
4 51.2% 72.7% 50.0% 63.6% 80% 84.1%
5 64.4% 53.5% 46.7% 50.0% 70.5% 82.2%
6 52.7% 67.3% 32.7% 63.3%
Students at Risk* 39.9% 32.8% 42.2% 30.8% (Percentages of students in all grades not meeting proficiency)
*Official New York State Education Department statistics for 2007-08 have not yet been released. These numbers are the best District estimate.
Mission: The school, in partnership with parents and community, is committed to preparing our students to value themselves and
others, attain their highest level of achievement, become life long learners, and serve as productive citizens.
Fiscal Year 2010-11 Allocation Weighting Factors
Budget Allocations by Account
ELA MathStudent Achievement (percentage of students attaining proficiency)*
Student Demographic DataPosition Information (FTEs)
Section 4 Page 23
School Profiles and Budgets 2009-10 Draft Budget

8/7/2019 2009_2010DRAFT
http://slidepdf.com/reader/full/20092010draft 86/268
School: BioScience & Health Careers High School at Franklin 2008-09 Accountability Status: SINI
(Bioscience is a School in Need of Improvement Year 2 for 3-8 ELA & HS ELA because they did not make AYP for 3 consecutive years in each area
Address: 950 Norton St. 14621 Mary Aronson, Principal Phone: 324-3730
2009 2010 2008-09 2009-10(est
Teachers 45.33 43.67 Total Enrollment 490 46
Principals/AP/AD 3.34 3.34 African American 72.7% 72.7%
Other Instructional 8.49 7.59 Asian 1.0% 1.0%
Non-instructional 14.88 14.88 Hispanic 21.6% 21.6%
Total, Staff 72.04 69.48 Native American 0.2% 0.2%
White 4.5% 4.5%
Teacher-Pupil Ratio 10.8 : 1 10.5 : 1 Free & Reduced Lunch 76.9% 76.9%
Other-Staff-Pupil Ratio 18.3 : 1 17.8 : 1 Special Education 19.6% 19.6%
Total-Staff-Pupil Ratio 6.8 : 1 6.6 : 1 English Language Learners 4.7% 4.7%
Attendance (2007-08) 84.7%
Proposed 2009-10 Funding Allocation Grades Served 7-12 7-12
0000: General Fund - No Project $ 3,236,211
0151: SP LEG PROJ @ FRANK BIOSC #1 -
0152: SP LEG PROJ @ FRANK BIOSC #2 - Major Object 2008-09 2009-10
0250: Title I - Parent Component 14,793 Salary Compensation 3,985,103 3,866,379
0268: Title I - AIS Services 103,049 Other Compensation 234,059 28,856
0274: Title I - Misc/Carryover - Fixed Obligation/Variability 13,425 3,000
0300: Title I - Improvement/Choice 43,096 Cash Capital Outlays 49,500 18,500
0453: Safe Schools/Healthy Stdnts I 13,666 Facilities and Related 205,204 59,556
0703: Health Care Apprenticeship 40,000 Technology 1,325 -
0707: Perkins Secondary - Miscellaneous Services 1,500 500
0755: SURR Grant - Other Variable Expenses 342,920 15,306
1020: Foundation Aid IPP 92,712 Total, All Objects 4,833,036 3,992,097
1038: Foundation Aid MA 50,628
1045: Foundation Aid CR 130,450
1300: Extracurricular Activities - Average Daily Attendance pct:
1357: Student & Family Support Ctr 18,692 Special Population Units Count wt. Uni
1468: Prior Year Expenses - Mobility (applies over 40%)
1814: Gear Up Match 50,946 Free/Reduced Lunch
1910: Drop-Out Prevention 27,642 At Risk
4020: Green Schools Program - Special Education
4512: C4E - AVID Program 58,116 Gifted & Talented
4515: C4E - Extended Day Program 39,450 Career & Technical Education
4528: C4E - In-School Suspension 72,646 English Language Learners
Total, Special Population Units
Total, Refined Units
Total $ 3,992,097 Basic Allocation
Science Social Studies
GRADE 2007 2008* 2007 2008* 2007 2008* 2007 2008*
7 19.4% 16.4% 4.1% 23.7%
8 64.8% 15.9% 8.3% 26.0% 24.2% 37.9% 6.1% 6.4%
Physical Setting/Earth Science
NYS Regents* 41.9% 59.4% 61.2% 46.2% 44% 100% 21.7% 30.2%
Graduation 2007-08* 44.0% 58.6% 62.3%
Students at Risk* 50.9% 71.3% 80.8% 65.5% (Percentages of students in all grades not meeting proficiency)
*Official New York State Education Department statistics for 2007-08 have not yet been released. These numbers are the best District estimate.
U.S. History and Government
English Mathematics
Student Demographic DataPosition Information (FTEs)
Mission: “Perfecting the Science of Learning through Inquiry.” Students approach learning through inquiry and experimentation to
become problem-solvers and gain an in-depth understanding of material.
Global History and Geography
Budget Allocations by Account
ELA Math
Student Achievement (percentage of students attaining proficiency)*
Fiscal Year 2010-11 Allocation Weighting Factors
Section 4 Page 24
School Profiles and Budgets 2009-10 Draft Budget

8/7/2019 2009_2010DRAFT
http://slidepdf.com/reader/full/20092010draft 87/268
School: Global Media Arts High School at Franklin 2008-09 Accountability Status: SIN
(Global Media is a School in Need of Improvement Year 2 for HS ELA because they did not make AYP for 3 consecutive yea
Address: 950 Norton St. 14621 Samuel Rodriguez, Principal Phone: 324-372
2009 2010 2008-09 2009-10(es
Teachers 48.83 42.76 Total Enrollment 498 4
Principals/AP/AD 3.83 3.83 African American 72.9% 72.9
Other Instructional 8.50 8.00 Asian 0.2% 0.2
Non-instructional 12.74 12.74 Hispanic 21.9% 21.9
Total, Staff 73.90 67.33 Native American 0.0% 0.0
White 4.8% 4.
Teacher-Pupil Ratio 10.2 : 1 10.7 : 1 Free & Reduced Lunch 75.3% 75.3
Other-Staff-Pupil Ratio 19.9 : 1 18.6 : 1 Special Education 20.3% 20.3
Total-Staff-Pupil Ratio 6.7 : 1 6.8 : 1 English Language Learners 2.8% 2.
Attendance (2007-08) 87.4%
Proposed 2009-10 Funding Allocation Grades Served 7-12 7-12
0000: General Fund - No Project $ 2,982,795
0250: Title I - Parent Component 20,682
0268: Title I - AIS Services 145,325 Major Object 2008-09 2009-10
0274: Title I - Misc/Carryover - Salary Compensation 3,583,151 3,482,8
0300: Title I - Improvement/Choice 45,500 Other Compensation 327,710 23,96
0453: Safe Schools/Healthy Stdnts I 13,667 Fixed Obligation/Variability 16,255 7,00
0703: Health Care Apprenticeship 4,000 Cash Capital Outlays 80,300 45,44
0707: Perkins Secondary - Facilities and Related 78,602 70,15
0755: SURR Grant - Technology 10,000 -
1020: Foundation Aid IPP 61,763 Miscellaneous Services 5,750 2,60
1045: Foundation Aid CR 16,330 Other Variable Expenses 36,476 40,55
1300: Extracurricular Activities - Total, All Objects 4,138,244 3,672,60
1357: Student & Family Support Ctr 18,692
1468: Prior Year Expenses -
1814: Gear Up Match 49,300 Average Daily Attendance pct:
1910: Drop-Out Prevention 29,008 Special Population Units Count wt. Un
4020: Green Schools Program - Mobility (applies over 40%)
4506: C4E - Roberts Wesleyan Global - Free/Reduced Lunch
4512: C4E - AVID Program 43,228 At Risk
4515: C4E - Extended Day Program 33,891 Special Education
4524: C4E - Dream Schools 150,303 Gifted & Talented
4528: C4E - In-School Suspension 58,116 Career & Technical Education
English Language Learners
Total, Special Population Units
Total, Refined Units
Total $ 3,672,600 Basic Allocation
Science Social Studies
GRADE 2007 2008* 2007 2008* 2007 2008* 2007 2008*
7 14.3% 47.9% 7.0% 24.7%
8 N/A 15.2% 5.9% 26.4% 18.8% 22.1% 9.4% 9.4%
Physical Setting/Earth Science
NYS Regents* 60.0% 53.8% 60.5% 42.8% 11.5% 36.1% 21.3% 37.2
Graduation 2007-08* 61.0% 42.2% 69.3
Students at Risk* 66.7% 62.6% 83.5% 66.5% (Percentages of students in all grades not meeting proficiency)
*Official New York State Education Department statistics for 2007-08 have not yet been released. These numbers are the best District estimate.
U.S. History and Government
English Mathematics
Student Demographic DataPosition Information (FTEs)
Mission: Improve student performance through a variety of assessments and project-based learning. Much of the learning is
technology-based to give students the best possible means of improving academic performance.
Global History and Geography
Budget Allocations by Account
ELA Math
Student Achievement (percentage of students attaining proficiency)*
Fiscal Year 2010-11 Allocation Weighting Factors
Section 4 Page 25
School Profiles and Budgets 2009-10 Draft Budget
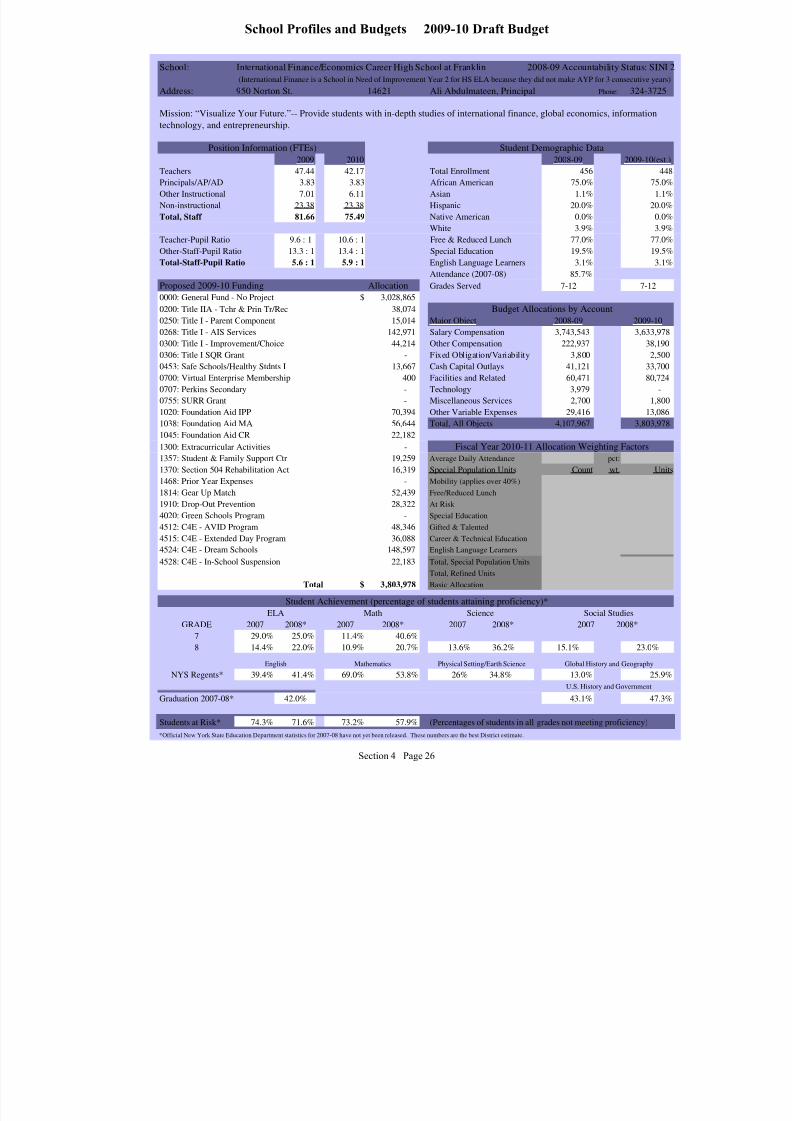
8/7/2019 2009_2010DRAFT
http://slidepdf.com/reader/full/20092010draft 88/268
School: International Finance/Economics Career High School at Franklin 2008-09 Accountability Status: SIN
(International Finance is a School in Need of Improvement Year 2 for HS ELA because they did not make AYP for 3 consecutive yea
Address: 950 Norton St. 14621 Ali Abdulmateen, Principal Phone: 324-372
2009 2010 2008-09 2009-10(es
Teachers 47.44 42.17 Total Enrollment 456 4
Principals/AP/AD 3.83 3.83 African American 75.0% 75.0
Other Instructional 7.01 6.11 Asian 1.1% 1.
Non-instructional 23.38 23.38 Hispanic 20.0% 20.0
Total, Staff 81.66 75.49 Native American 0.0% 0.0
White 3.9% 3.9
Teacher-Pupil Ratio 9.6 : 1 10.6 : 1 Free & Reduced Lunch 77.0% 77.0
Other-Staff-Pupil Ratio 13.3 : 1 13.4 : 1 Special Education 19.5% 19.5
Total-Staff-Pupil Ratio 5.6 : 1 5.9 : 1 English Language Learners 3.1% 3.
Attendance (2007-08) 85.7%
Proposed 2009-10 Funding Allocation Grades Served 7-12 7-12
0000: General Fund - No Project $ 3,028,865
0200: Title IIA - Tchr & Prin Tr/Rec 38,074
0250: Title I - Parent Component 15,014 Major Object 2008-09 2009-10
0268: Title I - AIS Services 142,971 Salary Compensation 3,743,543 3,633,97
0300: Title I - Improvement/Choice 44,214 Other Compensation 222,937 38,19
0306: Title I SQR Grant - Fixed Obligation/Variability 3,800 2,50
0453: Safe Schools/Healthy Stdnts I 13,667 Cash Capital Outlays 41,121 33,70
0700: Virtual Enterprise Membership 400 Facilities and Related 60,471 80,72
0707: Perkins Secondary - Technology 3,979 -
0755: SURR Grant - Miscellaneous Services 2,700 1,80
1020: Foundation Aid IPP 70,394 Other Variable Expenses 29,416 13,08
1038: Foundation Aid MA 56,644 Total, All Objects 4,107,967 3,803,97
1045: Foundation Aid CR 22,182
1300: Extracurricular Activities -
1357: Student & Family Support Ctr 19,259 Average Daily Attendance pct:
1370: Section 504 Rehabilitation Act 16,319 Special Population Units Count wt. Un
1468: Prior Year Expenses - Mobility (applies over 40%)
1814: Gear Up Match 52,439 Free/Reduced Lunch
1910: Drop-Out Prevention 28,322 At Risk
4020: Green Schools Program - Special Education
4512: C4E - AVID Program 48,346 Gifted & Talented
4515: C4E - Extended Day Program 36,088 Career & Technical Education
4524: C4E - Dream Schools 148,597 English Language Learners
4528: C4E - In-School Suspension 22,183 Total, Special Population Units
Total, Refined Units
Total $ 3,803,978 Basic Allocation
Science Social Studies
GRADE 2007 2008* 2007 2008* 2007 2008* 2007 2008*
7 29.0% 25.0% 11.4% 40.6%
8 14.4% 22.0% 10.9% 20.7% 13.6% 36.2% 15.1% 23.0%
Physical Setting/Earth Science
NYS Regents* 39.4% 41.4% 69.0% 53.8% 26% 34.8% 13.0% 25.9
Graduation 2007-08* 42.0% 43.1% 47.3
Students at Risk* 74.3% 71.6% 73.2% 57.9% (Percentages of students in all grades not meeting proficiency)
*Official New York State Education Department statistics for 2007-08 have not yet been released. These numbers are the best District estimate.
U.S. History and Government
English Mathematics
Student Demographic DataPosition Information (FTEs)
Mission: “Visualize Your Future.”-- Provide students with in-depth studies of international finance, global economics, information
technology, and entrepreneurship.
Global History and Geography
Budget Allocations by Account
ELA Math
Student Achievement (percentage of students attaining proficiency)*
Fiscal Year 2010-11 Allocation Weighting Factors
Section 4 Page 26
School Profiles and Budgets 2009-10 Draft Budget

8/7/2019 2009_2010DRAFT
http://slidepdf.com/reader/full/20092010draft 89/268
School: Dr. Freddie Thomas High School 2008-09 Accountability Status: SINI 1-Hold
(FTHS is holding as a School in Need of Improvement Year 1 for 3-8 ELA because it made AYP for the 2008-09 School Ye
Address: 625 Scio St. 14605 Sandra Jordan , Principal Phone: 262-885
2009 2010 2008-09 2009-10(e
Teachers 91.30 88.40 Total Enrollment 1,074 1,0
Principals/AP/AD 8.00 8.00 African American 68.7% 68.
Other Instructional 15.50 15.50 Asian 0.9% 0.
Non-instructional 40.00 39.00 Hispanic 24.3% 24.
Total, Staff 154.80 150.90 Native American 0.1% 0.
White 5.9% 5.
Teacher-Pupil Ratio 11.8 : 1 11.6 : 1 Free & Reduced Lunch 80.4% 80.
Other-Staff-Pupil Ratio 16.9 : 1 16.4 : 1 Special Education 18.2% 18.
Total-Staff-Pupil Ratio 6.9 : 1 6.8 : 1 English Language Learners 4.3% 4.
Attendance (2007-08) 86.6%
Proposed 2009-10 Funding Allocation Grades Served 7-12 7-12
0000: General Fund - No Project $ 6,672,366
0250: Title I - Parent Component -
0268: Title I - AIS Services 88,730 Major Object 2008-09 2009-10
0274: Title I - Misc/Carryover - Salary Compensation 7,050,400 7,191,1
0300: Title I - Improvement/Choice 39,147 Other Compensation 289,960 16,0
0306: Title I SQR Grant - Fixed Obligation/Variability 3,300 3,3
0703: Health Care Apprenticeship 8,000 Cash Capital Outlays 38,952 25,0
0707: Perkins Secondary - Facilities and Related 177,566 117,4
1020: Foundation Aid IPP 101,236 Technology - -
1038: Foundation Aid MA 76,148 Miscellaneous Services - 5
1045: Foundation Aid CR 121,528 Other Variable Expenses 1,712 7
1300: Extracurricular Activities - Total, All Objects 7,561,890 7,354,1
1357: Student & Family Support Ctr 24,174
1395: Community Use 21,500
1910: Drop-Out Prevention 26,782 Average Daily Attendance pct:
4020: Green Schools Program - Special Population Units Count wt. U
4512: C4E - AVID Program 60,534 Mobility (applies over 40%)
4515: C4E - Extended Day Program 64,540 Free/Reduced Lunch
4528: C4E - In-School Suspension 49,484 At Risk
Special Education
Gifted & Talented
Career & Technical Education
English Language Learners
Total, Special Population Units
Total, Refined Units
Total $ 7,354,169 Basic Allocation
Science Social Studies
GRADE 2007 2008* 2007 2008* 2007 2008* 2007 2008*
7 26.1% 48.1% 41.2% 66.5%
8 N/A 36.5% 34.9% 58.8% 30.2% 38.7% 2.0% 13.7%
Physical Setting/Earth Science
NYS Regents* 66.2% 64.8% 66.7% 67.5% 86.2% 52.6% 25.6% 44.
Graduation 2007-08* 42.0% 64.1% 70.
Students at Risk* 64.5% 53.2% 53.2% 35.5% (Percentages of students in all grades not meeting proficiency)
*Official New York State Education Department statistics for 2007-08 have not yet been released. These numbers are the best District estimate.
U.S. History and Government
English Mathematics
Student Demographic DataPosition Information (FTEs)
Mission: Connect students through an enriched and diversified curriculum, so that students become self-motivated independent
learners with the social, emotional and academic skills needed to meet future challenges.
Global History and Geography
Budget Allocations by Account
ELA Math
Student Achievement (percentage of students attaining proficiency)*
Fiscal Year 2010-11 Allocation Weighting Factors
Section 4 Page 27
School Profiles and Budgets 2009-10 Draft Budget

8/7/2019 2009_2010DRAFT
http://slidepdf.com/reader/full/20092010draft 90/268
School: Northeast College Preparatory High School 2008-09 Accountability Status: G
(NE College Preparatory did not make AYP for the 2008-09 Accountability Year in 3-8 ELA (Year
Address: 940 Fernwood Pk. 14609 Robert Goldsberry , Principal Phone: 324-9273
2009 2010 2008-09 2009-10(es
Teachers 35.45 38.65 Total Enrollment 364 3
Principals/AP/AD 2.50 2.50 African American 69.5% 69.5
Other Instructional 4.70 4.00 Asian 0.0% 0.0
Non-instructional 22.75 22.75 Hispanic 22.5% 22.5
Total, Staff 65.40 67.90 Native American 0.0% 0.0
White 8.0% 8.0
Teacher-Pupil Ratio 10.3 : 1 9.4 : 1 Free & Reduced Lunch 82.1% 82.1
Other-Staff-Pupil Ratio 12.2 : 1 12.4 : 1 Special Education 20.6% 20.6
Total-Staff-Pupil Ratio 5.6 : 1 5.4 : 1 English Language Learners 2.7% 2.7
Attendance (2007-08) 91.2%
Proposed 2009-10 Funding Allocation Grades Served 7-11 7-11
0000: General Fund - No Project $ 2,584,819
0250: Title I - Parent Component 10,278
0268: Title I - AIS Services 70,511 Major Object 2008-09 2009-10
1020: Foundation Aid IPP 137,852 Salary Compensation 2,858,483 3,081,02
1038: Foundation Aid MA 46,071 Other Compensation 149,687 1,18
1045: Foundation Aid CR 132,527 Fixed Obligation/Variability 4,000 6,00
1300: Extracurricular Activities - Cash Capital Outlays 76,931 53,30
1315: Legislative Fund - NE/NW CP - Facilities and Related 54,096 31,97
1323: School Redesign 50,000 Technology 2,000 2,00
1357: Student & Family Support Ctr 13,074 Miscellaneous Services 5,500 5,00
1468: Prior Year Expenses - Other Variable Expenses 2,750 3,00
4512: C4E - AVID Program 48,346 Total, All Objects 3,153,447 3,183,49
4515: C4E - Extended Day Program 20,188
4528: C4E - In-School Suspension 69,825
Average Daily Attendance pct:
Special Population Units Count wt. Un
Mobility (applies over 40%)
Free/Reduced Lunch
At Risk
Special Education
Gifted & Talented
Career & Technical Education
English Language Learners
Total, Special Population Units
Total, Refined Units
Total $ 3,183,491 Basic Allocation
Science Social Studies
GRADE 2007 2008* 2007 2008* 2007 2008* 2007 2008*
7 38.0% 47.6% 34.6% 56.6%
8 N/A 40.8% N/A 57.0% N/A N/A 28.4%
Physical Setting/Earth Science
NYS Regents* N/A 0.0% 69.4% 54.0% N/A 50.0% 50.7
Graduation 2007-08* 0.0% N/A 100.0
Students at Risk* 62.0% 55.5% 54.4% 44.2% (Percentages of students in all grades not meeting proficiency)
*Official New York State Education Department statistics for 2007-08 have not yet been released. These numbers are the best District estimate.
Mission: Graduate students who will have the knowledge, skills and experience necessary to successfully complete college and be
ready to select the career best suited to their talents, skills and potential. Our desire is to produce individuals who are proactive,
resourceful, positive, creative, and well-adjusted, ready to make a meaningful contribution to our society.
Global History and Geography
Budget Allocations by Account
ELA Math
Student Achievement (percentage of students attaining proficiency)*
Fiscal Year 2010-11 Allocation Weighting Factors
U.S. History and Government
English Mathematics
Student Demographic DataPosition Information (FTEs)
Section 4 Page 28
School Profiles and Budgets 2009-10 Draft Budget

8/7/2019 2009_2010DRAFT
http://slidepdf.com/reader/full/20092010draft 91/268
School: Northwest College Preparatory High School at Douglass Campus 2008-09 Accountability Status: G
(NW College Preparatory is in good standing for the 2008-09 Accountability Yea
Address: 940 Fernwood Pk. 14609 Toyia Wilson, Principal Phone: 324-9289
2009 2010 2008-09 2009-10(est
Teachers 38.45 39.25 Total Enrollment 332 33
Principals/AP/AD 2.50 2.50 African American 76.5% 76.5%
Other Instructional 8.70 8.70 Asian 0.3% 0.3%
Non-instructional 8.25 8.25 Hispanic 14.2% 14.2%
Total, Staff 57.90 58.70 Native American 0.6% 0.6%
White 8.4% 8.4%
Teacher-Pupil Ratio 8.6 : 1 8.4 : 1 Free & Reduced Lunch 82.5% 82.5%
Other-Staff-Pupil Ratio 17.1 : 1 17 : 1 Special Education 25.0% 25.0%
Total-Staff-Pupil Ratio 5.7 : 1 5.6 : 1 English Language Learners 2.1% 2.1%
Attendance (2007-08) 91.0%
Proposed 2009-10 Funding Allocation Grades Served 7-11 7-11
0000: General Fund - No Project $ 2,602,116
0200: Title IIA - Tchr & Prin Tr/Rec 48,862
0250: Title I - Parent Component 10,278 Major Object 2008-09 2009-10
0268: Title I - AIS Services 94,870 Salary Compensation 2,845,594 2,975,873
1020: Foundation Aid IPP 46,071 Other Compensation 121,510 6,444
1038: Foundation Aid MA 21,045 Fixed Obligation/Variability 9,500 5,000
1045: Foundation Aid CR 53,565 Cash Capital Outlays 75,785 56,400
1300: Extracurricular Activities - Facilities and Related 45,511 33,172
1315: Legislative Fund - NE/NW CP - Technology - -
1323: School Redesign 50,000 Miscellaneous Services 7,000 2,000
1357: Student & Family Support Ctr 13,073 Other Variable Expenses 1,500 -
4512: C4E - AVID Program 43,228 Total, All Objects 3,106,400 3,078,889
4515: C4E - Extended Day Program 21,444
4528: C4E - In-School Suspension 74,337
Average Daily Attendance pct:
Special Population Units Count wt. Uni
Mobility (applies over 40%)
Free/Reduced Lunch
At Risk
Special Education
Gifted & Talented
Career & Technical Education
English Language Learners
Total, Special Population Units
Total, Refined Units
Total $ 3,078,889 Basic Allocation
Science Social Studies
GRADE 2007 2008* 2007 2008* 2007 2008* 2007 2008*
7 27.0% 31.9% 30.1% 43.3%
8 N/A 37.5% N/A 43.2% N/A N/A 25.3%
Physical Setting/Earth Science
NYS Regents* N/A N/A 87.5% 63.0% N/A 57.4% 70.0%
Graduation 2007-08* 0.0% N/A 97.1%
Students at Risk* 73.0% 65.5% 55.7% 51.0% (Percentages of students in all grades not meeting proficiency)
*Official New York State Education Department statistics for 2007-08 have not yet been released. These numbers are the best District estimate.
Mission: Graduate students prepared to become good citizens, future leaders and meaningful contributors to society. Students will
grow and learn in a safe and positive environment characterized by cutting-edge technology and highly skilled teachers.
Global History and Geography
Budget Allocations by Account
ELA Math
Student Achievement (percentage of students attaining proficiency)*
Fiscal Year 2010-11 Allocation Weighting Factors
U.S. History and Government
English Mathematics
Student Demographic DataPosition Information (FTEs)
Section 4 Page 29
School Profiles and Budgets 2009-10 Draft Budget
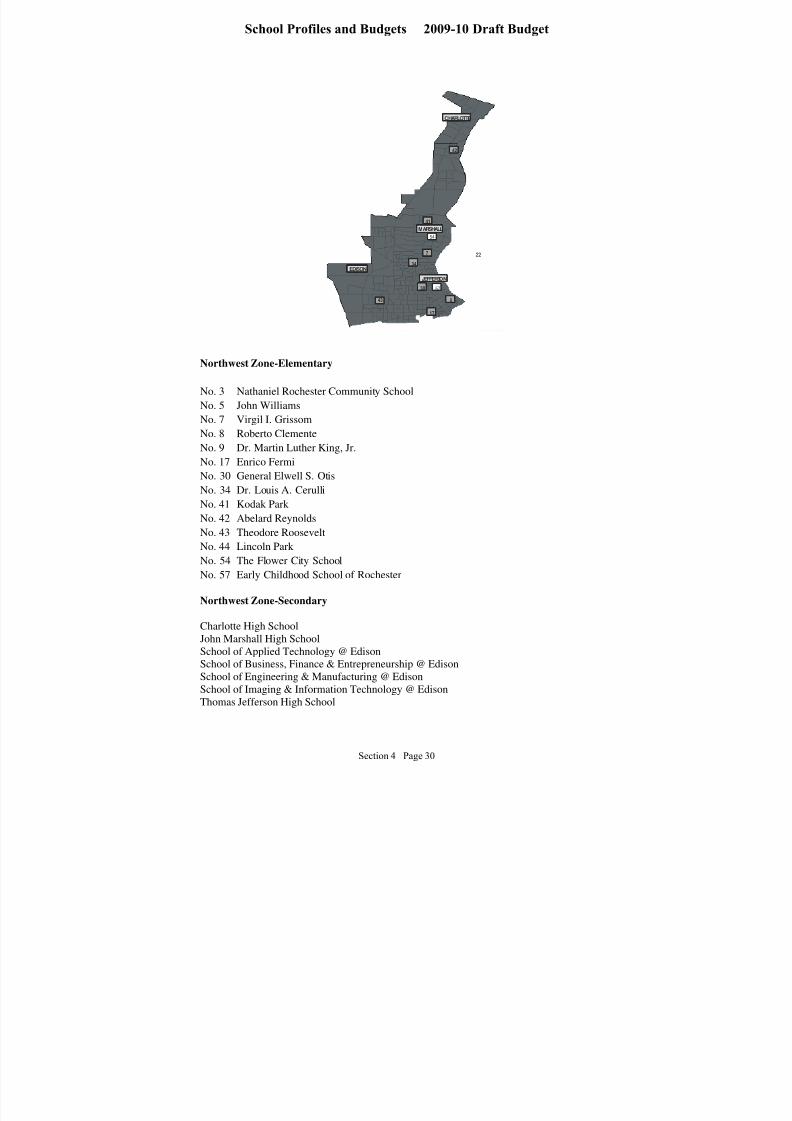
8/7/2019 2009_2010DRAFT
http://slidepdf.com/reader/full/20092010draft 92/268
7
34
17
30
5
42
22
41
43
17
5
54
57
7
30
34
NORTHWESTERN
MARSHALL
CHARLOTTE
EDISON
JEFFERSON
Northwest Zone-Elementary
No. 3 Nathaniel Rochester Community School
No. 5 John Williams
No. 7 Virgil I. Grissom
No. 8 Roberto Clemente
No. 9 Dr. Martin Luther King, Jr.
No. 17 Enrico Fermi
No. 30 General Elwell S. Otis
No. 34 Dr. Louis A. Cerulli
No. 41 Kodak Park
No. 42 Abelard Reynolds
No. 43 Theodore Roosevelt
No. 44 Lincoln Park
No. 54 The Flower City School
No. 57 Early Childhood School of Rochester
Northwest Zone-Secondary
Charlotte High School
John Marshall High School
School of Applied Technology @ Edison
School of Business, Finance & Entrepreneurship @ Edison
School of Engineering & Manufacturing @ Edison
School of Imaging & Information Technology @ Edison
Thomas Jefferson High School
Section 4 Page 30
School Profiles and Budgets 2009-10 Draft Budget
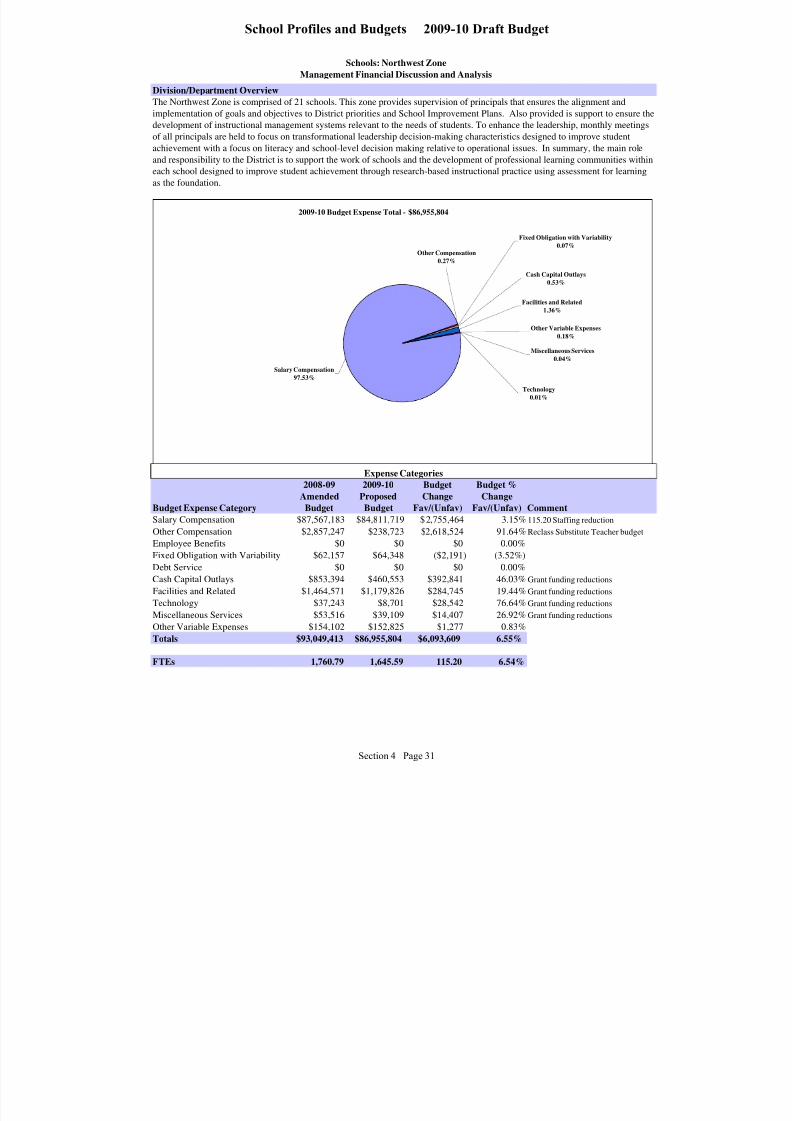
8/7/2019 2009_2010DRAFT
http://slidepdf.com/reader/full/20092010draft 93/268
Schools: Northwest Zone
Management Financial Discussion and Analysis
Division/Department Overview
Budget Expense Category
2008-09
Amended
Budget
2009-10
Proposed
Budget
Budget
Change
Fav/(Unfav)
Budget %
Change
Fav/(Unfav) Comment
Salary Compensation $87,567,183 $84,811,719 $2,755,464 3.15% 115.20 Staffing reduction
Other Compensation $2,857,247 $238,723 $2,618,524 91.64% Reclass Substitute Teacher budget
Employee Benefits $0 $0 $0 0.00%
Fixed Obligation with Variability $62,157 $64,348 ($2,191) (3.52%)
Debt Service $0 $0 $0 0.00%
Cash Capital Outlays $853,394 $460,553 $392,841 46.03% Grant funding reductions
Facilities and Related $1,464,571 $1,179,826 $284,745 19.44% Grant funding reductions
Technology $37,243 $8,701 $28,542 76.64% Grant funding reductionsMiscellaneous Services $53,516 $39,109 $14,407 26.92% Grant funding reductions
Other Variable Expenses $154,102 $152,825 $1,277 0.83%
Totals $93,049,413 $86,955,804 $6,093,609 6.55%
FTEs 1,760.79 1,645.59 115.20 6.54%
Expense Categories
The Northwest Zone is comprised of 21 schools. This zone provides supervision of principals that ensures the alignment and
implementation of goals and objectives to District priorities and School Improvement Plans. Also provided is support to ensure the
development of instructional management systems relevant to the needs of students. To enhance the leadership, monthly meetings
of all principals are held to focus on transformational leadership decision-making characteristics designed to improve student
achievement with a focus on literacy and school-level decision making relative to operational issues. In summary, the main roleand responsibility to the District is to support the work of schools and the development of professional learning communities within
each school designed to improve student achievement through research-based instructional practice using assessment for learning
as the foundation.
2009-10 Budget Expense Total - $86,955,804
Other Variable Expenses
0.18%
Miscellaneous Services
0.04%
Technology
0.01%
Cash Capital Outlays
0.53%
Salary Compensation
97.53%
Fixed Obligation with Variability
0.07%Other Compensation
0.27%
Facilities and Related1.36%
Section 4 Page 31
School Profiles and Budgets 2009-10 Draft Budget
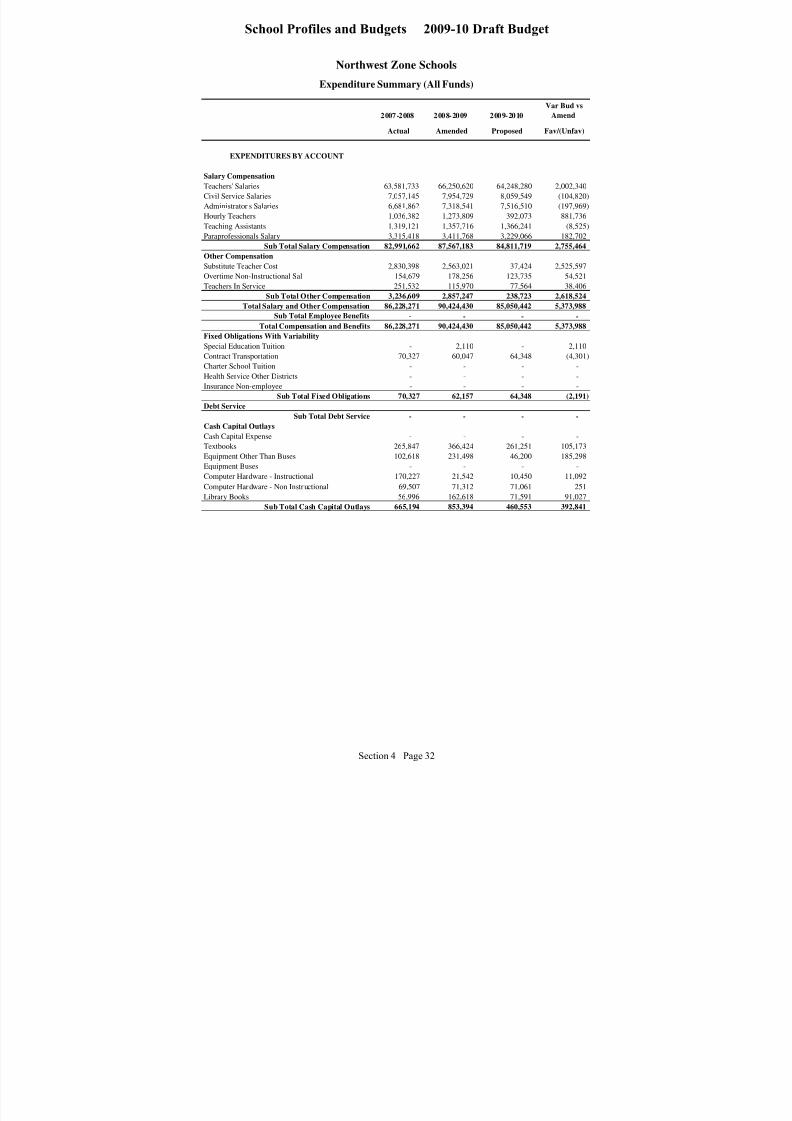
8/7/2019 2009_2010DRAFT
http://slidepdf.com/reader/full/20092010draft 94/268
Northwest Zone Schools
2007-2008 2008-2009 2009-2010
Var Bud vs
Amend
Actual Amended Proposed Fav/(Unfav)
EXPENDITURES BY ACCOUNT
Salary Compensation
Teachers' Salaries 63,581,733 66,250,620 64,248,280 2,002,340
Civil Service Salaries 7,057,145 7,954,729 8,059,549 (104,820)
Administrator's Salaries 6,681,862 7,318,541 7,516,510 (197,969)
Hourly Teachers 1,036,382 1,273,809 392,073 881,736
Teaching Assistants 1,319,121 1,357,716 1,366,241 (8,525)
Paraprofessionals Salary 3,315,418 3,411,768 3,229,066 182,702
Sub Total Salary Compensation 82,991,662 87,567,183 84,811,719 2,755,464
Other Compensation
Substitute Teacher Cost 2,830,398 2,563,021 37,424 2,525,597
Overtime Non-Instructional Sal 154,679 178,256 123,735 54,521
Teachers In Service 251,532 115,970 77,564 38,406
Sub Total Other Compensation 3,236,609 2,857,247 238,723 2,618,524
Total Salary and Other Compensation 86,228,271 90,424,430 85,050,442 5,373,988
Sub Total Employee Benefits - - - -
Total Compensation and Benefits 86,228,271 90,424,430 85,050,442 5,373,988
Fixed Obligations With Variability
Special Education Tuition - 2,110 - 2,110
Contract Transportation 70,327 60,047 64,348 (4,301)
Charter School Tuition - - - -
Health Service Other Districts - - - -
Insurance Non-employee - - - -
Sub Total Fixed Obligations 70,327 62,157 64,348 (2,191)
Debt Service
Sub Total Debt Service - - - -
Cash Capital Outlays
Cash Capital Expense - - - -
Textbooks 265,847 366,424 261,251 105,173
Equipment Other Than Buses 102,618 231,498 46,200 185,298 Equipment Buses - - - -
Computer Hardware - Instructional 170,227 21,542 10,450 11,092
Computer Hardware - Non Instructional 69,507 71,312 71,061 251
Library Books 56,996 162,618 71,591 91,027
Sub Total Cash Capital Outlays 665,194 853,394 460,553 392,841
Expenditure Summary (All Funds)
Section 4 Page 32
School Profiles and Budgets 2009-10 Draft Budget

8/7/2019 2009_2010DRAFT
http://slidepdf.com/reader/full/20092010draft 95/268
Northwest Zone Schools
2007-2008 2008-2009 2009-2010
Var Bud vs
Amend
Actual Amended Proposed Fav/(Unfav)
Expenditure Summary (All Funds)
Facilities and Related
Utilities 119 9,800 9,700 100
Instructional Supplies 1,289,657 1,022,668 784,472 238,196
Equip Service Contr & Repair 24,904 61,258 55,800 5,458
Facilities Service Contracts - - - -
Rentals 4,335 7,833 6,208 1,625
Maintenance Repair Supplies 1,623 3,800 3,800 -
Postage Printing & Advertising 67,504 75,041 69,508 5,533
Auto Supplies 4,329 300 300 -
Supplies and Materials 58,968 48,407 30,459 17,948
Custodial Supplies 118,870 181,200 163,500 17,700
Office Supplies 60,453 54,264 56,079 (1,815)
Sub Total Facilities and Related 1,630,764 1,464,571 1,179,826 284,745
Technology
Computer Software - Instructional 6,639 7,432 4,436 2,996
Computer Software - Non Instructional 7,750 29,811 4,265 25,546
Subtotal Technology 14,389 37,243 8,701 28,542
Miscellaneous Services
Sub Total Miscellaneous Services 51,753 53,516 39,109 14,407
All Other Variable Expenses
Professional & Technical Serv 97,595 35,170 63,271 (28,101)
Agency Clerical 46,453 48,457 44,300 4,157
Judgments and Claims - - - -
Grant Disallowances - - - -
Departmental Credits (15,302) (8,723) (8,723) -
Indirect Costs Grants - - - -
BOCES Services - - - -
Professional Development 115,287 79,198 53,977 25,221
Subtotal of All Other Variable Expenses 244,031 154,102 152,825 1,277
Total Non Compensation 2,676,458 2,624,983 1,905,362 719,621
Sub Total 88,904,729 93,049,413 86,955,804 6,093,609
Fund Balance Reserve - - - -
Grand Total 88,904,729 93,049,413 86,955,804 6,093,609
Section 4 Page 33
School Profiles and Budgets 2009-10 Draft Budget

8/7/2019 2009_2010DRAFT
http://slidepdf.com/reader/full/20092010draft 96/268
Northwest Zone Schools
2007 - 2008 2008 - 2009 2009 - 2010
Var Bud vs
Amend
Actual Amended Proposed Fav/(Unfav)
POSITIONS BY ACCOUNT
Salary Compensation
Teachers' Salaries 1,200.95 1,210.35 1,099.65 110.70
Civil Service Salaries 234.64 242.64 239.14 3.50
Administrator's Salaries 73.00 77.50 76.50 1.00
Teaching Assistants 58.00 57.00 56.00 1.00
Paraprofessionals Salary 177.80 173.30 174.30 (1.00)
Hourly Teachers 0.00 0.00 0.00 0.00
Total Salary Compensation 1,744.39 1,760.79 1,645.59 115.20
Other Compensation
Substitute Teacher Cost 0.00 0.00 0.00 0.00
Overtime Non-Instructional Sal 0.00 0.00 0.00 0.00Teachers In Service 0.00 0.00 0.00 0.00
Total Other Compensation 0.00 0.00 0.00 0.00
Total Salary and Other Compensation 1,744.39 1,760.79 1,645.59 115.20
Grand Total 1,744.39 1,760.79 1,645.59 115.20
Position Summary
Section 4 Page 34
School Profiles and Budgets 2009-10 Draft Budget

8/7/2019 2009_2010DRAFT
http://slidepdf.com/reader/full/20092010draft 97/268
School: No. 3 Nathaniel Rochester Community School 2008-09 Accountability Status: GS
(School 3 is in good standing for the 2008-09 Accountability Year
Address: 85 Adams St. 14608 Connie Wehner , Principal Phone: 454-3525
2009 2010 2008-09 2009-10 (est.
Teachers 40.05 36.10 Total Enrollment 434 439
Principals/AP/AD 2.00 2.00 African American 89.0% 89.0%
Other Instructional 3.00 4.00 Asian 0.5% 0.5%
Non-instructional 11.50 11.50 Hispanic 7.1% 7.1%
Total 56.55 53.60 Native American 0.5% 0.5%
White 2.5% 2.5%
Teacher-Pupil Ratio 10.8 : 1 12.2 : 1 Free & Reduced Lunch 81.7% 81.7%
Other-Staff-Pupil Ratio 26.3 : 1 25.1 : 1 Special Education 17.0% 17.0%
Total-Staff-Pupil Ratio 7.7 : 1 8.2 : 1 English Language Learners 0.6% 0.6%
Attendance (2007-08) 93.0%
Proposed 2009-10 Funding Allocation Grades Served K-9 K-9
0000: General Fund - No Project $ 1,835,071 0197: Foreign Lang. Assist Prog -
0200: Title IIA - Tchr & Prin Tr/Rec - Major Object 2008-09 2009-10
0206: Title I - Kindergarten 59,920 Salary Compensation 2,669,710 2,533,228
0243: Title I - Eng 4 Spkrs Ot Lang 24,213 Other Compensation 101,750 -
0250: Title I - Parent Component 18,759 Fixed Obligation/Variability 15,000 10,000
0268: Title I - AIS Services 143,476 Cash Capital Outlays 41,000 24,000
1020: Foundation Aid IPP 93,280 Facilities and Related 59,226 66,933
1038: Foundation Aid MA 208,908 Technology 500 500
1300: Extracurricular Activities - Miscellaneous Services 3,200 600
1817: FLAP Grant Match - Other Variable Expenses 5,000 5,000
1910: Drop-Out Prevention 20,433 Total, All Objects 2,895,386 2,640,261
4501: C4E - Class Size 106,462
4515: C4E - Extended Day Program 42,736
4517: C4E - Great Beginnings 39,765 Average Daily Attendance pct:
4528: C4E - In-School Suspension 47,238 Special Population Units Count wt. Unit
Mobility (applies over 40%)
Free/Reduced Lunch
At Risk
Special Education
Gifted &Talented
Career & Technical Education
English Language Learners
Total, Special Population Units
Total, Refined Units
Total $ 2,640,261 Basic Allocation
Science Social Studies
GRADE 2007 2008* 2007 2008* 2007 2008* 2007 2008*
1 55.6% 61.3% 50.0% 59.7%
2 55.4% 57.9% 52.3% 54.4%
3 46.2% 57.4% 90.2% 90.3%
4 43.4% 42.6% 60.0% 59.3% 83% 80.8%
5 31.9% 53.8% 64.6% 75.0% 66.7% 69.8%
6 37.3% 50.9% 45.3% 64.2%
Students at Risk* 55.5% 50.9% 50.0% 40.7% (Percentages of students in all grades not meeting proficiency)
*Official New York State Education Department statistics for 2007-08 have not yet been released. These numbers are the best District estimate.
Mission: “Educate, Partner, Prepare” -- create a high quality educational environment where unique gifts and talents of its students
are acknowledged, affirmed and developed. Working collaboratively, students, faculty, and parents create a safe, supportive and
tolerant atmosphere for academic, emotional, social, artistic, and physical development.
Fiscal Year 2010-11 Allocation Weighting Factors
Budget Allocations by Account
ELA MathStudent Achievement (percentage of students attaining proficiency)*
Student Demographic DataPosition Information (FTEs)
Section 4 Page 35
School Profiles and Budgets 2009-10 Draft Budget

8/7/2019 2009_2010DRAFT
http://slidepdf.com/reader/full/20092010draft 98/268
School: No. 3 Nathaniel Rochester Community School 2008-09 Accountability Status: G
(School 3 is in good standing for the 2008-09 Accountability Yea
Address: 85 Adams St. 14608 Connie Wehner , Principal Phone: 454-3525
2009 2010 2008-09 2009-10(est
Teachers 24.20 21.05 Total Enrollment 217 17
Principals/AP/AD 2.00 2.00 African American 89.0% 89.0%
Other Instructional 6.00 5.70 Asian 0.5% 0.5%
Non-instructional 7.50 7.50 Hispanic 7.1% 7.1%
Total, Staff 39.70 36.25 Native American 0.5% 0.5%
White 2.5% 2.5%
Teacher-Pupil Ratio 9 : 1 8.3 : 1 Free & Reduced Lunch 81.7% 81.7%
Other-Staff-Pupil Ratio 14 : 1 11.5 : 1 Special Education 17.0% 17.0%
Total-Staff-Pupil Ratio 5.5 : 1 4.8 : 1 English Language Learners 0.6% 0.6%
Attendance (2007-08) 93.0%
Proposed 2009-10 Funding Allocation Grades Served K-9 K-9
0000: General Fund - No Project $ 1,791,176
0274: Title I - Misc/Carryover -
1038: Foundation Aid MA 38,524 Major Object 2008-09 2009-10
1045: Foundation Aid CR 44,934 Salary Compensation 2,099,494 2,000,497
4512: C4E - AVID Program 58,116 Other Compensation 127,295 -
4515: C4E - Extended Day Program - Fixed Obligation/Variability - -
4528: C4E - In-School Suspension 67,747 Cash Capital Outlays - -
Facilities and Related - -
Technology - -
Miscellaneous Services - -
Other Variable Expenses - -
Total, All Objects 2,226,789 2,000,497
Average Daily Attendance pct:
Special Population Units Count wt. Uni
Mobility (applies over 40%)
Free/Reduced Lunch
At Risk
Special Education
Gifted & Talented
Career & Technical Education
English Language Learners
Total, Special Population Units
Total, Refined Units
Total $ 2,000,497 Basic Allocation
Science Social Studies
GRADE 2007 2008* 2007 2008* 2007 2008* 2007 2008*
7 28.0% 32.4% 26.3% 41.6%
8 53.5% 41.6% 37.6% 41.6% 27.8% 20.8% 18.4% 20.8%
Physical Setting/Earth Science
NYS Regents* 0.0% 0.0% 0.0% 0.0% 0% 0% 0.0% 0.0%
Graduation 2007-08* 0.0% 0.0% 0.0%
Students at Risk* 55.5% 50.9% 50.0% 40.7% (Percentages of students in all grades not meeting proficiency)
*Official New York State Education Department statistics for 2007-08 have not yet been released. These numbers are the best District estimate.
Mission: “Educate, Partner, Prepare” -- create a high quality educational environment where unique gifts and talents of its students
are acknowledged, affirmed and developed. Working collaboratively, students, faculty, and parents create a safe, supportive and
tolerant atmosphere for academic, emotional, social, artistic, and physical development.
Global History and Geography
Budget Allocations by Account
ELA Math
Student Achievement (percentage of students attaining proficiency)*
Fiscal Year 2010-11 Allocation Weighting Factors
U.S. History and Government
English Mathematics
Student Demographic DataPosition Information (FTEs)
Section 4 Page 36
School Profiles and Budgets 2009-10 Draft Budget
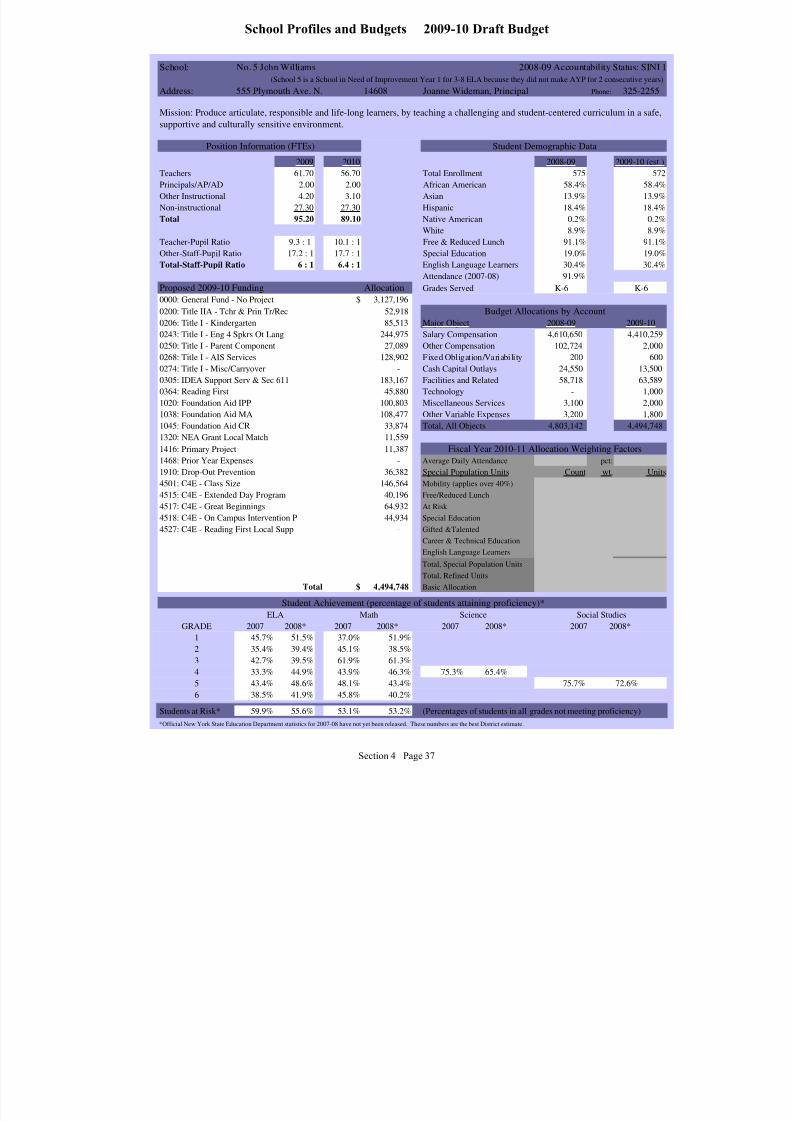
8/7/2019 2009_2010DRAFT
http://slidepdf.com/reader/full/20092010draft 99/268
School: No. 5 John Williams 2008-09 Accountability Status: SINI
(School 5 is a School in Need of Improvement Year 1 for 3-8 ELA because they did not make AYP for 2 consecutive years
Address: 555 Plymouth Ave. N. 14608 Joanne Wideman, Principal Phone: 325-2255
2009 2010 2008-09 2009-10 (est.
Teachers 61.70 56.70 Total Enrollment 575 572
Principals/AP/AD 2.00 2.00 African American 58.4% 58.4%
Other Instructional 4.20 3.10 Asian 13.9% 13.9%
Non-instructional 27.30 27.30 Hispanic 18.4% 18.4%
Total 95.20 89.10 Native American 0.2% 0.2%
White 8.9% 8.9%
Teacher-Pupil Ratio 9.3 : 1 10.1 : 1 Free & Reduced Lunch 91.1% 91.1%
Other-Staff-Pupil Ratio 17.2 : 1 17.7 : 1 Special Education 19.0% 19.0%
Total-Staff-Pupil Ratio 6 : 1 6.4 : 1 English Language Learners 30.4% 30.4%
Attendance (2007-08) 91.9%
Proposed 2009-10 Funding Allocation Grades Served K-6 K-6
0000: General Fund - No Project $ 3,127,196 0200: Title IIA - Tchr & Prin Tr/Rec 52,918
0206: Title I - Kindergarten 85,513 Major Object 2008-09 2009-10
0243: Title I - Eng 4 Spkrs Ot Lang 244,975 Salary Compensation 4,610,650 4,410,259
0250: Title I - Parent Component 27,089 Other Compensation 102,724 2,000
0268: Title I - AIS Services 128,902 Fixed Obligation/Variability 200 600
0274: Title I - Misc/Carryover - Cash Capital Outlays 24,550 13,500
0305: IDEA Support Serv & Sec 611 183,167 Facilities and Related 58,718 63,589
0364: Reading First 45,880 Technology - 1,000
1020: Foundation Aid IPP 100,803 Miscellaneous Services 3,100 2,000
1038: Foundation Aid MA 108,477 Other Variable Expenses 3,200 1,800
1045: Foundation Aid CR 33,874 Total, All Objects 4,803,142 4,494,748
1320: NEA Grant Local Match 11,559
1416: Primary Project 11,387
1468: Prior Year Expenses - Average Daily Attendance pct:
1910: Drop-Out Prevention 36,382 Special Population Units Count wt. Unit
4501: C4E - Class Size 146,564 Mobility (applies over 40%)
4515: C4E - Extended Day Program 40,196 Free/Reduced Lunch
4517: C4E - Great Beginnings 64,932 At Risk
4518: C4E - On Campus Intervention P 44,934 Special Education
4527: C4E - Reading First Local Supp - Gifted &Talented
Career & Technical Education
English Language Learners
Total, Special Population Units
Total, Refined Units
Total $ 4,494,748 Basic Allocation
Science Social Studies
GRADE 2007 2008* 2007 2008* 2007 2008* 2007 2008*
1 45.7% 51.5% 37.0% 51.9%
2 35.4% 39.4% 45.1% 38.5%
3 42.7% 39.5% 61.9% 61.3%
4 33.3% 44.9% 43.9% 46.3% 75.3% 65.4%
5 43.4% 48.6% 48.1% 43.4% 75.7% 72.6%
6 38.5% 41.9% 45.8% 40.2%
Students at Risk* 59.9% 55.6% 53.1% 53.2% (Percentages of students in all grades not meeting proficiency)
*Official New York State Education Department statistics for 2007-08 have not yet been released. These numbers are the best District estimate.
Mission: Produce articulate, responsible and life-long learners, by teaching a challenging and student-centered curriculum in a safe,
supportive and culturally sensitive environment.
Fiscal Year 2010-11 Allocation Weighting Factors
Budget Allocations by Account
ELA MathStudent Achievement (percentage of students attaining proficiency)*
Student Demographic DataPosition Information (FTEs)
Section 4 Page 37
School Profiles and Budgets 2009-10 Draft Budget
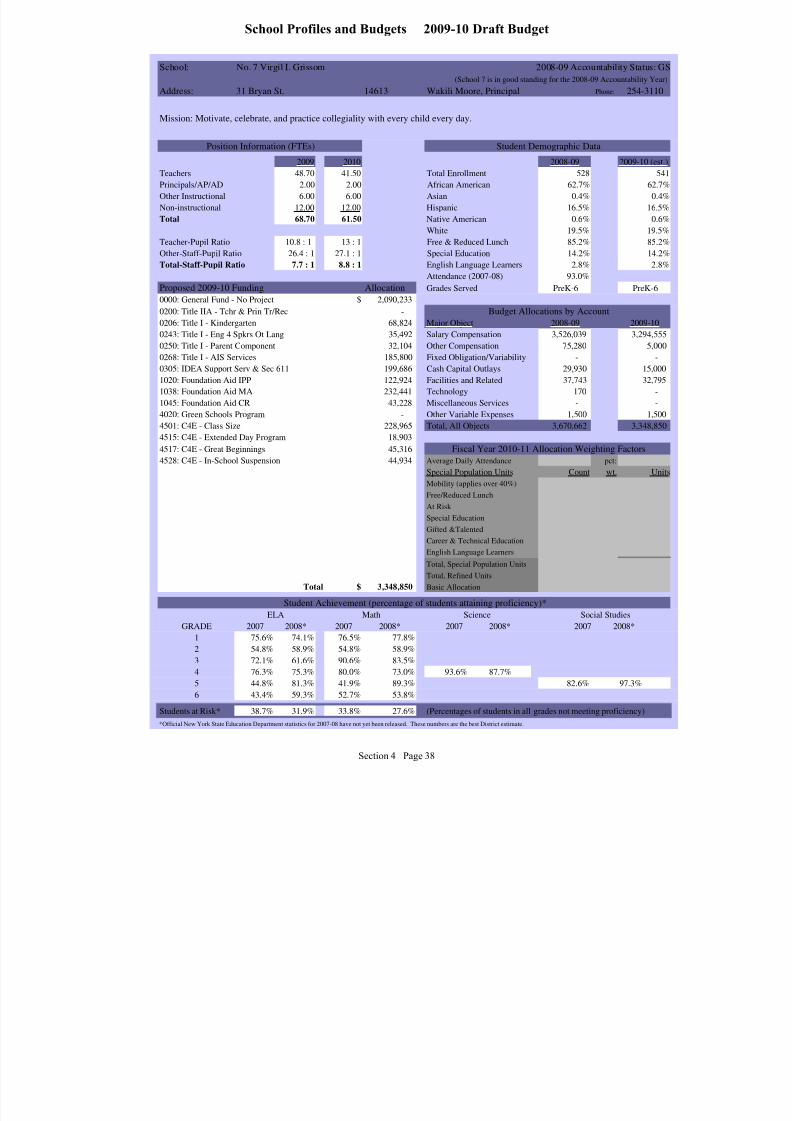
8/7/2019 2009_2010DRAFT
http://slidepdf.com/reader/full/20092010draft 100/268
School: No. 7 Virgil I. Grissom 2008-09 Accountability Status: G
(School 7 is in good standing for the 2008-09 Accountability Yea
Address: 31 Bryan St. 14613 Wakili Moore, Principal Phone: 254-3110
2009 2010 2008-09 2009-10 (est
Teachers 48.70 41.50 Total Enrollment 528 54
Principals/AP/AD 2.00 2.00 African American 62.7% 62.7
Other Instructional 6.00 6.00 Asian 0.4% 0.4
Non-instructional 12.00 12.00 Hispanic 16.5% 16.5
Total 68.70 61.50 Native American 0.6% 0.6
White 19.5% 19.5
Teacher-Pupil Ratio 10.8 : 1 13 : 1 Free & Reduced Lunch 85.2% 85.2
Other-Staff-Pupil Ratio 26.4 : 1 27.1 : 1 Special Education 14.2% 14.2
Total-Staff-Pupil Ratio 7.7 : 1 8.8 : 1 English Language Learners 2.8% 2.8
Attendance (2007-08) 93.0%
Proposed 2009-10 Funding Allocation Grades Served PreK-6 PreK-6
0000: General Fund - No Project $ 2,090,233 0200: Title IIA - Tchr & Prin Tr/Rec -
0206: Title I - Kindergarten 68,824 Major Object 2008-09 2009-10
0243: Title I - Eng 4 Spkrs Ot Lang 35,492 Salary Compensation 3,526,039 3,294,55
0250: Title I - Parent Component 32,104 Other Compensation 75,280 5,00
0268: Title I - AIS Services 185,800 Fixed Obligation/Variability - -
0305: IDEA Support Serv & Sec 611 199,686 Cash Capital Outlays 29,930 15,00
1020: Foundation Aid IPP 122,924 Facilities and Related 37,743 32,79
1038: Foundation Aid MA 232,441 Technology 170 -
1045: Foundation Aid CR 43,228 Miscellaneous Services - -
4020: Green Schools Program - Other Variable Expenses 1,500 1,50
4501: C4E - Class Size 228,965 Total, All Objects 3,670,662 3,348,85
4515: C4E - Extended Day Program 18,903
4517: C4E - Great Beginnings 45,316
4528: C4E - In-School Suspension 44,934 Average Daily Attendance pct:
Special Population Units Count wt. Un
Mobility (applies over 40%)
Free/Reduced Lunch
At Risk
Special Education
Gifted &Talented
Career & Technical Education
English Language Learners
Total, Special Population Units
Total, Refined Units
Total $ 3,348,850 Basic Allocation
Science Social Studies
GRADE 2007 2008* 2007 2008* 2007 2008* 2007 2008*
1 75.6% 74.1% 76.5% 77.8%
2 54.8% 58.9% 54.8% 58.9%
3 72.1% 61.6% 90.6% 83.5%
4 76.3% 75.3% 80.0% 73.0% 93.6% 87.7%
5 44.8% 81.3% 41.9% 89.3% 82.6% 97.3%
6 43.4% 59.3% 52.7% 53.8%
Students at Risk* 38.7% 31.9% 33.8% 27.6% (Percentages of students in all grades not meeting proficiency)
*Official New York State Education Department statistics for 2007-08 have not yet been released. These numbers are the best District estimate.
Mission: Motivate, celebrate, and practice collegiality with every child every day.
Fiscal Year 2010-11 Allocation Weighting Factors
Budget Allocations by Account
ELA MathStudent Achievement (percentage of students attaining proficiency)*
Student Demographic DataPosition Information (FTEs)
Section 4 Page 38
School Profiles and Budgets 2009-10 Draft Budget

8/7/2019 2009_2010DRAFT
http://slidepdf.com/reader/full/20092010draft 101/268
School: No. 8 Roberto Clemente 2008-09 Accountability Status: G
(School 8 did not make AYP for the 2008-09 Accountability Year in 3-8 Math (Year 1
Address: 1180 St. Paul St. 14621 Jacquelyn Cox-Cooper, Principal Phone: 262-8888
2009 2010 2008-09 2009-10 (est
Teachers 49.90 41.60 Total Enrollment 520 52
Principals/AP/AD 3.50 3.50 African American 61.5% 61.5
Other Instructional 5.00 5.00 Asian 1.0% 1.0
Non-instructional 23.00 24.00 Hispanic 32.7% 32.7
Total 81.40 74.10 Native American 0.8% 0.8
White 3.7% 3.7
Teacher-Pupil Ratio 10.4 : 1 12.7 : 1 Free & Reduced Lunch 91.3% 91.3
Other-Staff-Pupil Ratio 16.5 : 1 16.3 : 1 Special Education 9.2% 9.2
Total-Staff-Pupil Ratio 6.4 : 1 7.1 : 1 English Language Learners 6.5% 6.5
Attendance (2007-08) 88.8%
Proposed 2009-10 Funding Allocation Grades Served PreK-6 PreK-6
0000: General Fund - No Project $ 2,609,244 0138: GRHF Dancing Stars Future #8 -
0200: Title IIA - Tchr & Prin Tr/Rec - Major Object 2008-09 2009-10
0206: Title I - Kindergarten 107,712 Salary Compensation 3,837,642 3,621,55
0243: Title I - Eng 4 Spkrs Ot Lang 107,320 Other Compensation 112,220 8,70
0250: Title I - Parent Component 31,419 Fixed Obligation/Variability - -
0268: Title I - AIS Services 120,881 Cash Capital Outlays 56,802 33,30
0274: Title I - Misc/Carryover - Facilities and Related 72,884 50,00
0364: Reading First 45,880 Technology - -
0458: Title IV SDFSCA8 - Miscellaneous Services 440 40
1020: Foundation Aid IPP 105,354 Other Variable Expenses 30,300 12,20
1038: Foundation Aid MA 68,253 Total, All Objects 4,110,288 3,726,15
1045: Foundation Aid CR 43,228
1416: Primary Project 33,623
1910: Drop-Out Prevention 40,866 Average Daily Attendance pct:
4501: C4E - Class Size 195,066 Special Population Units Count wt. Un
4515: C4E - Extended Day Program 32,500 Mobility (applies over 40%)
4517: C4E - Great Beginnings 38,676 Free/Reduced Lunch
4518: C4E - On Campus Intervention P 53,565 At Risk
4524: C4E - Dream Schools 92,567 Special Education
4527: C4E - Reading First Local Supp - Gifted &Talented
Career & Technical Education
English Language Learners
Total, Special Population Units
Total, Refined Units
Total $ 3,726,154 Basic Allocation
Science Social Studies
GRADE 2007 2008* 2007 2008* 2007 2008* 2007 2008*
1 32.2% 52.0% 28.7% 32.0%
2 43.9% 44.7% 41.5% 31.6%
3 33.3% 32.7% 32.9% 42.6%
4 23.3% 44.4% 15.1% 38.1% 58.1% 79%
5 37.3% 47.1% 26.5% 41.4% 65.2% 70.0%
6 24.4% 24.6% 27.5% 16.9%
Students at Risk* 68.2% 58.3% 71.9% 66.5% (Percentages of students in all grades not meeting proficiency)
*Official New York State Education Department statistics for 2007-08 have not yet been released. These numbers are the best District estimate.
Mission: Through professional collaboration, establish a learning community where all students are expected to achieve more and to
excel academically.
Fiscal Year 2010-11 Allocation Weighting Factors
Budget Allocations by Account
ELA MathStudent Achievement (percentage of students attaining proficiency)*
Student Demographic DataPosition Information (FTEs)
Section 4 Page 39
School Profiles and Budgets 2009-10 Draft Budget

8/7/2019 2009_2010DRAFT
http://slidepdf.com/reader/full/20092010draft 102/268
School: No. 9 Dr. Martin Luther King, Jr. 2008-09 Accountability Status: SINI 5-YR
(School 9 is a School Restructuring (SINI 5) Year 3 for 3-8 ELA because they did not make AYP for over six consecutive year
Address: 485 Clinton Ave. N. 14605 Sharon Jackson, Principal Phone: 325-7828
2009 2010 2008-09 2009-10 (est
Teachers 71.00 66.15 Total Enrollment 670 67
Principals/AP/AD 3.00 3.00 African American 37.5% 37.5%
Other Instructional 9.30 9.05 Asian 0.0% 0.0%
Non-instructional 16.80 16.80 Hispanic 60.0% 60.0%
Total 100.10 95.00 Native American 0.3% 0.3%
White 1.8% 1.8%
Teacher-Pupil Ratio 9.4 : 1 10.3 : 1 Free & Reduced Lunch 97.9% 97.9%
Other-Staff-Pupil Ratio 23 : 1 23.5 : 1 Special Education 14.3% 14.3%
Total-Staff-Pupil Ratio 6.7 : 1 7.1 : 1 English Language Learners 39.6% 39.6%
Attendance (2007-08) 90.5%
Proposed 2009-10 Funding Allocation Grades Served PreK-6 PreK-6
0000: General Fund - No Project $ 3,541,789 0139: GRHF Fitness Stations #9 -
0199: Title III - Bilingual Educ - Major Object 2008-09 2009-10
0200: Title IIA - Tchr & Prin Tr/Rec - Salary Compensation 5,184,088 5,094,193
0206: Title I - Kindergarten 61,249 Other Compensation 96,771 9,552
0243: Title I - Eng 4 Spkrs Ot Lang 343,591 Fixed Obligation/Variability 5,500 17,000
0250: Title I - Parent Component 13,578 Cash Capital Outlays 48,930 42,500
0268: Title I - AIS Services 295,285 Facilities and Related 56,911 50,682
0274: Title I - Misc/Carryover - Technology - -
0300: Title I - Improvement/Choice 44,174 Miscellaneous Services - -
0313: School #12/United Way - Other Variable Expenses 2,000 13,000
0513: The Primary Project - Total, All Objects 5,394,200 5,226,927
1020: Foundation Aid IPP 167,017
1038: Foundation Aid MA 245,799
1045: Foundation Aid CR 66,275 Average Daily Attendance pct:
1103: Ed Related Support Services 34,913 Special Population Units Count wt. Uni
1122: School Special Projects 11,039 Mobility (applies over 40%)
1313: Strong Start Program - Free/Reduced Lunch
1416: Primary Project 24,953 At Risk
1468: Prior Year Expenses - Special Education
1910: Drop-Out Prevention 35,460 Gifted &Talented
4501: C4E - Class Size 191,921 Career & Technical Education
4515: C4E - Extended Day Program 40,950 English Language Learners
4517: C4E - Great Beginnings 53,818 Total, Special Population Units
4518: C4E - On Campus Intervention P 55,116 Total, Refined Units
Total $ 5,226,927 Basic Allocation
Science Social Studies
GRADE 2007 2008* 2007 2008* 2007 2008* 2007 2008*
1 50.0% 50.0% 58.6% 49.4%
2 44.0% 49.2% 20.9% 50.0%
3 50.6% 32.5% 78.9% 77.5%
4 44.8% 42.5% 54.7% 68.8% 75.3% 67%
5 27.7% 52.8% 46.9% 51.6% 43.8% 70.8%
6 30.7% 32.0% 25.0% 37.4%
Students at Risk* 60.2% 57.7% 52.3% 44.5% (Percentages of students in all grades not meeting proficiency)
*Official New York State Education Department statistics for 2007-08 have not yet been released. These numbers are the best District estimate.
Mission: Prepare students to be productive members of a culturally diverse and increasingly complex society. We will accomplish
this in a safe, nurturing, and pleasing environment where a competent, cooperative, and collaborative staff provides a challenging
academic program for all students.
Fiscal Year 2010-11 Allocation Weighting Factors
Budget Allocations by Account
ELA MathStudent Achievement (percentage of students attaining proficiency)*
Student Demographic DataPosition Information (FTEs)
Section 4 Page 40
School Profiles and Budgets 2009-10 Draft Budget

8/7/2019 2009_2010DRAFT
http://slidepdf.com/reader/full/20092010draft 103/268
School: No. 17 Enrico Fermi 2008-09 Accountability Status: SINI
(School 17 is a School in Need of Improvement Year 1 for 3-8 ELA because they did not make AYP for 2 consecutive year
Address: 158 Orchard St. 14611 Patricia Jones, Principal Phone: 436-2560
2009 2010 2008-09 2009-10 (est
Teachers 53.30 47.20 Total Enrollment 515 54
Principals/AP/AD 2.00 2.00 African American 57.7% 57.7%
Other Instructional 4.20 3.20 Asian 1.4% 1.4%
Non-instructional 22.30 22.30 Hispanic 31.1% 31.1%
Total 81.80 74.70 Native American 0.2% 0.2%
White 9.3% 9.3%
Teacher-Pupil Ratio 9.7 : 1 11.6 : 1 Free & Reduced Lunch 97.9% 97.9%
Other-Staff-Pupil Ratio 18.1 : 1 19.9 : 1 Special Education 12.6% 12.6%
Total-Staff-Pupil Ratio 6.3 : 1 7.3 : 1 English Language Learners 18.1% 18.1%
Attendance (2007-08) 90.0%
Proposed 2009-10 Funding Allocation Grades Served PreK-6 PreK-6
0000: General Fund - No Project $ 2,481,897 0200: Title IIA - Tchr & Prin Tr/Rec -
0206: Title I - Kindergarten 54,340 Major Object 2008-09 2009-10
0243: Title I - Eng 4 Spkrs Ot Lang 56,616 Salary Compensation 3,923,201 3,750,289
0250: Title I - Parent Component 24,522 Other Compensation 113,713 6,000
0268: Title I - AIS Services 158,677 Fixed Obligation/Variability 500 500
0274: Title I - Misc/Carryover - Cash Capital Outlays 19,500 18,000
0364: Reading First 25,504 Facilities and Related 52,496 49,324
1020: Foundation Aid IPP 110,408 Technology 1,436 936
1038: Foundation Aid MA 263,590 Miscellaneous Services 1,500 750
1045: Foundation Aid CR 66,275 Other Variable Expenses 6,000 3,500
1323: School Redesign - Total, All Objects 4,118,346 3,829,299
1416: Primary Project 14,725
1910: Drop-Out Prevention 47,631
4501: C4E - Class Size 365,931 Average Daily Attendance pct:
4515: C4E - Extended Day Program 44,481 Special Population Units Count wt. Uni
4517: C4E - Great Beginnings 48,427 Mobility (applies over 40%)
4518: C4E - On Campus Intervention P 66,275 Free/Reduced Lunch
4527: C4E - Reading First Local Supp - At Risk
Special Education
Gifted &Talented
Career & Technical Education
English Language Learners
Total, Special Population Units
Total, Refined Units
Total $ 3,829,299 Basic Allocation
Science Social Studies
GRADE 2007 2008* 2007 2008* 2007 2008* 2007 2008*
1 49.0% 48.2% 40.3% 46.0%
2 26.0% 43.2% 35.5% 35.6%
3 39.4% 37.2% 57.7% 65.8%
4 37.7% 35.8% 45.6% 52.1% 79.4% 76.7%
5 47.4% 43.5% 48.7% 48.4% 78.9% 53.2%
6 22.4% 51.4% 25.9% 51.4%
Students at Risk* 62.8% 57.3% 57.6% 49.9% (Percentages of students in all grades not meeting proficiency)
*Official New York State Education Department statistics for 2007-08 have not yet been released. These numbers are the best District estimate.
Mission: Improve student performance by: maintaining high academic standards; working in partnerships with families, caregivers,
and the Rochester community to provide a quality education in a positive school environment; empowering each student to be a
confident and productive member of society; recognizing and respecting diversity; and, modeling lifelong learning.
Fiscal Year 2010-11 Allocation Weighting Factors
Budget Allocations by Account
ELA MathStudent Achievement (percentage of students attaining proficiency)*
Student Demographic DataPosition Information (FTEs)
Section 4 Page 41
School Profiles and Budgets 2009-10 Draft Budget
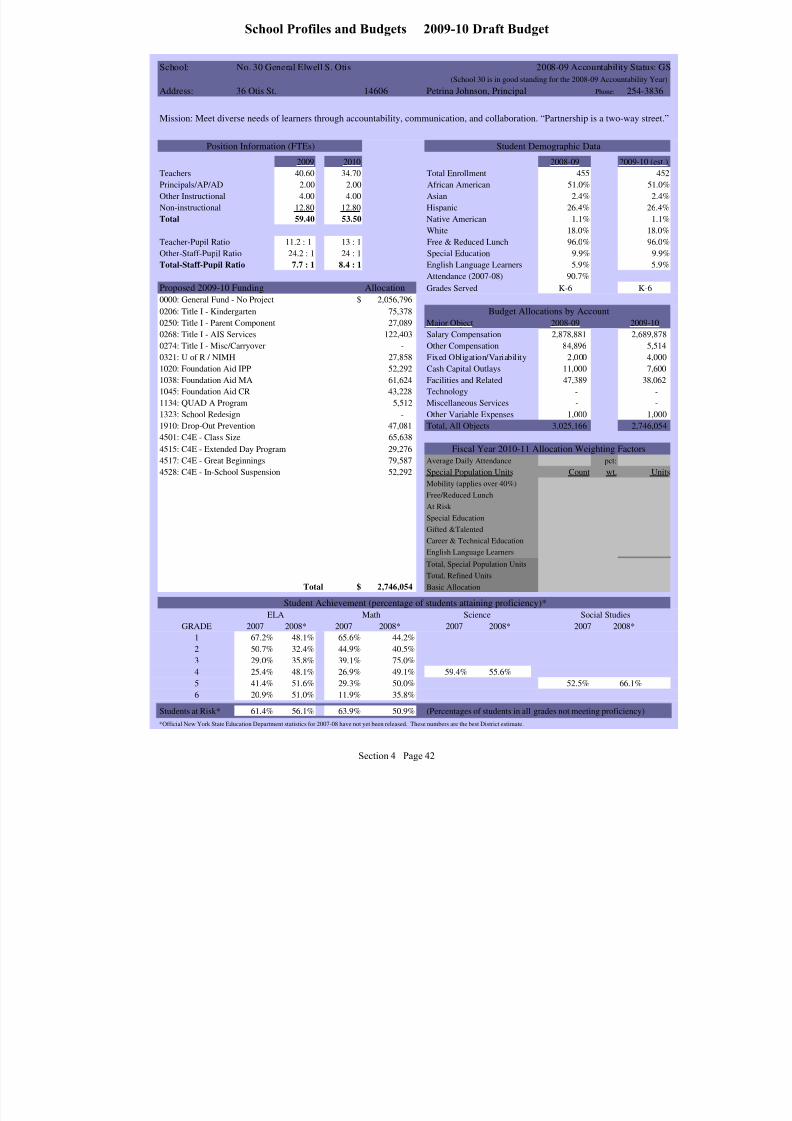
8/7/2019 2009_2010DRAFT
http://slidepdf.com/reader/full/20092010draft 104/268
School: No. 30 General Elwell S. Otis 2008-09 Accountability Status: G
(School 30 is in good standing for the 2008-09 Accountability Yea
Address: 36 Otis St. 14606 Petrina Johnson, Principal Phone: 254-3836
2009 2010 2008-09 2009-10 (est
Teachers 40.60 34.70 Total Enrollment 455 45
Principals/AP/AD 2.00 2.00 African American 51.0% 51.0
Other Instructional 4.00 4.00 Asian 2.4% 2.4
Non-instructional 12.80 12.80 Hispanic 26.4% 26.4
Total 59.40 53.50 Native American 1.1% 1.1
White 18.0% 18.0
Teacher-Pupil Ratio 11.2 : 1 13 : 1 Free & Reduced Lunch 96.0% 96.0
Other-Staff-Pupil Ratio 24.2 : 1 24 : 1 Special Education 9.9% 9.9
Total-Staff-Pupil Ratio 7.7 : 1 8.4 : 1 English Language Learners 5.9% 5.9
Attendance (2007-08) 90.7%
Proposed 2009-10 Funding Allocation Grades Served K-6 K-6
0000: General Fund - No Project $ 2,056,796 0206: Title I - Kindergarten 75,378
0250: Title I - Parent Component 27,089 Major Object 2008-09 2009-10
0268: Title I - AIS Services 122,403 Salary Compensation 2,878,881 2,689,87
0274: Title I - Misc/Carryover - Other Compensation 84,896 5,51
0321: U of R / NIMH 27,858 Fixed Obligation/Variability 2,000 4,00
1020: Foundation Aid IPP 52,292 Cash Capital Outlays 11,000 7,60
1038: Foundation Aid MA 61,624 Facilities and Related 47,389 38,06
1045: Foundation Aid CR 43,228 Technology - -
1134: QUAD A Program 5,512 Miscellaneous Services - -
1323: School Redesign - Other Variable Expenses 1,000 1,00
1910: Drop-Out Prevention 47,081 Total, All Objects 3,025,166 2,746,05
4501: C4E - Class Size 65,638
4515: C4E - Extended Day Program 29,276
4517: C4E - Great Beginnings 79,587 Average Daily Attendance pct:
4528: C4E - In-School Suspension 52,292 Special Population Units Count wt. Un
Mobility (applies over 40%)
Free/Reduced Lunch
At Risk
Special Education
Gifted &Talented
Career & Technical Education
English Language Learners
Total, Special Population Units
Total, Refined Units
Total $ 2,746,054 Basic Allocation
Science Social Studies
GRADE 2007 2008* 2007 2008* 2007 2008* 2007 2008*
1 67.2% 48.1% 65.6% 44.2%
2 50.7% 32.4% 44.9% 40.5%
3 29.0% 35.8% 39.1% 75.0%
4 25.4% 48.1% 26.9% 49.1% 59.4% 55.6%
5 41.4% 51.6% 29.3% 50.0% 52.5% 66.1%
6 20.9% 51.0% 11.9% 35.8%
Students at Risk* 61.4% 56.1% 63.9% 50.9% (Percentages of students in all grades not meeting proficiency)
*Official New York State Education Department statistics for 2007-08 have not yet been released. These numbers are the best District estimate.
Mission: Meet diverse needs of learners through accountability, communication, and collaboration. “Partnership is a two-way street
Fiscal Year 2010-11 Allocation Weighting Factors
Budget Allocations by Account
ELA MathStudent Achievement (percentage of students attaining proficiency)*
Student Demographic DataPosition Information (FTEs)
Section 4 Page 42
School Profiles and Budgets 2009-10 Draft Budget

8/7/2019 2009_2010DRAFT
http://slidepdf.com/reader/full/20092010draft 105/268
School: No. 34 Dr. Louis A. Cerulli 2008-09 Accountability Status: G
(School 34 is in good standing for the 2008-09 Accountability Yea
Address: 530 Lexington Ave. 14613 Debra Ramsperger, Principal Phone: 458-3210
2009 2010 2008-09 2009-10 (est
Teachers 43.50 39.80 Total Enrollment 462 47
Principals/AP/AD 2.00 2.00 African American 60.6% 60.6
Other Instructional 3.80 3.60 Asian 1.7% 1.7
Non-instructional 11.80 11.80 Hispanic 18.2% 18.2
Total 61.10 57.20 Native American 0.2% 0.2
White 18.2% 18.2
Teacher-Pupil Ratio 10.6 : 1 11.9 : 1 Free & Reduced Lunch 95.0% 95.0
Other-Staff-Pupil Ratio 26.3 : 1 27.3 : 1 Special Education 17.7% 17.7
Total-Staff-Pupil Ratio 7.6 : 1 8.3 : 1 English Language Learners 2.8% 2.8
Attendance (2007-08) 91.9%
Proposed 2009-10 Funding Allocation Grades Served K-6 K-6
0000: General Fund - No Project $ 2,094,233 0200: Title IIA - Tchr & Prin Tr/Rec -
0206: Title I - Kindergarten 44,366 Major Object 2008-09 2009-10
0250: Title I - Parent Component 20,884 Salary Compensation 3,093,560 3,050,85
0268: Title I - AIS Services 168,079 Other Compensation 68,840 28,78
0305: IDEA Support Serv & Sec 611 48,346 Fixed Obligation/Variability 1,200 1,00
0513: The Primary Project 15,234 Cash Capital Outlays 17,501 18,50
1020: Foundation Aid IPP 99,636 Facilities and Related 57,172 46,64
1038: Foundation Aid MA 130,774 Technology 574 50
1045: Foundation Aid CR 51,177 Miscellaneous Services 2,590 1,10
1134: QUAD A Program 75,940 Other Variable Expenses 2,900 1,50
1323: School Redesign - Total, All Objects 3,244,337 3,148,88
1416: Primary Project 10,263
1910: Drop-Out Prevention 40,866
4501: C4E - Class Size 224,007 Average Daily Attendance pct:
4515: C4E - Extended Day Program 25,364 Special Population Units Count wt. Un
4517: C4E - Great Beginnings 47,423 Mobility (applies over 40%)
4528: C4E - In-School Suspension 52,292 Free/Reduced Lunch
At Risk
Special Education
Gifted &Talented
Career & Technical Education
English Language Learners
Total, Special Population Units
Total, Refined Units
Total $ 3,148,884 Basic Allocation
Science Social Studies
GRADE 2007 2008* 2007 2008* 2007 2008* 2007 2008*
1 57.8% 43.1% 64.6% 43.1%
2 35.9% 30.0% 34.8% 40.3%
3 29.9% 34.1% 54.5% 63.8%
4 36.0% 45.9% 48.0% 61.7% 72% 78.3%
5 46.8% 51.1% 52.2% 52.2% 58.3% 80.4%
6 35.0% 66.7% 41.7% 57.1%
Students at Risk* 60.3% 56.9% 51.7% 46.8% (Percentages of students in all grades not meeting proficiency)
*Official New York State Education Department statistics for 2007-08 have not yet been released. These numbers are the best District estimate.
Mission: Educate all of our students through research-proven models; provide a positive, enriching, and diverse learning
environment; communicate academic and developmental progress with all students and families.
Fiscal Year 2010-11 Allocation Weighting Factors
Budget Allocations by Account
ELA MathStudent Achievement (percentage of students attaining proficiency)*
Student Demographic DataPosition Information (FTEs)
Section 4 Page 43
School Profiles and Budgets 2009-10 Draft Budget

8/7/2019 2009_2010DRAFT
http://slidepdf.com/reader/full/20092010draft 106/268
School: No. 41 Kodak Park 2008-09 Accountability Status: G
(School 41 is in good standing for the 2008-09 Accountability Yea
Address: 279 Ridge Rd. W. 14615 Roshon Bradley, Principal Phone: 254-4472
2009 2010 2008-09 2009-10 (est
Teachers 55.70 48.80 Total Enrollment 558 57
Principals/AP/AD 2.00 2.00 African American 55.9% 55.9
Other Instructional 7.00 6.50 Asian 2.0% 2.0
Non-instructional 14.70 14.70 Hispanic 15.8% 15.8
Total 79.40 72.00 Native American 0.4% 0.4
White 25.4% 25.4
Teacher-Pupil Ratio 10 : 1 11.8 : 1 Free & Reduced Lunch 92.5% 92.5
Other-Staff-Pupil Ratio 23.5 : 1 24.8 : 1 Special Education 21.1% 21.1
Total-Staff-Pupil Ratio 7 : 1 8 : 1 English Language Learners 3.2% 3.2
Attendance (2007-08) 92.4%
Proposed 2009-10 Funding Allocation Grades Served PreK-6 PreK-6
0000: General Fund - No Project $ 2,658,058 0200: Title IIA - Tchr & Prin Tr/Rec -
0206: Title I - Kindergarten 52,294 Major Object 2008-09 2009-10
0250: Title I - Parent Component 18,759 Salary Compensation 3,870,187 3,597,38
0268: Title I - AIS Services 176,310 Other Compensation 96,087 4,50
0305: IDEA Support Serv & Sec 611 65,423 Fixed Obligation/Variability - -
0364: Reading First - Cash Capital Outlays 18,600 16,50
0515: The Primary Project - Facilities and Related 74,023 56,76
1020: Foundation Aid IPP 105,857 Technology 100 10
1038: Foundation Aid MA 138,961 Miscellaneous Services 1,100 50
1045: Foundation Aid CR 35,933 Other Variable Expenses 600 20
1323: School Redesign - Total, All Objects 4,060,697 3,675,95
1416: Primary Project 18,316
4020: Green Schools Program -
4501: C4E - Class Size 250,840 Average Daily Attendance pct:
4515: C4E - Extended Day Program 24,357 Special Population Units Count wt. Un
4517: C4E - Great Beginnings 37,790 Mobility (applies over 40%)
4527: C4E - Reading First Local Supp 26,782 Free/Reduced Lunch
4528: C4E - In-School Suspension 66,275 At Risk
Special Education
Gifted &Talented
Career & Technical Education
English Language Learners
Total, Special Population Units
Total, Refined Units
Total $ 3,675,955 Basic Allocation
Science Social Studies
GRADE 2007 2008* 2007 2008* 2007 2008* 2007 2008*
1 59.1% 50.0% 40.0% 32.9%
2 60.0% 40.4% 36.0% 42.2%
3 37.8% 62.1% 51.9% 81.6%
4 48.3% 44.3% 55.7% 57.7% 78.3% 73.6%
5 45.2% 57.8% 40.3% 65.6% 73.3% 87.9%
6 39.5% 50.8% 37.2% 62.5%
Students at Risk* 50.2% 49.7% 56.5% 44.0% (Percentages of students in all grades not meeting proficiency)
*Official New York State Education Department statistics for 2007-08 have not yet been released. These numbers are the best District estimate.
Mission: Provide student-centered learning experiences through: research-based instruction; promoting a safe learning environment;
increasing parent participation and community support; increasing collaborative efforts in learning; and, using reflective practices fo
continuous improvement of teaching and learning.
Fiscal Year 2010-11 Allocation Weighting Factors
Budget Allocations by Account
ELA MathStudent Achievement (percentage of students attaining proficiency)*
Student Demographic DataPosition Information (FTEs)
Section 4 Page 44
School Profiles and Budgets 2009-10 Draft Budget
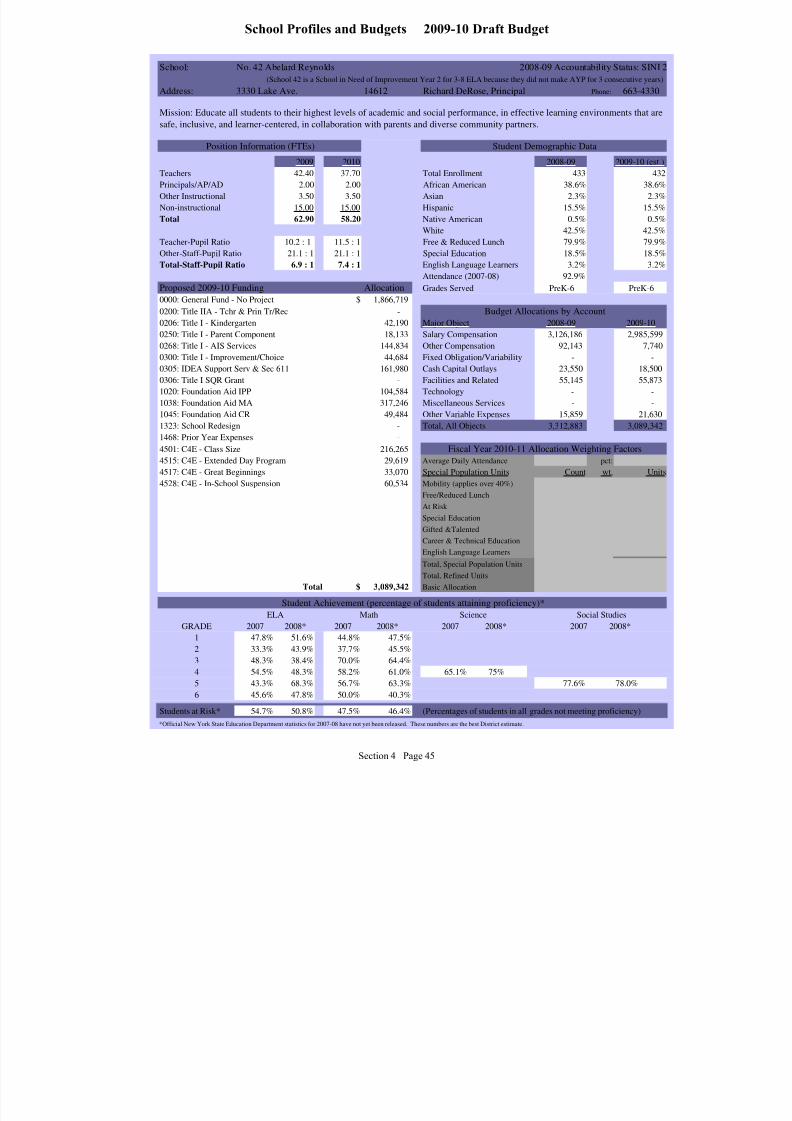
8/7/2019 2009_2010DRAFT
http://slidepdf.com/reader/full/20092010draft 107/268
School: No. 42 Abelard Reynolds 2008-09 Accountability Status: SINI
(School 42 is a School in Need of Improvement Year 2 for 3-8 ELA because they did not make AYP for 3 consecutive years
Address: 3330 Lake Ave. 14612 Richard DeRose, Principal Phone: 663-4330
2009 2010 2008-09 2009-10 (est.
Teachers 42.40 37.70 Total Enrollment 433 432
Principals/AP/AD 2.00 2.00 African American 38.6% 38.6%
Other Instructional 3.50 3.50 Asian 2.3% 2.3%
Non-instructional 15.00 15.00 Hispanic 15.5% 15.5%
Total 62.90 58.20 Native American 0.5% 0.5%
White 42.5% 42.5%
Teacher-Pupil Ratio 10.2 : 1 11.5 : 1 Free & Reduced Lunch 79.9% 79.9%
Other-Staff-Pupil Ratio 21.1 : 1 21.1 : 1 Special Education 18.5% 18.5%
Total-Staff-Pupil Ratio 6.9 : 1 7.4 : 1 English Language Learners 3.2% 3.2%
Attendance (2007-08) 92.9%
Proposed 2009-10 Funding Allocation Grades Served PreK-6 PreK-6
0000: General Fund - No Project $ 1,866,719 0200: Title IIA - Tchr & Prin Tr/Rec -
0206: Title I - Kindergarten 42,190 Major Object 2008-09 2009-10
0250: Title I - Parent Component 18,133 Salary Compensation 3,126,186 2,985,599
0268: Title I - AIS Services 144,834 Other Compensation 92,143 7,740
0300: Title I - Improvement/Choice 44,684 Fixed Obligation/Variability - -
0305: IDEA Support Serv & Sec 611 161,980 Cash Capital Outlays 23,550 18,500
0306: Title I SQR Grant - Facilities and Related 55,145 55,873
1020: Foundation Aid IPP 104,584 Technology - -
1038: Foundation Aid MA 317,246 Miscellaneous Services - -
1045: Foundation Aid CR 49,484 Other Variable Expenses 15,859 21,630
1323: School Redesign - Total, All Objects 3,312,883 3,089,342
1468: Prior Year Expenses -
4501: C4E - Class Size 216,265
4515: C4E - Extended Day Program 29,619 Average Daily Attendance pct:
4517: C4E - Great Beginnings 33,070 Special Population Units Count wt. Unit
4528: C4E - In-School Suspension 60,534 Mobility (applies over 40%)
Free/Reduced Lunch
At Risk
Special Education
Gifted &Talented
Career & Technical Education
English Language Learners
Total, Special Population Units
Total, Refined Units
Total $ 3,089,342 Basic Allocation
Science Social Studies
GRADE 2007 2008* 2007 2008* 2007 2008* 2007 2008*
1 47.8% 51.6% 44.8% 47.5%
2 33.3% 43.9% 37.7% 45.5%
3 48.3% 38.4% 70.0% 64.4%
4 54.5% 48.3% 58.2% 61.0% 65.1% 75%
5 43.3% 68.3% 56.7% 63.3% 77.6% 78.0%
6 45.6% 47.8% 50.0% 40.3%
Students at Risk* 54.7% 50.8% 47.5% 46.4% (Percentages of students in all grades not meeting proficiency)
*Official New York State Education Department statistics for 2007-08 have not yet been released. These numbers are the best District estimate.
Mission: Educate all students to their highest levels of academic and social performance, in effective learning environments that are
safe, inclusive, and learner-centered, in collaboration with parents and diverse community partners.
Fiscal Year 2010-11 Allocation Weighting Factors
Budget Allocations by Account
ELA MathStudent Achievement (percentage of students attaining proficiency)*
Student Demographic DataPosition Information (FTEs)
Section 4 Page 45
School Profiles and Budgets 2009-10 Draft Budget

8/7/2019 2009_2010DRAFT
http://slidepdf.com/reader/full/20092010draft 108/268
School: No. 43 Theodore Roosevelt 2008-09 Accountability Status: G
(School 43 is in good standing for the 2008-09 Accountability Yea
Address: 1305 Lyell Ave. 14606 Anne McAndrew, Principal Phone: 458-4200
2009 2010 2008-09 2009-10 (est
Teachers 47.50 43.80 Total Enrollment 584 57
Principals/AP/AD 2.00 2.00 African American 56.0% 56.0
Other Instructional 3.10 3.10 Asian 1.5% 1.5
Non-instructional 11.60 10.60 Hispanic 17.5% 17.5
Total 64.20 59.50 Native American 0.3% 0.3
White 23.3% 23.3
Teacher-Pupil Ratio 12.3 : 1 13.2 : 1 Free & Reduced Lunch 87.0% 87.0
Other-Staff-Pupil Ratio 35 : 1 36.7 : 1 Special Education 9.8% 9.8
Total-Staff-Pupil Ratio 9.1 : 1 9.7 : 1 English Language Learners 3.6% 3.6
Attendance (2007-08) 92.4%
Proposed 2009-10 Funding Allocation Grades Served K-6 K-6
0000: General Fund - No Project $ 2,048,899 0200: Title IIA - Tchr & Prin Tr/Rec -
0206: Title I - Kindergarten 93,159 Major Object 2008-09 2009-10
0250: Title I - Parent Component 27,089 Salary Compensation 3,369,275 3,197,12
0268: Title I - AIS Services 141,992 Other Compensation 67,280 5,00
0305: IDEA Support Serv & Sec 611 100,289 Fixed Obligation/Variability - -
0513: The Primary Project 14,382 Cash Capital Outlays 22,240 13,84
1020: Foundation Aid IPP 101,344 Facilities and Related 61,996 45,48
1038: Foundation Aid MA 306,144 Technology 2,000 2,00
1045: Foundation Aid CR 43,228 Miscellaneous Services 560 56
1323: School Redesign - Other Variable Expenses 5,000 10,17
1416: Primary Project 19,822 Total, All Objects 3,528,351 3,274,18
1910: Drop-Out Prevention 45,910
4020: Green Schools Program -
4501: C4E - Class Size 218,516 Average Daily Attendance pct:
4515: C4E - Extended Day Program 24,610 Special Population Units Count wt. Un
4517: C4E - Great Beginnings 37,790 Mobility (applies over 40%)
4518: C4E - On Campus Intervention P 51,009 Free/Reduced Lunch
At Risk
Special Education
Gifted &Talented
Career & Technical Education
English Language Learners
Total, Special Population Units
Total, Refined Units
Total $ 3,274,183 Basic Allocation
Science Social Studies
GRADE 2007 2008* 2007 2008* 2007 2008* 2007 2008*
1 46.8% 54.9% 42.6% 41.5%
2 47.9% 43.8% 38.0% 37.1%
3 39.5% 36.9% 62.5% 81.3%
4 50.6% 45.0% 57.1% 76.3% 81.8% 89.9%
5 60.9% 71.0% 44.9% 67.6% 86.3% 94.2%
6 67.5% 80.6% 57.5% 79.4%
Students at Risk* 48.0% 45.5% 49.5% 38.3% (Percentages of students in all grades not meeting proficiency)
*Official New York State Education Department statistics for 2007-08 have not yet been released. These numbers are the best District estimate.
Mission: Strive to provide each student with an education that will enable him/her to experience success. We are committed to
provide a safe, respectful, and supportive school environment that promotes self-discipline, motivation, responsibility, and excellenc
in learning, using research-based strategies to create a stimulating learning environment for our students.
Fiscal Year 2010-11 Allocation Weighting Factors
Budget Allocations by Account
ELA MathStudent Achievement (percentage of students attaining proficiency)*
Student Demographic DataPosition Information (FTEs)
Section 4 Page 46
School Profiles and Budgets 2009-10 Draft Budget
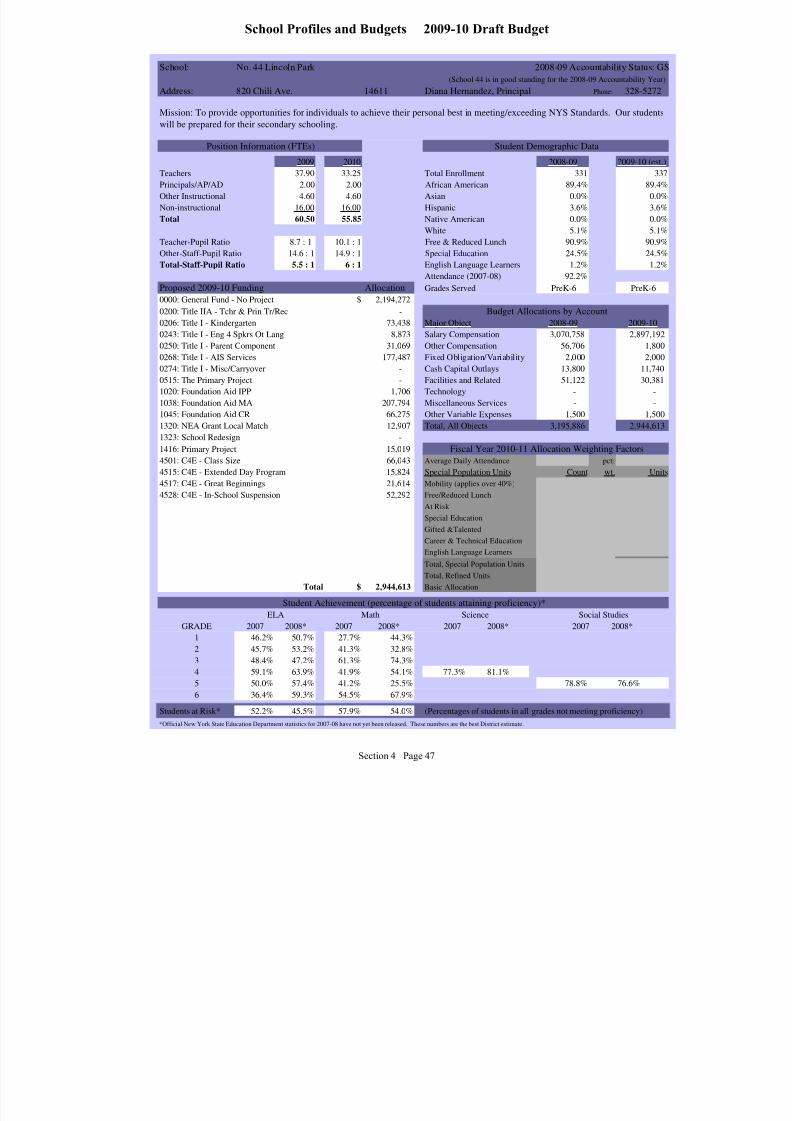
8/7/2019 2009_2010DRAFT
http://slidepdf.com/reader/full/20092010draft 109/268
School: No. 44 Lincoln Park 2008-09 Accountability Status: G
(School 44 is in good standing for the 2008-09 Accountability Year
Address: 820 Chili Ave. 14611 Diana Hernandez, Principal Phone: 328-5272
2009 2010 2008-09 2009-10 (est
Teachers 37.90 33.25 Total Enrollment 331 33
Principals/AP/AD 2.00 2.00 African American 89.4% 89.4%
Other Instructional 4.60 4.60 Asian 0.0% 0.0%
Non-instructional 16.00 16.00 Hispanic 3.6% 3.6%
Total 60.50 55.85 Native American 0.0% 0.0%
White 5.1% 5.1%
Teacher-Pupil Ratio 8.7 : 1 10.1 : 1 Free & Reduced Lunch 90.9% 90.9%
Other-Staff-Pupil Ratio 14.6 : 1 14.9 : 1 Special Education 24.5% 24.5%
Total-Staff-Pupil Ratio 5.5 : 1 6 : 1 English Language Learners 1.2% 1.2%
Attendance (2007-08) 92.2%
Proposed 2009-10 Funding Allocation Grades Served PreK-6 PreK-6
0000: General Fund - No Project $ 2,194,272 0200: Title IIA - Tchr & Prin Tr/Rec -
0206: Title I - Kindergarten 73,438 Major Object 2008-09 2009-10
0243: Title I - Eng 4 Spkrs Ot Lang 8,873 Salary Compensation 3,070,758 2,897,192
0250: Title I - Parent Component 31,069 Other Compensation 56,706 1,800
0268: Title I - AIS Services 177,487 Fixed Obligation/Variability 2,000 2,000
0274: Title I - Misc/Carryover - Cash Capital Outlays 13,800 11,740
0515: The Primary Project - Facilities and Related 51,122 30,381
1020: Foundation Aid IPP 1,706 Technology - -
1038: Foundation Aid MA 207,794 Miscellaneous Services - -
1045: Foundation Aid CR 66,275 Other Variable Expenses 1,500 1,500
1320: NEA Grant Local Match 12,907 Total, All Objects 3,195,886 2,944,613
1323: School Redesign -
1416: Primary Project 15,019
4501: C4E - Class Size 66,043 Average Daily Attendance pct:
4515: C4E - Extended Day Program 15,824 Special Population Units Count wt. Uni
4517: C4E - Great Beginnings 21,614 Mobility (applies over 40%)
4528: C4E - In-School Suspension 52,292 Free/Reduced Lunch
At Risk
Special Education
Gifted &Talented
Career & Technical Education
English Language Learners
Total, Special Population Units
Total, Refined Units
Total $ 2,944,613 Basic Allocation
Science Social Studies
GRADE 2007 2008* 2007 2008* 2007 2008* 2007 2008*
1 46.2% 50.7% 27.7% 44.3%
2 45.7% 53.2% 41.3% 32.8%
3 48.4% 47.2% 61.3% 74.3%
4 59.1% 63.9% 41.9% 54.1% 77.3% 81.1%
5 50.0% 57.4% 41.2% 25.5% 78.8% 76.6%
6 36.4% 59.3% 54.5% 67.9%
Students at Risk* 52.2% 45.5% 57.9% 54.0% (Percentages of students in all grades not meeting proficiency)
*Official New York State Education Department statistics for 2007-08 have not yet been released. These numbers are the best District estimate.
Mission: To provide opportunities for individuals to achieve their personal best in meeting/exceeding NYS Standards. Our students
will be prepared for their secondary schooling.
Fiscal Year 2010-11 Allocation Weighting Factors
Budget Allocations by Account
ELA MathStudent Achievement (percentage of students attaining proficiency)*
Student Demographic DataPosition Information (FTEs)
Section 4 Page 47
School Profiles and Budgets 2009-10 Draft Budget

8/7/2019 2009_2010DRAFT
http://slidepdf.com/reader/full/20092010draft 110/268
School: No. 54 The Flower City School 2008-09 Accountability Status: G
(School 54 is in good standing for the 2008-09 Accountability Year
Address: 311 Flower City Pk. 14615 Lessie Hamilton-Rose, Principal Phone: 254-2080
2009 2010 2008-09 2009-10 (est.
Teachers 26.80 25.90 Total Enrollment 288 297
Principals/AP/AD 1.00 1.00 African American 77.4% 77.4%
Other Instructional 1.80 1.80 Asian 0.7% 0.7%
Non-instructional 7.00 7.00 Hispanic 12.5% 12.5%
Total 36.60 35.70 Native American 0.3% 0.3%
White 6.3% 6.3%
Teacher-Pupil Ratio 10.7 : 1 11.5 : 1 Free & Reduced Lunch 91.3% 91.3%
Other-Staff-Pupil Ratio 29.4 : 1 30.3 : 1 Special Education 13.9% 13.9%
Total-Staff-Pupil Ratio 7.9 : 1 8.3 : 1 English Language Learners 1.4% 1.4%
Attendance (2007-08) 93.0%
Proposed 2009-10 Funding Allocation Grades Served K-6 K-6
0000: General Fund - No Project $ 1,474,107 0200: Title IIA - Tchr & Prin Tr/Rec -
0206: Title I - Kindergarten 52,300 Major Object 2008-09 2009-10
0250: Title I - Parent Component 31,069 Salary Compensation 1,843,626 1,854,930
0268: Title I - AIS Services 107,127 Other Compensation 80,473 4,000
0453: Safe Schools/Healthy Stdnts I 7,000 Fixed Obligation/Variability - -
1020: Foundation Aid IPP 93,422 Cash Capital Outlays 17,700 16,200
1038: Foundation Aid MA 9,447 Facilities and Related 49,212 32,957
1045: Foundation Aid CR 44,934 Technology 300 300
1323: School Redesign - Miscellaneous Services - -
4515: C4E - Extended Day Program 20,356 Other Variable Expenses 6,384 3,100
4517: C4E - Great Beginnings 18,160 Total, All Objects 1,997,695 1,911,487
4528: C4E - In-School Suspension 53,565
Average Daily Attendance pct:
Special Population Units Count wt. Unit
Mobility (applies over 40%)
Free/Reduced Lunch
At Risk
Special Education
Gifted &Talented
Career & Technical Education
English Language Learners
Total, Special Population Units
Total, Refined Units
Total $ 1,911,487 Basic Allocation
Science Social Studies
GRADE 2007 2008* 2007 2008* 2007 2008* 2007 2008*
1 50.0% 51.1% 25.0% 53.3%
2 N/A 39.5% N/A 41.9%
3 51.4% 30.2% 57.9% 67.4%
4 60.0% 60.7% 35.9% 82.1% 84.6% 100%
5 45.0% 51.6% 30.0% 51.6% 95.0% 84.4%
6 60.5% 76.2% 23.3% 70.0%
Students at Risk* 45.5% 51.7% 65.6% 41.0% (Percentages of students in all grades not meeting proficiency)
*Official New York State Education Department statistics for 2007-08 have not yet been released. These numbers are the best District estimate.
Mission: Support and strengthen the mission and vision of the school so that our students will have the necessary skills, experiences
and techniques to achieve at the highest levels of performance. Create and support learning environments that are safe, inclusive,
differentiated, and student-centered in collaboration with parents and community partners.
Fiscal Year 2010-11 Allocation Weighting Factors
Budget Allocations by Account
ELA MathStudent Achievement (percentage of students attaining proficiency)*
Student Demographic DataPosition Information (FTEs)
Section 4 Page 48
School Profiles and Budgets 2009-10 Draft Budget

8/7/2019 2009_2010DRAFT
http://slidepdf.com/reader/full/20092010draft 111/268
School: No. 57 Early Childhood School of Rochester 2008-09 Accountability Status: GS
(School 57 is in good standing for the 2008-09 Accountability Year
Address: 15 Costar St. 14608 Cheryl Moss, Principal Phone: 277-0190
2009 2010 2008-09 2009-10 (est.
Teachers 20.30 20.10 Total Enrollment 157 170
Principals/AP/AD 1.00 1.00 African American 67.5% 67.5%
Other Instructional 2.10 1.70 Asian 0.6% 0.6%
Non-instructional 9.50 9.50 Hispanic 16.6% 16.6%
Total 32.90 32.30 Native American 0.0% 0.0%
White 14.0% 14.0%
Teacher-Pupil Ratio 7.7 : 1 8.5 : 1 Free & Reduced Lunch 91.7% 91.7%
Other-Staff-Pupil Ratio 12.5 : 1 13.9 : 1 Special Education 17.2% 17.2%
Total-Staff-Pupil Ratio 4.8 : 1 5.3 : 1 English Language Learners 1.9% 1.9%
Attendance (2007-08) 92.6%
Proposed 2009-10 Funding Allocation Grades Served PreK-2 PreK-2
0000: General Fund - No Project $ 1,129,067 0206: Title I - Kindergarten 75,669
0250: Title I - Parent Component 32,104 Major Object 2008-09 2009-10
0268: Title I - AIS Services 132,022 Salary Compensation 1,713,905 1,716,413
0453: Safe Schools/Healthy Stdnts I 5,819 Other Compensation 29,955 18,315
1020: Foundation Aid IPP - Fixed Obligation/Variability 2,500 2,500
1038: Foundation Aid MA 71,488 Cash Capital Outlays 19,833 6,000
1045: Foundation Aid CR 60,273 Facilities and Related 35,577 40,553
1468: Prior Year Expenses - Technology 100 100
4501: C4E - Class Size 163,541 Miscellaneous Services 1,869 1,500
4515: C4E - Extended Day Program 12,515 Other Variable Expenses 6,050 3,502
4517: C4E - Great Beginnings 45,689 Total, All Objects 1,809,789 1,788,883
4528: C4E - In-School Suspension 60,696
Average Daily Attendance pct:
Special Population Units Count wt. Unit
Mobility (applies over 40%)
Free/Reduced Lunch
At Risk
Special Education
Gifted &Talented
Career & Technical Education
English Language Learners
Total, Special Population Units
Total, Refined Units
Total $ 1,788,883 Basic Allocation
Science Social Studies
GRADE 2007 2008* 2007 2008* 2007 2008* 2007 2008*
1 49.2% 59.6% 49.2% 63.8%
2 53.0% 47.5% 42.4% 49.2%
3 N/A N/A N/A N/A
4 N/A N/A N/A N/A N/A
5 N/A N/A N/A N/A N/A N/A
6 N/A N/A N/A N/A
Students at Risk* 48.8% 47.2% 54.3% 44.3% (Percentages of students in all grades not meeting proficiency)
*Official New York State Education Department statistics for 2007-08 have not yet been released. These numbers are the best District estimate.
Mission: Provide a safe, nurturing, and child-centered environment where teaching and learning are valued by all – “Small Steps
Today, Giant Leaps Tomorrow.”
Fiscal Year 2010-11 Allocation Weighting Factors
Budget Allocations by Account
ELA MathStudent Achievement (percentage of students attaining proficiency)*
Student Demographic DataPosition Information (FTEs)
Section 4 Page 49
School Profiles and Budgets 2009-10 Draft Budget

8/7/2019 2009_2010DRAFT
http://slidepdf.com/reader/full/20092010draft 112/268
School: Charlotte High School 2008-09 Accountability Status: SINI 5-Y
(Charlotte is a School Restructuring (SINI 5) Year 5 for 3-8 ELA because they did not make AYP for over six consecutive y
Address: 4115 Lake Ave. 14612 Jeff Mikols, Principal Phone: 663-707
2009 2010 2008-09 2009-10(e
Teachers 96.90 86.75 Total Enrollment 1,053 1,
Principals/AP/AD 7.00 7.00 African American 61.9% 61
Other Instructional 20.60 20.00 Asian 1.9% 1
Non-instructional 35.00 35.00 Hispanic 19.9% 19
Total, Staff 159.50 148.75 Native American 0.2% 0
White 16.0% 16
Teacher-Pupil Ratio 10.9 : 1 12.1 : 1 Free & Reduced Lunch 82.1% 82
Other-Staff-Pupil Ratio 16.8 : 1 17 : 1 Special Education 21.4% 21
Total-Staff-Pupil Ratio 6.6 : 1 7.1 : 1 English Language Learners 3.8% 3
Attendance (2007-08) 87.9%
Proposed 2009-10 Funding Allocation Grades Served 7-12 7-12
0000: General Fund - No Project $ 6,961,594
0200: Title IIA - Tchr & Prin Tr/Rec 47,651
0243: Title I - Eng 4 Spkrs Ot Lang 17,746 Major Object 2008-09 2009-1
0250: Title I - Parent Component 21,401 Salary Compensation 7,680,842 7,532,
0268: Title I - AIS Services 35,819 Other Compensation 319,742 17,9
0274: Title I - Misc/Carryover 44,365 Fixed Obligation/Variability 3,000 3,0
0300: Title I - Improvement/Choice 35,766 Cash Capital Outlays 55,862 47,0
0700: Virtual Enterprise Membership 400 Facilities and Related 119,128 116,8
0703: Health Care Apprenticeship 8,000 Technology 3,415 4
0707: Perkins Secondary - Miscellaneous Services 4,055 7,0
1020: Foundation Aid IPP 155,574 Other Variable Expenses 8,821 3,2
1038: Foundation Aid MA 42,826 Total, All Objects 8,194,865 7,727,7
1045: Foundation Aid CR 132,123
1122: School Special Projects 8,750
1300: Extracurricular Activities - Average Daily Attendance pct:
1357: Student & Family Support Ctr 26,782 Special Population Units Count wt. U
1468: Prior Year Expenses - Mobility (applies over 40%)
1910: Drop-Out Prevention 21,426 Free/Reduced Lunch
4020: Green Schools Program - At Risk
4512: C4E - AVID Program 44,934 Special Education
4515: C4E - Extended Day Program 65,900 Gifted & Talented
4528: C4E - In-School Suspension 56,644 Career & Technical Education
English Language Learners
Total, Special Population Units
Total, Refined Units
Total $ 7,727,701 Basic Allocation
Science Social Studies
GRADE 2007 2008* 2007 2008* 2007 2008* 2007 2008*
7 24.7% 30.5% 18.9% 44.5%
8 N/A 25.8% 14.9% 33.8% 16.7% 36.7% 9.3% 25.9%
Physical Setting/Earth Science
NYS Regents* 61.6% 83.6% 69.8% 69.8% 40.2% 85.5% 26.5% 44
Graduation 2007-08* 50.0% 58.9% 74
Students at Risk* 61.7% 59.8% 74.0% 52.4% (Percentages of students in all grades not meeting proficiency)
*Official New York State Education Department statistics for 2007-08 have not yet been released. These numbers are the best District estimate.
U.S. History and Government
English Mathematics
Student Demographic DataPosition Information (FTEs)
Mission: Develop students who have the skills for continuous learning and for becoming successful, contributing citizens in a
multicultural society. We will accomplish this by providing a student-centered program, dedicated staff and a secure nurturing
environment with high expectations.
Global History and Geography
Budget Allocations by Account
ELA Math
Student Achievement (percentage of students attaining proficiency)*
Fiscal Year 2010-11 Allocation Weighting Factors
Section 4 Page 50
School Profiles and Budgets 2009-10 Draft Budget

8/7/2019 2009_2010DRAFT
http://slidepdf.com/reader/full/20092010draft 113/268
School: John Marshall High School 2008-09 Accountability Status: SINI 5-Y
(Marshall is a School Restructuring (SINI 5) Year 3 for HS ELA because they did not make AYP over six consecutive ye
Address: 180 Ridgeway Ave. 14615 Richard Smith, Principal Phone: 458-211
2009 2010 2008-09 2009-10(e
Teachers 104.20 100.85 Total Enrollment 1,247 1,2
Principals/AP/AD 7.00 7.00 African American 79.7% 79.
Other Instructional 17.00 16.00 Asian 0.2% 0.
Non-instructional 49.57 49.57 Hispanic 12.3% 12.
Total, Staff 177.77 173.42 Native American 0.6% 0.
White 7.0% 7.
Teacher-Pupil Ratio 12 : 1 12.2 : 1 Free & Reduced Lunch 79.6% 79.
Other-Staff-Pupil Ratio 16.9 : 1 16.9 : 1 Special Education 18.5% 18.
Total-Staff-Pupil Ratio 7 : 1 7.1 : 1 English Language Learners 1.6% 1.
Attendance (2007-08) 82.8%
Proposed 2009-10 Funding Allocation Grades Served 7-12 7-12
0000: General Fund - No Project $ 7,929,355
0137: GRHF Water Marshall -
0200: Title IIA - Tchr & Prin Tr/Rec 27,099 Major Object 2008-09 2009-10
0243: Title I - Eng 4 Spkrs Ot Lang - Salary Compensation 8,686,613 8,802,2
0250: Title I - Parent Component 47,010 Other Compensation 373,291 10,0
0268: Title I - AIS Services 103,832 Fixed Obligation/Variability 10,529 4,5
0300: Title I - Improvement/Choice 44,924 Cash Capital Outlays 43,000 30,7
0305: IDEA Support Serv & Sec 611 71,488 Facilities and Related 150,082 177,7
0700: Virtual Enterprise Membership 250 Technology 1,900 1,5
0703: Health Care Apprenticeship 16,000 Miscellaneous Services 15,000 14,0
0707: Perkins Secondary - Other Variable Expenses 816 3,0
0734: Law Prep Summer Internship @ M - Total, All Objects 9,281,231 9,043,7
0739: LAW ENFORCEMENT PROG @ MARSHAL -
0747: GARDEN PLOTS @ Marshall -
1010: Foundation Aid TS 161,947 Average Daily Attendance pct:
1020: Foundation Aid IPP 177,461 Special Population Units Count wt. U
1038: Foundation Aid MA 60,369 Mobility (applies over 40%)
1045: Foundation Aid CR 121,247 Free/Reduced Lunch
1300: Extracurricular Activities - At Risk
1357: Student & Family Support Ctr 44,365 Special Education
1910: Drop-Out Prevention 29,058 Gifted & Talented
4020: Green Schools Program - Career & Technical Education
4512: C4E - AVID Program 53,565 English Language Learners
4515: C4E - Extended Day Program 88,075 Total, Special Population Units
4528: C4E - In-School Suspension 67,747 Total, Refined Units
Total $ 9,043,792 Basic Allocation
Science Social Studies
GRADE 2007 2008* 2007 2008* 2007 2008* 2007 2008*
7 23.8% 32.8% 12.7% 44.0%
8 25.2% 20.9% 29.6% 35.2% 28.2% 32% 9.8% 15.8%
Physical Setting/Earth Science
NYS Regents* 57.8% 79.8% 69.3% 60.8% 31.3% 86.5% 46.6% 56.
Graduation 2007-08* 59.0% 59.8% 66.
Students at Risk* 65.7% 62.7% 62.2% 52.5% (Percentages of students in all grades not meeting proficiency)
*Official New York State Education Department statistics for 2007-08 have not yet been released. These numbers are the best District estimate.
Mission: Facilitate a steady, progressive growth in the number of our students meeting New York State standards in each of the five
academic areas, resulting in a 90% success rate by the fifth year, by analysis of performance data, a prescribed instructional program
utilizing successful strategies, and a staff committed to the process and strategies that we have embraced.
Global History and Geography
Budget Allocations by Account
ELA Math
Student Achievement (percentage of students attaining proficiency)*
Fiscal Year 2010-11 Allocation Weighting Factors
U.S. History and Government
English Mathematics
Student Demographic DataPosition Information (FTEs)
Section 4 Page 51
School Profiles and Budgets 2009-10 Draft Budget

8/7/2019 2009_2010DRAFT
http://slidepdf.com/reader/full/20092010draft 114/268
School: School of Business, Finance & Entrepreneurship at Edison 2008-09 Accountability Status: SIN
(Business Finance is a School in Need of Improvement Year 1 for HS ELA because they did not make AYP for 2 consecutive yea
Address: 655 Colfax St. 14606 Joseph T. Baldino, Principal Phone: 324-978
2009 2010 2008-09 2009-10(es
Teachers 36.90 33.65 Total Enrollment 310 3
Principals/AP/AD 19.75 19.50 African American 75.5% 75.5
Other Instructional 7.35 6.50 Asian 0.6% 0.6
Non-instructional 3.25 3.25 Hispanic 18.7% 18.7
Total, Staff 67.25 62.90 Native American 0.0% 0.0
White 5.2% 5.2
Teacher-Pupil Ratio 8.4 : 1 9.7 : 1 Free & Reduced Lunch 68.4% 68.4
Other-Staff-Pupil Ratio 10.2 : 1 11.1 : 1 Special Education 23.2% 23.2
Total-Staff-Pupil Ratio 4.6 : 1 5.2 : 1 English Language Learners 1.6% 1.6
Attendance (2007-08) 83.9%
Proposed 2009-10 Funding Allocation Grades Served 10-12 10-12
0000: General Fund - No Project $ 2,859,663
0200: Title IIA - Tchr & Prin Tr/Rec -
0250: Title I - Parent Component 10,489 Major Object 2008-09 2009-10
0268: Title I - AIS Services 148,490 Salary Compensation 3,414,976 3,329,47
0453: Safe Schools/Healthy Stdnts I 10,807 Other Compensation 112,393 4,19
0700: Virtual Enterprise Membership 400 Fixed Obligation/Variability 2,000 1,00
1020: Foundation Aid IPP 107,130 Cash Capital Outlays 14,951 8,00
1038: Foundation Aid MA 60,575 Facilities and Related 13,216 30,80
1045: Foundation Aid CR 46,289 Technology - -
1300: Extracurricular Activities - Miscellaneous Services 8,523 1,10
1357: Student & Family Support Ctr 15,586 Other Variable Expenses 6,626 6,00
1910: Drop-Out Prevention 24,213 Total, All Objects 3,572,685 3,380,57
4020: Green Schools Program -
4515: C4E - Extended Day Program 22,594
4528: C4E - In-School Suspension 74,337 Average Daily Attendance pct:
Special Population Units Count wt. Un
Mobility (applies over 40%)
Free/Reduced Lunch
At Risk
Special Education
Gifted & Talented
Career & Technical Education
English Language Learners
Total, Special Population Units
Total, Refined Units
Total $ 3,380,573 Basic Allocation
Science Social Studies
GRADE 2007 2008* 2007 2008* 2007 2008* 2007 2008*
7 N/A N/A N/A N/A
8 N/A N/A N/A N/A N/A N/A N/A
Physical Setting/Earth Science
NYS Regents* 50.4% 54.3% 71.6% 51.2% 39.2% 88.9% 21.8% 57.8
Graduation 2007-08* 37.0% 57.5% 82.2
Students at Risk* 49.6% 45.7% 28.4% 48.8% (Percentages of students in all grades not meeting proficiency)
*Official New York State Education Department statistics for 2007-08 have not yet been released. These numbers are the best District estimate.
U.S. History and Government
English Mathematics
Student Demographic DataPosition Information (FTEs)
Mission: Create an empowering environment where students develop skills, knowledge and values for a changing world based on: a
standards-based curriculum; collaboration among students, staff, parents and community; a school culture promoting diversity,
tolerance, empathy, and community; and, challenging and team-oriented leadership opportunities.
Global History and Geography
Budget Allocations by Account
ELA Math
Student Achievement (percentage of students attaining proficiency)*
Fiscal Year 2010-11 Allocation Weighting Factors
Section 4 Page 52
School Profiles and Budgets 2009-10 Draft Budget

8/7/2019 2009_2010DRAFT
http://slidepdf.com/reader/full/20092010draft 115/268
School: School of Engineering & Manufacturing at Edison 2008-09 Accountability Status: SINI
(Engineering is a School in Need of Improvement Year 2 for HS ELA & HS Math because they did not make AYP for 3 consecutive years in each are
Address: 655 Colfax St. 14606 Linda Kantor, Principal Phone: 324-9782
2009 2010 2008-09 2009-10(es
Teachers 37.50 35.45 Total Enrollment 343 3
Principals/AP/AD 3.25 3.25 African American 72.9% 72.9
Other Instructional 7.35 6.90 Asian 0.6% 0.6
Non-instructional 13.75 13.00 Hispanic 18.4% 18.4
Total, Staff 61.85 58.60 Native American 0.3% 0.3
White 7.6% 7.6
Teacher-Pupil Ratio 9.1 : 1 9 : 1 Free & Reduced Lunch 73.2% 73.2
Other-Staff-Pupil Ratio 14.1 : 1 13.8 : 1 Special Education 26.2% 26.2
Total-Staff-Pupil Ratio 5.5 : 1 5.5 : 1 English Language Learners 3.2% 3.2
Attendance (2007-08) 81.2%
Proposed 2009-10 Funding Allocation Grades Served 10-12 10-12
0000: General Fund - No Project $ 2,918,987
0200: Title IIA - Tchr & Prin Tr/Rec -
0243: Title I - Eng 4 Spkrs Ot Lang 22,183 Major Object 2008-09 2009-10
0250: Title I - Parent Component 11,515 Salary Compensation 3,406,716 3,403,85
0268: Title I - AIS Services 84,627 Other Compensation 95,395 8,62
0274: Title I - Misc/Carryover 22,183 Fixed Obligation/Variability 300 3,60
0300: Title I - Improvement/Choice 41,737 Cash Capital Outlays 37,725 11,00
0305: IDEA Support Serv & Sec 611 35,608 Facilities and Related 31,567 41,48
0453: Safe Schools/Healthy Stdnts I 10,807 Technology 7,284 -
0707: Perkins Secondary - Miscellaneous Services 250 30
0755: SURR Grant - Other Variable Expenses 20,547 9,34
1020: Foundation Aid IPP 100,803 Total, All Objects 3,599,784 3,478,20
1038: Foundation Aid MA -
1045: Foundation Aid CR 67,451
1300: Extracurricular Activities - Average Daily Attendance pct:
1357: Student & Family Support Ctr 15,586 Special Population Units Count wt. Un
1910: Drop-Out Prevention 24,938 Mobility (applies over 40%)
4020: Green Schools Program - Free/Reduced Lunch
4512: C4E - AVID Program 46,071 At Risk
4515: C4E - Extended Day Program 19,068 Special Education
4518: C4E - On Campus Intervention P 56,644 Gifted & Talented
Career & Technical Education
English Language Learners
Total, Special Population Units
Total, Refined Units
Total $ 3,478,208 Basic Allocation
Science Social Studies
GRADE 2007 2008* 2007 2008* 2007 2008* 2007 2008*
7 N/A N/A N/A N/A
8 N/A N/A N/A N/A N/A N/A N/A
Physical Setting/Earth Science
NYS Regents* 36.8% 50.0% 54.5% 46.0% 31.4% 61.5% 31.6% 40.3
Graduation 2007-08* 34.0% 70.1% 74.5
Students at Risk* 63.2% 50.0% 45.5% 54.0% (Percentages of students in all grades not meeting proficiency)
*Official New York State Education Department statistics for 2007-08 have not yet been released. These numbers are the best District estimate.
Mission: “Engineering the Future.” Our mission is to prepare students for entry-level jobs in engineering and manufacturing, as we
as further study at the college level.
Global History and Geography
Budget Allocations by Account
ELA Math
Student Achievement (percentage of students attaining proficiency)*
Fiscal Year 2010-11 Allocation Weighting Factors
U.S. History and Government
English Mathematics
Student Demographic DataPosition Information (FTEs)
Section 4 Page 53
School Profiles and Budgets 2009-10 Draft Budget

8/7/2019 2009_2010DRAFT
http://slidepdf.com/reader/full/20092010draft 116/268
School: School of Applied Technology at Edison 2008-09 Accountability Status: SINI
(Applied Technology is a School in Need of Improvement Year 1 for HS ELA because they did not make AYP for 2 consecutive year
Address: 655 Colfax St. 14606 Matthew Laniak, Principal Phone: 324-9783
2009 2010 2008-09 2009-10(est
Teachers 41.30 38.90 Total Enrollment 391 39
Principals/AP/AD 3.25 3.25 African American 66.0% 66.0%
Other Instructional 9.45 9.00 Asian 1.5% 1.5%
Non-instructional 14.75 14.00 Hispanic 23.8% 23.8%
Total, Staff 68.75 65.15 Native American 0.3% 0.3%
White 7.4% 7.4%
Teacher-Pupil Ratio 9.5 : 1 10.1 : 1 Free & Reduced Lunch 75.2% 75.2%
Other-Staff-Pupil Ratio 14.2 : 1 14.9 : 1 Special Education 18.4% 18.4%
Total-Staff-Pupil Ratio 5.7 : 1 6 : 1 English Language Learners 3.3% 3.3%
Attendance (2007-08) 82.6%
Proposed 2009-10 Funding Allocation Grades Served 10-12 10-12
0000: General Fund - No Project $ 3,219,121
0143: Toshiba America Foundation -
0200: Title IIA - Tchr & Prin Tr/Rec - Major Object 2008-09 2009-10
0243: Title I - Eng 4 Spkrs Ot Lang 11,091 Salary Compensation 3,857,655 3,813,47
0250: Title I - Parent Component 11,515 Other Compensation 125,600 425
0268: Title I - AIS Services 69,120 Fixed Obligation/Variability 100 100
0274: Title I - Misc/Carryover 44,366 Cash Capital Outlays 96,823 8,000
0305: IDEA Support Serv & Sec 611 29,161 Facilities and Related 96,296 45,101
0453: Safe Schools/Healthy Stdnts I 10,807 Technology 18,900 800
0707: Perkins Secondary - Miscellaneous Services 3,729 4,154
1020: Foundation Aid IPP 96,793 Other Variable Expenses 2,927 (2,228
1038: Foundation Aid MA 94,816 Total, All Objects 4,202,030 3,869,823
1045: Foundation Aid CR 61,561
1300: Extracurricular Activities -
1357: Student & Family Support Ctr 15,586 Average Daily Attendance pct:
1910: Drop-Out Prevention 18,429 Special Population Units Count wt. Uni
4020: Green Schools Program - Mobility (applies over 40%)
4512: C4E - AVID Program 93,105 Free/Reduced Lunch
4515: C4E - Extended Day Program 32,008 At Risk
4528: C4E - In-School Suspension 62,344 Special Education
Gifted & Talented
Career & Technical Education
English Language Learners
Total, Special Population Units
Total, Refined Units
Total $ 3,869,823 Basic Allocation
Science Social Studies
GRADE 2007 2008* 2007 2008* 2007 2008* 2007 2008*
7 N/A N/A N/A N/A
8 N/A N/A N/A N/A N/A N/A N/A
Physical Setting/Earth Science
NYS Regents* 38.1% 57.1% 41.8% 56.2% 41.2% 100% 33.0% 40.9%
Graduation 2007-08* 42.0% 65.8% 77.6%
Students at Risk* 61.9% 42.9% 58.2% 43.8% (Percentages of students in all grades not meeting proficiency)
*Official New York State Education Department statistics for 2007-08 have not yet been released. These numbers are the best District estimate.
U.S. History and Government
English Mathematics
Student Demographic DataPosition Information (FTEs)
Mission: Ensure that all our graduates have successful transitions to the workforce and/or post-secondary education. Our
relationships with community partners provide students with opportunities to extend their learning beyond the classroom.
Global History and Geography
Budget Allocations by Account
ELA Math
Student Achievement (percentage of students attaining proficiency)*
Fiscal Year 2010-11 Allocation Weighting Factors
Section 4 Page 54
School Profiles and Budgets 2009-10 Draft Budget

8/7/2019 2009_2010DRAFT
http://slidepdf.com/reader/full/20092010draft 117/268
School: School of Imaging & Information Technology at Edison 2008-09 Accountability Status: SIN
(IIT is a School in Need of Improvement Year 2 for HS ELA & HS Math because they did not make AYP for 3 consecutive years in each ar
Address: 655 Colfax St. 14606 Bonnie Atkins, Principal Phone: 324-979
2009 2010 2008-09 2009-10(es
Teachers 43.00 38.75 Total Enrollment 391 3
Principals/AP/AD 3.25 3.25 African American 69.3% 69.3
Other Instructional 10.35 9.75 Asian 1.0% 1.0
Non-instructional 16.75 16.00 Hispanic 19.9% 19.9
Total, Staff 73.35 67.75 Native American 0.3% 0.3
White 8.7% 8.7
Teacher-Pupil Ratio 9.1 : 1 8.7 : 1 Free & Reduced Lunch 77.0% 77.0
Other-Staff-Pupil Ratio 12.9 : 1 11.7 : 1 Special Education 18.4% 18.4
Total-Staff-Pupil Ratio 5.3 : 1 5 : 1 English Language Learners 3.8% 3.
Attendance (2007-08) 83.4%
Proposed 2009-10 Funding Allocation Grades Served 10-12 10-12
0000: General Fund - No Project $ 2,656,205
0200: Title IIA - Tchr & Prin Tr/Rec -
0250: Title I - Parent Component 10,489 Major Object 2008-09 2009-10
0268: Title I - AIS Services 130,892 Salary Compensation 3,421,796 3,268,2
0300: Title I - Improvement/Choice 43,808 Other Compensation 162,939 22,23
0305: IDEA Support Serv & Sec 611 113,697 Fixed Obligation/Variability 6,608 3,74
0453: Safe Schools/Healthy Stdnts I 10,807 Cash Capital Outlays 60,000 12,00
0707: Perkins Secondary - Facilities and Related 148,551 33,22
1020: Foundation Aid IPP 95,555 Technology 64 -
1038: Foundation Aid MA 92,826 Miscellaneous Services 4,300 4,00
1045: Foundation Aid CR 63,611 Other Variable Expenses 6,116 31,70
1300: Extracurricular Activities - Total, All Objects 3,810,374 3,375,19
1357: Student & Family Support Ctr 15,586
1910: Drop-Out Prevention 20,404
4020: Green Schools Program - Average Daily Attendance pct:
4512: C4E - AVID Program 48,346 Special Population Units Count wt. Un
4515: C4E - Extended Day Program 25,732 Mobility (applies over 40%)
4528: C4E - In-School Suspension 47,238 Free/Reduced Lunch
At Risk
Special Education
Gifted & Talented
Career & Technical Education
English Language Learners
Total, Special Population Units
Total, Refined Units
Total $ 3,375,196 Basic Allocation
Science Social Studies
GRADE 2007 2008* 2007 2008* 2007 2008* 2007 2008*
7 N/A N/A N/A N/A
8 N/A N/A N/A N/A N/A N/A N/A
Physical Setting/Earth Science
NYS Regents* 42.1% 73.2% 82.2% 66.5% 34.8% 80% 33.3% 40.0
Graduation 2007-08* 32.0% 55.7% 81.7
Students at Risk* 57.9% 26.8% 17.8% 33.5% (Percentages of students in all grades not meeting proficiency)
*Official New York State Education Department statistics for 2007-08 have not yet been released. These numbers are the best District estimate.
Mission: Build a student-centered learning community, driven by high expectations for academic success. Through a technology ric
curriculum, we will provide relevant and engaging instruction where students learn and achieve. IIT graduates will be ready for the
work force and prepared for post secondary education.
Global History and Geography
Budget Allocations by Account
ELA Math
Student Achievement (percentage of students attaining proficiency)*
Fiscal Year 2010-11 Allocation Weighting Factors
U.S. History and Government
English Mathematics
Student Demographic DataPosition Information (FTEs)
Section 4 Page 55
School Profiles and Budgets 2009-10 Draft Budget

8/7/2019 2009_2010DRAFT
http://slidepdf.com/reader/full/20092010draft 118/268
School: Thomas Jefferson High School 2008-09 Accountability Status: SINI 5-YR
(Jefferson is a School Restructuring (SINI 5) Year 5 for 3-8 ELA because they did not make AYP for over six consecutive ye
Address: Edgerton Park 14608 Mary Andrecolich-Diaz , Principal Phone: 458-228
2009 2010 2008-09 2009-10(e
Teachers 102.30 91.25 Total Enrollment 1,039 1,0
Principals/AP/AD 10.00 9.00 African American 55.8% 55.
Other Instructional 17.00 17.70 Asian 14.6% 14.
Non-instructional 42.57 42.57 Hispanic 19.0% 19.
Total, Staff 171.87 160.52 Native American 0.5% 0.
White 9.9% 9.
Teacher-Pupil Ratio 10.2 : 1 11.1 : 1 Free & Reduced Lunch 84.5% 84.
Other-Staff-Pupil Ratio 14.9 : 1 14.7 : 1 Special Education 19.2% 19.
Total-Staff-Pupil Ratio 6 : 1 6.3 : 1 English Language Learners 28.0% 28.
Attendance (2007-08) 82.9%
Proposed 2009-10 Funding Allocation Grades Served 7-12 7-12
0000: General Fund - No Project $ 6,972,236
0200: Title IIA - Tchr & Prin Tr/Rec -
0243: Title I - Eng 4 Spkrs Ot Lang 116,873 Major Object 2008-09 2009-10
0250: Title I - Parent Component 20,978 Salary Compensation 8,274,183 7,968,3
0268: Title I - AIS Services 104,574 Other Compensation 361,174 68,2
0274: Title I - Misc/Carryover - Fixed Obligation/Variability 10,720 10,80
0300: Title I - Improvement/Choice 41,871 Cash Capital Outlays 155,645 88,6
0305: IDEA Support Serv & Sec 611 147,559 Facilities and Related 95,623 74,49
0703: Health Care Apprenticeship 8,000 Technology 500 5
0707: Perkins Secondary - Miscellaneous Services 2,900 1,1
0740: Hospit & Lodging Career @ jeff - Other Variable Expenses 20,956 22,19
0755: SURR Grant - Total, All Objects 8,921,701 8,234,37
1020: Foundation Aid IPP 97,830
1038: Foundation Aid MA 27,558
1045: Foundation Aid CR 196,802 Average Daily Attendance pct:
1300: Extracurricular Activities - Special Population Units Count wt. Un
1323: School Redesign - Mobility (applies over 40%)
1357: Student & Family Support Ctr 55,116 Free/Reduced Lunch
1910: Drop-Out Prevention 27,558 At Risk
4020: Green Schools Program - Special Education
4507: C4E - Jefferson School of Entr 113,948 Gifted & Talented
4512: C4E - AVID Program 43,228 Career & Technical Education
4515: C4E - Extended Day Program 69,244 English Language Learners
4524: C4E - Dream Schools 141,515 Total, Special Population Units
4528: C4E - In-School Suspension 49,484 Total, Refined Units
Total $ 8,234,374 Basic Allocation
Science Social Studies
GRADE 2007 2008* 2007 2008* 2007 2008* 2007 2008*
7 22.6% 25.9% 15.0% 41.3%
8 27.6% 22.6% 11.1% 36.5% 6.8% 28% N/A 14.4%
Physical Setting/Earth Science
NYS Regents* 37.5% 46.5% 63.0% 58.9% 43.1% 66.1% 18.6% 25.
Graduation 2007-08* 53.0% 51.3% 55.
Students at Risk* 71.9% 69.6% 73.1% 54.4% (Percentages of students in all grades not meeting proficiency)
*Official New York State Education Department statistics for 2007-08 have not yet been released. These numbers are the best District estimate.
U.S. History and Government
English Mathematics
Student Demographic DataPosition Information (FTEs)
Mission: Paving roads for life-long learners to a future of higher education, successful employability, and responsible citizenship.
Global History and Geography
Budget Allocations by Account
ELA Math
Student Achievement (percentage of students attaining proficiency)*
Fiscal Year 2010-11 Allocation Weighting Factors
Section 4 Page 56
School Profiles and Budgets 2009-10 Draft Budget

8/7/2019 2009_2010DRAFT
http://slidepdf.com/reader/full/20092010draft 119/268
14
44 2
3/NRCS
19
135
2
4
15 23
29
16
44
SOUTHERN
58
MONROE
SOTA
WILSON
COMMENCEMENT
WILSON
FOUNDATION
SWW
COMMENCEMENT
SWW
FOUNDATION
12
South Zone-Elementary
No. 1 Martin B. Anderson
No. 2 Clara Barton
No. 4 George Mather Forbes
No. 12 James P.B. Duffy
No. 14 Chester Dewey
No. 15 The Children’s School of RochesterNo. 16 John Walton Spencer
No. 19 Dr. Charles T. Lunsford
No. 23 Francis Parker
No. 28 Henry Hudson
No. 29 Adlai E. Stevenson
No. 35 Pinnacle
No. 46 Charles Carroll
No. 58 World of Inquiry
South Zone-Secondary
East High School
James Monroe High School
School of the Arts
School Without Walls-Commencement Academy
School Without Walls-Foundation Academy
Wilson Commencement Academy
Wilson Foundation Academy
Section 4 Page 57
School Profiles and Budgets 2009-10 Draft Budget

8/7/2019 2009_2010DRAFT
http://slidepdf.com/reader/full/20092010draft 120/268
Schools: South Zone
Management Financial Discussion and Analysis
Division/Department Overview
Budget Expense Category
2008-09
Amended Budget
2009-10
Proposed Budget
BudgetChange
Fav/(Unfav)
Budget %Change
Fav/(Unfav) CommentSalary Compensation $95,879,377 $93,711,058 $2,168,319 2.26% 112.45 FTE staffing reduction
Other Compensation $3,093,529 $382,594 $2,710,935 87.63% Reclass substitutes to central budget
Employee Benefits $0 $0 $0 0.00%
Fixed Obligation with Variability $77,188 $74,950 $2,238 2.90%
Debt Service $0 $0 $0 0.00%
Cash Capital Outlays $680,004 $440,353 $239,651 35.24% Grant funding reductions
Facilities and Related $1,624,427 $1,372,782 $251,645 15.49% Grant funding reductions
Technology $11,183 $7,040 $4,143 37.05% Grant funding reductions
Miscellaneous Services $120,226 $98,983 $21,243 17.67%
Other Variable Expenses $375,432 $180,317 $195,115 51.97% Grant funding reductions
Totals $101,861,366 $96,268,077 $5,593,289 5.49%
FTEs 1,922.20 1,809.75 112.45 5.85%
The South Zone is comprised of 21 schools. This zone provides supervision of principals that ensures the alignment and implementation of
goals and objectives to District priorities and School Improvement Plans. Also provided is support to ensure the development of instructional
management systems relevant to the needs of students. To enhance the leadership, monthly meetings of all principals are held to focus on
transformational leadership decision-making characteristics designed to improve student achievement with a focus on literacy and school-level
decision making relative to operational issues. In summary, the main role and responsibility of the District is to support the work of schools
and the development of professional learning communities within each school designed to improve student achievement through research-
based instructional practice using assessment for learning as the foundation.
Expense Categories
2009-10 Budget Expense Total - $96,268,077
Other Variable Expenses
0.19%
Miscellaneous Services
0.10%
Technology
0.01%
Cash Capital Outlays
0.46%
Salary Compensation
97.34%
Fixed Obligation with Variability
0.08%
Other Compensation
0.40%
Facilities and Related
1.43%
Section 4 Page 58
School Profiles and Budgets 2009-10 Draft Budget

8/7/2019 2009_2010DRAFT
http://slidepdf.com/reader/full/20092010draft 121/268
South Zone Schools
2007-2008 2008-2009 2009-2010
Var Bud vs
Amend
Actual Amended Proposed Fav/(Unfav)
EXPENDITURES BY ACCOUNT
Salary Compensation
Teachers' Salaries 68,587,008 72,424,036 70,688,821 1,735,215
Civil Service Salaries 7,876,892 8,687,469 9,046,584 (359,115)
Administrator's Salaries 7,586,820 7,797,486 7,920,656 (123,170)
Hourly Teachers 1,075,171 1,244,802 431,577 813,225
Teaching Assistants 1,062,749 1,365,740 1,401,493 (35,753)
Paraprofessionals Salary 3,980,237 4,359,844 4,221,927 137,917
Sub Total Salary Compensation 90,168,877 95,879,377 93,711,058 2,168,319
Other Compensation
Substitute Teacher Cost 3,142,110 2,693,792 70,758 2,623,034
Overtime Non-Instructional Sal 240,519 235,582 174,566 61,016
Teachers In Service 156,674 164,155 137,270 26,885
Sub Total Other Compensation 3,539,303 3,093,529 382,594 2,710,935
Total Salary and Other Compensation 93,708,180 98,972,906 94,093,652 4,879,254 Sub Total Employee Benefits - - - -
Total Compensation and Benefits 93,708,180 98,972,906 94,093,652 4,879,254
Fixed Obligations With Variability
Special Education Tuition - - - -
Contract Transportation 59,042 77,188 74,950 2,238
Charter School Tuition - - - -
Health Service Other Districts - - - -
Insurance Non-employee - - - -
Sub Total Fixed Obligations 59,042 77,188 74,950 2,238
Debt Service
Sub Total Debt Service - - - -
Cash Capital Outlays
Cash Capital Expense - - - -
Textbooks 323,331 292,635 186,390 106,245
Equipment Other Than Buses 114,974 123,805 108,651 15,154 Equipment Buses - - - -
Computer Hardware - Instructional 76,879 49,842 37,975 11,867
Computer Hardware - Non Instructional 24,430 28,588 24,200 4,388
Library Books 74,370 185,134 83,137 101,997
Sub Total Cash Capital Outlays 613,984 680,004 440,353 239,651
Expenditure Summary (All Funds)
Section 4 Page 59
School Profiles and Budgets 2009-10 Draft Budget

8/7/2019 2009_2010DRAFT
http://slidepdf.com/reader/full/20092010draft 122/268
South Zone Schools
2007-2008 2008-2009 2009-2010
Var Bud vs
Amend
Actual Amended Proposed Fav/(Unfav)
Expenditure Summary (All Funds)
Facilities and Related
Utilities 204 8,250 4,100 4,150
Instructional Supplies 1,233,489 1,109,882 949,967 159,915
Equip Service Contr & Repair 37,134 80,775 57,812 22,963
Facilities Service Contracts - - - -
Rentals 16,828 10,725 7,743 2,982
Maintenance Repair Supplies 593 4,800 800 4,000
Postage Printing & Advertising 98,034 118,515 107,567 10,948
Auto Supplies 147 100 150 (50)
Supplies and Materials 49,351 71,325 40,950 30,375
Custodial Supplies 133,496 166,855 158,211 8,644
Office Supplies 47,653 53,200 45,482 7,718
Sub Total Facilities and Related 1,616,929 1,624,427 1,372,782 251,645
Technology
Computer Software - Instructional 14,748 9,793 5,850 3,943
Computer Software - Non Instructional 1,245 1,390 1,190 200
Subtotal Technology 15,993 11,183 7,040 4,143 Miscellaneous Services
Sub Total Miscellaneous Services 83,258 120,226 98,983 21,243
All Other Variable Expenses
Professional & Technical Serv 110,883 235,091 60,591 174,500
Agency Clerical 73,084 56,540 48,421 8,119
Judgments and Claims - - - -
Grant Disallowances - - - -
Departmental Credits (37,389) (39,500) (29,500) (10,000)
Indirect Costs Grants - - - -
BOCES Services - 3,830 1,700 2,130
Professional Development 65,418 119,471 99,105 20,366
Subtotal of All Other Variable Expenses 211,995 375,432 180,317 195,115
Total Non Compensation 2,601,202 2,888,460 2,174,425 714,035
Sub Total 96,309,381 101,861,366 96,268,077 5,593,289
Fund Balance Reserve - - - - Grand Total 96,309,381 101,861,366 96,268,077 5,593,289
Section 4 Page 60
School Profiles and Budgets 2009-10 Draft Budget

8/7/2019 2009_2010DRAFT
http://slidepdf.com/reader/full/20092010draft 123/268
South Zone Schools
2007 - 2008 2008 - 2009 2009 - 2010
Var Bud vs
Amend
Actual Amended Proposed Fav/(Unfav)
POSITIONS BY ACCOUNT
Salary Compensation
Teachers' Salaries 1,273.19 1,292.50 1,186.55 105.95
Civil Service Salaries 260.00 274.00 269.00 5.00
Administrator's Salaries 81.00 83.00 81.00 2.00
Teaching Assistants 50.50 58.00 57.00 1.00
Paraprofessionals Salary 208.00 214.70 216.20 (1.50)
Hourly Teachers 0.00 0.00 0.00 0.00
Total Salary Compensation 1,872.69 1,922.20 1,809.75 112.45
Other Compensation
Substitute Teacher Cost 0.00 0.00 0.00 0.00
Overtime Non-Instructional Sal 0.00 0.00 0.00 0.00
Teachers In Service 0.00 0.00 0.00 0.00
Total Other Compensation 0.00 0.00 0.00 0.00
Total Salary and Other Compensation 1,872.69 1,922.20 1,809.75 112.45
Grand Total 1,872.69 1,922.20 1,809.75 112.45
Position Summary
Section 4 Page 61
School Profiles and Budgets 2009-10 Draft Budget

8/7/2019 2009_2010DRAFT
http://slidepdf.com/reader/full/20092010draft 124/268
School: No. 1 Martin B. Anderson 2008-09 Accountability Status: G
(School 1 is in good standing for the 2008-09 Accountability Yea
Address: 85 Hillside Ave. 14610 Kimberly Harris-Pappin, Principal Phone: 473-1533
2009 2010 2008-09 2009-10 (est
Teachers 29.10 28.20 Total Enrollment 305 28
Principals/AP/AD 2.00 2.00 African American 70.8% 70.8
Other Instructional 2.20 1.50 Asian 2.3% 2.3
Non-instructional 8.00 8.00 Hispanic 10.2% 10.2
Total 41.30 39.70 Native American 1.0% 1.0
White 14.4% 14.4
Teacher-Pupil Ratio 10.5 : 1 10.2 : 1 Free & Reduced Lunch 83.6% 83.6
Other-Staff-Pupil Ratio 25 : 1 25.1 : 1 Special Education 9.8% 9.8
Total-Staff-Pupil Ratio 7.4 : 1 7.3 : 1 English Language Learners 3.9% 3.9
Attendance (2007-08) 94.1%
Proposed 2009-10 Funding Allocation Grades Served PreK-6 PreK-6
0000: General Fund - No Project $ 1,683,728 0200: Title IIA - Tchr & Prin Tr/Rec 81,344
0206: Title I - Kindergarten 46,712 Major Object 2008-09 2009-10
0250: Title I - Parent Component 25,425 Salary Compensation 2,297,006 2,262,74
0268: Title I - AIS Services 164,288 Other Compensation 94,872 1,00
0305: IDEA Support Serv & Sec 611 18,065 Fixed Obligation/Variability - -
1020: Foundation Aid IPP 47,238 Cash Capital Outlays 17,389 13,00
1038: Foundation Aid MA 132,372 Facilities and Related 50,901 39,75
1045: Foundation Aid CR 42,625 Technology 500 50
1468: Prior Year Expenses - Miscellaneous Services - -
4020: Green Schools Program - Other Variable Expenses 2,000 1,00
4515: C4E - Extended Day Program - Total, All Objects 2,462,668 2,318,00
4517: C4E - Great Beginnings 21,087
4528: C4E - In-School Suspension 55,116
Average Daily Attendance pct:
Special Population Units Count wt. Uni
Mobility (applies over 40%)
Free/Reduced Lunch
At Risk
Special Education
Gifted &Talented
Career & Technical Education
English Language Learners
Total, Special Population Units
Total, Refined Units
Total $ 2,318,000 Basic Allocation
Science Social Studies
GRADE 2007 2008* 2007 2008* 2007 2008* 2007 2008*
1 48.8% 83.7% 51.2% 81.4%
2 62.8% 52.9% 69.8% 64.7%
3 36.6% 45.5% 69.2% 56.8%
4 51.6% 53.8% 64.5% 68.3% 77.4% 90.2%
5 50.0% 79.2% 58.5% 63.6% 73.8% 94.5%
6 51.6% 70.3% 68.2% 86.1%
Students at Risk* 50.0% 36.8% 37.4% 32.5% (Percentages of students in all grades not meeting proficiency)
*Official New York State Education Department statistics for 2007-08 have not yet been released. These numbers are the best District estimate.
Mission: Develop each student’s ability to achieve excellence through a focus on academic skills, communication, positive decision
making, and social/emotional growth. Student achievement will be strengthened by integrating a “village” of positive role models fo
students and fostering personal accountability.
Fiscal Year 2010-11 Allocation Weighting Factors
Budget Allocations by Account
ELA MathStudent Achievement (percentage of students attaining proficiency)*
Student Demographic DataPosition Information (FTEs)
Section 4 Page 62
School Profiles and Budgets 2009-10 Draft Budget

8/7/2019 2009_2010DRAFT
http://slidepdf.com/reader/full/20092010draft 125/268
School: No. 2 Clara Barton 2008-09 Accountability Status: G
(School 2 is in good standing for the 2008-09 Accountability Year
Address: 190 Reynolds St. 14608 Najmah Abdulmateen, Principal Phone: 235-2820
2009 2010 2008-09 2009-10 (est
Teachers 42.60 38.40 Total Enrollment 326 33
Principals/AP/AD 2.00 2.00 African American 89.6% 89.6%
Other Instructional 7.50 7.00 Asian 0.3% 0.3%
Non-instructional 13.30 13.30 Hispanic 4.3% 4.3%
Total 65.40 60.70 Native American 0.0% 0.0%
White 4.6% 4.6%
Teacher-Pupil Ratio 7.7 : 1 8.6 : 1 Free & Reduced Lunch 95.7% 95.7%
Other-Staff-Pupil Ratio 14.3 : 1 14.9 : 1 Special Education 31.9% 31.9%
Total-Staff-Pupil Ratio 5 : 1 5.5 : 1 English Language Learners 1.5% 1.5%
Attendance (2007-08) 92.1%
Proposed 2009-10 Funding Allocation Grades Served PreK-6 PreK-6
0000: General Fund - No Project $ 2,109,657 0200: Title IIA - Tchr & Prin Tr/Rec -
0206: Title I - Kindergarten 52,093 Major Object 2008-09 2009-10
0243: Title I - Eng 4 Spkrs Ot Lang 24,213 Salary Compensation 3,141,073 2,978,230
0250: Title I - Parent Component 21,898 Other Compensation 102,458 1,300
0268: Title I - AIS Services 128,035 Fixed Obligation/Variability 5,000 5,000
0305: IDEA Support Serv & Sec 611 122,524 Cash Capital Outlays 8,000 4,000
0351: Extend Day/Violence Prevention - Facilities and Related 35,012 33,792
0364: Reading First 26,783 Technology - -
1020: Foundation Aid IPP 55,116 Miscellaneous Services - -
1038: Foundation Aid MA 233,497 Other Variable Expenses 2,300 1,000
1045: Foundation Aid CR 35,933 Total, All Objects 3,293,843 3,023,322
1103: Ed Related Support Services 44,270
1357: Student & Family Support Ctr 44,270
1416: Primary Project 16,278 Average Daily Attendance pct:
4501: C4E - Class Size - Special Population Units Count wt. Uni
4515: C4E - Extended Day Program 20,504 Mobility (applies over 40%)
4517: C4E - Great Beginnings 37,242 Free/Reduced Lunch
4518: C4E - On Campus Intervention P 51,009 At Risk
4527: C4E - Reading First Local Supp - Special Education
Gifted &Talented
Career & Technical Education
English Language Learners
Total, Special Population Units
Total, Refined Units
Total $ 3,023,322 Basic Allocation
Science Social Studies
GRADE 2007 2008* 2007 2008* 2007 2008* 2007 2008*
1 38.8% 51.4% 31.3% 40.0%
2 32.1% 36.5% 30.2% 22.2%
3 37.0% 31.5% 52.2% 64.2%
4 36.5% 44.2% 50.9% 51.2% 92.5% 74.4%
5 32.6% 57.4% 34.8% 61.7% 72.3% 78.7%
6 30.4% 50.0% 58.7% 66.7%
Students at Risk* 65.2% 56.0% 57.8% 50.2% (Percentages of students in all grades not meeting proficiency)
*Official New York State Education Department statistics for 2007-08 have not yet been released. These numbers are the best District estimate.
Mission: Engage all students in the learning process to reach high standards, so that all students are prepared for success as assessed
by multiple measures.
Fiscal Year 2010-11 Allocation Weighting Factors
Budget Allocations by Account
ELA MathStudent Achievement (percentage of students attaining proficiency)*
Student Demographic DataPosition Information (FTEs)
Section 4 Page 63
School Profiles and Budgets 2009-10 Draft Budget

8/7/2019 2009_2010DRAFT
http://slidepdf.com/reader/full/20092010draft 126/268
School: No. 4 George Mather Forbes 2008-09 Accountability Status: G
(School 4 is in good standing for the 2008-09 Accountability Year
Address: 198 Dr. Samuel McCree Way 14611 Karon A. Jackson , Principal Phone: 235-7848
2009 2010 2008-09 2009-10 (est.
Teachers 47.10 43.60 Total Enrollment 401 412
Principals/AP/AD 2.00 2.00 African American 86.0% 86.0%
Other Instructional 10.00 9.10 Asian 0.2% 0.2%
Non-instructional 28.50 29.00 Hispanic 7.0% 7.0%
Total 87.60 83.70 Native American 0.2% 0.2%
White 4.5% 4.5%
Teacher-Pupil Ratio 8.5 : 1 9.4 : 1 Free & Reduced Lunch 94.8% 94.8%
Other-Staff-Pupil Ratio 9.9 : 1 10.3 : 1 Special Education 27.7% 27.7%
Total-Staff-Pupil Ratio 4.6 : 1 4.9 : 1 English Language Learners 3.7% 3.7%
Attendance (2007-08) 92.1%
Proposed 2009-10 Funding Allocation Grades Served K-6 K-6
0000: General Fund - No Project $ 2,541,319 0206: Title I - Kindergarten 54,469
0250: Title I - Parent Component 24,623 Major Object 2008-09 2009-10
0268: Title I - AIS Services 172,304 Salary Compensation 3,953,724 3,785,079
0305: IDEA Support Serv & Sec 611 513,918 Other Compensation 78,778 29,253
0453: Safe Schools/Healthy Stdnts I 5,819 Fixed Obligation/Variability 1,500 1,000
1020: Foundation Aid IPP 110,408 Cash Capital Outlays 35,906 25,150
1038: Foundation Aid MA 284,795 Facilities and Related 29,060 40,168
1045: Foundation Aid CR 38,189 Technology - -
1134: QUAD A Program 45,548 Miscellaneous Services 500 400
4020: Green Schools Program - Other Variable Expenses 2,000 1,000
4515: C4E - Extended Day Program 23,018 Total, All Objects 4,101,468 3,882,050
4517: C4E - Great Beginnings 26,510
4518: C4E - On Campus Intervention P 41,130
Average Daily Attendance pct:
Special Population Units Count wt. Unit
Mobility (applies over 40%)
Free/Reduced Lunch
At Risk
Special Education
Gifted &Talented
Career & Technical Education
English Language Learners
Total, Special Population Units
Total, Refined Units
Total $ 3,882,050 Basic Allocation
Science Social Studies
GRADE 2007 2008* 2007 2008* 2007 2008* 2007 2008*
1 50.0% 36.4% 40.0% 29.1%
2 44.1% 34.9% 32.4% 32.6%
3 49.1% 51.2% 66.7% 67.5%
4 70.2% 62.7% 66.0% 65.5% 83.3% 86.2%
5 51.1% 62.0% 45.7% 62.0% 70.8% 74.5%
6 44.8% 58.6% 35.8% 47.5%
Students at Risk* 48.5% 48.4% 52.2% 49.5% (Percentages of students in all grades not meeting proficiency)
*Official New York State Education Department statistics for 2007-08 have not yet been released. These numbers are the best District estimate.
Mission: Committment to: a multi-cultural integrated curriculum; creating critical and divergent thinkers; staff development for child
centered instruction; fostering respect for self and others; including parents and community as partners and resources; incorporating
support staff in an interdisciplinary approach; and, enabling all students to attain their maximum potential.
Fiscal Year 2010-11 Allocation Weighting Factors
Budget Allocations by Account
ELA MathStudent Achievement (percentage of students attaining proficiency)*
Student Demographic DataPosition Information (FTEs)
Section 4 Page 64
School Profiles and Budgets 2009-10 Draft Budget

8/7/2019 2009_2010DRAFT
http://slidepdf.com/reader/full/20092010draft 127/268
School: No. 12 James P.B. Duffy 2008-09 Accountability Status: G
(School 12 is in good standing for the 2008-09 Accountability Yea
Address: 999 South Ave. 14620 Michele Liguori-Alampi, Principal Phone: 461-3280
2009 2010 2008-09 2009-10 (est
Teachers 68.70 59.50 Total Enrollment 755 76
Principals/AP/AD 3.00 3.00 African American 60.7% 60.7
Other Instructional 7.00 7.00 Asian 1.2% 1.2
Non-instructional 18.00 18.00 Hispanic 24.4% 24.4
Total 96.70 87.50 Native American 0.1% 0.1
White 12.5% 12.5
Teacher-Pupil Ratio 11 : 1 12.8 : 1 Free & Reduced Lunch 81.3% 81.3
Other-Staff-Pupil Ratio 27 : 1 27.3 : 1 Special Education 10.2% 10.2
Total-Staff-Pupil Ratio 7.8 : 1 8.7 : 1 English Language Learners 13.9% 13.9
Attendance (2007-08) 94.0%
Proposed 2009-10 Funding Allocation Grades Served K-6 K-6
0000: General Fund - No Project $ 2,998,077 0200: Title IIA - Tchr & Prin Tr/Rec -
0206: Title I - Kindergarten 49,623 Major Object 2008-09 2009-10
0229: Title I - CSRD Support 10,000 Salary Compensation 4,777,666 4,509,92
0243: Title I - Eng 4 Spkrs Ot Lang 122,385 Other Compensation 169,915 2,60
0250: Title I - Parent Component 14,116 Fixed Obligation/Variability 839 -
0268: Title I - AIS Services 134,253 Cash Capital Outlays 18,815 12,75
0305: IDEA Support Serv & Sec 611 204,067 Facilities and Related 113,736 74,77
0313: School #12/United Way 33,138 Technology 750 50
1020: Foundation Aid IPP 111,209 Miscellaneous Services 1,428 1,00
1038: Foundation Aid MA 425,004 Other Variable Expenses 8,920 6,77
1045: Foundation Aid CR 47,777 Total, All Objects 5,092,069 4,608,32
1313: Strong Start Program 33,138
1323: School Redesign -
1468: Prior Year Expenses - Average Daily Attendance pct:
4020: Green Schools Program - Special Population Units Count wt. Un
4501: C4E - Class Size 270,677 Mobility (applies over 40%)
4515: C4E - Extended Day Program 44,452 Free/Reduced Lunch
4517: C4E - Great Beginnings 52,292 At Risk
4518: C4E - On Campus Intervention P 58,116 Special Education
Gifted &Talented
Career & Technical Education
English Language Learners
Total, Special Population Units
Total, Refined Units
Total $ 4,608,324 Basic Allocation
Science Social Studies
GRADE 2007 2008* 2007 2008* 2007 2008* 2007 2008*
1 55.9% 66.4% 39.8% 50.4%
2 44.9% 41.3% 33.7% 50.5%
3 44.4% 48.3% 59.3% 71.4%
4 67.3% 59.6% 63.6% 69.1% 83.6% 78.6%
5 52.0% 67.0% 40.0% 57.5% 74.5% 83.2%
6 57.9% 61.0% 49.5% 64.2%
Students at Risk* 45.7% 42.5% 52.2% 40.1% (Percentages of students in all grades not meeting proficiency)
*Official New York State Education Department statistics for 2007-08 have not yet been released. These numbers are the best District estimate.
Mission: Educate in a safe, inclusive environment. Through quality programs, we will meet every student’s individual needs and
provide a strong foundation for life-long learning.
Fiscal Year 2010-11 Allocation Weighting Factors
Budget Allocations by Account
ELA MathStudent Achievement (percentage of students attaining proficiency)*
Student Demographic DataPosition Information (FTEs)
Section 4 Page 65
School Profiles and Budgets 2009-10 Draft Budget

8/7/2019 2009_2010DRAFT
http://slidepdf.com/reader/full/20092010draft 128/268
School: No. 14 Chester Dewey 2008-09 Accountability Status: G
(School 14 is in good standing for the 2008-09 Accountability Year
Address: 200 University Ave. 14605 Camaron Clyburn, Principal Phone: 325-6738
2009 2010 2008-09 2009-10 (est
Teachers 45.40 39.10 Total Enrollment 385 29
Principals/AP/AD 2.00 2.00 African American 67.0% 67.0%
Other Instructional 4.80 3.70 Asian 16.9% 16.9%
Non-instructional 13.20 13.20 Hispanic 7.5% 7.5%
Total 65.40 58.00 Native American 0.8% 0.8%
White 7.5% 7.5%
Teacher-Pupil Ratio 8.5 : 1 7.4 : 1 Free & Reduced Lunch 90.1% 90.1%
Other-Staff-Pupil Ratio 19.3 : 1 15.4 : 1 Special Education 18.7% 18.7%
Total-Staff-Pupil Ratio 5.9 : 1 5 : 1 English Language Learners 40.5% 40.5%
Attendance (2007-08) 93.1%
Proposed 2009-10 Funding Allocation Grades Served PreK-6 PreK-6
0000: General Fund - No Project $ 1,874,086 0200: Title IIA - Tchr & Prin Tr/Rec -
0206: Title I - Kindergarten 50,266 Major Object 2008-09 2009-10
0243: Title I - Eng 4 Spkrs Ot Lang 217,188 Salary Compensation 3,129,939 2,893,239
0250: Title I - Parent Component 30,369 Other Compensation 114,487 3,400
0268: Title I - AIS Services 111,680 Fixed Obligation/Variability 2,714 3,000
0305: IDEA Support Serv & Sec 611 117,268 Cash Capital Outlays 9,300 8,600
0364: Reading First 26,782 Facilities and Related 56,298 37,070
0515: The Primary Project - Technology - -
1020: Foundation Aid IPP 93,309 Miscellaneous Services - 500
1038: Foundation Aid MA 250,091 Other Variable Expenses 500 3,000
1045: Foundation Aid CR 58,116 Total, All Objects 3,313,238 2,948,809
1416: Primary Project 16,112
1468: Prior Year Expenses -
4515: C4E - Extended Day Program 21,919 Average Daily Attendance pct:
4517: C4E - Great Beginnings 32,139 Special Population Units Count wt. Uni
4527: C4E - Reading First Local Supp - Mobility (applies over 40%)
4528: C4E - In-School Suspension 49,484 Free/Reduced Lunch
At Risk
Special Education
Gifted &Talented
Career & Technical Education
English Language Learners
Total, Special Population Units
Total, Refined Units
Total $ 2,948,809 Basic Allocation
Science Social Studies
GRADE 2007 2008* 2007 2008* 2007 2008* 2007 2008*
1 53.1% 30.2% 35.9% 9.5%
2 29.2% 21.7% 31.3% 15.9%
3 27.3% 34.0% 39.0% 66.7%
4 42.9% 46.3% 62.8% 72.1% 89.7% 96.4%
5 52.5% 57.1% 73.9% 64.0% 82.5% 94.6%
6 37.8% 58.5% 35.1% 65.3%
Students at Risk* 59.4% 61.2% 54.5% 53.5% (Percentages of students in all grades not meeting proficiency)
*Official New York State Education Department statistics for 2007-08 have not yet been released. These numbers are the best District estimate.
Mission: A learning community where each and every child will be prepared for success-- today, tomorrow and always.
Fiscal Year 2010-11 Allocation Weighting Factors
Budget Allocations by Account
ELA MathStudent Achievement (percentage of students attaining proficiency)*
Student Demographic DataPosition Information (FTEs)
Section 4 Page 66
School Profiles and Budgets 2009-10 Draft Budget

8/7/2019 2009_2010DRAFT
http://slidepdf.com/reader/full/20092010draft 129/268
School: No. 15 The Children’s School of Rochester 2008-09 Accountability Status: GS
(School 15 is in good standing for the 2008-09 Accountability Year
Address: 494 Averill Ave. 14607 Patricia A. Townsend, Principal Phone: 262-8830
2009 2010 2008-09 2009-10 (est.
Teachers 30.40 29.80 Total Enrollment 283 287
Principals/AP/AD 1.00 1.00 African American 45.6% 45.6%
Other Instructional 1.60 1.40 Asian 23.0% 23.0%
Non-instructional 10.40 10.40 Hispanic 11.7% 11.7%
Total 43.40 42.60 Native American 0.0% 0.0%
White 19.1% 19.1%
Teacher-Pupil Ratio 9.3 : 1 9.6 : 1 Free & Reduced Lunch 81.3% 81.3%
Other-Staff-Pupil Ratio 21.8 : 1 22.4 : 1 Special Education 6.4% 6.4%
Total-Staff-Pupil Ratio 6.5 : 1 6.7 : 1 English Language Learners 47.0% 47.0%
Attendance (2007-08) 94.8%
Proposed 2009-10 Funding Allocation Grades Served K-6 K-6
0000: General Fund - No Project $ 1,412,207 0200: Title IIA - Tchr & Prin Tr/Rec -
0206: Title I - Kindergarten 23,619 Major Object 2008-09 2009-10
0243: Title I - Eng 4 Spkrs Ot Lang 59,366 Salary Compensation 2,208,614 2,199,901
0250: Title I - Parent Component 21,757 Other Compensation 26,224 1,000
0268: Title I - AIS Services 142,496 Fixed Obligation/Variability 3,000 1,500
0453: Safe Schools/Healthy Stdnts I 5,819 Cash Capital Outlays 25,145 10,800
1020: Foundation Aid IPP 52,292 Facilities and Related 32,418 35,324
1038: Foundation Aid MA 371,138 Technology - -
1045: Foundation Aid CR 58,116 Miscellaneous Services - -
4020: Green Schools Program - Other Variable Expenses 6,728 18,626
4515: C4E - Extended Day Program 21,562 Total, All Objects 2,302,129 2,267,151
4517: C4E - Great Beginnings 17,435
4528: C4E - In-School Suspension 81,344
Average Daily Attendance pct:
Special Population Units Count wt. Unit
Mobility (applies over 40%)
Free/Reduced Lunch
At Risk
Special Education
Gifted &Talented
Career & Technical Education
English Language Learners
Total, Special Population Units
Total, Refined Units
Total $ 2,267,151 Basic Allocation
Science Social Studies
GRADE 2007 2008* 2007 2008* 2007 2008* 2007 2008*
1 44.7% 34.1% 40.4% 26.7%
2 43.2% 57.5% 29.7% 61.0%
3 43.9% 23.7% 57.5% 31.7%
4 55.0% 80.0% 65.9% 67.9% 77.8% 81.5%
5 27.0% 63.2% 41.0% 70.0% 90.9% 76.5%
6 43.2% 61.1% 44.4% 52.4%
Students at Risk* 56.9% 48.9% 53.4% 49.8% (Percentages of students in all grades not meeting proficiency)
*Official New York State Education Department statistics for 2007-08 have not yet been released. These numbers are the best District estimate.
Mission: Enable students to become critical, literate thinkers and doers, to learn, to know how to learn, and to love to learn, with a
child-centered structure and curriculum that explicitly values and nurtures the bond with the child’s home culture.
Fiscal Year 2010-11 Allocation Weighting Factors
Budget Allocations by Account
ELA MathStudent Achievement (percentage of students attaining proficiency)*
Student Demographic DataPosition Information (FTEs)
Section 4 Page 67
School Profiles and Budgets 2009-10 Draft Budget

8/7/2019 2009_2010DRAFT
http://slidepdf.com/reader/full/20092010draft 130/268
School: No. 16 John Walton Spencer 2008-09 Accountability Status: SINI
(School 16 is a School in Need of Improvement Year 1 for 3-8 ELA because they did not make AYP for 2 consecutive year
Address: 321 Post Ave. 14619 Sylvia Cooksey, Principal Phone: 235-1272
2009 2010 2008-09 2009-10 (est
Teachers 43.60 36.80 Total Enrollment 463 45
Principals/AP/AD 2.00 2.00 African American 91.8% 91.8
Other Instructional 5.60 5.60 Asian 0.4% 0.4
Non-instructional 14.64 14.64 Hispanic 3.5% 3.5
Total 65.84 59.04 Native American 0.0% 0.0
White 2.8% 2.8
Teacher-Pupil Ratio 10.6 : 1 12.4 : 1 Free & Reduced Lunch 92.2% 92.2
Other-Staff-Pupil Ratio 20.8 : 1 20.6 : 1 Special Education 14.9% 14.9
Total-Staff-Pupil Ratio 7 : 1 7.8 : 1 English Language Learners 1.5% 1.5
Attendance (2007-08) 91.7%
Proposed 2009-10 Funding Allocation Grades Served PreK-6 PreK-6
0000: General Fund - No Project $ 2,040,437 0200: Title IIA - Tchr & Prin Tr/Rec -
0206: Title I - Kindergarten 30,267 Major Object 2008-09 2009-10
0243: Title I - Eng 4 Spkrs Ot Lang 21,426 Salary Compensation 3,102,689 2,853,16
0250: Title I - Parent Component 24,623 Other Compensation 77,259 4,06
0268: Title I - AIS Services 115,527 Fixed Obligation/Variability - -
0453: Safe Schools/Healthy Stdnts I 7,000 Cash Capital Outlays 21,928 11,41
1020: Foundation Aid IPP 103,049 Facilities and Related 43,136 30,82
1038: Foundation Aid MA 275,560 Technology - -
1045: Foundation Aid CR 44,365 Miscellaneous Services - 50
1323: School Redesign - Other Variable Expenses 500 3,42
4020: Green Schools Program - Total, All Objects 3,245,512 2,903,39
4501: C4E - Class Size 113,387
4515: C4E - Extended Day Program 45,646
4517: C4E - Great Beginnings 34,869 Average Daily Attendance pct:
4528: C4E - In-School Suspension 47,238 Special Population Units Count wt. Un
Mobility (applies over 40%)
Free/Reduced Lunch
At Risk
Special Education
Gifted &Talented
Career & Technical Education
English Language Learners
Total, Special Population Units
Total, Refined Units
Total $ 2,903,394 Basic Allocation
Science Social Studies
GRADE 2007 2008* 2007 2008* 2007 2008* 2007 2008*
1 34.7% 33.3% 22.2% 22.2%
2 39.1% 53.2% 45.1% 35.5%
3 44.4% 32.9% 77.0% 73.3%
4 44.4% 61.6% 44.4% 72.2% 93.5% 75%
5 45.2% 62.5% 57.4% 63.5% 75.4% 82.5%
6 50.0% 59.3% 28.3% 51.9%
Students at Risk* 57.3% 50.0% 53.9% 45.8% (Percentages of students in all grades not meeting proficiency)
*Official New York State Education Department statistics for 2007-08 have not yet been released. These numbers are the best District estimate.
Mission: Empower a community that shares accountability for teaching and learning to promote good citizenship and celebrate
successes.
Fiscal Year 2010-11 Allocation Weighting Factors
Budget Allocations by Account
ELA MathStudent Achievement (percentage of students attaining proficiency)*
Student Demographic DataPosition Information (FTEs)
Section 4 Page 68
School Profiles and Budgets 2009-10 Draft Budget
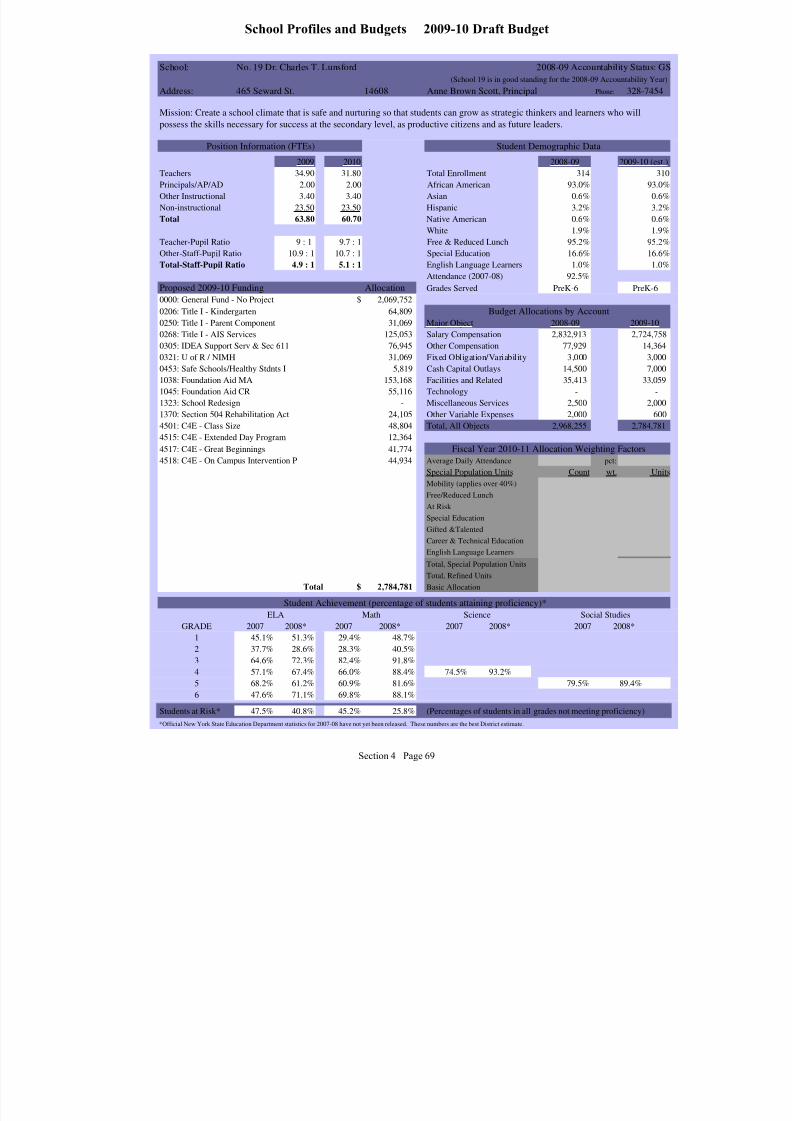
8/7/2019 2009_2010DRAFT
http://slidepdf.com/reader/full/20092010draft 131/268
School: No. 19 Dr. Charles T. Lunsford 2008-09 Accountability Status: G
(School 19 is in good standing for the 2008-09 Accountability Yea
Address: 465 Seward St. 14608 Anne Brown Scott, Principal Phone: 328-7454
2009 2010 2008-09 2009-10 (est
Teachers 34.90 31.80 Total Enrollment 314 3
Principals/AP/AD 2.00 2.00 African American 93.0% 93.0
Other Instructional 3.40 3.40 Asian 0.6% 0.6
Non-instructional 23.50 23.50 Hispanic 3.2% 3.2
Total 63.80 60.70 Native American 0.6% 0.6
White 1.9% 1.9
Teacher-Pupil Ratio 9 : 1 9.7 : 1 Free & Reduced Lunch 95.2% 95.2
Other-Staff-Pupil Ratio 10.9 : 1 10.7 : 1 Special Education 16.6% 16.6
Total-Staff-Pupil Ratio 4.9 : 1 5.1 : 1 English Language Learners 1.0% 1.0
Attendance (2007-08) 92.5%
Proposed 2009-10 Funding Allocation Grades Served PreK-6 PreK-6
0000: General Fund - No Project $ 2,069,752 0206: Title I - Kindergarten 64,809
0250: Title I - Parent Component 31,069 Major Object 2008-09 2009-10
0268: Title I - AIS Services 125,053 Salary Compensation 2,832,913 2,724,75
0305: IDEA Support Serv & Sec 611 76,945 Other Compensation 77,929 14,36
0321: U of R / NIMH 31,069 Fixed Obligation/Variability 3,000 3,00
0453: Safe Schools/Healthy Stdnts I 5,819 Cash Capital Outlays 14,500 7,00
1038: Foundation Aid MA 153,168 Facilities and Related 35,413 33,05
1045: Foundation Aid CR 55,116 Technology - -
1323: School Redesign - Miscellaneous Services 2,500 2,00
1370: Section 504 Rehabilitation Act 24,105 Other Variable Expenses 2,000 60
4501: C4E - Class Size 48,804 Total, All Objects 2,968,255 2,784,78
4515: C4E - Extended Day Program 12,364
4517: C4E - Great Beginnings 41,774
4518: C4E - On Campus Intervention P 44,934 Average Daily Attendance pct:
Special Population Units Count wt. Un
Mobility (applies over 40%)
Free/Reduced Lunch
At Risk
Special Education
Gifted &Talented
Career & Technical Education
English Language Learners
Total, Special Population Units
Total, Refined Units
Total $ 2,784,781 Basic Allocation
Science Social Studies
GRADE 2007 2008* 2007 2008* 2007 2008* 2007 2008*
1 45.1% 51.3% 29.4% 48.7%
2 37.7% 28.6% 28.3% 40.5%
3 64.6% 72.3% 82.4% 91.8%
4 57.1% 67.4% 66.0% 88.4% 74.5% 93.2%
5 68.2% 61.2% 60.9% 81.6% 79.5% 89.4%
6 47.6% 71.1% 69.8% 88.1%
Students at Risk* 47.5% 40.8% 45.2% 25.8% (Percentages of students in all grades not meeting proficiency)
*Official New York State Education Department statistics for 2007-08 have not yet been released. These numbers are the best District estimate.
Mission: Create a school climate that is safe and nurturing so that students can grow as strategic thinkers and learners who will
possess the skills necessary for success at the secondary level, as productive citizens and as future leaders.
Fiscal Year 2010-11 Allocation Weighting Factors
Budget Allocations by Account
ELA MathStudent Achievement (percentage of students attaining proficiency)*
Student Demographic DataPosition Information (FTEs)
Section 4 Page 69
School Profiles and Budgets 2009-10 Draft Budget
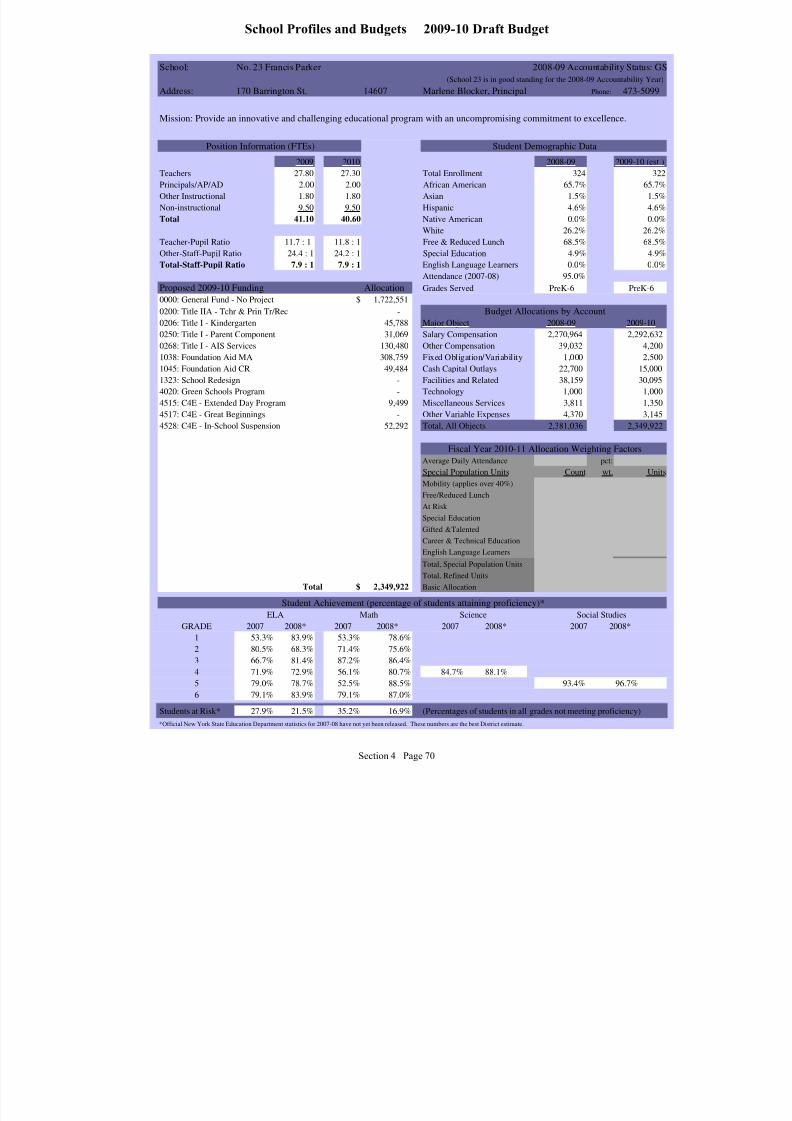
8/7/2019 2009_2010DRAFT
http://slidepdf.com/reader/full/20092010draft 132/268
School: No. 23 Francis Parker 2008-09 Accountability Status: G
(School 23 is in good standing for the 2008-09 Accountability Year
Address: 170 Barrington St. 14607 Marlene Blocker, Principal Phone: 473-5099
2009 2010 2008-09 2009-10 (est.
Teachers 27.80 27.30 Total Enrollment 324 322
Principals/AP/AD 2.00 2.00 African American 65.7% 65.7%
Other Instructional 1.80 1.80 Asian 1.5% 1.5%
Non-instructional 9.50 9.50 Hispanic 4.6% 4.6%
Total 41.10 40.60 Native American 0.0% 0.0%
White 26.2% 26.2%
Teacher-Pupil Ratio 11.7 : 1 11.8 : 1 Free & Reduced Lunch 68.5% 68.5%
Other-Staff-Pupil Ratio 24.4 : 1 24.2 : 1 Special Education 4.9% 4.9%
Total-Staff-Pupil Ratio 7.9 : 1 7.9 : 1 English Language Learners 0.0% 0.0%
Attendance (2007-08) 95.0%
Proposed 2009-10 Funding Allocation Grades Served PreK-6 PreK-6
0000: General Fund - No Project $ 1,722,551 0200: Title IIA - Tchr & Prin Tr/Rec -
0206: Title I - Kindergarten 45,788 Major Object 2008-09 2009-10
0250: Title I - Parent Component 31,069 Salary Compensation 2,270,964 2,292,632
0268: Title I - AIS Services 130,480 Other Compensation 39,032 4,200
1038: Foundation Aid MA 308,759 Fixed Obligation/Variability 1,000 2,500
1045: Foundation Aid CR 49,484 Cash Capital Outlays 22,700 15,000
1323: School Redesign - Facilities and Related 38,159 30,095
4020: Green Schools Program - Technology 1,000 1,000
4515: C4E - Extended Day Program 9,499 Miscellaneous Services 3,811 1,350
4517: C4E - Great Beginnings - Other Variable Expenses 4,370 3,145
4528: C4E - In-School Suspension 52,292 Total, All Objects 2,381,036 2,349,922
Average Daily Attendance pct:
Special Population Units Count wt. Unit
Mobility (applies over 40%)
Free/Reduced Lunch
At Risk
Special Education
Gifted &Talented
Career & Technical Education
English Language Learners
Total, Special Population Units
Total, Refined Units
Total $ 2,349,922 Basic Allocation
Science Social Studies
GRADE 2007 2008* 2007 2008* 2007 2008* 2007 2008*
1 53.3% 83.9% 53.3% 78.6%
2 80.5% 68.3% 71.4% 75.6%
3 66.7% 81.4% 87.2% 86.4%
4 71.9% 72.9% 56.1% 80.7% 84.7% 88.1%
5 79.0% 78.7% 52.5% 88.5% 93.4% 96.7%
6 79.1% 83.9% 79.1% 87.0%
Students at Risk* 27.9% 21.5% 35.2% 16.9% (Percentages of students in all grades not meeting proficiency)
*Official New York State Education Department statistics for 2007-08 have not yet been released. These numbers are the best District estimate.
Mission: Provide an innovative and challenging educational program with an uncompromising commitment to excellence.
Fiscal Year 2010-11 Allocation Weighting Factors
Budget Allocations by Account
ELA MathStudent Achievement (percentage of students attaining proficiency)*
Student Demographic DataPosition Information (FTEs)
Section 4 Page 70
School Profiles and Budgets 2009-10 Draft Budget
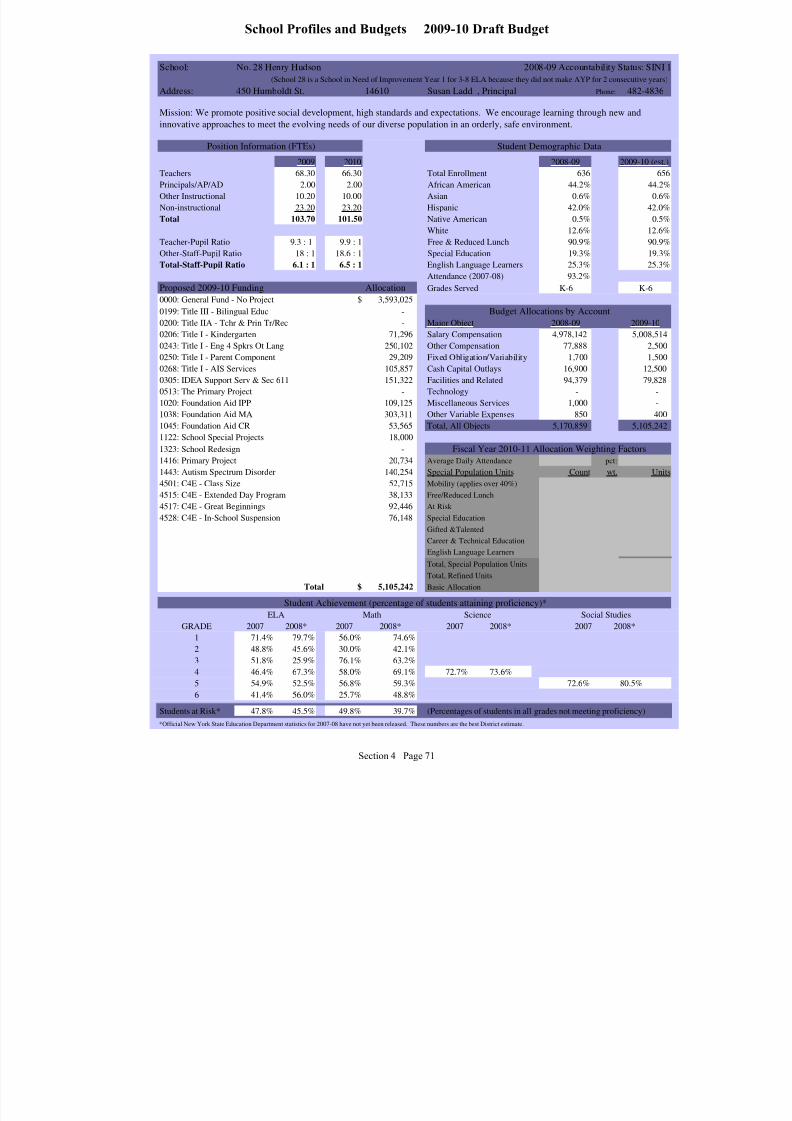
8/7/2019 2009_2010DRAFT
http://slidepdf.com/reader/full/20092010draft 133/268
School: No. 28 Henry Hudson 2008-09 Accountability Status: SINI
(School 28 is a School in Need of Improvement Year 1 for 3-8 ELA because they did not make AYP for 2 consecutive year
Address: 450 Humboldt St. 14610 Susan Ladd , Principal Phone: 482-4836
2009 2010 2008-09 2009-10 (es
Teachers 68.30 66.30 Total Enrollment 636 6
Principals/AP/AD 2.00 2.00 African American 44.2% 44.2
Other Instructional 10.20 10.00 Asian 0.6% 0.6
Non-instructional 23.20 23.20 Hispanic 42.0% 42.0
Total 103.70 101.50 Native American 0.5% 0.5
White 12.6% 12.6
Teacher-Pupil Ratio 9.3 : 1 9.9 : 1 Free & Reduced Lunch 90.9% 90.9
Other-Staff-Pupil Ratio 18 : 1 18.6 : 1 Special Education 19.3% 19.3
Total-Staff-Pupil Ratio 6.1 : 1 6.5 : 1 English Language Learners 25.3% 25.3
Attendance (2007-08) 93.2%
Proposed 2009-10 Funding Allocation Grades Served K-6 K-6
0000: General Fund - No Project $ 3,593,025 0199: Title III - Bilingual Educ -
0200: Title IIA - Tchr & Prin Tr/Rec - Major Object 2008-09 2009-10
0206: Title I - Kindergarten 71,296 Salary Compensation 4,978,142 5,008,51
0243: Title I - Eng 4 Spkrs Ot Lang 250,102 Other Compensation 77,888 2,50
0250: Title I - Parent Component 29,209 Fixed Obligation/Variability 1,700 1,50
0268: Title I - AIS Services 105,857 Cash Capital Outlays 16,900 12,50
0305: IDEA Support Serv & Sec 611 151,322 Facilities and Related 94,379 79,82
0513: The Primary Project - Technology - -
1020: Foundation Aid IPP 109,125 Miscellaneous Services 1,000 -
1038: Foundation Aid MA 303,311 Other Variable Expenses 850 40
1045: Foundation Aid CR 53,565 Total, All Objects 5,170,859 5,105,24
1122: School Special Projects 18,000
1323: School Redesign -
1416: Primary Project 20,734 Average Daily Attendance pct:
1443: Autism Spectrum Disorder 140,254 Special Population Units Count wt. Un
4501: C4E - Class Size 52,715 Mobility (applies over 40%)
4515: C4E - Extended Day Program 38,133 Free/Reduced Lunch
4517: C4E - Great Beginnings 92,446 At Risk
4528: C4E - In-School Suspension 76,148 Special Education
Gifted &Talented
Career & Technical Education
English Language Learners
Total, Special Population Units
Total, Refined Units
Total $ 5,105,242 Basic Allocation
Science Social Studies
GRADE 2007 2008* 2007 2008* 2007 2008* 2007 2008*
1 71.4% 79.7% 56.0% 74.6%
2 48.8% 45.6% 30.0% 42.1%
3 51.8% 25.9% 76.1% 63.2%
4 46.4% 67.3% 58.0% 69.1% 72.7% 73.6%
5 54.9% 52.5% 56.8% 59.3% 72.6% 80.5%
6 41.4% 56.0% 25.7% 48.8%
Students at Risk* 47.8% 45.5% 49.8% 39.7% (Percentages of students in all grades not meeting proficiency)
*Official New York State Education Department statistics for 2007-08 have not yet been released. These numbers are the best District estimate.
Mission: We promote positive social development, high standards and expectations. We encourage learning through new and
innovative approaches to meet the evolving needs of our diverse population in an orderly, safe environment.
Fiscal Year 2010-11 Allocation Weighting Factors
Budget Allocations by Account
ELA MathStudent Achievement (percentage of students attaining proficiency)*
Student Demographic DataPosition Information (FTEs)
Section 4 Page 71
School Profiles and Budgets 2009-10 Draft Budget

8/7/2019 2009_2010DRAFT
http://slidepdf.com/reader/full/20092010draft 134/268
School: No. 29 Adlai E. Stevenson 2008-09 Accountability Status: G
(School 29 is in good standing for the 2008-09 Accountability Yea
Address: 88 Kirkland Rd. 14611 Clinton Strickland, Jr. , Principal Phone: 328-8228
2009 2010 2008-09 2009-10 (est
Teachers 44.90 37.60 Total Enrollment 370 36
Principals/AP/AD 2.00 2.00 African American 85.1% 85.1
Other Instructional 6.20 6.20 Asian 0.5% 0.5
Non-instructional 44.50 44.50 Hispanic 7.8% 7.8
Total 97.60 90.30 Native American 0.0% 0.0
White 4.9% 4.9
Teacher-Pupil Ratio 8.2 : 1 9.7 : 1 Free & Reduced Lunch 97.0% 97.0
Other-Staff-Pupil Ratio 7 : 1 6.9 : 1 Special Education 23.0% 23.0
Total-Staff-Pupil Ratio 3.8 : 1 4 : 1 English Language Learners 1.6% 1.6
Attendance (2007-08) 92.1%
Proposed 2009-10 Funding Allocation Grades Served PreK-6 PreK-6
0000: General Fund - No Project $ 2,330,938 0200: Title IIA - Tchr & Prin Tr/Rec -
0206: Title I - Kindergarten 81,001 Major Object 2008-09 2009-10
0243: Title I - Eng 4 Spkrs Ot Lang 12,107 Salary Compensation 4,240,930 4,027,17
0250: Title I - Parent Component 19,039 Other Compensation 132,528 4,02
0268: Title I - AIS Services 167,113 Fixed Obligation/Variability - 74
0305: IDEA Support Serv & Sec 611 982,834 Cash Capital Outlays 9,000 4,41
0513: The Primary Project 23,519 Facilities and Related 50,736 40,78
1020: Foundation Aid IPP 113,818 Technology 100 10
1038: Foundation Aid MA 57,659 Miscellaneous Services 1,758 70
1045: Foundation Aid CR 97,192 Other Variable Expenses 4,100 2,00
1323: School Redesign - Total, All Objects 4,439,152 4,079,95
1416: Primary Project 16,450
1910: Drop-Out Prevention -
4501: C4E - Class Size 41,216 Average Daily Attendance pct:
4515: C4E - Extended Day Program 34,680 Special Population Units Count wt. Un
4517: C4E - Great Beginnings 44,270 Mobility (applies over 40%)
4528: C4E - In-School Suspension 58,116 Free/Reduced Lunch
At Risk
Special Education
Gifted &Talented
Career & Technical Education
English Language Learners
Total, Special Population Units
Total, Refined Units
Total $ 4,079,952 Basic Allocation
Science Social Studies
GRADE 2007 2008* 2007 2008* 2007 2008* 2007 2008*
1 N/A 36.7% N/A 30.0%
2 N/A 72.0% N/A 62.0%
3 32.8% 45.2% 50.8% 69.0%
4 47.9% 21.7% 59.2% 49.2% 66.7% 50.8%
5 26.0% 47.3% 23.1% 61.8% 46.0% 72.7%
6 29.2% 36.4% 25.0% 38.1%
Students at Risk* 66.7% 57.6% 61.6% 49.0% (Percentages of students in all grades not meeting proficiency)
*Official New York State Education Department statistics for 2007-08 have not yet been released. These numbers are the best District estimate.
Mission: Use a standards based and culturally diverse curriculum and instruction to ensure that all students meet or exceed state and
national standards in all subject areas.
Fiscal Year 2010-11 Allocation Weighting Factors
Budget Allocations by Account
ELA MathStudent Achievement (percentage of students attaining proficiency)*
Student Demographic DataPosition Information (FTEs)
Section 4 Page 72
School Profiles and Budgets 2009-10 Draft Budget

8/7/2019 2009_2010DRAFT
http://slidepdf.com/reader/full/20092010draft 135/268
School: No. 35 Pinnacle 2008-09 Accountability Status: SINI
(School 35 is a School in Need of Improvement Year 1 for 3-8 ELA; they made AYP for the 2008-09 School Year
Address: 194 Field St. 14620 Robert Kuter, Principal Phone: 271-4583
2009 2010 2008-09 2009-10 (est.
Teachers 41.00 38.60 Total Enrollment 430 429
Principals/AP/AD 2.00 2.00 African American 45.6% 45.6%
Other Instructional 5.00 5.10 Asian 0.2% 0.2%
Non-instructional 10.80 10.80 Hispanic 41.4% 41.4%
Total 58.80 56.50 Native American 0.7% 0.7%
White 10.2% 10.2%
Teacher-Pupil Ratio 10.5 : 1 11.1 : 1 Free & Reduced Lunch 91.2% 91.2%
Other-Staff-Pupil Ratio 24.2 : 1 24 : 1 Special Education 9.5% 9.5%
Total-Staff-Pupil Ratio 7.3 : 1 7.6 : 1 English Language Learners 29.8% 29.8%
Attendance (2007-08) 92.0%
Proposed 2009-10 Funding Allocation Grades Served K-6 K-6
0000: General Fund - No Project $ 2,130,561 0199: Title III - Bilingual Educ -
0200: Title IIA - Tchr & Prin Tr/Rec - Major Object 2008-09 2009-10
0206: Title I - Kindergarten 49,817 Salary Compensation 3,095,338 3,050,780
0243: Title I - Eng 4 Spkrs Ot Lang 125,632 Other Compensation 80,629 43,671
0250: Title I - Parent Component 17,652 Fixed Obligation/Variability (1,650) -
0268: Title I - AIS Services 161,558 Cash Capital Outlays 16,598 11,000
0274: Title I - Misc/Carryover - Facilities and Related 57,559 61,093
0300: Title I - Improvement/Choice 41,419 Technology 506 -
0305: IDEA Support Serv & Sec 611 122,487 Miscellaneous Services 678 1,560
0306: Title I SQR Grant - Other Variable Expenses 2,445 500
0515: The Primary Project - Total, All Objects 3,252,103 3,168,604
1020: Foundation Aid IPP 137,831
1038: Foundation Aid MA 125,614
1045: Foundation Aid CR 69,825 Average Daily Attendance pct:
1320: NEA Grant Local Match 12,708 Special Population Units Count wt. Unit
1416: Primary Project 13,393 Mobility (applies over 40%)
1910: Drop-Out Prevention 31,770 Free/Reduced Lunch
4020: Green Schools Program - At Risk
4515: C4E - Extended Day Program 31,212 Special Education
4517: C4E - Great Beginnings 39,009 Gifted &Talented
4528: C4E - In-School Suspension 58,116 Career & Technical Education
English Language Learners
Total, Special Population Units
Total, Refined Units
Total $ 3,168,604 Basic Allocation
Science Social Studies
GRADE 2007 2008* 2007 2008* 2007 2008* 2007 2008*
1 50.0% 71.9% 42.9% 63.2%
2 40.9% 56.1% 36.4% 35.9%
3 31.3% 55.8% 47.1% 78.2%
4 35.3% 52.7% 34.3% 52.6% 73.5% 92.6%
5 46.4% 60.9% 34.5% 60.6% 67.2% 78.1%
6 42.6% 48.9% 30.9% 40.4%
Students at Risk* 59.8% 41.7% 62.3% 43.3% (Percentages of students in all grades not meeting proficiency)
*Official New York State Education Department statistics for 2007-08 have not yet been released. These numbers are the best District estimate.
Mission: Work cooperatively as a community to integrate curriculum, instill values, and foster individual growth and development,
using the America’s Choice comprehensive school model to develop strong school, home and community partnership, emphasizing
the building of academic excellence, positive character and citizenship.
Fiscal Year 2010-11 Allocation Weighting Factors
Budget Allocations by Account
ELA MathStudent Achievement (percentage of students attaining proficiency)*
Student Demographic DataPosition Information (FTEs)
Section 4 Page 73
School Profiles and Budgets 2009-10 Draft Budget
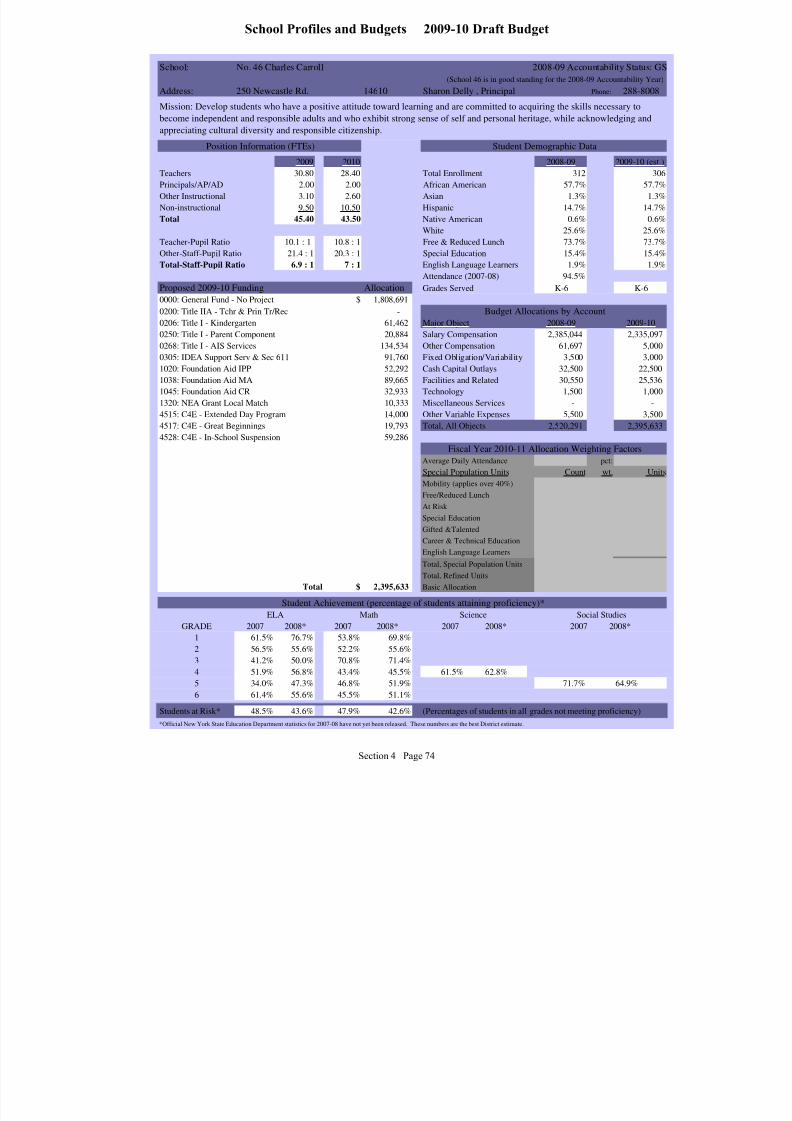
8/7/2019 2009_2010DRAFT
http://slidepdf.com/reader/full/20092010draft 136/268
School: No. 46 Charles Carroll 2008-09 Accountability Status: G
(School 46 is in good standing for the 2008-09 Accountability Year
Address: 250 Newcastle Rd. 14610 Sharon Delly , Principal Phone: 288-8008
2009 2010 2008-09 2009-10 (est.
Teachers 30.80 28.40 Total Enrollment 312 306
Principals/AP/AD 2.00 2.00 African American 57.7% 57.7%
Other Instructional 3.10 2.60 Asian 1.3% 1.3%
Non-instructional 9.50 10.50 Hispanic 14.7% 14.7%
Total 45.40 43.50 Native American 0.6% 0.6%
White 25.6% 25.6%
Teacher-Pupil Ratio 10.1 : 1 10.8 : 1 Free & Reduced Lunch 73.7% 73.7%
Other-Staff-Pupil Ratio 21.4 : 1 20.3 : 1 Special Education 15.4% 15.4%
Total-Staff-Pupil Ratio 6.9 : 1 7 : 1 English Language Learners 1.9% 1.9%
Attendance (2007-08) 94.5%
Proposed 2009-10 Funding Allocation Grades Served K-6 K-6
0000: General Fund - No Project $ 1,808,691 0200: Title IIA - Tchr & Prin Tr/Rec -
0206: Title I - Kindergarten 61,462 Major Object 2008-09 2009-10
0250: Title I - Parent Component 20,884 Salary Compensation 2,385,044 2,335,097
0268: Title I - AIS Services 134,534 Other Compensation 61,697 5,000
0305: IDEA Support Serv & Sec 611 91,760 Fixed Obligation/Variability 3,500 3,000
1020: Foundation Aid IPP 52,292 Cash Capital Outlays 32,500 22,500
1038: Foundation Aid MA 89,665 Facilities and Related 30,550 25,536
1045: Foundation Aid CR 32,933 Technology 1,500 1,000
1320: NEA Grant Local Match 10,333 Miscellaneous Services - -
4515: C4E - Extended Day Program 14,000 Other Variable Expenses 5,500 3,500
4517: C4E - Great Beginnings 19,793 Total, All Objects 2,520,291 2,395,633
4528: C4E - In-School Suspension 59,286
Average Daily Attendance pct:
Special Population Units Count wt. Unit
Mobility (applies over 40%)
Free/Reduced Lunch
At Risk
Special Education
Gifted &Talented
Career & Technical Education
English Language Learners
Total, Special Population Units
Total, Refined Units
Total $ 2,395,633 Basic Allocation
Science Social Studies
GRADE 2007 2008* 2007 2008* 2007 2008* 2007 2008*
1 61.5% 76.7% 53.8% 69.8%
2 56.5% 55.6% 52.2% 55.6%
3 41.2% 50.0% 70.8% 71.4%
4 51.9% 56.8% 43.4% 45.5% 61.5% 62.8%
5 34.0% 47.3% 46.8% 51.9% 71.7% 64.9%
6 61.4% 55.6% 45.5% 51.1%
Students at Risk* 48.5% 43.6% 47.9% 42.6% (Percentages of students in all grades not meeting proficiency)
*Official New York State Education Department statistics for 2007-08 have not yet been released. These numbers are the best District estimate.
Mission: Develop students who have a positive attitude toward learning and are committed to acquiring the skills necessary to
become independent and responsible adults and who exhibit strong sense of self and personal heritage, while acknowledging and
appreciating cultural diversity and responsible citizenship.
Fiscal Year 2010-11 Allocation Weighting Factors
Budget Allocations by Account
ELA MathStudent Achievement (percentage of students attaining proficiency)*
Student Demographic DataPosition Information (FTEs)
Section 4 Page 74
School Profiles and Budgets 2009-10 Draft Budget
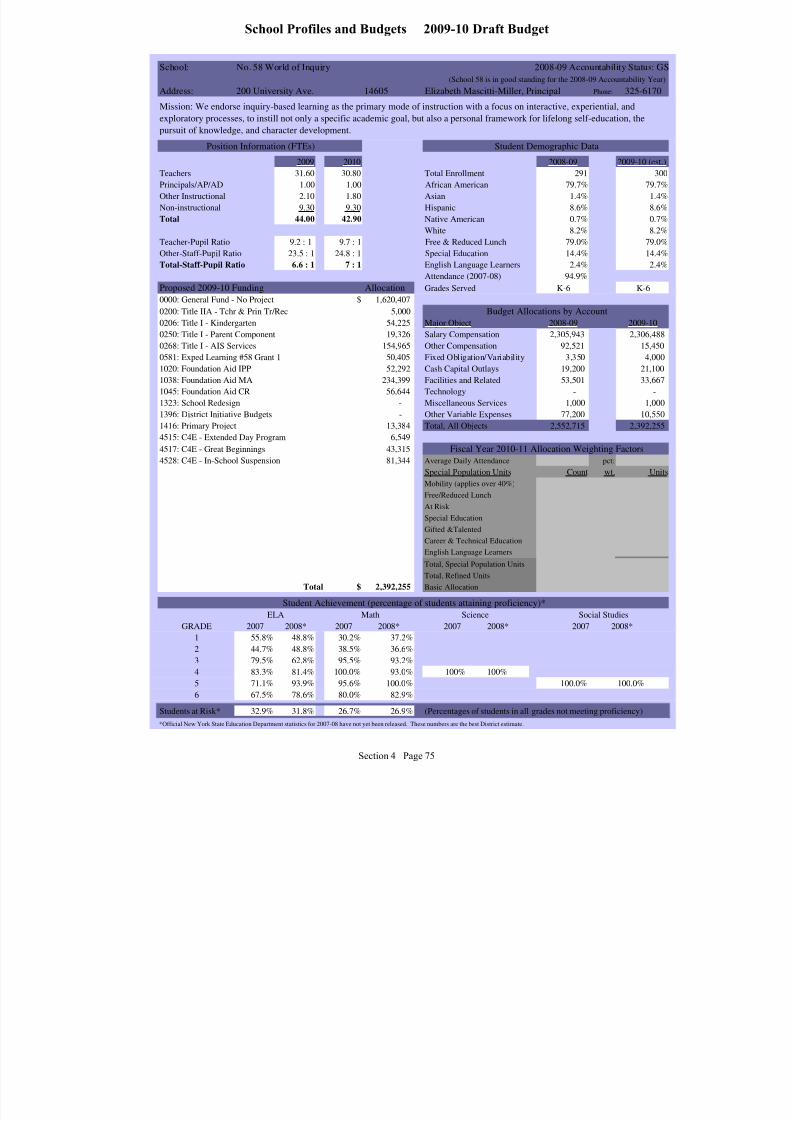
8/7/2019 2009_2010DRAFT
http://slidepdf.com/reader/full/20092010draft 137/268
School: No. 58 World of Inquiry 2008-09 Accountability Status: G
(School 58 is in good standing for the 2008-09 Accountability Year
Address: 200 University Ave. 14605 Elizabeth Mascitti-Miller, Principal Phone: 325-6170
2009 2010 2008-09 2009-10 (est
Teachers 31.60 30.80 Total Enrollment 291 30
Principals/AP/AD 1.00 1.00 African American 79.7% 79.7%
Other Instructional 2.10 1.80 Asian 1.4% 1.4%
Non-instructional 9.30 9.30 Hispanic 8.6% 8.6%
Total 44.00 42.90 Native American 0.7% 0.7%
White 8.2% 8.2%
Teacher-Pupil Ratio 9.2 : 1 9.7 : 1 Free & Reduced Lunch 79.0% 79.0%
Other-Staff-Pupil Ratio 23.5 : 1 24.8 : 1 Special Education 14.4% 14.4%
Total-Staff-Pupil Ratio 6.6 : 1 7 : 1 English Language Learners 2.4% 2.4%
Attendance (2007-08) 94.9%
Proposed 2009-10 Funding Allocation Grades Served K-6 K-6
0000: General Fund - No Project $ 1,620,407 0200: Title IIA - Tchr & Prin Tr/Rec 5,000
0206: Title I - Kindergarten 54,225 Major Object 2008-09 2009-10
0250: Title I - Parent Component 19,326 Salary Compensation 2,305,943 2,306,488
0268: Title I - AIS Services 154,965 Other Compensation 92,521 15,450
0581: Exped Learning #58 Grant 1 50,405 Fixed Obligation/Variability 3,350 4,000
1020: Foundation Aid IPP 52,292 Cash Capital Outlays 19,200 21,100
1038: Foundation Aid MA 234,399 Facilities and Related 53,501 33,667
1045: Foundation Aid CR 56,644 Technology - -
1323: School Redesign - Miscellaneous Services 1,000 1,000
1396: District Initiative Budgets - Other Variable Expenses 77,200 10,550
1416: Primary Project 13,384 Total, All Objects 2,552,715 2,392,255
4515: C4E - Extended Day Program 6,549
4517: C4E - Great Beginnings 43,315
4528: C4E - In-School Suspension 81,344 Average Daily Attendance pct:
Special Population Units Count wt. Uni
Mobility (applies over 40%)
Free/Reduced Lunch
At Risk
Special Education
Gifted &Talented
Career & Technical Education
English Language Learners
Total, Special Population Units
Total, Refined Units
Total $ 2,392,255 Basic Allocation
Science Social Studies
GRADE 2007 2008* 2007 2008* 2007 2008* 2007 2008*
1 55.8% 48.8% 30.2% 37.2%
2 44.7% 48.8% 38.5% 36.6%
3 79.5% 62.8% 95.5% 93.2%
4 83.3% 81.4% 100.0% 93.0% 100% 100%
5 71.1% 93.9% 95.6% 100.0% 100.0% 100.0%
6 67.5% 78.6% 80.0% 82.9%
Students at Risk* 32.9% 31.8% 26.7% 26.9% (Percentages of students in all grades not meeting proficiency)
*Official New York State Education Department statistics for 2007-08 have not yet been released. These numbers are the best District estimate.
Mission: We endorse inquiry-based learning as the primary mode of instruction with a focus on interactive, experiential, and
exploratory processes, to instill not only a specific academic goal, but also a personal framework for lifelong self-education, the
pursuit of knowledge, and character development.
Fiscal Year 2010-11 Allocation Weighting Factors
Budget Allocations by Account
ELA MathStudent Achievement (percentage of students attaining proficiency)*
Student Demographic DataPosition Information (FTEs)
Section 4 Page 75
School Profiles and Budgets 2009-10 Draft Budget

8/7/2019 2009_2010DRAFT
http://slidepdf.com/reader/full/20092010draft 138/268
School: James Monroe High School 2008-09 Accountability Status: SINI 5-YR
(Monroe is a School Restructuring (SINI 5) Year 2 for 3-8 ELA & 3-8 Math; they made AYP in both areas in the 2008-09 Accountability Yea
Address: 164 Alexander St. 14607 Vicky Ramos , Principal Phone: 232-1530
2009 2010 2008-09 2009-10(es
Teachers 117.70 104.00 Total Enrollment 1,118 1,1
Principals/AP/AD 9.00 8.00 African American 34.4% 34.4
Other Instructional 25.00 23.60 Asian 1.5% 1.5
Non-instructional 37.50 36.50 Hispanic 58.9% 58.9
Total, Staff 189.20 172.10 Native American 0.1% 0.1
White 5.1% 5.1
Teacher-Pupil Ratio 9.5 : 1 10.7 : 1 Free & Reduced Lunch 88.3% 88.3
Other-Staff-Pupil Ratio 15.6 : 1 16.3 : 1 Special Education 22.6% 22.6
Total-Staff-Pupil Ratio 5.9 : 1 6.5 : 1 English Language Learners 30.7% 30.7
Attendance (2007-08) 86.7%
Proposed 2009-10 Funding Allocation Grades Served 7-12 7-12
0000: General Fund - No Project $ 7,757,451
0111: WC Foundation -
0124: Learn Tech Monroe - Major Object 2008-09 2009-10
0200: Title IIA - Tchr & Prin Tr/Rec - Salary Compensation 9,589,362 9,144,73
0243: Title I - Eng 4 Spkrs Ot Lang 66,276 Other Compensation 351,505 41,62
0268: Title I - AIS Services 176,274 Fixed Obligation/Variability 1,300 9,43
0274: Title I - Misc/Carryover - Cash Capital Outlays 121,686 53,00
0300: Title I - Improvement/Choice 46,813 Facilities and Related 132,125 119,66
0305: IDEA Support Serv & Sec 611 357,157 Technology 2,000 1,00
0703: Health Care Apprenticeship 20,000 Miscellaneous Services 3,425 1,42
0707: Perkins Secondary - Other Variable Expenses 45,594 7,50
0755: SURR Grant - Total, All Objects 10,246,997 9,378,38
1020: Foundation Aid IPP 47,777
1038: Foundation Aid MA 505,972
1045: Foundation Aid CR 109,742 Average Daily Attendance pct:
1300: Extracurricular Activities - Special Population Units Count wt. Un
1357: Student & Family Support Ctr 65,784 Mobility (applies over 40%)
1468: Prior Year Expenses - Free/Reduced Lunch
1910: Drop-Out Prevention 6,875 At Risk
4020: Green Schools Program - Special Education
4512: C4E - AVID Program 46,071 Gifted & Talented
4515: C4E - Extended Day Program 69,142 Career & Technical Education
4518: C4E - On Campus Intervention P 53,565 English Language Learners
4528: C4E - In-School Suspension 49,484 Total, Special Population Units
Total, Refined Units
Total $ 9,378,383 Basic Allocation
Science Social Studies
GRADE 2007 2008* 2007 2008* 2007 2008* 2007 2008*
7 17.6% 25.2% 7.6% 35.0%
8 N/A 17.8% 4.1% 12.6% 23.3% 29.4% 16.5% 11.2%
Physical Setting/Earth Science
NYS Regents* 44.7% 69.4% 62.3% 49.5% 40.4% 89.4% 25.1% 36.0
Graduation 2007-08* 0.0% 56.5% 60.0
Students at Risk* 71.3% 65.7% 83.4% 65.1% (Percentages of students in all grades not meeting proficiency)
*Official New York State Education Department statistics for 2007-08 have not yet been released. These numbers are the best District estimate.
U.S. History and Government
English Mathematics
Student Demographic DataPosition Information (FTEs)
Mission: We work together to create a safe community that fosters respect and caring for each other while addressing the unique
needs of our students, providing a variety of opportunities to achieve our educational goals, building an appreciation of world
cultures, and helping students acquire the skills needed to live, work, and succeed in a global society.
Global History and Geography
Budget Allocations by Account
ELA Math
Student Achievement (percentage of students attaining proficiency)*
Fiscal Year 2010-11 Allocation Weighting Factors
Section 4 Page 76
School Profiles and Budgets 2009-10 Draft Budget
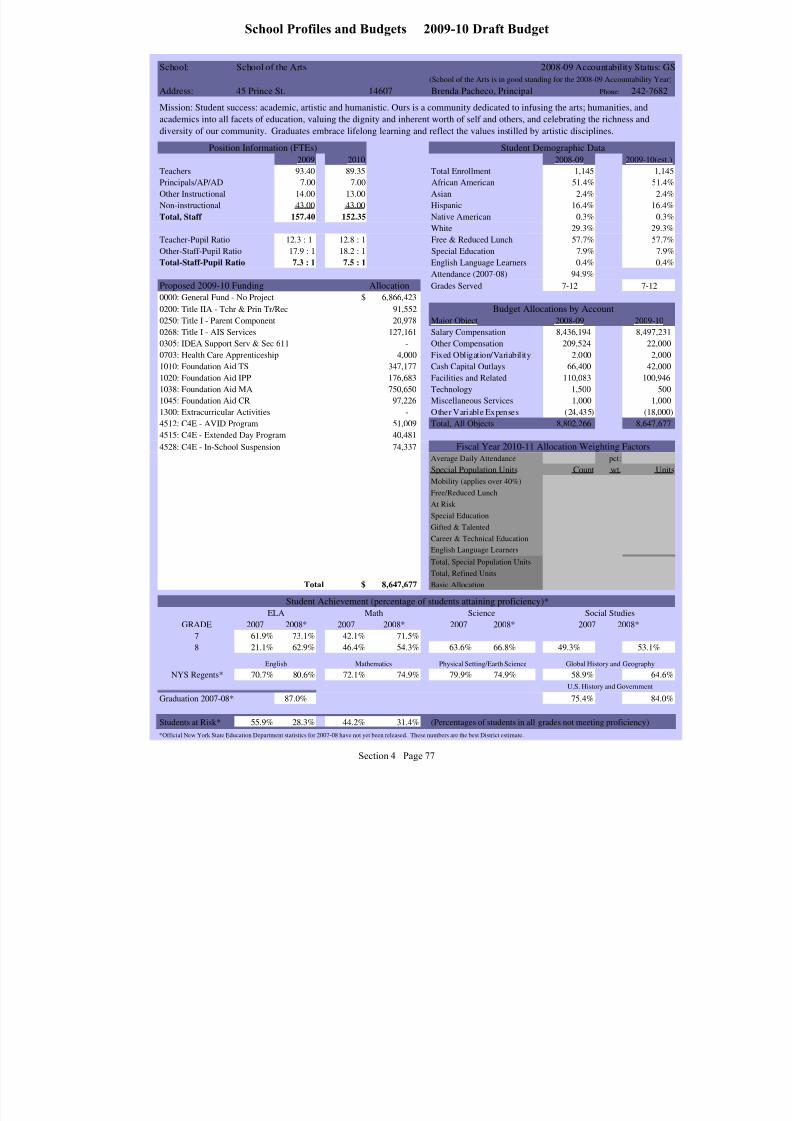
8/7/2019 2009_2010DRAFT
http://slidepdf.com/reader/full/20092010draft 139/268
School: School of the Arts 2008-09 Accountability Status:
(School of the Arts is in good standing for the 2008-09 Accountability Ye
Address: 45 Prince St. 14607 Brenda Pacheco, Principal Phone: 242-768
2009 2010 2008-09 2009-10(e
Teachers 93.40 89.35 Total Enrollment 1,145 1,
Principals/AP/AD 7.00 7.00 African American 51.4% 51.
Other Instructional 14.00 13.00 Asian 2.4% 2.
Non-instructional 43.00 43.00 Hispanic 16.4% 16.
Total, Staff 157.40 152.35 Native American 0.3% 0.
White 29.3% 29.
Teacher-Pupil Ratio 12.3 : 1 12.8 : 1 Free & Reduced Lunch 57.7% 57.
Other-Staff-Pupil Ratio 17.9 : 1 18.2 : 1 Special Education 7.9% 7.
Total-Staff-Pupil Ratio 7.3 : 1 7.5 : 1 English Language Learners 0.4% 0.
Attendance (2007-08) 94.9%
Proposed 2009-10 Funding Allocation Grades Served 7-12 7-12
0000: General Fund - No Project $ 6,866,423
0200: Title IIA - Tchr & Prin Tr/Rec 91,552
0250: Title I - Parent Component 20,978 Major Object 2008-09 2009-10
0268: Title I - AIS Services 127,161 Salary Compensation 8,436,194 8,497,2
0305: IDEA Support Serv & Sec 611 - Other Compensation 209,524 22,0
0703: Health Care Apprenticeship 4,000 Fixed Obligation/Variability 2,000 2,0
1010: Foundation Aid TS 347,177 Cash Capital Outlays 66,400 42,0
1020: Foundation Aid IPP 176,683 Facilities and Related 110,083 100,9
1038: Foundation Aid MA 750,650 Technology 1,500 5
1045: Foundation Aid CR 97,226 Miscellaneous Services 1,000 1,0
1300: Extracurricular Activities - Other Variable Expenses (24,435) (18,0
4512: C4E - AVID Program 51,009 Total, All Objects 8,802,266 8,647,6
4515: C4E - Extended Day Program 40,481
4528: C4E - In-School Suspension 74,337
Average Daily Attendance pct:
Special Population Units Count wt. U
Mobility (applies over 40%)
Free/Reduced Lunch
At Risk
Special Education
Gifted & Talented
Career & Technical Education
English Language Learners
Total, Special Population Units
Total, Refined Units
Total $ 8,647,677 Basic Allocation
Science Social Studies
GRADE 2007 2008* 2007 2008* 2007 2008* 2007 2008*
7 61.9% 73.1% 42.1% 71.5%
8 21.1% 62.9% 46.4% 54.3% 63.6% 66.8% 49.3% 53.1%
Physical Setting/Earth Science
NYS Regents* 70.7% 80.6% 72.1% 74.9% 79.9% 74.9% 58.9% 64.
Graduation 2007-08* 87.0% 75.4% 84.
Students at Risk* 55.9% 28.3% 44.2% 31.4% (Percentages of students in all grades not meeting proficiency)
*Official New York State Education Department statistics for 2007-08 have not yet been released. These numbers are the best District estimate.
U.S. History and Government
English Mathematics
Student Demographic DataPosition Information (FTEs)
Mission: Student success: academic, artistic and humanistic. Ours is a community dedicated to infusing the arts; humanities, and
academics into all facets of education, valuing the dignity and inherent worth of self and others, and celebrating the richness and
diversity of our community. Graduates embrace lifelong learning and reflect the values instilled by artistic disciplines.
Global History and Geography
Budget Allocations by Account
ELA Math
Student Achievement (percentage of students attaining proficiency)*
Fiscal Year 2010-11 Allocation Weighting Factors
Section 4 Page 77
School Profiles and Budgets 2009-10 Draft Budget

8/7/2019 2009_2010DRAFT
http://slidepdf.com/reader/full/20092010draft 140/268
School: School Without Walls: Foundation Academy 2008-09 Accountability Status: G
(SWW did not make AYP in the 2008-09 Accountability Year for HS ELA and graduation (Year 1
Address: 111 N. Clinton Ave. 14604 Idonia Owens , Principal Phone: 324-3111
2009 2010 2008-09 2009-10(est
Teachers 18.20 18.20 Total Enrollment 229 22
Principals/AP/AD 1.00 1.00 African American 57.7% 57.7%
Other Instructional 1.80 1.80 Asian 2.1% 2.1%
Non-instructional 5.00 5.00 Hispanic 16.9% 16.9%
Total, Staff 26.00 26.00 Native American 1.0% 1.0%
White 21.5% 21.5%
Teacher-Pupil Ratio 12.6 : 1 12.6 : 1 Free & Reduced Lunch 69.9% 69.9%
Other-Staff-Pupil Ratio 29.4 : 1 29.4 : 1 Special Education 10.3% 10.3%
Total-Staff-Pupil Ratio 8.8 : 1 8.8 : 1 English Language Learners 2.7% 2.7%
Attendance (2007-08) 92.4%
Proposed 2009-10 Funding Allocation Grades Served 7-8 7-8
0000: General Fund - No Project $ 1,146,831
1045: Foundation Aid CR 91,005
1396: District Initiative Budgets - Major Object 2008-09 2009-10
4512: C4E - AVID Program 53,565 Salary Compensation 1,223,927 1,315,81
4515: C4E - Extended Day Program 5,767 Other Compensation 42,340 3,87
4519: C4E - SWW Center for Youth Ser 35,000 Fixed Obligation/Variability 15,400 9,500
4528: C4E - In-School Suspension 66,275 Cash Capital Outlays 13,750 21,475
Facilities and Related 44,870 32,296
Technology 300 1,000
Miscellaneous Services 8,790 9,190
Other Variable Expenses 69,350 5,300
Total, All Objects 1,418,727 1,398,443
Average Daily Attendance pct:
Special Population Units Count wt. Uni
Mobility (applies over 40%)
Free/Reduced Lunch
At Risk
Special Education
Gifted & Talented
Career & Technical Education
English Language Learners
Total, Special Population Units
Total, Refined Units
Total $ 1,398,443 Basic Allocation
Science Social Studies
GRADE 2007 2008* 2007 2008* 2007 2008* 2007 2008*
7 44.6% 72.9% 17.6% 63.4%
8 26.9% 69.9% 23.0% 25.7% 43.7% 71.8% 19.7% 78.9%
Physical Setting/Earth Science
NYS Regents* N/A N/A N/A N/A N/A N/A N/A
Graduation 2007-08* N/A N/A N/A
Students at Risk* 66.8% 28.8% 68.9% 54.5% (Percentages of students in all grades not meeting proficiency)
*Official New York State Education Department statistics for 2007-08 have not yet been released. These numbers are the best District estimate.
Mission: Where Learning Has No Limits
Global History and Geography
Budget Allocations by Account
ELA Math
Student Achievement (percentage of students attaining proficiency)*
Fiscal Year 2010-11 Allocation Weighting Factors
U.S. History and Government
English Mathematics
Student Demographic DataPosition Information (FTEs)
Section 4 Page 78
School Profiles and Budgets 2009-10 Draft Budget
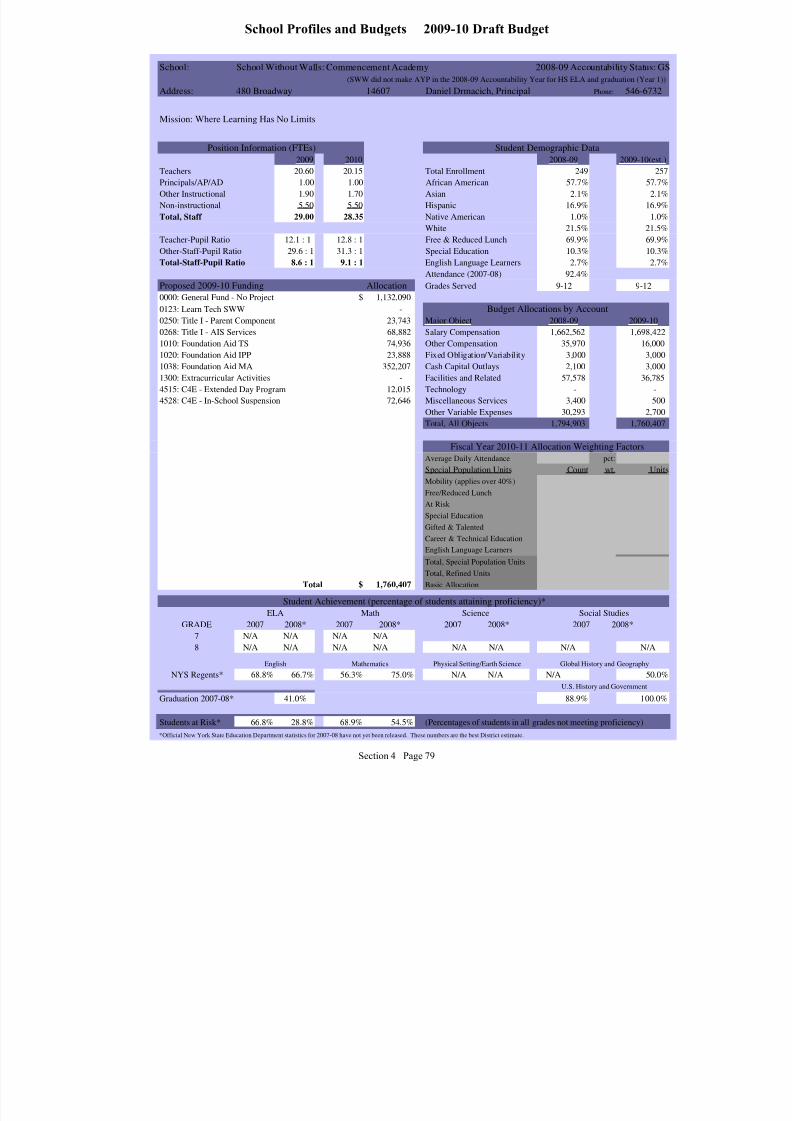
8/7/2019 2009_2010DRAFT
http://slidepdf.com/reader/full/20092010draft 141/268
School: School Without Walls: Commencement Academy 2008-09 Accountability Status: G
(SWW did not make AYP in the 2008-09 Accountability Year for HS ELA and graduation (Year 1
Address: 480 Broadway 14607 Daniel Drmacich, Principal Phone: 546-6732
2009 2010 2008-09 2009-10(est
Teachers 20.60 20.15 Total Enrollment 249 25
Principals/AP/AD 1.00 1.00 African American 57.7% 57.7%
Other Instructional 1.90 1.70 Asian 2.1% 2.1%
Non-instructional 5.50 5.50 Hispanic 16.9% 16.9%
Total, Staff 29.00 28.35 Native American 1.0% 1.0%
White 21.5% 21.5%
Teacher-Pupil Ratio 12.1 : 1 12.8 : 1 Free & Reduced Lunch 69.9% 69.9%
Other-Staff-Pupil Ratio 29.6 : 1 31.3 : 1 Special Education 10.3% 10.3%
Total-Staff-Pupil Ratio 8.6 : 1 9.1 : 1 English Language Learners 2.7% 2.7%
Attendance (2007-08) 92.4%
Proposed 2009-10 Funding Allocation Grades Served 9-12 9-12
0000: General Fund - No Project $ 1,132,090
0123: Learn Tech SWW -
0250: Title I - Parent Component 23,743 Major Object 2008-09 2009-10
0268: Title I - AIS Services 68,882 Salary Compensation 1,662,562 1,698,422
1010: Foundation Aid TS 74,936 Other Compensation 35,970 16,000
1020: Foundation Aid IPP 23,888 Fixed Obligation/Variability 3,000 3,000
1038: Foundation Aid MA 352,207 Cash Capital Outlays 2,100 3,000
1300: Extracurricular Activities - Facilities and Related 57,578 36,785
4515: C4E - Extended Day Program 12,015 Technology - -
4528: C4E - In-School Suspension 72,646 Miscellaneous Services 3,400 500
Other Variable Expenses 30,293 2,700
Total, All Objects 1,794,903 1,760,407
Average Daily Attendance pct:
Special Population Units Count wt. Uni
Mobility (applies over 40%)
Free/Reduced Lunch
At Risk
Special Education
Gifted & Talented
Career & Technical Education
English Language Learners
Total, Special Population Units
Total, Refined Units
Total $ 1,760,407 Basic Allocation
Science Social Studies
GRADE 2007 2008* 2007 2008* 2007 2008* 2007 2008*
7 N/A N/A N/A N/A
8 N/A N/A N/A N/A N/A N/A N/A N/A
Physical Setting/Earth Science
NYS Regents* 68.8% 66.7% 56.3% 75.0% N/A N/A N/A 50.0%
Graduation 2007-08* 41.0% 88.9% 100.0%
Students at Risk* 66.8% 28.8% 68.9% 54.5% (Percentages of students in all grades not meeting proficiency)
*Official New York State Education Department statistics for 2007-08 have not yet been released. These numbers are the best District estimate.
U.S. History and Government
English Mathematics
Student Demographic DataPosition Information (FTEs)
Mission: Where Learning Has No Limits
Global History and Geography
Budget Allocations by Account
ELA Math
Student Achievement (percentage of students attaining proficiency)*
Fiscal Year 2010-11 Allocation Weighting Factors
Section 4 Page 79
School Profiles and Budgets 2009-10 Draft Budget

8/7/2019 2009_2010DRAFT
http://slidepdf.com/reader/full/20092010draft 142/268
School: Joseph C. Wilson Magnet High School: Foundation Academy 2008-09 Accountability Status: SIN
(Wilson Foundation is a School in Need of Improvement Year 1 for 3-8 ELA because they did not make AYP for 2 consecutive yea
Address: 200 Genesee St. 14611 Deasure Matthew , Principal Phone: 463-4100
2009 2010 2008-09 2009-10(es
Teachers 95.80 87.00 Total Enrollment 942 9
Principals/AP/AD 7.00 7.00 African American 78.4% 78.4
Other Instructional 16.80 16.80 Asian 2.6% 2.6
Non-instructional 45.00 43.00 Hispanic 10.4% 10.4
Total, Staff 164.60 153.80 Native American 0.5% 0.5
White 8.1% 8.1
Teacher-Pupil Ratio 9.8 : 1 10.6 : 1 Free & Reduced Lunch 74.0% 74.0
Other-Staff-Pupil Ratio 13.7 : 1 13.8 : 1 Special Education 18.6% 18.6
Total-Staff-Pupil Ratio 5.7 : 1 6 : 1 English Language Learners 1.6% 1.6
Attendance (2007-08) 90.5%
Proposed 2009-10 Funding Allocation Grades Served 7-9 7-9
0000: General Fund - No Project $ 6,731,802
0200: Title IIA - Tchr & Prin Tr/Rec 32,099
0250: Title I - Parent Component 34,603 Major Object 2008-09 2009-10
0268: Title I - AIS Services 131,617 Salary Compensation 7,559,232 7,534,66
0274: Title I - Misc/Carryover - Other Compensation 330,209 65,56
0305: IDEA Support Serv & Sec 611 102,670 Fixed Obligation/Variability 3,500 3,50
0362: IDEA Quality Assurance Impleme 3,564 Cash Capital Outlays 47,213 20,75
0755: SURR Grant - Facilities and Related 106,483 112,70
1020: Foundation Aid IPP 96,692 Technology - -
1045: Foundation Aid CR 153,366 Miscellaneous Services 4,046 3,10
1300: Extracurricular Activities - Other Variable Expenses 19,500 18,20
1357: Student & Family Support Ctr 27,558 Total, All Objects 8,070,183 7,758,48
1395: Community Use 72,278
1910: Drop-Out Prevention 40,672
4020: Green Schools Program - Average Daily Attendance pct:
4512: C4E - AVID Program 48,346 Special Population Units Count wt. Un
4515: C4E - Extended Day Program 70,502 Mobility (applies over 40%)
4524: C4E - Dream Schools 147,906 Free/Reduced Lunch
4528: C4E - In-School Suspension 64,808 At Risk
Special Education
Gifted & Talented
Career & Technical Education
English Language Learners
Total, Special Population Units
Total, Refined Units
Total $ 7,758,483 Basic Allocation
Science Social Studies
GRADE 2007 2008* 2007 2008* 2007 2008* 2007 2008*
7 38.3% 50.8% 25.1% 52.0%
8 43.7% 41.4% 10.9% 33.9% 28.6% 48.7% N/A 33.1%
Physical Setting/Earth Science
NYS Regents* N/A N/A N/A N/A N/A N/A N/A N/A
Graduation 2007-08* N/A N/A N/A
Students at Risk* 57.3% 45.9% 65.2% 52.5% (Percentages of students in all grades not meeting proficiency)
*Official New York State Education Department statistics for 2007-08 have not yet been released. These numbers are the best District estimate.
U.S. History and Government
English Mathematics
Student Demographic DataPosition Information (FTEs)
Mission: Our mission is excellence for all students in all aspects of their development.
Global History and Geography
Budget Allocations by Account
ELA Math
Student Achievement (percentage of students attaining proficiency)*
Fiscal Year 2010-11 Allocation Weighting Factors
Section 4 Page 80
School Profiles and Budgets 2009-10 Draft Budget
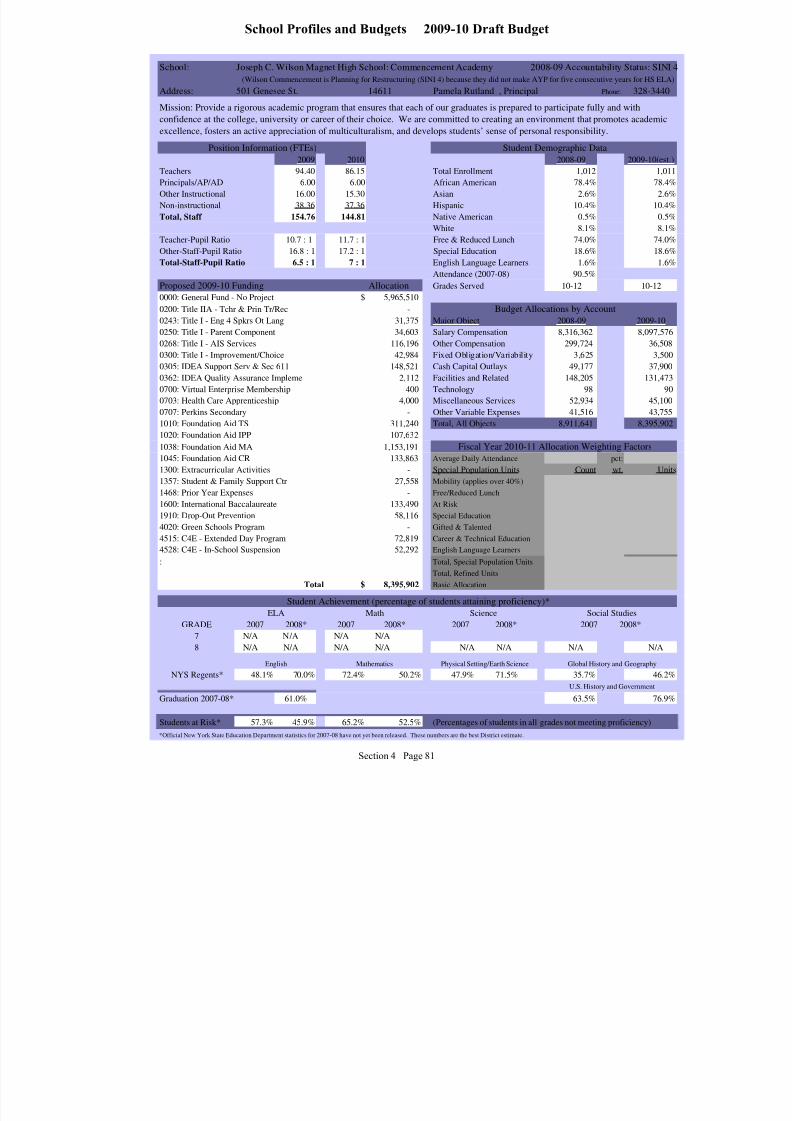
8/7/2019 2009_2010DRAFT
http://slidepdf.com/reader/full/20092010draft 143/268
School: Joseph C. Wilson Magnet High School: Commencement Academy 2008-09 Accountability Status: SIN
(Wilson Commencement is Planning for Restructuring (SINI 4) because they did not make AYP for five consecutive years for HS E
Address: 501 Genesee St. 14611 Pamela Rutland , Principal Phone: 328-344
2009 2010 2008-09 2009-10(e
Teachers 94.40 86.15 Total Enrollment 1,012 1,
Principals/AP/AD 6.00 6.00 African American 78.4% 78
Other Instructional 16.00 15.30 Asian 2.6% 2
Non-instructional 38.36 37.36 Hispanic 10.4% 10
Total, Staff 154.76 144.81 Native American 0.5% 0
White 8.1% 8
Teacher-Pupil Ratio 10.7 : 1 11.7 : 1 Free & Reduced Lunch 74.0% 74
Other-Staff-Pupil Ratio 16.8 : 1 17.2 : 1 Special Education 18.6% 18
Total-Staff-Pupil Ratio 6.5 : 1 7 : 1 English Language Learners 1.6% 1
Attendance (2007-08) 90.5%
Proposed 2009-10 Funding Allocation Grades Served 10-12 10-12
0000: General Fund - No Project $ 5,965,510
0200: Title IIA - Tchr & Prin Tr/Rec -
0243: Title I - Eng 4 Spkrs Ot Lang 31,375 Major Object 2008-09 2009-10
0250: Title I - Parent Component 34,603 Salary Compensation 8,316,362 8,097,5
0268: Title I - AIS Services 116,196 Other Compensation 299,724 36,5
0300: Title I - Improvement/Choice 42,984 Fixed Obligation/Variability 3,625 3,5
0305: IDEA Support Serv & Sec 611 148,521 Cash Capital Outlays 49,177 37,9
0362: IDEA Quality Assurance Impleme 2,112 Facilities and Related 148,205 131,4
0700: Virtual Enterprise Membership 400 Technology 98
0703: Health Care Apprenticeship 4,000 Miscellaneous Services 52,934 45,1
0707: Perkins Secondary - Other Variable Expenses 41,516 43,7
1010: Foundation Aid TS 311,240 Total, All Objects 8,911,641 8,395,9
1020: Foundation Aid IPP 107,632
1038: Foundation Aid MA 1,153,191
1045: Foundation Aid CR 133,863 Average Daily Attendance pct:
1300: Extracurricular Activities - Special Population Units Count wt. U
1357: Student & Family Support Ctr 27,558 Mobility (applies over 40%)
1468: Prior Year Expenses - Free/Reduced Lunch
1600: International Baccalaureate 133,490 At Risk
1910: Drop-Out Prevention 58,116 Special Education
4020: Green Schools Program - Gifted & Talented
4515: C4E - Extended Day Program 72,819 Career & Technical Education
4528: C4E - In-School Suspension 52,292 English Language Learners
: Total, Special Population Units
Total, Refined Units
Total $ 8,395,902 Basic Allocation
Science Social Studies
GRADE 2007 2008* 2007 2008* 2007 2008* 2007 2008*
7 N/A N/A N/A N/A
8 N/A N/A N/A N/A N/A N/A N/A N/A
Physical Setting/Earth Science
NYS Regents* 48.1% 70.0% 72.4% 50.2% 47.9% 71.5% 35.7% 46
Graduation 2007-08* 61.0% 63.5% 76
Students at Risk* 57.3% 45.9% 65.2% 52.5% (Percentages of students in all grades not meeting proficiency)
*Official New York State Education Department statistics for 2007-08 have not yet been released. These numbers are the best District estimate.
Mission: Provide a rigorous academic program that ensures that each of our graduates is prepared to participate fully and with
confidence at the college, university or career of their choice. We are committed to creating an environment that promotes academi
excellence, fosters an active appreciation of multiculturalism, and develops students’ sense of personal responsibility.
Global History and Geography
Budget Allocations by Account
ELA Math
Student Achievement (percentage of students attaining proficiency)*
Fiscal Year 2010-11 Allocation Weighting Factors
U.S. History and Government
English Mathematics
Student Demographic DataPosition Information (FTEs)
Section 4 Page 81
School Profiles and Budgets 2009-10 Draft Budget

8/7/2019 2009_2010DRAFT
http://slidepdf.com/reader/full/20092010draft 144/268
School: East High School 2008-09 Accountability Status: SINI 5-Y
(East is a School Restructuring (SINI 5) Year 3 for HS Math because they did not make AYP for over six consecutive y
Address: 1801 Main St. E. 14609 Edward Cavalier, Principal Phone: 288-31
2009 2010 2008-09 2009-10(e
Teachers 176.20 163.10 Total Enrollment 1,948 1
Principals/AP/AD 13.00 12.00 African American 67.5% 67
Other Instructional 25.00 24.00 Asian 0.9% 0
Non-instructional 67.00 66.00 Hispanic 20.5% 20
Total, Staff 281.20 265.10 Native American 0.3% 0
White 10.6% 10
Teacher-Pupil Ratio 11.1 : 1 11.5 : 1 Free & Reduced Lunch 79.7% 79
Other-Staff-Pupil Ratio 18.6 : 1 18.4 : 1 Special Education 17.9% 17
Total-Staff-Pupil Ratio 6.9 : 1 7.1 : 1 English Language Learners 4.9% 4
Attendance (2007-08) 86.8%
Proposed 2009-10 Funding Allocation Grades Served 7-12 7-12
0000: General Fund - No Project $ 12,593,835
0127: Learn Tech East -
0147: Smaller Learning Communities 179,464 Major Object 2008-09 2009-1
0200: Title IIA - Tchr & Prin Tr/Rec 82,648 Salary Compensation 14,460,040 14,194,
0243: Title I - Eng 4 Spkrs Ot Lang 66,275 Other Compensation 598,040 65,
0250: Title I - Parent Component 25,031 Fixed Obligation/Variability 24,410 18,7
0268: Title I - AIS Services 216,153 Cash Capital Outlays 111,797 83,0
0274: Title I - Misc/Carryover - Facilities and Related 304,225 243,
0300: Title I - Improvement/Choice 43,353 Technology 2,929 1,3
0305: IDEA Support Serv & Sec 611 88,539 Miscellaneous Services 33,956 29,6
0700: Virtual Enterprise Membership 250 Other Variable Expenses 74,201 65,3
0703: Health Care Apprenticeship 20,000 Total, All Objects 15,609,598 14,701,3
1010: Foundation Aid TS 206,080
1020: Foundation Aid IPP 222,003
1045: Foundation Aid CR 227,436 Average Daily Attendance pct:
1151: Teaching/Learning Instit.-East 14,400 Special Population Units Count wt. U
1300: Extracurricular Activities - Mobility (applies over 40%)
1357: Student & Family Support Ctr 51,009 Free/Reduced Lunch
1600: International Baccalaureate 86,950 At Risk
1814: Gear Up Match 126,922 Special Education
1910: Drop-Out Prevention 45,035 Gifted & Talented
4504: C4E - East High School Art Pea 75,648 Career & Technical Education
4512: C4E - AVID Program 57,116 English Language Learners
4515: C4E - Extended Day Program 160,042 Total, Special Population Units
4528: C4E - In-School Suspension 113,154 Total, Refined Units
Total $ 14,701,343 Basic Allocation
Science Social Studies
GRADE 2007 2008* 2007 2008* 2007 2008* 2007 2008*
7 26.7% 31.0% 21.4% 45.2%
8 N/A 24.9% 18.3% 19.4% 13.9% 20.4% 22.0% 21.8%
Physical Setting/Earth Science
NYS Regents* 46.0% 59.1% 63.8% 39.9% 42.7% 60.5% 28.9% 32
Graduation 2007-08* 49.0% 62.0% 69
Students at Risk* 64.6% 64.3% 63.4% 64.6% (Percentages of students in all grades not meeting proficiency)
*Official New York State Education Department statistics for 2007-08 have not yet been released. These numbers are the best District estimate.
U.S. History and Government
English Mathematics
Student Demographic DataPosition Information (FTEs)
Mission: We, the community, staff, parents, and students, are partners in the educational process. We believe that all students can lea
It is our collective goal to ensure that all students have the necessary skills for attaining success after graduation in higher education
the work force.
Global History and Geography
Budget Allocations by Account
ELA Math
Student Achievement (percentage of students attaining proficiency)*
Fiscal Year 2010-11 Allocation Weighting Factors
Section 4 Page 82
School Profiles and Budgets 2009-10 Draft Budget
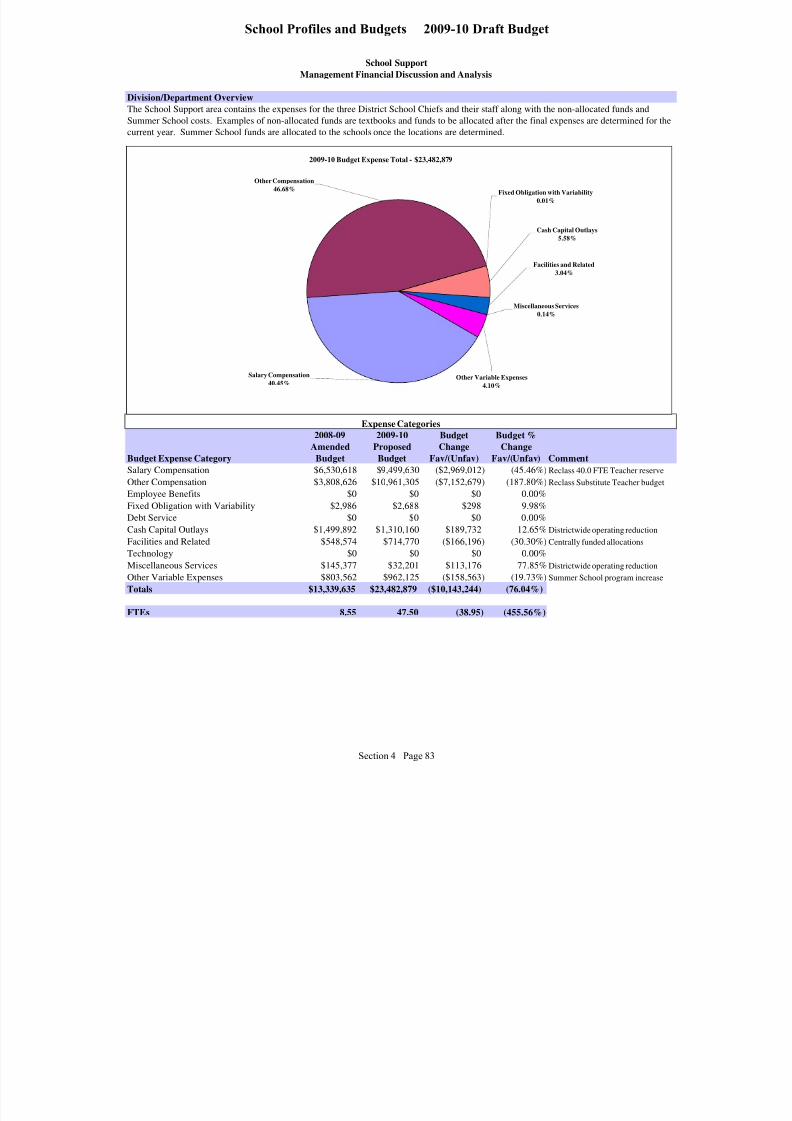
8/7/2019 2009_2010DRAFT
http://slidepdf.com/reader/full/20092010draft 145/268
School Support
Management Financial Discussion and Analysis
Division/Department Overview
Budget Expense Category
2008-09
Amended
Budget
2009-10
Proposed
Budget
Budget
Change
Fav/(Unfav)
Budget %
Change
Fav/(Unfav) CommentSalary Compensation $6,530,618 $9,499,630 ($2,969,012) (45.46%) Reclass 40.0 FTE Teacher reserve
Other Compensation $3,808,626 $10,961,305 ($7,152,679) (187.80%) Reclass Substitute Teacher budge
Employee Benefits $0 $0 $0 0.00%
Fixed Obligation with Variability $2,986 $2,688 $298 9.98%
Debt Service $0 $0 $0 0.00%
Cash Capital Outlays $1,499,892 $1,310,160 $189,732 12.65% Districtwide operating reduction
Facilities and Related $548,574 $714,770 ($166,196) (30.30%) Centrally funded allocations
Technology $0 $0 $0 0.00%
Miscellaneous Services $145,377 $32,201 $113,176 77.85% Districtwide operating reduction
Other Variable Expenses $803,562 $962,125 ($158,563) (19.73%) Summer School program increase
Totals $13,339,635 $23,482,879 ($10,143,244) (76.04%)
FTEs 8.55 47.50 (38.95) (455.56%)
Expense Categories
The School Support area contains the expenses for the three District School Chiefs and their staff along with the non-allocated funds and
Summer School costs. Examples of non-allocated funds are textbooks and funds to be allocated after the final expenses are determined for th
current year. Summer School funds are allocated to the schools once the locations are determined.
2009-10 Budget Expense Total - $23,482,879
Other Variable Expenses
4.10%
Miscellaneous Services
0.14%
Other Compensation
46.68%Fixed Obligation with Variability
0.01%
Cash Capital Outlays
5.58%
Facilities and Related
3.04%
Salary Compensation
40.45%
Section 4 Page 83
School Profiles and Budgets 2009-10 Draft Budget
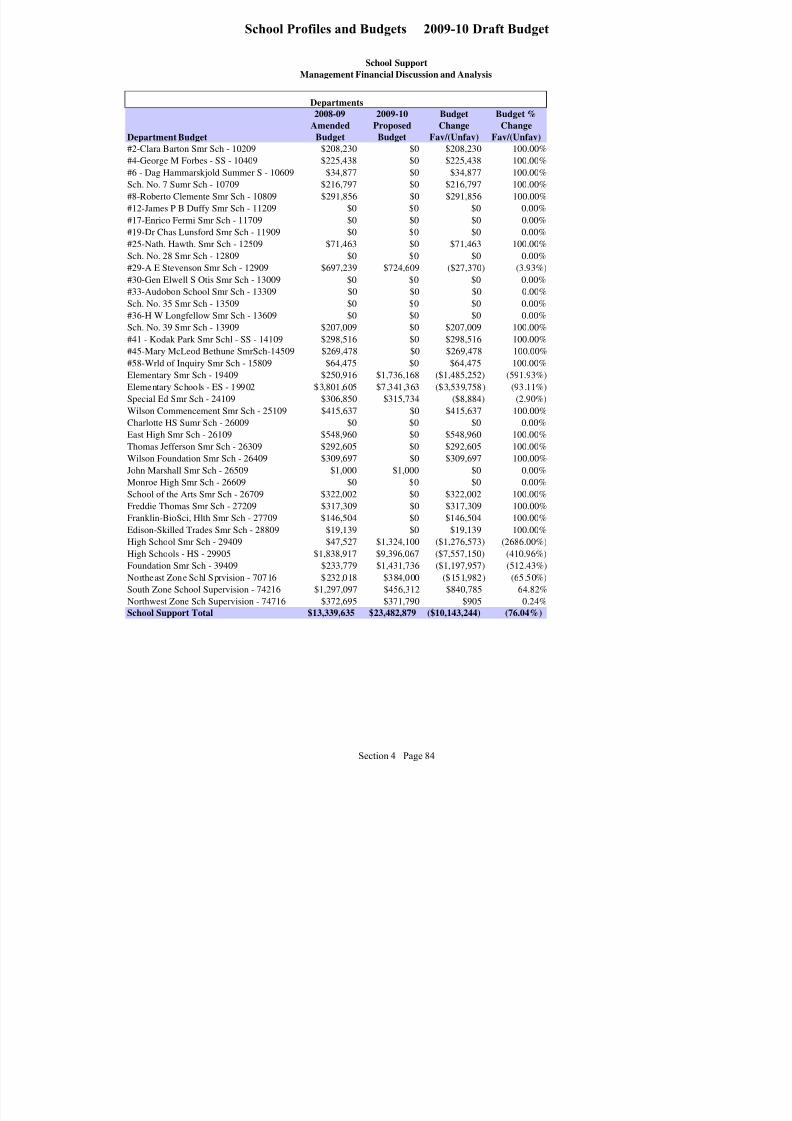
8/7/2019 2009_2010DRAFT
http://slidepdf.com/reader/full/20092010draft 146/268
School Support
Management Financial Discussion and Analysis
Department Budget
2008-09
Amended
Budget
2009-10
Proposed
Budget
Budget
Change
Fav/(Unfav)
Budget %
Change
Fav/(Unfav)
#2-Clara Barton Smr Sch - 10209 $208,230 $0 $208,230 100.00%#4-George M Forbes - SS - 10409 $225,438 $0 $225,438 100.00%
#6 - Dag Hammarskjold Summer S - 10609 $34,877 $0 $34,877 100.00%
Sch. No. 7 Sumr Sch - 10709 $216,797 $0 $216,797 100.00%
#8-Roberto Clemente Smr Sch - 10809 $291,856 $0 $291,856 100.00%
#12-James P B Duffy Smr Sch - 11209 $0 $0 $0 0.00%
#17-Enrico Fermi Smr Sch - 11709 $0 $0 $0 0.00%
#19-Dr Chas Lunsford Smr Sch - 11909 $0 $0 $0 0.00%
#25-Nath. Hawth. Smr Sch - 12509 $71,463 $0 $71,463 100.00%
Sch. No. 28 Smr Sch - 12809 $0 $0 $0 0.00%
#29-A E Stevenson Smr Sch - 12909 $697,239 $724,609 ($27,370) (3.93%)
#30-Gen Elwell S Otis Smr Sch - 13009 $0 $0 $0 0.00%
#33-Audobon School Smr Sch - 13309 $0 $0 $0 0.00%
Sch. No. 35 Smr Sch - 13509 $0 $0 $0 0.00%#36-H W Longfellow Smr Sch - 13609 $0 $0 $0 0.00%
Sch. No. 39 Smr Sch - 13909 $207,009 $0 $207,009 100.00%
#41 - Kodak Park Smr Schl - SS - 14109 $298,516 $0 $298,516 100.00%
#45-Mary McLeod Bethune SmrSch-14509 $269,478 $0 $269,478 100.00%
#58-Wrld of Inquiry Smr Sch - 15809 $64,475 $0 $64,475 100.00%
Elementary Smr Sch - 19409 $250,916 $1,736,168 ($1,485,252) (591.93%)
Elementary Schools - ES - 19902 $3,801,605 $7,341,363 ($3,539,758) (93.11%)
Special Ed Smr Sch - 24109 $306,850 $315,734 ($8,884) (2.90%)
Wilson Commencement Smr Sch - 25109 $415,637 $0 $415,637 100.00%
Charlotte HS Sumr Sch - 26009 $0 $0 $0 0.00%
East High Smr Sch - 26109 $548,960 $0 $548,960 100.00%
Thomas Jefferson Smr Sch - 26309 $292,605 $0 $292,605 100.00%
Wilson Foundation Smr Sch - 26409 $309,697 $0 $309,697 100.00%
John Marshall Smr Sch - 26509 $1,000 $1,000 $0 0.00%
Monroe High Smr Sch - 26609 $0 $0 $0 0.00%
School of the Arts Smr Sch - 26709 $322,002 $0 $322,002 100.00%
Freddie Thomas Smr Sch - 27209 $317,309 $0 $317,309 100.00%
Franklin-BioSci, Hlth Smr Sch - 27709 $146,504 $0 $146,504 100.00%
Edison-Skilled Trades Smr Sch - 28809 $19,139 $0 $19,139 100.00%
High School Smr Sch - 29409 $47,527 $1,324,100 ($1,276,573) (2686.00%)
High Schools - HS - 29905 $1,838,917 $9,396,067 ($7,557,150) (410.96%)
Foundation Smr Sch - 39409 $233,779 $1,431,736 ($1,197,957) (512.43%)
Northeast Zone Schl Sprvision - 70716 $232,018 $384,000 ($151,982) (65.50%)
South Zone School Supervision - 74216 $1,297,097 $456,312 $840,785 64.82%
Northwest Zone Sch Supervision - 74716 $372,695 $371,790 $905 0.24%
School Support Total $13,339,635 $23,482,879 ($10,143,244) (76.04%)
Departments
Section 4 Page 84
School Profiles and Budgets 2009-10 Draft Budget

8/7/2019 2009_2010DRAFT
http://slidepdf.com/reader/full/20092010draft 147/268
School Support
2007-2008 2008-2009 2009-2010
Var Bud vs
Amend
Actual Amended Proposed Fav/(Unfav)
EXPENDITURES BY ACCOUNT
Salary Compensation
Teachers' Salaries - 749,374 2,528,035 (1,778,661)
Civil Service Salaries 320,772 285,755 204,782 80,973
Administrator's Salaries 661,638 430,250 447,245 (16,995)
Hourly Teachers 4,720,917 4,719,939 4,883,873 (163,934)
Teaching Assistants - - - -
Paraprofessionals Salary - 345,300 1,435,695 (1,090,395)
Sub Total Salary Compensation 5,703,327 6,530,618 9,499,630 (2,969,012)
Other Compensation
Substitute Teacher Cost 90,626 2,715,751 10,191,610 (7,475,859)
Overtime Non-Instructional Sal 564,381 670,579 650,676 19,903
Teachers In Service 203,664 422,296 119,019 303,277
Sub Total Other Compensation 858,671 3,808,626 10,961,305 (7,152,679)
Total Salary and Other Compensation 6,561,998 10,339,244 20,460,935 (10,121,691) Sub Total Employee Benefits - - - -
Total Compensation and Benefits 6,561,998 10,339,244 20,460,935 (10,121,691)
Fixed Obligations With Variability
Special Education Tuition - - - -
Contract Transportation 5,015 2,986 2,688 298
Charter School Tuition - - - -
Health Service Other Districts - - - -
Insurance Non-employee - - - -
Sub Total Fixed Obligations 5,015 2,986 2,688 298
Debt Service
Sub Total Debt Service - - - -
Cash Capital Outlays
Cash Capital Expense - - - -
Textbooks 1,781,818 1,499,892 1,302,160 197,732
Equipment Other Than Buses - - 8,000 (8,000) Equipment Buses - - - -
Computer Hardware - Instructional - - - -
Computer Hardware - Non Instructional 992 - - -
Library Books - - - -
Sub Total Cash Capital Outlays 1,782,809 1,499,892 1,310,160 189,732
Expenditure Summary (All Funds)
Section 4 Page 85
School Profiles and Budgets 2009-10 Draft Budget
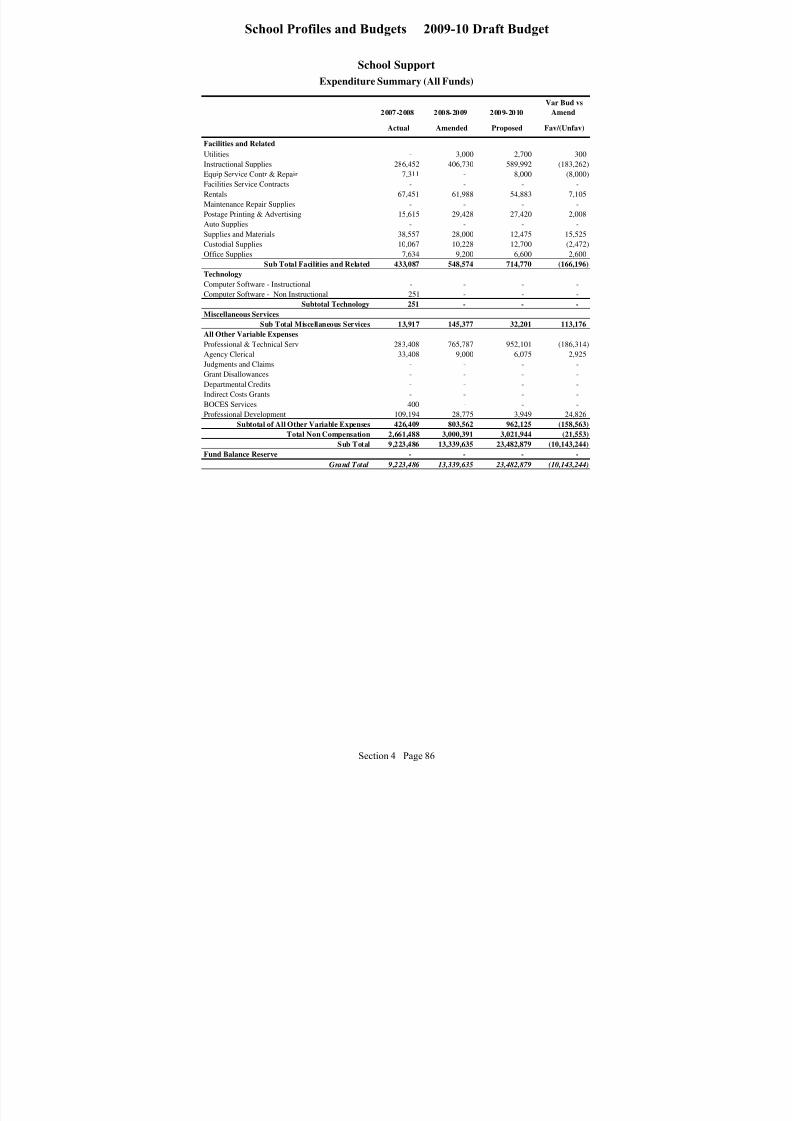
8/7/2019 2009_2010DRAFT
http://slidepdf.com/reader/full/20092010draft 148/268
School Support
2007-2008 2008-2009 2009-2010
Var Bud vs
Amend
Actual Amended Proposed Fav/(Unfav)
Expenditure Summary (All Funds)
Facilities and Related
Utilities - 3,000 2,700 300
Instructional Supplies 286,452 406,730 589,992 (183,262)
Equip Service Contr & Repair 7,311 - 8,000 (8,000)
Facilities Service Contracts - - - -
Rentals 67,451 61,988 54,883 7,105
Maintenance Repair Supplies - - - -
Postage Printing & Advertising 15,615 29,428 27,420 2,008
Auto Supplies - - - -
Supplies and Materials 38,557 28,000 12,475 15,525
Custodial Supplies 10,067 10,228 12,700 (2,472)
Office Supplies 7,634 9,200 6,600 2,600
Sub Total Facilities and Related 433,087 548,574 714,770 (166,196)
Technology
Computer Software - Instructional - - - -
Computer Software - Non Instructional 251 - - -
Subtotal Technology 251 - - - Miscellaneous Services
Sub Total Miscellaneous Services 13,917 145,377 32,201 113,176
All Other Variable Expenses
Professional & Technical Serv 283,408 765,787 952,101 (186,314)
Agency Clerical 33,408 9,000 6,075 2,925
Judgments and Claims - - - -
Grant Disallowances - - - -
Departmental Credits - - - -
Indirect Costs Grants - - - -
BOCES Services 400 - - -
Professional Development 109,194 28,775 3,949 24,826
Subtotal of All Other Variable Expenses 426,409 803,562 962,125 (158,563)
Total Non Compensation 2,661,488 3,000,391 3,021,944 (21,553)
Sub Total 9,223,486 13,339,635 23,482,879 (10,143,244)
Fund Balance Reserve - - - - Grand Total 9,223,486 13,339,635 23,482,879 (10,143,244)
Section 4 Page 86
School Profiles and Budgets 2009-10 Draft Budget
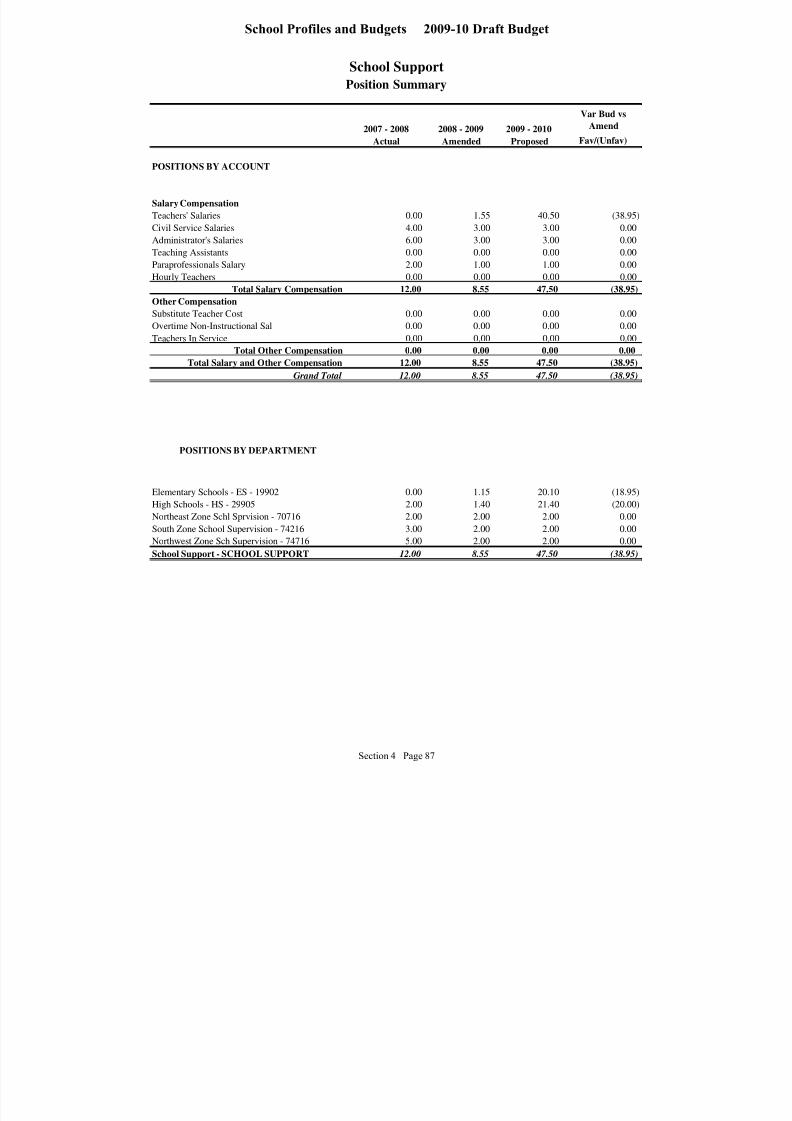
8/7/2019 2009_2010DRAFT
http://slidepdf.com/reader/full/20092010draft 149/268
School Support
2007 - 2008 2008 - 2009 2009 - 2010
Var Bud vs
Amend
Actual Amended Proposed Fav/(Unfav)
POSITIONS BY ACCOUNT
Salary Compensation
Teachers' Salaries 0.00 1.55 40.50 (38.95)
Civil Service Salaries 4.00 3.00 3.00 0.00
Administrator's Salaries 6.00 3.00 3.00 0.00
Teaching Assistants 0.00 0.00 0.00 0.00
Paraprofessionals Salary 2.00 1.00 1.00 0.00
Hourly Teachers 0.00 0.00 0.00 0.00
Total Salary Compensation 12.00 8.55 47.50 (38.95)
Other CompensationSubstitute Teacher Cost 0.00 0.00 0.00 0.00
Overtime Non-Instructional Sal 0.00 0.00 0.00 0.00
Teachers In Service 0.00 0.00 0.00 0.00
Total Other Compensation 0.00 0.00 0.00 0.00
Total Salary and Other Compensation 12.00 8.55 47.50 (38.95)
Grand Total 12.00 8.55 47.50 (38.95)
POSITIONS BY DEPARTMENT
Elementary Schools - ES - 19902 0.00 1.15 20.10 (18.95)
High Schools - HS - 29905 2.00 1.40 21.40 (20.00)
Northeast Zone Schl Sprvision - 70716 2.00 2.00 2.00 0.00
South Zone School Supervision - 74216 3.00 2.00 2.00 0.00
Northwest Zone Sch Supervision - 74716 5.00 2.00 2.00 0.00
School Support - SCHOOL SUPPORT 12.00 8.55 47.50 (38.95)
Position Summary
Section 4 Page 87
School Profiles and Budgets 2009-10 Draft Budget

8/7/2019 2009_2010DRAFT
http://slidepdf.com/reader/full/20092010draft 150/268
THIS PAGE INTENTIONALLY LEFT BLANK
Section 4 Page 88
School Profiles and Budgets 2009-10 Draft Budget

8/7/2019 2009_2010DRAFT
http://slidepdf.com/reader/full/20092010draft 151/268
Program ProfIles and Budgets
Overview Individual Program Summaries

8/7/2019 2009_2010DRAFT
http://slidepdf.com/reader/full/20092010draft 152/268
THIS PAGE INTENTIONALLY LEFT BLANK
Section 5 Page 2
Program Profiles and Budgets 2009-10 Draft Budget

8/7/2019 2009_2010DRAFT
http://slidepdf.com/reader/full/20092010draft 153/268
PROGRAM-BASED BUDGETING (PBB)
Program-Based Budgeting (PBB) is a program-based format that supplements the traditionalnarrative and financial information in the Budget Book. PBB links programs to the Board of
Education/Superintendent goals and objectives and provides measures of achievements to
evaluate the program in meeting the District’s Strategic Plan. The PBB format used to present
each program or group of related programs is organized into three sections: Program Descriptionand Objectives, Program Measures/Metrics, and Financial Information.
I. Program Description Section provides a brief description of the program or group of related
programs and summarizes the objectives. These objectives should be aligned with the Board of
Education/Superintendent goals, as well as student achievement and/or customer service
outcomes whenever possible.
II. Program Measures/Metrics Section provides quantifiable measures/metrics to facilitate
assessment of the program’s value toward achieving its stated objectives. The measures/metrics
should reflect a multiple year outlook that supports the program’s current and future value
towards meeting organizational goals and objectives. This section provides statistics that measure
student achievement and/or customer service outcomes against stated program objectives. Some
of the available data to compare change include total grade/school results year to year; only
program results year to year; total grade/school cohort results by each year; only program cohortresults by each year. Due to limited space on the PBB form and a need for a uniform measure,
only program results year to year or total grade/school results year to year are reported on the
form. More detailed measures/metrics are provided through C4E year end evaluation forms.
Evaluation of programs is strengthened by relative comparisons to total District results and other
comparable programs.
III. Financial Information Section goes beyond the traditional cost and FTE information
provided in the current Budget Book format. It also lists program funding sources such as grants,
local funds or user fees, as well as providing costs on a per student or service basis. This
additional financial information shows a program’s net cost on a per unit basis to provide a
standard measure for comparison to other programs throughout the organization.
Contract for Excellence Programs Other Programs Art Peace at East High School Agency Youth Program
AVID Careers in Teaching (CIT)
Bryant & Stratton Middle College Commencement Summer School
Charlotte HS Urban League Diversity Initiative – Recruiting
Dream School #8 Incarcerated Youth Program
Dream School #45 Instructional Technology Support
Dream School #63 Jefferson Interscholastic Sports
Dream School #68 Wilson Foundation School Food Service
Dream School #84 Global Media Special Ed – NorthSTAR Program
Dream School #86 Finance Special Ed–Occupational & Physical Therapy
Elementary Summer Program (AIS) Special Ed - RCSD Summer Program
Encompass Extended Day/Year Program (AIS)
Great Beginnings
In-School Suspension (ISS)
On Campus Intervention Program (OCIP)
Reading First
Springboard
School W Walls Center for Youth Services
Section 5 Page 3
Program Profiles and Budgets 2009-10 Draft Budget

8/7/2019 2009_2010DRAFT
http://slidepdf.com/reader/full/20092010draft 154/268
Program Name:
Number of students served: 144 Location:
Grade level(s) of students served: 7-8
Program Description:
Program Objectives:
Program Measures:
2006-07
Actual
2007-08
Actual
2008-09
Budget
2009-10
Budget
2010-2011
Projected
N/A 31.0% 71.0%
N/A 25.2% 47.0%
Revenue:
N/A 187,539 225,053 184,591 189,065
N/A 187,539$ 225,053$ 184,591$ 189,065$
Expenditures:
N/A - - - -
N/A 44,448 58,939 55,648 58,09
N/A - - - - N/A 12,428 15,606 14,887 16,918
N/A 56,876 74,545 70,535 75,009
Operating Expenses:
N/A 130,662 150,508 114,056 114,056
N/A 130,662 150,508 114,056 114,056
N/A 187,539$ 225,053$ 184,591$ 189,065$
Position Summary (FTE)
N/A - - - -
N/A 0.60 0.60 0.60 0.60 N/A - - - -
N/A 0.60 0.60 0.60 0.60
Per Unit Cost Measures
N/A 1,302$ 1,563$ 1,282$ 1,313$
East High School
ArtPeace at East
ArtPeace is an innovative alternative program in collaboration with ArtPeace, Inc. is an in collaboration with. It integrates thearts and technology across the curriculum to serve students with varying abilities and learning styles. Learning is made more
meaningful for students by engaging them in an environment that is both created and enriched with the arts and technology as a
base for all instruction. ArtPeace students experience daily exposure to visual art, music, dance, and media technology as it is
infused into the required RCSD curriculum. The program also provides cross-curricular collaboration that integrates the core
subject areas with the arts to provide a comprehensive, multi-disciplinary learning environment. 2007-08 grade 7; 2008-09
grades 7 -8; 2009-10 grades 7-10 C4EYr1
1) Percent passing NYS ELA 7
Cost per student enrolled
Administrator Salaries
Teacher Salaries
Clerical/Para/Sentry SalariesBenefit Expense
Subtotal - Salary & Benefits
Material and Supplies
Civil Service
Total Positions
General Fund
1) Increase the percent of students scoring in Levels 3 & 4 on NYS ELA 7
Total Revenue
Teachers
Subtotal - Operating Expenses
Total Expenditures
Administrators
2) Increase the percent of students scoring in Levels 3 & 4 on NYS ELA 8
2) Percent passing NYS ELA 8
Section 5 Page 4
Program Profiles and Budgets 2009-10 Draft Budget

8/7/2019 2009_2010DRAFT
http://slidepdf.com/reader/full/20092010draft 155/268
Program Name:
Number of students served: 906 Location:
Grade level(s) of students served: 7-9
Program Description:
Program Objectives:
Program Measures:
2006-07
Actual
2007-08
Actual
2008-09
Budget
2009-10
Budget
2010-2011
Projected
N/A 63.0% 75.0% 75.0% 75.0%
N/A 17.0% 50.0% 50.0% 50.0%
N/A N/A N/A 100.0% 100.0%
Revenue:
N/A 161,432 2,006,110 1,640,971 1,740,129
N/A 161,432$ 2,006,110$ 1,640,971$ 1,740,129$
Expenditures:
N/A 95,306 100,619 104,593 109,185
N/A - 903,602 943,270 984,680
N/A - - 60,000 62,634 N/A 24,543 337,865 363,648 414,171
N/A 119,849 1,342,086 1,471,511 1,570,669
Operating Expenses:
N/A 5,864 13,294 14,000 14,000
N/A 35,719 650,730 155,460 155,460
N/A 41,583 664,024 169,460 169,460
N/A 161,432$ 2,006,110$ 1,640,971$ 1,740,129$
Position Summary (FTE)
N/A 1.0 1.0 1.0 1.0
N/A - 18.0 18.0 18.0 N/A - - - -
N/A 1.0 19.0 19.0 19.0
Per Unit Cost Measures
N/A 178$ 2,214$ 1,811$ 1,921$
Administrators
Other Variable Expenses
Subtotal - Operating Expenses
Total Expenditures
2) % of students enrolled in AP class
3) Compliance with AVID program
General Fund
Total Revenue
Cost per student enrolled
Administrator Salaries
Teacher Salaries
Clerical/Para/Sentry SalariesBenefit Expense
Subtotal - Salary & Benefits
Civil Service
Total Positions
Material and Supplies
Teachers
15 sec schools with grade 7
AVID (Advancement Via Individual Determination)
AVID is designed to increase school-wide learning and performance by ensuring that all students, and most especially the least served
students who are in the middle: • succeed in rigorous curriculum • complete a rigorous college preparatory path • enter mainstreamactivities of the school • increase their enrollment in four-year colleges, and become educated and responsible participants and leaders in a
democratic society. AVID’s systematic approach is designed to support students and educators as they increase school-wide/district-wide
learning and performance. The purpose of AVID is to restructure the teaching methods of an entire school and to open access to the
curricula that will ensure four-year college eligibility to almost all students.
In 2007-08, the Avid program was in three schools: East, Imaging & Information Technology and Edison Applied Technology. Beginning
in 2008-09, AVID program is in all schools that have Grade 7-9 students.
1) % of students enrolled in Algebra
1) Increase percent of AVID students enrolled in Algebra
2) Increase percent of AVID students enrolled in at least one AP class
3) 100% compliance with AVID program essential measurements
Section 5 Page 5
Program Profiles and Budgets 2009-10 Draft Budget
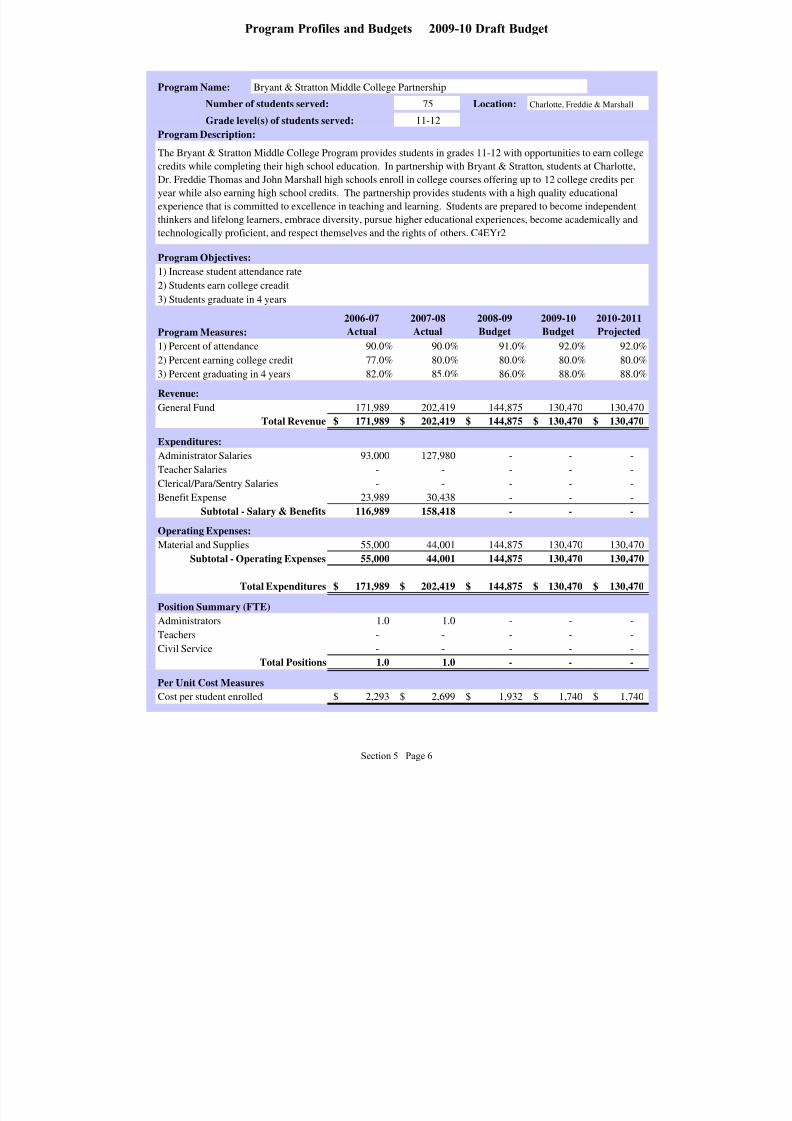
8/7/2019 2009_2010DRAFT
http://slidepdf.com/reader/full/20092010draft 156/268
Program Name:
Number of students served: 75 Location:
Grade level(s) of students served: 11-12
Program Description:
Program Objectives:
Program Measures:
2006-07
Actual
2007-08
Actual
2008-09
Budget
2009-10
Budget
2010-2011
Projected
90.0% 90.0% 91.0% 92.0% 92.0%
77.0% 80.0% 80.0% 80.0% 80.0%
82.0% 85.0% 86.0% 88.0% 88.0%
Revenue:
171,989 202,419 144,875 130,470 130,470
171,989$ 202,419$ 144,875$ 130,470$ 130,470$
Expenditures:
93,000 127,980 - - - - - - - -
- - - - -
23,989 30,438 - - -
116,989 158,418 - - -
Operating Expenses:
55,000 44,001 144,875 130,470 130,470
55,000 44,001 144,875 130,470 130,470
171,989$ 202,419$ 144,875$ 130,470$ 130,470$
Position Summary (FTE)1.0 1.0 - - -
- - - - -
- - - - -
1.0 1.0 - - -
Per Unit Cost Measures
2,293$ 2,699$ 1,932$ 1,740$ 1,740$
3) Percent graduating in 4 years
Charlotte, Freddie & Marshall
Bryant & Stratton Middle College Partnership
The Bryant & Stratton Middle College Program provides students in grades 11-12 with opportunities to earn collegecredits while completing their high school education. In partnership with Bryant & Stratton, students at Charlotte,
Dr. Freddie Thomas and John Marshall high schools enroll in college courses offering up to 12 college credits per
year while also earning high school credits. The partnership provides students with a high quality educational
experience that is committed to excellence in teaching and learning. Students are prepared to become independent
thinkers and lifelong learners, embrace diversity, pursue higher educational experiences, become academically and
technologically proficient, and respect themselves and the rights of others. C4EYr2
1) Percent of attendance
Cost per student enrolled
Administrator SalariesTeacher Salaries
Clerical/Para/Sentry Salaries
Benefit Expense
Subtotal - Salary & Benefits
Material and Supplies
Civil Service
Total Positions
General Fund
1) Increase student attendance rate
Total Revenue
Teachers
Subtotal - Operating Expenses
Total Expenditures
Administrators
2) Students earn college creadit
3) Students graduate in 4 years
2) Percent earning college credit
Section 5 Page 6
Program Profiles and Budgets 2009-10 Draft Budget

8/7/2019 2009_2010DRAFT
http://slidepdf.com/reader/full/20092010draft 157/268
Program Name:
Number of students served: 100 Location:
Grade level(s) of students served: 7
Program Description:
Program Objectives:
Program Measures:
2006-07
Actual
2007-08
Actual
2008-09
Budget
2009-10
Budget
2010-2011
Projected
N/A 2.0% 1.0% 0.0% 0.0%
N/A 14.0% 20.0% 25.0% 30.0%
N/A 18.0% 30.0% 40.0% 45.0%
Revenue:
N/A 203,452 228,884 228,884 228,884
N/A 203,452$ 228,884$ 228,884$ 228,884$
Expenditures:
N/A - - - - N/A - - - -
N/A - - - -
N/A - - - -
N/A - - - -
Operating Expenses:
N/A 203,452 228,884 228,884 228,884
N/A 203,452 228,884 228,884 228,884
N/A 203,452$ 228,884$ 228,884$ 228,884$
Position Summary (FTE)N/A - - - -
N/A - - - -
N/A - - - -
N/A - - - -
Per Unit Cost Measures
N/A 2,035$ 2,289$ 2,289$ 2,289$
General Fund
1) Reduce number of student receiving long term suspension
Total Revenue
Teachers
Subtotal - Operating Expenses
Total Expenditures
Administrators
2) Increase percent of students scoring Level 3 & 4 on NYS ELA 7
3) Increase percent of students scoring Level 3 & 4 on NYS Math 7
2) Percent passing NYS ELA 7
Cost per student enrolled
Administrator SalariesTeacher Salaries
Clerical/Para/Sentry Salaries
Benefit Expense
Subtotal - Salary & Benefits
Material and Supplies
Civil Service
Total Positions
3) Percent passing NYS Math 7
Charlotte
Charlotte HS Urban League
Charlotte High School partners with the Urban League to provide wrap-around services for incoming 7th grade
students at risk of academic failure, with discipline problems and/or social and emotional issues. The primary
program components are social wellness, youth mentoring, academic support services, case management, and job
readiness training. An individualized program plan focusing on school performance, behavior management, and job
readiness is prepared for each student to guide them through the program. C4EYr2
1) Percent with long term suspension
Section 5 Page 7
Program Profiles and Budgets 2009-10 Draft Budget

8/7/2019 2009_2010DRAFT
http://slidepdf.com/reader/full/20092010draft 158/268
Program Name:
Number of students served: 162 Location:
Grade level(s) of students served: 3-6
Program Description:
Program Objectives:
Program Measures:
2006-07
Actual
2007-08
Actual
2008-09
Budget
2009-10
Budget
2010-2011
Projected
N/A 31.6% 34.8%N/A 27.0% 29.7%
N/A 17.2% 18.9%
Revenue:
N/A N/A 110,576 106,454 110,759
N/A N/A 110,576$ 106,454$ 110,759$
Expenditures:
N/A N/A 46,144 47,967 50,073
N/A N/A 9,587 7,200 7,516
N/A N/A - - -
N/A N/A 14,345 13,887 15,770
N/A N/A 70,076 69,054 73,359
Operating Expenses:
N/A N/A 40,500 37,400 37,400
N/A N/A 40,500 37,400 37,400
N/A N/A 110,576$ 106,454$ 110,759$
Position Summary (FTE)
N/A N/A 0.5 0.5 0.5
N/A N/A - - -
N/A N/A - - -
N/A N/A 0.5 0.5 0.5
Per Unit Cost Measures
N/A N/A 683$ 657$ 684$
General Fund
1) Increase the percent of students scoring in Levels 3 & 4 on the NYS ELA 3
Total Revenue
Teachers
Subtotal - Operating Expenses
Total Expenditures
Administrators
2) Increase the percent of students scoring in Levels 3 & 4 on the NYS ELA 6
3) Increase the percent of students scoring in Levels 3 & 4 on the NYS Math 6
2) Percent passing NYS ELA 6
Cost per student enrolled
Administrator Salaries
Teacher Salaries
Clerical/Para/Sentry Salaries
Benefit Expense
Subtotal - Salary & Benefits
Material and Supplies
Civil Service
Total Positions
3) Percent passing NYS Math 6
#8 Roberto Clemente
Dream School #8
1) Percent passing NYS ELA 3
The Dream School Program at #8 provides professional development to staff working with students in grades 3 and 6in the areas of ELA and math. Professional development focuses on best teaching practices, the writing process, and
strategies for teaching writing, asking critical questions during math instruction, and teaching number sense and
operations with conceptual understanding. C4EYr1
Section 5 Page 8
Program Profiles and Budgets 2009-10 Draft Budget

8/7/2019 2009_2010DRAFT
http://slidepdf.com/reader/full/20092010draft 159/268
Program Name:
Number of students served: app 380 Location:
Grade level(s) of students served: K-6
Program Description:
Program Objectives:
Program Measures:2006-07Actual
2007-08Actual
2008-09Budget
2009-10Budget
2010-2011Projected
N/A 44.4% 50.0% 55.0% 60.0%
N/A 34.0% 38.0% 42.0% 46.0%
N/A 37.0% 40.0% 45.0% 50.0%
Revenue:
N/A N/A 153,616 152,637 157,579
N/A N/A 153,616$ 152,637$ 157,579$
Expenditures:
N/A N/A 46,144 47,967 50,073
N/A N/A 9,587 7,200 7,516 N/A N/A 22,392 23,276 24,298
N/A N/A 34,993 36,794 42,032
N/A N/A 113,116 115,237 123,919
Operating Expenses:
N/A N/A 40,500 37,400 33,660
N/A N/A 40,500 37,400 33,660
N/A N/A
N/A N/A 153,616$ 152,637$ 157,579$
Position Summary (FTE)
N/A N/A 0.5 0.5 0.5
N/A N/A - - -
N/A N/A 2.0 2.0 2.0
N/A N/A 2.5 2.5 2.5
Per Unit Cost Measures
N/A N/A 404$ 402$ 415$
General Fund
1) Increase the percent of students scoring in Levels 3 & 4 on the TerraNova ELA 1
Total Revenue
Teachers
Subtotal - Operating Expenses
Total Expenditures
Administrators
2) Increase the percent of students scoring in Levels 3 & 4 on the TerraNova ELA 2
3) Increase the percent of students scoring in Levels 3 & 4 on the NYS ELA 3-8
2) Percent passing TerraNova ELA 2
Cost per student enrolled
Administrator Salaries
Teacher SalariesClerical/Para/Sentry Salaries
Benefit Expense
Subtotal - Salary & Benefits
Material and Supplies
Civil Service
Total Positions
3) Percent passing NYS ELA 3-8
#45 Mary McLeod
Dream School #45
The Dream School Program at #45 provides professional development to staff working with students in grades K
through 6 in ELA. Professional development focuses on developing instructional leaders through exemplary
instructional practices. Professional development sessions focus on reflecting, planning, and modifying instruction to
improve ELA achievement. A second area of focus is a consistent understanding of solid writing practices with
vertical alignment K-6. C4EYr1
1) Percent passing TerraNova ELA 1
Section 5 Page 9
Program Profiles and Budgets 2009-10 Draft Budget
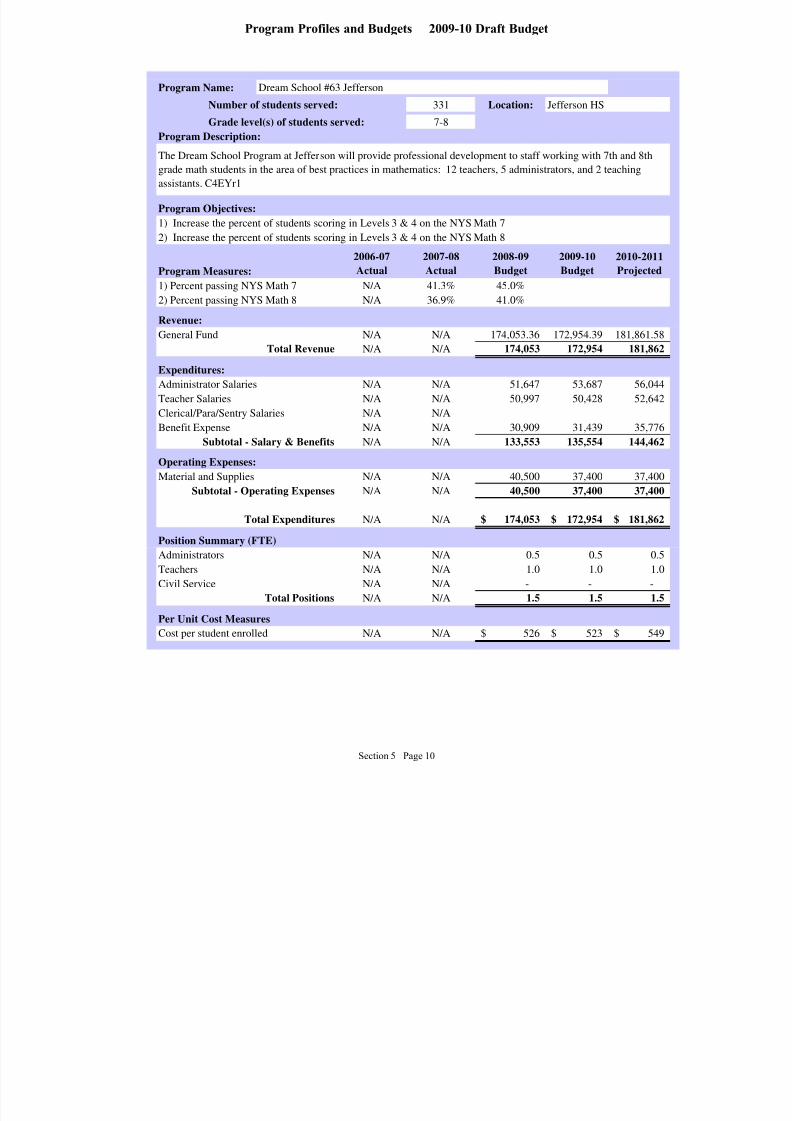
8/7/2019 2009_2010DRAFT
http://slidepdf.com/reader/full/20092010draft 160/268
Program Name:
Number of students served: 331 Location:
Grade level(s) of students served: 7-8
Program Description:
Program Objectives:
Program Measures:
2006-07
Actual
2007-08
Actual
2008-09
Budget
2009-10
Budget
2010-2011
Projected
N/A 41.3% 45.0%
N/A 36.9% 41.0%Revenue:
N/A N/A 174,053.36 172,954.39 181,861.58
N/A N/A 174,053 172,954 181,862
Expenditures:
N/A N/A 51,647 53,687 56,044
N/A N/A 50,997 50,428 52,642
N/A N/A
N/A N/A 30,909 31,439 35,776
N/A N/A 133,553 135,554 144,462
Operating Expenses:
N/A N/A 40,500 37,400 37,400
N/A N/A 40,500 37,400 37,400
N/A N/A 174,053$ 172,954$ 181,862$
Position Summary (FTE)
N/A N/A 0.5 0.5 0.5
N/A N/A 1.0 1.0 1.0
N/A N/A - - -
N/A N/A 1.5 1.5 1.5
Per Unit Cost Measures
N/A N/A 526$ 523$ 549$
General Fund
1) Increase the percent of students scoring in Levels 3 & 4 on the NYS Math 7
Total Revenue
Teachers
Subtotal - Operating Expenses
Total Expenditures
Administrators
2) Increase the percent of students scoring in Levels 3 & 4 on the NYS Math 8
2) Percent passing NYS Math 8
Cost per student enrolled
Administrator Salaries
Teacher Salaries
Clerical/Para/Sentry Salaries
Benefit Expense
Subtotal - Salary & Benefits
Material and Supplies
Civil Service
Total Positions
Jefferson HS
Dream School #63 Jefferson
The Dream School Program at Jefferson will provide professional development to staff working with 7th and 8th
grade math students in the area of best practices in mathematics: 12 teachers, 5 administrators, and 2 teaching
assistants. C4EYr1
1) Percent passing NYS Math 7
Section 5 Page 10
Program Profiles and Budgets 2009-10 Draft Budget
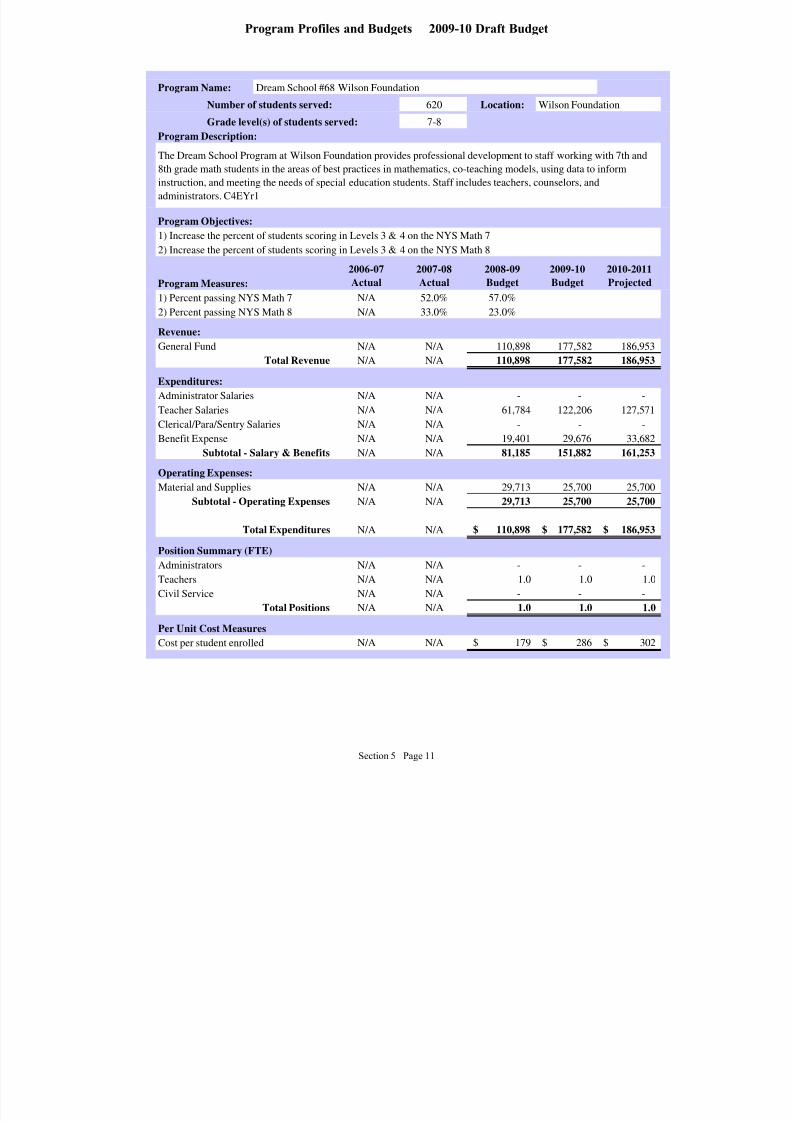
8/7/2019 2009_2010DRAFT
http://slidepdf.com/reader/full/20092010draft 161/268
Program Name:
Number of students served: 620 Location:
Grade level(s) of students served: 7-8
Program Description:
Program Objectives:
Program Measures:
2006-07
Actual
2007-08
Actual
2008-09
Budget
2009-10
Budget
2010-2011
Projected
N/A 52.0% 57.0%N/A 33.0% 23.0%
Revenue:
N/A N/A 110,898 177,582 186,953
N/A N/A 110,898 177,582 186,953
Expenditures:
N/A N/A - - -
N/A N/A 61,784 122,206 127,571
N/A N/A - - -
N/A N/A 19,401 29,676 33,682
N/A N/A 81,185 151,882 161,253
Operating Expenses:
N/A N/A 29,713 25,700 25,700
N/A N/A 29,713 25,700 25,700
N/A N/A 110,898$ 177,582$ 186,953$
Position Summary (FTE)
N/A N/A - - -
N/A N/A 1.0 1.0 1.0
N/A N/A - - -
N/A N/A 1.0 1.0 1.0
Per Unit Cost Measures
N/A N/A 179$ 286$ 302$
General Fund
1) Increase the percent of students scoring in Levels 3 & 4 on the NYS Math 7
Total Revenue
Teachers
Subtotal - Operating Expenses
Total Expenditures
Administrators
2) Increase the percent of students scoring in Levels 3 & 4 on the NYS Math 8
2) Percent passing NYS Math 8
Cost per student enrolled
Administrator Salaries
Teacher Salaries
Clerical/Para/Sentry Salaries
Benefit Expense
Subtotal - Salary & Benefits
Material and Supplies
Civil Service
Total Positions
Wilson Foundation
Dream School #68 Wilson Foundation
The Dream School Program at Wilson Foundation provides professional development to staff working with 7th and
8th grade math students in the areas of best practices in mathematics, co-teaching models, using data to inform
instruction, and meeting the needs of special education students. Staff includes teachers, counselors, and
administrators. C4EYr1
1) Percent passing NYS Math 7
Section 5 Page 11
Program Profiles and Budgets 2009-10 Draft Budget
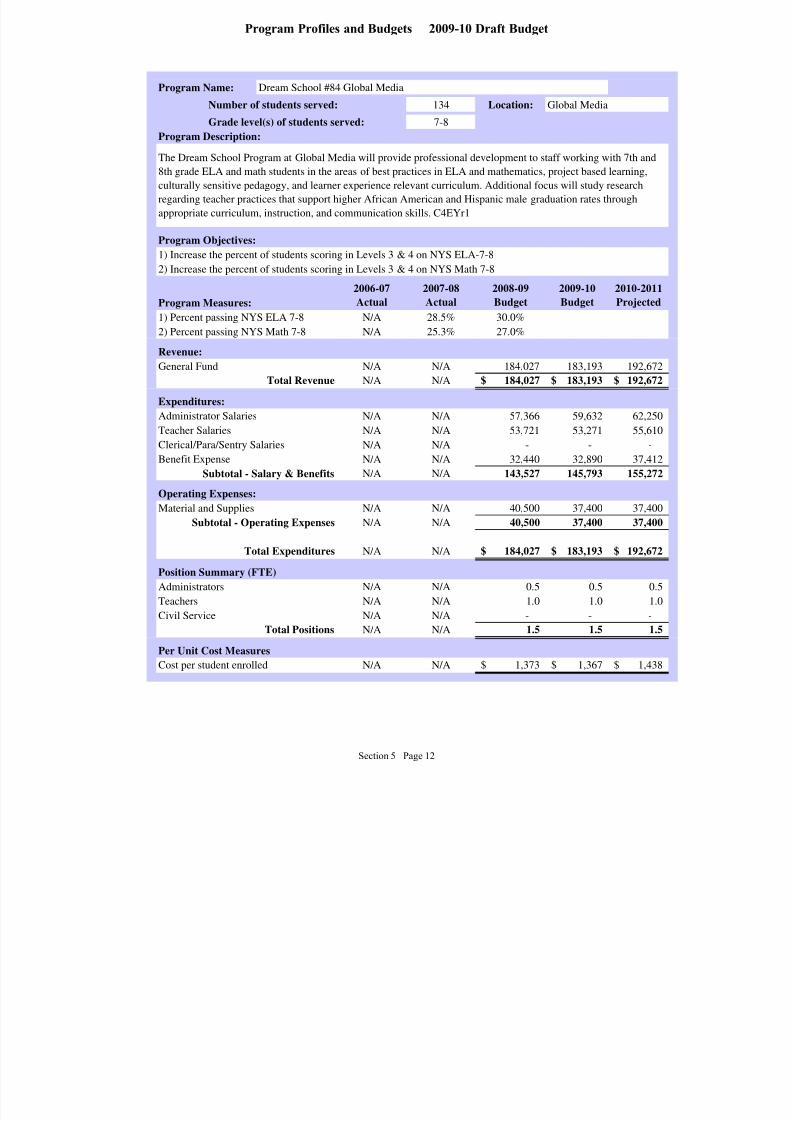
8/7/2019 2009_2010DRAFT
http://slidepdf.com/reader/full/20092010draft 162/268
Program Name:
Number of students served: 134 Location:
Grade level(s) of students served: 7-8
Program Description:
Program Objectives:
Program Measures:
2006-07
Actual
2007-08
Actual
2008-09
Budget
2009-10
Budget
2010-2011
ProjectedN/A 28.5% 30.0%
N/A 25.3% 27.0%
Revenue:
N/A N/A 184,027 183,193 192,672
N/A N/A 184,027$ 183,193$ 192,672$
Expenditures:
N/A N/A 57,366 59,632 62,250
N/A N/A 53,721 53,271 55,610
N/A N/A - - -
N/A N/A 32,440 32,890 37,412
N/A N/A 143,527 145,793 155,272
Operating Expenses:
N/A N/A 40,500 37,400 37,400
N/A N/A 40,500 37,400 37,400
N/A N/A 184,027$ 183,193$ 192,672$
Position Summary (FTE)
N/A N/A 0.5 0.5 0.5
N/A N/A 1.0 1.0 1.0 N/A N/A - - -
N/A N/A 1.5 1.5 1.5
Per Unit Cost Measures
N/A N/A 1,373$ 1,367$ 1,438$
General Fund
1) Increase the percent of students scoring in Levels 3 & 4 on NYS ELA-7-8
Total Revenue
Teachers
Subtotal - Operating Expenses
Total Expenditures
Administrators
2) Increase the percent of students scoring in Levels 3 & 4 on NYS Math 7-8
2) Percent passing NYS Math 7-8
Cost per student enrolled
Administrator Salaries
Teacher Salaries
Clerical/Para/Sentry Salaries
Benefit Expense
Subtotal - Salary & Benefits
Material and Supplies
Civil Service
Total Positions
Global Media
Dream School #84 Global Media
The Dream School Program at Global Media will provide professional development to staff working with 7th and
8th grade ELA and math students in the areas of best practices in ELA and mathematics, project based learning,
culturally sensitive pedagogy, and learner experience relevant curriculum. Additional focus will study research
regarding teacher practices that support higher African American and Hispanic male graduation rates through
appropriate curriculum, instruction, and communication skills. C4EYr1
1) Percent passing NYS ELA 7-8
Section 5 Page 12
Program Profiles and Budgets 2009-10 Draft Budget
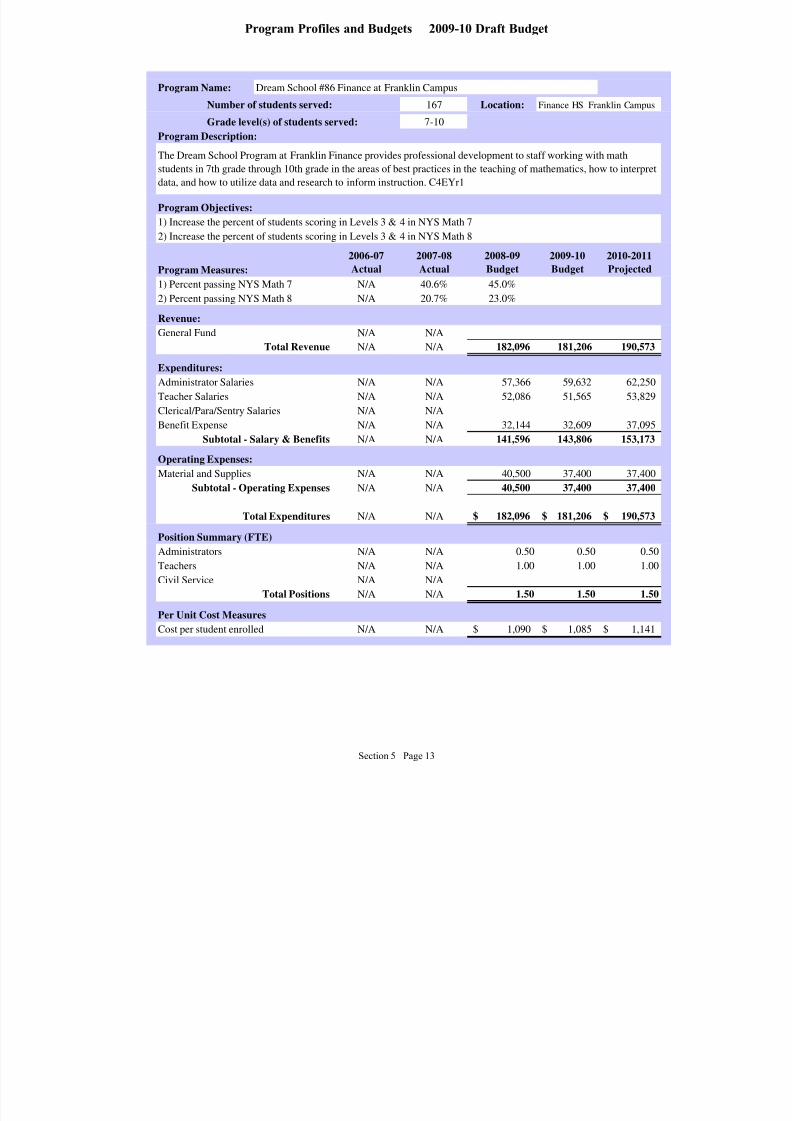
8/7/2019 2009_2010DRAFT
http://slidepdf.com/reader/full/20092010draft 163/268
Program Name:
Number of students served: 167 Location:
Grade level(s) of students served: 7-10
Program Description:
Program Objectives:
Program Measures:
2006-07
Actual
2007-08
Actual
2008-09
Budget
2009-10
Budget
2010-2011
Projected
N/A 40.6% 45.0%
N/A 20.7% 23.0%Revenue:
N/A N/A
N/A N/A 182,096 181,206 190,573
Expenditures:
N/A N/A 57,366 59,632 62,250
N/A N/A 52,086 51,565 53,829
N/A N/A
N/A N/A 32,144 32,609 37,095
N/A N/A 141,596 143,806 153,173
Operating Expenses:
N/A N/A 40,500 37,400 37,400
N/A N/A 40,500 37,400 37,400
N/A N/A 182,096$ 181,206$ 190,573$
Position Summary (FTE)
N/A N/A 0.50 0.50 0.50
N/A N/A 1.00 1.00 1.00
N/A N/A
N/A N/A 1.50 1.50 1.50
Per Unit Cost Measures
N/A N/A 1,090$ 1,085$ 1,141$
General Fund
1) Increase the percent of students scoring in Levels 3 & 4 in NYS Math 7
Total Revenue
Teachers
Subtotal - Operating Expenses
Total Expenditures
Administrators
2) Increase the percent of students scoring in Levels 3 & 4 in NYS Math 8
2) Percent passing NYS Math 8
Cost per student enrolled
Administrator Salaries
Teacher Salaries
Clerical/Para/Sentry Salaries
Benefit Expense
Subtotal - Salary & Benefits
Material and Supplies
Civil Service
Total Positions
Finance HS Franklin Campus
Dream School #86 Finance at Franklin Campus
The Dream School Program at Franklin Finance provides professional development to staff working with math
students in 7th grade through 10th grade in the areas of best practices in the teaching of mathematics, how to interpret
data, and how to utilize data and research to inform instruction. C4EYr1
1) Percent passing NYS Math 7
Section 5 Page 13
Program Profiles and Budgets 2009-10 Draft Budget
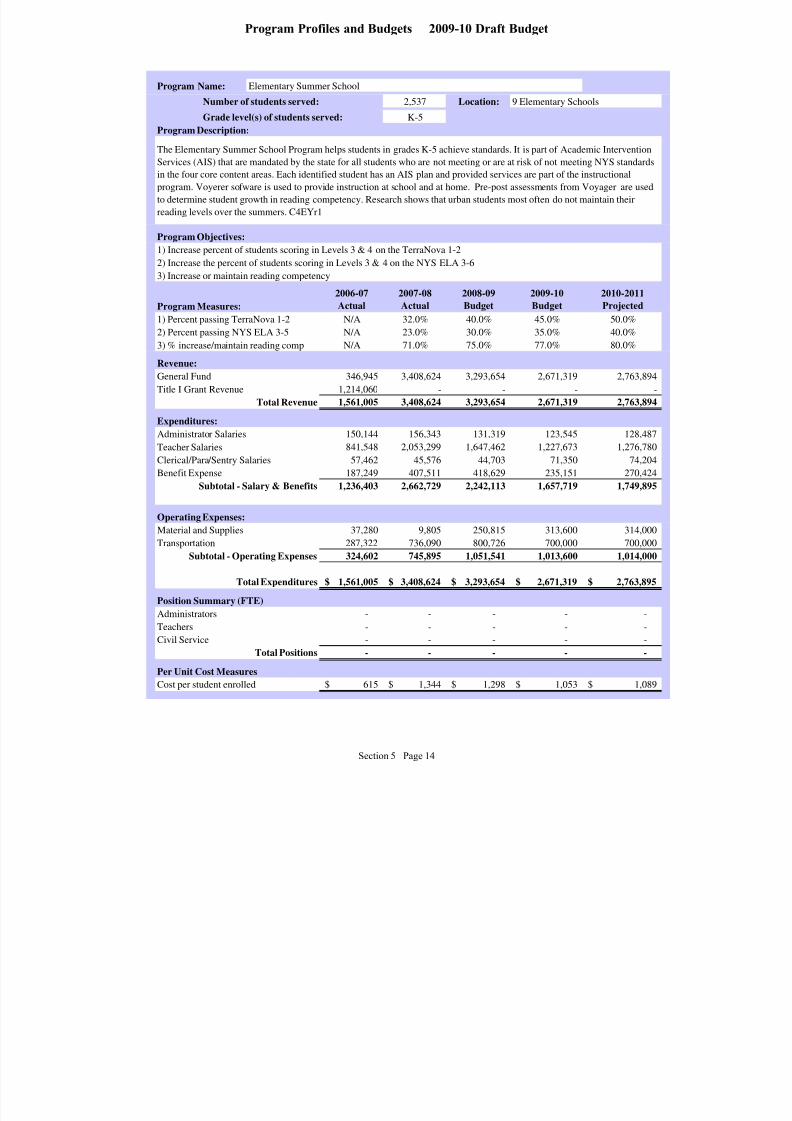
8/7/2019 2009_2010DRAFT
http://slidepdf.com/reader/full/20092010draft 164/268
Program Name:
Number of students served: 2,537 Location:
Grade level(s) of students served: K-5
Program Description:
Program Objectives:
Program Measures:
2006-07
Actual
2007-08
Actual
2008-09
Budget
2009-10
Budget
2010-2011
ProjectedN/A 32.0% 40.0% 45.0% 50.0%
N/A 23.0% 30.0% 35.0% 40.0%
N/A 71.0% 75.0% 77.0% 80.0%
Revenue:
346,945 3,408,624 3,293,654 2,671,319 2,763,894
Title I Grant Revenue 1,214,060 - - - -
1,561,005 3,408,624 3,293,654 2,671,319 2,763,894
Expenditures:
150,144 156,343 131,319 123,545 128,487
841,548 2,053,299 1,647,462 1,227,673 1,276,780
57,462 45,576 44,703 71,350 74,204
187,249 407,511 418,629 235,151 270,424
1,236,403 2,662,729 2,242,113 1,657,719 1,749,895
Operating Expenses:
37,280 9,805 250,815 313,600 314,000
Transportation 287,322 736,090 800,726 700,000 700,000
324,602 745,895 1,051,541 1,013,600 1,014,000
1,561,005$ 3,408,624$ 3,293,654$ 2,671,319$ 2,763,895$
Position Summary (FTE)
- - - - -
- - - - -
- - - - -
- - - - -
Per Unit Cost Measures
615$ 1,344$ 1,298$ 1,053$ 1,089$
General Fund
1) Increase percent of students scoring in Levels 3 & 4 on the TerraNova 1-2
Total Revenue
Teachers
Subtotal - Operating Expenses
Total Expenditures
Administrators
2) Increase the percent of students scoring in Levels 3 & 4 on the NYS ELA 3-6
3) Increase or maintain reading competency
2) Percent passing NYS ELA 3-5
Cost per student enrolled
Administrator Salaries
Teacher Salaries
Clerical/Para/Sentry Salaries
Benefit Expense
Subtotal - Salary & Benefits
Material and Supplies
Civil Service
Total Positions
3) % increase/maintain reading comp
9 Elementary Schools
Elementary Summer School
The Elementary Summer School Program helps students in grades K-5 achieve standards. It is part of Academic InterventionServices (AIS) that are mandated by the state for all students who are not meeting or are at risk of not meeting NYS standards
in the four core content areas. Each identified student has an AIS plan and provided services are part of the instructional
program. Voyerer sofware is used to provide instruction at school and at home. Pre-post assessments from Voyager are used
to determine student growth in reading competency. Research shows that urban students most often do not maintain their
reading levels over the summers. C4EYr1
1) Percent passing TerraNova 1-2
Section 5 Page 14
Program Profiles and Budgets 2009-10 Draft Budget

8/7/2019 2009_2010DRAFT
http://slidepdf.com/reader/full/20092010draft 165/268
Program Name:
Number of students served: 750 Location:
Grade level(s) of students served: K-2
Program Description:
Program Objectives:
Program Measures:2006-07Actual
2007-08Actual
2008-09Budget
2009-10Budget
2010-2011Projected
N/A 85.0% 90.0% 92.0% 95.0%
Revenue:
N/A 860,310 918,520 900,000 900,000
N/A 860,310$ 918,520$ 900,000$ 900,000$
Expenditures:
N/A - - - -
N/A 8,633 9,649 - -
N/A - - - -
N/A 1,557 1,749 - -
N/A 10,190 11,284 - -
Operating Expenses:
N/A 850,120 907,236 900,000 900,000
N/A 850,120 907,236 900,000 900,000
N/A 860,310$ 918,520$ 900,000$ 900,000$
Position Summary (FTE)
N/A - - - -
N/A - - - - N/A - - - -
N/A - - - -
Per Unit Cost Measures
N/A 1,147$ 1,225$ 1,200$ 1,200$
General Fund
1) Increase the percent of students scoring in Levels 3 & 4 in TerraNova ELA 1
Total Revenue
Teachers
Subtotal - Operating Expenses
Total Expenditures
Administrators
2) Increase the percent of students scoring in Levels 3 & 4 in TerraNova ELA 2
3) Increase the percent of students achieving 10% overall growth on Literacy Assessment
Cost per student enrolled
Administrator Salaries
Teacher Salaries
Clerical/Para/Sentry Salaries
Benefit Expense
Subtotal - Salary & Benefits
Material and Supplies
Civil Service
Total Positions
1) % achieving 10% growth in literacy
5 Elementary Schools
Encompass
Encompass is an intervention program that identifies student strengths and maximizes those strengths through thedevelopment of individualized learning plans. The goal is to improve student academic performance through
individualized learning plans that focus on the unique abilities of each student. The program is for grades K-2 in
five schools: #8, #14, #19, # 22 and #58. The Literacy Assessment was created by Children’s Literacy Institute. All
students take the District Terra Nova assessment. C4EYr1
Section 5 Page 15
Program Profiles and Budgets 2009-10 Draft Budget

8/7/2019 2009_2010DRAFT
http://slidepdf.com/reader/full/20092010draft 166/268
Program Name:
Number of students served: 8,164 Location:
Grade level(s) of students served: K-12
Program Description:
Program Objectives:
Program Measures:
2006-07
Actual
2007-08
Actual
2008-09
Budget
2009-10
Budget
2010-2011
ProjectedN/A 40.0% 46.0% 53.0% 60.0%
N/A 34.0% 40.0% 45.0% 50.0%
Revenue:
- 2,946,714 3,475,046 3,349,241 3,484,50
Title I Grant Revenue 1,253,155 - - -
1,253,155$ 2,946,714$ 3,475,046$ 3,349,241$ 3,484,50$
Expenditures:
49,988 89,718 142,101 85,237 88,64
704,705 1,280,931 1,558,850 1,422,996 1,479,91
189,158 186,778 258,079 164,443 171,02
170,654 283,706 335,653 455,702 524,05 1,114,505 1,841,133 2,294,683 2,128,378 2,263,64
Operating Expenses:
75,922 135,206 180,363 220,863 220,86
Transportation 62,728 970,375 1,000,000 1,000,000 1,000,00
138,650 1,105,581 1,180,363 1,220,863 1,220,86
1,253,155$ 2,946,714$ 3,475,046$ 3,349,241$ 3,484,50$
Position Summary (FTE)
- - - - -
- - - 15.1 15.
- - - 3.8 3. - - - 18.8 18.
Per Unit Cost Measures
153$ 361$ 426$ 410$ 42$
General Fund
1) Increase the percent of students scoring in Levels 3 & 4 on TerraNova ELA 2
Total Revenue
Teachers
Subtotal - Operating Expenses
Total Expenditures
Administrators
2) Increase the percent of students scoring in Levels 3 & 4 on NYS ELA 3-8
2) Percent passing NYS ELA 3-8
Cost per student enrolled
Administrator Salaries
Teacher Salaries
Clerical/Para/Sentry Salaries
Benefit ExpenseSubtotal - Salary & Benefits
Material and Supplies
Civil ServiceTotal Positions
all schools
Extended Day/Extended Year
The Extended Day Program meets after the regular school day or on Saturdays to provide additional instruction to promotestudent achievement of the standards. It is part of Academic Intervention Services (AIS) which are mandated by the state for all
students who are not meeting or at risk of not meeting NYS standards in the four core content areas or are at risk for not
graduating. Each identified student has an AIS plan and services are part of the instructional program. Student progress is
monitored by a review team and reported to parents on a quarterly basis. Programming for high school may include additional
academic support in all content areas as well as preparation for Regents exams. C4EYr1
1) Percent passing TerraNova ELA 2
Section 5 Page 16
Program Profiles and Budgets 2009-10 Draft Budget

8/7/2019 2009_2010DRAFT
http://slidepdf.com/reader/full/20092010draft 167/268
Program Name:
Number of students served: 5,013 Location:
Grade level(s) of students served: K-1
Program Description:
Program Objectives:
Program Measures:
2006-07
Actual
2007-08
Actual
2008-09
Budget
2009-10
Budget
2010-2011
Projected
NA 38.3% 41.0% 44.0% 47.0%
NA 24.5% 28.0% 32.0% 36.0%
Revenue:
NA 2,958,320 4,535,237 2,638,481 2,836,67
NA 2,958,320$ 4,535,237$ 2,638,481$ 2,836,67$
Expenditures:
NA
NA 2,305,560 3,137,633 1,679,421 1,753,14
NA 287,424 292,843 305,69
NA 635,224 1,066,180 634,117 745,73
NA 2,940,784 4,491,237 2,606,381 2,804,57
Operating Expenses:
NA 17,536 44,000 32,100 32,10
NA 17,536 44,000 32,100 32,10
NA 2,958,320$ 4,535,237$ 2,638,481$ 2,836,67$
Position Summary (FTE)
NA - - - -
NA 26.7 53.1 26.7 26.
NA - 5.7 5.7 5.
NA 26.7 58.8 32.4 32.
Per Unit Cost Measures
NA 590$ 905$ 526$ 56$
General Fund
1) Increase the percent of students improving vocabulary skills on the Peabody Vocabulary
Total Revenue
Teachers
Subtotal - Operating Expenses
Total Expenditures
Administrators
2) % 1st students at proficiency level
Cost per student enrolled
Administrator Salaries
Teacher Salaries
Clerical/Para/Sentry/OT Salaries
Benefit Expense
Subtotal - Salary & Benefits
Material and Supplies
Civil Service
Total Positions
all elementary schools
Great Beginnings
Great Beginnings was designed to enhance and reinforce vocabulary development. The program provides developmentally
appropriate strategies to all kindergarten and first grade students. The services are delivered in an integrated model in the
classroom by a special education teacher (26.8 FTE), speech pathologist (24.5 FTE), and an occupational therapist (5.7FTE), in
conjunction with the classroom teacher.
Research by Gates (1931) and McCormick (1999) showed that students with average cognitive ability require thirty-five
repetitions of each vocabulary word to achieve mastery. Therefore, this model uses multiple providers to achieve the goal.
Reading is a fundamental skill that predicts academic success in school. Research studies show that the development of literacy
skills is based on 5 core areas: vocabulary, phonemic awareness, phonology, fluency and comprehension (Nat’l. Reading Panel,
2000). Hirsch, 1996 study shows that there is a correlation between oral language and reading readiness. Hirsch also suggested
that entering kindergarten students with below average skills will be less likely to be successful readers as they advance in scho
1) % K students at proficiency level
Section 5 Page 17
Program Profiles and Budgets 2009-10 Draft Budget
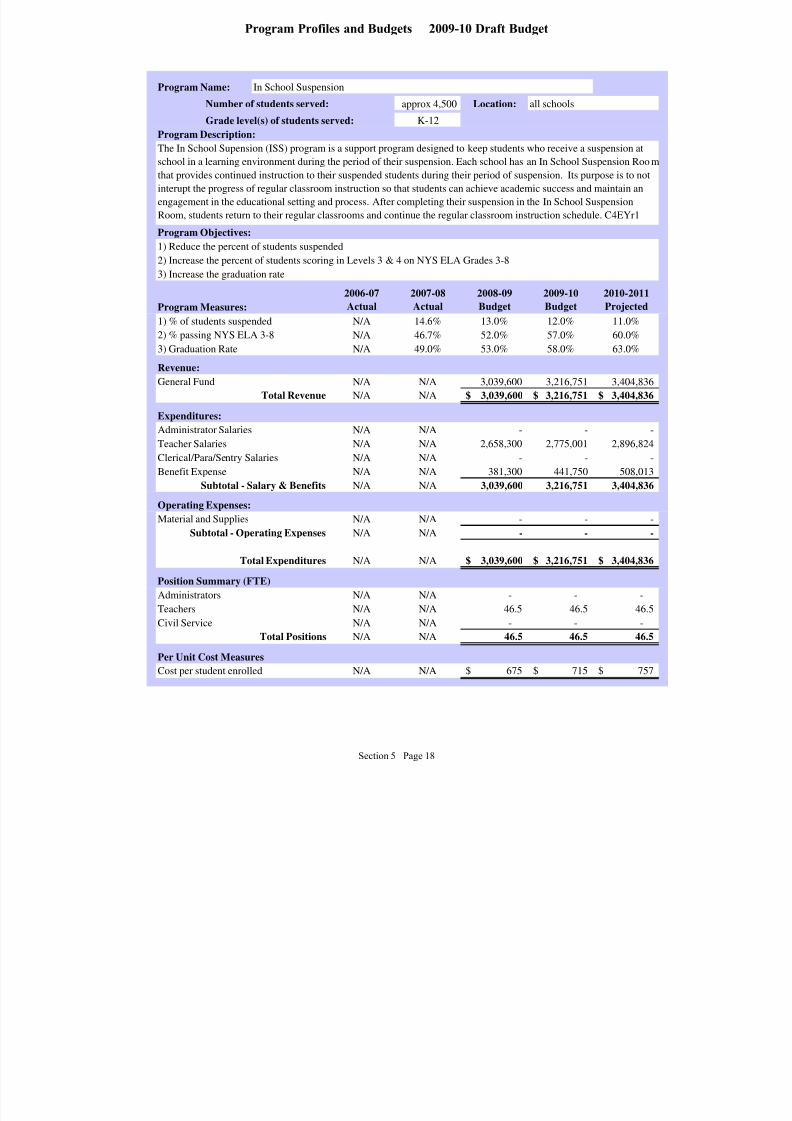
8/7/2019 2009_2010DRAFT
http://slidepdf.com/reader/full/20092010draft 168/268
Program Name:
Number of students served: approx 4,500 Location:
Grade level(s) of students served: K-12
Program Description:
Program Objectives:
Program Measures:
2006-07
Actual
2007-08
Actual
2008-09
Budget
2009-10
Budget
2010-2011
Projected
N/A 14.6% 13.0% 12.0% 11.0%
N/A 46.7% 52.0% 57.0% 60.0%
N/A 49.0% 53.0% 58.0% 63.0%
Revenue:
N/A N/A 3,039,600 3,216,751 3,404,836
N/A N/A 3,039,600$ 3,216,751$ 3,404,836$
Expenditures:
N/A N/A - - -
N/A N/A 2,658,300 2,775,001 2,896,824
N/A N/A - - -
N/A N/A 381,300 441,750 508,013
N/A N/A 3,039,600 3,216,751 3,404,836
Operating Expenses:
N/A N/A - - -
N/A N/A - - -
N/A N/A 3,039,600$ 3,216,751$ 3,404,836$
Position Summary (FTE)
N/A N/A - - -
N/A N/A 46.5 46.5 46.5 N/A N/A - - -
N/A N/A 46.5 46.5 46.5
Per Unit Cost Measures
N/A N/A 675$ 715$ 757$
General Fund
1) Reduce the percent of students suspended
Total Revenue
Teachers
Subtotal - Operating Expenses
Total Expenditures
Administrators
2) Increase the percent of students scoring in Levels 3 & 4 on NYS ELA Grades 3-8
3) Increase the graduation rate
2) % passing NYS ELA 3-8
Cost per student enrolled
Administrator Salaries
Teacher Salaries
Clerical/Para/Sentry Salaries
Benefit Expense
Subtotal - Salary & Benefits
Material and Supplies
Civil Service
Total Positions
3) Graduation Rate
all schools
In School Suspension
The In School Supension (ISS) program is a support program designed to keep students who receive a suspension atschool in a learning environment during the period of their suspension. Each school has an In School Suspension Room
that provides continued instruction to their suspended students during their period of suspension. Its purpose is to not
interupt the progress of regular classroom instruction so that students can achieve academic success and maintain an
engagement in the educational setting and process. After completing their suspension in the In School Suspension
Room, students return to their regular classrooms and continue the regular classroom instruction schedule. C4EYr1
1) % of students suspended
Section 5 Page 18
Program Profiles and Budgets 2009-10 Draft Budget
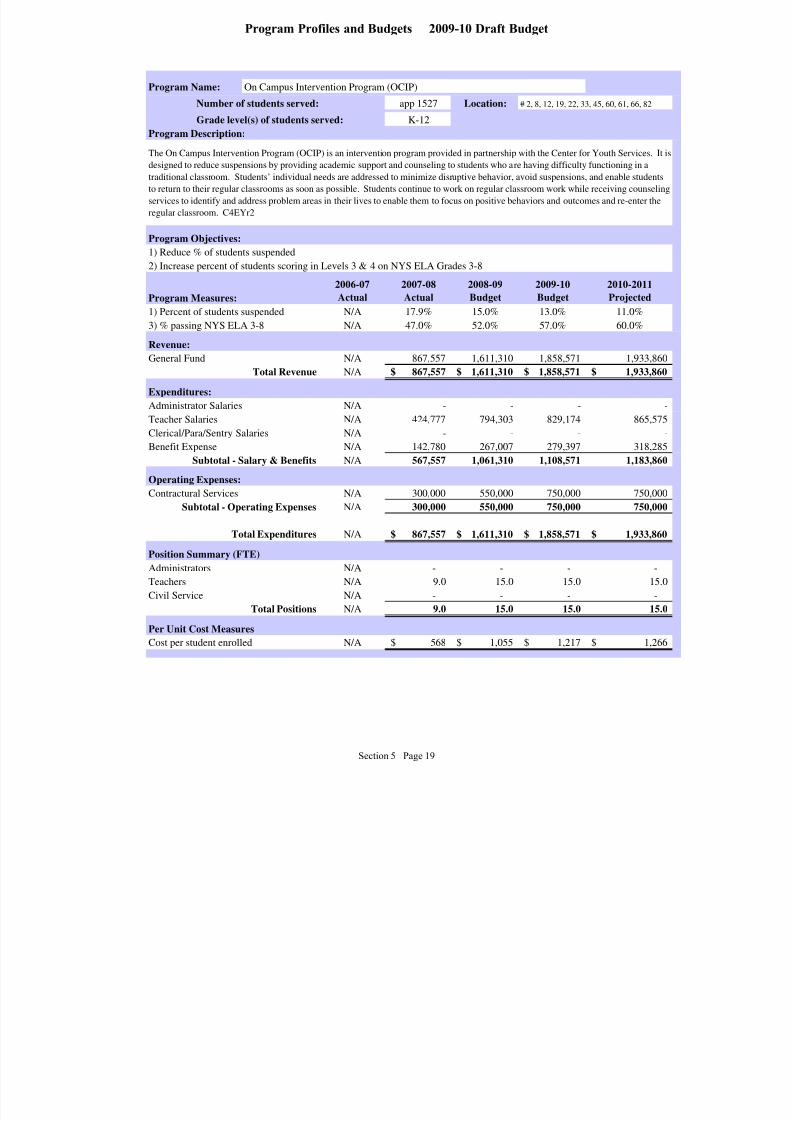
8/7/2019 2009_2010DRAFT
http://slidepdf.com/reader/full/20092010draft 169/268
Program Name:
Number of students served: app 1527 Location:
Grade level(s) of students served: K-12
Program Description:
Program Objectives:
Program Measures:
2006-07
Actual
2007-08
Actual
2008-09
Budget
2009-10
Budget
2010-2011
Projected
N/A 17.9% 15.0% 13.0% 11.0%
N/A 47.0% 52.0% 57.0% 60.0%
Revenue:
N/A 867,557 1,611,310 1,858,571 1,933,86
N/A 867,557$ 1,611,310$ 1,858,571$ 1,933,86$
Expenditures:
N/A - - -
N/A 424,777 794,303 829,174 865,57
N/A - - -
N/A 142,780 267,007 279,397 318,28
N/A 567,557 1,061,310 1,108,571 1,183,86
Operating Expenses:
N/A 300,000 550,000 750,000 750,00
N/A 300,000 550,000 750,000 750,00
N/A 867,557$ 1,611,310$ 1,858,571$ 1,933,86$
Position Summary (FTE)
N/A - - - -
N/A 9.0 15.0 15.0 15.
N/A - - - -
N/A 9.0 15.0 15.0 15.
Per Unit Cost Measures
N/A 568$ 1,055$ 1,217$ 1,26$
General Fund
1) Reduce % of students suspended
Total Revenue
Teachers
Subtotal - Operating Expenses
Total Expenditures
Administrators
2) Increase percent of students scoring in Levels 3 & 4 on NYS ELA Grades 3-8
Cost per student enrolled
Administrator Salaries
Teacher Salaries
Clerical/Para/Sentry Salaries
Benefit Expense
Subtotal - Salary & Benefits
Contractural Services
Civil Service
Total Positions
3) % passing NYS ELA 3-8
# 2, 8, 12, 19, 22, 33, 45, 60, 61, 66, 82
On Campus Intervention Program (OCIP)
The On Campus Intervention Program (OCIP) is an intervention program provided in partnership with the Center for Youth Services. Itdesigned to reduce suspensions by providing academic support and counseling to students who are having difficulty functioning in a
traditional classroom. Students’ individual needs are addressed to minimize disruptive behavior, avoid suspensions, and enable students
to return to their regular classrooms as soon as possible. Students continue to work on regular classroom work while receiving counselin
services to identify and address problem areas in their lives to enable them to focus on positive behaviors and outcomes and re-enter the
regular classroom. C4EYr2
1) Percent of students suspended
Section 5 Page 19
Program Profiles and Budgets 2009-10 Draft Budget

8/7/2019 2009_2010DRAFT
http://slidepdf.com/reader/full/20092010draft 170/268
Program Name:
Number of students served: 2,499 Location:
Grade level(s) of students served: K-3
Program Description:
Program Objectives:
Program Measures:2006-07Actual
2007-08Actual
2008-09Budget
2009-10Budget
2010-2011Projected
N/A 70.0% 75.0% 75.0% N/A
N/A 45.0% 50.0% 50.0% N/A
Revenue:
- - 1,296,761 300,631 N/A
3,595,861 2,899,800 690,942 341,313 N/A
3,595,861$ 2,899,800$ 1,987,703$ 641,944$ N/A
Expenditures:
- - - - N/A
1,937,930 1,383,857 1,205,200 380,246 N/A18,553 274,222 275,784 20,780 N/A
524,839 518,136 504,206 120,918 N/A
2,481,322 2,176,215 1,985,190 521,944 N/A
Operating Expenses:
1,114,539 723,585 2,513 120,000 N/A
1,114,539 723,585 2,513 120,000 N/A
N/A
3,595,861$ 2,899,800$ 1,987,703$ 641,944$ N/A
Position Summary (FTE)
- - - - N/A28.0 20.0 19.0 5.5 N/A
0.3 9.3 9.3 0.3 N/A
28.3 29.3 28.3 5.8 N/A
Per Unit Cost Measures
1,254$ 1,094$ 795$ 257$ N/A
# 2, 5, 6, 8, 14, 17, 36, 41, 45
Reading First
The Reading First Grant is a three year, federal reading initiative for local educational agencies with high levels of poverty land lowstudent performance. It is a program for K-3 classrooms and provides extensive research-based professional development in reading
for the administrators, teachers and teachers’ assistants who participate in the instruction of K-3 students. Reading First’s goal is to
have all students reading proficiently by the end of third grade. The process for meeting this expectation is the implementation of
rigorous professional development, scientifically based core reading materials, and interventions and on-going assessment. The
original Reading First program (2003-2006) started in four schools: #5, #17, #28, and #36. The new Reading First program (2007-
2009) expanded to include six more schools: #2, #6, #8, #14, #41, and #45, while School #28 dropped out of the program, leaving a
total of 9 schools. The Reading First grant will end in 2009-10. C4EYr2
1) % K-1 scoring 80% on DIBLES
Cost per student enrolled
Administrator Salaries
Teacher SalariesClerical/Para/Sentry Salaries
Benefit Expense
Subtotal - Salary & Benefits
Material and Supplies
Civil Service
Total Positions
Teachers
Subtotal - Operating Expenses
Total Expenditures
Administrators
Reading First Grant
General Fund
1) Increase the percent of K-1 students attaining 80% on DIBLES assessments
Total Revenue
2) Increase the percent of grades 2-3 students achieving 50% proficiency on DIBLES assessments
2) % Gr 2-3 scoring 50% on DIBLES
Section 5 Page 20
Program Profiles and Budgets 2009-10 Draft Budget

8/7/2019 2009_2010DRAFT
http://slidepdf.com/reader/full/20092010draft 171/268
Program Name:
Number of students served: 12,062 Location:
Grade level(s) of students served: 7-12
Program Description:
Program Objectives:
Program Measures:
2006-07
Actual
2007-08
Actual
2008-09
Budget
2009-10
Budget
2010-2011
Projected
N/A 29.0% 49.0% 59.0% 69.0%N/A 28.0% 41.0% 51.0% 61.0%
Revenue:
N/A 443,602 491,853 259,765 264,196
N/A 443,602$ 491,853$ 259,765$ 264,196$
Expenditures:
N/A - - - -
N/A 29,007 212,960 154,418 161,197
N/A - - - -
N/A 5,233 46,810 34,994 39,681
N/A 34,240 259,770 189,412 200,878
Operating Expenses:
N/A 409,363 232,083 70,353 63,318
N/A 409,363 232,083 70,353 63,318
N/A 443,602$ 491,853$ 259,765$ 264,196$
Position Summary (FTE)
N/A - - - -
N/A - 1.0 1.0 1.0
N/A - - - -
N/A - 1.0 1.0 1.0
Per Unit Cost Measures
N/A 37$ 41$ 22$ 22$
General Fund
1) Increase the percent of students scoring in Levels 3 & 4 on the NYS ELA 7
Total Revenue
Teachers
Subtotal - Operating Expenses
Total Expenditures
Administrators
2) Increase the percent of students scoring in Levels 3 & 4 on the NYS ELA 8
2) Percent passing NYS ELA 8
Cost per student enrolled
Administrator Salaries
Teacher Salaries
Clerical/Para/Sentry Salaries
Benefit Expense
Subtotal - Salary & Benefits
Material and Supplies
Civil Service
Total Positions
all secondary schools
Springboard
The Springboard program is an English Language Arts program for grades 6-12 that supports high expectations and
develops students’ reading, writing, oral, and collaborative skills. Program alignment ensures that students in all
secondary schools have a consistent ELA curriculum enables them to develop proficiency at each grade level.
Springboard is in all schools that have any students in grades 7-12 students (19) C4EYr1
1) Percent passing NYS ELA 7
Section 5 Page 21
Program Profiles and Budgets 2009-10 Draft Budget
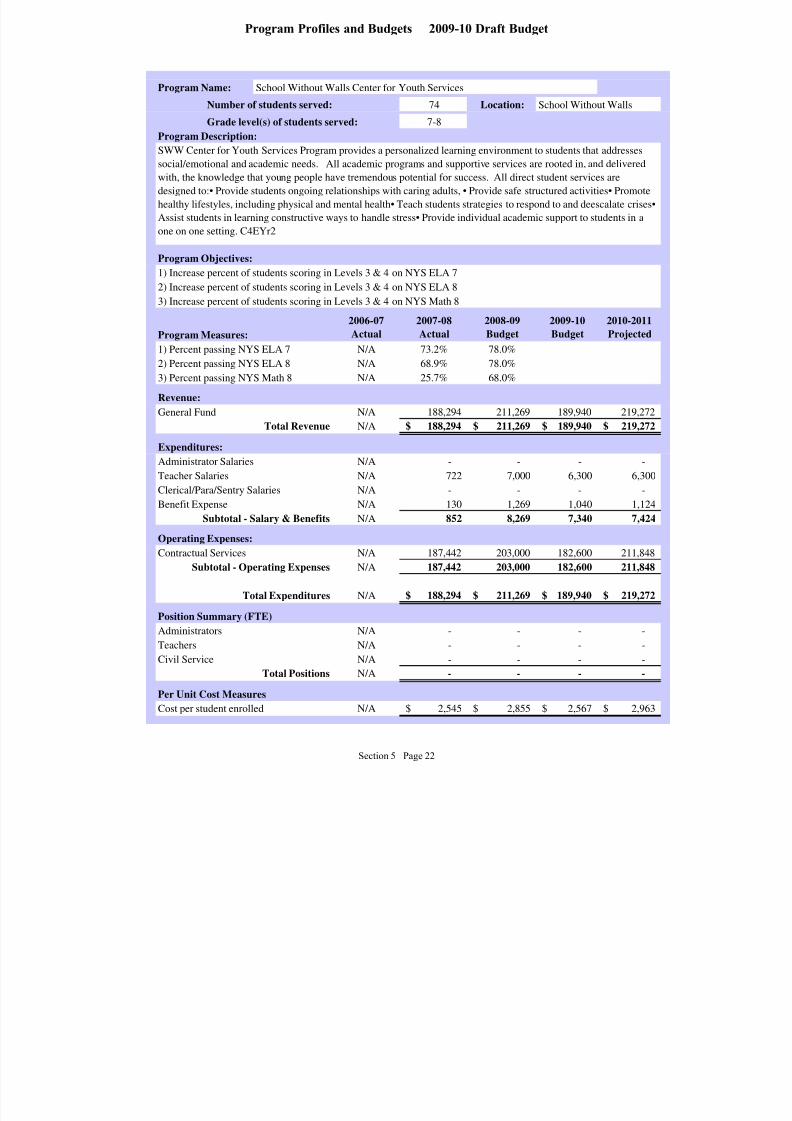
8/7/2019 2009_2010DRAFT
http://slidepdf.com/reader/full/20092010draft 172/268
Program Name:
Number of students served: 74 Location:
Grade level(s) of students served: 7-8
Program Description:
Program Objectives:
Program Measures:
2006-07
Actual
2007-08
Actual
2008-09
Budget
2009-10
Budget
2010-2011
Projected
N/A 73.2% 78.0%
N/A 68.9% 78.0%
N/A 25.7% 68.0%
Revenue:
N/A 188,294 211,269 189,940 219,272
N/A 188,294$ 211,269$ 189,940$ 219,272$
Expenditures:
N/A - - - -
N/A 722 7,000 6,300 6,300
N/A - - - -
N/A 130 1,269 1,040 1,124
N/A 852 8,269 7,340 7,424
Operating Expenses:
N/A 187,442 203,000 182,600 211,848
N/A 187,442 203,000 182,600 211,848
N/A 188,294$ 211,269$ 189,940$ 219,272$
Position Summary (FTE)
N/A - - - -
N/A - - - -
N/A - - - -
N/A - - - -
Per Unit Cost Measures
N/A 2,545$ 2,855$ 2,567$ 2,963$
General Fund
1) Increase percent of students scoring in Levels 3 & 4 on NYS ELA 7
Total Revenue
Teachers
Subtotal - Operating Expenses
Total Expenditures
Administrators
2) Increase percent of students scoring in Levels 3 & 4 on NYS ELA 8
3) Increase percent of students scoring in Levels 3 & 4 on NYS Math 8
2) Percent passing NYS ELA 8
Cost per student enrolled
Administrator Salaries
Teacher Salaries
Clerical/Para/Sentry Salaries
Benefit Expense
Subtotal - Salary & Benefits
Contractual Services
Civil Service
Total Positions
3) Percent passing NYS Math 8
School Without Walls
School Without Walls Center for Youth Services
SWW Center for Youth Services Program provides a personalized learning environment to students that addressessocial/emotional and academic needs. All academic programs and supportive services are rooted in, and delivered
with, the knowledge that young people have tremendous potential for success. All direct student services are
designed to:• Provide students ongoing relationships with caring adults, • Provide safe structured activities• Promote
healthy lifestyles, including physical and mental health• Teach students strategies to respond to and deescalate crises•
Assist students in learning constructive ways to handle stress• Provide individual academic support to students in a
one on one setting. C4EYr2
1) Percent passing NYS ELA 7
Section 5 Page 22
Program Profiles and Budgets 2009-10 Draft Budget

8/7/2019 2009_2010DRAFT
http://slidepdf.com/reader/full/20092010draft 173/268
Program Name:
Number of students served: 1,900 Location:
Grade level(s) of students served: All grades
Program Description:
Program Objectives:
Program Measures:
2006-07
Actual
2007-08
Actual
2008-09
Budget
2009-10
Budget
2010-2011
Projected
2,229 1,890 1,880 1,900 1,900 Revenue:
2,017,089 1,874,489 1,769,238 1,741,588 1,834,747
2,017,089$ 1,874,489$ 1,769,238$ 1,741,588$ 1,834,747$
Expenditures:
83,053 102,646 86,455 89,869 93,464
1,408,851 1,362,919 1,269,082 1,299,313 1,351,286
65,088 73,291 85,931 48,792 50,744
455,889 278,687 245,448 237,605 273,245
2,012,881 1,817,543 1,686,916 1,675,579 1,768,738
Operating Expenses:
4,208 56,946 82,322 66,009 66,009 4,208 56,946 82,322 66,009 66,009
2,017,089$ 1,874,489$ 1,769,238$ 1,741,588$ 1,834,747$
Position Summary (FTE)
1.0 1.0 1.0
20.0 20.0 20.0
0.5 0.5 0.5
21.5 21.5 21.5
Per Unit Cost Measures
905$ 992$ 941$ 917$ 966$
General Fund
1) Provide instructional and counseling services to ensure successful re-entry into regular school programs.
Total Revenue
Teachers
Subtotal - Operating Expenses
Total Expenditures
Administrators
Cost per student enrolled
Administrator Salaries
Teacher Salaries
Clerical/Para/Sentry Salaries
Benefit Expense
Subtotal - Salary & Benefits
Material and Supplies
Civil Service
Total Positions
Various (approximately 8)
Agency Youth Program
The Agency Youth program works with students placed through the Monroe County Office of Probation, Courts, Department oHealth and Human Services into secure or non-secure environments for the purpose of receiving intensive services.
Collaboration with the District schools and the County is the primary focus. Sites which provide services in classroom
instruction and counseling include: St. Joseph's Villa Watertower, Rochester Educators and Probation Officers Program, The
Children's Detention Center, and Northaven, and nonsecure facilities including Appleton, Monroe Community Hospital, and
Strong/University of Rochester Behavioral Health Programs.
1) Number of students served
Section 5 Page 23
Program Profiles and Budgets 2009-10 Draft Budget
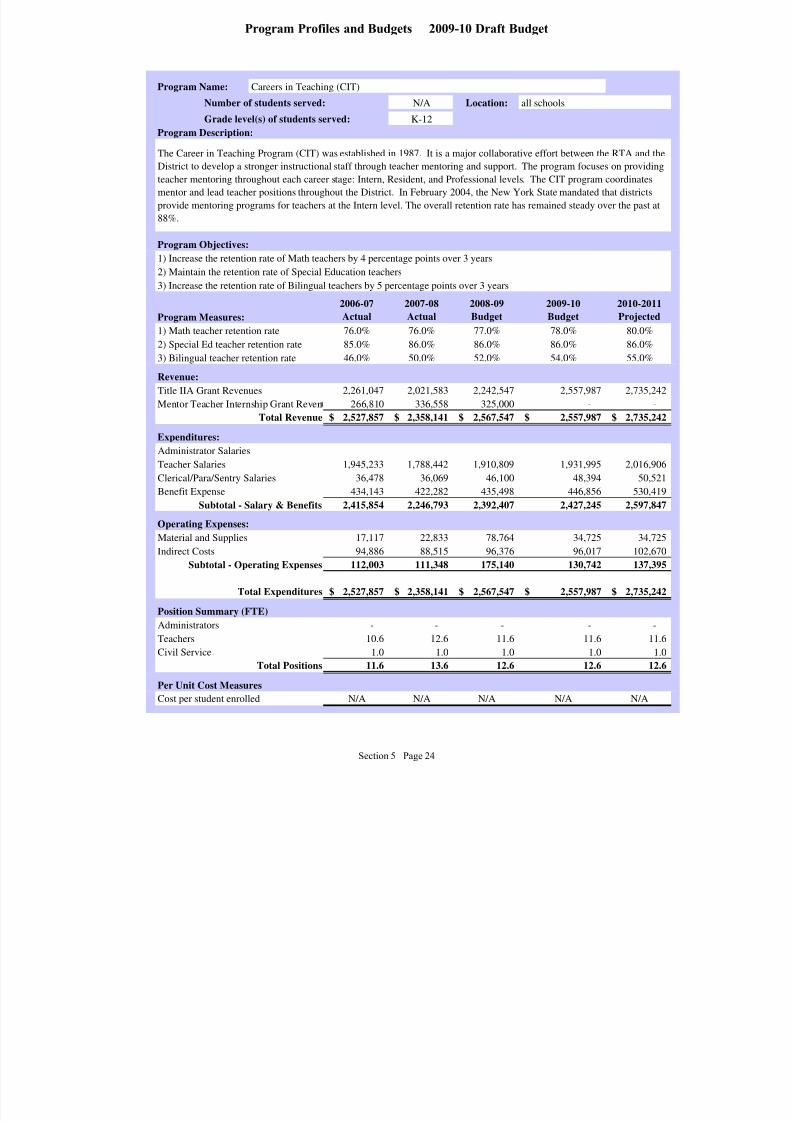
8/7/2019 2009_2010DRAFT
http://slidepdf.com/reader/full/20092010draft 174/268
Program Name:
Number of students served: N/A Location:
Grade level(s) of students served: K-12
Program Description:
Program Objectives:
Program Measures:2006-07Actual
2007-08Actual
2008-09Budget
2009-10Budget
2010-2011Projected
76.0% 76.0% 77.0% 78.0% 80.0%
85.0% 86.0% 86.0% 86.0% 86.0%
46.0% 50.0% 52.0% 54.0% 55.0%
Revenue:
2,261,047 2,021,583 2,242,547 2,557,987 2,735,24
Mentor Teacher Internship Grant Reven 266,810 336,558 325,000 - -
2,527,857$ 2,358,141$ 2,567,547$ 2,557,987$ 2,735,242$
Expenditures:
1,945,233 1,788,442 1,910,809 1,931,995 2,016,90
36,478 36,069 46,100 48,394 50,52
434,143 422,282 435,498 446,856 530,41
2,415,854 2,246,793 2,392,407 2,427,245 2,597,847
Operating Expenses:
17,117 22,833 78,764 34,725 34,72
Indirect Costs 94,886 88,515 96,376 96,017 102,670
112,003 111,348 175,140 130,742 137,39
2,527,857$ 2,358,141$ 2,567,547$ 2,557,987$ 2,735,242$
Position Summary (FTE)
- - - - -
10.6 12.6 11.6 11.6 11.
1.0 1.0 1.0 1.0 1.
11.6 13.6 12.6 12.6 12.
Per Unit Cost Measures
N/A N/A N/A N/A N/A
3) Bilingual teacher retention rate
all schools
Careers in Teaching (CIT)
The Career in Teaching Program (CIT) was established in 1987. It is a major collaborative effort between the RTA and theDistrict to develop a stronger instructional staff through teacher mentoring and support. The program focuses on providing
teacher mentoring throughout each career stage: Intern, Resident, and Professional levels. The CIT program coordinates
mentor and lead teacher positions throughout the District. In February 2004, the New York State mandated that districts
provide mentoring programs for teachers at the Intern level. The overall retention rate has remained steady over the past at
88%.
1) Math teacher retention rate
Cost per student enrolled
Administrator SalariesTeacher Salaries
Clerical/Para/Sentry Salaries
Benefit Expense
Subtotal - Salary & Benefits
Material and Supplies
Civil Service
Total Positions
Title IIA Grant Revenues
1) Increase the retention rate of Math teachers by 4 percentage points over 3 years
Total Revenue
Teachers
Subtotal - Operating Expenses
Total Expenditures
Administrators
2) Maintain the retention rate of Special Education teachers
3) Increase the retention rate of Bilingual teachers by 5 percentage points over 3 years
2) Special Ed teacher retention rate
Section 5 Page 24
Program Profiles and Budgets 2009-10 Draft Budget
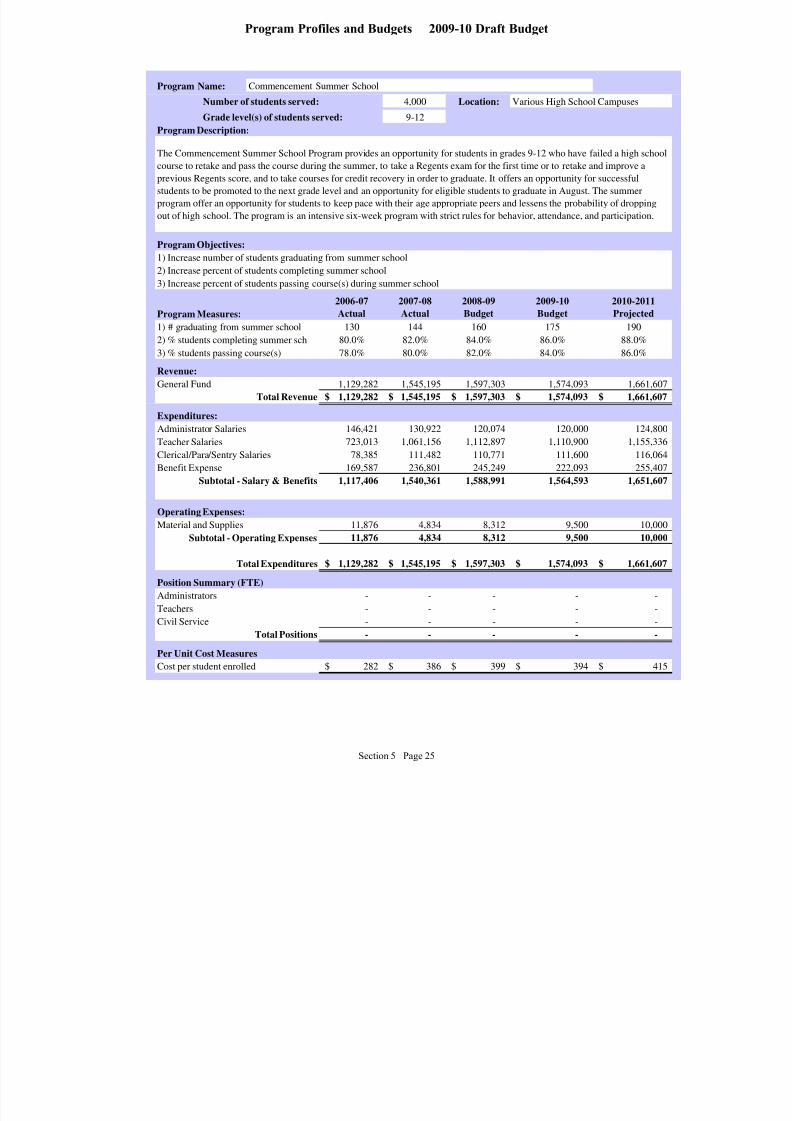
8/7/2019 2009_2010DRAFT
http://slidepdf.com/reader/full/20092010draft 175/268
Program Name:
Number of students served: 4,000 Location:
Grade level(s) of students served: 9-12
Program Description:
Program Objectives:
Program Measures:2006-07Actual
2007-08Actual
2008-09Budget
2009-10Budget
2010-2011Projected
130 144 160 175 190
80.0% 82.0% 84.0% 86.0% 88.0%
78.0% 80.0% 82.0% 84.0% 86.0%
Revenue:
1,129,282 1,545,195 1,597,303 1,574,093 1,661,60
1,129,282$ 1,545,195$ 1,597,303$ 1,574,093$ 1,661,60$
Expenditures:
146,421 130,922 120,074 120,000 124,80
723,013 1,061,156 1,112,897 1,110,900 1,155,33
78,385 111,482 110,771 111,600 116,06 169,587 236,801 245,249 222,093 255,40
1,117,406 1,540,361 1,588,991 1,564,593 1,651,60
Operating Expenses:
11,876 4,834 8,312 9,500 10,00
11,876 4,834 8,312 9,500 10,00
1,129,282$ 1,545,195$ 1,597,303$ 1,574,093$ 1,661,60$
Position Summary (FTE)
- - - - -
- - - - - - - - - -
- - - - -
Per Unit Cost Measures
282$ 386$ 399$ 394$ 41$
3) % students passing course(s)
Various High School Campuses
Commencement Summer School
The Commencement Summer School Program provides an opportunity for students in grades 9-12 who have failed a high schoocourse to retake and pass the course during the summer, to take a Regents exam for the first time or to retake and improve a
previous Regents score, and to take courses for credit recovery in order to graduate. It offers an opportunity for successful
students to be promoted to the next grade level and an opportunity for eligible students to graduate in August. The summer
program offer an opportunity for students to keep pace with their age appropriate peers and lessens the probability of dropping
out of high school. The program is an intensive six-week program with strict rules for behavior, attendance, and participation.
1) # graduating from summer school
Cost per student enrolled
Administrator Salaries
Teacher Salaries
Clerical/Para/Sentry SalariesBenefit Expense
Subtotal - Salary & Benefits
Material and Supplies
Civil Service
Total Positions
General Fund
1) Increase number of students graduating from summer school
Total Revenue
Teachers
Subtotal - Operating Expenses
Total Expenditures
Administrators
2) Increase percent of students completing summer school
3) Increase percent of students passing course(s) during summer school
2) % students completing summer sch
Section 5 Page 25
Program Profiles and Budgets 2009-10 Draft Budget

8/7/2019 2009_2010DRAFT
http://slidepdf.com/reader/full/20092010draft 176/268
Program Name:
Number of students served: N/A Location:
Grade level(s) of students served: PreK-12
Program Description:
Program Objectives:
Program Measures:
2006-07
Actual
2007-08
Actual
2008-09
Budget
2009-10
Budget
2010-2011
Projected1,500 2,000 2,200 2,350 2500
22.1% 23.0% 24.0% 25.0% 27.0%
Revenue:
276,154 246,816 294,715 388,002 380,28
- - - - -
276,154$ 246,816$ 294,715$ 388,002$ 380,28$
Expenditures:
84,750 88,092 66,500 69,127 72,16
5,602 6,557 14,000 14,000 14,00
- - - 69,387 72,43 28,478 22,220 20,335 41,608 47,19
118,830 116,869 100,835 194,122 205,79
Operating Expenses:
157,324 129,947 193,880 193,880 174,49
157,324 129,947 193,880 193,880 174,49
276,154$ 246,816$ 294,715$ 388,002$ 380,28$
Position Summary (FTE)
0.7 0.7 0.7 0.7 0.
- - - - -
- - - 1.0 1.
0.7 0.7 0.7 1.7 1.
Per Unit Cost Measures
N/A N/A N/A N/A N/A
General Fund
1) Increase the number of teacher applictions received
Total Revenue
Teachers
Subtotal - Operating Expenses
Total Expenditures
Administrators
2) Increase the percent of African-American and Hispanic teachers in the District work force
Cost per student enrolled
Administrator Salaries
Teacher Salaries
Clerical/Para/Sentry SalariesBenefit Expense
Subtotal - Salary & Benefits
Material and Supplies
Civil Service
Total Positions
Title IIA Grant Revenue
2) % of of minority teachers in District
all schools
Diversity Recruiting
The goal of the Diversity Recruiting Initiative is to increase representation of African-American and Hispanic
teaching staff in the District. Recruitment efforts are expanded beyond western New York state primarily through
attendance at job fairs and interviews at colleges and universities that have high enrollments of African-American
and Hispanic students. The recruitment effort focuses primarily on teacher hiring.
1) # of teacher applications received
Section 5 Page 26
Program Profiles and Budgets 2009-10 Draft Budget
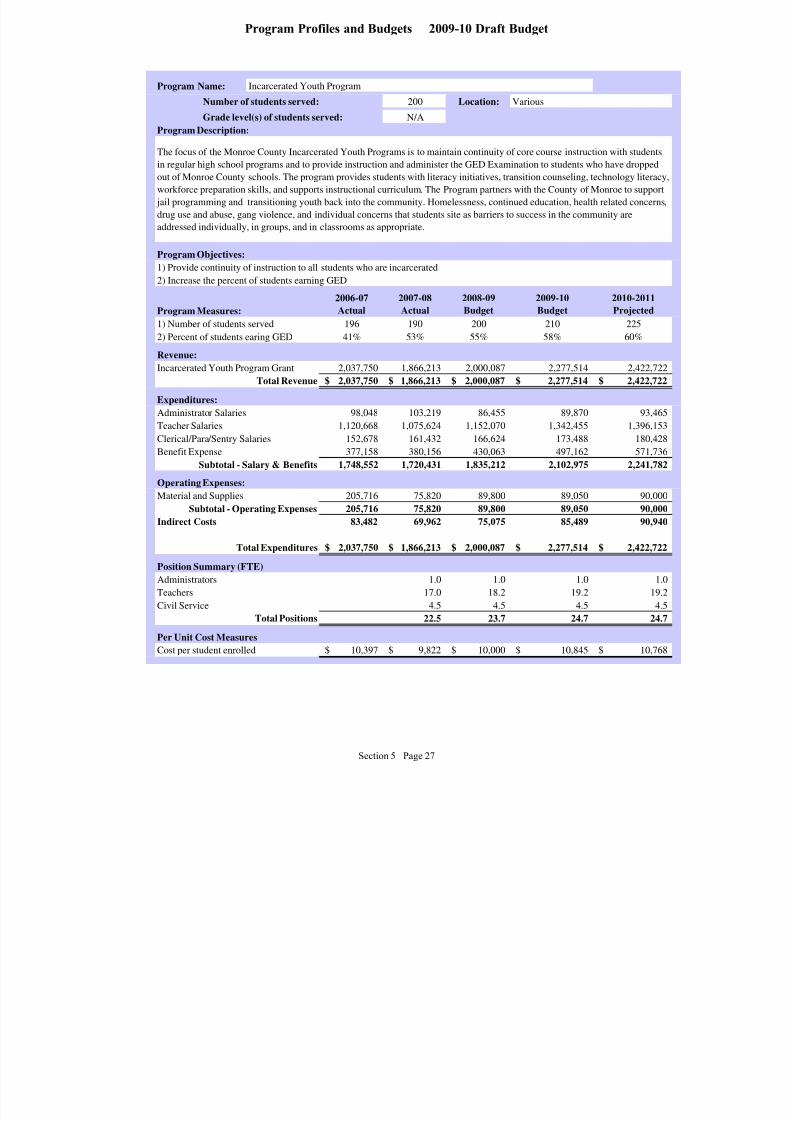
8/7/2019 2009_2010DRAFT
http://slidepdf.com/reader/full/20092010draft 177/268
Program Name:
Number of students served: 200 Location:
Grade level(s) of students served: N/A
Program Description:
Program Objectives:
Program Measures: 2006-07Actual 2007-08Actual 2008-09Budget 2009-10Budget 2010-2011Projected
196 190 200 210 225
41% 53% 55% 58% 60%
Revenue:
2,037,750 1,866,213 2,000,087 2,277,514 2,422,72
2,037,750$ 1,866,213$ 2,000,087$ 2,277,514$ 2,422,72$
Expenditures:
98,048 103,219 86,455 89,870 93,46
1,120,668 1,075,624 1,152,070 1,342,455 1,396,15
152,678 161,432 166,624 173,488 180,42
377,158 380,156 430,063 497,162 571,73 1,748,552 1,720,431 1,835,212 2,102,975 2,241,78
Operating Expenses:
205,716 75,820 89,800 89,050 90,00
205,716 75,820 89,800 89,050 90,00
Indirect Costs 83,482 69,962 75,075 85,489 90,94
2,037,750$ 1,866,213$ 2,000,087$ 2,277,514$ 2,422,72$
Position Summary (FTE)
1.0 1.0 1.0 1.
17.0 18.2 19.2 19.
4.5 4.5 4.5 4. 22.5 23.7 24.7 24.
Per Unit Cost Measures
10,397$ 9,822$ 10,000$ 10,845$ 10,76$
Various
Incarcerated Youth Program
The focus of the Monroe County Incarcerated Youth Programs is to maintain continuity of core course instruction with studentsin regular high school programs and to provide instruction and administer the GED Examination to students who have dropped
out of Monroe County schools. The program provides students with literacy initiatives, transition counseling, technology literac
workforce preparation skills, and supports instructional curriculum. The Program partners with the County of Monroe to suppor
jail programming and transitioning youth back into the community. Homelessness, continued education, health related concern
drug use and abuse, gang violence, and individual concerns that students site as barriers to success in the community are
addressed individually, in groups, and in classrooms as appropriate.
1) Number of students served
Cost per student enrolled
Administrator Salaries
Teacher Salaries
Clerical/Para/Sentry Salaries
Benefit ExpenseSubtotal - Salary & Benefits
Material and Supplies
Civil ServiceTotal Positions
Incarcerated Youth Program Grant
1) Provide continuity of instruction to all students who are incarcerated
Total Revenue
Teachers
Subtotal - Operating Expenses
Total Expenditures
Administrators
2) Increase the percent of students earning GED
2) Percent of students earing GED
Section 5 Page 27
Program Profiles and Budgets 2009-10 Draft Budget

8/7/2019 2009_2010DRAFT
http://slidepdf.com/reader/full/20092010draft 178/268
Program Name:
Number of students served: all students Location:
Grade level(s) of students served: K-12
Program Description:
Program Objectives:
Program Measures:
2006-07
Actual
2007-08
Actual
2008-09
Budget
2009-10
Budget
2010-2011
Projected
81% 91% 100% 100% 100%50% 90% 100% 100% 100%
1,392 1,243 800 750 750
Revenue:
1,044,654 1,169,807 1,521,116 1,207,467 1,271,309
85,498 - - - -
282,980 273,576 246,221 262,894 262,894
- 243,925 500,000 - -
1,413,132$ 1,687,308$ 2,267,336$ 1,470,361$ 1,534,203$
Expenditures:
164,580 188,767 213,484 221,916 231,658
773,141 690,095 928,772 604,061 630,579
4,789 36,154 85,384 87,256 91,087
231,366 234,525 286,156 237,511 261,262
1,173,876 1,149,542 1,513,796 1,150,744 1,214,586
Operating Expenses:
225,990 517,980 725,530 309,749 309,749
225,990 517,980 725,530 309,749 309,749
13,266 19,786 28,010 9,868 9,868
1,413,132$ 1,687,308$ 2,267,336$ 1,470,361$ 1,534,203$
Position Summary (FTE)
2.0 2.0 2.0 2.0 2.0
7.0 6.0 6.0 6.0 6.0
- 1.0 1.0 1.0 1.0
9.0 9.0 9.0 9.0 9.0
Per Unit Cost Measures
1,015$ 1,357$ 2,834$ 1,960$ 2,046$
Total Expenditures
Total Positions
Cost per staff member trained
Teachers
Civil Service
Benefit Expense
Subtotal - Salary & Benefits
Material and Supplies
Indirect Costs
Title I - Miscellaneous
Title II-D - Technology
Title IID Competitive
Clerical/Para/Sentry Salaries
General Fund
1) Increase the participation of Math Benchmark Testing in Grades 3-8
Total Revenue
Administrators
Subtotal - Operating Expenses
2) Continue consolidation and implementation of centrally served student software in elementary schools
3) Maintin the total enrollment within the ITII program until all staff has received training
2)% of software consolidation
Administrator Salaries
Teacher Salaries
3)# enrolled in ITII training
all schools
Instructional Technology Support
The Department of Instructional Technology is involved with several District-wide initiatives including a comprehensivetraining program for all elementary schools and a District-wide Benchmark Assessment Program in Math. The
department is also focused on reduction of standalone and school based software programs and transitioning to centrally
managed programs that address Math and Reading needs. The Instructional Technology Infusion Initiative (ITII) is one
of the Department's training programs. Yr2
1)% of schools using Math Benchmark
Section 5 Page 28
Program Profiles and Budgets 2009-10 Draft Budget
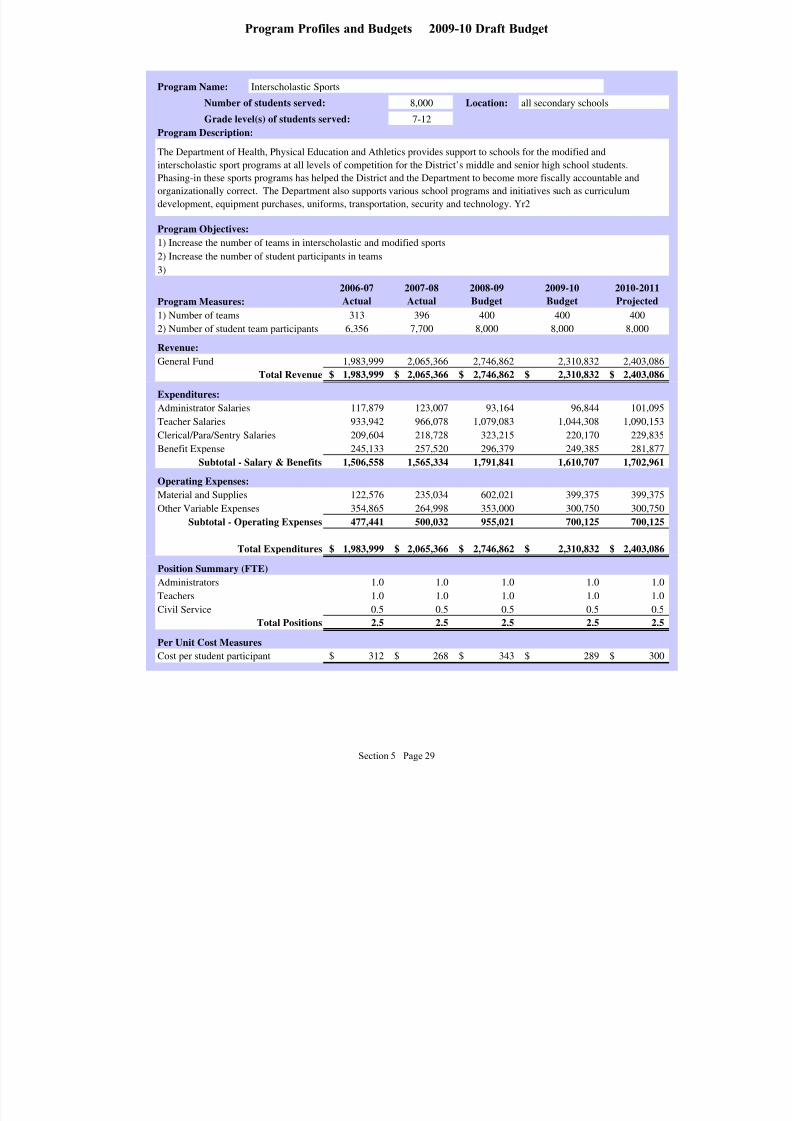
8/7/2019 2009_2010DRAFT
http://slidepdf.com/reader/full/20092010draft 179/268
Program Name:
Number of students served: 8,000 Location:
Grade level(s) of students served: 7-12
Program Description:
Program Objectives:
Program Measures:
2006-07
Actual
2007-08
Actual
2008-09
Budget
2009-10
Budget
2010-2011
Projected313 396 400 400 400
6,356 7,700 8,000 8,000 8,000
Revenue:
1,983,999 2,065,366 2,746,862 2,310,832 2,403,086
1,983,999$ 2,065,366$ 2,746,862$ 2,310,832$ 2,403,086$
Expenditures:
117,879 123,007 93,164 96,844 101,095
933,942 966,078 1,079,083 1,044,308 1,090,153
209,604 218,728 323,215 220,170 229,835
245,133 257,520 296,379 249,385 281,877
1,506,558 1,565,334 1,791,841 1,610,707 1,702,961
Operating Expenses:
122,576 235,034 602,021 399,375 399,375
354,865 264,998 353,000 300,750 300,750
477,441 500,032 955,021 700,125 700,125
1,983,999$ 2,065,366$ 2,746,862$ 2,310,832$ 2,403,086$
Position Summary (FTE)
1.0 1.0 1.0 1.0 1.0
1.0 1.0 1.0 1.0 1.0
0.5 0.5 0.5 0.5 0.5
2.5 2.5 2.5 2.5 2.5
Per Unit Cost Measures
312$ 268$ 343$ 289$ 300$
Subtotal - Operating Expenses
Total Expenditures
Administrators
2) Number of student team participants
General Fund
Material and Supplies
Total Revenue
Cost per student participant
Administrator Salaries
Teacher Salaries
Clerical/Para/Sentry Salaries
Benefit Expense
Subtotal - Salary & Benefits
Other Variable Expenses
Civil Service
Total Positions
Teachers
all secondary schools
Interscholastic Sports
The Department of Health, Physical Education and Athletics provides support to schools for the modified andinterscholastic sport programs at all levels of competition for the District’s middle and senior high school students.
Phasing-in these sports programs has helped the District and the Department to become more fiscally accountable and
organizationally correct. The Department also supports various school programs and initiatives such as curriculum
development, equipment purchases, uniforms, transportation, security and technology. Yr2
1) Number of teams
1) Increase the number of teams in interscholastic and modified sports
2) Increase the number of student participants in teams
3)
Section 5 Page 29
Program Profiles and Budgets 2009-10 Draft Budget

8/7/2019 2009_2010DRAFT
http://slidepdf.com/reader/full/20092010draft 180/268
Program Name:
Number of students served: 28,000 app Location:
Grade level(s) of students served: K-12
Program Description:
Program Objectives:
Program Measures:
2006-07
Actual
2007-08
Actual
2008-09
Budget
2009-10
Budget
2010-2011
Projected
79% 83% 83% 85% 85%37% 40% 40% 40% 40%
73% 73% 73% 73% 73%
Revenue:
14,030,807 14,793,480 14,964,291 16,789,000 17,825,555
14,030,807$ 14,793,480$ 14,964,291$ 16,789,000$ 17,825,555$
Expenditures:
- - - - -
- - - - -
4,930,524 5,112,332 5,440,863 5,622,183 5,868,997
2,049,304 2,103,527 2,113,000 2,314,000 2,661,100
6,979,828 7,215,859 7,553,863 7,936,183 8,530,097
Operating Expenses:7,050,979 7,577,621 7,410,428 8,852,817 9,295,458
7,050,979 7,577,621 7,410,428 8,852,817 9,295,458
14,030,807$ 14,793,480$ 14,964,291$ 16,789,000$ 17,825,555$
Position Summary (FTE)
- - - - -
- - - - -
246.5 246.5 246.3 246.3 246.3
246.5 246.5 246.3 246.3 246.3
Per Unit Cost Measures
391.39$ 399.82$ 404.44$ 438.97$ 466.08$
3) % students participating in lunch
all schools
School Food Service Programs
The District Food Service is managed under contract by Chartwells K-12 (Compass NA Division), a private management company. Breakfast anlunch are served daily at 61 sites, including six parochial schools. This program includes three Field Supervisors that monitor and provide suppor
for a staff of 375 employees. Approximately 85% of the students attending District schools qualify for Free and Reduced Priced Meals. School
Food Services is responsible for complying with Federal and State guidelines to provide healthy and nutritious meals that are consistent with the
Recommended Dietary Allowances (RDA) for caloric goals and dietary guidelines.
1) Percent of eligible students enrolled
Cost per student enrolled
Administrator Salaries
Teacher Salaries
Clerical/Para/Sentry Salaries
Benefit Expense
Subtotal - Salary & Benefits
Material and Supplies
Civil Service
Total Positions
Lunch Fund
1) Increase the percentage of students enrolled in the Free & Reduced Price Lunch Program
Total Revenue
Teachers
Subtotal - Operating Expenses
Total Expenditures
Administrators
2) Increase the percentage of students participating in breakfast program
3) Increase the percentage of students participating in lunch program
2) % students participating in breakfast
Section 5 Page 30
Program Profiles and Budgets 2009-10 Draft Budget

8/7/2019 2009_2010DRAFT
http://slidepdf.com/reader/full/20092010draft 181/268
Program Name:
Number of students served: 110 app Location:
Grade level(s) of students served: 7-12
Program Description:
Program Objectives:
Program Measures:
2006-07
Actual
2007-08
Actual
2008-09
Budget
2009-10
Budget
2010-2011
Projected
31.0% 32.0% 32.0% 35.0% 40.0%
75.0% 77.0% 80.0% 82.0% 85.0%
Revenue:
2,253,329 2,365,911 2,689,699 2,730,750 2,918,840
2,253,329$ 2,365,911$ 2,689,699$ 2,730,750$ 2,918,840$
Expenditures:
90,712 95,543 99,009 102,919 107,437
1,157,971 1,311,053 1,467,117 1,475,887 1,540,678
205,866 277,057 374,941 392,511 409,742
544,022 547,414 715,767 738,384 842,039
1,998,571 2,231,066 2,656,834 2,709,701 2,899,896
Operating Expenses:
254,758 134,845 32,865 21,049 18,944
254,758 134,845 32,865 21,049 18,944
2,253,329$ 2,365,911$ 2,689,699$ 2,730,750$ 2,918,840$
Position Summary (FTE)
1.0 1.0 1.0 1.0 1.0
19.3 20.6 24.7 24.3 24.3
12.0 11.0 18.0 18.0 18.0
32.3 32.6 43.7 43.3 43.3
Per Unit Cost Measures
20,485$ 21,508$ 24,452$ 24,825$ 26,535$
Special Education NorthStar
The North S.T.A.R. Program is designed to help emotionally fragile children learn coping strategies and to increase theiracademic skills so that they will be able to successfully reintegrate into comprehensive high schools. This is achieved
through an instructional program that provides a nurturing environment and researched-based intervention in collaboration
with Hillside Children's Center.
1) % returned to high school programs
Cost per student enrolled
Administrator Salaries
Teacher Salaries
Clerical/Para/Sentry Salaries
Benefit Expense
Subtotal - Salary & Benefits
Material and Supplies
Civil Service
Total Positions
General Fund
1) Increase the percent of student who return to returned to comprehensive high school programs
Total Revenue
Teachers
Subtotal - Operating Expenses
Total Expenditures
Administrators
2) Increase average daily attendance
2) Daily attendance rate
Section 5 Page 31
Program Profiles and Budgets 2009-10 Draft Budget

8/7/2019 2009_2010DRAFT
http://slidepdf.com/reader/full/20092010draft 182/268
Program Name:
Number of students served: 1,000 Location:
Grade level(s) of students served: PreK-12
Program Description:
Program Objectives:
Program Measures:
2006-07
Actual
2007-08
Actual
2008-09
Budget
2009-10
Budget
2010-2011
Projected
1,067 1,004 1,000 1,000 1,00
83% 92% 92% 93% 95%
Revenue:
2,689,129 3,045,524 3,134,170 3,141,513 3,362,30
Grant 229,534 248,269 294,217 307,807 320,11
2,918,663$ 3,293,793$ 3,428,387$ 3,449,319$ 3,682,42$
Expenditures:
- - - - -
- - - - -
2,145,757 2,436,706 2,534,007 2,567,168 2,669,85
741,308 812,766 873,381 860,753 989,86
2,887,065 3,249,472 3,407,388 3,427,921 3,659,72
Operating Expenses:
22,982 36,002 9,955 9,845 10,33
Indirect Costs 8,616 8,319 11,044 11,554 12,36
31,598 44,321 20,999 21,399 22,70
2,918,663$ 3,293,793$ 3,428,387$ 3,449,319$ 3,682,42$
Position Summary (FTE)
- - - - -
- - - - -
45.9 45.9 45.9 44.9 44.
45.9 45.9 45.9 44.9 44.
Per Unit Cost Measures
2,735$ 3,281$ 3,428$ 3,449$ 3,68$
all school sites
Special Education OT & PT
Occupational Therapy (OT) and Physical Therapy (PT) provide therapy services to students preschool through grade 12.
Professional development opportunities are provided to further enhance consultation, collaborative, and therapy skills. Evaluatio
series are provided to all students who are referred to the Committee on Special Education (CSE) within mandated timelines.
1) # of students receiving OT/PT
Cost per student served
Administrator Salaries
Teacher Salaries
Clerical/Para/Sentry Salaries
Benefit Expense
Subtotal - Salary & Benefits
Material and Supplies
Civil Service
Total Positions
General Fund
1) Provide Occupational and Physical Therapy services to General and Special Education students
Total Revenue
Teachers
Subtotal - Operating Expenses
Total Expenditures
Administrators
2) Provide professional develoment for staff
3)
2)% of staff participating in PD
Section 5 Page 32
Program Profiles and Budgets 2009-10 Draft Budget

8/7/2019 2009_2010DRAFT
http://slidepdf.com/reader/full/20092010draft 183/268
Program Name:
Number of students served: 317 app Location:
Grade level(s) of students served: All grades
Program Description:
Program Objectives:
Program Measures:
2006-07
Actual
2007-08
Actual
2008-09
Budget
2009-10
Budget
2010-2011
Projected
93.0% 94.0% 90.0% 90.0% 90.0%
29.0% 18.0% 22.0% 22.0% 22.0%21.0% 50.0% 50.0% 50.0% 50.0%
Revenue:
403,940 411,432 420,625 452,729 478,020
State Reimbursement 80% 1,615,760 1,645,729 1,682,501 1,810,916 1,912,078
2,019,700$ 2,057,161$ 2,103,126$ 2,263,645$ 2,390,098$
Expenditures:
- - - - -
753,688 731,952 692,346 721,092 752,820
578,596 611,833 621,833 643,562 671,879
237,296 228,150 236,033 214,584 246,772
1,569,580 1,571,935 1,550,212 1,579,238 1,671,470 Operating Expenses:
450,120 485,226 552,914 684,407 718,627
450,120 485,226 552,914 684,407 718,627
2,019,700$ 2,057,161$ 2,103,126$ 2,263,645$ 2,390,098$
Position Summary (FTE)
- - - - -
- - - - -
- - - - -
- - - - -
Per Unit Cost Measures7,213$ 6,701$ 6,634$ 7,141$ 7,540$
General Fund 20% of Cost
3)% student parents at end event
Various Locations
Special Education Summer School
The Special Education RCSD Summer program is mandated by state regulations. It provides in-district special educationservices to students who are severely disabled and are likely to regress during the summer months. The programs purpose is to
maintain or enhance the skills that students mastered during the previous school year. Attendance in the program and parent
support are important factors.
1)% students maintaing/increasing skills
1) Maintain or increase skills students mastered during the previous school year
2) Increase attendance rate
3) Increase percent of students whose parent(s) attend the end of program culminating activitity
2)% students with =>95% attendance
Cost per student enrolled
Administrator Salaries
Teacher Salaries
Clerical/Para/Sentry Salaries
Benefit Expense
Subtotal - Salary & Benefits
Material and Supplies /Transport
Civil Service
Total Positions
Total Revenue
Teachers
Subtotal - Operating Expenses
Total Expenditures
Administrators
Section 5 Page 33
Program Profiles and Budgets 2009-10 Draft Budget

8/7/2019 2009_2010DRAFT
http://slidepdf.com/reader/full/20092010draft 184/268
THIS PAGE INTENTIONALLY LEFT BLANK
Section 5 Page 34
Program Profiles and Budgets 2009-10 Draft Budget

8/7/2019 2009_2010DRAFT
http://slidepdf.com/reader/full/20092010draft 185/268
school suPPort ProfIles and Budgets
Teaching and LearningYouth Development and Family Services

8/7/2019 2009_2010DRAFT
http://slidepdf.com/reader/full/20092010draft 186/268
THIS PAGE INTENTIONALLY LEFT BLANK
Section 6 Page 2
School Support Profiles and Budgets 2009-10 Draft Budget
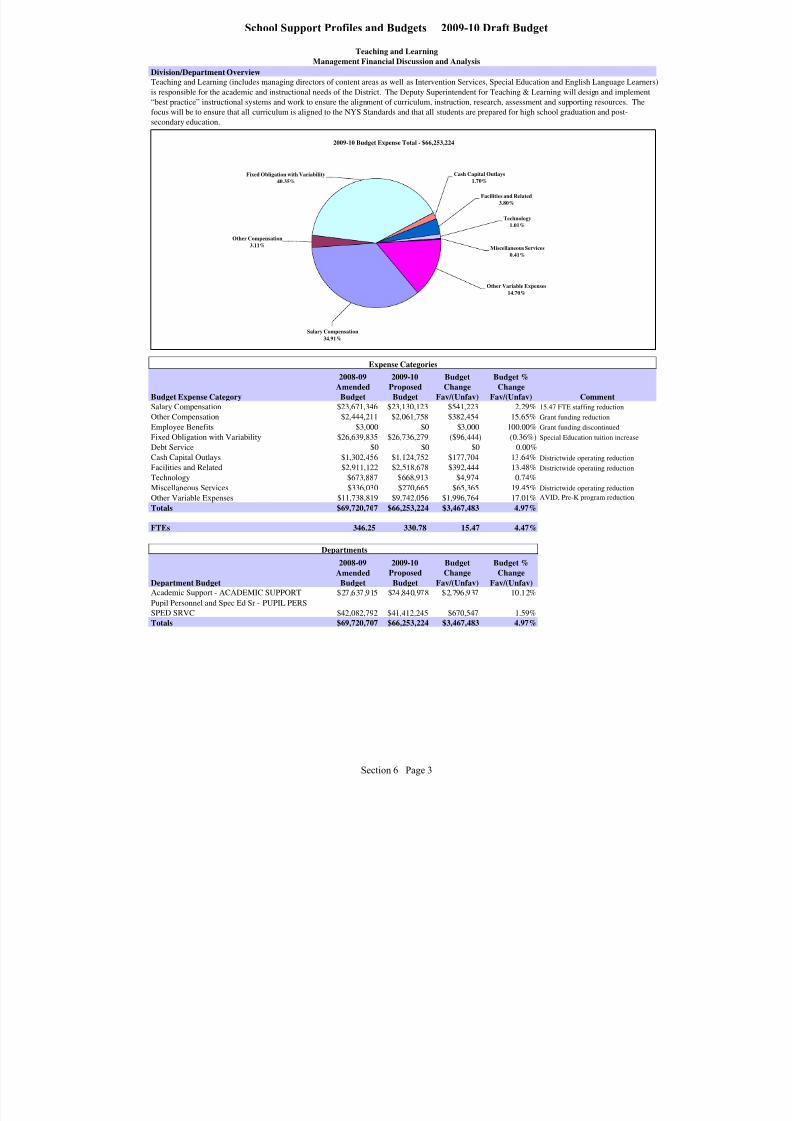
8/7/2019 2009_2010DRAFT
http://slidepdf.com/reader/full/20092010draft 187/268
Teaching and Learning
Management Financial Discussion and Analysis
Division/Department Overview
Budget Expense Category
2008-09
Amended
Budget
2009-10
Proposed
Budget
Budget
Change
Fav/(Unfav)
Budget %
Change
Fav/(Unfav) CommentSalary Compensation $23,671,346 $23,130,123 $541,223 2.29% 15.47 FTE staffing reduction
Other Compensation $2,444,211 $2,061,758 $382,454 15.65% Grant funding reduction
Employee Benefits $3,000 $0 $3,000 100.00% Grant funding discontinued
Fixed Obligation with Variability $26,639,835 $26,736,279 ($96,444) (0.36%) Special Education tuition increase
Debt Service $0 $0 $0 0.00%
Cash Capital Outlays $1,302,456 $1,124,752 $177,704 13.64% Districtwide operating reduction
Facilities and Related $2,911,122 $2,518,678 $392,444 13.48% Districtwide operating reduction
Technology $673,887 $668,913 $4,974 0.74%
Miscellaneous Services $336,030 $270,665 $65,365 19.45% Districtwide operating reduction
Other Variable Expenses $11,738,819 $9,742,056 $1,996,764 17.01% AVID, Pre-K program reduction
Totals $69,720,707 $66,253,224 $3,467,483 4.97%
FTEs 346.25 330.78 15.47 4.47%
Department Budget
2008-09
Amended
Budget
2009-10
Proposed
Budget
Budget
Change
Fav/(Unfav)
Budget %
Change
Fav/(Unfav)Academic Support - ACADEMIC SUPPORT $27,637,915 $24,840,978 $2,796,937 10.12%
Pupil Personnel and Spec Ed Sr - PUPIL PERSSPED SRVC $42,082,792 $41,412,245 $670,547 1.59%
Totals $69,720,707 $66,253,224 $3,467,483 4.97%
Expense Categories
Departments
Teaching and Learning (includes managing directors of content areas as well as Intervention Services, Special Education and English Language Learners)
is responsible for the academic and instructional needs of the District. The Deputy Superintendent for Teaching & Learning will design and implement
“best practice” instructional systems and work to ensure the alignment of curriculum, instruction, research, assessment and supporting resources. The
focus will be to ensure that all curriculum is aligned to the NYS Standards and that all students are prepared for high school graduation and post-
secondary education.
2009-10 Budget Expense Total - $66,253,224
Other Variable Expenses
14.70%
Miscellaneous Services
0.41%
Technology
1.01%
Fixed Obligation with Variability
40.35%
Other Compensation
3.11%
Salary Compensation
34.91%
Cash Capital Outlays
1.70%
Facilities and Related
3.80%
Section 6 Page 3
School Support Profiles and Budgets 2009-10 Draft Budget
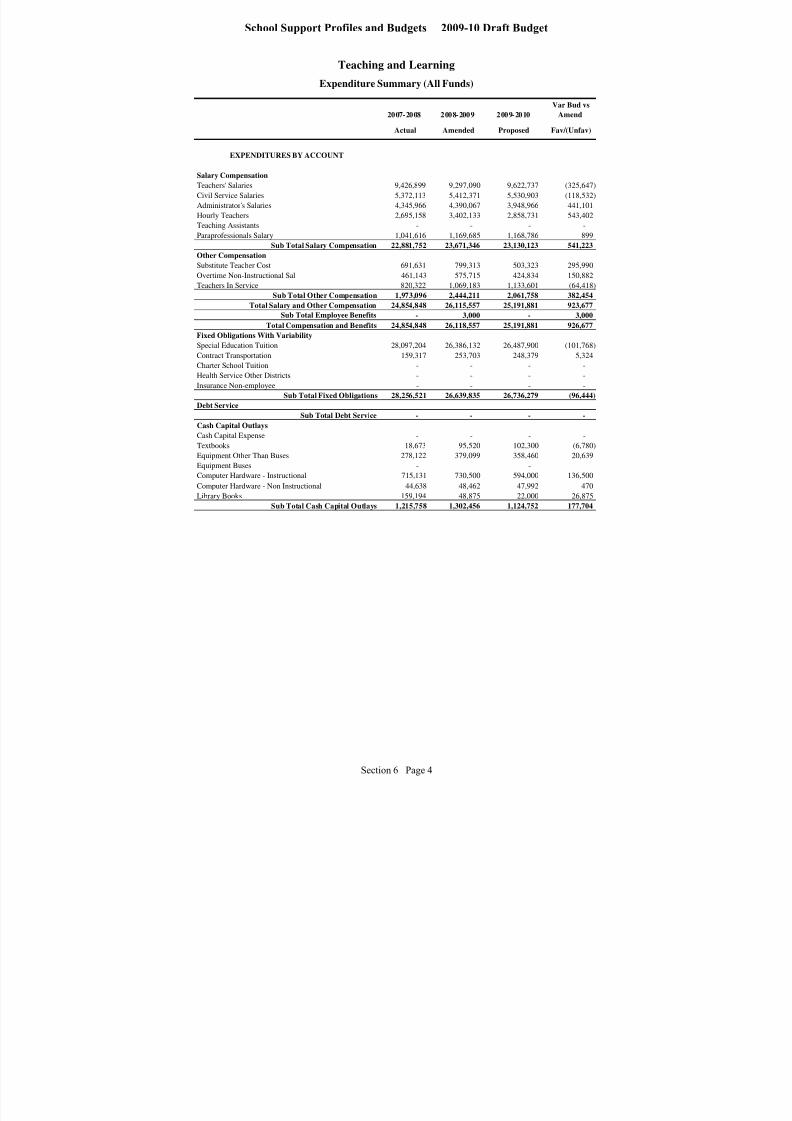
8/7/2019 2009_2010DRAFT
http://slidepdf.com/reader/full/20092010draft 188/268
Teaching and Learning
2007-2008 2008-2009 2009-2010
Var Bud vs
Amend
Actual Amended Proposed Fav/(Unfav)
EXPENDITURES BY ACCOUNT
Salary Compensation
Teachers' Salaries 9,426,899 9,297,090 9,622,737 (325,647)
Civil Service Salaries 5,372,113 5,412,371 5,530,903 (118,532)
Administrator's Salaries 4,345,966 4,390,067 3,948,966 441,101
Hourly Teachers 2,695,158 3,402,133 2,858,731 543,402
Teaching Assistants - - - -
Paraprofessionals Salary 1,041,616 1,169,685 1,168,786 899
Sub Total Salary Compensation 22,881,752 23,671,346 23,130,123 541,223
Other Compensation
Substitute Teacher Cost 691,631 799,313 503,323 295,990
Overtime Non-Instructional Sal 461,143 575,715 424,834 150,882
Teachers In Service 820,322 1,069,183 1,133,601 (64,418)
Sub Total Other Compensation 1,973,096 2,444,211 2,061,758 382,454
Total Salary and Other Compensation 24,854,848 26,115,557 25,191,881 923,677
Sub Total Employee Benefits - 3,000 - 3,000
Total Compensation and Benefits 24,854,848 26,118,557 25,191,881 926,677
Fixed Obligations With Variability
Special Education Tuition 28,097,204 26,386,132 26,487,900 (101,768)
Contract Transportation 159,317 253,703 248,379 5,324
Charter School Tuition - - - -
Health Service Other Districts - - - -
Insurance Non-employee - - - -
Sub Total Fixed Obligations 28,256,521 26,639,835 26,736,279 (96,444)
Debt Service
Sub Total Debt Service - - - -
Cash Capital Outlays
Cash Capital Expense - - - -
Textbooks 18,673 95,520 102,300 (6,780)
Equipment Other Than Buses 278,122 379,099 358,460 20,639 Equipment Buses - - - -
Computer Hardware - Instructional 715,131 730,500 594,000 136,500
Computer Hardware - Non Instructional 44,638 48,462 47,992 470
Library Books 159,194 48,875 22,000 26,875
Sub Total Cash Capital Outlays 1,215,758 1,302,456 1,124,752 177,704
Expenditure Summary (All Funds)
Section 6 Page 4
School Support Profiles and Budgets 2009-10 Draft Budget

8/7/2019 2009_2010DRAFT
http://slidepdf.com/reader/full/20092010draft 189/268
Teaching and Learning
2007-2008 2008-2009 2009-2010
Var Bud vs
Amend
Actual Amended Proposed Fav/(Unfav)
Expenditure Summary (All Funds)
Facilities and Related
Utilities 1,835 4,800 1,700 3,100
Instructional Supplies 2,755,559 1,737,341 1,425,414 311,927
Equip Service Contr & Repair 260,781 313,429 290,571 22,858
Facilities Service Contracts - - - -
Rentals 51,804 139,249 108,690 30,559
Maintenance Repair Supplies - - - -
Postage Printing & Advertising 235,543 102,939 190,987 (88,048)
Auto Supplies 781 1,500 1,100 400
Supplies and Materials 269,662 480,530 407,212 73,318
Custodial Supplies 1,086 700 - 700
Office Supplies 109,178 130,634 93,005 37,629
Sub Total Facilities and Related 3,686,227 2,911,122 2,518,678 392,444
Technology
Computer Software - Instructional 585,245 608,511 606,847 1,664
Computer Software - Non Instructional 30,370 65,376 62,066 3,310
Subtotal Technology 615,615 673,887 668,913 4,974
Miscellaneous Services
Sub Total Miscellaneous Services 264,158 336,030 270,665 65,365
All Other Variable Expenses
Professional & Technical Serv 6,429,369 10,104,313 8,624,427 1,479,886
Agency Clerical 169,913 198,985 26,931 172,054
Judgments and Claims - - - -
Grant Disallowances - - - -
Departmental Credits - - - -
Indirect Costs Grants - - - -
BOCES Services 407,847 798,946 825,466 (26,520)
Professional Development 256,844 636,575 265,232 371,344
Subtotal of All Other Variable Expenses 7,263,973 11,738,819 9,742,056 1,996,764
Total Non Compensation 41,302,251 43,602,150 41,061,343 2,540,807
Sub Total 66,157,099 69,720,707 66,253,224 3,467,483
Fund Balance Reserve - - - -
Grand Total 66,157,099 69,720,707 66,253,224 3,467,483
Section 6 Page 5
School Support Profiles and Budgets 2009-10 Draft Budget
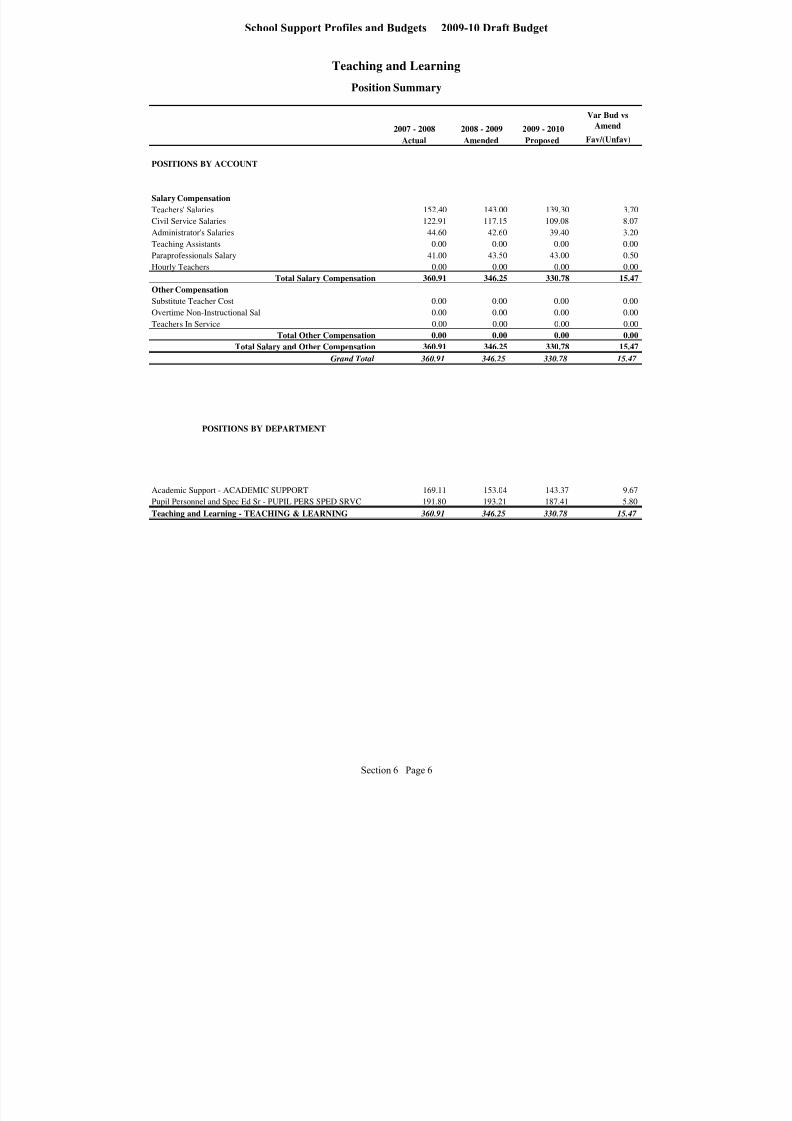
8/7/2019 2009_2010DRAFT
http://slidepdf.com/reader/full/20092010draft 190/268
Teaching and Learning
2007 - 2008 2008 - 2009 2009 - 2010
Var Bud vs
Amend
Actual Amended Proposed Fav/(Unfav)
POSITIONS BY ACCOUNT
Salary Compensation
Teachers' Salaries 152.40 143.00 139.30 3.70
Civil Service Salaries 122.91 117.15 109.08 8.07
Administrator's Salaries 44.60 42.60 39.40 3.20
Teaching Assistants 0.00 0.00 0.00 0.00
Paraprofessionals Salary 41.00 43.50 43.00 0.50
Hourly Teachers 0.00 0.00 0.00 0.00
Total Salary Compensation 360.91 346.25 330.78 15.47
Other Compensation
Substitute Teacher Cost 0.00 0.00 0.00 0.00Overtime Non-Instructional Sal 0.00 0.00 0.00 0.00
Teachers In Service 0.00 0.00 0.00 0.00
Total Other Compensation 0.00 0.00 0.00 0.00
Total Salary and Other Compensation 360.91 346.25 330.78 15.47
Grand Total 360.91 346.25 330.78 15.47
POSITIONS BY DEPARTMENT
Academic Support - ACADEMIC SUPPORT 169.11 153.04 143.37 9.67
Pupil Personnel and Spec Ed Sr - PUPIL PERS SPED SRVC 191.80 193.21 187.41 5.80
Teaching and Learning - TEACHING & LEARNING 360.91 346.25 330.78 15.47
Position Summary
Section 6 Page 6
School Support Profiles and Budgets 2009-10 Draft Budget
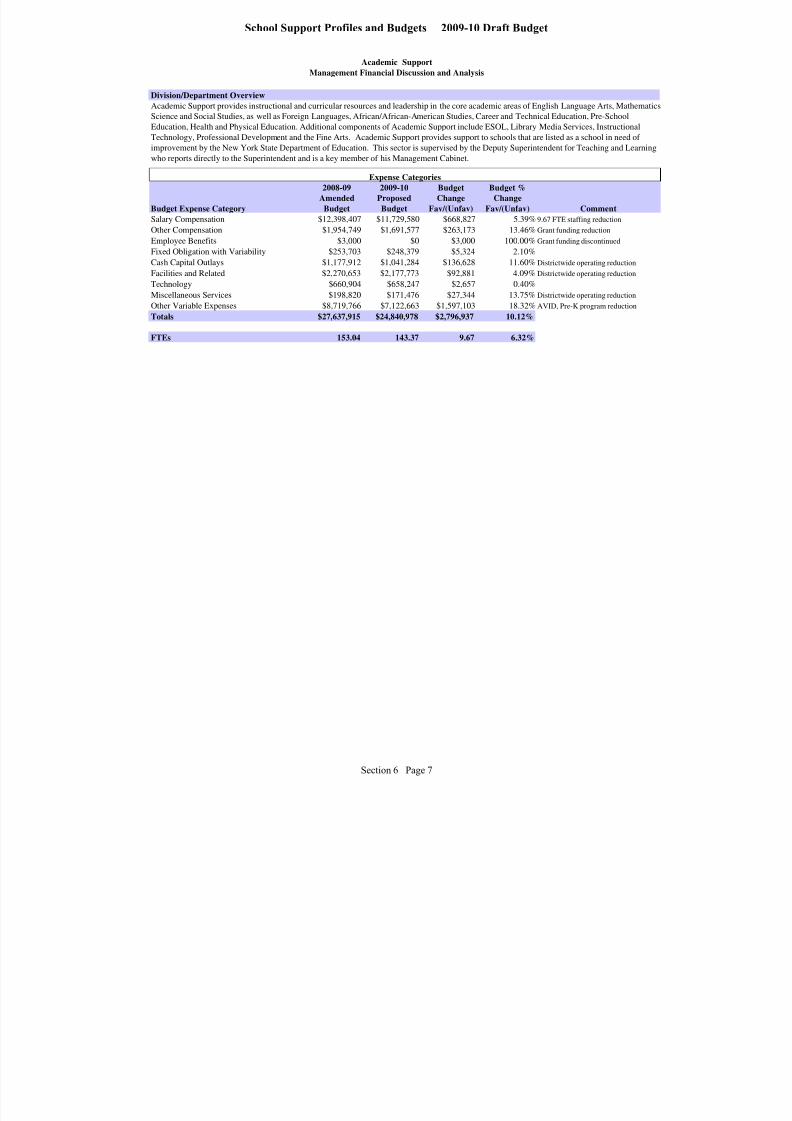
8/7/2019 2009_2010DRAFT
http://slidepdf.com/reader/full/20092010draft 191/268
Academic Support
Management Financial Discussion and Analysis
Division/Department Overview
Budget Expense Category
2008-09
Amended
Budget
2009-10
Proposed
Budget
Budget
Change
Fav/(Unfav)
Budget %
Change
Fav/(Unfav) Comment
Salary Compensation $12,398,407 $11,729,580 $668,827 5.39% 9.67 FTE staffing reduction
Other Compensation $1,954,749 $1,691,577 $263,173 13.46% Grant funding reduction
Employee Benefits $3,000 $0 $3,000 100.00% Grant funding discontinued
Fixed Obligation with Variability $253,703 $248,379 $5,324 2.10%
Cash Capital Outlays $1,177,912 $1,041,284 $136,628 11.60% Districtwide operating reduction
Facilities and Related $2,270,653 $2,177,773 $92,881 4.09% Districtwide operating reduction
Technology $660,904 $658,247 $2,657 0.40%
Miscellaneous Services $198,820 $171,476 $27,344 13.75% Districtwide operating reduction
Other Variable Expenses $8,719,766 $7,122,663 $1,597,103 18.32% AVID, Pre-K program reduction
Totals $27,637,915 $24,840,978 $2,796,937 10.12%
FTEs 153.04 143.37 9.67 6.32%
Expense Categories
Academic Support provides instructional and curricular resources and leadership in the core academic areas of English Language Arts, Mathematics
Science and Social Studies, as well as Foreign Languages, African/African-American Studies, Career and Technical Education, Pre-School
Education, Health and Physical Education. Additional components of Academic Support include ESOL, Library Media Services, Instructional
Technology, Professional Development and the Fine Arts. Academic Support provides support to schools that are listed as a school in need of
improvement by the New York State Department of Education. This sector is supervised by the Deputy Superintendent for Teaching and Learningwho reports directly to the Superintendent and is a key member of his Management Cabinet.
Section 6 Page 7
School Support Profiles and Budgets 2009-10 Draft Budget

8/7/2019 2009_2010DRAFT
http://slidepdf.com/reader/full/20092010draft 192/268
Academic Support
Management Financial Discussion and Analysis
Department Budget
2008-09
Amended
Budget
2009-10
Proposed
Budget
Budget
Change
Fav/(Unfav)
Budget %
Change
Fav/(Unfav)
#1 - Martin B Anderson - PreK - 10101 $5,798 $9,311 ($3,513) (60.59%)
#2 - Clara Barton - PreK - 10201 $18,125 $9,311 $8,814 48.63%# 4 - George M Forbes - PS - 10401 $11,501 $0 $11,501 100.00%
# 6 - Dag Hammarskjold - PreK - 10601 $32,300 $6,053 $26,247 81.26%
#7 - Virgil I. Grissom - PreK - 10701 $18,149 $8,053 $10,096 55.63%
#8 - Roberto Clemente - PreK - 10801 $357,321 $348,237 $9,084 2.54%
#9 - Martin Luther King - PreK - 10901 $81,689 $112,526 ($30,837) (37.75%)
#14 - Chester Dewey - PreK - 11401 $124,563 $118,007 $6,556 5.26%
#16 - John W Spencer - PreK - 11601 $5,798 $6,054 ($256) (4.42%)
#17 - Enrico Fermi - PreK - 11701 $252,305 $209,851 $42,454 16.83%
#19 - Dr Chas Lunsford - PreK - 11901 $229,893 $228,389 $1,504 0.65%
#20 - Henry Lomb - PreK - 12001 $90,724 $94,366 ($3,642) (4.01%)
#22 - Abraham Lincoln - PreK - 12201 $8,083 $8,438 ($355) (4.39%)
#23 - Francis Parker - PreK - 12301 $8,790 $9,176 ($386) (4.39%)
#25 - Nathan. Hawthorne - PreK - 12501 $106,266 $90,431 $15,835 14.90%
#29 - Adlai E Stevenson - PreK - 12901 $8,481 $8,854 ($373) (4.40%)#33 - Audubon School - PreK - 13301 $846,964 $861,247 ($14,283) (1.69%)
#36 - Henry Longfellow - PreK - 13601 $7,544 $7,615 ($71) (0.94%)
#39 - Andrew J Townson - PreK - 13901 $9,420 $4,607 $4,813 51.09%
#41 - Kodak Park School - PreK - 14101 $22,567 $5,101 $17,466 77.40%
#42 - Abelard Reynolds - PreK - 14201 $5,009 $5,179 ($170) (3.39%)
#44 - Lincoln Park - PreK - 14401 $5,679 $4,323 $1,356 23.88%
#45 - Mary McLeod Bethune-PreK - 14501 $93,825 $78,931 $14,894 15.87%
#52 - Frank Fowler Dow - PreK - 15201 $6,344 $6,628 ($284) (4.48%)
#53 -Montessori Academy - PreK - 15301 $253,012 $225,811 $27,201 10.75%
#57 - Early Childhood - PreK - 15701 $365,752 $380,646 ($14,894) (4.07%)
#58 - World of Inquiry -PS - 15801 $6,413 $0 $6,413 100.00%
Pre-School Parent Program - PS - 18101 $1,704,869 $1,720,837 ($15,968) (0.94%)
Elementary Schools - PS - 19901 $0 $58,365 ($58,365) 0.00%
Career & Technical Education - 24003 $205,111 $660,835 ($455,724) (222.18%)Interscholastic Sports - HS - 29305 $2,702,376 $2,167,068 $535,308 19.81%
Bilingual Education - AS - 33317 $1,071,712 $1,185,050 ($113,338) (10.58%)
Native American Program - AS - 33817 $88,061 $75,845 $12,216 13.87%
Arts Education - AS - 42117 $835,837 $534,426 $301,411 36.06%
Library Services - AS - 42217 $371,532 $334,317 $37,215 10.02%
Early Childhood Office - PS - 44501 $5,846,569 $5,409,851 $436,718 7.47%
Instruct Tech for Schools - CS - 64513 $3,254,092 $2,387,404 $866,688 26.63%
Magnet School Supervision - 71517 $65,000 $0 $65,000 100.00%
Dept of School Improvement - 73016 $201,343 $161,346 $39,997 19.87%
Dept of School Support - DM - 73116 $3,132,450 $2,794,808 $337,642 10.78%
Dpty Supt Teaching & Learning - 73216 $1,913,319 $1,856,121 $57,198 2.99%
Office of Mathematics - 73516 $811,025 $682,961 $128,064 15.79%
Office of Social Studies - 73616 $315,065 $298,280 $16,785 5.33%
Off Eng Lang Arts 7-12 - 73716 $451,016 $151,326 $299,690 66.45%Academic Intervention Services - 73916 $1,270,521 $1,171,871 $98,650 7.76%
Literacy Center - 74316 $0 $0 $0 0.00%
Office of Foreign Languages - - 74416 $207,067 $95,744 $111,323 53.76%
African & African-Amer Studies - 74616 $7,000 $4,900 $2,100 30.00%
Dept of Professional Dvlpmnt - 75216 $201,635 $242,479 ($40,844) (20.26%)
School Support $27,637,915 $24,840,978 $2,796,937 10.12%
Departments
Section 6 Page 8
School Support Profiles and Budgets 2009-10 Draft Budget
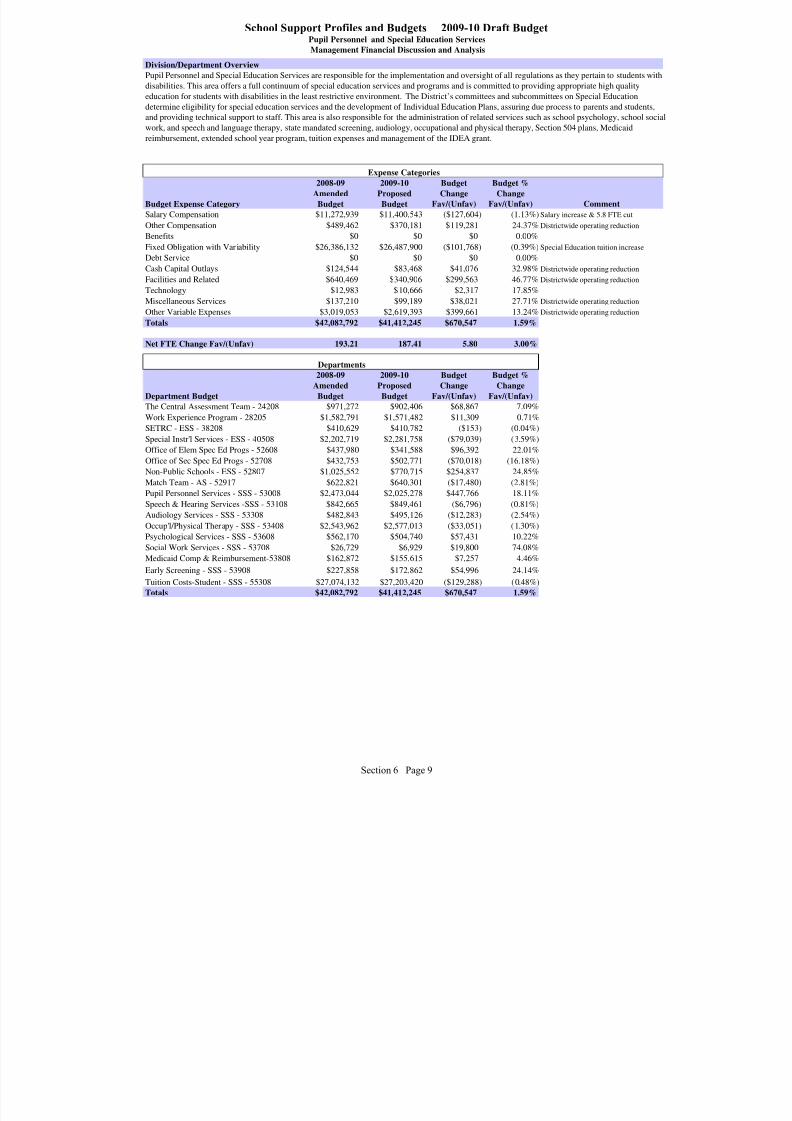
8/7/2019 2009_2010DRAFT
http://slidepdf.com/reader/full/20092010draft 193/268
Pupil Personnel and Special Education Services
Management Financial Discussion and Analysis
Division/Department Overview
Budget Expense Category
2008-09
Amended
Budget
2009-10
Proposed
Budget
Budget
Change
Fav/(Unfav)
Budget %
Change
Fav/(Unfav) Comment
Salary Compensation $11,272,939 $11,400,543 ($127,604) (1.13%) Salary increase & 5.8 FTE cut
Other Compensation $489,462 $370,181 $119,281 24.37% Districtwide operating reduction
Benefits $0 $0 $0 0.00%
Fixed Obligation with Variability $26,386,132 $26,487,900 ($101,768) (0.39%) Special Education tuition increase
Debt Service $0 $0 $0 0.00%
Cash Capital Outlays $124,544 $83,468 $41,076 32.98% Districtwide operating reduction
Facilities and Related $640,469 $340,906 $299,563 46.77% Districtwide operating reduction
Technology $12,983 $10,666 $2,317 17.85%
Miscellaneous Services $137,210 $99,189 $38,021 27.71% Districtwide operating reductionOther Variable Expenses $3,019,053 $2,619,393 $399,661 13.24% Districtwide operating reduction
Totals $42,082,792 $41,412,245 $670,547 1.59%
Net FTE Change Fav/(Unfav) 193.21 187.41 5.80 3.00%
Department Budget
2008-09
Amended
Budget
2009-10
Proposed
Budget
Budget
Change
Fav/(Unfav)
Budget %
Change
Fav/(Unfav)
The Central Assessment Team - 24208 $971,272 $902,406 $68,867 7.09%
Work Experience Program - 28205 $1,582,791 $1,571,482 $11,309 0.71%
SETRC - ESS - 38208 $410,629 $410,782 ($153) (0.04%)
Special Instr'l Services - ESS - 40508 $2,202,719 $2,281,758 ($79,039) (3.59%)
Office of Elem Spec Ed Progs - 52608 $437,980 $341,588 $96,392 22.01%
Office of Sec Spec Ed Progs - 52708 $432,753 $502,771 ($70,018) (16.18%)
Non-Public Schools - ESS - 52807 $1,025,552 $770,715 $254,837 24.85%
Match Team - AS - 52917 $622,821 $640,301 ($17,480) (2.81%)
Pupil Personnel Services - SSS - 53008 $2,473,044 $2,025,278 $447,766 18.11%
Speech & Hearing Services -SSS - 53108 $842,665 $849,461 ($6,796) (0.81%)
Audiology Services - SSS - 53308 $482,843 $495,126 ($12,283) (2.54%)
Occup'l/Physical Therapy - SSS - 53408 $2,543,962 $2,577,013 ($33,051) (1.30%)
Psychological Services - SSS - 53608 $562,170 $504,740 $57,431 10.22%
Social Work Services - SSS - 53708 $26,729 $6,929 $19,800 74.08%
Medicaid Comp & Reimbursement-53808 $162,872 $155,615 $7,257 4.46%
Early Screening - SSS - 53908 $227,858 $172,862 $54,996 24.14%
Tuition Costs-Student - SSS - 55308 $27,074,132 $27,203,420 ($129,288) (0.48%)
Totals $42,082,792 $41,412,245 $670,547 1.59%
Expense Categories
Pupil Personnel and Special Education Services are responsible for the implementation and oversight of all regulations as they pertain to students with
disabilities. This area offers a full continuum of special education services and programs and is committed to providing appropriate high quality
education for students with disabilities in the least restrictive environment. The District’s committees and subcommittees on Special Education
determine eligibility for special education services and the development of Individual Education Plans, assuring due process to parents and students,
and providing technical support to staff. This area is also responsible for the administration of related services such as school psychology, school socia
work, and speech and language therapy, state mandated screening, audiology, occupational and physical therapy, Section 504 plans, Medicaid
reimbursement, extended school year program, tuition expenses and management of the IDEA grant.
Departments
Section 6 Page 9
School Support Profiles and Budgets 2009-10 Draft Budget
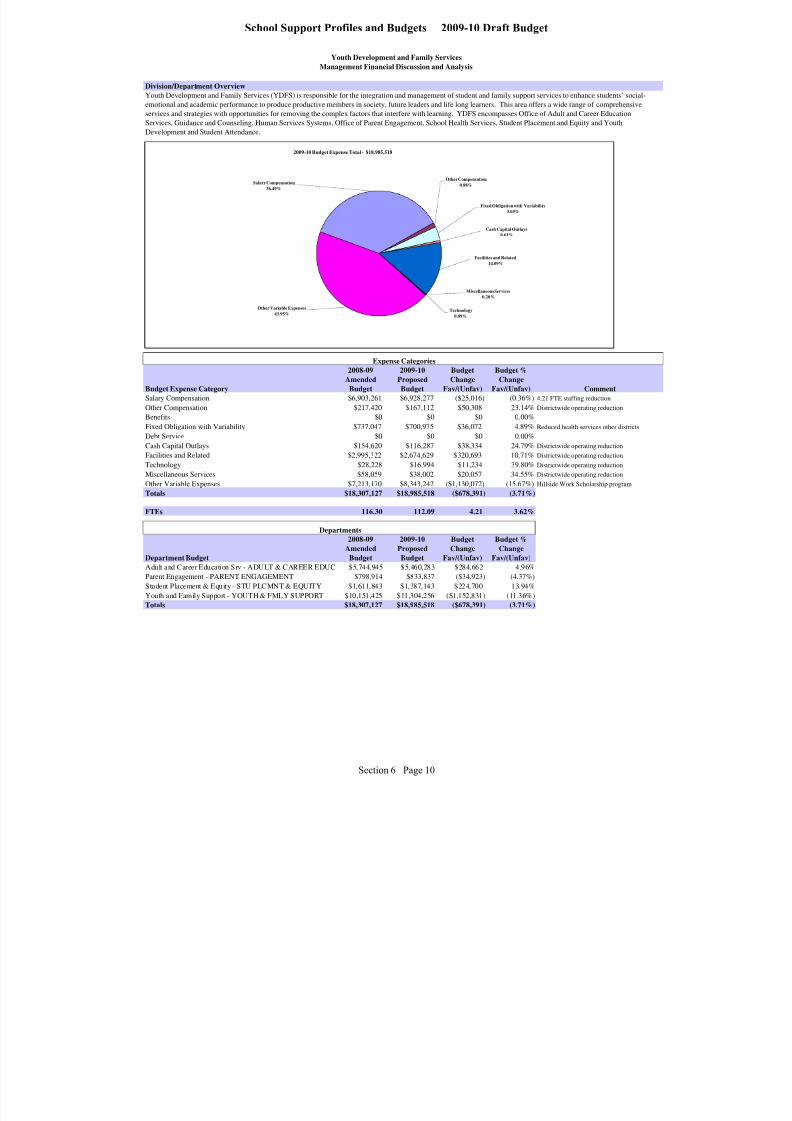
8/7/2019 2009_2010DRAFT
http://slidepdf.com/reader/full/20092010draft 194/268
Youth Development and Family Services
Management Financial Discussion and Analysis
Division/Department Overview
Budget Expense Category
2008-09
Amended
Budget
2009-10
Proposed
Budget
Budget
Change
Fav/(Unfav)
Budget %
Change
Fav/(Unfav) Comment
Salary Compensation $6,903,261 $6,928,277 ($25,016) (0.36%) 4.21 FTE staffing reduction
Other Compensation $217,420 $167,112 $50,308 23.14% Districtwide operating reduction
Benefits $0 $0 $0 0.00%
Fixed Obligation with Variability $737,047 $700,975 $36,072 4.89% Reduced health services other districts
Debt Service $0 $0 $0 0.00%
Cash Capital Outlays $154,620 $116,287 $38,334 24.79% Districtwide operating reduction
Facilities and Related $2,995,322 $2,674,629 $320,693 10.71% Districtwide operating reductionTechnology $28,228 $16,994 $11,234 39.80% Districtwide operating reduction
Miscellaneous Services $58,059 $38,002 $20,057 34.55% Districtwide operating reduction
Other Variable Expenses $7,213,170 $8,343,242 ($1,130,072) (15.67%) Hillside Work Scholarship program
Totals $18,307,127 $18,985,518 ($678,391) (3.71%)
FTEs 116.30 112.09 4.21 3.62%
Department Budget
2008-09
Amended
Budget
2009-10
Proposed
Budget
Budget
Change
Fav/(Unfav)
Budget %
Change
Fav/(Unfav)
Adult and Career Education Srv - ADULT & CAREER EDUC $5,744,945 $5,460,283 $284,662 4.96%
Parent Engagement - PARENT ENGAGEMENT $798,914 $833,837 ($34,923) (4.37%)
Student Placement & Equity - STU PLCMNT & EQUITY $1,611,843 $1,387,143 $224,700 13.94%
Youth and Family Support - YOUTH & FMLY SUPPORT $10,151,425 $11,304,256 ($1,152,831) (11.36%)
Totals $18,307,127 $18,985,518 ($678,391) (3.71%)
Youth Development and Family Services (YDFS) is responsible for the integration and management of student and family support services to enhance students’ social-
emotional and academic performance to produce productive members in society, future leaders and life long learners. This area offers a wide range of comprehensive
services and strategies with opportunities for removing the complex factors that interfere with learning. YDFS encompasses Office of Adult and Career Education
Services, Guidance and Counseling, Human Services Systems, Office of Parent Engagement, School Health Services, Student Placement and Equity and Youth
Development and Student Attendance.
Expense Categories
Departments
2009-10 Budget Expense Total - $18,985,518
Other Variable Expenses
43.95%Technology
0.09%
Miscellaneous Services
0.20%
Salary Compensation
36.49%
Fixed Obligation with Variability
3.69%
Cash Capital Outlays
0.61%
Facilities and Related
14.09%
Other Compensation
0.88%
Section 6 Page 10
School Support Profiles and Budgets 2009-10 Draft Budget

8/7/2019 2009_2010DRAFT
http://slidepdf.com/reader/full/20092010draft 195/268
Youth Development and Family Services
2007-2008 2008-2009 2009-2010
Var Bud vs
Amend
Actual Amended Proposed Fav/(Unfav)
EXPENDITURES BY ACCOUNT
Salary Compensation
Teachers' Salaries 2,712,159 2,653,851 2,524,404 129,447
Civil Service Salaries 2,136,322 2,397,775 2,591,482 (193,707)
Administrator's Salaries 863,264 1,309,245 1,368,636 (59,391)
Hourly Teachers 384,126 440,699 344,934 95,765
Teaching Assistants - - - -
Paraprofessionals Salary 91,018 101,691 98,821 2,870
Sub Total Salary Compensation 6,186,888 6,903,261 6,928,277 (25,016)
Other Compensation
Substitute Teacher Cost 21,187 37,090 35,738 1,352
Overtime Non-Instructional Sal 155,153 136,011 107,551 28,460
Teachers In Service 35,412 44,319 23,823 20,496
Sub Total Other Compensation 211,752 217,420 167,112 50,308
Total Salary and Other Compensation 6,398,640 7,120,681 7,095,389 25,292
Employee Benefits
Employee Benefits - - - -
State Employee Retirement - - - -
State Teachers Retirement - - - -
Voluntary Separation Plan - - - -
ERI Incentive - - - -
TRI Incentive - - - -
Sub Total Employee Benefits - - - -
Total Compensation and Benefits 6,398,640 7,120,681 7,095,389 25,292
Fixed Obligations With Variability
Special Education Tuition - - - -
Contract Transportation 23,527 53,047 50,975 2,072
Charter School Tuition - - - -
Health Service Other Districts 519,824 599,000 575,000 24,000
Insurance Non-employee - 85,000 75,000 10,000
Sub Total Fixed Obligations 543,351 737,047 700,975 36,072
Debt Service
Sub Total Debt Service - - - -
Cash Capital Outlays
Cash Capital Expense - - - -
Textbooks 3,517 11,012 5,224 5,788
Equipment Other Than Buses 96,856 69,490 47,378 22,113
Equipment Buses - - - -
Computer Hardware - Instructional - - - -
Computer Hardware - Non Instructional 71,500 74,118 63,685 10,433
Library Books - - - -
Sub Total Cash Capital Outlays 171,873 154,620 116,287 38,334
Expenditure Summary (All Funds)
Section 6 Page 11
School Support Profiles and Budgets 2009-10 Draft Budget
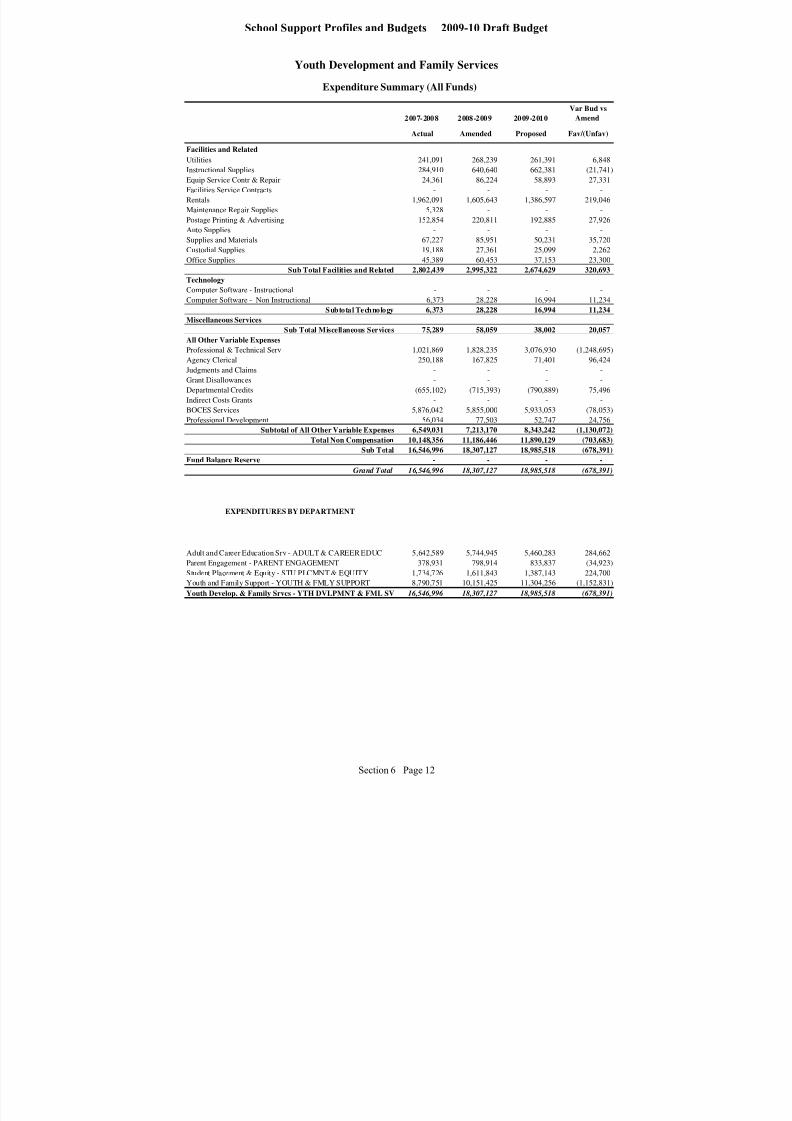
8/7/2019 2009_2010DRAFT
http://slidepdf.com/reader/full/20092010draft 196/268
Youth Development and Family Services
2007-2008 2008-2009 2009-2010
Var Bud vs
Amend
Actual Amended Proposed Fav/(Unfav)
Expenditure Summary (All Funds)
Facilities and RelatedUtilities 241,091 268,239 261,391 6,848
Instructional Supplies 284,910 640,640 662,381 (21,741)
Equip Service Contr & Repair 24,361 86,224 58,893 27,331
Facilities Service Contracts - - - -
Rentals 1,962,091 1,605,643 1,386,597 219,046
Maintenance Repair Supplies 5,328 - - -
Postage Printing & Advertising 152,854 220,811 192,885 27,926
Auto Supplies - - - -
Supplies and Materials 67,227 85,951 50,231 35,720
Custodial Supplies 19,188 27,361 25,099 2,262
Office Supplies 45,389 60,453 37,153 23,300
Sub Total Facilities and Related 2,802,439 2,995,322 2,674,629 320,693
Technology
Computer Software - Instructional - - - -
Computer Software - Non Instructional 6,373 28,228 16,994 11,234 Subtotal Technology 6,373 28,228 16,994 11,234
Miscellaneous Services
Sub Total Miscellaneous Services 75,289 58,059 38,002 20,057
All Other Variable Expenses
Professional & Technical Serv 1,021,869 1,828,235 3,076,930 (1,248,695)
Agency Clerical 250,188 167,825 71,401 96,424
Judgments and Claims - - - -
Grant Disallowances - - - -
Departmental Credits (655,102) (715,393) (790,889) 75,496
Indirect Costs Grants - - - -
BOCES Services 5,876,042 5,855,000 5,933,053 (78,053)
Professional Development 56,034 77,503 52,747 24,756
Subtotal of All Other Variable Expenses 6,549,031 7,213,170 8,343,242 (1,130,072)
Total Non Compensation 10,148,356 11,186,446 11,890,129 (703,683)
Sub Total 16,546,996 18,307,127 18,985,518 (678,391)
Fund Balance Reserve - - - -
Grand Total 16,546,996 18,307,127 18,985,518 (678,391)
EXPENDITURES BY DEPARTMENT
Adult and Career Education Srv - ADULT & CAREER EDUC 5,642,589 5,744,945 5,460,283 284,662
Parent Engagement - PARENT ENGAGEMENT 378,931 798,914 833,837 (34,923)
Student Placement & Equity - STU PLCMNT & EQUITY 1,734,726 1,611,843 1,387,143 224,700
Youth and Family Support - YOUTH & FMLY SUPPORT 8,790,751 10,151,425 11,304,256 (1,152,831)
Youth Develop. & Family Srvcs - YTH DVLPMNT & FML SV 16,546,996 18,307,127 18,985,518 (678,391)
Section 6 Page 12
School Support Profiles and Budgets 2009-10 Draft Budget

8/7/2019 2009_2010DRAFT
http://slidepdf.com/reader/full/20092010draft 197/268
Youth Development and Family Services
2007 - 2008 2008 - 2009 2009 - 2010
Var Bud vs
Amend
Actual Amended Proposed Fav/(Unfav)
POSITIONS BY ACCOUNT
Salary Compensation
Teachers' Salaries 42.36 38.26 35.42 2.84
Civil Service Salaries 63.52 60.04 58.67 1.37
Administrator's Salaries 8.00 14.00 14.00 0.00
Teaching Assistants 0.00 0.00 0.00 0.00
Paraprofessionals Salary 5.00 4.00 4.00 0.00
Hourly Teachers 0.00 0.00 0.00 0.00
Total Salary Compensation 118.88 116.30 112.09 4.21
Other Compensation
Substitute Teacher Cost 0.00 0.00 0.00 0.00
Overtime Non-Instructional Sal 0.00 0.00 0.00 0.00Teachers In Service 0.00 0.00 0.00 0.00
Total Other Compensation 0.00 0.00 0.00 0.00
Total Salary and Other Compensation 118.88 116.30 112.09 4.21
Grand Total 118.88 116.30 112.09 4.21
POSITIONS BY DEPARTMENT
Adult and Career Education Srv - ADULT & CAREER EDUC 72.88 73.30 69.09 4.21
Parent Engagement - PARENT ENGAGEMENT 8.00 9.00 9.00 0.00
Student Placement & Equity - STU PLCMNT & EQUITY 24.00 18.00 18.00 0.00
Youth and Family Support - YOUTH & FMLY SUPPORT 14.00 16.00 16.00 0.00
Youth Develop. & Family Srvcs - YTH DVLPMNT & FML S 118.88 116.30 112.09 4.21
Position Summary
Section 6 Page 13
School Support Profiles and Budgets 2009-10 Draft Budget

8/7/2019 2009_2010DRAFT
http://slidepdf.com/reader/full/20092010draft 198/268
Adult and Career Education
Management Financial Discussion and Analysis
Division/Department Overview
Budget Expense Category
2008-09
Amended
Budget
2009-10
Proposed
Budget
Budget
Change
Fav/(Unfav)
Budget %
Change
Fav/(Unfav) Comment
Salary Compensation $3,955,093 $4,041,163 ($86,070) (2.18%) Salary increases & 4.21 FTE reduction
Other Compensation $40,271 $29,563 $10,709 26.59% Grant funding reduction
Benefits $0 $0 $0 0.00%
Fixed Obligations with Variability $28,166 $27,175 $991 3.52%
Debt Service $0 $0 $0 0.00%
Cash Capital Outlays $113,135 $85,189 $27,946 24.70% Districtwide operating reduction
Facilities and Related $2,052,037 $1,913,317 $138,720 6.76% Decreased rental costsTechnology $6,084 $5,050 $1,034 17.00%
Miscellaneous Services $30,296 $23,689 $6,607 21.81% Districtwide operating reduction
Other Variable Expenses ($480,137) ($664,863) $184,726 (38.47%) Increased rental chargeback credits
Totals $5,744,945 $5,460,283 $284,662 4.96%
FTEs 73.30 69.09 4.21 4.96%
Department Budget
2008-09
Amended
Budget
2009-10
Proposed
Budget
Budget
Change
Fav/(Unfav)
Budget %
Change
Fav/(Unfav)
Adult & Continuing Instr - WFP - 20003 $0 $0 $0 0.00%
Occup/Apprent Avocat Ed - WFP - 23103 $33,144 $31,358 $1,787 5.39%
CAREERS - WFP - 23303 $426,154 $308,358 $117,796 27.64%Equivalent Attendance - WFP - 23503 $1,833,432 $1,937,626 ($104,194) (5.68%)
Family Learn Ctr Hart St - WFP - 23703 $3,452,215 $3,182,941 $269,274 7.80%
Totals $5,744,945 $5,460,283 $284,662 4.96%
Departments
Expense Categories
Adult and Career Education Services helps students of all ages learn the skills they need for success in the workplace. Rochester residents learn new
skills in programs offered throughout the community in schools, businesses, industries, community-based organizations, libraries and jails. The
District offers comprehensive services to recruit, instruct, counsel, train, and place adult learners in jobs. Adult students participate in full or part-time
classes weekly. Grants are used to provide free educational opportunities to adults who do not have a high school or equivalency diploma or speak
English. Grants are used to help offset the costs of other occupational apprenticeship classes to keep student fees reasonable. Workforce Preparation
gives adults the chance to develop skills to function in a changing society.
Section 6 Page 14
School Support Profiles and Budgets 2009-10 Draft Budget

8/7/2019 2009_2010DRAFT
http://slidepdf.com/reader/full/20092010draft 199/268
Parent Engagement
Management Financial Discussion and Analysis
Division/Department Overview
Budget Expense Category
2008-09
Amended
Budget
2009-10
Proposed
Budget
Budget
Change
Fav/(Unfav)
Budget %
Change
Fav/(Unfav) Comment
Salary Compensation $408,346 $473,245 ($64,899) (15.89%) 2008-09 partial year salaries
Other Compensation $18,654 $10,904 $7,750 41.55% Districtwide operating reduction
Benefits $0 $0 $0 0.00%
Fixed Obligations with Variability $1,045 $800 $245 23.44% Districtwide operating reduction
Debt Service $0 $0 $0 0.00%
Cash Capital Outlays $5,700 $3,488 $2,213 38.82% Districtwide operating reduction
Facilities and Related $317,671 $313,374 $4,297 1.35%
Technology $385 $385 $0 0.00%Miscellaneous Services $15,130 $9,458 $5,672 37.49% Districtwide operating reduction
Other Variable Expenses $31,983 $22,183 $9,800 30.64% Districtwide operating reduction
Totals $798,914 $833,837 ($34,923) (4.37%)
FTEs 9.00 9.00 - 0.00%
Department Budget
2008-09
Amended
Budget
2009-10
Proposed
Budget
Budget
Change
Fav/(Unfav)
Budget %
Change
Fav/(Unfav)
Parent Engagement - 24516 $171,813 $196,826 ($25,013) (14.56%)
Parent University - DM - 54016 $50,000 $0 $50,000 100.00%Parent Involvement - 55516 $562,904 $622,814 ($59,910) (10.64%)
Dist. Adv, Counc to Title I - 55616 $14,197 $14,197 $0 0.00%
Totals $798,914 $833,837 ($34,923) (4.37%)
Expense Categories
Departments
Parent Engagement is responsible for the overall customer satisfaction of parents in the Rochester City School District. This office is
dedicated to partnering with parents in making sure their children’s educational needs are being met. The Parent Engagement Office
seeks to help schools and parents work together for student achievement through support systems by programs and standards established
by the National PTA. This area offers a wide variety of courses for parents throughout the year and shares resources and pertinent
information with parents. The Office of Parent Engagement empowers all parents to support the schools in educating their child.
Section 6 Page 15
School Support Profiles and Budgets 2009-10 Draft Budget
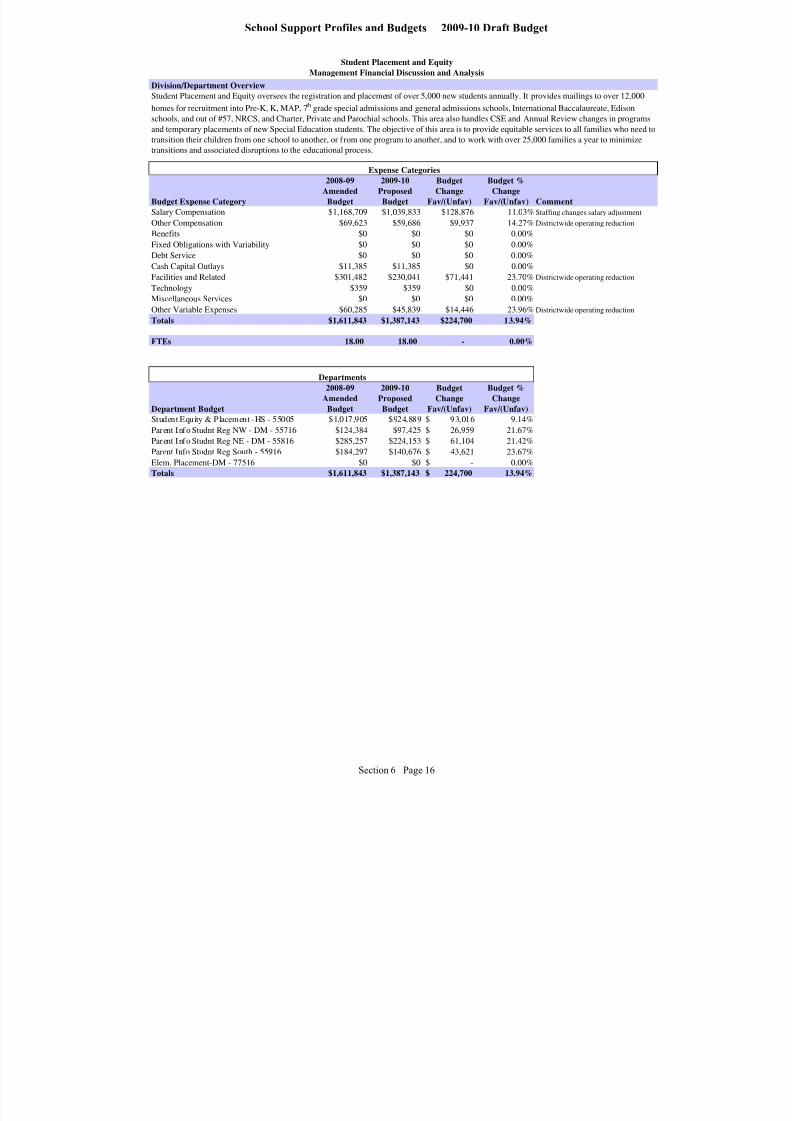
8/7/2019 2009_2010DRAFT
http://slidepdf.com/reader/full/20092010draft 200/268
Student Placement and Equity
Management Financial Discussion and Analysis
Division/Department Overview
Budget Expense Category
2008-09
Amended
Budget
2009-10
Proposed
Budget
Budget
Change
Fav/(Unfav)
Budget %
Change
Fav/(Unfav) Comment
Salary Compensation $1,168,709 $1,039,833 $128,876 11.03% Staffing changes salary adjustment
Other Compensation $69,623 $59,686 $9,937 14.27% Districtwide operating reduction
Benefits $0 $0 $0 0.00%
Fixed Obligations with Variability $0 $0 $0 0.00%
Debt Service $0 $0 $0 0.00%
Cash Capital Outlays $11,385 $11,385 $0 0.00%
Facilities and Related $301,482 $230,041 $71,441 23.70% Districtwide operating reduction
Technology $359 $359 $0 0.00%
Miscellaneous Services $0 $0 $0 0.00%Other Variable Expenses $60,285 $45,839 $14,446 23.96% Districtwide operating reduction
Totals $1,611,843 $1,387,143 $224,700 13.94%
FTEs 18.00 18.00 - 0.00%
Department Budget
2008-09
Amended
Budget
2009-10
Proposed
Budget
Budget
Change
Fav/(Unfav)
Budget %
Change
Fav/(Unfav)
Student Equity & Placement -HS - 55005 $1,017,905 $924,889 93,016$ 9.14%
Parent Info Studnt Reg NW - DM - 55716 $124,384 $97,425 26,959$ 21.67%
Parent Info Studnt Reg NE - DM - 55816 $285,257 $224,153 61,104$ 21.42%
Parent Info Studnt Reg South - 55916 $184,297 $140,676 43,621$ 23.67%Elem. Placement-DM - 77516 $0 $0 -$ 0.00%
Totals $1,611,843 $1,387,143 224,700$ 13.94%
Departments
Student Placement and Equity oversees the registration and placement of over 5,000 new students annually. It provides mailings to over 12,000
homes for recruitment into Pre-K, K, MAP, 7th
grade special admissions and general admissions schools, International Baccalaureate, Edison
schools, and out of #57, NRCS, and Charter, Private and Parochial schools. This area also handles CSE and Annual Review changes in programs
and temporary placements of new Special Education students. The objective of this area is to provide equitable services to all families who need to
transition their children from one school to another, or from one program to another, and to work with over 25,000 families a year to minimize
transitions and associated disruptions to the educational process.
Expense Categories
Section 6 Page 16
School Support Profiles and Budgets 2009-10 Draft Budget

8/7/2019 2009_2010DRAFT
http://slidepdf.com/reader/full/20092010draft 201/268
Youth and Family Support
Management Financial Discussion and Analysis
Division/Department Overview
Budget Expense Category
2008-09
Amended
Budget
2009-10
Proposed
Budget
Budget
Change
Fav/(Unfav)
Budget %
Change
Fav/(Unfav) Comment
Salary Compensation $1,371,113 $1,374,036 ($2,923) (0.2%)
Other Compensation $88,872 $66,960 $21,912 24.66% Districtwide operating reduction
Benefits $0 $0 $0 0.00%
Fixed Obligations With Variability $707,836 $673,000 $34,836 4.92% Districtwide operating reduction
Debt Service $0 $0 $0 0.00%
Cash Capital Outlays $24,400 $16,225 $8,175 33.50% Districtwide operating reduction
Facilities and Related $324,132 $217,897 $106,235 32.78% Districtwide operating reduction
Technology $21,400 $11,200 $10,200 47.66% Districtwide operating reduction
Miscellaneous Services $12,633 $4,855 $7,778 61.57% Districtwide operating reduction
Other Variable Expenses $7,601,039 $8,940,083 ($1,339,044) (17.6%) Hillside Work Scholarship program
Totals $10,151,425 $11,304,256 ($1,152,831) (11.4%)
FTEs 16.00 16.00 - 0.00%
Department Budget
2007-08
Amended
Budget
2008-09
Proposed
Budget
Budget
Change
Fav/(Unfav)
Budget %
Change
Fav/(Unfav)
Yth Dev Fmly Srv Supervision - 38508 $276,490 $1,581,078 ($1,304,588) (471.8%)
Human Services Systems - DM - 40616 $2,217,211 $2,106,122 $111,089 5.01%
Non-Public for Title IV - 40707 $29,190 $29,190 $0 0.00%
Attendance Services - SSS - 53208 $449,253 $400,107 $49,146 10.94%
Health Services - SSS - 53508 $6,812,282 $6,820,288 ($8,006) (0.1%)Office of Guidance - HS - 70905 $238,312 $233,701 $4,611 1.93%
Rochester Surround Care Comm C - 77316 $128,687 $133,770 ($5,083) (3.9%)
Totals $10,151,425 $11,304,256 ($1,152,831) (11.4%)
Departments
Youth and Family Support is responsible for implementing and evaluating youth development strategies, systems, and structures that help students
to become fully equipped to engage constructively as academic achievers in school and as citizens in our community. This office will take an
interdisciplinary approach to help standardize the social, emotional, and counseling curriculum and professional development across all schools and
work with the Director of Counseling to expand counseling services to K-6 schools; work with the Director of Human Services to provide
appropriate services to schools through outside agencies and student support services. The Office of Youth Development which includes the
supervision of attendance staff, are responsible for working with schools to improve attendance.
Expense Categories
Section 6 Page 17
School Support Profiles and Budgets 2009-10 Draft Budget

8/7/2019 2009_2010DRAFT
http://slidepdf.com/reader/full/20092010draft 202/268
THIS PAGE INTENTIONALLY LEFT BLANK
Section 6 Page 18
School Support Profiles and Budgets 2009-10 Draft Budget
8/7/2019 2009_2010DRAFT
http://slidepdf.com/reader/full/20092010draft 203/268
a dmInIstratIon ProfIles and Budgets
Board o EducationSuperintendentChie o Sta Accountability Administrative ServicesCommunicationsGeneral CounselHuman Capital Initiatives
School InnovationDebt ServiceDistrict-Wide Non-Program ExpenseEmployee Benefts

8/7/2019 2009_2010DRAFT
http://slidepdf.com/reader/full/20092010draft 204/268
THIS PAGE INTENTIONALLY LEFT BLANK
Section 7 Page 2
Administration Profiles and Budgets 2009-10 Draft Budget
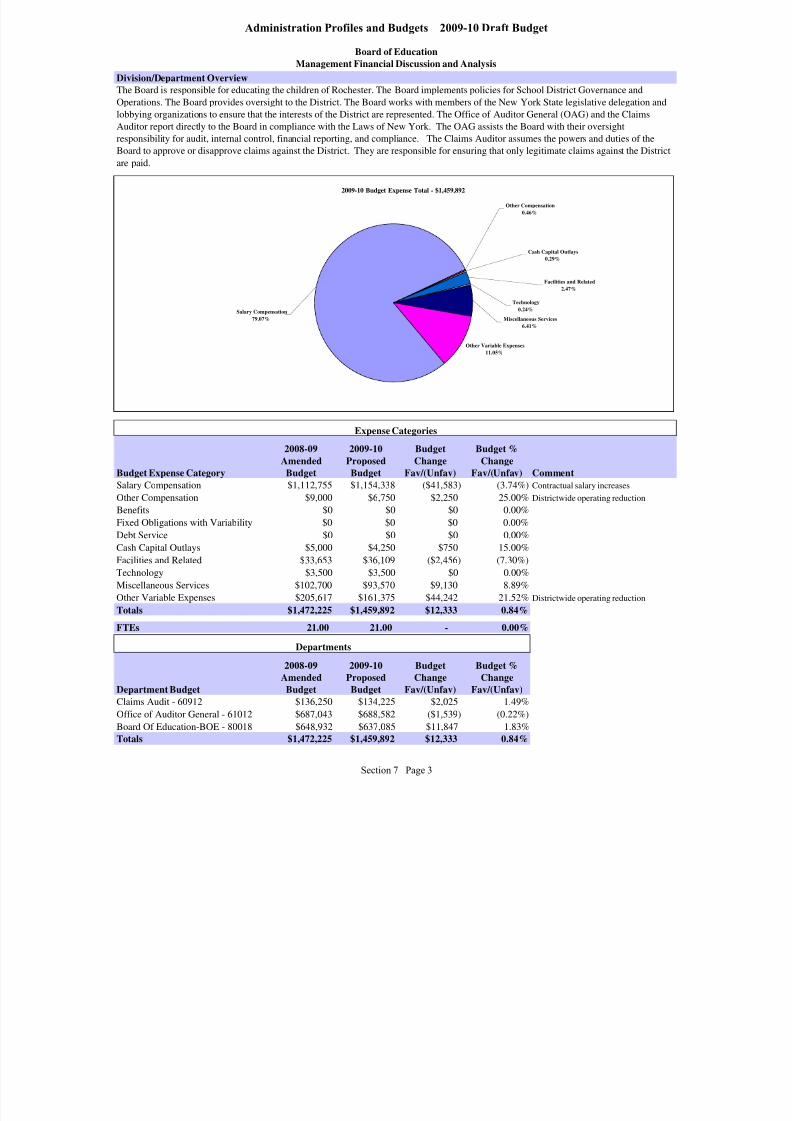
8/7/2019 2009_2010DRAFT
http://slidepdf.com/reader/full/20092010draft 205/268
Board of Education
Management Financial Discussion and Analysis
Division/Department Overview
Budget Expense Category
2008-09
Amended
Budget
2009-10
Proposed
Budget
Budget
Change
Fav/(Unfav)
Budget %
Change
Fav/(Unfav) Comment
Salary Compensation $1,112,755 $1,154,338 ($41,583) (3.74%) Contractual salary increases
Other Compensation $9,000 $6,750 $2,250 25.00% Districtwide operating reduction
Benefits $0 $0 $0 0.00%
Fixed Obligations with Variability $0 $0 $0 0.00%
Debt Service $0 $0 $0 0.00%
Cash Capital Outlays $5,000 $4,250 $750 15.00%
Facilities and Related $33,653 $36,109 ($2,456) (7.30%)
Technology $3,500 $3,500 $0 0.00%
Miscellaneous Services $102,700 $93,570 $9,130 8.89%
Other Variable Expenses $205,617 $161,375 $44,242 21.52% Districtwide operating reduction
Totals $1,472,225 $1,459,892 $12,333 0.84%
FTEs 21.00 21.00 - 0.00%
Department Budget
2008-09
Amended
Budget
2009-10
Proposed
Budget
Budget
Change
Fav/(Unfav)
Budget %
Change
Fav/(Unfav)
Claims Audit - 60912 $136,250 $134,225 $2,025 1.49%
Office of Auditor General - 61012 $687,043 $688,582 ($1,539) (0.22%)
Board Of Education-BOE - 80018 $648,932 $637,085 $11,847 1.83%
Totals $1,472,225 $1,459,892 $12,333 0.84%
Expense Categories
Departments
The Board is responsible for educating the children of Rochester. The Board implements policies for School District Governance and
Operations. The Board provides oversight to the District. The Board works with members of the New York State legislative delegation an
lobbying organizations to ensure that the interests of the District are represented. The Office of Auditor General (OAG) and the Claims
Auditor report directly to the Board in compliance with the Laws of New York. The OAG assists the Board with their oversight
responsibility for audit, internal control, financial reporting, and compliance. The Claims Auditor assumes the powers and duties of the
Board to approve or disapprove claims against the District. They are responsible for ensuring that only legitimate claims against the Distrare paid.
2009-10 Budget Expense Total - $1,459,892
Other Variable Expenses
11.05%
Miscellaneous Services
6.41%
Technology0.24%
Facilities and Related
2.47%
Cash Capital Outlays
0.29%
Other Compensation
0.46%
Salary Compensation
79.07%
Section 7 Page 3
Administration Profiles and Budgets 2009-10 Draft Budget
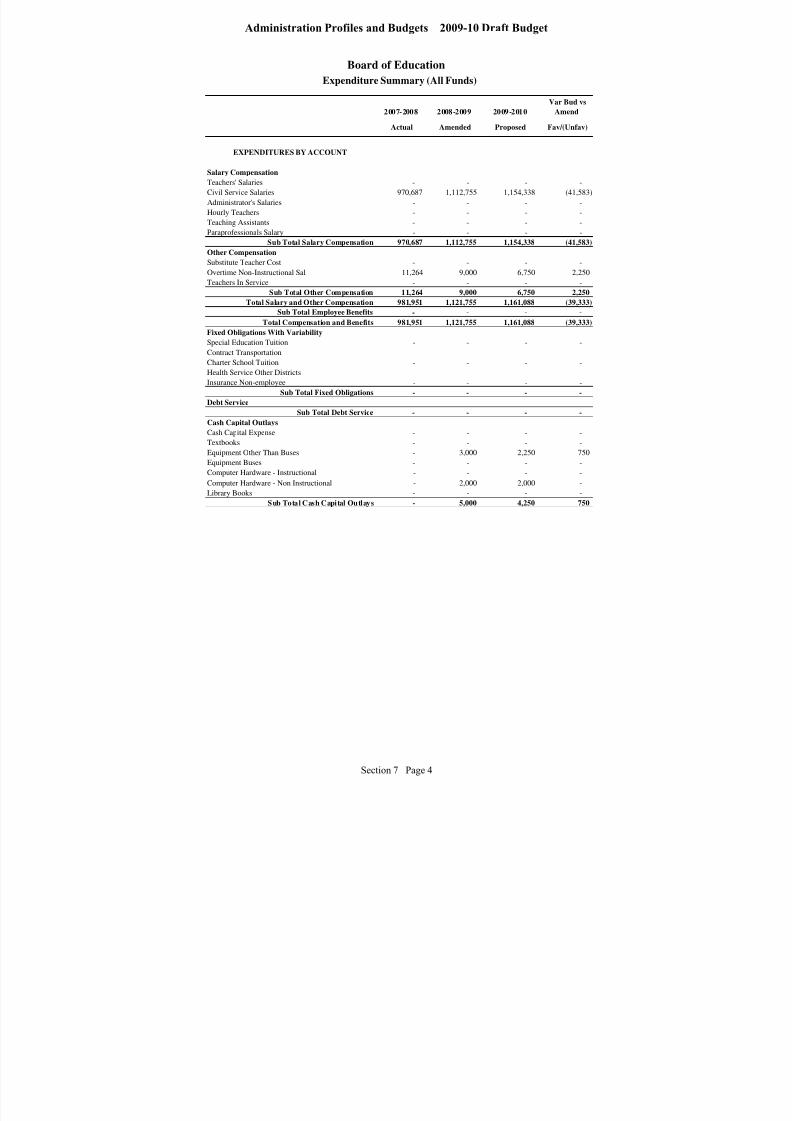
8/7/2019 2009_2010DRAFT
http://slidepdf.com/reader/full/20092010draft 206/268
Board of Education
2007-2008 2008-2009 2009-2010
Var Bud vs
Amend
Actual Amended Proposed Fav/(Unfav)
EXPENDITURES BY ACCOUNT
Salary Compensation
Teachers' Salaries - - - -
Civil Service Salaries 970,687 1,112,755 1,154,338 (41,583)
Administrator's Salaries - - - -
Hourly Teachers - - - -
Teaching Assistants - - - -
Paraprofessionals Salary - - - -
Sub Total Salary Compensation 970,687 1,112,755 1,154,338 (41,583)
Other Compensation
Substitute Teacher Cost - - - -
Overtime Non-Instructional Sal 11,264 9,000 6,750 2,250
Teachers In Service - - - -
Sub Total Other Compensation 11,264 9,000 6,750 2,250
Total Salary and Other Compensation 981,951 1,121,755 1,161,088 (39,333) Sub Total Employee Benefits - - - -
Total Compensation and Benefits 981,951 1,121,755 1,161,088 (39,333)
Fixed Obligations With Variability
Special Education Tuition - - - -
Contract Transportation - - - -
Charter School Tuition - - - -
Health Service Other Districts - - - -
Insurance Non-employee - - - -
Sub Total Fixed Obligations - - - -
Debt Service
Sub Total Debt Service - - - -
Cash Capital Outlays
Cash Capital Expense - - - -
Textbooks - - - -
Equipment Other Than Buses - 3,000 2,250 750 Equipment Buses - - - -
Computer Hardware - Instructional - - - -
Computer Hardware - Non Instructional - 2,000 2,000 -
Library Books - - - -
Sub Total Cash Capital Outlays - 5,000 4,250 750
Expenditure Summary (All Funds)
Section 7 Page 4
Administration Profiles and Budgets 2009-10 Draft Budget

8/7/2019 2009_2010DRAFT
http://slidepdf.com/reader/full/20092010draft 207/268
Board of Education
2007-2008 2008-2009 2009-2010
Var Bud vs
Amend
Actual Amended Proposed Fav/(Unfav)
Expenditure Summary (All Funds)
Facilities and Related
Utilities 200 1,250 250 1,000
Instructional Supplies - 2,500 2,500 -
Equip Service Contr & Repair 589 2,000 4,000 (2,000)
Facilities Service Contracts - - - -
Rentals 1,758 1,500 1,500 -
Maintenance Repair Supplies - - - -
Postage Printing & Advertising 928 13,550 13,650 (100)
Auto Supplies - - - -
Supplies and Materials 669 3,000 3,000 -
Custodial Supplies - - - -
Office Supplies 8,060 9,853 11,209 (1,356)
Sub Total Facilities and Related 12,203 33,653 36,109 (2,456)
Technology
Computer Software - Instructional - - - -
Computer Software - Non Instructional 2,020 3,500 3,500 -
Subtotal Technology 2,020 3,500 3,500 - Miscellaneous Services
Sub Total Miscellaneous Services 29,907 102,700 93,570 9,130
All Other Variable Expenses
Professional & Technical Serv 123,747 151,417 136,000 15,417
Agency Clerical 7,655 22,200 - 22,200
Judgments and Claims - - - -
Grant Disallowances - - - -
Departmental Credits - - - -
Indirect Costs Grants - - - -
BOCES Services - - - -
Professional Development 21,103 32,000 25,375 6,625
Subtotal of All Other Variable Expenses 152,506 205,617 161,375 44,242
Total Non Compensation 196,636 350,470 298,804 51,666
Sub Total 1,178,587 1,472,225 1,459,892 12,333
Fund Balance Reserve - - - - Grand Total 1,178,587 1,472,225 1,459,892 12,333
Section 7 Page 5
Administration Profiles and Budgets 2009-10 Draft Budget
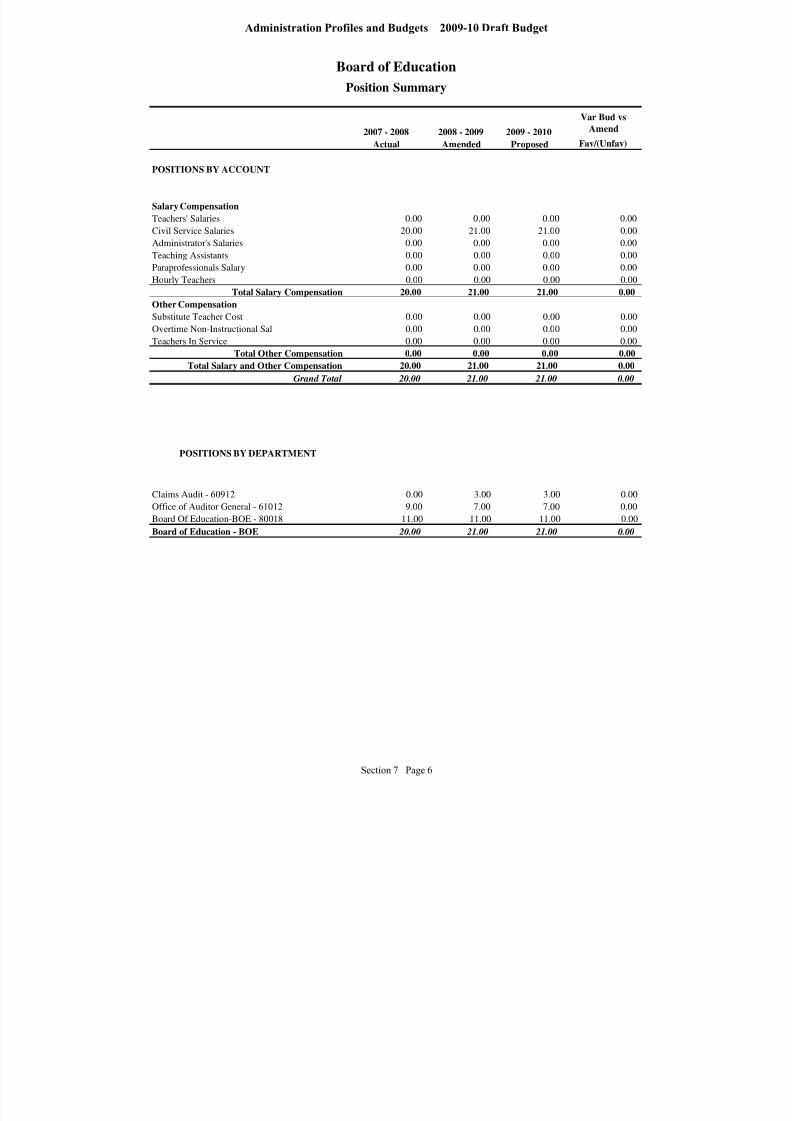
8/7/2019 2009_2010DRAFT
http://slidepdf.com/reader/full/20092010draft 208/268
Board of Education
2007 - 2008 2008 - 2009 2009 - 2010
Var Bud vs
Amend
Actual Amended Proposed Fav/(Unfav)
POSITIONS BY ACCOUNT
Salary Compensation
Teachers' Salaries 0.00 0.00 0.00 0.00
Civil Service Salaries 20.00 21.00 21.00 0.00
Administrator's Salaries 0.00 0.00 0.00 0.00
Teaching Assistants 0.00 0.00 0.00 0.00
Paraprofessionals Salary 0.00 0.00 0.00 0.00
Hourly Teachers 0.00 0.00 0.00 0.00
Total Salary Compensation 20.00 21.00 21.00 0.00
Other CompensationSubstitute Teacher Cost 0.00 0.00 0.00 0.00
Overtime Non-Instructional Sal 0.00 0.00 0.00 0.00
Teachers In Service 0.00 0.00 0.00 0.00
Total Other Compensation 0.00 0.00 0.00 0.00
Total Salary and Other Compensation 20.00 21.00 21.00 0.00
Grand Total 20.00 21.00 21.00 0.00
POSITIONS BY DEPARTMENT
Claims Audit - 60912 0.00 3.00 3.00 0.00
Office of Auditor General - 61012 9.00 7.00 7.00 0.00
Board Of Education-BOE - 80018 11.00 11.00 11.00 0.00
Board of Education - BOE 20.00 21.00 21.00 0.00
Position Summary
Section 7 Page 6
Administration Profiles and Budgets 2009-10 Draft Budget

8/7/2019 2009_2010DRAFT
http://slidepdf.com/reader/full/20092010draft 209/268
Superintendent
Management Financial Discussion and Analysis
Division/Department Overview
Budget Expense Category
2008-09
Amended
Budget
2009-10
Proposed
Budget
Budget
Change
Fav/(Unfav)
Budget %
Change
Fav/(Unfav) Comment
Salary Compensation $295,525 $307,199 ($11,674) (3.95%) Contractual salary increases
Other Compensation $0 $0 $0 0.00%
Benefits $0 $0 $0 0.00%
Fixed Obligations with Variability $0 $0 $0 0.00%
Debt Service $0 $0 $0 0.00%
Cash Capital $0 $0 $0 0.00%
Facilities and Related $0 $0 $0 0.00%
Technology $0 $0 $0 0.00%
Miscellaneous Services $0 $0 $0 0.00%
Other Variable Expenses $0 $0 $0 0.00%
Totals $295,525 $307,199 ($11,674) (3.95%)
FTEs 2.00 2.00 - 0.00%
Department Budget
2008-09
Amended
Budget
2009-10
Proposed
Budget
Budget
Change
Fav/(Unfav)
Budget %
Change
Fav/(Unfav)
Chief School Administrator -DM - 70016 $295,525 $307,199 ($11,674) (3.95%)
Totals $295,525 $307,199 ($11,674) (3.95%)
Departments
Expense Categories
The Superintendent of Schools leads the school district in carrying out its primary mission: ensuring that every child in Rochester has
access to world-class content taught by world-class teachers in schools led by world-class leaders. The goal is to ensure that every child is
post-secondary ready. The Office of the Superintendent is focused on three core values: Achievement – Improving student achievement
through a laser-like focus on teaching and learning with an emphasis on results; Equity – Equitable distribution of resources based on the
needs of schools and students; Accountability – Use of data to ensure that we hold adults accountable for the success of all students. The
Superintendent has chief executive authority and accountability for all aspects of District operations and for integrating them all in
support of student achievement.
2009-10 Budget Expense Total - $307,199
Salary Compensation
100.00%
Section 7 Page 7
Administration Profiles and Budgets 2009-10 Draft Budget
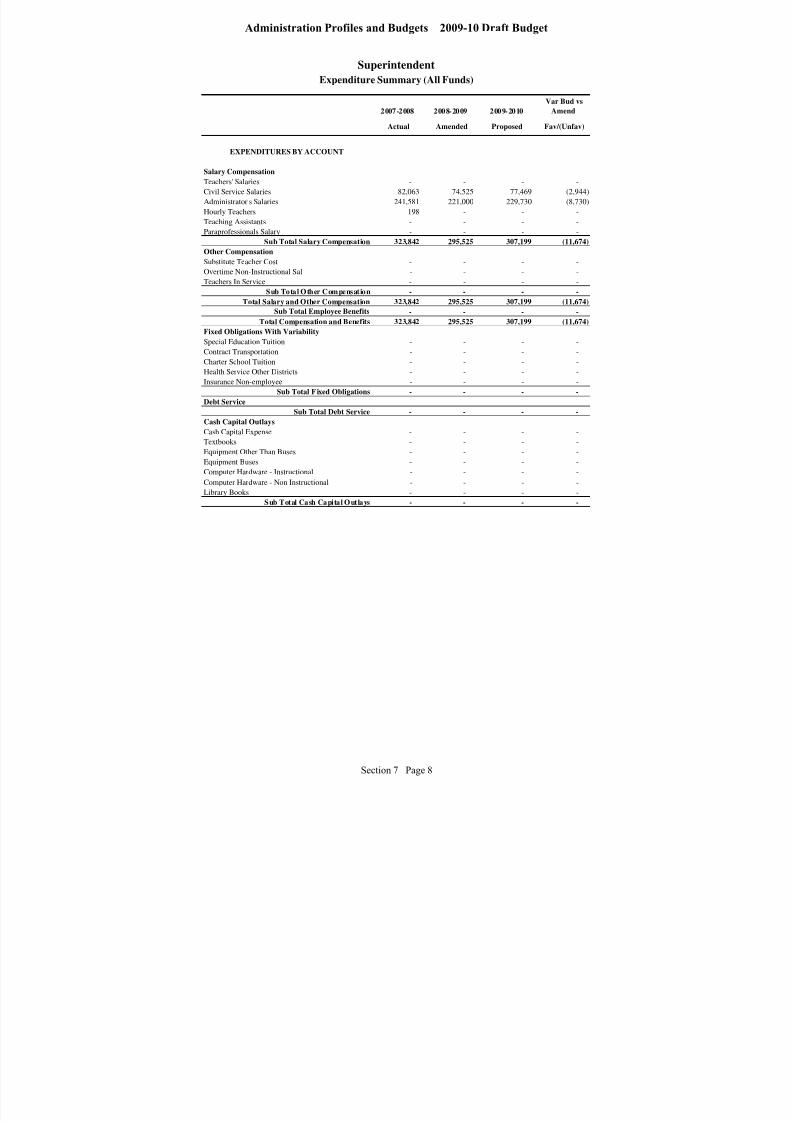
8/7/2019 2009_2010DRAFT
http://slidepdf.com/reader/full/20092010draft 210/268
Superintendent
2007-2008 2008-2009 2009-2010
Var Bud vs
Amend
Actual Amended Proposed Fav/(Unfav)
EXPENDITURES BY ACCOUNT
Salary Compensation
Teachers' Salaries - - - -
Civil Service Salaries 82,063 74,525 77,469 (2,944)
Administrator's Salaries 241,581 221,000 229,730 (8,730)
Hourly Teachers 198 - - -
Teaching Assistants - - - -
Paraprofessionals Salary - - - -
Sub Total Salary Compensation 323,842 295,525 307,199 (11,674)
Other Compensation
Substitute Teacher Cost - - - -
Overtime Non-Instructional Sal - - - -
Teachers In Service - - - -
Sub Total Other Compensation - - - -
Total Salary and Other Compensation 323,842 295,525 307,199 (11,674) Sub Total Employee Benefits - - - -
Total Compensation and Benefits 323,842 295,525 307,199 (11,674)
Fixed Obligations With Variability
Special Education Tuition - - - -
Contract Transportation - - - -
Charter School Tuition - - - -
Health Service Other Districts - - - -
Insurance Non-employee - - - -
Sub Total Fixed Obligations - - - -
Debt Service
Sub Total Debt Service - - - -
Cash Capital Outlays
Cash Capital Expense - - - -
Textbooks - - - -
Equipment Other Than Buses - - - - Equipment Buses - - - -
Computer Hardware - Instructional - - - -
Computer Hardware - Non Instructional - - - -
Library Books - - - -
Sub Total Cash Capital Outlays - - - -
Expenditure Summary (All Funds)
Section 7 Page 8
Administration Profiles and Budgets 2009-10 Draft Budget
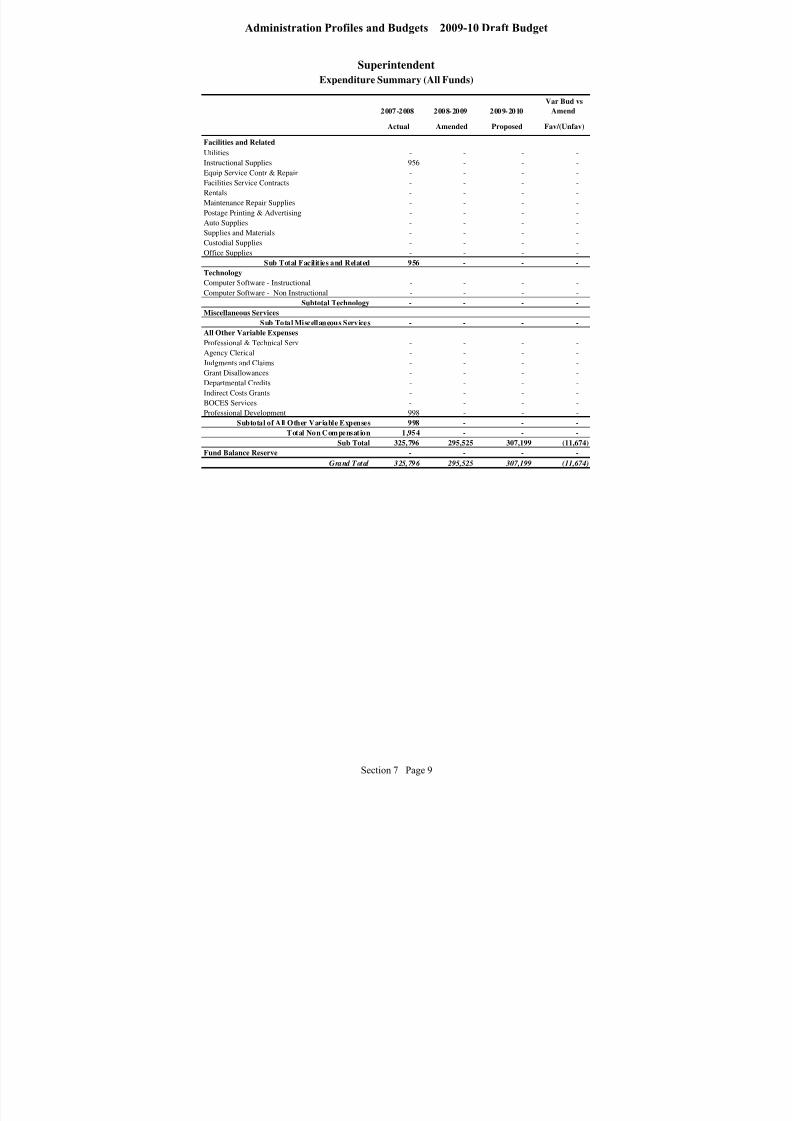
8/7/2019 2009_2010DRAFT
http://slidepdf.com/reader/full/20092010draft 211/268
Superintendent
2007-2008 2008-2009 2009-2010
Var Bud vs
Amend
Actual Amended Proposed Fav/(Unfav)
Expenditure Summary (All Funds)
Facilities and Related
Utilities - - - - Instructional Supplies 956 - - -
Equip Service Contr & Repair - - - -
Facilities Service Contracts - - - -
Rentals - - - -
Maintenance Repair Supplies - - - -
Postage Printing & Advertising - - - -
Auto Supplies - - - -
Supplies and Materials - - - -
Custodial Supplies - - - -
Office Supplies - - - -
Sub Total Facilities and Related 956 - - -
Technology
Computer Software - Instructional - - - -
Computer Software - Non Instructional - - - -
Subtotal Technology - - - - Miscellaneous Services
Sub Total Miscellaneous Services - - - -
All Other Variable Expenses
Professional & Technical Serv - - - -
Agency Clerical - - - -
Judgments and Claims - - - -
Grant Disallowances - - - -
Departmental Credits - - - -
Indirect Costs Grants - - - -
BOCES Services - - - -
Professional Development 998 - - -
Subtotal of All Other Variable Expenses 998 - - -
Total Non Compensation 1,954 - - -
Sub Total 325,796 295,525 307,199 (11,674)
Fund Balance Reserve - - - - Grand Total 325,796 295,525 307,199 (11,674)
Section 7 Page 9
Administration Profiles and Budgets 2009-10 Draft Budget

8/7/2019 2009_2010DRAFT
http://slidepdf.com/reader/full/20092010draft 212/268
Superintendent
2007 - 2008 2008 - 2009 2009 - 2010
Var Bud vs
Amend
Actual Amended Proposed Fav/(Unfav)
POSITIONS BY ACCOUNT
Salary Compensation
Teachers' Salaries 0.00 0.00 0.00 0.00
Civil Service Salaries 1.00 1.00 1.00 0.00
Administrator's Salaries 1.00 1.00 1.00 0.00
Teaching Assistants 0.00 0.00 0.00 0.00
Paraprofessionals Salary 0.00 0.00 0.00 0.00
Hourly Teachers 0.00 0.00 0.00 0.00
Total Salary Compensation 2.00 2.00 2.00 0.00
Other CompensationSubstitute Teacher Cost 0.00 0.00 0.00 0.00
Overtime Non-Instructional Sal 0.00 0.00 0.00 0.00
Teachers In Service 0.00 0.00 0.00 0.00
Total Other Compensation 0.00 0.00 0.00 0.00
Total Salary and Other Compensation 2.00 2.00 2.00 0.00
Grand Total 2.00 2.00 2.00 0.00
POSITIONS BY DEPARTMENT
Chief School Administrator -DM - 70016 2.00 2.00 2.00 0.00
Superintendent - SUPERINTENDENT 2.00 2.00 2.00 0.00
Position Summary
Section 7 Page 10
Administration Profiles and Budgets 2009-10 Draft Budget
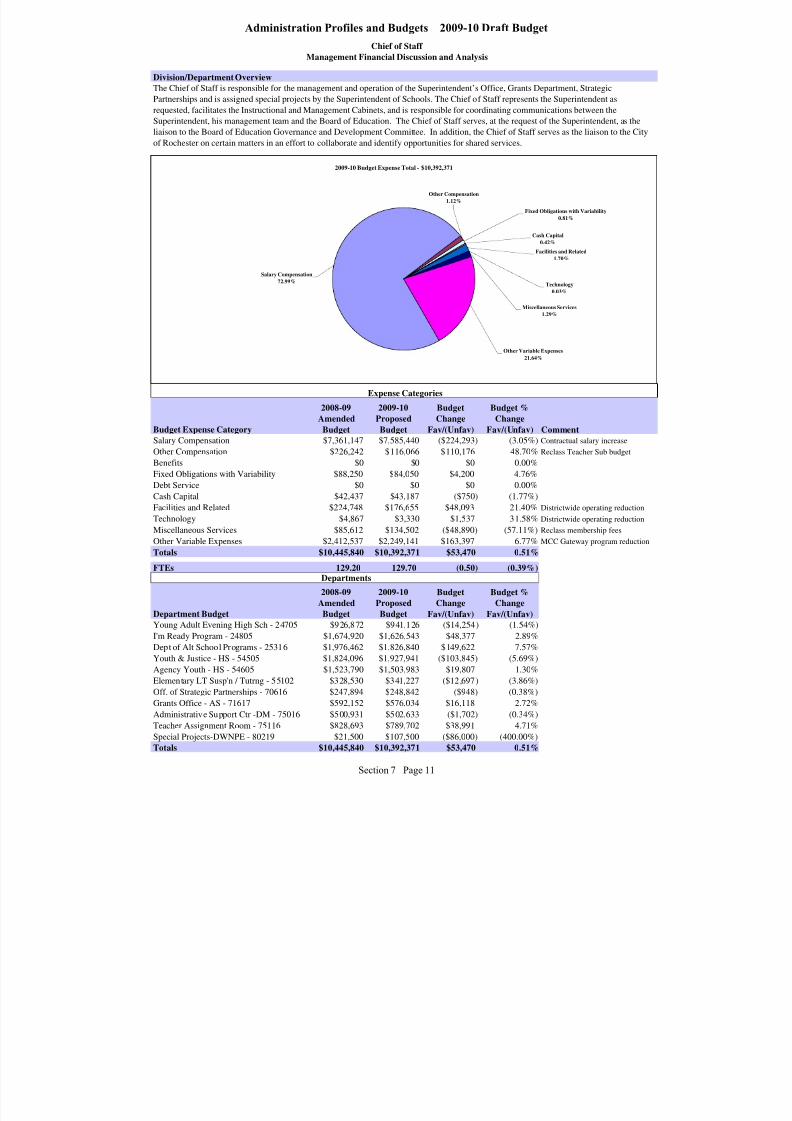
8/7/2019 2009_2010DRAFT
http://slidepdf.com/reader/full/20092010draft 213/268
Chief of Staff
Management Financial Discussion and Analysis
Division/Department Overview
Budget Expense Category
2008-09
Amended
Budget
2009-10
Proposed
Budget
Budget
Change
Fav/(Unfav)
Budget %
Change
Fav/(Unfav) CommentSalary Compensation $7,361,147 $7,585,440 ($224,293) (3.05%) Contractual salary increase
Other Compensation $226,242 $116,066 $110,176 48.70% Reclass Teacher Sub budgetBenefits $0 $0 $0 0.00%
Fixed Obligations with Variability $88,250 $84,050 $4,200 4.76%
Debt Service $0 $0 $0 0.00%
Cash Capital $42,437 $43,187 ($750) (1.77%)
Facilities and Related $224,748 $176,655 $48,093 21.40% Districtwide operating reduction
Technology $4,867 $3,330 $1,537 31.58% Districtwide operating reduction
Miscellaneous Services $85,612 $134,502 ($48,890) (57.11%) Reclass membership fees
Other Variable Expenses $2,412,537 $2,249,141 $163,397 6.77% MCC Gateway program reduction
Totals $10,445,840 $10,392,371 $53,470 0.51%
FTEs 129.20 129.70 (0.50) (0.39%)
Department Budget
2008-09
AmendedBudget
2009-10
ProposedBudget
Budget
ChangeFav/(Unfav)
Budget %
ChangeFav/(Unfav)Young Adult Evening High Sch - 24705 $926,872 $941,126 ($14,254) (1.54%)
I'm Ready Program - 24805 $1,674,920 $1,626,543 $48,377 2.89%
Dept of Alt School Programs - 25316 $1,976,462 $1,826,840 $149,622 7.57%
Youth & Justice - HS - 54505 $1,824,096 $1,927,941 ($103,845) (5.69%)
Agency Youth - HS - 54605 $1,523,790 $1,503,983 $19,807 1.30%
Elementary LT Susp'n / Tutrng - 55102 $328,530 $341,227 ($12,697) (3.86%)
Off. of Strategic Partnerships - 70616 $247,894 $248,842 ($948) (0.38%)
Grants Office - AS - 71617 $592,152 $576,034 $16,118 2.72%
Administrative Support Ctr -DM - 75016 $500,931 $502,633 ($1,702) (0.34%)
Teacher Assignment Room - 75116 $828,693 $789,702 $38,991 4.71%
Special Projects-DWNPE - 80219 $21,500 $107,500 ($86,000) (400.00%)
Totals $10,445,840 $10,392,371 $53,470 0.51%
The Chief of Staff is responsible for the management and operation of the Superintendent’s Office, Grants Department, Strategic
Partnerships and is assigned special projects by the Superintendent of Schools. The Chief of Staff represents the Superintendent as
requested, facilitates the Instructional and Management Cabinets, and is responsible for coordinating communications between the
Superintendent, his management team and the Board of Education. The Chief of Staff serves, at the request of the Superintendent, as the
liaison to the Board of Education Governance and Development Committee. In addition, the Chief of Staff serves as the liaison to the City
of Rochester on certain matters in an effort to collaborate and identify opportunities for shared services.
Expense Categories
Departments
2009-10 Budget Expense Total - $10,392,371
Facilities and Related
1.70%
Cash Capital
0.42%
Fixed Obligations with Variability
0.81%
Other Compensation
1.12%
Salary Compensation
72.99%
Other Variable Expenses
21.64%
Miscellaneous Services
1.29%
Technology
0.03%
Section 7 Page 11
Administration Profiles and Budgets 2009-10 Draft Budget
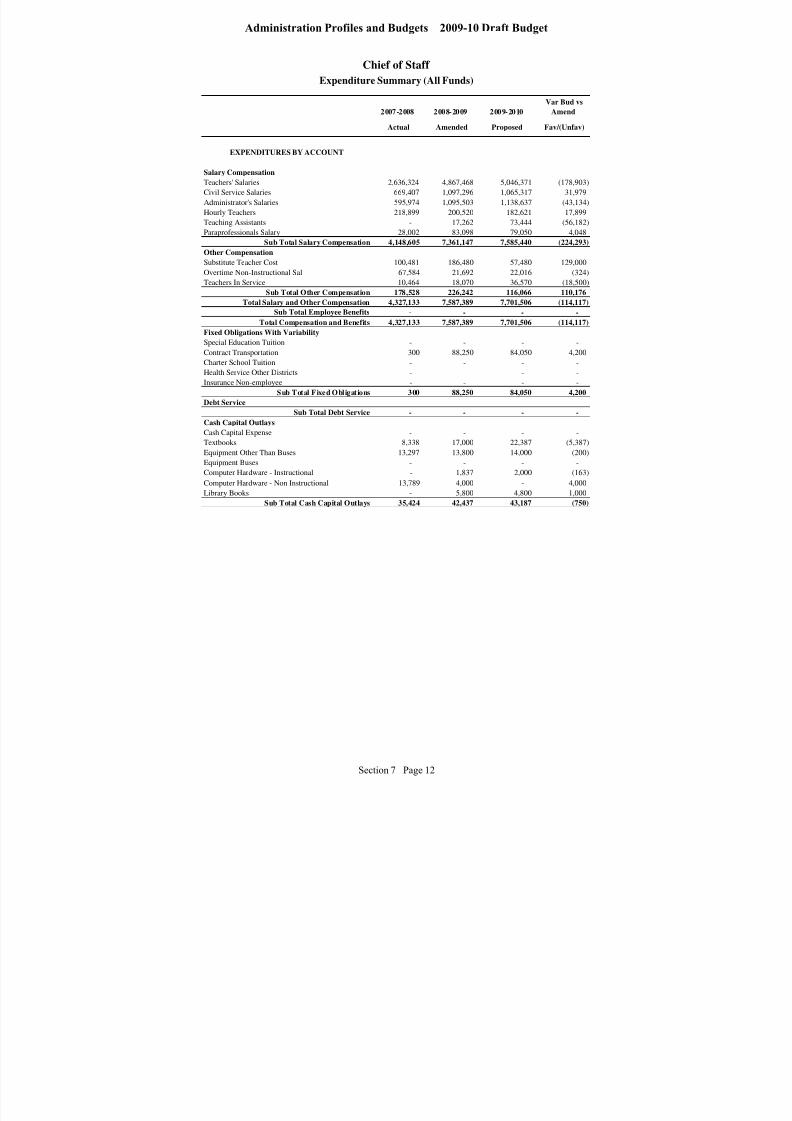
8/7/2019 2009_2010DRAFT
http://slidepdf.com/reader/full/20092010draft 214/268
Chief of Staff
2007-2008 2008-2009 2009-2010
Var Bud vs
Amend
Actual Amended Proposed Fav/(Unfav)
EXPENDITURES BY ACCOUNT
Salary Compensation
Teachers' Salaries 2,636,324 4,867,468 5,046,371 (178,903)
Civil Service Salaries 669,407 1,097,296 1,065,317 31,979
Administrator's Salaries 595,974 1,095,503 1,138,637 (43,134)
Hourly Teachers 218,899 200,520 182,621 17,899
Teaching Assistants - 17,262 73,444 (56,182)
Paraprofessionals Salary 28,002 83,098 79,050 4,048
Sub Total Salary Compensation 4,148,605 7,361,147 7,585,440 (224,293)
Other Compensation
Substitute Teacher Cost 100,481 186,480 57,480 129,000
Overtime Non-Instructional Sal 67,584 21,692 22,016 (324)
Teachers In Service 10,464 18,070 36,570 (18,500)
Sub Total Other Compensation 178,528 226,242 116,066 110,176
Total Salary and Other Compensation 4,327,133 7,587,389 7,701,506 (114,117) Sub Total Employee Benefits - - - -
Total Compensation and Benefits 4,327,133 7,587,389 7,701,506 (114,117)
Fixed Obligations With Variability
Special Education Tuition - - - -
Contract Transportation 300 88,250 84,050 4,200
Charter School Tuition - - - -
Health Service Other Districts - - - -
Insurance Non-employee - - - -
Sub Total Fixed Obligations 300 88,250 84,050 4,200
Debt Service
Sub Total Debt Service - - - -
Cash Capital Outlays
Cash Capital Expense - - - -
Textbooks 8,338 17,000 22,387 (5,387)
Equipment Other Than Buses 13,297 13,800 14,000 (200) Equipment Buses - - - -
Computer Hardware - Instructional - 1,837 2,000 (163)
Computer Hardware - Non Instructional 13,789 4,000 - 4,000
Library Books - 5,800 4,800 1,000
Sub Total Cash Capital Outlays 35,424 42,437 43,187 (750)
Expenditure Summary (All Funds)
Section 7 Page 12
Administration Profiles and Budgets 2009-10 Draft Budget

8/7/2019 2009_2010DRAFT
http://slidepdf.com/reader/full/20092010draft 215/268
Chief of Staff
2007-2008 2008-2009 2009-2010
Var Bud vs
Amend
Actual Amended Proposed Fav/(Unfav)
Expenditure Summary (All Funds)
Facilities and Related
Utilities - 8,700 1,750 6,950
Instructional Supplies 69,317 84,769 75,273 9,496
Equip Service Contr & Repair 13,056 16,100 22,500 (6,400)
Facilities Service Contracts - - - -
Rentals 1,560 32,200 22,687 9,513
Maintenance Repair Supplies - 1,100 1,100 -
Postage Printing & Advertising 2,577 22,000 18,720 3,280
Auto Supplies - - - -
Supplies and Materials 16,875 15,643 7,600 8,043
Custodial Supplies 6,930 11,400 12,000 (600)
Office Supplies 4,781 32,836 15,025 17,811
Sub Total Facilities and Related 115,096 224,748 176,655 48,093
Technology
Computer Software - Instructional 2,006 3,127 730 2,397
Computer Software - Non Instructional 372 1,740 2,600 (860)
Subtotal Technology 2,378 4,867 3,330 1,537 Miscellaneous Services
Sub Total Miscellaneous Services 16,364 85,612 134,502 (48,890)
All Other Variable Expenses
Professional & Technical Serv 1,428,876 2,327,603 2,181,278 146,325
Agency Clerical 6,590 3,070 1,803 1,268
Judgments and Claims - - - -
Grant Disallowances - - - -
Departmental Credits - - - -
Indirect Costs Grants - - - -
BOCES Services 1,100 120 120 -
Professional Development 71,353 81,744 65,940 15,804
Subtotal of All Other Variable Expenses 1,507,918 2,412,537 2,249,141 163,397
Total Non Compensation 1,677,481 2,858,451 2,690,865 167,587
Sub Total 6,004,614 10,445,840 10,392,371 53,470
Fund Balance Reserve - - - - Grand Total 6,004,614 10,445,840 10,392,371 53,470
Section 7 Page 13
Administration Profiles and Budgets 2009-10 Draft Budget

8/7/2019 2009_2010DRAFT
http://slidepdf.com/reader/full/20092010draft 216/268
Chief of Staff
2007 - 2008 2008 - 2009 2009 - 2010
Var Bud vs
Amend
Actual Amended Proposed Fav/(Unfav)
POSITIONS BY ACCOUNT
Salary Compensation
Teachers' Salaries 44.50 85.20 85.70 (0.50)
Civil Service Salaries 16.00 23.00 23.00 0.00
Administrator's Salaries 6.00 11.00 11.00 0.00
Teaching Assistants 0.00 4.00 4.00 0.00
Paraprofessionals Salary 2.00 6.00 6.00 0.00
Hourly Teachers 0.00 0.00 0.00 0.00
Total Salary Compensation 68.50 129.20 129.70 (0.50)
Other Compensation
Substitute Teacher Cost 0.00 0.00 0.00 0.00
Overtime Non-Instructional Sal 0.00 0.00 0.00 0.00
Teachers In Service 0.00 0.00 0.00 0.00
Total Other Compensation 0.00 0.00 0.00 0.00
Total Salary and Other Compensation 68.50 129.20 129.70 (0.50)
Grand Total 68.50 129.20 129.70 (0.50)
POSITIONS BY DEPARTMENT
Young Adult Evening High Sch - 24705 2.00 17.50 17.50 0.00
I'm Ready Program - 24805 0.00 30.00 30.00 0.00
Youth & Justice - HS - 54505 23.50 28.70 29.20 (0.50)
Agency Youth - HS - 54605 26.00 22.50 22.50 0.00
Elementary LT Susp'n / Tutrng - 55102 6.50 6.50 6.50 0.00
Off. of Strategic Partnerships - 70616 0.00 3.00 3.00 0.00
Grants Office - AS - 71617 8.50 7.00 7.00 0.00
Administrative Support Ctr -DM - 75016 2.00 3.00 3.00 0.00
Teacher Assignment Room - 75116 0.00 11.00 11.00 0.00
Chief of Staff - CHIEF OF STAFF 68.50 129.20 129.70 (0.50)
Position Summary
Section 7 Page 14
Administration Profiles and Budgets 2009-10 Draft Budget

8/7/2019 2009_2010DRAFT
http://slidepdf.com/reader/full/20092010draft 217/268
Accountability
Management Financial Discussion and AnalysisDivision/Department Overview
Budget Expense Category
2008-09
Amended
Budget
2009-10
Proposed
Budget
Budget
Change
Fav/(Unfav)
Budget %
Change
Fav/(Unfav) Comment
Salary Compensation $3,381,794 $3,460,385 ($78,591) (2.32%) Salary increase & 1.0 FTE reduction
Other Compensation $425,545 $382,275 $43,270 10.17%
Benefits $0 $0 $0 0.00%Fixed Obligations with Variability $0 $0 $0 0.00%
Debt Service $0 $0 $0 0.00%
Cash Capital Outlays $54,520 $39,695 $14,825 27.19% Districtwide operating reduction
Facilities and Related $902,974 $479,174 $423,800 46.93% Districtwide operating reduction
Technology $19,050 $12,050 $7,000 36.75% Districtwide operating reduction
Miscellaneous Services $255,172 $251,262 $3,910 1.53%
Other Variable Expenses $7,309,948 $6,150,086 $1,159,862 15.87% Reclass Hillside Work Scholarship
Totals $12,349,003 $10,774,927 $1,574,077 12.75%
FTEs 53.00 52.00 1.00 1.89%
Department Budget
2008-09
Amended
Budget
2009-10
Proposed
Budget
Budget
Change
Fav/(Unfav)
Budget %
Change
Fav/(Unfav)Monroe Nonsec Detention - SPP-29807 $81,753 $45,753 36,000$ 44.04%
Hillside Children's Cent - SPP - 35007 $107,915 $107,915 -$ 0.00%
Non Public Schools: City - SPP - 35207 $680,643 $711,416 (30,773)$ (4.52%)
External Education - SPP - 42307 $5,356 $4,000 1,356$ 25.32%
Testing & Accountability - 51013 $2,120,106 $2,050,289 69,817$ 3.29%
Research & Program Evaluation-51513 $588,031 $598,272 (10,241)$ (1.74%)
Monroe Cty Children's Ctr -SPP-54107 $227,401 $216,750 10,651$ 4.68%
Center for Youth Services -SPP-54207 $14,587 $14,587 -$ 0.00%
St Joseph's Villa - SPP - 54307 $16,187 $16,187 -$ 0.00%
Salvation Army - SPP - 54407 $6,174 $6,174 -$ 0.00%
Title 1 Office - AS - 71717 $6,519,995 $6,404,742 115,253$ 1.77%
Chief Accountability Officer - 77216 $1,980,855 $598,842 1,382,013$ 69.77%
Totals $12,349,003 $10,774,927 1,574,077$ 12.75%
Expense Categories
The Office of Accountability provides relevant, accurate, reliable, and timely data that reflect integrity, sensitivity, and congruence with
District Goals. Data Management collects, analyzes, reports, archives student data and records, and disseminates data and provides
professional development for effective utilization. Research and Evaluation reviews all data and survey requests and evaluates student dat
programs, and initiatives. Assessment and Reporting provides test liaisons with detailed information required for administration of New
York State mandated testing and formative assessments and is the Regional Center for area district schools and agencies. Accountability
verifies and communicates data regarding State assessments, Special Education, VADIR, and BEDS. Strategic Planning coordinates distri
wide planning efforts, relating to the Superintendent’s Annual Goals. NCLB/Title I manages federal grant programs in accordance with
applicable statutes, regulations, and guidance.
Departments
2009-10 Budget Expense Total - $10,774,927
Technology
0.11%
Miscellaneous Services
2.33%Other Variable Expenses
57.08%
Facilities and Related
4.45%
Cash Capital Outlays
0.37%
Other Compensation
3.55%
Salary Compensation
32.12%
Section 7 Page 15
Administration Profiles and Budgets 2009-10 Draft Budget
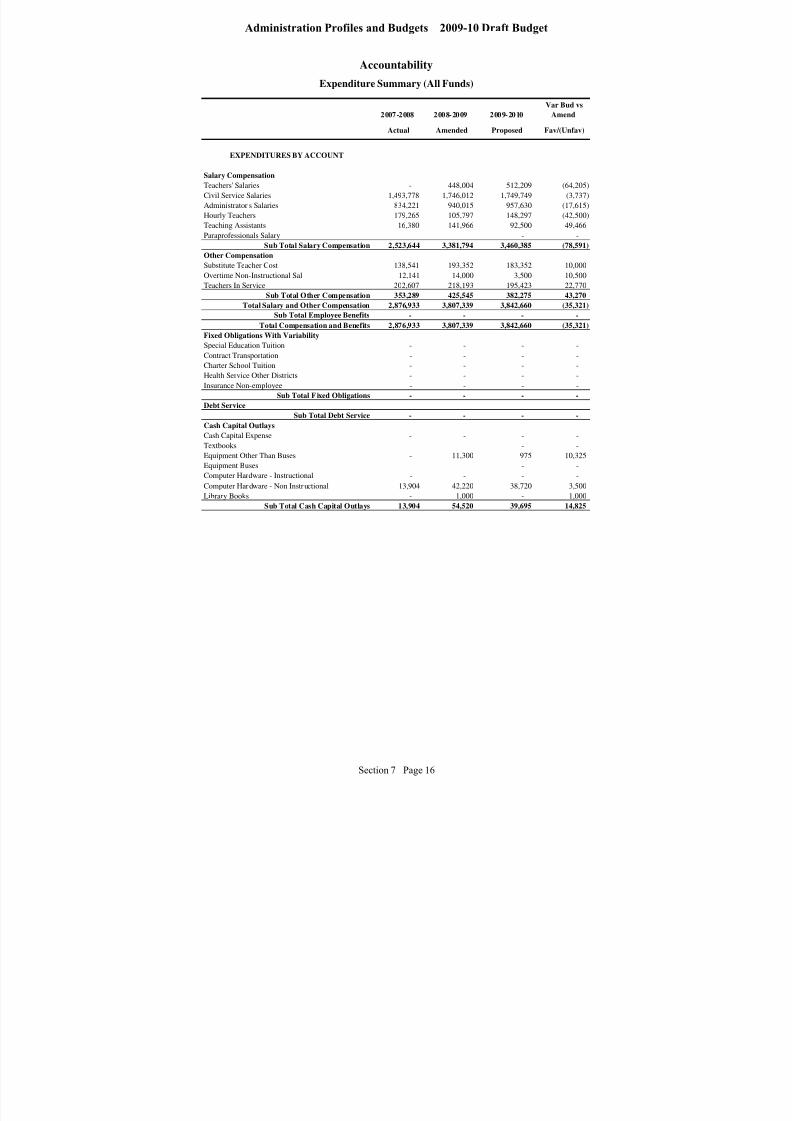
8/7/2019 2009_2010DRAFT
http://slidepdf.com/reader/full/20092010draft 218/268
Accountability
2007-2008 2008-2009 2009-2010
Var Bud vs
Amend
Actual Amended Proposed Fav/(Unfav)
EXPENDITURES BY ACCOUNT
Salary Compensation
Teachers' Salaries - 448,004 512,209 (64,205)
Civil Service Salaries 1,493,778 1,746,012 1,749,749 (3,737)
Administrator's Salaries 834,221 940,015 957,630 (17,615)
Hourly Teachers 179,265 105,797 148,297 (42,500)
Teaching Assistants 16,380 141,966 92,500 49,466
Paraprofessionals Salary - - - -
Sub Total Salary Compensation 2,523,644 3,381,794 3,460,385 (78,591)
Other Compensation
Substitute Teacher Cost 138,541 193,352 183,352 10,000
Overtime Non-Instructional Sal 12,141 14,000 3,500 10,500
Teachers In Service 202,607 218,193 195,423 22,770
Sub Total Other Compensation 353,289 425,545 382,275 43,270
Total Salary and Other Compensation 2,876,933 3,807,339 3,842,660 (35,321)
Sub Total Employee Benefits - - - -
Total Compensation and Benefits 2,876,933 3,807,339 3,842,660 (35,321)
Fixed Obligations With Variability
Special Education Tuition - - - -
Contract Transportation - - - -
Charter School Tuition - - - -
Health Service Other Districts - - - -
Insurance Non-employee - - - -
Sub Total Fixed Obligations - - - -
Debt Service
Sub Total Debt Service - - - -
Cash Capital Outlays
Cash Capital Expense - - - -
Textbooks - - - -
Equipment Other Than Buses - 11,300 975 10,325 Equipment Buses - - - -
Computer Hardware - Instructional - - - -
Computer Hardware - Non Instructional 13,904 42,220 38,720 3,500
Library Books - 1,000 - 1,000
Sub Total Cash Capital Outlays 13,904 54,520 39,695 14,825
Expenditure Summary (All Funds)
Section 7 Page 16
Administration Profiles and Budgets 2009-10 Draft Budget
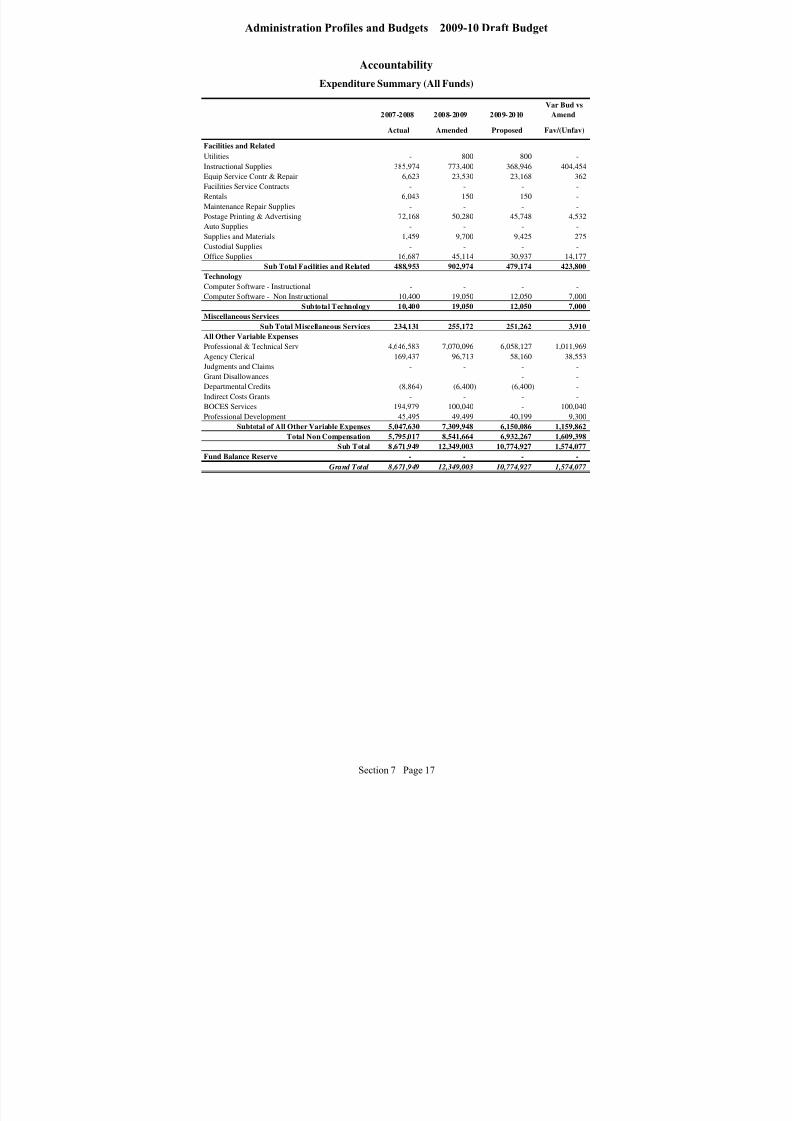
8/7/2019 2009_2010DRAFT
http://slidepdf.com/reader/full/20092010draft 219/268
Accountability
2007-2008 2008-2009 2009-2010
Var Bud vs
Amend
Actual Amended Proposed Fav/(Unfav)
Expenditure Summary (All Funds)
Facilities and Related
Utilities - 800 800 -
Instructional Supplies 385,974 773,400 368,946 404,454
Equip Service Contr & Repair 6,623 23,530 23,168 362
Facilities Service Contracts - - - -
Rentals 6,043 150 150 -
Maintenance Repair Supplies - - - -
Postage Printing & Advertising 72,168 50,280 45,748 4,532
Auto Supplies - - - -
Supplies and Materials 1,459 9,700 9,425 275
Custodial Supplies - - - -
Office Supplies 16,687 45,114 30,937 14,177
Sub Total Facilities and Related 488,953 902,974 479,174 423,800
Technology
Computer Software - Instructional - - - -
Computer Software - Non Instructional 10,400 19,050 12,050 7,000
Subtotal Technology 10,400 19,050 12,050 7,000
Miscellaneous Services
Sub Total Miscellaneous Services 234,131 255,172 251,262 3,910
All Other Variable Expenses
Professional & Technical Serv 4,646,583 7,070,096 6,058,127 1,011,969
Agency Clerical 169,437 96,713 58,160 38,553
Judgments and Claims - - - -
Grant Disallowances - - - -
Departmental Credits (8,864) (6,400) (6,400) -
Indirect Costs Grants - - - -
BOCES Services 194,979 100,040 - 100,040
Professional Development 45,495 49,499 40,199 9,300
Subtotal of All Other Variable Expenses 5,047,630 7,309,948 6,150,086 1,159,862
Total Non Compensation 5,795,017 8,541,664 6,932,267 1,609,398
Sub Total 8,671,949 12,349,003 10,774,927 1,574,077
Fund Balance Reserve - - - -
Grand Total 8,671,949 12,349,003 10,774,927 1,574,077
Section 7 Page 17
Administration Profiles and Budgets 2009-10 Draft Budget
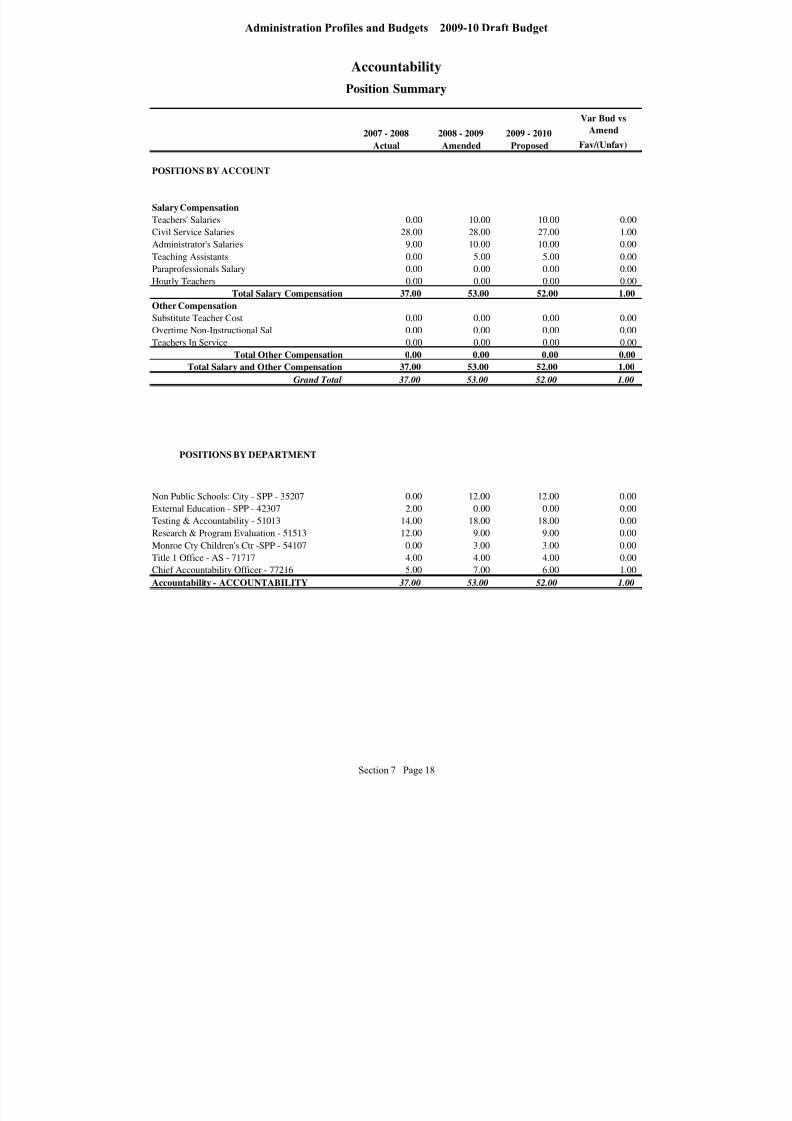
8/7/2019 2009_2010DRAFT
http://slidepdf.com/reader/full/20092010draft 220/268
Accountability
2007 - 2008 2008 - 2009 2009 - 2010
Var Bud vs
Amend
Actual Amended Proposed Fav/(Unfav)
POSITIONS BY ACCOUNT
Salary Compensation
Teachers' Salaries 0.00 10.00 10.00 0.00
Civil Service Salaries 28.00 28.00 27.00 1.00
Administrator's Salaries 9.00 10.00 10.00 0.00
Teaching Assistants 0.00 5.00 5.00 0.00
Paraprofessionals Salary 0.00 0.00 0.00 0.00
Hourly Teachers 0.00 0.00 0.00 0.00
Total Salary Compensation 37.00 53.00 52.00 1.00
Other Compensation
Substitute Teacher Cost 0.00 0.00 0.00 0.00
Overtime Non-Instructional Sal 0.00 0.00 0.00 0.00
Teachers In Service 0.00 0.00 0.00 0.00
Total Other Compensation 0.00 0.00 0.00 0.00
Total Salary and Other Compensation 37.00 53.00 52.00 1.00
Grand Total 37.00 53.00 52.00 1.00
POSITIONS BY DEPARTMENT
Non Public Schools: City - SPP - 35207 0.00 12.00 12.00 0.00
External Education - SPP - 42307 2.00 0.00 0.00 0.00
Testing & Accountability - 51013 14.00 18.00 18.00 0.00
Research & Program Evaluation - 51513 12.00 9.00 9.00 0.00
Monroe Cty Children's Ctr -SPP - 54107 0.00 3.00 3.00 0.00
Title 1 Office - AS - 71717 4.00 4.00 4.00 0.00
Chief Accountability Officer - 77216 5.00 7.00 6.00 1.00
Accountability - ACCOUNTABILITY 37.00 53.00 52.00 1.00
Position Summary
Section 7 Page 18
Administration Profiles and Budgets 2009-10 Draft Budget

8/7/2019 2009_2010DRAFT
http://slidepdf.com/reader/full/20092010draft 221/268
Administrative Services
Management Financial Discussion and Analysis
Division/Department Overview
Budget Expense Category
2008-09
Amended
Budget
2009-10
Proposed
Budget
Budget
Change
Fav/(Unfav)
Budget %
Change
Fav/(Unfav) Comment
Salary Compensation $26,522,395 $27,216,454 ($694,059) (2.62%) Salary increases & 8.0 FTE cut
Other Compensation $1,881,490 $1,091,191 $790,299 42.00% Districtwide operating reduction
Benefits $0 $0 $0 0.00%
Fixed Obligations with Variability $45,526,995 $39,669,176 $5,857,819 12.87% Transportation contract reduction
Debt Service $984,244 $931,545 $52,699 5.35% Copier lease reductions
Cash Capital Outlays $1,615,005 $628,812 $986,193 61.06% Not buying new buses
Facilities and Related $30,591,984 $30,203,731 $388,254 1.27% Districtwide operating reduction
Technology $174,100 $162,306 $11,794 6.77% Districtwide operating reduction
Miscellaneous Services $1,283,548 $863,111 $420,437 32.76% Storehouse inventory reduction
Other Variable Expenses $1,203,767 $2,070,661 ($866,894) (72.02%) Lunch program food cost increase
Totals $109,783,528 $102,836,987 $6,946,541 6.33%
FTEs 665.24 657.24 8.00 1.20%
Department Budget
2008-09
Amended
Budget
2009-10
Proposed
Budget
Budget
Change
Fav/(Unfav)
Budget %
Change
Fav/(Unfav)Administrative Support $381,500 $701,580 ($320,080) (100.00%)
Facilities $23,974,560 $22,992,227 $982,333 4.10%
Finance $3,978,689 $3,820,764 $157,925 3.97%
Food Service $12,833,063 $14,433,142 ($1,600,079) (12.47%)
Information Technology $11,388,441 $10,784,772 $603,670 5.30%
Minority/Women Business Enterprises $94,000 $104,176 ($10,176) (10.83%)
Operations $317,487 $226,833 $90,654 28.55%
School Safety $2,267,910 $2,228,053 $39,857 1.76%
Transportation Services $54,547,878 $47,545,441 $7,002,437 12.84%
Totals $109,783,528 $102,836,987 $6,946,541 6.33%
The Deputy Superintendent of Administration (DSA) plans, organizes, controls and directs the administrative services of the District and
serves on the Superintendent’s cabinet. The DSA provides oversight of the District’s assets and compliance with state, federal and local
laws. Areas of operation include facilities, finance, food services, technology, MWBE, operations, school safety, and transportation. The
team works to enhance the instructional programs of the District by providing value added services, efficiently and effectively.
Administrative Services strives to increase service levels and reduce costs through continuous improvement processes and reengineering
departmental operations after recognized “best practices”.
Expense Categories
Departments
2009-10 Budget Expense Total - $102,836,987
Other Variable Expenses
2.01%
Miscellaneous Services
0.84%
Facilities and Related
29.37%
Technology
0.16%
Debt Service
0.91%
Salary Compensation
26.47%
Other Compensation
1.06%
Fixed Obligations with Variability
38.57%
Cash Capital Outlays
0.61%
Section 7 Page 19
Administration Profiles and Budgets 2009-10 Draft Budget

8/7/2019 2009_2010DRAFT
http://slidepdf.com/reader/full/20092010draft 222/268
Administrative Services
2007-2008 2008-2009 2009-2010
Var Bud vs
Amend
Actual Amended Proposed Fav/(Unfav)
EXPENDITURES BY ACCOUNT
Salary Compensation
Teachers' Salaries 200,569 84,816 88,539 (3,723)
Civil Service Salaries 24,658,646 26,402,501 27,099,615 (697,114)
Administrator's Salaries - - - -
Hourly Teachers 7,968 30,078 23,000 7,078
Teaching Assistants - - - -
Paraprofessionals Salary 4,859 5,000 5,300 (300)
Sub Total Salary Compensation 24,872,042 26,522,395 27,216,454 (694,059)
Other Compensation
Substitute Teacher Cost 9,760 6,100 4,100 2,000
Overtime Non-Instructional Sal 1,951,427 1,854,660 1,066,361 788,299
Teachers In Service 281 20,730 20,730 - Sub Total Other Compensation 1,961,467 1,881,490 1,091,191 790,299
Total Salary and Other Compensation 26,833,509 28,403,885 28,307,645 96,240
Sub Total Employee Benefits - - - -
Total Compensation and Benefits 26,833,509 28,403,885 28,307,645 96,240
Fixed Obligations With Variability
Special Education Tuition - - - -
Contract Transportation 41,609,840 45,285,346 39,427,527 5,857,819
Charter School Tuition - - - -
Health Service Other Districts - - - -
Insurance Non-employee 178,404 241,649 241,649 -
Sub Total Fixed Obligations 41,788,244 45,526,995 39,669,176 5,857,819
Debt Service
Sub Total Debt Service 1,074,252 984,244 931,545 52,699
Cash Capital Outlays
Cash Capital Expense - - - -
Textbooks 263,036 299,694 290,677 9,017
Equipment Other Than Buses 70,798 220,635 200,279 20,356
Equipment Buses 680,947 914,780 - 914,780
Computer Hardware - Instructional 29,697 54,000 54,000 -
Computer Hardware - Non Instructional 212,291 103,465 60,200 43,265
Library Books 17,365 22,431 23,656 (1,225)
Sub Total Cash Capital Outlays 1,274,134 1,615,005 628,812 986,193
Expenditure Summary (All Funds)
Section 7 Page 20
Administration Profiles and Budgets 2009-10 Draft Budget
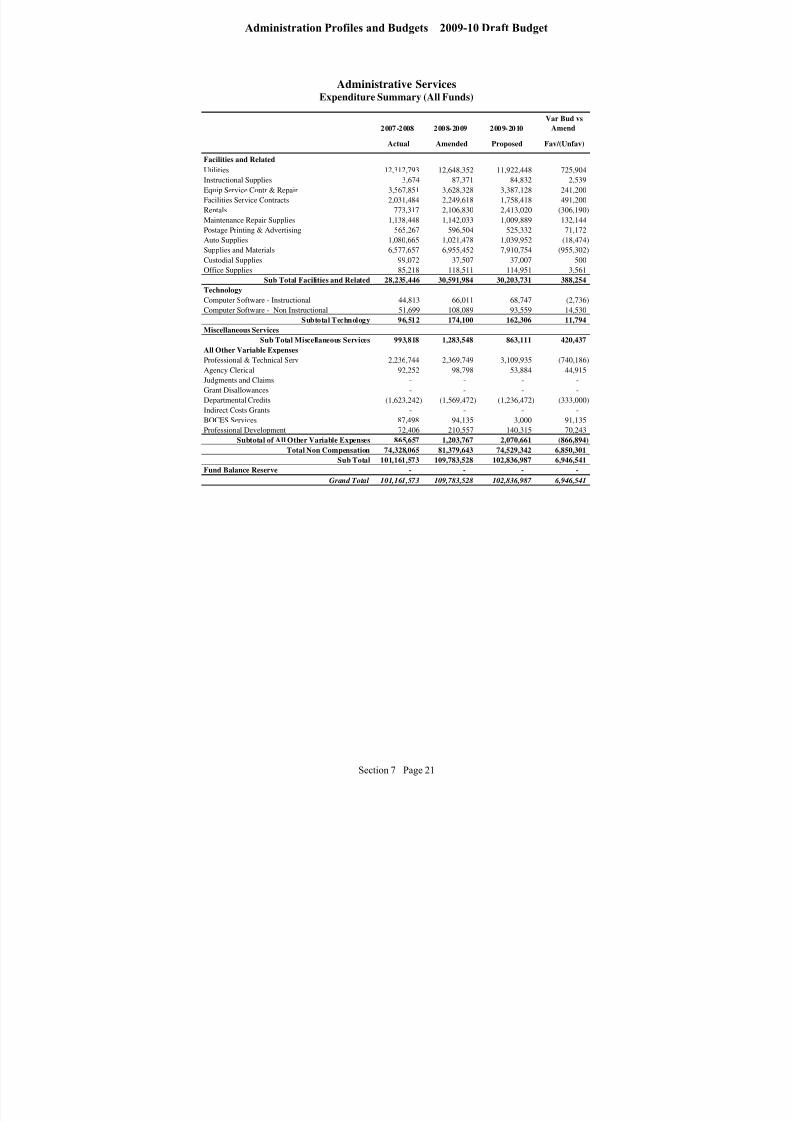
8/7/2019 2009_2010DRAFT
http://slidepdf.com/reader/full/20092010draft 223/268
Administrative Services
2007-2008 2008-2009 2009-2010
Var Bud vs
Amend
Actual Amended Proposed Fav/(Unfav)
Expenditure Summary (All Funds)
Facilities and Related
Utilities 12,312,793 12,648,352 11,922,448 725,904
Instructional Supplies 3,674 87,371 84,832 2,539
Equip Service Contr & Repair 3,567,851 3,628,328 3,387,128 241,200
Facilities Service Contracts 2,031,484 2,249,618 1,758,418 491,200
Rentals 773,317 2,106,830 2,413,020 (306,190)
Maintenance Repair Supplies 1,138,448 1,142,033 1,009,889 132,144
Postage Printing & Advertising 565,267 596,504 525,332 71,172
Auto Supplies 1,080,665 1,021,478 1,039,952 (18,474)
Supplies and Materials 6,577,657 6,955,452 7,910,754 (955,302)
Custodial Supplies 99,072 37,507 37,007 500
Office Supplies 85,218 118,511 114,951 3,561
Sub Total Facilities and Related 28,235,446 30,591,984 30,203,731 388,254
Technology
Computer Software - Instructional 44,813 66,011 68,747 (2,736) Computer Software - Non Instructional 51,699 108,089 93,559 14,530
Subtotal Technology 96,512 174,100 162,306 11,794
Miscellaneous Services
Sub Total Miscellaneous Services 993,818 1,283,548 863,111 420,437
All Other Variable Expenses
Professional & Technical Serv 2,236,744 2,369,749 3,109,935 (740,186)
Agency Clerical 92,252 98,798 53,884 44,915
Judgments and Claims - - - -
Grant Disallowances - - - -
Departmental Credits (1,623,242) (1,569,472) (1,236,472) (333,000)
Indirect Costs Grants - - - -
BOCES Services 87,498 94,135 3,000 91,135
Professional Development 72,406 210,557 140,315 70,243
Subtotal of All Other Variable Expenses 865,657 1,203,767 2,070,661 (866,894)
Total Non Compensation 74,328,065 81,379,643 74,529,342 6,850,301
Sub Total 101,161,573 109,783,528 102,836,987 6,946,541
Fund Balance Reserve - - - -
Grand Total 101,161,573 109,783,528 102,836,987 6,946,541
Section 7 Page 21
Administration Profiles and Budgets 2009-10 Draft Budget

8/7/2019 2009_2010DRAFT
http://slidepdf.com/reader/full/20092010draft 224/268
Administrative Services
2007 - 2008 2008 - 2009 2009 - 2010
Var Bud vs
Amend
Actual Amended Proposed Fav/(Unfav)
POSITIONS BY ACCOUNT
Salary Compensation
Teachers' Salaries 3.00 1.00 1.00 0.00
Civil Service Salaries 660.74 664.24 656.24 8.00
Administrator's Salaries 0.00 0.00 0.00 0.00
Teaching Assistants 0.00 0.00 0.00 0.00
Paraprofessionals Salary 0.00 0.00 0.00 0.00
Hourly Teachers 0.00 0.00 0.00 0.00
Total Salary Compensation 663.74 665.24 657.24 8.00
Other CompensationSubstitute Teacher Cost 0.00 0.00 0.00 0.00
Overtime Non-Instructional Sal 0.00 0.00 0.00 0.00
Teachers In Service 0.00 0.00 0.00 0.00
Total Other Compensation 0.00 0.00 0.00 0.00
Total Salary and Other Compensation 663.74 665.24 657.24 8.00
Grand Total 663.74 665.24 657.24 8.00
POSITIONS BY DEPARTMENT
Administrative Support - ADMIN SUPPORT 0.00 3.00 2.00 1.00
Facilities - FACILITIES 113.50 113.50 113.50 0.00
Finance - FINANCE 63.00 60.50 57.50 3.00
Food Service - FOOD SERVICE 246.54 245.54 245.54 0.00
Information Technology - INFO TECHNOLOGY 76.00 64.50 64.50 0.00
M/WBE - MWBE 0.00 1.00 1.00 0.00
Operations - OPERATIONS 1.50 2.00 2.00 0.00
School Safety - SCHOOL SAFETY 6.00 19.00 15.00 4.00
Transportation Services - TRANSPORTATION 157.20 156.20 156.20 0.00
Administrative Services - ADMINISTRATION 663.74 665.24 657.24 8.00
Position Summary
Section 7 Page 22
Administration Profiles and Budgets 2009-10 Draft Budget
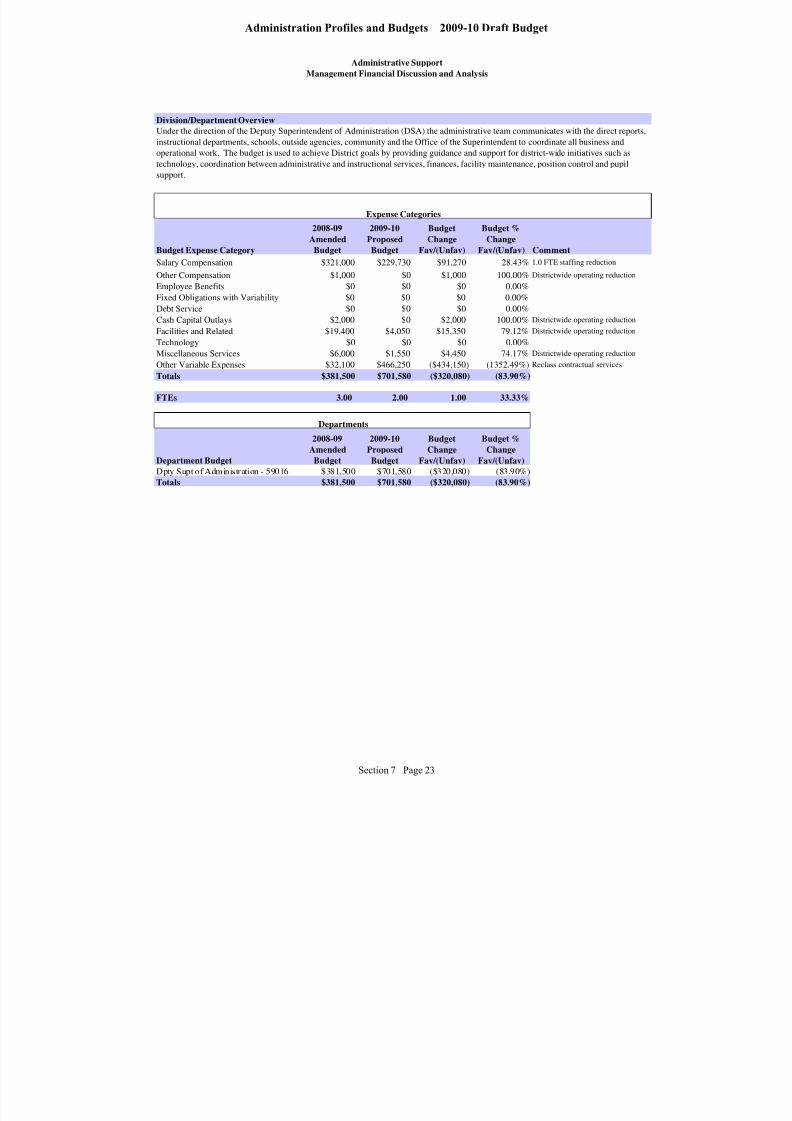
8/7/2019 2009_2010DRAFT
http://slidepdf.com/reader/full/20092010draft 225/268
Administrative Support
Management Financial Discussion and Analysis
Division/Department Overview
Budget Expense Category
2008-09
Amended
Budget
2009-10
Proposed
Budget
Budget
Change
Fav/(Unfav)
Budget %
Change
Fav/(Unfav) Comment
Salary Compensation $321,000 $229,730 $91,270 28.43% 1.0 FTE staffing reduction
Other Compensation $1,000 $0 $1,000 100.00% Districtwide operating reduction
Employee Benefits $0 $0 $0 0.00%
Fixed Obligations with Variability $0 $0 $0 0.00%
Debt Service $0 $0 $0 0.00%
Cash Capital Outlays $2,000 $0 $2,000 100.00% Districtwide operating reduction
Facilities and Related $19,400 $4,050 $15,350 79.12% Districtwide operating reduction
Technology $0 $0 $0 0.00%
Miscellaneous Services $6,000 $1,550 $4,450 74.17% Districtwide operating reduction
Other Variable Expenses $32,100 $466,250 ($434,150) (1352.49%) Reclass contractual services
Totals $381,500 $701,580 ($320,080) (83.90%)
FTEs 3.00 2.00 1.00 33.33%
Department Budget
2008-09
Amended
Budget
2009-10
Proposed
Budget
Budget
Change
Fav/(Unfav)
Budget %
Change
Fav/(Unfav)Dpty Supt of Administration - 59016 $381,500 $701,580 ($320,080) (83.90%)
Totals $381,500 $701,580 ($320,080) (83.90%)
Departments
Expense Categories
Under the direction of the Deputy Superintendent of Administration (DSA) the administrative team communicates with the direct reports,
instructional departments, schools, outside agencies, community and the Office of the Superintendent to coordinate all business and
operational work. The budget is used to achieve District goals by providing guidance and support for district-wide initiatives such astechnology, coordination between administrative and instructional services, finances, facility maintenance, position control and pupil
support.
Section 7 Page 23
Administration Profiles and Budgets 2009-10 Draft Budget
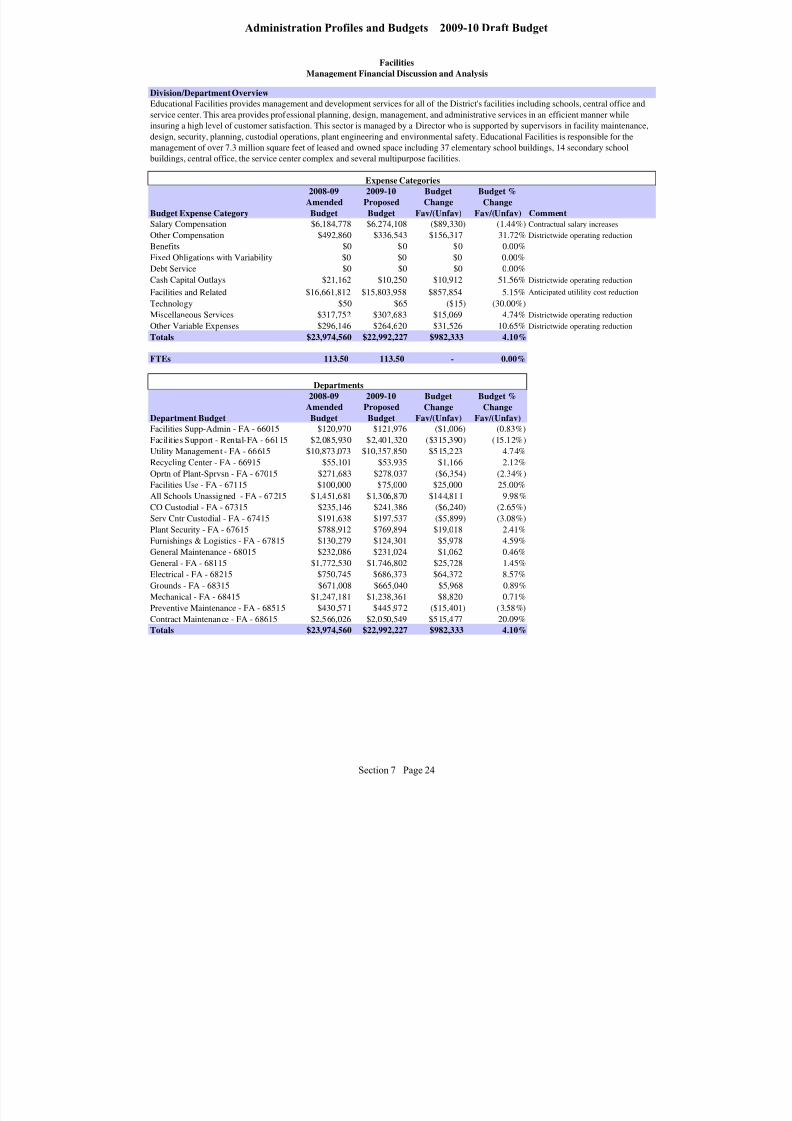
8/7/2019 2009_2010DRAFT
http://slidepdf.com/reader/full/20092010draft 226/268
Facilities
Management Financial Discussion and Analysis
Division/Department Overview
Budget Expense Category
2008-09
Amended
Budget
2009-10
Proposed
Budget
Budget
Change
Fav/(Unfav)
Budget %
Change
Fav/(Unfav) CommentSalary Compensation $6,184,778 $6,274,108 ($89,330) (1.44%) Contractual salary increases
Other Compensation $492,860 $336,543 $156,317 31.72% Districtwide operating reduction
Benefits $0 $0 $0 0.00%
Fixed Obligations with Variability $0 $0 $0 0.00%
Debt Service $0 $0 $0 0.00%
Cash Capital Outlays $21,162 $10,250 $10,912 51.56% Districtwide operating reduction
Facilities and Related $16,661,812 $15,803,958 $857,854 5.15% Anticipated utilility cost reduction
Technology $50 $65 ($15) (30.00%)Miscellaneous Services $317,752 $302,683 $15,069 4.74% Districtwide operating reduction
Other Variable Expenses $296,146 $264,620 $31,526 10.65% Districtwide operating reduction
Totals $23,974,560 $22,992,227 $982,333 4.10%
FTEs 113.50 113.50 - 0.00%
Department Budget
2008-09
Amended
Budget
2009-10
Proposed
Budget
Budget
Change
Fav/(Unfav)
Budget %
Change
Fav/(Unfav)Facilities Supp-Admin - FA - 66015 $120,970 $121,976 ($1,006) (0.83%)
Facilities Support - Rental-FA - 66115 $2,085,930 $2,401,320 ($315,390) (15.12%)
Utility Management - FA - 66615 $10,873,073 $10,357,850 $515,223 4.74%Recycling Center - FA - 66915 $55,101 $53,935 $1,166 2.12%
Oprtn of Plant-Sprvsn - FA - 67015 $271,683 $278,037 ($6,354) (2.34%)
Facilities Use - FA - 67115 $100,000 $75,000 $25,000 25.00%
All Schools Unassigned - FA - 67215 $1,451,681 $1,306,870 $144,811 9.98%
CO Custodial - FA - 67315 $235,146 $241,386 ($6,240) (2.65%)
Serv Cntr Custodial - FA - 67415 $191,638 $197,537 ($5,899) (3.08%)
Plant Security - FA - 67615 $788,912 $769,894 $19,018 2.41%
Furnishings & Logistics - FA - 67815 $130,279 $124,301 $5,978 4.59%
General Maintenance - 68015 $232,086 $231,024 $1,062 0.46%
General - FA - 68115 $1,772,530 $1,746,802 $25,728 1.45%
Electrical - FA - 68215 $750,745 $686,373 $64,372 8.57%
Grounds - FA - 68315 $671,008 $665,040 $5,968 0.89%
Mechanical - FA - 68415 $1,247,181 $1,238,361 $8,820 0.71%
Preventive Maintenance - FA - 68515 $430,571 $445,972 ($15,401) (3.58%)Contract Maintenance - FA - 68615 $2,566,026 $2,050,549 $515,477 20.09%
Totals $23,974,560 $22,992,227 $982,333 4.10%
Departments
Educational Facilities provides management and development services for all of the District's facilities including schools, central office and
service center. This area provides professional planning, design, management, and administrative services in an efficient manner while
insuring a high level of customer satisfaction. This sector is managed by a Director who is supported by supervisors in facility maintenance,
design, security, planning, custodial operations, plant engineering and environmental safety. Educational Facilities is responsible for the
management of over 7.3 million square feet of leased and owned space including 37 elementary school buildings, 14 secondary schoolbuildings, central office, the service center complex and several multipurpose facilities.
Expense Categories
Section 7 Page 24
Administration Profiles and Budgets 2009-10 Draft Budget

8/7/2019 2009_2010DRAFT
http://slidepdf.com/reader/full/20092010draft 227/268
Finance
Management Financial Discussion and Analysis
Division/Department Overview
Budget Expense Category
2008-09
Amended
Budget
2009-10
Proposed
Budget
Budget
Change
Fav/(Unfav)
Budget %
Change
Fav/(Unfav) CommentSalary Compensation $3,481,994 $3,378,961 $103,033 2.96% 3.0 FTE staffing reduction
Other Compensation $72,050 $43,410 $28,640 39.75% Districtwide operating reduction
Benefits $0 $0 $0 0.00%
Fixed Obligations with Variability $0 $0 $0 0.00%
Debt Service $0 $0 $0 0.00%
Cash Capital $380,325 $371,283 $9,042 2.38%
Facilities and Related $65,259 $65,649 ($390) (0.60%)
Technology $66,061 $68,847 ($2,786) (4.22%)
Miscellaneous Services $547,750 $210,764 $336,986 61.52% Storehouse inventory reduction
Other Variable Expenses ($634,750) ($318,150) ($316,600) 49.88% Storehouse inventory credit reduction
Totals $3,978,689 $3,820,764 $157,925 3.97%
FTEs 60.50 57.50 3.00 4.96%
Department Budget
2008-09
Amended
Budget
2009-10
Proposed
Budget
Budget
Change
Fav/(Unfav)
Budget %
Change
Fav/(Unfav)Comptroller - 60212 $220,235 $168,643 $51,592 23.43%
Accounting Department - FS - 61212 $980,655 $904,889 $75,767 7.73%
Payroll Department -FS - 61412 $677,934 $695,370 ($17,436) (2.57%)
Offc of Budget & Revenue - FS - 61512 $483,226 $486,220 ($2,994) (0.62%)
Financial Grants Mgt - CS - 61612 $355,340 $337,965 $17,375 4.89%
Procurement Dept - FS - 62012 $432,616 $436,378 ($3,762) (0.87%)
Distribution Center - 62113 $708,861 $656,220 $52,642 7.43%Charter School Distribution - 62126 $119,822 $135,080 ($15,258) (12.73%)
Totals $3,978,689 $3,820,764 $157,925 3.97%
Departments
Expense Categories
Finance, with oversight by the Comptroller, is responsible for collecting, managing and overseeing the District’s financial operations including
Accounting, Budget and Revenue, Financial Grant Management, Payroll, Accounts Payable and Procurement. The team works to communicate and
develop business processes and procedures to comply with Board policies and law. Financial direction and support is given to the District in
planning, developing and implementing strategies for immediate and long-range financial management, the District’s annual budget and budget
preparation for grant development. The team is also responsible for processing payroll, financial reporting to government and funding agencies, the
District’s procurement, recording and verification of payment for goods and services.
Section 7 Page 25
Administration Profiles and Budgets 2009-10 Draft Budget
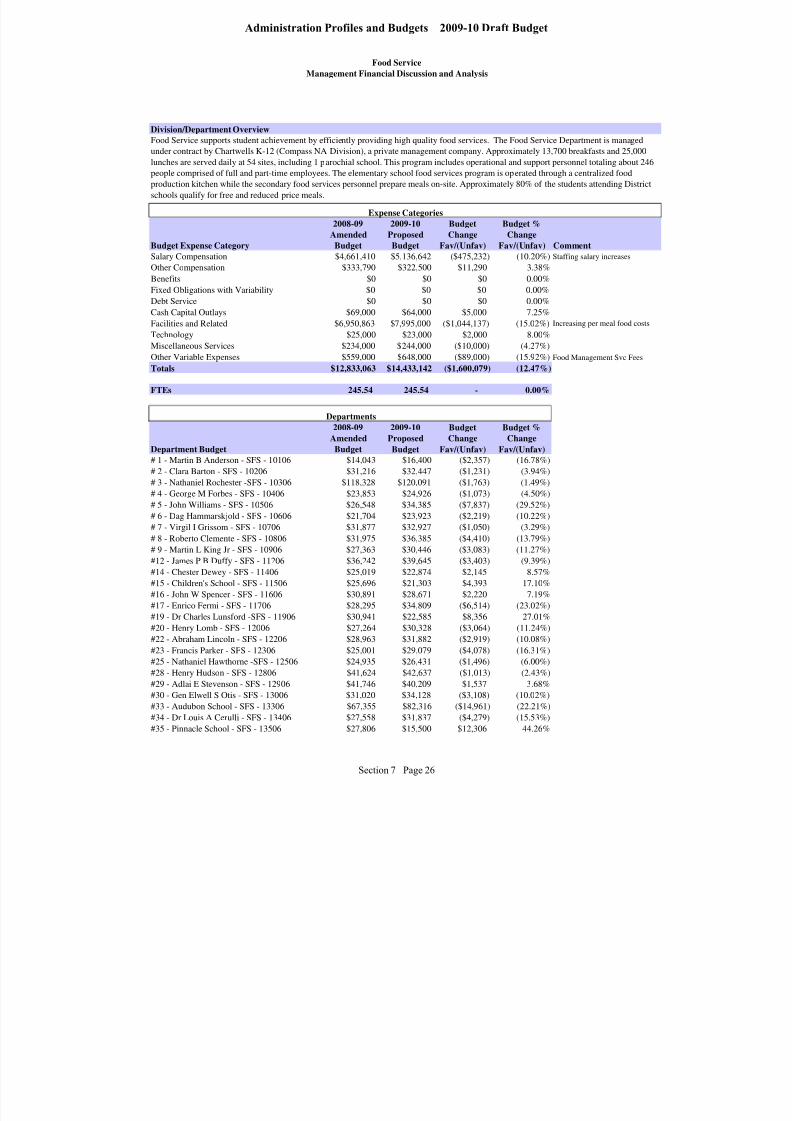
8/7/2019 2009_2010DRAFT
http://slidepdf.com/reader/full/20092010draft 228/268
Food Service
Management Financial Discussion and Analysis
Division/Department Overview
Budget Expense Category
2008-09
Amended
Budget
2009-10
Proposed
Budget
Budget
Change
Fav/(Unfav)
Budget %
Change
Fav/(Unfav) Comment
Salary Compensation $4,661,410 $5,136,642 ($475,232) (10.20%) Staffing salary increases
Other Compensation $333,790 $322,500 $11,290 3.38%
Benefits $0 $0 $0 0.00%
Fixed Obligations with Variability $0 $0 $0 0.00%
Debt Service $0 $0 $0 0.00%Cash Capital Outlays $69,000 $64,000 $5,000 7.25%
Facilities and Related $6,950,863 $7,995,000 ($1,044,137) (15.02%) Increasing per meal food costs
Technology $25,000 $23,000 $2,000 8.00%
Miscellaneous Services $234,000 $244,000 ($10,000) (4.27%)
Other Variable Expenses $559,000 $648,000 ($89,000) (15.92%) Food Management Svc Fees
Totals $12,833,063 $14,433,142 ($1,600,079) (12.47%)
FTEs 245.54 245.54 - 0.00%
Department Budget
2008-09
Amended
Budget
2009-10
Proposed
Budget
Budget
Change
Fav/(Unfav)
Budget %
Change
Fav/(Unfav)# 1 - Martin B Anderson - SFS - 10106 $14,043 $16,400 ($2,357) (16.78%)
# 2 - Clara Barton - SFS - 10206 $31,216 $32,447 ($1,231) (3.94%)
# 3 - Nathaniel Rochester -SFS - 10306 $118,328 $120,091 ($1,763) (1.49%)
# 4 - George M Forbes - SFS - 10406 $23,853 $24,926 ($1,073) (4.50%)
# 5 - John Williams - SFS - 10506 $26,548 $34,385 ($7,837) (29.52%)
# 6 - Dag Hammarskjold - SFS - 10606 $21,704 $23,923 ($2,219) (10.22%)
# 7 - Virgil I Grissom - SFS - 10706 $31,877 $32,927 ($1,050) (3.29%)
# 8 - Roberto Clemente - SFS - 10806 $31,975 $36,385 ($4,410) (13.79%)
# 9 - Martin L King Jr - SFS - 10906 $27,363 $30,446 ($3,083) (11.27%)
#12 - James P B Duffy - SFS - 11206 $36,242 $39,645 ($3,403) (9.39%)
#14 - Chester Dewey - SFS - 11406 $25,019 $22,874 $2,145 8.57%
#15 - Children's School - SFS - 11506 $25,696 $21,303 $4,393 17.10%
#16 - John W Spencer - SFS - 11606 $30,891 $28,671 $2,220 7.19%
#17 - Enrico Fermi - SFS - 11706 $28,295 $34,809 ($6,514) (23.02%)#19 - Dr Charles Lunsford -SFS - 11906 $30,941 $22,585 $8,356 27.01%
#20 - Henry Lomb - SFS - 12006 $27,264 $30,328 ($3,064) (11.24%)
#22 - Abraham Lincoln - SFS - 12206 $28,963 $31,882 ($2,919) (10.08%)
#23 - Francis Parker - SFS - 12306 $25,001 $29,079 ($4,078) (16.31%)
#25 - Nathaniel Hawthorne -SFS - 12506 $24,935 $26,431 ($1,496) (6.00%)
#28 - Henry Hudson - SFS - 12806 $41,624 $42,637 ($1,013) (2.43%)
#29 - Adlai E Stevenson - SFS - 12906 $41,746 $40,209 $1,537 3.68%
#30 - Gen Elwell S Otis - SFS - 13006 $31,020 $34,128 ($3,108) (10.02%)
#33 - Audubon School - SFS - 13306 $67,355 $82,316 ($14,961) (22.21%)
#34 - Dr Louis A Cerulli - SFS - 13406 $27,558 $31,837 ($4,279) (15.53%)
#35 - Pinnacle School - SFS - 13506 $27,806 $15,500 $12,306 44.26%
Expense Categories
Food Service supports student achievement by efficiently providing high quality food services. The Food Service Department is managed
under contract by Chartwells K-12 (Compass NA Division), a private management company. Approximately 13,700 breakfasts and 25,000lunches are served daily at 54 sites, including 1 parochial school. This program includes operational and support personnel totaling about 246
people comprised of full and part-time employees. The elementary school food services program is operated through a centralized food
production kitchen while the secondary food services personnel prepare meals on-site. Approximately 80% of the students attending District
schools qualify for free and reduced price meals.
Departments
Section 7 Page 26
Administration Profiles and Budgets 2009-10 Draft Budget

8/7/2019 2009_2010DRAFT
http://slidepdf.com/reader/full/20092010draft 229/268
Food Service
Management Financial Discussion and Analysis
#36 - Henry W Longfellow - SFS - 13606 $25,595 $28,057 ($2,462) (9.62%)
#39 - Andrew J Townson - SFS - 13906 $40,443 $45,461 ($5,018) (12.41%)
#41 - Kodak Park School - SFS - 14106 $37,073 $34,760 $2,313 6.24%#42 - Abelard Reynolds - SFS - 14206 $25,780 $28,487 ($2,707) (10.50%)
#43 - Theodore Roosevelt - SFS - 14306 $35,394 $38,777 ($3,383) (9.56%)
#44 - Lincoln Park - SFS - 14406 $27,831 $30,920 ($3,089) (11.10%)
#45 - Mary McLeod Bethune -SFS - 14506 $37,017 $46,700 ($9,683) (26.16%)
#46 - Charles Carroll - SFS - 14606 $25,662 $28,672 ($3,010) (11.73%)
#50 - Helen B Montgomery - SFS - 15006 $29,825 $32,573 ($2,748) (9.21%)
#52 - Frank Fowler Dow - SFS - 15206 $19,029 $21,749 ($2,720) (14.29%)
#54 - Flower City School - SFS - 15406 $23,558 $28,004 ($4,446) (18.87%)
#57 - Early Childhood - SFS - 15706 $19,629 $22,389 ($2,760) (14.06%)
#58 - World of Inquiry - SFS - 15806 $35,630 $33,636 $1,994 5.60%
St Monica's - SFS - 17106 $10,325 $6,900 $3,425 33.17%
Corpus Christi - SFS - 17606 $5,137 $3,200 $1,937 37.71%
St Andrew's - FS - 17706 $0 $0 $0 0.00%
Holy Cross - SFS - 18406 $10,310 $5,900 $4,410 42.77%
Holy Rosary - SFS - 18506 $9,231 $5,600 $3,631 39.33%
Central Kitchen - SFS - 19806 $2,700,744 $2,951,476 ($250,732) (9.28%)
Elementary Schools - SFS - 19906 (98,600)$ (82,352)$ ($16,248) (16.48%)
Family Learn Ctr Hart St - FS - 23706 $24,281 $25,849 ($1,568) (6.46%)
NE/NW College Brd Schls - SFS - 25006 $227,041 $224,337 $2,704 1.19%
Wilson Commencement Academ-SFS - 25106 $141,013 $146,323 ($5,310) (3.77%)
Charlotte High School - SFS - 26006 $119,941 $148,743 ($28,802) (24.01%)
East High School - SFS - 26106 $244,421 $240,978 $3,443 1.41%
Jefferson High School - SFS - 26306 $182,320 $205,014 ($22,694) (12.45%)
Wilson Found Academy - SFS - 26406 $176,580 $179,632 ($3,052) (1.73%)
John Marshall High School -SFS - 26506 $147,756 $154,101 ($6,345) (4.29%)
Monroe High School - SFS - 26606 $187,436 $180,308 $7,128 3.80%
School of The Arts - SFS - 26706 $152,052 $167,801 ($15,749) (10.36%)Edison Tech Occup Ed Ctr - SFS - 27006 $270,587 $272,429 ($1,842) (0.68%)
Freddie Thomas High School-SFS - 27206 $201,509 $199,332 $2,177 1.08%
BioScience Health Franklin-SFS - 27706 $106,430 $110,003 ($3,573) (3.36%)
Global Media Arts Franklin-SFS - 28406 $52,097 $51,983 $114 0.22%
Finance/Econ at Franklin-SFS - 28606 $52,555 $52,583 ($28) (0.05%)
High Schools - SFS - 29906 (288,037)$ (297,831)$ 9,794$ 3.40%
Central Office Building - SFS - 67306 $114,574 $108,634 $5,940 5.18%
Office - Food Services - SFS - 69006 $6,853,631 $8,065,850 ($1,212,219) (17.69%)
Totals $12,833,063 $14,433,142 ($1,600,079) (12.47%)
Section 7 Page 27
Administration Profiles and Budgets 2009-10 Draft Budget
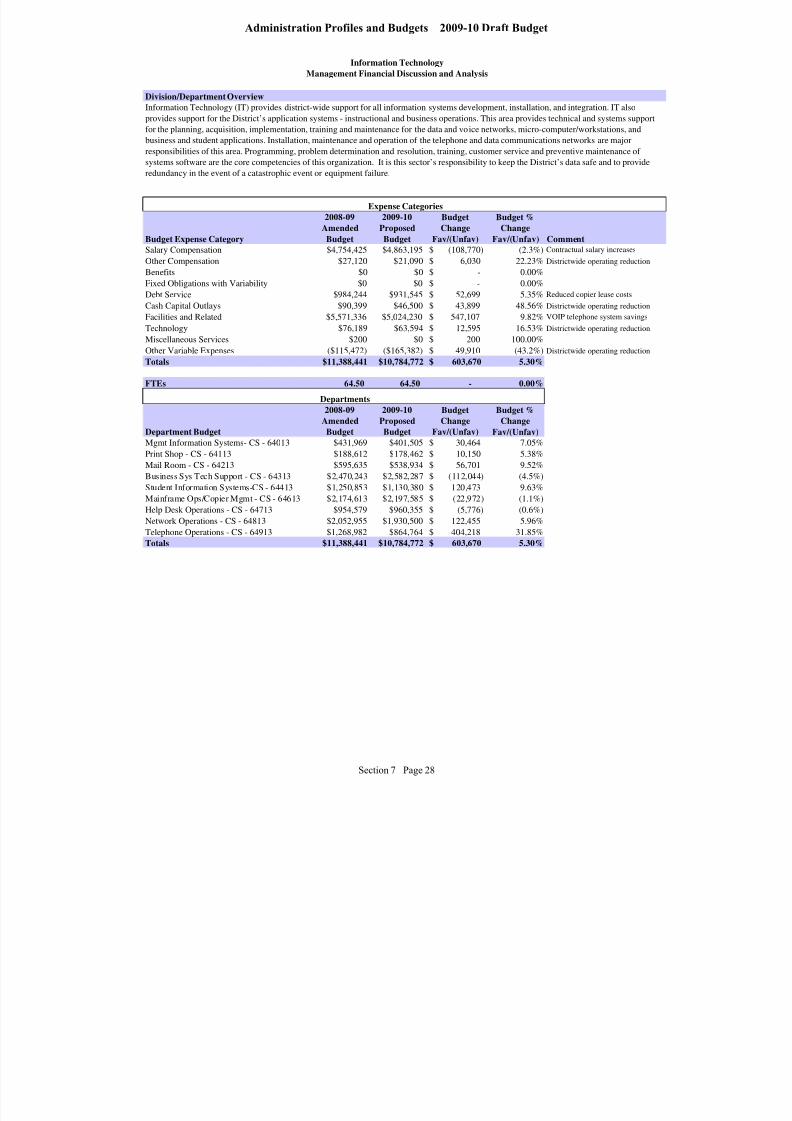
8/7/2019 2009_2010DRAFT
http://slidepdf.com/reader/full/20092010draft 230/268
Information Technology
Management Financial Discussion and Analysis
Division/Department Overview
Budget Expense Category
2008-09
Amended
Budget
2009-10
Proposed
Budget
Budget
Change
Fav/(Unfav)
Budget %
Change
Fav/(Unfav) CommentSalary Compensation $4,754,425 $4,863,195 (108,770)$ (2.3%) Contractual salary increases
Other Compensation $27,120 $21,090 6,030$ 22.23% Districtwide operating reduction
Benefits $0 $0 -$ 0.00%
Fixed Obligations with Variability $0 $0 -$ 0.00%
Debt Service $984,244 $931,545 52,699$ 5.35% Reduced copier lease costs
Cash Capital Outlays $90,399 $46,500 43,899$ 48.56% Districtwide operating reduction
Facilities and Related $5,571,336 $5,024,230 547,107$ 9.82% VOIP telephone system savings
Technology $76,189 $63,594 12,595$ 16.53% Districtwide operating reduction
Miscellaneous Services $200 $0 200$ 100.00%
Other Variable Expenses ($115,472) ($165,382) 49,910$ (43.2%) Districtwide operating reduction
Totals $11,388,441 $10,784,772 603,670$ 5.30%
FTEs 64.50 64.50 - 0.00%
Department Budget
2008-09
Amended
Budget
2009-10
Proposed
Budget
Budget
Change
Fav/(Unfav)
Budget %
Change
Fav/(Unfav)Mgmt Information Systems- CS - 64013 $431,969 $401,505 30,464$ 7.05%
Print Shop - CS - 64113 $188,612 $178,462 10,150$ 5.38%Mail Room - CS - 64213 $595,635 $538,934 56,701$ 9.52%
Business Sys Tech Support - CS - 64313 $2,470,243 $2,582,287 (112,044)$ (4.5%)
Student Information Systems-CS - 64413 $1,250,853 $1,130,380 120,473$ 9.63%
Mainframe Ops/Copier Mgmt - CS - 64613 $2,174,613 $2,197,585 (22,972)$ (1.1%)
Help Desk Operations - CS - 64713 $954,579 $960,355 (5,776)$ (0.6%)
Network Operations - CS - 64813 $2,052,955 $1,930,500 122,455$ 5.96%
Telephone Operations - CS - 64913 $1,268,982 $864,764 404,218$ 31.85%
Totals $11,388,441 $10,784,772 603,670$ 5.30%
Expense Categories
Information Technology (IT) provides district-wide support for all information systems development, installation, and integration. IT also
provides support for the District’s application systems - instructional and business operations. This area provides technical and systems support
for the planning, acquisition, implementation, training and maintenance for the data and voice networks, micro-computer/workstations, and
business and student applications. Installation, maintenance and operation of the telephone and data communications networks are major
responsibilities of this area. Programming, problem determination and resolution, training, customer service and preventive maintenance of systems software are the core competencies of this organization. It is this sector’s responsibility to keep the District’s data safe and to provide
redundancy in the event of a catastrophic event or equipment failure.
Departments
Section 7 Page 28
Administration Profiles and Budgets 2009-10 Draft Budget

8/7/2019 2009_2010DRAFT
http://slidepdf.com/reader/full/20092010draft 231/268
Minority and Women Business Enterprises
Management Financial Discussion and Analysis
Division/Department Overview
Budget Expense Category
2008-09
Amended
Budget
2009-10
Proposed
Budget
Budget
Change
Fav/(Unfav)
Budget %
Change
Fav/(Unfav) Comment
Salary Compensation $94,000 $97,713 ($3,713) (3.95%) Contractual salary increase
Other Compensation $0 $0 $0 0.00%
Benefits $0 $0 $0 0.00%
Fixed Obligation with Variability $0 $0 $0 0.00%
Debt Service $0 $0 $0 0.00%
Cash Capital $0 $0 $0 0.00%
Facilities and Related $0 $4,319 ($4,319) (100.00%) Establish department budget
Technology $0 $0 $0 0.00%
Miscellaneous Services $0 $669 ($669) (100.00%) Establish department budget
Other Variable Expenses $0 $1,475 ($1,475) (100.00%) Establish department budget
Totals $94,000 $104,176 ($10,176) (10.83%)
FTEs 1.00 1.00 - 0.00%
Department Budget
2008-09
Amended
Budget
2009-10
Proposed
Budget
Budget
Change
Fav/(Unfav)
Budget %
Change
Fav/(Unfav)Office of M/WBE - 63016 $94,000 $104,176 ($10,176) (10.83%)
Totals $94,000 $104,176 ($10,176) (10.83%)
The mission of MWBE Development is to provide minority and women-owned business enterprises with equal opportunity to participat
in all aspects of the District’s contracting and purchasing programs. To fulfill the mission, this sector promotes minority and women-
owned business participation in the District’s bidding process and provides guidance to District departments in establishing, maintaining
and monitoring MWBE utilization and performance. One of the priorities is to conduct reviews and analysis of all District contract
opportunities to ensure compliance with MWBE utilization goals for District and state programs. Additionally, MWBE Developmentworks to enhance the educational experience of District students by presenting opportunities for students to interact with minority and
women-owned businesses to understand the role these businesses play in our local economy, government, and community.
Expense Categories
Departments
Section 7 Page 29
Administration Profiles and Budgets 2009-10 Draft Budget

8/7/2019 2009_2010DRAFT
http://slidepdf.com/reader/full/20092010draft 232/268
Operations
Management Financial Discussion and Analysis
Division/Department Overview
Budget Expense Category
2008-09
Amended
Budget
2009-10
Proposed
Budget
Budget
Change
Fav/(Unfav)
Budget %
Change
Fav/(Unfav) Comment
Salary Compensation $176,000 $180,977 ($4,977) (2.83%)
Other Compensation $0 $0 $0 0.00%
Benefits $0 $0 $0 0.00%
Fixed Obligations with Variability $0 $0 $0 0.00%
Debt Service $0 $0 $0 0.00%
Cash Capital Outlays $0 $0 $0 0.00%
Facilities and Related $3,573 $2,314 $1,259 35.24% Districtwide operating reductionTechnology $0 $0 $0 0.00%
Miscellaneous Services $65,500 $200 $65,300 99.69% Reclass membership fees
Other Variable Expenses $72,414 $43,342 $29,072 40.15% Districtwide operating reduction
Totals $317,487 $226,833 $90,654 28.55%
FTEs 2.00 2.00 - 0.00%
Department Budget
2008-09
Amended
Budget
2009-10
Proposed
Budget
Budget
Change
Fav/(Unfav)
Budget %
Change
Fav/(Unfav)
Administrative Operations - 78016 $317,487 $226,833 $90,654 28.55%
Totals $317,487 $226,833 $90,654 28.55%
Departments
Expense Categories
District Operations is responsible for providing safe, comfortable learning environments, transportation and food services for every
child in the District by overseeing the departments of Educational Facilities, School Food Services and Transportation. The goal of
Operations is to deliver efficient services to the schools and students in order to provide excellent learning environments, nutritional
meals and safe transportation in a manner that is cost effective. Under the leadership of the Supervising Director of District
Operations, the Facilities Modernization Program is a joint venture with the City and community agencies to cooperativelyundertake new and innovative ways of renovating and financing public schools.
Section 7 Page 30
Administration Profiles and Budgets 2009-10 Draft Budget

8/7/2019 2009_2010DRAFT
http://slidepdf.com/reader/full/20092010draft 233/268
School Safety
Management Financial Discussion and Analysis
Division/Department Overview
Budget Expense Category
2008-09
Amended
Budget
2009-10
Proposed
Budget
Budget Change
Fav/(Unfav)
Budget %
Change
Fav/(Unfav) Comment
Salary Compensation $834,510 $789,975 $44,535 5.34% 4.0 FTE staffing reduction
Other Compensation $52,849 $44,944 $7,905 14.96% Districtwide operating reduction
Benefits $0 $0 $0 0.00%
Fixed Obligations with Variability $0 $0 $0 0.00%
Cash Capital Outlays $300 $91,500 ($91,200) 0.00% School safety equipment
Facilities and Related $139,143 $128,754 $10,389 7.47% Districtwide operating reduction
Technology $0 $0 $0 0.00%
Miscellaneous Services $41,550 $35,500 $6,050 0.00% Districtwide operating reductionOther Variable Expenses $1,199,558 $1,137,380 $62,178 5.18% Reclass Teen Court
Totals $2,267,910 $2,228,053 $39,857 1.76%
FTEs 19.00 15.00 4.00 21.05%
Department Budget
2008-09
Amended
Budget
2009-10
Proposed
Budget
Budget Change
Fav/(Unfav)
Budget %
Change
Fav/(Unfav)
Truancy Center - 56005 $126,581 $129,958 (3,377)$ (2.7%)
Office of Security Operations - 57016 $2,141,329 $2,098,095 43,234$ 2.02%
Totals $2,267,910 $2,228,053 39,857$ 1.76%
Departments
School Safety and Security is committed to the safety of our students, staff and visitors, the security of all RCSD facilities, and creating safe
school environments. The Department collaborates with District staff and community partners to: reduce VADIR incidents (Violent and
Disruptive Incident Reporting); and ensure District staff is prepared to plan for, respond to, and recover from critical incidents. School Safety
supports the District’s goals to establish and maintain safe schools, increase the graduation rate, and ensure each of our students is prepared for
post-secondary educational opportunities by providing relevant training and professional development; data analysis; safety assessments; incident
reviews; and exploring and enhancing collaborative opportunities. In addition, School Safety conducts thorough and impartial internalinvestigations to ensure the integrity of the RCSD and the professionalism demonstrated by District employees.
Expense Categories
Section 7 Page 31
Administration Profiles and Budgets 2009-10 Draft Budget
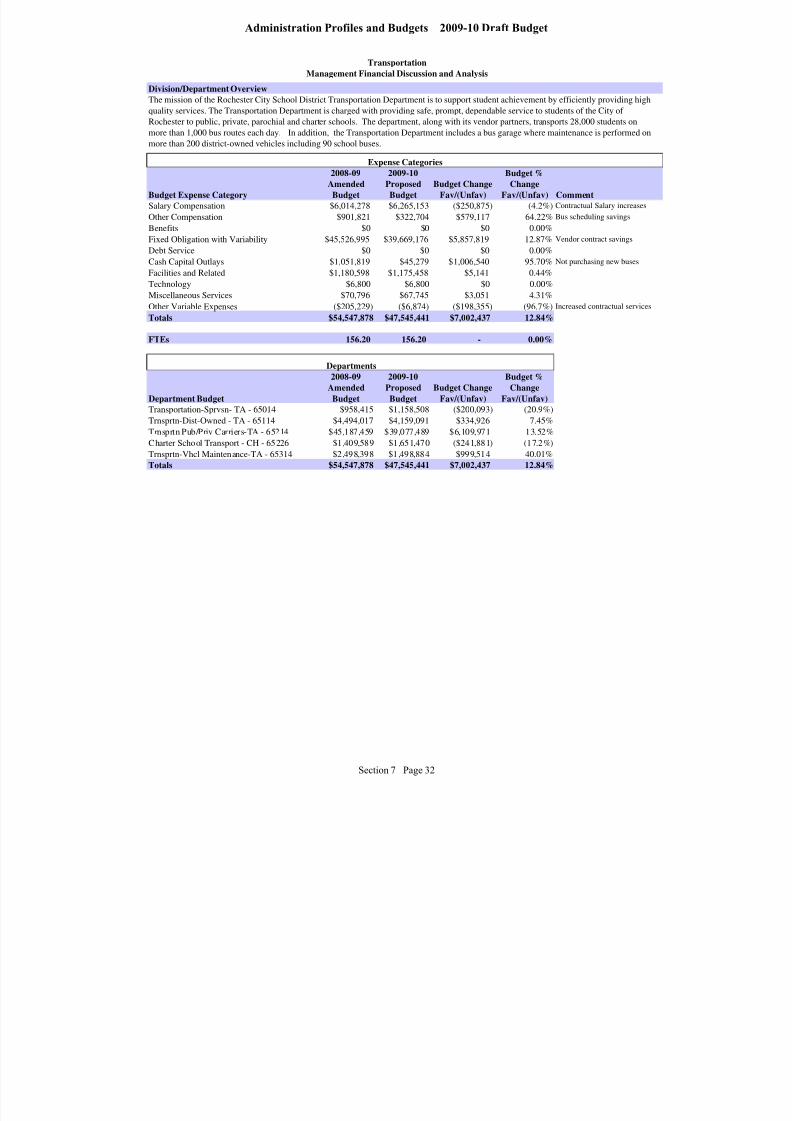
8/7/2019 2009_2010DRAFT
http://slidepdf.com/reader/full/20092010draft 234/268
Transportation
Management Financial Discussion and Analysis
Division/Department Overview
Budget Expense Category
2008-09
Amended
Budget
2009-10
Proposed
Budget
Budget Change
Fav/(Unfav)
Budget %
Change
Fav/(Unfav) Comment
Salary Compensation $6,014,278 $6,265,153 ($250,875) (4.2%) Contractual Salary increases
Other Compensation $901,821 $322,704 $579,117 64.22% Bus scheduling savings
Benefits $0 $0 $0 0.00%
Fixed Obligation with Variability $45,526,995 $39,669,176 $5,857,819 12.87% Vendor contract savings
Debt Service $0 $0 $0 0.00%
Cash Capital Outlays $1,051,819 $45,279 $1,006,540 95.70% Not purchasing new buses
Facilities and Related $1,180,598 $1,175,458 $5,141 0.44%
Technology $6,800 $6,800 $0 0.00%
Miscellaneous Services $70,796 $67,745 $3,051 4.31%
Other Variable Expenses ($205,229) ($6,874) ($198,355) (96.7%) Increased contractual services
Totals $54,547,878 $47,545,441 $7,002,437 12.84%
FTEs 156.20 156.20 - 0.00%
Department Budget
2008-09
Amended
Budget
2009-10
Proposed
Budget
Budget Change
Fav/(Unfav)
Budget %
Change
Fav/(Unfav)Transportation-Sprvsn- TA - 65014 $958,415 $1,158,508 ($200,093) (20.9%)
Trnsprtn-Dist-Owned - TA - 65114 $4,494,017 $4,159,091 $334,926 7.45%
Trnsprtn Pub/Priv Carriers-TA - 65214 $45,187,459 $39,077,489 $6,109,971 13.52%
Charter School Transport - CH - 65226 $1,409,589 $1,651,470 ($241,881) (17.2%)
Trnsprtn-Vhcl Maintenance-TA - 65314 $2,498,398 $1,498,884 $999,514 40.01%Totals $54,547,878 $47,545,441 $7,002,437 12.84%
Expense Categories
The mission of the Rochester City School District Transportation Department is to support student achievement by efficiently providing high
quality services. The Transportation Department is charged with providing safe, prompt, dependable service to students of the City of
Rochester to public, private, parochial and charter schools. The department, along with its vendor partners, transports 28,000 students on
more than 1,000 bus routes each day. In addition, the Transportation Department includes a bus garage where maintenance is performed on
more than 200 district-owned vehicles including 90 school buses.
Departments
Section 7 Page 32
Administration Profiles and Budgets 2009-10 Draft Budget

8/7/2019 2009_2010DRAFT
http://slidepdf.com/reader/full/20092010draft 235/268
Communications
Management Financial Discussion and Analysis
Division/Department Overview
Budget Expense Category
2008-09Amended
Budget
2009-10Proposed
Budget
BudgetChange
Fav/(Unfav)
Budget %Change
Fav/(Unfav) Comment
Salary Compensation $596,222 $620,146 ($23,924) (4.01%) Contractual salary increase
Other Compensation $5,500 $3,750 $1,750 31.82% Districtwide operating reduction
Benefits $0 $0 $0 0.00%
Fixed Obligations with Variability $0 $0 $0 0.00%
Debt Service $0 $0 $0 0.00%
Cash Capital Outlays $31,107 $8,500 $22,607 72.67% Districtwide operating reduction
Facilities and Related $83,520 $53,075 $30,445 36.45% Districtwide operating reduction
Technology $106,385 $100,000 $6,385 6.00%
Miscellaneous Services $2,330 $1,100 $1,230 52.79% Districtwide operating reduction
Other Variable Expenses $160,320 $52,250 $108,070 67.41% Districtwide operating reduction
Totals $985,384 $838,821 $146,563 14.87%
FTEs 9.00 9.00 - 0.00%
Department Budget
2008-09
Amended
Budget
2009-10
Proposed
Budget
Budget
Change
Fav/(Unfav)
Budget %
Change
Fav/(Unfav)
Dept of Communications-DM - 70116 $985,384 $838,821 $146,563 14.87%
Totals $985,384 $838,821 $146,563 14.87%
Departments
Communications helps the District and its schools meet their communications needs and provide clear, useful, accurate information to the
public. This area’s work is intended to raise awareness of school and student successes; build parent and community support through effective
communication in a variety of media; and strengthen public confidence in the District and its schools through media outreach and public
relations. Services include the creation of marketing/promotional materials for schools; assistance in reaching parents and the public through
effective communication; daily interaction with the news media to promote positive coverage and accurate, balanced reporting; support for
schools in working with the media; video production and multimedia support; Spanish translation; and presentation of news and informationvia the District’s website.
Expense Categories
2009-10 Budget Expense Total - $838,821
Other Variable Expenses
6.23%
Miscellaneous Services
0.13%
Technology
11.92%
Cash Capital Outlays
1.01%
Facilities and Related
6.33%
Other Compensation
0.45%
Salary Compensation
73.93%
Section 7 Page 33
Administration Profiles and Budgets 2009-10 Draft Budget

8/7/2019 2009_2010DRAFT
http://slidepdf.com/reader/full/20092010draft 236/268
Communications
2007-2008 2008-2009 2009-2010
Var Bud vs
Amend
Actual Amended Proposed Fav/(Unfav)
EXPENDITURES BY ACCOUNT
Salary Compensation
Teachers' Salaries - - - -
Civil Service Salaries 517,784 596,222 620,146 (23,924)
Administrator's Salaries 105,935 - - -
Hourly Teachers - - - -
Teaching Assistants - - - -
Paraprofessionals Salary - - - -
Sub Total Salary Compensation 623,719 596,222 620,146 (23,924)
Other Compensation
Substitute Teacher Cost - - - -
Overtime Non-Instructional Sal 5,393 5,500 3,750 1,750
Teachers In Service - - - -
Sub Total Other Compensation 5,393 5,500 3,750 1,750
Total Salary and Other Compensation 629,112 601,722 623,896 (22,174) Sub Total Employee Benefits - - - -
Total Compensation and Benefits 629,112 601,722 623,896 (22,174)
Fixed Obligations With Variability
Special Education Tuition - - - -
Contract Transportation - - - -
Charter School Tuition - - - -
Health Service Other Districts - - - -
Insurance Non-employee - - - -
Sub Total Fixed Obligations - - - -
Debt Service
Sub Total Debt Service - - - -
Cash Capital Outlays
Cash Capital Expense - - - -
Textbooks - - - -
Equipment Other Than Buses 7,115 28,307 7,500 20,807 Equipment Buses - - - -
Computer Hardware - Instructional - - - -
Computer Hardware - Non Instructional 2,728 2,800 1,000 1,800
Library Books - - - -
Sub Total Cash Capital Outlays 9,842 31,107 8,500 22,607
Expenditure Summary (All Funds)
Section 7 Page 34
Administration Profiles and Budgets 2009-10 Draft Budget

8/7/2019 2009_2010DRAFT
http://slidepdf.com/reader/full/20092010draft 237/268
Communications
2007-2008 2008-2009 2009-2010
Var Bud vs
Amend
Actual Amended Proposed Fav/(Unfav)
Expenditure Summary (All Funds)
Facilities and Related
Utilities - - - -
Instructional Supplies - - - -
Equip Service Contr & Repair 650 5,000 - 5,000
Facilities Service Contracts - - - -
Rentals - - - -
Maintenance Repair Supplies - - - -
Postage Printing & Advertising 79,634 70,400 50,000 20,400
Auto Supplies - - - -
Supplies and Materials 77 120 75 45
Custodial Supplies - - - -
Office Supplies 6,467 8,000 3,000 5,000
Sub Total Facilities and Related 86,828 83,520 53,075 30,445
Technology
Computer Software - Instructional - - - -
Computer Software - Non Instructional 851 106,385 100,000 6,385
Subtotal Technology 851 106,385 100,000 6,385
Miscellaneous Services
Sub Total Miscellaneous Services 567 2,330 1,100 1,230
All Other Variable Expenses
Professional & Technical Serv 6,534 152,820 50,000 102,820
Agency Clerical 4,304 7,500 2,250 5,250
Judgments and Claims - - - -
Grant Disallowances - - - -
Departmental Credits - - - -
Indirect Costs Grants - - - -
BOCES Services - - - -
Professional Development - - - -
Subtotal of All Other Variable Expenses 10,837 160,320 52,250 108,070
Total Non Compensation 108,926 383,662 214,925 168,737
Sub Total 738,038 985,384 838,821 146,563
Fund Balance Reserve - - - - Grand Total 738,038 985,384 838,821 146,563
Section 7 Page 35
Administration Profiles and Budgets 2009-10 Draft Budget
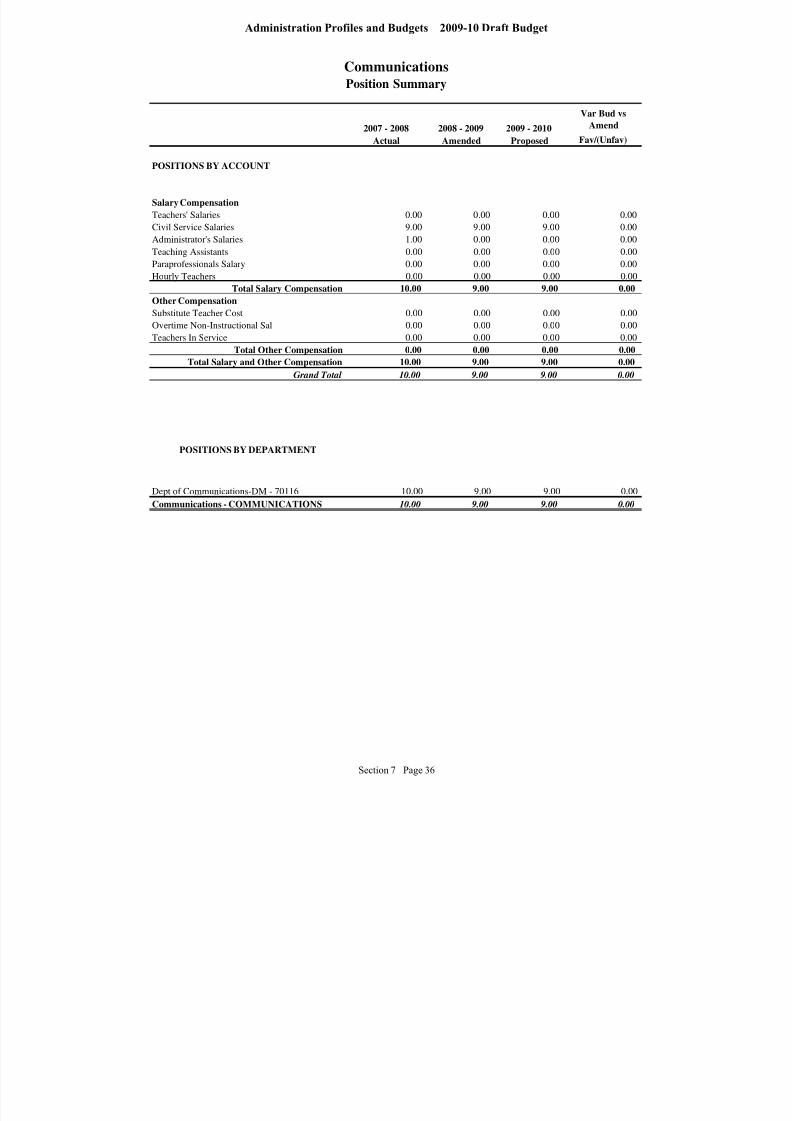
8/7/2019 2009_2010DRAFT
http://slidepdf.com/reader/full/20092010draft 238/268
Communications
2007 - 2008 2008 - 2009 2009 - 2010
Var Bud vs
Amend
Actual Amended Proposed Fav/(Unfav)
POSITIONS BY ACCOUNT
Salary Compensation
Teachers' Salaries 0.00 0.00 0.00 0.00
Civil Service Salaries 9.00 9.00 9.00 0.00
Administrator's Salaries 1.00 0.00 0.00 0.00
Teaching Assistants 0.00 0.00 0.00 0.00
Paraprofessionals Salary 0.00 0.00 0.00 0.00
Hourly Teachers 0.00 0.00 0.00 0.00
Total Salary Compensation 10.00 9.00 9.00 0.00
Other CompensationSubstitute Teacher Cost 0.00 0.00 0.00 0.00
Overtime Non-Instructional Sal 0.00 0.00 0.00 0.00
Teachers In Service 0.00 0.00 0.00 0.00
Total Other Compensation 0.00 0.00 0.00 0.00
Total Salary and Other Compensation 10.00 9.00 9.00 0.00
Grand Total 10.00 9.00 9.00 0.00
POSITIONS BY DEPARTMENT
Dept of Communications-DM - 70116 10.00 9.00 9.00 0.00
Communications - COMMUNICATIONS 10.00 9.00 9.00 0.00
Position Summary
Section 7 Page 36
Administration Profiles and Budgets 2009-10 Draft Budget

8/7/2019 2009_2010DRAFT
http://slidepdf.com/reader/full/20092010draft 239/268
General Counsel
Management Financial Discussion and Analysis
Division/Department Overview
Budget Expense Category
2008-09
Amended
Budget
2009-10
Proposed
Budget
Budget
Change
Fav/(Unfav)
Budget %
Change
Fav/(Unfav) Comment
Salary Compensation $1,169,156 $1,302,124 ($132,968) (11.37%) 1.0 FTE increase & contractual salary increase
Other Compensation $0 $0 $0 0.00%
Benefits $0 $0 $0 0.00%
Fixed Obligations with Variability $0 $0 $0 0.00%
Debt Service $0 $0 $0 0.00%
Cash Capital $3,100 $2,575 $525 16.94% Districtwide operating reduction
Facilities and Related $56,880 $44,370 $12,510 21.99% Districtwide operating reduction
Technology $5,300 $5,300 $0 0.00%
Miscellaneous Services $7,089 $5,442 $1,647 23.24% Districtwide operating reduction
Other Variable Expenses $420,205 $365,396 $54,810 13.04% Districtwide operating reduction
Totals $1,661,730 $1,725,206 ($63,476) (3.82%)
FTEs 14.00 15.00 (1.00) (7.14%)
Department Budget
2008-09
Amended
Budget
2009-10
Proposed
Budget
Budget
Change
Fav/(Unfav)
Budget %
Change
Fav/(Unfav)
Off Internal Ctrl Standards-DM - 70316 $0 $0 $0 0.00%
General Counsel - 74016 $1,661,730 $1,725,206 ($63,476) (3.82%)
Totals $1,661,730 $1,725,206 ($63,476) (3.82%)
Departments
Expense Categories
General Counsel’s mission is to advance the cause of urban education, render legal advice to the Superintendent of Schools, Board of Education and
various departments, and represent the District in matters relating to state and federal laws, regulations and policies. General Counsel serves as the
District’s advocate in legal and quasi-legal proceedings brought by and against the District involving students, employees, governmental entities and
private citizens. The legal staff provide counsel on a daily basis to schools and District administrators. This sector represents the District and Board o
Education at administrative and arbitration hearings related to collective bargaining agreements and state and federal law. The legal staff perform othe
duties at the request of the Superintendent of Schools and the Board of Education.
2009-10 Budget Expense Total - $1,725,206
Facilities and Related
2.57%
Cash Capital
0.15%
Technology
0.31%
Miscellaneous Services
0.32%
Other Variable Expenses
21.18%
Salary Compensation
75.48%
Section 7 Page 37
Administration Profiles and Budgets 2009-10 Draft Budget
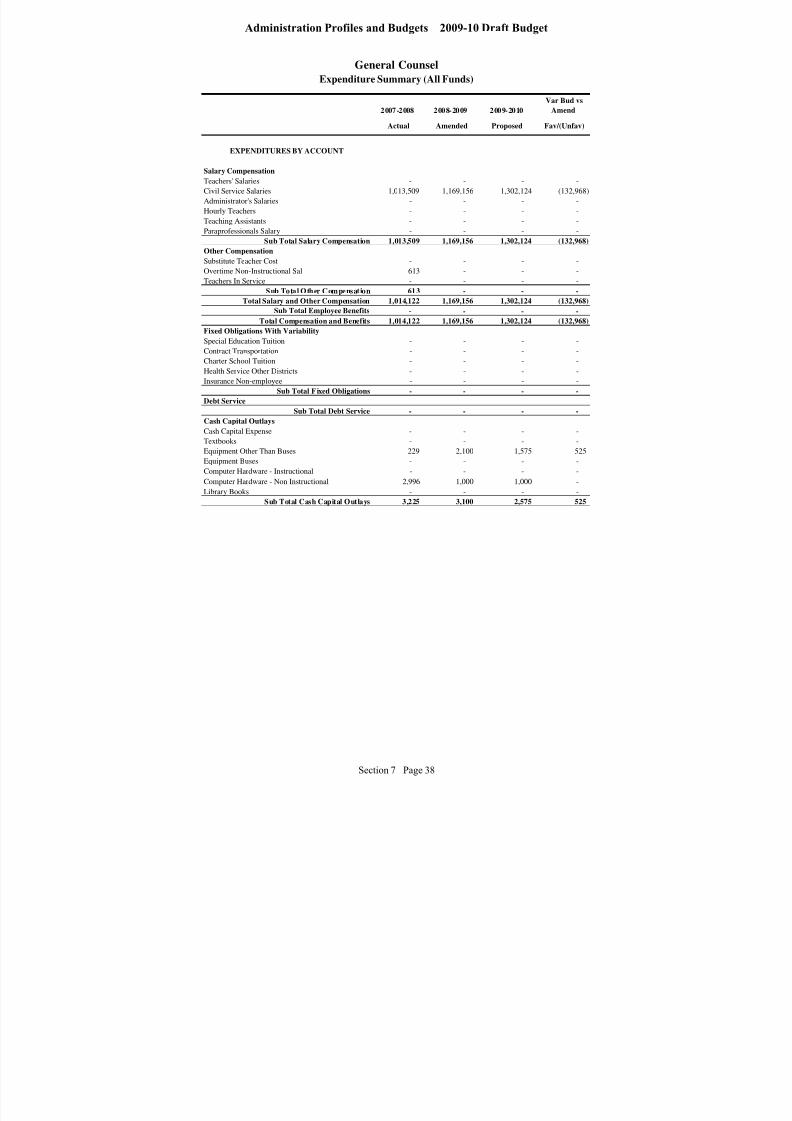
8/7/2019 2009_2010DRAFT
http://slidepdf.com/reader/full/20092010draft 240/268
General Counsel
2007-2008 2008-2009 2009-2010
Var Bud vs
Amend
Actual Amended Proposed Fav/(Unfav)
EXPENDITURES BY ACCOUNT
Salary Compensation
Teachers' Salaries - - - -
Civil Service Salaries 1,013,509 1,169,156 1,302,124 (132,968)
Administrator's Salaries - - - -
Hourly Teachers - - - -
Teaching Assistants - - - -
Paraprofessionals Salary - - - -
Sub Total Salary Compensation 1,013,509 1,169,156 1,302,124 (132,968)
Other Compensation
Substitute Teacher Cost - - - -
Overtime Non-Instructional Sal 613 - - -
Teachers In Service - - - -
Sub Total Other Compensation 613 - - -
Total Salary and Other Compensation 1,014,122 1,169,156 1,302,124 (132,968) Sub Total Employee Benefits - - - -
Total Compensation and Benefits 1,014,122 1,169,156 1,302,124 (132,968)
Fixed Obligations With Variability
Special Education Tuition - - - -
Contract Transportation - - - -
Charter School Tuition - - - -
Health Service Other Districts - - - -
Insurance Non-employee - - - -
Sub Total Fixed Obligations - - - -
Debt Service
Sub Total Debt Service - - - -
Cash Capital Outlays
Cash Capital Expense - - - -
Textbooks - - - -
Equipment Other Than Buses 229 2,100 1,575 525 Equipment Buses - - - -
Computer Hardware - Instructional - - - -
Computer Hardware - Non Instructional 2,996 1,000 1,000 -
Library Books - - - -
Sub Total Cash Capital Outlays 3,225 3,100 2,575 525
Expenditure Summary (All Funds)
Section 7 Page 38
Administration Profiles and Budgets 2009-10 Draft Budget

8/7/2019 2009_2010DRAFT
http://slidepdf.com/reader/full/20092010draft 241/268
General Counsel
2007-2008 2008-2009 2009-2010
Var Bud vs
Amend
Actual Amended Proposed Fav/(Unfav)
Expenditure Summary (All Funds)
Facilities and Related
Utilities - - - - Instructional Supplies - - - -
Equip Service Contr & Repair 279 4,380 4,380 -
Facilities Service Contracts - - - -
Rentals - - - -
Maintenance Repair Supplies - - - -
Postage Printing & Advertising 486 5,900 5,040 860
Auto Supplies - - - -
Supplies and Materials 30,595 41,300 30,975 10,325
Custodial Supplies - - - -
Office Supplies (7,372) 5,300 3,975 1,325
Sub Total Facilities and Related 23,988 56,880 44,370 12,510
Technology
Computer Software - Instructional - - - -
Computer Software - Non Instructional 341 5,300 5,300 -
Subtotal Technology 341 5,300 5,300 - Miscellaneous Services
Sub Total Miscellaneous Services 2,940 7,089 5,442 1,647
All Other Variable Expenses
Professional & Technical Serv 250,291 421,500 372,243 49,257
Agency Clerical 15,431 - - -
Judgments and Claims - - - -
Grant Disallowances - - - -
Departmental Credits (20,854) (20,000) (20,000) -
Indirect Costs Grants - - - -
BOCES Services - - - -
Professional Development 4,469 18,705 13,153 5,553
Subtotal of All Other Variable Expenses 249,338 420,205 365,396 54,810
Total Non Compensation 279,832 492,574 423,082 69,492
Sub Total 1,293,954 1,661,730 1,725,206 (63,476)
Fund Balance Reserve - - - - Grand Total 1,293,954 1,661,730 1,725,206 (63,476)
Section 7 Page 39
Administration Profiles and Budgets 2009-10 Draft Budget
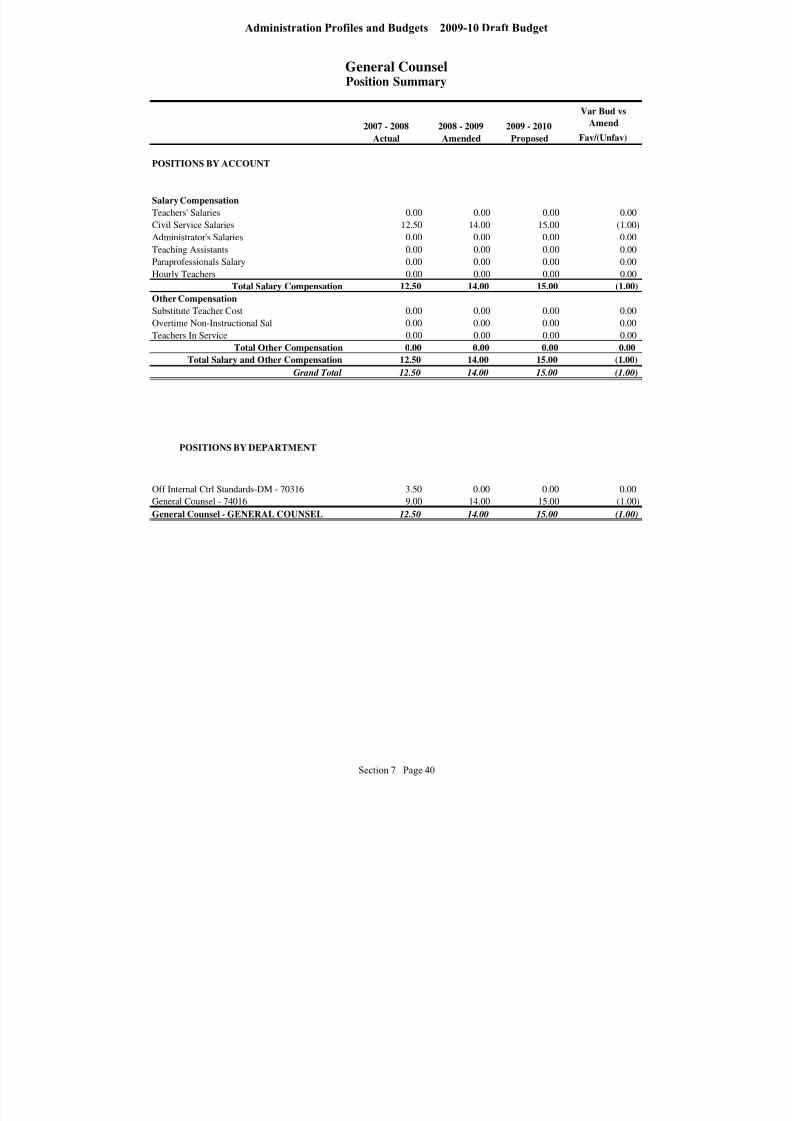
8/7/2019 2009_2010DRAFT
http://slidepdf.com/reader/full/20092010draft 242/268
General Counsel
2007 - 2008 2008 - 2009 2009 - 2010
Var Bud vs
Amend
Actual Amended Proposed Fav/(Unfav)
POSITIONS BY ACCOUNT
Salary Compensation
Teachers' Salaries 0.00 0.00 0.00 0.00
Civil Service Salaries 12.50 14.00 15.00 (1.00)
Administrator's Salaries 0.00 0.00 0.00 0.00
Teaching Assistants 0.00 0.00 0.00 0.00
Paraprofessionals Salary 0.00 0.00 0.00 0.00
Hourly Teachers 0.00 0.00 0.00 0.00
Total Salary Compensation 12.50 14.00 15.00 (1.00)
Other CompensationSubstitute Teacher Cost 0.00 0.00 0.00 0.00
Overtime Non-Instructional Sal 0.00 0.00 0.00 0.00
Teachers In Service 0.00 0.00 0.00 0.00
Total Other Compensation 0.00 0.00 0.00 0.00
Total Salary and Other Compensation 12.50 14.00 15.00 (1.00)
Grand Total 12.50 14.00 15.00 (1.00)
POSITIONS BY DEPARTMENT
Off Internal Ctrl Standards-DM - 70316 3.50 0.00 0.00 0.00
General Counsel - 74016 9.00 14.00 15.00 (1.00)
General Counsel - GENERAL COUNSEL 12.50 14.00 15.00 (1.00)
Position Summary
Section 7 Page 40
Administration Profiles and Budgets 2009-10 Draft Budget
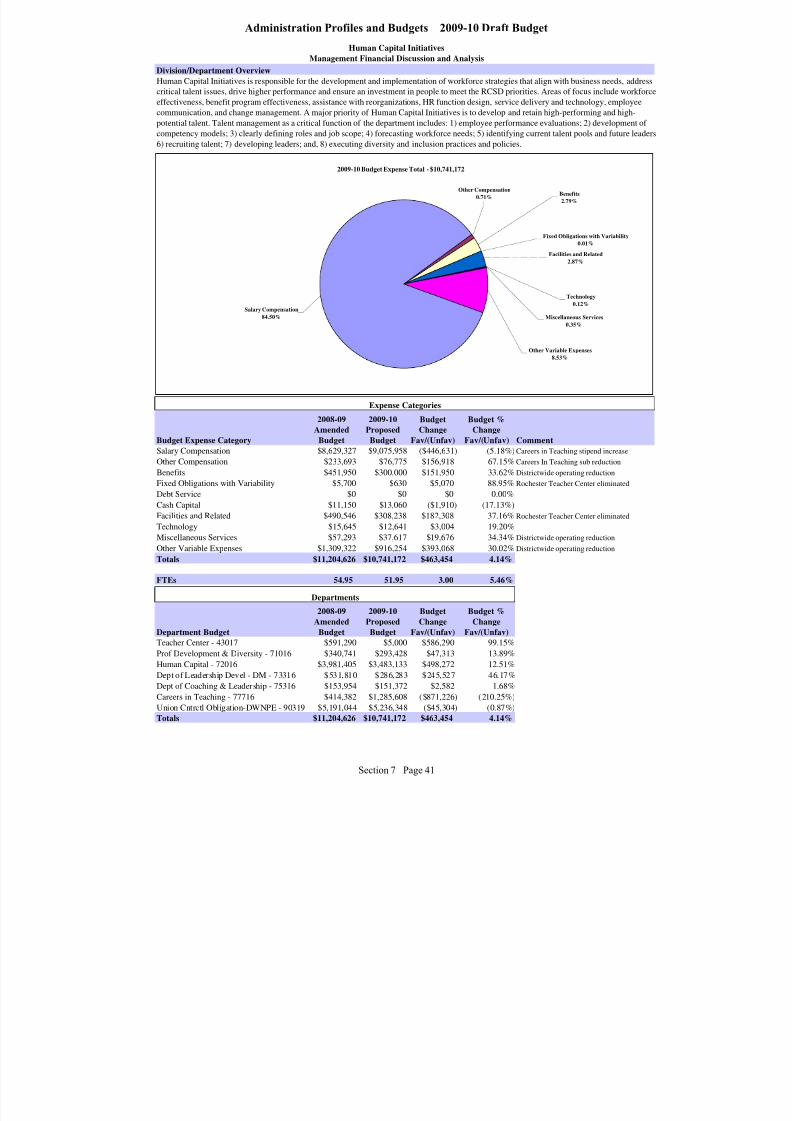
8/7/2019 2009_2010DRAFT
http://slidepdf.com/reader/full/20092010draft 243/268
Human Capital Initiatives
Management Financial Discussion and Analysis
Division/Department Overview
Budget Expense Category
2008-09
Amended
Budget
2009-10
Proposed
Budget
Budget
Change
Fav/(Unfav)
Budget %
Change
Fav/(Unfav) Comment
Salary Compensation $8,629,327 $9,075,958 ($446,631) (5.18%) Careers in Teaching stipend increaseOther Compensation $233,693 $76,775 $156,918 67.15% Careers In Teaching sub reduction
Benefits $451,950 $300,000 $151,950 33.62% Districtwide operating reduction
Fixed Obligations with Variability $5,700 $630 $5,070 88.95% Rochester Teacher Center eliminated
Debt Service $0 $0 $0 0.00%
Cash Capital $11,150 $13,060 ($1,910) (17.13%)
Facilities and Related $490,546 $308,238 $182,308 37.16% Rochester Teacher Center eliminated
Technology $15,645 $12,641 $3,004 19.20%
Miscellaneous Services $57,293 $37,617 $19,676 34.34% Districtwide operating reduction
Other Variable Expenses $1,309,322 $916,254 $393,068 30.02% Districtwide operating reduction
Totals $11,204,626 $10,741,172 $463,454 4.14%
FTEs 54.95 51.95 3.00 5.46%
Department Budget
2008-09
Amended
Budget
2009-10
Proposed
Budget
Budget
Change
Fav/(Unfav)
Budget %
Change
Fav/(Unfav)
Teacher Center - 43017 $591,290 $5,000 $586,290 99.15%
Prof Development & Diversity - 71016 $340,741 $293,428 $47,313 13.89%
Human Capital - 72016 $3,981,405 $3,483,133 $498,272 12.51%
Dept of Leadership Devel - DM - 73316 $531,810 $286,283 $245,527 46.17%
Dept of Coaching & Leadership - 75316 $153,954 $151,372 $2,582 1.68%
Careers in Teaching - 77716 $414,382 $1,285,608 ($871,226) (210.25%)
Union Cntrctl Obligation-DWNPE - 90319 $5,191,044 $5,236,348 ($45,304) (0.87%)
Totals $11,204,626 $10,741,172 $463,454 4.14%
Expense Categories
Departments
Human Capital Initiatives is responsible for the development and implementation of workforce strategies that align with business needs, address
critical talent issues, drive higher performance and ensure an investment in people to meet the RCSD priorities. Areas of focus include workforce
effectiveness, benefit program effectiveness, assistance with reorganizations, HR function design, service delivery and technology, employee
communication, and change management. A major priority of Human Capital Initiatives is to develop and retain high-performing and high-
potential talent. Talent management as a critical function of the department includes: 1) employee performance evaluations; 2) development of
competency models; 3) clearly defining roles and job scope; 4) forecasting workforce needs; 5) identifying current talent pools and future leaders
6) recruiting talent; 7) developing leaders; and, 8) executing diversity and inclusion practices and policies.
2009-10 Budget Expense Total - $10,741,172
Other Variable Expenses
8.53%
Miscellaneous Services
0.35%
Technology
0.12%
Facilities and Related
2.87%
Benefits
2.79%
Fixed Obligations with Variability
0.01%
Other Compensation
0.71%
Salary Compensation
84.50%
Section 7 Page 41
Administration Profiles and Budgets 2009-10 Draft Budget
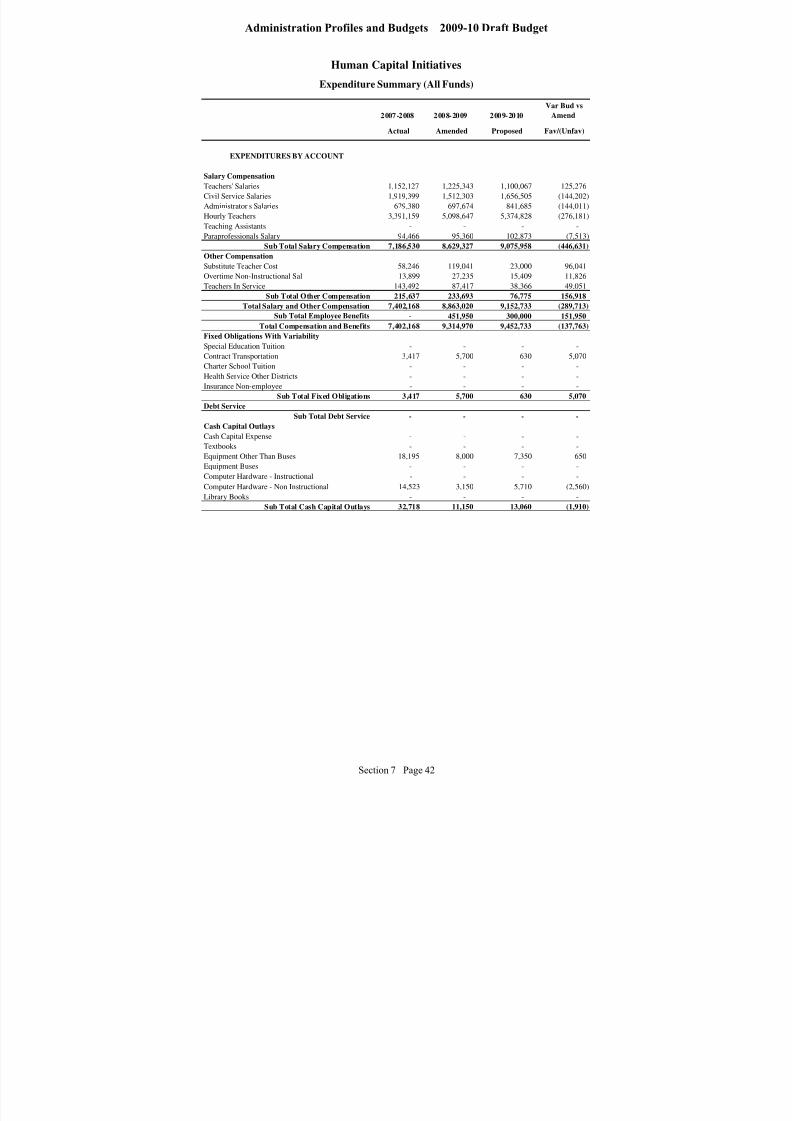
8/7/2019 2009_2010DRAFT
http://slidepdf.com/reader/full/20092010draft 244/268
Human Capital Initiatives
2007-2008 2008-2009 2009-2010
Var Bud vs
Amend
Actual Amended Proposed Fav/(Unfav)
EXPENDITURES BY ACCOUNT
Salary Compensation
Teachers' Salaries 1,152,127 1,225,343 1,100,067 125,276
Civil Service Salaries 1,919,399 1,512,303 1,656,505 (144,202)
Administrator's Salaries 629,380 697,674 841,685 (144,011)
Hourly Teachers 3,391,159 5,098,647 5,374,828 (276,181)
Teaching Assistants - - - -
Paraprofessionals Salary 94,466 95,360 102,873 (7,513)
Sub Total Salary Compensation 7,186,530 8,629,327 9,075,958 (446,631)
Other Compensation
Substitute Teacher Cost 58,246 119,041 23,000 96,041
Overtime Non-Instructional Sal 13,899 27,235 15,409 11,826
Teachers In Service 143,492 87,417 38,366 49,051
Sub Total Other Compensation 215,637 233,693 76,775 156,918
Total Salary and Other Compensation 7,402,168 8,863,020 9,152,733 (289,713)
Sub Total Employee Benefits - 451,950 300,000 151,950
Total Compensation and Benefits 7,402,168 9,314,970 9,452,733 (137,763)
Fixed Obligations With Variability
Special Education Tuition - - - -
Contract Transportation 3,417 5,700 630 5,070
Charter School Tuition - - - -
Health Service Other Districts - - - -
Insurance Non-employee - - - -
Sub Total Fixed Obligations 3,417 5,700 630 5,070
Debt Service
Sub Total Debt Service - - - -
Cash Capital Outlays
Cash Capital Expense - - - -
Textbooks - - - -
Equipment Other Than Buses 18,195 8,000 7,350 650 Equipment Buses - - - -
Computer Hardware - Instructional - - - -
Computer Hardware - Non Instructional 14,523 3,150 5,710 (2,560)
Library Books - - - -
Sub Total Cash Capital Outlays 32,718 11,150 13,060 (1,910)
Expenditure Summary (All Funds)
Section 7 Page 42
Administration Profiles and Budgets 2009-10 Draft Budget

8/7/2019 2009_2010DRAFT
http://slidepdf.com/reader/full/20092010draft 245/268
Human Capital Initiatives
2007-2008 2008-2009 2009-2010
Var Bud vs
Amend
Actual Amended Proposed Fav/(Unfav)
Expenditure Summary (All Funds)
Facilities and Related
Utilities 1,013 6,281 3,888 2,393
Instructional Supplies 95,594 69,409 33,298 36,111
Equip Service Contr & Repair 3,426 3,508 900 2,608
Facilities Service Contracts - - - -
Rentals 80,433 138,027 56,542 81,485
Maintenance Repair Supplies - - - -
Postage Printing & Advertising 117,388 137,780 122,390 15,390
Auto Supplies - - - -
Supplies and Materials 79,596 73,793 49,525 24,268
Custodial Supplies - - - -
Office Supplies 37,723 61,748 41,695 20,053
Sub Total Facilities and Related 415,173 490,546 308,238 182,308
Technology
Computer Software - Instructional - - - -
Computer Software - Non Instructional 31,024 15,645 12,641 3,004
Subtotal Technology 31,024 15,645 12,641 3,004
Miscellaneous Services
Sub Total Miscellaneous Services 38,027 57,293 37,617 19,676
All Other Variable Expenses
Professional & Technical Serv 1,120,593 655,800 323,190 332,610
Agency Clerical 20,891 23,250 12,256 10,994
Judgments and Claims - - - -
Grant Disallowances - - - -
Departmental Credits - - - -
Indirect Costs Grants - - - -
BOCES Services 690 1,884 1,620 264
Professional Development 657,213 628,388 579,188 49,201
Subtotal of All Other Variable Expenses 1,799,387 1,309,322 916,254 393,068
Total Non Compensation 2,319,746 1,889,656 1,288,440 601,216
Sub Total 9,721,913 11,204,626 10,741,172 463,454
Fund Balance Reserve - - - -
Grand Total 9,721,913 11,204,626 10,741,172 463,454
Section 7 Page 43
Administration Profiles and Budgets 2009-10 Draft Budget

8/7/2019 2009_2010DRAFT
http://slidepdf.com/reader/full/20092010draft 246/268
Human Capital Initiatives
2007 - 2008 2008 - 2009 2009 - 2010
Var Bud vs
Amend
Actual Amended Proposed Fav/(Unfav)
POSITIONS BY ACCOUNT
Salary Compensation
Teachers' Salaries 16.50 18.95 15.95 3.00
Civil Service Salaries 33.00 26.00 26.00 0.00
Administrator's Salaries 6.00 7.00 7.00 0.00
Teaching Assistants 0.00 0.00 0.00 0.00
Paraprofessionals Salary 3.00 3.00 3.00 0.00
Hourly Teachers 0.00 0.00 0.00 0.00
Total Salary Compensation 58.50 54.95 51.95 3.00
Other Compensation
Substitute Teacher Cost 0.00 0.00 0.00 0.00
Overtime Non-Instructional Sal 0.00 0.00 0.00 0.00
Teachers In Service 0.00 0.00 0.00 0.00
Total Other Compensation 0.00 0.00 0.00 0.00
Total Salary and Other Compensation 58.50 54.95 51.95 3.00
Grand Total 58.50 54.95 51.95 3.00
POSITIONS BY DEPARTMENT
Teacher Center - 43017 2.50 3.00 0.00 3.00
Prof Development & Diversity - 71016 4.00 3.00 3.00 0.00
Human Capital - 72016 29.00 23.00 23.00 0.00
Dept of Coaching & Leadership - 75316 1.00 1.00 1.00 0.00
Careers in Teaching - 77716 4.80 4.20 4.20 0.00
Union Cntrctl Obligation-DWNPE - 90319 17.20 20.75 20.75 0.00
Human Capital Initiatives - HUMAN CAPITAL INITIA 58.50 54.95 51.95 3.00
Position Summary
Section 7 Page 44
Administration Profiles and Budgets 2009-10 Draft Budget

8/7/2019 2009_2010DRAFT
http://slidepdf.com/reader/full/20092010draft 247/268
School Innovation
Management Financial Discussion and Analysis
Division/Department Overview
Budget Expense Category
2008-09
Amended
Budget
2009-10
Proposed
Budget
Budget
Change
Fav/(Unfav)
Budget %
Change
Fav/(Unfav) CommentSalary Compensation $95,000 $98,753 ($3,753) (4.0%)
Other Compensation $0 $226,759 ($226,759) (100.0%) School #14 & #58 redesign costs
Benefits $0 $0 $0 0.00%Fixed Obligations with Variability $0 $0 $0 0.00%
Debt Service $0 $0 $0 0.00%
Cash Capital Outlays $0 $0 $0 0.00%
Facilities and Related $1,000 $675 $325 32.50% Districtwide operating reduction
Technology $0 $0 $0 0.00%
Miscellaneous Services $0 $0 $0 0.00%
Other Variable Expenses $104,075 $273,418 ($169,343) (162.7%) School #14 & #58 redesign costs
Totals $200,075 $599,605 ($399,530) (199.69%)
FTEs 1.00 1.00 - 0.00%
Department Budget
2008-09Amended
Budget
2009-10Proposed
Budget
BudgetChange
Fav/(Unfav)
Budget %Change
Fav/(Unfav)Office of School Innovation - 77016 $200,075 $599,605 ($399,530) (199.7%)
Totals $200,075 $599,605 ($399,530) (199.69%)
Expense Categories
School Innovation’s goal is to create higher quality school options, to provide a portfolio of choice for students, and to better compete with
surrounding districts. School Innovation is responsible for creating new schools, redesigning schools, and phasing out schools.
Departments
2009-10 Budget Expense Total - $599.605
Fac ilities and Related
0.11%
Other Compensation
37.82%
Salary Compensation
16.47%
Other Variable Expenses
45.60%
Section 7 Page 45
Administration Profiles and Budgets 2009-10 Draft Budget

8/7/2019 2009_2010DRAFT
http://slidepdf.com/reader/full/20092010draft 248/268
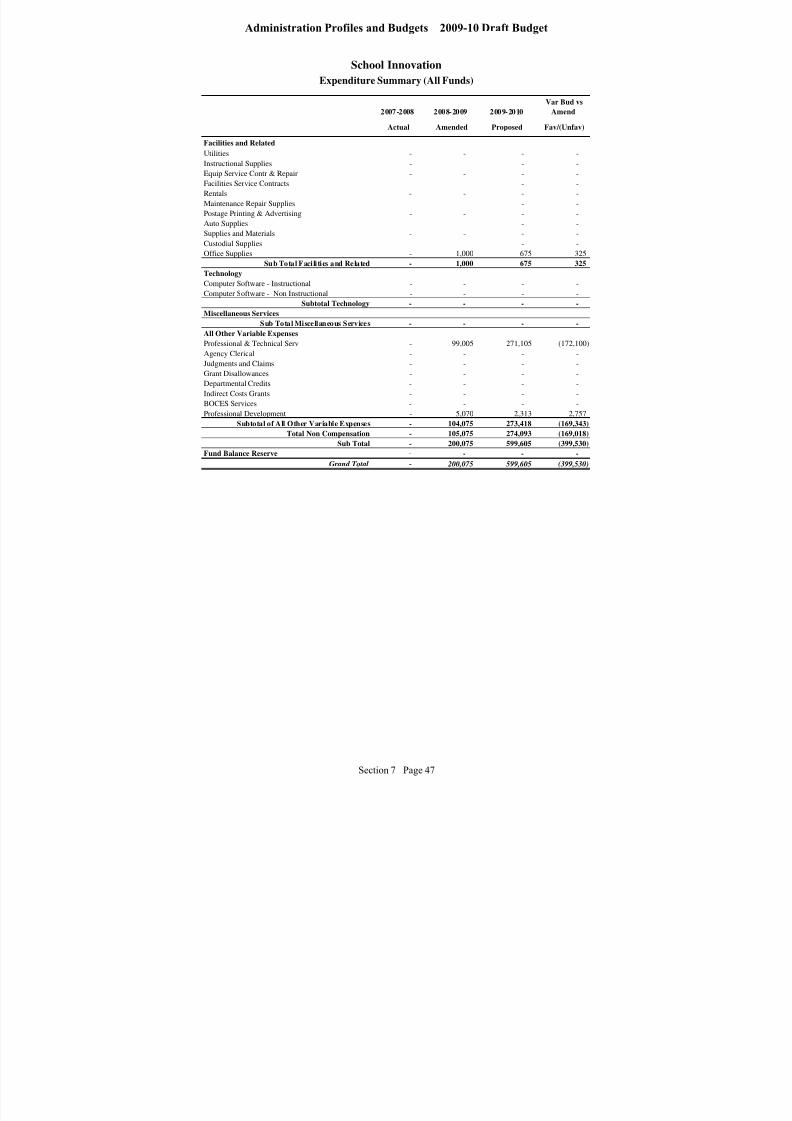
8/7/2019 2009_2010DRAFT
http://slidepdf.com/reader/full/20092010draft 249/268
School Innovation
2007-2008 2008-2009 2009-2010
Var Bud vs
Amend
Actual Amended Proposed Fav/(Unfav)
Expenditure Summary (All Funds)
Facilities and Related
Utilities - - - -
Instructional Supplies - - - -
Equip Service Contr & Repair - - - -
Facilities Service Contracts - - - -
Rentals - - - -
Maintenance Repair Supplies - - - -
Postage Printing & Advertising - - - -
Auto Supplies - - - -
Supplies and Materials - - - -
Custodial Supplies - - - -
Office Supplies - 1,000 675 325
Sub Total Facilities and Related - 1,000 675 325
Technology
Computer Software - Instructional - - - -
Computer Software - Non Instructional - - - -
Subtotal Technology - - - - Miscellaneous Services
Sub Total Miscellaneous Services - - - -
All Other Variable Expenses
Professional & Technical Serv - 99,005 271,105 (172,100)
Agency Clerical - - - -
Judgments and Claims - - - -
Grant Disallowances - - - -
Departmental Credits - - - -
Indirect Costs Grants - - - -
BOCES Services - - - -
Professional Development - 5,070 2,313 2,757
Subtotal of All Other Variable Expenses - 104,075 273,418 (169,343)
Total Non Compensation - 105,075 274,093 (169,018)
Sub Total - 200,075 599,605 (399,530)
Fund Balance Reserve - - - - Grand Total - 200,075 599,605 (399,530)
Section 7 Page 47
Administration Profiles and Budgets 2009-10 Draft Budget
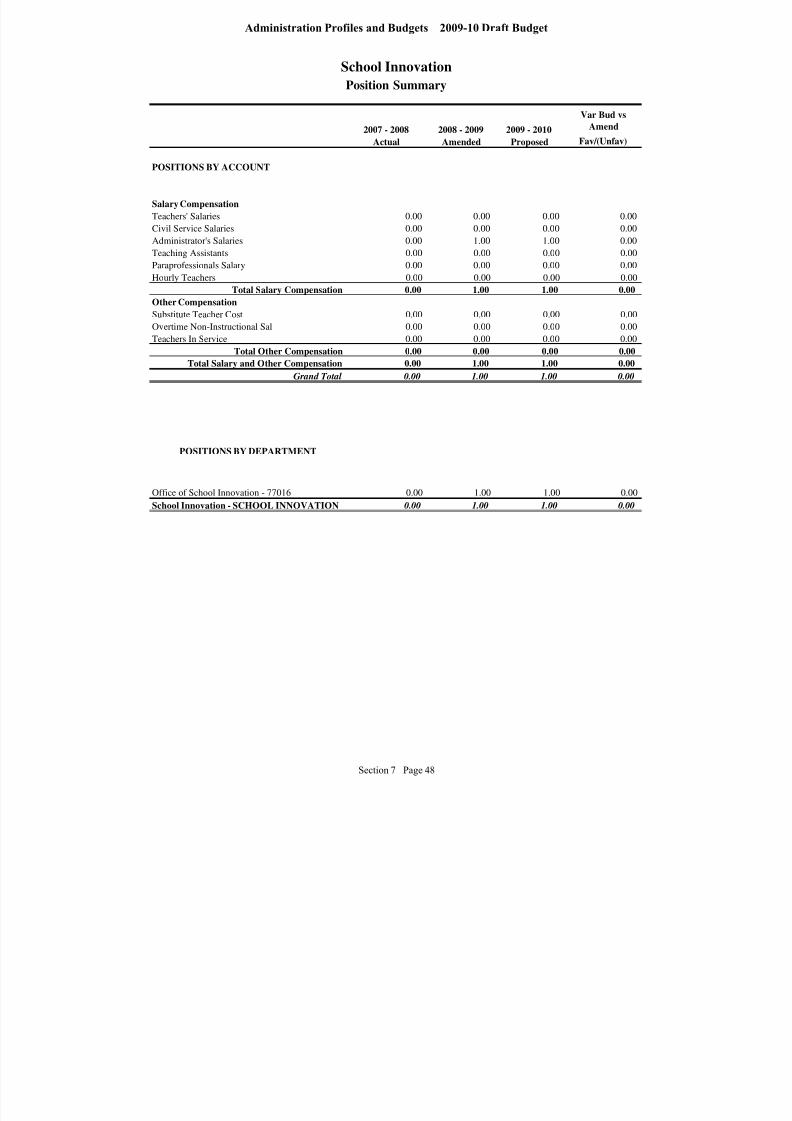
8/7/2019 2009_2010DRAFT
http://slidepdf.com/reader/full/20092010draft 250/268
School Innovation
2007 - 2008 2008 - 2009 2009 - 2010
Var Bud vs
Amend
Actual Amended Proposed Fav/(Unfav)
POSITIONS BY ACCOUNT
Salary Compensation
Teachers' Salaries 0.00 0.00 0.00 0.00
Civil Service Salaries 0.00 0.00 0.00 0.00
Administrator's Salaries 0.00 1.00 1.00 0.00
Teaching Assistants 0.00 0.00 0.00 0.00
Paraprofessionals Salary 0.00 0.00 0.00 0.00
Hourly Teachers 0.00 0.00 0.00 0.00
Total Salary Compensation 0.00 1.00 1.00 0.00
Other CompensationSubstitute Teacher Cost 0.00 0.00 0.00 0.00
Overtime Non-Instructional Sal 0.00 0.00 0.00 0.00
Teachers In Service 0.00 0.00 0.00 0.00
Total Other Compensation 0.00 0.00 0.00 0.00
Total Salary and Other Compensation 0.00 1.00 1.00 0.00
Grand Total 0.00 1.00 1.00 0.00
POSITIONS BY DEPARTMENT
Office of School Innovation - 77016 0.00 1.00 1.00 0.00
School Innovation - SCHOOL INNOVATION 0.00 1.00 1.00 0.00
Position Summary
Section 7 Page 48
Administration Profiles and Budgets 2009-10 Draft Budget
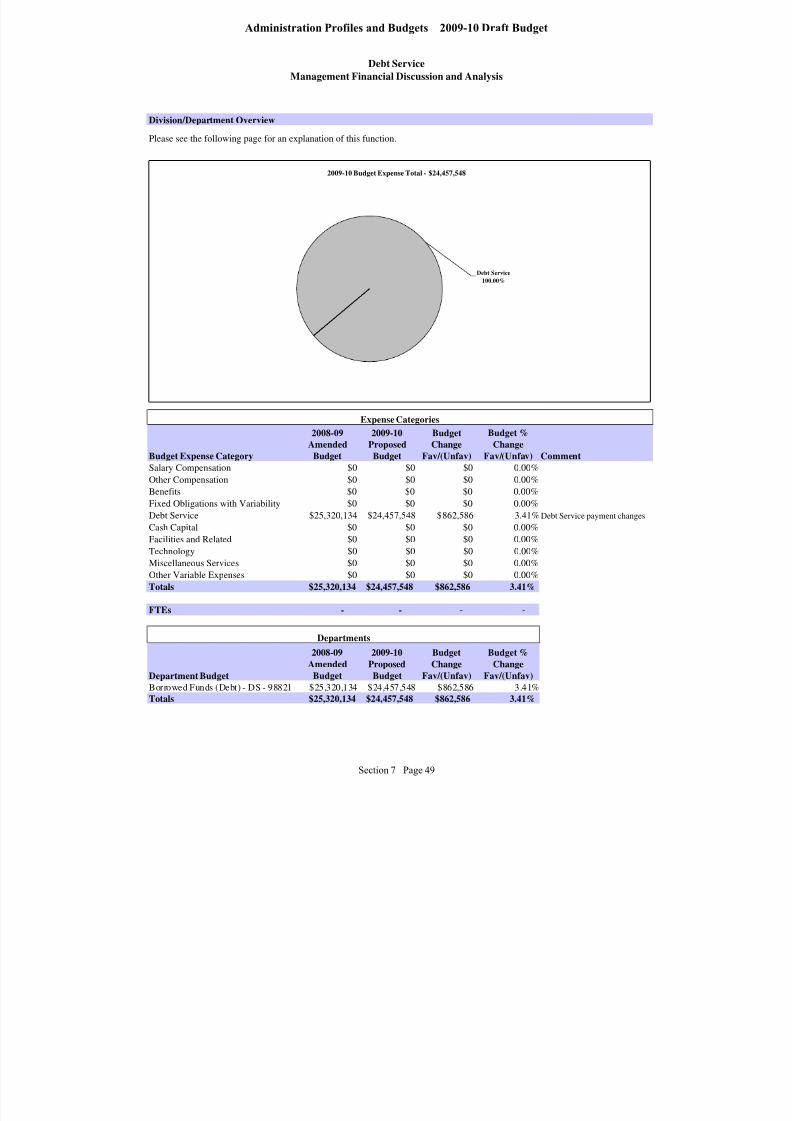
8/7/2019 2009_2010DRAFT
http://slidepdf.com/reader/full/20092010draft 251/268
Debt Service
Management Financial Discussion and Analysis
Division/Department Overview
Budget Expense Category
2008-09
Amended
Budget
2009-10
Proposed
Budget
Budget
Change
Fav/(Unfav)
Budget %
Change
Fav/(Unfav) CommentSalary Compensation $0 $0 $0 0.00%
Other Compensation $0 $0 $0 0.00%
Benefits $0 $0 $0 0.00%
Fixed Obligations with Variability $0 $0 $0 0.00%
Debt Service $25,320,134 $24,457,548 $862,586 3.41% Debt Service payment changes
Cash Capital $0 $0 $0 0.00%
Facilities and Related $0 $0 $0 0.00%
Technology $0 $0 $0 0.00%
Miscellaneous Services $0 $0 $0 0.00%
Other Variable Expenses $0 $0 $0 0.00%
Totals $25,320,134 $24,457,548 $862,586 3.41%
FTEs - - - -
Department Budget
2008-09
Amended
Budget
2009-10
Proposed
Budget
Budget
Change
Fav/(Unfav)
Budget %
Change
Fav/(Unfav)
Borrowed Funds (Debt) - DS - 98821 $25,320,134 $24,457,548 $862,586 3.41%
Totals $25,320,134 $24,457,548 $862,586 3.41%
Departments
Expense Categories
Please see the following page for an explanation of this function.
2009-10 Budget Expense Total - $24,457,548
Debt Service
100.00%
Section 7 Page 49
Administration Profiles and Budgets 2009-10 Draft Budget
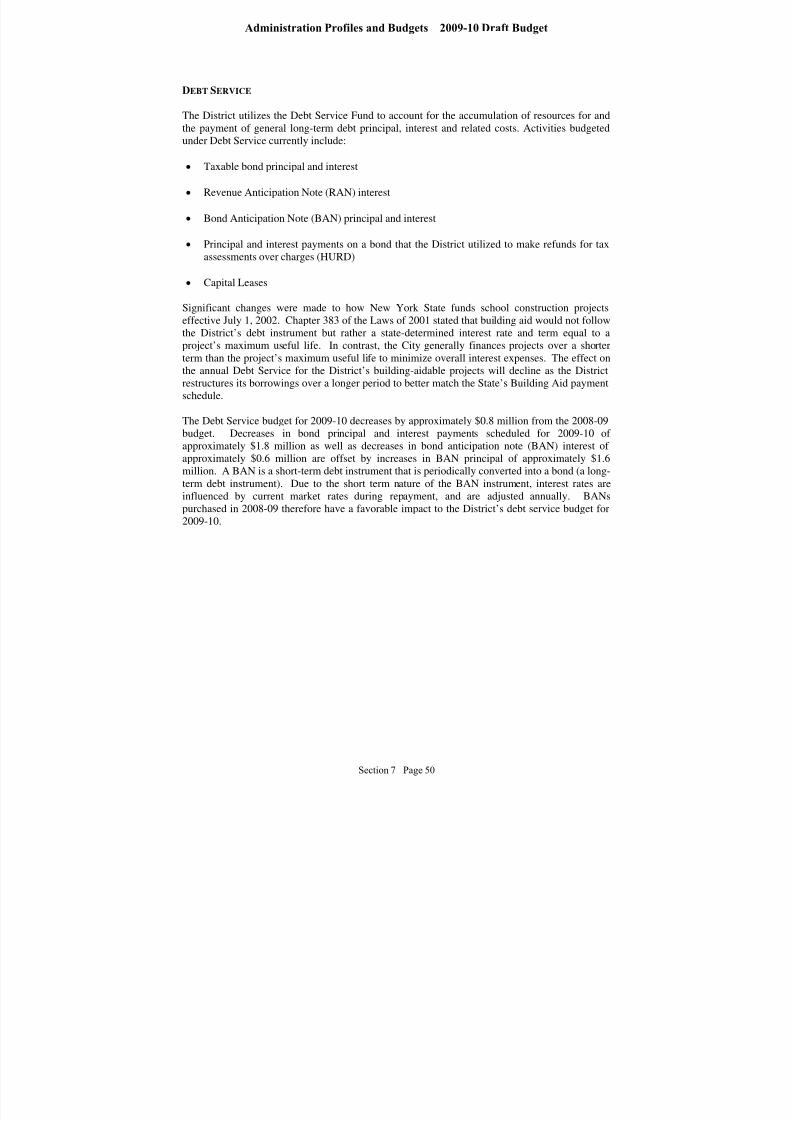
8/7/2019 2009_2010DRAFT
http://slidepdf.com/reader/full/20092010draft 252/268
DEBT SERVICE
The District utilizes the Debt Service Fund to account for the accumulation of resources for andthe payment of general long-term debt principal, interest and related costs. Activities budgetedunder Debt Service currently include:
Taxable bond principal and interest
Revenue Anticipation Note (RAN) interest
Bond Anticipation Note (BAN) principal and interest
Principal and interest payments on a bond that the District utilized to make refunds for taxassessments over charges (HURD)
Capital Leases
Significant changes were made to how New York State funds school construction projectseffective July 1, 2002. Chapter 383 of the Laws of 2001 stated that building aid would not followthe District’s debt instrument but rather a state-determined interest rate and term equal to aproject’s maximum useful life. In contrast, the City generally finances projects over a shorterterm than the project’s maximum useful life to minimize overall interest expenses. The effect onthe annual Debt Service for the District’s building-aidable projects will decline as the Districtrestructures its borrowings over a longer period to better match the State’s Building Aid paymentschedule.
The Debt Service budget for 2009-10 decreases by approximately $0.8 million from the 2008-09budget. Decreases in bond principal and interest payments scheduled for 2009-10 of approximately $1.8 million as well as decreases in bond anticipation note (BAN) interest of
approximately $0.6 million are offset by increases in BAN principal of approximately $1.6million. A BAN is a short-term debt instrument that is periodically converted into a bond (a long-term debt instrument). Due to the short term nature of the BAN instrument, interest rates areinfluenced by current market rates during repayment, and are adjusted annually. BANspurchased in 2008-09 therefore have a favorable impact to the District’s debt service budget for2009-10.
Section 7 Page 50
Administration Profiles and Budgets 2009-10 Draft Budget
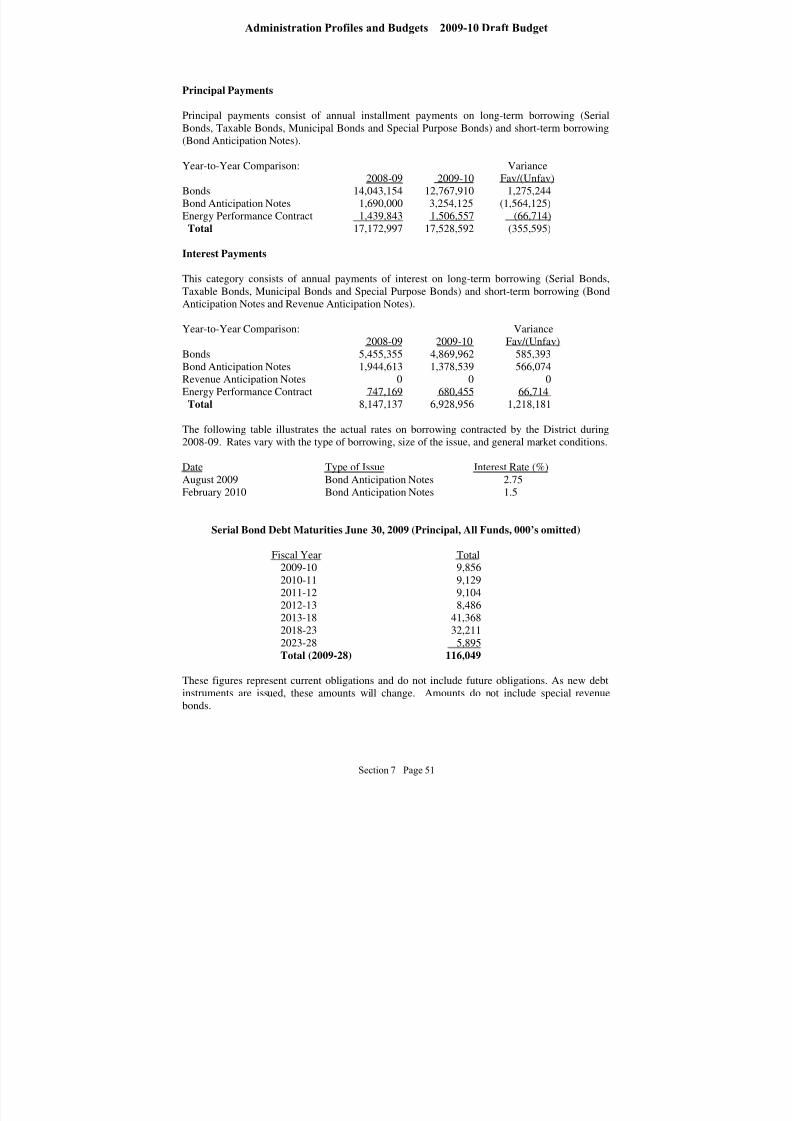
8/7/2019 2009_2010DRAFT
http://slidepdf.com/reader/full/20092010draft 253/268
Principal Payments
Principal payments consist of annual installment payments on long-term borrowing (SerialBonds, Taxable Bonds, Municipal Bonds and Special Purpose Bonds) and short-term borrowing(Bond Anticipation Notes).
Year-to-Year Comparison: Variance2008-09 2009-10 Fav/(Unfav)
Bonds 14,043,154 12,767,910 1,275,244Bond Anticipation Notes 1,690,000 3,254,125 (1,564,125)Energy Performance Contract 1,439,843 1,506,557 (66,714)Total 17,172,997 17,528,592 (355,595)
Interest Payments
This category consists of annual payments of interest on long-term borrowing (Serial Bonds,Taxable Bonds, Municipal Bonds and Special Purpose Bonds) and short-term borrowing (Bond
Anticipation Notes and Revenue Anticipation Notes).
Year-to-Year Comparison: Variance2008-09 2009-10 Fav/(Unfav)
Bonds 5,455,355 4,869,962 585,393 Bond Anticipation Notes 1,944,613 1,378,539 566,074 Revenue Anticipation Notes 0 0 0Energy Performance Contract 747,169 680,455 66,714 Total 8,147,137 6,928,956 1,218,181
The following table illustrates the actual rates on borrowing contracted by the District during2008-09. Rates vary with the type of borrowing, size of the issue, and general market conditions.
Date Type of Issue Interest Rate (%)August 2009 Bond Anticipation Notes 2.75February 2010 Bond Anticipation Notes 1.5
Serial Bond Debt Maturities June 30, 2009 (Principal, All Funds, 000’s omitted)
Fiscal Year Total2009-10 9,8562010-11 9,1292011-12 9,104
2012-13 8,4862013-18 41,3682018-23 32,2112023-28 5,895Total (2009-28) 116,049
These figures represent current obligations and do not include future obligations. As new debtinstruments are issued, these amounts will change. Amounts do not include special revenuebonds.
Section 7 Page 51
Administration Profiles and Budgets 2009-10 Draft Budget

8/7/2019 2009_2010DRAFT
http://slidepdf.com/reader/full/20092010draft 254/268
District-wide Non-program Expense
Management Financial Discussion and Analysis
Division/Department Overview
Budget Expense Category
2008-09
Amended
Budget
2009-10
Proposed
Budget
Budget
Change
Fav/(Unfav)
Budget %
Change
Fav/(Unfav) Comment
Salary Compensation ($6,751,484) $0 ($6,751,484) (100.00%) Vacancy savings reduction
Other Compensation $0 $0 $0 0.00%
Employee Benefits $174,474 $2,000,000 ($1,825,526) (1046.30%) Workers' Compensation Reserve
Fixed Obligation with Variability $13,882,457 $18,454,758 ($4,572,301) (32.94%) Charter School tuition increase
Debt Service $0 $0 $0 0.00%
Cash Capital Outlays $6,973,066 $6,115,000 $858,066 12.31% Capital project funding reduction
Facilities and Related $9,000 $9,000 $0 0.00%
Technology $0 $0 $0 0.00%
Miscellaneous Services $4,000 $30,000 ($26,000) (650.00%) Uncollectible invoice adjustment
Other Variable Expenses $5,993,981 $6,005,665 ($11,684) (0.19%)
Totals $20,285,494 $32,614,423 ($12,328,929) (60.78%)
FTEs - - - 0.00%
Department Budget
2008-09
Amended
Budget
2009-10
Proposed
Budget
Budget
Change
Fav/(Unfav)
Budget %
Change
Fav/(Unfav)
Charter School Tuition - FS - 55326 $13,312,457 $17,789,758 ($4,477,301) (33.63%)District-Wide Exp - DWNPE - 90519 ($4,003,010) $4,631,500 ($8,634,510) (215.70%)
Indirect Costs - DWNPE - 90719 $2,702,981 $2,698,165 $4,816 0.18%
Adjustment/Disallowances-DWNPE - 93 $1,300,000 $1,380,000 ($80,000) (6.15%)
Interfund Transfers-FA - 94015 $6,973,066 $6,115,000 $858,066 12.31%
Totals $20,285,494 $32,614,423 ($12,328,929) (60.78%)
Expense Categories
Departments
Please see the following page for an explanation of this function.
2009-10 Budget Expense Total - $32,614,423
Other Variable Expenses
18.41%
Miscellaneous Services0.09%
Cash Capital Outlays
18.75%
Fixed Obligation with Variability
56.58%
Employee Benefits
6.13%
Facilities and Related
0.03%
Section 7 Page 52
Administration Profiles and Budgets 2009-10 Draft Budget

8/7/2019 2009_2010DRAFT
http://slidepdf.com/reader/full/20092010draft 255/268
DISTRICT-WIDE NON-PROGRAM EXPENSE
The District-Wide Non-Program Expense cost center includes major expense budgets related to the
organization, but not directly tied to a specific program or department. Examples include: Charter
School tuition, indirect cost support for grants, funds to support the District’s long-term capital plan, and
grant disallowances.
Salary Compensation
The Non-Program Expenses salary budget includes staffing turnover and vacancy savings that occur
throughout the year. Savings through retirement incentives is included in this category.
Other Major Activities - budgeted under District-Wide Non-Program Expense include:
• Charter School Tuition - The District provides tuition to Charter Schools for Rochester City residents,
as stipulated by New York State law.
• Insurance Non-Employees - This budget covers Property and Liability Insurance, as well as SchoolBoard Liability Insurance.
• Cash Capital Expenditures - These expenditures are funded with cash rather than Debt Service. Under
Governmental Accounting Rules, the District must include Cash Capital as a single cost item in the
General Fund budget. In effect, it is treated as an inter-fund expense.
• Agency Clerical - This budget represents long-term temporary labor costs. Schools and Central Office
Departments are required to fund short-term temporary labor costs (up to 5 days) from their budgets.
Long-term vacancies are funded from a central budget.
• Judgments and Claims - These funds defray the costs of legal claims against the District that are not
covered by insurance.
• Grant Disallowances – This budget includes costs of programs accounted for in the Special Aid Fund
that are not reimbursed by the funding organization. This includes program costs, such as Pre-School
Special Education services, whose reimbursement rates are not sufficient to fully fund the program.
• Indirect Costs Grants - The District is allowed to charge overhead cost allocations to grants for
reimbursement purposes. These costs are not specifically identified. They are, instead, a percentage of
grant dollars to be used as an offset to District indirect expenditures. As these costs do not represent
offsets to specific expenditures they are included in the Non-Program Expense group.
Section 7 Page 53
Administration Profiles and Budgets 2009-10 Draft Budget

8/7/2019 2009_2010DRAFT
http://slidepdf.com/reader/full/20092010draft 256/268
Employee Benefits
Management Financial Discussion and Analysis
Division/Department Overview
Budget Expense Category
2008-09
Amended Budget
2009-10
Proposed Budget
Budget Change
Fav/(Unfav)
Budget %
Change
Fav/(Unfav) Comment
Salary Compensation $0 $812,894 ($812,894) 100.00%
Other Compensation $0 $0 $0 0.00%
Employee Benefits $38,989,428 $40,544,206 ($1,554,778) (3.99%) FICA & Unemployment increase
Health and Dental Insurance $61,889,427 $62,660,813 ($771,386) (1.25%) Increase offset by staff reduction
State Employee Retirement $5,455,406 $4,855,400 $600,006 11.00% ERS system rate reduction
State Teachers Retirement $21,284,545 $20,222,000 $1,062,545 4.99% TRS system rate reduction
Voluntary Separation Plan $210,000 $200,000 $10,000 4.76%
Fixed Obligations with Variability $0 $0 $0 0.00%
Debt Service $0 $0 $0 0.00%
Cash Capital $0 $0 $0 0.00%
Facilities and Related $30,000 $0 $30,000 100.00% Districtwide operating reduction
Technology $0 $0 $0 0.00%
Miscellaneous Services $35,000 $16,000 $19,000 54.29% Anticipated reduction in physicals
Other Variable Expenses $201,500 $192,000 $9,500 4.71%
Totals $128,095,306 $129,503,313 ($1,408,007) (1.10%)
FTEs 20.08 20.08 - 0.00%
Department Budget
2008-09
Amended Budget
2009-10
Proposed Budget
Budget Change
Fav/(Unfav)
Budget %
Change
Fav/(Unfav)
Employment Benefits - EB - 90120 $128,095,306 $129,503,313 ($1,408,007) (1.10%)
Totals $128,095,306 $129,503,313 ($1,408,007) (1.10%)
Expense Categories
Departments
Please see the following page for an explanation of this function.
2009-10 Budget Expense Total - $129,503,313
Other Variable Expenses0.15%
Miscellaneous Services
0.01%
Salary Compensation
0.63%
Health and Dental Insurance
48.39%
Employee Benefits
31.31%
State Employee Retirement
3.75%
State Teachers Retirement
15.62%
Voluntary Separation Plan
0.15%
Section 7 Page 54
Administration Profiles and Budgets 2009-10 Draft Budget

8/7/2019 2009_2010DRAFT
http://slidepdf.com/reader/full/20092010draft 257/268
EMPLOYEE BENEFITS
The District provides employee benefits based on collective bargaining agreements and New
York State (NYS) Labor Laws. The expenditures in this area cover health insurance, retirement
plans, Social Security, illness leave, and other insurance and contractual benefits.
Health and Dental Group Insurance Plans – The District provides health insurancecoverage to active employees and retirees with active employees and some retirees
also participating in dental plans.
Retirement Plans – This budget provides contributions to the NYS Teachers
Retirement System and the NYS Employees’ Retirement System for active
employees. The New York State Comptroller determines the employer rate of
contribution required each year to maintain the fiscal integrity of the plans based
upon actuarial cost projections, employer and employee contributions and
anticipated retirement fund investment earnings.
Social Security – The Federal Insurance Contribution Act (FICA) requires
employers and employees to contribute 6.2% of salary towards retirement, and anadditional 1.45% towards Medicare.
Unemployment Insurance – The District is self-insured for unemployment and
provides a quarterly payment to the NYS Unemployment Office based on actual
claims paid.
Workers Compensation – The District is self-insured, and utilizes an independent
organization to manage the health claims of its employees.
Employee Assistance Program – The District provides counseling services
accessible to all employees and their families.
Life and Disability Insurance – These funds cover insurance policies available to
employees under negotiated agreements.
Paid Illness Leave – The Districts’ employees are provided long term illness benefits
for unexpected additional health care needs.
Flexible Spending Accounts (Section 125 Plans) and Medical Reimbursement
Accounts (Section 105 Plans) – FSAs and MRAs are tax-advantaged financial
accounts that allow the employee to set aside a portion of their pre-tax earnings tocover dependent or medical expenses.
Other Contractual Benefits – Additional benefits include early retirement and attendanceincentives.
Section 7 Page 55
Administration Profiles and Budgets 2009-10 Draft Budget

8/7/2019 2009_2010DRAFT
http://slidepdf.com/reader/full/20092010draft 258/268
THIS PAGE INTENTIONALLY LEFT BLANK
Section 7 Page 56
Administration Profiles and Budgets 2009-10 Draft Budget

8/7/2019 2009_2010DRAFT
http://slidepdf.com/reader/full/20092010draft 259/268
a PPendIces
A – How to Read a BudgetB – Budget Development ProcessC – Glossary D – District Report Card

8/7/2019 2009_2010DRAFT
http://slidepdf.com/reader/full/20092010draft 260/268
THIS PAGE INTENTIONALLY LEFT BLANK
Section 8 Page 2
Appendices 2009-10 Draft Budget

8/7/2019 2009_2010DRAFT
http://slidepdf.com/reader/full/20092010draft 261/268
HOW TO READ A BUDGET
As part of the Rochester City School District’s financial redesign, we are presenting our recentlyimproved budget book and District profile. This presentation is to provide users of the book with
a transparent, user-friendly format of the District’s financial condition. The 2009-10 Budget
Book provides the reader with an understanding of the District’s policies and plans, schools and
programs, and overall operations. You will see that the main focus is on the schools of theDistrict, their students and the programs that support the achievement of our students.
The financial information of the District is based on our fiscal year, which runs from July 1st
through June 30th. Budget presentation includes two fiscal years. The current year is shown for
comparative purposes. You will see the amended and the projected for the fiscal year of July 1,
2008 through June 30, 2009. Projected current budget is based on the most current knowledge
and carried forward to June 30, 2009. Proposed budget is the projection for the fiscal year ending
June 30, 2010. The numbers used for the proposed budget are also based on the most current
knowledge known by the District at the time of this presentation.
Book Organization
The budget book is divided into sections in order to facilitate the reader’s use. A Table of
Contents is provided as a roadmap to the information. The first several sections of the book will
provide you with basic information concerning the District as a whole. Documents are provided
to explain the priorities of the District through the guidance of the Superintendent, an Executive
Budget Summary, Mission and Vision, Student Achievement, Enrollment and Collective
Bargaining overviews. Information is given for all revenue sources as well as the breakdown of
expenditures by major category. A multi-year projection is also provided for your information.
The next section will provide you with information concerning the various zones of the District
and the schools within that zone. Information is provided for all schools, then by zone and lastly,
by each school. This is the first year in presenting information for each individual school. The
school page will provide you with information concerning the mission of the school, teacher andstaff breakdown, student enrollment, demographics of the student population, revenue resources,
expenditures, and the achievement metrics of the school. It will also provide you with
information concerning the location of the school, School Accountability Status, and contact
information of the principal at the time of this presentation.
Following the school section will be sections related to the other areas of the District. Sections
closely related to the support of the schools will be presented first, followed by the areas within
Central Office. Each section will provide you with an overview of the expenditures of the area
including full-time equivalents (FTE).
Presentations and explanations of programs and departments are brief and meant to provide a
concise overview of the area. Additional information may be found on our website or bycontacting the District’s Communication Department.
This budget publication is available in several different formats:
PDF format may be found on the website at www.rcsdk12.org
Printed version may be reviewed at the District office located at:
131 West Broad St, Rochester, NY 14614
CD or printed version may be requested by contacting the District’s Communication
Department at 585-262-8363.
Section 8 Page 3
Appendices 2009-10 Draft Budget

8/7/2019 2009_2010DRAFT
http://slidepdf.com/reader/full/20092010draft 262/268
BUDGET DEVELOPMENT PROCESS
The budget development process is a collaborative process involving the Superintendent, Cabinet,
Grant Monitors, Department Leaders, Principals, Community and the Board of Education. The
budget serves as an operational plan, stated in financial terms, for carrying out the needs of our
students, then to align our fiscal and human resources to meet those needs.
As part of our financial redesign, the timeline has been restructured for the 2010-2011 budgetprocess. This new timeline is reflected below. Although the same process was used for the
development of the 2009-10 proposed budget, it was completed in a condensed timeframe. The
process timeline was reduced due to the uncertainties of the Governor’s Proposed Budget. The
process was delayed in hopes of gaining a better understanding of projected cuts from the State
funding and possible support from a Federal Stimulus package.
The 2010-11 budget preparation cycle will begin in October and continue through June with the
approval of the budget by the City of Rochester. When this cycle begins in October, the District is
actually working in three different budget years. The three years include the closing of the prior
year (2008-09), execution of actual year (2009-10), and the planning for the following year
(2010-11). The Budget Department will work with Cabinet, schools, and program administrators
to determine enrollment projections and anticipated programmatic changes to start the planning.
OCT NOV DEC JAN FEB MAR APR MAY JUN JUL AUG
Develop, review and revise resource and appropriation estimates
Review program metrics Review program metrics Review program metrics Review program metrics
Review budget allocation formula
Revenue assumptions and projections
Conduct Budget Training classes for Schools and Central Office departments
Schools and Central Office develop their proposed Budgets and Academic Plans
Analysis of Budgets with Schools and departments
Budget refinement for Draft presentation
Draft presentation to Board
Public process for C4E
Board of Education Adopts Budget
City of Rochester Approves Budget
Budget posted to District Website
Section 8 Page 4
Appendices 2009-10 Draft Budget
8/7/2019 2009_2010DRAFT
http://slidepdf.com/reader/full/20092010draft 263/268
Legal Guidelines
New York State Education Law Section 2576(2) requires that the District file an estimated budget
with the Mayor of Rochester. The District’s budget is then evaluated and dealt with in a similar
manner to estimates from other city departments. The Charter and Code of the City of Rochester,
v20, updated on November 1, 2008 states that no later than thirty-three calendar days prior to thelast regularly scheduled city council meeting of June in each year that the Board of Education
shall submit to the Mayor a budget estimate for the ensuing fiscal year. The classification of the
estimates for the various operating units of the District shall be as uniform as possible, and,
consistent with the Mayor’s budget estimate.
Additional Board of Education policies state that a public hearing on the Superintendent’s
proposed budget will be held during the month of April. This hearing will be held at a facility
designated by the Clerk of the Board. The purpose of this hearing is to provide the Community
with an opportunity to express their interests and concerns on the Superintendent’s proposed
budget to the Board prior to the Board’s deliberations, final decisions, and subsequent adoption of
the budget that the District will operate under for the upcoming fiscal year. The Board will adopt
the budget proposal for the coming fiscal year at a Special Meeting of the Board of Education tendays prior to the deadline for the submission to the City of Rochester.
Devolvement of Budgets to Schools
As part of the multi-year financial redesign, school principals will continue to have increased
control over their resources. During the 2009-10 fiscal year, the District Office will provide
principals with training to increase their knowledge and skills in working with devolved
resources. Principals will be trained on the impact of collective bargaining, federal and state
restrictions concerning funding and instruction, and education to better understand the
requirements in developing and maintaining their individual school budgets. The devolvement of
certain resources will allow principals to better meet the core values of achievement, equity and
accountability for their staff and students. Each year more resources will be devolved to theschools. This year the resources for Extended Day programs and certain specialists were moved
to the schools.
District Office
Although school based resources will be given to the schools to control and align with their
student needs over the next few years, certain resources that support all schools will remain under
the control of the District Office. Decisions on school or District resource control will be
evaluated based on the several factors including central office functions, consistency of service,
service predictability, required input/out, and economies of scale. Examples of District
management might include payroll, District textbook adoptions, capital equipment replacement,
transportation, or special education services.
Upon adoption of the Superintendent’s budget each office department and school will be given a
budget workbook that will contain their specific allocations. The workbook will contain any
additions or deletions made to their proposed budget as presented in March. The budget office
will continue to work with school principals to assist in the preparation of their budgets and as
support in tracking and analysis throughout the year.
Section 8 Page 5
Appendices 2009-10 Draft Budget
8/7/2019 2009_2010DRAFT
http://slidepdf.com/reader/full/20092010draft 264/268
GLOSSARY
Accrual Basis of Accounting
The accounting policies of the Rochester City School District conform to generally accepted
accounting principles. The basis of accounting is the modified accrual method, wherein revenues
are recognized in the period in which they become available and measurable and expenditures are
recognized at the time a liability is incurred, except for principal and interest on long-term debt,which are recorded when due.
Actuals
The amount the District has spent in a given period as opposed to original budget estimates.
Advanced Placement (AP)
A program developed by College Board that offers college level courses and end-of-course exams
to high school students.
Advancement Via Individual Determination (AVID)
AVID provides secondary students with the skills, support and expectations necessary to succeed
in college-preparatory classes and to enter four-year colleges.
Amended Budget
The original budget with adjustments which have been adopted by the Board of Education.
Adopted Budget
The annual financial plan, listing estimated revenues and expenditures for a fiscal year, and is
formally adopted by the Board of Education. Before the budget is adopted, it is known as the
Proposed Budget.
Appropriation
An authorization to expend funds for stated purposes.
Assessment
Each year, the District assesses student performance for identifying areas to target for
improvement. The assessment is the cornerstone for the District’s planning process and the
development and implementation of initiatives.
Attrition
The difference between actual expenditure requirements for personnel resources and expenditure
requirements that would be required if all positions were filled at all times. The attrition factor
accounts for position vacancies, which result from routine employee turnover.
Average Daily Attendance (ADA)
The total days of attendance for a period divided by the number of days in which school is insession.
Balanced Budget
A budget in which income/revenues equal expenses.
Bilingual Education
Programs designed to help students who have limited English proficiency.
Section 8 Page 6
Appendices 2009-10 Draft Budget
8/7/2019 2009_2010DRAFT
http://slidepdf.com/reader/full/20092010draft 265/268
Bond Anticipation Note
A note which may be redeemed using the proceeds from the future sale of a serial bond. A note
is a short-term borrowing instrument, usually requiring repayment within one year of issuance.
Budget Amendment
A formal action by the Board of Education to adjust the budget after it has been adopted.
Cash Capital The cash capital expenditures are for the purchase of equipment, textbooks, library books, and
building renovations. Cash capital appropriations exclude those renovation projects that require
the use of borrowing. The cash capital expenditures are distributed in each program and
departmental budget.
Career Technical Education (CTE)
A program of study involving a multiyear sequence of courses that integrates core academic
knowledge with technical and occupational knowledge to provide students with a pathway to
postsecondary education and careers.
Categorical Grants/Funds
Funds the District receives from another entity earmarked for use exclusively for specific
programs, such as Special Education, or activities such as transportation. Categorical funds are
also referred to as restricted funds because they cannot be used for purposes other than to cover
the expenses of a specific program/activity set by the funding agency.
Certificated Employee
A District employee whose position requires certification by the State of New York. Teachers
and most administrators must meet New York requirements for certification issued by the State
Commission on Teacher Credentialing. Teachers operating under an emergency permit are
included in this category. Examples of staff that are credentialed for a specific function include
teachers, counselors, psychologists, social workers, librarians, principals and assistant principals,certificated central office managers, resource teachers, content administrators and peer coach/staff
developers.
Choice
RCSD offers students an opportunity to attend a school that is not their neighborhood school.
Debt Service
The repayment of debt, including interest payments and installments on the principal.
Deficit
The amount by which expenses exceed revenues in a fiscal year.
Departmental Credits A charge from one department to another for services rendered (e.g. printing, rental costs and
automotive repairs).
Section 8 Page 7
Appendices 2009-10 Draft Budget

8/7/2019 2009_2010DRAFT
http://slidepdf.com/reader/full/20092010draft 266/268
Employee Benefits
The direct expenditures, other than salaries, associated with employee compensation. In the
budget, employee benefits are not distributed by programs or departments. Benefits includeretirement system contributions, social security contributions, medical and dental insurance,
workers’ compensation, unemployment payments and life insurance.
EnrollmentThe total number of students enrolled, whether resident or non-resident, at a site or home-bound
or in a qualifying alternative program. Enrollment is not the same as Average Daily Attendance
(ADA). Enrollment will exceed ADA, since not every student achieves perfect attendance.
3p4.7347_
Fiscal Year
RCSD operates on a fiscal year beginning on July 1st and ending on June 30th.
Full-Time Equivalent (FTE)
Classified employees who work an average of 35-40 hours per week are categorized as 1.0 FTE.
For example, an employee who works 20 hours per week is counted as 0.5 FTE.
Generally Accepted Accounting Principles (GAAP)Accounting standards such as conventions, broad guidelines, rules, procedures and detailed
practices that pertain to universally accepted financial accounting and reporting practices.
Government Accounting Standards Board (GASB)
A federal organization that promulgates standards of financial accounting and reporting with
respect to state and local government entities.
Government Finance Officers Association (GFOA)
A national association whose purpose is to enhance and promote the professional management of
governments for the public benefit by identifying and developing financial policies and practices
and promoting them through education, training and leadership. The GFAO rates outstanding
budget documents according to highly specific criteria, honoring organizations who meet thesecriteria with the annual GFOA Distinguished Budget Presentation Award.
Grant Maximization
Full utilization of grant funding, including budget transfers, permissible by law, mandate, and in
compliance with grant regulations.
Individualized Education Program (IEP)
Individual Education Program designed for students with special needs.
Mentor Teachers
Specially selected teachers who receive a stipend to work with inexperienced teachers on
improving curriculum and instruction practices.
Section 8 Page 8
Appendices 2009-10 Draft Budget
8/7/2019 2009_2010DRAFT
http://slidepdf.com/reader/full/20092010draft 267/268
No Child Left Behind (NCLB) Act
The No Child Left Behind Act of 2001 became law in January 2002, effecting extensive changes
to the Elementary and Secondary Education Act of 1965. Under NCLB: 1. All states and schooldistricts are required to develop accountability systems based on student performance and to test
students in grades 3-8 on reading, math and (eventually) science 2. Every school is expected to
make Adequate Yearly Progress (AYP) in meeting state standards 3. Parents of children in failing
schools are allowed to transfer the child to a better performing school. The law also gives statesand school districts increased local control and flexibility in the use of federal education funds.
Performance Indicators
Measures of performance because of a specific activity, program initiative or service rendered.
Program Based Budgeting
Program Based Budgeting (PBB) is a program-based format that supplements the traditional
Budget Book report format. PBB is a format that links programs to the Board of
Education/Superintendent goals and objectives and provides measures of achievements to
evaluate the program. This information supplements the traditional program narrative and
financial information.
Program Initiatives
Based on an assessment, program initiatives are developed to target resources for addressing
specific problems related to student performance, attainment, attendance, and behavior.
Revenue Anticipation Note (RAN)
A RAN is a short-term borrowing instrument issued in anticipation of a known and quantifiable
future revenue source (i.e., a RAN may be issued in anticipation of the collection of revenue
sources later in the fiscal year).
Schools
Most Rochester schools fall into one of the following categories:
Elementary School Grades (Pre-) K-6High School Grades 7-12
Special Education
A category of programs that deliver educational services to students with diverse special needs.
State Aid
The primary type of State Aid is provided through Foundation Aid, which can be used for any
purpose or program.
Title I
This federal program provides funds for educationally disadvantaged (low-income) students. Title
I monies are intended to supplement state and District funds, with schools involving parents indeciding and monitoring how funds are spent. Title I is the largest federal program included in the
No Child Left Behind (NCLB) Act.
Section 8 Page 9
Appendices 2009-10 Draft Budget

8/7/2019 2009_2010DRAFT
http://slidepdf.com/reader/full/20092010draft 268/268
ABBREVIATIONS
The following are abbreviations that you may encounter in our budget presentation. You may
find additional information in the Glossary for some of the abbreviations.
Appendices 2009-10 Draft Budget


