2009.11.17- SLIDE 1IS 257 – Fall 2009 Data Mining and the Weka Toolkit University of California,...
34
IS 257 – Fall 2009 2009.11.17- SLIDE 1 Data Mining and the Weka Toolkit University of California, Berkeley School of Information IS 257: Database Management
-
date post
19-Dec-2015 -
Category
Documents
-
view
218 -
download
2
Transcript of 2009.11.17- SLIDE 1IS 257 – Fall 2009 Data Mining and the Weka Toolkit University of California,...

IS 257 – Fall 2009 2009.11.17- SLIDE 1
Data Mining and the Weka Toolkit
University of California, Berkeley
School of Information
IS 257: Database Management

IS 257 – Fall 2009 2009.11.17- SLIDE 2
Lecture Outline
• Final Reports and Presentations• Review
– Data Warehouses• (Based on lecture notes from Joachim Hammer, University of
Florida, and Joe Hellerstein and Mike Stonebraker of UCB)
• Applications for Data Warehouses– Decision Support Systems (DSS)– OLAP (ROLAP, MOLAP)– Data Mining
• Thanks again to lecture notes from Joachim Hammer of the University of Florida

IS 257 – Fall 2009 2009.11.17- SLIDE 3
Final project
• Final project is the completed version of your personal project with an enhanced version of Assignment 4
• AND an in-class presentation on the database design and interface
• Detailed description and elements to be considered in grading are available by following the links on the Assignments page or the main page of the class site

IS 257 – Fall 2009 2009.11.17- SLIDE 4
Knowledge Discovery in Data (KDD)
• Knowledge Discovery in Data is the non-trivial process of identifying – valid– novel– potentially useful– and ultimately understandable patterns in
data.• from Advances in Knowledge Discovery and Data
Mining, Fayyad, Piatetsky-Shapiro, Smyth, and Uthurusamy, (Chapter 1), AAAI/MIT Press 1996
Source: Gregory Piatetsky-Shapiro

IS 257 – Fall 2009 2009.11.17- SLIDE 5
Related Fields
Statistics
MachineLearning
Databases
Visualization
Data Mining and Knowledge Discovery
Source: Gregory Piatetsky-Shapiro

IS 257 – Fall 2009 2009.11.17- SLIDE 6
______
______
______
Transformed Data
Patternsand
Rules
Target Data
RawData
KnowledgeData MiningTransformation
Interpretation& Evaluation
Selection& Cleaning
Integration
Understanding
Knowledge Discovery Process
DATAWarehouse
Knowledge
Source: Gregory Piatetsky-Shapiro

IS 257 – Fall 2009 2009.11.17- SLIDE 7
OLAP
• Online Line Analytical Processing– Intended to provide multidimensional views of
the data– I.e., the “Data Cube”– The PivotTables in MS Excel are examples of
OLAP tools

IS 257 – Fall 2009 2009.11.17- SLIDE 8
Data Cube

IS 257 – Fall 2009 2009.11.17- SLIDE 9
Phases in the DM Process: CRISP-DM
Source: Laura Squier

IS 257 – Fall 2009 2009.11.17- SLIDE 10
BusinessUnderstanding
DataUnderstanding
EvaluationDataPreparation
Modeling
Determine Business ObjectivesBackgroundBusiness ObjectivesBusiness Success Criteria
Situation AssessmentInventory of ResourcesRequirements, Assumptions, and ConstraintsRisks and ContingenciesTerminologyCosts and Benefits
Determine Data Mining GoalData Mining GoalsData Mining Success Criteria
Produce Project PlanProject PlanInitial Asessment of Tools and Techniques
Collect Initial DataInitial Data Collection Report
Describe DataData Description Report
Explore DataData Exploration Report
Verify Data Quality Data Quality Report
Data SetData Set Description
Select Data Rationale for Inclusion / Exclusion
Clean Data Data Cleaning Report
Construct DataDerived AttributesGenerated Records
Integrate DataMerged Data
Format DataReformatted Data
Select Modeling TechniqueModeling TechniqueModeling Assumptions
Generate Test DesignTest Design
Build ModelParameter SettingsModelsModel Description
Assess ModelModel AssessmentRevised Parameter Settings
Evaluate ResultsAssessment of Data Mining Results w.r.t. Business Success CriteriaApproved Models
Review ProcessReview of Process
Determine Next StepsList of Possible ActionsDecision
Plan DeploymentDeployment Plan
Plan Monitoring and MaintenanceMonitoring and Maintenance Plan
Produce Final ReportFinal ReportFinal Presentation
Review ProjectExperience Documentation
Deployment
Phases and TasksPhases and Tasks
Source: Laura Squier

IS 257 – Fall 2009 2009.11.17- SLIDE 11
Phases in CRISP
• Business Understanding– This initial phase focuses on understanding the project objectives and requirements from a business perspective, and then
converting this knowledge into a data mining problem definition, and a preliminary plan designed to achieve the objectives.
• Data Understanding– The data understanding phase starts with an initial data collection and proceeds with activities in order to get familiar with the data,
to identify data quality problems, to discover first insights into the data, or to detect interesting subsets to form hypotheses for hidden information.
• Data Preparation– The data preparation phase covers all activities to construct the final dataset (data that will be fed into the modeling tool(s)) from
the initial raw data. Data preparation tasks are likely to be performed multiple times, and not in any prescribed order. Tasks include table, record, and attribute selection as well as transformation and cleaning of data for modeling tools.
• Modeling– In this phase, various modeling techniques are selected and applied, and their parameters are calibrated to optimal values.
Typically, there are several techniques for the same data mining problem type. Some techniques have specific requirements on the form of data. Therefore, stepping back to the data preparation phase is often needed.
• Evaluation– At this stage in the project you have built a model (or models) that appears to have high quality, from a data analysis perspective.
Before proceeding to final deployment of the model, it is important to more thoroughly evaluate the model, and review the steps executed to construct the model, to be certain it properly achieves the business objectives. A key objective is to determine if there is some important business issue that has not been sufficiently considered. At the end of this phase, a decision on the use of the data mining results should be reached.
• Deployment– Creation of the model is generally not the end of the project. Even if the purpose of the model is to increase knowledge of the data,
the knowledge gained will need to be organized and presented in a way that the customer can use it. Depending on the requirements, the deployment phase can be as simple as generating a report or as complex as implementing a repeatable data mining process. In many cases it will be the customer, not the data analyst, who will carry out the deployment steps. However, even if the analyst will not carry out the deployment effort it is important for the customer to understand up front what actions will need to be carried out in order to actually make use of the created models.

IS 257 – Fall 2009 2009.11.17- SLIDE 12
Data Mining Algorithms
• Market Basket Analysis
• Memory-based reasoning
• Cluster detection
• Link analysis
• Decision trees and rule induction algorithms
• Neural Networks
• Genetic algorithms

IS 257 – Fall 2009 2009.11.17- SLIDE 13
Market Basket Analysis
• A type of clustering used to predict purchase patterns.
• Identify the products likely to be purchased in conjunction with other products– E.g., the famous (and apocryphal) story that
men who buy diapers on Friday nights also buy beer.

IS 257 – Fall 2009 2009.11.17- SLIDE 14
Memory-based reasoning
• Use known instances of a model to make predictions about unknown instances.
• Could be used for sales forecasting or fraud detection by working from known cases to predict new cases

IS 257 – Fall 2009 2009.11.17- SLIDE 15
Cluster detection
• Finds data records that are similar to each other.
• K-nearest neighbors (where K represents the mathematical distance to the nearest similar record) is an example of one clustering algorithm

IS 257 – Fall 2009 2009.11.17- SLIDE 16
Kohonen Network
• Description
• unsupervised
• seeks to describe dataset in terms of natural clusters of cases
Source: Laura Squier

IS 257 – Fall 2009 2009.11.17- SLIDE 17
Link analysis
• Follows relationships between records to discover patterns
• Link analysis can provide the basis for various affinity marketing programs
• Similar to Markov transition analysis methods where probabilities are calculated for each observed transition.
IS 257 – Fall 2009 2009.11.17- SLIDE 18
Decision trees and rule induction algorithms
• Pulls rules out of a mass of data using classification and regression trees (CART) or Chi-Square automatic interaction detectors (CHAID)
• These algorithms produce explicit rules, which make understanding the results simpler

IS 257 – Fall 2009 2009.11.17- SLIDE 19
Rule Induction
• Description– Produces decision trees:
• income < $40K– job > 5 yrs then good risk– job < 5 yrs then bad risk
• income > $40K– high debt then bad risk– low debt then good risk
– Or Rule Sets:• Rule #1 for good risk:
– if income > $40K
– if low debt
• Rule #2 for good risk:– if income < $40K
– if job > 5 years
Cat. % nBad 52.01 168
Good 47.99 155Total (100.00) 323
Credit ranking (1=default)
Cat. % nBad 86.67 143
Good 13.33 22Total (51.08) 165
Paid Weekly/MonthlyP-value=0.0000, Chi-square=179.6665, df=1
Weekly pay
Cat. % nBad 15.82 25Good 84.18 133Total (48.92) 158
Monthly salary
Cat. % nBad 90.51 143
Good 9.49 15Total (48.92) 158
Age CategoricalP-value=0.0000, Chi-square=30.1113, df=1
Young (< 25);Middle (25-35)
Cat. % nBad 0.00 0Good 100.00 7Total (2.17) 7
Old ( > 35)
Cat. % nBad 48.98 24Good 51.02 25Total (15.17) 49
Age CategoricalP-value=0.0000, Chi-square=58.7255, df=1
Young (< 25)
Cat. % nBad 0.92 1Good 99.08 108Total (33.75) 109
Middle (25-35);Old ( > 35)
Cat. % nBad 0.00 0Good 100.00 8Total (2.48) 8
Social ClassP-value=0.0016, Chi-square=12.0388, df=1
Management;Clerical
Cat. % nBad 58.54 24
Good 41.46 17Total (12.69) 41
Professional
Source: Laura Squier

IS 257 – Fall 2009 2009.11.17- SLIDE 20
Rule Induction
• Description
• Intuitive output
• Handles all forms of numeric data, as well as non-numeric (symbolic) data
• C5 Algorithm a special case of rule induction
• Target variable must be symbolic
Source: Laura Squier

IS 257 – Fall 2009 2009.11.17- SLIDE 21
Apriori
• Description
• Seeks association rules in dataset
• ‘Market basket’ analysis
• Sequence discovery
Source: Laura Squier

IS 257 – Fall 2009 2009.11.17- SLIDE 22
Neural Networks
• Attempt to model neurons in the brain
• Learn from a training set and then can be used to detect patterns inherent in that training set
• Neural nets are effective when the data is shapeless and lacking any apparent patterns
• May be hard to understand results

IS 257 – Fall 2009 2009.11.17- SLIDE 23
Neural Network
Output
Hidden layer
Input layer
Source: Laura Squier

IS 257 – Fall 2009 2009.11.17- SLIDE 24
Neural Networks
• Description– Difficult interpretation– Tends to ‘overfit’ the training data– Extensive amount of training time– A lot of data preparation– Works with all data types
Source: Laura Squier
IS 257 – Fall 2009 2009.11.17- SLIDE 25
Genetic algorithms
• Imitate natural selection processes to evolve models using– Selection– Crossover– Mutation
• Each new generation inherits traits from the previous ones until only the most predictive survive.
IS 257 – Fall 2009 2009.11.17- SLIDE 26
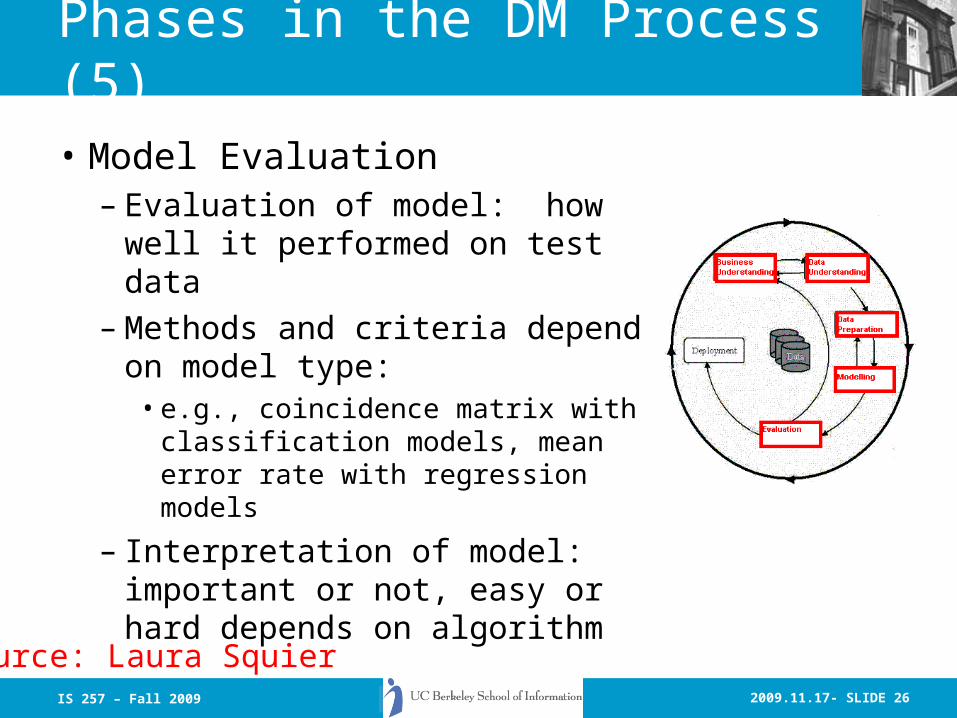
Phases in the DM Process (5)
• Model Evaluation– Evaluation of model: how well it
performed on test data– Methods and criteria depend on
model type:• e.g., coincidence matrix with
classification models, mean error rate with regression models
– Interpretation of model: important or not, easy or hard depends on algorithm
Source: Laura Squier

IS 257 – Fall 2009 2009.11.17- SLIDE 27
Phases in the DM Process (6)
• Deployment– Determine how the results need to be utilized– Who needs to use them?– How often do they need to be used
• Deploy Data Mining results by:– Scoring a database– Utilizing results as business rules– interactive scoring on-line
Source: Laura Squier

IS 257 – Fall 2009 2009.11.17- SLIDE 28
What data mining has done for...
Scheduled its workforce to provide faster, more accurate
answers to questions.
The US Internal Revenue Service needed to improve customer
service and...
Source: Laura Squier

IS 257 – Fall 2009 2009.11.17- SLIDE 29
What data mining has done for...
analyzed suspects’ cell phone usage to focus investigations.
The US Drug Enforcement Agency needed to be more effective in their drug “busts” and
Source: Laura Squier

IS 257 – Fall 2009 2009.11.17- SLIDE 30
What data mining has done for...
Reduced direct mail costs by 30% while garnering 95% of the
campaign’s revenue.
HSBC need to cross-sell more effectively by identifying profiles that would be interested in higheryielding investments and...
Source: Laura Squier

IS 257 – Fall 2009 2009.11.17- SLIDE 31
Analytic technology can be effective
• Combining multiple models and link analysis can reduce false positives
• Today there are millions of false positives with manual analysis
• Data Mining is just one additional tool to help analysts
• Analytic Technology has the potential to reduce the current high rate of false positives
Source: Gregory Piatetsky-Shapiro

IS 257 – Fall 2009 2009.11.17- SLIDE 32
Data Mining with Privacy
• Data Mining looks for patterns, not people!
• Technical solutions can limit privacy invasion– Replacing sensitive personal data with anon.
ID– Give randomized outputs– Multi-party computation – distributed data– …
• Bayardo & Srikant, Technological Solutions for Protecting Privacy, IEEE Computer, Sep 2003
Source: Gregory Piatetsky-Shapiro
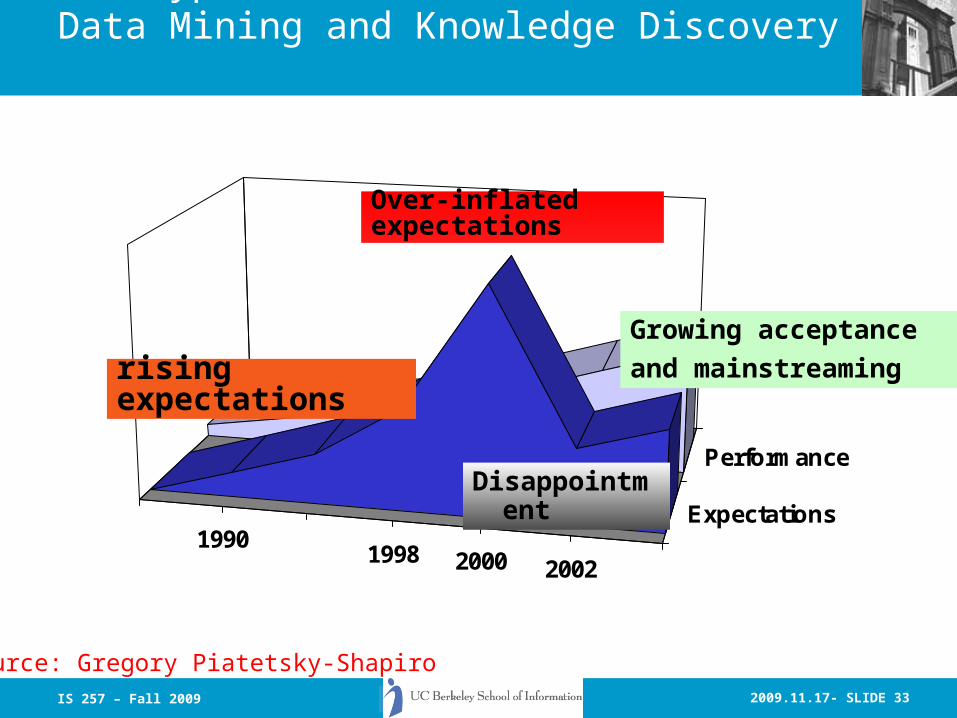
IS 257 – Fall 2009 2009.11.17- SLIDE 33
19901998 2000 2002
Expectations
Performance
The Hype Curve for Data Mining and Knowledge Discovery
Over-inflated expectations
Disappointment
Growing acceptance
and mainstreaming
rising expectations
Source: Gregory Piatetsky-Shapiro

IS 257 – Fall 2009 2009.11.17- SLIDE 34
More on Data Mining using Weka
• Slides from Eibe Frank, Waikato Univ. NZ