2009 Foster Business School Cost Accounting L.DuCharme 1 Cost-Volume-Profit Analysis Chapter 3.
31
1 2009 Foster Business School Cost Accounting L.DuCharme Cost-Volume-Profit Analysis Chapter 3
-
date post
19-Dec-2015 -
Category
Documents
-
view
219 -
download
2
Transcript of 2009 Foster Business School Cost Accounting L.DuCharme 1 Cost-Volume-Profit Analysis Chapter 3.

12009 Foster Business School Cost Accounting L.DuCharme
Cost-Volume-Profit Analysis
Chapter 3

22009 Foster Business School Cost Accounting L.DuCharme
Outline
• CVP assumptions & terminology
• BEP solution– Target operating income– Target net income
• Margin of Safety
• Operating Leverage
• CM vs. GM
32009 Foster Business School Cost Accounting L.DuCharme
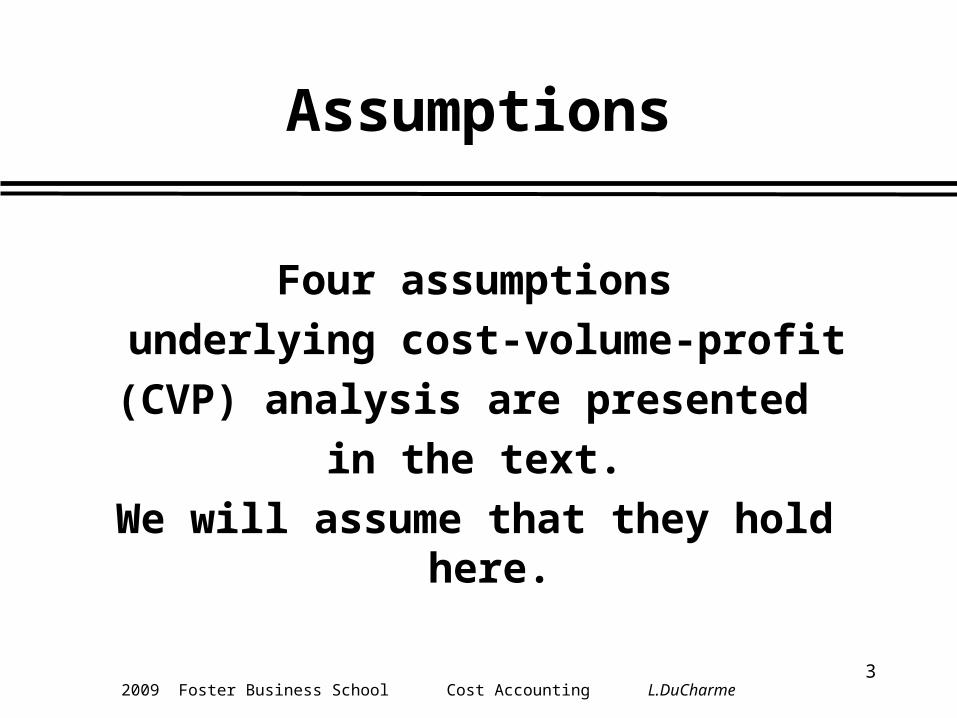
Assumptions
Four assumptions
underlying cost-volume-profit
(CVP) analysis are presented
in the text.
We will assume that they hold here.

42009 Foster Business School Cost Accounting L.DuCharme
Cost-Volume-Profit Terminology
Operating income= Total revenues from operations– Cost of goods sold and operating costs (excluding income taxes)
Net income = Operating income – Income taxes
52009 Foster Business School Cost Accounting L.DuCharme
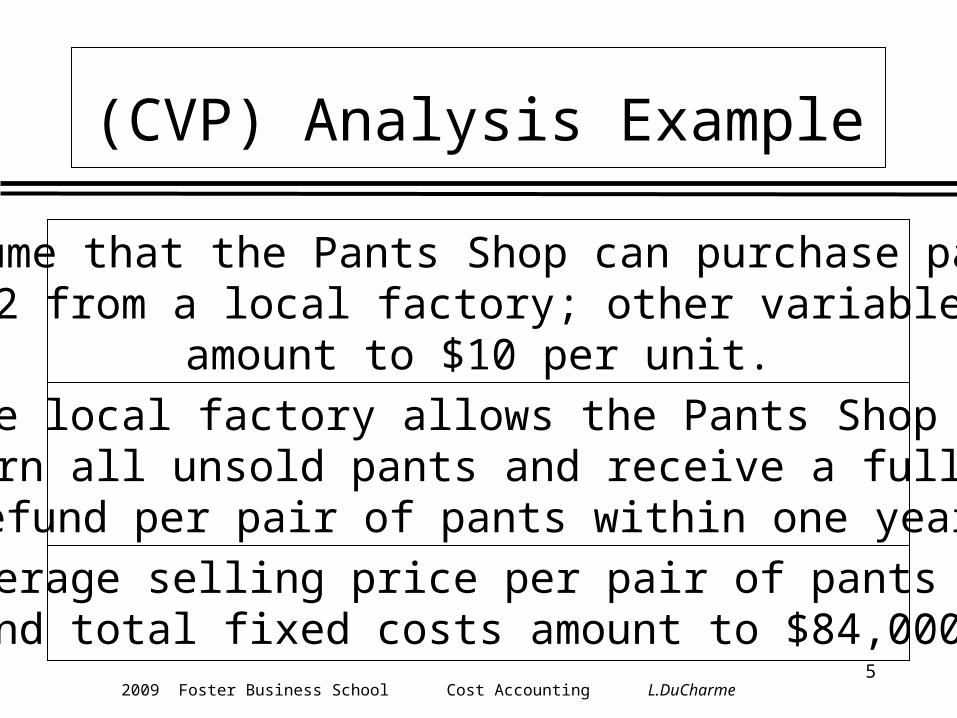
(CVP) Analysis Example
Assume that the Pants Shop can purchase pantsfor $32 from a local factory; other variable costs
amount to $10 per unit.
The local factory allows the Pants Shop toreturn all unsold pants and receive a full $32
refund per pair of pants within one year.
The average selling price per pair of pants is $70and total fixed costs amount to $84,000.

62009 Foster Business School Cost Accounting L.DuCharme
(CVP) Analysis Example
How much revenue will the business receive if2,500 units are sold?
2,500 × $70 = $175,000
How much variable costs will the business incur?
2,500 × $42 = $105,000
$175,000 – 105,000 – 84,000 = ($14,000)

72009 Foster Business School Cost Accounting L.DuCharme
(CVP) Analysis Example
What is the contribution margin per unit?
$70 – $42 = $28 contribution margin per unit
What is the total contribution margin when2,500 pairs of pants are sold?
2,500 × $28 = $70,000

82009 Foster Business School Cost Accounting L.DuCharme
(CVP) Analysis Example
Contribution margin percentage (contributionmargin ratio) is the contribution margin per
unit divided by the selling price.
What is the contribution margin percentage?
$28 ÷ $70 = 40%

92009 Foster Business School Cost Accounting L.DuCharme
(CVP) Analysis Example
If the business sells 3,000 pairs of pants,revenues will be $210,000 and contribution
margin would equal 40% × $210,000 = $84,000.
A
FEDERAL RESERVE NOTE
THE UNITED STATES OF AMERICATHE UNITED STATES OF AMERICA
L70744629F
12
1212
12
L70744629F
ONE DOLLARONE DOLLAR
WA SHINGTON, D.C.
TH IS N O TE IS LE GA L TE N DE R
FOR A LL D E B TS , P UB LIC AN D P RIV A TE
S E RIES
19 85
H 293

102009 Foster Business School Cost Accounting L.DuCharme
BEPs
Determine the breakeven pointand output level needed to achievea target operating income using: (1) the equation, (2) contribution margin, and(3) graph methods.
112009 Foster Business School Cost Accounting L.DuCharme
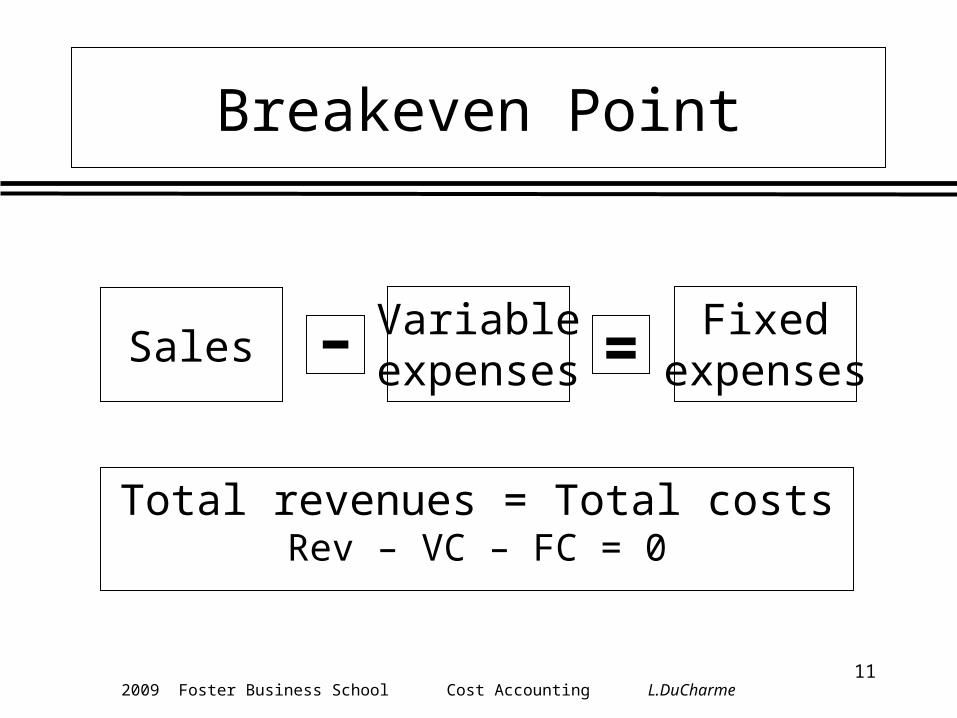
Breakeven Point
SalesVariableexpenses
Fixedexpenses
– =
Total revenues = Total costsRev – VC – FC = 0

122009 Foster Business School Cost Accounting L.DuCharme
Abbreviations
SP = Selling price
VCU = Variable cost per unit
CMU = Contribution margin per unit
CM% = Contribution margin percentage
FC = Fixed costs

132009 Foster Business School Cost Accounting L.DuCharme
Abbreviations
Q = Quantity of output units sold(and manufactured)
OI = Operating income
TOI = Target operating income
TNI = Target net income (after tax)

142009 Foster Business School Cost Accounting L.DuCharme
Equation Method
$70Q – $42Q – $84,000 = 0$28Q = $84,000
Q = $84,000 ÷ $28 = 3,000 units
Let Q = number of units to be sold to break even
(Selling price × Quantity sold) – (Variable unit cost× Quantity sold) – Fixed costs = Operating income
152009 Foster Business School Cost Accounting L.DuCharme
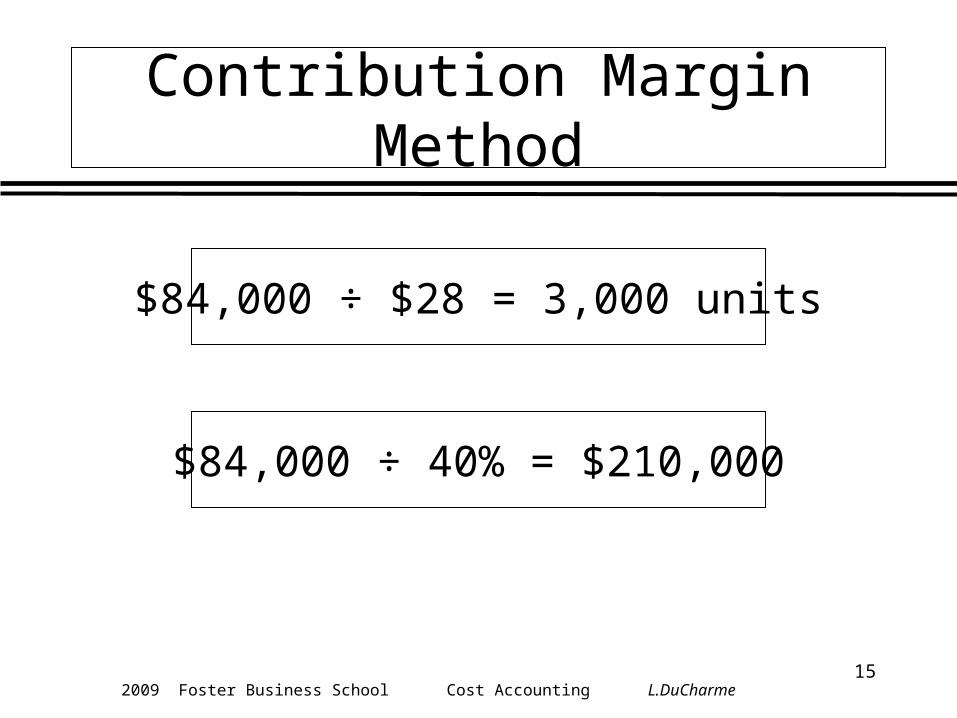
Contribution Margin Method
$84,000 ÷ $28 = 3,000 units
$84,000 ÷ 40% = $210,000

162009 Foster Business School Cost Accounting L.DuCharme
Graph Method
04284
126168210252294336378
0 1000 2000 3000 4000 5000
Units
$(00
0)
Revenue
Total costs
Breakeven
Fixed costs

172009 Foster Business School Cost Accounting L.DuCharme
Target Operating Income
(Fixed costs + Target operating income)divided either by Contribution Margin
percentage or Contribution Margin per unit

182009 Foster Business School Cost Accounting L.DuCharme
Target Operating Income
Assume that management wants to have anoperating income of $14,000.
How many pairs of pants must be sold?
($84,000 + $14,000) ÷ $28 = 3,500
What dollar sales are needed to achieve this income?
($84,000 + $14,000) ÷ 40% = $245,000

192009 Foster Business School Cost Accounting L.DuCharme
Income Taxes
Understand how incometaxes affect CVP analysis.

202009 Foster Business School Cost Accounting L.DuCharme
Target Net Incomeand Income Taxes Example
Management would like to earnan after tax income of $35,711.
The tax rate is 30%.
What is the target operating income?
Target operating income= Target net income ÷ (1 – tax rate)
TOI = $35,711 ÷ (1 – 0.30) = $51,016

212009 Foster Business School Cost Accounting L.DuCharme
Target Net Incomeand Income Taxes Example
How many units must be sold?
Revenues – Variable costs – Fixed costs= Target net income ÷ (1 – tax rate)
$70Q – $42Q – $84,000 = $35,711 ÷ 0.70
$28Q = $51,016 + $84,000
Q = $135,016 ÷ $28 = 4,822 pairs of pants

222009 Foster Business School Cost Accounting L.DuCharme
Target Net Incomeand Income Taxes Example
Proof:Revenues: 4,822 × $70 $337,540Variable costs: 4,822 × $42 202,524Contribution margin $135,016Fixed costs 84,000Operating income 51,016Income taxes: $51,016 × 30% 15,305Net income $ 35,711

232009 Foster Business School Cost Accounting L.DuCharme
Margin of Safety (MoS)
Margin of Safety = Revenues* – BEP (*Revenues are either budgeted or actual.)
MoS can either be expressed in # of units or $.

242009 Foster Business School Cost Accounting L.DuCharme
MoS--question
Brie Soda has sales of $200,000; a CM of 20%; and a margin of safety of $80,000. What is Brie’s fixed cost?
A. $16,000B. $24,000C. $80,000D. $96,000E. None of the above

252009 Foster Business School Cost Accounting L.DuCharme
Operating Leverage
Operating leverage describes the effects thatfixed costs have on changes in operatingincome as changes occur in units sold.
Organizations with a high proportion of fixedcosts have high operating leverage.

262009 Foster Business School Cost Accounting L.DuCharme
Operating Leverage Example
Degree of operating leverage= Contribution margin ÷ Operating income
What is the degree of operating leverageof the Pants Shop at the 3,500 sales level
under two different arrangements?
Existing arrangement:3,500 × $28 = $98,000 contribution margin

272009 Foster Business School Cost Accounting L.DuCharme
Operating Leverage Example
$98,000 contribution margin – $84,000 fixed costs= $14,000 operating income
$98,000 ÷ $14,000 = 7.0
New arrangement:Assume Unit Variable Costs = $35 and Fixed Cost = $114,000
3,500 × $35 = $122,500 contribution margin

282009 Foster Business School Cost Accounting L.DuCharme
Operating Leverage Example
$122,500 contribution margin– $114,000 fixed costs = $8,500
$122,500 ÷ $8,500 = 14.4
The degree of operating leverage at a given levelof sales helps managers calculate the effect of
fluctuations in sales on operating income.E.g., above: a 10% increase in sales will yield a 144% increase in op. income!
What is operating leverage if fixed costs = 0?As sales increase, what happens to op. leverage?

292009 Foster Business School Cost Accounting L.DuCharme
Contribution Margin versusGross Margin
Contribution income statement emphasizescontribution margin.
Financial accounting income statementemphasizes gross margin.

302009 Foster Business School Cost Accounting L.DuCharme
GM versus CM
• The difference between GM and CM all is in how you account for:– Fixed mfg. costs (in CoGS, NOT in VC)
– Variable non-mfg. costs (in VC, NOT in CoGS)
GM = Rev. – CoGS
CM = Rev. – VC “Margins” are usually referred to in finance. What margins are they usually referring to?

312009 Foster Business School Cost Accounting L.DuCharme
End of Chapter 3


![Cost Volume Profit Analysis A tool for decision making Source- Cost Accounting – A managerial emphasis by Horngreen, Datar & Foster [ Chapter-3]](https://static.fdocuments.us/doc/165x107/56649e5f5503460f94b58dc3/cost-volume-profit-analysis-a-tool-for-decision-making-source-cost-accounting.jpg)