2009 Commercial Space & Business Parks Guide
20
SPONSORED BY COMMERCIAL SPACE & BUSINESS PARKS GUIDE 2009
-
Upload
sc-biz-news -
Category
Documents
-
view
214 -
download
1
description
The 2009 Commercial Space & Business Parks Guide offers a comprehensive look at the region’s commercial real estate market.
Transcript of 2009 Commercial Space & Business Parks Guide
SPONSORED BY
COMMERCIAL SPACE &
BUSINESS PARKS GUIDE
2009
2009 COMMERCIAL SPACE & BUSINESS PARKS GUIDE 3
Dear Readers,I am proud to present the 2009 Commercial Space & Business Parks Guide. Inside you’ll fi nd a wealth of
information presented in our statistics and lists, along with the featured properties, that we hope will provide
you with a useful commercial real estate decision-making tool.
We all know the real estate market ebbs and fl ows. And of late, there has been
more ebbing than fl owing. But this publication reminds me of the great opportuni-
ties for economic development that exist right here in the Charleston region. We not
only have desirable offi ce space, industrial space and available land, but we also have
competitive rates, good infrastructure, a strong business community and a wonderful
quality of life. All things one must consider when relocating an existing business or
deciding where to set up shop.
Th is publication also reminds me of the great value commercial real estate agents
bring to the table through their expertise. As our business has expanded across the
state, I have realized that the advice and representation of a commercial real estate agent are vital. One of the
overlooked assets of our region is the large number of highly knowledgeable commercial real estate agents who
reside here. All of them stay current with continuing education and many have chosen to take their skills to a
higher level by qualifying as Certifi ed Commercial Investment Managers and/or for the Society of Industrial
and Offi ce Realtors. Not only do these individuals possess a high level of knowledge, they and their companies
produce a substantial volume of high quality, accurate data upon which we rely as journalists.
As the economy turns around and real estate begins to fl ow again, we know these agents will be working
with area offi cials to help keep Charleston top-of-mind among investors and to expand the region’s economic
development base.
Enjoy,
Welcome from our
Sponsors
Contents
Grady JohnsonCEO and
Group Publisher
Th e SOCIETY OF INDUSTRIAL AND
OFFICE REALTORS® is the leading professional
commercial and industrial real estate association.
SIOR® represents today’s most knowledgeable,
experienced and successful commercial real estate
brokerage specialists. Th e designation signifi es that
an individual has achieved a high level of compe-
tence and success and adheres to high professional
standards. Many corporate executives consider
the SIOR® designation a prerequisite in choosing a
service provider.
Charleston Chapter SIOR® members hold the
prestigious SIOR® designation. Th ese real estate
professionals are recognized by corporate real
estate executives, commercial real estate brokers,
agents, lenders, and other real estate professionals
as the most capable and experienced brokerage
practitioners in the market. SIOR® designees can
hold the following specialty designations: indus-
trial, offi ce, sales manager, executive manager or
advisory service. Make a name with the only name
that matters — SIOR®.
Durlach Associates is celebrating its 30th year
of developing, leasing, and managing Class A
offi ce buildings in the Charleston area. Fift een
years ago, when Charleston Regional Business
Journal was getting started, they leased offi ce space
in a building developed and managed by Dur-
lach Associates, and we were located in adjoining
offi ces. Since its inception, Charleston Regional
Business Journal has remained a leading source for
business news and information. Durlach Associ-
ates is pleased to be a sponsor of the Commercial
Space & Business Parks Guide. We look forward
to the next 30 years and to continuing to partner
with Charleston Regional Business Journal and
other great companies in the growth of business in
Charleston.
Commercial, industrial market experts cautiously optimistic ..............4
Charleston Region Offi ce and Retail Shopping Center Space .............5
Offi ce Vacancy Rate* Second Quarter 2009 .......................................5
Offi ce Market Snapshot – Charleston – Second Quarter 2009 ......... 6
Industrial Market Snapshot – Charleston – Second Quarter 2009 .... 7
Offi ce Buildings ............................................................................ 15
Commercial/Industrial Real Estate Companies .............................. 18
Feature PropertiesFaber Centre ....................... 8
Parkshore Centre ................ 9
SCRA Innovation Center at Charleston ......... 10
Trident Research Center ... 11
Liberty Center ................... 12
Ashley Overlook ................ 13
Two Rivers Center ............. 14

2009 COMMERCIAL SPACE & BUSINESS PARKS GUIDE4
By Allison Cooke [email protected]
An increasing number of economists are saying the worst of the reces-
sion is over and the nation’s economy is on the long road to recovery.
But those in the real estate industry are still waiting to exhale.
Th ere have been signs of improvement — including a rebound in the
local housing market and a 1.4% drop in industrial property vacancies
— but the market as a whole remains uncertain, and consumers remain
cautious.
Hunkered downMore than 125,000 square feet of offi ce space opened up in the Charles-
ton region in the second quarter, bringing the vacancy rate up to 21.5%.
According to the second-quarter offi ce market report released this summer
by Grubb & Ellis WRS, although vacancy rates have continued to increase,
they have done so at a slower rate.
“Th e pace has slowed, so I think people have hunkered down to try to
ride this out. It seems like the housing market is warming up, so I expect
it (the offi ce market) to rise slightly and hopefully level off ,” said Jeremy
Willits, senior vice president and principal of Grubb & Ellis WRS. “But I
Commercial, industrial market experts cautiously optimistic
don’t think we’ll see any dramatic improvement until the unemployment
rate improves.”
Th e central business district downtown proved to be the bright spot in
the offi ce market report, with “an astonishing 93% occupancy rate.”
Meanwhile, offi ce space in suburban areas has taken the hardest hit.
Vacancies on Daniel Island and in Mount Pleasant, North Charleston and
West Ashley range from 23.2%-27.4%.
Willits said many renters in suburban areas were largely tied to the real
estate industry, including real estate agents, homebuilders and closing
attorneys. As companies looked for ways to lower overhead this year, many
decided to consolidate offi ces and reduce their footprint.
To attract new offi ce tenants and keep current tenants, Willits said land-
lords in all areas are more willing to accept shorter lease terms or reduced
rental rates. In some cases, rent has dropped nearly 25%. Th e goal is to gen-
erate income in the short term while limiting the long-term commitment
to a lower rental rate.
When it comes to purchasing offi ce space, Willits said there are many
good opportunities, particularly for owners who intend to occupy a space.
“Th e buyers that are owner-occupants are the ones who are more likely to
get a loan,” he said. “Th ey can purchase now for a better price than they’ve
seen in years.”

2009 COMMERCIAL SPACE & BUSINESS PARKS GUIDE 5
Industrial leasing strengthens“For the fi rst time since the peak of the market in 2007, the Charleston
industrial market has hard data to indicate a turnaround,” Grubb & Ellis
stated in its industrial market trends report for the second quarter.
Overall, Grubb & Ellis’ research shows vacancy rates in the second quar-
ter dropped from 13.8% to 12.4%. And while rates hover around 20% for
the Summerville, West Ashley and Clements Ferry/East Cooper areas, rates
for downtown, North Charleston and Berkeley County all have single-digit
vacancy rates.
“Leasing will be the main driver for the next 18 months or so,” said
Michael Ferrer, vice president of global logistics for Grubb & Ellis WRS.
“We are not seeing the same amount of fear people had in the fourth quarter
of last year or the fi rst quarter of this year.”
Th e report also noted that landlords continue to off er incentives, includ-
ing short-term leases, to keep properties occupied. But the real value is in
locking in a long-term lease.
“Th e silver lining is, if you are a successful company in the defense or
medical industry or other market that hasn’t been impacted, you can get a
good deal,” Ferrer said. “It’s a tenant’s market.”
With the amount of space available — about 4.6 million total square feet
— and the great desire to sell or rent, buyers and renters can fi nd a good
deal.
Th e best deals in purchasing industrial space occur when the buyer
intends to use the space purchases, rather than rent it out. Still, not too
many people have been motivated to buy, as Grubb & Ellis reports there
have been fewer than 11 transactions in the past 12 months.
Ferrer said that activity has greatly diminished as a result of a combina-
tion of more stringent lending requirements; a big disconnect between buy-
ers and sellers on property value; and diffi culty in securing fi nancing.
Cautiously optimisticLooking ahead, Ferrer is hopeful that things will really begin to turn
around by the end of next year.
“I think everyone is going to be cautiously optimistic,” he said. “It’s not
going to be red-hot like it was before.”
But Charleston is poised for a strong return, Ferrer continued.
“Charleston has very strong fundamentals, and this, too, shall pass,” he
said. “Charleston still has a lot going for it — great quality of life, good infra-
structure, great port and national developers with the ability to provide job
creation that we haven’t had in the past. Th ese things will have led Charles-
ton to a position where it is well-situated for the rebound.”
CHARLESTON REGION OFFICE AND RETAIL SHOPPING CENTER SPACE
* The Center for Business Research suspended its office and retail surveys from 2004-06.
Surveys resumed in 2007.
Note: Survey includes retail shopping centers larger than 30,000 square feet and office
buildings larger than 10,000 square feet in the tri-county area.
Source: Center for Business Research
Offi ce Space % Available Retail Space % Available1997 4,769,013 16.3% 11,494,631 15.0%
1998 5,130,751 12.0% 11,168,835 12.1%
1999 5,100,681 11.4% 11,354,901 10.7%
2000 5,271,948 12.5% 12,278,197 11.2%
2001 5,740,524 11.7% 12,333,817 11.8%
2002 6,548,371 16.1% 13,001,699 12.2%
2003 6,957,945 16.9% 12,683,726 10.3%
2007* 8,646,005 15.9% 14,976,315 10.0%
2008 9,881,505 17.7% 14,712,658 8.1%
OFFICE VACANCY RATE* SECOND QUARTER 2009
*All classes of space
Source: Grubb & Ellis WRS Offi ce Market Trends Charleston, Second Quarter 2009
Centra
l Bus
iness
Dist
rict
Daniel
Islan
d
Mount
Pleasa
nt
North
Charle
ston
West A
shley
25
20
15
10
5
0
6.9
27.4
24.0
25.3
23.2

2009 COMMERCIAL SPACE & BUSINESS PARKS GUIDE6
2003 2004 2005 2006 2007 2008 2009
*All industrial product types
Source: Grubb & Ellis WRS Offi ce Market Trends Charleston, Second Quarter 2009
INDUSTRIAL VACANCY RATE* THROUGH SECOND QUARTER 2009
22.0%
18.0%
13.0%
9.0%8.4%
13.4% 12.4%
OFFICE MARKET SNAPSHOT – CHARLESTON – SECOND QUARTER 2009
By submarket(All classes) Total (1) SF Vacant (2) SF Vacant %
Net AbsorptionUnder Construction SF (3)
Asking Rent (4)
Current Qtr. Year-to-Date Class “A” Class “B”Downtown 1,755,436 121,538 6.9 252 263 35,000 $28.76 $23.37
CBD Total 1,755,436 121,538 6.9 252 263 35,000 $28.76 $23.37
Daniel Island 1,076,779 295,127 27.4 (49,265) (53,593) 76,120 $24.78 $22.38
Mount Pleasant 1,547,508 371,919 24 (2,633) (44,316) 22,500 $23.94 $22.75
North Charleston 3,570,318 9,047,161 25.3 (43,805) 16,100 150,000 $21.39 $20.05
West Ashley 1,096,469 254,197 23.2 (26,259) (17,816) 62,800 $23.89 $20.36
Suburban Total 7,291,074 1,825,959 25 (121,962) (99,625) 311,420 $23.20 $21.32
Totals 9,046,510 1,947,497 21.5 (121,710) (99,362) 346,420 $23.77 $21.43 (1) Inventory includes multitenant and single-tenant buildings with at least 10,000 square feet.
(2) Vacant space includes both vacant direct and vacant sublease space.
(3) Space under construction includes speculative and build-to-suit for lease projects.
(4) Asking rates are per square foot, per year, full service. Rates for each building are weighted by the size of the building.
By Class (All submarkets) Total (1) SF Vacant (2) SF Vacant %
Net AbsorptionUnder Construction SF (3)
Available for SubleaseCurrent Qtr. Year-to-Date CBD Suburban
Class A 4,422,195 1,099,122 24.9 (16,855) (1,926) 346,420 – 63,000
Class B 2,179,921 357,468 16.4 (87,340) (94,765) – – 54,790
Class C 2,444,394 490,907 20.1 (17,515) (2,671) – – 12,048
Totals 9,046,510 1,947,497 21.5 (121,710) (99,362) 346,420 – 129,838
Class “A” properties are the most prestigious buildings competing for premier offi ce users with rents above average for the area. Class “B” properties compete for a wide range of users with rents in the aver-
age range for the area. Class “C” buildings compete for tenants requiring functional space at rents below the area average.
CBD = Central Business District
Source: Grubb & Ellis WRS Offi ce Market Trends Charleston, Second Quarter 2009
0%
2%
4%
6%
8%
10%
12%
14%
16%
18%
20%
22%

2009 COMMERCIAL SPACE & BUSINESS PARKS GUIDE 7
Commercial and Residential Plumbing Professionals* Unlimited License *
www.crosbyplumbing.com843.284.0286
Serving the Carolinas and Georgia
Uncompromising quality. No buts about it.
newcomers guidenewcomers guidenewcomers gug ide
Committ ed to delivering you right to South Carolina’s newcomers.
Get Th ere First! Be the fi rst to introduce your products and services!
For advertising information, contact James Molnarat [email protected] or 843.849.3146
www.intronewcomersguide.com
From the publishers of
INDUSTRIAL MARKET SNAPSHOT – CHARLESTON – SECOND QUARTER 2009
By submarket(All classes) Total (1) SF Vacant (2) SF
TotalVacancy %
Net AbsorptionUnder Construction SF (3)
Asking Rent (4)
Current Qtr. Year-to-Date WH/Dist. R&D/FlexBerkeley County 6,718,590 450,215 6.7 – 129,710 – $5.74 $7.27
Downtown 2,810,406 203,860 7.3 (10,000) (10,000) – $4.22 $8.67
East Cooper 3,974,250 850,962 21.4 215,143 219,953 – $4.85 $5.50
North Charleston 17,269,400 1,626,517 9.4 241,759 95,985 39,892 $4.27 $6.52
Outside Metro AreaSummerville 5,812,077 1,373,105 23.6 81,290 70,666 60,000 $3.88 $7.20
West Ashley 764,460 139,423 18.2 – 4,000 – $4.42 $7.30
Totals 37,349,183 4,644,082 12.4 528,192 510,314 98,892 $4.41 $6.36 (1) Inventory includes multitenant and single-tenant buildings with at least 10,000 square feet.
(2) Vacant space includes both vacant direct and vacant sublease space.
(3) Space under construction includes speculative and build-to-suit for lease projects.
(4) Asking rates are per square foot, per year, triple net. Rates for each building are weighted by amount of available space within the building.
By property type Total (1) SF Vacant (2) SFTotal
Vacancy %Net Absorption
Under Construction SF (3) Asking Rent (4)Current Qtr. Year-to-DateGeneral Industrial 1,121,583 119,637 10.7 (8,000) -25,500 – $5.62
R&D/Flex 4,221,823 926,889 22 18,425 40,858 39,892 $6.36
Warehouse/Distribution 32,005,777 6,597,556 11.2 517,767 494,956 60,000 $4.41
Totals 37,349,183 4,644,082 12.4 528,192 510,314 99,892 $4.84
Industrial buildings are categorized as warehouse/distribution, general industrial and R&D/fl ex based on their physical
characteristics, including percentage of offi ce buildout, clear height, typical bay depth, typical suit size, type of loading and typical uses.
Source: Grubb & Ellis WRS Offi ce Market Trends Charleston, Second Quarter 2009

2009 COMMERCIAL SPACE & BUSINESS PARKS GUIDE8
FABER CENTRE
ADDRESS: 4000 Faber Place Drive
CLASSIFICATION: Class “A+” Offi ce
PROPERTY MANAGER: Durlach Associates
AVAILABLE SQUARE FOOTAGE: Contact
Owner’s Representatives for Availabilities
YEAR DEVELOPED: 2008
DESCRIPTION: Developed by Durlach Associates and Holder Properties, Faber Centre is a modern four story Class A+ offi ce building centrally located at the intersection of I-526 and Leeds Avenue in the Executive Park at Faber Place. Faber Centre opened August 2008 and is home to lead tenants SunTrust, Centex, CIGNA, and MetLife.
TOP ASSETS: Flexible fl oor plans accommodate tenant layouts and expansion requirements up to 25,000 sq. ft. on a single fl oor. The limestone and granite lobby provides an entry appropriate for Charleston’s most successful businesses. Class A lobbies, restrooms and common areas set the tone for an exceptional business experience. Facility management by Durlach Associates.
DEVELOPER’S REPRESENTATIVE
NAME: John Durlach and Darby Siegel
PHONE: 723-2801 and 266-8601
E-MAIL: [email protected] and
WEBSITE: www.FaberCentre.com

2009 COMMERCIAL SPACE & BUSINESS PARKS GUIDE 9
PARKSHORE CENTRE
ADDRESS: One Poston Road, Charleston
CLASSIFICATION: Class “A+” Offi ce
PROPERTY MANAGER: Durlach Associates
ZONING: General Offi ce
AVAILABLE SQUARE FOOTAGE: Contact
Developer’s Representative for Availabilities
PARK SIZE: 7 Acres
YEAR DEVELOPED: 1989
DESCRIPTION: Charleston’s premier offi ce environment, Parkshore Centre, offers 120,000 square feet of class A offi ces. Under 10 minutes from Charleston International Airport and downtown, Parkshore provides metropolitan convenience in a naturally wooded, beautifully landscaped setting.
TOP ASSETS: Flexible fl oor plans accommodate layouts from 1,000 to 40,000 square feet on a single fl oor. Tri-county’s most central location with direct access to I-26. Class A lobby, restrooms, and common areas. Large common conference room. On site management and leasing by Durlach Associates. Abundant parking – 5 spaces per 1,000 square feet.
DEVELOPER’S REPRESENTATIVE
NAME: John Durlach
PHONE: 843-723-2801
E-MAIL: [email protected]
WEBSITE: www.durlach.com

2009 COMMERCIAL SPACE & BUSINESS PARKS GUIDE10
SCRA INNOVATION CENTER AT CHARLESTON
ADDRESS: 645 Meeting St., Charleston, SC 29403
CLASSIFICATION: Class “A” offi ce/laboratory space
PROPERTY MANAGER: South Carolina Research Authority
AVAILABLE SQUARE FOOTAGE: 25,000
YEAR DEVELOPED: 2009
DESCRIPTION: The 28,400-square-foot facility will consist of fl exible-use, multi-tenant laboratory and offi ce space supporting biopharma, biomed and biotech research and commercialization.
TOP ASSETS: Parking provided. Common reception area; receptionist provided. Common meeting rooms provided. Network access including e-mail available. Administrative offi ce assistance available. Flexible modular offi ce confi gurations. 24/7 security monitoring and police substation. Business, legal and fi nancial planning assistance on site.
DEVELOPER’S REPRESENTATIVE
NAME: Mark Mattison, CCIMPHONE: 843-720-7505E-MAIL: [email protected]
NAME: Peter Fennelly, SIOR, MCRPHONE: 843-720-7500E-MAIL: [email protected]
WEB SITE: www.scra.org/scra_innovationacenters.shtml
2009 COMMERCIAL SPACE & BUSINESS PARKS GUIDE 11
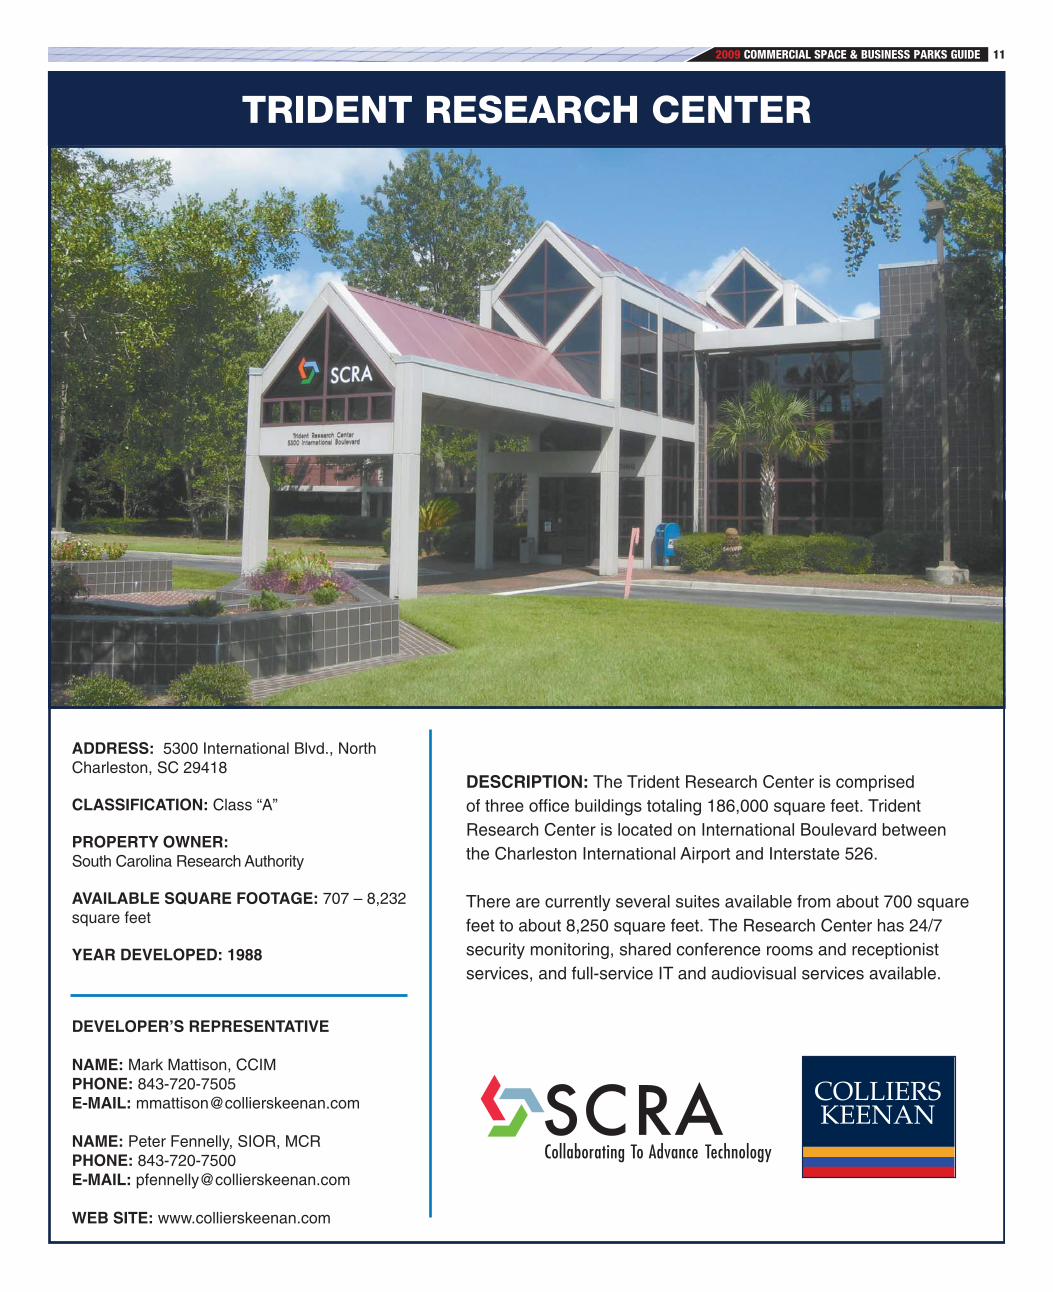
TRIDENT RESEARCH CENTER
ADDRESS: 5300 International Blvd., North Charleston, SC 29418
CLASSIFICATION: Class “A”
PROPERTY OWNER:South Carolina Research Authority
AVAILABLE SQUARE FOOTAGE: 707 – 8,232 square feet
YEAR DEVELOPED: 1988
DESCRIPTION: The Trident Research Center is comprised of three offi ce buildings totaling 186,000 square feet. Trident Research Center is located on International Boulevard between the Charleston International Airport and Interstate 526.
There are currently several suites available from about 700 square feet to about 8,250 square feet. The Research Center has 24/7 security monitoring, shared conference rooms and receptionist services, and full-service IT and audiovisual services available.
DEVELOPER’S REPRESENTATIVE
NAME: Mark Mattison, CCIMPHONE: 843-720-7505E-MAIL: [email protected]
NAME: Peter Fennelly, SIOR, MCRPHONE: 843-720-7500E-MAIL: [email protected]
WEB SITE: www.collierskeenan.com

2009 COMMERCIAL SPACE & BUSINESS PARKS GUIDE12
LIBERTY CENTER
ADDRESS: 151 Meeting StreetCharleston, SC 29401
CLASSIFICATION: “A+” offi ce space
AVAILABLE SQUARE FOOTAGE: 14,100
YEAR DEVELOPED: 1981
DESCRIPTION: The Class “A” offi ce space is a sublease opportunity of approximately 14,100 square feet located on the 4th fl oor of Liberty Center at 151 Meeting St. in the Central Business District. The space may be subdivided to suites as small as 3,000 square feet.
TOP ASSETS: Liberty Center has true Class “A” fi nishes within the common areas. The 4th fl oor lobby entrance has marble fl oors and the interior of Suite 400 has many private offi ces with side lights and a 12-person conference room, break area, storage areas and work rooms.
DEVELOPER’S REPRESENTATIVE
NAME: Mark Mattison, CCIMPHONE: 843-720-7505E-MAIL: [email protected]
NAME: Colin DunnPHONE: 843-720-1202E-MAIL: [email protected]
WEB SITE: www.collierskeenan.com

2009 COMMERCIAL SPACE & BUSINESS PARKS GUIDE 13
ASHLEY OVERLOOK
ADDRESS: 4390 Belle Oaks Dr., North Charleston, SC 29405
CLASSIFICATION: Class A Offi ce
PROPERTY OWNER: Grubb & Ellis Realty Investors
PROPERTY MANAGER: Holder Properties
AVAILABLE SQUARE FOOTAGE: 11,078 rentable square feet
YEAR DEVELOPED: 2006
DESCRIPTION: Located in only Class A offi ce park in Charleston. With close proximity to Interstates 526 and 26, downtown, the Charleston Airport and a variety of restaurants and shopping all make Ashley Overlook a great location.
TOP ASSETS: Built in 2006. First generation space still available. Professionally managed by Holder Properties.
DEVELOPER’S REPRESENTATIVE
FOR LEASING INFO: Darby Siegel, Director, Holder Properties
PHONE: 843-266-8601
E-MAIL: [email protected]
WEBSITE: www.ashleyoverlook.com
2009 COMMERCIAL SPACE & BUSINESS PARKS GUIDE14
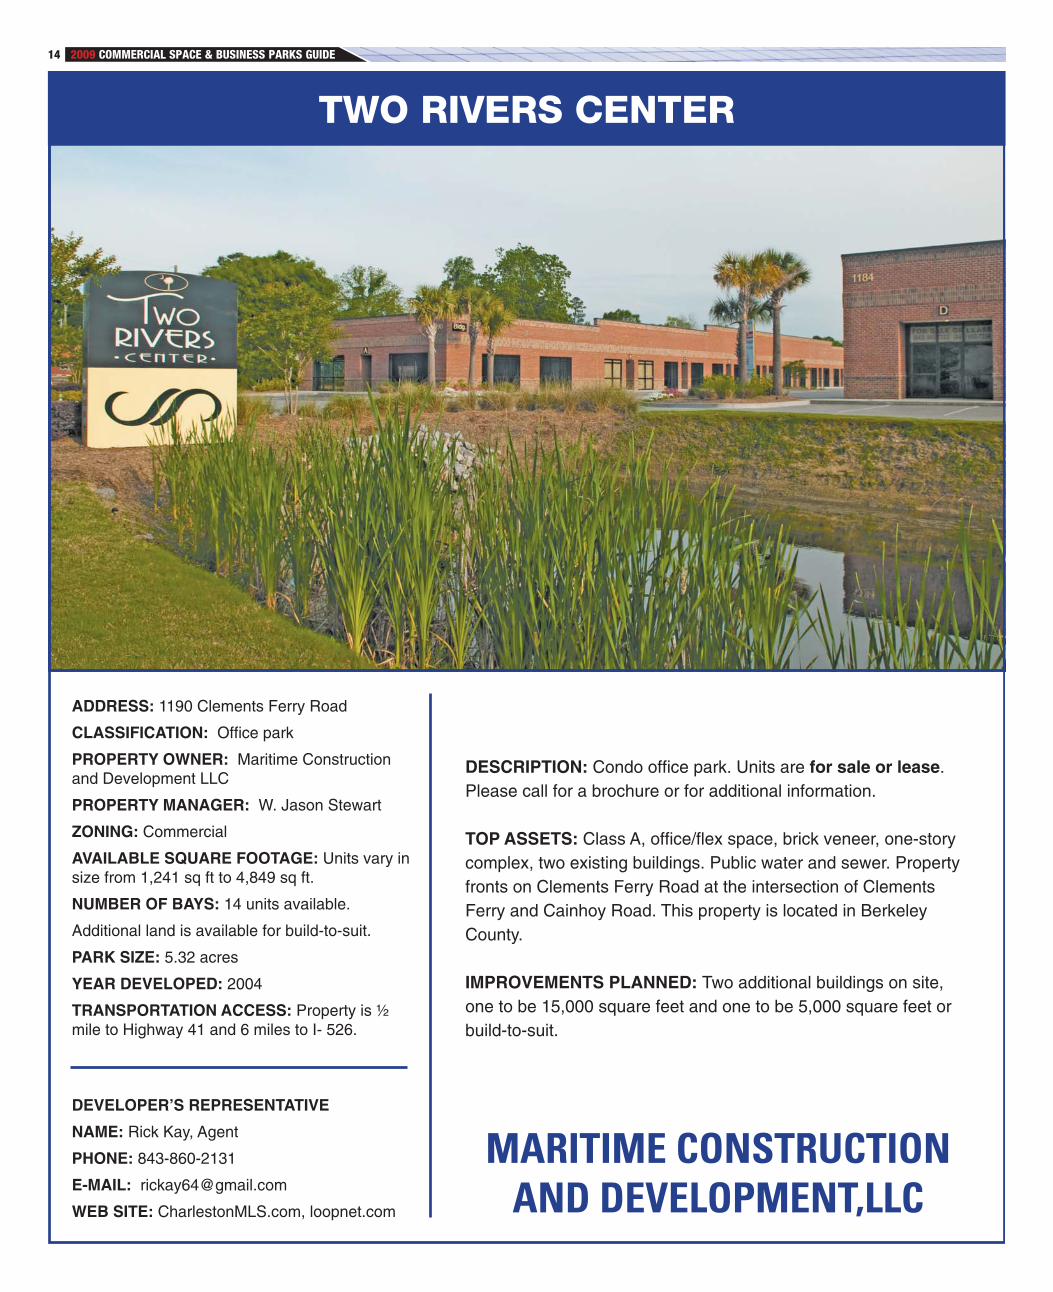
TWO RIVERS CENTER
ADDRESS: 1190 Clements Ferry Road
CLASSIFICATION: Offi ce park
PROPERTY OWNER: Maritime Construction and Development LLC
PROPERTY MANAGER: W. Jason Stewart
ZONING: Commercial
AVAILABLE SQUARE FOOTAGE: Units vary in size from 1,241 sq ft to 4,849 sq ft.
NUMBER OF BAYS: 14 units available.
Additional land is available for build-to-suit.
PARK SIZE: 5.32 acres
YEAR DEVELOPED: 2004
TRANSPORTATION ACCESS: Property is ½ mile to Highway 41 and 6 miles to I- 526.
DESCRIPTION: Condo offi ce park. Units are for sale or lease. Please call for a brochure or for additional information.
TOP ASSETS: Class A, offi ce/fl ex space, brick veneer, one-story complex, two existing buildings. Public water and sewer. Property fronts on Clements Ferry Road at the intersection of Clements Ferry and Cainhoy Road. This property is located in Berkeley County.
IMPROVEMENTS PLANNED: Two additional buildings on site, one to be 15,000 square feet and one to be 5,000 square feet or build-to-suit.
DEVELOPER’S REPRESENTATIVE
NAME: Rick Kay, Agent
PHONE: 843-860-2131
E-MAIL: [email protected]
WEB SITE: CharlestonMLS.com, loopnet.com
MARITIME CONSTRUCTION AND DEVELOPMENT,LLC

2009 COMMERCIAL SPACE & BUSINESS PARKS GUIDE 15
These industry-specifi c lists appear in each issue of the Charleston Regional Business Journal. To update your
company information or to be added to the list, call Gini Rice at 843-849-3114 or update online at
www.charlestonbusiness.com/update_lists/.

2009 COMMERCIAL SPACE & BUSINESS PARKS GUIDE16
Why use SCJobMarket.com?SCJobMarket.com is an Internet recruiting Web site based in
South Carolina, devoted to connecting local candidates with local employers. Currently, we have over 135,000 unique site visitors a
month and over 18,000 active job seekers registered.
Connect with the Best Local Job Candidates.
From the publishers ofFor more information, call 843.849.3126 or visit our web site at www.SCJobMarket.com
These industry-specifi c lists appear in each issue of the Charleston Regional Business Journal. To update your
company information or to be added to the list, call Gini Rice at 843-849-3114 or update online at
www.charlestonbusiness.com/update_lists/.

2009 COMMERCIAL SPACE & BUSINESS PARKS GUIDE 17
These industry-specifi c lists appear in each issue of the Charleston Regional Business Journal. To update your
company information or to be added to the list, call Gini Rice at 843-849-3114 or update online at
www.charlestonbusiness.com/update_lists/.
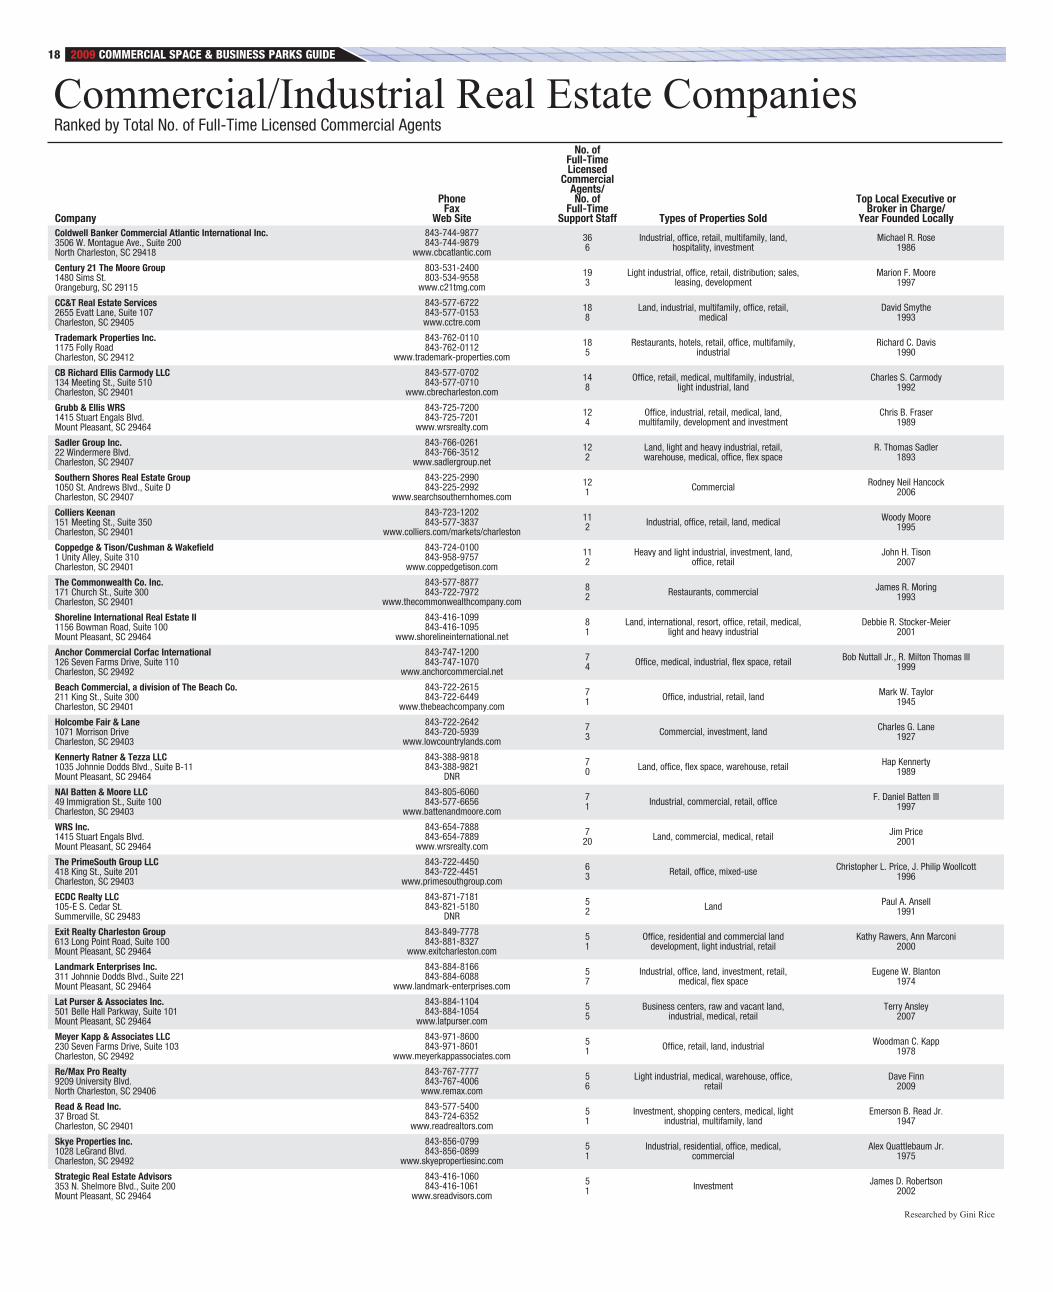
2009 COMMERCIAL SPACE & BUSINESS PARKS GUIDE18

2009 COMMERCIAL SPACE & BUSINESS PARKS GUIDE 19

2009 COMMERCIAL SPACE & BUSINESS PARKS GUIDE20
EXPECT MORE!
More space lease/sold
More transactions closed
More transaction dollar volume
Make a name with the only name that matters—SIOR®
The ociety of ndustrial and f ce EALTORS®pecialists in ndustrial and f ce eal Estate
Thomas G. Buist, JrSIOR
Grubb & Ellis/Barkley Fraser
725-7200
Robert A. CaldwellSIOR
Caldwell Commercial Real Estate Services
566-1888
Charles S. Carmody SIOR, CCIM
CB Richard Ellis Carmody, LLC
577-0702
Kristie S. RoeSIOR, CCIM
The Beach Company722-2615
Peter S. Fennelly SIOR, MCR
Colliers Keenan 723-1202
Michael G. McFallSIOR, CCIM
Maybank Properties740-9202
Charles L. Moore, JrSIOR, CCIMNAI Batten
& Moore, LLC805-6060
Frank W. NorvellSIOR
Norvell Real Estate Group, LLC 579-0055
Robert H. Nuttall, JrSIOR
Anchor Commercial CORFAC International
747-2333
Robert L. PrattSIOR, CCIM
RE/MAX Professional Realty
576-2705
R. Milton Thomas IIISIOR, CCIM
Anchor CommercialCORFAC International
747-3999
Hagood MorrisonSIOR, CCIM
Colliers Keenan723-1202
Reid P. DavisSIOR, CCIM
Anchor Commercial CORFAC International
277-4326
W. Scott RogersSIOR, CCIM
Sperry Van Ness290-9948
Eric V. CooperSIOR, CCIMBond Street
Investment Properties469-5455