2008:059 MASTER'S THESIS
115
2008:059 MASTER'S THESIS Customer Satisfaction in Four Star Isfahan Hotels An Application of SERVQUAL Model Mahdavinia Seyed Hessamaldin Luleå University of Technology Master Thesis, Continuation Courses Marketing and e-commerce Department of Business Administration and Social Sciences Division of Industrial marketing and e-commerce 2008:059 - ISSN: 1653-0187 - ISRN: LTU-PB-EX--08/059--SE
Transcript of 2008:059 MASTER'S THESIS
2008:059
M A S T E R ' S T H E S I S
Customer Satisfaction inFour Star Isfahan Hotels
An Application of SERVQUAL Model
Mahdavinia Seyed Hessamaldin
Luleå University of Technology
Master Thesis, Continuation Courses Marketing and e-commerce
Department of Business Administration and Social SciencesDivision of Industrial marketing and e-commerce
2008:059 - ISSN: 1653-0187 - ISRN: LTU-PB-EX--08/059--SE
0
Customer Satisfaction in Four Star Isfahan Hotels: An
Application of SERVQUAL Model
Supervisors:
Dr. Peter Dieke Dr. Bahram Ranjbarian
By:
SEYED HESSAMALDIN MAHDAVINIA
Thesis submitted to Lulea University of Technology and Isfahan university in partial fulfilment of
the degree of Master of Tourism and Hospitality Management.
2007

1
Acknowledgement :
I would like to acknowledge the people who assisted me in writing this thesis. Firstly, my
supervisors, Dr Ranjbarian, and Dr Dieke, for their patience, motivation and guidance
throughout all stages of my research. I whould like to thank my parents, my wife and my sister,
for their ongoing support, positivity and belief in my ability.
Hessam Mahdavinia
Fall-2007
2
Abstract :
Rsearch findings show that tourist industries have turned into one of the most profitable sources
of income throughout the world especially in the last decade of the seconde millennium.
Interestingly, this phenomenon holds clear promises for many countries which have suffered
from the dwindling and erratic functioning of the oil market. As such, hotel industry-as one of the
vital infrastructures of tourism is playing a very significant role in the economy of countries in the
modern era.
Consequently, the present research aims to investigate the customer satisfaction, in application
of SERVQUAL model among the two, four star hotels in Isfahan, (Aseman as type A and
Aliqapoo as type B) which were chosen as the two sample hotels, among all the four star hotels.
To achieve this end, this study has enlisted a field-descriptive survey design. The instrument for
collecting the data was a resercher-developed questionnaire containing fifty questions. Form
195 questionnaires distributed among the guests in different hotels of Isfahan, a sample of 170
was returened.
SPSS software was utilized for analyzing the obtained data at both descrivptive and inferential
statistical levels. The findings revealed that hotel guests' perceptions of the offered services was
below the expected average level-an index indicating that none of these hotels in Isfahan has
an optimal service quality. The results differentiated between hotel A and B. In fact, the quality
of services at Aseman hotel (A) was to some extent slightly better than that of the Aliqapoo
hotel (B). Unfortunately, the overall quality of these hotels did not match the optimal standards
expectd by the guests at all.

3
Table of content:
Chapter 1:Introduction.............................................................9 1-1-Statement of problem ......................................................................................... 10
1-2-Important of research.......................................................................................... 13
1-3-Research objectives ........................................................................................... 14
1-4-Research questions ............................................................................................ 15
1-5-Definition of terms............................................................................................... 15 Chapter 2: Literature review....................................................17 2-1-Quality ................................................................................................................ 18
2-1-1-Definition of quality .......................................................................................... 18
2-1-2-Different views on quality basis ....................................................................... 18
2-2-Services.............................................................................................................. 19
2-2-1-Definition of services ....................................................................................... 19
2-2-2-Specification of services .................................................................................. 20
2-2-3-Service package.............................................................................................. 21
2-3-customer............................................................................................................. 22
2-3-1-Definition of customer...................................................................................... 22
2-3-2-Recognition of customer.................................................................................. 23
2-3-3-customer ‘s needs ...........................................................................................24
2-3-4-Factors influencing on customer ‘s expectations ............................................. 25
2-4-customer satisfaction .......................................................................................... 27
2-4-1-customer satisfaction and measuring system.................................................. 28
2-5-Service quality .................................................................................................... 36
2-5-1-The customer ‘s perspective of service quality ................................................ 37
2-5-2-The manager ‘s role in service quality ............................................................. 39
2-5-3-Expectations and perceptions of service quality .............................................. 40
2-5-4-Service quality and customer satisfaction........................................................ 42
4
2-6-Hotel attributes ................................................................................................... 43
2-7-Loyalty ................................................................................................................ 44
2-7-1-Satisfaction and loyalty.................................................................................... 45
2-7-2-Benefit of loyalty .............................................................................................. 45
2-7-3-Relationship between customer satisfaction and loyalty.................................. 46
2-8-Service quality models........................................................................................ 47
2-8-1-SERVQUAL-Gap analysis ............................................................................... 49 Chapter 3:Methodology ................................................. 52 3-1-Research methodology....................................................................................... 52
3-2-Population........................................................................................................... 53
3-3-Sampling size ..................................................................................................... 53
3-4-Sampling method................................................................................................ 54
3-5-Data collection tools............................................................................................ 55
3-6-Estimation of the reliability of the questionnaire.................................................. 56
3-7-The estimation of the validity of questionnaire.................................................... 58
3-8-Method of data collection.................................................................................... 58
3-9-Method of data analysis...................................................................................... 59 Chapter 4:Analysis section ............................................ 61 4-1-The analysis of the demographic questions of research..................................... 61
4-1-1-The guests’ distribution based on their gender................................................62
4-1-2-The guests’ distribution based on their educational certificate ........................ 63
4-1-3-The guests’ distribution based on the purpose of their travel .......................... 64
4-1-4-The guests’ distribution based on the process of the reservations .................. 65
4-2-The analysis of the questionnaire based in the five dimensional SERVQUAL
model ........................................................................................................................ 66
4-2-1-Tangibles......................................................................................................... 66
4-2-2-Reliability ......................................................................................................... 68
5
4-2-3-Responsiveness .............................................................................................. 70
4-2-4-Assurance ....................................................................................................... 72
4-2-5-Empathy .......................................................................................................... 74
4-3-Analysis of the research questions ..................................................................... 76
4-4-Analysis the rate of expectations and perceptions of the guests ........................ 81
4-4-1-Rate of expectations and perceptions based on the gender............................ 81
4-4-2-Rate of expectations and perceptions based on educational certificate .......... 83
4-5-The quality of provided services and the obtained gap in any of studied hotel,
based on dimensions of SERVQUAL model ............................................................. 85
4-5-1-Aseman hotel,as type of A............................................................................... 85
4-5-2-Aliqapoo hotel,as type of B.............................................................................. 86
4-6-Comparing the service quality dimensions, simultaneously
in under study hotels ................................................................................................ 87
4-6-1-Expectations.................................................................................................... 87
4-6-2-Perceptions ..................................................................................................... 88 Chapter 5:Discussion and conclusion ........................... 90 5-1-Interpretation of research results ........................................................................ 91
5-1-1-Study of basic research questions in Aliqapoo hotel(B)................................... 91
5-1-2-Study of basic research questions in Aseman hotel(A) ................................... 93
5-1-3-Comparison of five dimensions of service quality in under study hotels .......... 95
5-1-4-Study of demographic questions and other research results........................... 97
5-2-Research limitations ........................................................................................... 98
5-3-Suggestions........................................................................................................ 99
5-3-1-Applied suggestions ........................................................................................ 99
List of References .....................................................................................................102
Appendix: questionnaire............................................................................................ 108
6
List of Tables
Table 3-1: the distribution of research questions parallel to the questions of the
questionnaire ........................................................................................................... 56
Table 4-1: guests’distribution based on their gender ................................................62
Table 4-2: guests’distribution based on the educational certificate ........................... 63
Table 4-3: guests’distribution on the basis of their purpose of travel ........................ 64
Table 4-4: guests’distribution on the basis of the hotel reservation........................... 65 Table 4-5: distribution of the frequency and the percentage of the answers to The
questions related to the guests total expectations of tangibles ................................ 66 Table 4-6: distribution of the frequency and the percentage of the answers to The
questions related to the guests total perceptions of tangibles................................... 67 Table 4-7: distribution of the frequency and the rate of the answers to the questions
related to the quests total expectations of the reliability .......................................... 68 Table 4-8: distribution of the frequency and percentage of answers to the questions,
related to the quests total perceptions of reliability. ............................................................ 69 Table 4-9: distribution of the frequency and the percentage of the answers to questions
related to the quests total expectations in the responsiveness dimension. ............. 70 Table 4-10: distribution of the frequency and the percentage of the answers to questions
related to the guests total perceptions in the responsiveness dimension ................. 71 Table 4-11: distribution of the frequency and the percentage of the answers to the
questions related to the quests total expectations of the assurance dimension. ..... 72 Table 4-12: distribution of the frequency and the average of the answers to questions
related to the guests total perceptions of the assurance dimension......................... 73 Table 4-13: distribution of the frequency and the percentage of the answers to questions
related to the guests total expectations of the empathy dimension. ........................ 74 Table 4-14: distribution of the frequency and the percentage of the answers to questions
related to the guests total perceptions of the empathy dimension. ........................ 75 Table 4-15: comparing the average of the scores related to the perceptions and
expectations of the guests in the tangibles dimension. ............................................ 76 Table 4-16: Comparing the average of the scores related to the perceptions and
expectations of the guests in the reliability dimension. ............................................ 77 Table 4-17: Comparing the average of the scores related to the perceptions and
expectations of the guests in the responsiveness dimension. ................................. 78 Table 4-18: Comparing the average of the scores related to the perceptions and
7
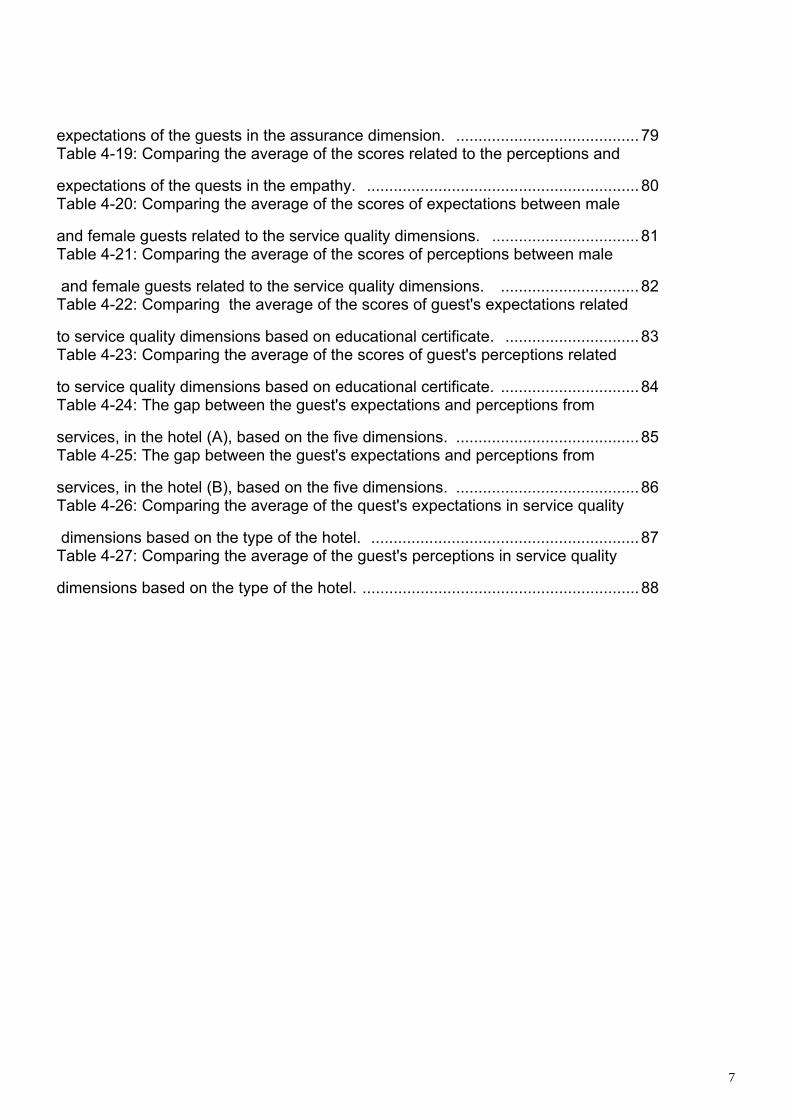
expectations of the guests in the assurance dimension. ......................................... 79 Table 4-19: Comparing the average of the scores related to the perceptions and
expectations of the quests in the empathy. ............................................................. 80 Table 4-20: Comparing the average of the scores of expectations between male
and female guests related to the service quality dimensions. ................................. 81 Table 4-21: Comparing the average of the scores of perceptions between male
and female guests related to the service quality dimensions. ............................... 82 Table 4-22: Comparing the average of the scores of guest's expectations related
to service quality dimensions based on educational certificate. .............................. 83 Table 4-23: Comparing the average of the scores of guest's perceptions related
to service quality dimensions based on educational certificate. ............................... 84 Table 4-24: The gap between the guest's expectations and perceptions from
services, in the hotel (A), based on the five dimensions. ......................................... 85 Table 4-25: The gap between the guest's expectations and perceptions from
services, in the hotel (B), based on the five dimensions. ......................................... 86 Table 4-26: Comparing the average of the quest's expectations in service quality
dimensions based on the type of the hotel. ............................................................ 87 Table 4-27: Comparing the average of the guest's perceptions in service quality
dimensions based on the type of the hotel. .............................................................. 88
8
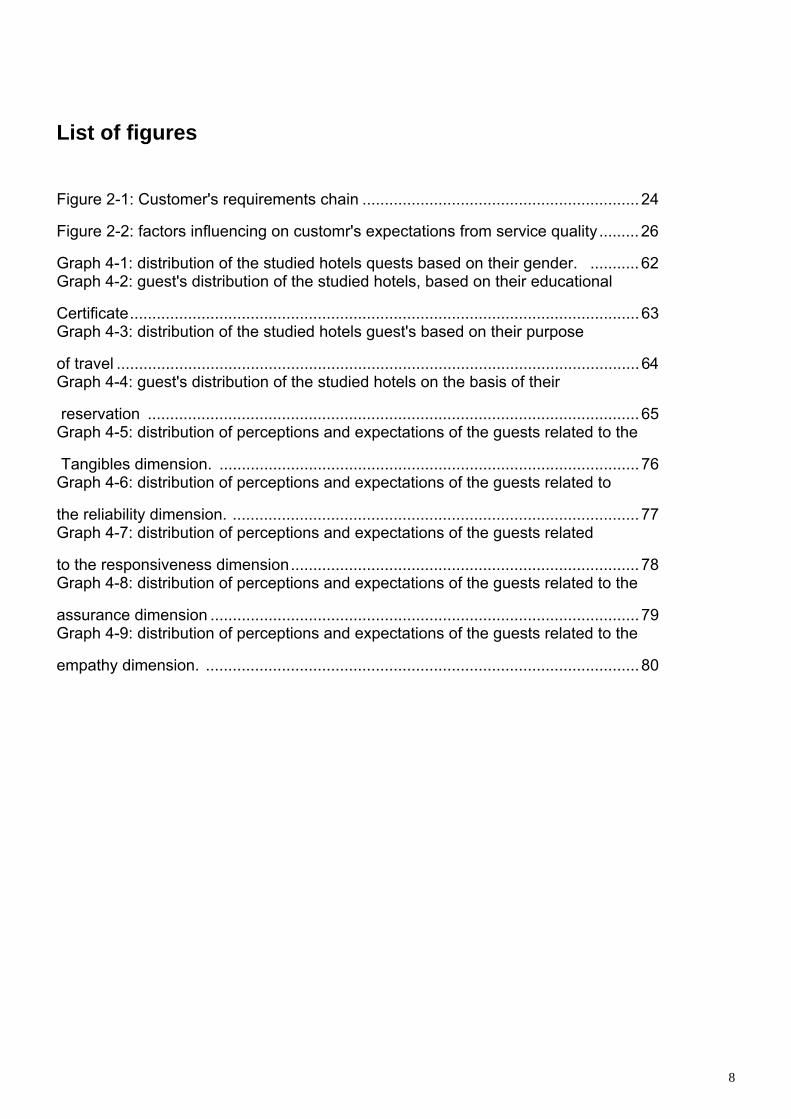
List of figures
Figure 2-1: Customer's requirements chain .............................................................. 24
Figure 2-2: factors influencing on customr's expectations from service quality ......... 26
Graph 4-1: distribution of the studied hotels quests based on their gender. ........... 62 Graph 4-2: guest's distribution of the studied hotels, based on their educational
Certificate.................................................................................................................. 63 Graph 4-3: distribution of the studied hotels guest's based on their purpose
of travel ..................................................................................................................... 64 Graph 4-4: guest's distribution of the studied hotels on the basis of their
reservation .............................................................................................................. 65 Graph 4-5: distribution of perceptions and expectations of the guests related to the
Tangibles dimension. .............................................................................................. 76 Graph 4-6: distribution of perceptions and expectations of the guests related to
the reliability dimension. ........................................................................................... 77 Graph 4-7: distribution of perceptions and expectations of the guests related
to the responsiveness dimension.............................................................................. 78 Graph 4-8: distribution of perceptions and expectations of the guests related to the
assurance dimension ................................................................................................ 79 Graph 4-9: distribution of perceptions and expectations of the guests related to the
empathy dimension. ................................................................................................. 80

9
Chapter 1
Introduction:
Obtaining an economic development in the purpose of increasing life standards in a
comprehensive level, is suitable for each society and necessary for human desire
improvements.
Mankind who lives in a proper society, tends to inquriy his needs in such aspects as, increasing
his knowledge and cognition, healthcare improvement, facility, social and personal
improvement, law sovereignty and creating a social environment along saftey and discipline.
In this respect, in the era of the modern economical history, many production and trade units,
have been developed and established along each other.
In the preceding decades, the tourism industry has become one of the most important monetary
industries.
This, very important industry, has many infrastructures and service institutions in its category, in
which, among the most important infrastructures, the hotel industry can be named out.
Hotels are one of the most important institutions in the field of tourism industry in providing
services.
Therefore, they play a sufficient role in improving and expanding the tourism industry and also
in improving and developing economic circumstances.
10
Nowadays, the customer satisfactin is a definite need for service organizations improvement as
hotels, and increasing profits , therefore maintaining, measuring systems and measuring
customer satisfaction as one of the most imporatnt aspects of quality improvement, which is the
basic need of the recent organizations, on the other hand, by developing the borders of the
global village, the necessity of indicating specified criteria in order to estimate the quality of
given products and provided services, is to measure the situation of the organizations in the
international competitive market, can be felt more than ever.
1-1-Statement of problem:
In this specific world, among the institutions and service companies, there exists so much
competetivness at this level, the most successful institution is the one in which, rather than
providing services and goods with a high quality, in the way of, managing policies, programming
and the applications of techniques and practical models, would be able to satisfy the customers
and go throught a lot of effort in maintaining their customer satisfaction.
Customer satisfaction is when the customer, feels that the specifications of a service is fixed
attached to his expectations.
Therefore, measuring the customer satisfaction, including the inner applications of a service
company can be point out which leads them to a higher quality. One important aspect which is
to be considered about customer satisfaction of a service company that is highly effective, is the
quality of the provided services.
In 1983, three researchers as parasuraman, Berry and Zethaml started a vast research on the
issue of service quality.
11
They achieved to this important issue of evaluation of the service quality, that in comparison
with the provided goods for the customers, it is much harder work.
they have also issued that, the criteria which is counted in the estimation of the service quality is
only valued by the customers and the rest of the evaluations are invalid by any other people
rather than the customers. On this basis the five main dimension that the customers use in
order to judge for service quality are explained as follow :
Tangibles:
Appearance of physical facilities, equipment, personnel and communication materials.
Reliability:
Ability to perform the promised service dependably and accurately.
Responsiveness:
Willingness to help customers and provide prompt service.
Assurance:
Knowledge and courtesy of employees and their ability to convey trust and confidence.
Empathy:
Caring, individualized attention the firm provides its customers.
To evaluate these five aspects of service quality, Parasuraman et al., designed “Servqual”
model. This model includes a questionnaire including 22 pairs of questions, half of these
12
questions related to customer's expectations and the other half are related to customer's
perceptions of services. Accordingly, service quality is assessed as follows:
Perceptions – expectations = Service Quality
"Servqual" has many applications. Its most important usage is keeping the track of the changes
in service quality of an organization which is acquired by making a periodic survey on
customers.
What's more, Servqual can also be used for both marketing studies and comparison of a service
with a similar service offered by rival companies (Parasuraman et al.., 1988).
To gain a comparative advantage over rival companies, any service organization should make
allowance for a performance evaluation system with which its overall status can be evaluated.
Today, tourism has turned into a major lucrative business worldwide. Besides, this industry has
provided countless job opportunities all around the world. Given the statistics released by UN in
the year 2000, about 700 million visitors traveled in different corners of the world. It is work
mentioning that this huge category, forms 11% of the whole world's employment. This industry
consists of many infrastructures and service companies. Hotels are of the paramount
importance in this field.
Therefore, hotels play a vital role in improving tourism in Iran and contribute to remarkable
economic growth in historical cities such as Isfahan whose eye-catching tourist attractions are
universally recognized.

13
So, the present research focuses on hotel industry. Consequently two 4-star hotels located in
Isfahan were chosen as samples and a survey was carried out in order to assess their customer
satisfaction according to Servqual model.
1-2: Importance of research:
Tourism is one of the most locative businesses in 21st century and it should be pointed out that
hotel industry, another words "hotel section" plays an important role in this regard. Hotels hold
the key role to success and development of Tourism and result in economic growth of a region
as a tourist resort.
Since this section directly deals with tourists and travelers, hotels play a big role in the tourist
satisfaction.
On the other hand, there is a boom in construction of luxurious hotels; however, it is absolutely
difficult to meet infinite variety of hotel guest's expectations.
To gain a comparative advantage over the rival hotels, hotel managers have to provide their
customers with the service quality and meet their expectations.
Achieving this goal "customer satisfaction" would be impractical unless hotel managers carry
out a periodical assessment on their customer satisfaction and quality improvement which are
the focus of the present study. Therefore, this study focuses on customer satisfaction of two 4-
star hotels in Isfahan (Aseman (A) and Aliqapoo (B) ) chosen as the two sample hotels, on the
basis of Servqual model.

14
Besides, it can bring this section into limelight and be beneficial for hotel managers and the
hotel industry in Iran, particularly in Isfahan.
1-3- Research objectives
The main objectives of the present research are based on 5 dimensions of Servqual tools
including: Tangibles, Reliability, Responsiveness, Assurance and Empathy which are served as
5 criteria for making a judgment about quality of provided services by hotel guests. This way,
customer satisfaction can be evaluated into the bargain.
1. Indication of a difference between provided services and customer's expectations in terms of
Tangibles in studied hotels.
2. Indication of a difference between provided services and customer's expectations in terms of
reliability (ability to program the promised service dependably and accurately) in studied hotels.
3. Indication of a difference between provided services and customer's expectations in terms of
responsiveness (willingness to help customers and provide prompt service) in studied hotels.
4. Indication of a difference between provided services and customer's expectations in terms of
assurance (knowledge and curtsey of employees and their ability to convey trust and
confidence) in studied hotels.
5. Indication of a difference between provided services and customer's expectations in terms of
empathy (caring individualized retention the firm provides its customers) in studied hotels.

15
1-4: Research questions:
1. Is there a difference between provided services and customers' expectations in terms of
Tangibles in studied hotels?
2. Is there a difference between provided services and customers' expectations in terms of
Reliability in studied hotels?
3. Is there a difference between provided services and customers' expectations in terms of
Responsiveness in studied hotels?
4. Is there a difference between provided services and customers' expectations in terms of
Assurance in studied hotels?
5. Is there a difference between provided services and customers' expectations in terms of
empathy in studied hotels?
1-5: Definition of terms:
1. Customer: Either a natural or a juridical person who is somehow in connection with an
organization and receives its goods or services.
2. Customer satisfaction: Is a state when the customer feels a product or a service meets
his/her expectations. (Juran, 1992)

16
3. Service: A series of intangible, activities throughout interactions between customers and
service employees or physical resources/goods and service companies which are presented as
a solution for customers' problems. (Gronroos, 1990, P.279).
4. Expected service: It is the same ideal service which is desired by a customer (Parasuraman,
et al.1991).
5. Quality: It consists of a collection of specifications of a product or a service which meets
expectations of a customer and are indicated by the customer neither the producer nor a
service company. (David Garvin, 1987).
6. Service quality: The difference between customer's expectations and that of his perceived
concept of real performance of service. (Zethaml & Bitner, 1996).
7. Expectations: The same ideal service which is desired by a customer before his entering to
an organization.
17
Chapter 2
Literature Review
Introduction:
In today’s world and in this competitive market, trading and service-delivering organizations all
over the world attempt to achieve a specific and distinguished position over other competitors
through getting unique advantages to fulfill their customers' satisfaction and consequently to
create resoluteness and loyalty in them. On the other hand, customers and consumers also are
always in seek of suppliers that offer goods and services of much better quality and meet their
expectations. But, as there are suppliers or service organization supplying products with
relatively equal quality, most customers, when buying goods and/or receiving required services,
are able to select multiple choices, that is, they consider other quality indexes apart from
apparent specifications of product. Therefore, today service-delivering organizations should
recognize these indexes in the arena of their own business and careers to retain survive and
increase the productivity, to respond their customers' expectations and, in this way, they strive
to meet the customers' satisfaction as much as possible.
In this respect, considering “service quality” and customer satisfaction in hotel keeping industry
is of great importance as one of the significant infrastructures of tourism industry.
Therefore, it is necessary to apply appropriate means and procedures for recognition and
improvement of services so much as possible to satisfy hotel guests and customers and since in
two recent decades the “Servqual” model has been recognized as an efficient means for

18
measuring service quality in service-delivering organizations, it has been served in this research
as well.
2.1. Quality
2.1.1. Definition of quality:
The term of “quality” has many definitions and interpretations, but the general definition having
been applied in this research is as follows:
“A measure of the extent to which the service delivered meets the customer’s expectations.”
2.1.2. Different Views on quality basis:
Firstly, David Garvin (1987, p. 109) has classified quality as follows:
A. Product-based quality:
In this respect, certain features and specifications of product are taken into account, which are
measurable and at the same time are representing a higher quality as well.
B. Goods specifications-based quality:
In this viewpoint, the experts introduce specific features of a product or service and the closer
the manufactured product to these features, the higher quality is considered.
C. Consumer-based quality:
According to this basis, the consumer is the determinant of the quality of goods and services,
based upon his vision, the types of goods and a service that satisfies his needs, are in high
19
quality. More truly, in this point of view customer satisfaction and the quality of service are to be
known as a unity.
D. Costs-based quality:
This viewpoint mainly emphasizes the element of price; in other words, on the basis of this
viewpoint, the quality of a product or goods would be its accepted price and logical cost.
With regard to the fact that in today’s competitive world, consideration of customer’s needs and
expectations and subsequently fulfillment of customer’s satisfaction is one of the most important
organizations’ success factors, in this research we will follow the viewpoint C above.
2.2. Services:
2.2.1. Definition of services:
Many definitions have been proposed for services, but all have common aspects as intangibility
and immediate consumption. Here are some definitions for services as follows:
- Services are attitudes, processes and functions. (Zethaml & Bitner, 1996, p. 50)
- Service is an act or activity, necessarily immovable and intangible, suggested by one
transaction party to another one that would lead to the ownership of no external object. Service
production may attach to physical goods or not. (Kotler & Armstrong, 1990, p. 809)
- Services include recognizable and necessarily immovable activities which meet a need and
Its attachment to goods sale or other services is not of necessity. (Stanton, 1986)
20
2.2.2. Specifications of services:
Four main features distinguish services from goods which are as follows:
(Fitzsimons, 2001)
1. Simultaneity: The fact that the services are consumed at the same time when they are
generated and that the services cannot be stored is a fundamental feature in service
management. A product can be inspected before delivery, but a service should be evaluated in
other ways to be assured of its quality.
2. Perishability: A service is a perishable object or goods. An airplane seat or unoccupied rooms
in hospital or hotel or a leisure hour of a dentist are examples for useless opportunities. Since a
service cannot be stored, it would be annihilated forever and could not be used. Fully
application of service capacity would transform to a management challenge, because
customer’s demand continuously changes and one cannot respond to these demands through
making inventory.
3. Intangibility: Services are beliefs and concepts, and goods are objects. Therefore, one can
not maintain moral ownership right for innovations in services and patent and registry rights for
innovator. When buying a product, the customer can see it, touch it and test its function before
purchasing. But, in case of a service, the customer should rely on and satisfy with service-
delivering company’s fame and credit.
4. Heterogeneity: Integrating the intangibility nature of services on one hand participates with
the customer as a person available in service delivery system and, on the other hand, makes
difference in services from one customer to another. In services, working activity generally

21
focuses on staff rather than objects.
But, there are exceptions especially in information processing services e.g. communications.
2.2.3. Service Package:
Service managers encounter many problems on recognition of a product. These problems, to
some extent, are due to intangibility of services, but this is the customer’s presence in process
that causes concern about full experience of services. For instance, when it comes to a
restaurant, the space and environment governing thereon is as important as the foods are
served therein because going restaurant for most customers is regarded as a way for gathering
friends together. Bank client's view is formed quickly and through the attitude of the bank’s clerk
toward him or her.
Service package is a collection of goods and services, which is presented and delivered in an
environment. This collection has the following features:
1. Supporting facility: is a cluster of physical resources that should be available in place before
service delivery. For example, we can refer to a golf course, a hospital and an airplane.
2. Facilitating goods: are the materials being purchased or used by service receiver, or the
items prepared by customer such as a golf club, skiing sticks, food products, auto spare parts
and legal documents.
3. Explicit services: are tangible and observable advantages. Of these services, one can refer to
termination of a toothache after its being recovered, a good automobile after being tuned up and
urgent arrival of fire fighters to accident place.

22
4. Implicit services: are non-material and moral advantages that customer feels in an indefinite
way. Of these kinds of services, one can refer to privacy and confidential of a loan granting
bureau or repairing a car without any mental disturbance.
Customer experiences all above features and judges them on the basis of his or her perception
of services. Therefore, service manager should provide his or her customer with a full
experience conforming to desired service package. For instance, in a cheap hotel, a cement-
block building with plain furniture is regarded as supporting facilitates. Soap and food are also
considered as the least facilitating goods. Explicit services include a comfortable bed in a clean
room and implicit services include friendly attitude of receptionist and the security of a parking
lot with sufficient light.
Any distortion from this service package e.g. employing a porter will increase hotel costs and
will damage its mode of cheapness. (Sasser et al, 1978, p. 11)
2.3. Customer:
Customer is the most important factor in goal setting, activity and trying for quality improvement.
Therefore, in this section we will pay to definition of customer as well as recognition of customer
and his or her needs.
2.3.1. Definition of customer:
Customer is a real or legal person who somehow relates to organization and benefits from its
goods and services.
23
Juran (1990) stated the concept of customer as: "Most people suppose that customer is the final
consumer whereas the customer is both categories of the intra organizational and the extra
organizational, i.e. whoever the product and/or service are produced to meet his or her need.
2.3.2. Recognition of customers:
In the opinion of “Schlesinger & Heskitt,1991”, knowing that “Who are the customers exactly?"
though seems to be the most commonplace aspect of customer satisfaction measure but, at the
same time, it can be the most important and most complex feature thereof and if ignored it
would turn to the most vulnerable customer satisfaction program. They divide the customers into
two distinct groups:
1. External customers (extra organizational): a kind of external customer that immediately
comes to mind is final consumer who consumes or uses products for his or her own production
or usage. But, there are other groups of external customers recognized who are available in
products distribution channel between organization and final consumer. These intermediate
external customers include distributors, producers’ representatives and, etc. The satisfaction of
other types of external customers can also be of significance as final consumers’ satisfaction for
organization long-term success.
2. Internal customers (intra organizational): This category of customers is the organization staffs
themselves who use products and services made by other people or organizational units.
Today, the staff is of so value for services execution that organizations often make great efforts
to satisfy them.
24
2.3.3. Customers' needs
(Hayes’ 1998) defines the customers' needs as follows: “features of a product or service, which
indicate its significant dimensions”. He suggests that for making researches on customer's
satisfaction these dimensions should be applied in the form of particular examples or phrases
relevant to their function.
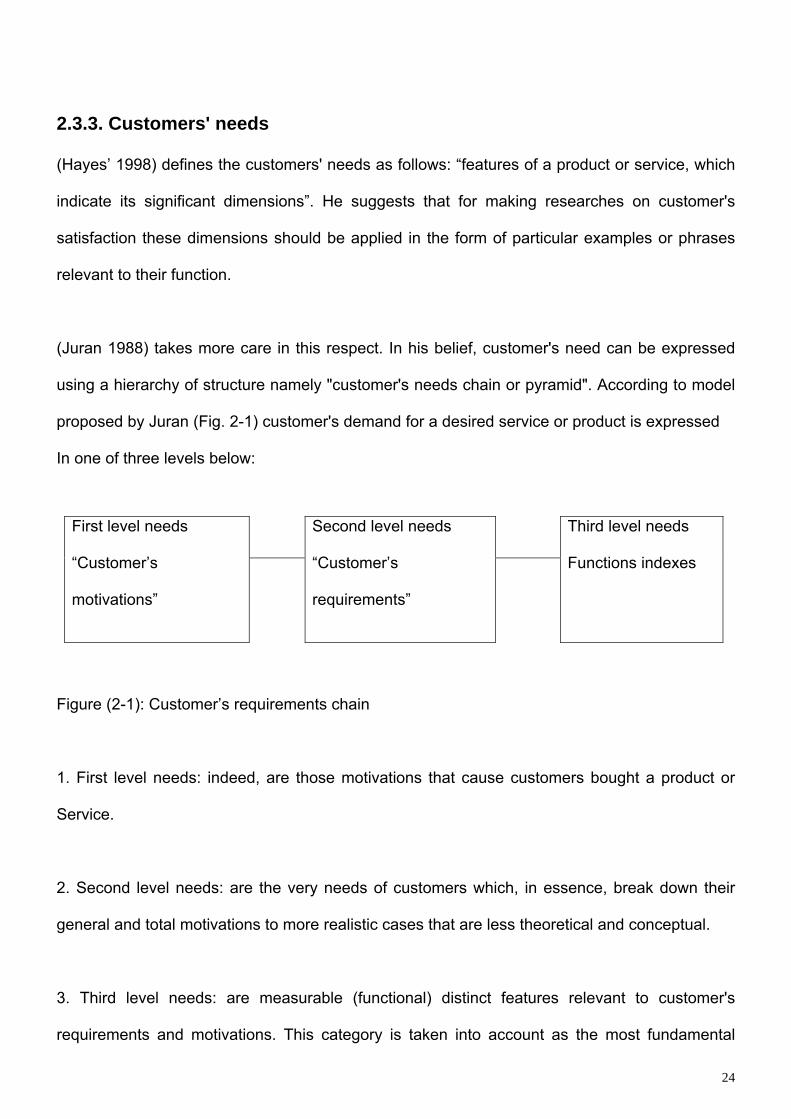
(Juran 1988) takes more care in this respect. In his belief, customer's need can be expressed
using a hierarchy of structure namely "customer's needs chain or pyramid". According to model
proposed by Juran (Fig. 2-1) customer's demand for a desired service or product is expressed
In one of three levels below:
First level needs
“Customer’s
motivations”
Second level needs
“Customer’s
requirements”
Third level needs
Functions indexes
Figure (2-1): Customer’s requirements chain
1. First level needs: indeed, are those motivations that cause customers bought a product or
Service.
2. Second level needs: are the very needs of customers which, in essence, break down their
general and total motivations to more realistic cases that are less theoretical and conceptual.
3. Third level needs: are measurable (functional) distinct features relevant to customer's
requirements and motivations. This category is taken into account as the most fundamental
25
(and the most common) means for the evaluation of customer satisfaction with products or
services, and indeed in this level the organizations' questions about the service or product
functions are asked from the customers.
2.3.4. Factors influencing on customer's expectations:
Recognition of factors, which influence customer’s expectations, will help the suppliers applying
appropriate procedures to modify customer's expectations and to provide customers with
service proportion to thereof.
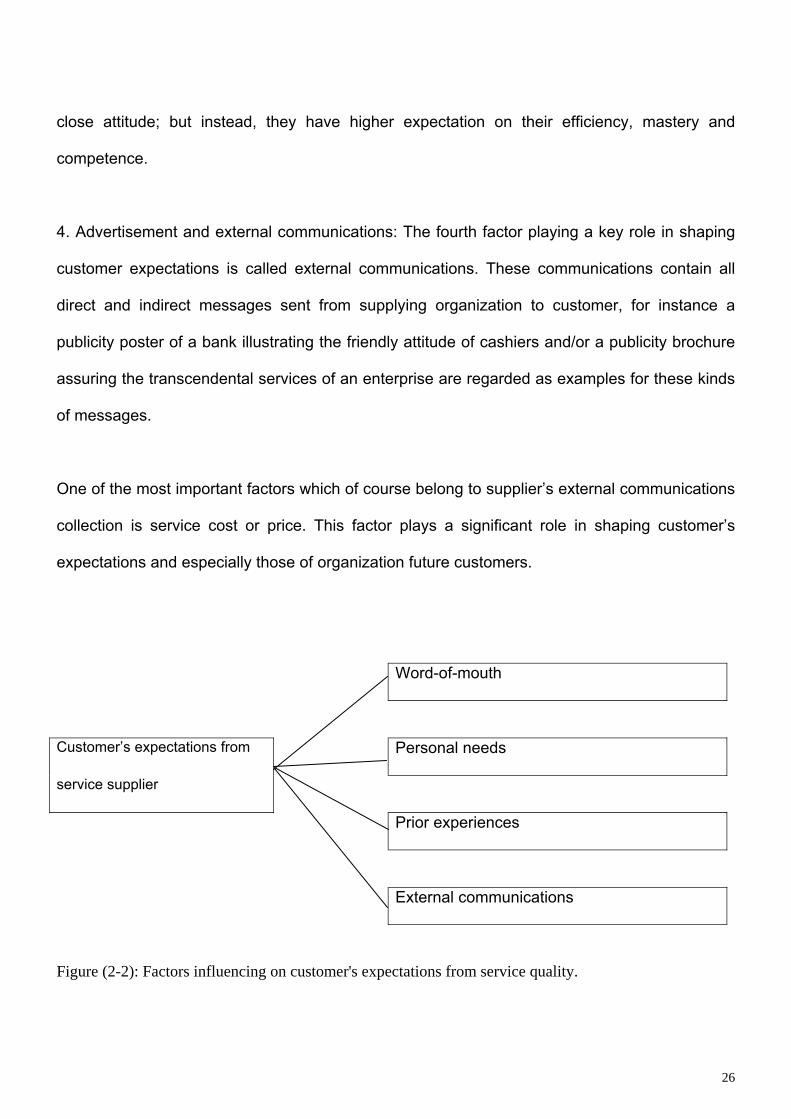
During their study on customer's comments, “Parauraman et al, 1990" have mentioned four key
factors in shaping customers' expectations.
1. Word-of-mouth: The first factor, which potentially determines customer’s expectations, is the
word he or she has heard from other customers and is referred to as “word-of-mouth”.
2. Personal needs: The second factor that to a certain extent modifies consumer’s expectations
is obtained as a result of particular situations and requirements and is called “personal needs.
These needs are customer’s particular physical, moral and mental situations or states, which
greatly affect other, people and are oriented by the latter. For example, some customers
compared to other needier ones, are more sensitive and have more expectations from services.
3. Prior experiences: is the third factor influencing on customers’ expectations. For instance, by
interviewing the customers of negotiable paper offering enterprises it appeared that customers
with higher experience have lower expectations about agents' modes of behavior, i.e. polite and
26
close attitude; but instead, they have higher expectation on their efficiency, mastery and
competence.
4. Advertisement and external communications: The fourth factor playing a key role in shaping
customer expectations is called external communications. These communications contain all
direct and indirect messages sent from supplying organization to customer, for instance a
publicity poster of a bank illustrating the friendly attitude of cashiers and/or a publicity brochure
assuring the transcendental services of an enterprise are regarded as examples for these kinds
of messages.
One of the most important factors which of course belong to supplier’s external communications
collection is service cost or price. This factor plays a significant role in shaping customer’s
expectations and especially those of organization future customers.
Word-of-mouth
Customer’s expectations from Personal needs
service supplier
Prior experiences
External communications
Figure (2-2): Factors influencing on customer's expectations from service quality.

27
2-4. Customer Satisfaction
Customer satisfaction is an important topic for both researchers and managers, because a high
level of customer satisfaction leads to an increase in repeat patronage among current
customers and aids customer recruitment by enhancing an organizations marker reputation.
Being able to successfully judge customers’ satisfaction levels and to apply that knowledge are
critical starting points to establishing and maintaining long term customer retention and long
term competitiveness (Yuksel & Yuksel, 2002). Customer satisfaction brings many benefits.
Satisfaction increases customer retention and customer retention is dependent on the
substance of the relationship between parties which is also affected by the service delivered.
Satisfaction is an “overall customer attitude towards a service provider”, or an emotional
reaction to the difference between what customers anticipate and what they receive (Zineldin,
2000), regarding the fulfillment of some need, goal or desire. For most products or services,
aspects of performance can be objectively assessed. Although these attributes can be
objectively measured, customers’ assessments may not objectively reflect measured
performance. Some clients may be taken to several homes that “fit” their criteria but are
unsuitable to the clients’ personal taste which leads to the client’s assessment of the service as
being unpleasant because they did not see listings that they liked.
Kano, Bentler and Li-tze (1984) developed a model to categorize the attributes of a product or
service based on how well they are able to satisfy customer needs. Considering Kano’s model,
one sees how it may not be enough to merely satisfy customers by meeting only their basic and
performance needs. In a highly competitive marketplace, organizations need to adopt strategies
28
and to create product attributes targeted specifically at exciting customers and over-satisfying
them (Tan & Pawitra, 2001). In real estate to excite or over satisfy customers, an agent would
need to have a thorough and vast knowledge of all listings in the local area.
In essence, it is the experience and attitudes of the individuals in closest contact with customers
that are most likely to affect whether or not customers are satisfied and willing to return to the
company. It is also the people in direct contact with customers who determine who the retained
and satisfied customers are, and their experience determines how they treat the customers
(Hansemark & Albinsson, 2004) thus impacting on the service quality delivered.
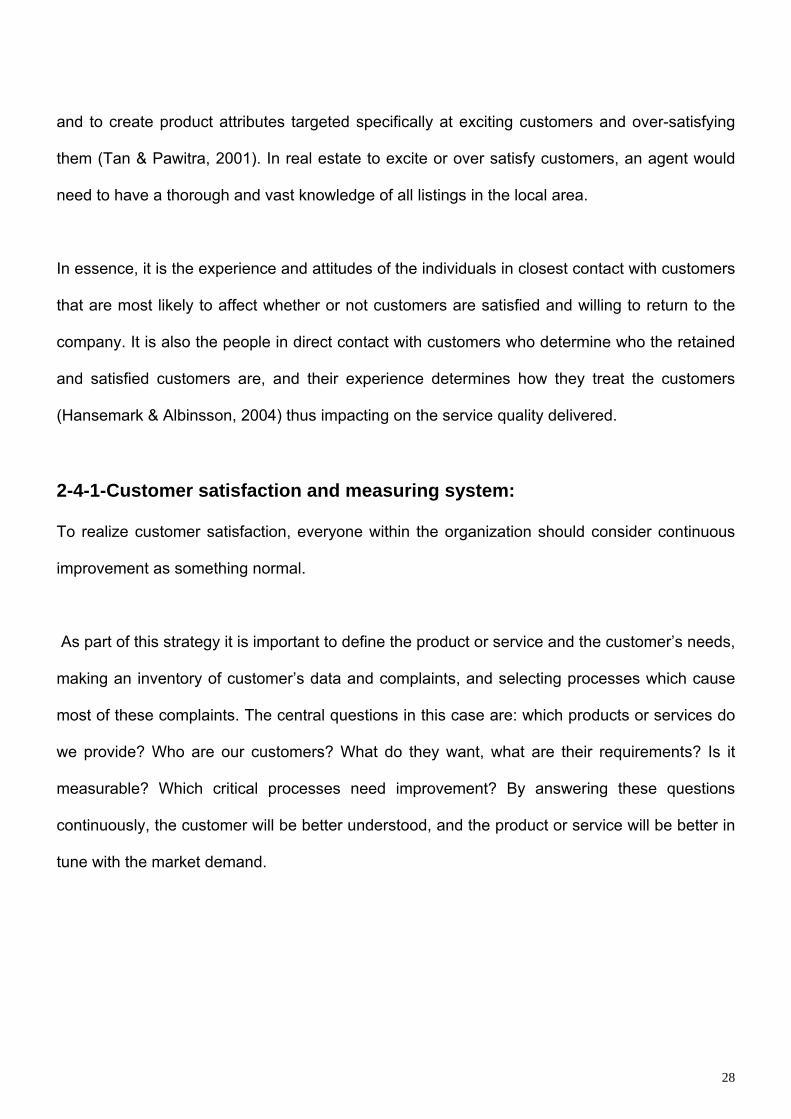
2-4-1-Customer satisfaction and measuring system:
To realize customer satisfaction, everyone within the organization should consider continuous
improvement as something normal.
As part of this strategy it is important to define the product or service and the customer’s needs,
making an inventory of customer’s data and complaints, and selecting processes which cause
most of these complaints. The central questions in this case are: which products or services do
we provide? Who are our customers? What do they want, what are their requirements? Is it
measurable? Which critical processes need improvement? By answering these questions
continuously, the customer will be better understood, and the product or service will be better in
tune with the market demand.
29
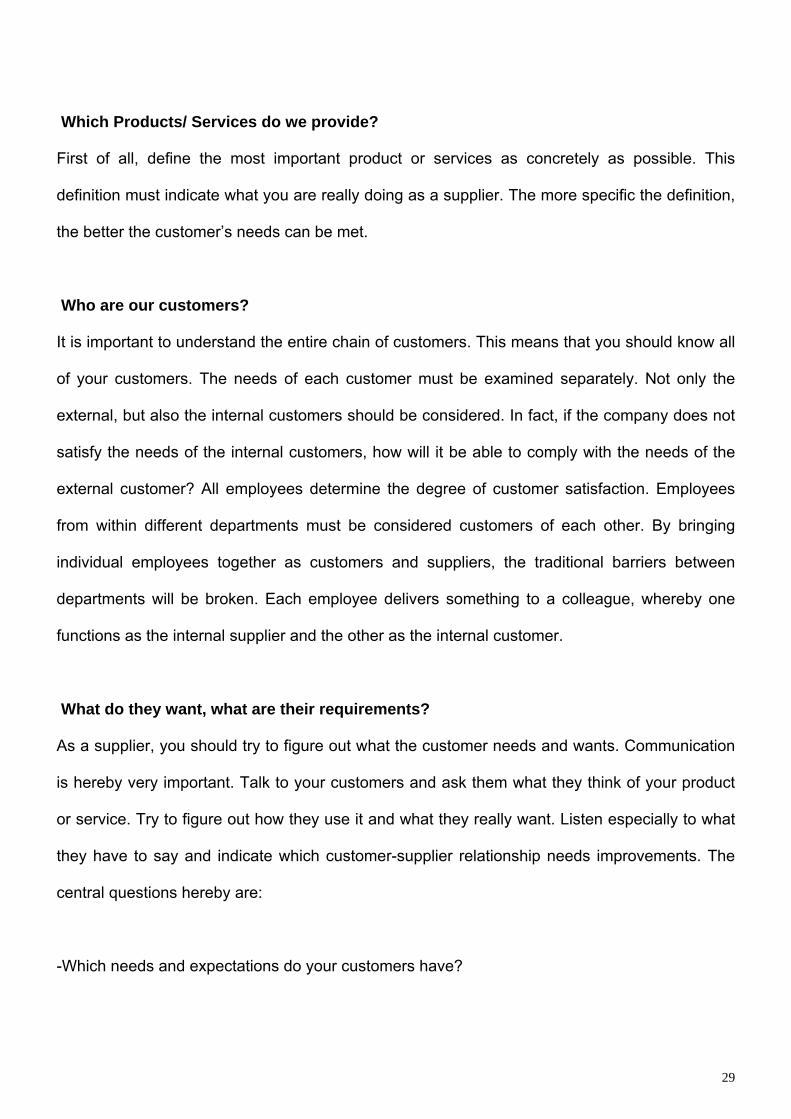
Which Products/ Services do we provide?
First of all, define the most important product or services as concretely as possible. This
definition must indicate what you are really doing as a supplier. The more specific the definition,
the better the customer’s needs can be met.
Who are our customers?
It is important to understand the entire chain of customers. This means that you should know all
of your customers. The needs of each customer must be examined separately. Not only the
external, but also the internal customers should be considered. In fact, if the company does not
satisfy the needs of the internal customers, how will it be able to comply with the needs of the
external customer? All employees determine the degree of customer satisfaction. Employees
from within different departments must be considered customers of each other. By bringing
individual employees together as customers and suppliers, the traditional barriers between
departments will be broken. Each employee delivers something to a colleague, whereby one
functions as the internal supplier and the other as the internal customer.
What do they want, what are their requirements?
As a supplier, you should try to figure out what the customer needs and wants. Communication
is hereby very important. Talk to your customers and ask them what they think of your product
or service. Try to figure out how they use it and what they really want. Listen especially to what
they have to say and indicate which customer-supplier relationship needs improvements. The
central questions hereby are:
-Which needs and expectations do your customers have?

30
-Which needs and expectations do you know?
-To what extent do you comply with the needs and expectations of your customers?
-If you do not satisfy their needs, what is the reason according to your customers?
Making an inventory of customer’s data, customers’ complaints and benchmarking are important
opportunities to improve the customer orientation of the organization.
Information about the opinion of the customer regarding a product or service is of essential
importance, and can be obtained in several ways, such as customer surveys, phone interviews,
and customer panel discussions. Customer surveys are a powerful tool to get information about
what the customer thinks and expects. In general, questionnaires are used with different
questions, which may vary from organization to organization.
Is it measurable?
To comply with the needs of the customer, it is necessary to translate these into product
specifications. Quality function deployment is a practical technique to do this. Usually, it is
necessary to negotiate with the customer, which results in feasible and agreed on customer’s
requirements, which are measurable and understood by all parties. All statements of the
customer about qualitative aspects must be translated into quantitative specifications for the
supplier. Define clearly and explicitly what they are talking about.
31
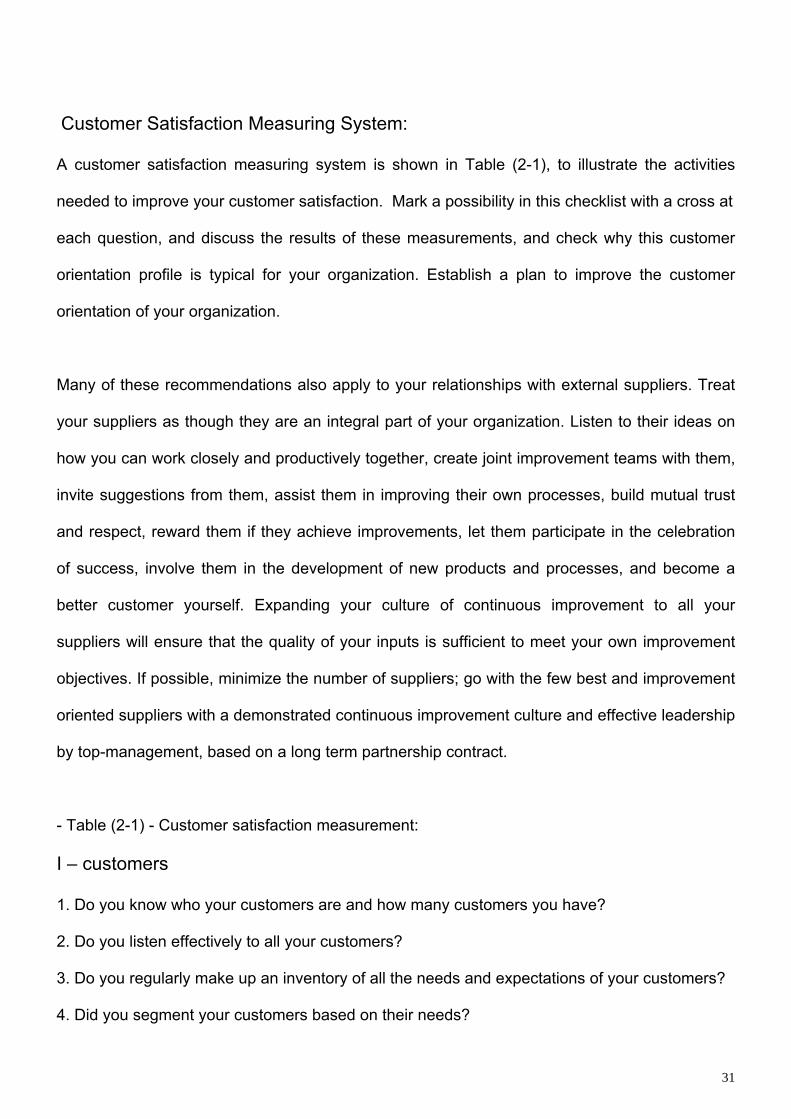
Customer Satisfaction Measuring System:
A customer satisfaction measuring system is shown in Table (2-1), to illustrate the activities
needed to improve your customer satisfaction. Mark a possibility in this checklist with a cross at
each question, and discuss the results of these measurements, and check why this customer
orientation profile is typical for your organization. Establish a plan to improve the customer
orientation of your organization.
Many of these recommendations also apply to your relationships with external suppliers. Treat
your suppliers as though they are an integral part of your organization. Listen to their ideas on
how you can work closely and productively together, create joint improvement teams with them,
invite suggestions from them, assist them in improving their own processes, build mutual trust
and respect, reward them if they achieve improvements, let them participate in the celebration
of success, involve them in the development of new products and processes, and become a
better customer yourself. Expanding your culture of continuous improvement to all your
suppliers will ensure that the quality of your inputs is sufficient to meet your own improvement
objectives. If possible, minimize the number of suppliers; go with the few best and improvement
oriented suppliers with a demonstrated continuous improvement culture and effective leadership
by top-management, based on a long term partnership contract.
- Table (2-1) - Customer satisfaction measurement:
I – customers
1. Do you know who your customers are and how many customers you have?
2. Do you listen effectively to all your customers?
3. Do you regularly make up an inventory of all the needs and expectations of your customers?
4. Did you segment your customers based on their needs?

32
5. Do you routinely conduct surveys among your customers about your products and services?
6. Are all your employees informed about the results of these surveys?
7. Are more than 75 percent of your customers satisfied?
8. Do you anticipate customer needs?
9. Do you treat each customer as unique?
10. Are complaints replied to whit in two days and solved within one week?
11. Do you stimulate customers to register their complaints?
12. Do you use e-business tools to communicate with customers?
13. Do you have a customer’s helpdesk or a call center?
14. Do you know which percentage of the customers who terminated their relationship with your
organization did this out of dissatisfaction?
15. Are complaints systematically registered and analyzed in your organization?
16. Did you establish complaints handling procedures and are these routinely used in your
organization?
17. Do you measure the degree of customer loyalty?
18. Do you make recommendations to customers about the products or services that best suit
their needs?
19. Do you know what the costs are when you lose a customer?
20. Do you know what the costs are to gain a new customer?
21. Do you know how much sales you lose due to unsatisfied customers?
22. Do you regularly visit your customers?
23. Do you regularly organize meetings with customers groups to learn about their needs,
wants, ideas, and complaints?

33
II. Leadership
24. As a manager, do you know how many complaints are received yearly?
25. is there commitment at top-management for customer orientation?
26. Did you integrate customer satisfaction into the norms and values of the organization?
27. Are these norms and values clearly communicated to all your customers?
28. Does management recognize visible trends and do they anticipate these in a timely
manner?
29. Is management convinced of the importance of satisfied customers and do they act
accordingly?
30. Does management try to express the importance of satisfied customers to the
organization at every occasion?
31. Does management set a good example with regard to customer friendly behavior?
32. Is management open to suggestions and ideas of customers?
33. Does management personally reward those employees who deliver a valuable contribution
to increased customers satisfaction?
34. Are relationships with customers reasonably supported and stimulated by
management?
35. Is management at all times available to the customer?
36. Does customer satisfaction also belong to the evaluation criteria of management?
37. Are the customers’ wishes continuously taken into consideration when taking decisions?
38. Does top management also personally handle complaints of customers?
39. Do all members of management in the company have personal contact with external
customers at least once a week?
34
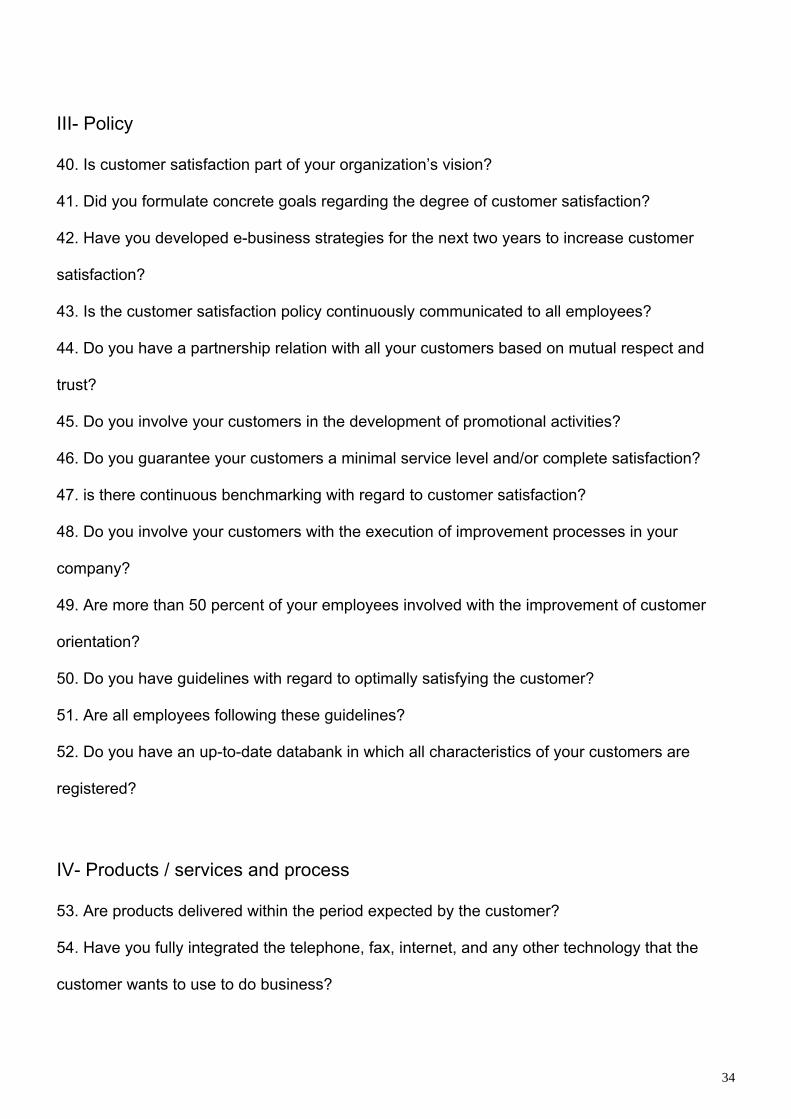
III- Policy
40. Is customer satisfaction part of your organization’s vision?
41. Did you formulate concrete goals regarding the degree of customer satisfaction?
42. Have you developed e-business strategies for the next two years to increase customer
satisfaction?
43. Is the customer satisfaction policy continuously communicated to all employees?
44. Do you have a partnership relation with all your customers based on mutual respect and
trust?
45. Do you involve your customers in the development of promotional activities?
46. Do you guarantee your customers a minimal service level and/or complete satisfaction?
47. is there continuous benchmarking with regard to customer satisfaction?
48. Do you involve your customers with the execution of improvement processes in your
company?
49. Are more than 50 percent of your employees involved with the improvement of customer
orientation?
50. Do you have guidelines with regard to optimally satisfying the customer?
51. Are all employees following these guidelines?
52. Do you have an up-to-date databank in which all characteristics of your customers are
registered?
IV- Products / services and process
53. Are products delivered within the period expected by the customer?
54. Have you fully integrated the telephone, fax, internet, and any other technology that the
customer wants to use to do business?
35
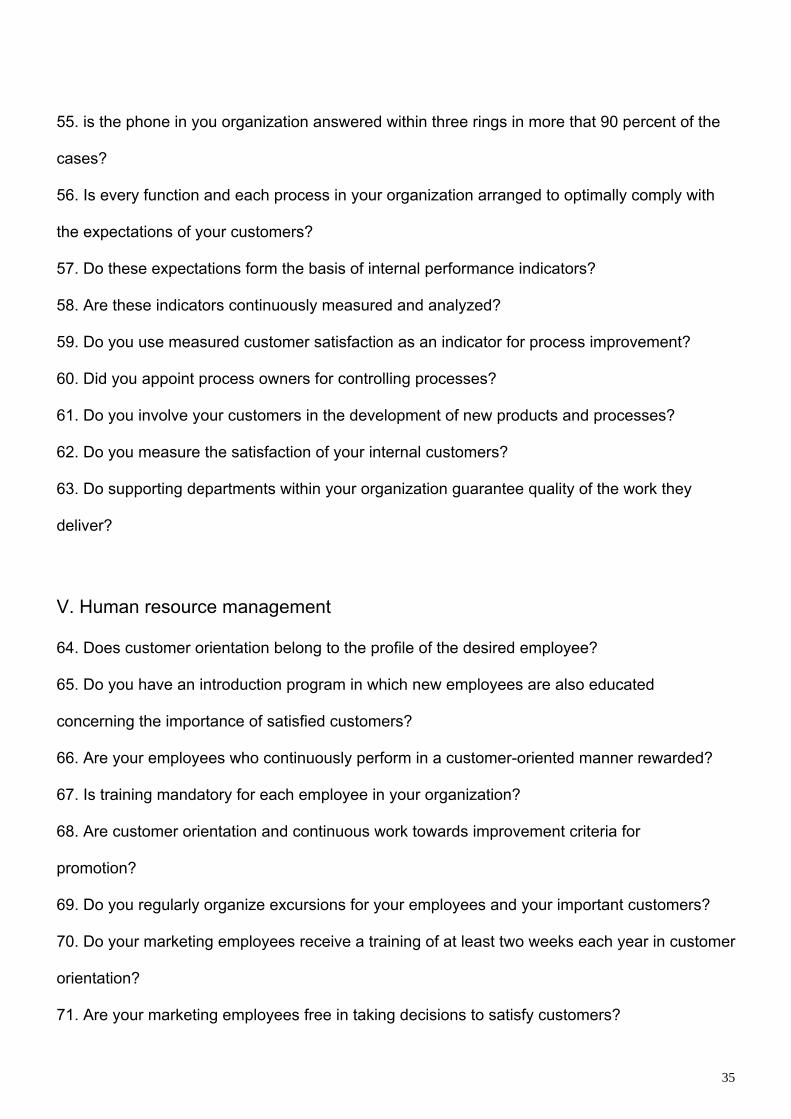
55. is the phone in you organization answered within three rings in more that 90 percent of the
cases?
56. Is every function and each process in your organization arranged to optimally comply with
the expectations of your customers?
57. Do these expectations form the basis of internal performance indicators?
58. Are these indicators continuously measured and analyzed?
59. Do you use measured customer satisfaction as an indicator for process improvement?
60. Did you appoint process owners for controlling processes?
61. Do you involve your customers in the development of new products and processes?
62. Do you measure the satisfaction of your internal customers?
63. Do supporting departments within your organization guarantee quality of the work they
deliver?
V. Human resource management
64. Does customer orientation belong to the profile of the desired employee?
65. Do you have an introduction program in which new employees are also educated
concerning the importance of satisfied customers?
66. Are your employees who continuously perform in a customer-oriented manner rewarded?
67. Is training mandatory for each employee in your organization?
68. Are customer orientation and continuous work towards improvement criteria for
promotion?
69. Do you regularly organize excursions for your employees and your important customers?
70. Do your marketing employees receive a training of at least two weeks each year in customer
orientation?
71. Are your marketing employees free in taking decisions to satisfy customers?

36
72. Are your marketing employees free to spend what is necessary to correct a mistake made
with a customer?
73. Do you involve your employees in improvement projects about increasing customer
satisfaction?
74. Do you stimulate your employees to generate ideas about increasing customer
satisfactions?
75. Are the employees’ interest and the interest of the customer related?
2-5. Service quality
The concept of service quality as a whole construct is large and varied. The theory has been
elaborated on by many researchers. Berry, Parasuraman and Zeithaml (1985) write service
quality as perceived by consumers stems from a comparison of what they feel service firms
should offer (i.e. from their expectations) with their perception of the performance of the firm
providing the services. Perceived service quality is therefore viewed as the degree and direction
of discrepancy between consumers’ perceptions and expectations. For example in real estate,
this would be what the client is expecting from the agent in comparison to which is actually
delivered by that agent.
In real estate, that interaction occurs from the moment the client and agent speak either verbally
or electronically. It is evident that research on goods quality is inadequate in the service field,
which has three inherent characteristics: intangibility, heterogeneity and inseparability between
production and consumption (Berry, Parasuraman and Zeithmal, 1985).
37
2-5-1. The Customer’s Perspective of Service Quality
Service quality is usually expressed as a function of customers’ expectations of the service to
be provided (based upon their previous experience, the organizations image, the price of the
service for example) compared with their perceptions of the actual service experience
(Gronroos, 1984; Berry et al, 1985; Johnston and Heineke, 1998). Perceptions are defined as
the consumer’s judgment of the service organization’s performance. However, Parasuraman et
al (1988) delve deeper and define the service performance gap as the discrepancy between the
specifications of service and the delivery (Chenet, Tynan & Money, 2000).
Imrie, Cadogan and McNaughton (2002) study shows that using service quality as a key point of
marker differentiation positively influences customer retention and market growth (Buzzell and
Gale, 1987; Jacobson and Aaker, 1987).
Kelley (1992) argues that customer orientation plays a more important role in service firms than
in any other firms because of the intangibility, heterogeneity and inseparability of service (Berry,
Parasuraman and Zeithaml, 1985). In an attempt to establish a competitive advantage,
marketing practioner’s often seek to differentiate their service offering upon service quality, a
vital element to real estate due to the large amount of agents and competition. Berry et al.,
(1985) state that the benefits of differentiating on the basis of a service quality platform are
significant in respect to both defensive and offensive strategies which is particularly relevant to
real estate as there are limited elements of differentiation between companies. Commissions
are generally the same as is the access to listings particularly when most companies will in
together to get a deal through.

38
Kellogg (2000) states that customers have contact with the service delivery system in three
ways: directly, being physically present; indirectly, via a surrogate, such as paper or some
electronic media, or with no contact. However, Gronroos argues that employee performance
constitutes the service as far as customers are concerned (Hartline et al., 2003). Within the real
estate industry Kellogg’s (2000) statement is more apt as this can often be the first contact.
In many cases, customer contact employees are the first and only representative of a service
firm. Therefore, customers often base their impressions of the firm largely on the service
received from customer contact employees (Hartline and Mckee, 2000). Johnston and Heineke
(1998) summaries that if a customer expects a poor performance then they may be satisfied
with a poor performance. This is one of the paradoxes of service quality as identified by
Gronroos (1989). This would also be affected by nationality and culture, where expectations can
differ greatly.
However, there is extensive literature in the field of social psychology on the effects that
passage of time has on attitudes and perceptions. Abercrombie (1967) pointed out that
perceptions are not stable over time by stating that : with the passage of time, experiences,
which at first were defined and separate from each other, tend to become associated and
confused, this particularly occurs in real estate if a client has been out with many agents from
different companies and seen a number of listings. It is not so much that we actually forget
things, but that we do not remember them correctly (O’Neill & Palmer, 2001).
The most common explanation of the difference between service quality and satisfaction is that
perceived service quality is a form of attitude, a long-run overall evaluation, whereas satisfaction
is a transaction-specific measure (Bitner, 1990; Bolton & Drew, 1991; Parasuraman, Zeithaml

39
and Berry, 1988). Parasuraman et al., (1988) further suggest that the difference lies in the way
disconfirmation is operationalized. They sate that in measuring perceived service quality the
level of comparison is what a consumer should expect, whereas in measures of satisfaction the
appropriate comparison is what a consumer would expect.
2.5.2. The Manager’s Role in Service Quality
The first conceptual model of service quality was developed by Gronroos to enhance
understanding of consumers’ service quality perceptions and the factors that influence those
perceptions. According to the model, consumers’ perceptions of service quality results from an
evaluation process, in which consumers’ expectations are compared with their perceptions of
the service actually delivered (Mangold & Emin, 1990).
It is suggested that managers need to understand the types of service quality factors for their
own service(s) and understand their various relationships between perception and performance
in order to design, measure and control their service. Service levels need to be set and
strategies devised, that first recognize the relative impact of individual factors on overall
perceptions and secondly, link them to the organization’s quality strategy (Johnston & Heineke,
1998).
Swan and Trawick (1979) divide the customer’s expectations into two types – desired
expectation, that is to say the wanted performance level– and foretold expectation, the
performance level that is predicted to happen. Kellogg (2000) also divides customer’s
expectations into two traits; furthermore, Kellogg (2000) goes on to define the implications:
permanence implies that the changes provided by the service are expected to last. Its

40
conceptual opposite is transience, that is, the results of the service, will fade with time.
Reversibility implies the ability to undo the effects of the service (Kellogg, 2000).
Most writers agree that customers’ expectations are rarely concerned with single aspect of the
service package, but rather with many aspects. Gronroos (1984), for example, investigates an
attitudinal construct, resulting from the discrepancy between consumers’ expectations and their
perceptions of the quality of service actually delivered (Mangold & Emin, 1990).
Furthermore, when decision makers in service organist ions, such as banks and hospitals are
asked what constitutes quality in their services, the answers are less well-defined and tend to
vary more from individual to individual. Consequently, the measurement, monitoring and
improvement of quality is an elusive task in many service organizations. While the concept of
service quality is difficult to define, the fact is, that both consumers and service providers
evaluate service quality on a daily and revolving basis (Mangold & Emin, 1990).
2-5-3. Expectations and Perceptions of service Quality
Several conceptual models have been developed to help define the service quality construct
and the factors that enter into consumers’ perceptions of service quality (Mangold & Emin,
1991). Driver and Johnston (2001) ascertain that there is a general agreement that a service
comprises a complex bundle of explicit and implicit attributes. The relative importance of
different attributes is likely to differ from service to service and from person to person (Cronin
and Taylor, 1994, parasuraman, Zeithaml and Berry, 1994) which is particularly relevant to the
real estate industry where no two clients have the same requirements or expectations.

41
In fact, Svensson (2003) agrees that service quality is a fundamental feature in services
marketing (Gronroos, 1989), industrial marketing, relationship marketing and consumer
marketing (Kotler, 1999). Berry et al., (1985) deem that quality is essential when service is what
is being sold.
Mangold and Emin (1991) focus on “front-stage” and “back-stage” perspectives, whereby both
the customer and the employees observe different perspectives of activities and problems that
accompany the service delivery process. This approach is particularly relevant to a service
environment because the “front-stage” and “back-stage” perspectives of the two groups may
result in a lack of agreement about the level of service that should be provided (Mangold &
Emin, 1991).
Some authors have suggested that perceptions are more dominantly driven by experiences (i.e.
the service performance) rather that expectations. Alternatively, quality has been defined as the
consumer’s overall impression of the relative inferiority or superiority of the organization and its
services (Zeithaml, Berry and Parasuraman, 1983; Taylor and Baker, 1994). Perceived service
quality is an attitude – a consumer judgment on the overall service.
Measuring perceptions of service quality has subsequently produced various models of
measurement. The SERVQUAL model of parasuraman et al (1988) proposed a five-
dimensional construct of perceived service quality – tangibles, reliability, responsiveness,
assurance, and empathy – with items reflecting both expectations and perceived performance.

42
2-5-4- Service Quality and Customer Satisfaction:
The main function a hospitality organization's members must perform is the delivery of quality
service to its customers. Service quality has been defined as how well a customer's needs are
met, and how well the service delivered meets the customer's expectations.
Gronoos (1984) indicated that the perceived quality of service is dependent on a comparison
between expected and perceived service, and is thus the outcome of a comparative evaluation
process. Parasuraman et al. (1985) defined “service quality” as the degree and direction of
discrepancy between a customer’s perceptions and expectations, whereas “perceived service
quality” is the gap between a customer’s expectations and perceptions as a measurement of
service quality. The smaller the gap, the better the quality of service and greater the customer
satisfaction. Barsky (1996) suggests that the customers may be excellent sources of information
for management on how the organization can provide quality service. Through surveys and
focus groups, customers can help management to determine which service areas are most in
need of improvement. Gunderson et al. (1996) defined customer satisfaction as, “a guest’s post-
consumption judgment of a product or service that can, in turn, be measured by assessing
guest’s evaluation of a performance on specific attributes. Providing services which customers
prefer is obviously a starting point for providing customer satisfaction. A relatively easy way to
determine what services customers prefer is simply to ask them. Greathous et al. (1996)
conducted research investigating the factors that travelers considered important in hotel
accommodations. In this study, travelers questioned at visitor information centers rated
cleanliness of room, value for price, friendliness of staff, and security of property as some of the
most important attributes of a hotel. A number of studies on customer satisfaction in the
hospitality industry have focused on identifying service attributes; that is, a customer’s needs
and wants. From a marketing perspective, customer satisfaction is achieved when the
43
customer’s needs and wants are fulfilled (Lam and Zhang, 1999). Lam and Zhang (1999)
conducted a study to assess customers’ expectations and perceptions of service quality, and
identified a gap between the two. They also explored the impact of service quality factors on
overall customer satisfaction. Their findings revealed that “reliability” and “responsiveness and
assurance” are the most significant factors in predicting customer satisfaction. In addition, these
two factors had the largest differential scores, indicating that the customers’ perceptions fell well
short of their expectations. The purpose of measuring customer satisfaction is to assess the
quality of the existing management practices and identify directions for improvement. The aim of
managing satisfaction is to obtain a higher rate of customer retention and improve a company’s
market share and profits. Many researchers propose that customer satisfaction influences
customer loyalty, which in turn affects profitability.
2.6- Hotel Attributes:
Research into hotel selection criteria has focused on the relationship between customer
satisfaction and service quality of services and facilities. Because of the intangibility,
inseparability, variability, and perishability of services, consumers’ perception of satisfaction
criteria may include contextual cues that they use to evaluate the service quality and to make
decisions about future patronage, whether or not they experienced the hotel’s products and
services before (Bitner, 1990; Parasuraman et al., 1985). Alpert (1971) and Kivela (1996)
viewed consumer products and services as a bundle of attributes, or features, and benefits; and
stated that those attributes that directly influence consumer choice are termed “determinant”
attributes. These attributes, which could be different from those of competitors’ offerings, may
be key factors in determining consumers’ intentions regarding future purchases. Wuest et al.
(1996) defined perceptions of hotel attributes as the degree to which travelers find various
services and facilities important in promoting their satisfaction with hotel stays. There have been

44
numerous studies of the needs and characteristics of travelers. Reviews of the literature
suggest that most travelers would consider the following hotel attributes when making a hotel
choice decision: cleanliness, location, room rate, security, service quality and the reputation of
the hotel or chain. Atkinson (1988) found that cleanliness of accommodation, followed by safety
and security, accommodation value for money, and courtesy and helpfulness of staff were the
top attributes for travelers in hotel choice selection.
2.7- Loyalty:
Customer loyalty is difficult to define. In general, there are three distinctive approaches to
measure loyalty:
1-Behavioral measurements.
2- Attitudinal measurement; and 3 composite measurements.
The behavior measurements consider consistent, repetitious purchase behavior as an indicator
of loyalty. One problem with the behavioral approach is that repeat purchases are not always
the result of a psychological commitment toward the brand. For example, a traveler may stay at
a hotel because it is the most convenient location. When a new hotel opens across the street,
they switch because the new hotel offers better value. Thus, repeat purchase does not always
mean commitment. Attitudinal measurements use attitudinal data to reflect the emotional and
psychological attachment inherent in loyalty. The attitudinal measurements are concerned with
the sense of loyalty, engagement and allegiance. There are instances when a customer holds a
favorable attitude toward a hotel, but he/she does not stay, at the hotel. A guest could hold a
hotel in high regard, recommend the hotel to others, but feel the hotel was too expensive for
him/her to use on a regular basis. The above approaches measure loyalty uni-dimensionally.
45
The third approach, composite measurements of loyalty, combine the first two dimensions and
measure loyalty by customers product preferences, propensity of brand-switching, frequency of
purchase, recency of purchase and total amount of purchase.
The use of both attitude and behavior in a loyalty definition substantially increases the predictive
power of loyalty (Pritchard and Howard, 1997). The two-dimensional composite measurement
approach has been applied and supported as a valuable tool to understand customer loyalty in
several fields, such as retailing, recreation, upscale hotels and airlines.
For this study, loyal customers are customers who hold favorable attitudes toward the company,
commit to repurchase the product/service, and recommend the product to others.
2-7-1- Satisfaction and Loyalty:
The results of our study verified that customer satisfaction does not equal customer loyalty.
Managers should realize that having satisfied customers is not good enough; they must have
extremely satisfied customers. Moreover, a small increase in customer satisfaction boosted
customer loyalty dramatically. In addition to benefiting from the extremely satisfied customers’
repeat patronage, the hotel managers can save their marketing expenses because of the
extreme satisfied customers marketing power. Therefore, hotel managers should not be content
with having satisfied customers. They need customers who are very satisfied.
2-7-2- Benefit of Loyalty:
The results of our study supported the contentions that there is a positive correlation between
loyal Customers and profitability. Loyal customers indeed provide more repeat business and
46
were less likely to shop around for the best deals than non-loyal customers.
The importance of word-of-mouth can never be overemphasized in the hotel industry, since
hotel customers prefer personal information sources. Positive word-of-mouth increase the
hotel’s reliability and decrease customer’s perceived risk. Once again, the results verified that
loyal customers indeed spread positive work-of-mouth and made recommendations. Loyal
customers are critical for the hotel business. How to create loyal customers is deemed
universally an essentially important task for the hotel managers.
2-7-3- Relationship between customer satisfaction and loyalty:
Customer satisfaction is considered to be one of the most important outcomes of all marketing
activities in a market-oriented firm. The obvious need for satisfying the firm’s customer is to
expand the business, to gain a higher market share, and to acquire repeat and referral
business, all of which lead to improved profitability. Studies conducted by Cronin and Taylor
(1992) in service sectors such as: banking, pest control, dry cleaning, and fast food, found that
customer satisfaction has a significant effect on purchase intentions in all four sectors. Similarly,
in the health-care sector, MsAlxander et al. (1994) found that patient satisfaction and service
quality have a significant effect on future purchase intentions.
Getty and Thompson (1994) studied relationships between quality of loading, satisfaction, and
the resulting effect on customers’ intentions to recommend the lodging to prospective
customers.
Their findings suggest that customers’ intentions to recommend are a function of their
perception of both their satisfaction and service quality with the lodging experience. Hence, it

47
can be concluded that there is a positive relationship between customer satisfaction and
customer loyalty.
2-8- Service Quality Models:
Due to the vast array of research in relation to service quality and the amount of criticisms that
SERVQUAL has received over the last decade alternative studies and measurement tools have
been created and conducted with the aim to measure service quality in the most effective way.
There have been five predominant measurement tools since 1991. These tools all differ in
theoretical background, data collection, sample size dimensions and response. No one
measurement tool has been classified as superior but applicability is determined by the final
result and the industry that is to be investigated. The following are the five measurements tools
since 1991.
Two-way used latent evaluations factors based on the theory that service quality is evaluated by
answers given by customers about ‘objective’ (quality attributes) and ‘subjective’ (satisfaction
levels). The survey was sent to 330 service providers including banks, restaurants, laundries
and supermarkets. Schvaneveldt (1991) employed a five-point semantic scale, to examine the
five dimensions. Performances, security completeness, ease of use and emotively/environment.
SERVPERF (Cronin and Taylor, 1992) based their survey on the theory that service quality is
evaluated by perceptions only and used two banks, pest control companies, laundries and fast
food companies with a sample size of 600. Cronin and Taylor (1992) also used a seven-point
semantic differential scale and utilized the same dimensions as the SERVQUAL study. The key
difference was that only perceptions were evaluated.
48
Nor med quality (Test, 1994) was based on the theory that the problem for expectation runs to a
redefinition of this component and discriminate between ideal exception and feasible
expectation to calculate service quality and was conducted on three large department stores
with a sample size of 120. It also employed the same semantic scale and dimensions as
SERVQUAL.
Qualitometro (Franceschini, Cignetti and Caldara, 1998) is founded on the determinants of
service quality. Customer expectations and perceptions are evaluated in two distinct moments.
Quality evaluation is carried out by means of a comparison between quality and expectations
and perception profiles. The study was conducted in a library facility, utilizing a sample size of
100. It also deployed the same semantic scale and dimensions as SERVQUAL.
SERVQUAL was developed to measure the service quality construct as defined by the service
quality model and the extended service model. SERVQUAL is used to measure consumers’ and
service providers’ expectations and perceptions. This approach enables the exceptions and
perceptions gaps to be assessed, while providing a measure of the service quality gap and the
service delivery gap (Mangold and Emin, 1990). According to Parasuraman et al’s., (1988)
model, the gap between consumers’ expectations and perceptions are a function of several
other gaps in the service delivery process (Mangold and Emin, 1990).
SERVQUAL (Parasuraman et al., 1991) uses the determinants methods of service quality and
gap theory. Service quality is calculated as the difference between perceptions and expectation
with importance weights associated to each dimension. The original survey was based on two
telephone companies, insurance companies and banks with a sample size ranging from 290-

49
497. Parasuraman et al., (1991) utilized a seven-point semantic differential scale. The survey
consisted of the following five dimensions: tangibles, reliability, assurance, responsiveness, and
empathy.
SERVQUAL, in essence, is an instrument for assessing customer perceptions of service quality
in service and retailing organizations (Parasuraman et al., 1988), the customer’s judgment
about an entity’s overall excellence or superiority’. It is a sort of attitude and comes from a
comparison of expectations and perceived performance. Exploratory research conducted in
1985 showed that clients judge service quality by using the same general criteria, regardless of
the type of service. The evaluations are collected using a seven-point likert scale.
The SERVQUAL model is used widely to measure service quality and has undoubtedly had a
major impact on the business and academic communities (Buttle, 1996). Its original service
dimensions were determined by Berry et al., (1985), with subsequent refinements and industry-
specific adaptations. Zeithaml et al., (1983) augmented SERVQUAL to further differentiate
between quality and customer satisfaction. SERVQUAL is designed and used as a diagnostic
technique for uncovering broad areas of an organization’s service quality strengths and
weaknesses (Tan & Pawitra, 2001).
2-8-1- SERVQUAL-Gap Analysis
SERVQUAL defines customer’s evaluation of quality as a function of the gap (difference)
between expected service and perceived service. Gap analysis defines service quality in terms
of the gap between what the service should provide and the customer’s perception of what the
service actually provides. Parasuraman et al., (1988) identified the following five gaps that can
50
result in unsuccessful service delivery and how it affects the real estate industry from client’s
perspective:
1. Gap between customer expectation and management perception: this may result from a lack
of understanding of what customers expect from a particular service such as the clients may
expect the salesperson to know the local school zones, local services and are disappointed
when they do not. This may be viewed by management as a non-important issue and training or
encouragement to know this information may not be encouraged.
2. Gap between management’s perception and service quality specifications: this gap results
when there is a discrepancy between what management perceives to be the customers’
expectations and the actual established service quality specifications.
This would occur in real estate if management assumes clients do not want to know about
things such as financial guidelines but the clients do actually want and need this information
provided.
3. Gap between service delivery and service specifications: even when guidelines or
specifications exist for performing excellent service, its delivery may not be up to standard due
to poor employee performance, resulting in this gap.
If a salesperson doesn’t know their listings (homes on the market) or they aren’t a good
negotiator, this would affect all aspects of the service delivery.

51
4. Gap between service delivery and external communications: Customer expectations are
established by promises made by a service provider’s promotional massages.
These gaps measure the consistency between the quality image portrayed in Promotional
activities and the actual quality of services offered.
5. Gap between perceived service and delivered service would occur in real estate when one
or more of the previous gaps occur between customers, front-line employees and management.

52
Chapter 3
Methodology
:Introduction
In scientific studies an appropriate method shall be used to solve each problem quicker
and more carefully and easily. For this purpose, researcher shall select a research
methodology after determining the subject of the research. He / she shall consider the
most appropriate research methodology to study the subject of the research.
In this chapter, research methodology, method of sampling, data collection, data
collection tools and the method of data extraction from questionnaire will be studied and
explained.
3.1. Research methodology:
The result of each research largely depends on the type of research. On the other hand, the
selection of research methodology depends on the objectives, the nature of the subject of
research and the relevant implementing facilities. For this reason, one can make a decision for
research methodology if he / she specify the nature, objectives and the extent of research. In
other word, the purpose of the selection of research methodology is to select a method to find
the answer / answers to the question / questions of the research quicker and more exactly and
easily.
The research methodology used in this research is descriptive-measuring of field study type.
53
Descriptive method has been used for review of literature. As one of the subdivisions of
descriptive method, measuring method has been used for the study of distribution and
specifications of statistical sample, determining the nature of conditions and the relations
between the events.
3.2. Population
Population means all elements and people who share one or some common quality in a special
geographical scale.
The population of this research is all Iranian and foreign customers (guests) stayed in the hotels
selected (Aliqapoo & Aseman Hotels) among 4-star hotels of Isfahan in Nov., 2007.
According to the statistics presented by the managers of the above-mentioned hotels the
number of the customers was estimated 3210.
3.3. Sampling size:
The number of the samples selected shall be in proportion to the relevant population for
assuring of the generalization of the results of the sample from the whole of population. In this
research, first, 30 questionnaires have been distributed among the customers of the under
study hotels in pre-testing for the calculation of the sampling size. Then the sampling size was
calculated using the below formula.
n = Nt 2 S 2
Nd 2 + t 2 s 2
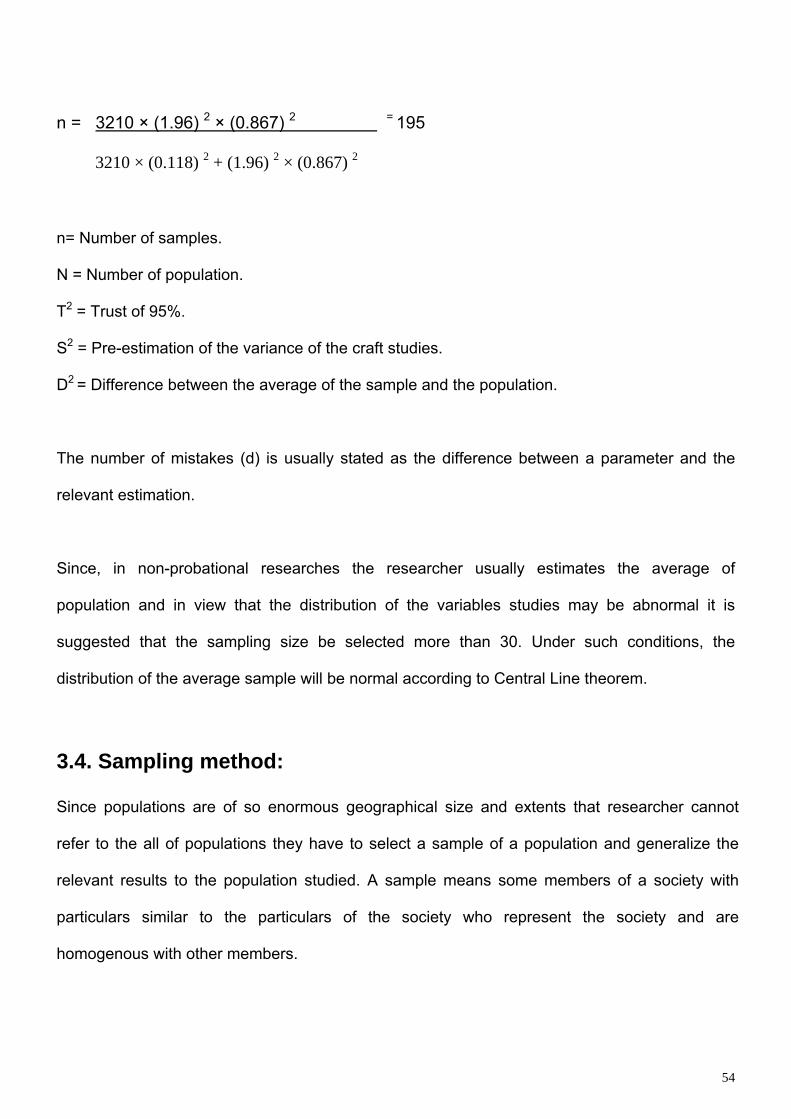
54
n = 3210 × (1.96) 2 × (0.867) 2 = 195
3210 × (0.118) 2 + (1.96) 2 × (0.867) 2
n= Number of samples.
N = Number of population.
T2 = Trust of 95%.
S2 = Pre-estimation of the variance of the craft studies.
D2 = Difference between the average of the sample and the population.
The number of mistakes (d) is usually stated as the difference between a parameter and the
relevant estimation.
Since, in non-probational researches the researcher usually estimates the average of
population and in view that the distribution of the variables studies may be abnormal it is
suggested that the sampling size be selected more than 30. Under such conditions, the
distribution of the average sample will be normal according to Central Line theorem.
3.4. Sampling method:
Since populations are of so enormous geographical size and extents that researcher cannot
refer to the all of populations they have to select a sample of a population and generalize the
relevant results to the population studied. A sample means some members of a society with
particulars similar to the particulars of the society who represent the society and are
homogenous with other members.
55
In this research attribute random sampling method has been used for the selection of the
sample representing the population. For this purpose, 195 customers (guests) of the under
study hotels have randomly been selected.
3.5. Data collection tools:
Data collection tools are those tools by which the researcher can collect the necessary
information for the analysis of the phenomenon studied and discovering the truth.
In this research, the data collection tool was questionnaire. Because questionnaire is one of the
most practical and easiest tool for collecting data out of the population, it should be noted that
The questionnaire selected in this research has been of structured closed type in which the
researcher has promoted the responder to answer one of the five questions prepared based on
Likert Scale by designing some special and purposeful questions (including five dimensions in
Servqual model) and restricting the options.
This research has been done by putting five principal questions. For this purposes several
determining factors have been extracted and put into the questions according to the present
components on Servqual model and theoretical studies. In this way the questionnaires have
been prepared.
The following table contains each research questions parallel to the questions of the
questionnaire.

56
Table (3-1): The distribution of research questions parallel to the questions of the questionnaire.
Research questions Questions of the questionnaire
1st question 1-2-3-4
2nd question 5-6-7-8
3rd question 9-10-11-12
4th question 13-14-15-16-17
5th question 18-19-20-21-22
3.6. Estimation of the reliability of the questionnaire:
Permanence of a measuring instrument means that similar results will be achieved if a
measuring instrument, manufactured for variable measuring, is used in different places or at
different time under similar conditions. In other words, permanent or reliable tools are those
tools which can repeatedly be used for measuring similar results.
Cronbaksh's Alpha has been used for the estimation of the permanence of present
questionnaire.
This method is used for calculating the internal coordination of measuring tools such as
questionnaires or the tests measuring different particulars.

57
First the variance of the marks of each question of the questionnaire and the variance of the
population shall be calculated for the calculation of Cronbaksh’s Alpha.
Then, the alpha coefficient shall be calculated using the below formula: (Sermed et al).
ra = j [1 - £S 2 J ]
j – 1 S2
ra = 22 (1 – 58/64) = 0.86 For the questionnaire of the “Expectations”
21 327/47
ra = 22 (1 – 37/04) = 0.89 For the questionnaire of the “perceptions”
21 246/23
ra : Cronbaksh’s Alpha coefficient.
S2 : Variance of the test.
S2j : Variance of each questions of the questionnaire.
J : the number of the questions in the questionnaire.
In the study of pre-testing the amounts of Cronbaksh's Alpha has been calculated at 86% for the
questionnaire of “Expectations” and 89% for the questionnaire of “perceptions" which is
significant for a = 5% (denoting the high validity of measuring tools).
58
3.7. The estimation of the validity of questionnaire:
The validity of behavioral research is of utmost importance and is a complicated and
challenging subject. Measuring and evaluating specialists consider some specifications for
measuring tools, such as the validity of questionnaire. The validity of a measuring tool means
that it can measure the relevant specification not any other variable.
Content validity has been used for measuring the validity of the questionnaires of this research.
For this purpose, the content of the questionnaire has been prepared by referring to scientific
texts, theories and the model relevant to the subject and the questions of the research.
After doing amendments by advising professors the content validity and face validity of the
questionnaire have been approved.
3.8. Method of data collection:
In this research, secondary data such as laboratory data has been collected for theory subjects.
For this purpose, books, papers and these in the major of Management and Hotel Management
have been used for theory subject. On the other hand, the information of questionnaire has
been used for testing the questions. For this purpose, the questioners with the necessary
explanations, have been distributed among 195 guests of the under study hotels after
determining the sampling size.
87% of the guests have completed and returned 170 questionnaires.

59
3.9. Method of data analysis:
In this research, data has been analyzed using descriptive-inferential statistics and SPSS
Computer systems (Statistical Package Social Science). In using descriptive statistics, the data
has been analyzed using statistical indexes such as frequency, percentage, average and
standard deviation. In using inferential statistics, the following statistical tests have been used
according to the level of data testing.
Correlated T-Test:
In an intra testing design if a tested person is observed twice and /or each member of a similar
couple is observed once, T-Test is used for correlated groups for the analysis of the data
collected.
T-Test of correlated groups aims at determining that the difference between two sample means
is caused by chance or caused by the real difference between population means.
T-Test:
In the study of two independent means, T-Test aims at helping the researcher in decision
making. In testing the relevant hypothesis, T-Test also aims at helping the researcher in
decision making for accepting or refusing Zero Theorem, which is the similarity between the
means of both groups.
Since, it is not possible to make a final decision for accepting or refusing the Zero Theorem
there will always be some errors in the decisions made. The main problem is that the probability
of difference observing shall be specified as much as a difference is observed between the
means of two sample groups, by assuming the similarity between both groups.

60
In this research, T-Test with common variances is used if the variances of both groups are
homogenous. Otherwise, T-Test with non-common variances is used.
Hetling t2-Test:
This test is used if the researcher intends to compare two groups in the means of more than
one correlated variables (Sermed et al). In this research, this type of test is used for comparing
the expectations and perceptions of the guests of the under study hotels using five components
of Servqual model to determine if the means of Services quality are different or identical in the
size or the indexes of the above-mentioned model.
Unilateral variance analysis test:
The purpose of analysis of unilateral variance is to compare two or more means to determine if
the differences observed between the means are caused by chance or caused by testing. This
method in which the means of two or more levels of a variable are compared is called unilateral
variance analysis.
61
Chapter 4 Analysis section Introduction: Analysis of information as a part of scientific methodology of research process is a fundamental
base in any study. In other words, in this section, the researcher will apply different methods of
analysis to answer the specific issue or to make decision for accepting or rejecting theory or
theories. For the current research analysis, at first the specification of statistical sample, its
distribution, percentage and average of the relevant questions of five dimensions of the
SERVQUAL model are determined and discussed through explanatory statistics and then the
relevant questions are put under study and analysis by T-test (independent t), Hetling t2-test and
unilateral variance analysis test in the deductive statistics. The above-mentioned data
concerning the guest’s opinion of under study hotels will be applied to meet the satisfaction of
customers according to SERVQUAL model.
4-1- The analysis and the estimation of the demographic questions of research:
In this section, the distribution of the guests due to gender, educational certificate, purpose of
travel, the process of reservations and bookings are being estimated.

62
4-1-1- How was the guests’ distribution due to their gender in this study?
Table4-1: guests’ distribution based on their gender
sex frequency percentage female 51 30 male 119 70 total 170 100
According to the obtained results due to table (4-1) %30 of the total guests were valued as
woman and %70 were as man.
The obtained results of the analysis of elaborating on male and female are figured in graph
(4-1):
Graph 4-1: distribution of the studied hotel guests based on their gender

63
4-1-2- How was the guests’ distribution of the studied hotels, based on their educational certificate in this research?
Table4-2: guests’ distribution based on the educational certificate Educational certificate frequency percentage Diploma & lower 43 25.3 Associate diploma 7 4.1 Bachelor 81 47.7 Master degree &higher 39 22.9 total 170 100
The obtained results of table (4-2) show the higher degree among the guests was the bachelor
degree with a percentage of 47.7 and the lowest degree was the associate diploma with a
percentage of 4.1.
The estimated results in table (4-2) which is due to the educational certificate are figured in
graph 4-2:
0
10
20
30
40
50
25.3
4.1
47.6
22.9
Diploma & lower associate diploma bachelor master degree & higher
Graph 4-2: guest distribution of the studied hotels, based on their educational certificate

64
4-1-3-How was the guests’ distribution of the studied hotels based on the purpose of their travel in this research? Table (4-3): guests’ distribution on the basis of their purpose of the trip Purpose of travel frequency percentage recreation 72 42.4 business 98 57.6 total 170 100
Obtained results in table (4-3) shows, due to the purpose of the guests for their trip %42.4 is
based on recreation and %57.6 is based on the business travel.
The results in graph 4-3 are focused on the purpose of the guests for their trips:
0
10
20
30
40
50
60
42.4
57.6
Recreation business Graph 4-3: distribution of the studied hotel guests based on their purpose of travel
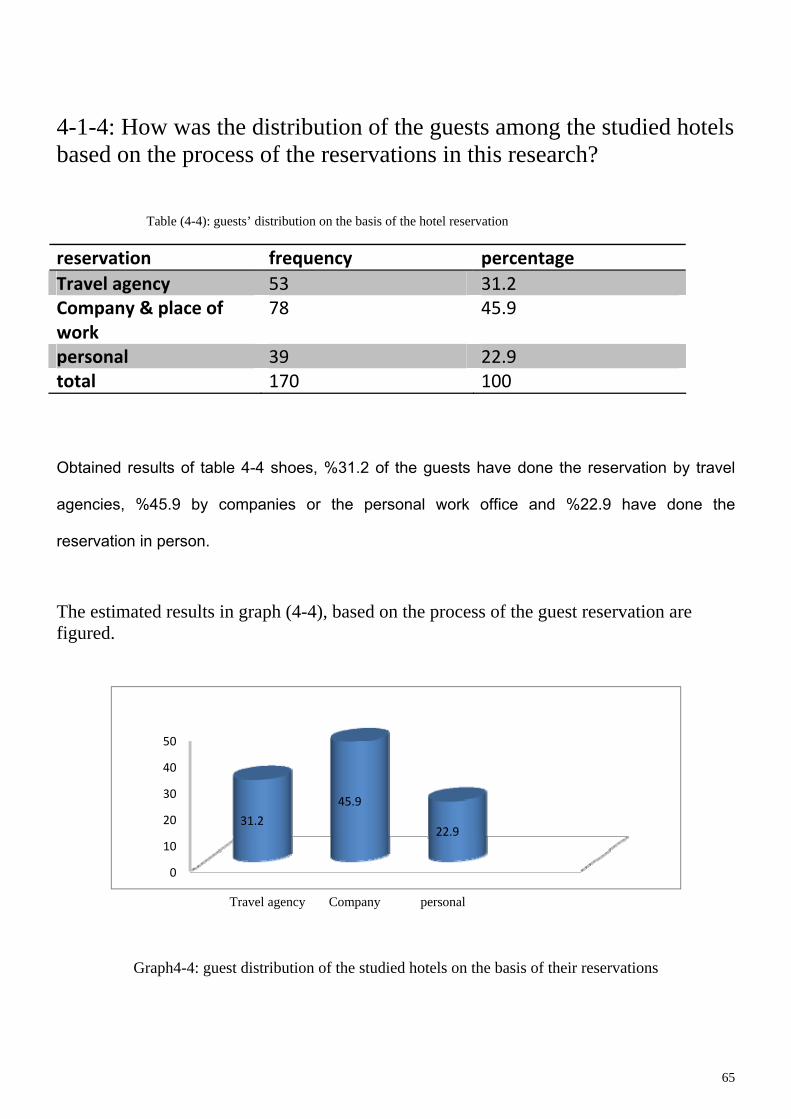
65
4-1-4: How was the distribution of the guests among the studied hotels based on the process of the reservations in this research?
Table (4-4): guests’ distribution on the basis of the hotel reservation
reservation frequency percentage Travel agency 53 31.2 Company & place of work
78 45.9
personal 39 22.9 total 170 100
Obtained results of table 4-4 shoes, %31.2 of the guests have done the reservation by travel
agencies, %45.9 by companies or the personal work office and %22.9 have done the
reservation in person.
The estimated results in graph (4-4), based on the process of the guest reservation are figured.
0
10
20
30
40
50
31.2
45.9
22.9
Travel agency Company personal
Graph4-4: guest distribution of the studied hotels on the basis of their reservations

66
4-2-Estimation and the analysis of the questionnaire based on the five dimensional model of SERVQUAL: In this section, the frequency distribution and the percentage of the answers to the
questionnaire based on expectations and general perceptions of the guests towards the five
dimensions in the SERVQUAL model are being estimated.
4-2-1-Tangibles: Table4-5: distribution of the frequency and the percentage of the answers to the questions related to the guests total expectations of tangibles
Very few Few Middle High very high average
Attraction of the outer building structure
frequency percentage
‐‐‐‐‐ ‐‐‐‐‐
2 1.2
56 30.6
95 55.9
21 12.4
3.79
Attraction of the inner decoration of the hotel
frequency percentage
‐‐‐‐‐ ‐‐‐‐‐
2 1.2
46 27.1
106 62.4
16 9.4
3.85
Discipline and the cleanness of the hotel staff
Frequency percentage
‐‐‐‐‐ ‐‐‐‐‐
1 0.6
29 17.1
86 50.6
54 31.8
4.13
Having, new and modern hotel facilities
frequency percentage
‐‐‐‐‐ ‐‐‐‐‐
2 1.2
36 21.2
97 57.1
35 20.6
3.97
According to the results in table 4-5, the highest average of the answer scores are referred to
the (discipline and cleanness of the staff), which was 4.13. The least average of the answer
scores are related to the (attraction of the outer building structure) with rate of 3.79.

67
Table (4-6): distribution of the frequency and the percentage of the answers to the questions related to the guests total perceptions of tangibles.
Very few
Few Middle High Very high
Average
Attraction of the outer building structure
Frequency Percentage
3 1.8
54 31.8
81 47.6
29 17.1
3 1.8
2.85
Attraction of the inner decoration of the hotel
Frequency Percentage
3 1.8
49 28.8
87 51.2
28 16.5
3 1.8
2.87
Discipline and the cleanness of the hotel staff
Frequency Percentage
‐‐‐‐ ‐‐‐‐
14 8.2
113 66.5
42 24.7
1 0.6
3.17
Having, new and modern hotel facilities
Frequency Percentage
7 4.1
62 36.5
75 44.1
23 13.5
3 1.8
2.72
According to the results in table 4-6, the highest average of the answer scores is referred to the
(discipline and cleanness of the staff), which was 3.17. The least average of the answer scores
is related to (Having, new and modern hotel facilities) with a rate of 2.72.
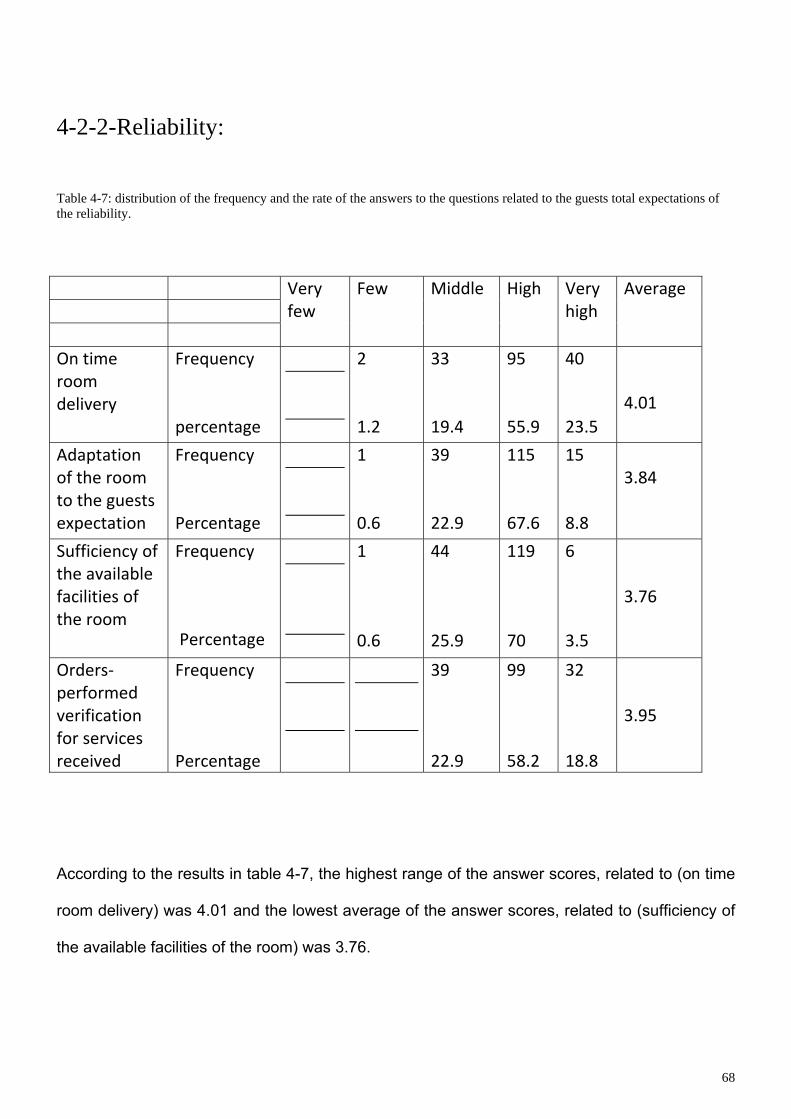
68
4-2-2-Reliability: Table 4-7: distribution of the frequency and the rate of the answers to the questions related to the guests total expectations of the reliability.
Very few
Few Middle High Very high
Average
On time room delivery
Frequency percentage
2 1.2
33 19.4
95 55.9
40 23.5
4.01
Adaptation of the room to the guests expectation
Frequency Percentage
1 0.6
39 22.9
115 67.6
15 8.8
3.84
Sufficiency of the available facilities of the room
Frequency Percentage
1 0.6
44 25.9
119 70
6 3.5
3.76
Orders‐performed verification for services received
Frequency Percentage
39 22.9
99 58.2
32 18.8
3.95
According to the results in table 4-7, the highest range of the answer scores, related to (on time
room delivery) was 4.01 and the lowest average of the answer scores, related to (sufficiency of
the available facilities of the room) was 3.76.

69
Table 4-8: distribution of the frequency and percentage of answers to the questions, related to the guests total perceptions of the reliability.
Very few
Few Middle High Very high
Average
On time room delivery
Frequency Percentage
3 1.8
99 58.2
66 38.8
2 1.2
3.39
Adaptation of the room to the guests expectation
Frequency Percentage
7 4.1
77 45.3
70 41.2
15 8.8
1 3.6
2.56
Sufficiency of the available facilities of the room
Frequency Percentage
7 4.1
72 42.4
75 44.1
14 8.2
2 1.2
2.60
Orders performed verification for services received
Frequency Percentage
3 1.8
68 40
83 48.8
15 8.8
1 0.6
2.66
According to the results in table 4-8, the highest range of the answer scores related to (on time
room delivery) was 3.39 and the lowest average of the answer scores related to (adaptation of
the room to the guests’ expectation) was 2.56.
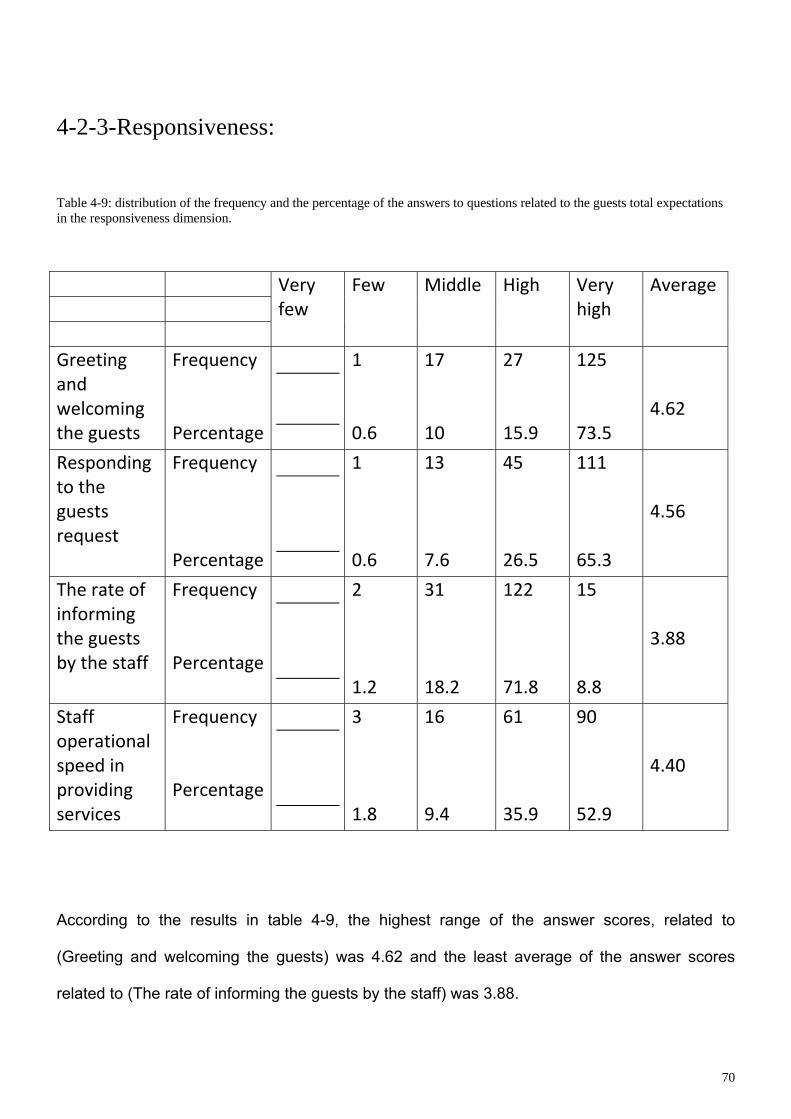
70
4-2-3-Responsiveness: Table 4-9: distribution of the frequency and the percentage of the answers to questions related to the guests total expectations in the responsiveness dimension.
Very few
Few Middle High Very high
Average
Greeting and welcoming the guests
Frequency Percentage
1 0.6
17 10
27 15.9
125 73.5
4.62
Responding to the guests request
Frequency Percentage
1 0.6
13 7.6
45 26.5
111 65.3
4.56
The rate of informing the guests by the staff
Frequency Percentage
2 1.2
31 18.2
122 71.8
15 8.8
3.88
Staff operational speed in providing services
Frequency Percentage
3 1.8
16 9.4
61 35.9
90 52.9
4.40
According to the results in table 4-9, the highest range of the answer scores, related to
(Greeting and welcoming the guests) was 4.62 and the least average of the answer scores
related to (The rate of informing the guests by the staff) was 3.88.

71
Table 4-10: distribution of the frequency and the percentage of the answers to questions related to the guests total perceptions in the responsiveness dimension.
Very few
Few Middle High Very high
Average
Greeting and welcoming the guests
Frequency Percentage
10 5.9
114 67.1
36 21.2
10 5.9
3.27
Responding to the guests request
Frequency Percentage
23 13.5
110 64.7
32 18.8
5 2.9
3.11
The rate of informing the guests by the staff
Frequency Percentage
30 17.6
91 53.5
40 23.5
8 4.7
1 0.6
3.17
Staff operational speed in providing services
Frequency Percentage
1 0.6
38 22.4
104 61.2
25 14.7
2 1.2
2.90
According to the results in table 4-10, the highest range of the answer scores, related to
(Greeting and welcoming the guests) was 3.27 and the least average of the answer scores,
related to (Staff operational speed in providing services) was 2.90.

72
4-2-4: Assurance:
Table 4-11: distribution of the frequency and the percentage of the answers to the questions related to the guests total expectations of the assurance dimension:
Very few
Few Middle High Very high
Average
Skill and experience of the staff
Frequency Percentage
1 0.6
26 15.3
114 67.1
29 17.1
4
Politeness of the staff
Frequency Percentage
1 0.6
12 7.1
23 13.5
134 78.8
4.70
The rate of ratio between the services and their price
Frequency Percentage
2 1.2
41 24.1
113 13.5
14 8.2
3.81
Providing a delicate and calm place
Frequency Percentage
14 8.2
72 42.4
84 49.4
4.41
Effort of the staff in providing & keeping a safe place
Frequency percentage
2 1.2
17 10
38 22.4
113 66.5
4.54
According to the results in table 4-11, the highest range of the answer scores related to
(Politeness of the staff), was 4.70 and the least average of the answer scores related to the
(The rate of ratio between the services and their price) was 3.81.

73
Table4-12: distribution of the frequency and the average of the answers to questions related to the guests total perceptions of the assurance dimension.
Very few
Few Middle High Very high
Average
Skill and experience of the staff
Frequency Percentage
11 6.5
73 42.9
64 37.6
20 11.8
2 1.2
2.58
Politeness of the staff
Frequency Percentage
3 1.8
121 71.2
37 21.8
9 5.3
3.30
The rate of ratio between the services & their price
Frequency Percentage
34 20
75 44.1
52 30.6
8 4.7
1 0.6
2.21
Providing a delicate and calm place
Frequency Percentage
1 0.6
37 21.8
103 60.6
24 14.1
5 2.9
2.97
Effort of the staff in providing & keeping a safe place
Frequency percentage
1 0.6
16 9.4
125 73.5
28 16.5
4.05
According to the results in table 4-12, the highest range of the answer scores, related to the
(Effort of the staff in providing and keeping a safe place) was 4.05 and the lowest range of the
answer scores related to the (rate of ratio between the services and their price) was 2.21.

74
4-2-5-Empathy:
Table 4-13: distribution of the frequency and the percentage of the answers to questions related to the guests total expectations of the empathy dimension.
Very few
Few Middle High Very high
Average
The access to the hotel in local condition
Frequency Percentage
25 14.7
46 27.1
99 58.2
4.43
Feasibility in being connected with the staff
Frequency Percentage
2 1.2
52 30.6
97 57.1
19 11.2
3.78
The attention of the staff in making effective relation with the guests
Frequency Percentage
4 2.4
51 30
107 62.9
8 4.7
3.7
the rate of flexibility of the staff
Frequency Percentage
43 25.3
113 66.5
14 2.8
3.82
The rate of hotel managers perception & prediction of the guests needs
Frequency Percentage
26 15.3
114 72.9
20 11.8
3.96
According to the results in table 4-13, the highest range of the answer scores related to the
(access to the hotel in local condition) was 4.43 and the lowest average of the answer scores
related to the (attention of the staff in making effective relation with the guests) was 3.70.
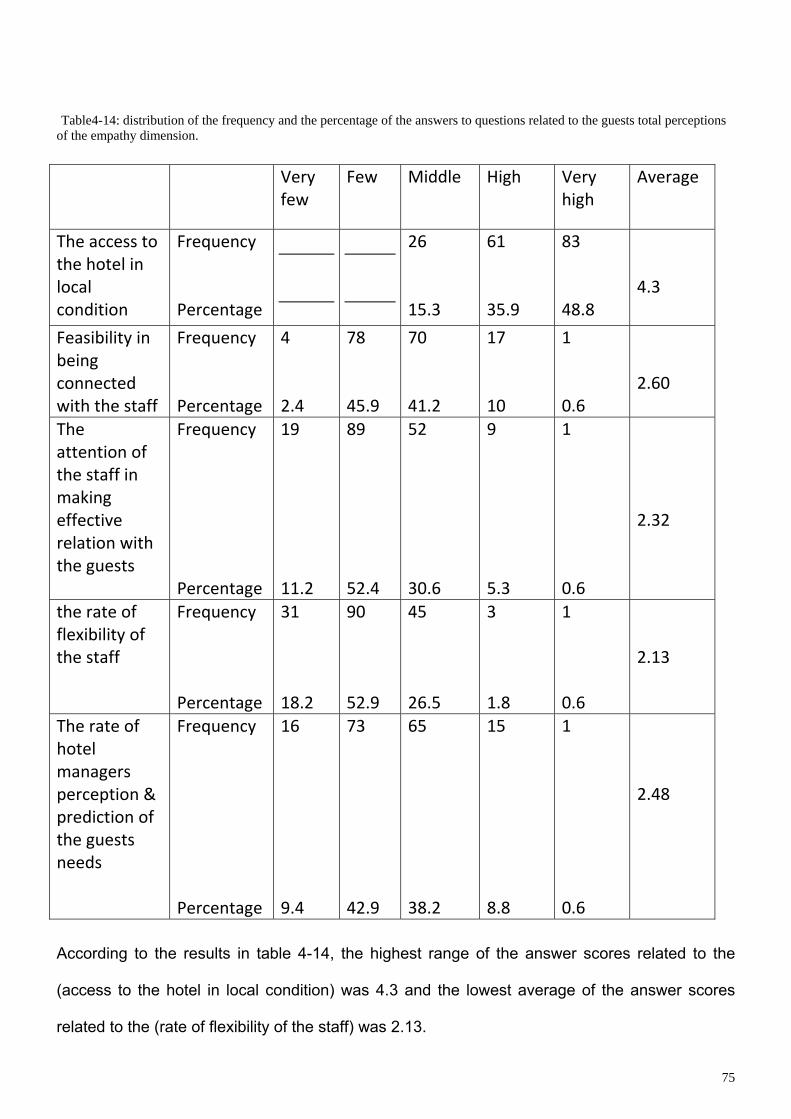
75
Table4-14: distribution of the frequency and the percentage of the answers to questions related to the guests total perceptions of the empathy dimension. Very
few Few Middle High Very
high Average
The access to the hotel in local condition
Frequency Percentage
26 15.3
61 35.9
83 48.8
4.3
Feasibility in being connected with the staff
Frequency Percentage
4 2.4
78 45.9
70 41.2
17 10
1 0.6
2.60
The attention of the staff in making effective relation with the guests
Frequency Percentage
19 11.2
89 52.4
52 30.6
9 5.3
1 0.6
2.32
the rate of flexibility of the staff
Frequency Percentage
31 18.2
90 52.9
45 26.5
3 1.8
1 0.6
2.13
The rate of hotel managers perception & prediction of the guests needs
Frequency Percentage
16 9.4
73 42.9
65 38.2
15 8.8
1 0.6
2.48
According to the results in table 4-14, the highest range of the answer scores related to the
(access to the hotel in local condition) was 4.3 and the lowest average of the answer scores
related to the (rate of flexibility of the staff) was 2.13.
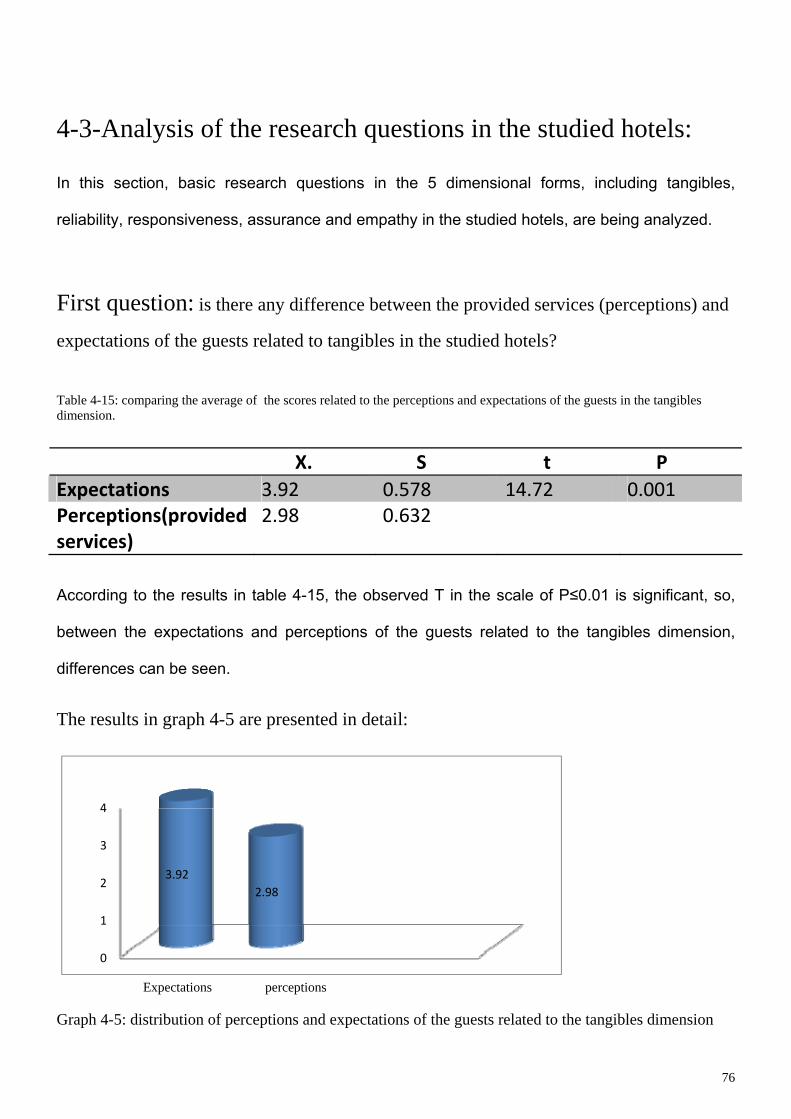
76
4-3-Analysis of the research questions in the studied hotels:
In this section, basic research questions in the 5 dimensional forms, including tangibles,
reliability, responsiveness, assurance and empathy in the studied hotels, are being analyzed.
First question: is there any difference between the provided services (perceptions) and
expectations of the guests related to tangibles in the studied hotels? Table 4-15: comparing the average of the scores related to the perceptions and expectations of the guests in the tangibles dimension.
X. S t P Expectations 3.92 0.578 14.72 0.001 Perceptions(provided services)
2.98 0.632
According to the results in table 4-15, the observed T in the scale of P≤0.01 is significant, so,
between the expectations and perceptions of the guests related to the tangibles dimension,
differences can be seen.
The results in graph 4-5 are presented in detail:
0
1
2
3
4
3.922.98
Expectations perceptions Graph 4-5: distribution of perceptions and expectations of the guests related to the tangibles dimension

77
Second question: is there any difference between the provided services (perceptions)
and expectations of the guests related to reliability in the studied hotels?
Table 4-16: comparing the average of the scores related to the perceptions and expectations of the guests in the reliability dimension. X. S t P Expectations 3.98 0.486 17.35 0.001 Perceptions (provided services)
2.80 0.570
According to the results in table 4-16, the observed T in the scale of P≤0.01 is significant, so,
between the expectations and perceptions of the guests related to the reliability dimension,
differences can be seen.
The results in graph 4-6 are presented in detail:
0
0.5
1
1.5
2
2.5
3
3.5
4
3.98
2.8
Expectations perceptions Graph 4-6: distribution of perceptions and expectations of the guests related to the reliability dimension

78
Third question: is there any difference between the provided services (perceptions)
and expectations of the guests related to responsiveness in the studied hotels?
Table 4-17: comparing the average of the scores related to the perceptions and expectations of the guests in the responsiveness dimension. X. S t P
expectations 4.36 0.550 20.5 0.001 Perceptions(provided services
2.87 0.582
According to the results in table 4-17, the observed T in the scale of P≤0.01 is significant, so,
between the expectations and perceptions of the guests related to the responsiveness
dimension, differences can be seen.
The results in graph 4-7 are presented in detail:
Expectations perceptions Graph 4-7: distribution of perceptions and expectations of the guests related to the responsiveness dimension
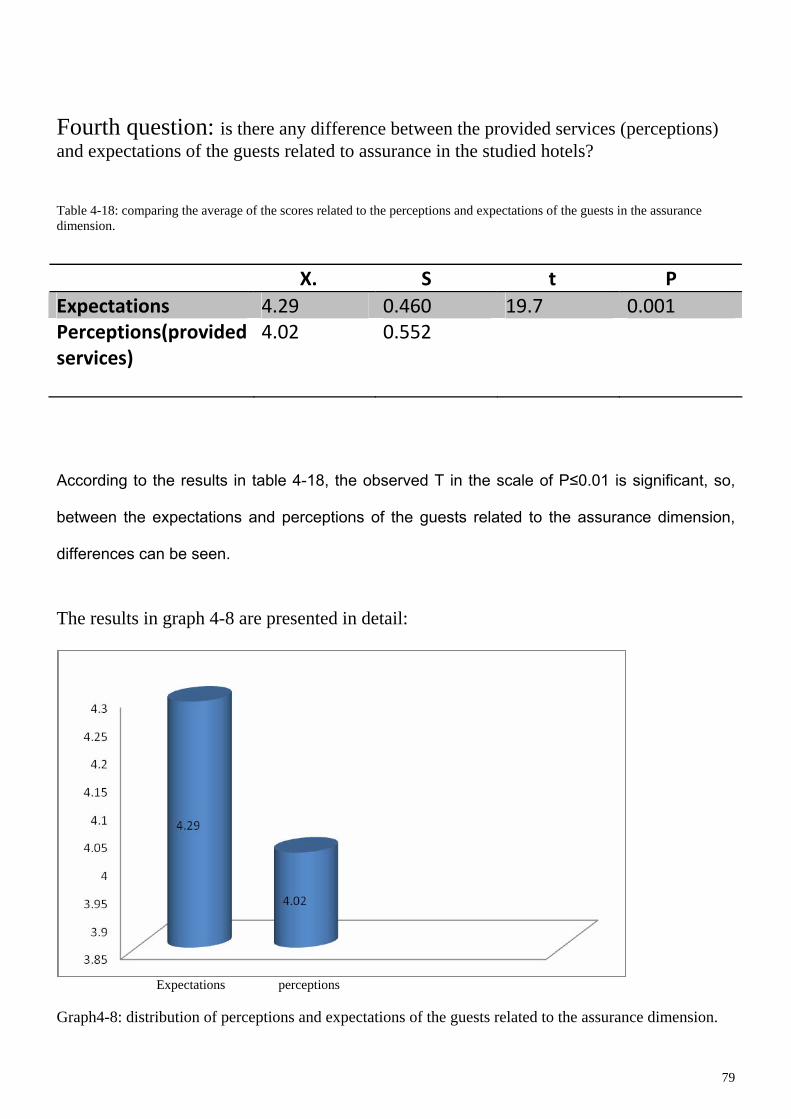
79
Fourth question: is there any difference between the provided services (perceptions) and expectations of the guests related to assurance in the studied hotels? Table 4-18: comparing the average of the scores related to the perceptions and expectations of the guests in the assurance dimension.
X. S t P Expectations 4.29 0.460 19.7 0.001 Perceptions(provided services)
4.02 0.552
According to the results in table 4-18, the observed T in the scale of P≤0.01 is significant, so,
between the expectations and perceptions of the guests related to the assurance dimension,
differences can be seen.
The results in graph 4-8 are presented in detail:
Expectations perceptions Graph4-8: distribution of perceptions and expectations of the guests related to the assurance dimension.

80
Fifth question: is there any difference between the provided services (perceptions) and expectations of the guests related to empathy in the studied hotels? Table 4-19: comparing the average of the scores related to the perceptions and expectations of the guests in the empathy dimension.
X. S t P Expectations 3.94 0.511 19.27 0.001 Perceptions(provided services)
2.77 0.562
According to the results in table 4-19, the observed T in the scale of P≤0.01 is significant, so,
between the expectations and perceptions of the guests related to the empathy dimension,
differences can be seen.
The results in graph 4-9 are presented in detail:
Expectations perceptions Graph4-9: distribution of perceptions and expectations of the guests related to the empathy dimension.
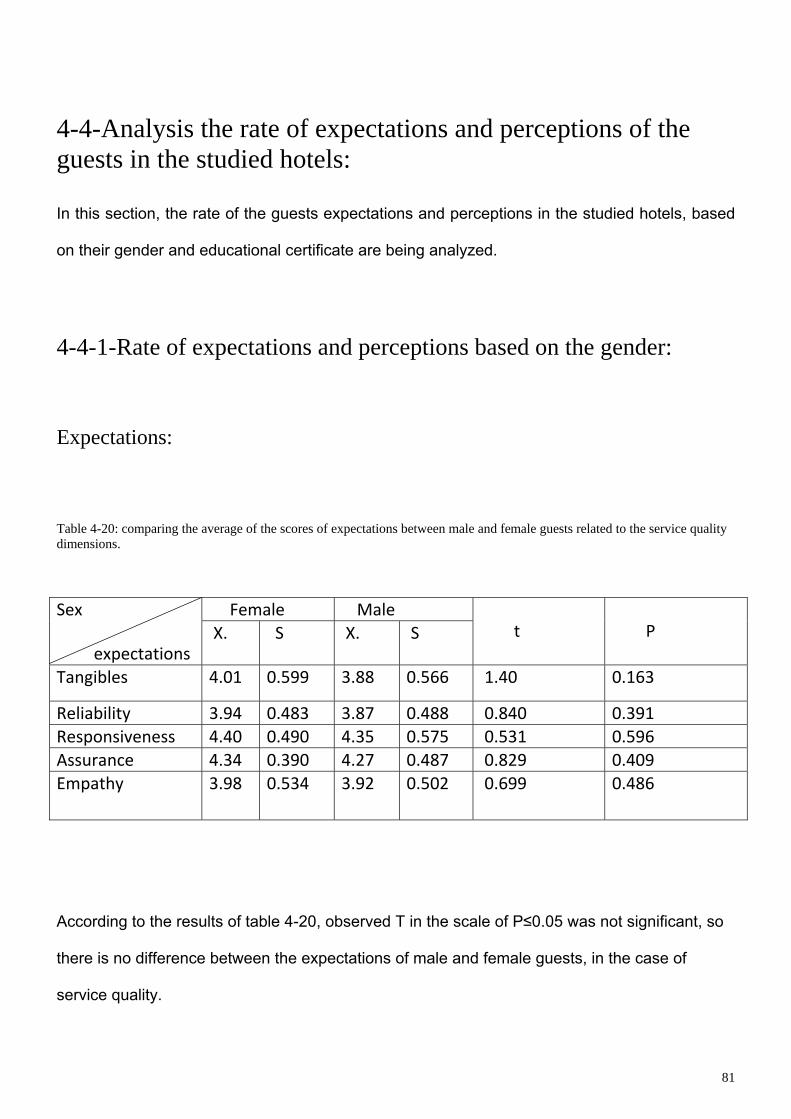
81
4-4-Analysis the rate of expectations and perceptions of the guests in the studied hotels: In this section, the rate of the guests expectations and perceptions in the studied hotels, based
on their gender and educational certificate are being analyzed.
4-4-1-Rate of expectations and perceptions based on the gender: Expectations:
Table 4-20: comparing the average of the scores of expectations between male and female guests related to the service quality dimensions.
Female Male Sex
expectations X. S X. S
t
P
Tangibles 4.01 0.599 3.88 0.566 1.40 0.163
Reliability 3.94 0.483 3.87 0.488 0.840 0.391 Responsiveness 4.40 0.490 4.35 0.575 0.531 0.596 Assurance 4.34 0.390 4.27 0.487 0.829 0.409 Empathy 3.98 0.534 3.92 0.502 0.699 0.486
According to the results of table 4-20, observed T in the scale of P≤0.05 was not significant, so
there is no difference between the expectations of male and female guests, in the case of
service quality.
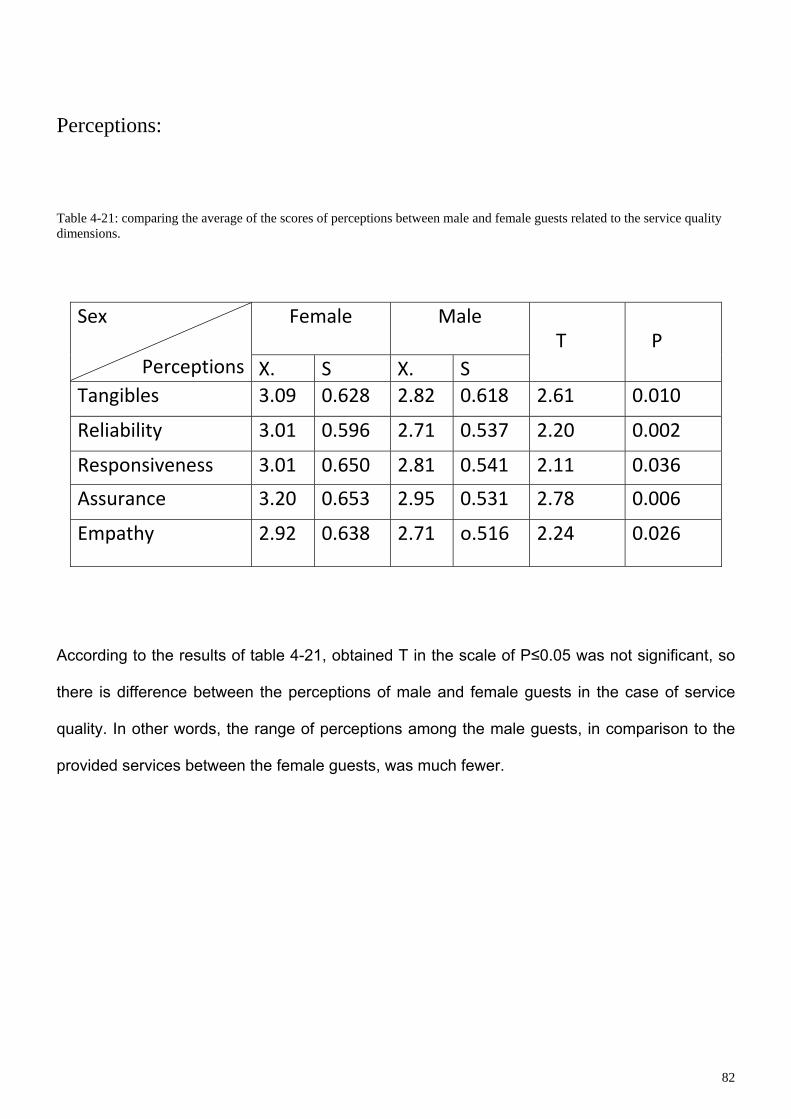
82
Perceptions: Table 4-21: comparing the average of the scores of perceptions between male and female guests related to the service quality dimensions.
Female
Male Sex
Perceptions X. S X. S
T
P
Tangibles 3.09 0.628 2.82 0.618 2.61 0.010
Reliability 3.01 0.596 2.71 0.537 2.20 0.002
Responsiveness 3.01 0.650 2.81 0.541 2.11 0.036
Assurance 3.20 0.653 2.95 0.531 2.78 0.006
Empathy 2.92 0.638 2.71 o.516 2.24 0.026
According to the results of table 4-21, obtained T in the scale of P≤0.05 was not significant, so
there is difference between the perceptions of male and female guests in the case of service
quality. In other words, the range of perceptions among the male guests, in comparison to the
provided services between the female guests, was much fewer.
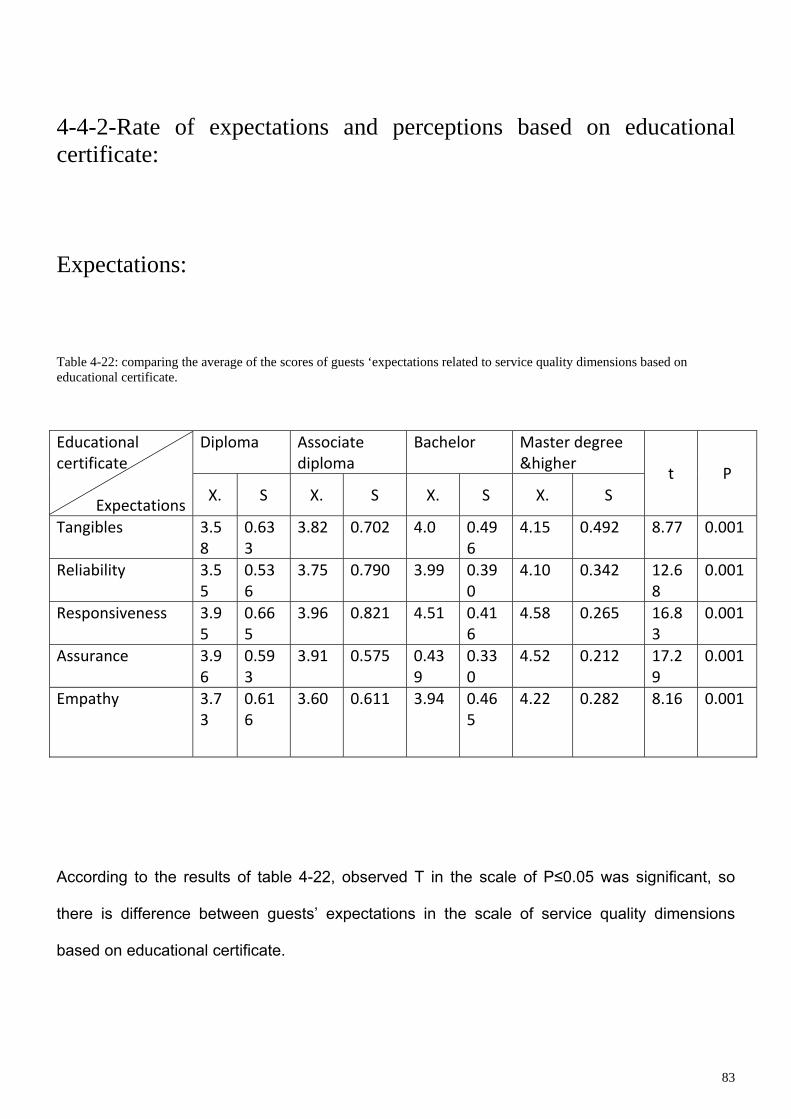
83
4-4-2-Rate of expectations and perceptions based on educational certificate: Expectations: Table 4-22: comparing the average of the scores of guests ‘expectations related to service quality dimensions based on educational certificate.
Diploma Associate diploma
Bachelor Master degree &higher
Educational certificate
Expectations X. S X. S X. S X. S
t P
Tangibles 3.58
0.633
3.82 0.702 4.0 0.496
4.15 0.492 8.77 0.001
Reliability 3.55
0.536
3.75 0.790 3.99 0.390
4.10 0.342 12.68
0.001
Responsiveness 3.95
0.665
3.96 0.821 4.51 0.416
4.58 0.265 16.83
0.001
Assurance 3.96
0.593
3.91 0.575 0.439
0.330
4.52 0.212 17.29
0.001
Empathy 3.73
0.616
3.60 0.611 3.94 0.465
4.22 0.282 8.16 0.001
According to the results of table 4-22, observed T in the scale of P≤0.05 was significant, so
there is difference between guests’ expectations in the scale of service quality dimensions
based on educational certificate.

84
Perceptions:
Table 4-23: comparing the average of the scores of guests’ perceptions related to service quality dimensions based on educational certificate.
Diploma Associate diploma
Bachelor Master degree &higher
Educational certificate
Expectations X. S X. S X. S X. S
t P
Tangibles 3.50 5.28 3.42 5.90 2.75 5.22 2.47 0.388 39.94 0.001Reliability 3.32 4.54 3.21 54.8 2.65 4.90 2.48 4.15 28.75 0.001Responsiveness 3.43 5.06 3.46 42.7 72.2 4.23 2.45 3.43 40.99 0.001Assurance 3.54 4.92 3.48 5.52 2.91 4.44 2.61 2.63 38.21 0.001Empathy 3.30 5.57 2.20 2.30 2.66 4.19 2.34 3.64 37.02 0.001
According to the results of table 4-23, observed T in the scale of P≤0.05 was significant, so
there is difference between guests’ perceptions in the case of service quality dimensions based
on educational certificate.

85
4-5-The quality of provided services and the existing gap in any of studied hotels, based on five dimensions of SERVQUAL model: 4-5-1-Aseman hotel (A):
Table 4-24: the gap between the guests’ expectations and perceptions from services, in the hotel (A), based on the five dimensions: Five dimensions Average of
perceptions P
Average of expectations E
Gap E‐P
Tangibles 3.18 4.06 ‐0.88 Reliability 2.95 4.0 ‐0.1.05 Responsiveness 2.99 4.32 ‐1.33 Assurance 3.18 4.35 ‐1.17 Empathy 2.78 4.15 ‐1.37 Service quality 3.016 4.176 ‐1.16
As it clear in table 4-24, in hotel Aseman (A) the tangibles dimension with a score of E-P:-0.88
had the least difference, and the empathy dimension with a score of E-P:-1.37 had the highest
difference.
The negative sign of the scores, shows between the provided services (perceptions) and
expectations of the guests, there is significant difference in all dimensions. In other words, the
mentioned hotel (A) was not capable in fulfilling the guests’ satisfaction in any of the
dimensions.

86
4-5-2-Aliqapoo hotel (B): Table 4-25: the gap between the guests’ expectations and perceptions from services, in the hotel (B), based on the five dimensions: Five dimensions Average of
perceptions P
Average of expectations E
Gap E‐P
Tangibles 2.70 3.82 ‐1.12 Reliability 2.69 3.81 ‐1.12 Responsiveness 2.78 4.39 ‐1.61 Assurance 2.91 4.25 ‐1.34 Empathy 2.76 3.78 ‐1.02 Service quality 2.768 4.01 ‐1.242
As it clear in table 4-25, in hotel Aliqapoo (B) the empathy dimension with a score of E-P:-1.02
had the least difference, and the responsiveness dimension with a score of E-P:-1.61 had the
highest difference.
The negative sign of the scores, shows between the provided services (perceptions) and
expectations of the guests, there is significant difference in all dimensions. In other words, the
mentioned hotel (B) was not capable in fulfilling the guests’ satisfaction in any of the
dimensions.

87
4-6-comparing the service quality dimensions simultaneously, in the studied hotels: 4-6-1-Expectations:
Table 4-26: comparing the average of the guests ‘expectations in service quality dimensions based on the type of the hotel:
Aseman hotel (A)
Aliqapoo hotel (B)
Type of hotel Expectations
X. S X. S t P
Tangibles 4.06 0.588 3.82 0.550 2.77 0.006 Reliability 4.0 0.502 3.81 0.460 2.48 0.014 Responsiveness 4.32 0.556 4.39 0.546 0.767 0.444 Assurance 4.35 0.455 4.25 0.460 1.50 0.133 Empathy 4.15 0.453 3.78 0.497 5.04 0.001
According to the results of table 4-26, observed t in the case of the guests’ expectations of
tangibles, reliability and empathy in the scale of P≤0.05 was significant. So there is difference
between the guests ‘expectations of hotel A and B.
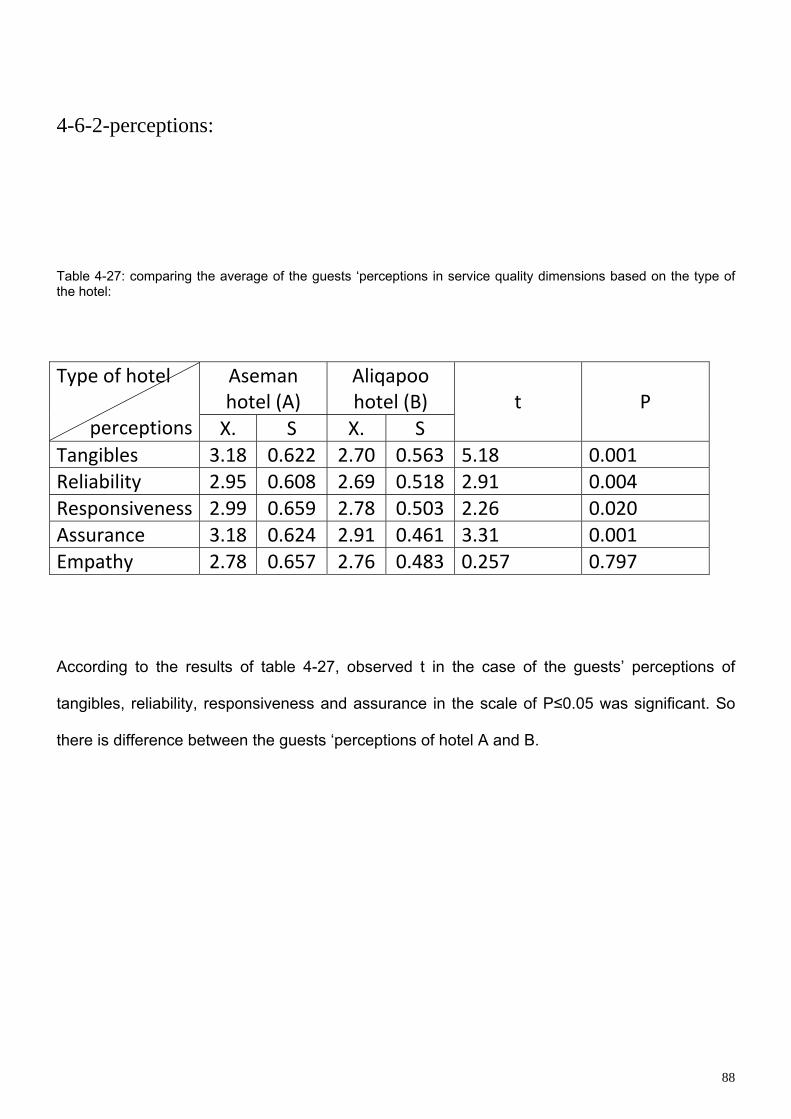
88
4-6-2-perceptions: Table 4-27: comparing the average of the guests ‘perceptions in service quality dimensions based on the type of the hotel:
Aseman hotel (A)
Aliqapoo hotel (B)
Type of hotel
perceptions X. S X. S t P
Tangibles 3.18 0.622 2.70 0.563 5.18 0.001 Reliability 2.95 0.608 2.69 0.518 2.91 0.004 Responsiveness 2.99 0.659 2.78 0.503 2.26 0.020 Assurance 3.18 0.624 2.91 0.461 3.31 0.001 Empathy 2.78 0.657 2.76 0.483 0.257 0.797
According to the results of table 4-27, observed t in the case of the guests’ perceptions of
tangibles, reliability, responsiveness and assurance in the scale of P≤0.05 was significant. So
there is difference between the guests ‘perceptions of hotel A and B.
89
According to the analysis made, it is inferred that:
1. The answer to the basic questions of research is positive. It means that there is a
difference between provided services (perceptions) and expectations of guests in the under
study hotels in view of tangibles, reliability, responsiveness, assurance, and empathy. This
difference will be significant according to the concluded results.
2. During this research, the distribution of frequency of guests has been on the basis of gender
(men) at 70%, the intention for work at 57.6%, reserving room by relevant company at 45.9%
and degree (Bachelor’s degree) at 47.7%.
Their expectations will be increased when higher degree is achieved.

90
Chapter 5
Discussion & Conclusions
Introduction:
The information analysis is a fundamental basis for any research. It is important to state that the
analysis of data is not enough to answer research questions and it is required to interpret data.
The interpretation means the explanation and finding the meaning of data. Since the
explanation of data without analysis is very difficult or impossible, therefore it is necessary to
interpret the results achieved after analysis, enabling us to reach truths and use of its results.
In this chapter while stating the results of this research, it is important to describe the current
weak points of five dimensions of Servqual model which affect the satisfaction of the customer
and to suggest ways for their correction. It is hoped that the hotel managers of Isfahan can
benefit the relevant information to raise the satisfaction level of their customers and to improve
the service quality of hotel.

91
5.1. Interpretation of Research Results
5.1.1. Study of basic research questions in Aliqapoo Hotel, type of B:
According to the results in tables (4-25), (4-26) and (4-27):
1. Concerning first question, is there any difference between the provided services and the
expectations of guests in view of “Tangibles” in under study hotels? The average of this
question is 3.82 with the standard deviation of 0.55 in view of the quests’ expectations and is
2.70 with the standard deviation of 0.56 in view of the guests’ perceptions. Since the calculated
t was significant in the scale of P≤0.05, therefore there is a difference between guests’
expectations and perceptions in view of tangibles.
For this reason, according to the Servqual model, service quality in this dimension is rated at
_1.12. It shows that the quests’ perception is lower than that of the quests’ expectations and this
index has not met their expectations.
2. Concerning second question, is there any difference between the provided services and the
expectations of guests in view of “Reliability” in under study hotels? The mean average of this
question is 3.81 with the standard deviation of 0.46 in view of the quests’ expectations and is
2.69 with the standard deviation of 0.52 in view of the guests’ perceptions. Since the calculated
t was significant in the scale of p≤0.05, therefore there is a difference between guests’
expectations and perceptions in view of reliability.
For this reason, according to the Servqual model, service quality in this dimension is rated at
_1.12. It shows that the quests’ perception in this dimension is lower than that of the guests’
expectations and this index has not met their expectations.
92
3. Concerning third question, is there any difference between the provided services and the
expectations of guests in view of “Responsiveness” in under study hotels? The average of this
question is 4.39 with the standard deviation of 0.55 in view of the quests’ expectations and is
2.78 with the standard deviation of 0.50 in view of the guests' perceptions. Since the calculated t
was significant in the scale of p≤0.05, therefore there is a difference between guests’
expectations and perceptions in view of responsiveness. For this reason, according to the
Servqual model, service quality is rated at –1.61. It shows that the guests’ perception in this
dimension is lower than that of the guests’ expectations and this index has not met their
expectations.
4. Concerning fourth question, is there any difference between the provided services and the
expectations of guests in view of “assurance” in under study hotels? The average of this
question is 4.25 with the standard deviation of 0.46 in view of the quests’ expectations and is
2.91 with the standard deviation of 0.46 in view of the guests' perceptions. Since the calculated t
was significant in the scale of p≤0.05, therefore there is a difference between guests’
expectations and perceptions in view of assurance. For this reason, according to the Servqual
model, service quality is rated at –1.34. It shows that the guests’ perception in this dimension is
lower than the guests’ expectations and this index has not met their expectations.
5. Concerning fifth question, is there any difference between the provided services and the
expectations of guests in view of “Empathy” in under study hotels? The average of this question
is 3.78 with the standard deviation of 0.50 in view of the quests’ expectations and is 2.76 with
the standard deviation of 0.48 in view of the gusts’ perceptions. Since the calculated t was
significant in the scale of p≤0.05, therefore there is a difference between guests’ expectations
and perceptions in view of empathy. For this reason, according to the Servqual model, service

93
quality is rated at –1.02. It shows that the guests’ perception in this dimension is lower than the
guests’ expectations and this index has not met their expectations.
In view of the above-mentioned results, it is concluded that in Aliqapoo Hotel, type of B, the
most gap (difference between guests’ expectations and perceptions) is –1.61 related to the
dimension of “responsiveness” and the lowest gap is –1.02 related to the dimension of
“Empathy”. The average of all five dimensions of the Servqual model in the mentioned hotel is
_1.24. It means that service quality in the all of dimensions is lower than the quests’
expectations.
5-1-2. Study of basic research questions in Aseman Hotel, type of A:
According to the results in tables (4-24), (4-26) & (4-27):
1. Concerning first question, is there any difference between the provided services and the
expectations of guests in view of “Tangibles” in under study hotels? The average of this
question is 4.06 with the standard deviation of 0.59 in view of the quests’ expectations and is
3.18 with the standard deviation of 0.62 in view of the guest’s perceptions. Since the calculated
t was significant in the scale of P≤0.05, therefore there is a difference between guests’
expectations and perceptions in view of tangibles. For this reason, according to the Servqual
model, service quality in this dimension is rated at –0.88. It shows that the quests’ perceptions
are lower than that of the quests’ expectations and this index has not met their expectations.
2. Concerning second question, is there any difference between the provided services and the
expectations of guests in view of “Reliability” in under study hotels? The average of this
question is 4.0 with the standard deviation of 0.50 in view of the quests’ expectations and is
2.95 with the standard deviation of 0.61 in view of the guests’ perceptions. Since the calculated
94
t was significant in the scale of p≤0.05, therefore there is a difference between guests’
expectations and perceptions in view of reliability. For this reason, according to the Servqual
model, service quality in this dimension is rated at–1.05. It shows that the quests’ perception is
lower than that of the guests’ expectations and this index has not met their expectations.
3. Concerning third question, is there any difference between the provided services and the
expectations of guests in view of “Responsiveness” in under study hotels? The average of this
question is 4.32 with the standard deviation of 0.56 in view of the quests’ expectations and is
2.99 with the standard deviation of 0.66 in view of the guests’ perceptions. Since the calculated
t was significant in the scale of p≤0.05, therefore there is a difference between guests’
expectations and perceptions in view of responsiveness. For this reason, according to the
Servqual model, service quality in this dimension is rated at –1.33. It shows that the guests’
perception is lower than that of the guests’ expectations and this index has not met their
expectations.
4. Concerning fourth question, is there any difference between the provided services and the
expectations of guests in view of “assurance” in under study hotels? The average of this
question is 4.35 with the standard deviation of 0.45 in view of the quests’ expectations and is
3.18 with the standard deviation of 0.62 in view of the guests’ perceptions. Since the calculated
t was significant in the scale of p≤0.05, therefore there is a difference between guests’
expectations and perceptions in view of assurance. For this reason, according to the Servqual
model, service quality is rated at –1.17. It shows that the guests’ perception in this dimension is
lower than the guests’ expectations and this index has not met their expectations.

95
5. Concerning fifth question, is there any difference between the provided services and the
expectations of guests in view of “Empathy” in under study hotels? The average of this question
is 4.15 with the standard deviation of 0.45 in view of the quests’ expectations and is 2.78 with
the standard deviation of 0.66 in view of the guests’ perceptions. Since the calculated t was
significant in the scale of p≤0.05, therefore there is a difference between guests’ expectations
and perceptions in view of empathy. For this reason, according to the Servqual model, service
quality is rated at –1.37. It shows that the guests’ perception in this dimension is lower than the
guests’ exceptions and this index has not met their expectations.
In view of the above-mentioned results, it is concluded that in Aseman Hotel, type of A, the most
gap (difference between guests’ expectations and perceptions) is –1.37 related to the
dimension of “Empathy” and the lowest gap is –0.88 related to the dimension of “Tangibles”.
The average of all five dimensions of the Servqual model in the mentioned hotel is –1.16. It
means that service quality in the all of dimensions is lower than that of the quests’ expectations.
5.1.3. Comparison of five dimension of service quality in under study hotels:
According to the results in tables (4-24) and (4-25):
1. In tangibles, the average of difference or gap between the guests’ expectations and
perceptions is –1.12 in Aliqapoo, Hotel of type B and is –0.88 in Aseman, Hotel of type A. It
shows that in this dimension Hotel A is more preferable than hotel B in the rate of 0.24. The
main reason of this preference is that hotel A is a new-built hotel with an attractive façade of
building, equipped with new decoration and furniture and staffed with young and disciplined
personnel to draw the attraction of guests.
96
2. In reliability, the average of difference or gap between the guests’ expectations and
perceptions is –1.12 in Aliqapoo, Hotel of type B and is –1.05 in Aseman, Hotel of type A. It
shows that in this dimension hotel A is more preferable than hotel B in the rate of 0.07. This
different is insignificant.
3. In responsiveness, the average of difference or gap between guests’ expectations and
perceptions is –1.61 in Aliqapoo, Hotel of type B and is –1.33 in Aseman, Hotel of type A. It
shows that in this dimension hotel A is more preferable than hotel B in the rate of 0.28. The
main reason of this preference is related to this fact that hotel A is a new-established hotel. The
owners of new hotel try to publicize of their hotels to reach to the relevant profit. They welcome
to their new guests in a special way. They met their needs cheerfully. They solve their problems
quickly and explain of different services rendered by hotel for more sales.
4. In Assurance, the average of difference or gap between guests’ expectations and perceptions
is –1.34 in Hotel B and is –1.17 in Hotel A. It shows that in this dimension hotel A is more
preferable than hotel B in the rate of 0.17. As stated in responsiveness, the reason of this
preference related to the interest of the hotel owners to draw the attraction of new guests and to
this effect they fix rather fairly the tariff of their hotel price list in the beginning.
5. In Empathy, the average of difference between the guests’ expectations and perceptions is
_1.02 in hotel B and is –1.37 in hotel A. It shows that in this dimension hotel B is more
preferable than hotel A in the rate of 0.35. As seen in tables 4-24 and 4-25, the reason of this
preference is related to this fact that the guests of hotel A has more expectations in this
dimension and it is because of the local situation of this hotel.

97
In view of the above-mentioned results, it is inferred that the average of service quality is –1.16
in Aseman, hotel of type A and is –1.24 in Aliqapoo, hotel of type B. Hotel A is more preferable
than hotel B in the rate of 0.08.
In reality, none of the above-mentioned hotels were not able to meet guests’ expectations and
their satisfaction.
With construction of new hotels in Isfahan and creating more competitive markets the present
hotels will go to recession. Therefore, it is necessary that the hotel managers evaluate and
consider the satisfaction of their guests on the basis of seasonal measurement and remove
deficiencies and improve the quality of their services in different aspects.
5.1.4. Study of demographic questions and other research results.
1. According to the results of No. 4-1(chapter 4), 30% of the guests of the studied hotels were
women and 70% were men. According to the results of table 4-20, the calculated t was not
significant at p≤0.05. Therefore, there is no difference between the expectations of men and
women in view of the service quality. But according to the results of Table 4-21, the calculated t
was significant at p≤0.05. Therefore, there is a difference between the perceptions of male and
female guests in the hotels in view of the service quality. It means that the perception of men
was less than the perceptions of women in service quality. Men have given lower points to the
performance of hotels and it was because men have more experience than women in travels.
2. According to the results of Table 4-2, the guests held Bachelor’s degree at most at the rate of
47.7% and at least at the rate of 4.1% with Associate degree, on the other hand, it is seen in
Table 4-22 and 4-23, the observed t was significant at P≤0.05. Therefore there is a difference
98
between guests’ expectations and perceptions of service quality in view of their educational
certificates.
If the degree of guests becomes higher, their expectations are increased more and the
performances of hotels are put under careful supervision.
3. As it is shown in table 4-3, the quests’ intention in travel to Isfahan was 42.4% for pleasure
and 57.6% for work. In Nov., 2007 (when the Questionnaires were distributed), it was certain
that the intention of the most of guests was for work.
4. In view of the results of Table 4.4, the frequency of hotel reservation for work has been done
by the relevant company at 45.9%, at most and for pleasure by the guests at 22.9%, at least.
This fact shows that at the time of distribution of Questionnaires, the most of reservation has
been done through companies and departments.
Therefore, the hotel managers can plan for marketing, and to be ready for rendering high quality
services considering the age, gender, nationality, degree, taste and number of guests.
5.2. Research limitations:
It is for a century that the quality of goods and products has been considered and studies, but
service quality has not been taken serious until the early 1980. Therefore, the limited research
in this field and with no access to information and statistics is one of the important limitations as
stated in the current research. Other limitations are as follows:
99
1. The main questions in this research are limited to the five items of Servqual model such as
tangibles, reliability, responsiveness, assurance and empathy.
2. The current research is limited to the two hotels of Aseman and Aliqapoo in Isfahan.
3. The statistical population of this research is limited to guests, who resided in these hotels in
Nov., 2007 and this statistics is estimated by the above-mentioned hotel managers on the basis
of the hotels occupied in the previous year.
4. The other limitation of this research is relevant to having no qualification to distribute the
questionnaires for the guests expectations and perception separately (at the time of their entry
and exit) and this is because the hotel authorities do not cooperate and guests do not show any
interest to fill the questionnaires.
5. The generalization of the research conclusions to other hotels of Isfahan should be applied
with care.
5.3. Suggestions:
In view of the theoretical studies of service quality and the conclusions of this research, the
following suggestions are presented in two applied and research sections.
5.3.1. Applied suggestions:
1. According to the results stated in Tables 4-24 and 4-25 concerning the medium function of
the relevant hotels in rendering services to meet the satisfaction of customers, it is

100
recommended to recruit staff who have adequate knowledge in managing, especially in hotel
management.
2. In view of the conclusions and the theoretical subjects of research concerning the gaps in
service quality, it is recommended that the hotel managers should understand the guests’
expectations and standardize relevant services with their expectations to reach the normal
standard, and even beyond that. They should also be careful not to have exaggerated
advertisements to increase the guests’ expectations.
3. For reaching the above aim and increasing the effect of the function of hotels, the hotel
managers shall set the proper standards and to support them with the enough resources and
facilities (worthy and trained staff, proper system and advanced technology) and to minimize the
communication obstacles in cooperation with the staffs to establish an organizational culture so
that all would comply with the service quality rules and standards.
4. According to the results in Tables 4-24 and 4-25, it is recommended that the hotel managers
evaluate the quality and quantity of services in different seasons of each year to know the
present deficiencies on the basis of guests’ expectations and perceptions, enabling them to
remove deficiencies and to improve the quality.
5. According to the results of the ergonomic questions of this research, it is recommended that
the hotel managers specify the frequency of distribution of guests upon considering age,
gender, nationality, degree, the way of room reservation, intention of their travel and other
specifications through doing periodical quality evaluations in their hotels to meet the satisfaction
of customers on the basis of their needs and interests.
101
6. Since quality is not stable and it is a changeable aim which may takes different shapes
according to different needs of customers, therefore, it is recommended that the hotel managers
make efforts to improve and make better the quality of products and services to meet the
satisfaction of customers for higher loyalty.
7. In view of the theoretical subjects of research, the hotel keeping is an industrial business
affected with the bilateral relations of the hosts and guest as an unforgettable experience. It
leads to making decision to apply that experience or not to apply it again. For this reason, the
role of staff is important and it is recommended to make the best efforts to elect, evaluate,
employ and to train the best personnel.
8. As stated in Item 7 and in view of the bilateral relations between the customers in the
organization and customers outside of the organization, it is recommended that the hotel
managers consider the job satisfaction of personnel and improve their interest in work. If not, it
may decrease the quality of provided services and the non-satisfaction of customers, which will
not refer to these hotels.
9. According to the results achieved in the importance of customers with their variable indexes
in forming the nature of organization, it is recommended to the investors who want to build
various types of residential places to anticipate the indexes of customers. For example, they
should select the place of the hotel construction so that the customers would be able to have
access to the hotels easily.
102
List of Reference
- Abercrombie, D. (1967). Elements of general phonetics. Edinburgh, University Press.
- Alpert, M.I. (1971), “Identification of determinant attributes: a comparison of models”, Journal
of Marketing Research, Vol.8, May, pp. 184-91.
-Atkinson, A. (1988), “Answering the eternal question: What does the customer want?”, The
Cornell Hotel and Restaurant Administration Quarterly, August, pp. 12-14
- Berry L, Parasuraman, A; Zeithaml V, (1985) A conceptual model of service quality and its
implications for future research. Journal of Marketing, 4 (49) 1
- Bitner, M, J, (1990) Evaluating service encounters: The effects of physical surrounding and employee
Responses, Journal of Marketing, Vol. 54, pp. 69-82.
- Bolton R N, & Drew J H. (1991) A Multistage Model of Customers’ Assessments of Service Quality and
Value. Journal of Consumer Research. 4(17) 10
- Buzzell R & Gale B, (1987) Market share—a key to profitability. Harvard Business Review, 1(53) 10
- Barsky, J, 1996. Designing service with function analysis. The Hospitality Research Journal,
20 (1), 73-100
- Chenet, P., Tynan, C., & Money, A. (2000). The service performance gap: testing the
redeveloped causal model. European Journal of Marketing, 34(3/4), 472
103
- Cronin, J.J., Jnr., & Taylor, S. A. (1992). Measuring service Quality: A Reexamination and
Extension. Journal of Marketing, 56(3), 55
- Cronin, J. J., & Taylor, S. A. (1994). SERVPERF versus SERVQUAL; Reconciling
performance-based and. Journal of Marketing, 58(1), 125
- Franceschini, F., Cignetti, M, & Caldara, M. (1998). Comparing tools for service quality
evaluation. International Journal of Quality Science, 3(4), 356-367.
- Fitzsimons. J, Fitzsimons. M, (2001), Service Management, 3ed, New York, Free Press.
- Gronroos C. (1984) A Service Quality Model and its marketing Implications. European Journal
of Marketing, 18(4)9
- Gronroos C. (1989) Defining Marketing: A Market-Orientated Approach. European Journal of
Marketing, 23 (1) 9
-Garvin.D.A., (1987), Managing quality, New York, Free Press
- Gunderson, M.G, Heide, M, Olsson, U.H, 1996. Hotel guest satisfaction among business
travelers. The Cornell Hotel and Restaurant Administration Quarterly 37(2), 72-81
-Getty, J.M. and Thompson, K.N. (1994), “The relationship between quality, satisfaction, and
recommending behavior in lodging decision”, Journal of Hospitality & Leisure
Marketing, Vol. 2No. 3, pp. 3-22

104
- Hansemark, O., & Albinsson, M. (2004). Customer satisfaction and retention: the experiences
of individual employees. Journal of Managing Service Quality, 14(1), 40-57
- Hayes.B.E., (1998), Measuring Customer Satisfaction: Survey Design Use and Statistical
Analysis Methods, Milwaukee: ASQ Quality Press.
- Hartline, M, Woolridge, B, & Jones, K. (2003). Guest Perceptions of Hotel Quality: Determining
Which employee groups count most. Cornell Hotel and Restaurant Administration
Quarterly, 44(1), 249-264
- Hartline, M, III, J. M, & McKee, D. (2000). Corridors of influence in the dissemination of
Customer-oriented strategy to customer contact service employees. Journal of
Marketing, 64(2), 35-51
- Imrie, B. C., Cadogan, J. W., & McNaughton, R. (2002). The service quality construct on a
Global stage. Managing Service Quality, 12(1), 10-18
- Johnston, R., & Heineke, J. (1998). Exploring the relationship between perception and
Performance: priorities for action. The Service Industries Journal, 18(1), 101-112
- Juran. J. M., (1990), Made In USA: A Renaissance of Quality, Harvard Business Review, (July,
August)
- Juran.J.M., (1988), Juran on Planning For Quality, New York, Free Press.
105
- Juran.J.M., (1992), Juran on Quality by Design, Milwaukee: ASQC Quality Press.
- Kano Y, Bentler P & Li-tze H (1984) Can Test Statistics in covariance structure analysis by
trusted? Psychological Bulletin, 112 (2) 351
- Kelley (1992) Statements to the Congress. Federal Reserve Bulletin, 78 (7) 515
- Kotler P. (1999) Futurespeak. Sales and Marketing Management, 151 (5) 14
- Kellogg, D. L. (2000). A customer contact measurement model: an extension. International
Journal of Service Industry Management, 11(1), 26
- Lam, T, Zhang, H, 1999. Service quality of travel agents: the case of travel agents in Hong
Kong. Tourism Management, 20, 341-349
- Mangold, G., & Emin, B. (1990). Monitoring Service Quality. Review of Business, 11 (4), 21-27
- Mangold, G, & Emin, B. (1991). Service Quality: The front-stage vs. the back-stage
perspective. Journal of Services Marketing, 5(4), 59-70
-McAlexander, J.H., Kaldenberg, D.O.and Koenig, H.F. (1994), “Service quality measurement”,
Journal of Health Care Marketing, Vol.14, No.3, pp. 34-40
-O’Neill, M., & Palmer, A. (2001). Survey Timing and consumer perceptions of service quality:
an overview of empirical evidence. Managing Service Quality, 11(3), 192-190
106
- Parasuraman, A., Zeithaml, V.A., & Berry, L. L. (1988). Servqual: A Multiple-Item Scale For
Measuring Consumer Perception. Journal of Retailing, 64(1), 12
- Parasuraman A, Leonard L Berry, Valarie A Zeithaml. (1991). PERCEIVED SERVICE QUALITY AS A
CUSTOMER-BASED PERFORMANCE MEASURE: AN EMPIRICAL EXAMINATION OF ORGANIZATIONAL
BARRIERS USING AN EXTENDED SERVICE QUALITY MODEL. Human Resource Management,
30 (3) 8
- Parasuraman, A., Zeithaml, V. A., & Berry, L. L. (1994). Reassessment of expectations as
comparison standard in measuring service quality: Implications for further
research. Journal of Marketing, 58(1), 111
- Parasuraman.A., Zeithamal. V. A., Berry. L.L, (1990), Delivering Quality Service: Balancing
Customer Perceptions and Expectations, New York, Free Press.
-Pritchard, M.P. and Howard, D.R. (1997), “The loyal traveler: examining a typology of service
Patronage”, Journal of Travelers Research, Vol.35 No. 4, pp.2-11
-Schvaneveldt, S. & Enkawa T. (1991) Consumer evaluation perspectives of service quality:
evaluation factors and two-way model of quality. Total Quality Management,
2(2) 13
-Sasser. W.E., Olsen.R.P.,Wyckott.D., (1978) , Management of Service Operations, Allyn and
Boston, p.11.

107
-Schesinger.L.A.,Heskitt.J.L., (1991) , Breaking The Cycle Of Failure in Services, Sloan
Management Review, pp. 17-28
- Tan, K. C., & Pawitra, T.A. (2001). Integrating SERVQUAL and kano’s model into QFD for
service excellence development. Managing Service Quality, 11(6), 418
- Taylor, Steven A, Baker T L, (1994) An assessment of the relationship between service quality
and customer satisfaction in the formation of consumers’ purchase
intentions. Journal of retailing, 2(70) 16
-Wuest, B.E.S., Tas, R.F. and Emenheiser, D.A. (1996), “What do mature travellers perceive as
important hotel/motel customer service?”, Hospitality Research Journal,
Vol. 20 No. 2, pp. 77-93
- Yuksel, A., Yuksel, F. (2002). Measurement of Tourist satisfaction with restaurant services: a
segment-based approach. Journal of Vacation Marketing, 9(1), 52-68
-Zeithaml. V.A.,Bitner.M.J.,(1996), Services Marketing, New York, Mac Grow Hill.
- Zineldin M A. (2000) Towards an ecological collaborative relationship management. European
Journal of Marketing, 32(11/12) 27

108
Appendixes:
Questionnaire
Dear guest:
Wishing you a pleasant stay in Isfahan, the attached questionnaire is a research instrument on
customer satisfaction and service quality in four star hotels in Isfahan. Your answers to the
questions will be a great help for evaluating the status quo and finding some solutions for
offering better services in Isfahan hotels in the near future.
With best regards
M. A. graduate student
Responder personal attributes:
1. Age:………. Years
2. Sex: male female
3. Education level: .......
4. Reason for touring Isfahan: vacation work
5. Residential place: ..........
6. Reservation thought: travel agency company yourself

109
1. About the hotel external facade:
1-1. How attractive did you consider it before arriving to the hotel?
1. Very little 2. Little 3. So –so 4. Much 5. very much
1-2. How attractive did you find it after seeing the building?
1. Very little 2. Little 3. So –so 4. Much 5. very much
2. About the beauty of hotel internal decorations:
2-1. how much was your expectation about it before entering the hotel?
1. Very little 2. Little 3. So –so 4. Much 5. very much
2-2. How did you like it after walking in?
1. Very little 2. Little 3. So –so 4. Much 5. very much
3. About the staff appearance and their tidiness:
3-1. how much was your expectation about if before meeting them?
1. Very little 2. Little 3. So –so 4. Much 5. very much
3-2. How tidiness do you evaluate them now?
1. Very little 2. Little 3. So –so 4. Much 5. very much
4. About the hotel facilities:
4-1. How modern did you consider them before checking in?
1. Very little 2. Little 3. So –so 4. Much 5. very much
4-2. How modern did you find them after checking in?
1. Very little 2. Little 3. So –so 4. Much 5. very much
5. About timely accommodation:
5-1. How much was your expectation about it before checking in?
1. Very little 2. Little 3. So –so 4. Much 5. very much
5-2. How much effort the staff make to lodge you on time?
1. Very little 2. Little 3. So –so 4. Much 5. very much
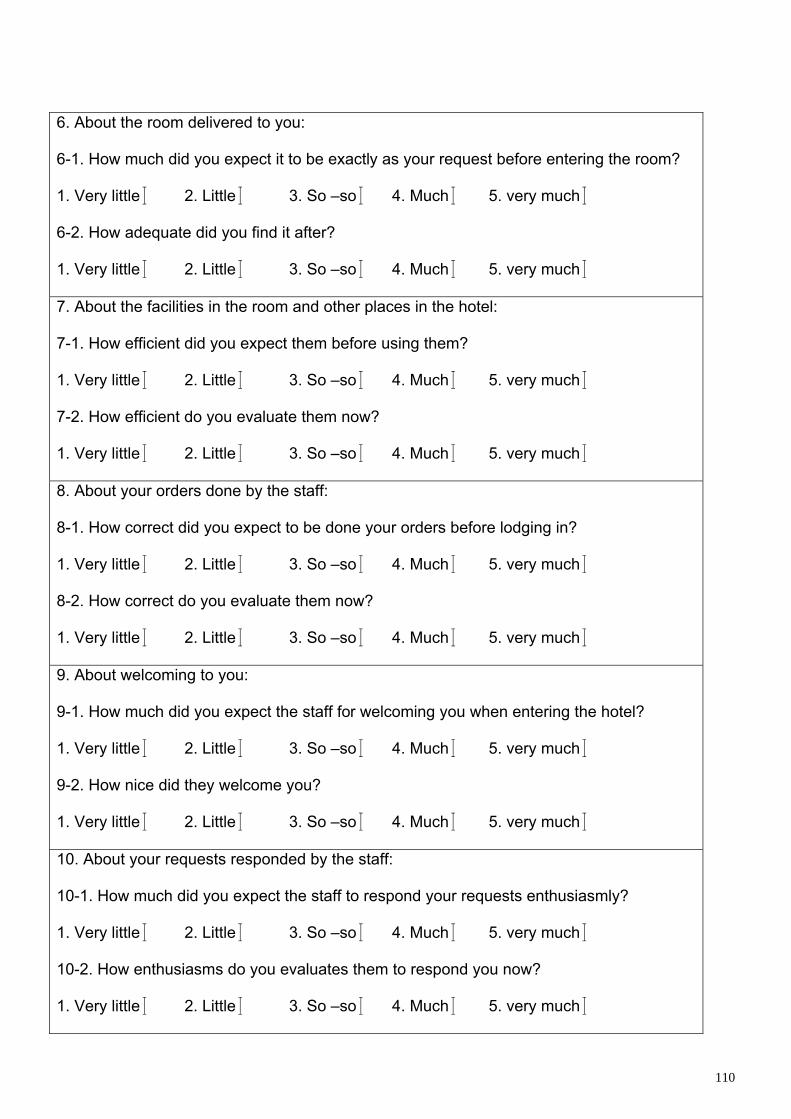
110
6. About the room delivered to you:
6-1. How much did you expect it to be exactly as your request before entering the room?
1. Very little 2. Little 3. So –so 4. Much 5. very much
6-2. How adequate did you find it after?
1. Very little 2. Little 3. So –so 4. Much 5. very much
7. About the facilities in the room and other places in the hotel:
7-1. How efficient did you expect them before using them?
1. Very little 2. Little 3. So –so 4. Much 5. very much
7-2. How efficient do you evaluate them now?
1. Very little 2. Little 3. So –so 4. Much 5. very much
8. About your orders done by the staff:
8-1. How correct did you expect to be done your orders before lodging in?
1. Very little 2. Little 3. So –so 4. Much 5. very much
8-2. How correct do you evaluate them now?
1. Very little 2. Little 3. So –so 4. Much 5. very much
9. About welcoming to you:
9-1. How much did you expect the staff for welcoming you when entering the hotel?
1. Very little 2. Little 3. So –so 4. Much 5. very much
9-2. How nice did they welcome you?
1. Very little 2. Little 3. So –so 4. Much 5. very much
10. About your requests responded by the staff:
10-1. How much did you expect the staff to respond your requests enthusiasmly?
1. Very little 2. Little 3. So –so 4. Much 5. very much
10-2. How enthusiasms do you evaluates them to respond you now?
1. Very little 2. Little 3. So –so 4. Much 5. very much

111
11. About giving information for offering you better services:
11-1. How much was you expectation for this before lodging in?
1. Very little 2. Little 3. So –so 4. Much 5. very much
11-2. How much do you evaluate it now?
1. Very little 2. Little 3. So –so 4. Much 5. very much
12. About the speed of services giving to you:
12-1. How fast did you expect to be done you requests before lodging in?
1. Very little 2. Little 3. So –so 4. Much 5. very much
12-2. How fast do you evaluate them now?
1. Very little 2. Little 3. So –so 4. Much 5. very much
13. About the staff experience and professionally?
13-1. How much did you expect it before lodging in?
1. Very little 2. Little 3. So –so 4. Much 5. very much
13-2. How capable do you evaluate them now?
1. Very little 2. Little 3. So –so 4. Much 5. very much
14. About the staff politeness:
14-1. How was your expectation about it before meeting them?
1. Very little 2. Little 3. So –so 4. Much 5. very much
14-2. How polite do you evaluate them now?
1. Very little 2. Little 3. So –so 4. Much 5. very much
15. About the price of the services:
15-1. How adequate did you expect the price with the services before lodging in?
1. Very little 2. Little 3. So –so 4. Much 5. very much
15-2. How adequate do you find them now?
1. Very little 2. Little 3. So –so 4. Much 5. very much

112
16. About the effort done by the staff for security:
16-1. How much did you expect the staff for it before lodging in?
1. Very little 2. Little 3. So –so 4. Much 5. very much
16-2. How save do you evaluate the hotel now?
1. Very little 2. Little 3. So –so 4. Much 5. very much
17. About the hotel atmosphere:
17-1. How much calm and silent did you expect the hotel before lodging in?
1. Very little 2. Little 3. So –so 4. Much 5. very much
17-2. How quiet do you find it now?
1. Very little 2. Little 3. So –so 4. Much 5. very much
18. About the hotel accessibility:
18-1. How accessible did you expect the hotel before lodging in?
1. Very little 2. Little 3. So –so 4. Much 5. very much
18-2. How accessible do you evaluate it now?
1. Very little 2. Little 3. So –so 4. Much 5. very much
19. About the staff availability:
19-1. How much was your expectation about it before lodging in?
1. Very little 2. Little 3. So –so 4. Much 5. very much
19-2. How available do you find them now?
1. Very little 2. Little 3. So –so 4. Much 5. very much
20. About the attention paid by the staff for informing you about the services:
20-1. How much did you expect them for this before lodging in?
1. Very little 2. Little 3. So –so 4. Much 5. very much
20-2. How attendant do you find them now?
1. Very little 2. Little 3. So –so 4. Much 5. very much

113
21. About the staff flexibility for adapting themselves to your requests:
21-1. How much was your expectation for that before lodging in?
1. Very little 2. Little 3. So –so 4. Much 5. very much
21-2. How flexible do you evaluate them now?
1. Very little 2. Little 3. So –so 4. Much 5. very much
22. About the hotel prevision for your necessities:
22-1. How much was your expectation for that before lodging in?
1. Very little 2. Little 3. So –so 4. Much 5. very much
22-2. How mobilized do you find the hotel now?
1. Very little 2. Little 3. So –so 4. Much 5. very much