2008 Tasmanian Dairy Conference 8 th October 2008 Frank Drum – NAB Agribusiness Economist...
27
008 Tasmanian Dairy Conference th October 2008 rank Drum – NAB Agribusiness Economist Tasmania’s potential for growth in a world market
-
Upload
jasmin-maxwell -
Category
Documents
-
view
215 -
download
1
Transcript of 2008 Tasmanian Dairy Conference 8 th October 2008 Frank Drum – NAB Agribusiness Economist...

2008 Tasmanian Dairy Conference8th October 2008Frank Drum – NAB Agribusiness Economist
Tasmania’s potential for growth in a world market

Discussion outline
• Macro Economic Outlook
• Potential for growth in world markets
• Summary
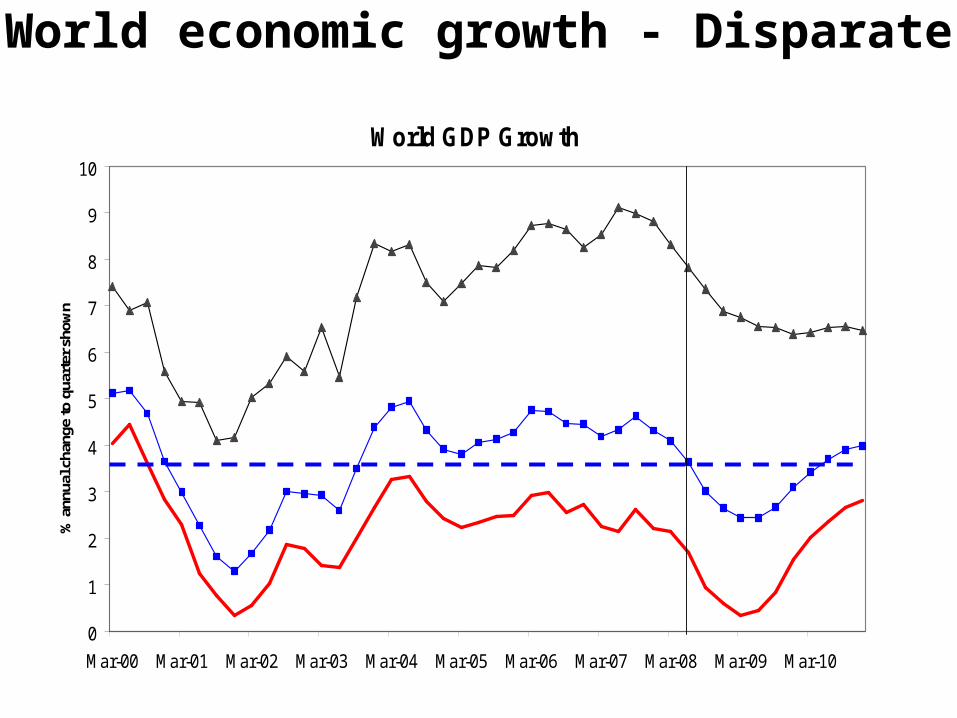
World economic growth - Disparate
World GDP Growth
0
1
2
3
4
5
6
7
8
9
10
Mar-00 Mar-01 Mar-02 Mar-03 Mar-04 Mar-05 Mar-06 Mar-07 Mar-08 Mar-09 Mar-10
% a
nnua
l cha
nge
to q
uart
er s
how
n
Forecast
Global growth
Developed economies
Emerging economies
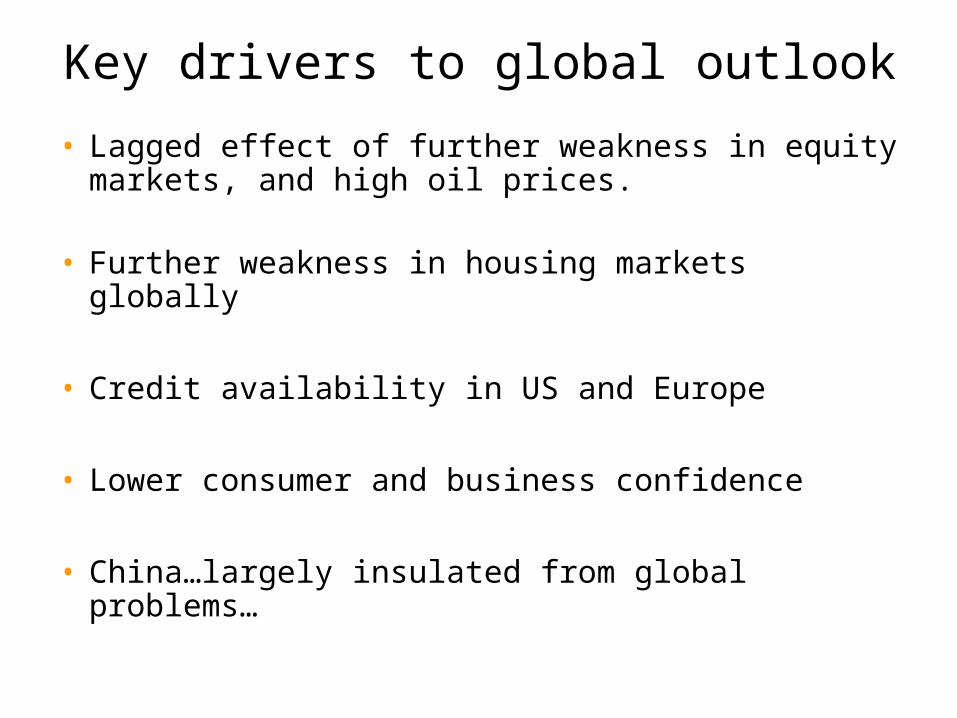
Key drivers to global outlook
• Lagged effect of further weakness in equity markets, and high oil prices.
• Further weakness in housing markets globally
• Credit availability in US and Europe
• Lower consumer and business confidence
• China…largely insulated from global problems…

Australian economic cycleSustained but slower “real” GDP growth for next couple of years
Medium term driven by the 4 P’s….Population, Participation, Productivity ….Politics/Policy
Australian GDP: Economy-wide v Excl. Farming & Mining
-2.5%
-1.5%
-0.5%
0.5%
1.5%
2.5%
3.5%
4.5%
5.5%
6.5%
Dec
-86
Dec
-87
Dec
-88
Dec
-89
Dec
-90
Dec
-91
Dec
-92
Dec
-93
Dec
-94
Dec
-95
Dec
-96
Dec
-97
Dec
-98
Dec
-99
Dec
-00
Dec
-01
Dec
-02
Dec
-03
Dec
-04
Dec
-05
Dec
-06
Dec
-07
Dec
-08
Dec
-09
Dec
-10
% c
han
ge
- 12
mo
nth
s to
-2.5%
-1.5%
-0.5%
0.5%
1.5%
2.5%
3.5%
4.5%
5.5%
6.5%
GDP GDP excl. primary resources

Key watch issues for Australia
• Further deterioration in global financial instability
• Further increase in global oil prices
• Government policy
• Sustained drought
• Brazil, Russia, India and China….
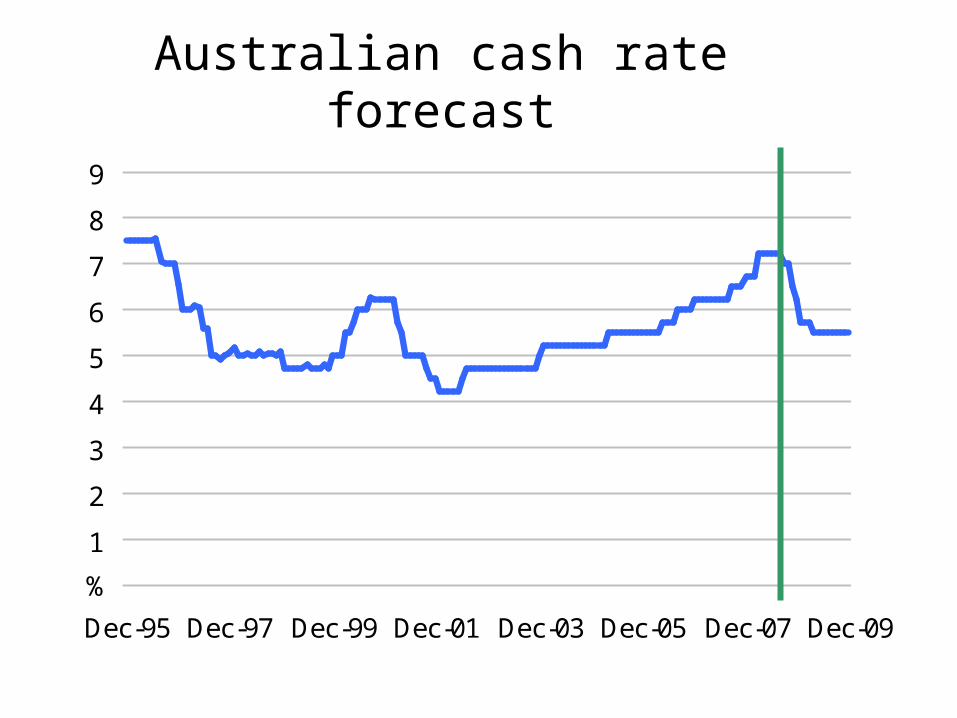
Australian cash rate forecast
1
2
3
4
5
6
7
8
9
Dec-95 Dec-97 Dec-99 Dec-01 Dec-03 Dec-05 Dec-07 Dec-09
%
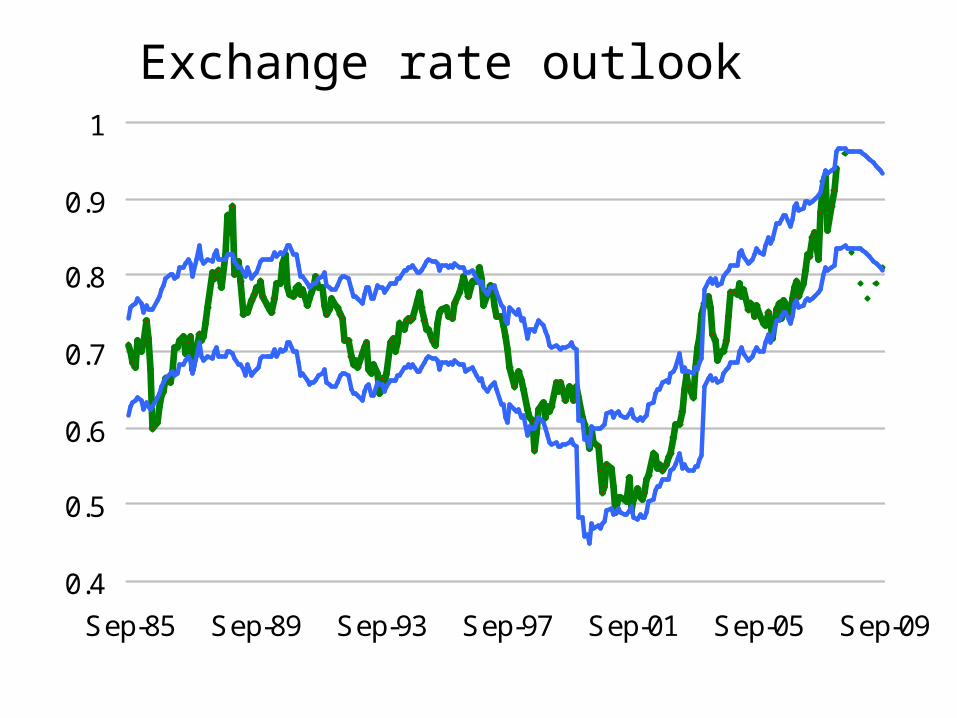
Exchange rate outlook
0.4
0.5
0.6
0.7
0.8
0.9
1
Sep-85 Sep-89 Sep-93 Sep-97 Sep-01 Sep-05 Sep-09

Macro Summary
• Global economic growth is slowing
• Growth in emerging economies to remain strong
• In Australia – slower but sustained growth
• Business – slower & a lot riskier
• Households - spending, unemployment
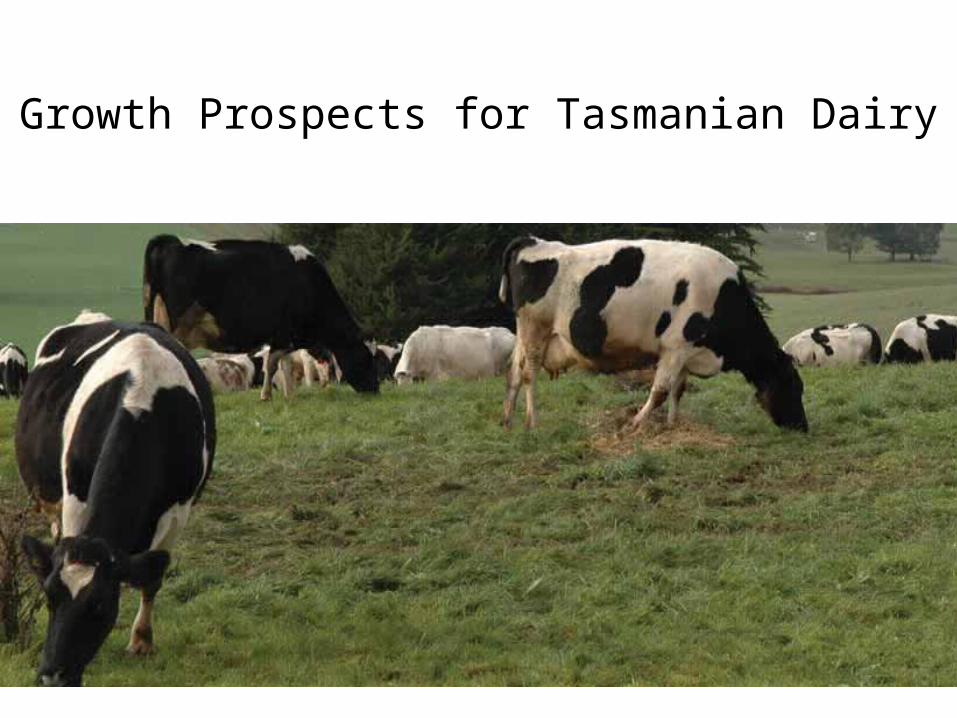
Growth Prospects for Tasmanian Dairy
Key growth Factors
• Developing new markets
• Production costs
• Key competitors
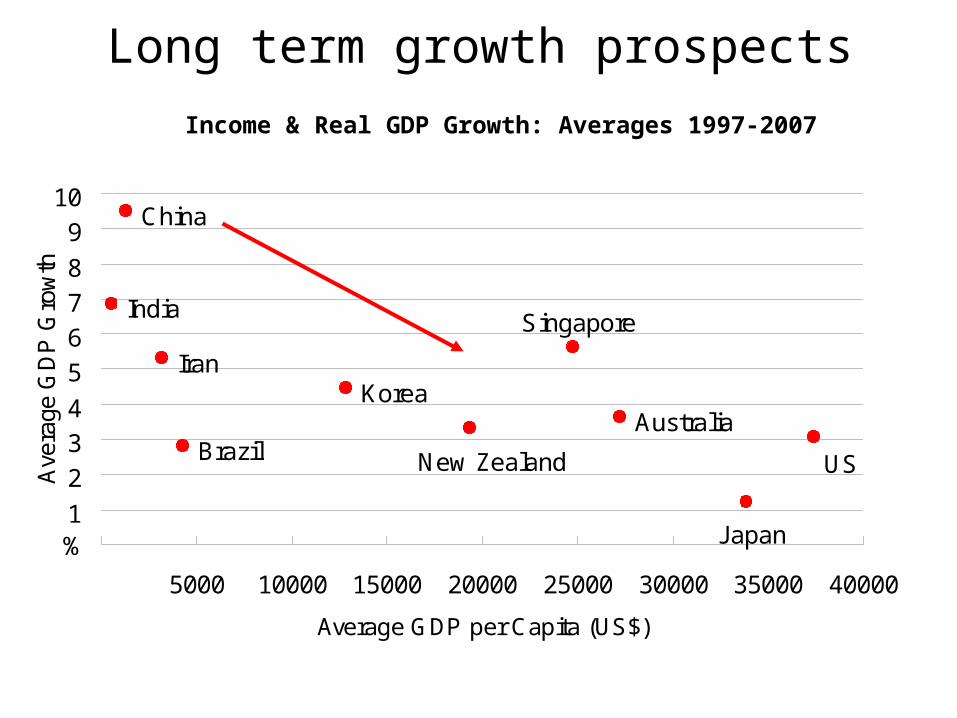
Long term growth prospects
China
India
KoreaIran
BrazilAustralia
New Zealand
Singapore
US
Japan1
2
3
4
5
6
7
8
9
10
5000 10000 15000 20000 25000 30000 35000 40000
Average GDP per Capita (US$)
Ave
rage
GD
P G
row
th
%
Income & Real GDP Growth: Averages 1997-2007

Per capita consumption of liquid milk & cheese
● China and India have low per capita consumption of milk products.
● As incomes rise and access to refrigeration increases there is scope for spectacular increases in consumption. We are already starting to see signs of that…

Annual meat consumption
20
40
60
80
100
120
140
1986 1991 1996 2001 2006 2011 2016Kg/person
US China India EU
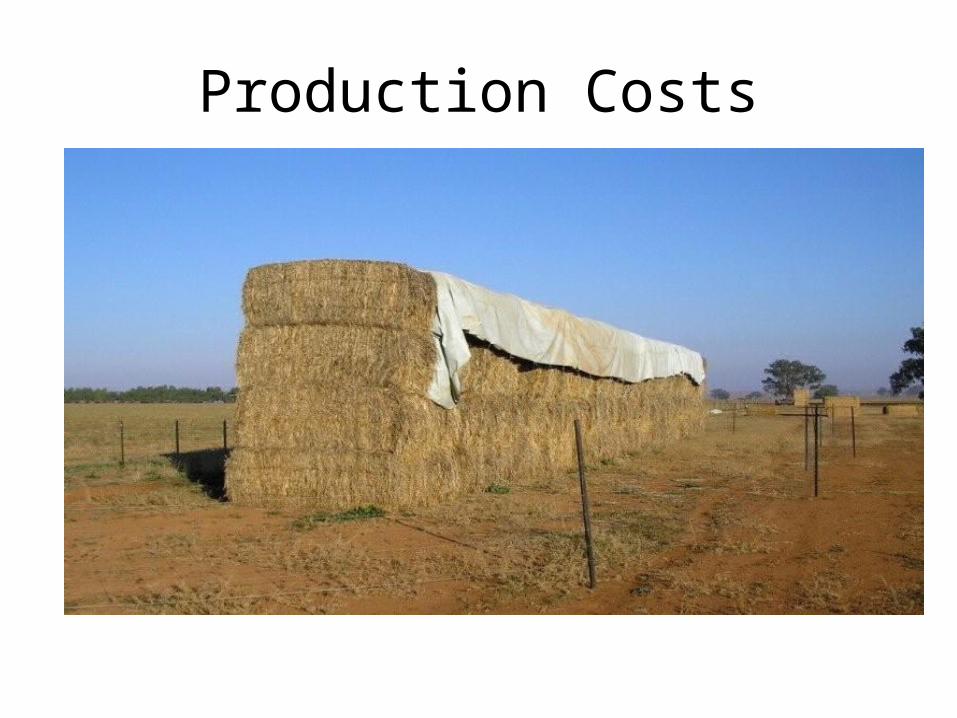
Production Costs

Feed Costs
10 20 30 40 50 60
Tasmania
Western Australia
Western Victoria
Gipplsland
South Australia
Northern NSW and QLD
Southern & Central NSW
Northern Victoria & Riverina
%
2007-082006-07

Biofuel explosion
Production of Ethanol and Biodiesel in the US and EU

Fertiliser costs
5 10 15 20
Northern Victoria & Riverina
Southern & Central NSW
South Australia
Northern NSW and QLD
Western Victoria
Gipplsland
Tasmania
Western Australia
%
2007-082006-07
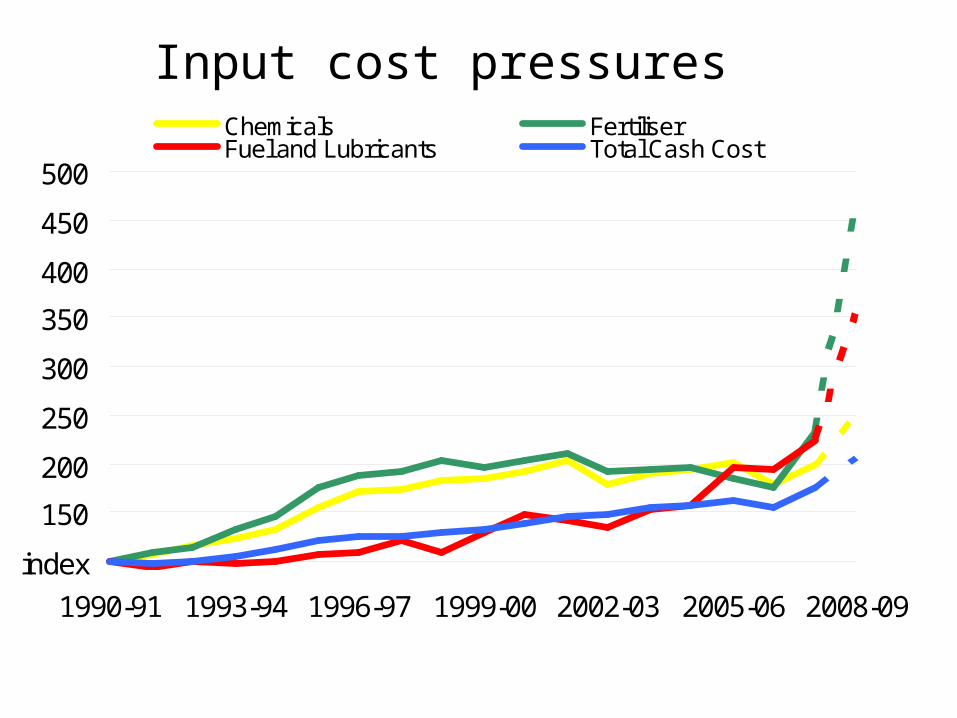
Input cost pressures
150
200
250
300
350
400
450
500
1990-91 1993-94 1996-97 1999-00 2002-03 2005-06 2008-09
index
Chemicals FertiliserFuel and Lubricants Total Cash Cost
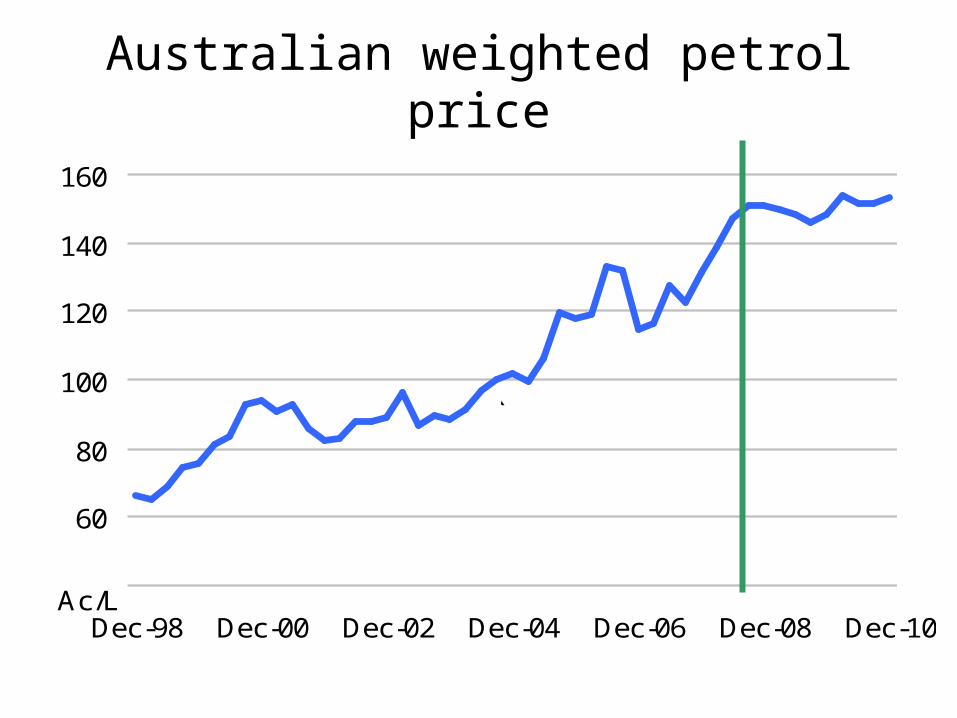
Australian weighted petrol price
60
80
100
120
140
160
Dec-98 Dec-00 Dec-02 Dec-04 Dec-06 Dec-08 Dec-10Ac/L
`

Global Players
• New Zealand
• European Union
• South America, India and China
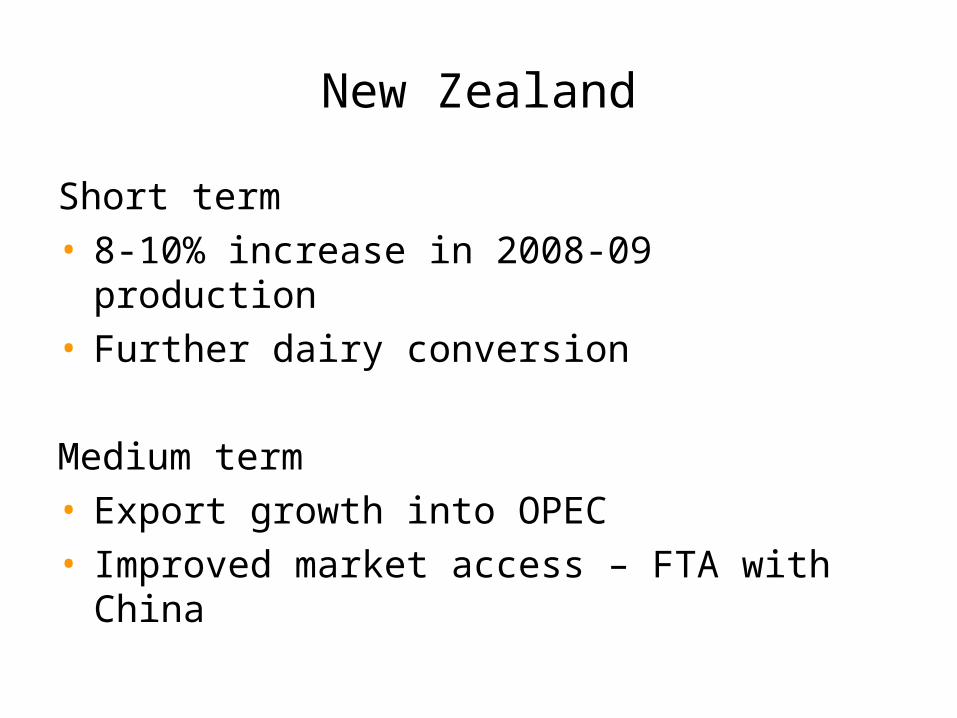
New Zealand
Short term• 8-10% increase in 2008-09 production• Further dairy conversion
Medium term• Export growth into OPEC• Improved market access – FTA with China
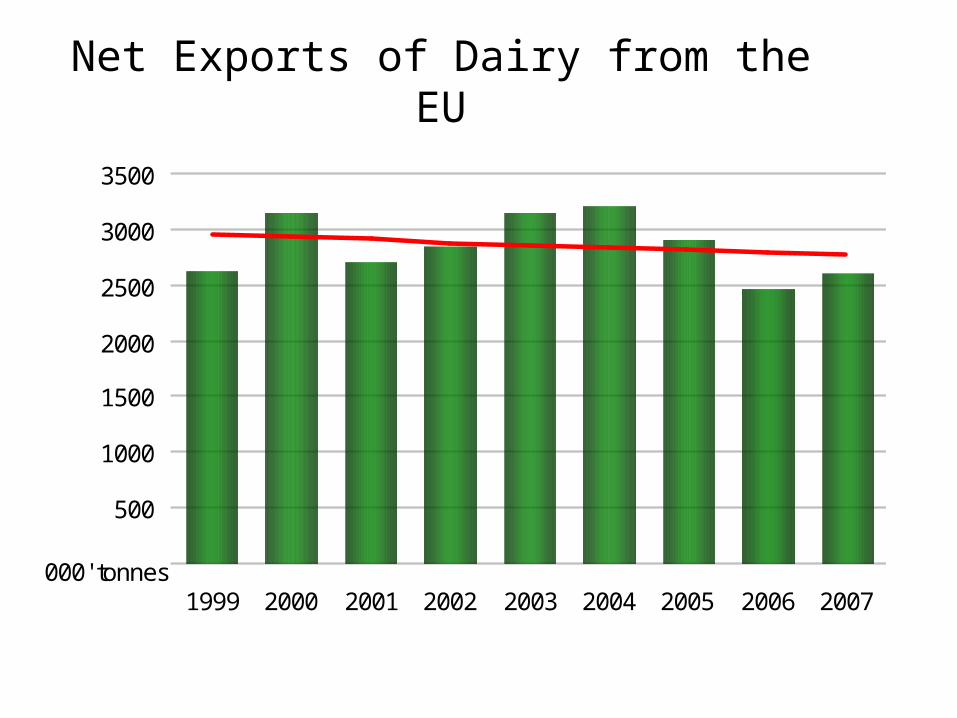
Net Exports of Dairy from the EU
500
1000
1500
2000
2500
3000
3500
1999 2000 2001 2002 2003 2004 2005 2006 2007000' tonnes
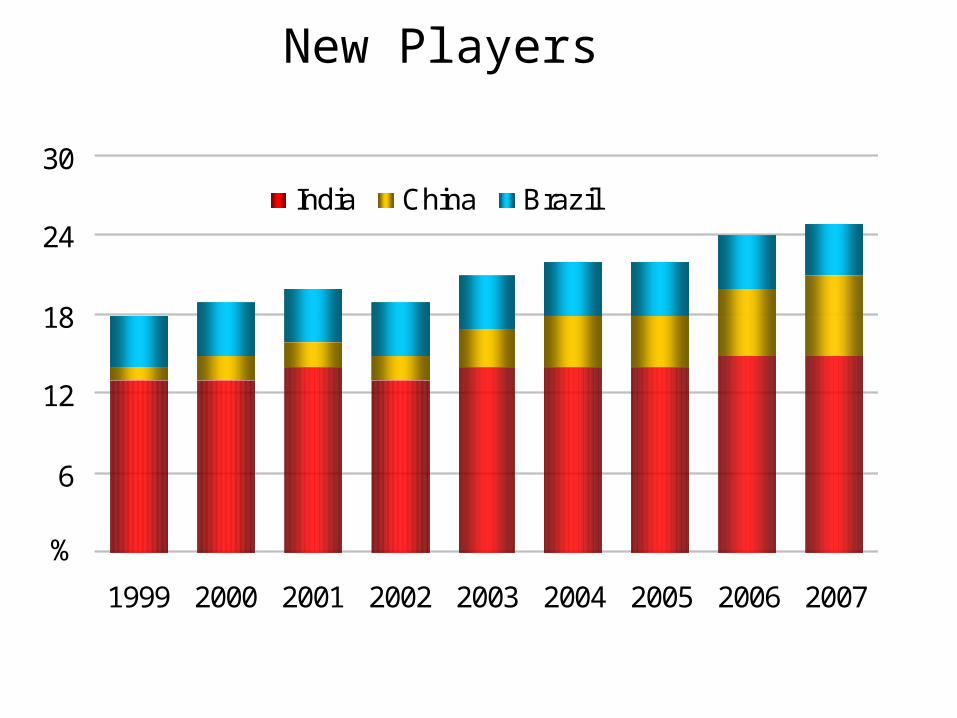
New Players
6
12
18
24
30
1999 2000 2001 2002 2003 2004 2005 2006 2007
%
India China Brazil

Summary
• Global economic environment is slowing• Increasing demand for protein remains long term
trend• Opportunities exist
• Challenges– Emerging markets– Cost competitiveness– Changing nature of global dairy environment
Important Notices
ANALYST CERTIFICATION: The person or persons named as the author's) of this report hereby certify that the views expressed in the research report accurately reflect their personal views about the subject securities and issuers and other subject matters discussed. No part of their compensation was, is, or will be, directly or indirectly, related to the specific recommendations or views expressed in the research report. Research analysts responsible for this report receive compensation based upon, among other factors, the overall profitability of the Markets Division which is part of the Institutional Markets & Services division of National Australia Bank Limited, a member of the National Australia Bank Group (the “National”). The views of the author's) do not necessarily reflect the views of the National and are subject to change without notice. The National may receive fees for banking services provided to an issuer of securities mentioned in this report. The National, its affiliates and their respective officers, and employees, including persons involved in the preparation or issuance of this report (subject to the policies of the National), may also from time to time maintain a long or short position in, or purchase or sell a position in, hold or act as advisors, brokers or commercial bankers in relation to the securities (or related securities and financial instruments), of companies mentioned in this report. The National or its affiliates may engage in these transactions in a manner that is inconsistent with or contrary to any recommendations made in this report.
DISCLAIMER: So far as the law allows, National Australia Bank Limited ABN 12 004 044 937 ("the National") disclaims any warranty or representations as to the accuracy or reliability of the information and statements in this document. The National expressly advises that, to the extent permitted by the law of Victoria, Australia, by which law use and all other matters relating to this document are governed, it shall not be liable in any way whatsoever (whether in negligence or otherwise) for any loss or damage which may be suffered by any person relying upon such information or any opinion, recommendations or conclusions contained in this document or otherwise arising in connection with the contents of or any omission from this document where the liability is made non-excludable by legislation. This document has been prepared for dissemination to professional investors. The opinions expressed herein are those of the author and not necessarily those of the National. The information on which those opinions are based has been gleaned from public sources or provided by the subject on a non-confidential basis. This document does not purport to contain all relevant information and any statement as to any future matter is a present prediction of a possible future outcome, the accuracy of which cannot be guaranteed. Past performance is not a guide to future performance. Recipients should not rely upon the contents of this document, but should make their own assessment and evaluation, undertake an investigation and enquire and seek advice to enable them to make any decision concerning their own risk. This material is not intended as an offer or solicitation for the purchase or sale of any financial instrument. The National, its affiliates, and employees may hold a position or act as price maker in the financial instruments of any issuer discussed within this document or act as underwriter, placement agent, adviser or lender to such issuer. © Copyright National Australia Bank Limited ABN 12 004 044 937.
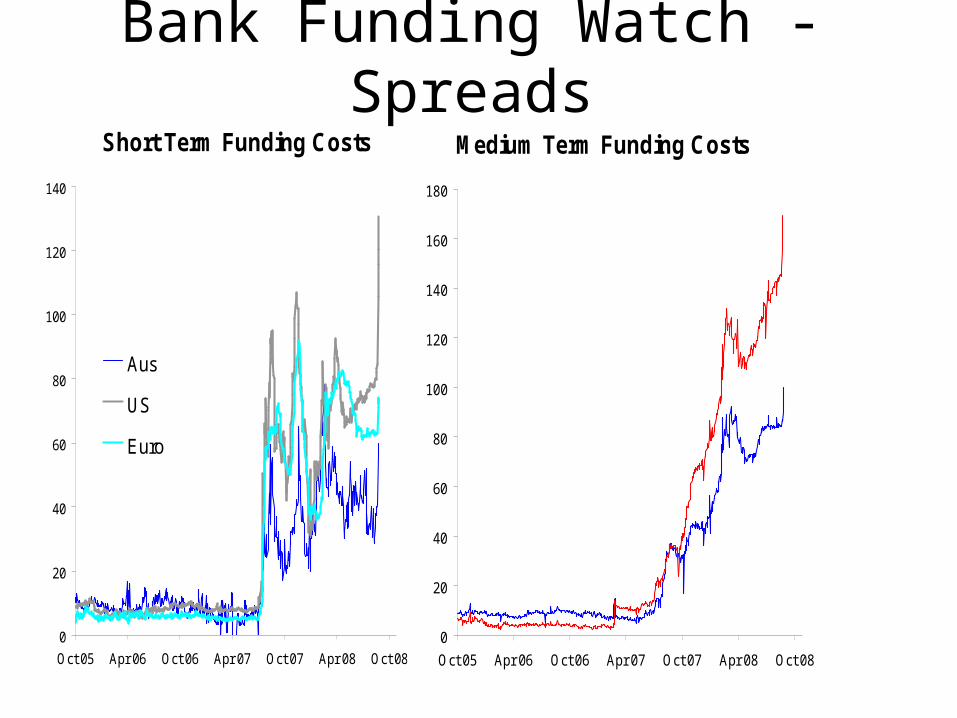
Bank Funding Watch - SpreadsShort Term Funding Costs
0
20
40
60
80
100
120
140
Oct 05 Apr 06 Oct 06 Apr 07 Oct 07 Apr 08 Oct 08
Aus
US
Euro
basis point spread between 3mth BBSW/Libor and the 3mth overight index swap
Medium Term Funding Costs
0
20
40
60
80
100
120
140
160
180
Oct 05 Apr 06 Oct 06 Apr 07 Oct 07 Apr 08 Oct 08
Bank spread to swap - 2-3 year
Domestic Banks
International Banks