©2008 Public Assets Institute State Taxes and Budgets: Policies for Prosperity October 2, 2008 Paul...
18
©2008 Public Assets Institute State Taxes and Budgets: Policies for Prosperity October 2, 2008 Paul A. Cillo Jack Hoffman Public Assets Institute www.publicassets.org
-
Upload
bernice-webb -
Category
Documents
-
view
213 -
download
0
Transcript of ©2008 Public Assets Institute State Taxes and Budgets: Policies for Prosperity October 2, 2008 Paul...

©2008 Public Assets Institute
State Taxes and Budgets: Policies for Prosperity
October 2, 2008
Paul A. CilloJack Hoffman
Public Assets Institute www.publicassets.org

©2008 Public Assets Institute
Public Assets Institute
Mission: To conduct research, perform fiscal analysis, disseminate information, and develop policies that apply the powers of government to improving the well being of ordinary citizens, especially the most vulnerable.

©2008 Public Assets Institute
FY-08 State Expenditures - $4.15 billion Source: JFO
K-1235.0%
Medicaid-SCHIP-Rx-Catamount
27.6%
Transportation2.9%
Corrections2.9%
Higher Ed2.1%
Natural Resources2.0%
All other27.5%

©2008 Public Assets Institute
FY08 State Budget by Funding Source - $4.15 billion Includes Federal Funds and Statewide Education Tax
Source: JFO
Federal funds31.5%
General fund28.3%
Education fund23.6%
Special funds5.6%
Transportation fund5.6%
State health care resources fund3.8%
Other1.6%

©2008 Public Assets Institute
FY-08 General Fund Revenue Sources – $1.170 billion(July 2007 Projection)
Source: JFO
Personal Income51%
Sales & Use20%
Rooms & Meals10%
Corporate Income5%
Property Transfer
Fees1%
Estate2%
Insurance5%
Other5%

©2008 Public Assets Institute
2007Vermont Tax Rate SchedulesMarried Filing Jointly Single IndividualsTaxable Income Taxable IncomeoverBut not over Pay+ % on Excessof amt over overBut not over Pay+ % on Excessof amt over053,150 0.003.60% 0 031,850 0.003.60%053,150128,5001,913.007.20%53,15031,85077,1001,147.007.20%31,850128,500195,8507,339.008.50%128,50077,100160,8504,405.008.50%77,100195,850349,70013,063.009.00%195,850160,850349,70011,523.009.00%160,850349,700- 26,910.009.50%349,700349,700- 28,520.009.50%349,700Heads of Household Married Filing SeparatelyTaxable Income Taxable IncomeoverBut not over Pay+ % on Excessof amt over overBut not over Pay+ % on Excessof amt over042,650 0.003.60% 0 026,575 0.003.60%042,650110,1001,535.007.20%42,65026,57564,250957.007.20%26,575110,100178,3506,392.008.50%110,10064,25097,9253,669.008.50%64,250178,350349,70012,193.009.00%178,35097,925174,8506,532.009.00%97,925349,700- 27,615.009.50%349,700174,850- 13,455.009.50%174,850
2007 Vermont Income Tax

©2008 Public Assets Institute
Distribution of Vermonters' Tax Returns, Income, and VT Income Tax (2006)
Data Source: VT Tax Department
0%
10%
20%
30%
40%
50%
60%
70%
$0-$49,999 $50,000-$99,999
$100,000-$299,999
$300,000-$999,999
$1,000,000 +
ReturnsAGIVT tax

©2008 Public Assets Institute
FY-08 Education Fund Revenue Sources - $1.24 billion (Sept. 2007 Projection)
Source: JFO
Homestead Education25%
Non-homestead Education38%
Sales and Use9%
Purchase and Use2%
General Fund Transfer23%
Lottery2%
Other1%

©2008 Public Assets Institute
FY-08 Transportation Fund Revenue Sources - $229.4 million (July 2007 Projection)
Source: JFO
Gasoline28%
Diesel8%
Purchase and Use 24%
Motor Vehicle Fees31%
Other9%

©2008 Public Assets Institute
GSP, VTrs AGI, GF Base, VTrs School TaxesCompound Average Annual Growth -- Vermont (1996-2006)
(not inflation adjusted)Data Sources: VT Tax Dept., JFO, Economy.com
1
1.2
1.4
1.6
1.8
1996 1997 1998 1999 2000 2001 2002 2003 2004 2005 2006
Index (1996=1)
Gross State Product Vermonters' AGI GF Base Appropriations Vermonters' School Taxes

©2008 Public Assets Institute
General Fund FY2009
$1,160
$1,180
$1,200
$1,220
$1,240
$1,260
$1,280
FY2008 As Passed Governor's ProposedBudget FY2009
FY 2009 As Passed FY2009 After AugustRescisions
5-year AverageAnnual Increase (6 %)
Millions

©2008 Public Assets Institute
FY2010 ProjectedBudget Gap
Revenue Millions
Current forecast $1,194
Expenditures
3% growth over FY2009 ($1,236)
Gap ($42)
FY2010 ProjectedBudget Gap
$0
$10
$20
$30
$40
$50
$60
$70
$80
$90
$100
$110
3% grow th
©2008 Public Assets Institute
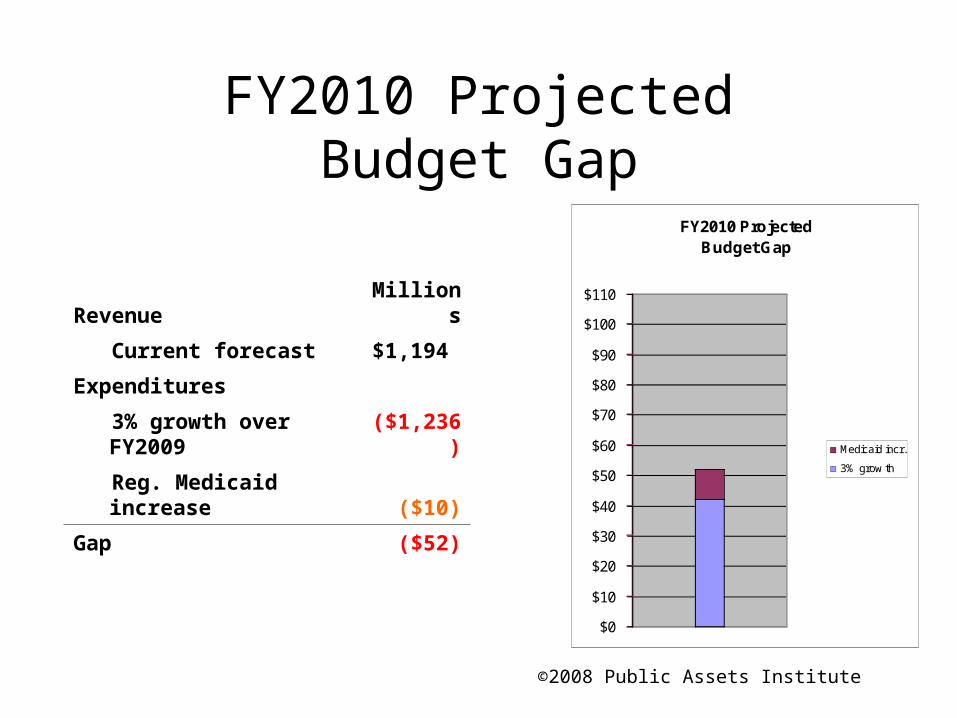
FY2010 ProjectedBudget Gap
Revenue Millions
Current forecast $1,194
Expenditures
3% growth over FY2009 ($1,236)
Reg. Medicaid increase ($10)
Gap ($52)
FY2010 ProjectedBudget Gap
$0
$10
$20
$30
$40
$50
$60
$70
$80
$90
$100
$110
Medicaid incr.
3% grow th

©2008 Public Assets Institute
FY2010 ProjectedBudget Gap
Revenue Millions
Current forecast $1,194
Expenditures
3% growth over FY2009 ($1,236)
Reg. Medicaid increase ($10)
Medicaid deficit ($38)
Gap ($90)
FY2010 ProjectedBudget Gap
$0
$10
$20
$30
$40
$50
$60
$70
$80
$90
$100
$110
Medicaid deficit
Medicaid incr.
3% grow th

©2008 Public Assets Institute
FY2010 ProjectedBudget Gap
Revenue Millions
Current forecast $1,194
Expenditures
3% growth over FY2009 ($1,236)
Reg. Medicaid increase ($10)
Medicaid deficit ($38)
LIHEAP ($5)
Gap ($95)
FY2010 ProjectedBudget Gap
$0
$10
$20
$30
$40
$50
$60
$70
$80
$90
$100
$110
LIHEAP
Medicaid deficit
Medicaid incr.
3% grow th
©2008 Public Assets Institute
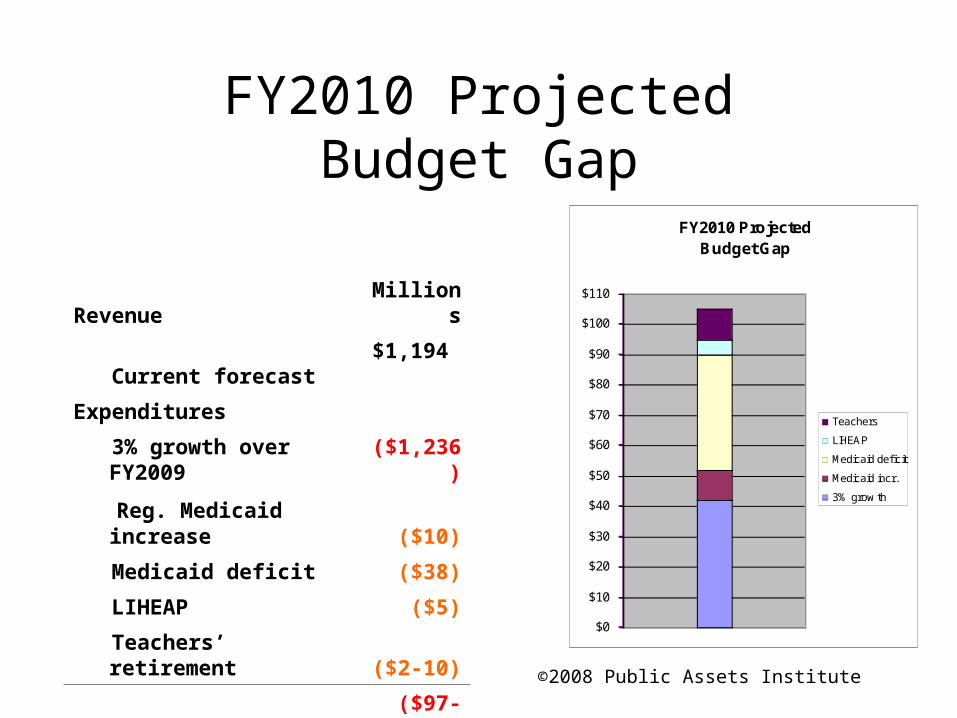
FY2010 ProjectedBudget Gap
Revenue Millions
Current forecast $1,194
Expenditures
3% growth over FY2009 ($1,236)
Reg. Medicaid increase ($10)
Medicaid deficit ($38)
LIHEAP ($5)
Teachers’ retirement ($2-10)
Gap ($97-107)
FY2010 ProjectedBudget Gap
$0
$10
$20
$30
$40
$50
$60
$70
$80
$90
$100
$110
Teachers
LIHEAP
Medicaid deficit
Medicaid incr.
3% grow th

©2008 Public Assets Institute
Vermont Gasoline Tax as % of Per-Gallon
0%
5%
10%
15%
20%
25%
$1.00 $1.25 $1.50 $1.75 $2.00 $2.25 $2.50 $2.75 $3.00 $3.25 $3.50 $3.75 $4.00 $4.25 $4.50 $4.75 $5.00

©2008 Public Assets Institute
Changes in Costs for 2008
($100,000,000)
$0
$100,000,000
$200,000,000
$300,000,000
$400,000,000
$500,000,000
$600,000,000
$700,000,000
Fossil fuel energy Health care General & Transportation Fund taxes