2008 _ parker county _ peaster isd _ 2008 texas school survey of drug and alcohol use _ elementary...
40
Peaster Spring 2008 Table T-1: How recently, if ever, have you used... Ever Used School Year Not Past Year Never Used Any tobacco product All 10.0% 5.5% 4.5% 90.0% Grade 5 2.9% 0.0% 2.9% 97.1% Grade 6 16.4% 10.4% 6.0% 83.6% Cigarettes All 8.4% 4.7% 3.7% 91.6% Grade 5 2.9% 0.0% 2.9% 97.1% Grade 6 13.4% 9.0% 4.5% 86.6% Smokeless tobacco All 4.0% 1.6% 2.4% 96.0% Grade 5 0.0% 0.0% 0.0% 100.0% Grade 6 7.6% 3.0% 4.5% 92.4% Table T-2: Average number of times selected tobacco products were used by those who reported use of .. School Year Lifetime All 3.9 3.6 Grade 5 * * Grade 6 3.9 3.1 Elementary Report-Page 1 of 40
-
Upload
texas-school-survey-of-drug-and-alcohol-use-elementary-reports -
Category
Documents
-
view
217 -
download
0
Transcript of 2008 _ parker county _ peaster isd _ 2008 texas school survey of drug and alcohol use _ elementary...

7/30/2019 2008 _ parker county _ peaster isd _ 2008 texas school survey of drug and alcohol use _ elementary report
http://slidepdf.com/reader/full/2008-parker-county-peaster-isd-2008-texas-school-survey-of-drug-and-alcohol 1/40
Peaster
Spring 2008
Table T-1: How recently, if ever, have you used...
Ever
Used
School
Year
Not Past
Year
Never
Used
Any tobacco product
All 10.0% 5.5% 4.5% 90.0%
Grade 5 2.9% 0.0% 2.9% 97.1%
Grade 6 16.4% 10.4% 6.0% 83.6%
Cigarettes
All 8.4% 4.7% 3.7% 91.6%
Grade 5 2.9% 0.0% 2.9% 97.1%
Grade 6 13.4% 9.0% 4.5% 86.6%
Smokeless tobacco
All 4.0% 1.6% 2.4% 96.0%
Grade 5 0.0% 0.0% 0.0% 100.0%
Grade 6 7.6% 3.0% 4.5% 92.4%
Table T-2: Average number of times selected tobacco products were used by thosewho reported use of ..
School
Year Lifetime
All 3.9 3.6
Grade 5 * *
Grade 6 3.9 3.1
Elementary Report-Page

7/30/2019 2008 _ parker county _ peaster isd _ 2008 texas school survey of drug and alcohol use _ elementary report
http://slidepdf.com/reader/full/2008-parker-county-peaster-isd-2008-texas-school-survey-of-drug-and-alcohol 2/40
Peaster
Spring 2008
Table T-3: Average age of first use of tobacco:
Grade 5 Grade 6
Cigarettes
* 9.8
Smokeless Tobacco
* *
Any Tobacco
* 9.6
Table T-4: Age of first use of tobacco by family situation:
Never Under 8 8 9 10 11 Over 11
Two Parent Family
All 90.3% 4.2% 1.1% 0.0% 1.1% 2.2% 1.1%
Grade 5 96.4% 3.6% 0.0% 0.0% 0.0% 0.0% 0.0%
Grade 6 83.3% 4.8% 2.4% 0.0% 2.4% 4.8% 2.4%
Other Family Situation
All 88.1% 2.7% 0.0% 3.1% 3.1% 3.1% 0.0%
Grade 5 90.9% 9.1% 0.0% 0.0% 0.0% 0.0% 0.0%
Grade 6 87.0% 0.0% 0.0% 4.3% 4.3% 4.3% 0.0%
Table T-5: About how many of your close friends use ...
Never
Heard Of None Some Most
Any tobacco product?All 0.0% 74.8% 19.7% 5.5%
Grade 5 0.0% 89.9% 10.1% 0.0%
Grade 6 0.0% 61.2% 28.4% 10.4%
Cigarettes?
All 1.5% 76.9% 16.9% 4.7%
Grade 5 1.4% 92.8% 5.8% 0.0%
Grade 6 1.5% 62.7% 26.9% 9.0%
Smokeless tobacco?
All 0.0% 89.2% 9.2% 1.6%
Grade 5 0.0% 94.0% 6.0% 0.0%
Grade 6 0.0% 84.8% 12.1% 3.0%
Elementary Report-Page

7/30/2019 2008 _ parker county _ peaster isd _ 2008 texas school survey of drug and alcohol use _ elementary report
http://slidepdf.com/reader/full/2008-parker-county-peaster-isd-2008-texas-school-survey-of-drug-and-alcohol 3/40
Peaster
Spring 2008
Table T-6: Have you ever been offered ...
Never
Heard Of Yes No
Any tobacco product?
All 0.8% 18.2% 81.0%
Grade 5 0.0% 10.0% 90.0%
Grade 6 1.5% 25.8% 72.7%
Cigarettes?
All 2.3% 15.9% 81.8%
Grade 5 1.4% 10.1% 88.4%
Grade 6 3.0% 21.2% 75.8%
Smokeless tobacco?
All 0.8% 9.4% 89.8%
Grade 5 0.0% 3.0% 97.0%
Grade 6 1.5% 15.2% 83.3%
Table T-7: How dangerous do you think it is for kids your age to use ...
Never
Heard Of
Very
Dangerous Dangerous
Not at All
Dangerous Do Not Know
Any tobacco product?
All 0.0% 77.6% 20.8% 0.8% 0.8%
Grade 5 0.0% 79.7% 20.3% 0.0% 0.0%
Grade 6 0.0% 75.8% 21.2% 1.5% 1.5%
Cigarettes?
All 0.0% 73.7% 24.0% 0.8% 1.5%
Grade 5 0.0% 76.8% 21.7% 0.0% 1.4%
Grade 6 0.0% 70.8% 26.2% 1.5% 1.5%
Smokeless tobacco?
All 0.0% 66.2% 27.8% 1.5% 4.5%
Grade 5 0.0% 65.7% 28.4% 1.5% 4.5%
Grade 6 0.0% 66.7% 27.3% 1.5% 4.5%
Elementary Report-Page

7/30/2019 2008 _ parker county _ peaster isd _ 2008 texas school survey of drug and alcohol use _ elementary report
http://slidepdf.com/reader/full/2008-parker-county-peaster-isd-2008-texas-school-survey-of-drug-and-alcohol 4/40
Peaster
Spring 2008
Table T-8: How do your parents feel about kids your age smoking cigarettes?
Don't Like Don't Care Think It's OK Don't know
All 88.6% 0.0% 0.8% 10.6%
Grade 5 89.9% 0.0% 0.0% 10.1%
Grade 6 87.5% 0.0% 1.6% 10.9%
Elementary Report-Page

7/30/2019 2008 _ parker county _ peaster isd _ 2008 texas school survey of drug and alcohol use _ elementary report
http://slidepdf.com/reader/full/2008-parker-county-peaster-isd-2008-texas-school-survey-of-drug-and-alcohol 5/40
Peaster
Spring 2008
Table A-1: How recently, if ever, have you used..
Ever
Used
School
Year
Not Past
Year
Never
Used
Any alcohol product
All 26.4% 17.9% 8.5% 73.6%
Grade 5 24.6% 11.6% 13.0% 75.4%
Grade 6 27.9% 23.5% 4.4% 72.1%
Beer
All 20.2% 9.9% 10.3% 79.8%
Grade 5 14.7% 4.4% 10.3% 85.3%
Grade 6 25.0% 14.7% 10.3% 75.0%
Wine coolers
All 14.6% 11.6% 2.9% 85.4%
Grade 5 10.4% 6.0% 4.5% 89.6%
Grade 6 18.2% 16.7% 1.5% 81.8%
Wine
All 17.5% 11.6% 5.9% 82.5%
Grade 5 14.7% 7.4% 7.4% 85.3%Grade 6 20.0% 15.4% 4.6% 80.0%
Liquor
All 8.6% 5.5% 3.1% 91.4%
Grade 5 2.9% 1.5% 1.5% 97.1%
Grade 6 13.6% 9.1% 4.5% 86.4%
Elementary Report-Page

7/30/2019 2008 _ parker county _ peaster isd _ 2008 texas school survey of drug and alcohol use _ elementary report
http://slidepdf.com/reader/full/2008-parker-county-peaster-isd-2008-texas-school-survey-of-drug-and-alcohol 6/40
Peaster
Spring 2008
Table A-2: Average number of times selected alcohol products were used by thosewho reported use of ..
School
Year Lifetime
Beer
All * 2.8
Grade 5 * 2.1
Grade 6 3.5 3.2
Liquor
All 6.9 4.7
Grade 5 * *
Grade 6 6.3 4.3
Wine
All 3.2 2.9
Grade 5 2.5 2.0
Grade 6 3.5 3.6
Elementary Report-Page

7/30/2019 2008 _ parker county _ peaster isd _ 2008 texas school survey of drug and alcohol use _ elementary report
http://slidepdf.com/reader/full/2008-parker-county-peaster-isd-2008-texas-school-survey-of-drug-and-alcohol 7/40
Peaster
Spring 2008
Table A-3: In the past year, how many times have you had two or more drinks at one time of ..
Never 1 Time 2 Times 3+ Times Ever
Beer?
All 86.7% 7.6% 1.6% 4.1% 13.3%
Grade 5 92.8% 7.2% 0.0% 0.0% 7.2%
Grade 6 81.0% 7.9% 3.2% 7.9% 19.0%
Wine Coolers?
All 90.4% 5.5% 0.0% 4.1% 9.6%
Grade 5 97.0% 3.0% 0.0% 0.0% 3.0%
Grade 6 84.4% 7.8% 0.0% 7.8% 15.6%
Wine?
All 83.8% 10.5% 2.4% 3.2% 16.2%
Grade 5 88.1% 11.9% 0.0% 0.0% 11.9%
Grade 6 80.0% 9.2% 4.6% 6.2% 20.0%
Liquor?
All 95.1% 0.8% 0.8% 3.3% 4.9%
Grade 5 100.0% 0.0% 0.0% 0.0% 0.0%
Grade 6 90.6% 1.6% 1.6% 6.3% 9.4%
Elementary Report-Page

7/30/2019 2008 _ parker county _ peaster isd _ 2008 texas school survey of drug and alcohol use _ elementary report
http://slidepdf.com/reader/full/2008-parker-county-peaster-isd-2008-texas-school-survey-of-drug-and-alcohol 8/40
Peaster
Spring 2008
Table A-4: Average age of first use of alcohol:
Grade 5 Grade 6
Beer
8.2 10.1
Wine Coolers
9.1 9.8
Wine
9.8 10.5
Liquor
* 10.9
Any Alcohol
8.7 10.0
Table A-5: Age of first use of alcohol by family situation:
Never Under 8 8 9 10 11 Over 11
Two Parent Family
All 75.2% 4.0% 4.2% 4.0% 3.9% 5.4% 3.3%
Grade 5 75.9% 5.6% 3.7% 5.6% 7.4% 1.9% 0.0%
Grade 6 74.4% 2.3% 4.7% 2.3% 0.0% 9.3% 7.0%
Other Family Situation
All 63.6% 5.9% 5.9% 9.5% 5.5% 0.0% 9.5%
Grade 5 63.6% 9.1% 9.1% 0.0% 18.2% 0.0% 0.0%
Grade 6 63.6% 4.5% 4.5% 13.6% 0.0% 0.0% 13.6%
Table A-6 : Lifetime prevalence of use of alcohol by reported conduct problemsthis school year:
No Absences
or Conduct
Problems Cut School
Sent to
Principal Both
10.7% 75.0% 60.2% 100.0%
Elementary Report-Page

7/30/2019 2008 _ parker county _ peaster isd _ 2008 texas school survey of drug and alcohol use _ elementary report
http://slidepdf.com/reader/full/2008-parker-county-peaster-isd-2008-texas-school-survey-of-drug-and-alcohol 9/40
Peaster
Spring 2008
Table A-7: When you drink alcohol, do you get it from ..
Don't Drink Yes No
Home?
All 74.0% 18.5% 7.5%
Grade 5 75.0% 16.2% 8.8%
Grade 6 73.0% 20.6% 6.3%
Friends?
All 76.2% 4.2% 19.6%
Grade 5 76.6% 0.0% 23.4%
Grade 6 75.8% 8.1% 16.1%
Somewhere else?
All 75.9% 7.6% 16.5%
Grade 5 77.8% 1.6% 20.6%
Grade 6 74.2% 12.9% 12.9%
Elementary Report-Page

7/30/2019 2008 _ parker county _ peaster isd _ 2008 texas school survey of drug and alcohol use _ elementary report
http://slidepdf.com/reader/full/2008-parker-county-peaster-isd-2008-texas-school-survey-of-drug-and-alcohol 10/40
Peaster
Spring 2008
Table A-8: About how many of your close friends use ..
Never
Heard Of None Some Most
Any alcohol product?
All 0.0% 70.5% 20.9% 8.6%
Grade 5 0.0% 83.8% 16.2% 0.0%
Grade 6 0.0% 58.8% 25.0% 16.2%
Beer?
All 0.0% 73.3% 17.8% 8.9%
Grade 5 0.0% 87.9% 12.1% 0.0%
Grade 6 0.0% 60.6% 22.7% 16.7%
Wine coolers?
All 6.0% 76.8% 11.5% 5.6%
Grade 5 6.0% 86.6% 7.5% 0.0%
Grade 6 6.1% 68.2% 15.2% 10.6%
Wine?
All 0.0% 83.8% 10.3% 5.9%
Grade 5 0.0% 89.2% 10.8% 0.0%Grade 6 0.0% 78.7% 9.8% 11.5%
Liquor?
All 2.8% 82.5% 8.4% 6.3%
Grade 5 5.9% 89.7% 4.4% 0.0%
Grade 6 0.0% 76.1% 11.9% 11.9%
Elementary Report-Page

7/30/2019 2008 _ parker county _ peaster isd _ 2008 texas school survey of drug and alcohol use _ elementary report
http://slidepdf.com/reader/full/2008-parker-county-peaster-isd-2008-texas-school-survey-of-drug-and-alcohol 11/40
Peaster
Spring 2008
Table A-9: Have you ever been offered ..
Never
Heard Of Yes No
Any alcohol product?
All 0.0% 26.8% 73.2%
Grade 5 0.0% 24.6% 75.4%
Grade 6 0.0% 28.8% 71.2%
Beer?
All 0.0% 21.2% 78.8%
Grade 5 0.0% 16.7% 83.3%
Grade 6 0.0% 25.4% 74.6%
Wine coolers?
All 9.0% 11.5% 79.5%
Grade 5 10.3% 8.8% 80.9%
Grade 6 7.8% 14.1% 78.1%
Wine?
All 0.0% 13.4% 86.6%
Grade 5 0.0% 7.5% 92.5%Grade 6 0.0% 18.8% 81.3%
Liquor?
All 2.8% 10.3% 86.8%
Grade 5 6.0% 3.0% 91.0%
Grade 6 0.0% 16.9% 83.1%
Elementary Report-Page
7/30/2019 2008 _ parker county _ peaster isd _ 2008 texas school survey of drug and alcohol use _ elementary report
http://slidepdf.com/reader/full/2008-parker-county-peaster-isd-2008-texas-school-survey-of-drug-and-alcohol 12/40
Peaster
Spring 2008
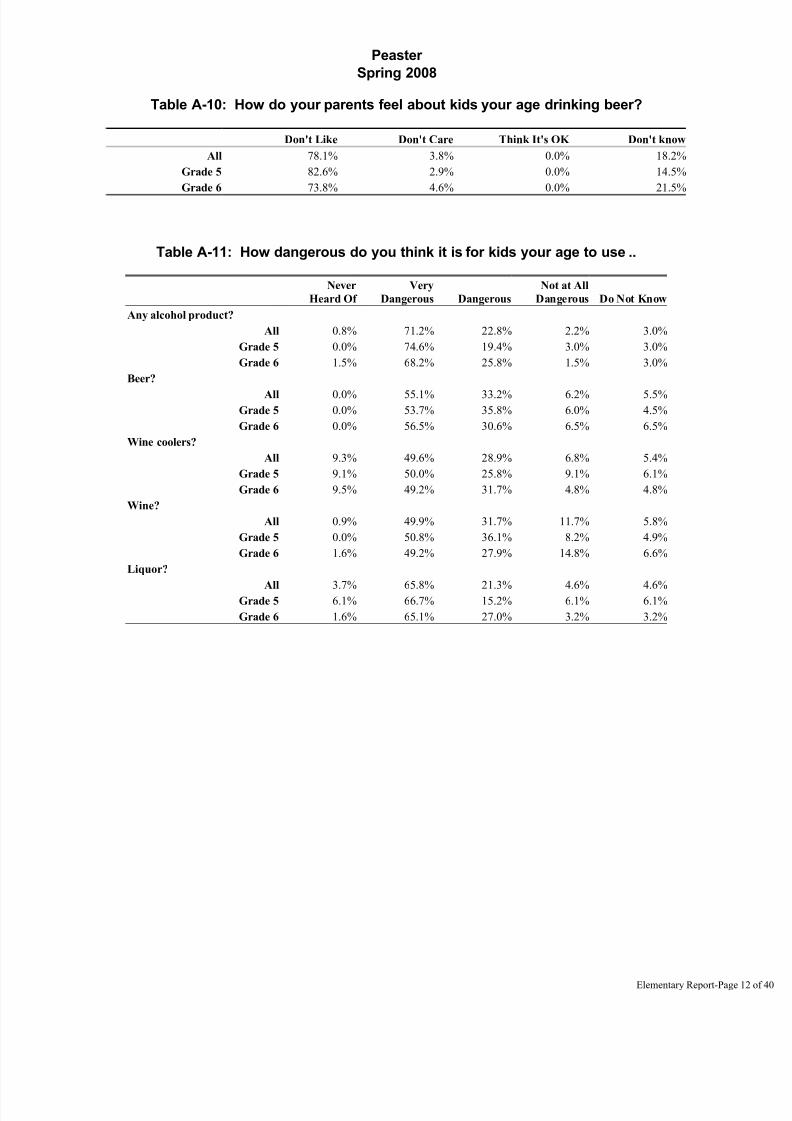
Table A-10: How do your parents feel about kids your age drinking beer?
Don't Like Don't Care Think It's OK Don't know
All 78.1% 3.8% 0.0% 18.2%
Grade 5 82.6% 2.9% 0.0% 14.5%
Grade 6 73.8% 4.6% 0.0% 21.5%
Table A-11: How dangerous do you think it is for kids your age to use ..
Never
Heard Of
Very
Dangerous Dangerous
Not at All
Dangerous Do Not Know
Any alcohol product?
All 0.8% 71.2% 22.8% 2.2% 3.0%
Grade 5 0.0% 74.6% 19.4% 3.0% 3.0%
Grade 6 1.5% 68.2% 25.8% 1.5% 3.0%
Beer?
All 0.0% 55.1% 33.2% 6.2% 5.5%Grade 5 0.0% 53.7% 35.8% 6.0% 4.5%
Grade 6 0.0% 56.5% 30.6% 6.5% 6.5%
Wine coolers?
All 9.3% 49.6% 28.9% 6.8% 5.4%
Grade 5 9.1% 50.0% 25.8% 9.1% 6.1%
Grade 6 9.5% 49.2% 31.7% 4.8% 4.8%
Wine?
All 0.9% 49.9% 31.7% 11.7% 5.8%
Grade 5 0.0% 50.8% 36.1% 8.2% 4.9%
Grade 6 1.6% 49.2% 27.9% 14.8% 6.6%
Liquor?
All 3.7% 65.8% 21.3% 4.6% 4.6%Grade 5 6.1% 66.7% 15.2% 6.1% 6.1%
Grade 6 1.6% 65.1% 27.0% 3.2% 3.2%
Elementary Report-Page
7/30/2019 2008 _ parker county _ peaster isd _ 2008 texas school survey of drug and alcohol use _ elementary report
http://slidepdf.com/reader/full/2008-parker-county-peaster-isd-2008-texas-school-survey-of-drug-and-alcohol 13/40
Peaster
Spring 2008
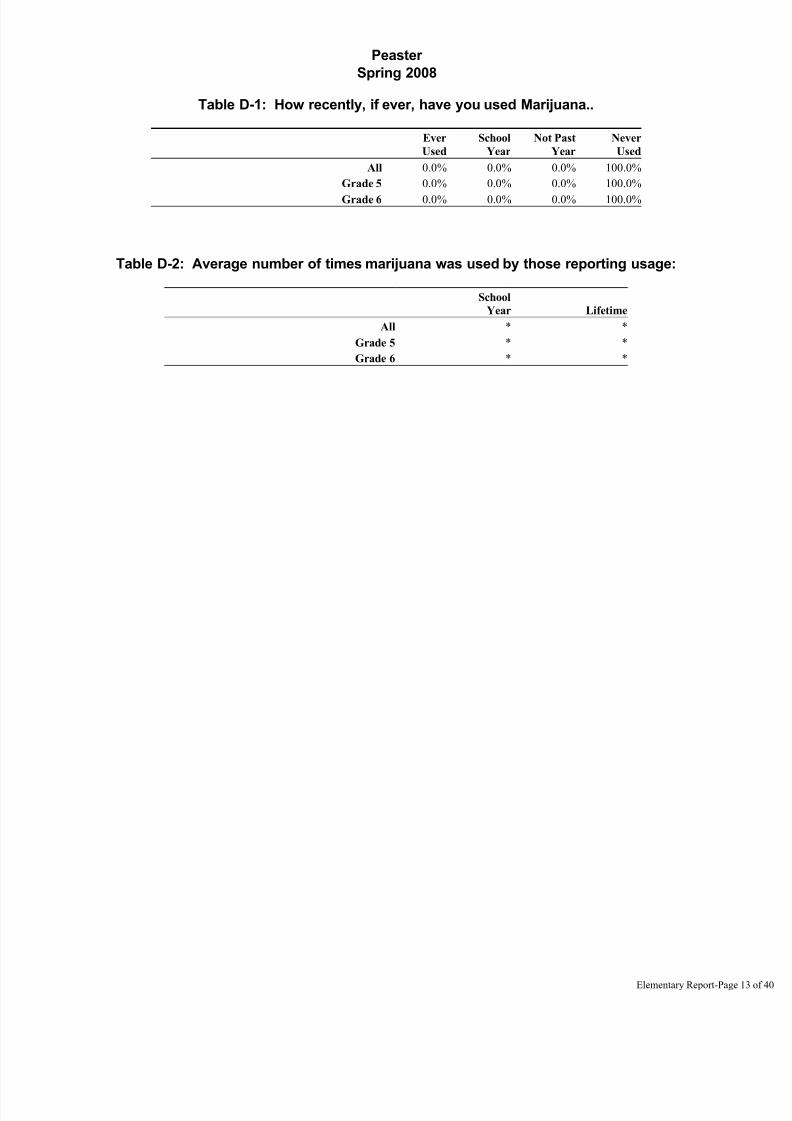
Table D-1: How recently, if ever, have you used Marijuana..
Ever
Used
School
Year
Not Past
Year
Never
Used
All 0.0% 0.0% 0.0% 100.0%
Grade 5 0.0% 0.0% 0.0% 100.0%
Grade 6 0.0% 0.0% 0.0% 100.0%
Table D-2: Average number of times marijuana was used by those reporting usage:
School
Year Lifetime
All * *
Grade 5 * *
Grade 6 * *
Elementary Report-Page

7/30/2019 2008 _ parker county _ peaster isd _ 2008 texas school survey of drug and alcohol use _ elementary report
http://slidepdf.com/reader/full/2008-parker-county-peaster-isd-2008-texas-school-survey-of-drug-and-alcohol 14/40
Peaster
Spring 2008
Table D-3: Average age of first use of marijuana:
Grade 5 Grade 6
* *
Table D-4: Age of first use of marijuana by family situation:
Never Under 8 8 9 10 11 Over 11
Two Parent Family
All 100.0% 0.0% 0.0% 0.0% 0.0% 0.0% 0.0%
Grade 5 100.0% 0.0% 0.0% 0.0% 0.0% 0.0% 0.0%
Grade 6 100.0% 0.0% 0.0% 0.0% 0.0% 0.0% 0.0%
Other Family Situation
All 100.0% 0.0% 0.0% 0.0% 0.0% 0.0% 0.0%
Grade 5 100.0% 0.0% 0.0% 0.0% 0.0% 0.0% 0.0%
Grade 6 100.0% 0.0% 0.0% 0.0% 0.0% 0.0% 0.0%
Elementary Report-Page

7/30/2019 2008 _ parker county _ peaster isd _ 2008 texas school survey of drug and alcohol use _ elementary report
http://slidepdf.com/reader/full/2008-parker-county-peaster-isd-2008-texas-school-survey-of-drug-and-alcohol 15/40
Peaster
Spring 2008
Table D-5 : Lifetime prevalence of use of marijuana by reported conductproblems this school year:
No Absences
or Conduct
Problems Cut School
Sent to
Principal Both
* * * *
Table D-6: About how many of your close friends use marijuana?
Never
Heard Of None Some Most
All 8.2% 83.6% 7.5% 0.8%
Grade 5 13.8% 86.2% 0.0% 0.0%
Grade 6 3.1% 81.3% 14.1% 1.6%
Table D-7: Have you ever been offered marijuana?
Never
Heard Of Yes No
All 8.0% 2.4% 89.6%
Grade 5 13.2% 0.0% 86.8%
Grade 6 3.1% 4.7% 92.2%
Table D-8: How do your parents feel about kids your age smoking marijuana?
Don't Like Don't Care Think It's OK Don't know
All 84.4% 0.0% 0.0% 15.6%
Grade 5 82.6% 0.0% 0.0% 17.4%
Grade 6 86.2% 0.0% 0.0% 13.8%
Table D-9: How dangerous do you think it is for kids your age to use marijuana?
Never
Heard Of
Very
Dangerous Dangerous
Not at All
Dangerous Do Not Know
All 6.7% 78.5% 8.7% 0.7% 5.4%
Grade 5 10.8% 75.4% 6.2% 1.5% 6.2%
Grade 6 3.1% 81.3% 10.9% 0.0% 4.7%
Elementary Report-Page

7/30/2019 2008 _ parker county _ peaster isd _ 2008 texas school survey of drug and alcohol use _ elementary report
http://slidepdf.com/reader/full/2008-parker-county-peaster-isd-2008-texas-school-survey-of-drug-and-alcohol 16/40
Peaster
Spring 2008
Table I-1: How recently, if ever, have you used Inhalants..
Ever
Used
School
Year
Not Past
Year
Never
Used
All 8.2% 7.6% 0.7% 91.8%
Grade 5 5.8% 4.3% 1.4% 94.2%
Grade 6 10.4% 10.4% 0.0% 89.6%
Table I-2: Have you ever sniffed any of the following inhalants to get high?
Not Used Used
Correction Fluid/Whiteout
All 94.0% 6.0%
Grade 5 94.0% 6.0%
Grade 6 94.0% 6.0%
Gasoline
All 97.0% 3.0%Grade 5 98.6% 1.4%
Grade 6 95.5% 4.5%
Glue
All 99.2% 0.8%
Grade 5 100.0% 0.0%
Grade 6 98.4% 1.6%
Paint Thinner
All 99.2% 0.8%
Grade 5 100.0% 0.0%
Grade 6 98.5% 1.5%
Spray Paint
All 96.9% 3.1%Grade 5 98.5% 1.5%
Grade 6 95.5% 4.5%
Other Inhalants
All 96.2% 3.8%
Grade 5 97.1% 2.9%
Grade 6 95.5% 4.5%
Elementary Report-Page
7/30/2019 2008 _ parker county _ peaster isd _ 2008 texas school survey of drug and alcohol use _ elementary report
http://slidepdf.com/reader/full/2008-parker-county-peaster-isd-2008-texas-school-survey-of-drug-and-alcohol 17/40
Peaster
Spring 2008
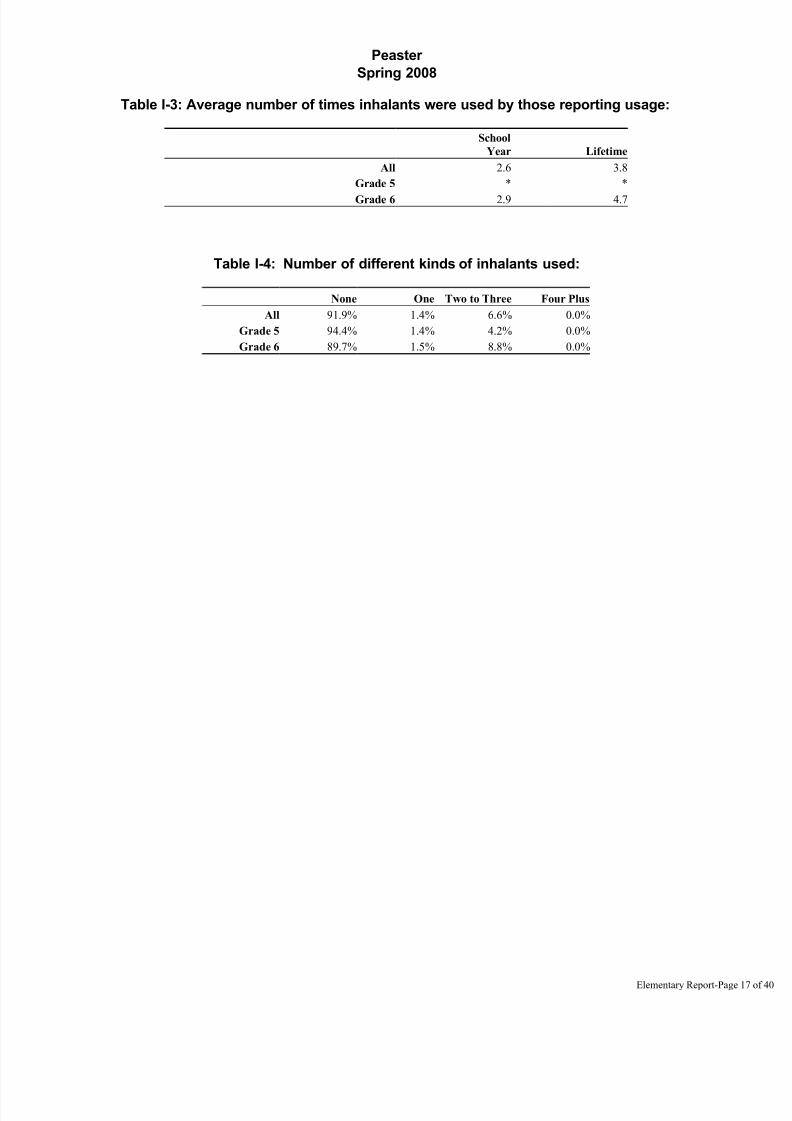
Table I-3: Average number of times inhalants were used by those reporting usage:
School
Year Lifetime
All 2.6 3.8
Grade 5 * *
Grade 6 2.9 4.7
Table I-4: Number of different kinds of inhalants used:
None One Two to Three Four Plus
All 91.9% 1.4% 6.6% 0.0%
Grade 5 94.4% 1.4% 4.2% 0.0%
Grade 6 89.7% 1.5% 8.8% 0.0%
Elementary Report-Page
7/30/2019 2008 _ parker county _ peaster isd _ 2008 texas school survey of drug and alcohol use _ elementary report
http://slidepdf.com/reader/full/2008-parker-county-peaster-isd-2008-texas-school-survey-of-drug-and-alcohol 18/40
Peaster
Spring 2008
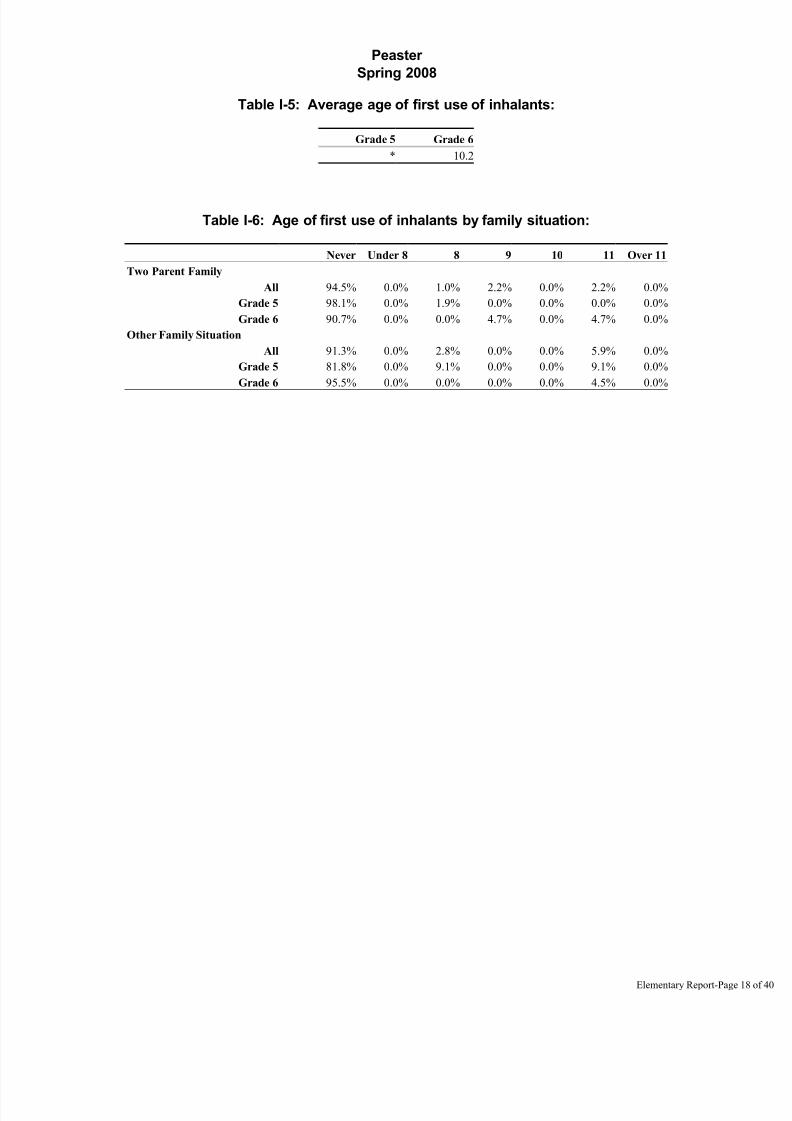
Table I-5: Average age of first use of inhalants:
Grade 5 Grade 6
* 10.2
Table I-6: Age of first use of inhalants by family situation:
Never Under 8 8 9 10 11 Over 11
Two Parent Family
All 94.5% 0.0% 1.0% 2.2% 0.0% 2.2% 0.0%
Grade 5 98.1% 0.0% 1.9% 0.0% 0.0% 0.0% 0.0%
Grade 6 90.7% 0.0% 0.0% 4.7% 0.0% 4.7% 0.0%
Other Family Situation
All 91.3% 0.0% 2.8% 0.0% 0.0% 5.9% 0.0%
Grade 5 81.8% 0.0% 9.1% 0.0% 0.0% 9.1% 0.0%
Grade 6 95.5% 0.0% 0.0% 0.0% 0.0% 4.5% 0.0%
Elementary Report-Page

7/30/2019 2008 _ parker county _ peaster isd _ 2008 texas school survey of drug and alcohol use _ elementary report
http://slidepdf.com/reader/full/2008-parker-county-peaster-isd-2008-texas-school-survey-of-drug-and-alcohol 19/40
Peaster
Spring 2008
Table I-7: Lifetime prevalence of use of inhalants by reported conductproblems this school year:
No Absences
or Conduct
Problems Cut School
Sent to
Principal Both
3.2% 75.0% 16.2% 100.0%
Table I-8: About how many of your close friends use inhalants?
Never
Heard Of None Some Most
All 2.2% 77.8% 15.1% 4.9%
Grade 5 3.1% 90.8% 6.2% 0.0%
Grade 6 1.5% 66.7% 22.7% 9.1%
Elementary Report-Page

7/30/2019 2008 _ parker county _ peaster isd _ 2008 texas school survey of drug and alcohol use _ elementary report
http://slidepdf.com/reader/full/2008-parker-county-peaster-isd-2008-texas-school-survey-of-drug-and-alcohol 20/40
Peaster
Spring 2008
Table I-9: Have you ever been offered inhalants?
Never
Heard Of Yes No
All 2.3% 12.9% 84.7%
Grade 5 1.5% 11.9% 86.6%
Grade 6 3.1% 13.8% 83.1%
Table I-10: How dangerous do you think it is for kids your age to use inhalants?
Never
Heard Of
Very
Dangerous Dangerous
Not at All
Dangerous Do Not Know
All 0.7% 69.3% 20.4% 3.2% 6.3%
Grade 5 1.5% 68.7% 20.9% 3.0% 6.0%
Grade 6 0.0% 70.0% 20.0% 3.3% 6.7%
Elementary Report-Page

7/30/2019 2008 _ parker county _ peaster isd _ 2008 texas school survey of drug and alcohol use _ elementary report
http://slidepdf.com/reader/full/2008-parker-county-peaster-isd-2008-texas-school-survey-of-drug-and-alcohol 21/40
Peaster
Spring 2008
Table X-1: Since school began in the fall, have you gotten information on drugsor alcohol from ..
CATEGORY Yes
An Assembly Program? All 57.1%
Grade 5 68.3%
Grade 6 47.5%
Guidance Counselor? All 74.7%
Grade 5 92.8%
Grade 6 56.7%
Visitor to Class? All 72.1%
Grade 5 51.6%
Grade 6 90.2%
Someone Else at School? All 39.0%
Grade 5 44.3%
Grade 6 34.4%
Your Teacher? All 66.8%
Grade 5 65.1%
Grade 6 68.3%Any School Source? All 95.7%
Grade 5 94.2%
Grade 6 97.0%
Elementary Report-Page

7/30/2019 2008 _ parker county _ peaster isd _ 2008 texas school survey of drug and alcohol use _ elementary report
http://slidepdf.com/reader/full/2008-parker-county-peaster-isd-2008-texas-school-survey-of-drug-and-alcohol 22/40
Peaster
Spring 2008
Table B1: Prevalence and recency of use of selected substances by gradeAll Students
Ever
Used
School
Year
Not Past
Year
Never
Used
Tobacco
All 10.0% 5.5% 4.5% 90.0%
Grade 5 2.9% 0.0% 2.9% 97.1%
Grade 6 16.4% 10.4% 6.0% 83.6%
Alcohol
All 26.4% 17.9% 8.5% 73.6%
Grade 5 24.6% 11.6% 13.0% 75.4%
Grade 6 27.9% 23.5% 4.4% 72.1%
Inhalants
All 8.2% 7.6% 0.7% 91.8%
Grade 5 5.8% 4.3% 1.4% 94.2%
Grade 6 10.4% 10.4% 0.0% 89.6%
Marijuana
All 0.0% 0.0% 0.0% 100.0%Grade 5 0.0% 0.0% 0.0% 100.0%
Grade 6 0.0% 0.0% 0.0% 100.0%
Elementary Report-Page

7/30/2019 2008 _ parker county _ peaster isd _ 2008 texas school survey of drug and alcohol use _ elementary report
http://slidepdf.com/reader/full/2008-parker-county-peaster-isd-2008-texas-school-survey-of-drug-and-alcohol 23/40
Peaster
Spring 2008
Table B2: Prevalence and recency of use of selected substances by gradeMale Students
Ever
Used
School
Year
Not Past
Year
Never
Used
Tobacco
All 15.6% 7.9% 7.7% 84.4%
Grade 5 2.7% 0.0% 2.7% 97.3%
Grade 6 29.0% 16.1% 12.9% 71.0%
Alcohol
All 36.0% 24.4% 11.6% 64.0%
Grade 5 33.3% 16.7% 16.7% 66.7%
Grade 6 38.7% 32.3% 6.5% 61.3%
Inhalants
All 10.8% 9.4% 1.4% 89.2%
Grade 5 8.3% 5.6% 2.8% 91.7%
Grade 6 13.3% 13.3% 0.0% 86.7%
Marijuana
All 0.0% 0.0% 0.0% 100.0%Grade 5 0.0% 0.0% 0.0% 100.0%
Grade 6 0.0% 0.0% 0.0% 100.0%
Elementary Report-Page

7/30/2019 2008 _ parker county _ peaster isd _ 2008 texas school survey of drug and alcohol use _ elementary report
http://slidepdf.com/reader/full/2008-parker-county-peaster-isd-2008-texas-school-survey-of-drug-and-alcohol 24/40
Peaster
Spring 2008
Table B3: Prevalence and recency of use of selected substances by gradeFemale Students
Ever
Used
School
Year
Not Past
Year
Never
Used
Tobacco
All 4.4% 3.1% 1.3% 95.6%
Grade 5 3.0% 0.0% 3.0% 97.0%
Grade 6 5.6% 5.6% 0.0% 94.4%
Alcohol
All 17.3% 11.8% 5.5% 82.7%
Grade 5 15.2% 6.1% 9.1% 84.8%
Grade 6 18.9% 16.2% 2.7% 81.1%
Inhalants
All 5.9% 5.9% 0.0% 94.1%
Grade 5 3.0% 3.0% 0.0% 97.0%
Grade 6 8.1% 8.1% 0.0% 91.9%
Marijuana
All 0.0% 0.0% 0.0% 100.0%Grade 5 0.0% 0.0% 0.0% 100.0%
Grade 6 0.0% 0.0% 0.0% 100.0%
Elementary Report-Page

7/30/2019 2008 _ parker county _ peaster isd _ 2008 texas school survey of drug and alcohol use _ elementary report
http://slidepdf.com/reader/full/2008-parker-county-peaster-isd-2008-texas-school-survey-of-drug-and-alcohol 25/40
Peaster
Spring 2008
Table B4: Prevalence and recency of use of selected substances by gradeWhite Students
Ever
Used
School
Year
Not Past
Year
Never
Used
Tobacco
All 7.4% 2.9% 4.5% 92.6%
Grade 5 3.3% 0.0% 3.3% 96.7%
Grade 6 11.5% 5.8% 5.8% 88.5%
Alcohol
All 26.8% 18.2% 8.6% 73.2%
Grade 5 26.7% 13.3% 13.3% 73.3%
Grade 6 26.9% 23.1% 3.8% 73.1%
Inhalants
All 7.2% 6.3% 0.8% 92.8%
Grade 5 6.7% 5.0% 1.7% 93.3%
Grade 6 7.7% 7.7% 0.0% 92.3%
Marijuana
All 0.0% 0.0% 0.0% 100.0%Grade 5 0.0% 0.0% 0.0% 100.0%
Grade 6 0.0% 0.0% 0.0% 100.0%
Elementary Report-Page

7/30/2019 2008 _ parker county _ peaster isd _ 2008 texas school survey of drug and alcohol use _ elementary report
http://slidepdf.com/reader/full/2008-parker-county-peaster-isd-2008-texas-school-survey-of-drug-and-alcohol 26/40
Peaster
Spring 2008
Table B5: Prevalence and recency of use of selected substances by gradeAfrican/American Students
Table skipped because an insufficient number of cases.
Elementary Report-Page

7/30/2019 2008 _ parker county _ peaster isd _ 2008 texas school survey of drug and alcohol use _ elementary report
http://slidepdf.com/reader/full/2008-parker-county-peaster-isd-2008-texas-school-survey-of-drug-and-alcohol 27/40
Peaster
Spring 2008
Table B6: Prevalence and recency of use of selected substances by gradeMexican/American Students
Ever
Used
School
Year
Not Past
Year
Never
Used
Tobacco
All 22.5% 15.0% 7.5% 77.5%
Grade 5 * * * *
Grade 6 * * * *
Alcohol
All 29.0% 15.0% 14.0% 71.0%
Grade 5 * * * *
Grade 6 * * * *
Inhalants
All 7.5% 7.5% 0.0% 92.5%
Grade 5 * * * *
Grade 6 * * * *
Marijuana
All 0.0% 0.0% 0.0% 100.0%Grade 5 * * * *
Grade 6 * * * *
Elementary Report-Page

7/30/2019 2008 _ parker county _ peaster isd _ 2008 texas school survey of drug and alcohol use _ elementary report
http://slidepdf.com/reader/full/2008-parker-county-peaster-isd-2008-texas-school-survey-of-drug-and-alcohol 28/40
Peaster
Spring 2008
Table B7: Prevalence and recency of use of selected substances by gradeStudents Reporting A Grades
Ever
Used
School
Year
Not Past
Year
Never
Used
Tobacco
All 0.0% 0.0% 0.0% 100.0%
Grade 5 0.0% 0.0% 0.0% 100.0%
Grade 6 0.0% 0.0% 0.0% 100.0%
Alcohol
All 9.9% 2.7% 7.2% 90.1%
Grade 5 15.0% 0.0% 15.0% 85.0%
Grade 6 5.3% 5.3% 0.0% 94.7%
Inhalants
All 2.4% 0.0% 2.4% 97.6%
Grade 5 5.0% 0.0% 5.0% 95.0%
Grade 6 0.0% 0.0% 0.0% 100.0%
Marijuana
All 0.0% 0.0% 0.0% 100.0%Grade 5 0.0% 0.0% 0.0% 100.0%
Grade 6 0.0% 0.0% 0.0% 100.0%
Elementary Report-Page

7/30/2019 2008 _ parker county _ peaster isd _ 2008 texas school survey of drug and alcohol use _ elementary report
http://slidepdf.com/reader/full/2008-parker-county-peaster-isd-2008-texas-school-survey-of-drug-and-alcohol 29/40
Peaster
Spring 2008
Table B8: Prevalence and recency of use of selected substances by gradeStudents Reporting grades lower than A
Ever
Used
School
Year
Not Past
Year
Never
Used
Tobacco
All 14.4% 7.9% 6.5% 85.6%
Grade 5 4.1% 0.0% 4.1% 95.9%
Grade 6 23.9% 15.2% 8.7% 76.1%
Alcohol
All 33.0% 23.8% 9.3% 67.0%
Grade 5 27.1% 14.6% 12.5% 72.9%
Grade 6 38.3% 31.9% 6.4% 61.7%
Inhalants
All 10.8% 10.8% 0.0% 89.2%
Grade 5 6.3% 6.3% 0.0% 93.8%
Grade 6 14.9% 14.9% 0.0% 85.1%
Marijuana
All 0.0% 0.0% 0.0% 100.0%Grade 5 0.0% 0.0% 0.0% 100.0%
Grade 6 0.0% 0.0% 0.0% 100.0%
Elementary Report-Page

7/30/2019 2008 _ parker county _ peaster isd _ 2008 texas school survey of drug and alcohol use _ elementary report
http://slidepdf.com/reader/full/2008-parker-county-peaster-isd-2008-texas-school-survey-of-drug-and-alcohol 30/40
Peaster
Spring 2008
Table B9: Prevalence and recency of use of selected substances by gradeStudents Living With 2 Parents
Ever
Used
School
Year
Not Past
Year
Never
Used
Tobacco
All 8.6% 5.4% 3.1% 91.4%
Grade 5 1.8% 0.0% 1.8% 98.2%
Grade 6 16.3% 11.6% 4.7% 83.7%
Alcohol
All 23.6% 15.8% 7.8% 76.4%
Grade 5 21.8% 9.1% 12.7% 78.2%
Grade 6 25.6% 23.3% 2.3% 74.4%
Inhalants
All 6.3% 5.4% 1.0% 93.7%
Grade 5 3.6% 1.8% 1.8% 96.4%
Grade 6 9.3% 9.3% 0.0% 90.7%
Marijuana
All 0.0% 0.0% 0.0% 100.0%Grade 5 0.0% 0.0% 0.0% 100.0%
Grade 6 0.0% 0.0% 0.0% 100.0%
Elementary Report-Page
7/30/2019 2008 _ parker county _ peaster isd _ 2008 texas school survey of drug and alcohol use _ elementary report
http://slidepdf.com/reader/full/2008-parker-county-peaster-isd-2008-texas-school-survey-of-drug-and-alcohol 31/40
Peaster
Spring 2008
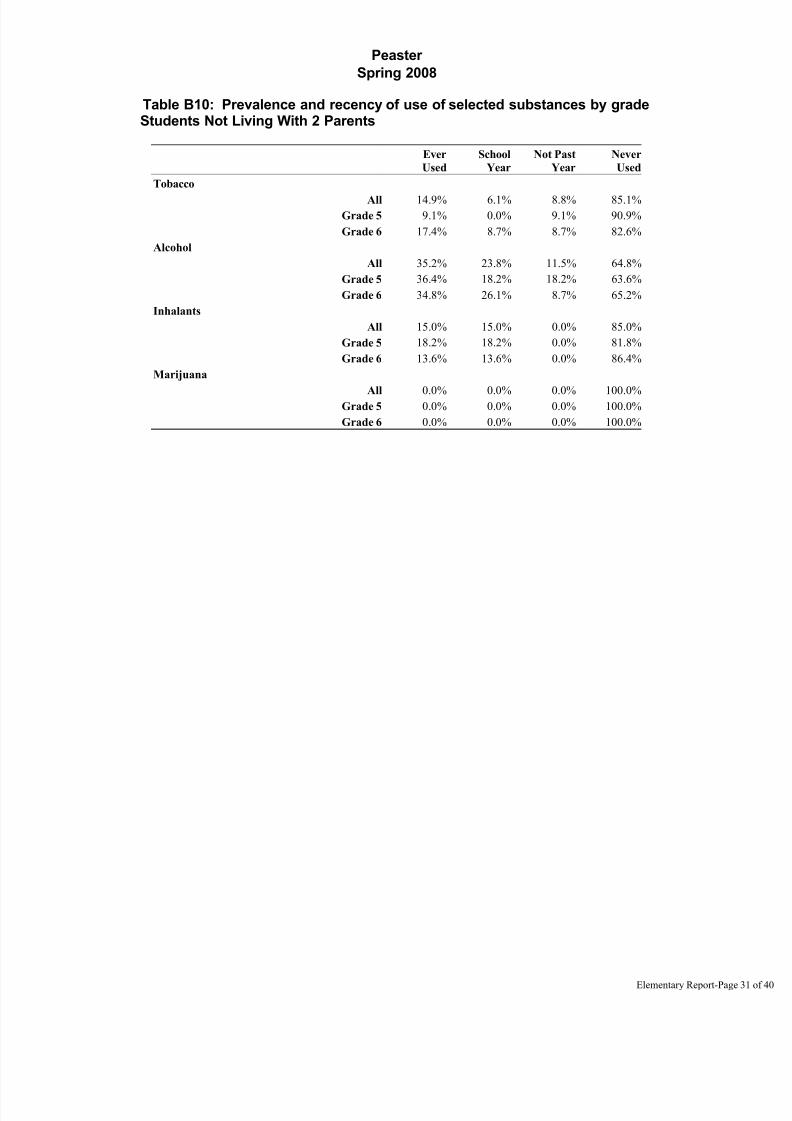
Table B10: Prevalence and recency of use of selected substances by gradeStudents Not Living With 2 Parents
Ever
Used
School
Year
Not Past
Year
Never
Used
Tobacco
All 14.9% 6.1% 8.8% 85.1%
Grade 5 9.1% 0.0% 9.1% 90.9%
Grade 6 17.4% 8.7% 8.7% 82.6%
Alcohol
All 35.2% 23.8% 11.5% 64.8%
Grade 5 36.4% 18.2% 18.2% 63.6%
Grade 6 34.8% 26.1% 8.7% 65.2%
Inhalants
All 15.0% 15.0% 0.0% 85.0%
Grade 5 18.2% 18.2% 0.0% 81.8%
Grade 6 13.6% 13.6% 0.0% 86.4%
Marijuana
All 0.0% 0.0% 0.0% 100.0%Grade 5 0.0% 0.0% 0.0% 100.0%
Grade 6 0.0% 0.0% 0.0% 100.0%
Elementary Report-Page
7/30/2019 2008 _ parker county _ peaster isd _ 2008 texas school survey of drug and alcohol use _ elementary report
http://slidepdf.com/reader/full/2008-parker-county-peaster-isd-2008-texas-school-survey-of-drug-and-alcohol 32/40
Peaster
Spring 2008
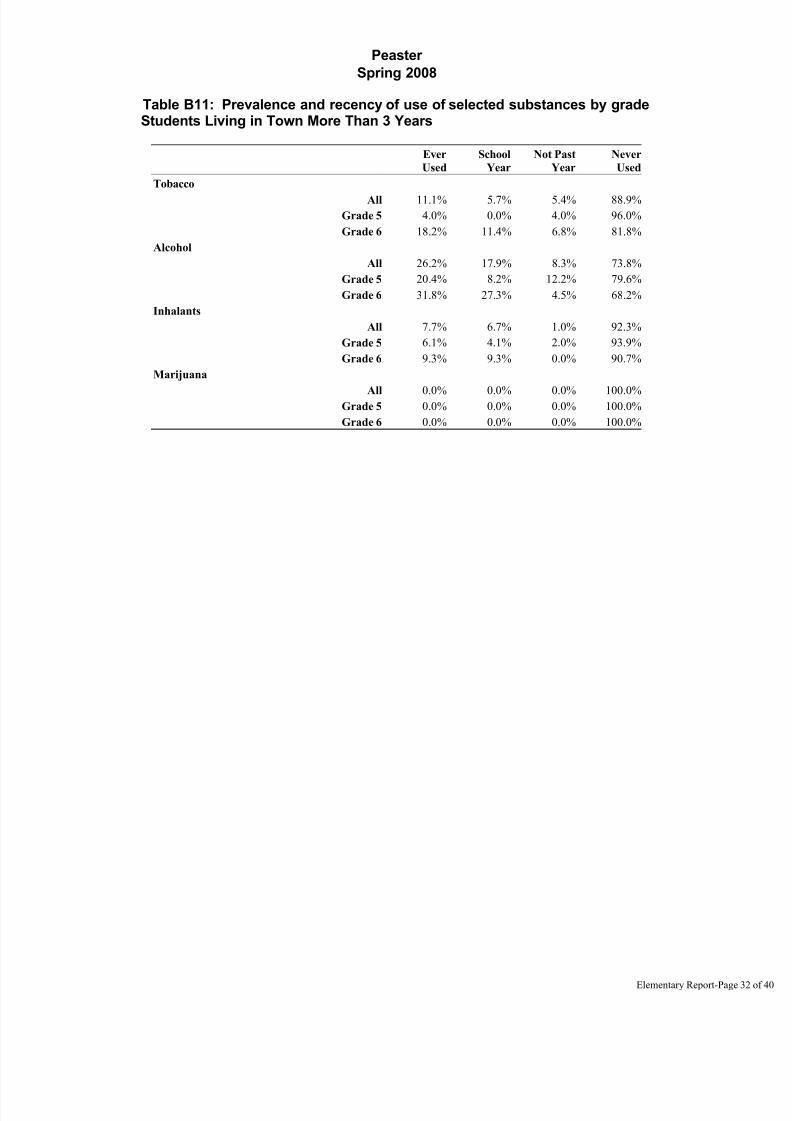
Table B11: Prevalence and recency of use of selected substances by gradeStudents Living in Town More Than 3 Years
Ever
Used
School
Year
Not Past
Year
Never
Used
Tobacco
All 11.1% 5.7% 5.4% 88.9%
Grade 5 4.0% 0.0% 4.0% 96.0%
Grade 6 18.2% 11.4% 6.8% 81.8%
Alcohol
All 26.2% 17.9% 8.3% 73.8%
Grade 5 20.4% 8.2% 12.2% 79.6%
Grade 6 31.8% 27.3% 4.5% 68.2%
Inhalants
All 7.7% 6.7% 1.0% 92.3%
Grade 5 6.1% 4.1% 2.0% 93.9%
Grade 6 9.3% 9.3% 0.0% 90.7%
Marijuana
All 0.0% 0.0% 0.0% 100.0%Grade 5 0.0% 0.0% 0.0% 100.0%
Grade 6 0.0% 0.0% 0.0% 100.0%
Elementary Report-Page

7/30/2019 2008 _ parker county _ peaster isd _ 2008 texas school survey of drug and alcohol use _ elementary report
http://slidepdf.com/reader/full/2008-parker-county-peaster-isd-2008-texas-school-survey-of-drug-and-alcohol 33/40
Peaster
Spring 2008
Table B12: Prevalence and recency of use of selected substances by gradeStudents Living in Town 3 Years or Less
Ever
Used
School
Year
Not Past
Year
Never
Used
Tobacco
All 9.4% 6.3% 3.1% 90.6%
Grade 5 0.0% 0.0% 0.0% 100.0%
Grade 6 16.7% 11.1% 5.6% 83.3%
Alcohol
All 32.0% 20.7% 11.3% 68.0%
Grade 5 37.5% 18.8% 18.8% 62.5%
Grade 6 27.8% 22.2% 5.6% 72.2%
Inhalants
All 9.4% 9.4% 0.0% 90.6%
Grade 5 0.0% 0.0% 0.0% 100.0%
Grade 6 16.7% 16.7% 0.0% 83.3%
Marijuana
All 0.0% 0.0% 0.0% 100.0%Grade 5 0.0% 0.0% 0.0% 100.0%
Grade 6 0.0% 0.0% 0.0% 100.0%
Elementary Report-Page

7/30/2019 2008 _ parker county _ peaster isd _ 2008 texas school survey of drug and alcohol use _ elementary report
http://slidepdf.com/reader/full/2008-parker-county-peaster-isd-2008-texas-school-survey-of-drug-and-alcohol 34/40
Peaster
Spring 2008
The FREQ Procedure
GENDER
Q1 Frequency Percent
Female 70 50.63
Male 69 49.37
GRADE LEVEL
Q2 Frequency Percent
Grade 5 66 47.65
Grade 6 73 52.35
DO YOU LIVE WITH
BOTH PARENTS?
Q3 Frequency Percent
No 36 26.71
Yes 98 73.29
Frequency Missing = 4.9388077379
AGE
Q4 Frequency Percent
10 14 10.21
11 72 52.69
12 49 35.53
13 or older 2 1.56
Frequency Missing = 2.0029609159
ETHNICITY
Q5 Frequency Percent
African/American 1 0.69
Mexican/American 14 10.61
Native/American 2 1.49
Other 4 2.97
White 113 84.24
Frequency Missing = 4.2803000395
WHAT GRADES DO YOU
USUALLY GET
Q6 Frequency Percent
Mostly A's 39 28.88
Mostly B's 68 50.55
Mostly C's 23 16.91
Mostly D's 5 3.66
Frequency Missing = 4.0059218318
LIVED IN THIS TOWN FOR
MORE THAN 3 YEARS
Q7 Frequency Percent
Don't Know 6 4.39
No 34 25.55
Yes 94 70.06
Frequency Missing = 5.2131859455
EITHER PARENT
GRADUATE FROM
COLLEGE
Q8 Frequency Percent
Don't Know 24 17.60
No 35 25.91
Yes 76 56.48
Frequency Missing = 4.0059218318
QUALIFY FOR A
FREE/REDUCED PRICE
LUNCH?
Q9 Frequency Percent
Don't Know 52 38.17
No 55 40.63
Yes 29 21.19
Frequency Missing = 2.935846822
PARENTS ATTEND
PTA MEETINGS?
Q10 Frequency Percent
No 70 51.24
Yes 66 48.76
Frequency Missing = 2.935846822
EVER INHALED
GASOLINE TO GET
HIGH?
Q11a Frequency Percent
Not Used 133 96.98Used 4 3.02
Frequency Missing = 2.00296091
EVER INHALED PAINT
THINNER TO GET HIGH?
Q11b Frequency Percent
Not Used 132 99.20
Used 1 0.80
Frequency Missing = 6.00888274
EVER INHALED GLUE TO
GET HIGH?
Q11c Frequency Percent
Not Used 131 99.19
Used 1 0.81
Frequency Missing = 7.07895775
EVER INHALEDWHITEOUT TO GET
HIGH?
Q11d Frequency Percent
Not Used 126 94.03
Used 8 5.97
Frequency Missing = 4.8016186
EVER INHALED SPRAY
PAINT TO GET HIGH?
Q11e Frequency PercentNot Used 129 96.89
Used 4 3.11
Frequency Missing = 5.87169364
The frequencies have been weighted so that the
analysis reflects the distribution of students by grade
level in the district
Page
7/30/2019 2008 _ parker county _ peaster isd _ 2008 texas school survey of drug and alcohol use _ elementary report
http://slidepdf.com/reader/full/2008-parker-county-peaster-isd-2008-texas-school-survey-of-drug-and-alcohol 35/40
Peaster
Spring 2008
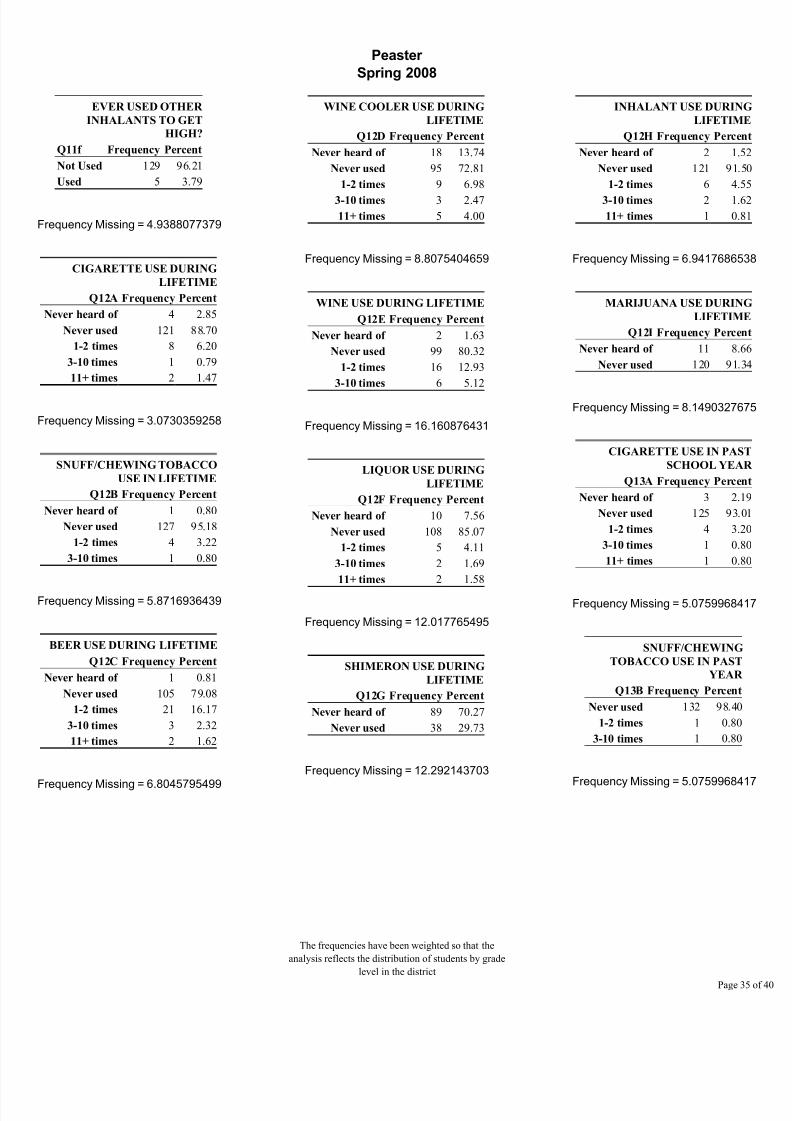
EVER USED OTHER
INHALANTS TO GET
HIGH?
Q11f Frequency Percent
Not Used 129 96.21
Used 5 3.79
Frequency Missing = 4.9388077379
CIGARETTE USE DURING
LIFETIME
Q12A Frequency Percent
Never heard of 4 2.85
Never used 121 88.70
1-2 times 8 6.20
3-10 times 1 0.79
11+ times 2 1.47
Frequency Missing = 3.0730359258
SNUFF/CHEWING TOBACCO
USE IN LIFETIME
Q12B Frequency Percent
Never heard of 1 0.80
Never used 127 95.18
1-2 times 4 3.22
3-10 times 1 0.80
Frequency Missing = 5.8716936439
BEER USE DURING LIFETIME
Q12C Frequency Percent
Never heard of 1 0.81
Never used 105 79.08
1-2 times 21 16.17
3-10 times 3 2.32
11+ times 2 1.62
Frequency Missing = 6.8045795499
WINE COOLER USE DURING
LIFETIME
Q12D Frequency Percent
Never heard of 18 13.74
Never used 95 72.81
1-2 times 9 6.98
3-10 times 3 2.47
11+ times 5 4.00
Frequency Missing = 8.8075404659
WINE USE DURING LIFETIME
Q12E Frequency Percent
Never heard of 2 1.63
Never used 99 80.32
1-2 times 16 12.93
3-10 times 6 5.12
Frequency Missing = 16.160876431
LIQUOR USE DURING
LIFETIME
Q12F Frequency Percent
Never heard of 10 7.56
Never used 108 85.07
1-2 times 5 4.11
3-10 times 2 1.69
11+ times 2 1.58
Frequency Missing = 12.017765495
SHIMERON USE DURING
LIFETIME
Q12G Frequency Percent
Never heard of 89 70.27
Never used 38 29.73
Frequency Missing = 12.292143703
INHALANT USE DURIN
LIFETIM
Q12H Frequency Perce
Never heard of 2 1.
Never used 121 91.
1-2 times 6 4.
3-10 times 2 1.
11+ times 1 0.
Frequency Missing = 6.94176865
MARIJUANA USE DURIN
LIFETIM
Q12I Frequency Perce
Never heard of 11 8.
Never used 120 91.
Frequency Missing = 8.14903276
CIGARETTE USE IN PAS
SCHOOL YEA
Q13A Frequency Perce
Never heard of 3 2.
Never used 125 93.
1-2 times 4 3.
3-10 times 1 0.
11+ times 1 0.
Frequency Missing = 5.07599684
SNUFF/CHEWING
TOBACCO USE IN PAST
YEAR
Q13B Frequency Percent
Never used 132 98.40
1-2 times 1 0.80
3-10 times 1 0.80
Frequency Missing = 5.07599684
The frequencies have been weighted so that the
analysis reflects the distribution of students by grade
level in the district
Page

7/30/2019 2008 _ parker county _ peaster isd _ 2008 texas school survey of drug and alcohol use _ elementary report
http://slidepdf.com/reader/full/2008-parker-county-peaster-isd-2008-texas-school-survey-of-drug-and-alcohol 36/40
Peaster
Spring 2008
BEER USE IN PAST SCHOOL
YEAR
Q13C Frequency Percent
Never heard of 1 0.71
Never used 118 89.08
1-2 times 10 7.78
3-10 times 2 1.62
11+ times 1 0.81
Frequency Missing = 6.8045795499
WINE COOLER USE IN PAST
SCHOOL YEAR
Q13D Frequency Percent
Never heard of 12 9.00
Never used 105 79.26
1-2 times 11 8.60
3-10 times 2 1.62
11+ times 2 1.52
Frequency Missing = 6.9417686538
WINE USE IN PAST SCHOOL
YEAR
Q13E Frequency Percent
Never heard of 1 0.74
Never used 110 87.08
1-2 times 10 8.05
3-10 times 5 4.13
Frequency Missing = 12.813462298
LIQUOR USE IN PAST SCHOOL
YEAR
Q13F Frequency Percent
Never heard of 7 5.08
Never used 117 89.31
1-2 times 2 1.63
3-10 times 2 1.63
11+ times 3 2.34
Frequency Missing = 7.8746545598
SHIMERON USE IN PAST
SCHOOL YEAR
Q13G Frequency Percent
Never heard of 90 68.37
Never used 42 31.63
Frequency Missing = 6.8045795499
INHALANT USE IN PAST
SCHOOL YEAR
Q13H Frequency Percent
Never heard of 1 0.71
Never used 122 92.21
1-2 times 8 6.27
11+ times 1 0.81
Frequency Missing = 6.9417686538
MARIJUANA USE IN PAST
SCHOOL YEAR
Q13I Frequency Percent
Never heard of 14 10.80
Never used 118 89.20
Frequency Missing = 6.9417686538
AGE WHEN FIRST USEDCIGARETTES
Q14A Frequency Percent
7 or younger 4 2.94
9 years old 1 0.79
10 years old 2 1.57
11 years old 3 2.36
12 or older 1 0.79
Never heard/used 125 91.55
Frequency Missing = 2.935846822
AGE WHEN FIRST USED
SNUFF/CHEW TOBACCO
Q14B Frequency Percent
7 or younger 1 0.71
8 years old 1 0.82
11 years old 3 2.45
Never heard/used 126 96.02
Frequency Missing = 8.01184366
AGE WHEN FIRST USED BE
Q14C Frequency Perc
7 or younger 5 38 years old 4 3
9 years old 7 5
10 years old 4 3
11 years old 3 2
12 or older 4 3
Never heard/used 105 79
Frequency Missing = 6.80457954
AGE WHEN FIRST USED WI
COOLEQ14D Frequency Perc
7 or younger 2 1
8 years old 2 1
9 years old 5 3
10 years old 5 3
11 years old 1 0
12 or older 3 2
Never heard/used 113 86
Frequency Missing = 7.87465455
AGE WHEN FIRST USED WI
Q14E Frequency Perc
7 or younger 2 1
8 years old 1 0
9 years old 3 2
10 years old 7 5
11 years old 6 4
12 or older 5 3
Never heard/used 108 8
Frequency Missing = 6.80457954
The frequencies have been weighted so that the
analysis reflects the distribution of students by grade
level in the district
Page

7/30/2019 2008 _ parker county _ peaster isd _ 2008 texas school survey of drug and alcohol use _ elementary report
http://slidepdf.com/reader/full/2008-parker-county-peaster-isd-2008-texas-school-survey-of-drug-and-alcohol 37/40
Peaster
Spring 2008
AGE WHEN FIRST USED LIQUOR
Q14F Frequency Percent
9 years old 1 0.82
10 years old 1 0.82
11 years old 5 4.01
12 or older 3 2.36
Never heard/used 120 91.98
Frequency Missing = 8.9447295697
AGE WHEN FIRST USED
SHIMERON
Q14G Frequency Percent
Never heard/used 130 100.00
Frequency Missing = 8.9447295697
AGE WHEN FIRST USED
INHALANTS
Q14H Frequency Percent
8 years old 2 1.40
9 years old 2 1.61
11 years old 4 3.11
Never heard/used 125 93.88
Frequency Missing = 5.8716936439
AGE WHEN FIRST USED
MARIJUANA
Q14I Frequency Percent
Never heard/used 131 100.00
Frequency Missing = 8.0118436636
CLOSE FRIENDS USE
CIGARETTES
Q15A Frequency Percent
Never heard of 2 1.47None 105 76.91
Some 23 16.90
Most 6 4.72
Frequency Missing = 2.935846822
CLOSE FRIENDS USE
SNUFF/CHEWING
TOBACCO
Q15B Frequency Percent
None 119 89.16
Some 12 9.23
Most 2 1.61
Frequency Missing = 5.8716936439
CLOSE FRIENDS USE
BEER
Q15C Frequency Percent
None 97 73.31
Some 24 17.79
Most 12 8.90
Frequency Missing = 6.8045795499
CLOSE FRIENDS USE WINE
COOLERS
Q15D Frequency Percent
Never heard of 8 6.02
None 102 76.81
Some 15 11.54
Most 7 5.63
Frequency Missing = 5.8716936439
CLOSE FRIENDS USE
WINE
Q15E Frequency Percent
None 105 83.77
Some 13 10.29
Most 7 5.95
Frequency Missing = 13.087840505
CLOSE FRIENDS USE LIQUOR
Q15F Frequency Percent
Never heard of 4 2.76
None 111 82.50
Some 11 8.41
Most 9 6.34
Frequency Missing = 3.8687327
CLOSE FRIENDS US
SHIMERO
Q15G Frequency Perce
Never heard of 66 50.None 61 47.
Some 2 1.
Most 1 0.
Frequency Missing = 8.94472956
CLOSE FRIENDS US
INHALANT
Q15H Frequency Perce
Never heard of 3 2.
None 102 77.Some 20 15.
Most 6 4.
Frequency Missing = 7.7374654
CLOSE FRIENDS US
MARIJUAN
Q15I Frequency Perce
Never heard of 11 8.
None 108 83.
Some 10 7.Most 1 0.
Frequency Missing = 9.87761547
EVER BEEN OFFERE
CIGARETTE
Q16a Frequency Perce
Never heard of 3 2.
No 110 81.
Yes 22 15.
Frequency Missing = 4.00592183
The frequencies have been weighted so that the
analysis reflects the distribution of students by grade
level in the district
Page

7/30/2019 2008 _ parker county _ peaster isd _ 2008 texas school survey of drug and alcohol use _ elementary report
http://slidepdf.com/reader/full/2008-parker-county-peaster-isd-2008-texas-school-survey-of-drug-and-alcohol 38/40
Peaster
Spring 2008
EVER BEEN OFFERED
SNUFF/CHEWING TOBACCO
Q16b Frequency Percent
Never heard of 1 0.80
No 119 89.76
Yes 13 9.44
Frequency Missing = 5.8716936439
EVER BEEN OFFERED
BEER
Q16c Frequency Percent
No 102 78.77
Yes 27 21.23
Frequency Missing = 10.01480458
EVER BEEN OFFERED WINE
COOLERS
Q16d Frequency Percent
Never heard of 12 9.01
No 105 79.45
Yes 15 11.54
Frequency Missing = 7.0789577576
EVER BEEN OFFEREDWINE
Q16e Frequency Percent
No 113 86.64
Yes 18 13.36
Frequency Missing = 8.0118436636
EVER BEEN OFFERED
LIQUOR
Q16f Frequency Percent
Never heard of 4 2.83
No 115 86.85
Yes 14 10.33
Frequency Missing = 6.9417686538
EVER BEEN OFFERED
SHIMERON
Q16g Frequency Percent
Never heard of 67 53.10
No 59 46.90
Frequency Missing = 12.292143703
EVER BEEN OFFERED
INHALANTS
Q16h Frequency Percent
Never heard of 3 2.33
No 112 84.73
Yes 17 12.94
Frequency Missing = 6.9417686538
EVER BEEN OFFERED
MARIJUANA
Q16i Frequency Percent
Never heard of 11 7.99
No 118 89.58
Yes 3 2.43
Frequency Missing = 7.0789577576
IS ALCOHOL OBTAINEDFROM HOME
Q17a Frequency Percent
Do Not Drink 97 73.98
No 10 7.55
Yes 24 18.47
Frequency Missing = 8.1490327675
IS ALCOHOL OBTAINED
FROM FRIENDS
Q17b Frequency Percent
Do Not Drink 96 76.16
No 25 19.59
Yes 5 4.24
Frequency Missing = 12.950651402
IS ALCOHOL OBTAINE
SOMEWHERE ELS
Q17c Frequency Percen
Do Not Drink 95 75.8
No 21 16.5
Yes 9 7.5
Frequency Missing = 13.8835373
DANGEROUS FOR KIDS TO U
CIGARETT
Q18A Frequency Perce
Very dangerous 99 73
Dangerous 32 24
Not at all 1 0
Don't know 2 1
Frequency Missing = 5.07599684
DANGEROUS TO U
SNUFF/CHEWING TOBACC
Q18B Frequency Perce
Very dangerous 88 66
Dangerous 37 27
Not at all 2 1
Don't know 6 4
Frequency Missing = 5.87169364
DANGEROUS FOR KIDS TO U
BEE
Q18C Frequency Perce
Very dangerous 71 55
Dangerous 43 33
Not at all 8 6
Don't know 7 5
Frequency Missing = 10.1519936
The frequencies have been weighted so that the
analysis reflects the distribution of students by grade
level in the district
Page

7/30/2019 2008 _ parker county _ peaster isd _ 2008 texas school survey of drug and alcohol use _ elementary report
http://slidepdf.com/reader/full/2008-parker-county-peaster-isd-2008-texas-school-survey-of-drug-and-alcohol 39/40
Peaster
Spring 2008
DANGEROUS FOR KIDS TO USE
WINE COOLERS
Q18D Frequency Percent
Very dangerous 64 49.59
Dangerous 37 28.89
Not at all 9 6.83
Don't know 7 5.38
Never heard of 12 9.32
Frequency Missing = 10.01480458
DANGEROUS FOR KIDS TO USE
WINE
Q18E Frequency Percent
Very dangerous 61 49.94
Dangerous 39 31.69
Not at all 14 11.70
Don't know 7 5.79
Never heard of 1 0.88
Frequency Missing = 16.819384129
DANGEROUS FOR KIDS TO USE
LIQUOR
Q18F Frequency Percent
Very dangerous 85 65.84
Dangerous 28 21.34
Not at all 6 4.55
Don't know 6 4.55
Never heard of 5 3.72
Frequency Missing = 10.01480458
DANGEROUS FOR KIDS TO USE
SHIMERON
Q18G Frequency Percent
Very dangerous 41 31.80
Dangerous 6 4.63
Don't know 12 9.37
Never heard of 70 54.21
Frequency Missing = 9.2191077773
DANGEROUS FOR KIDS TO USE
INHALANTS
Q18H Frequency Percent
Very dangerous 88 69.34
Dangerous 26 20.44
Not at all 4 3.16
Don't know 8 6.32
Never heard of 1 0.74
Frequency Missing = 12.292143703
DANGEROUS FOR KIDS TO USE
MARIJUANA
Q18I Frequency Percent
Very dangerous 101 78.50
Dangerous 11 8.69
Not at all 1 0.72
Don't know 7 5.38
Never heard of 9 6.71
Frequency Missing = 9.8776154757
DRUG/ALCOHOL INFO
FROM TEACHER
Q19a Frequency Percent
No 41 33.22
Yes 82 66.78
Frequency Missing = 16.023687327
DRUG/ALC INFO
FROM VISITOR TO
CLASS
Q19b Frequency Percent
No 34 27.95
Yes 89 72.05
Frequency Missing = 15.886498223
DRUG/ALC INFO
FROM ASSEMBLY
PROGRAM
Q19c Frequency Percent
No 52 42.86
Yes 69 57.14
Frequency Missing = 17.7522700
DRUG/ALC INFO
FROM GUIDE
COUNSELOR
Q19d Frequency PercentNo 32 25.27
Yes 96 74.73
Frequency Missing = 10.4263718
DRUG/ALC INF FROM
SOMEONE ELSE AT
SCHOOL
Q19e Frequency Percent
No 75 60.99
Yes 48 39.01
Frequency Missing = 16.8193841
BEER, TWO OR MORE
AT ONE TIME
Q20a Frequency Percent
Never 114 86.72
1 time 10 7.60
2 times 2 1.62
3+ times 5 4.06
Frequency Missing = 7.21614686
WINE COOLERS, TWO
OR MORE AT ONE TIME
Q20b Frequency Percent
Never 118 90.41
1 time 7 5.51
3+ times 5 4.08
Frequency Missing = 8.01184366
WINE, TWO OR MORE
AT ONE TIME
Q20c Frequency Percent
Never 111 83.81
1 time 14 10.51
2 times 3 2.43
3+ times 4 3.24
The frequencies have been weighted so that the
analysis reflects the distribution of students by grade
level in the district
Page

7/30/2019 2008 _ parker county _ peaster isd _ 2008 texas school survey of drug and alcohol use _ elementary report
http://slidepdf.com/reader/full/2008-parker-county-peaster-isd-2008-texas-school-survey-of-drug-and-alcohol 40/40
Peaster
Spring 2008
Frequency Missing = 6.9417686538
LIQUOR, TWO OR MORE
AT ONE TIME
Q20d Frequency Percent
Never 125 95.10
1 time 1 0.82
2 times 1 0.82
3+ times 4 3.27
Frequency Missing = 8.0118436636
MISSED SCHOOL
WITHOUT PARENT'S
CONSENT
Q21 Frequency Percent
No 131 96.83
Yes 4 3.17
Frequency Missing = 4.0059218318
SENT TO
PRINCIPAL/DEAN
SINCE SEPTEMBER
Q22 Frequency Percent
No 98 73.49
Yes 35 26.51
Frequency Missing = 6.0088827477
PARENTS FEEL ABOUT KIDS
SMOKING CIGARETTES
Q23 Frequency Percent
Don't like it 118 88.64
Think it's O.K. 1 0.81
Don't know 14 10.55
Frequency Missing = 6.1460718516
PARENTS FEEL ABOUT
KIDS DRINKING BEER
Q24 Frequency Percent
Don't like it 105 78.06
Don't care 5 3.79
Don't know 24 18.15
Frequency Missing = 5.0759968417
PARENTS FEEL ABOUT
KIDS USING MARIJUANA
q25 Frequency Percent
Don't like it 113 84.45
Don't know 21 15.55
Frequency Missing = 5.0759968417


![Mercedes ISD Random Drug Testing Program [FNF(Local)] 2008-2009.](https://static.fdocuments.us/doc/165x107/56649c7f5503460f94935373/mercedes-isd-random-drug-testing-program-fnflocal-2008-2009.jpg)