2008 Market Update: Clinton Dobson Livestock Market Analyst Alberta Agriculture and Rural...
68
2008 Market Update: Clinton Dobson Livestock Market Analyst Alberta Agriculture and Rural Development
-
Upload
lorin-mcbride -
Category
Documents
-
view
218 -
download
4
Transcript of 2008 Market Update: Clinton Dobson Livestock Market Analyst Alberta Agriculture and Rural...

2008 Market Update:
Clinton DobsonLivestock Market AnalystAlberta Agriculture and Rural Development

2
2008 – Along for a WILD Ride
• Grains and Oilseeds Prices, Balance Sheets…Costs
• Livestock Prices, trade, major events
• Farm Income• Coming around the bend…

3
Canadian Canola
0
1,000
2,000
3,000
4,000
5,000
6,000
7,000
8,000
9,000
10,000
1999-2000
2000-2001
2001-2002
2002-2003
2003-2004
2004-2005
2005-2006
2006-2007
2007-2008[F]
2008-2009[F]
Pro
du
ctio
n (
ton
nes
)
0%
5%
10%
15%
20%
25%
30%
35%
Sto
cks/
Use
Rat
io
Production Stocks/Use
2008/09 seeded acreage up 1%
4
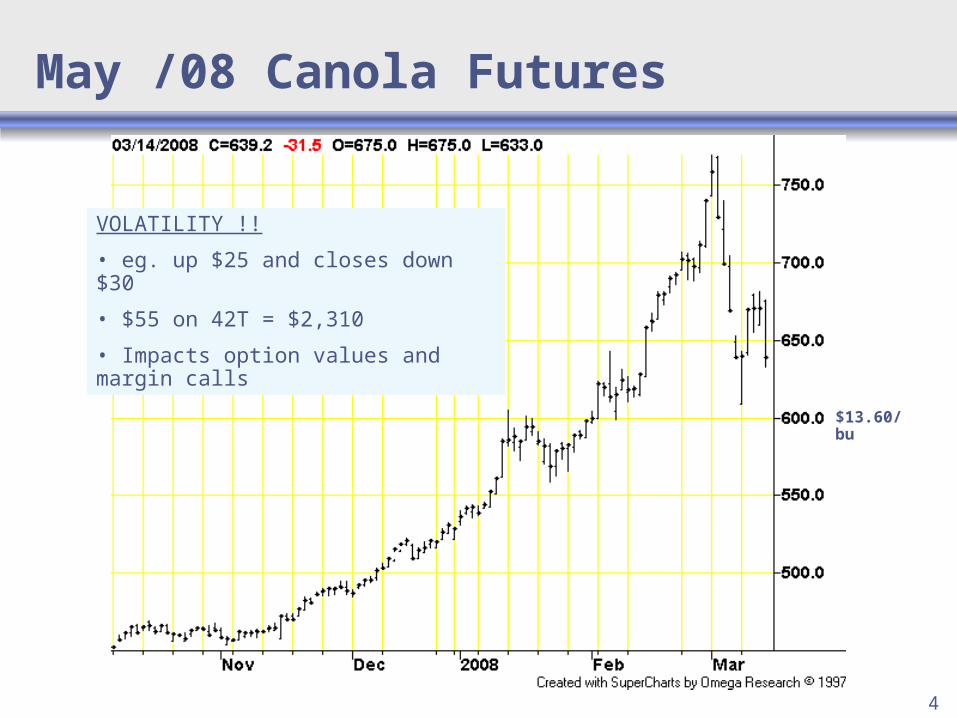
May /08 Canola Futures
$13.60/bu
VOLATILITY !!
• eg. up $25 and closes down $30
• $55 on 42T = $2,310
• Impacts option values and margin calls

5
Canadian Barley
0
2,000
4,000
6,000
8,000
10,000
12,000
14,000
1999-2000
2000-2001
2001-2002
2002-2003
2003-2004
2004-2005
2005-2006
2006-2007
2007-2008[F]
2008-2009[F]
Pro
du
ctio
n (
ton
nes
)
0%
5%
10%
15%
20%
25%
30%
35%
Sto
cks/
Use
Rat
io
Production Stocks/Use
2008/09 seeded acreage up 1%

6
Feed Barley
Feed Barley (Elevator Average)
50
75
100
125
150
175
200
225
J-04
A-0
4
J-04
O-0
4
J-05
A-0
5
J-05
O-0
5
J-06
A-0
6
J-06
O-0
6
J-07
A-0
7
J-07
O-0
7
J-08
$/to
nn
e
Source: Economics and Competitiveness Divison, AF
2-Row Malt
2007/08 PRO - $360/tonne Van
Saudi Arabia, increased barley import subsidy by 71%

7
French Malt Barley Prices
$ 465/tonne = $10/bu
Source: Alberta Grain Commission, March 2008

8
Canadian Wheat
0
5,000
10,000
15,000
20,000
25,000
1999-2000
2000-2001
2001-2002
2002-2003
2003-2004
2004-2005
2005-2006
2006-2007
2007-2008[F]
2008-2009[F]
Pro
du
ctio
n (
ton
nes
)
0%
5%
10%
15%
20%
25%
30%
35%
40%
Sto
cks/
Use
Rat
io
Production Stocks/Use
2008/09 seeded acreage up 7%

9
Spring Wheat Nearest Futures

10
World Wheat Ending Stocks
0.0
50.0
100.0
150.0
200.0
250.0
Mil
lio
n t
on
ne
s
0%
5%
10%
15%
20%
25%
30%
35%
40%
45%
Pe
rce
nt
Ending Stocks Stocks Use Ratio
Consumption > Production
9 yrs

11
Canada – Stocks to Use Ratio
0%
5%
10%
15%
20%
25%
30%
35%
40%
1999-2000
2000-2001
2001-2002
2002-2003
2003-2004
2004-2005
2005-2006
2006-2007
2007-2008 [F]
2008-2009 [F]
Wheat (except Durum) Canola Barley
Source: Agriculture and Agri-Food Canada
Very low Ending Stocks to Use Ratio
12
Costs…

13
AB Diesel Prices are on the rise
0
10
20
30
40
50
60
70
80
90
100Ja
n-97
Jul-9
7
Jan-
98
Jul-9
8
Jan-
99
Jul-9
9
Jan-
00
Jul-0
0
Jan-
01
Jul-0
1
Jan-
02
Jul-0
2
Jan-
03
Jul-0
3
Jan-
04
Jul-0
4
Jan-
05
Jul-0
5
Jan-
06
Jul-0
6
Jan-
07
Jul-0
7
Ce
nts
/litr
e
DIESELFUEL
$0.86/litre
May /07 - $0.72/litre
Sept /07 - $0.75/litre

14
Fertilizer prices also move higher
200
300
400
500
600
700
800
900
1000
Jan
-97
Jan
-98
Jan
-99
Jan
-00
Jan
-01
Jan
-02
Jan
-03
Jan
-04
Jan
-05
Jan
-06
Jan
-07
$/to
nn
e
FERT46 FERT11-51 FERT82$884/tonne
$571/tonne
$620/tonne
Dec 31, 06 vs Dec 31, 07
46-0-0 up 39%
11-51-0 up 42%
82-0-0 up 24%

15
And so do ocean freight rates

16
Renewable Fuels - US Ethanol

17
Grains and Oilseeds Summary
• Several years of declining carryout.• Market tightness, causes major buyers to
increase purchases.• Increasing demand – biofuels, China• Weather problems• Volatility – impacts risk management

18
Livestock
• Feed grains prices and overall value• Exchange rate• Market access• Disease and productivity• Capacity utilization• Substitutes…pork and chicken• Profits, consumer confidence

19
US $ Declines
CDN $
0.7
0.75
0.8
0.85
0.9
0.95
1
1.05
1.1J-
04
A-0
4
J-0
4
O-0
4
J-0
5
A-0
5
J-0
5
O-0
5
J-0
6
A-0
6
J-0
6
O-0
6
J-0
7
A-0
7
J-0
7
O-0
7
J-0
8
1 C
DN
$ i
n U
S$
CDN $
Source: Economics and Competitiveness Divison, AF

20
Consumer Confidence is dwindling
Feb
March

21
AAA Cutout
Canadian AAA Cutout
125
135
145
155
165
175
185
195
205
1 4 7 10 13 16 19 22 25 28 31 34 37 40 43 46 49 52
$/c
wt
2005 2006 2007 2008

22
Current meat supply is large
US Beef, Pork and Poultry Production
1,400
1,500
1,600
1,700
1,800
1,900
2,000
1 3 5 7 9 11 13 15 17 19 21 23 25 27 29 31 33 35 37 39 41 43 45 47 49 51 53
Wee
kly
Pro
du
ctio
n (
mil
lio
n l
bs)
2001-05 2008 2007
Source: LMIC
08 vs 07 7%

23
US, Forecasted Year over Year Growth
Year over Year % Change
-6.0%
-4.0%
-2.0%
0.0%
2.0%
4.0%
6.0%
8.0%
10.0%
12.0%
Q3 06 Q4 06 Q1 07 Q2 07 Q3 07 Q4 07 Q1 08 Q2 08 Q3 08 Q4 08
08
/ 0
7 %
Ch
an
ge
Beef Pork Broiler
Source: USDA Feb 27, 2008
The Circovirus Vaccine Works !!!

24
Feeder Steer Comparison
Kansas vs Alberta Steer PriceWeekly Average 8-900 pound Steer Price
$45
$60
$75
$90
$105
$120
$135
$150
$165
Jan-
98
May
-98
Oct
-98
Mar
-99
Aug
-99
Jan-
00
Jun-
00
Oct
-00
Mar
-01
Aug
-01
Jan-
02
Jun-
02
Oct
-02
Mar
-03
Aug
-03
Jan-
04
Jun-
04
Nov
-04
Mar
-05
Aug
-05
Jan-
06
Jun-
06
Nov
-06
Apr
-07
Aug
-07
Jan-
08
Jun-
08
($ p
er c
wt.)
Kansas Steers (US$) Alberta Steers (Cdn$)
Source: Canfax; Livestock Marketing Information Center, USDA

25
Feeder cattle prices
Northern Alberta 5-600 lb. FeedersWeekly Steer Price
$80
$95
$110
$125
$140
$155
$170
1/1 1/29 2/26 3/26 4/23 5/21 6/18 7/16 8/13 9/10 10/8 11/5 12/3
C$
pe
r c
wt.
$0.80
$0.95
$1.10
$1.25
$1.40
$1.55
$1.70
C$
pe
r p
ou
nd
5-Year Avg (1999-2003)
2006
2007
2008
Source: Canfax (ave. of midpoint of the range); Economics & Competitiveness Division, AF
26
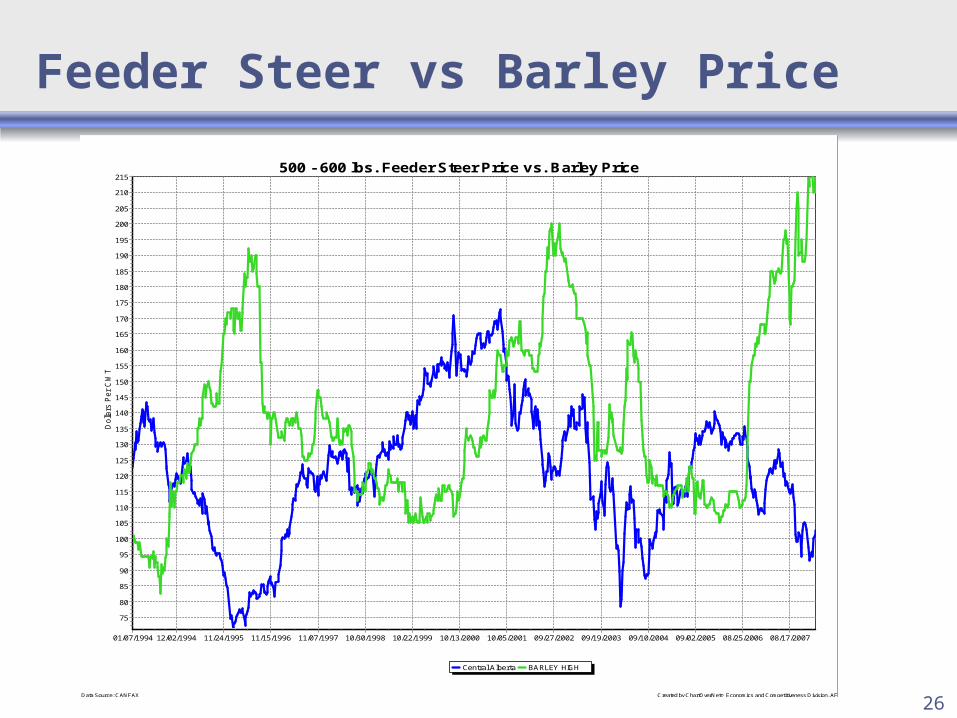
Feeder Steer vs Barley Price
500 - 600 lbs. Feeder Steer Price vs. Barley Price
Central Alberta BARLEY HIGH
01/07/1994 12/02/1994 11/24/1995 11/15/1996 11/07/1997 10/30/1998 10/22/1999 10/13/2000 10/05/2001 09/27/2002 09/19/2003 09/10/2004 09/02/2005 08/25/2006 08/17/2007
Dolla
rs P
er
CW
T
215
210
205
200
195
190
185
180
175
170
165
160
155
150
145
140
135
130
125
120
115
110
105
100
95
90
85
80
75
Data Source: CANFAX Created by ChartOverNet© Economics and Competitiveness Division, AF

27
Feed Grain Comparison
Corn-Barley SpreadTexas Triangle Corn (Barley-equivalent price) less Lethbridge Barley
($100)
($80)
($60)
($40)
($20)
$0
$20
$40
$60
$80
$100
'89 '89 '90 '91 '92 '92 '93 '94 '95 '95 '96 '97 '98 '99 '99 '00 '01 '02 '02 '03 '04 '05 '05 '06 '07
Cd
n $
per
to
nn
e
Source: Livestock Marketing Information Center; Alberta Grain Commission
Drought in the US
Drought in Alberta

28
AB/SK Feeder Placements
AB/SK Feeder Placements
0
50
100
150
200
250
300
350
400
Jan Mar May Jul Sep Nov
Mo
nth
ly P
lacem
en
ts
2001-05 2006 2007 2008
Source: Canfax
January was very cold
July – Dec down 13%

29
Feeder Cattle Exports
Canadian Feeder Cattle Exports the US
0
5,000
10,000
15,000
20,000
25,000
1 3 5 7 9 11 13 15 17 19 21 23 25 27 29 31 33 35 37 39 41 43 45 47 49 51
Wee
kly
Exp
ort
s
2000-02 2006 2007 2008
Source: APHIS, LMIC
Corn $ < Barley $
Despite the lower US$ that makes Canadian Cattle more
Expensive

30
2007 Fall-run
Alberta Feeder Cattle MarketingsFall-run Volume & Feeder Prices
$80
$90
$100
$110
$120
$130
$140
11
-Ma
y
25
-Ma
y
8-J
un
22
-Ju
n
6-J
ul
20
-Ju
l
3-A
ug
17
-Au
g
31
-Au
g
14
-Se
p
28
-Se
p
12
-Oc
t
26
-Oc
t
9-N
ov
23
-No
v
7-D
ec
C$
pe
r c
wt.
0
20000
40000
60000
80000
100000
120000
no
. of
he
ad
Avg. Sales 1997-20062007 Sales to date5-wt Steer Price8-wt Steer Price
Source: Canfax; Economics & Competitiveness Division, AF

31
Fed Cattle Exports
Canadian Fed Cattle Exports the US
0
5,000
10,000
15,000
20,000
25,000
30,000
1 3 5 7 9 11 13 15 17 19 21 23 25 27 29 31 33 35 37 39 41 43 45 47 49 51
Wee
kly
Exp
ort
s
2000-02 2006 2007 2008
Source: APHIS, LMIC

32
Alberta Fed Steer Prices
Alberta Fed Cattle - Direct Cash SalesWeekly Average Steer Price
$50
$70
$90
$110
$130
1/1 1/29 2/26 3/26 4/23 5/21 6/18 7/16 8/13 9/10 10/8 11/5 12/3 12/3
C$
per
cw
t.
10-Year Avg (1994-2003) 2006 2007 2008
Source: Canfax; Economics & Competitiveness Division, AF

33
Fed Steer Basis
Alberta/Nebraska Fed Steer Basis (Cash to Cash)
-$25
-$20
-$15
-$10
-$5
$0
1 5 9 13 17 21 25 29 33 37 41 45 49
Cd
n $
pe
r c
wt
2006 2007 2008
Source: Canfax

34
Canadian Fed Cattle Slaughter
Canadian Fed Cattle Slaughter
30,000
35,000
40,000
45,000
50,000
55,000
60,000
65,000
1 3 5 7 9 11 13 15 17 19 21 23 25 27 29 31 33 35 37 39 41 43 45 47 49 51
Wee
kly
Sla
ug
hte
r
1998-02 2007 2008
Source: Canadian Beef Grading Agency

35
Slaughter Cow Exports
Canadian Slaughter Cow Exports the US
0
1,000
2,000
3,000
4,000
5,000
6,000
7,000
1 3 5 7 9 11 13 15 17 19 21 23 25 27 29 31 33 35 37 39 41 43 45 47 49 51
Wee
kly
Exp
ort
s
2000-02 2006 2007 2008
Source: APHIS, LMIC
Rule 2: Nov 19th border opens to
OTM

36
Canadian Cow Slaughter
Canadian Cow Slaughter
0
2,000
4,000
6,000
8,000
10,000
12,000
14,000
16,000
18,000
20,000
1 3 5 7 9 11 13 15 17 19 21 23 25 27 29 31 33 35 37 39 41 43 45 47 49 51
Wee
kly
Sla
ug
hte
r
1998-02 2006 2007 2008
Source: Canadian Beef Grading Agency
Impact of the Border Closure
Still large slaughter despite open border

37
Alberta – Beef Cow Inventory
Beef Cows: January 1, 1998-2008
1.6
1.8
2.0
2.2
1998 2000 2002 2004 2006 2008
Bee
f C
ow
s (M
illi
on
Hea
d)
Source: Statistics Canadastimate for 2006
Down 4.8% since 2005
Canada Down 5.7% since 2005

38
US Beef Herd is declining…
US Beef Cow Herd, Jan 1
31,000
31,500
32,000
32,500
33,000
33,500
34,000
34,500
35,000
35,500
36,000
1990
1991
1992
1993
1994
1995
1996
1997
1998
1999
2000
2001
2002
2003
2004
2005
2006
2007
2008
#of
Bee
f C
ow
s ('
000)
• Drought in SE US
• High Feed Grain Prices
• Aging Producers
Last cycle had large herd expansion
Quick Peak

39
Heavy losses feeding cattle
40
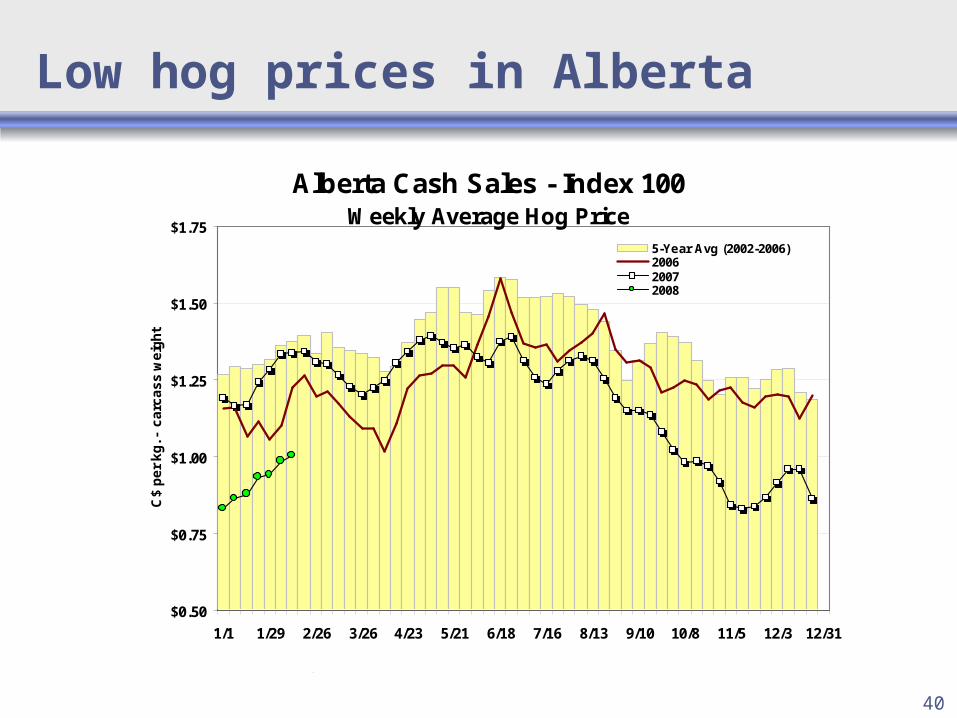
Low hog prices in Alberta
Alberta Cash Sales - Index 100Weekly Average Hog Price
$0.50
$0.75
$1.00
$1.25
$1.50
$1.75
1/1 1/29 2/26 3/26 4/23 5/21 6/18 7/16 8/13 9/10 10/8 11/5 12/3 12/31
C$
pe
r k
g. -
ca
rca
ss
we
igh
t
5-Year Avg (2002-2006)200620072008
Source: Economics and Competitiveness Division, AF

41
Increased Feeder Pig Exports
Canadian Feeder Pig Exports to the US
60,000
80,000
100,000
120,000
140,000
160,000
180,000
1 3 5 7 9 11 13 15 17 19 21 23 25 27 29 31 33 35 37 39 41 43 45 47 49 51
Weekly
Exp
ort
s
2001-05 2006 2007 2008
Source: APHIS, LMIC

42
The same for fed pig exports
Canadian Fed Pig Exports to the US
0
10,000
20,000
30,000
40,000
50,000
60,000
70,000
80,000
90,000
100,000
1 3 5 7 9 11 13 15 17 19 21 23 25 27 29 31 33 35 37 39 41 43 45 47 49 51
Wee
kly
Exp
ort
s
2001-05 2006 2007 2008
Source: APHIS, LMIC

43
Western Canada Sow Inventory
Jan 1 Sow and Bred Gilt Inventory
0
50
100
150
200
250
300
350
400
1990
1991
1992
1993
1994
1995
1996
1997
1998
1999
2000
2001
2002
2003
2004
2005
2006
2007
Inv
en
tory
('0
00
)
Alberta Saskatchewan Manitoba

44
Slaughter Sow and Boar Exports to US
Canadian Slaughter Sows and Boar Exports to the US
0
2,000
4,000
6,000
8,000
10,000
12,000
14,000
16,000
1 3 5 7 9 11 13 15 17 19 21 23 25 27 29 31 33 35 37 39 41 43 45 47 49 51
Wee
kly
Exp
ort
s
2001-05 2006 2007 2008
Source: APHIS, LMIC

45
What is happening with our Sows??
Canadian Slaughter Sows and Boar Exports to the US and Slaughter in Canada
6,000
7,000
8,000
9,000
10,000
11,000
12,000
13,000
14,000
1 3 5 7 9 11 13 15 17 19 21 23 25 27 29 31 33 35 37 39 41 43 45 47 49 51
Wee
kly
Exp
ort
s an
d S
lau
gh
ter
2006 2007 2008
Source: APHIS, LMIC, Agriculture Canada
YTD down 11% from 2007

46
US Sow Slaughter
US Sow Slaughter
40
45
50
55
60
65
70
75
80
1 3 5 7 9 11 13 15 17 19 21 23 25 27 29 31 33 35 37 39 41 43 45 47 49 51 53
Wee
kly
Sla
ug
hte
r ('0
00)
2001-05 2006 2007 2008
Source: LMIC
47
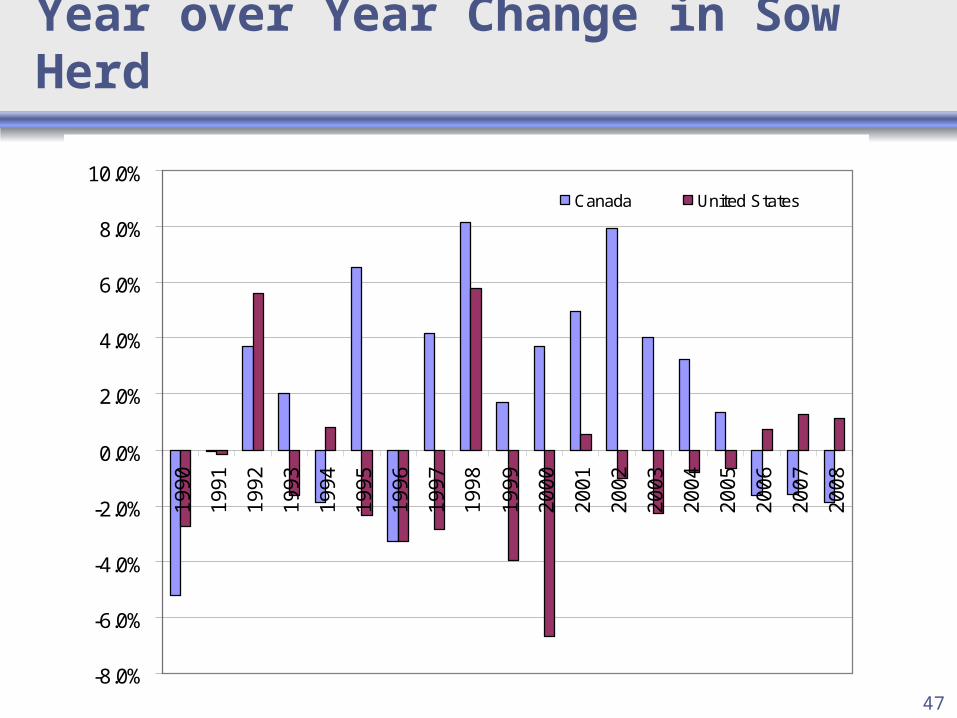
Year over Year Change in Sow Herd
-8.0%
-6.0%
-4.0%
-2.0%
0.0%
2.0%
4.0%
6.0%
8.0%
10.0%1
99
0
19
91
19
92
19
93
19
94
19
95
19
96
19
97
19
98
19
99
20
00
20
01
20
02
20
03
20
04
20
05
20
06
20
07
20
08
Canada United States

48
Low prices in Canada, but….Imports
Canadian Beef and Pork Imports
0
100
200
300
400
500
600
2003 2004 2005 2006 2007
Mil
lio
ns
($)
Beef Fresh Beef Frozen Pork Fresh and Frozen
Source: Statistics Canada

49
Alberta Farm Cash Receipts
0
2
4
6
1977
1979
1981
1983
1985
1987
1989
1991
1993
1995
1997
1999
2001
2003
2005
2007
Re
ce
ipts
($
Bil
lio
n)
Livestock Crops
Source: Statistics Canada, 2007

50
Summary
• Exchange Rate• Feed Grain Prices and Competitiveness• Record Meat Production• Over capacity in Beef Slaughter• US herd not expanding• …in addition the meat market is becoming
increasingly complex as consumers search for antibiotic free,organic, animal welfare, traceable, carbon food-print, guaranteed tender, ‘Angus’….

51
Questions

52
Fed Cattle Price Projection
Choice Steers, Neb $/cwt
75
77
79
81
83
85
87
89
91
93
95
1 2 3 4
Quarter
2006 2007 2008
Source: ERS Projections - Feb 15, 2008

53
Feeder Steer Price Projection
Feeder Steers, Ok City $/cwt
90.00
95.00
100.00
105.00
110.00
115.00
120.00
1 2 3 4
Quarter
2006 2007 2008
Source: ERS Projections - Feb 15, 2008

54
Hog Price Projections
Barrows and Gilts, N base, cwt
35
37
39
41
43
45
47
49
51
53
55
1 2 3 4
Quarter
2006 2007 2008
Source: ERS Projections - Feb 15, 2008

55
Feeder Cattle Basis (Cash to Futures)
Alberta Feeder Calf Basis Levels(C. Alberta 5-600 lb. Cash STEERS less Nearby CME Feeder Cattle Futures )
-$24.00
-$16.00
-$8.00
$0.00
$8.00
$16.00
$24.00
$32.00
$40.00
$48.00
$56.00
12-Jan 23-Feb 6-Apr 18-May 29-Jun 10-Aug 21-Sep 2-Nov 14-Dec
(Ca
na
dia
n $
pe
r c
wt.
)
-24.00
-16.00
-8.00
0.00
8.00
16.00
24.00
32.00
40.00
48.00
56.00
2007 2006
2008
5-Year Average
Source: CME; Canfax; Economics & Competitiveness Division, AAF
5-Year AVERAGE basis 1998 to 2002 (yellow line) plus/minus 1 standard deviation

56
Fed Cattle Basis (Cash to Futures)
Alberta Slaughter Cattle Basis Levels(Direct Sales Cash Steer Price less Nearby CME Live Cattle
Futures)
-$24.00
-$22.00
-$20.00
-$18.00
-$16.00
-$14.00
-$12.00
-$10.00
-$8.00
-$6.00
-$4.00
-$2.00
$0.00
$2.00
$4.00
$6.00
$8.00
5-Jan 9-Feb 16-Mar 20-Apr 25-May 29-Jun 3-Aug 7-Sep 12-Oct 16-Nov 21-Dec
(Can
adia
n $
per
cw
t.)
-24.00
-20.00
-16.00
-12.00
-8.00
-4.00
0.00
4.00
8.00
2007 2006
2008
5-Year AVERAGE basis 1998 to 2002 (yellow line) plus/minus 1 standard deviation

57
Pork Exports in 2007
Canadian Pork Exports
0%
5%
10%
15%
20%
25%
30%
35%
40%
Australia Japan South Korea Russia USA
Sh
are
of
Exp
ort
s ($
)

58
Beef Exports in 2007
Canadian Beef Exports
0%
10%
20%
30%
40%
50%
60%
70%
80%
90%
Japan Hong Kong Mexico US Other
Sh
are
of
Exp
ort
s ($
)

59
Beef Cutout Comparison
Cutout: Canadian AAA (C$) vs US Choice (US$) (2007)
125
135
145
155
165
175
185
195
205
1 3 5 7 9 11 13 15 17 19 21 23 25 27 29 31 33 35 37 39 41 43 45 47 49 51
$/c
wt
US Choice US$ AAA US Choice C$

60
Be prepared to switch feed grains
Feed Wheat premium over Feed Barley (Red Deer)
-35
-25
-15
-5
5
15
25
35
45
55
J-04
M-0
4
M-0
4
J-04
S-0
4
N-0
4
J-05
M-0
5
M-0
5
J-05
S-0
5
N-0
5
J-06
M-0
6
M-0
6
J-06
S-0
6
N-0
6
J-07
M-0
7
M-0
7
J-07
S-0
7
N-0
7
J-08
Fe
ed
Wh
ea
t P
rem
ium
($
/to
nn
e)
Source: Alberta Grain Commission, Economics and Competitiveness Divison, AF

61
“Prediction is very difficult, especially about the future.”
Niels Bohr (1885 - 1962)
“As a general rule, the most successful people in life are the people who have the best information.”
Benjamin Disraeli

62
Nearby is , future months
Lean Hogs Futures: Daily Settlement March 2, 2008
40
45
50
55
60
65
70
75
80
85
Apr-08 May-08 Jun-08 Jul-08 Aug-08 Oct-08 Dec-08 Feb-09 Apr-09
Futures Month
$US
/cw
t
Source: Chicago Mercantile Exchange
Lean Hog Futures: February 25 vs March 2, 2008

63
2007 Slaughter Plant Capacity
Capacity is running at around 70-75% capacity.

64
After JBS Acquisitions
• Fall of 2007 – up to $75/head loss in the US.
65
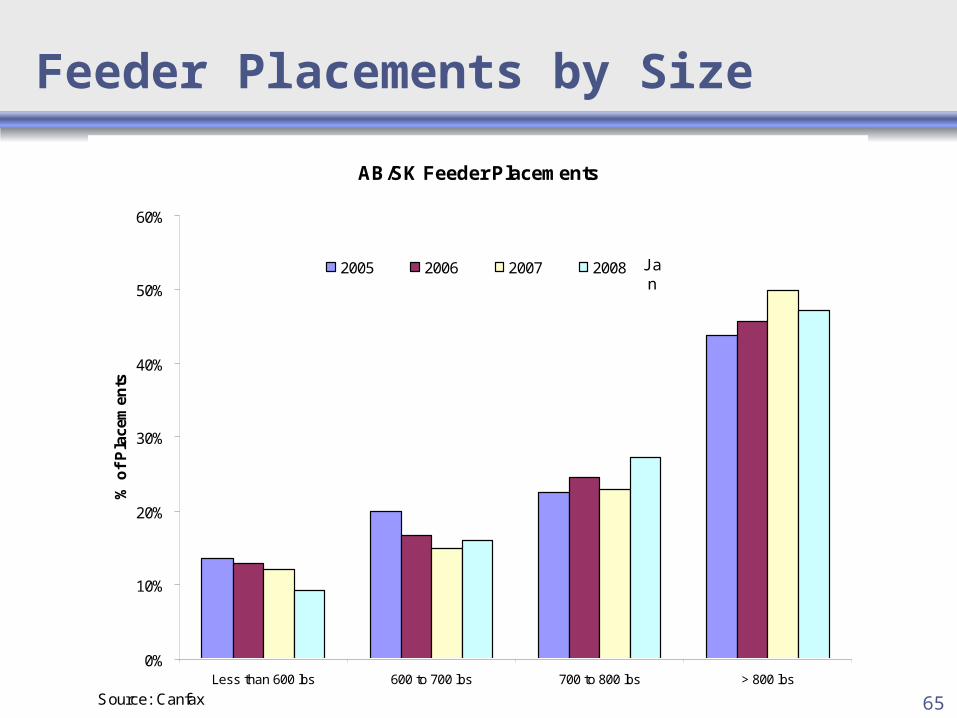
Feeder Placements by Size
AB/SK Feeder Placements
0%
10%
20%
30%
40%
50%
60%
Less than 600 lbs 600 to 700 lbs 700 to 800 lbs > 800 lbs
% o
f P
lace
men
ts
2005 2006 2007 2008
Source: Canfax
Jan

66
Meat Consumption
US: Annual Per Person Consumption
30
40
50
60
70
80
90
100
1970
1972
1974
1976
1978
1980
1982
1984
1986
1988
1990
1992
1994
1996
1998
2000
2002
2004
2006
Co
nsu
mp
tio
n p
er p
erso
n (
lbs)
Beef Pork Chicken
67
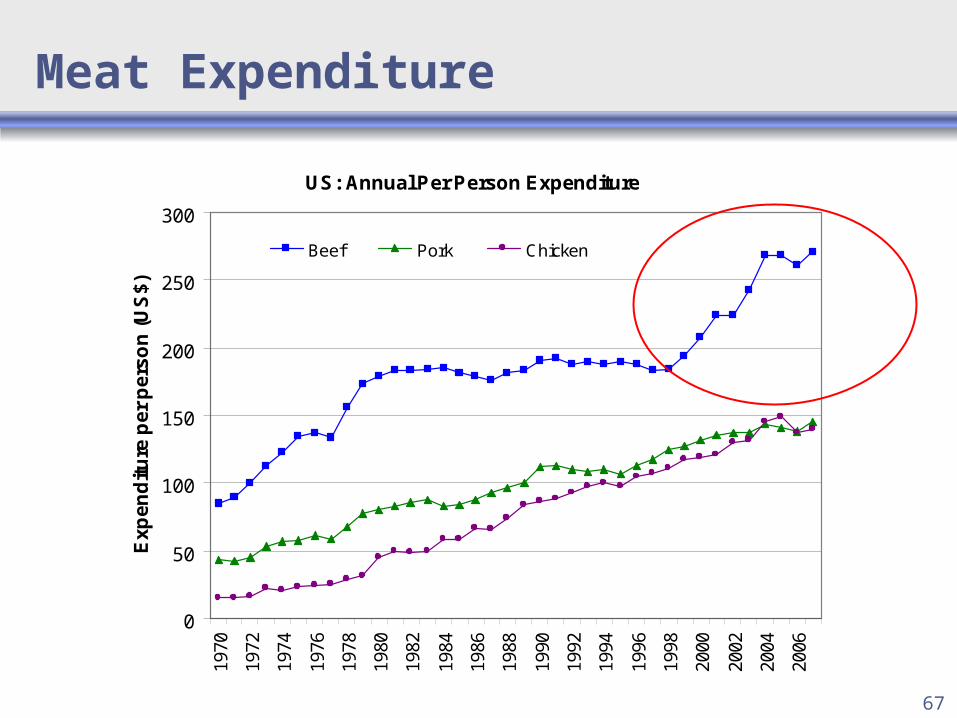
Meat Expenditure
US: Annual Per Person Expenditure
0
50
100
150
200
250
30019
70
1972
1974
1976
1978
1980
1982
1984
1986
1988
1990
1992
1994
1996
1998
2000
2002
2004
2006
Ex
pe
nd
itu
re p
er
pe
rso
n (
US
$)
Beef Pork Chicken

68
Coarse Grains 2007-08
137
5
351
7128
428 179 3
535
0
50
100
150
200
250
300
350
400
Production Trade
EU US Canada Argentina Australia FSU
World production – 1,052 MMT World trade – 120 MMT
Canada