2008 - Lake Lemon Conservancy District
37
LAKE LEMON MONITORING PROGRAM 2008 RESULTS Prepared for: Lake Lemon Conservancy District Prepared by: Melissa A.L. Clark & William W. Jones School of Public & Environmental Affairs Indiana University Bloomington, Indiana 47405 February 2009
Transcript of 2008 - Lake Lemon Conservancy District

LAKE LEMON MONITORING PROGRAM 2008 RESULTS
Prepared for:
Lake Lemon Conservancy District
Prepared by:
Melissa A.L. Clark & William W. Jones School of Public & Environmental Affairs
Indiana University Bloomington, Indiana 47405
February 2009

ii
Acknowledgments
We’d like to thank the following SPEA students for their help in collecting and analyzing the data used in this report: Ted Derheimer, Laura Montgrain, Matt Deaner, Eva Olin, Thomas Parr, Matt Robinson, and Moira Rojas. We’d also like to thank Bob Madden and Scott McWhorter of the Lake Lemon Conservancy District for their help in facilitating our sampling efforts.
iii
CONTENTS INTRODUCTION ...........................................................................................................................1 METHODS ......................................................................................................................................1 RESULTS ........................................................................................................................................5
Water Quality .......................................................................................................................5 Comparison with Other Indiana Lakes ..............................................................................23 Stream Results ...................................................................................................................24 Trophic State ......................................................................................................................25
TROPHIC STATE TRENDS ........................................................................................................27 WATER QUALITY TRENDS ......................................................................................................29 CONCLUSIONS............................................................................................................................31 REFERENCES ..............................................................................................................................33

1
INTRODUCTION
The Lake Lemon Conservancy District (LLCD) has entered into a lease agreement with the City of Bloomington Utilities Service Board (USB) to maintain Lake Lemon in such condition necessary to protect the lake’s water quality consistent with its potential use as a drinking water source. LLCD also agreed to maintain the lake in such condition to meet all state and federal requirements for recreational waters and to maintain the quality of the water in the lake at least at its present level.
The LLCD has contracted with Indiana University’s School of Public & Environmental Affairs (SPEA) to evaluate the condition of Lake Lemon since 1997. This report is the result of SPEA’s 2008 monitoring efforts. METHODS
The water sampling and analytical methods used for Lake Lemon were consistent with those used in IDEM’s Indiana Clean Lakes Program and IDNR’s Lake and River Enhancement Program. We collected water samples for various parameters on 5/13/08, 6/11/08, and 8/6/08 from over the point of maximum depth off Cemetery Island near Riddle Point and in the channel off Reed Point in the eastern end of Lake Lemon. We also collected water samples from the entrance to the Chitwood Addition (Chitwood #1).
We collected water samples from one meter below the surface (epilimnion) and from one
meter above the bottom (hypolimnion) at each lake site, except the Chitwood site where we only sampled the epilimnion due to the very shallow channel. These samples were preserved as needed, placed in coolers and transported to our laboratory for analysis. Chlorophyll was determined only for the epilimnetic sample. Other parameters such as Secchi disk transparency, light transmission, and oxygen saturation are single measurements. In addition, dissolved oxygen and temperature were measured at one-meter intervals from the surface to the bottom. A tow to collect plankton was made from the 1% light level to the water surface. Because Lake Lemon’s condition is heavily influenced by runoff from its watershed, it was also important to monitor the main inlet to the lake - Beanblossom Creek. Therefore, we sampled Beanblossom Creek on 5/13/08 and 8/6/08, at one location at mid-depth near its discharge point to the lake. The following parameters were measured for both the lake and stream samples:
- pH - alkalinity - conductivity - dissolved oxygen - temperature - total phosphorus
- soluble reactive phosphorus - nitrate+nitrite - ammonia - total organic nitrogen - total suspended solids - fecal coliform bacteria
In addition to the water sampling stations described above, we also monitored several other locations for fecal coliform bacteria. At the Chitwood Addition, we collected water samples
2
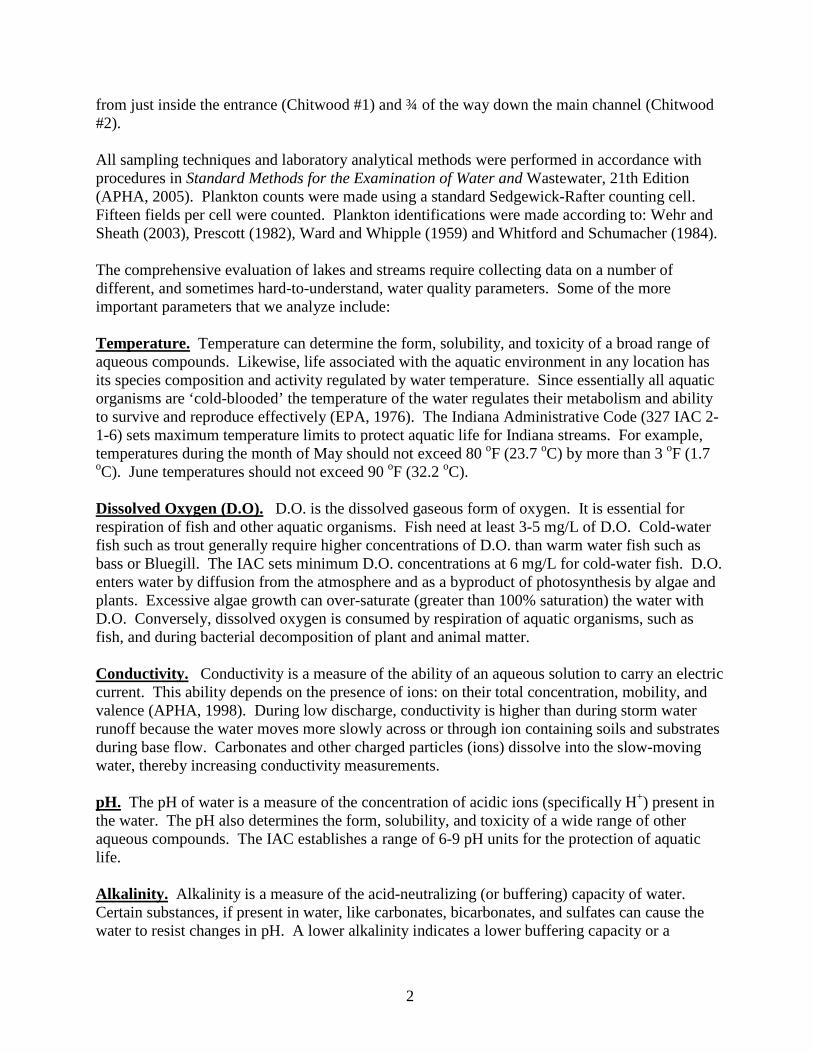
from just inside the entrance (Chitwood #1) and ¾ of the way down the main channel (Chitwood #2). All sampling techniques and laboratory analytical methods were performed in accordance with procedures in Standard Methods for the Examination of Water and Wastewater, 21th Edition (APHA, 2005). Plankton counts were made using a standard Sedgewick-Rafter counting cell. Fifteen fields per cell were counted. Plankton identifications were made according to: Wehr and Sheath (2003), Prescott (1982), Ward and Whipple (1959) and Whitford and Schumacher (1984). The comprehensive evaluation of lakes and streams require collecting data on a number of different, and sometimes hard-to-understand, water quality parameters. Some of the more important parameters that we analyze include: Temperature. Temperature can determine the form, solubility, and toxicity of a broad range of aqueous compounds. Likewise, life associated with the aquatic environment in any location has its species composition and activity regulated by water temperature. Since essentially all aquatic organisms are ‘cold-blooded’ the temperature of the water regulates their metabolism and ability to survive and reproduce effectively (EPA, 1976). The Indiana Administrative Code (327 IAC 2-1-6) sets maximum temperature limits to protect aquatic life for Indiana streams. For example, temperatures during the month of May should not exceed 80 oF (23.7 oC) by more than 3 oF (1.7 oC). June temperatures should not exceed 90 oF (32.2 oC). Dissolved Oxygen (D.O). D.O. is the dissolved gaseous form of oxygen. It is essential for respiration of fish and other aquatic organisms. Fish need at least 3-5 mg/L of D.O. Cold-water fish such as trout generally require higher concentrations of D.O. than warm water fish such as bass or Bluegill. The IAC sets minimum D.O. concentrations at 6 mg/L for cold-water fish. D.O. enters water by diffusion from the atmosphere and as a byproduct of photosynthesis by algae and plants. Excessive algae growth can over-saturate (greater than 100% saturation) the water with D.O. Conversely, dissolved oxygen is consumed by respiration of aquatic organisms, such as fish, and during bacterial decomposition of plant and animal matter. Conductivity. Conductivity is a measure of the ability of an aqueous solution to carry an electric current. This ability depends on the presence of ions: on their total concentration, mobility, and valence (APHA, 1998). During low discharge, conductivity is higher than during storm water runoff because the water moves more slowly across or through ion containing soils and substrates during base flow. Carbonates and other charged particles (ions) dissolve into the slow-moving water, thereby increasing conductivity measurements. pH. The pH of water is a measure of the concentration of acidic ions (specifically H+) present in the water. The pH also determines the form, solubility, and toxicity of a wide range of other aqueous compounds. The IAC establishes a range of 6-9 pH units for the protection of aquatic life. Alkalinity. Alkalinity is a measure of the acid-neutralizing (or buffering) capacity of water. Certain substances, if present in water, like carbonates, bicarbonates, and sulfates can cause the water to resist changes in pH. A lower alkalinity indicates a lower buffering capacity or a

3
decreased ability to resist changes in pH. During base flow conditions, alkalinity is usually high because the water picks up carbonates from the bedrock. Alkalinity measurements are usually lower during storm flow conditions because buffering compounds are diluted by rainwater and the runoff water moves across carbonate-containing bedrock materials so quickly that little carbonate is dissolved to add additional buffering capacity. Turbidity. Turbidity (measured in Nephelometric Turbidity Units) is a measure of particles suspended in the water itself. It is generally related to suspended and colloidal matter such as clay, silt, finely divided organic and inorganic matter, plankton, and other microscopic organisms. According to the Hoosier Riverwatch, the average turbidity of an Indiana stream is 11 NTU with a typical range of 4.5-17.5 NTU (White, unpublished data). Turbidity measurements >20 NTU have been found to cause undesirable changes in aquatic life (Walker, 1978). Nitrogen. Nitrogen is an essential plant nutrient found in fertilizers, human and animal wastes, yard waste, and the air. About 80% of the air we breathe is nitrogen gas. Nitrogen gas diffuses into water where it can be “fixed”, or converted, by Blue-green algae to ammonia for their use. Nitrogen can also enter lakes and streams as inorganic nitrogen and ammonia. Because of this, there is an abundant supply of available nitrogen to aquatic systems. The three common forms of nitrogen are:
Nitrate (NO3-) – Nitrate is an oxidized form of dissolved nitrogen that is converted to
ammonia by algae. It is found in streams and runoff when dissolved oxygen is present, usually in the surface waters. Ammonia applied to farmland is rapidly oxidized or converted to nitrate and usually enters surface and groundwater as nitrate. The Ohio EPA (1999) found that the median nitrate-nitrogen concentration in wadeable streams that support modified warmwater habitat (MWH) was 1.6 mg/L. Modified warmwater habitat was defined as: aquatic life use assigned to streams that have irretrievable, extensive, man-induced modification that preclude attainment of the warmwater habitat use (WWH) designation; such streams are characterized by species that are tolerant of poor chemical quality (fluctuating dissolved oxygen) and habitat conditions (siltation, habitat amplification) that often occur in modified streams (Ohio EPA, 1999). Nitrate concentrations exceeding 10 mg/1 in drinking water are considered hazardous to human health (Indiana Administrative Code IAC 2-1-6).
Ammonia (NH4
+) – Ammonia is a form of dissolved nitrogen that is the preferred form for algae use. It is the reduced form of nitrogen and is found in water where dissolved oxygen is lacking. Important sources of ammonia include fertilizers and animal manure. In addition, bacteria produce ammonia as a by-product as they decompose dead plant and animal matter. Both temperature and pH govern the toxicity of ammonia for aquatic life.
Organic Nitrogen (Org N) – Organic nitrogen includes nitrogen found in plant and animal materials. It may be in dissolved or particulate form. In the analytical procedures, total Kjeldahl nitrogen (TKN) was analyzed. Organic nitrogen is TKN minus ammonia.
Phosphorus. Phosphorus is an essential plant nutrient, and the one that most often controls aquatic plant (algae and macrophyte) growth in freshwater. It is found in fertilizers, human and

4
animal wastes, and yard waste. There are few natural sources of phosphorus to streams other than what is attached to soil particles, and there is no atmospheric (vapor) form of phosphorus. For this reason, phosphorus is often a limiting nutrient in aquatic systems. This means that the relative scarcity of phosphorus may limit the ultimate growth and production of algae and rooted aquatic plants. Therefore, management efforts often focus on reducing phosphorus inputs to receiving waterways because: (a) it can be managed and (b) reducing phosphorus can reduce algae production. Two common forms of phosphorus are:
Soluble reactive phosphorus (SRP) – SRP is dissolved phosphorus readily usable by algae. SRP is often found in very low concentrations in phosphorus-limited systems where the phosphorus is tied up in the algae themselves. Because phosphorus is cycled so rapidly through biota, SRP concentrations as low as 0.005 mg/L are enough to maintain eutrophic or highly productive conditions in lake systems (Correll, 1998). Sources of SRP include fertilizers, animal wastes, and septic systems.
Total phosphorus (TP) – TP includes dissolved and particulate phosphorus. TP concentrations greater than 0.03 mg/L (or 30µg/L) can cause algal blooms in lakes and reservoirs. The Ohio EPA (1999) found that the median TP in wadeable streams that support MWH for fish was 0.28 mg/L.
Total Suspended Solids (TSS). A TSS measurement quantifies all particles suspended and dissolved in stream water. Closely related to turbidity, this parameter quantifies sediment particles and other solid compounds typically found in stream water. In general, the concentration of suspended solids is greater during high flow events due to increased overland flow. The increased overland flow erodes and carries more soil and other particulates to the stream. Although the State of Indiana sets no standard for TSS, total dissolved solids should not exceed 750 mg/L. In general, TSS concentrations >80 mg/L have been found to be deleterious to aquatic life (Waters, 1995). Fecal Coliform Bacteria - is used as an indicator organism to identify the potential for the presence of pathogenic organisms in a water sample. Pathogenic organisms can present a threat to human health by causing a variety of serious diseases, including infectious hepatitis, typhoid, gastroenteritis, and other gastrointestinal illnesses. Fecal coliforms can come from the feces of any warm-blooded animal. Wildlife, livestock, and/or domestic animal defecation, manure fertilizers, previously contaminated sediments, and failing or improperly sited septic systems are common sources of the bacteria. The IAC sets the maximum standard at 235 colonies/100 ml in any one sample within a 30-day period or a geometric mean of 125 colonies per 100 ml for five samples collected in any 30-day period. In general, fecal coliform bacteria have a life expectancy of less than 24 hours. Secchi Disk Transparency. This refers to the depth to which the black & white Secchi disk can be seen in the lake water. Water clarity, as determined by a Secchi disk, is affected by two primary factors: algae and suspended particulate matter. Particulates (for example, soil or dead leaves) may be introduced into the water by either runoff from the land or from sediments already on the bottom of the lake. Many processes may introduce sediments from runoff; examples include erosion from construction sites, agricultural lands, and riverbanks. Bottom sediments

5
may be resuspended by bottom feeding fish such as carp, or in shallow lakes, by motorboats or strong winds. Light Transmission. Similar to the Secchi disk transparency, this measurement uses a light meter (photocell) to determine the rate at which light transmission is diminished in the upper portion of the lake’s water column. Another important light transmission measurement is determination of the 1% light level. The 1% light level is the water depth to which one percent of the surface light penetrates. This is considered the lower limit of algal growth in lakes and is referred to as the photic zone. Plankton. Plankton are important members of the aquatic food web. The plankton include the algae (microscopic plants) and the zooplankton (tiny shrimp-like animals that eat algae). Determined by filtering water through a net having a very fine mesh (63-micron openings = 63/1000 millimeter). The plankton net is towed up through the lake’s water column from the one percent light level to the surface. Algae are reported as natural units, which records one colonial filament of multiple cells as one natural unit and one cell of a singular alga also as one natural unit. Of the many different algal species present in the water, we are particularly interested in the Blue-green algae. Blue-green algae are those that most often form nuisance blooms and their dominance in lakes may indicate poor water conditions. Chlorophyll a
RESULTS
. The plant pigments of algae consist of the chlorophylls (green color) and carotenoids (yellow color). Chlorophyll a is by far the most dominant chlorophyll pigment and occurs in great abundance. Thus, chlorophyll a is often used as a direct estimate of algal biomass.
Water Quality
Temperature profiles indicated slight to strong thermal stratification at Riddle Point, while Reed Point primarily illustrates weaker to no stratification (Figures 1–6). In most Indiana lakes, thermal stratification is weakest in the spring and gets stronger as summer progresses, which is demonstrated at Riddle Point. The May temperature at Riddle Point is almost isothermal, which means the temperature is the same throughout the entire water column. There is less than a 2°C difference between the epilimnion and the hypolimnion. By August, the Riddle Point temperature profile was stratified with the hypolimnion at approximately 23°C. Reed Point was slightly stratified in May and June, but had an isothermal profile in August. Reed Point is shallow enough that turbulence from winds and boating activity keeps it well mixed.

6
FIGURE 1. Temperature and dissolved oxygen profiles for Lake Lemon at Riddle Point on 5/13/08.
FIGURE 2. Temperature and dissolved oxygen profiles for Lake Lemon at Riddle Point on 6/11/08.
0
1
2
3
4
5
6
7
80 2 4 6 8 10 12 14 16 18 20
Dep
th (m
)
mg/L and °C
Lake Lemon Temperature and Dissolved Oxygen Profiles -Riddle Point 5/13/08
Temp
DO
0
1
2
3
4
5
6
7
8
90 5 10 15 20 25 30
Dep
th (m
)
mg/L and °C
Lake Lemon Temperature and Dissolved Oxygen Profiles -Riddle Point 6/11/08
Temp
DO

7
FIGURE 3. Temperature and dissolved oxygen profiles for Lake Lemon at Riddle Point on 8/6/08.
FIGURE 4. Temperature and dissolved oxygen profiles for Lake Lemon at Reed Point on 5/13/08.
0
1
2
3
4
5
6
7
80 5 10 15 20 25 30 35
Dep
th (m
)
mg/L and °C
Lake Lemon Temperature and Dissolved Oxygen Profiles -Riddle Point 8/6/08
Temp
DO
0
1
2
3
40 2 4 6 8 10 12 14 16 18
Dep
th (m
)
mg/L and °C
Lake Lemon Temperature and Dissolved Oxygen Profiles -Reed Point 5/13/08
Temp
DO

8
FIGURE 5. Temperature and dissolved oxygen profiles for Lake Lemon at Reed Point on 6/11/08.
FIGURE 6. Temperature and dissolved oxygen profiles for Lake Lemon at Reed Point on 8/6/08.
0
1
2
3
40 5 10 15 20 25 30
Dep
th (m
)
mg/L and °C
Lake Lemon Temperature and Dissolved Oxygen Profiles -Reed Point 6/11/08
Temp
DO
0
1
2
3
40 5 10 15 20 25 30
Dep
th (m
)
mg/L and °C
Lake Lemon Temperature and Dissolved Oxygen Profiles -Reed Point 8/6/08
Temp
DO
9
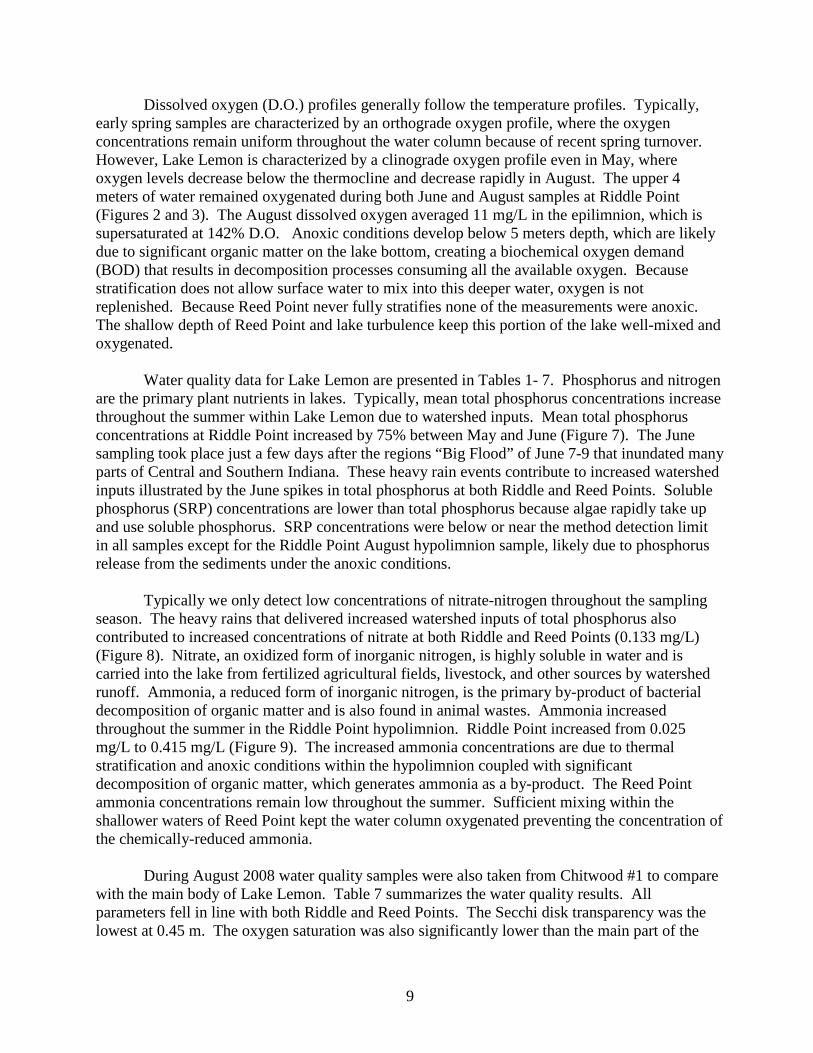
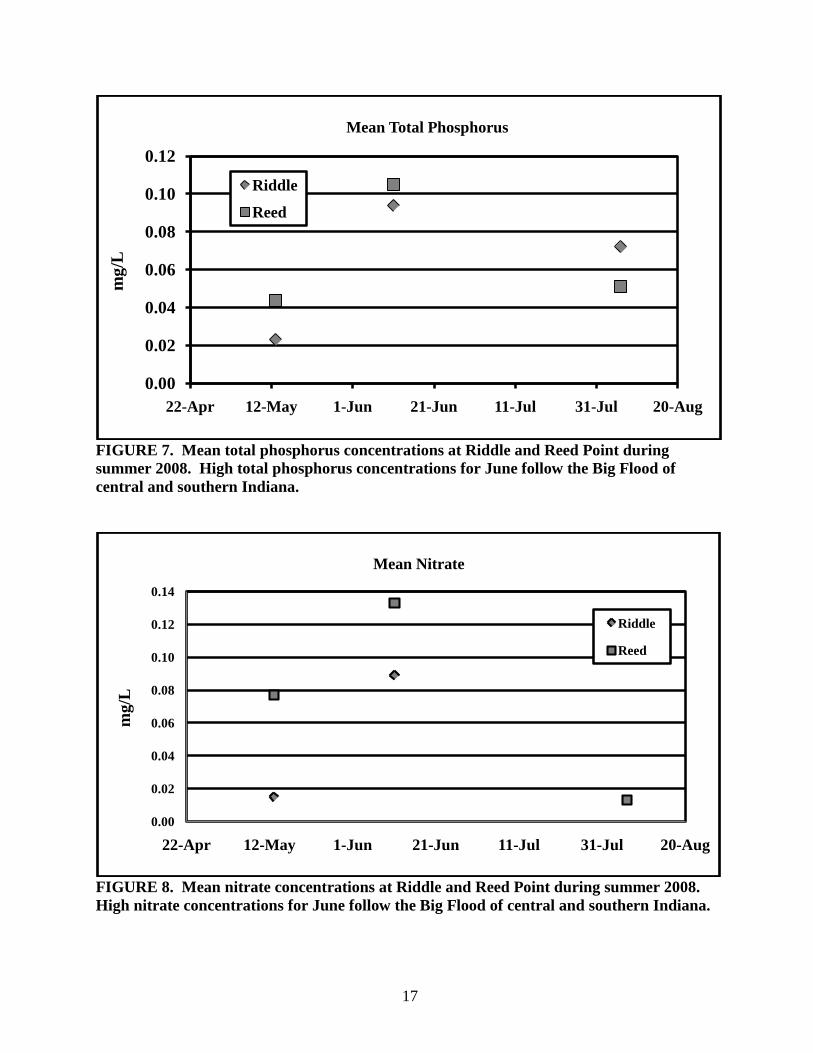
Dissolved oxygen (D.O.) profiles generally follow the temperature profiles. Typically, early spring samples are characterized by an orthograde oxygen profile, where the oxygen concentrations remain uniform throughout the water column because of recent spring turnover. However, Lake Lemon is characterized by a clinograde oxygen profile even in May, where oxygen levels decrease below the thermocline and decrease rapidly in August. The upper 4 meters of water remained oxygenated during both June and August samples at Riddle Point (Figures 2 and 3). The August dissolved oxygen averaged 11 mg/L in the epilimnion, which is supersaturated at 142% D.O. Anoxic conditions develop below 5 meters depth, which are likely due to significant organic matter on the lake bottom, creating a biochemical oxygen demand (BOD) that results in decomposition processes consuming all the available oxygen. Because stratification does not allow surface water to mix into this deeper water, oxygen is not replenished. Because Reed Point never fully stratifies none of the measurements were anoxic. The shallow depth of Reed Point and lake turbulence keep this portion of the lake well-mixed and oxygenated. Water quality data for Lake Lemon are presented in Tables 1- 7. Phosphorus and nitrogen are the primary plant nutrients in lakes. Typically, mean total phosphorus concentrations increase throughout the summer within Lake Lemon due to watershed inputs. Mean total phosphorus concentrations at Riddle Point increased by 75% between May and June (Figure 7). The June sampling took place just a few days after the regions “Big Flood” of June 7-9 that inundated many parts of Central and Southern Indiana. These heavy rain events contribute to increased watershed inputs illustrated by the June spikes in total phosphorus at both Riddle and Reed Points. Soluble phosphorus (SRP) concentrations are lower than total phosphorus because algae rapidly take up and use soluble phosphorus. SRP concentrations were below or near the method detection limit in all samples except for the Riddle Point August hypolimnion sample, likely due to phosphorus release from the sediments under the anoxic conditions.
Typically we only detect low concentrations of nitrate-nitrogen throughout the sampling
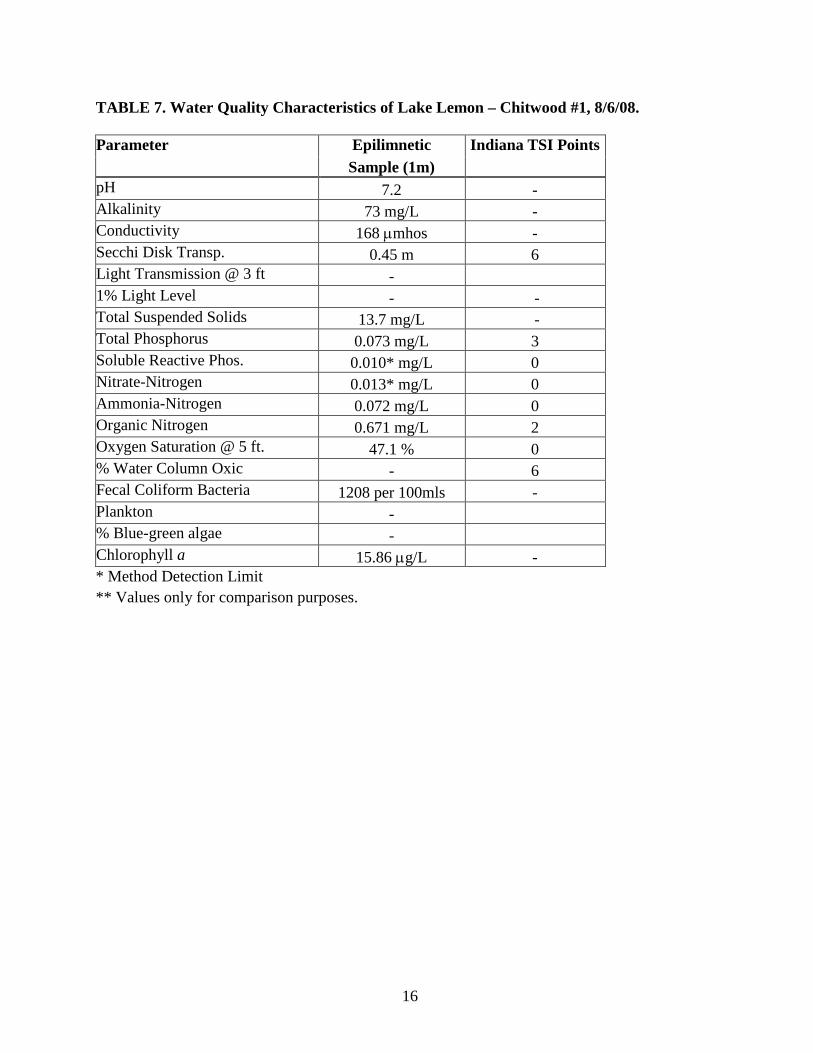
season. The heavy rains that delivered increased watershed inputs of total phosphorus also contributed to increased concentrations of nitrate at both Riddle and Reed Points (0.133 mg/L) (Figure 8). Nitrate, an oxidized form of inorganic nitrogen, is highly soluble in water and is carried into the lake from fertilized agricultural fields, livestock, and other sources by watershed runoff. Ammonia, a reduced form of inorganic nitrogen, is the primary by-product of bacterial decomposition of organic matter and is also found in animal wastes. Ammonia increased throughout the summer in the Riddle Point hypolimnion. Riddle Point increased from 0.025 mg/L to 0.415 mg/L (Figure 9). The increased ammonia concentrations are due to thermal stratification and anoxic conditions within the hypolimnion coupled with significant decomposition of organic matter, which generates ammonia as a by-product. The Reed Point ammonia concentrations remain low throughout the summer. Sufficient mixing within the shallower waters of Reed Point kept the water column oxygenated preventing the concentration of the chemically-reduced ammonia. During August 2008 water quality samples were also taken from Chitwood #1 to compare with the main body of Lake Lemon. Table 7 summarizes the water quality results. All parameters fell in line with both Riddle and Reed Points. The Secchi disk transparency was the lowest at 0.45 m. The oxygen saturation was also significantly lower than the main part of the

10
lake with 47.1% saturation. This is likely due the heavy sedimentation and macrophyte decomposition in the shallow channel. TABLE 1. Water Quality Characteristics of Lake Lemon – Riddle Point, 5/13/08. Parameter Epilimnetic Hypolimnetic Indiana TSI Points
Sample (1m) Sample (7m) (based on mean values) pH 7.5 7.2 - Alkalinity 53 mg/L 35 mg/L - Conductivity 117.3 µmhos 116.9 µmhos - Secchi Disk Transp. 1.05 m - 6 Light Transmission @ 3 ft 12.7 % - 4 1% Light Level 6 ft - - Total Suspended Solids 4.4 mg/L 7.8 mg/L - Total Phosphorus 0.033 mg/L 0.013 mg/L 0 Soluble Reactive Phos. 0.010* mg/L 0.010* mg/L 0 Nitrate-Nitrogen 0.013* mg/L 0.017 mg/L 0 Ammonia-Nitrogen 0.025 mg/L 0.066 mg/L 0 Organic Nitrogen 0.773 mg/L 0.255 mg/L 1 Oxygen Saturation @ 5 ft. 89.7 % - 0 % Water Column Oxic 100 % - 0 Fecal Coliform Bacteria 20 per 100mls - - Plankton 2,223 N.U./L - 0 % Blue-green algae 29.1 % - 0 Chlorophyll a 4.81 µg/L - - * Method Detection Limit TSI score = 11
11
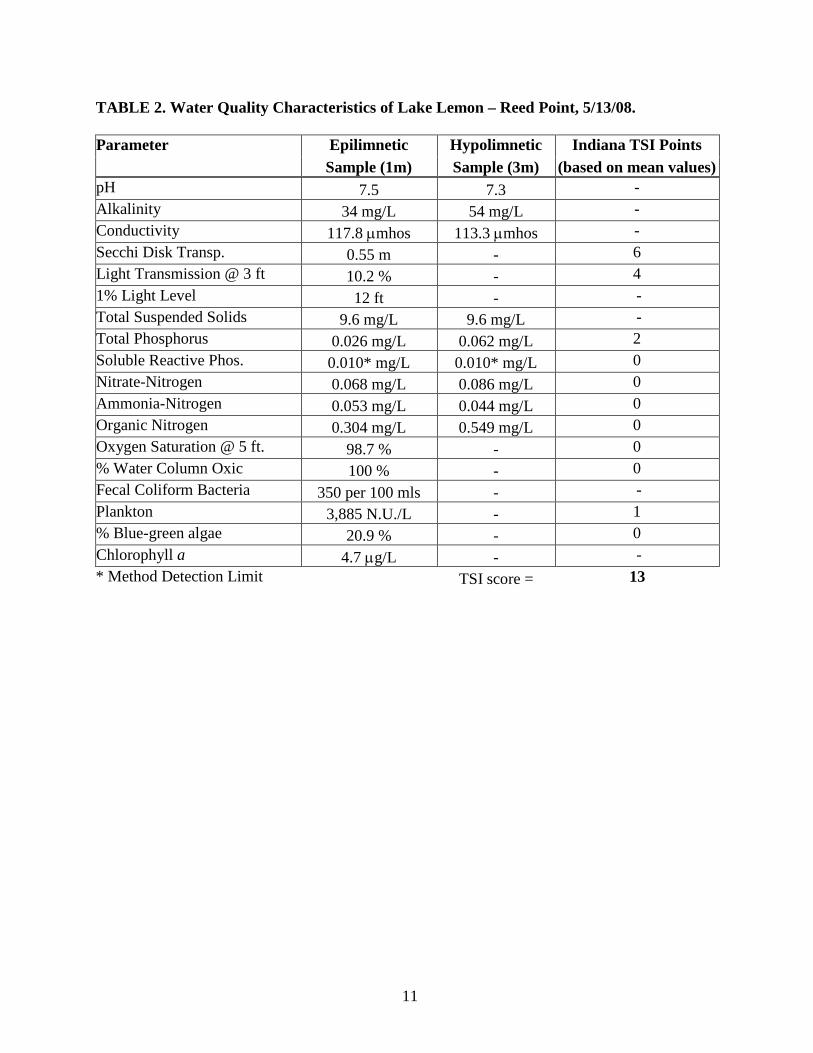
TABLE 2. Water Quality Characteristics of Lake Lemon – Reed Point, 5/13/08. Parameter Epilimnetic Hypolimnetic Indiana TSI Points
Sample (1m) Sample (3m) (based on mean values) pH 7.5 7.3 - Alkalinity 34 mg/L 54 mg/L - Conductivity 117.8 µmhos 113.3 µmhos - Secchi Disk Transp. 0.55 m - 6 Light Transmission @ 3 ft 10.2 % - 4 1% Light Level 12 ft - - Total Suspended Solids 9.6 mg/L 9.6 mg/L - Total Phosphorus 0.026 mg/L 0.062 mg/L 2 Soluble Reactive Phos. 0.010* mg/L 0.010* mg/L 0 Nitrate-Nitrogen 0.068 mg/L 0.086 mg/L 0 Ammonia-Nitrogen 0.053 mg/L 0.044 mg/L 0 Organic Nitrogen 0.304 mg/L 0.549 mg/L 0 Oxygen Saturation @ 5 ft. 98.7 % - 0 % Water Column Oxic 100 % - 0 Fecal Coliform Bacteria 350 per 100 mls - - Plankton 3,885 N.U./L - 1 % Blue-green algae 20.9 % - 0 Chlorophyll a 4.7 µg/L - - * Method Detection Limit TSI score = 13

12
TABLE 3. Water Quality Characteristics of Lake Lemon – Riddle Point, 6/11/08. Parameter Epilimnetic Hypolimnetic Indiana TSI Points
Sample (1m) Sample (7m) (based on mean values) pH 7.1 6.9 - Alkalinity 33 mg/L 33 mg/L - Conductivity 82.8 µmhos 76.5 µmhos - Secchi Disk Transp. 0.2 m - 6 Light Transmission @ 3 ft 0.09 % - 4 1% Light Level 1.97 ft - - Total Suspended Solids 45.5 mg/L 48.4 mg/L - Total Phosphorus 0.069 mg/L 0.120 mg/L 3 Soluble Reactive Phos. 0.017 mg/L 0.016 mg/L 0 Nitrate-Nitrogen 0.096 mg/L 0.081 mg/L 0 Ammonia-Nitrogen 0.088 mg/L 0.131 mg/L 0 Organic Nitrogen 0.702 mg/L 0.509 mg/L 2 Oxygen Saturation @ 5 ft. 73 % - 0 % Water Column Oxic 87.5 % - 0 Fecal Coliform Bacteria 32 per 100 mls - - Plankton 2541 N.U./L - 0 % Blue-green algae 8.9 % - 0 Chlorophyll a 4.35 µg/L - - * Method Detection Limit TSI score = 15
13
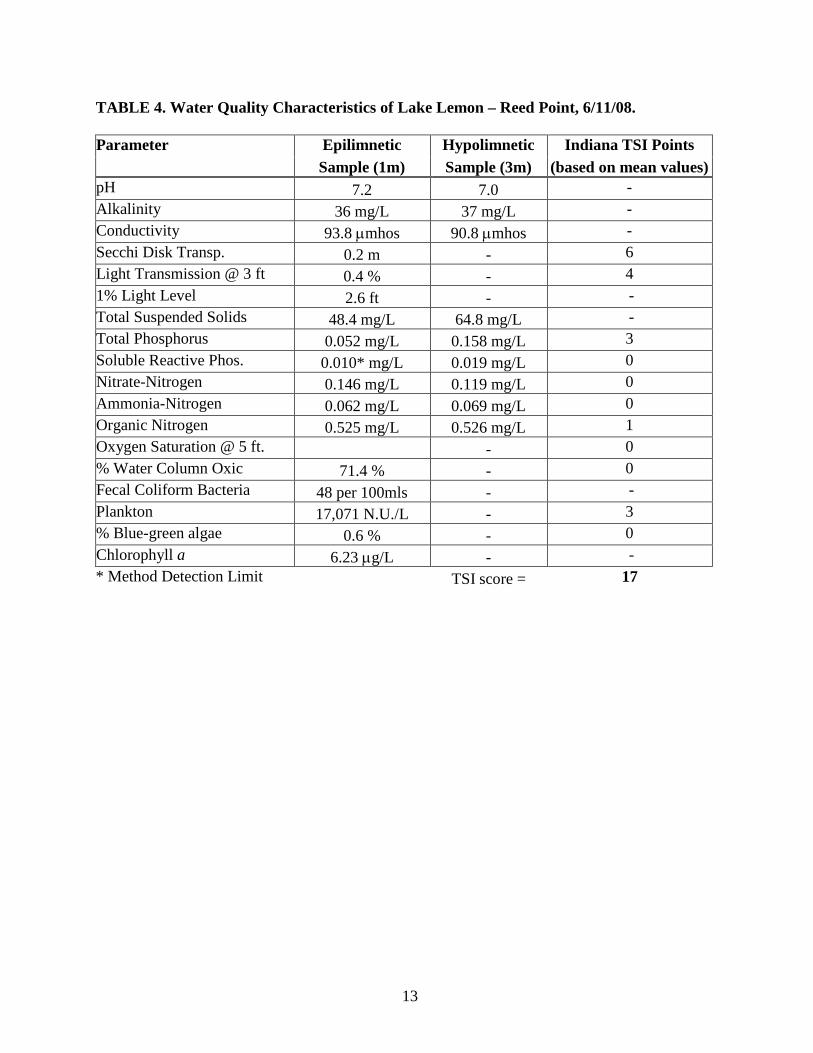
TABLE 4. Water Quality Characteristics of Lake Lemon – Reed Point, 6/11/08. Parameter Epilimnetic Hypolimnetic Indiana TSI Points
Sample (1m) Sample (3m) (based on mean values) pH 7.2 7.0 - Alkalinity 36 mg/L 37 mg/L - Conductivity 93.8 µmhos 90.8 µmhos - Secchi Disk Transp. 0.2 m - 6 Light Transmission @ 3 ft 0.4 % - 4 1% Light Level 2.6 ft - - Total Suspended Solids 48.4 mg/L 64.8 mg/L - Total Phosphorus 0.052 mg/L 0.158 mg/L 3 Soluble Reactive Phos. 0.010* mg/L 0.019 mg/L 0 Nitrate-Nitrogen 0.146 mg/L 0.119 mg/L 0 Ammonia-Nitrogen 0.062 mg/L 0.069 mg/L 0 Organic Nitrogen 0.525 mg/L 0.526 mg/L 1 Oxygen Saturation @ 5 ft. - 0 % Water Column Oxic 71.4 % - 0 Fecal Coliform Bacteria 48 per 100mls - - Plankton 17,071 N.U./L - 3 % Blue-green algae 0.6 % - 0 Chlorophyll a 6.23 µg/L - - * Method Detection Limit TSI score = 17

14
TABLE 5. Water Quality Characteristics of Lake Lemon – Riddle Point, 8/6/08. Parameter Epilimnetic Hypolimnetic Indiana TSI Points
Sample (1m) Sample (7m) (based on mean values) pH 8.6 7.2 - Alkalinity 59 mg/L 79 mg/L - Conductivity 139 µmhos 175 µmhos - Secchi Disk Transp. 0.8 m - 6 Light Transmission @ 3 ft 9.96 % - 4 1% Light Level 8.5 ft - - Total Suspended Solids 6.7 mg/L 13.0 mg/L - Total Phosphorus 0.056 mg/L 0.087 mg/L 3 Soluble Reactive Phos. 0.010* mg/L 0.053 mg/L 1 Nitrate-Nitrogen 0.013* mg/L 0.013* mg/L 0 Ammonia-Nitrogen 0.021 mg/L 0.415 mg/L 0 Organic Nitrogen 0.635 mg/L 1.085 mg/L 2 Oxygen Saturation @ 5 ft. 142 % - 3 % Water Column Oxic 100 % - 0 Fecal Coliform Bacteria 40 per 100mls - - Plankton 4006 N.U./L - 1 % Blue-green algae 54.4 % - 10 Chlorophyll a 28.99 µg/L - - * Method Detection Limit TSI score = 30
15
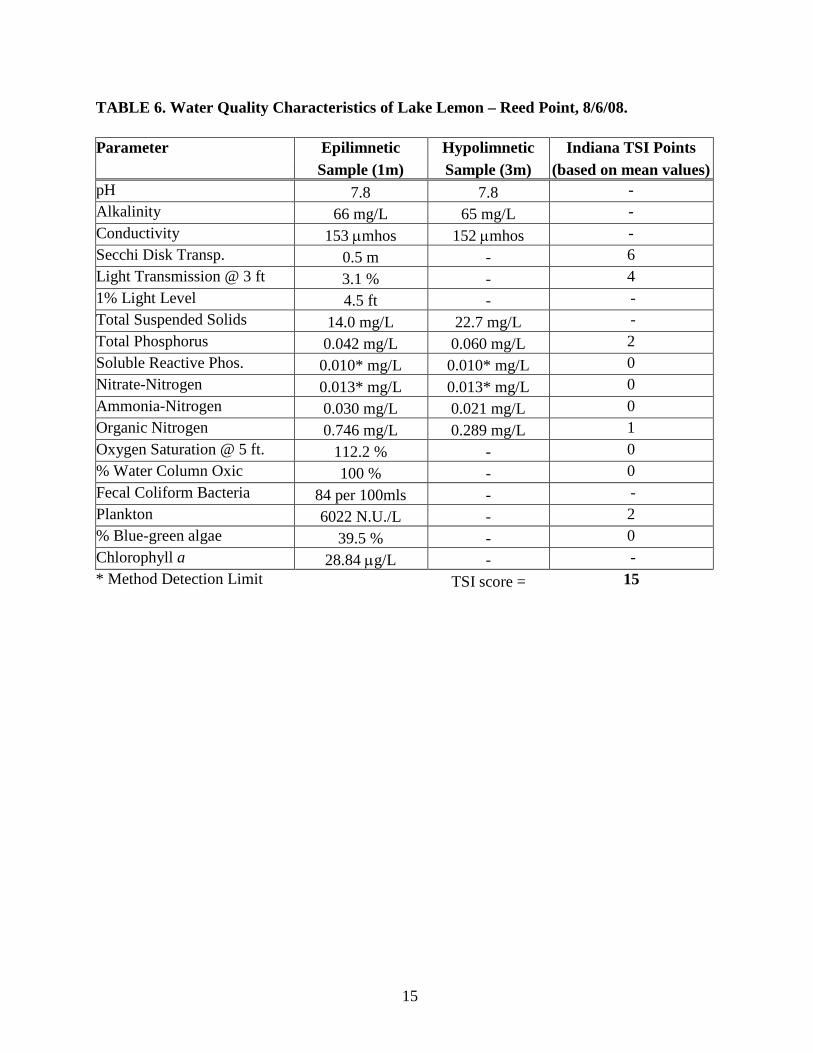
TABLE 6. Water Quality Characteristics of Lake Lemon – Reed Point, 8/6/08. Parameter Epilimnetic Hypolimnetic Indiana TSI Points
Sample (1m) Sample (3m) (based on mean values) pH 7.8 7.8 - Alkalinity 66 mg/L 65 mg/L - Conductivity 153 µmhos 152 µmhos - Secchi Disk Transp. 0.5 m - 6 Light Transmission @ 3 ft 3.1 % - 4 1% Light Level 4.5 ft - - Total Suspended Solids 14.0 mg/L 22.7 mg/L - Total Phosphorus 0.042 mg/L 0.060 mg/L 2 Soluble Reactive Phos. 0.010* mg/L 0.010* mg/L 0 Nitrate-Nitrogen 0.013* mg/L 0.013* mg/L 0 Ammonia-Nitrogen 0.030 mg/L 0.021 mg/L 0 Organic Nitrogen 0.746 mg/L 0.289 mg/L 1 Oxygen Saturation @ 5 ft. 112.2 % - 0 % Water Column Oxic 100 % - 0 Fecal Coliform Bacteria 84 per 100mls - - Plankton 6022 N.U./L - 2 % Blue-green algae 39.5 % - 0 Chlorophyll a 28.84 µg/L - - * Method Detection Limit TSI score = 15
16
TABLE 7. Water Quality Characteristics of Lake Lemon – Chitwood #1, 8/6/08. Parameter Epilimnetic Indiana TSI Points
Sample (1m) pH 7.2 - Alkalinity 73 mg/L - Conductivity 168 µmhos - Secchi Disk Transp. 0.45 m 6 Light Transmission @ 3 ft - 1% Light Level - - Total Suspended Solids 13.7 mg/L - Total Phosphorus 0.073 mg/L 3 Soluble Reactive Phos. 0.010* mg/L 0 Nitrate-Nitrogen 0.013* mg/L 0 Ammonia-Nitrogen 0.072 mg/L 0 Organic Nitrogen 0.671 mg/L 2 Oxygen Saturation @ 5 ft. 47.1 % 0 % Water Column Oxic - 6 Fecal Coliform Bacteria 1208 per 100mls - Plankton - % Blue-green algae - Chlorophyll a 15.86 µg/L - * Method Detection Limit ** Values only for comparison purposes.
17
FIGURE 7. Mean total phosphorus concentrations at Riddle and Reed Point during summer 2008. High total phosphorus concentrations for June follow the Big Flood of central and southern Indiana.
FIGURE 8. Mean nitrate concentrations at Riddle and Reed Point during summer 2008. High nitrate concentrations for June follow the Big Flood of central and southern Indiana.
0.00
0.02
0.04
0.06
0.08
0.10
0.12
22-Apr 12-May 1-Jun 21-Jun 11-Jul 31-Jul 20-Aug
mg/
LMean Total Phosphorus
Riddle
Reed
0.00
0.02
0.04
0.06
0.08
0.10
0.12
0.14
22-Apr 12-May 1-Jun 21-Jun 11-Jul 31-Jul 20-Aug
mg/
L
Mean Nitrate
Riddle
Reed

18
FIGURE 9. Summer 2008 mean concentrations of ammonia. The high ammonia concentration at Riddle Point in August was driven by a high hypolimnetic ammonia concentration, likely created by bacterial decomposition in the anoxic environment.
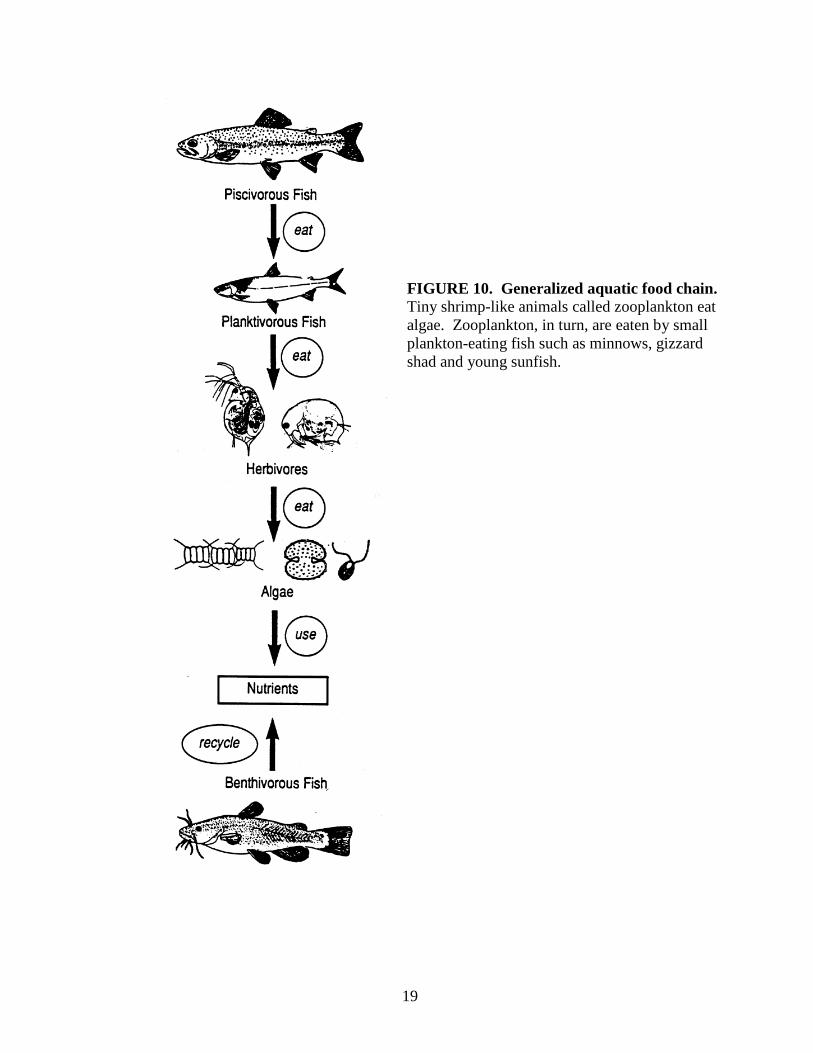
Plankton include algae (microscopic green plants) and zooplankton (microscopic, primarily crustacean animals). Ecologically, the algae are the chief primary producers in lakes and form the base of the aquatic food chain. Zooplankton are the primary consumers of algae and are, in turn, preyed upon by many fish (Figure 10). Ecologically healthy lakes need healthy, balanced plankton populations.
Lake Lemon is characterized by relatively low to average plankton densities. In 2008, both Riddle Point and Reed Point samples were lower in May (early in the growing season) and higher in August (Table 8 and 9). The plankton densities significantly spiked at Reed Point during June reaching 17,072 N.U./L. Riddle Point achieved a plankton density of 4,036 N.U./L in August, while Reed Point decreased to 6,024 N.U./L. Typically, the plankton assemblage shifted towards a strongly dominant blue-green algae proportion by August. However, in 2008, blue-greens accounted for 54% of all plankton at Riddle and only 39.5% at Reed on August 6. Blue-green algae are less desirable in lakes because they: 1) may form extremely dense nuisance blooms; 2) may cause taste and odor problems; and 3) are unpalatable as food for many zooplankton grazers.
0.00
0.05
0.10
0.15
0.20
0.25
22-Apr 12-May 1-Jun 21-Jun 11-Jul 31-Jul 20-Aug
mg/
LMean Ammonia
Riddle
Reed
19
FIGURE 10. Generalized aquatic food chain. Tiny shrimp-like animals called zooplankton eat algae. Zooplankton, in turn, are eaten by small plankton-eating fish such as minnows, gizzard shad and young sunfish.

20
TABLE 8. Phytoplankton and Zooplankton Community for Lake Lemon at Riddle Point. 5/13/08 6/11/08 8/6/08 Species Classification Total # % Total # % Total # %
Blue-green Algae 647 29% 225 9% 2179 54.0% Green Algae 303 14% 1012 40% 335 8.3% Diatoms 757 34% 281 11% 34 0.8% Other Algae 317 14% 844 33% 1375 34.1% Rotifers 193 9% 112 4% 67 1.7% Zooplankton 6 0% 67 3% 46 1.1%
Total Number 2223 2541 4036 TABLE 9. Phytoplankton and Zooplankton Community for Lake Lemon at Reed Point. 5/13/08 6/11/08 8/6/08 Species Classification Total # % Total # % Total # %
Blue-green Algae 810 21% 107 1% 2380 39.5% Green Algae 529 14% 14570 85% 760 12.6% Diatoms 1092 28% 107 1% 1519 25.2% Other Algae 1057 27% 2242 13% 1165 19.3% Rotifers 388 10% 0 0% 152 2.5% Zooplankton 9 0% 46 0% 48 0.8%
Total Number 3885 17072 6024
Green algae typically decrease throughout the summer, having very low presence in the August sample. These algae, as a rule, make great food for the zooplankton, however the green algae cannot compete well with the blue-greens for resources (light, nutrients, carbon dioxide) necessary for continued growth in the summer. Green algae are usually outcompeted by blue-green algae. This year the June samples had very high numbers of green algae reaching 14,570 N.U./L at Reed Point. This is very likely due to the increased watershed inputs of nitrate. Blue-green algae usually have an advantage over other plankton tend to dominate reaching nuisance proportions. These competitive advantages include: 1) ability to regulate buoyancy and thus stay up in the light, 2) nitrogen fixation, and 3) more efficient use of nutrients. Dominant blue-green algae populations are typical of temperate lakes with high nutrient availability, especially from a large watershed that is predominately agriculture. However, with the increase nutrient inputs from the very rainy May and June, the green algae had enough nutrients to have a more dominant role in the algal community.

21
Diatoms typically have higher concentrations early in the sampling season, which falls closer to spring turnover. Diatom numbers increase with turnover because of the increased supply of available dissolved silica (Kalff and Watson, 1986). The diatom numbers generally decrease throughout the growing season, which could result from less available silica. The spring samples resulted in a different assemblage of plankton, with diatoms taking a high presence at Reed Point, averaging 31% of the total plankton assemblage. Diatoms densities did represent about 25% of the Reed August sample but decreased below 1% of the total plankton assemblage by August at Riddle. Plankton diversity typically decreases in Lake Lemon in regards to plankton groups throughout the summer. With the green algae and the multiple “other” plankton species maintaining a strong presence, the diversity does significantly change during 2008 (Table __). TABLE 10. Shannon-Weiner Diversity Index* for Riddle Point and Reed Point plankton assemblage, with higher values indicating increasing diversity. 5/13/08 6/11/06 8/6/08 Riddle Point 1.5 1.42 1.07 Reed Point 1.55 0.48 1.58 * Shannon-Weimer Diversity Index:
H '= −niN
ln niN∑
ni = number of individuals in species N = total number of all individuals
The low Secchi disk transparencies in Lake Lemon (1.05m dipping to 0.2m in June and 0.5m in August) are a reflection of the relatively high amount of suspended material (sediments, algae, etc.) in the water. June samples, which followed multiple heavy rain days, increased by an order of magnitude at both sites from 4.4 mg/L to 45.5 mg/L of total suspended solids (TSS) (Figure 11 and 12). Sources of suspended sediments to Lake Lemon include soils washed in from the watershed, resuspended lake sediments, and algal cells produced within the lake. The fine clays and silts of the sediments (Zogorski et al., 1986) can be suspended in the shallow east end of the lake by wind directed along the main west-east axis of the lake. In addition, turbulence from motorboats is capable of resuspending fine clay sediments from a depth exceeding ten feet (Yousef et al., 1978). All of these actions likely contribute to the poor clarity of Lake Lemon and of shallow lakes in general.
Chlorophyll a, which is a measure of the primary pigment in algae, is a direct measure of algal productivity. In the integrated samples from the surface to the 2-meter depth, the chlorophyll a concentrations ranged from 4.7 μg/L in May to 28.99 μg/L in August (Figure 11 and 12). Chlorophyll a concentrations >7 µg/L are indicative of eutrophic lake conditions.
Overall, we see a seasonal pattern of nutrient increase by late summer. This pattern is mirrored by increases in chlorophyll a concentrations (Figures 11 and 12). This suggests that conditions exist for promoting increased growth of algae. The increased total phosphorus concentrations could support this increased blue-green algal growth.

22
FIGURE 11. Seasonal changes in total phosphorus, total suspended solids, and chlorophyll a in the surface waters (epilimnion) at Riddle Point in Lake Lemon in 2008.
FIGURE 12. Seasonal changes in total phosphorus, total suspended solids, and chlorophyll a in the surface waters (epilimnion) at Reed Point in Lake Lemon in 2008.
0
0.01
0.02
0.03
0.04
0.05
0.06
0.07
0.08
0
10
20
30
40
50
60
4/22 5/12 6/1 6/21 7/11 7/31 8/20
TP
(mg/
L)
Chl
-a (u
g/L
), T
SS (m
g/L
)
Date
Seasonal Changes - Riddle Point Epilimnion
TSSChl aTP
0
0.01
0.02
0.03
0.04
0.05
0.06
0
10
20
30
40
50
60
4/22 5/12 6/1 6/21 7/11 7/31 8/20
TP
(mg/
L)
Chl
-a (u
g/L
), T
SS (m
g/L
)
Date
Seasonal Changes - Reed Point Epilimnion
TSS
Chl a
TP

23
COMPARISON WITH OTHER INDIANA LAKES Table 5 gives values of water quality parameters determined for 355 Indiana lakes during
July-August 1994-2006 by the Indiana Clean Lakes Program. This table can be used to compare values determined for Lake Lemon with other Indiana lakes. Table 5 shows that all of the Lake Lemon parameters, except NO3 and TKN, exceeded the median values for these 355 lakes. TABLE 11. July-August Water Quality Characteristics of 355 Indiana Lakes Sampled From 1994 thru 2006 by the Indiana Clean Lakes Program compared to Riddle Point of Lake Lemon (8/6/08). Means of epilimnion and hypolimnion samples were used for Lake Lemon. Secchi
Disk (m) NO3
(mg/L) NH4
(mg/L) TKN
(mg/L) TP
(mg/L) SRP
(mg/L) Chl. a (µg/L)
Median 1.7 0.037 0.07 1.101 0.058 0.01 4.11
Maximum 16 21.12 27.14 27.54 3.73 2.84 380.38
Minimum 0.1 0.013* 0.018* 0.230* 0.01* 0.01* 0.01
Mean Values for Riddle Pt. (8/6/08)
0.8 0.013* 0.218 1.078 0.072 0.032 28.99
* Method Detection Limit

24
STREAM RESULTS
Results from the Beanblossom Creek samples are given in Table 11. Stream values generally fell within the range of lake parameters. Two moderate flow samples were collected on 5/3/08 and 8/6/08.
Variation among the sample parameters was slight. Historically, most of the parameters
increased throughout the summer. The most significant change was the decrease in nitrate from 0.153 mg/L to our method detection limit of 0.013 mg/L. Fecal coliform bacteria decreased from 202 colinies per 100 mls, which exceeds state standards to 144 colonies per 100 mls. Fecal coliform bacteria results for all lake and stream sites are summarized in Table 12. Most of samples were below the state standard of 200 colonies per 100mls. The August Chitwood Fecal coliform levels increased to 1208 and 1682 colonies per 100mls (Chitwood #1 and Chitwood #2, respectively). TABLE 12. Water Quality Characteristics of Lake Lemon - Beanblossom Creek. Parameter Beanblossom Creek Beanblossom Creek
5/13/08 8/6/08 pH 7.5 7.7 Alkalinity 51 mg/L 98 mg/L Temperature 14.3 C 26.9 C Dissolved Oxygen 10.3 mg/L 9.35 mg/L Oxygen Saturation 100.3 % 116.0 % Conductivity 117.4 µmhos - Total Suspended Solids 7.0 mg/L 7.8 mg/L Fecal Coliform Bacteria 202 per 100mls 144 per 100mls Total Phosphorus 0.049 mg/L 0.045 mg/L Soluble Reactive Phos. 0.010* mg/L 0.010* mg/L Nitrate-Nitrogen 0.153 mg/L 0.013* mg/L Ammonia-Nitrogen 0.057 mg/L 0.022 mg/L Organic Nitrogen 0.150 mg/L 0.327 mg/L * Method Detection Limit TABLE 13. Fecal coliform bacteria summary for 2008 Lake Lemon samples. Fecal Coliform Bacteria (#/100mls)
Site 5/13/08 6/11/08 8/6/08
Riddle Point 20 32 40 Reed Point 350 48 84 Chitwood #1 124 1208 Chitwood #2 50 1682 Beanblossom Creek 202 144
25
TROPHIC STATE Introduction
The most widely used standard for assessing the condition of a lake is by considering its trophic state. The trophic state of a lake refers to its overall level of nutrition or biological productivity. Trophic categories include: oligotrophic, mesotrophic, eutrophic and hypereutrophic, with productivity increasing from oligotrophic to eutrophic. Some characteristics of these trophic states are:
Oligotrophic - clear water, dissolved oxygen is present in the hypolimnion (bottom waters), can support salmonid fisheries.
Mesotrophic - water less clear, decreasing dissolved oxygen in the hypolimnion, loss of salmonids.
Eutrophic - transparency less than two meters, no dissolved oxygen in hypolimnion during summer, weeds and algae abundant.
The changes in a lake from oligotrophy to a higher trophic state is called eutrophication.
Eutrophication is defined as the excessive addition of inorganic nutrients, organic matter and silt to lakes and reservoirs at rates sufficient to increase biological production and to lead to a decrease in lake volume. By this definition, high phosphorus alone does not make a lake eutrophic. The phosphorus levels must also cause an increase or potential increase in plant production and/or sedimentation. Trophic State Indices
The large amount of water quality data collected during lake water quality assessments can be confusing to evaluate. Because of this, Indiana and many other states use a trophic state index (TSI) to help evaluate water quality data. A TSI condenses water quality data into a single, numerical index. Different index (or eutrophy) points are assigned for various water quality concentrations. The index total, or TSI, is the sum of individual eutrophy points for a lake.
The most widely used and accepted TSI is one developed by Bob Carlson (1977) called
the Carlson TSI (Figure 9). Carlson analyzed total phosphorus, chlorophyll a, and Secchi disk transparency data for numerous lakes and found statistically significant relationships among the three parameters. He developed mathematical equations for these relationships and these for the basis for the Carlson TSI. Using this index, a TSI value can be generated by one of three measurements: Secchi disk transparency, chlorophyll a or total phosphorus. Data for one parameter can also be used to predict a value for another. The TSI values range from 0 to 100. Each major TSI division (10, 20, 30, etc.) represents a doubling in algal biomass.

26
CARLSON'S TROPHIC STATE INDEX Oligotrophic Mesotrophic Eutrophic Hypereutrophic 20 25 30 35 40 45 50 55 60 65 70 75 80 Trophic State Index └────┴────┴────┴────┴────┴────┴────┴────┴────┴────┴────┴────┘ 15 10 8 7 6 5 4 3 2 1.5 1 0.5 0.3 Transparency (Meters) └─┴────┴──┴─┴─┴──┴───┴───┴─────┴───┴────┴───────┴──────┴────┘ 0.5 1 2 3 4 5 7 10 15 20 30 40 60 80 100 150 Chlorophyll a (ug/L or PPB) └───┴─────┴─────┴────┴──┴─┴───┴───┴──┴──┴───┴──┴───┴──┴─┴───┘ Total 3 5 7 10 15 20 25 30 40 50 60 80 100 150 Phosphorus (ug/L or PPB) └┴─────┴────┴────┴────┴───┴───┴──┴───┴──┴──┴───┴────┴────┴──┘
FIGURE 13. Carlson's trophic state index. Trophic State Scores
Using Carlson’s TSI for the May, June, and August data, Lake Lemon was hypereutrophic for most parameters (Table 13). The earlier May and June TSI scores are shifted towards mesotrophic and eutrophic conditions. All the parameters have maintained the high trophic scoring or have become shifted higher since 2007, particularly during June.
TABLE 14. Summary of Trophic State Index Scores Using Mean 2008 Water Quality Data for Riddle/Reed Points. DATE
Carlson’s
Secchi Disk TSI
Carlson’s
Total Phosphorus TSI
Carlson’s
Chlorophyll TSI
May 61/67 48/56 47/47 Eutrophic/Hypereutrophic Mesotrophic/Eutrophic Mesotrophic
June 77/77 72/74 46/50 Hypereutrophic Hypereutrophic Mesotrophic/Eutrophic
August
63/68 66/61 64/64 Hypereutrophic Hypereutrophic/Eutrophic Hypereutrophic

27
TROPHIC STATE TRENDS Using Riddle Point Carlson TSI scores to look at the historic trend for Lake Lemon shows that the lake generally scores between eutrophic and hypereutrophic. Figures 14-16 illustrate the Carlson TSI historic trends for Secchi disk, total phosphorus, and chlorophyll. Overall, a pattern is seen within the seasonal variation with the late spring months scoring significantly lower (less eutrophic) while increasing during the late summer months to a hypereutrophic status (Secchi TSI: P≤0.034; TP: P≤0.002; Chl-a TSI: P≤0.0004). Chlorophyll a samples for 2005 – 2008 (Figure 16) were generally below the 10-year mean. We cannot conclude that Lake Lemon is producing less algae but the lower chlorophyll a concentrations are certainly a good sign. Despite the less eutrophic conditions early in the season, the decade average for all three parameters maintain at least a eutrophic score. As noted previously, the June flooding shifted the seasonal trends, which is seen by uncharacteristic spikes in total phosphorus and decreased secchi disk transparency (Figures 14 and 15).
FIGURE 14. The 11 year historic trend for Carlson Secchi disk TSI scores. All but three August samples, shown in gray, scored above the mean for eutrophic status. The dashed line illustrates the 11 year mean. The dotted line illustrates eutrophic status for the Carlson TSI.
0
10
20
30
40
50
60
70
80
90
Car
lson
TSI
Carlson Secchi Disk TSI Historic Trend
28
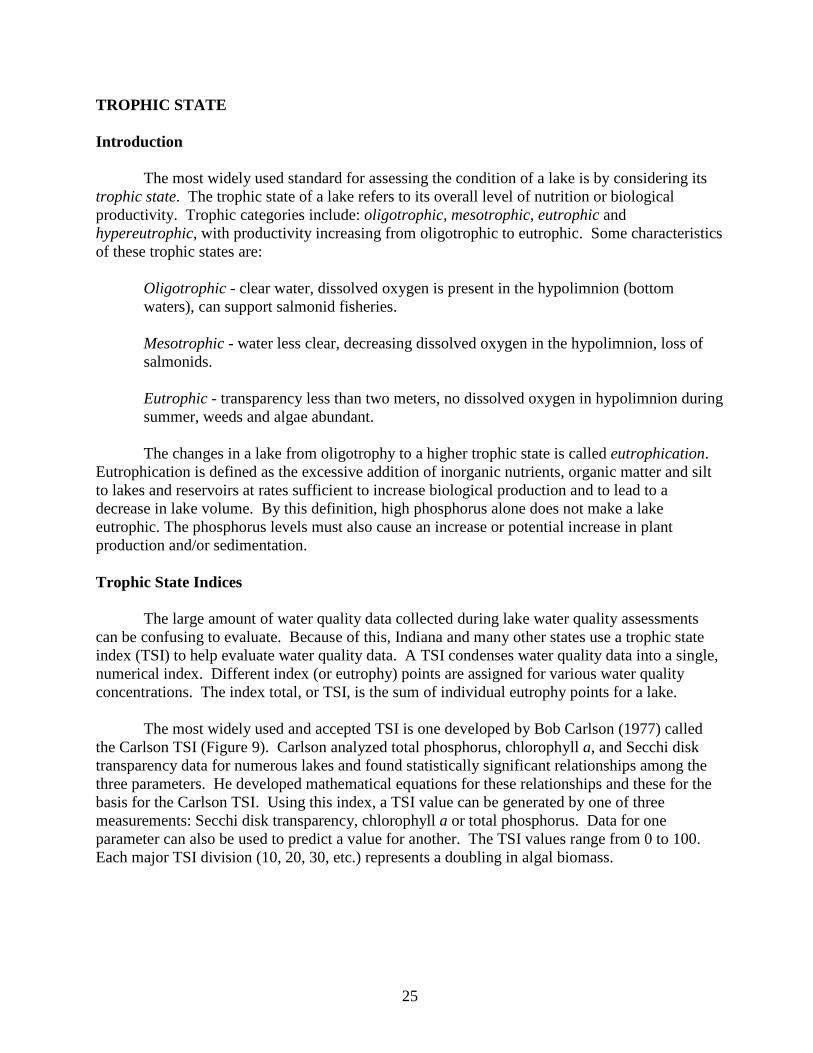
FIGURE 15. The 11 year historic trend for Carlson total phosphorus TSI scores. All August samples, shown in gray, score above the mean for eutrophic status. The dashed line illustrates the 11 year mean. The dotted line illustrates eutrophic status for the Carlson TSI.
FIGURE 16. The 11 year historic trend for Carlson chlorophyll -a TSI scores. All August samples, shown in gray, except one score above the mean for eutrophic status. Both the 11 year mean and the Carlson TSI eutrophic status score a 50 (dotted line).
0
10
20
30
40
50
60
70
80
90C
arls
on T
SICarlson TP TSI Historic Trend
0
10
20
30
40
50
60
70
80
Car
lson
TSI
Carlson Chl-a TSI Historic Trend

29
WATER QUALITY TRENDS
Compiled Secchi disk transparency data from volunteer monitors and SPEA monitoring studies over the past 17 years are shown in Figure 17. There is no apparent long-term trend in transparency except that August samples are generally much lower in transparency. All measures of record would be considered indicative of eutrophic conditions.
Total phosphorus (TP) concentrations are quite variable over the past eighteen years at
Lake Lemon’s Riddle Point sampling site (Figure 18). There is little visible long-term trend. Most of the values were above the eutrophic threshold of 30 µg/L. All but two August samples are above this threshold.
FIGURE 17. Historic Secchi disk transparency data for Lake Lemon. All data are less than the general eutrophic indicator of 2 meters. Gray markers indicate August samples.
Epilimnetic total phosphorus concentrations at Riddle Point are mostly in the eutrophic range but the resulting chlorophyll a concentrations (Figure 19) do not always reach the eutrophic range of greater than 7 µg/L; however, the majority of the August chlorophyll a samples over the fifteen years do fall above the eutrophic classification. This increase is especially evident over the past six years (Figure 19).
0.0
0.5
1.0
1.5
2.0
2.5
Tra
nspa
renc
y (m
)
Secchi Disk Transparency Trend - Riddle Point
Eutrophic

30
FIGURE 18. Historic epilimnetic total phosphorus trend for Lake Lemon. Most concentrations are higher than 0.030 mg/L, the level generally considered high enough to support eutrophic conditions. Gray markers indicate August samples.
FIGURE 19. Historic chlorophyll a data for Lake Lemon. Gray markers indicate August.
0.00
0.05
0.10
0.15
0.20
0.25
0.30
Con
cent
ratio
n (m
g/L
)Total Phosphorus Trend - Riddle Point
Eutrophic
05
1015202530354045505560
Con
cent
ratio
n (u
g/L
)
Chlorophyll a Trends - Riddle Point
Eutrophic

31
CONCLUSIONS
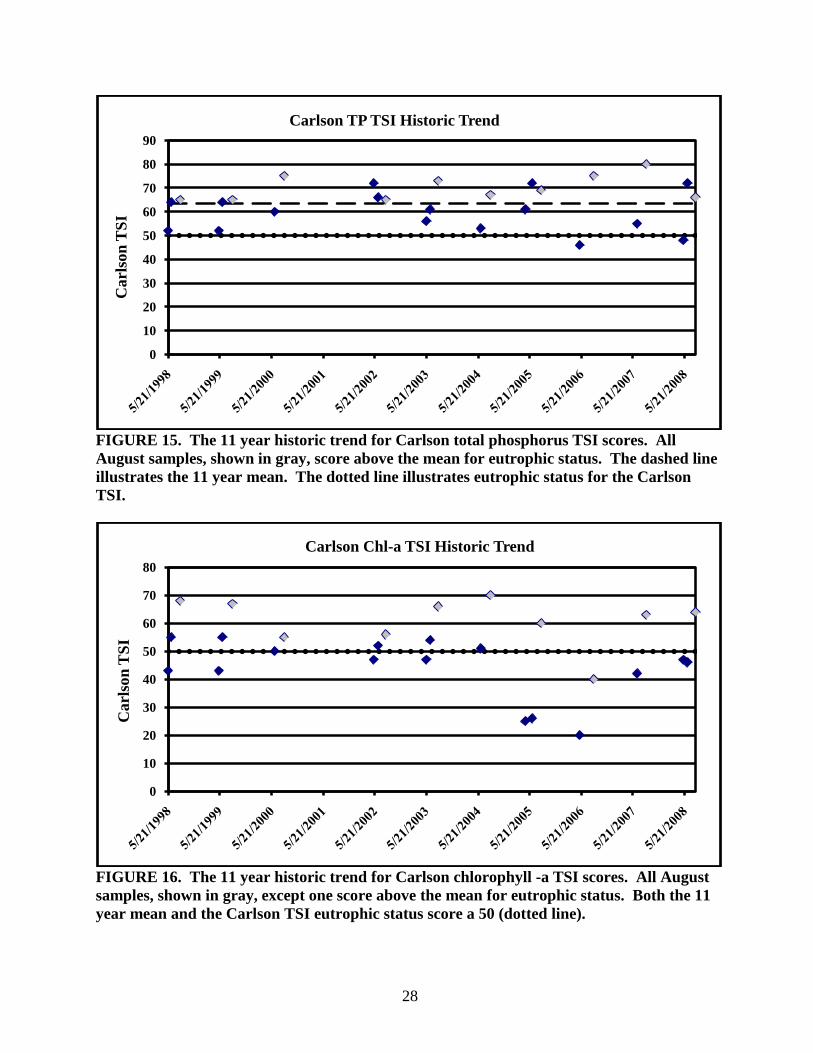
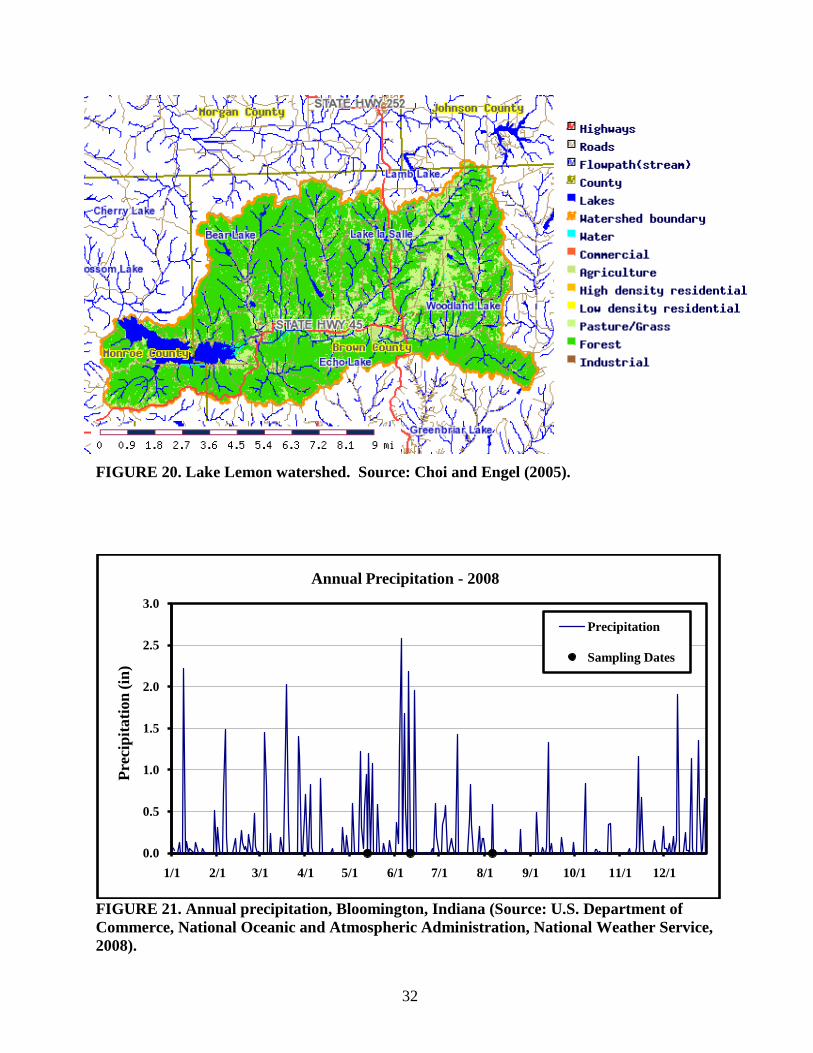
The water characteristics of Lake Lemon are highly variable due, in large part, to runoff from the very large watershed that can replace the entire lake volume in a relatively short time (Figure 20). This causes difficulties in monitoring because the water conditions at any particular time depend on several immeasurable variables, including: time since the last major storm and the intensity and duration of that storm (Figure 21). This is particularly evident during June with the unusually heavy rains and flood events. While these variables affect other Indiana lakes and reservoirs, they have a much greater influence at Lake Lemon because of its very large watershed. Lake Lemon suffers from seasonally high levels of phosphorus, suspended sediments and fecal coliform bacteria, and relatively low Secchi disk transparency throughout the year. Current water conditions unquestionably place the lake into the ‘eutrophic’ or over-productive trophic category. Eutrophic lakes produce more algae and rooted plants than the bacteria and microbes can decompose annually. As a result, decaying organic matter accumulates on the sediments where it contributes to low dissolved oxygen levels and decreased lake volume.
The delivery of eroded watershed soils to the lake has created bars and shallow water
depths in the eastern end of the lake. In addition to posing navigation problems, sediment accumulations provide more potential habitat for rooted aquatic plants. The abundant shallow water and freshly deposited sediments in Lake Lemon provide ideal conditions for the growth of rooted plants. As a result, there is an abundance of rooted plants in the lake. These rooted aquatic plants then provide additional hydraulic resistance encouraging sedimentation, which exacerbates the siltation in the eastern end of the lake.
Sedimentation and its consequences are likely the most pervasive problems currently
facing Lake Lemon. The LLCD has initiated a dredging program at Lake Lemon. Dredging, along with controlling the watershed sources of sediment delivery, are the most needed lake management activities currently at the lake.
While Lake Lemon continues to face watershed and lake challenges ranging from eutrophic water conditions that peak towards the end of the summer season to watershed land uses, there has been no significant change over the last 10 years. Key eutrophy parameters (total phosphorus, chl-a, secchi disk transparency) have produced similar yearly results. While Lake Lemon’s eutrophy status has not decreased, it also has not deteriorated.
32
FIGURE 20. Lake Lemon watershed. Source: Choi and Engel (2005).
FIGURE 21. Annual precipitation, Bloomington, Indiana (Source: U.S. Department of Commerce, National Oceanic and Atmospheric Administration, National Weather Service, 2008).
0.0
0.5
1.0
1.5
2.0
2.5
3.0
1/1 2/1 3/1 4/1 5/1 6/1 7/1 8/1 9/1 10/1 11/1 12/1
Prec
ipita
tion
(in)
Annual Precipitation - 2008
Precipitation
Sampling Dates

33
REFERENCES APHA et al. 2005. Standard Methods for the Examination of Water and Wastewater,
21th edition. American Public Health Association, Washington, D.C. Carlson, R.E. 1977. A trophic state index for lakes. Limnology and Oceanography,
22(2): 361-369. Choi, Jin-Yong and Bernard A. Engel. 2005. Watershed Delineation – Watershed Generation
website. URL: http://pasture.ecn.purdue.edu/~jychoi/wd_home/ Agricultural & Biological Engineering Department, Purdue University, West Lafayette, IN.
Correll, David L. 1998. The role of phosphorus in the eutrophication of receiving
waters: a review. J. Environ. Qual., 27(2):261-266. IDEM. 1976. Indiana Lake Classification System and Management Plan. Stream
Pollution Control Board, Indianapolis, Indiana. IDEM. 1986. Indiana Lake Classification System and Management Plan. Department
of Environmental Management, Indianapolis, Indiana. Jones, W.W. and L. Clemency. 1992. Lake Lemon Enhancement Study. School of
Public and Environmental Affairs, Indiana University, Bloomington, Indiana. Jones, W.W., M.A. Pfister, R. Harris, P. Felling and M. Lincoln. 1992. Indiana
Volunteer Lake Monitoring Results for 1990 and 1991. Office of Water Management, Indiana Department of Environmental Management, Indianapolis, Indiana.
Jones, W.W., C. Czarnecki, J. Joerke, and R. Price. 1994. Indiana Volunteer Lake
Monitoring Results for 1992 and 1993. Office of Water Management, Indiana Department of Environmental Management, Indianapolis, Indiana
Jones, W.W. 1996. Indiana Lake Water Quality Update for 1989 - 1993. Clean Lakes
Program, Indiana Department of Environmental Management, Indianapolis, IN, 58pp. Jones, W.W. and seven others. 1997. Lake Monroe Diagnostic and Feasibility Study.
School of Public and Environmental Affairs, Indiana University, Bloomington, IN, 324pp. Jones, W.W. and five others. 1998. Lake Lemon Monitoring Program, 1998 Results. School of Public and Environmental Affairs, Indiana University, Bloomington, IN. Jones, W.W. and Melissa Clark. 1999. Lake Lemon Monitoring Program, 1999 Results. School of Public and Environmental Affairs, Indiana University, Bloomington, IN. Kalff, J. and S. Watson. 1986. Phytoplnakton and its dynamics in two tropical lakes: a tropical
and temperate zone comparison. Hydrobiologia, 138:161-176.

34
Ohio EPA. 1999. Association between nutrients, habitat, and the aquatic biota in Ohio
rivers and streams. Ohio EPA Technical Bulletin MAS/1999-1-1, Columbus. Prescott, G.W. 1982. Algae of the Western Great Lakes Area. Otto Koeltz Science Publishers,
West Germany. U.S. Department of Commerce. 2007. National Climatic Data Center. URL:
www.ncdc.noaa.gov/oa/ncdc.html . Walker, R.D. 1978. Task force on Agricultural Nonpoint Sources of Pollution Subcommittee on
soil Erosion and Sedimentation. Illinois Institute for Enbironmental Qaulity, 72pp. Ward, H.B. and G.C. Whipple. 1959. Freshwater Biology, Second Edition. W.T.
Edmondson, editor. John Wiley & Sons, Inc., New York. Wehr, J.D. and R.G. Sheath. 2003. Freshwater ALgae of North America, Ecology and Classification. Academic Press, San Diego. Whitford, L.A. and G.J. Schumacher. 1984. A Manual of Fresh-Water Algae.
Sparks Press, Raleigh, N.C. Yousef, Y.A. et. al. 1978. Mixing effects due to boating activities in shallow lakes. Draft
Report to OWRT, U.S. Dep. Inter. Tech. Rep. ESEI 78-10, Washington, D.C. Zogorski, J.S., W.W. Jones and others. 1986. Lake Lemon Diagnostic/Feasibility
Study. ESAC-86-02. School of Public and Environmental Affairs, Indiana University, Bloomington, Indiana.