2008 Juvenile Court Statistics Report
36
Division of Youth Services 2008 Juvenile Court Statistics Report
Transcript of 2008 Juvenile Court Statistics Report

Division of Youth Services
2008 Juvenile CourtStatistics Report
MISSOURI JUVENILE COURT
ANNUAL REPORT
CALENDAR YEAR 2008
Missouri Department of Social ServicesP. O. Box 1527
221 West High StreetJefferson City, MO 65102-1527
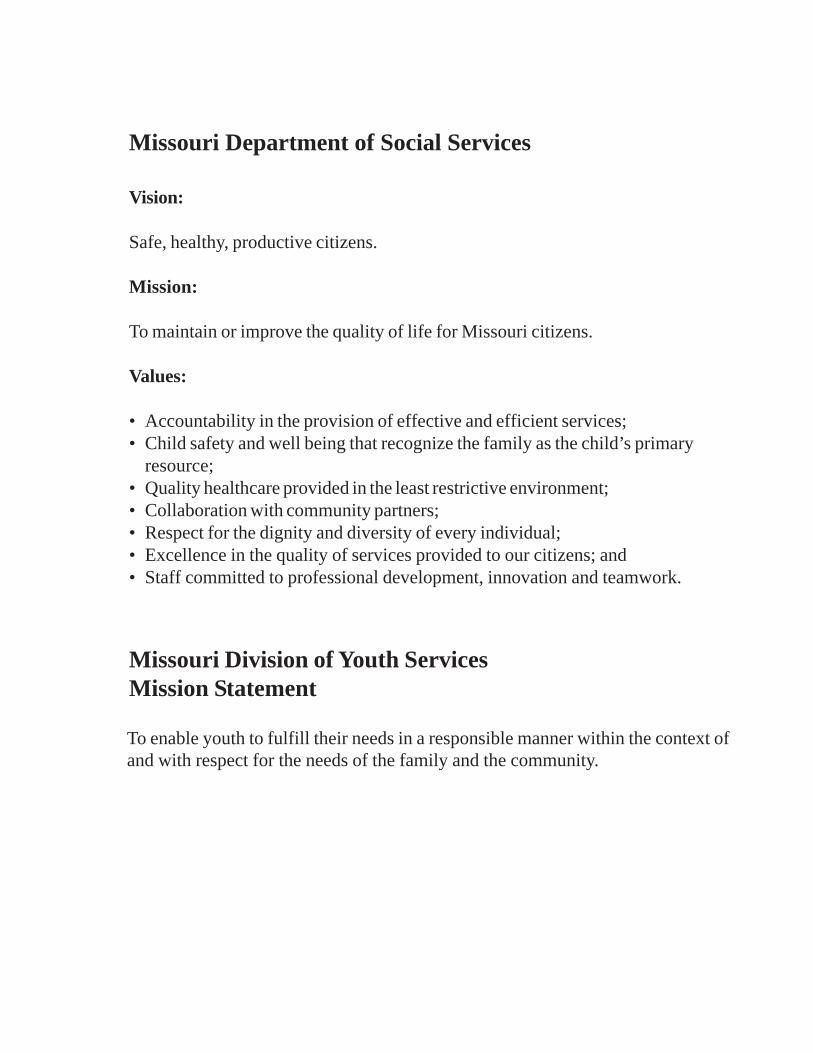
Missouri Department of Social Services
Vision:
Safe, healthy, productive citizens.
Mission:
To maintain or improve the quality of life for Missouri citizens.
Values:
• Accountability in the provision of effective and efficient services;• Child safety and well being that recognize the family as the child’s primary
resource;• Quality healthcare provided in the least restrictive environment;• Collaboration with community partners;• Respect for the dignity and diversity of every individual;• Excellence in the quality of services provided to our citizens; and• Staff committed to professional development, innovation and teamwork.
Missouri Division of Youth ServicesMission Statement
To enable youth to fulfill their needs in a responsible manner within the context ofand with respect for the needs of the family and the community.

DIVISION OF YOUTH SERVICES
TIM DECKER, DIRECTOR
P.O. BOX 447 • JEFFERSON CITY, MO 65102-0447 WWW.DSS.MO.GOV • 573-751-3324 • 573-526-4494 FAX
RELAY MISSOURI FOR HEARING AND SPEECH IMPAIRED
1-800-735-2466 VOICE • 1-800-735-2966 TEXT PHONE An Equal Opportunity Employer, services provided on a nondiscriminatory basis.
JEREMIAH W. (JAY) NIXON, GOVERNOR • RONALD J. LEVY, DIRECTOR
Dear Reader: The Missouri Division of Youth Services (DYS) is pleased to present the 2008 Missouri Juvenile Court Annual Report. This is the sixty-fourth annual juvenile court report, providing pertinent statistics regarding the number and characteristics of referrals made to Missouri’s juvenile courts. We extend our appreciation to the Governor, Missouri Legislature, Department of Social Services and Juvenile Courts throughout the state for their cooperation in this project. Thanks are also due to the Research and Evaluation Unit for helping collect and assemble the data included in this report. Very truly yours, (Original document signed by) Tim Decker Director
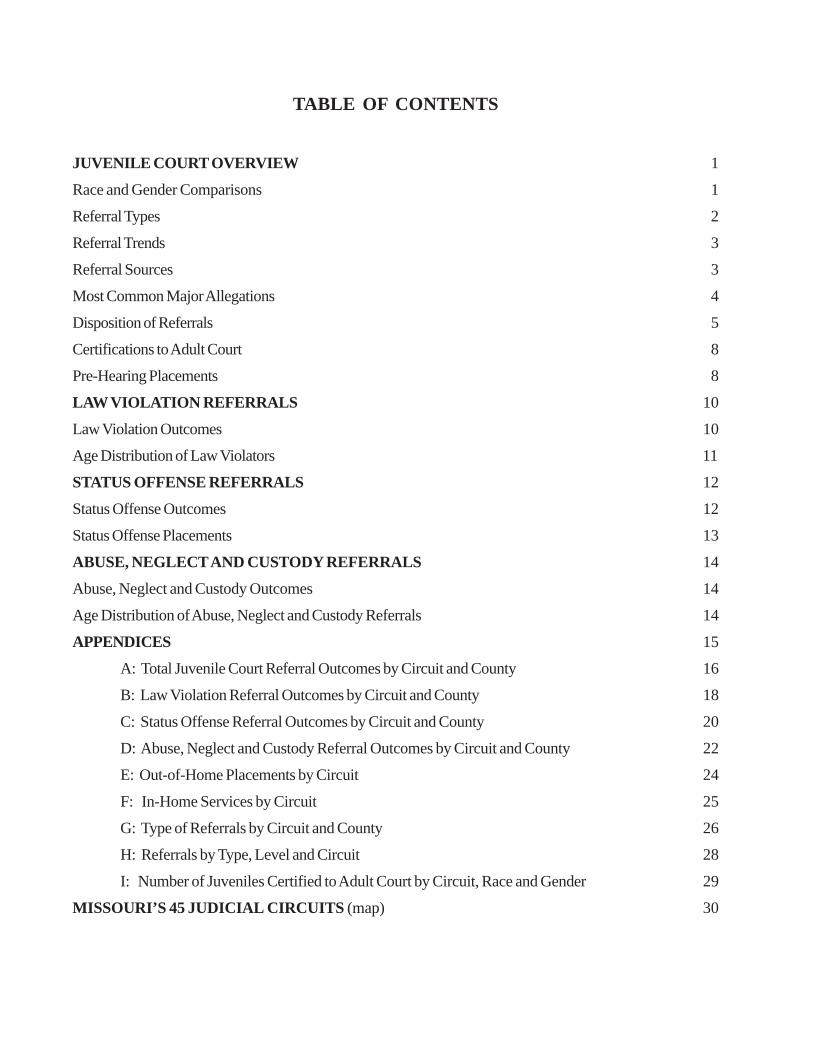
TABLE OF CONTENTS
JUVENILE COURT OVERVIEW 1
Race and Gender Comparisons 1
Referral Types 2
Referral Trends 3
Referral Sources 3
Most Common Major Allegations 4
Disposition of Referrals 5
Certifications to Adult Court 8
Pre-Hearing Placements 8
LAW VIOLATION REFERRALS 10
Law Violation Outcomes 10
Age Distribution of Law Violators 11
STATUS OFFENSE REFERRALS 12
Status Offense Outcomes 12
Status Offense Placements 13
ABUSE, NEGLECT AND CUSTODY REFERRALS 14
Abuse, Neglect and Custody Outcomes 14
Age Distribution of Abuse, Neglect and Custody Referrals 14
APPENDICES 15
A: Total Juvenile Court Referral Outcomes by Circuit and County 16
B: Law Violation Referral Outcomes by Circuit and County 18
C: Status Offense Referral Outcomes by Circuit and County 20
D: Abuse, Neglect and Custody Referral Outcomes by Circuit and County 22
E: Out-of-Home Placements by Circuit 24
F: In-Home Services by Circuit 25
G: Type of Referrals by Circuit and County 26
H: Referrals by Type, Level and Circuit 28
I: Number of Juveniles Certified to Adult Court by Circuit, Race and Gender 29
MISSOURI’S 45 JUDICIAL CIRCUITS (map) 30

CHARTS AND TABLES
Table 1. Annual Referrals 1
Chart 1. Total Referrals by Race and Gender 1
Table 2. Juvenile Court Referral Statistics: 1999-2008 2
Chart 2. Trend of Referrals 3
Table 3. Referral Source 3
Chart 3. Most Common Major Allegation: Male 4
Chart 4. Most Common Major Allegation: Female 4
Chart 5. Disposition of Referrals 6
Chart 6. Outcomes of Formally Disposed Referrals 6
Chart 7. Outcomes of Informally Disposed Referrals 6
Chart 8. Out-of-Home Placements 7
Chart 9. In-Home Service Providers 7
Table 4. Referrals Certified to Adult Court - Age by Race 8
Table 5. Pre-Hearing Placements by Referral Type and Gender 8
Chart 10. Non-Secure Pre-Hearing Placements: Type of Facility 8
Chart 11. Non-Secure Pre-Hearing Placements: Operator of Facility 9
Chart 12. Outcomes of Law Violation Referrals 10
Table 6. Law Violation Referrals by Allegation and Age 11
Chart 13. Outcomes of Status Offense Referrals 12
Chart 14. Status Offense Referrals by Gender 12
Table 7. Pre-Hearing Placements: Status Offense Referrals 13
Table 8. Out-of-Home Placements: Status Offense Referrals 13
Table 9. Abuse, Neglect and Custody Referrals by Category 14
Chart 15. Outcomes of Abuse, Neglect and Custody Referrals 14
Table 10. Age Group of Victim 14

Missouri Juvenile Court2008 Annual Report
1
Year Referrals2004 75,4082005 72,0332006 71,0272007 69,3852008 68,464
Table 1. Annual Referrals
28,747
13,319
838
715
17,105
6,900
424
416
0 10,000 20,000 30,000 40,000 50,000
Caucasian
African-American
Hispanic
Other
Referrals
Chart 1. Total Referrals in 2008by Race and Gender
Female
Male
JUVENILE COURT OVERVIEW
This report is the sixty-fourth in a series of juvenile court statistics, and the thirtieth published under the directionof the Division of Youth Services (DYS) and the Department of Social Services’ Research and Evaluation Unit,as mandated by Section 219.036.4, RSMo. This report presents the summary statistics of Missouri’s juvenilecourt system for calendar year 2008.
The numbers presented in this report are not individual children, but separately disposed court referrals. Areferral is defined as “any action involving a juvenile which results in a determination, finding, or outcome anda written record maintained in the juvenile’s name.” A disposed referral is one which has resulted in a “finding”or “outcome.”
Examples of findings and outcomes include the following: Court Adjudication, Informal Adjustment, Transferto Other Court, and Rejection of Referral.
Throughout this report, the term “referral” means “disposed referral.”
In calendar year 2008, Missouri’s 45 juvenile courts disposed 68,464 referrals. This is a 9% decrease from75,408 in 2004 and a 1% decrease from 2007 alone.
NOTE: The number of children represented by these referrals can not beaccurately reported due to inconsistencies in identification systems fromcircuit to circuit. Therefore, an unduplicated statewide count of individualchildren is not available.
Race and Gender Comparisons
Chart 1 shows the gender and racial breakdown of all referrals in 2008. Males made up the larger portion in eachracial grouping. Overall, males made up 64% of all referrals, while females made up 36%. Caucasian youthcomprised 67% of the referral population, African-American youth comprised 30%, and 3% of referrals were ofother races or unknown.

Missouri Juvenile Court2008 Annual Report
2
Abuse, CourtLaw Neglect, Order Municipal, Status
Year Violation Custody Violation* Juvenile** Offense*** Total1999 49,323 13,696 835 24,570 88,4242000 46,291 14,843 1,048 22,728 84,9102001 45,942 17,483 1,124 2,814 19,977 87,3402002 42,793 15,949 1,147 2,189 18,303 80,3812003 40,922 15,261 940 2,132 17,672 76,9272004 41,249 14,523 855 1,878 16,903 75,4082005 38,937 13,598 1,043 2,232 16,223 72,0332006 39,496 11,890 1,376 2,179 16,086 71,0272007 37,249 12,713 1,239 1,999 16,185 69,3852008 36,774 12,957 1,296 2,017 15,420 68,464
Table 2. Juvenile Court Referral Statis tics : 1999 - 2008
Referral Types
Referrals to Missouri’s juvenile courts break down into five categories:
Law Violations:
Status Violations:
Abuse, Neglect, Custody:(A/N/C)
Court Order Violations:
Acts which would be in violation of the Missouri Criminal Codeif they were committed by an adult.
Acts which are violations only if committed by a juvenile. Theseinclude such infractions as truancy and running away from home.
Reports of Missouri children who were victims of abuse or ne-glect, and children involved in custody disputes, transfers, or ter-minations of parental rights.
Reported referrals of violations of court orders.
Referrals for juvenile municipal violations, such as smoking in apublic place and curfew violations. Prior to 2001, these referralswere reported in the Status and Administrative categories.
Table 2 shows the breakdown of all referrals into the appropriate referral categories over the past ten years. Asin the past, the Law Violation category contained the most referrals, at 54%.
Municipal, Juvenile:
*
**
***
The definition for Court Order Violation changed in 2001. It was previously called the Administrativecategory and consisted of court order violations and miscellaneous municipal juvenile charges.
The Municipal, Juvenile category is effective with 2001 reporting. See above definition.
The definition for Status Offense reporting changed in 1994 to include curfew violations and changedagain in 2001 to remove curfew violations, which are now tracked in the Municipal, Juvenile category.
Missouri Juvenile Court2008 Annual Report
3
ReferralsLaw Enforcement Municipal Police 35,875 County Sheriff 5,460 Other Law Enforcement 690 Highway Patrol 289Children's Divis ion 9,191School 8,533Juvenile Court Personnel 3,254Parent 2,353Other Juvenile Court 627Social Agency - Public 256Social Agency - Private 203Relative, Other than Parent 203Victim or Self-Referral 108Department of Mental Health 33Other 853Miscode 536Total 68,464
2008Table 3. Referral Source
0
20,000
40,000
60,00019
99
2000
2001
2002
2003
2004
2005
2006
2007
2008
Year
Chart 2. Trend of Referrals
A/N/C
Law Violation
Status Offense
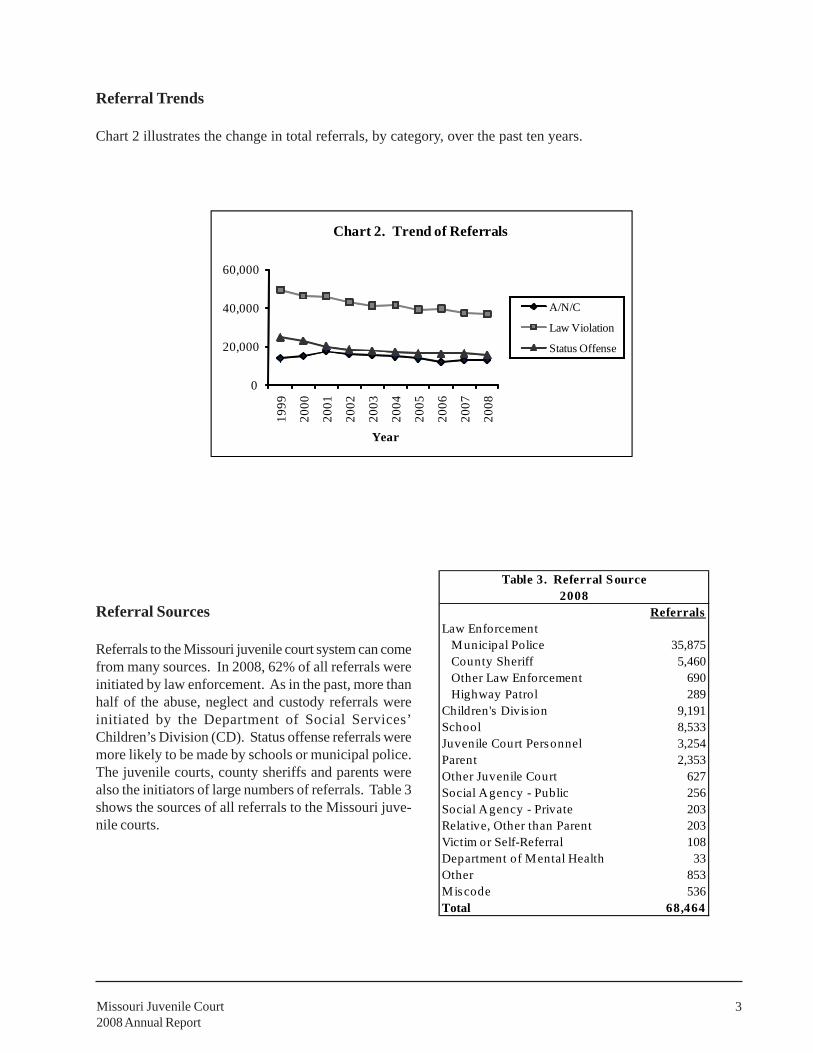
Referral Trends
Chart 2 illustrates the change in total referrals, by category, over the past ten years.
Referral Sources
Referrals to the Missouri juvenile court system can comefrom many sources. In 2008, 62% of all referrals wereinitiated by law enforcement. As in the past, more thanhalf of the abuse, neglect and custody referrals wereinitiated by the Department of Social Services’Children’s Division (CD). Status offense referrals weremore likely to be made by schools or municipal police.The juvenile courts, county sheriffs and parents werealso the initiators of large numbers of referrals. Table 3shows the sources of all referrals to the Missouri juve-nile courts.
Missouri Juvenile Court2008 Annual Report
4
6,805 6,552
3,5172,647
907 702 660 639 6241,792
0
2,000
4,000
6,000
8,000
10,000
Stat
us
A/N
/C
Stea
ling
Ass
ault
Peac
e D
istu
rban
ce
Liq
uor L
aws
Vio
latio
n
Mun
icip
al,
Juve
nile
Dan
gero
us
Dru
gs
Prop
erty
D
amag
e
* A
ll O
ther
s
Chart 4. Most Common Major Allegation in 2008: Female
8,615
6,4055,671
4,6193,665
2,050 1,732 1,559 1,357
7,946
0
2,000
4,000
6,000
8,000
10,000
Stat
us
A/N
/C
Ass
ault
Stea
ling
Prop
erty
D
amag
e
Dan
gero
us
Dru
gs
Peac
e D
istu
rban
ce
Bur
glar
y
Mun
icip
al,
Juve
nile
* A
ll O
ther
s
Chart 3. Most Common Major Allegation in 2008: Male
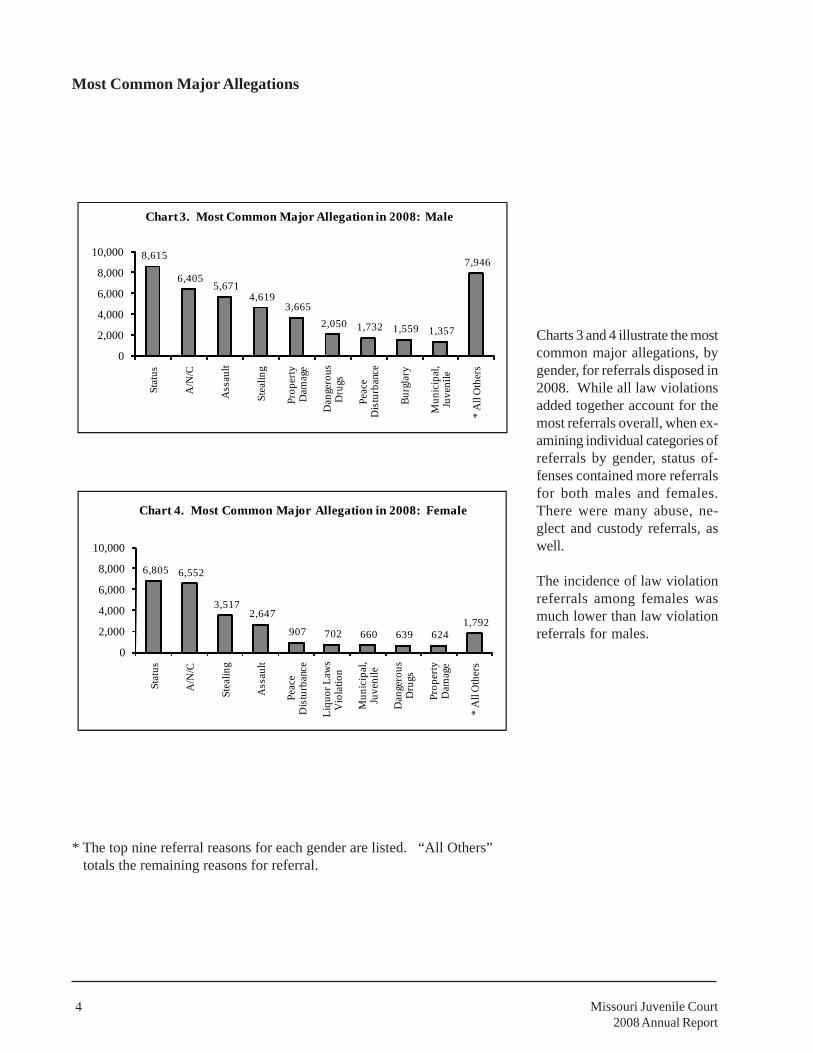
Most Common Major Allegations
Charts 3 and 4 illustrate the mostcommon major allegations, bygender, for referrals disposed in2008. While all law violationsadded together account for themost referrals overall, when ex-amining individual categories ofreferrals by gender, status of-fenses contained more referralsfor both males and females.There were many abuse, ne-glect and custody referrals, aswell.
The incidence of law violationreferrals among females wasmuch lower than law violationreferrals for males.
* The top nine referral reasons for each gender are listed. “All Others” totals the remaining reasons for referral.
Missouri Juvenile Court2008 Annual Report
5
Disposition of Referrals
After a youth has been referred to a juvenile court, a formal judgment or informal decision is made about how tohandle the case. The possible determinations or outcomes fall into two categories: (1) those that are handledformally with a petition to the court, and (2) those that are informally adjusted outside of the court.
The formal dispositions are:
True, Out-of-Home:
True, In-Home:
True, No Services:
Not True:
Motion to Dismiss:
Dismiss for Certification:
The informal dispositions are:
Adjust without Supervision:
Adjust with Supervision:
Adjust - No Action:
Transfer to Other Juvenile Court:
Transfer to Other Agency:
Referral Rejected:
The allegation is found to be true and the youth is placed out ofhis or her home. The placement may be with the Division ofYouth Services, a foster home, a relative, or some other agency.
The allegation is found to be true and the youth receives ser-vices in his or her own home.
The allegation is found to be true, but the youth receives no ser-vices.
The allegation is found to be not true.
The court sustains a motion to dismiss and the case is closed.
The court sustains a motion to dismiss and the case is trans-ferred to an adult criminal court to be processed under the crimi-nal code.
No more than one face-to-face contact is made between courtpersonnel and the juvenile. This usually results in the giving ofadvice, counsel or a verbal warning.
Either a verbal or written agreement is made to put the juvenileunder court supervision. This usually includes some sort of res-titution or community service.
No action is taken by the juvenile officer other than the collec-tion of information.
Jurisdiction over the juvenile is transferred to another juvenilecourt for disposition.
The youth’s case record is turned over to another agency fordisposition.
No reason is found to sustain the referral.
Missouri Juvenile Court2008 Annual Report
6
15,523
52,310
Formal (23%)
Informal (77%)
4,008
4,145
9,936
10,044
11,864
12,313
0 5,000 10,000 15,000 20,000
Other Juv. Ct.
Other Agency
Rejected
W/ Supervision
No Action
W/O Supervision
Chart 7. Outcomes of Informally Disposed Referralsin 2008
97
567
739
1,534
5,814
6,772
0 2,000 4,000 6,000 8,000 10,000 12,000
Certification
True, No Services
Not True
Dismissed
True, In-Home
True, Out-of-Home
Chart 6. Outcomes of Formally Disposed Referralsin 2008
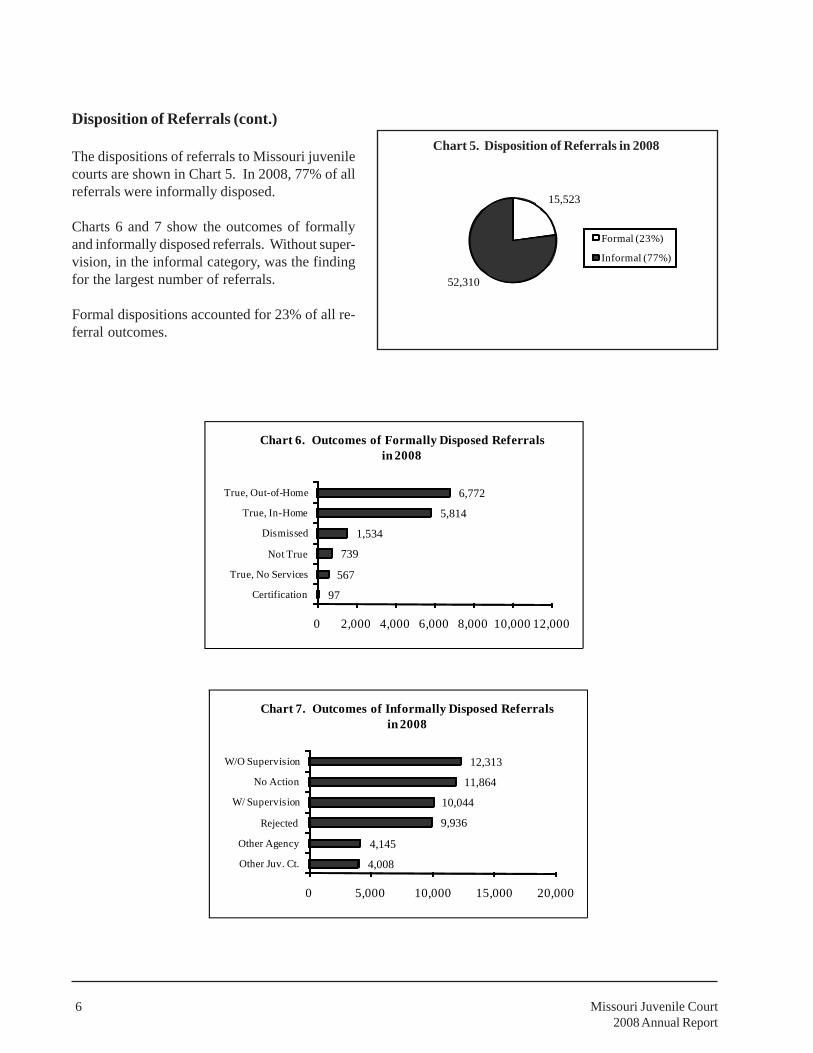
Disposition of Referrals (cont.)
The dispositions of referrals to Missouri juvenilecourts are shown in Chart 5. In 2008, 77% of allreferrals were informally disposed.
Charts 6 and 7 show the outcomes of formallyand informally disposed referrals. Without super-vision, in the informal category, was the findingfor the largest number of referrals.
Formal dispositions accounted for 23% of all re-ferral outcomes.
Chart 5. Disposition of Referrals in 2008
Missouri Juvenile Court2008 Annual Report
7
9
113
246
645
656
1,009
10,545
0 2,000 4,000 6,000 8,000 10,000 12,000
DYS (<1%)
DMH (1%)
Public Agency (2%)
Other (5%)
Private Agency (5%)
CD (8%)
Court Supervision (80%)
Chart 9. In-Home Service Providers in 2008
13
81
105
126
184
666
1,143
2,944
0 1,000 2,000 3,000 4,000 5,000 6,000 7,000
DMH (<1%)
Private Agency (2%)
Public Agency (2%)
Court Res. Care (2%)
Other (3%)
Other Relative (13%)
DYS (22%)
CD (56%)
Chart 8. Out-of-Home Placements in 2008
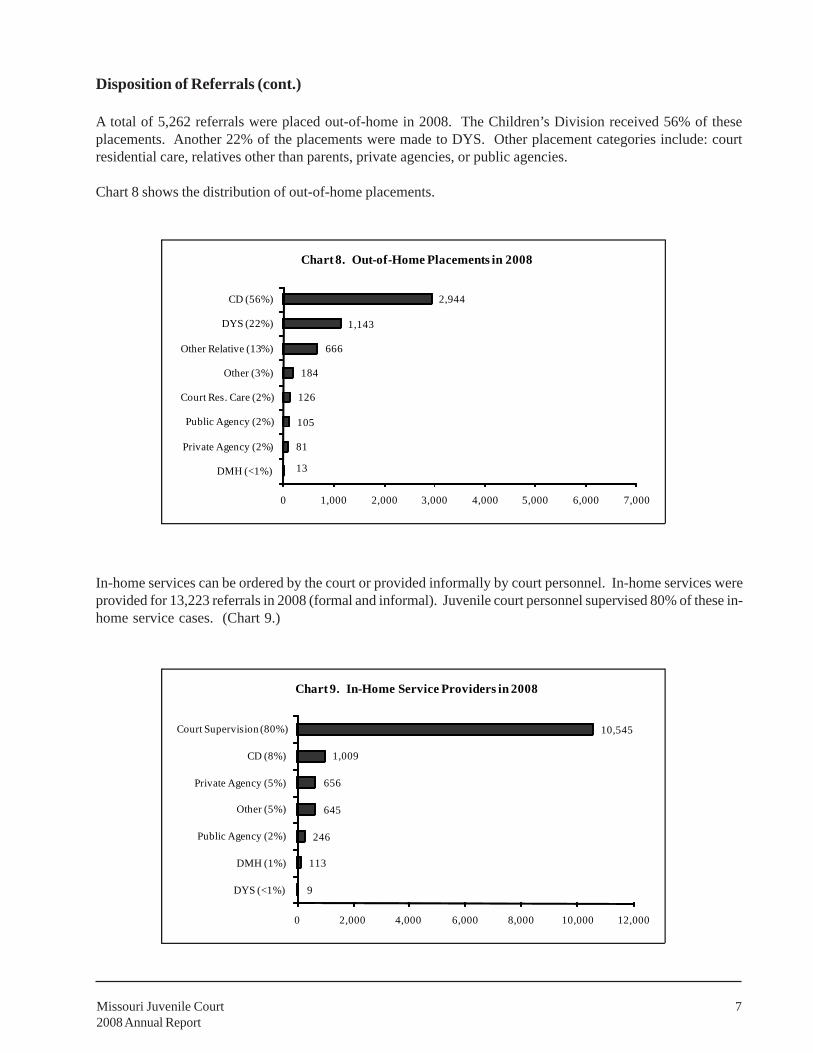
Disposition of Referrals (cont.)
A total of 5,262 referrals were placed out-of-home in 2008. The Children’s Division received 56% of theseplacements. Another 22% of the placements were made to DYS. Other placement categories include: courtresidential care, relatives other than parents, private agencies, or public agencies.
Chart 8 shows the distribution of out-of-home placements.
In-home services can be ordered by the court or provided informally by court personnel. In-home services wereprovided for 13,223 referrals in 2008 (formal and informal). Juvenile court personnel supervised 80% of these in-home service cases. (Chart 9.)
Missouri Juvenile Court2008 Annual Report
8
Foster24%
Group Foster1%
Group 2%
Institution47%
Relative15%
Other11%
Referral Type Male Female Male Female Male FemaleLaw Violation 3,495 893 487 134 257 49Status 505 410 172 195 30 25Abuse, Neglect, Cus tody 44 47 1,923 2,061 32 29Court Order Violation 339 91 67 15 29 6Municipal, Juvenile 40 19 2 3 4 0Total 4,423 1,460 2,651 2,408 352 109
Secure Non-Secure Both2008
Table 5. Pre-Hearing Placements by Referral Type and Gender
African-Caucas ian American Other Total
Age 14 2 0 0 2Age 15 3 7 0 10Age 16 22 35 2 59Age 17 6 6 3 15Age 18 + 4 7 0 11Total 37 55 5 97
Adult Court in 2008 - Age by RaceTable 4. Referrals Certified to
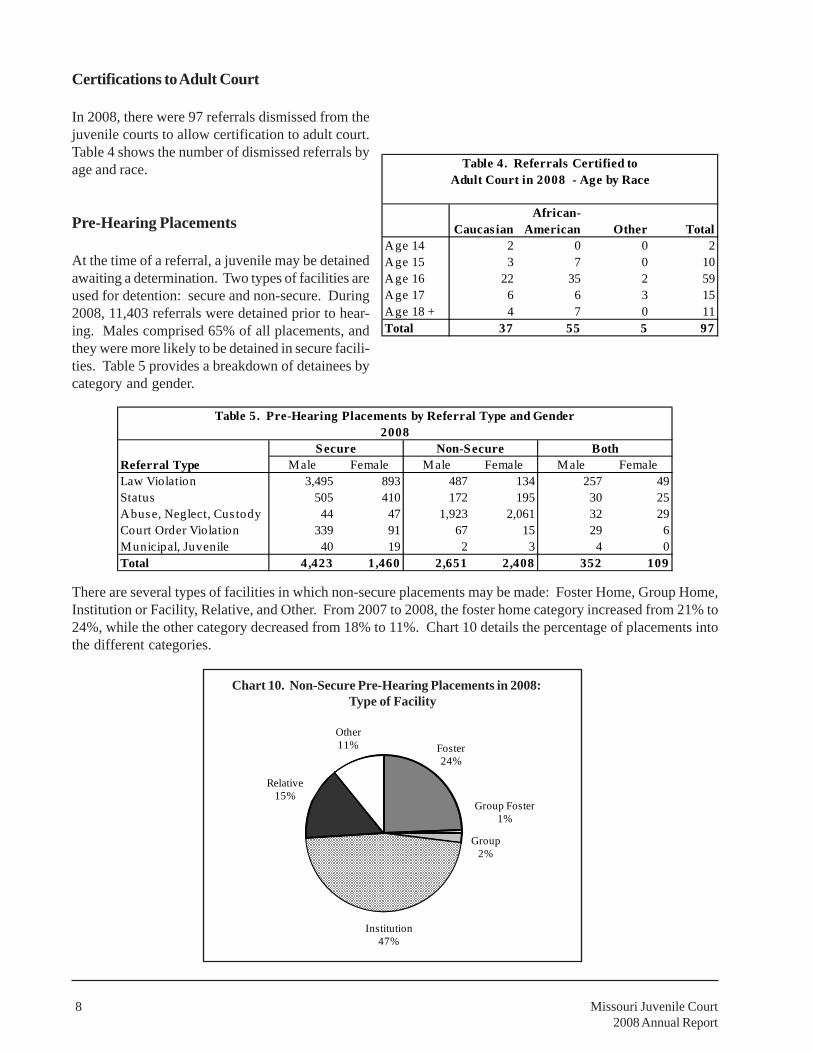
Certifications to Adult Court
In 2008, there were 97 referrals dismissed from thejuvenile courts to allow certification to adult court.Table 4 shows the number of dismissed referrals byage and race.
Pre-Hearing Placements
At the time of a referral, a juvenile may be detainedawaiting a determination. Two types of facilities areused for detention: secure and non-secure. During2008, 11,403 referrals were detained prior to hear-ing. Males comprised 65% of all placements, andthey were more likely to be detained in secure facili-ties. Table 5 provides a breakdown of detainees bycategory and gender.
There are several types of facilities in which non-secure placements may be made: Foster Home, Group Home,Institution or Facility, Relative, and Other. From 2007 to 2008, the foster home category increased from 21% to24%, while the other category decreased from 18% to 11%. Chart 10 details the percentage of placements intothe different categories.
Chart 10. Non-Secure Pre-Hearing Placements in 2008: Type of Facility
Missouri Juvenile Court2008 Annual Report
9
CD32%
DMH1%
Juvenile Court46%
City/County Government
3%
Private Agency
4%
Relative9%
Other6%
Chart 11. Non-Secure Pre-Hearing Placements: Operator of Facility
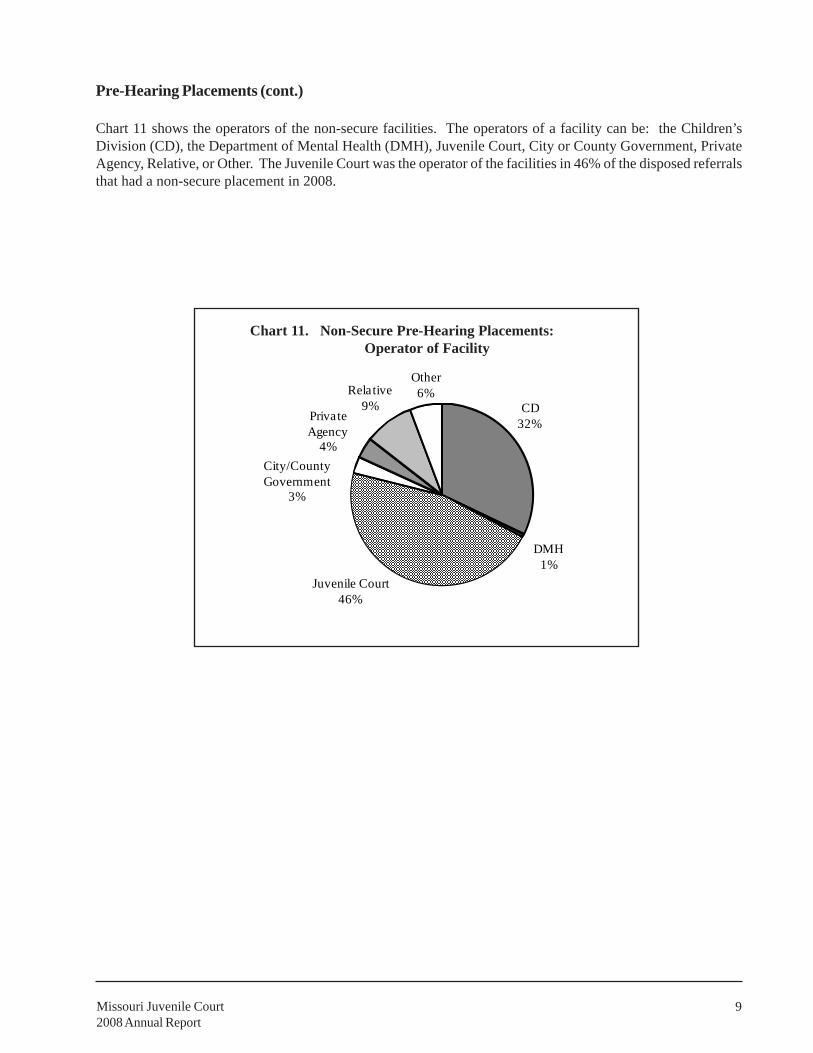
Pre-Hearing Placements (cont.)
Chart 11 shows the operators of the non-secure facilities. The operators of a facility can be: the Children’sDivision (CD), the Department of Mental Health (DMH), Juvenile Court, City or County Government, PrivateAgency, Relative, or Other. The Juvenile Court was the operator of the facilities in 46% of the disposed referralsthat had a non-secure placement in 2008.
Missouri Juvenile Court2008 Annual Report
10
7,391
6,569
5,937
5,492
3,738
3,101
1,720
1,125
700
359
284
261
97
0 2,000 4,000 6,000 8,000
W/O Supervision
Rejected
W/ Supervision
No Action
True, In-Home
Other Juv. Court
True, Out-of-Home
Other Agency
Dismissed
Not True
Miscode
True, No Services
Certification
Chart 12. Outcomes of Law Violation Referrals, 2008
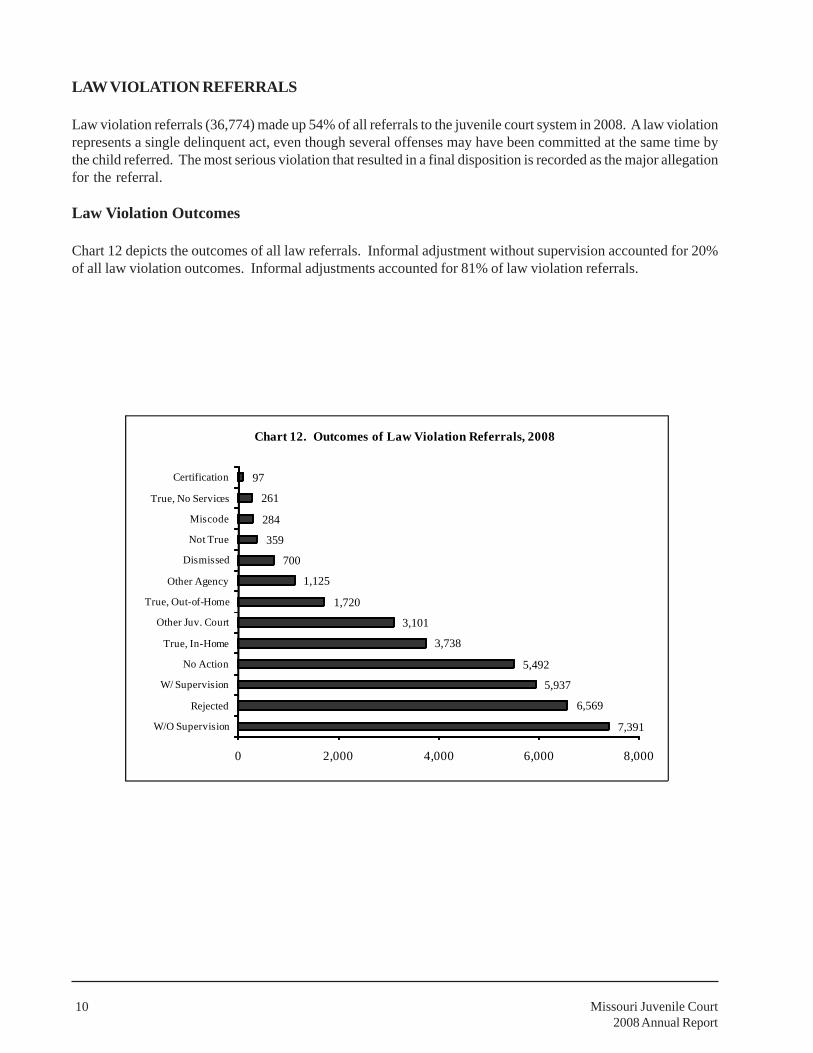
LAW VIOLATION REFERRALS
Law violation referrals (36,774) made up 54% of all referrals to the juvenile court system in 2008. A law violationrepresents a single delinquent act, even though several offenses may have been committed at the same time bythe child referred. The most serious violation that resulted in a final disposition is recorded as the major allegationfor the referral.
Law Violation Outcomes
Chart 12 depicts the outcomes of all law referrals. Informal adjustment without supervision accounted for 20%of all law violation outcomes. Informal adjustments accounted for 81% of law violation referrals.
Missouri Juvenile Court2008 Annual Report
11
Violation Miscode < 12 12 13 14 15 16 17 18+ TotalMurder/Homicide 0 0 0 0 2 4 8 5 2 21Sexual Assault 23 40 33 50 76 88 115 35 41 501Robbery 0 0 3 16 58 98 151 21 1 348Assault 14 830 629 969 1,461 1,840 2,069 480 25 8,317Burglary 4 81 72 148 317 417 521 123 14 1,697Stealing 23 323 349 734 1,334 1,960 2,693 689 31 8,136Kidnapping 0 0 1 2 4 5 4 2 0 18Arson 1 54 23 32 36 43 43 3 0 235Forgery 0 1 0 3 3 9 19 5 2 42Fraud 0 2 0 3 8 18 40 17 1 89Gambling 0 0 0 0 0 0 3 0 0 3Prostitution 0 0 0 0 0 1 0 1 0 2Sex Offenses 12 223 80 135 196 204 135 41 24 1,050Property Damage 10 418 268 440 722 1,012 1,123 273 23 4,289Stolen Property 1 3 10 29 65 106 133 29 3 379Obscenity 0 1 2 1 7 11 7 0 0 29Family Offenses 0 4 0 4 1 5 7 3 1 25Obstructing Police 1 18 11 33 80 149 167 36 0 495Flight/Escape 0 0 0 1 3 8 15 9 1 37Obstruct Judicial Process 0 2 12 42 220 225 288 164 4 957Weapons 0 50 45 72 124 157 206 16 3 673Dangerous Drugs 8 18 45 152 365 654 1,032 399 16 2,689Liquor Laws/Violations 5 3 11 39 146 394 879 252 7 1,736Peace Disturbance 9 174 174 303 490 685 668 132 4 2,639Health And Safety 0 10 12 17 46 65 118 28 0 296Conservation 0 0 1 1 11 12 28 9 1 63Motor Vehicle Violations 1 3 5 12 44 72 24 3 1 165Hazardous Driving 0 5 1 6 19 46 62 15 2 156Invasion Of Privacy 1 59 72 118 263 333 491 80 4 1,421Threats 0 12 14 7 23 23 18 4 0 101Exploitation/Enticement 0 0 0 1 0 0 1 1 0 3City Park Violation 0 0 0 1 0 1 3 0 0 5Driver License Violations 0 0 0 0 7 0 1 0 0 8Misc. Driving/Vehicle Viol. 0 0 1 1 0 3 3 1 0 9Pedestrian Violations 0 0 0 0 0 0 0 0 1 1Property Violations 0 1 1 1 3 4 9 1 0 20Speeding Violations 0 0 0 0 1 1 0 0 0 2Tampering Ordinances 0 0 0 0 1 4 5 3 0 13Miscellaneous Ordinances 0 5 6 13 21 26 24 8 0 103Total 113 2,340 1,881 3,386 6,157 8,683 11,113 2,888 212 36,773
Age Group
Table 6. Law Violation Referrals in 2008 by Allegation and Age
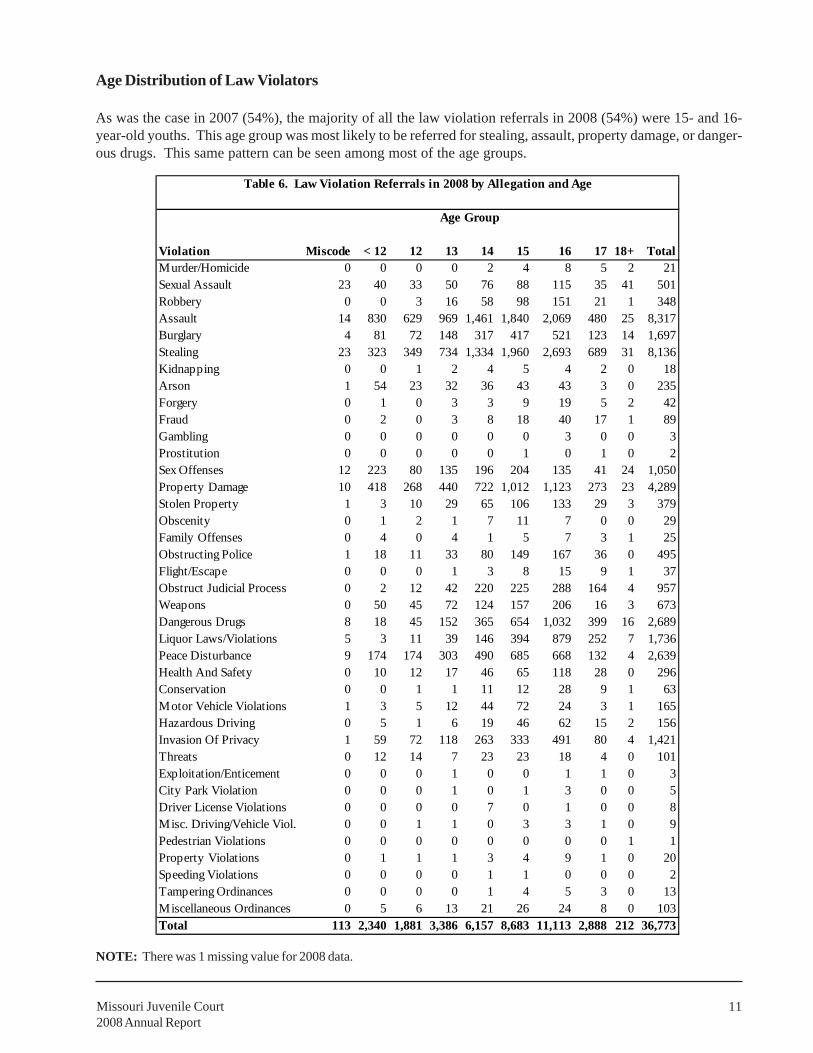
Age Distribution of Law Violators
As was the case in 2007 (54%), the majority of all the law violation referrals in 2008 (54%) were 15- and 16-year-old youths. This age group was most likely to be referred for stealing, assault, property damage, or danger-ous drugs. This same pattern can be seen among most of the age groups.
NOTE: There was 1 missing value for 2008 data.
Missouri Juvenile Court2008 Annual Report
12
2,02
2
1,62
4
1,77
7
2,69
5
497
1,87
5
1,28
4
2,01
0
1,43
9
197
0
500
1,000
1,500
2,000
2,500
3,000
Truancy Beyond Parental Control
Absent from Home
Behavior Injurious to Self/Others
Other Status
Chart 14. Status Offense Referrals by Gender, 2008
Male
Female
3,736
3,562
2,996
1,781
952
879
533
470
287
124
73
27
0 500 1,000 1,500 2,000 2,500 3,000 3,500 4,000
W/O Supervision
No Action
W/ Supervision
Rejected
Other Agency
True, In-Home
Other Juv. Court
True, Out-of-Home
Dismissed
Miscode
True, No Services
Not True
Chart 13. Outcomes of Status Offense Referrals, 2008
STATUS OFFENSE REFERRALS
Status Offense Outcomes
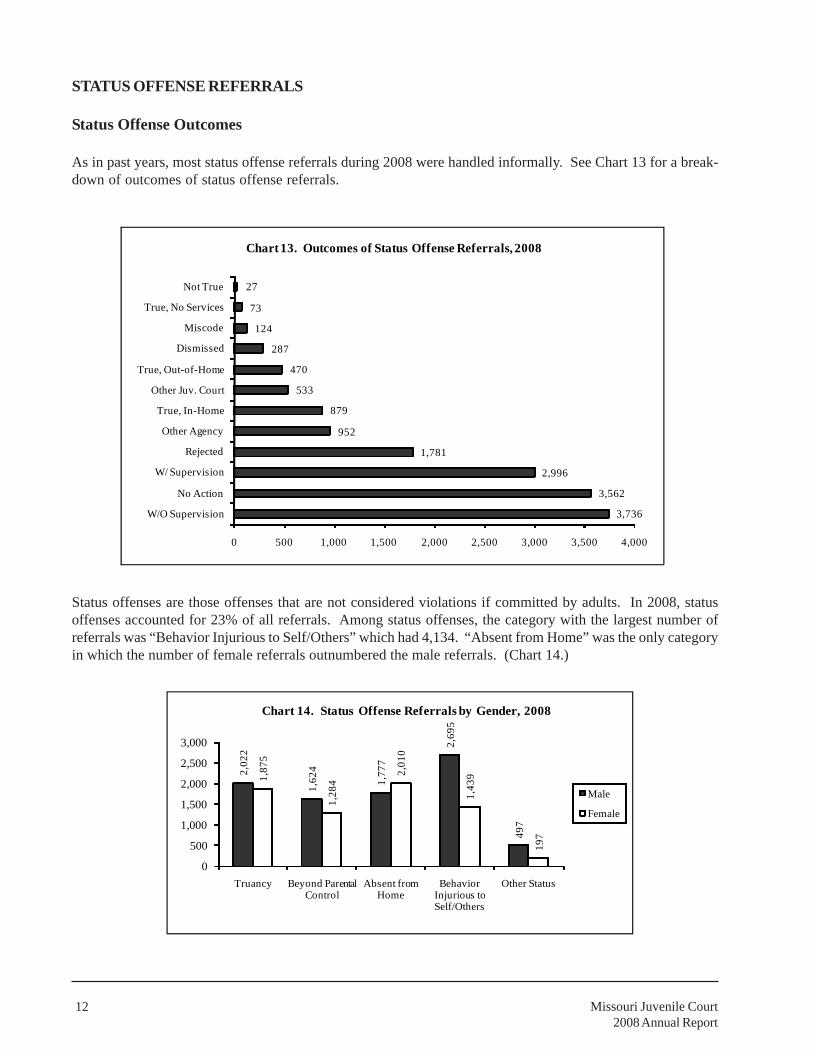
As in past years, most status offense referrals during 2008 were handled informally. See Chart 13 for a break-down of outcomes of status offense referrals.
Status offenses are those offenses that are not considered violations if committed by adults. In 2008, statusoffenses accounted for 23% of all referrals. Among status offenses, the category with the largest number ofreferrals was “Behavior Injurious to Self/Others” which had 4,134. “Absent from Home” was the only categoryin which the number of female referrals outnumbered the male referrals. (Chart 14.)
Missouri Juvenile Court2008 Annual Report
13
Location Referrals %
CD 208 41%DYS 119 23%Private Agency 58 11%Other 38 7%Court Res idential Care 29 6%Public Agency 26 5%Relative 17 3%DMH 14 3%Supervis ion by Court 0 0%
Total 509 100%
Table 8. Out-of-Home Placements : S tatus Offense Referrals , 2008
Male Female Male Female Male Female
Truancy 30 23 7 14 7 5Beyond Parental Control 119 109 47 60 7 8Absent from Home 156 172 42 50 3 4Behavior Injurious to Self/Others 149 81 68 67 12 8Other Status 51 25 8 4 1 0
Total 505 410 172 195 30 25
Secure Non-Secure Both
Table 7. Pre-Hearing Placements: Status Offense Referrals , 2008
Status Offense Placements
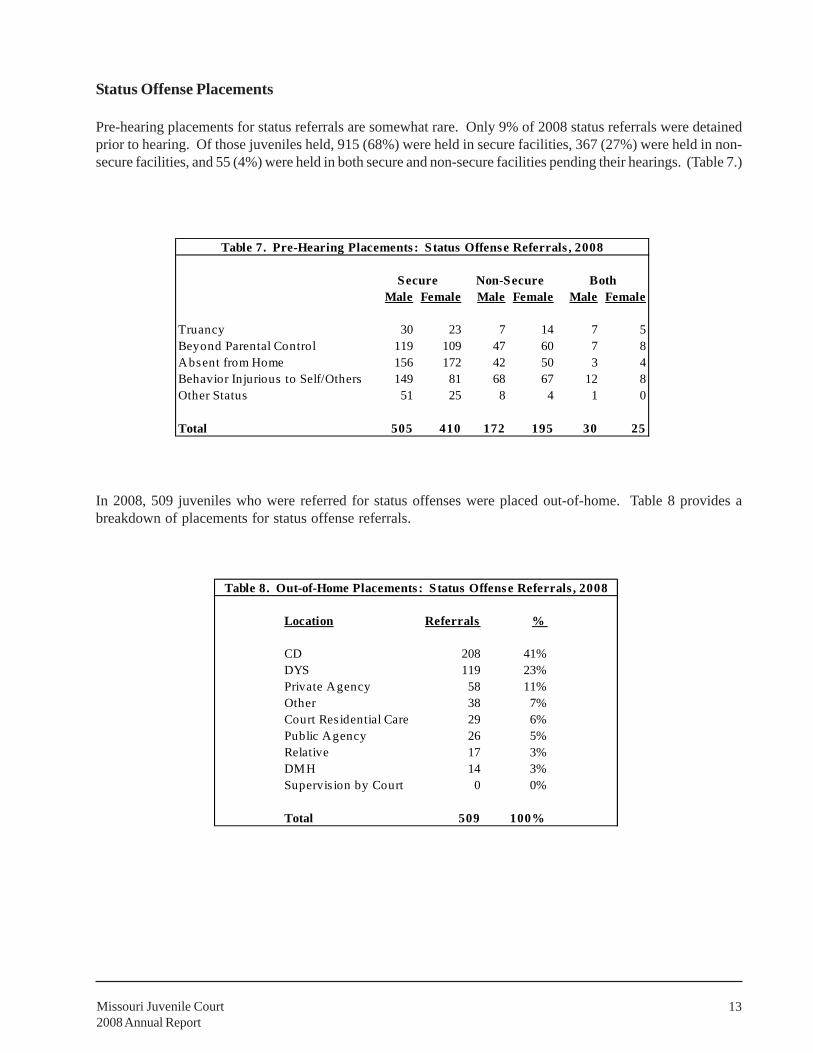
Pre-hearing placements for status referrals are somewhat rare. Only 9% of 2008 status referrals were detainedprior to hearing. Of those juveniles held, 915 (68%) were held in secure facilities, 367 (27%) were held in non-secure facilities, and 55 (4%) were held in both secure and non-secure facilities pending their hearings. (Table 7.)
In 2008, 509 juveniles who were referred for status offenses were placed out-of-home. Table 8 provides abreakdown of placements for status offense referrals.

Missouri Juvenile Court2008 Annual Report
14
Years of Age Abuse Neglect Custody0 - 3 613 2,906 5894 - 7 712 1,976 2968 - 11 613 1,642 223
12 - 15 793 1,459 21316 and Over 304 511 104
Total 3,035 8,494 1,425
Table 10. Age Group of Victim, 2008
4,180
1,909
1,765
1,325
886
853
837
480
226
160
140
0 1,000 2,000 3,000 4,000 5,000
True, Out-of-Home
Other Agency
No Action
Rejected
W/O Supervision
True, In-Home
W/ Supervision
Dismissed
Not True
Other Juv. Court
True, No Services
Chart 15. Outcomes of Abuse, Neglect and Custody Referrals, 2008*
Phys ical 1,724 Improper Care 5,445 Protective 858Sexual 926 Other Neglect 1,726 Termination 487Emotional 337 Educational 994 Transfer 36Inces t 49 Medical/Surgical 255 Relief 35
Abandonment 76 Abduction 9
CustodyAbuse Neglect
Table 9. Abuse, Neglect and Custody Referrals , 2008
ABUSE, NEGLECT AND CUSTODY REFERRALS
The abuse, neglect and custody category encompasses a wide range of referral types. Children can be referredbecause of physical abuse, abandonment, neglect, or because they are involved in custody disputes. In 2008,66% of all child abuse, neglect and custody referrals were due to neglect. A breakdown of all the abuse, neglectand custody referrals is listed in Table 9.
Abuse, Neglect and Custody Outcomes
For Abuse, Neglect and Custody referrals, “True, Out-of-Home” was the most frequently reported outcomecategory. Chart 15 shows the distribution of outcomes.
Age Distribution of Abuse, Neglect and CustodyReferrals
See Table 10 for a breakdown of the age groups forAbuse, Neglect and Custody referrals. Age is missingfor 3 children.
* NOTE: This chart does notdisplay a total of 196 miscodedreferral outcomes in 2008.

Missouri Juvenile Court2008 Annual Report
15
APPENDICES
Missouri Juvenile Court2008 Annual Report
16
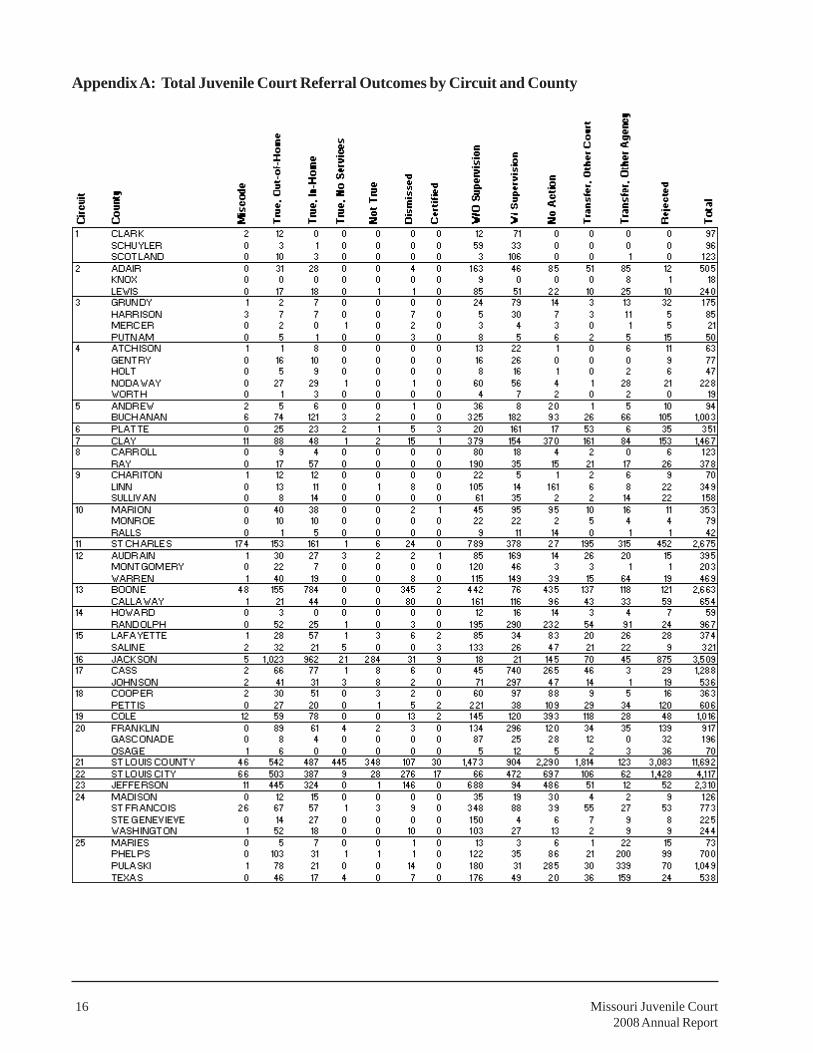
Appendix A: Total Juvenile Court Referral Outcomes by Circuit and County

Missouri Juvenile Court2008 Annual Report
17
Appendix A: Total Juvenile Court Referral Outcomes by Circuit and County (cont.)
Missouri Juvenile Court2008 Annual Report
18
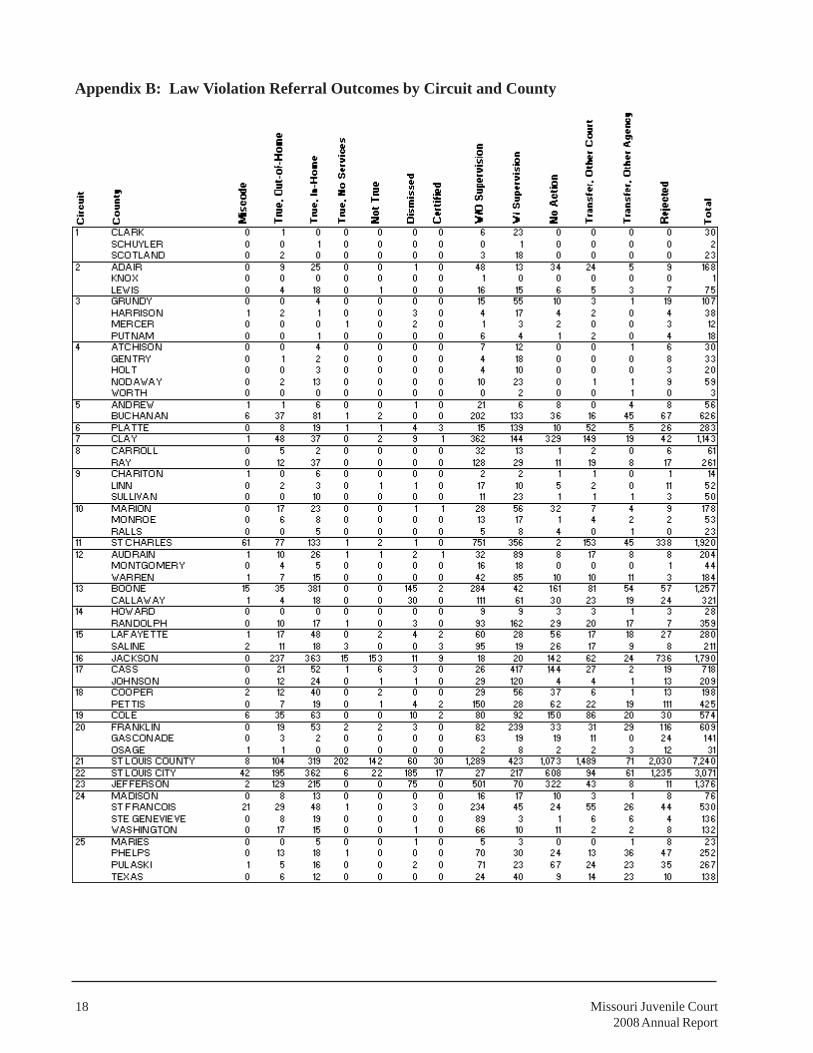
Appendix B: Law Violation Referral Outcomes by Circuit and County

Missouri Juvenile Court2008 Annual Report
19
Appendix B: Law Violation Referral Outcomes by Circuit and County (cont.)
Missouri Juvenile Court2008 Annual Report
20
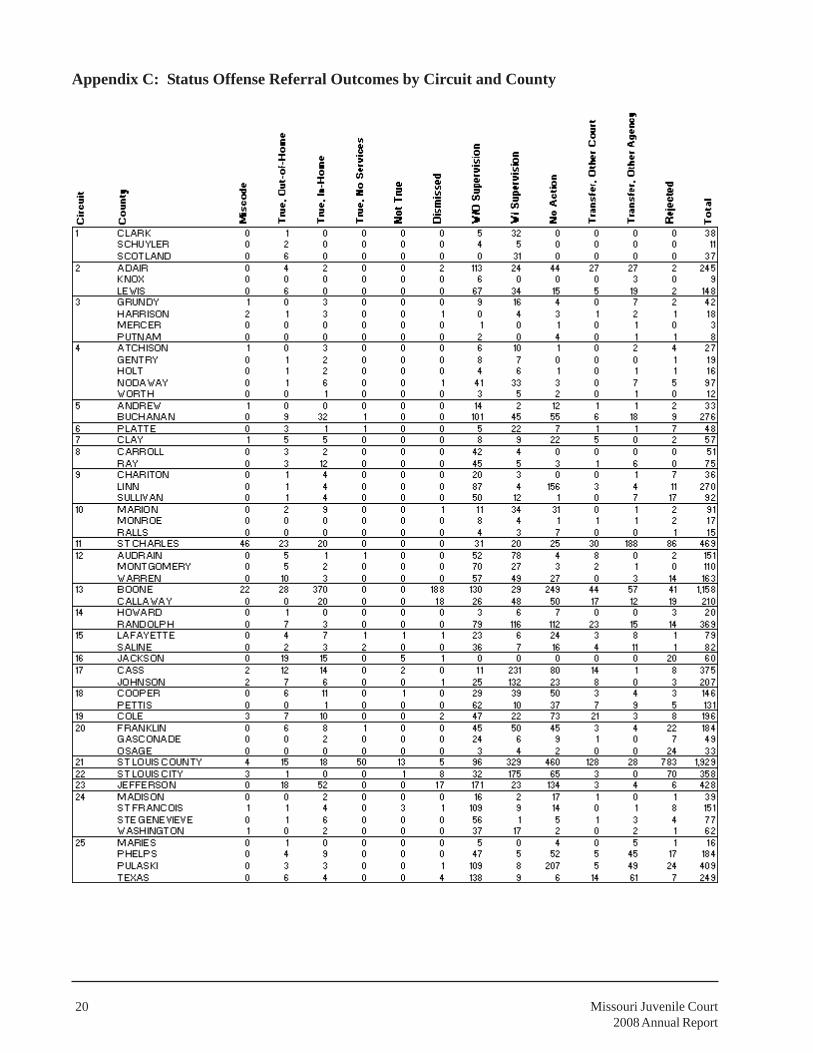
Appendix C: Status Offense Referral Outcomes by Circuit and County

Missouri Juvenile Court2008 Annual Report
21
Appendix C: Status Offense Referral Outcomes by Circuit and County (cont.)

Missouri Juvenile Court2008 Annual Report
22
Appendix D: Abuse, Neglect and Custody Referral Outcomes by Circuit and County

Missouri Juvenile Court2008 Annual Report
23
Appendix D: Abuse, Neglect and Custody Referral Outcomes by Circuit and County (cont.)
Missouri Juvenile Court2008 Annual Report
24
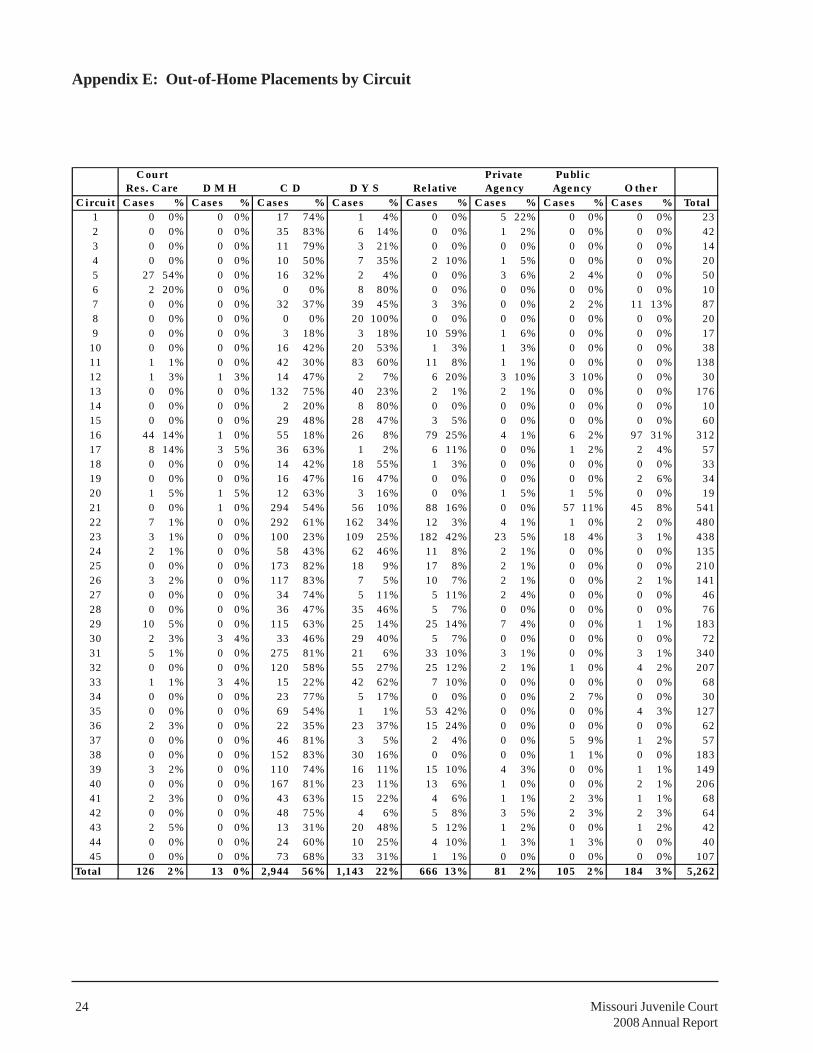
C ircu i t C ase s % C ase s % C ase s % C ase s % C ase s % C ase s % C ase s % C ase s % Total1 0 0% 0 0% 17 74% 1 4% 0 0% 5 22% 0 0% 0 0% 232 0 0% 0 0% 35 83% 6 14% 0 0% 1 2% 0 0% 0 0% 423 0 0% 0 0% 11 79% 3 21% 0 0% 0 0% 0 0% 0 0% 144 0 0% 0 0% 10 50% 7 35% 2 10% 1 5% 0 0% 0 0% 205 27 54% 0 0% 16 32% 2 4% 0 0% 3 6% 2 4% 0 0% 506 2 20% 0 0% 0 0% 8 80% 0 0% 0 0% 0 0% 0 0% 107 0 0% 0 0% 32 37% 39 45% 3 3% 0 0% 2 2% 11 13% 878 0 0% 0 0% 0 0% 20 100% 0 0% 0 0% 0 0% 0 0% 209 0 0% 0 0% 3 18% 3 18% 10 59% 1 6% 0 0% 0 0% 17
10 0 0% 0 0% 16 42% 20 53% 1 3% 1 3% 0 0% 0 0% 3811 1 1% 0 0% 42 30% 83 60% 11 8% 1 1% 0 0% 0 0% 13812 1 3% 1 3% 14 47% 2 7% 6 20% 3 10% 3 10% 0 0% 3013 0 0% 0 0% 132 75% 40 23% 2 1% 2 1% 0 0% 0 0% 17614 0 0% 0 0% 2 20% 8 80% 0 0% 0 0% 0 0% 0 0% 1015 0 0% 0 0% 29 48% 28 47% 3 5% 0 0% 0 0% 0 0% 6016 44 14% 1 0% 55 18% 26 8% 79 25% 4 1% 6 2% 97 31% 31217 8 14% 3 5% 36 63% 1 2% 6 11% 0 0% 1 2% 2 4% 5718 0 0% 0 0% 14 42% 18 55% 1 3% 0 0% 0 0% 0 0% 3319 0 0% 0 0% 16 47% 16 47% 0 0% 0 0% 0 0% 2 6% 3420 1 5% 1 5% 12 63% 3 16% 0 0% 1 5% 1 5% 0 0% 1921 0 0% 1 0% 294 54% 56 10% 88 16% 0 0% 57 11% 45 8% 54122 7 1% 0 0% 292 61% 162 34% 12 3% 4 1% 1 0% 2 0% 48023 3 1% 0 0% 100 23% 109 25% 182 42% 23 5% 18 4% 3 1% 43824 2 1% 0 0% 58 43% 62 46% 11 8% 2 1% 0 0% 0 0% 13525 0 0% 0 0% 173 82% 18 9% 17 8% 2 1% 0 0% 0 0% 21026 3 2% 0 0% 117 83% 7 5% 10 7% 2 1% 0 0% 2 1% 14127 0 0% 0 0% 34 74% 5 11% 5 11% 2 4% 0 0% 0 0% 4628 0 0% 0 0% 36 47% 35 46% 5 7% 0 0% 0 0% 0 0% 7629 10 5% 0 0% 115 63% 25 14% 25 14% 7 4% 0 0% 1 1% 18330 2 3% 3 4% 33 46% 29 40% 5 7% 0 0% 0 0% 0 0% 7231 5 1% 0 0% 275 81% 21 6% 33 10% 3 1% 0 0% 3 1% 34032 0 0% 0 0% 120 58% 55 27% 25 12% 2 1% 1 0% 4 2% 20733 1 1% 3 4% 15 22% 42 62% 7 10% 0 0% 0 0% 0 0% 6834 0 0% 0 0% 23 77% 5 17% 0 0% 0 0% 2 7% 0 0% 3035 0 0% 0 0% 69 54% 1 1% 53 42% 0 0% 0 0% 4 3% 12736 2 3% 0 0% 22 35% 23 37% 15 24% 0 0% 0 0% 0 0% 6237 0 0% 0 0% 46 81% 3 5% 2 4% 0 0% 5 9% 1 2% 5738 0 0% 0 0% 152 83% 30 16% 0 0% 0 0% 1 1% 0 0% 18339 3 2% 0 0% 110 74% 16 11% 15 10% 4 3% 0 0% 1 1% 14940 0 0% 0 0% 167 81% 23 11% 13 6% 1 0% 0 0% 2 1% 20641 2 3% 0 0% 43 63% 15 22% 4 6% 1 1% 2 3% 1 1% 6842 0 0% 0 0% 48 75% 4 6% 5 8% 3 5% 2 3% 2 3% 6443 2 5% 0 0% 13 31% 20 48% 5 12% 1 2% 0 0% 1 2% 4244 0 0% 0 0% 24 60% 10 25% 4 10% 1 3% 1 3% 0 0% 4045 0 0% 0 0% 73 68% 33 31% 1 1% 0 0% 0 0% 0 0% 107
Total 126 2% 13 0% 2,944 56% 1,143 22% 666 13% 81 2% 105 2% 184 3% 5,262
O th e rC D D Y S Re lative Age n cyC ou rt
Re s. C are D M HPu bl ic
Age n cyPrivate
Appendix E: Out-of-Home Placements by Circuit

Missouri Juvenile Court2008 Annual Report
25
C ircu i t C ase s % C ase s % C ase s % C ase s % C ase s % C ase s % C ase s % Total1 201 57% 0 0% 102 29% 0 0% 50 14% 0 0% 1 0% 3542 87 73% 1 1% 3 3% 0 0% 26 22% 2 2% 0 0% 1193 65 63% 6 6% 21 20% 0 0% 9 9% 2 2% 1 1% 1044 130 67% 2 1% 13 7% 1 1% 43 22% 3 2% 3 2% 1955 156 87% 0 0% 2 1% 0 0% 11 6% 6 3% 4 2% 1796 132 70% 0 0% 2 1% 0 0% 6 3% 4 2% 44 23% 1887 79 92% 0 0% 4 5% 0 0% 1 1% 1 1% 1 1% 868 104 84% 3 2% 8 6% 0 0% 1 1% 6 5% 2 2% 1249 19 70% 1 4% 2 7% 0 0% 4 15% 0 0% 1 4% 27
10 166 85% 1 1% 1 1% 0 0% 17 9% 10 5% 1 1% 19611 538 91% 0 0% 3 1% 0 0% 12 2% 3 1% 35 6% 59112 329 78% 14 3% 10 2% 0 0% 59 14% 5 1% 6 1% 42313 791 97% 0 0% 27 3% 0 0% 0 0% 0 0% 0 0% 81814 1 33% 0 0% 0 0% 0 0% 0 0% 0 0% 2 67% 315 117 79% 0 0% 0 0% 0 0% 7 5% 17 11% 7 5% 14816 148 25% 0 0% 90 15% 0 0% 1 0% 1 0% 363 60% 60317 979 84% 16 1% 106 9% 0 0% 19 2% 26 2% 14 1% 1,16018 149 83% 12 7% 1 1% 0 0% 5 3% 0 0% 12 7% 17919 110 87% 1 1% 4 3% 0 0% 12 9% 0 0% 0 0% 12720 336 98% 4 1% 1 0% 0 0% 0 0% 1 0% 0 0% 34221 398 76% 2 0% 93 18% 1 0% 10 2% 3 1% 15 3% 52222 694 88% 0 0% 12 2% 1 0% 48 6% 17 2% 16 2% 78823 362 96% 0 0% 16 4% 0 0% 0 0% 0 0% 0 0% 37824 184 67% 3 1% 7 3% 0 0% 41 15% 35 13% 5 2% 27525 78 89% 0 0% 10 11% 0 0% 0 0% 0 0% 0 0% 8826 142 55% 2 1% 70 27% 0 0% 32 12% 10 4% 4 2% 26027 251 81% 9 3% 31 10% 0 0% 18 6% 2 1% 0 0% 31128 145 75% 1 1% 7 4% 1 1% 38 20% 2 1% 0 0% 19429 218 63% 2 1% 59 17% 3 1% 35 10% 2 1% 28 8% 34730 84 97% 0 0% 1 1% 0 0% 1 1% 0 0% 1 1% 8731 344 95% 1 0% 8 2% 0 0% 3 1% 4 1% 3 1% 36332 980 92% 9 1% 16 1% 0 0% 23 2% 33 3% 7 1% 1,06833 269 73% 6 2% 17 5% 0 0% 52 14% 5 1% 20 5% 36934 18 95% 0 0% 0 0% 0 0% 1 5% 0 0% 0 0% 1935 325 59% 0 0% 196 36% 0 0% 19 3% 8 1% 1 0% 54936 49 63% 1 1% 1 1% 0 0% 1 1% 1 1% 25 32% 7837 259 82% 3 1% 7 2% 1 0% 20 6% 11 3% 16 5% 31738 225 97% 0 0% 7 3% 0 0% 0 0% 1 0% 0 0% 23339 172 87% 2 1% 13 7% 1 1% 6 3% 1 1% 3 2% 19840 33 79% 0 0% 9 21% 0 0% 0 0% 0 0% 0 0% 4241 114 81% 2 1% 13 9% 0 0% 7 5% 3 2% 1 1% 14042 143 73% 9 5% 9 5% 0 0% 11 6% 21 11% 2 1% 19543 69 96% 0 0% 2 3% 0 0% 0 0% 0 0% 1 1% 7244 123 95% 0 0% 0 0% 0 0% 7 5% 0 0% 0 0% 13045 229 98% 0 0% 5 2% 0 0% 0 0% 0 0% 0 0% 234
Total 10,545 80% 113 1% 1,009 8% 9 0% 656 5% 246 2% 645 5% 13,223
S u pe rvi s ionby C ou rt D M H C D O th e rD Y S Age n cy
PrivateAge n cyPu bl i c
Appendix F: In-Home Services by Circuit
Missouri Juvenile Court2008 Annual Report
26
C irc u it C o u n t y M is c e lla n e o u s P e o p le P ro p e rt y P e a c e D is t u rb a n c e D ru g s S t a t u s T o t a l1 C LA R K 41 8 10 0 0 38 97
S C H UYLER 83 1 1 0 0 11 96S C O TLA N D 75 3 5 3 0 37 123
2 A D A IR 131 57 54 7 11 245 505KN O X 9 0 0 0 0 9 18LEWIS 28 22 31 7 4 148 240
3 G R UN D Y 50 42 36 5 0 42 175H A R R IS O N 37 13 15 2 0 18 85M ER C ER 8 4 6 0 0 3 21P UTN A M 26 3 12 1 0 8 50
4 A TC H IS O N 15 11 10 0 0 27 63G EN TR Y 37 4 14 2 1 19 77H O LT 20 6 5 0 0 16 47N O D A WA Y 82 11 34 2 2 97 228WO R TH 5 2 0 0 0 12 19
5 A N D R EW 9 21 18 11 2 33 94B UC H A N A N 172 142 222 152 39 276 1,003
6 P LA TTE 65 63 117 10 48 48 3517 C LA Y 451 248 497 95 119 57 1,4678 C A R R O LL 18 11 35 6 2 51 123
R A Y 87 90 77 23 26 75 3789 C H A R ITO N 23 2 7 0 2 36 70
LIN N 41 19 13 0 6 270 349S ULLIVA N 31 6 21 0 8 92 158
10 M AR IO N 130 39 48 35 10 91 353M ON R O E 22 14 24 1 1 17 79R A LLS 6 5 9 5 2 15 42
11 S T C H A R LES 687 365 784 147 223 469 2,67512 A UD R A IN 100 45 69 14 16 151 395
M ON TG O M ER Y 55 16 19 0 3 110 203WA R R EN 150 61 76 3 16 163 469
13 B O O N E 437 352 480 170 66 1,158 2,663C A LLA WA Y 196 79 114 22 33 210 654
14 H O WA R D 14 12 10 0 3 20 59R A N D O LP H 274 107 113 97 7 369 967
15 LA F A YETTE 64 82 118 16 15 79 374S A LIN E 52 66 97 16 8 82 321
16 J A C KS O N 1,848 548 831 81 141 60 3,50917 C A S S 319 195 221 98 80 375 1,288
J O H N S ON 168 65 69 17 10 207 53618 C O O P ER 51 47 94 17 8 146 363
P ETTIS 122 112 187 35 19 131 60619 C O LE 337 192 180 69 42 196 1,01620 F R A N KLIN 239 127 270 35 62 184 917
G A S C O N A DE 34 52 44 7 10 49 196O S A G E 13 12 10 1 1 33 70
21 S T LO UIS C O UN TY 3,694 1,706 3,471 419 473 1,929 11,69222 S T LO UIS C ITY 1,156 843 1,498 108 154 358 4,11723 J EF F ER S O N 786 470 441 47 138 428 2,31024 M AD IS O N 27 33 22 2 3 39 126
S T F R A N C OIS 159 286 137 18 22 151 773S TE G EN EVIEVE 21 50 45 12 20 77 225WA S H IN G TO N 74 75 20 8 5 62 244
25 M AR IES 35 5 15 0 2 16 73P H ELP S 287 103 103 6 17 184 700P ULA S KI 421 116 78 8 17 409 1,049TEXA S 184 46 47 3 9 249 538
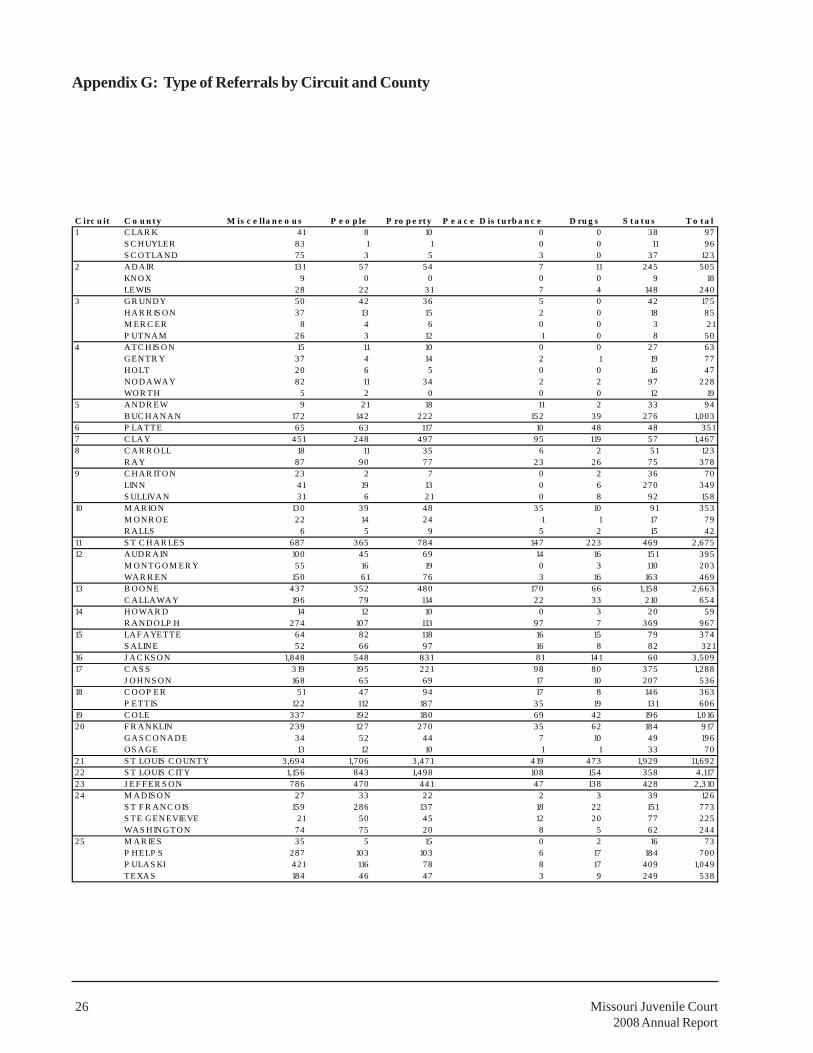
Appendix G: Type of Referrals by Circuit and County
Missouri Juvenile Court2008 Annual Report
27
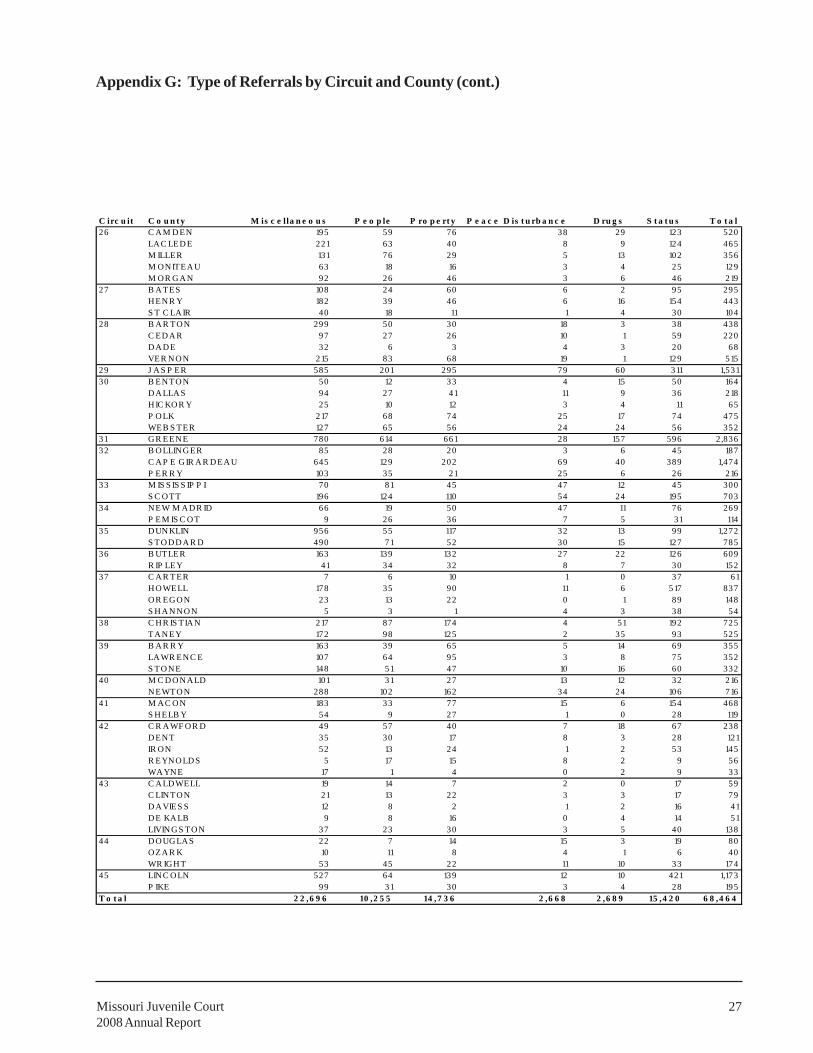
C irc u it C o u n t y M is c e lla n e o u s P e o p le P ro p e rt y P e a c e D is t u rb a n c e D ru g s S t a t u s T o t a l26 C A M D EN 195 59 76 38 29 123 520
LA C LED E 221 63 40 8 9 124 465M ILLER 131 76 29 5 13 102 356M ON ITEA U 63 18 16 3 4 25 129M OR G A N 92 26 46 3 6 46 219
27 B A TES 108 24 60 6 2 95 295H EN R Y 182 39 46 6 16 154 443S T C LA IR 40 18 11 1 4 30 104
28 B A R TO N 299 50 30 18 3 38 438C ED A R 97 27 26 10 1 59 220D A D E 32 6 3 4 3 20 68VER N O N 215 83 68 19 1 129 515
29 J A S P ER 585 201 295 79 60 311 1,53130 B EN TO N 50 12 33 4 15 50 164
D A LLA S 94 27 41 11 9 36 218H IC KO R Y 25 10 12 3 4 11 65P O LK 217 68 74 25 17 74 475WEB S TER 127 65 56 24 24 56 352
31 G R EEN E 780 614 661 28 157 596 2,83632 B O LLIN G ER 85 28 20 3 6 45 187
C A P E G IR A R D EA U 645 129 202 69 40 389 1,474P ER R Y 103 35 21 25 6 26 216
33 M IS S IS S IP P I 70 81 45 47 12 45 300S C O TT 196 124 110 54 24 195 703
34 N EW M AD R ID 66 19 50 47 11 76 269P EM IS C O T 9 26 36 7 5 31 114
35 D UN KLIN 956 55 117 32 13 99 1,272S TO D D A R D 490 71 52 30 15 127 785
36 B UTLER 163 139 132 27 22 126 609R IP LEY 41 34 32 8 7 30 152
37 C A R TER 7 6 10 1 0 37 61H O WELL 178 35 90 11 6 517 837O R EG O N 23 13 22 0 1 89 148S H A N N O N 5 3 1 4 3 38 54
38 C H R IS TIA N 217 87 174 4 51 192 725TA N EY 172 98 125 2 35 93 525
39 B A R R Y 163 39 65 5 14 69 355LA WR EN C E 107 64 95 3 8 75 352S TO N E 148 51 47 10 16 60 332
40 M C D O N A LD 101 31 27 13 12 32 216N EWTO N 288 102 162 34 24 106 716
41 M AC O N 183 33 77 15 6 154 468S H ELB Y 54 9 27 1 0 28 119
42 C R A WF O R D 49 57 40 7 18 67 238D EN T 35 30 17 8 3 28 121IR ON 52 13 24 1 2 53 145R EYN O LD S 5 17 15 8 2 9 56WA YN E 17 1 4 0 2 9 33
43 C A LD WELL 19 14 7 2 0 17 59C LIN TO N 21 13 22 3 3 17 79D A VIES S 12 8 2 1 2 16 41D E KA LB 9 8 16 0 4 14 51LIVIN G S TO N 37 23 30 3 5 40 138
44 D O UG LAS 22 7 14 15 3 19 80O ZA R K 10 11 8 4 1 6 40WR IGH T 53 45 22 11 10 33 174
45 LIN C O LN 527 64 139 12 10 421 1,173P IKE 99 31 30 3 4 28 195
T o t a l 2 2 ,6 9 6 10 ,2 5 5 14 ,7 3 6 2 ,6 6 8 2 ,6 8 9 15 ,4 2 0 6 8 ,4 6 4
Appendix G: Type of Referrals by Circuit and County (cont.)

Missouri Juvenile Court2008 Annual Report
28
Appendix H: Referrals by Type, Level and Circuit
NOTE: Juvenile Referrals include Status, Abuse/Neglect/Custody, Court Order Violation, and Municipal Referrals.

Missouri Juvenile Court2008 Annual Report
29
Circuit Male Female Male Female Male Female Male Female Total1 0 0 0 0 0 0 0 0 02 0 0 0 0 0 0 0 0 03 0 0 0 0 0 0 0 0 04 0 0 0 0 0 0 0 0 05 0 0 0 0 0 0 0 0 06 2 1 0 0 0 0 0 0 37 1 0 0 0 0 0 0 0 18 0 0 0 0 0 0 0 0 09 0 0 0 0 0 0 0 0 0
10 0 0 1 0 0 0 0 0 111 0 0 0 0 0 0 0 0 012 1 0 0 0 0 0 0 0 113 0 0 2 0 0 0 0 0 214 0 0 0 0 0 0 0 0 015 2 0 0 0 0 0 0 0 216 2 0 6 0 1 0 0 0 917 0 0 0 0 0 0 0 0 018 1 0 0 0 1 0 0 0 219 0 1 1 0 0 0 0 0 220 0 0 0 0 0 0 0 0 021 3 0 25 0 0 0 0 0 2822 0 0 17 0 0 0 0 0 1723 0 0 0 0 0 0 0 0 024 0 0 0 0 0 0 0 0 025 0 0 0 0 0 0 0 0 026 0 0 0 0 0 0 0 0 027 0 0 0 0 0 0 0 0 028 0 0 0 0 0 0 0 0 029 2 0 0 0 0 0 0 0 230 1 0 0 0 0 0 0 0 131 0 0 0 0 0 0 0 0 032 0 0 0 0 0 0 0 0 033 4 0 1 0 1 0 0 0 634 0 0 0 0 0 0 0 0 035 1 0 0 0 0 0 0 0 136 0 0 0 0 0 0 0 0 037 0 0 0 0 1 0 0 0 138 3 0 0 0 0 0 0 0 339 0 0 0 0 0 0 0 0 040 0 0 0 0 0 0 0 0 041 1 0 0 0 0 0 0 0 142 1 0 0 0 0 0 0 0 143 0 0 0 0 0 0 0 0 044 0 0 0 0 0 0 0 0 045 4 0 0 0 0 0 0 0 4
Total 29 2 53 0 4 0 0 0 88
UnknownCaucasian AmericanAfrican-
O ther
Appendix I: Number of Juveniles Certified to Adult Court by Circuit, Race and Gender
NOTE: The totals on this table have been unduplicated by youth within the circuit; therefore, totals will not match other tables or appendices found in this report.
Because not all circuits and counties use unique individual identification numbers, and because two separatecircuits might prosecute the same child using different IDs, a true statewide count of the number of childrencertified cannot be accurately found. The numbers on this table have been unduplicated to represent individualchildren within the circuit.

Missouri Juvenile Court2008 Annual Report
30
Missouri’s 45 Juvenile Divisions