
2008 AnnuAl RepoRt are pleased to report that while 2008 was a year of extraordinary global economic...
52
2008 ANNUAL REPORT ESCO TECHNOLOGIES INC.
Transcript of 2008 AnnuAl RepoRt are pleased to report that while 2008 was a year of extraordinary global economic...

2 0 0 8 A n n u A l R e p o R t
e S C o t e C h n o l o g i e S i n C .

Table of Contents
To Our Shareholders 1
Company Overview 3
Utility Solutions 4
RF Shielding & Test 6
Filtration/Fluid Flow 7
Commitment To Communities 8
Financial Section 9
Management’s Discussion
and Analysis 10
Financial Statements 21
Notes to Consolidated
Financial Statements 26
Accountability Reports 43
Five-Year Financial Summary 46
Market Performance 47
Shareholders’ Summary 48
Management and Directors 49
E S C O A t A G l a n c e
U t i l i t y S o l u t i o n s
R F S h i e l d i n g & T e s t
F i l t r a t i o n / F l u i d F l o w

We are pleased to report that while 2008 was a year of extraordinary global economic challenges, ESCO
was able to deliver outstanding financial results for our shareholders. Meaningful growth in sales across
all operating segments and geographic areas resulted in strong top and bottom line performance. We
believe ESCO’s growth and profitability over the last several years validates our belief that we are pursuing the
right core strategies to deliver on our steadfast commitment of increasing long-term shareholder value.
Financially, our success in 2008 was evident by the following: sales increased 40 percent; EBIT increased
116 percent; EBIT margin increased 460 basis points; EPS-Continuing Operations increased 57 percent; net cash
provided by operating activities increased 71 percent; and entered orders increased 35 percent.
Fiscal 2008 was also a transformational year for ESCO, as we significantly repositioned the Company by
expanding our focus on our fastest growing, highest margin business segment, the Utility Solutions Group (USG).
Through the acquisitions of Doble and LDIC, complemented by the divestiture of Filtertek, we became a more
growth oriented, higher operating margin business with a substantially increased international market presence.
In addition, we narrowed the focus of our Filtration segment to concentrate on our higher margin business units,
while eliminating our exposure to lower growth, profit-challenged end markets such as automotive.
An additional piece of our transformation in 2008 involved the strategic alignment of our three AMI busi-
nesses into the integrated Aclara™ brand. Aclara brought together the industry’s most proven fixed-network
AMI systems and the most advanced meter data management software to provide proven at scale, state of the
art advanced metering solutions to customers worldwide. We aligned our organizational structure around our
distinct customer groups: investor owned utilities (IOUs); cooperative and municipals (COOPs/Munis); and
international. This integration was done to facilitate our customers’ success by offering them a comprehensive
suite of proven and tailored solutions to manage their utility communications and data information needs
today, and well into the future. The rebranding of Aclara has been extremely well received by our customers,
industry experts, and employees.
During 2008, we had numerous successes throughout the Company including:• Sales at Aclara RF (formerly Hexagram) were greater than $100 million, reflecting a 400 percent increase from
the annual sales level recorded prior to its acquisition in 2006;• Aclara RF gas AMI orders with PG&E in 2008 were 1.6 million units worth $93 million, bringing the cumulative
PG&E gas and electric AMI orders to 2.7 million units worth over $171 million since inception;• Aclara AMI project wins at Idaho Power, New York City water, Toronto water, and continued strength in the
COOP/Muni markets where orders were well over $100 million;• Significant inroads into the international AMI market with early success demonstrated by several pilot projects
in Central and South America, along with some initial technology evaluation activity in Asia;• The immediate success of Doble, which exceeded our expectations of sales, profit and cash flow, and also sig-
nificantly expanded our international footprint;• Sales growth and margin improvement realized in the Filtration segment by focusing on our profitable, well
managed businesses, along with the key win of a large aerospace filtration project with Airbus for the A350XWB
aircraft having a production value of $150 million; and,• Significant Test segment international growth where we continued our market leadership position by winning
several key projects in India, including NATRIP.
Gary E. Muenster,
Executive Vice
President and Chief
Financial Officer (left);
Alyson S. Barclay,
Senior Vice Pres ident,
Secretary and General
Counsel; and Victor
L. Richey, Chairman,
Chief Executive
Officer, and President
T o O u r S h a r e h o l d e r s
“Meaningful growth in sales across all oper-ating segments and geographic areas resulted in strong top and bottom line per-formance.”
1
Summarizing 2008, despite the economic challenges we faced, ESCO’s multi-segment, diverse end market,
global operating platform showed resiliency and delivered meaningful year-over-year improvement, and most
importantly, positioned us for sustainable growth in the years to come.
Regarding the outlook for 2009 and beyond, our confidence about our future comes from an unwavering
belief in our core fundamental strategies, which are key to our ability to deliver superior financial performance.
By maintaining a strong focus and not frequently shifting strategic priorities, we believe we can execute our
business plan through varying economic business cycles.
Certainly, there will continue to be economic downturns and other negative events that will create chal-
lenges for ESCO in the coming years, but our success will be driven by our ability to anticipate these problems,
act swiftly to mitigate their impact, and execute on contingency plans, while continuing to maintain a long-
term perspective. Our rigorous planning processes and our attention to costs will provide us with the timely
insight to identify changing market dynamics and will allow us to respond accordingly.
We also believe the investments we continue to make in new products and acquisition partners will position
us for continued improvement in our financial performance. Our organic growth is driven by our belief that
winning new programs requires a significant investment in research and development. We have stood firmly
behind this principle by investing nearly $115 million, or eight percent of sales, over the last three years in R&D
and engineering. This level of investment is a testament to our focus on providing innovative solutions to our
customers, and reflects our intention to deliver leading-edge capabilities well into the future.
A large part of this investment in our USG segment has resulted in ESCO having the most capable, proven
AMI technologies and utility solutions available in the market whether used for electric, gas or water utility
applications. With that said, we will never stand still when it comes to new product development, as we remain
fully committed to this growing, and highly profitable market segment.
A few examples of our successful new AMI products recently introduced include interfaces with smart ther-
mostats and multiple-function in-home displays which will allow utilities and their customers to better manage
how and when energy is used, and other sophisticated demand response/load control products. Our full suite of
products provides the information necessary to allow the utilities to gain greater insight into and better control
over the management of their energy resources, which is the core tenet of AMI. Our AMI products allow utilities
to contribute favorably to facilitating a “greener,” more environmentally friendly world, while reducing their
overall carbon footprint.
On the international AMI front, we expanded our focus by adding senior business development staff to
address the fast moving dynamics currently being seen in numerous countries outside of North America. The
international AMI opportunities are substantial, and we feel we have the appropriate resources and product
offerings in place to capitalize on these.
Overall, we believe ESCO has the financial strength and flexibility, as well as the right products and tech-
nologies, to effectively achieve our growth plans in 2009 and beyond. We are grateful that we have solid man-
agement teams in place across the Company who understand our mission and are fully committed to delivering
exceptional results.
In closing, we want to thank our customers for the opportunity to serve them, our employees for their
effort and dedication, our Board of Directors for their leadership and guidance, and our shareholders for their
support and confidence.
Vic Richey Gary Muenster
Chairman, Chief Executive Officer, Executive Vice President
& President & Chief Financial Officer
December 1, 2008
T o O u r S h a r e h o l d e r s Continued
“Our rigorous plan-ning processes and our attention to costs will provide us with the timely insight to identify changing market dynamics and will allow us to respond accordingly.”
2

C o m p a n y O v e r v i e w
Utility Solutions Companies of the Utility Solutions segment provide market and technology leadership, employing the highest caliber, proven Two-Way Fixed Network solutions for advanced metering (Aclara Power-Line Systems and Aclara RF Systems), along with enterprise software that stands apart in its ability to optimize what smart meter data can accomplish for utilities and their customers (Aclara Software). With world-class fully automated intelligent instrumentation (Doble Engineering), ESCO is able to provide diagnostics, testing and monitoring capabilities,
North America
Cedar Park, TX
Cleveland, OH
Durant, OK
Glendale Heights, IL
Huntley, IL
South America
São Paulo, Brazil
Europe
Dresden, Germany
Eura, Finland
Guildford, England
Stevenage, England
Trondheim, Norway
Indianapolis, IN
Marlboro, MA
Minocqua, WI
Morrisville, NC
Oxnard, CA
Raleigh, NC
South El Monte, CA
St. Louis, MO
Watertown, MA
Wellesley, MA
Asia
Beijing, China
Shenyang, China
Tokyo, Japan
Vadodara, India
ESCO Operations
Markets Served
making ESCO a total solution provider to the utility industry. ESCO’s SecurVision® product line provides digital video surveil-lance and security functions for large commercial enterprises and alarm monitoring companies.
Electric, Gas, and Water Utilities; Security Industry
Filtration/Fluid Flow In this segment, PTI Technologies and VACCO Industries design and manufacture specialty filtration products including hydraulic fil-ter elements used in commercial aerospace applications, unique filter mechanisms used in micro-
propulsion devices for satellites and custom designed filters for manned and unmanned aircraft. ESCO’s TekPackaging unit provides highly engineered thermoforming products.
Aviation, Space, Medical, Electronics, Consumer
RF Shielding & Test ETS-Lindgren, in ESCO’s RF Shielding & Test segment, is the industry leader in providing customers with the ability to identify, measure and contain magnetic, electromag-netic and acoustic energy.
Healthcare, Electronics, Transportation
Africa
Pietermaritzburg, South Africa
Australia
Brendale, Australia
ESCO Technologies Inc. is a worldwide manufac-turer of highly engineered products operating in three business segments:
3

U t i l i t y S o l u t i o n s
clara offers a complete set of Advanced Metering
Infrastructure (AMI) solutions for end-to-end data
capture, transfer, and processing. The Aclara
brand represents the utility industry’s leading fixed-
network AMI technologies as well as Meter Data and
Meter Device Management software serving water, gas,
and electric utilities globally. Aclara’s innovations in
advanced metering, demand response, and smart-grid
management provide customers with proven solu-
tions that enable choice, efficiency, information and
customer value. Capturing data. Only Aclara delivers
the system scalability necessary to serve municipali-
ties, rural-electric cooperatives and investor-owned
utilities. Aclara’s STAR® Network system and TWACS®
technology provide advanced RF- and PLC-based fixed-
network technologies proven to meet the wide-rang-
ing data communications requirements of utilities
worldwide. Liberating knowledge. Utilities use
Aclara Software™ solutions to maximize
their AMI data and improve the quality of
customer services. Aclara Software applications add
value across the enterprise, addressing meter and
energy data management, distribution
planning and operations, customer service and reve-
nue management, and resource management. Aclara is
driven by its technologies, its people, and its experience.
The Aclara brand is revolutionizing the AMI industry
with innovative solutions that build on our 20-year his-
tory of excellence and market growth.
The Intelligence of Reliable Utility Performance™
Aclara Software’s leading,
proven-at-scale solutions
allow customers to manage
their energy use, enable
service representatives to
better handle inquiries,
and empower utilities to
improve operations with
better data analysis.
Aclara‘s innova-
tive and proven
market and technol-
ogy leadership in
Advanced Utility
Communications
Infrastructure sup-
ports electric, water,
and gas utilities.
Aclara’s STAR®
ZoneScan RF-based
solution is the indus-
try’s only remotely
correlated acoustic
leak-detection
system that
cost effectively
identifies small
leaks before they
become major
problems.
A
4

5
The “Doble Test”
evaluates the condi-
tion of high voltage
power apparatus
as part of routine
maintenance checks
using the Doble
M4000 analyzer.
With Doble’s M4000
analyzer, users can
compare their test
results with a sta-
tistically significant
on-line database.
World Leader in Diagnostic Test Instruments and Knowledge Services for Electric Power
On-line water–in-oil
sensor testing is
performed in Doble
Laboratories.
Doble Engineering, the newest member of ESCO’s
Utility Solutions segment, pioneered the design
and manufacture of the high voltage insula-
tion diagnostic test. Recognized as the “gold standard”
for high quality, performance and reliability, Doble’s
proprietary instruments and consulting services for
analyzing and interpreting test data enable power
system operators to make mission critical decisions.
With its Doble Test Assistant software, DTAWeb, Doble’s
utility clients can compare their Doble test results with
those of the industry via a state-of-the-art, web-based
data management and analysis system. Enhanced
to include Sweep Frequency Response Analysis (SFRA)
and Laboratory test results, the system exemplifies
Doble’s ongoing commitment to customer-focused solu-
tions. The recent acquisition of LDIC, GmbH in Europe,
positioned Doble to increase its portfolio of products
and significantly expand its distribution channels
throughout Europe. With LDIC, a leading supplier of
partial discharge testing instruments used to assess
the integrity of high voltage power delivery equipment,
both companies can deliver a complete suite of diagnos-
tic solutions to its customers worldwide.
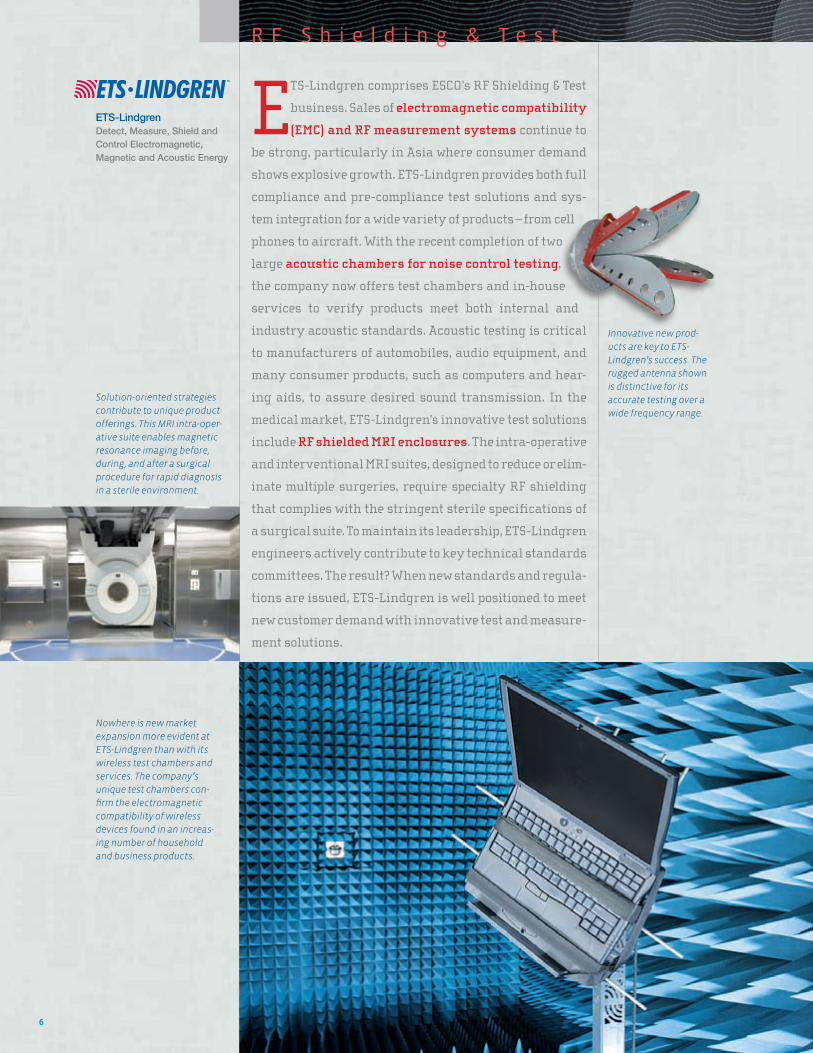
ETS-Lindgren comprises ESCO’s RF Shielding & Test
business. Sales of electromagnetic compatibility
(EMC) and RF measurement systems continue to
be strong, particularly in Asia where consumer demand
shows explosive growth. ETS-Lindgren provides both full
compliance and pre-compliance test solutions and sys-
tem integration for a wide variety of products – from cell
phones to aircraft. With the recent completion of two
large acoustic chambers for noise control testing,
the company now offers test chambers and in-house
services to verify products meet both internal and
industry acoustic standards. Acoustic testing is critical
to manufacturers of automobiles, audio equipment, and
many consumer products, such as computers and hear-
ing aids, to assure desired sound transmission. In the
medical market, ETS-Lindgren’s innovative test solutions
include RF shielded MRI enclosures. The intra-operative
and interventional MRI suites, designed to reduce or elim-
inate multiple surgeries, require specialty RF shielding
that complies with the stringent sterile specifications of
a surgical suite. To maintain its leadership, ETS-Lindgren
engineers actively contribute to key technical standards
committees. The result? When new standards and regula-
tions are issued, ETS-Lindgren is well positioned to meet
new customer demand with innovative test and measure-
ment solutions.
ETS-Lindgren Detect, Measure, Shield and Control Electromagnetic, Magnetic and Acoustic Energy
Solution-oriented strategies
contribute to unique product
offerings. This MRI intra-oper-
ative suite enables magnetic
resonance imaging before,
during, and after a surgical
procedure for rapid diagnosis
in a sterile environment.
Nowhere is new market
expansion more evident at
ETS-Lindgren than with its
wireless test chambers and
services. The company’s
unique test chambers con-
firm the electromagnetic
compatibility of wireless
devices found in an increas-
ing number of household
and business products.
R F S h i e l d i n g & T e s t
6
Innovative new prod-
ucts are key to ETS-
Lindgren’s success. The
rugged antenna shown
is distinctive for its
accurate testing over a
wide frequency range.

PTI Technologies Inc. (PTI) and VACCO Industries
(VACCO) comprise the Company’s Filtration/Fluid
Flow business. These two companies serve an
array of technically demanding, solution-oriented mar-
kets such as automotive, air transport, defense, medical
and satellite communications. Their technical knowl-
edge, experience and capabilities have enabled them to
provide winning solutions across all served markets.
Space and Aerospace Filtration. In practice, a solu-
tion-oriented strategy recognizes that success is
best measured by the solution which most compre-
hensively addresses the customer’s needs; one
which is best achieved through mutual com-
mitment and collaboration between parties.
PTI’s recent award of the main hydrau-
lics filtration system for the Airbus A350
XWB aircraft exemplifies the benefits of this approach.
Industrial Filtration. Commercial competitiveness is
the hallmark of this industry. Whether maintaining
an existing product position or tactically pursuing
new markets, technical superiority, increased value
and next generation innovations have been key to PTI’s
success. Engineered Fluid Controls. Taking a leading
role in the cooperative development of advanced solu-
tions with NASA, VACCO is ensuring that its fluid con-
trols components will best support the needs of Project
Constellation, the nation’s new manned space program.
Whether produced for
ground, flight or beyond,
the Filtration/Fluid
Flow group continues to
innovate, produce and
support technically best
in class product.
Utilizing extensive
heritage from the Space
Shuttle, such as this
2-inch cryogenic ball
valve, VACCO has begun
the development of
innovative solutions for
Project Constellation.
PTI Technologies Inc. Filtration and Fluid Flow Products for Industrial and Aerospace Markets
PTI’s filtration and fluid
flow products are the
result of custom develop-
ment of engineered solu-
tions for both commercial
and military platforms.
F i l t r a t i o n / F l u i d F l o w
VACCOVACCO Industries Engineered Fluid Controls and Etched Products
7

In its second full year of operation, the ESCO Technologies Foundation expanded its reach supporting
children and families in need in areas where the Company has operations. With funding from the
Company, as well as generous donations from employees and other contributors, the Foundation
added a number of new grant recipients in 2008. A few of the recipients are highlighted below.
Circle of Concern provides food and emergency aid to needy families in the St. Louis area. Its food
pantry feeds as many as 1,000 people a month. A grant was made by the Foundation for the purchase
of perishable foods for approximately 200 families. In addition, employees at the Company’s corporate
headquarters participate in a monthly food drive to supply Circle of Concern families with non-perishable
items such as cereal and canned goods.
Kenneth Young Center, located in Elk Grove Village, Illinois, provides mental health and senior citizen
support services through counseling and other support services. In 2008, the Foundation made its largest
grant to-date in the amount of $15,000 to the Kenneth Young Center to provide training in parenting with
its new Peer Parent Mentoring Program.
Jennifer S. Fallick Center provides free support services to men, women and children who are affect-
ed by cancer in Chicago suburbs. This year’s grant from the Foundation was designated for the Kid’s Corner
Program which provides counseling for children
affected by the disease.
Casa Pacifica received a Foundation grant to
support the operation of its Crisis Care Shelter
in the areas of Ventura and Santa Barbara County, California. The shelter offers a range of assessment,
trauma care, medical and educational services for abused and neglected children who have been removed
from their homes.
The Gathering Place is an organization offering a caring community for those touched by cancer in
the Cleveland area. The Foundation’s grant will provide general support to The Gathering Place in its
efforts to educate, support and empower individuals and families as they struggle with cancer.
The Littlest Heroes of Chesterland, Ohio, was the recipient of a grant from the Foundation
for its Littlest Heroes’ Complementary Medicine Therapy Program. Funding will be used to
train, screen and compensate the program’s practitioners as they provide spiritual,
emotional, social and physical activity for children with cancer.
R. M. Pyles Boys Camp in California, operates a wilderness camp for at-risk,
low-income boys from12 to 18 years of age. With a grant from the Foundation,
two boys from Ventura County, California were sponsored to attend the R. M.
Pyles Camp and funding was provided to help offset the high cost of fuel for
the generator that provides power for the facility.
Habitat For Humanity Valley of the Sun strives to eliminate sub-standard
housing. The Foundation’s grant will go toward the cost of materials to build a
home by the Habitat Arizona chapter.
Horizons for Homeless Children in the Boston area, strives to improve the lives of
children and parents living in homeless shelters. In 2008, the Foundation granted fund-
ing to be used to provide free day care services for homeless preschool-age children
while their parents are working. With this help, it is the hope that the families will
be able to eventually transition out of the homeless shelter.
C o m m i t m e n t T o C o m m u n i t i e s
To make a tax-deductible contribution or to learn more
about the Foundation, please call 314-213-7277 or visit
the Web site at www.escotechnologiesfoundation.org.
Pioneer Center of
McHenry County, Illinois,
helps disabled children
and the homeless. In 2008,
a Foundation grant was
made to assist with win-
ter heating bills
at the Center’s
group homes.
Ready Readers and its
volunteer readers, inspire
at-risk St. Louis preschool
children to become readers.
New books for children in
the reading program were
purchased with a grant
from the Foundation.
8

F i n a n c i a l S e c t i o n
Table Of Contents
Management’s Discussion and Analysis 10
Consolidated Statements of Operations 21
Consolidated Balance Sheets 22
Consolidated Statements of Shareholders’ Equity 24
Consolidated Statements of Cash Flows 25
Notes to Consolidated Financial Statements 26
Management’s Statement of Financial Responsibility 43
Management’s Report on Internal Control Over Financial Reporting 44
Report of Independent Registered Public Accounting Firm 45
Five-Year Financial Summary 46
Market Performance 47
Shareholders’ Summary 48
Management and Board of Directors 49
9E S C O T E C h n O l O g i E S i n C . 2 0 0 8 A n n u A l R E p O R T
E S C O T E C h n O l O g i E S i n C . 2 0 0 8 A n n u A l R E p O R T10
Management’s Discussion and Analysis
The following discussion should be read in conjunction with the Consolidated Financial Statements and Notes thereto. The years 2008, 2007 and 2006 represent the fiscal years ended September 30, 2008, 2007 and 2006, respectively, and are used throughout the document.
introduction
ESCO Technologies Inc. and its wholly owned subsidiaries (ESCO, the Company) are organized into three reporting segments: Utility Solutions Group (USG), RF Shielding and Test (Test), and Filtration/Fluid Flow (Filtration). In conjunction with the acquisition of Doble Engineering Company in November 2007, the Company changed the name of the Communications segment to the Utility Solutions Group segment. The renaming of this segment more accurately describes the segment’s operating activities and reflects the strategic alignment of the respective operating entities to focus on a single goal of satisfying the expanding Advanced Metering Infrastructure (AMI), Smart Grid, and other operational requirements of electric, gas and water utilities worldwide. The segment name change was done along with the Company’s strategic integration and rebranding of its three AMI related technologies under the unified brand name Aclara™, and renaming the AMI businesses as follows: Distribution Control Systems, Inc. was renamed Aclara Power-Line Systems Inc.; Hexagram, Inc. was renamed Aclara RF Systems Inc.; and Nexus Energy Software, Inc. was renamed Aclara Software Inc.
The Company’s business segments are comprised of the following primary operating entities:
▶ USG: Aclara Power-Line Systems Inc. (Aclara PLS), Aclara RF Systems Inc. (Aclara RF), Aclara Software Inc., Doble Engineering Company (Doble), and Comtrak Technologies, L.L.C. (Comtrak),
▶ Test: EMC Group companies consisting primarily of ETS-Lindgren L.P. (ETS) and Lindgren R.F. Enclosures, Inc. (Lindgren), and
▶ Filtration: PTI Technologies Inc. (PTI), VACCO Industries (VACCO), and TekPackaging L.L.C. (TekPack).
The USG segment is a proven supplier of special purpose fixed network communications systems for electric, gas and water utilities, including hardware and software to support advanced metering applications. Aclara’s STAR® Network system and TWACS® technology provide advanced radio-frequency (RF) and power-line (PLS) based fixed-network technologies proven to meet the wide-ranging data communications requirements of utilities worldwide. Aclara Software applications add value across the utility enterprise, addressing meter and energy data management, distribution planning and operations, customer service and revenue management. Doble provides high-end, diagnostic test solutions for the electric power delivery industry and is a leading supplier
of partial discharge testing instruments used to assess the integrity of high voltage power delivery equipment. Comtrak’s SecurVision® product line provides digital video surveillance and security functions for large commercial enterprises and alarm monitoring companies.
The Test segment is an industry leader in providing its customers with the ability to identify, measure and contain magnetic, electromagnetic and acoustic energy.
The Filtration segment designs and manufactures specialty filtration products including hydraulic filter elements used in commercial aerospace applications, unique filter mechanisms used in micro propulsion devices for satellites and custom designed filters for manned and unmanned aircraft.
On November 25, 2007, the Company completed the sale of the filtration portion of Filtertek Inc. (Filtertek); accordingly, the Filtertek businesses are reflected as discontinued operations in the financial statements and related notes for all periods presented.
ESCO continues to operate with meaningful growth prospects in its primary served markets and with considerable financial flexibility. The Company continues to focus on new products that incorporate proprietary design and process technologies. Management is committed to delivering shareholder value through internal growth, ongoing performance improvement initiatives, and selective acquisitions.
highlights of 2008 Continuing Operations
▶ Sales, net earnings and diluted earnings per share were $623.8 million, $47.4 million and $1.80 per share, respectively.
▶ Net cash provided by operating activities was $81.0 million.
▶ At September 30, 2008, cash on hand was $28.7 million.
▶ On November 30, 2007, the Company acquired Doble and on July 31, 2008, the Company acquired LDIC GmbH and LDIC AG (collectively “LDIC”).
▶ In 2008, the Company received $111.8 million in orders and recorded $110.2 million in sales from Pacific Gas & Electric Company (PG&E) related to its electric and gas AMI deployment.
▶ Aclara RF received an order for a fixed network water AMR project in New York City, with a value up to $68.3 million over a three-year deployment period.
▶ Aclara PLS’s TWACS® AMI product was selected by Idaho Power Company for its entire electric service territory. The Company expects orders up to $25 million related to this three-year deployment beginning in early fiscal 2009.
▶ Aclara PLS received $22.4 million in orders from the Puerto Rico Electric Power Authority (PREPA).

E S C O T E C h n O l O g i E S i n C . 2 0 0 8 A n n u A l R E p O R T 11
Management’s Discussion and Analysis
Results of Continuing Operations
nET SAlES
Change Change Fiscal year ended 2008 2007(Dollars in millions) 2008 2007 2006 vs. 2007 vs. 2006
USG $362.9 197.6 156.2 83.7% 26.5%
Test 144.8 141.5 128.6 2.3% 10.0%
Filtration 116.1 105.6 97.6 9.9% 8.2%
Total $623.8 444.7 382.4 40.3% 16.3%
uSg
The 83.7% or $165.3 million increase in net sales in 2008 as compared to the prior year was due to: the acquisition of Doble with sales of $74.3 million; a $55.4 million increase in sales from Aclara RF primarily due to higher gas and electric AMI deliveries at PG&E; a $31.7 million increase in sales from Aclara PLS; and a $3.0 million increase in sales from Comtrak. The Company’s total sales to PG&E were $110.2 million in 2008 which represented approximately 18% of the Company’s consolidated net sales.
The $31.7 million increase in Aclara PLS’s net sales in 2008 compared to 2007 was mainly due to: a $34.0 million increase in sales to PG&E for the electric AMI deployment (due to the recognition of previously deferred revenue from the hardware, program management and software provided to PG&E), a $16.8 million increase in sales to the Puerto Rico Electric Power Authority (PREPA), partially offset by a $18.4 million decrease in sales to other investor owned utilities (IOU) customers, such as Duke Energy and Oncor Electric.
The 26.5% or $41.4 million increase in net sales in 2007 as compared to the prior year was due to: an increase of $30.5 million at Aclara RF; an increase of $6.5 million at Aclara PLS; an increase in sales of $4.6 million at Aclara Software.
The $30.5 million increase in sales of Aclara RF’s AMI products in 2007 as compared to 2006 was due to: a $21.6 million increase in sales to PG&E related to their gas deployment; and a $3.1 million increase in sales from the advanced metering project in Kansas City, Missouri. In addition, Aclara RF’s 2007 results represented twelve months of sales compared to eight months in 2006.
Test
The net sales increase of $3.3 million or 2.3% in 2008 as compared to the prior year was mainly due to: a $5.2 million increase in net sales from the segment’s European operations; a $2.7 million increase in net sales from the segment’s Asian operations; partially offset by a $4.6 million decrease in net sales from the segment’s U.S. operations due to the timing of test chamber sales and sales of components.
The net sales increase of $12.9 million or 10.0% in 2007 as compared to the prior year was mainly due to: a $10.6 million
increase in net sales driven by project milestones on a large international aircraft chamber and completion of other test chambers; a $3.2 million increase in net sales from the segment’s Asian operations; partially offset by a $0.9 million decrease in net sales from the segment’s European operations.
Filtration
Net sales in 2008 increased $10.5 million or 9.9% compared to the prior year primarily due to a $5.5 million increase in commercial aerospace shipments at PTI and a $3.5 million increase in net sales at VACCO driven by higher space product shipments.
Net sales in 2007 increased $8.0 million or 8.2% compared to 2006 primarily as a result of higher commercial aerospace shipments at PTI of $6.4 million; a sales increase of $4.9 million at VACCO driven by higher defense spares and T-700 shipments; partially offset by a $3.1 million net sales decrease at TekPack driven by lower commercial product shipments.
pACiFiC gAS & ElECTRiC
Aclara plS
In November 2005, Aclara PLS (then named Distribution Control Systems, Inc.) entered into a contract (the “Aclara PLS Contract”) to provide equipment, software and services to Pacific Gas & Electric (PG&E) in support of the electric portion of PG&E’s AMI project. During the third quarter of 2007, PG&E announced its plans to evaluate alternative electric AMI technologies for the electric portion of its service territory currently included in the Aclara PLS Contract.
In light of PG&E’s announcement and its subsequent purchase of other technologies, including products from Aclara RF described below, for the electric portion of its service territory, Aclara PLS and PG&E entered into an amendment to the Aclara PLS Contract effective September 30, 2008 (the “Aclara PLS Amendment”). Execution of the Aclara PLS Amendment allowed the Company to recognize approximately $11.0 million of revenue and $6.5 million of profit during the fourth quarter of 2008. This revenue consisted of deferred program management services, software license fees and compensation for a shortfall in equipment purchases by PG&E, as all remaining undelivered elements are elements for which the Company has vendor-specific objective evidence. The Company now believes that further purchases, if any, made by PG&E under the Aclara PLS Contract will not be material. Total revenues under the Aclara PLS Contract were $34.3 million for the year ended Septem-ber 30, 2008.
Aclara RF
In November 2005, Aclara RF entered into a contract (the “Aclara RF Contract”) to provide equipment, software and services to PG&E in support of the gas utility portion of PG&E’s AMI project. The Aclara RF Contract also provided PG&E the option to purchase an RF fixed network electric product from Aclara RF. The total anticipated contract revenue from the gas portion of the Aclara RF Contract

12 E S C O T E C h n O l O g i E S i n C . 2 0 0 8 A n n u A l R E p O R T
from commencement through the five-year full deployment is expected to be up to approximately $225 million. As with the Aclara PLS Contract, equipment will be purchased only upon issuance of purchase orders and release authorizations, and PG&E will continue to have the right to purchase products or services from other suppliers for the gas and electric utility portion of the AMI project. The Aclara RF Contract provides for liquidated damages in the event of late deliveries, includes indemnification and other customary provisions, and may be terminated by PG&E for default, for its convenience and in the event of a force majeure lasting beyond certain prescribed periods. The Company has guaranteed the performance of the contract by Aclara RF.
Prior to PG&E’s announced decision in 2007 to evaluate alternative electric AMI technologies mentioned above, Aclara RF agreed to provide 2,000 of its RF fixed network electric units for PG&E testing. Testing of Aclara RF’s prototype electric solution began in the fourth quarter of 2007 and those units continue to perform in the field. During fiscal 2008, PG&E ordered approximately 290,000 second generation Aclara RF fixed network electric units which offer additional features and functionality. Also during this period, PG&E purchased electric units from a competing AMI vendor. Aclara RF and PG&E are negotiating an amendment to the Aclara RF Contract (the “Aclara RF Contract Amendment”) which would establish and define the technical specifications of Aclara RF’s electric solution and define the terms applicable to PG&E’s purchase of any additional RF fixed network electric units. Notwithstanding the expected execution of the Aclara RF Contract Amendment, due to the uncertainty regarding PG&E’s future plans for deployment of electric units, the Company cannot estimate the total value or the timing of orders, if any, that it may receive under the Aclara RF Contract Amendment.
ORDERS AnD BACKlOg
New orders received in 2008 were $633.0 million, resulting in order backlog from continuing operations of $266.8 million at Sep-tember 30, 2008 as compared to an order backlog of $257.6 million at September 30, 2007. In 2008, the Company recorded $365.3 mil-lion of new orders related to USG products (including $7.0 million of Doble acquired backlog), $154.5 million related to Test products, and $113.2 million related to Filtration products.
The Company received orders totaling $111.8 million and $49.1 million from PG&E under the Aclara PLS and RF Contracts during 2008 and 2007, respectively.
In July 2008, ETS-Lindgren signed a $16.7 million contract with the National Automotive Testing and R&D Infrastructure Project (NATRIP) in India to provide two automotive chambers.
In July 2008, Aclara RF was selected by the City of New York to provide its fixed network AMI solution for the city’s entire water service territory. The total value of purchase orders anticipated to be issued under this contract is up to $68.3 million and the system is expected to be deployed over a three-year period with the initial orders received during the fourth quarter of 2008.
In July 2008, Aclara PLS’s TWACS® AMI product was selected by Idaho Power Company for its entire electric service territory. The total value of purchase orders anticipated to be issued under this contract are up to $25 million and the system is expected to be deployed over a three-year period beginning in early fiscal 2009.
In December 2007, Aclara PLS signed a contract with PREPA for a total value expected to be up to $35 million for the purchase of Aclara PLS products to be released through the placement of purchase orders. The Company recorded $22.4 million in entered orders related to this contract during 2008.
In 2007, the Company recorded $201.8 million of new orders related to Utility Solutions products, $145.5 million related to Test products and $122.9 million related to Filtration products.
SElling, gEnERAl AnD ADMiniSTRATiVE EXpEnSES
Selling, general and administrative expenses (SG&A) were $151.2 million, or 24.2% of net sales in 2008, $111.6 million, or 25.1% of net sales in 2007, and $95.9 million, or 25.1% of net sales in 2006.
The increase in SG&A expenses in 2008 as compared to 2007 was primarily due to: $24.8 million of SG&A expenses related to Doble and an approximately $12.0 million increase in SG&A expenses related to Aclara mainly due to an increase in sales, marketing, and engineering head count.
The increase in SG&A expenses in 2007 as compared to the prior year was primarily due to: a $12.0 million increase in SG&A related to Aclara mainly due to an increase in engineering and software development head count; and an increase of $2.1 million incurred in the Test segment primarily to support new growth opportunities in Asia. In addition, a full twelve months of SG&A expenses were included in 2007 for Aclara RF and Aclara Software compared to eight months and ten months, respectively, in 2006.
AMORTiZATiOn OF inTAngiBlE ASSETS
Amortization of intangible assets was $17.6 million in 2008, $10.2 million in 2007 and $6.4 million in 2006. Amortization of intangible assets included $4.2 million and $2.1 million of amortization of acquired intangible assets related to the Company’s acquisitions in 2008 and 2007, respectively. The amortization of acquired intangible assets related to the Company’s acquisitions is included in the Corporate operating segment’s results. The remain-ing amortization expenses consist of other identifiable intangible assets (primarily software, patents and licenses). The Company recorded $11.0 million and $6.2 million in 2008 and 2007, respectively, related to Aclara PLS’s TWACS NG capitalized software.
OThER EXpEnSES (inCOME), nET
Other expenses (income), net, were $0.1 million, $2.8 million and $(2.7) million in 2008, 2007 and 2006, respectively. There were no individually significant items included in other expenses (income), net for the year ended September 30, 2008.
Management’s Discussion and Analysis
E S C O T E C h n O l O g i E S i n C . 2 0 0 8 A n n u A l R E p O R T 13
Management’s Discussion and Analysis
Other expenses (income), net, in 2007 consisted primarily of: $2.6 million of expenses within the Test segment related to an adverse arbitration award related to the delivery and installation contract completed in 2005 for a shielded communication room in an international location; partially offset by $(0.6) million of royalty income. Other expenses (income), net, in 2006 consisted primarily of: a $(1.8) million non-cash gain representing the reversal of a liability related to an indemnification obligation with respect to a previously divested subsidiary; and $(1.4) million of royalty income.
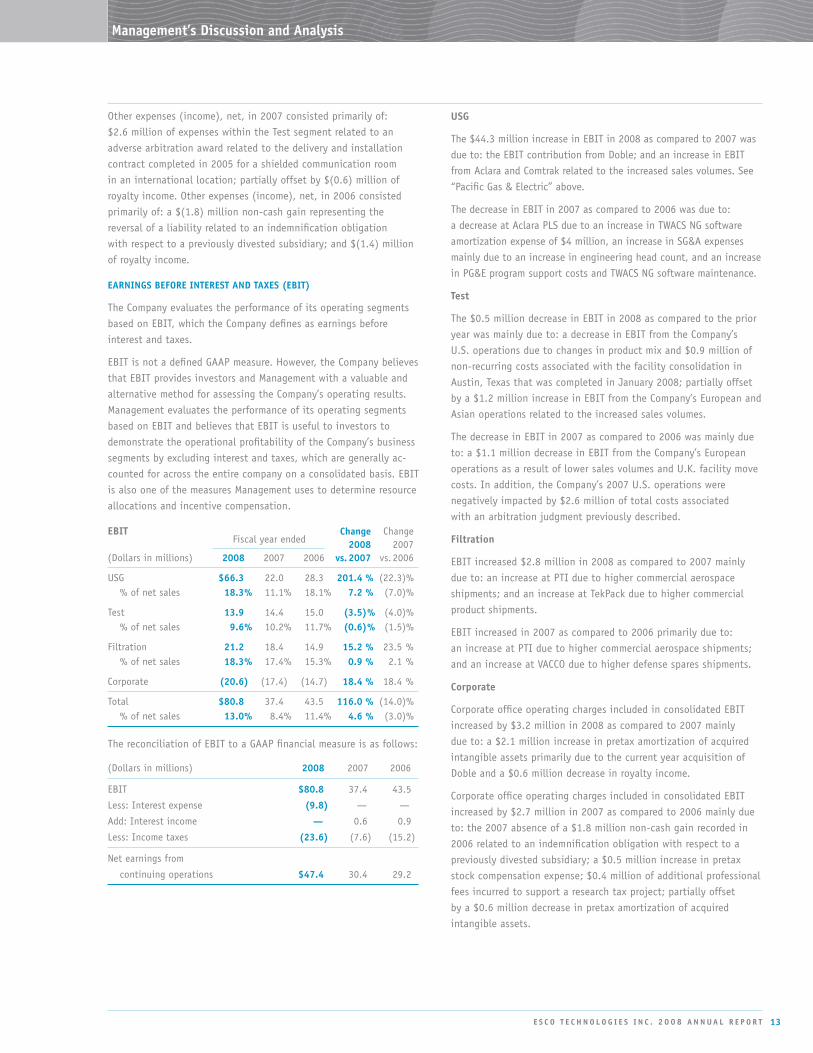
EARningS BEFORE inTEREST AnD TAXES (EBiT)
The Company evaluates the performance of its operating segments based on EBIT, which the Company defines as earnings before interest and taxes.
EBIT is not a defined GAAP measure. However, the Company believes that EBIT provides investors and Management with a valuable and alternative method for assessing the Company’s operating results. Management evaluates the performance of its operating segments based on EBIT and believes that EBIT is useful to investors to demonstrate the operational profitability of the Company’s business segments by excluding interest and taxes, which are generally ac-counted for across the entire company on a consolidated basis. EBIT is also one of the measures Management uses to determine resource allocations and incentive compensation.
EBiT Change Change Fiscal year ended 2008 2007(Dollars in millions) 2008 2007 2006 vs. 2007 vs. 2006
USG $66.3 22.0 28.3 201.4 % (22.3) % % of net sales 18.3% 11.1% 18.1% 7.2 % (7.0) %
Test 13.9 14.4 15.0 (3.5) % (4.0) % % of net sales 9.6% 10.2% 11.7% (0.6) % (1.5) %
Filtration 21.2 18.4 14.9 15.2 % 23.5 % % of net sales 18.3% 17.4% 15.3% 0.9 % 2.1 %
Corporate (20.6) (17.4) (14.7) 18.4 % 18.4 %
Total $80.8 37.4 43.5 116.0 % (14.0) % % of net sales 13.0% 8.4% 11.4% 4.6 % (3.0) %
The reconciliation of EBIT to a GAAP financial measure is as follows:
(Dollars in millions) 2008 2007 2006
EBIT $80.8 37.4 43.5
Less: Interest expense (9.8) — —
Add: Interest income — 0.6 0.9
Less: Income taxes (23.6) (7.6) (15.2)
Net earnings from
continuing operations $47.4 30.4 29.2
uSg
The $44.3 million increase in EBIT in 2008 as compared to 2007 was due to: the EBIT contribution from Doble; and an increase in EBIT from Aclara and Comtrak related to the increased sales volumes. See “Pacific Gas & Electric” above.
The decrease in EBIT in 2007 as compared to 2006 was due to: a decrease at Aclara PLS due to an increase in TWACS NG software amortization expense of $4 million, an increase in SG&A expenses mainly due to an increase in engineering head count, and an increase in PG&E program support costs and TWACS NG software maintenance.
Test
The $0.5 million decrease in EBIT in 2008 as compared to the prior year was mainly due to: a decrease in EBIT from the Company’s U.S. operations due to changes in product mix and $0.9 million of non-recurring costs associated with the facility consolidation in Austin, Texas that was completed in January 2008; partially offset by a $1.2 million increase in EBIT from the Company’s European and Asian operations related to the increased sales volumes.
The decrease in EBIT in 2007 as compared to 2006 was mainly due to: a $1.1 million decrease in EBIT from the Company’s European operations as a result of lower sales volumes and U.K. facility move costs. In addition, the Company’s 2007 U.S. operations were negatively impacted by $2.6 million of total costs associated with an arbitration judgment previously described.
Filtration
EBIT increased $2.8 million in 2008 as compared to 2007 mainly due to: an increase at PTI due to higher commercial aerospace shipments; and an increase at TekPack due to higher commercial product shipments.
EBIT increased in 2007 as compared to 2006 primarily due to: an increase at PTI due to higher commercial aerospace shipments; and an increase at VACCO due to higher defense spares shipments.
Corporate
Corporate office operating charges included in consolidated EBIT increased by $3.2 million in 2008 as compared to 2007 mainly due to: a $2.1 million increase in pretax amortization of acquired intangible assets primarily due to the current year acquisition of Doble and a $0.6 million decrease in royalty income.
Corporate office operating charges included in consolidated EBIT increased by $2.7 million in 2007 as compared to 2006 mainly due to: the 2007 absence of a $1.8 million non-cash gain recorded in 2006 related to an indemnification obligation with respect to a previously divested subsidiary; a $0.5 million increase in pretax stock compensation expense; $0.4 million of additional professional fees incurred to support a research tax project; partially offset by a $0.6 million decrease in pretax amortization of acquired intangible assets.

14 E S C O T E C h n O l O g i E S i n C . 2 0 0 8 A n n u A l R E p O R T
The “Reconciliation to Consolidated Totals (Corporate)” in Note 15 to the Consolidated Financial Statements represents Corporate office operating charges.
inTEREST EXpEnSE (inCOME), nET
Interest expense was $9.8 million in 2008 compared to interest income of $(0.6) million and $(0.9) million in 2007 and 2006, respectively. The increase in interest expense in 2008 as compared to the prior year periods was due to the outstanding borrowings under the revolving credit facility related to the Doble acquisition.
inCOME TAX EXpEnSE
The 2008 effective tax rate from continuing operations was 33.3% compared to 20.1% in 2007 and 34.3% in 2006. The increase in the 2008 effective tax rate as compared to the prior year was due to lower tax credits as compared to 2007. The research tax credit reduced 2008 income tax expense by $1.0 million and the effec-tive tax rate by 1.4% and 2007 income tax expense by $4.4 million and the 2007 effective tax rate by 11.6%; the impact of an export incentive reduced 2008 income tax expense by $1.6 million and the effective tax rate by 2.2%; the impact of the domestic production deduction reduced 2008 income tax expense by $0.8 million and the effective tax rate by 1.1%.
The decrease in the 2007 effective tax rate as compared to 2006 was due to: the impact of the research tax credit reduced 2007 income tax expense by $4.4 million and the effective tax rate by 11.6%; resolution of certain tax exposure items reduced 2007 income tax expense by $2.3 million and the effective tax rate by 5.9%; the release of a portion of the valuation allowance on capital loss carryforward reduced income tax expense by $0.8 million and the effective tax rate by 2.0%; and the effect of deferring U.S. tax on foreign earnings and adjustments to foreign tax accruals reduced 2007 tax expense by $0.5 million and the effective tax rate by 1.3%. The Company recorded $1.3 million as a cumulative credit to adjust previously recorded tax amounts during 2007.
Capital Resources and liquidity
Working capital from continuing operations (current assets less cur-rent liabilities) decreased to $102.0 million at September 30, 2008 from $122.5 million at September 30, 2007.
The $50.1 million increase in accounts receivable at September 30, 2008 is mainly due to: $21.3 million related to the Doble acquisi-tion, $18.4 million related to the USG segment and $7.2 million related to the Test segment, both due to timing and increased volume of sales. The $11.1 million increase in inventories at September 30, 2008 is mainly due to the Doble acquisition. Other current assets decreased by $12.9 million due to the decrease in deferred costs at Aclara PLS due to the revenue recognized under the Aclara PLS PG&E agreement. Current maturities of long-term
debt increased $50 million at September 30, 2008 due to the Company’s outstanding borrowings related to the Doble acquisition.
Net cash provided by operating activities from continuing opera-tions was $81.0 million, $46.1 million and $57.5 million in 2008, 2007 and 2006, respectively. The increase in 2008 is related to improvements in operating working capital requirements.
Capital expenditures from continuing operations were $16.7 million, $12.4 million and $5.8 million in 2008, 2007 and 2006, respective-ly. The increase in 2008 compared to 2007 included approximately $3 million for the ETS Austin, Texas facility expansion. There were no commitments outstanding that were considered material for capital expenditures at September 30, 2008.
At September 30, 2008, intangible assets, net, of $238.2 million included $63.8 million of capitalized software. Approximately $53.9 million of the capitalized software balance represents software development costs on the TWACS NG software within the USG segment. TWACS NG software is being deployed to efficiently handle the additional levels of communications dictated by the size of the utility service territories and the frequency of meter reads that are required under time-of-use or critical peak pricing scenarios to meet the requirements of large IOUs. Amortization is on a straight-line basis over seven years and began in March 2006. The Company recorded $11.0 million and $6.2 million in amortization expense related to TWACS NG during 2008 and 2007, respectively.
DiVESTiTuRE
On November 25, 2007, the Company completed the sale of the filtration portion of Filtertek Inc. (Filtertek) to Illinois Tool Works Inc. for $74.4 million, net. The TekPack division of Filtertek was not included in the transaction. The Filtertek businesses are accounted for as discontinued operations in accordance with SFAS No. 144, “Accounting for the Impairment or Disposal of Long-Lived Assets.” Accordingly, the Filtertek businesses are reflected as discontinued operations in the financial statements and related notes for all periods presented. A pretax loss of $0.2 million related to Filtertek is reflected in the Company’s fiscal 2008 results in discontinued operations. Filtertek’s net sales were $13.7 million for the two-month period ended November 25, 2007. Filtertek’s net sales were $82.8 million and $76.5 million for the years ended September 30, 2007 and 2006, respectively. The pretax earnings from operations from the Filtertek businesses were $4.7 million and $4.5 million for the years ended September 30, 2007 and 2006, respectively. Upon receipt of the final purchase price allocation in the fourth quarter of 2008, the Company reduced its expected tax expense on the sale of Filtertek from $4.8 million to $0.2 million. Filtertek’s operations were included within the Company’s Filtration segment prior to divestiture. The operations of the TekPack business are reflected in continuing operations and continue to be included in the Filtration segment.
Management’s Discussion and Analysis

E S C O T E C h n O l O g i E S i n C . 2 0 0 8 A n n u A l R E p O R T 15
Management’s Discussion and Analysis
ACQuiSiTiOnS
Doble
On November 30, 2007, the Company acquired the capital stock of Doble for a purchase price of approximately $328 million, net of cash acquired. Doble, headquartered in Watertown, Massachusetts, is a worldwide leader in providing high-end diagnostic test solutions for the electric utility industry. The acquisition aligns with the Company’s long-term growth strategy of expanding its products and services in the utility industry. The acquisition was funded by a combination of the Company’s existing cash, including the proceeds from the divestiture of Filtertek, and borrowings under a new $330 million credit facility led by National City Bank. The operating results for Doble, since the date of acquisition, are included within the USG segment.
lDiC
On July 31, 2008, the Company acquired the capital stock of LDIC GmbH and LDIC AG (collectively “LDIC”) for a purchase price of approximately $13 million, net of cash acquired. LDIC, with operations in Germany and Switzerland, is a manufacturer of partial discharge diagnostic testing instruments and systems serving the international electric utility industry with annual revenues of approximately $10 million. The operating results for LDIC, since the date of acquisition, are included within Doble in the USG segment. The acquisition serves to broaden the portfolio of intelligent diagnostic products and will expand the distribution channels for Doble’s products and services throughout Europe.
All of the Company’s acquisitions have been accounted for using the purchase method of accounting, and accordingly, the respective purchase prices were allocated to the assets (including intangible assets) acquired and liabilities assumed based on estimated fair values at the date of acquisition. The financial results from these acquisitions have been included in the Company’s financial statements from the date of acquisition.
BAnK CREDiT FACiliTY
On November 30, 2007, in conjunction with the acquisition of Doble, the Company entered into a new $330 million five-year revolving credit facility with a $50 million increase option. This facility replaced the Company’s $100 million credit facility. The credit facility is available for direct borrowings and/or the issuance of letters of credit, and is provided by a group of sixteen banks, led by National City Bank as agent, with a maturity of November 30, 2012. In October 2008, PNC Financial Services Group Inc. agreed to purchase National City Bank. The Company anticipates no material changes to the terms of its credit facility due to this transaction.
The credit facility requires, as determined by certain financial ratios, a facility fee ranging from 15 to 25 basis points per annum on the unused portion. The terms of the facility provide that inter-est on borrowings may be calculated at a spread over the LIBOR or based on the prime rate, at the Company’s election. The credit facility is secured by the unlimited guaranty of the Company’s mate-rial domestic subsidiaries and a 65% pledge of the material foreign subsidiaries’ share equity. The financial covenants of the credit facility include a leverage ratio and an interest coverage ratio.
At September 30, 2008, the Company had approximately $90 mil-lion available to borrow under the credit facility, plus a $50 million increase option, in addition to its $28.7 million cash on hand. At September 30, 2008, the Company had outstanding borrowings of $233.7 million, and outstanding letters of credit of $6.6 million. The Company classified $50 million as the current portion on long-term debt as of September 30, 2008, as the Company intends to repay this amount within the next twelve months. As of September 30, 2008, the Company was in compliance with all bank covenants.
Cash flow from operations and borrowings under the bank credit facility are expected to provide adequate resources to meet the Company’s capital requirements and operational needs for the foreseeable future.
COnTRACTuAl OBligATiOnS
The following table shows the Company’s contractual obligations as of September 30, 2008:
(Dollars in millions) Payments due by period
Less More Contractual than 1 to 3 3 to 5 thanObligations Total 1 year years years 5 years
Long-Term Debt Obligation $ 233.7 50.0 — 183.7 —
Estimated Interest Payments(1) 18.5 9.8 8.7 — —
Operating Lease Obligations 25.2 7.3 9.9 6.0 2.0
Purchase Obligations(2) — — — — —
Total $ 277.4 67.1 18.6 189.7 2.0
(1) Estimated interest payments for the Company’s debt obligations were calculated
based on management’s determination of the estimated applicable interest rates
and payment dates.
(2) A purchase obligation is defined as a legally binding and enforceable agree-
ment to purchase goods and services that specifies all significant terms. Since
the majority of the Company’s purchase orders can be cancelled, they are not
included in the table above.
The Company has no off balance sheet arrangements outstanding at September 30, 2008.

16 E S C O T E C h n O l O g i E S i n C . 2 0 0 8 A n n u A l R E p O R T
ShARE REpuRChASES
In August 2008, the Company’s Board of Directors authorized an open market common stock repurchase program of the Company’s shares in a value not to exceed $30 million, subject to market conditions and other factors which covers the period through September 30, 2009. There were no stock repurchases during 2008. The Company repurchased $10 million or 265,000 shares in 2007 under a previously authorized program. There were no stock repurchases during 2006.
pEnSiOn FunDing REQuiREMEnTS
The minimum cash funding requirements related to the Company’s defined benefit pension plans are approximately $3.5 million in 2009, approximately $1.8 million in 2010 and approximately $1.8 million in 2011.
OThER
Management believes that, for the periods presented, inflation has not had a material effect on the Company’s results of operations.
The Company is currently involved in various stages of investigation and remediation relating to environmental matters. Based on current information available, Management does not believe the aggregate costs involved in the resolution of these matters will have a material adverse effect on the Company’s operating results, capital expenditures or competitive position.
Market Risk Analysis
MARKET RiSK EXpOSuRE
Market risks relating to the Company’s operations result primarily from changes in interest rates and changes in foreign currency exchange rates. The Company is exposed to market risk related to changes in interest rates and selectively uses derivative financial instruments, including forward contracts and swaps, to manage these risks. During 2008, the Company entered into a two-year amortizing interest rate swap to hedge some of its exposure to variability in future LIBOR-based interest payments on variable rate debt. The swap notional amount for the first year is $175 million amortizing to $100 million in the second year. All derivative instruments are reported on the balance sheet at fair value. The derivative instrument is designated as a cash flow hedge and the gain or loss on the derivative is deferred in accumulated other comprehensive income until recognized in earnings with the underlying hedged item. Including the impact of interest rate swaps outstanding, the interest rates on approximately 75% of the Company’s total borrowings were effectively fixed as of
September 30, 2008. The following is a summary of the notional transaction amounts and fair values for the Company’s outstanding derivative financial instruments by risk category and instrument type, as of September 30, 2008.
(Dollars in thousands) Notional Avg Rec Average Fair Amount Rate Pay Rate Value
Interest rate swaps $175,000 2.82% 3.99% ($1,347)
At September 30, 2007, the Company had no obligations related to interest rate swaps.
The Company is also subject to foreign currency exchange rate risk inherent in its sales commitments, anticipated sales, anticipated purchases and assets and liabilities denominated in currencies other than the U.S. dollar. The foreign currency most significant to the Company’s operations is the Euro. Net sales to customers outside of the United States were $130.9 million, $83.1 million, and $71.4 million in 2008, 2007 and 2006, respectively. The Company hedges certain foreign currency commitments by purchasing foreign currency forward contracts. The estimated fair value of open forward contracts at September 30, 2008 was not material.
Critical Accounting policies
The preparation of financial statements in conformity with GAAP requires Management to make estimates and assumptions in certain circumstances that affect amounts reported in the accompanying Consolidated Financial Statements. In preparing these financial statements, Management has made its best estimates and judg-ments of certain amounts included in the Consolidated Financial Statements, giving due consideration to materiality. The Company does not believe there is a great likelihood that materially different amounts would be reported under different conditions or using different assumptions related to the accounting policies described below. However, application of these accounting policies involves the exercise of judgment and use of assumptions as to future uncertainties and, as a result, actual results could differ from these estimates. The Company’s senior Management discusses the critical accounting policies described below with the Audit and Finance Committee of the Company’s Board of Directors on a periodic basis.
The following discussion of critical accounting policies is intended to bring to the attention of readers those accounting policies which Management believes are critical to the Consolidated Financial Statements and other financial disclosure. It is not intended to be a comprehensive list of all significant accounting policies that are more fully described in Note 1 of Notes to Consolidated Financial Statements.
Management’s Discussion and Analysis

E S C O T E C h n O l O g i E S i n C . 2 0 0 8 A n n u A l R E p O R T 17
Management’s Discussion and Analysis
REVEnuE RECOgniTiOn
USG Segment: Within the USG segment, approximately 97% of the segment’s revenue arrangements (approximately 55% of consolidated revenues) contain software components. Revenue under these arrangements is recognized in accordance with Statement of Position 97-2 (SOP 97-2), “Software Revenue Recognition,” as amended by SOP 98-9, “Modification of SOP 97-2, Software Revenue Recognition, with Respect to Certain Transac-tions.” The application of software revenue recognition requires judgment, including the determination of whether a software arrangement includes multiple elements and estimates of the fair value of the elements, or vendor-specific objective evidence of fair value (“VSOE”). Changes to the elements in a software arrangement, and the ability to identify VSOE for those elements could materially impact the amount of earned and/or deferred revenue. There have been no material changes to these estimates for the financial statement periods presented and the Company believes that these estimates generally should not be subject to significant variation in the future. The remaining 3% of the segment’s revenues represent products sold under a single element arrangement and are recognized when products are delivered to unaffiliated customers.
Test Segment: Within the Test segment, approximately 40% of revenues (approximately 10% of consolidated revenues) are recognized when products are delivered (when title and risk of ownership transfers) or when services are performed for unaffiliated customers. Certain arrangements contain multiple elements which are accounted for under the provisions of EITF 00-21, “Revenue Arrangements with Multiple Deliverables.” The application of EITF 00-21 requires judgment as to whether the deliverables can be divided into more than one unit of accounting and whether the separate units of accounting have value to the customer on a stand-alone basis. Changes to these elements could affect the timing of revenue recognition. There have been no material changes to these elements for the financial statement periods presented.
Approximately 60% of the segment’s revenues (approximately 15% of consolidated revenues) are recorded under the percentage-of-completion provisions of SOP 81-1, “Accounting for the Performance of Construction-Type and Certain Production-Type Contracts” due to the complex nature of the enclosures that are designed and produced under these contracts. As discussed above, this method of accounting involves the use of various estimating techniques to project costs at completion, which are based on Management’s judgment and the Company’s substantial experience in develop-ing these types of estimates. Changes in underlying assumptions/estimates may adversely or positively affect financial performance. Due to the nature of these contracts and the operating unit’s cost estimating process, the Company believes that these estimates
generally should not be subject to significant variation in the future. There have been no material changes to these estimates for the financial statement periods presented. The Company regularly reviews its contract estimates to assess revisions in contract values and estimated costs at completion.
Filtration Segment: Within the Filtration segment, approximately 65% of segment revenues (approximately 12% of consolidated revenues) are recognized when products are delivered (when title and risk of ownership transfers) or when services are performed for unaffiliated customers.
Approximately 35% of segment revenues (approximately 8% of consolidated revenues) are recorded under the percentage-of-completion provisions of SOP 81-1, “Accounting for Performance of Construction-Type and Certain Production-Type Contracts” because the Company manufactures complex products for aerospace and military customers under production contracts. The percentage-of-completion method of accounting involves the use of various estimating techniques to project costs at completion. These estimates involve various assumptions and projections relative to the outcome of future events over a period of several years, including future labor productivity and availability, the nature and complexity of the work to be performed, availability of materials, the impact of delayed performance, and the timing of product deliveries. These estimates are based on Management’s judgment and the Company’s substantial experience in developing these types of estimates. Changes in underlying assumptions/estimates may adversely affect financial performance if they increase estimated project costs at completion, or positively affect financial perfor-mance if they decrease estimated project costs at completion. Due to the nature of these contracts and the operating unit’s cost estimating process, the Company believes that these estimates generally should not be subject to significant variation in the future. There have been no material changes to these estimates for the financial statement periods presented. The Company regularly reviews its estimates to assess revisions in contract values and estimated costs at completion.
inVEnTORY
Inventories are valued at the lower of cost (first-in, first-out) or market value. Management regularly reviews inventories on hand compared to historical usage and estimated future usage and sales. Inventories under long-term contracts reflect accumulated production costs, factory overhead, initial tooling and other related costs less the portion of such costs charged to cost of sales and any unliquidated progress payments. In accordance with industry practice, costs incurred on contracts in progress include amounts relating to programs having production cycles longer than one year, and a portion thereof may not be realized within one year.

18 E S C O T E C h n O l O g i E S i n C . 2 0 0 8 A n n u A l R E p O R T
inCOME TAXES
The Company operates in numerous taxing jurisdictions and is subject to examination by various U.S. Federal, state and foreign jurisdictions for various tax periods. Additionally, the Company has retained tax liabilities and the rights to tax refunds in connection with various divestitures of businesses in prior years. The Company’s income tax positions are based on research and interpretations of the income tax laws and rulings in each of the jurisdictions in which the Company does business. Due to the subjectivity of inter-pretations of laws and rulings in each jurisdiction, the differences and interplay in tax laws between those jurisdictions, as well as the inherent uncertainty in estimating the final resolution of complex tax audit matters, Management’s estimates of income tax liabilities may differ from actual payments or assessments.
While the Company has support for the positions taken on its tax returns, taxing authorities are increasingly asserting alternate interpretations of laws, and are challenging cross jurisdictional transactions. Cross jurisdictional transactions between the Company’s subsidiaries involving transfer prices for products and services, as well as various U.S. Federal, state and foreign tax matters, comprise the Company’s income tax exposures. Manage-ment regularly assesses the Company’s position with regard to tax exposures and records liabilities for these uncertain tax positions and related interest and penalties, if any, according to the prin-ciples of FASB Interpretation No. 48, “Accounting for Uncertainty in Income Taxes, an Interpretation of FASB Statement No. 109” (FIN 48). The Company has recorded an accrual that reflects the recognition and measurement process for the financial statement recognition and measurement of a tax position taken or expected to be taken on a tax return based upon FIN 48. Additional future income tax expense or benefit may be recognized once the positions are effectively settled.
At the end of each interim reporting period, Management estimates the effective tax rate expected to apply to the full fiscal year. The estimated effective tax rate contemplates the expected jurisdiction where income is earned, as well as tax planning strategies. Current and projected growth in income in higher tax jurisdictions may result in an increasing effective tax rate over time. If the actual results differ from Management’s estimates, Management may have to adjust the effective tax rate in the interim period if such determination is made.
Income taxes are accounted for under the asset and liability method. Deferred tax assets and liabilities are recognized for the future tax consequences attributable to differences between the financial statement carrying amounts of existing assets and liabilities and their respective tax bases. Deferred tax assets and liabilities are measured using enacted tax rates expected to apply to taxable income in the years in which those temporary differences are expected to be recovered or settled. Deferred tax assets may be reduced by a valuation allowance if it is more likely than not that some portion of the deferred tax assets will not be realized. The
effect on deferred tax assets and liabilities of a change in tax rates is recognized in income in the period that includes the enactment date. The Company regularly reviews its deferred tax assets for recoverability and establishes a valuation allowance when Manage-ment believes it is more likely than not such assets will not be recovered, taking into consideration historical operating results, expectations of future earnings, tax planning strategies, and the expected timing of the reversals of existing temporary differences.
gOODWill AnD OThER lOng-liVED ASSETS
In accordance with SFAS 142, Management annually reviews goodwill and other long-lived assets with indefinite useful lives for impairment or whenever events or changes in circumstances indicate the carrying amount may not be recoverable. If the Company determines that the carrying value of the long-lived asset may not be recoverable, a permanent impairment charge is recorded for the amount by which the carrying value of the long-lived asset exceeds its fair value. Fair value is measured based on a discounted cash flow method using a discount rate determined by Management to be commensurate with the risk inherent in the Company’s current business model. The estimates of cash flows and discount rate are subject to change due to the economic environment, including such factors as interest rates, expected market returns and volatility of markets served. Management believes that the estimates of future cash flows and fair value are reasonable; however, changes in estimates could result in impairment charges. SFAS 142 also requires that intangible assets with estimable useful lives be amortized over their respective estimated useful lives to their estimated residual values, and reviewed for impairment in accordance with SFAS 144.
pEnSiOn plAnS AnD OThER pOSTRETiREMEnT BEnEFiT plAnS
The measurement of liabilities related to pension plans and other post-retirement benefit plans is based on Management’s assumptions related to future events including interest rates, return on pension plan assets, rate of compensation increases, and health care cost trend rates. Actual pension plan asset performance will either decrease or increase unamortized pension losses that will affect net earnings in future years. Depending upon the performance of the equity and bond markets in 2009, the Company could be required to record a charge to equity. In addition, if the discount rate was decreased by 25 basis points from 7.25% to 7.00%, the projected benefit obligation for the defined benefit plan would increase by approximately $1.8 million and result in an additional after-tax charge to shareholders’ equity of approximately $1.1 million. The discount rate used in measuring the Company’s pension and postretirement welfare obligations was developed by matching yields of actual high-quality corporate bonds to expected future pension plan cash flows (benefit payments). Over 400 Aa-rated, non-callable bonds with a wide range of maturities were used in the analysis. After using the bond yields to determine the present value of the plan cash flows, a single representative rate that resulted in the same present value was developed.
Management’s Discussion and Analysis
E S C O T E C h n O l O g i E S i n C . 2 0 0 8 A n n u A l R E p O R T 19
Management’s Discussion and Analysis
Other Matters
COnTingEnCiES
As a normal incident of the businesses in which the Company is engaged, various claims, charges and litigation are asserted or com-menced against the Company. In the opinion of Management, final judgments, if any, which might be rendered against the Company are adequately reserved, covered by insurance, or otherwise are not likely to have a material adverse effect on its financial statements.
QuAnTiTATiVE AnD QuAliTATiVE DiSClOSuRES ABOuT MARKET RiSK
Market risks relating to the Company’s operations result primarily from changes in interest rates and changes in foreign currency exchange rates. The Company is exposed to market risk related to changes in interest rates and selectively uses derivative financial instruments, including forward contracts and swaps, to manage these risks. During 2008, the Company entered into a two-year amortizing interest rate swap to hedge some of its exposure to variability in future LIBOR-based interest payments on variable rate debt. The swap notional amount for the first year is $175 million amortizing to $100 million in the second year. All derivative instruments are reported on the balance sheet at fair value. The derivative instrument is designated as a cash flow hedge and the gain or loss on the derivative is deferred in accumulated other comprehensive income until recognized in earnings with the underlying hedged item. At September 30, 2007, the Company had no obligations related to interest rate swaps. See further discussion in “Management’s Discussion and Analysis — Market Risk Analysis” regarding the Company’s market risks.
COnTROlS AnD pROCEDuRES
The Company carried out an evaluation under the supervision of and with the participation of Management, including the Company’s Chief Executive Officer and Chief Financial Officer, of the effectiveness of the design and operation of the Company’s disclosure controls and procedures as of the end of the period covered by this report. Based upon that evaluation, the Company’s Chief Executive Officer and Chief Financial Officer concluded that the Company’s disclo-sure controls and procedures are effective. Disclosure controls and procedures are controls and procedures that are designed to ensure that information required to be disclosed in company reports filed or submitted under the Securities Exchange Act of 1934 is recorded, processed, summarized and reported within time periods specified in the Securities and Exchange Commission’s rules and forms. There have been no significant changes in the Company’s internal controls or in other factors during the period covered by this report that have materially affected, or are reasonably likely to materially affect, the Company’s internal control over financial reporting.
new Accounting pronouncements
In September 2006, the FASB issued SFAS No. 157, “Fair Value Measurements” (SFAS 157), which defines fair value in generally accepted accounting principles and expands disclosures about fair value measurements. This Statement is effective for financial statements issued for fiscal years beginning after November 15, 2007. The adoption of SFAS 157 is not expected to have a material impact to the Company’s financial position or results of operations.
In December 2007, the FASB issued SFAS No. 141R, “Business Combinations” (SFAS 141R), which establishes principles and requirements for how an acquirer recognizes and measures in its financial statements the identifiable assets acquired, the liabilities assumed, and any noncontrolling interest in an acquiree, including the recognition and measurement of goodwill acquired in a business combination. The requirements of SFAS 141R are effective for busi-ness combinations for which the acquisition date is on or after the beginning of the first annual reporting period beginning on or after December 15, 2008. Earlier adoption is not permitted.
In February 2008, the FASB released FASB Staff Position No. FAS 157-2, “Effective Date of FASB Statement No. 157,” which delayed for one year the effective date of SFAS 157 for all non-financial assets and non-financial liabilities, except those that are recognized or disclosed in the financial statements at fair value at least annually. Items in this classification include goodwill, asset retirement obligations, rationalization accruals, intangible assets with indefinite lives and certain other items. The adoption of SFAS 157 with respect to the Company’s non-financial assets and liabilities, effective January 1, 2009, is not expected to have a significant effect on the Company’s consolidated financial statements.
In March 2008, the FASB issued SFAS No. 161, “Disclosures about Derivative Instruments and Hedging Activities, an amendment of FASB Statement No. 133” (SFAS 161). This statement is intended to improve transparency in financial reporting by requiring enhanced disclosures of an entity’s derivative instruments and hedging activities and their effects on the entity’s financial position, financial performance, and cash flows. SFAS 161 is effective prospectively for financial statements issued for fiscal years and interim periods beginning after November 15, 2008, with early application permitted. The adoption of SFAS 161 is not expected to have a material impact to the Company’s financial position or results of operations.

20 E S C O T E C h n O l O g i E S i n C . 2 0 0 8 A n n u A l R E p O R T
Management’s Discussion and Analysis
Forward-looking information
Statements regarding future events and the Company’s future results that are based on current expectations, estimates, forecasts and projections about the Company’s performance and the industries in which the Company operates, adequacy of the Company’s credit facilities and future cash flows, estimates of anticipated contract costs and revenues, the timing, amount and success of claims for research credits, the anticipated value of the Aclara RF Contract with PG&E, the outcome of current litigation, claims and charges, the anticipated timing and amount of lost deferred tax assets, continued reinvestment of foreign earnings, the impact of SFAS 161 and SFAS 157, the timing, total value and period of performance of contracts awarded to the Company, the accuracy of the Company’s estimates utilized in software revenue recognition, the accuracy of the Company’s estimates utilized to project costs at completion in the Test segment and Filtration segment, income tax liabilities, the effective tax rate, the timing and results of the IRS audit of the Company’s Federal income tax returns for the period ended September 30, 2003 through September 30, 2006, repayment of debt within the next twelve months, the recognition of costs related to share-based compensation arrangements, future costs relating to environmental matters, share repurchases, investments, sustained performance improvement, performance improvement initiatives, growth opportunities, new product development, the Company’s ability to increase shareholder value, acquisitions, and the beliefs and assumptions of Management contained in the letter To Our Shareholders (pages 1-2), and Management’s Discussion and Analysis and other statements contained herein which are not strictly historical are considered “forward-looking statements” within the meaning of the safe harbor provisions of the Federal
securities laws. Words such as expects, anticipates, targets, goals, projects, intends, plans, believes, estimates, variations of such words, and similar expressions are intended to identify such forward-looking statements. Investors are cautioned that such statements are only predictions, speak only as of the date of this report, and the Company undertakes no duty to update. The Company’s actual results in the future may differ materially from those projected in the forward-looking statements due to risks and uncertainties that exist in the Company’s operations and business environment including, but not limited to those described under “Item 1A. Risk Factors” in the Company’s Annual Report on Form 10-K for the fiscal years ended September 30, 2008 and the following: actions by the California Public Utility Commission; PG&E’s Board of Directors or PG&E’s management impacting PG&E’s AMI projects; the timing and content of purchase order releases under the PG&E contracts; and Aclara RF System’s successful performance of the Aclara RF Contract with PG&E; termination for convenience of customer contracts; timing and magnitude of future contract awards; weakening of economic conditions in served markets; the success of the Company’s competitors; changes in customer demands or customer insolvencies; competition; intellectual property rights; technical difficulties; the availability of selected acquisitions; delivery delays or defaults by customers; performance issues with key customers, suppliers and subcontractors; material changes in the costs of certain raw materials; labor disputes; changes in laws and regulations including but not limited to changes in accounting standards and taxation requirements; costs relating to environmental matters; litigation uncertainty; and the Company’s successful execution of internal operating plans.

E S C O T E C h n O l O g i E S i n C . 2 0 0 8 A n n u A l R E p O R T 21
(Dollars in thousands, except per share amounts) Years ended September 30, 2008 2007 2006
Net sales $ 623,817 444,704 382,353
Costs and expenses: Cost of sales 374,098 282,596 239,199 Selling, general and administrative expenses 151,173 111,610 95,909 Amortization of intangible assets 17,570 10,243 6,410 Interest expense (income), net 9,812 (599) (867) Other expenses (income), net 149 2,815 (2,683)
Total costs and expenses 552,802 406,665 337,968
Earnings before income tax 71,015 38,039 44,385Income tax expense 23,613 7,633 15,220
Net earnings from continuing operations $ 47,402 30,406 29,165
(Loss) earnings from discontinued operations, net of tax of $325 in 2008, $1,382 in 2007 and $2,402 in 2006 (115) 3,307 2,115Loss on sale of discontinued operations, net of tax of $157 (576) — —
Net (loss) earnings from discontinued operations (691) 3,307 2,115
Net earnings $ 46,711 33,713 31,280
Earnings (loss) per share:
Basic: Continuing operations $ 1.83 1.17 1.14 Discontinued operations (0.03) 0.13 0.08
Net earnings $ 1.80 1.30 1.22
Diluted: Continuing operations 1.80 1.15 1.11 Discontinued operations (0.02) 0.13 0.08
Net earnings $ 1.78 1.28 1.19
Average common shares outstanding (in thousands):
Basic 25,909 25,865 25,718
Diluted 26,315 26,387 26,386
See accompanying Notes to Consolidated Financial Statements.
Consolidated Statements of Operations

22 E S C O T E C h n O l O g i E S i n C . 2 0 0 8 A n n u A l R E p O R T
Consolidated Balance Sheets
(Dollars in thousands) Years ended September 30, 2008 2007
ASSETS
Current assets:
Cash and cash equivalents $ 28,667 18,638
Accounts receivable, less allowance for doubtful accounts of $1,050 and $519 in 2008 and 2007, respectively 135,436 85,319
Costs and estimated earnings on long-term contracts, less progress billings of $34,978 and $3,881 in 2008 and 2007, respectively 9,095 11,520
Inventories 66,962 55,885
Current portion of deferred tax assets 15,368 25,264
Other current assets 15,108 28,054
Current assets from discontinued operations — 35,670
Total current assets 270,636 260,350
property, plant and equipment:
Land and land improvements 5,342 4,995
Buildings and leasehold improvements 48,050 32,626
Machinery and equipment 64,438 44,938
Construction in progress 2,344 5,184
120,174 87,743
Less accumulated depreciation and amortization 47,583 37,550
Net property, plant and equipment 72,591 50,193
Goodwill 328,878 124,757
Intangible assets, net 238,223 74,624
Other assets 17,745 10,338
Other assets from discontinued operations — 55,845
$ 928,073 576,107
See accompanying Notes to Consolidated Financial Statements.

E S C O T E C h n O l O g i E S i n C . 2 0 0 8 A n n u A l R E p O R T 23
Consolidated Balance Sheets
(Dollars in thousands) Years ended September 30, 2008 2007
liABiliTiES AnD ShAREhOlDERS’ EQuiTY
Current liabilities:
Short-term borrowings and current maturities of long-term debt $ 50,000 —
Accounts payable 49,329 45,726
Advance payments on long-term contracts, less costs incurred of $7,880 and $20,314 in 2008 and 2007, respectively 7,467 3,408
Accrued salaries 20,718 12,348
Current portion of deferred revenue 18,920 24,621
Accrued other expenses 22,249 16,103
Current liabilities from discontinued operations — 16,994
Total current liabilities 168,683 119,200
Long-term portion of deferred revenue 2,228 4,514
Pension obligations 12,172 8,029
Deferred tax liabilities 83,515 18,522
Other liabilities 9,588 7,825
Long-term debt 183,650 —
Long-term liabilities from discontinued operations — 2,534
Total liabilities 459,836 160,624
Shareholders’ equity:
Preferred stock, par value $.01 per share, authorized 10,000,000 shares — —
Common stock, par value $.01 per share, authorized 50,000,000 shares; Issued 29,465,154 and 29,159,629 shares in 2008 and 2007, respectively 295 292
Additional paid-in capital 254,240 243,131
Retained earnings 273,470 226,759
Accumulated other comprehensive income, net of tax 556 6,303
528,561 476,485
Less treasury stock, at cost (3,375,106 and 3,416,966 common shares in 2008 and 2007, respectively) (60,324) (61,002)
Total shareholders’ equity 468,237 415,483
$ 928,073 576,107
See accompanying Notes to Consolidated Financial Statements.

E S C O T E C h n O l O g i E S i n C . 2 0 0 8 A n n u A l R E p O R T24
Consolidated Statements of Shareholders’ Equity
Accumulated Additional Other (In thousands) Common Stock Paid-In Retained Comprehensive TreasuryYears ended September 30, Shares Amount Capital Earnings Income (Loss) Stock Total
Balance, September 30, 2005 28,739 $287 228,317 159,363 (5,566) (51,377) 331,024
SAB 108 Cumulative effect adjustment — — — 2,403 — — 2,403
Comprehensive income:
Net earnings — — — 31,280 — — 31,280
Translation adjustments — — — — 1,448 — 1,448
Minimum pension liability, net of tax of $(1,103) — — — — 2,048 — 2,048
Comprehensive income 34,776
Stock options and stock compensation plans, net of tax benefit of $(3,173) 292 3 8,073 — — 155 8,231
Balance, September 30, 2006 29,031 290 236,390 193,046 (2,070) (51,222) 376,434
Comprehensive income:
Net earnings — — — 33,713 — — 33,713
Translation adjustments — — — — 4,252 — 4,252
Minimum pension liability, net of tax of $(1,622) — — — — 3,558 — 3,558
Comprehensive income 41,523
SFAS 158 adjustment, net of tax of $(358) — — — — 563 — 563
Stock options and stock compensation plans, net of tax benefit of $(828) 129 2 6,741 — — 227 6,970
Purchases into treasury — — — — — (10,007) (10,007)
Balance, September 30, 2007 29,160 292 243,131 226,759 6,303 (61,002) 415,483
Comprehensive income:
Net earnings — — — 46,711 — — 46,711
Translation adjustments — — — — (869) — (869)
Net unrecognized actuarial loss, net of tax of $2,506 — — — — (4,043) — (4,043)
Interest rate swap, net of tax of $512 — — — — (835) — (835)
Comprehensive income 40,964
Stock options and stock compensation plans, net of tax benefit of $(845) 305 3 11,109 — — 678 11,790
Balance, September 30, 2008 29,465 $295 254,240 273,470 556 (60,324) 468,237
See accompanying Notes to Consolidated Financial Statements.

E S C O T E C h n O l O g i E S i n C . 2 0 0 8 A n n u A l R E p O R T 25
Consolidated Statements of Cash Flows
(Dollars in thousands) Years ended September 30, 2008 2007 2006
Cash flows from operating activities: Net earnings $ 46,711 33,713 31,280 Adjustments to reconcile net earnings to net cash provided by operating activities: Net loss (earnings) from discontinued operations, net of tax 691 (3,307) (2,115) Depreciation and amortization 27,634 16,406 11,716 Stock compensation expense 3,990 4,834 4,285 Changes in operating working capital (8,770) (29,504) 2,201 Effect of deferred taxes on tax provision 12,349 13,759 4,242 Change in deferred revenue and costs, net (2,780) 9,339 4,244 Other 1,213 814 1,671
Net cash provided by operating activities — continuing operations 81,038 46,054 57,524
Net (loss) earnings from discontinued operations, net of tax (691) 3,307 2,115 Net cash used by discontinued operations (3,207) (4,375) (3,427)
Net cash used by operating activities — discontinued operations (3,898) (1,068) (1,312)
Net cash provided by operating activities 77,140 44,986 56,212
Cash flows from investing activities: Acquisition of businesses, net of cash acquired (345,395) (8,250) (91,968) Proceeds from sale of marketable securities 4,966 — — Change in restricted cash (6,841) — — Capital expenditures — continuing operations (16,683) (12,443) (5,847) Additions to capitalized software (11,012) (29,994) (27,802)
Net cash used by investing activities — continuing operations (374,965) (50,687) (125,617)
Capital expenditures — discontinued operations (1,126) (7,060) (3,270) Proceeds from divestiture of business, net — discontinued operations 74,370 — —
Net cash provided (used) by investing activities — discontinued operations 73,244 (7,060) (3,270)
Net cash used by investing activities (301,721) (57,747) (128,887)
Cash flows from financing activities: Proceeds from long-term debt 304,157 — 52,000 Principal payments on long-term debt (71,197) — (52,000) Debt issuance costs (2,965) — — Net (decrease) increase in short-term borrowings — discontinued operations (2,844) 2,844 — Purchases of common stock into treasury — (10,007) — Excess tax benefit from stock options exercised 737 73 1,569 Proceeds from exercise of stock options 6,384 1,843 2,761 Other 338 (173) 680
Net cash provided (used) by financing activities 234,610 (5,420) 5,010
Net increase (decrease) in cash and cash equivalents 10,029 (18,181) (67,665)Cash and cash equivalents at beginning of year 18,638 36,819 104,484
Cash and cash equivalents at end of year $ 28,667 18,638 36,819
Changes in operating working capital: Accounts receivable, net $ (30,497) (16,220) (8,749) Costs and estimated earnings on long-term contracts, net 2,425 (10,175) 3,047 Inventories 1,051 (14,132) 2,190 Other current assets 5,732 (5,097) 3,294 Accounts payable 734 12,950 6,703 Advance payments on long-term contracts, net 3,716 (3,959) 594 Accrued expenses 8,069 7,129 (4,878)
$ (8,770) (29,504) 2,201
Supplemental cash flow information: Interest paid $ 9,233 109 456 Income taxes paid (including state, foreign & AMT) 7,004 3,731 10,768
See accompanying Notes to Consolidated Financial Statements.

26 E S C O T E C h n O l O g i E S i n C . 2 0 0 8 A n n u A l R E p O R T
notes to Consolidated Financial Statements
1. Summary of Significant Accounting policies
A. pRinCiplES OF COnSOliDATiOn
The Consolidated Financial Statements include the accounts of ESCO Technologies Inc. (ESCO) and its wholly owned subsidiaries (the Company). All significant intercompany transactions and accounts have been eliminated in consolidation.
B. BASiS OF pRESEnTATiOn
Fair values of the Company’s financial instruments are estimated by reference to quoted prices from market sources and financial institutions, as well as other valuation techniques. The estimated fair value of each class of financial instruments approximated the related carrying value at September 30, 2008 and 2007.
As a result of the acquisition of Doble Engineering Company (Doble) in November 2007, the Company changed the name of the Communications segment to the Utility Solutions Group segment. The renaming of this segment more accurately describes the segment’s operating activities and strategically aligns the respective operating entities to focus on a single goal of satisfying the expanding Automated Metering Infrastructure (AMI), Smart Grid, and other operational requirements of electric, gas and water utilities worldwide. The name change was done in conjunction with the Company’s strategic integration and rebranding of its AMI related technologies under the unified brand name Aclara™, and renaming the businesses as follows: Distribution Control Systems, Inc. was renamed Aclara Power-Line Systems Inc.; Hexagram, Inc. was renamed Aclara RF Systems Inc.; and Nexus Energy Software, Inc. was renamed Aclara Software Inc.
C. nATuRE OF OpERATiOnS
The Company has three industry operating segments: Utility Solutions Group (USG), RF Shielding and Test (Test), and Filtration/Fluid Flow (Filtration). The USG segment is a proven supplier of special purpose fixed network communications systems for electric, gas and water utilities, including hardware and software to support advanced metering applications. The Test segment is an industry leader in providing its customers with the ability to identify, measure and contain magnetic, electromagnetic and acoustic energy.
The Filtration segment designs and manufactures specialty filtration products including hydraulic filter elements used in commercial aerospace applications, unique filter mechanisms used in micro propulsion devices for satellites and custom designed filters for manned and unmanned aircraft.
D. uSE OF ESTiMATES
The preparation of financial statements in conformity with accounting principles generally accepted in the United States of America (GAAP) requires Management to make estimates and
assumptions, including estimates of anticipated contract costs and revenues utilized in the earnings process, that affect the reported amounts of assets and liabilities and disclosure of contingent assets and liabilities at the date of the financial statements and the reported amounts of revenues and expenses during the reporting period. Actual results could differ from those estimates.
E. REVEnuE RECOgniTiOn
USG Segment: Within the USG segment, approximately 97% of the segment’s revenue arrangements (approximately 55% of consolidated revenues) contain software components. Revenue under these arrangements is recognized in accordance with Statement of Position 97-2 (SOP 97-2), “Software Revenue Recognition,” as amended by SOP 98-9, “Modification of SOP 97-2, Software Revenue Recognition, with Respect to Certain Transactions.” The segment’s software revenue arrangements generally include multiple products and services, or “elements” consisting of meter and substation hardware, meter reading system software, program management support during the deployment period and software support (post-contract customer support, “PCS”). These arrangements typically require the Company to deliver software at the inception of the arrangement while the hardware and program management support are delivered over the contractual deployment period. Software support is provided during deployment and subsequent thereto. The software element included in such arrangements is essential to the functionality of the hardware and, therefore, the hardware is considered to be software-related. Hardware is considered a specified element in the software arrangement and vendor-specific objective evidence of fair value (“VSOE”) has been established for this element. VSOE for the hardware element is determined based on the price when sold separately to customers. These revenue arrangements are divided into separate units of accounting if the delivered item(s) has value to the customer on a stand-alone basis, there is objective and reliable evidence of the fair value of the undelivered item(s) and delivery/performance of the undelivered item(s) is probable. For multiple element arrangements, revenue is allocated to the individual elements based on VSOE of the individual elements.
The application of these principles requires judgment, including the determination of whether a software arrangement includes multiple elements and estimates of the fair value of the elements. The VSOE of the fair value of undelivered elements is determined based on the historical evidence of stand-alone sales of these elements to customers. Hardware revenues are generally recognized at the time of shipment or receipt by customer depending upon contract terms. VSOE generally does not exist for the software element; therefore, the Company uses the residual method to recognize revenue when VSOE exists for all other undelivered elements. Under the residual method, the fair value of the undelivered elements is deferred and the remaining portion of the arrangement fee is recognized as revenue.
E S C O T E C h n O l O g i E S i n C . 2 0 0 8 A n n u A l R E p O R T 27
notes to Consolidated Financial Statements
SOP 97-2 requires the seller of software that includes post-contract customer support (PCS) to establish VSOE of the undelivered element of the contract in order to account separately for the PCS revenue. The Company determines VSOE by a consistent pricing of PCS and PCS renewals as a percentage of the software license fees or by reference to contractual renewals, when the renewal terms are substantive. Revenues for PCS are recognized ratably over the maintenance term specified in the contract (generally in 12 monthly increments). Revenues for program management support are recog-nized when services have been provided. The Company determines VSOE for program management support based on hourly rates when services are performed separately.
Approximately 3% of segment revenues are recognized when products are delivered (when title and risk of ownership transfers) or when services are performed for unaffiliated customers. Products include the SecurVision® digital video surveillance systems.
Test Segment: Within the Test segment, approximately 40% of revenues (approximately 10% of consolidated revenues) are recognized when products are delivered (when title and risk of ownership transfers) or when services are performed for unaffiliated customers. Certain arrangements contain multiple elements which are accounted for under the provisions of EITF 00-21, “Revenue Arrangements with Multiple Deliverables.” The multiple elements generally consist of materials and installation services used in the construction and installation of standard shielded enclosures to measure and contain magnetic and electromagnetic energy. The installation process does not involve changes to the features or capabilities of the equipment and does not require proprietary information about the equipment in order for the installed equipment to perform to specifications. There is objective and reliable evidence of fair value for each of the units of accounting, as a result, the arrangement revenue is allocated to the separate units of accounting based on their relative fair values. Typically, fair value is the price of the deliverable when it is regularly sold on a stand-alone basis.
Approximately 60% of the segment’s revenues (approximately 15% of consolidated revenues) are recorded under the percentage-of-completion provisions of SOP 81-1, “Accounting for the Performance of Construction-Type and Certain Production-Type Contracts” due to the complex nature of the enclosures that are designed and produced under these contracts. Products accounted for under SOP 81-1 include the construction and installation of complex test chambers to a buyer’s specifications that provide its customers with the ability to measure and contain magnetic, electromagnetic and acoustic energy. As discussed above, for arrangements that are accounted for under SOP 81-1, the Company estimates profit as the difference between total estimated revenue and total estimated cost of a contract and recognizes these revenues and costs based on either (a) units delivered or (b) contract milestones.
If a reliable measure of output cannot be established (which applies in less than 8% of Test unit revenues or 2% of consolidated revenues), input measures (e.g., costs incurred) are used to recognize revenue. Given the nature of the Company’s operations related to these contracts, costs incurred represent an appropriate measure of progress towards completion.
The percentage-of-completion method of accounting involves the use of various techniques to estimate expected costs at completion. These estimates are based on Management’s judgment and the Company’s substantial experience in developing these types of estimates.
Filtration Segment: Within the Filtration segment, approximately 65% of revenues (approximately 12% of consolidated revenues) are recognized when products are delivered (when title and risk of ownership transfers) or when services are performed for unaffiliated customers.
Approximately 35% of segment revenues (approximately 8% of consolidated revenues) are recorded under the percentage-of-completion provisions of SOP 81-1, “Accounting for Performance of Construction-Type and Certain Production-Type Contracts.” Products accounted for under SOP 81-1 include the design, development and manufacture of complex fluid control products, quiet valves, manifolds and systems primarily for the aerospace and military markets. For arrangements that are accounted for under SOP 81-1, the Company estimates profit as the difference between total estimated revenue and total estimated cost of a contract and recognizes these revenues and costs based on units delivered. The percentage-of-completion method of accounting involves the use of various techniques to estimate expected costs at completion.
F. CASh AnD CASh EQuiVAlEnTS
Cash equivalents include temporary investments that are readily convertible into cash, such as money markets.
g. ACCOunTS RECEiVABlE
Accounts receivable have been reduced by an allowance for amounts that the Company estimates are uncollectible in the future. This estimated allowance is based on Management’s evaluation of the financial condition of the customer and historical write-off experience.
h. COSTS AnD ESTiMATED EARningS On lOng-TERM COnTRACTS
Costs and estimated earnings on long-term contracts represent unbilled revenues, including accrued profits, accounted for under the percentage-of-completion method, net of progress billings.

28 E S C O T E C h n O l O g i E S i n C . 2 0 0 8 A n n u A l R E p O R T
notes to Consolidated Financial Statements
i. inVEnTORiES
Inventories are valued at the lower of cost (first-in, first-out) or market value. Inventories under long-term contracts reflect accumulated production costs, factory overhead, initial tooling and other related costs less the portion of such costs charged to cost of sales and any unliquidated progress payments. In accordance with industry practice, costs incurred on contracts in progress include amounts relating to programs having production cycles longer than one year, and a portion thereof will not be realized within one year.
J. pROpERTY, plAnT AnD EQuipMEnT
Property, plant and equipment are recorded at cost. Depreciation and amortization are computed primarily on a straight-line basis over the estimated useful lives of the assets: buildings, 10-40 years; machinery and equipment, 3-10 years; and office furniture and equipment, 3-10 years. Leasehold improvements are amortized over the remaining term of the applicable lease or their estimated useful lives, whichever is shorter.
K. gOODWill AnD OThER lOng-liVED ASSETS
Goodwill represents the excess of purchase costs over the fair value of net identifiable assets acquired in business acquisitions. The Company accounts for goodwill as required by Statement of Financial Accounting Standards (SFAS) 142, “Goodwill and Other Intangible Assets.” Management annually reviews goodwill and other long-lived assets with indefinite useful lives for impairment or whenever events or changes in circumstances indicate the carrying amount may not be recoverable. If the Company determines that the carrying value of the long-lived asset may not be recoverable, a permanent impairment charge is recorded for the amount by which the carrying value of the long-lived asset exceeds its fair value.
Fair value is measured based on a discounted cash flow method using a discount rate determined by Management to be commensurate with the risk inherent in the Company’s current business model. Other intangible assets represent costs allocated to identifiable intangible assets, principally capitalized software, patents, trademarks, and technology rights. See Note 4 regarding goodwill and other intangible assets activity.
l. CApiTAliZED SOFTWARE
The costs incurred for the development of computer software that will be sold, leased, or otherwise marketed are charged to expense when incurred as research and development until technological feasibility has been established for the product. Technological feasibility is typically established upon completion of a detailed program design. Costs incurred after this point are capitalized on a project-by-project basis in accordance with SFAS No. 86, “Accounting for the Costs of Computer Software to be Sold, Leased or Otherwise Marketed.” Capitalized costs primarily consist of external development costs. Upon general release of the product to customers, the Company ceases capitalization and begins amortization, which is calculated on a project-by-project basis as the greater of (1) the ratio of current gross revenues for a product
to the total of current and anticipated future gross revenues for the product or (2) the straight-line method over the estimated economic life of the product. The Company generally amortizes the software development costs over a three- to seven-year period based upon the estimated future economic life of the product. Factors considered in determining the estimated future economic life of the product include anticipated future revenues, and changes in software and hardware technologies. The carrying values of capitalized costs are evaluated for impairment on an annual basis to determine if circumstances exist which indicate the carrying value of the asset may not be recoverable. If expected cash flows are insufficient to recover the carrying amount of the asset, then an impairment loss is recognized to state the asset at its net realizable value.
M. iMpAiRMEnT OF lOng-liVED ASSETS AnD lOng-liVED
ASSETS TO BE DiSpOSED OF
Recoverability of assets to be held and used is measured by a comparison of the carrying amount of an asset to future cash flows expected to be generated by the asset. If such assets are considered to be impaired, the impairment to be recognized is measured by the amount by which the carrying amount of the assets exceeds the fair value of the assets. Assets to be disposed of are reported at the lower of the carrying amount or fair value less costs to dispose.
n. inCOME TAXES
Income taxes are accounted for under the asset and liability method. Deferred tax assets and liabilities are recognized for the future tax consequences attributable to differences between the financial statement carrying amounts of existing assets and liabilities and their respective tax bases. Deferred tax assets and liabilities are measured using enacted tax rates expected to apply to taxable income in the years in which those temporary differences are expected to be recovered or settled. Deferred tax assets may be reduced by a valuation allowance if it is more likely than not that some portion or all of the deferred tax assets will not be realized. The effect on deferred tax assets and liabilities of a change in tax rates is recognized in income in the period that includes the enactment date. The Company regularly reviews its deferred tax assets for recoverability and establishes a valuation allowance when Management believes it is more likely than not such assets will not be recovered, taking into consideration historical operating results, expectations of future earnings, tax planning strategies, and the expected timing of the reversals of existing temporary differences.
O. RESEARCh AnD DEVElOpMEnT COSTS
Company-sponsored research and development costs include research and development and bid and proposal efforts related to the Company’s products and services. Company-sponsored product development costs are charged to expense when incurred. Customer-sponsored research and development costs incurred pursuant to contracts are accounted for similar to other program costs. Customer-sponsored research and development costs refer

E S C O T E C h n O l O g i E S i n C . 2 0 0 8 A n n u A l R E p O R T 29
notes to Consolidated Financial Statements
to certain situations whereby customers provide funding to support specific contractually defined research and development costs. As the Company incurs costs under these specific funding contracts, the costs are “inventoried” until billed to the customer for reimbursement, consistent with other program costs. Once billed/invoiced, these costs are transferred to accounts receivable until the cash is received from the customer. All research and development costs incurred in excess of the contractual funding amount, or costs incurred outside the scope of the contractual research and development project, are expensed as incurred.
p. FOREign CuRREnCY TRAnSlATiOn
The financial statements of the Company’s foreign operations are translated into U.S. dollars in accordance with SFAS 52 “Foreign Currency Translation” (SFAS 52). The resulting translation adjustments are recorded as a separate component of accumulated other comprehensive income.
Q. EARningS pER ShARE
Basic earnings per share is calculated using the weighted average number of common shares outstanding during the period. Diluted earnings per share is calculated using the weighted average number of common shares outstanding during the period plus shares issuable upon the assumed exercise of dilutive common share options and vesting of performance-accelerated restricted shares using the treasury stock method.
The number of shares used in the calculation of earnings per share for each year presented is as follows:
(In thousands) 2008 2007 2006
Weighted Average Shares Outstanding — Basic 25,909 25,865 25,718
Dilutive Options and Performance- Accelerated Restricted Stock 406 522 668
Adjusted Shares — Diluted 26,315 26,387 26,386
Options to purchase 542,689 shares at prices ranging from $35.69-$54.88 were outstanding during the year ended September 30, 2008, but were not included in the respective computation of diluted EPS because the options’ exercise price was greater than the average market price of the common shares. Options to purchase 602,731 shares at prices ranging from $36.07-$54.88 were outstanding during the year ended September 30, 2007, but were not included in the respective computation of diluted EPS because the options’ exercise price was greater than the average market price of the common shares. Options to purchase 264,430 shares at prices ranging from $42.99-$54.88 were outstanding during the year ended September 30, 2006, but were not included in the respective computation of diluted EPS because the options’ exercise price
was greater than the average market price of the common shares. These options expire in various periods through 2013. Approximate-ly 38,000, 14,000 and 9,000 restricted shares were outstanding but unearned at September 30, 2008, 2007 and 2006, respectively, and, therefore, were not included in the respective years’ computations of diluted EPS.
R. ShARE-BASED COMpEnSATiOn
The Company provides compensation benefits to certain key employees under several share-based plans providing for employee stock options and/or performance-accelerated restricted shares (restricted shares), and to non-employee directors under a non-employee directors compensation plan.
S. COMpREhEnSiVE inCOME (lOSS)
Accumulated other comprehensive income as shown on the consolidated balance sheet of $0.6 million at September 30, 2008 consisted of $(6.5) million related to the pension net actuarial loss; $7.9 million related to currency translation adjustments; and $(0.8) million related to interest rate swaps. Accumulated other comprehensive income of $6.3 million at September 30, 2007 consisted of $8.8 million related to currency translation adjustments; and $(2.5) million related to the minimum pension liability.
T. DEFERRED REVEnuE AnD COSTS
Deferred revenue and costs are recorded for products or services that have not been provided but have been invoiced under con-tractual agreements or paid for by a customer, or when products or services have been provided but the criteria for revenue recognition have not been met. If there is a customer acceptance provision or there is uncertainty about customer acceptance, revenue and costs are deferred until the customer has accepted the product or service.
u. DERiVATiVE FinAnCiAl inSTRuMEnTS
All derivative financial instruments are reported on the balance sheet at fair value. The accounting for changes in fair value of a derivative instrument depends on whether it has been designated and qualifies as a hedge and on the type of hedge. For each derivative instrument designated as a cash flow hedge, the effective portion of the gain or loss on the derivative is deferred in accumulated other comprehensive income until recognized in earnings with the underlying hedged item. For each derivative instrument designated as a fair value hedge, the gain or loss on the derivative and the offsetting gain or loss on the hedged item are recognized immediately in earnings. Regardless of type, a fully effective hedge will result in no net earnings impact while the derivative is outstanding. To the extent that any hedge is ineffective at offsetting cash flow or fair value changes in the underlying hedged item, there could be a net earnings impact.
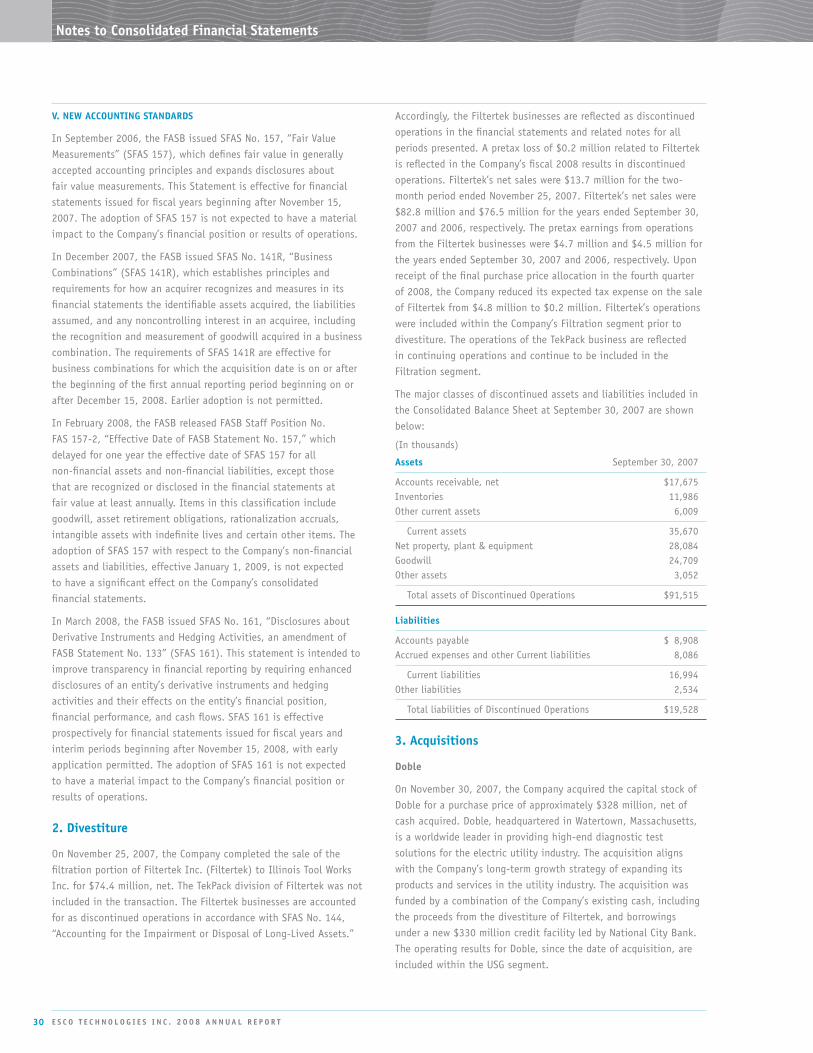
30 E S C O T E C h n O l O g i E S i n C . 2 0 0 8 A n n u A l R E p O R T
notes to Consolidated Financial Statements
V. nEW ACCOunTing STAnDARDS
In September 2006, the FASB issued SFAS No. 157, “Fair Value Measurements” (SFAS 157), which defines fair value in generally accepted accounting principles and expands disclosures about fair value measurements. This Statement is effective for financial statements issued for fiscal years beginning after November 15, 2007. The adoption of SFAS 157 is not expected to have a material impact to the Company’s financial position or results of operations.
In December 2007, the FASB issued SFAS No. 141R, “Business Combinations” (SFAS 141R), which establishes principles and requirements for how an acquirer recognizes and measures in its financial statements the identifiable assets acquired, the liabilities assumed, and any noncontrolling interest in an acquiree, including the recognition and measurement of goodwill acquired in a business combination. The requirements of SFAS 141R are effective for business combinations for which the acquisition date is on or after the beginning of the first annual reporting period beginning on or after December 15, 2008. Earlier adoption is not permitted.
In February 2008, the FASB released FASB Staff Position No. FAS 157-2, “Effective Date of FASB Statement No. 157,” which delayed for one year the effective date of SFAS 157 for all non-financial assets and non-financial liabilities, except those that are recognized or disclosed in the financial statements at fair value at least annually. Items in this classification include goodwill, asset retirement obligations, rationalization accruals, intangible assets with indefinite lives and certain other items. The adoption of SFAS 157 with respect to the Company’s non-financial assets and liabilities, effective January 1, 2009, is not expected to have a significant effect on the Company’s consolidated financial statements.
In March 2008, the FASB issued SFAS No. 161, “Disclosures about Derivative Instruments and Hedging Activities, an amendment of FASB Statement No. 133” (SFAS 161). This statement is intended to improve transparency in financial reporting by requiring enhanced disclosures of an entity’s derivative instruments and hedging activities and their effects on the entity’s financial position, financial performance, and cash flows. SFAS 161 is effective prospectively for financial statements issued for fiscal years and interim periods beginning after November 15, 2008, with early application permitted. The adoption of SFAS 161 is not expected to have a material impact to the Company’s financial position or results of operations.
2. Divestiture
On November 25, 2007, the Company completed the sale of the filtration portion of Filtertek Inc. (Filtertek) to Illinois Tool Works Inc. for $74.4 million, net. The TekPack division of Filtertek was not included in the transaction. The Filtertek businesses are accounted for as discontinued operations in accordance with SFAS No. 144, “Accounting for the Impairment or Disposal of Long-Lived Assets.”
Accordingly, the Filtertek businesses are reflected as discontinued operations in the financial statements and related notes for all periods presented. A pretax loss of $0.2 million related to Filtertek is reflected in the Company’s fiscal 2008 results in discontinued operations. Filtertek’s net sales were $13.7 million for the two-month period ended November 25, 2007. Filtertek’s net sales were $82.8 million and $76.5 million for the years ended September 30, 2007 and 2006, respectively. The pretax earnings from operations from the Filtertek businesses were $4.7 million and $4.5 million for the years ended September 30, 2007 and 2006, respectively. Upon receipt of the final purchase price allocation in the fourth quarter of 2008, the Company reduced its expected tax expense on the sale of Filtertek from $4.8 million to $0.2 million. Filtertek’s operations were included within the Company’s Filtration segment prior to divestiture. The operations of the TekPack business are reflected in continuing operations and continue to be included in the Filtration segment.
The major classes of discontinued assets and liabilities included in the Consolidated Balance Sheet at September 30, 2007 are shown below:
(In thousands)
Assets September 30, 2007
Accounts receivable, net $ 17,675 Inventories 11,986 Other current assets 6,009
Current assets 35,670 Net property, plant & equipment 28,084 Goodwill 24,709 Other assets 3,052
Total assets of Discontinued Operations $ 91,515
liabilities
Accounts payable $ 8,908 Accrued expenses and other Current liabilities 8,086
Current liabilities 16,994 Other liabilities 2,534
Total liabilities of Discontinued Operations $ 19,528
3. Acquisitions
Doble
On November 30, 2007, the Company acquired the capital stock of Doble for a purchase price of approximately $328 million, net of cash acquired. Doble, headquartered in Watertown, Massachusetts, is a worldwide leader in providing high-end diagnostic test solutions for the electric utility industry. The acquisition aligns with the Company’s long-term growth strategy of expanding its products and services in the utility industry. The acquisition was funded by a combination of the Company’s existing cash, including the proceeds from the divestiture of Filtertek, and borrowings under a new $330 million credit facility led by National City Bank. The operating results for Doble, since the date of acquisition, are included within the USG segment.

E S C O T E C h n O l O g i E S i n C . 2 0 0 8 A n n u A l R E p O R T 31
notes to Consolidated Financial Statements
The acquisition was recorded by allocating the cost of completing the acquisition to the assets acquired, including identifiable intangible assets and liabilities assumed, based on their estimated fair values at the acquisition date pursuant to SFAS No. 141, “Business Combinations.” The excess of the cost of the acquisition over the net amounts assigned to the fair value of the assets acquired and the liabilities assumed was recorded as goodwill. The final valuation of intangible and tangible assets was completed prior to September 30, 2008. The purchase price allocation is as follows:
(In thousands)
Net tangible assets $ 44,498 Identifiable intangible assets: Trade names 112,290 Customer relationships 52,510 Software and databases 3,790
Total identifiable intangible assets 168,590 Goodwill 192,203 Long-term deferred tax liabilities (67,830)
Total cash consideration $ 337,461
Reconciliation of purchase price: Total cash consideration $ 337,461 Less: cash acquired (9,639)
Purchase price $ 327,822
The identifiable intangible assets consisting of customer relationships will be amortized on a straight-line basis over twenty years and the software and databases will be amortized on a straight-line basis over five years. The identifiable intangible asset consisting of trade names has an indefinite life and is not subject to amortization.
pro Forma Results
The following pro forma financial information for the years ended September 30, 2008 and 2007 presents the combined results of operations of ESCO and Doble as if the acquisition had occurred on October 1, 2006. The pro forma financial information for the periods presented excludes the Filtertek business which was sold on November 25, 2007. The combined results of operations have been adjusted for the impact of certain acquisition-related items, including additional amortization of identifiable intangible assets, additional financing expenses and other direct costs. The impact of pro forma adjustments are tax-effected at the expected future consolidated corporate tax rate.
The unaudited pro forma financial information is not intended to represent, or be indicative of, the Company’s consolidated results of operations or financial condition that would have been reported had the acquisition been completed as of the beginning of each of the periods presented. This information is provided for illustrative
purposes only and is not necessarily indicative of the Company’s future consolidated results of operations or financial condition.
(In millions, except per share data) (Unaudited)
Pro Forma Results FY 2008 FY 2007
Net sales $ 640.1 503.6 Net earnings from continuing operations $ 46.9 30.5
Net earnings per share Basic $ 1.82 1.18 Diluted $ 1.79 1.15
lDiC
On July 31, 2008, the Company acquired the capital stock of LDIC GmbH and LDIC AG (collectively “LDIC”) for a purchase price of approximately $13 million, net of cash acquired. LDIC, with operations in Germany and Switzerland, is a manufacturer of partial discharge diagnostic testing instruments and systems serving the international electric utility industry with annual revenues of approximately $10 million. The operating results for LDIC since the date of acquisition are included within Doble in the USG segment. The acquisition serves to broaden the portfolio of intelligent diagnostic products and will expand the distribution channels for Doble’s products and services throughout Europe. In connection with the acquisition of LDIC, the Company transferred $6.8 million of cash (€5 million) into an escrow account to be earned by the sellers if future target revenues are achieved. The $6.8 million is classified as restricted cash and is included in Other Assets on the Company’s consolidated balance sheet at September 30, 2008. The Company recorded approximately $8 million of goodwill as a result of the transaction and $2.5 million of trade names. In addition, the Company recorded $1.5 million of amortizable identifiable intangible assets consisting of customer relationships which are being amortized on a straight-line basis over seven years.
FY 07 — Wintec
On August 10, 2007, the Company acquired the assets and certain liabilities of Wintec, LLC (Wintec) for a purchase price of $6 million. Wintec is engaged in the design, manufacture and sale of metallic elements, filters, and strainers for pneumatic/hydraulic applications and surface tension devices for propellant management fluid control with annual revenues of approximately $3.5 million. The assets acquired consist of accounts receivable, inventory and property, plant and equipment. The Company recorded approximately $5 million of goodwill in connection with the transaction. In addition, the Company recorded $0.2 million of identifiable intangible assets consisting of customer contracts and order backlog which are being amortized on a straight-line basis over periods ranging from nine months to seventeen months. The operating results for Wintec, since the date of acquisition, are included within VACCO in the Filtration segment.

32 E S C O T E C h n O l O g i E S i n C . 2 0 0 8 A n n u A l R E p O R T
notes to Consolidated Financial Statements
FY 06 — Aclara RF
On February 1, 2006, the Company acquired the capital stock of Aclara RF (formerly Hexagram, Inc.) for a purchase price of approximately $66 million. The acquisition agreement also provides for contingent consideration of up to $6.25 million over the five-year period following the acquisition if Aclara RF exceeds certain sales targets. The Company paid $1.3 million of contingent consideration in both 2008 and 2007. Aclara RF is a radio-frequency (RF) fixed network AMI company headquartered in Cleveland, Ohio. Aclara RF broadens the Company’s served market and provides an RF based AMI system serving primarily electric, gas and water utilities. The operating results for Aclara RF, since the date of acquisition, are included within the USG segment. The Company recorded $6.6 million of amortizable identifiable intangible assets consisting primarily of patents and proprietary know-how, customer contracts, and order backlog which are being amortized on a straight-line basis over periods ranging from six months to seven years.
FY 06 — Aclara Software
On November 29, 2005, the Company acquired Aclara Software (formerly Nexus Energy Software, Inc.) through an all cash for shares merger transaction for approximately $29 million in cash plus contingent cash consideration over the four-year period following the merger if Aclara Software exceeds certain sales targets. Aclara Software is a software company headquartered in Wellesley, Massachusetts. Aclara Software broadens the Company’s served market and provides software solutions that allow utilities to fully utilize the information produced by the Company’s AMI systems. The operating results for Aclara Software, since the date of acquisition, are included within the USG segment. The Company recorded $2.7 million of identifiable intangible assets consisting primarily of customer contracts and order backlog which are being amortized on a straight-line basis over periods ranging from one year to three years. In connection with the acquisition of Aclara Software, the Company acquired approximately $13 million of net operating loss carryforward that will expire between 2017 and 2025 and is subject to a Section 382 limitation.
All of the Company’s acquisitions have been accounted for using the purchase method of accounting and accordingly, the respective purchase prices were allocated to the assets (including intangible assets) acquired and liabilities assumed based on estimated fair values at the date of acquisition. The financial results from these acquisitions have been included in the Company’s financial statements from the date of acquisition. Pro forma financial information related to the Company’s acquisitions, excluding Doble, was not presented as it was not significant to the Company’s results of operations. None of the goodwill recorded as part of the acquisitions mentioned above is expected to be deductible for U.S. Federal or state income tax purposes.
4. goodwill and Other intangible Assets
Included on the Company’s Consolidated Balance Sheets at September 30, 2008 and 2007 are the following intangible assets gross carrying amounts and accumulated amortization:
(Dollars in millions) 2008 2007
Goodwill $ 328.9 124.8
Intangible assets with determinable lives: Patents Gross carrying amount $ 13.6 13.5 Less: accumulated amortization 12.8 12.5
Net $ 0.8 1.0
Capitalized software Gross carrying amount $ 91.2 79.1 Less: accumulated amortization 27.4 13.7
Net $ 63.8 65.4
Customer Relationships Gross carrying amount $ 54.0 — Less: accumulated amortization 2.2 —
Net $ 51.8 —
Other Gross carrying amount $ 10.0 9.9 Less: accumulated amortization 6.5 5.1
Net $ 3.5 4.8
Intangible assets with indeterminable lives: Trade names $ 118.3 3.5
The Company performed its annual evaluation of goodwill and intangible assets for impairment during the fourth quarter of fiscal 2008 and concluded no impairment existed at September 30, 2008.
The changes in the carrying amount of goodwill attributable to each business segment for the years ended September 30, 2008 and 2007 are as follows:
(Dollars in millions) USG Test Filtration
Balance as of September 30, 2006 $ 74.6 29.1 39.8 Acquisitions 0.8 — 5.2
Balance as of September 30, 2007 75.4 29.1 45.0 Divestiture — — (24.7)
Acquisitions 203.7 0.4 —
Balance as of September 30, 2008 $ 279.1 29.5 20.3

E S C O T E C h n O l O g i E S i n C . 2 0 0 8 A n n u A l R E p O R T 33
Amortization expense related to intangible assets with determinable lives was $17.6 million, $10.2 million and $6.4 million in 2008, 2007 and 2006, respectively. The increase in amortization expense in 2008 as compared to the prior year was mainly due to the Company’s TWACS NG software and the purchase accounting identifiable assets. The Company recorded $11.0 million and $6.2 million of amortization expense related to Aclara PLS’s TWACS NG software in 2008 and 2007, respectively. Patents are amortized over the life of the patents, generally 17 years. Capitalized software is amortized over the estimated useful life of the software, generally three to seven years. Estimated intangible assets amortization for fiscal year 2009 is approximately $19 million. Intangible asset amortization for fiscal years 2010 through 2013 is estimated at approximately $20 million declining to $12 million per year. The decrease in intangible asset amortization is related to the TWACS NG software.
5. Accounts Receivable
Accounts receivable, net of the allowance for doubtful accounts, consist of the following at September 30, 2008 and 2007:
(Dollars in thousands) 2008 2007
Commercial $126,860 80,039
U.S. Government and prime contractors 8,576 5,280
Total $135,436 85,319
6. inventories
Inventories consist of the following at September 30, 2008 and 2007:
(Dollars in thousands) 2008 2007
Finished goods $20,590 17,653
Work in process — including long-term contracts 15,736 13,892
Raw materials 30,636 24,340
Total $66,962 55,885
7. property, plant and Equipment
Depreciation expense of property, plant and equipment from continuing operations for the years ended September 30, 2008, 2007 and 2006 was $10.0 million, $6.3 million and $5.3 million, respectively.
The Company leases certain real property, equipment and machinery under noncancelable operating leases. Rental expense under these operating leases for the years ended September 30, 2008, 2007 and 2006 was $7.8 million, $6.6 million and $5.5 million, respectively.
Future aggregate minimum lease payments under operating leases that have initial or remaining noncancelable lease terms in excess of one year as of September 30, 2008 are:
(Dollars in thousands) Years ending September 30:
2009 $ 7,305
2010 5,621
2011 4,313
2012 3,863
2013 and thereafter 4,067
Total $25,169
8. income Tax Expense
Total income tax expense for the years ended September 30, 2008, 2007 and 2006 was allocated as follows:
(Dollars in thousands) 2008 2007 2006
Income tax expense from continuing operations $23,613 7,633 15,220Discontinued operations 482 1,382 2,402
Total income tax expense $24,095 9,015 17,622
The components of income from continuing operations before income taxes consisted of the following for the years ended September 30:
(Dollars in thousands) 2008 2007 2006
United States $66,460 33,922 40,204Foreign 4,555 4,117 4,181
Total income before income taxes $71,015 38,039 44,385
The principal components of income tax expense from continuing operations for the years ended September 30, 2008, 2007 and 2006 consist of:
(Dollars in thousands) 2008 2007 2006
Federal
Current (including Alternative Minimum Tax) $ 737 (6,530) 1,607
Deferred 16,457 10,342 10,384
State and local:
Current 2,807 919 2,454
Deferred 2,113 1,967 (451)
Foreign:
Current 1,234 1,106 1,220
Deferred 265 (171) 6
Total $ 23,613 7,633 15,220
notes to Consolidated Financial Statements

34 E S C O T E C h n O l O g i E S i n C . 2 0 0 8 A n n u A l R E p O R T
The actual income tax expense from continuing operations for the years ended September 30, 2008, 2007 and 2006 differs from the expected tax expense for those years (computed by applying the U.S. Federal corporate statutory rate) as follows:
2008 2007 2006
Federal corporate statutory rate 35.0% 35.0% 35.0%
State and local, net of Federal benefits 2.5 2.8 2.4
Foreign — Puerto Rico — (0.7) 0.4
Foreign — Other (0.1) (0.6) (0.6)
Foreign — Tax Credit (0.2) — —
Foreign earnings repatriation — — 4.4
Research credit (1.4) (11.6) (5.5)
Export Incentive (2.2) — —
Domestic Production Deduction (1.1) — —
Share-Based Compensation 0.7 3.7 1.3
Change in tax contingencies — (5.9) (3.1)
Change in FIN 48 Liability (0.3) — —
Release of valuation allowance — (2.0) —
Other, net 0.4 (0.6) —
Effective income tax rate 33.3% 20.1% 34.3%
The tax effects of temporary differences that give rise to significant portions of the deferred tax assets and liabilities at September 30, 2008 and 2007 are presented below.
(Dollars in thousands) 2008 2007
Deferred tax assets:
Inventories, long-term contract accounting, contract cost reserves and others $ 1,964 3,828
Pension and other postretirement benefits 4,393 3,339
Net operating loss carryforward — domestic 1,429 12,311
Net operating loss carryforward — foreign 3,950 3,092
Alternative Minimum Tax credit carryforward — 779
Capital loss carryforward 8,297 7,888
Other compensation-related costs and other cost accruals 10,830 11,285
Research credit carryforward 10,020 13,979
Total deferred tax assets 40,883 56,501
Deferred tax liabilities:
Plant and equipment, depreciation methods, acquisition asset allocations, and other (96,783) (38,780)
Net deferred tax (liability) asset before valuation allowance (55,900) 17,721
Less valuation allowance (12,247) (10,979)
Net deferred tax (liabilities) assets $ (68,147) 6,742
At September 30, 2008, the Company has established a valuation allowance of $8.3 million against the capital loss carryforward generated in 2004 and 2008, as such loss carryforward may not be realized in future periods. In addition, the Company has established a valuation allowance against certain net operating loss (NOL) carryforwards in foreign jurisdictions which may not be realized
in future periods. The valuation allowance established against the foreign NOL carryforwards was $3.9 million and $3.1 million at September 30, 2008 and 2007, respectively. The Company classifies its valuation allowance related to deferred taxes on a pro rata basis.
The Company expects the net research tax credits related to fiscal year 2008 to be approximately $0.9 million. On October 3, 2008, the President signed into law the Tax Extenders and Alternative Minimum Tax Relief Act of 2008. Accordingly, $0.7 million of fiscal year 2008 research tax credit benefit is expected to be recognized as a discrete item in the first quarter of 2009. In fiscal 2008, the Company recorded $1.0 million of research credits. The expiration of the research credits is between 2020 and 2028. The Company anticipates being able to utilize the research credits to reduce future Federal and state income tax cash payments.
No deferred taxes have been provided on the accumulated unremitted earnings of the Company’s foreign subsidiaries as of September 30, 2008. The Company’s intention is to reinvest these earnings indefinitely. In the event these foreign entities’ earnings were distributed, it is estimated that U.S. taxes, net of available foreign tax credits, of approximately $3.3 million would be due, which would correspondingly reduce the Company’s net earnings.
Effective October 1, 2007, the Company adopted FASB Interpretation No. 48, “Accounting for Uncertainty in Income Taxes” (FIN 48). FIN 48 provides a financial statement recognition threshold and measurement attribute for a tax position taken or expected to be taken in a tax return. The adoption of FIN 48 had the following impact on the Company’s financial statements: decreased current assets by $1.5 million, decreased current liabilities by $0.3 million, and decreased long-term liabilities by $1.2 million. As of October 1, 2007, the Company had $6.7 million of unrecognized tax benefits of which $5.9 million, if recognized, would affect the Company’s effective tax rate. The Company made no adjustments to retained earnings related to the adoption. As of September 30, 2008, the Company had $13.0 million of unrecognized benefits (see table below), of which $10.8 million of the unrecognized tax benefits, net of Federal benefit, if recognized, would affect the Company’s effective tax rate with the remaining amount impacting goodwill.
A reconciliation of the Company’s unrecognized tax benefits for the year ended September 30, 2008 is presented in the table below:
(Dollars in millions)
Balance as of October 1, 2007 $ 6.7
Increases related to prior year tax positions 6.3
Decreases related to prior year tax positions (0.1)
Increases related to current year tax positions 0.3
Lapse of statute of limitations (0.2)
Balance as of September 30, 2008 $13.0
The Company anticipates a $0.3 million reduction in the amount of unrecognized tax benefits in the next twelve months as a result of a lapse of the applicable statute of limitations. The Company’s policy
notes to Consolidated Financial Statements

E S C O T E C h n O l O g i E S i n C . 2 0 0 8 A n n u A l R E p O R T 35
notes to Consolidated Financial Statements
is to include interest related to unrecognized tax benefits in income tax expense and penalties in operating expense. As of September 30, 2008, the Company had accrued interest related to uncertain tax positions of $0.2 million, net of Federal income tax benefit, on its consolidated balance sheet. No penalties have been accrued.
The principal jurisdictions for which the Company files income tax returns are U.S. Federal and the various city, state, and interna-tional locations where the Company has operations. Due to the Company’s available net operating loss, the 1995 through 2007 U.S. Federal tax years remain subject to income tax examinations. During the fourth quarter of 2008, the Internal Revenue Service (IRS) commenced examination of the Company’s U.S. Federal income tax return for the period ended September 30, 2003 through September 30, 2006. It is reasonably possible that the fiscal years 2003-2006 U.S. audit cycle will be completed during the next twelve months, which could result in a decrease in the balance of unrecognized tax benefits. However, no adjustments have been pro-posed by the IRS and therefore, an estimate of a range cannot be made at this time. Various state tax years from 2003 through 2007 remain subject to income tax examinations. The Company is subject to income tax in many jurisdictions outside the United States, none of which are individually material to the Company’s financial posi-tion, statements of cash flows, or results of operations.
9. Debt
Debt consists of the following at September 30, 2008 and 2007:
(Dollars in thousands) 2008 2007
Revolving credit facility, including current portion $233,650 —
Current portion of long-term debt (50,000) —
Total long-term debt, less current portion $183,650 —
On November 30, 2007, in conjunction with the acquisition of Doble, the Company entered into a new $330 million five-year revolving credit facility with a $50 million increase option. This facility replaced the Company’s $100 million credit facility. The credit facility is available for direct borrowings and/or the issuance of letters of credit, and is provided by a group of sixteen banks, led by National City Bank as agent, with a maturity of November 30, 2012. At September 30, 2008, the Company had approximately $90 million available to borrow under the credit facility, plus a $50 million increase option, in addition to $28.7 million cash on hand. At September 30, 2008, the Company had outstanding letters of credit of $6.6 million. The Company classified $50 million as the current portion on long-term debt as of September 30, 2008, as the Company intends to repay this amount within the next twelve months.
The credit facility requires, as determined by certain financial ratios, a facility fee ranging from 15 to 25 basis points per annum on the unused portion. The terms of the facility provide that interest on borrowings may be calculated at a spread over the London Interbank Offered Rate (LIBOR) or based on the prime rate, at the Company’s election. The facility is secured by the unlimited guaranty of the Company’s material domestic subsidiaries and a 65% pledge of the material foreign subsidiaries’ share equity. The financial covenants of the credit facility include a leverage ratio and an interest coverage ratio. During 2008 and 2007, the maximum aggregate short-term borrowings at any month-end were $274.7 million and $9 million, respectively; the average aggregate short-term borrowings outstanding based on month-end balances were $249.8 million and $1.7 million, respectively; and the weighted average interest rates were 4.75%, 6.24%, and 5.25% for 2008, 2007 and 2006, respectively. The letters of credit issued and outstanding under the credit facility totaled $6.6 million and $0.8 million at September 30, 2008, and 2007, respectively.
10. Capital Stock
The 29,465,154 and 29,159,629 common shares as presented in the accompanying Consolidated Balance Sheets at September 30, 2008 and 2007 represent the actual number of shares issued at the respective dates. The Company held 3,375,106 and 3,416,966 common shares in treasury at September 30, 2008 and 2007, respectively.
In August 2008, the Company’s Board of Directors authorized an open market common stock repurchase program of the Company’s shares in a value not to exceed $30 million, subject to market conditions and other factors which covers the period through September 30, 2009. There were no stock repurchases during 2008. The Company repurchased $10 million or 265,000 shares during 2007. There were no stock repurchases during 2006.
11. Share-Based Compensation
The Company provides compensation benefits to certain key employees under several share-based plans providing for employee stock options and/or performance-accelerated restricted shares (restricted shares), and to non-employee directors under a non-employee directors compensation plan. During fiscal 2004, the Board of Directors authorized and the shareholders approved, the 2004 Incentive Compensation Plan, which states, in part, that on February 5, 2004, there shall be 2,000,000 shares added to the authorized shares allocated for the grant of stock options, stock appreciation rights, performance-accelerated restricted stock, or other full value awards. Of these, shares up to 600,000 may be utilized for performance-accelerated restricted stock or other full value awards. At September 30, 2008, the maximum number of full value shares available for issue under the 2004 Incentive Compensation Plan and the 2001 Stock Incentive Plan was 600,000 and 187,167 shares, respectively.
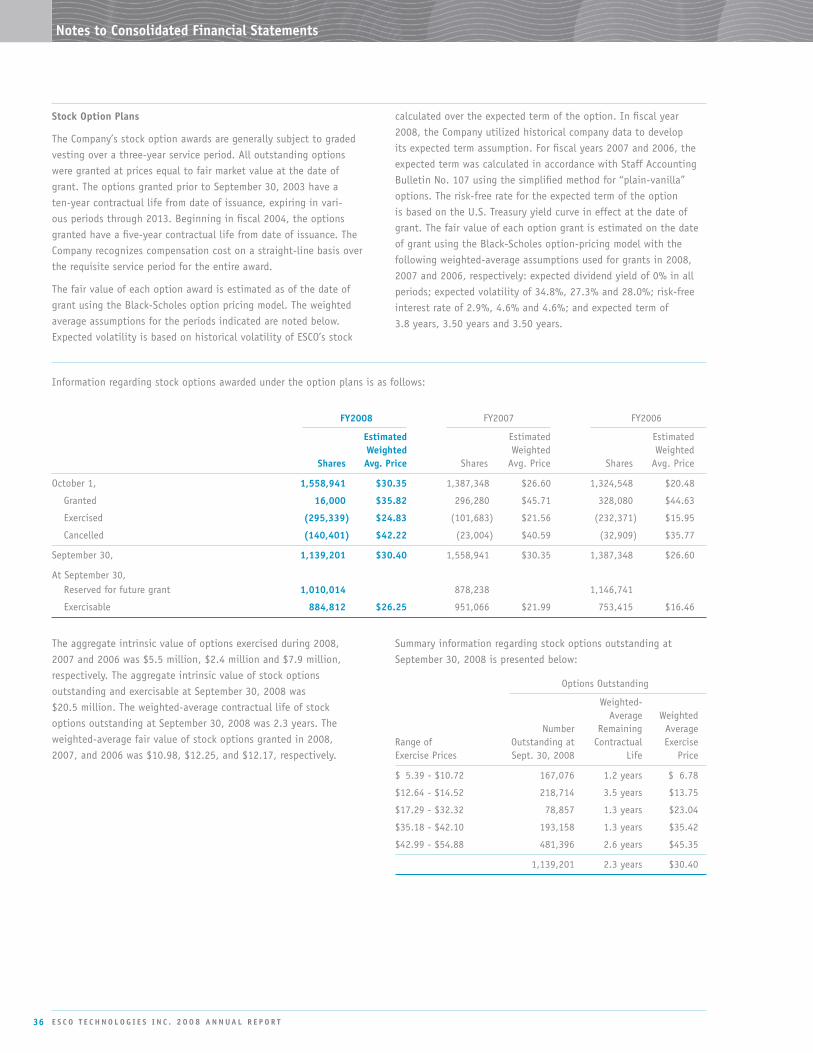
36 E S C O T E C h n O l O g i E S i n C . 2 0 0 8 A n n u A l R E p O R T
notes to Consolidated Financial Statements
The aggregate intrinsic value of options exercised during 2008, 2007 and 2006 was $5.5 million, $2.4 million and $7.9 million, respectively. The aggregate intrinsic value of stock options outstanding and exercisable at September 30, 2008 was $20.5 million. The weighted-average contractual life of stock options outstanding at September 30, 2008 was 2.3 years. The weighted-average fair value of stock options granted in 2008, 2007, and 2006 was $10.98, $12.25, and $12.17, respectively.
Summary information regarding stock options outstanding at September 30, 2008 is presented below:
Options Outstanding
Weighted- Average Weighted Number Remaining Average Range of Outstanding at Contractual Exercise Exercise Prices Sept. 30, 2008 Life Price
$ 5.39 - $10.72 167,076 1.2 years $ 6.78
$12.64 - $14.52 218,714 3.5 years $13.75
$17.29 - $32.32 78,857 1.3 years $23.04
$35.18 - $42.10 193,158 1.3 years $35.42
$42.99 - $54.88 481,396 2.6 years $45.35
1,139,201 2.3 years $30.40
FY2008 FY2007 FY2006
Estimated Estimated Estimated Weighted Weighted Weighted Shares Avg. price Shares Avg. Price Shares Avg. Price
October 1, 1,558,941 $30.35 1,387,348 $ 26.60 1,324,548 $ 20.48
Granted 16,000 $35.82 296,280 $ 45.71 328,080 $ 44.63
Exercised (295,339) $24.83 (101,683) $ 21.56 (232,371) $ 15.95
Cancelled (140,401) $42.22 (23,004) $ 40.59 (32,909) $ 35.77
September 30, 1,139,201 $30.40 1,558,941 $ 30.35 1,387,348 $ 26.60
At September 30, Reserved for future grant 1,010,014 878,238 1,146,741
Exercisable 884,812 $26.25 951,066 $ 21.99 753,415 $ 16.46
Information regarding stock options awarded under the option plans is as follows:
Stock Option plans
The Company’s stock option awards are generally subject to graded vesting over a three-year service period. All outstanding options were granted at prices equal to fair market value at the date of grant. The options granted prior to September 30, 2003 have a ten-year contractual life from date of issuance, expiring in vari-ous periods through 2013. Beginning in fiscal 2004, the options granted have a five-year contractual life from date of issuance. The Company recognizes compensation cost on a straight-line basis over the requisite service period for the entire award.
The fair value of each option award is estimated as of the date of grant using the Black-Scholes option pricing model. The weighted average assumptions for the periods indicated are noted below. Expected volatility is based on historical volatility of ESCO’s stock
calculated over the expected term of the option. In fiscal year 2008, the Company utilized historical company data to develop its expected term assumption. For fiscal years 2007 and 2006, the expected term was calculated in accordance with Staff Accounting Bulletin No. 107 using the simplified method for “plain-vanilla” options. The risk-free rate for the expected term of the option is based on the U.S. Treasury yield curve in effect at the date of grant. The fair value of each option grant is estimated on the date of grant using the Black-Scholes option-pricing model with the following weighted-average assumptions used for grants in 2008, 2007 and 2006, respectively: expected dividend yield of 0% in all periods; expected volatility of 34.8%, 27.3% and 28.0%; risk-free interest rate of 2.9%, 4.6% and 4.6%; and expected term of 3.8 years, 3.50 years and 3.50 years.

E S C O T E C h n O l O g i E S i n C . 2 0 0 8 A n n u A l R E p O R T 37
notes to Consolidated Financial Statements
Exercisable Options Outstanding
Weighted Number Average Range of Exercisable at Exercise Exercise Prices Sept. 30, 2008 Price
$ 5.39 - $10.72 167,076 $ 6.78
$12.64 - $14.52 218,714 $13.75
$17.29 - $32.32 78,857 $23.04
$35.18 - $54.88 420,165 $41.11
884,812 $26.25
performance-accelerated Restricted Share Awards
The performance-accelerated restricted shares (restricted shares) have a five-year term with accelerated vesting if certain performance targets are achieved. In these cases, if it is probable that the performance condition will be met, the Company recognizes compensation cost on a straight-line basis over the shorter performance period; otherwise, it will recognize compensation cost over the longer service period. Compensation cost for the majority of the outstanding restricted share awards is being recognized over the longer performance period as it is not probable the performance condition will be met. The restricted share award grants were valued at the stock price on the date of grant. Pretax compensation expense related to the restricted share awards was $1.2 million, $1.5 million and $1.5 million for fiscal years ended September 30, 2008, 2007 and 2006, respectively.
The following summary presents information regarding outstanding restricted share awards as of September 30, 2008 and changes during the period then ended:
Weighted Shares Avg. Price
Nonvested at October 1, 2007 164,060 $41.77
Granted 94,335 $37.08
Vested (44,500) $34.80
Cancelled (11,000) $41.32
Nonvested at September 30, 2008 202,895 $41.15
non-Employee Directors plan
The non-employee directors compensation plan provides to each non-employee director a retainer of 800 common shares per quarter. Compensation expense related to the non-employee director grants was $0.7 million, $0.8 million and $1.0 million for the years ended September 30, 2008, 2007 and 2006, respectively.
The total share-based compensation cost that has been recognized in results of operations and included within SG&A (continuing operations) was $4.0 million, $4.8 million and $4.3 million for the years ended September 30, 2008, 2007 and 2006, respectively. The total income tax benefit recognized in results of operations for share-based compensation arrangements was $1.1 million, $1.2 million and $1.2 million for the years ended September 30, 2008, 2007 and 2006, respectively. The Company has elected to
use tax law ordering rules when calculating the income tax benefit associated with its share-based payment arrangements. In addition, the Company elected to use the simplified method of calculating the pool of excess tax benefits available to absorb tax deficiencies recognized subsequent to the adoption of SFAS No. 123(R)-3, “Transition Election related to Accounting for the Tax Effects of Share-Based Payment Awards.” As of September 30, 2008, there was $9.6 million of total unrecognized compensation cost related to share-based compensation arrangements. That cost is expected to be recognized over a weighted-average period of 2.4 years.
12. Retirement and Other Benefit plans
Substantially all domestic employees are covered by a defined contribution pension plan maintained by the Company. Effective December 31, 2003, the Company’s defined benefit plan was frozen and no additional benefits will be accrued after that date. As a result, the accumulated benefit obligation and projected benefit obligation are equal. These frozen retirement income benefits are provided to employees under defined benefit pay-related and flat-dollar plans, which are noncontributory. In conjunction with the acquisition of Doble, the Company assumed responsibility for their defined benefit plan which it intends to freeze effective December 31, 2008 and no additional benefits will be accrued after that date. The annual contributions to the defined benefit retirement plans equal or exceed the minimum funding requirements of the Employee Retirement Income Security Act or applicable local regulations. In addition to providing retirement income benefits, the Company provides unfunded postretirement health and life insurance benefits to certain retirees. To qualify, an employee must retire at age 55 or later and the employee’s age plus service must equal or exceed 75. Retiree contributions are defined as a percentage of medical premiums. Consequently, retiree contributions increase with increases in the medical premiums. The life insurance plans are noncontributory and provide coverage of a flat dollar amount for qualifying retired employees. Effective December 31, 2004, no new retirees are eligible for life insurance benefits.
The Company adopted Statement of Financial Accounting Standards No. 158, “Employer’s Accounting for Defined Benefit Pension and Other Postretirement Plans” (SFAS 158) as of September 30, 2007. SFAS 158 requires an employer to recognize the overfunded or underfunded status of a defined benefit postretirement plan as an asset or liability in its statement of financial position and to recognize changes in that funded status in the year in which the changes occur through comprehensive income. As a result of adopting the provisions of SFAS 158, the Company recorded a pretax credit of $0.9 million to accumulated other comprehensive income in equity as of September 30, 2007.
The Company uses a measurement date of September 30 for its pension and other postretirement benefit plans. The Company has an accrued benefit liability of $0.6 million and $0.7 million at September 30, 2008 and 2007, respectively, related to its other
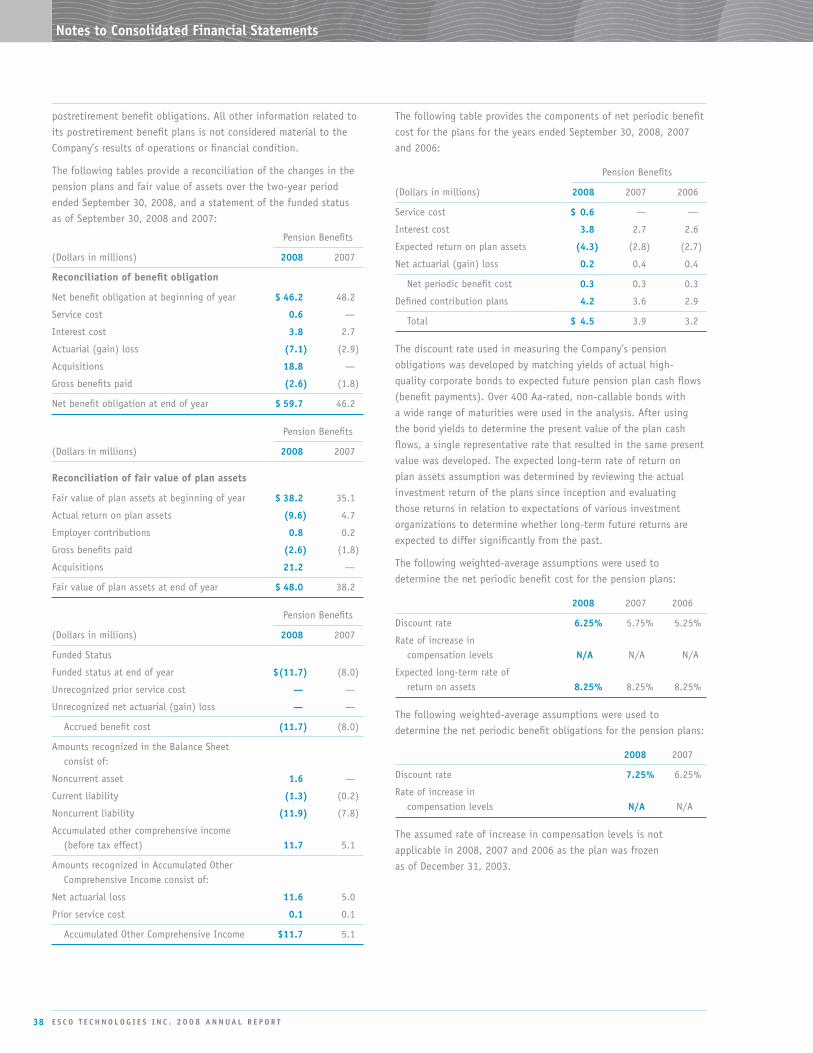
38 E S C O T E C h n O l O g i E S i n C . 2 0 0 8 A n n u A l R E p O R T
postretirement benefit obligations. All other information related to its postretirement benefit plans is not considered material to the Company’s results of operations or financial condition.
The following tables provide a reconciliation of the changes in the pension plans and fair value of assets over the two-year period ended September 30, 2008, and a statement of the funded status as of September 30, 2008 and 2007:
Pension Benefits
(Dollars in millions) 2008 2007
Reconciliation of benefit obligation
Net benefit obligation at beginning of year $ 46.2 48.2
Service cost 0.6 —
Interest cost 3.8 2.7
Actuarial (gain) loss (7.1) (2.9)
Acquisitions 18.8 —
Gross benefits paid (2.6) (1.8)
Net benefit obligation at end of year $ 59.7 46.2
Pension Benefits
(Dollars in millions) 2008 2007
Reconciliation of fair value of plan assets
Fair value of plan assets at beginning of year $ 38.2 35.1
Actual return on plan assets (9.6) 4.7
Employer contributions 0.8 0.2
Gross benefits paid (2.6) (1.8)
Acquisitions 21.2 —
Fair value of plan assets at end of year $ 48.0 38.2
Pension Benefits
(Dollars in millions) 2008 2007
Funded Status
Funded status at end of year $(11.7) (8.0)
Unrecognized prior service cost — —
Unrecognized net actuarial (gain) loss — —
Accrued benefit cost (11.7) (8.0)
Amounts recognized in the Balance Sheet consist of:
Noncurrent asset 1.6 —
Current liability (1.3) (0.2)
Noncurrent liability (11.9) (7.8)
Accumulated other comprehensive income (before tax effect) 11.7 5.1
Amounts recognized in Accumulated Other Comprehensive Income consist of:
Net actuarial loss 11.6 5.0
Prior service cost 0.1 0.1
Accumulated Other Comprehensive Income $11.7 5.1
The following table provides the components of net periodic benefit cost for the plans for the years ended September 30, 2008, 2007 and 2006:
Pension Benefits
(Dollars in millions) 2008 2007 2006
Service cost $ 0.6 — —
Interest cost 3.8 2.7 2.6
Expected return on plan assets (4.3) (2.8) (2.7)
Net actuarial (gain) loss 0.2 0.4 0.4
Net periodic benefit cost 0.3 0.3 0.3
Defined contribution plans 4.2 3.6 2.9
Total $ 4.5 3.9 3.2
The discount rate used in measuring the Company’s pension obligations was developed by matching yields of actual high-quality corporate bonds to expected future pension plan cash flows (benefit payments). Over 400 Aa-rated, non-callable bonds with a wide range of maturities were used in the analysis. After using the bond yields to determine the present value of the plan cash flows, a single representative rate that resulted in the same present value was developed. The expected long-term rate of return on plan assets assumption was determined by reviewing the actual investment return of the plans since inception and evaluating those returns in relation to expectations of various investment organizations to determine whether long-term future returns are expected to differ significantly from the past.
The following weighted-average assumptions were used to determine the net periodic benefit cost for the pension plans:
2008 2007 2006
Discount rate 6.25% 5.75% 5.25%
Rate of increase in compensation levels n/A N/A N/A
Expected long-term rate of return on assets 8.25% 8.25% 8.25%
The following weighted-average assumptions were used to determine the net periodic benefit obligations for the pension plans:
2008 2007
Discount rate 7.25% 6.25%
Rate of increase in compensation levels n/A N/A
The assumed rate of increase in compensation levels is not applicable in 2008, 2007 and 2006 as the plan was frozen as of December 31, 2003.
notes to Consolidated Financial Statements

E S C O T E C h n O l O g i E S i n C . 2 0 0 8 A n n u A l R E p O R T 39
The asset allocation for the Company’s pension plans at the end of 2008 and 2007, the Company’s acceptable range and the target allocation for 2009, by asset category, follows:
Target Acceptable Percentage of Plan Allocation Range Assets at Year-end Asset Category 2009 2008 2007
Equity securities 60% 50-70% 62% 69%
Fixed income 40% 30-50% 36% 29%
Cash/cash equivalents 0% 0-5% 2% 2%
The Company’s pension plan assets are managed by outside investment managers and assets are rebalanced when the target ranges are exceeded. Pension plan assets consist principally of marketable securities including common stocks, bonds, and interest-bearing deposits. The Company’s investment strategy with respect to pension assets is to achieve a total rate of return (income and capital appreciation) that is sufficient to accomplish the purpose of providing retirement benefits to all eligible and future retirees of the pension plan. The Company regularly monitors performance and compliance with investment guidelines.
EXpECTED CASh FlOWS
Information about the expected cash flows for the pension and other postretirement benefit plans follows:
Pension Other (Dollars in millions) Benefits Benefits
Expected Employer Contributions — 2009 $ 5.0 0.1
Expected Benefit Payments
2009 4.4 0.1
2010 3.4 0.1
2011 3.6 0.1
2012 3.9 0.1
2013 4.5 0.1
2014-2018 $24.5 0.3
13. Derivative Financial instruments
Market risks relating to the Company’s operations result primarily from changes in interest rates and changes in foreign currency exchange rates. The Company is exposed to market risk related to changes in interest rates and selectively uses derivative financial instruments, including forward contracts and swaps, to manage these risks. During 2008, the Company entered into a two-year amortizing interest rate swap to hedge some of its exposure to variability in future LIBOR-based interest payments on variable rate debt. The swap notional amount for the first year is $175 million amortizing to $100 million in the second year. All derivative
instruments are reported on the balance sheet at fair value. The derivative instrument is designated as a cash flow hedge and the gain or loss on the derivative is deferred in accumulated other comprehensive income until recognized in earnings with the underlying hedged item. Including the impact of interest rate swaps outstanding, the interest rates on approximately 75% of the Company’s total borrowings were effectively fixed as of September 30, 2008. The following is a summary of the notional transaction amounts and fair values for the Company’s outstanding derivative financial instruments by risk category and instrument type, as of September 30, 2008.
(Dollars in thousands) Notional Avg Rec Average Fair Amount Rate Pay Rate Value
Interest rate swaps $175,000 2.82% 3.99% ($1,347)
14. Other Financial Data
Items charged to operations during the years ended September 30, 2008, 2007 and 2006 included the following:
(Dollars in thousands) 2008 2007 2006
Salaries and wages (including fringes) $146,448 113,924 95,839
Maintenance and repairs 3,359 3,053 2,686
Research and development (R&D) costs:
Company-sponsored 32,955 23,471 18,329
Customer-sponsored 5,293 3,718 2,522
Total R&D $ 38,248 27,189 20,851
Other engineering costs 10,537 9,082 9,069
Total R&D and other engineering costs $ 48,785 36,271 29,920
As a % of net sales 7.8% 8.2% 7.8%
Customer-sponsored R&D is defined in Note 1(O) of Notes to Consolidated Financial Statements.
A reconciliation of the changes in accrued product warranty liability for the years ended September 30, 2008, 2007, and 2006 is as follows:
(Dollars in thousands) 2008 2007 2006
Balance as of October 1 $1,445 1,390 930
Additions charged to expense 3,387 1,769 2,330
Deductions (1,887) (1,714) (1,870)
Balance as of September 30 $2,945 1,445 1,390
notes to Consolidated Financial Statements

40 E S C O T E C h n O l O g i E S i n C . 2 0 0 8 A n n u A l R E p O R T
15. Business Segment information
The Company is organized based on the products and services it offers. Under this organizational structure, the Company has three reporting segments: Utility Solutions Group (USG), Test and Filtration/Fluid Flow (Filtration). In conjunction with the acquisition of Doble in November 2007, the Company changed the name of the Communications segment to the Utility Solutions Group segment. The renaming of this segment more accurately describes the segment’s operating activities and strategically aligns the respective operating entities to focus on a single goal of satisfying the expanding AMI, Smart Grid, and other operational requirements of electric, gas and water utilities worldwide. The segment name change was done along with the Company’s strategic integration and rebranding of its three AMI related technologies under the unified brand name Aclara™, and renaming the AMI businesses as follows: Distribution Control Systems, Inc. was renamed Aclara Power-Line Systems Inc.; Hexagram, Inc. was renamed Aclara RF Systems Inc.; and Nexus Energy Software, Inc. was renamed Aclara Software Inc. In addition to the AMI businesses operating under the Aclara™ brand, the USG also includes Comtrak Technologies, LLC (Comtrak) and Doble. The USG segment is a proven supplier of special purpose fixed network communications systems for electric, gas and water utilities, including hardware and software to support advanced metering applications. Aclara PLS’s Two-Way Automatic Communications System, known as TWACS®, is currently used for automatic meter reading (AMR) and related advanced metering infrastructure (AMI) functions serving over 200 utilities, as well as having load management capabilities. Aclara RF’s STAR® system, the premier wireless AMI system, delivers two-way and one-way operation on secure licensed radio frequencies for more than 100 utilities serving electric, gas and water customers. Aclara Software applications add value across the utility enterprise, addressing meter and energy data management, distribution planning and operations, customer service and revenue management. Doble provides high-end, diagnostic test solutions for the electric power delivery industry and is a leading supplier of partial discharge testing instruments used to assess the integrity of high voltage power delivery equipment. Comtrak’s SecurVision® product line provides digital video surveillance and security functions for large commercial enterprises and alarm monitoring companies.
Test segment operations represent the EMC Group, consisting primarily of ETS-Lindgren L.P. (ETS) and Lindgren R.F. Enclosures, Inc. (Lindgren). The EMC Group is principally involved in the design and manufacture of EMC test equipment, test chambers, and electromagnetic absorption materials.
The EMC Group also manufactures radio frequency (RF) shielding products and components used by manufacturers of medical equip-ment, communications systems, electronic products, and shielded rooms for high security data processing and secure communication.
As a result of the divestiture of Filtertek in November 2007, the Company reevaluated the aggregation criteria of its remaining
operating units within the Filtration segment. The TekPack business (formerly a division of Filtertek) was not included in the divestiture transaction. Prior to the divestiture of Filtertek, each of the components of the Filtration segment were presented separately due to differing long-term economics. However, as a result of the divestiture of Filtertek, management believes the remaining companies within the Filtration segment now have similar long-term economics and, therefore, will not be presented separately beginning in fiscal 2008. The Filtration segment’s operations consist of: PTI Technologies Inc., VACCO Industries and TekPack. PTI and VACCO develop and manufacture a wide range of filtration products and are leading suppliers of filters to the commercial and defense aerospace, satellite and industrial markets.
Accounting policies of the segments are the same as those described in the summary of significant accounting policies in Note 1 to the Consolidated Financial Statements.
In accordance with SFAS 131, the Company evaluates the performance of its operating units based on EBIT, which is defined as: Earnings Before Interest and Taxes. Intersegment sales and transfers are not significant. Segment assets consist primarily of customer receivables, inventories, capitalized software and fixed assets directly associated with the production processes of the segment. Segment depreciation and amortization is based upon the direct assets listed above. Information in the tables below is presented on a Continuing Operations basis and excludes Discontinued Operations.
nET SAlES
(Dollars in millions)
Year ended September 30, 2008 2007 2006
Utility Solutions $362.9 197.6 156.2
Test 144.8 141.5 128.6
Filtration 116.1 105.6 97.6
Consolidated totals $623.8 444.7 382.4
One customer (PG&E) exceeded 10% of net sales in fiscal 2008 with sales of $110.2 million. No customers exceeded 10% of net sales in 2007 or 2006.
EBiT
(Dollars in millions)
Year ended September 30, 2008 2007 2006
Utility Solutions $ 66.3 22.0 28.3
Test 13.9 14.4 15.0
Filtration 21.2 18.4 14.9
Reconciliation to consolidated totals (Corporate) (20.6) (17.4) (14.7)
Consolidated EBIT 80.8 37.4 43.5
Less: interest expense (9.8) — —
Add: interest income — 0.6 0.9
Earnings before income tax $ 71.0 38.0 44.4
notes to Consolidated Financial Statements

E S C O T E C h n O l O g i E S i n C . 2 0 0 8 A n n u A l R E p O R T 41
gEOgRAphiC inFORMATiOn
net sales
(Dollars in millions)
Year ended September 30, 2008 2007 2006
United States $492.9 361.7 311.0
Europe 34.4 21.1 16.9
Far East 55.5 38.0 36.1
Other 41.0 24.0 18.4
Consolidated totals $623.8 444.7 382.4
long-lived assets
(Dollars in millions)
Year ended September 30, 2008 2007 2006
United States $66.4 45.7 41.6
Europe 3.5 2.0 1.5
Other 2.7 2.5 0.8
Consolidated totals $72.6 50.2 43.9
Net sales are attributed to countries based on location of customer. Long-lived assets are attributed to countries based on location of the asset.
16. Commitments and Contingencies
At September 30, 2008, the Company had $6.6 million in letters of credit outstanding as guarantees of contract performance. As a normal incidence of the businesses in which the Company is engaged, various claims, charges and litigation are asserted or commenced against the Company. With respect to claims and litigation asserted or commenced against the Company, it is the opinion of Management, that final judgments, if any, which might be rendered against the Company are adequately reserved, covered by insurance, or are not likely to have a material adverse effect on its financial condition or results of operation.
iDEnTiFiABlE ASSETS
(Dollars in millions)
Year ended September 30, 2008 2007 2006
Utility Solutions $203.3 151.6 97.9
Test 84.2 72.0 50.3
Filtration 59.7 56.2 58.3
Corporate 580.9 296.3 282.2
Consolidated totals $ 928.1 576.1 488.7
Corporate assets consist primarily of goodwill, deferred taxes, acquired intangible assets and cash balances.
CApiTAl EXpEnDiTuRES
(Dollars in millions)
Year ended September 30, 2008 2007 2006
Utility Solutions $ 9.0 7.0 3.4
Test 5.9 4.0 0.7
Filtration 1.6 1.4 1.7
Corporate 0.2 — —
Consolidated totals $16.7 12.4 5.8
In addition to the above amounts, the Company incurred expenditures for capitalized software of $11.0 million, $30.0 million and $27.8 million in 2008, 2007 and 2006, respectively.
DEpRECiATiOn AnD AMORTiZATiOn
(Dollars in millions)
Year ended September 30, 2008 2007 2006
Utility Solutions $18.5 10.3 5.0
Test 1.8 1.3 1.3
Filtration 2.8 2.8 2.6
Corporate 4.5 2.0 2.8
Consolidated totals $27.6 16.4 11.7
notes to Consolidated Financial Statements

E S C O T E C h n O l O g i E S i n C . 2 0 0 8 A n n u A l R E p O R T42
notes to Consolidated Financial Statements
17. Quarterly Financial information (unaudited)
First Second Third Fourth Fiscal(Dollars in thousands, except per share amounts) Quarter Quarter Quarter Quarter Year
2008
Net sales $ 134,957 135,159 157,669 196,032 623,817
Net earnings from continuing operations 7,905 6,082 13,308 20,107 47,402Net earnings (loss) from discontinued operations (5,089) — — 4,398 (691)
Net earnings 2,816 6,082 13,308 24,505 46,711
Basic earnings (loss) per share: Net earnings from continuing operations 0.31 0.24 0.51 0.77 1.83 Net earnings (loss) from discontinued operations (0.20) — — 0.17 (0.03)
Net earnings 0.11 0.24 0.51 0.94 1.80
Diluted earnings (loss) per share: Net earnings from continuing operations 0.30 0.23 0.50 0.76 1.80 Net earnings (loss) from discontinued operations (0.19) — — 0.17 (0.02)
Net earnings $ 0.11 0.23 0.50 0.93 1.78
2007
Net sales $ 80,587 108,860 115,365 139,892 444,704
Net earnings (loss) from continuing operations (1,351) 8,953 7,879 14,925 30,406
Net earnings (loss) from discontinued operations (30) 665 975 1,697 3,307
Net earnings (loss) (1,381) 9,618 8,854 16,622 33,713
Basic earnings (loss) per share: Net earnings (loss) from continuing operations (0.05) 0.35 0.30 0.58 1.17
Net earnings from discontinued operations — 0.02 0.04 0.07 0.13
Net earnings (loss) (0.05) 0.37 0.34 0.65 1.30
Diluted earnings (loss) per share: Net earnings (loss) from continuing operations (0.05) 0.34 0.29 0.57 1.15
Net earnings from discontinued operations — 0.02 0.04 0.07 0.13
Net earnings (loss) $ (0.05) 0.36 0.33 0.64 1.28
See Notes 2 and 3 of Notes to Consolidated Financial Statements for discussion of divestiture and acquisition activity.
During the fourth quarter of 2008, the Company reduced its expected tax expense by $4.6 million on the sale of Filtertek upon receipt of the final purchase price allocation.
During 2007, the Company determined that certain tax accounts had not been accurately recorded in the financial statements for
fiscal years 2001 to 2006. The effect in any individual year was not material to the Company’s results of operations, financial position, or cash flows. The Company recorded $1.3 million as a cumulative credit adjustment to tax expense to correct previously recorded tax accounts during the fourth quarter of 2007.

E S C O T E C h n O l O g i E S i n C . 2 0 0 8 A n n u A l R E p O R T 43
The Company has a strong financial team, from its executive leader-ship to each of its individual contributors. Management monitors compliance with its financial policies and practices over critical areas including internal controls, financial accounting and report-ing, accountability, and safeguarding of its corporate assets. The internal audit control function maintains oversight over the key areas of the business and financial processes and controls, and reports directly to the Audit and Finance Committee. Additionally, all employees are required to adhere to the ESCO Code of Business Conduct and Ethics, which is monitored by the Corporate Ethics Committee.
Management is dedicated to ensuring that the standards of financial accounting and reporting that are established are maintained. The Company’s culture demands integrity and a commitment to strong internal practices and policies.
The Consolidated Financial Statements have been audited by KPMG LLP, whose report is included herein.
Victor L. Richey Gary E. Muenster Chairman, Chief Executive Officer Executive Vice President, and President and Chief Financial Officer
Management’s Statement of Financial Responsibility
The Company’s Management is responsible for the fair presentation of the Company’s financial statements in accordance with account-ing principles generally accepted in the United States of America, and for their integrity and accuracy. Management is confident that its financial and business processes provide accurate information on a timely basis.
Management, with the oversight of ESCO’s Board of Directors, has established and maintains a strong ethical climate in which the Company’s affairs are conducted. Management also has established an effective system of internal controls that provide reasonable as-surance as to the integrity and accuracy of the financial statements, and responsibility for the Company’s assets. KPMG LLP, the Com-pany’s independent accountants, reports directly to the Audit and Finance Committee of the Board of Directors. The Audit and Finance Committee has established policies consistent with newly enacted corporate reform laws for auditor independence. In accordance with corporate governance listing requirements of the New York Stock Exchange:
▶ A majority of Board members are independent of the Company and its Management.
▶ All members of the key Board committees — the Audit and Finance, the Human Resources and Compensation and the Nomi-nating and Corporate Governance Committees — are independent.
▶ The independent members of the Board meet regularly without the presence of Management.
▶ The Company has a clear code of ethics and a conflict of inter-est policy to ensure that key corporate decisions are made by individuals who do not have a financial interest in the outcome, separate from their interest as Company officials.
▶ The charters of the Board committees clearly establish their respective roles and responsibilities.
▶ The Company has a Corporate Ethics Committee, ethics officers at each operating location and an ombudsman hot line available to all domestic employees and all foreign employees have local ethics officers and access to the Company’s ombudsman.

44
The Company acquired Doble Engineering Company (Doble) on November 30, 2007. As permitted by SEC guidance, Management excluded from its assessment of the effectiveness of the Company’s internal control over financial reporting as of September 30, 2008, Doble’s internal control over financial reporting. Total assets related to Doble as of September 30, 2008 of $52.2 million and revenues for the ten-month period subsequent to the acquisition (November 30, 2007 to September 30, 2008) of $74.3 million were included in the Consolidated Financial Statements of the Company as of and for the year ended September 30, 2008.
Our internal control over financial reporting as of September 30, 2008, has been audited by KPMG LLP, an independent registered public accounting firm, as stated in the report which is included herein.
Victor L. Richey Gary E. Muenster Chairman, Chief Executive Officer Executive Vice President, and President and Chief Financial Officer
E S C O T E C h n O l O g i E S i n C . 2 0 0 8 A n n u A l R E p O R T
Management’s Report on internal Control Over Financial Reporting
The Company’s Management is responsible for establishing and maintaining adequate internal control over financial reporting (as defined in Rule 13a-15(f) under the Securities Exchange Act of 1934). Our internal control over financial reporting is designed to provide reasonable assurance regarding the reliability of financial reporting and the preparation of financial statements for external purposes in accordance with generally accepted accounting principles in the United States of America.
Because of its inherent limitations, any system of internal control over financial reporting, no matter how well designed, may not prevent or detect misstatements due to the possibility that a control can be circumvented or overridden or that misstatements due to error or fraud may occur that are not detected. Also, because of changes in conditions, internal control effectiveness may vary over time.
Management assessed the effectiveness of the Company’s internal control over financial reporting as of September 30, 2008 using criteria established in Internal Control — Integrated Framework issued by the Committee of Sponsoring Organizations of the Treadway Commission (COSO) and concluded that the Company maintained effective internal control over financial reporting as of September 30, 2008 based on these criteria.

E S C O T E C h n O l O g i E S i n C . 2 0 0 8 A n n u A l R E p O R T 45
Report of independent Registered public Accounting Firm
The Board of Directors and Shareholders ESCO Technologies Inc.:
We have audited the accompanying consolidated balance sheets of ESCO Technologies Inc. and subsidiaries (the Company) as of September 30, 2008 and 2007, and the related consolidated statements of operations, shareholders’ equity and cash flows for each of the years in the three-year period ended September 30, 2008. We also have audited the Company’s internal control over financial reporting as of September 30, 2008, based on criteria established in Internal Control — Integrated Framework issued by the Committee of Sponsoring Organizations of the Treadway Commission (COSO). The Company’s management is responsible for these Consolidated Financial Statements, for maintaining effective internal control over financial reporting, and for its assessment of the effectiveness of internal control over financial reporting, included in the accompanying Management’s Report on Internal Control Over Financial Reporting. Our responsibility is to express an opinion on these Consolidated Financial Statements and an opinion on the Company’s internal control over financial reporting based on our audits.
We conducted our audits in accordance with the standards of the Public Company Accounting Oversight Board (United States). Those standards require that we plan and perform the audits to obtain reasonable assurance about whether the financial statements are free of material misstatement and whether effective internal control over financial reporting was maintained in all material respects. Our audits of the Consolidated Financial Statements included examining, on a test basis, evidence supporting the amounts and disclosures in the financial statements, assessing the accounting principles used and significant estimates made by management, and evaluating the overall financial statement presentation. Our audit of internal control over financial reporting included obtaining an understanding of internal control over financial reporting, assessing the risk that a material weakness exists, and testing and evaluating the design and operating effectiveness of internal control based on the assessed risk. Our audits also included performing such other procedures as we considered necessary in the circumstances. We believe that our audits provide a reasonable basis for our opinions.
A company’s internal control over financial reporting is a process designed to provide reasonable assurance regarding the reliability of financial reporting and the preparation of financial statements for external purposes in accordance with generally accepted accounting principles. A company’s internal control over financial reporting includes those policies and procedures that (1) pertain to the maintenance of records that, in reasonable detail, accurately and fairly reflect the transactions and dispositions of the assets of the company; (2) provide reasonable assurance that transactions are recorded as necessary to permit preparation of financial statements in accordance with generally accepted accounting principles, and that receipts and expenditures of the company are being made only in accordance with authorizations of management and directors of the company; and (3) provide reasonable assurance regarding
prevention or timely detection of unauthorized acquisition, use, or disposition of the company’s assets that could have a material effect on the financial statements.
Because of its inherent limitations, internal control over financial reporting may not prevent or detect misstatements. Also, projections of any evaluation of effectiveness to future periods are subject to the risk that controls may become inadequate because of changes in conditions, or that the degree of compliance with the policies or procedures may deteriorate.
In our opinion, the Consolidated Financial Statements referred to previously present fairly, in all material respects, the financial position of ESCO Technologies Inc. and subsidiaries as of September 30, 2008 and 2007, and the results of their operations and their cash flows for each of the years in the three-year period ended September 30, 2008, in conformity with U.S. generally accepted accounting principles. Also in our opinion, ESCO Technologies Inc. and subsidiaries maintained, in all material respects, effective internal control over financial reporting as of September 30, 2008, based on criteria established in Internal Control — Integrated Framework issued by the Committee of Sponsoring Organizations of the Treadway Commission.
The Company acquired Doble Engineering Company (Doble) on November 30, 2007, and management excluded from its assessment of the effectiveness of the Company’s internal control over financial reporting as of September 30, 2008, Doble’s internal control over financial reporting. Total assets related to Doble as of September 30, 2008 of $52.2 million and revenues for the ten-month period subsequent to the acquisition (November 30, 2007 to September 30, 2008) of $74.3 million were included in the Consolidated Financial Statements of the Company as of and for the year ended September 30, 2008. Our audit of internal control over financial reporting of the Company also excluded an evaluation of the internal control over financial reporting of Doble.
As discussed in Note 8 to the Consolidated Financial Statements, the Company adopted Statement of Financial Accounting Standards Board Interpretation No. 48, Accounting for Uncertainty in Income Taxes, an interpretation of Statement of Financial Accounting Standard No. 109, effective October 1, 2007. As discussed in Note 12 to the Consolidated Financial Statements, the Company adopted Statement of Financial Accounting Standards (SFAS) No. 158, Employers’ Accounting for Defined Benefit Pension and Other Postretirement Plans, as of September 30, 2007. Additionally, as discussed in Note 11 to the Consolidated Financial Statements, the Company adopted SFAS No. 123(R), Share-Based Payment, effective October 1, 2005.
St. Louis, Missouri December 1, 2008

E S C O T E C h n O l O g i E S i n C . 2 0 0 8 A n n u A l R E p O R T46
(Dollars in millions, except per share amounts) 2008 2007 2006 2005 2004
For years ended September 30:
Net sales $623.8 444.7 382.4 350.4 342.1
Net earnings from continuing operations 47.4 30.4 29.2 38.4 35.1
Net earnings (loss) from discontinued operations (0.7) 3.3 2.1 5.1 0.6
Net earnings (loss) 46.7 33.7 31.3 43.5 35.7
Earnings (loss) per share:
Basic:
Continuing operations $1.83 1.17 1.14 1.51 1.36
Discontinued operations (0.03) 0.13 0.08 0.20 0.02
Net earnings (loss) $1.80 1.30 1.22 1.71 1.38
Diluted:
Continuing operations $1.80 1.15 1.11 1.46 1.32
Discontinued operations (0.02) 0.13 0.08 0.20 0.02
Net earnings (loss) $1.78 1.28 1.19 1.66 1.34
As of September 30:
Working capital from continuing operations 102.0 122.5 109.9 180.9 165.2
Total assets 928.1 576.1 488.7 423.8 402.4
Total debt 233.7 — — — 0.4
Shareholders’ equity $468.2 415.5 376.4 331.0 307.6
See Notes 2 and 3 of Notes to Consolidated Financial Statements for discussion of divestiture and acquisition activity.
Five-Year Financial Summary
Common Stock Market price
ESCO’s common stock and associated preferred stock purchase rights (subsequently referred to as common stock) are listed on the New York Stock Exchange under the symbol “ESE.” The following table summarizes the high and low prices of the common stock for each quarter of fiscal 2008 and 2007.
2008 2007
Quarter high low High Low
First $41.86 32.64 $49.28 41.88
Second 43.56 32.65 49.20 40.67
Third 52.11 38.72 52.41 34.73
Fourth 54.06 38.85 43.50 29.63
ESCO historically has not paid cash dividends on its common stock. Management continues to evaluate its cash dividend policy. There are no current plans to initiate a dividend.
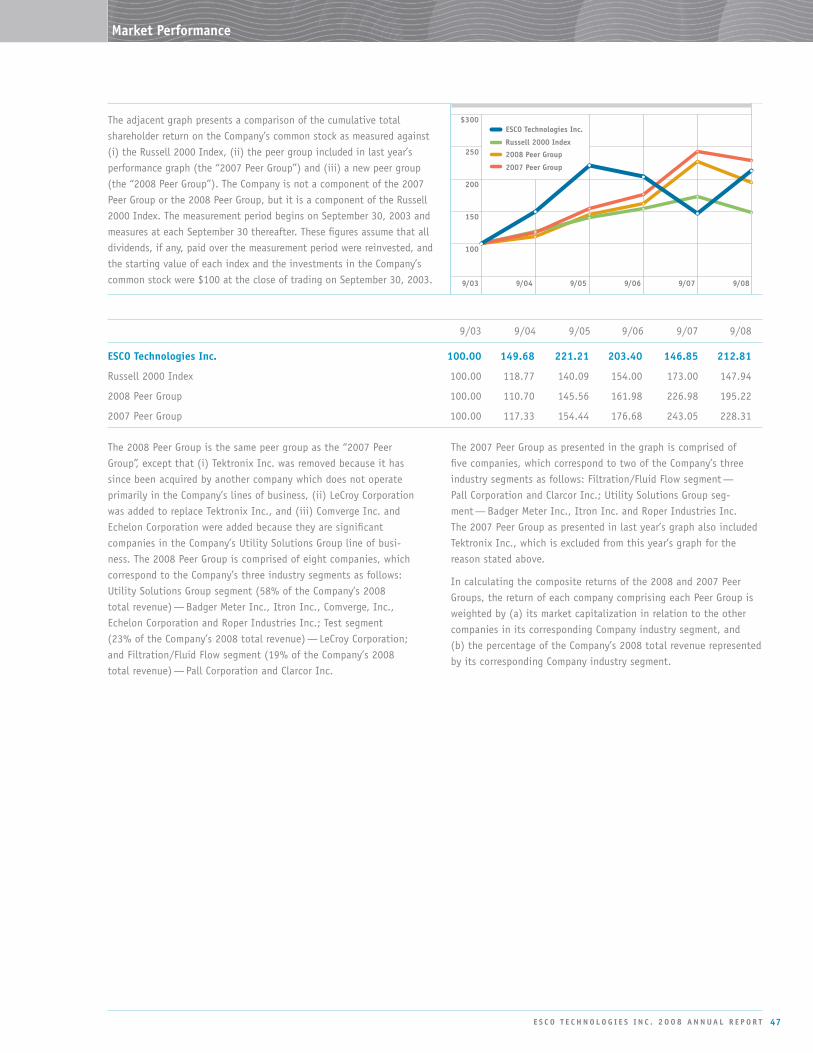
E S C O T E C h n O l O g i E S i n C . 2 0 0 8 A n n u A l R E p O R T 47
The adjacent graph presents a comparison of the cumulative total shareholder return on the Company’s common stock as measured against (i) the Russell 2000 Index, (ii) the peer group included in last year’s performance graph (the “2007 Peer Group”) and (iii) a new peer group (the “2008 Peer Group”). The Company is not a component of the 2007 Peer Group or the 2008 Peer Group, but it is a component of the Russell 2000 Index. The measurement period begins on September 30, 2003 and measures at each September 30 thereafter. These figures assume that all dividends, if any, paid over the measurement period were reinvested, and the starting value of each index and the investments in the Company’s common stock were $100 at the close of trading on September 30, 2003.
The 2008 Peer Group is the same peer group as the “2007 Peer Group”, except that (i) Tektronix Inc. was removed because it has since been acquired by another company which does not operate primarily in the Company’s lines of business, (ii) LeCroy Corporation was added to replace Tektronix Inc., and (iii) Comverge Inc. and Echelon Corporation were added because they are significant companies in the Company’s Utility Solutions Group line of busi-ness. The 2008 Peer Group is comprised of eight companies, which correspond to the Company’s three industry segments as follows: Utility Solutions Group segment (58% of the Company’s 2008 total revenue) — Badger Meter Inc., Itron Inc., Comverge, Inc., Echelon Corporation and Roper Industries Inc.; Test segment (23% of the Company’s 2008 total revenue) — LeCroy Corporation; and Filtration/Fluid Flow segment (19% of the Company’s 2008 total revenue) — Pall Corporation and Clarcor Inc.
Market performanceNew Peer Group
Russell 2000®
Old Peer Group
ESCO Technologies Inc.
9/03 9/04 9/05 9/06 9/07 9/08
150
100
200
250
$300ESCO Technologies Inc.
2008 Peer Group
Russell 2000 Index
2007 Peer Group
9/03 9/04 9/05 9/06 9/07 9/08
ESCO Technologies inc. 100.00 149.68 221.21 203.40 146.85 212.81
Russell 2000 Index 100.00 118.77 140.09 154.00 173.00 147.94
2008 Peer Group 100.00 110.70 145.56 161.98 226.98 195.22
2007 Peer Group 100.00 117.33 154.44 176.68 243.05 228.31
The 2007 Peer Group as presented in the graph is comprised of five companies, which correspond to two of the Company’s three industry segments as follows: Filtration/Fluid Flow segment — Pall Corporation and Clarcor Inc.; Utility Solutions Group seg-ment — Badger Meter Inc., Itron Inc. and Roper Industries Inc. The 2007 Peer Group as presented in last year’s graph also included Tektronix Inc., which is excluded from this year’s graph for the reason stated above.
In calculating the composite returns of the 2008 and 2007 Peer Groups, the return of each company comprising each Peer Group is weighted by (a) its market capitalization in relation to the other companies in its corresponding Company industry segment, and (b) the percentage of the Company’s 2008 total revenue represented by its corresponding Company industry segment.

48
inVESTOR RElATiOnS
Additional investor-related information may be obtained by contacting the Director of Investor Relations at (314) 213-7277 or toll free at (888) 622-3726. Information is also available through the Company’s web site at www.escotechnologies.com or via e-mail to [email protected].
TRAnSFER AgEnT AnD REgiSTRAR
Shareholder inquiries concerning lost certificates, transfer of shares or address changes should be directed to:
Registrar and Transfer Company 10 Commerce Drive Cranford, NJ 07016-3572 1 (800) 368-5948 E-mail: [email protected]
CApiTAl STOCK inFORMATiOn
ESCO Technologies Inc. common stock shares (symbol ESE) are listed on the New York Stock Exchange. There were approximately 2,500 holders of record of shares of common stock at November 13, 2008.
inDEpEnDEnT REgiSTERED puBliC ACCOunTing FiRM
KPMG LLP 10 South Broadway, Suite 900 St. Louis, Missouri 63102
ShAREhOlDERS’ AnnuAl MEETing
The Annual Meeting of the Shareholders of ESCO Technologies Inc. will be held at 9:30 a.m. Thursday, February 5, 2009, at the Company’s Corporate Headquarters, 9900A Clayton Road, St. Louis, Missouri 63124. Notice of the meeting and a proxy statement were sent to shareholders with this Annual Report.
CERTiFiCATiOnS
Pursuant to New York Stock Exchange (NYSE) requirements, the Company submitted to the NYSE the annual certifications, dated February 29, 2008 and February 23, 2007, by the Company’s chief executive officer that he was not aware of any violations by the Company of NYSE’s corporate governance listing standards. In addition, the Company filed with the Securities and Exchange Commission the certifications by the Company’s chief executive officer and chief financial officer required under Section 302 of the Sarbanes-Oxley Act of 2002 as exhibits to the Company’s Forms 10-K for its fiscal years ended September 30, 2008 and September 30, 2007.
10-K REpORT
A copy of the Company’s 2008 Annual Report on Form 10-K filed with the Securities and Exchange Commission is available to shareholders without charge. Direct your written request to patricia K. Moore, Director of investor Relations, ESCO Technologies inc., 9900A Clayton Road, St. louis, Missouri 63124.
The Form 10-K is also available on the Company’s web site at www.escotechnologies.com.
E S C O T E C h n O l O g i E S i n C . 2 0 0 8 A n n u A l R E p O R T
Shareholders’ Summary

49E S C O T E C h n O l O g i E S i n C . 2 0 0 8 A n n u A l R E p O R T
Management and Board of Directors
Des
ign:
Wan
dlin
g &
Ass
ocia
tes
Inc.
, St
. Lo
uis,
MO
w
ww
.wan
dlin
ginc
.com
ExEcutIvE OffIcErS cOrpOrAtE StAff
Bruce E. Butler President ETS-Lindgren LP
Sam r. chapetta Filtration Group Vice President & President PTI Technologies Inc.
William M. Giacone Vice President & General Manager — Lindgren ETS-Lindgren LP
Antonio E. Gonzalez President VACCO Industries
victor L. richey Chairman, Chief Executive Officer, & President
Alyson S. Barclay Senior Vice President, Secretary & General Counsel
Gary E. Muenster Executive Vice President & Chief Financial Officer
Mark S. Dunger Vice President Planning & Development
richard A. Garretson Vice President Tax
Deborah J. Hanlon Vice President Human Resources
charles J. Kretschmer Vice President
OpErAtInG ExEcutIvES
Bruce S. Kessler President Aclara Power-Line Systems Inc.
randall K. Loga President TekPackaging LLC
Kent A. Marty General Manager Comtrak Technologies, LLC
Gary L. Moore President Aclara RF Systems Inc.
Bruce A. phillips Group President Aclara Companies
Bryan Sayler Senior Vice President & General Manager — ETS ETS-Lindgren LP
robert A. Smith President Doble Engineering Company
James M. Mcconnell 2 Retired President & Chief Executive Officer Instron Corp.
victor L. richey 1 Chairman, Chief Executive Officer, & President
Larry W. Solley 3,4 Retired Executive Vice President Emerson Electric Co.
committee Membership1 Executive Committee
2 Audit and Finance Committee
3 Human Resources and Compensation Committee
4 Nominating and Corporate Governance
BOArD Of DIrEctOrS
James M. Stolze 2 Vice President & Chief Financial Officer Stereotaxis, Inc.
Donald c. trauscht 1,2,3,4 (Lead Director) Chairman BW Capital Corp.
James D. Woods 3 Chairman Emeritus & Retired Chief Executive Officer Baker Hughes Inc.

ESCO Technologies Inc. 9900A Clayton Road St. Louis, MO 63124
www.escotechnologies.com