2007 - Hawaii Department of Health
200
The H a w a i i Behavioral R i s k Factor Surveillance System 2007 RESULTS (2013 revision) Dung-Hanh Nguyen, B.Sc. Florentina R. Salvail, M.Sc. State of Hawaii
Transcript of 2007 - Hawaii Department of Health

The H aw a i i Behavioral R i sk Factor Surveillance System
2007 RESULTS
(2013 revision)
Dung-Hanh Nguyen, B.Sc. Florentina R. Salvail, M.Sc.
State of Hawaii
Table of Contents INTRODUCTION ....................................................................................................................................................................... 5
Demographic characteristics............................................................................................................................................... 5
County and community ....................................................................................................................................................... 6
Definition of community ................................................................................................................................................. 6
Community Map ............................................................................................................................................................. 7
HEALTH STATUS .................................................................................................................................................................... 11
General health status ...................................................................................................................................................... 12
Physical and mental health status .................................................................................................................................... 14
Physical or mental health status ....................................................................................................................................... 15
Physical health not good ............................................................................................................................................... 17
Mental health not good ................................................................................................................................................ 21
Unhealthy days ............................................................................................................................................................. 25
Poor health keeps you from doing usual activities ..................................................................................................... 29
Body weight status ............................................................................................................................................................ 33
More details on obese .................................................................................................................................................. 35
Overweight or obese .................................................................................................................................................... 37
Disability ............................................................................................................................................................................ 39
VETERAN STATUS .................................................................................................................................................................. 43
EMOTIONAL SUPPORT AND LIFE SATISFACTION .................................................................................................................. 45
HEALTH CARE ........................................................................................................................................................................ 49
Do you have any kind of health care coverage? ............................................................................................................... 50
Adults aged 18 to 64 ..................................................................................................................................................... 52
Do you have one person or more than one you think of as your personal doctor(s)? ................................................. 53
Could not see doctor because of cost ............................................................................................................................... 55
Last check up ..................................................................................................................................................................... 57
TOBACCO USE ....................................................................................................................................................................... 59
Smoked at least 100 cigarettes ......................................................................................................................................... 60
Smoking status .................................................................................................................................................................. 62
3 levels .......................................................................................................................................................................... 64
Try to stop smoking ....................................................................................................................................................... 66
Last smoked cigarette ................................................................................................................................................... 67
With adults who currently smoke or just quit less than one year ................................................................................ 68
ALCOHOL USE ........................................................................................................................................................................ 72
Bing drinking ..................................................................................................................................................................... 73
Heavy drinking .................................................................................................................................................................. 75
FRUITS AND VEGETABLES ..................................................................................................................................................... 77
PHYSICAL ACTIVITY ................................................................................................................................................................ 82
Any leisure time exercise .................................................................................................................................................. 83
Best describe what you do at work................................................................................................................................... 85
Physical activity status ...................................................................................................................................................... 87
IMMUNIZATION .................................................................................................................................................................... 93
Seasonal flu ....................................................................................................................................................................... 94
Flu shot .......................................................................................................................................................................... 94
Flu spray ........................................................................................................................................................................ 96
Either flu shot or flu spray ............................................................................................................................................. 98
Pneumonia ...................................................................................................................................................................... 102
18 to 64 years old ........................................................................................................................................................ 104
65 years old and older................................................................................................................................................. 105
Hepatitis B ....................................................................................................................................................................... 106
Vaccination .................................................................................................................................................................. 106
Risky behaviors............................................................................................................................................................ 108
CHRONIC HEALTH CONDITION ............................................................................................................................................ 110
Cardiovascular Diseases .................................................................................................................................................. 113
Heart attack................................................................................................................................................................. 113
Heart disease............................................................................................................................................................... 115
Stroke .......................................................................................................................................................................... 117
Hypertension ................................................................................................................................................................... 119
Have highblood pressure ............................................................................................................................................ 119
Blood Cholesterol ............................................................................................................................................................ 122
Had your blood cholesterol checked .......................................................................................................................... 122
Have highblood cholesterol ........................................................................................................................................ 126
Asthma ............................................................................................................................................................................ 128
Adults .......................................................................................................................................................................... 128
Children ....................................................................................................................................................................... 132
Diabetes .......................................................................................................................................................................... 134
Had diabetes ............................................................................................................................................................... 134
Diabetics care .............................................................................................................................................................. 136
Arthritis ........................................................................................................................................................................... 146

Have joint pains ........................................................................................................................................................... 146
Told you have arthritis ................................................................................................................................................ 152
Joint pains and arthritis ............................................................................................................................................... 154
GASTROINSTESTINAL DISEASE ............................................................................................................................................ 156
BREAST AND CERVICAL CANCER SCREENING ...................................................................................................................... 159
Mammogram .................................................................................................................................................................. 160
40 years old and older................................................................................................................................................. 163
Breast exam .................................................................................................................................................................... 166
40 years old and older................................................................................................................................................. 169
Pap smear ....................................................................................................................................................................... 172
Hysterectomy .................................................................................................................................................................. 176
PROSTATE CANCER SCREENING .......................................................................................................................................... 178
PSA test ........................................................................................................................................................................... 179
Digital rectal exam .......................................................................................................................................................... 181
Told you had prostate cancer ......................................................................................................................................... 183
COLORECTAL CANCER SCREENING...................................................................................................................................... 184
Blood stool test ............................................................................................................................................................... 185
Sigmoidoscopy or a colonoscopy ................................................................................................................................... 189
HIV ....................................................................................................................................................................................... 195
Ever been tested for HIV ................................................................................................................................................ 196
Timing .......................................................................................................................................................................... 198
Place where the test was performed .......................................................................................................................... 200

INTRODUCTION In this report, information from Hawaii BRFSS 2007 is prepared by demographic and geographic characteristics.
Demographic characteristics of Hawaii population are constructed based on the following questions:
A./ What is your age? (Code age in years) B./ Sex of respondent (Recorded after the random selection procedure was done) C./ Which one of the following would you say is your ethnicity? (Allow up to 6 ethnicities)
1. Caucasian (includes European, German, Irish, Italian, English) 2. Hawaiian 3. Chinese 4. Filipino 5. Japanese 6. Korean 7. Samoan 8. Black 9. American Indian/ Alaska Native/ Eskimo/ Inuit 10. Vietnamese 11. Asian Indian 12. Portuguese 13. Guamanian/Chamorro 14. Puerto Rican 15. Mexican 16. Tongan 17. Laotian 18. Cambodian 19. Malaysian 20. Fijian 21. Micronesian 22. Other Asian (record the specified) 23. Other (record the specified)
If more than one answer, then ask: Which one of these groups would you say best represents of your ethnicity?
D./ Are you …?
1. Married 2. Divorced 3. Widowed 4. Separated 5. Never married 6. A member of an unmarried couple
E./ What is the highest grade or year of school you completed?
1. Never attended school or only attended kindergarten 2. Grades 1 through 8 (Elementary) 3. Grades 9 through 11 (Some high school) 4. Grade 12 or GED (High school graduate) 5. College 1 year to 3 years (Some college or technical school) 6. College 4 years or more (College graduate)
F./ Are you currently …?
1. Employed for wages 2. Self-employed 3. Out of work for more than 1 year 4. Out of work for less than 1 year 5. A Homemaker 6. A Student 7. Retired
G./ Is your annual household income from all sources …?
1. Less than $10,000 2. From $10,000 to less than $15,000) 3. From $15,000 to less than $20,000) 4. From $20,000 to less than $25,000) 5. From $25,000 to less than $35,000) 6. From $35,000 to less than $50,000) 7. From $50,000 to less than $75,000) 8. $75,000 or more
County and community are obtained from two questions.
A./ What island do you live on?
B./ What is the ZIP Code where you live?
Definition of community
The four counties of the State of Hawaii are subdivided into communities or sub-areas by grouping zip codes such that each group has at least one school complex. These zip codes were given names as shown in the Community column in the following community maps by county.

DungHanh
Typewritten Text
DungHanh
Typewritten Text
COMMUNITY ZIP CODES North Shore/Laie: 96791, 96712, 96731, 96762, 96717, 96730 Ka'a'wa/Kahalu'u/Kaneohe: 96744, 96863 Kailua/Waimanalo: 96734, 96795 Wailae/Kahala/HawaiiKai: 96825, 96821, 96824 Kaimuki/Palolo/Waikiki: 96816, 96815, 96830, 96836, 96835 Manoa/Upper Makiki: 96822, 96813, 96801, 96802, 96803, 96804, 96805, 96806, 96807, 96808, 96809, 96810, 96811, 96812, 96839, 96840, 96841, 96842, 96843, 96844, 96845, 96848, 96850 Ala Moana: 96826, 96828, 96814, 96823, 96847 Nuuanu/Kalihi/MoanaLoa: 96817, 96819, 96820, 96827, 96837, 96838, 96846, 96849, 96858, 96859 Salt Lake/Foster Village: 96818, 96853, 96860 Aiea/Pearl City: 96701, 96782, 96861 Mililani/Wahiawa: 96789, 96786, 96854, 96857 Waipahu/Kapolei/Ewa: 96797, 96707, 96706, 96709, 96759 Nanakuli/Waianae: 96792
DungHanh
Typewritten Text

DungHanh
Typewritten Text
DungHanh
Typewritten Text
COMMUNITY ZIP CODES Kona: 96726, 96704, 96750, 96739, 96725, 96740, 96745 North Hawaii: 96738, 96755, 96719, 96743, 96727, 96775, 96776, 96774, 96764, 96780, 96773, 96710, 96728, 96783, 96781 Hilo: 96720, 96721 Puna/Ka'u: 96749, 96760, 96778, 96771, 96785, 96718, 96777, 96772, 96737
DungHanh
Typewritten Text
DungHanh
Typewritten Text
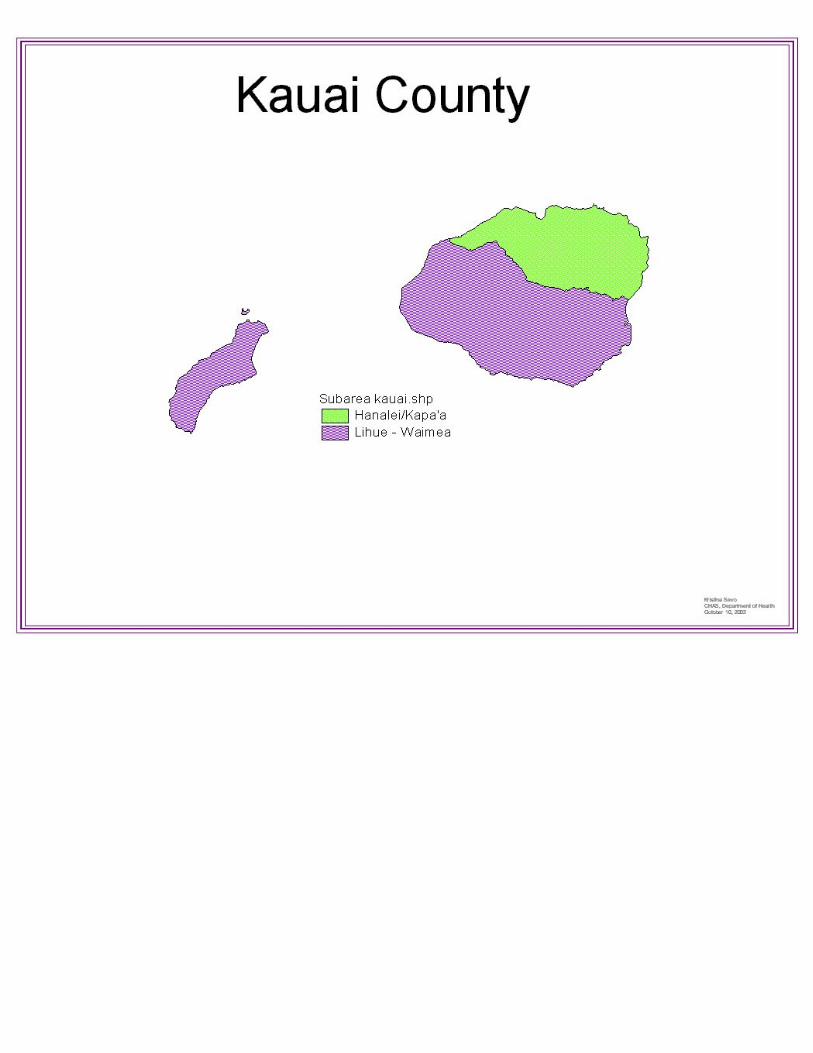
COMMUNITY ZIP CODES Hanalei/Kapa'a: 96714, 96722, 96754, 96703, 96751, 96746 Lihue-Waimea: 96766, 96715, 96756, 96765, 96741, 96705, 96716, 96747, 96769, 96796, 96752
DungHanh
Typewritten Text
DungHanh
Typewritten Text
DungHanh
Typewritten Text
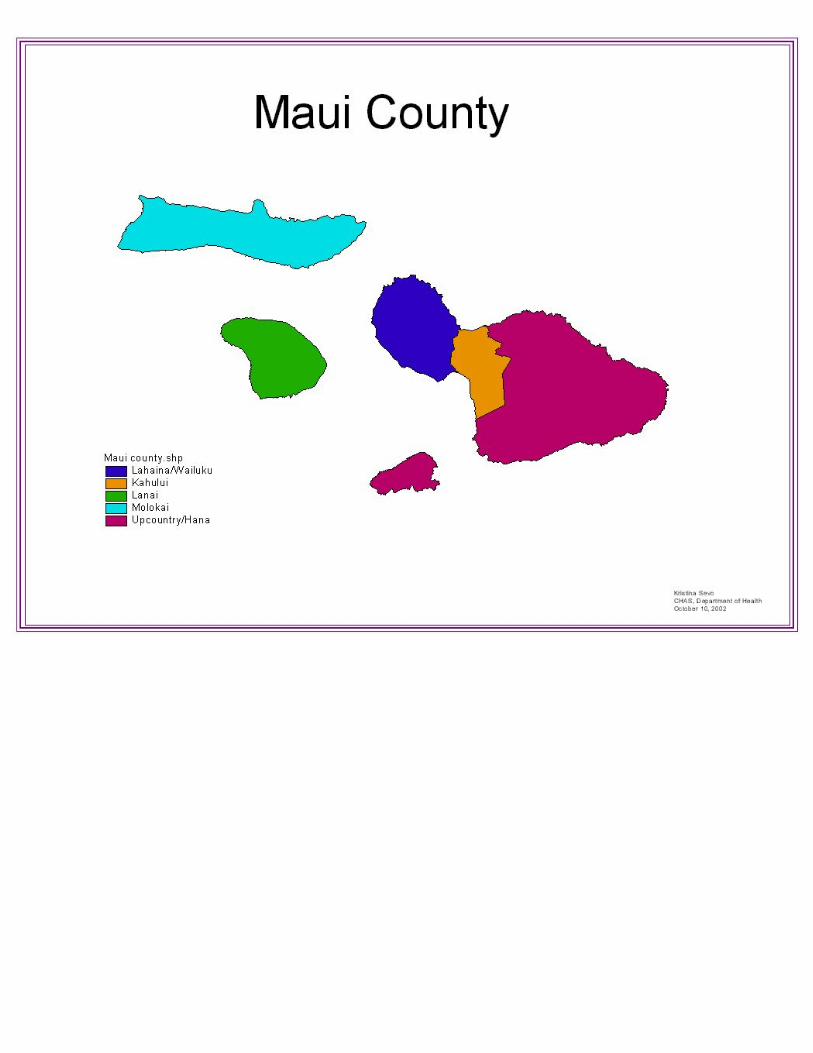
COMMUNITY ZIP CODES Lahaina/Wailuku: 96793, 96761, 96767 Kahului: 96753, 96784, 96732, 96733 Upcountry/Hana: 96788, 96790, 96713, 96708, 96779, 96768 Molokai: 96729, 96742, 96748, 96757, 96770 Lanai: 96763
DungHanh
Typewritten Text
HEALTH STATUS
Information about Health Status is drawn from the answers of following questions:
A./ Would you say that in general your health is …?
1. Excellent 2. Very good 3. Good 4. Fair 5. Poor
B./ Now thinking about your physical health, which includes physical illness and injury, for how many days during the past 30 days was your physical health not good? C./ Now thinking about your mental health, which includes stress, depression, and problems with emotions, for how many days during the past 30 days was your mental health not good? D./ During the past 30 days, for about how many days did poor physical or mental health keep you from doing your usual activities, such as self-care, work, or recreation? E./ About how much do you weigh without shoes? F./ About how tall are you without shoes? I./ Are you limited in any way in any activities because of physical, mental, or emotional problems? J./ Do you now have any health problem that requires you to use special equipment, such as a cane, a wheelchair, a special bed, or a special telephone?
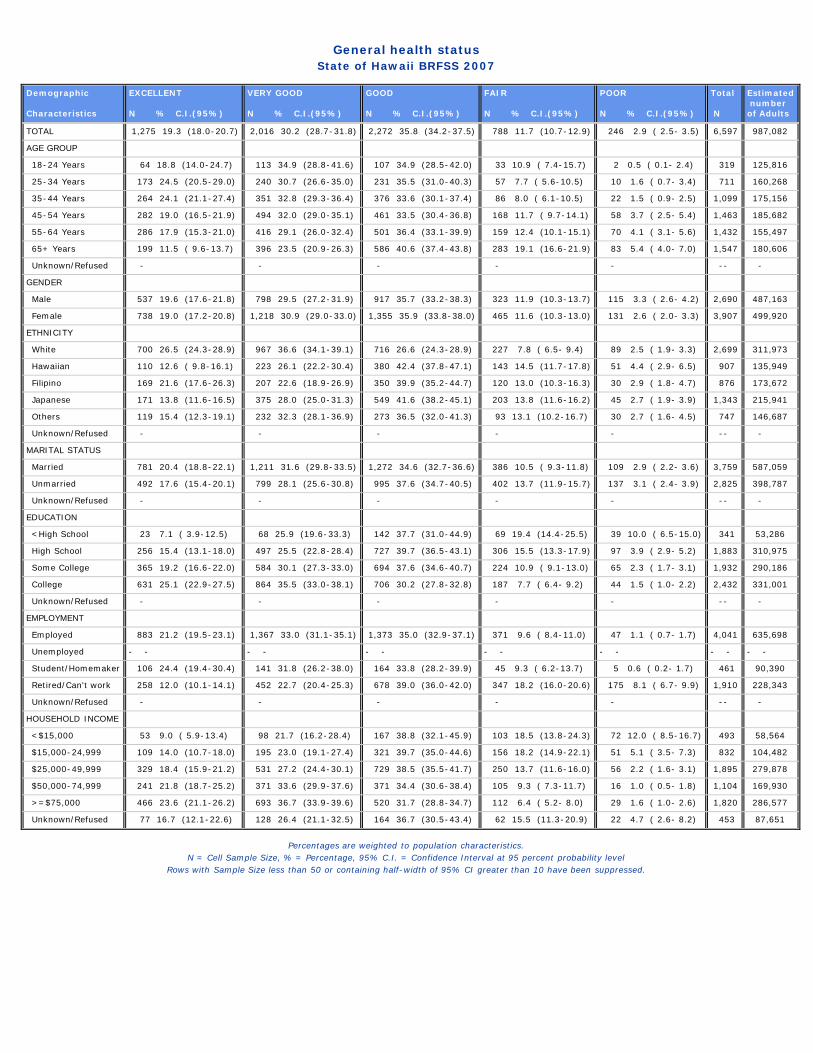
General health statusState of Hawaii BRFSS 2007
Demographic Characteristics
EXCELLENT N % C.I.(95%)
VERY GOOD N % C.I.(95%)
GOOD N % C.I.(95%)
FAIR N % C.I.(95%)
POOR N % C.I.(95%)
Total N
Estimated numberof Adults
TOTAL 1,275 19.3 (18.0-20.7) 2,016 30.2 (28.7-31.8) 2,272 35.8 (34.2-37.5) 788 11.7 (10.7-12.9) 246 2.9 ( 2.5- 3.5) 6,597 987,082
AGE GROUP
18-24 Years 64 18.8 (14.0-24.7) 113 34.9 (28.8-41.6) 107 34.9 (28.5-42.0) 33 10.9 ( 7.4-15.7) 2 0.5 ( 0.1- 2.4) 319 125,816
25-34 Years 173 24.5 (20.5-29.0) 240 30.7 (26.6-35.0) 231 35.5 (31.0-40.3) 57 7.7 ( 5.6-10.5) 10 1.6 ( 0.7- 3.4) 711 160,268
35-44 Years 264 24.1 (21.1-27.4) 351 32.8 (29.3-36.4) 376 33.6 (30.1-37.4) 86 8.0 ( 6.1-10.5) 22 1.5 ( 0.9- 2.5) 1,099 175,156
45-54 Years 282 19.0 (16.5-21.9) 494 32.0 (29.0-35.1) 461 33.5 (30.4-36.8) 168 11.7 ( 9.7-14.1) 58 3.7 ( 2.5- 5.4) 1,463 185,682
55-64 Years 286 17.9 (15.3-21.0) 416 29.1 (26.0-32.4) 501 36.4 (33.1-39.9) 159 12.4 (10.1-15.1) 70 4.1 ( 3.1- 5.6) 1,432 155,497
65+ Years 199 11.5 ( 9.6-13.7) 396 23.5 (20.9-26.3) 586 40.6 (37.4-43.8) 283 19.1 (16.6-21.9) 83 5.4 ( 4.0- 7.0) 1,547 180,606
Unknown/Refused - - - - - -- -
GENDER
Male 537 19.6 (17.6-21.8) 798 29.5 (27.2-31.9) 917 35.7 (33.2-38.3) 323 11.9 (10.3-13.7) 115 3.3 ( 2.6- 4.2) 2,690 487,163
Female 738 19.0 (17.2-20.8) 1,218 30.9 (29.0-33.0) 1,355 35.9 (33.8-38.0) 465 11.6 (10.3-13.0) 131 2.6 ( 2.0- 3.3) 3,907 499,920
ETHNICITY
White 700 26.5 (24.3-28.9) 967 36.6 (34.1-39.1) 716 26.6 (24.3-28.9) 227 7.8 ( 6.5- 9.4) 89 2.5 ( 1.9- 3.3) 2,699 311,973
Hawaiian 110 12.6 ( 9.8-16.1) 223 26.1 (22.2-30.4) 380 42.4 (37.8-47.1) 143 14.5 (11.7-17.8) 51 4.4 ( 2.9- 6.5) 907 135,949
Filipino 169 21.6 (17.6-26.3) 207 22.6 (18.9-26.9) 350 39.9 (35.2-44.7) 120 13.0 (10.3-16.3) 30 2.9 ( 1.8- 4.7) 876 173,672
Japanese 171 13.8 (11.6-16.5) 375 28.0 (25.0-31.3) 549 41.6 (38.2-45.1) 203 13.8 (11.6-16.2) 45 2.7 ( 1.9- 3.9) 1,343 215,941
Others 119 15.4 (12.3-19.1) 232 32.3 (28.1-36.9) 273 36.5 (32.0-41.3) 93 13.1 (10.2-16.7) 30 2.7 ( 1.6- 4.5) 747 146,687
Unknown/Refused - - - - - -- -
MARITAL STATUS
Married 781 20.4 (18.8-22.1) 1,211 31.6 (29.8-33.5) 1,272 34.6 (32.7-36.6) 386 10.5 ( 9.3-11.8) 109 2.9 ( 2.2- 3.6) 3,759 587,059
Unmarried 492 17.6 (15.4-20.1) 799 28.1 (25.6-30.8) 995 37.6 (34.7-40.5) 402 13.7 (11.9-15.7) 137 3.1 ( 2.4- 3.9) 2,825 398,787
Unknown/Refused - - - - - -- -
EDUCATION
<High School 23 7.1 ( 3.9-12.5) 68 25.9 (19.6-33.3) 142 37.7 (31.0-44.9) 69 19.4 (14.4-25.5) 39 10.0 ( 6.5-15.0) 341 53,286
High School 256 15.4 (13.1-18.0) 497 25.5 (22.8-28.4) 727 39.7 (36.5-43.1) 306 15.5 (13.3-17.9) 97 3.9 ( 2.9- 5.2) 1,883 310,975
Some College 365 19.2 (16.6-22.0) 584 30.1 (27.3-33.0) 694 37.6 (34.6-40.7) 224 10.9 ( 9.1-13.0) 65 2.3 ( 1.7- 3.1) 1,932 290,186
College 631 25.1 (22.9-27.5) 864 35.5 (33.0-38.1) 706 30.2 (27.8-32.8) 187 7.7 ( 6.4- 9.2) 44 1.5 ( 1.0- 2.2) 2,432 331,001
Unknown/Refused - - - - - -- -
EMPLOYMENT
Employed 883 21.2 (19.5-23.1) 1,367 33.0 (31.1-35.1) 1,373 35.0 (32.9-37.1) 371 9.6 ( 8.4-11.0) 47 1.1 ( 0.7- 1.7) 4,041 635,698
Unemployed - - - - - - - - - - - - - -
Student/Homemaker 106 24.4 (19.4-30.4) 141 31.8 (26.2-38.0) 164 33.8 (28.2-39.9) 45 9.3 ( 6.2-13.7) 5 0.6 ( 0.2- 1.7) 461 90,390
Retired/Can't work 258 12.0 (10.1-14.1) 452 22.7 (20.4-25.3) 678 39.0 (36.0-42.0) 347 18.2 (16.0-20.6) 175 8.1 ( 6.7- 9.9) 1,910 228,343
Unknown/Refused - - - - - -- -
HOUSEHOLD INCOME
<$15,000 53 9.0 ( 5.9-13.4) 98 21.7 (16.2-28.4) 167 38.8 (32.1-45.9) 103 18.5 (13.8-24.3) 72 12.0 ( 8.5-16.7) 493 58,564
$15,000-24,999 109 14.0 (10.7-18.0) 195 23.0 (19.1-27.4) 321 39.7 (35.0-44.6) 156 18.2 (14.9-22.1) 51 5.1 ( 3.5- 7.3) 832 104,482
$25,000-49,999 329 18.4 (15.9-21.2) 531 27.2 (24.4-30.1) 729 38.5 (35.5-41.7) 250 13.7 (11.6-16.0) 56 2.2 ( 1.6- 3.1) 1,895 279,878
$50,000-74,999 241 21.8 (18.7-25.2) 371 33.6 (29.9-37.6) 371 34.4 (30.6-38.4) 105 9.3 ( 7.3-11.7) 16 1.0 ( 0.5- 1.8) 1,104 169,930
>=$75,000 466 23.6 (21.1-26.2) 693 36.7 (33.9-39.6) 520 31.7 (28.8-34.7) 112 6.4 ( 5.2- 8.0) 29 1.6 ( 1.0- 2.6) 1,820 286,577
Unknown/Refused 77 16.7 (12.1-22.6) 128 26.4 (21.1-32.5) 164 36.7 (30.5-43.4) 62 15.5 (11.3-20.9) 22 4.7 ( 2.6- 8.2) 453 87,651
Percentages are weighted to population characteristics.N = Cell Sample Size, % = Percentage, 95% C.I. = Confidence Interval at 95 percent probability level
Rows with Sample Size less than 50 or containing half-width of 95% CI greater than 10 have been suppressed.
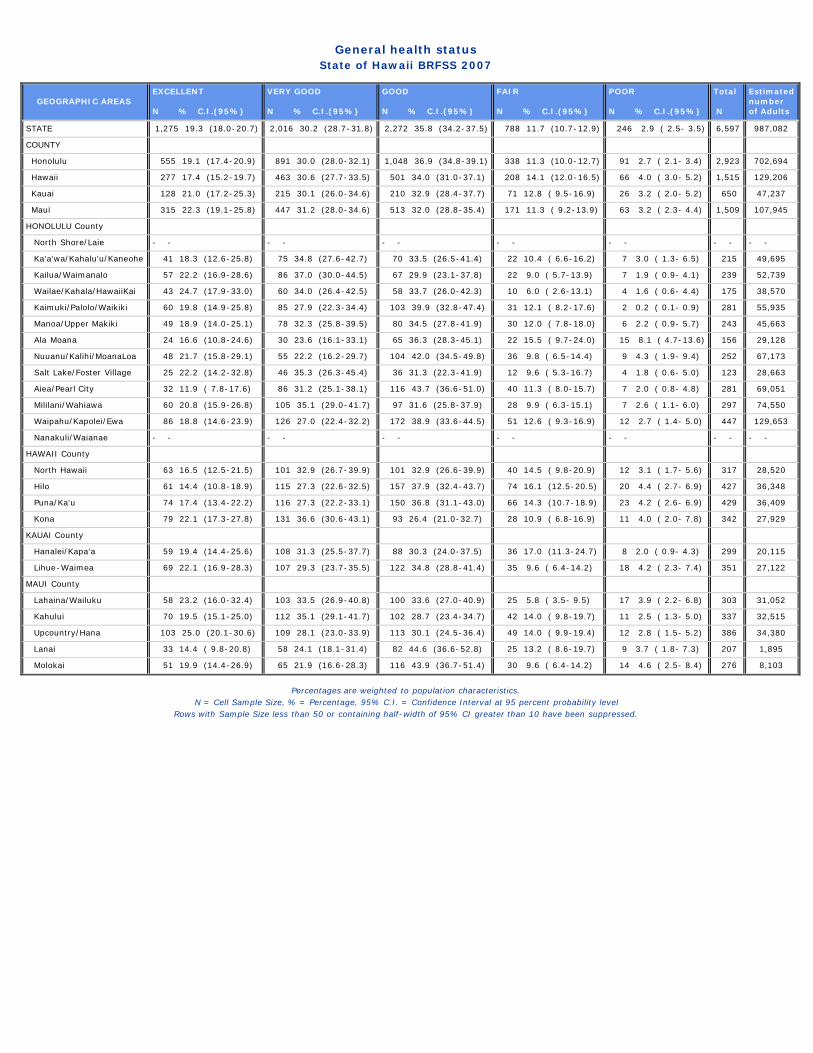
General health statusState of Hawaii BRFSS 2007
GEOGRAPHIC AREAS EXCELLENT N % C.I.(95%)
VERY GOOD N % C.I.(95%)
GOOD N % C.I.(95%)
FAIR N % C.I.(95%)
POOR N % C.I.(95%)
Total N
Estimatednumberof Adults
STATE 1,275 19.3 (18.0-20.7) 2,016 30.2 (28.7-31.8) 2,272 35.8 (34.2-37.5) 788 11.7 (10.7-12.9) 246 2.9 ( 2.5- 3.5) 6,597 987,082
COUNTY
Honolulu 555 19.1 (17.4-20.9) 891 30.0 (28.0-32.1) 1,048 36.9 (34.8-39.1) 338 11.3 (10.0-12.7) 91 2.7 ( 2.1- 3.4) 2,923 702,694
Hawaii 277 17.4 (15.2-19.7) 463 30.6 (27.7-33.5) 501 34.0 (31.0-37.1) 208 14.1 (12.0-16.5) 66 4.0 ( 3.0- 5.2) 1,515 129,206
Kauai 128 21.0 (17.2-25.3) 215 30.1 (26.0-34.6) 210 32.9 (28.4-37.7) 71 12.8 ( 9.5-16.9) 26 3.2 ( 2.0- 5.2) 650 47,237
Maui 315 22.3 (19.1-25.8) 447 31.2 (28.0-34.6) 513 32.0 (28.8-35.4) 171 11.3 ( 9.2-13.9) 63 3.2 ( 2.3- 4.4) 1,509 107,945
HONOLULU County
North Shore/Laie - - - - - - - - - - - - - -
Ka'a'wa/Kahalu'u/Kaneohe 41 18.3 (12.6-25.8) 75 34.8 (27.6-42.7) 70 33.5 (26.5-41.4) 22 10.4 ( 6.6-16.2) 7 3.0 ( 1.3- 6.5) 215 49,695
Kailua/Waimanalo 57 22.2 (16.9-28.6) 86 37.0 (30.0-44.5) 67 29.9 (23.1-37.8) 22 9.0 ( 5.7-13.9) 7 1.9 ( 0.9- 4.1) 239 52,739
Wailae/Kahala/HawaiiKai 43 24.7 (17.9-33.0) 60 34.0 (26.4-42.5) 58 33.7 (26.0-42.3) 10 6.0 ( 2.6-13.1) 4 1.6 ( 0.6- 4.4) 175 38,570
Kaimuki/Palolo/Waikiki 60 19.8 (14.9-25.8) 85 27.9 (22.3-34.4) 103 39.9 (32.8-47.4) 31 12.1 ( 8.2-17.6) 2 0.2 ( 0.1- 0.9) 281 55,935
Manoa/Upper Makiki 49 18.9 (14.0-25.1) 78 32.3 (25.8-39.5) 80 34.5 (27.8-41.9) 30 12.0 ( 7.8-18.0) 6 2.2 ( 0.9- 5.7) 243 45,663
Ala Moana 24 16.6 (10.8-24.6) 30 23.6 (16.1-33.1) 65 36.3 (28.3-45.1) 22 15.5 ( 9.7-24.0) 15 8.1 ( 4.7-13.6) 156 29,128
Nuuanu/Kalihi/MoanaLoa 48 21.7 (15.8-29.1) 55 22.2 (16.2-29.7) 104 42.0 (34.5-49.8) 36 9.8 ( 6.5-14.4) 9 4.3 ( 1.9- 9.4) 252 67,173
Salt Lake/Foster Village 25 22.2 (14.2-32.8) 46 35.3 (26.3-45.4) 36 31.3 (22.3-41.9) 12 9.6 ( 5.3-16.7) 4 1.8 ( 0.6- 5.0) 123 28,663
Aiea/Pearl City 32 11.9 ( 7.8-17.6) 86 31.2 (25.1-38.1) 116 43.7 (36.6-51.0) 40 11.3 ( 8.0-15.7) 7 2.0 ( 0.8- 4.8) 281 69,051
Mililani/Wahiawa 60 20.8 (15.9-26.8) 105 35.1 (29.0-41.7) 97 31.6 (25.8-37.9) 28 9.9 ( 6.3-15.1) 7 2.6 ( 1.1- 6.0) 297 74,550
Waipahu/Kapolei/Ewa 86 18.8 (14.6-23.9) 126 27.0 (22.4-32.2) 172 38.9 (33.6-44.5) 51 12.6 ( 9.3-16.9) 12 2.7 ( 1.4- 5.0) 447 129,653
Nanakuli/Waianae - - - - - - - - - - - - - -
HAWAII County
North Hawaii 63 16.5 (12.5-21.5) 101 32.9 (26.7-39.9) 101 32.9 (26.6-39.9) 40 14.5 ( 9.8-20.9) 12 3.1 ( 1.7- 5.6) 317 28,520
Hilo 61 14.4 (10.8-18.9) 115 27.3 (22.6-32.5) 157 37.9 (32.4-43.7) 74 16.1 (12.5-20.5) 20 4.4 ( 2.7- 6.9) 427 36,348
Puna/Ka'u 74 17.4 (13.4-22.2) 116 27.3 (22.2-33.1) 150 36.8 (31.1-43.0) 66 14.3 (10.7-18.9) 23 4.2 ( 2.6- 6.9) 429 36,409
Kona 79 22.1 (17.3-27.8) 131 36.6 (30.6-43.1) 93 26.4 (21.0-32.7) 28 10.9 ( 6.8-16.9) 11 4.0 ( 2.0- 7.8) 342 27,929
KAUAI County
Hanalei/Kapa'a 59 19.4 (14.4-25.6) 108 31.3 (25.5-37.7) 88 30.3 (24.0-37.5) 36 17.0 (11.3-24.7) 8 2.0 ( 0.9- 4.3) 299 20,115
Lihue-Waimea 69 22.1 (16.9-28.3) 107 29.3 (23.7-35.5) 122 34.8 (28.8-41.4) 35 9.6 ( 6.4-14.2) 18 4.2 ( 2.3- 7.4) 351 27,122
MAUI County
Lahaina/Wailuku 58 23.2 (16.0-32.4) 103 33.5 (26.9-40.8) 100 33.6 (27.0-40.9) 25 5.8 ( 3.5- 9.5) 17 3.9 ( 2.2- 6.8) 303 31,052
Kahului 70 19.5 (15.1-25.0) 112 35.1 (29.1-41.7) 102 28.7 (23.4-34.7) 42 14.0 ( 9.8-19.7) 11 2.5 ( 1.3- 5.0) 337 32,515
Upcountry/Hana 103 25.0 (20.1-30.6) 109 28.1 (23.0-33.9) 113 30.1 (24.5-36.4) 49 14.0 ( 9.9-19.4) 12 2.8 ( 1.5- 5.2) 386 34,380
Lanai 33 14.4 ( 9.8-20.8) 58 24.1 (18.1-31.4) 82 44.6 (36.6-52.8) 25 13.2 ( 8.6-19.7) 9 3.7 ( 1.8- 7.3) 207 1,895
Molokai 51 19.9 (14.4-26.9) 65 21.9 (16.6-28.3) 116 43.9 (36.7-51.4) 30 9.6 ( 6.4-14.2) 14 4.6 ( 2.5- 8.4) 276 8,103
Percentages are weighted to population characteristics.N = Cell Sample Size, % = Percentage, 95% C.I. = Confidence Interval at 95 percent probability level
Rows with Sample Size less than 50 or containing half-width of 95% CI greater than 10 have been suppressed.

Physical or mental health status during past 30 daysState of Hawaii BRFSS 2007
Demographic Characteristics
Not good N % C.I.(95%)
Good N % C.I.(95%)
Total N
Estimated numberof Adults
TOTAL 3,116 48.4 (46.7-50.2) 3,396 51.6 (49.8-53.3) 6,512 975,166
AGE GROUP
18-24 Years 182 58.0 (51.0-64.6) 132 42.0 (35.4-49.0) 314 124,557
25-34 Years 373 51.5 (46.7-56.3) 334 48.5 (43.7-53.3) 707 158,897
35-44 Years 574 50.5 (46.7-54.3) 517 49.5 (45.7-53.3) 1,091 173,891
45-54 Years 761 51.1 (47.7-54.4) 692 48.9 (45.6-52.3) 1,453 183,742
55-64 Years 646 44.4 (40.8-48.0) 771 55.6 (52.0-59.2) 1,417 153,692
65+ Years 572 38.2 (35.0-41.4) 933 61.8 (58.6-65.0) 1,505 176,403
Unknown/Refused - - -- -
GENDER
Male 1,206 46.0 (43.4-48.7) 1,457 54.0 (51.3-56.6) 2,663 481,788
Female 1,910 50.8 (48.6-53.0) 1,939 49.2 (47.0-51.4) 3,849 493,378
ETHNICITY
White 1,327 50.4 (47.9-53.0) 1,348 49.6 (47.0-52.1) 2,675 309,479
Hawaiian 447 50.6 (45.9-55.3) 448 49.4 (44.7-54.1) 895 134,632
Filipino 400 48.8 (43.9-53.7) 461 51.2 (46.3-56.1) 861 171,491
Japanese 562 43.4 (39.9-46.9) 764 56.6 (53.1-60.1) 1,326 213,994
Others 369 49.3 (44.5-54.1) 362 50.7 (45.9-55.5) 731 142,784
Unknown/Refused - - -- -
MARITAL STATUS
Married 1,704 46.0 (43.9-48.0) 2,024 54.0 (52.0-56.1) 3,728 581,354
Unmarried 1,407 52.2 (49.2-55.1) 1,364 47.8 (44.9-50.8) 2,771 392,576
Unknown/Refused - - -- -
EDUCATION
<High School 162 49.3 (41.8-56.8) 161 50.7 (43.2-58.2) 323 51,108
High School 891 48.6 (45.3-52.0) 957 51.4 (48.0-54.7) 1,848 305,869
Some College 935 50.7 (47.5-53.9) 984 49.3 (46.1-52.5) 1,919 288,795
College 1,125 46.3 (43.6-48.9) 1,289 53.7 (51.1-56.4) 2,414 328,013
Unknown/Refused - - -- -
EMPLOYMENT
Employed 1,906 47.9 (45.8-50.1) 2,106 52.1 (49.9-54.2) 4,012 630,362
Unemployed - - - - - - - -
Student/Homemaker 253 58.5 (52.2-64.5) 200 41.5 (35.5-47.8) 453 89,321
Retired/Can't work 849 44.4 (41.4-47.5) 1,016 55.6 (52.5-58.6) 1,865 223,482
Unknown/Refused - - -- -
HOUSEHOLD INCOME
<$15,000 285 60.1 (52.9-66.8) 191 39.9 (33.2-47.1) 476 56,634
$15,000-24,999 398 48.2 (43.3-53.2) 413 51.8 (46.8-56.7) 811 102,627
$25,000-49,999 906 50.1 (46.8-53.3) 971 49.9 (46.7-53.2) 1,877 276,712
$50,000-74,999 530 49.6 (45.5-53.6) 566 50.4 (46.4-54.5) 1,096 169,178
>=$75,000 798 43.9 (41.0-47.0) 1,014 56.1 (53.0-59.0) 1,812 284,751
Unknown/Refused 199 48.5 (41.8-55.3) 241 51.5 (44.7-58.2) 440 85,264
Percentages are weighted to population characteristics.N = Cell Sample Size, % = Percentage, 95% C.I. = Confidence Interval at 95 percent probability level
Rows with Sample Size less than 50 or containing half-width of 95% CI greater than 10 have been suppressed.

Physical or mental health status during past 30 daysState of Hawaii BRFSS 2007
GEOGRAPHIC AREAS Not good N % C.I.(95%)
Good N % C.I.(95%)
Total N
Estimatednumberof Adults
STATE 3,116 48.4 (46.7-50.2) 3,396 51.6 (49.8-53.3) 6,512 975,166
COUNTY
Honolulu 1,369 48.5 (46.2-50.7) 1,525 51.5 (49.3-53.8) 2,894 695,342
Hawaii 721 50.0 (46.8-53.2) 765 50.0 (46.8-53.2) 1,486 126,512
Kauai 319 50.1 (45.2-55.0) 324 49.9 (45.0-54.8) 643 46,728
Maui 707 45.8 (42.2-49.4) 782 54.2 (50.6-57.8) 1,489 106,584
HONOLULU County
North Shore/Laie - - - - - - - -
Ka'a'wa/Kahalu'u/Kaneohe 92 46.9 (38.9-54.9) 120 53.1 (45.1-61.1) 212 49,372
Kailua/Waimanalo 107 44.1 (36.7-51.8) 129 55.9 (48.2-63.3) 236 52,220
Wailae/Kahala/HawaiiKai 73 41.0 (32.9-49.7) 100 59.0 (50.3-67.1) 173 38,124
Kaimuki/Palolo/Waikiki 124 46.5 (39.3-53.8) 154 53.5 (46.2-60.7) 278 55,406
Manoa/Upper Makiki 109 43.9 (36.8-51.3) 133 56.1 (48.7-63.2) 242 45,495
Ala Moana 80 55.1 (45.9-64.0) 75 44.9 (36.0-54.1) 155 29,017
Nuuanu/Kalihi/MoanaLoa 117 47.5 (39.8-55.4) 132 52.5 (44.6-60.2) 249 65,999
Salt Lake/Foster Village - - - - - - - -
Aiea/Pearl City 133 49.7 (42.5-56.9) 146 50.3 (43.1-57.5) 279 68,265
Mililani/Wahiawa 140 47.3 (40.8-54.0) 154 52.7 (46.0-59.2) 294 74,019
Waipahu/Kapolei/Ewa 213 51.3 (45.6-56.9) 227 48.7 (43.1-54.4) 440 127,512
Nanakuli/Waianae - - - - - - - -
HAWAII County
North Hawaii 139 48.7 (41.6-55.8) 172 51.3 (44.2-58.4) 311 27,929
Hilo 212 52.7 (46.9-58.3) 208 47.3 (41.7-53.1) 420 35,723
Puna/Ka'u 219 51.8 (45.7-58.0) 199 48.2 (42.0-54.3) 418 35,405
Kona 151 45.4 (38.8-52.1) 186 54.6 (47.9-61.2) 337 27,454
KAUAI County
Hanalei/Kapa'a 147 52.3 (45.0-59.6) 146 47.7 (40.4-55.0) 293 19,737
Lihue-Waimea 172 48.5 (41.9-55.1) 178 51.5 (44.9-58.1) 350 26,991
MAUI County
Lahaina/Wailuku 148 44.7 (37.2-52.4) 150 55.3 (47.6-62.8) 298 30,696
Kahului 156 47.8 (41.3-54.4) 175 52.2 (45.6-58.7) 331 31,935
Upcountry/Hana 179 44.5 (38.4-50.8) 201 55.5 (49.2-61.6) 380 33,966
Lanai 95 49.0 (40.7-57.3) 108 51.0 (42.7-59.3) 203 1,838
Molokai 129 46.7 (39.5-54.0) 148 53.3 (46.0-60.5) 277 8,149
Percentages are weighted to population characteristics.N = Cell Sample Size, % = Percentage, 95% C.I. = Confidence Interval at 95 percent probability level
Rows with Sample Size less than 50 or containing half-width of 95% CI greater than 10 have been suppressed.
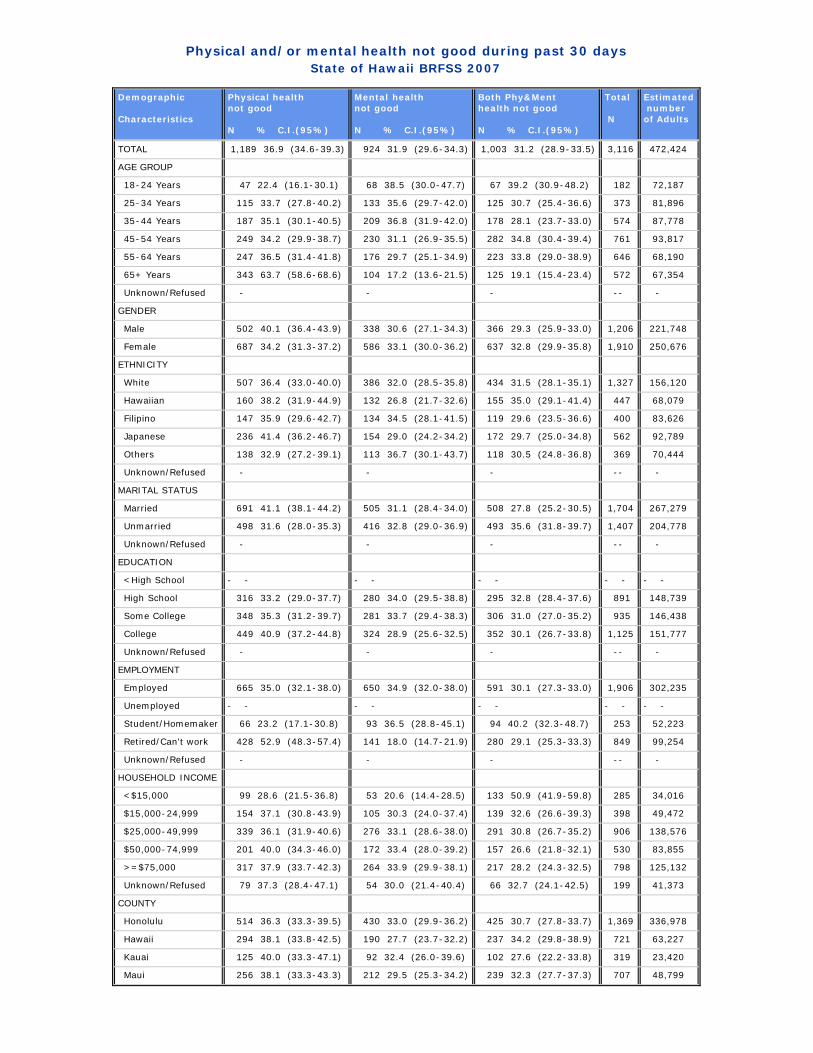
Physical and/or mental health not good during past 30 daysState of Hawaii BRFSS 2007
Demographic Characteristics
Physical healthnot good N % C.I.(95%)
Mental healthnot good N % C.I.(95%)
Both Phy&Menthealth not good N % C.I.(95%)
Total N
Estimated numberof Adults
TOTAL 1,189 36.9 (34.6-39.3) 924 31.9 (29.6-34.3) 1,003 31.2 (28.9-33.5) 3,116 472,424
AGE GROUP
18-24 Years 47 22.4 (16.1-30.1) 68 38.5 (30.0-47.7) 67 39.2 (30.9-48.2) 182 72,187
25-34 Years 115 33.7 (27.8-40.2) 133 35.6 (29.7-42.0) 125 30.7 (25.4-36.6) 373 81,896
35-44 Years 187 35.1 (30.1-40.5) 209 36.8 (31.9-42.0) 178 28.1 (23.7-33.0) 574 87,778
45-54 Years 249 34.2 (29.9-38.7) 230 31.1 (26.9-35.5) 282 34.8 (30.4-39.4) 761 93,817
55-64 Years 247 36.5 (31.4-41.8) 176 29.7 (25.1-34.9) 223 33.8 (29.0-38.9) 646 68,190
65+ Years 343 63.7 (58.6-68.6) 104 17.2 (13.6-21.5) 125 19.1 (15.4-23.4) 572 67,354
Unknown/Refused - - - -- -
GENDER
Male 502 40.1 (36.4-43.9) 338 30.6 (27.1-34.3) 366 29.3 (25.9-33.0) 1,206 221,748
Female 687 34.2 (31.3-37.2) 586 33.1 (30.0-36.2) 637 32.8 (29.9-35.8) 1,910 250,676
ETHNICITY
White 507 36.4 (33.0-40.0) 386 32.0 (28.5-35.8) 434 31.5 (28.1-35.1) 1,327 156,120
Hawaiian 160 38.2 (31.9-44.9) 132 26.8 (21.7-32.6) 155 35.0 (29.1-41.4) 447 68,079
Filipino 147 35.9 (29.6-42.7) 134 34.5 (28.1-41.5) 119 29.6 (23.5-36.6) 400 83,626
Japanese 236 41.4 (36.2-46.7) 154 29.0 (24.2-34.2) 172 29.7 (25.0-34.8) 562 92,789
Others 138 32.9 (27.2-39.1) 113 36.7 (30.1-43.7) 118 30.5 (24.8-36.8) 369 70,444
Unknown/Refused - - - -- -
MARITAL STATUS
Married 691 41.1 (38.1-44.2) 505 31.1 (28.4-34.0) 508 27.8 (25.2-30.5) 1,704 267,279
Unmarried 498 31.6 (28.0-35.3) 416 32.8 (29.0-36.9) 493 35.6 (31.8-39.7) 1,407 204,778
Unknown/Refused - - - -- -
EDUCATION
<High School - - - - - - - - - -
High School 316 33.2 (29.0-37.7) 280 34.0 (29.5-38.8) 295 32.8 (28.4-37.6) 891 148,739
Some College 348 35.3 (31.2-39.7) 281 33.7 (29.4-38.3) 306 31.0 (27.0-35.2) 935 146,438
College 449 40.9 (37.2-44.8) 324 28.9 (25.6-32.5) 352 30.1 (26.7-33.8) 1,125 151,777
Unknown/Refused - - - -- -
EMPLOYMENT
Employed 665 35.0 (32.1-38.0) 650 34.9 (32.0-38.0) 591 30.1 (27.3-33.0) 1,906 302,235
Unemployed - - - - - - - - - -
Student/Homemaker 66 23.2 (17.1-30.8) 93 36.5 (28.8-45.1) 94 40.2 (32.3-48.7) 253 52,223
Retired/Can't work 428 52.9 (48.3-57.4) 141 18.0 (14.7-21.9) 280 29.1 (25.3-33.3) 849 99,254
Unknown/Refused - - - -- -
HOUSEHOLD INCOME
<$15,000 99 28.6 (21.5-36.8) 53 20.6 (14.4-28.5) 133 50.9 (41.9-59.8) 285 34,016
$15,000-24,999 154 37.1 (30.8-43.9) 105 30.3 (24.0-37.4) 139 32.6 (26.6-39.3) 398 49,472
$25,000-49,999 339 36.1 (31.9-40.6) 276 33.1 (28.6-38.0) 291 30.8 (26.7-35.2) 906 138,576
$50,000-74,999 201 40.0 (34.3-46.0) 172 33.4 (28.0-39.2) 157 26.6 (21.8-32.1) 530 83,855
>=$75,000 317 37.9 (33.7-42.3) 264 33.9 (29.9-38.1) 217 28.2 (24.3-32.5) 798 125,132
Unknown/Refused 79 37.3 (28.4-47.1) 54 30.0 (21.4-40.4) 66 32.7 (24.1-42.5) 199 41,373
COUNTY
Honolulu 514 36.3 (33.3-39.5) 430 33.0 (29.9-36.2) 425 30.7 (27.8-33.7) 1,369 336,978
Hawaii 294 38.1 (33.8-42.5) 190 27.7 (23.7-32.2) 237 34.2 (29.8-38.9) 721 63,227
Kauai 125 40.0 (33.3-47.1) 92 32.4 (26.0-39.6) 102 27.6 (22.2-33.8) 319 23,420
Maui 256 38.1 (33.3-43.3) 212 29.5 (25.3-34.2) 239 32.3 (27.7-37.3) 707 48,799

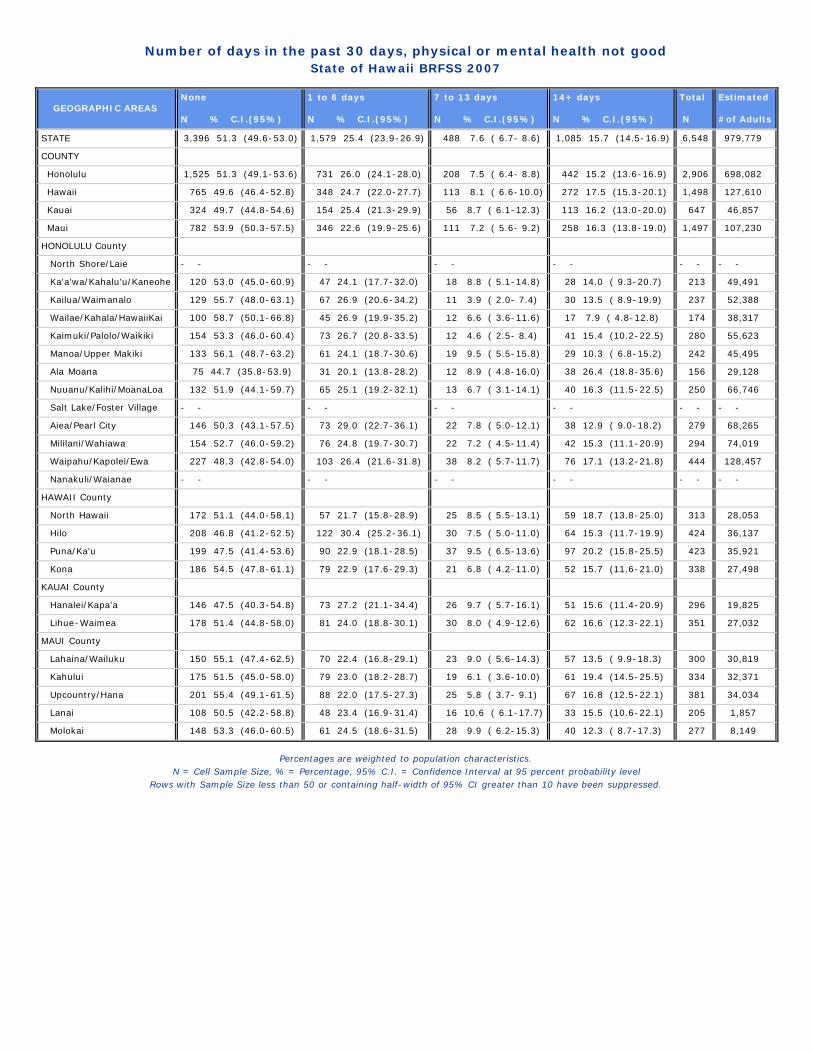
Number of days in the past 30 days, physical health not goodState of Hawaii BRFSS 2007
Demographic Characteristics
None N % C.I.(95%)
1 to 6 days N % C.I.(95%)
7 to 13 days N % C.I.(95%)
14+ days N % C.I.(95%)
Total N
Estimated numberof Adults
TOTAL 4,344 67.0 (65.4-68.6) 1,257 20.4 (19.1-21.9) 289 4.2 ( 3.6- 4.9) 671 8.4 ( 7.5- 9.2) 6,561 981,177
AGE GROUP
18-24 Years 201 64.5 (57.8-70.7) 91 29.5 (23.8-36.1) 8 2.3 ( 0.9- 5.8) 16 3.6 ( 2.1- 6.3) 316 125,329
25-34 Years 469 67.0 (62.5-71.2) 173 24.1 (20.4-28.3) 26 3.7 ( 2.3- 5.8) 42 5.2 ( 3.6- 7.5) 710 159,970
35-44 Years 730 68.1 (64.5-71.6) 228 20.0 (17.1-23.2) 58 5.0 ( 3.7- 6.8) 80 6.9 ( 5.2- 9.1) 1,096 174,634
45-54 Years 928 65.0 (61.7-68.1) 306 21.5 (18.9-24.4) 67 3.9 ( 2.9- 5.2) 159 9.6 ( 7.8-11.9) 1,460 184,770
55-64 Years 949 68.5 (65.1-71.7) 253 16.7 (14.2-19.6) 61 5.2 ( 3.7- 7.2) 165 9.5 ( 7.8-11.6) 1,428 154,534
65+ Years 1,046 68.1 (65.0-71.1) 205 13.5 (11.5-15.9) 67 4.6 ( 3.4- 6.2) 208 13.7 (11.6-16.2) 1,526 177,957
Unknown/Refused - - - - -- -
GENDER
Male 1,806 68.1 (65.6-70.5) 479 19.7 (17.7-21.9) 125 4.4 ( 3.5- 5.5) 271 7.8 ( 6.6- 9.2) 2,681 484,600
Female 2,538 65.9 (63.9-68.0) 778 21.1 (19.4-23.0) 164 4.0 ( 3.3- 4.9) 400 8.9 ( 7.8-10.1) 3,880 496,577
ETHNICITY
White 1,744 65.7 (63.2-68.1) 550 20.7 (18.7-22.9) 109 4.1 ( 3.1- 5.5) 292 9.4 ( 8.1-11.0) 2,695 311,499
Hawaiian 583 62.9 (58.2-67.3) 171 23.7 (19.8-28.2) 36 3.2 ( 2.1- 4.8) 111 10.2 ( 7.9-13.0) 901 135,226
Filipino 596 68.0 (63.3-72.4) 150 20.8 (16.8-25.3) 43 4.5 ( 3.0- 6.5) 77 6.8 ( 5.0- 9.0) 866 171,709
Japanese 922 69.1 (65.8-72.3) 229 18.2 (15.6-21.2) 64 4.9 ( 3.6- 6.6) 119 7.7 ( 6.2- 9.7) 1,334 214,743
Others 481 69.0 (64.7-73.0) 152 19.8 (16.5-23.6) 36 3.9 ( 2.7- 5.8) 72 7.3 ( 5.3- 9.9) 741 145,213
Unknown/Refused - - - - -- -
MARITAL STATUS
Married 2,539 68.3 (66.4-70.2) 707 19.6 (18.0-21.4) 173 4.3 ( 3.6- 5.2) 327 7.8 ( 6.8- 8.9) 3,746 584,022
Unmarried 1,794 65.0 (62.2-67.8) 549 21.7 (19.3-24.2) 116 4.1 ( 3.1- 5.3) 343 9.2 ( 7.9-10.8) 2,802 395,919
Unknown/Refused - - - - -- -
EDUCATION
<High School 202 63.6 (56.2-70.3) 49 12.5 ( 8.6-17.7) 18 3.7 ( 2.1- 6.7) 63 20.2 (14.8-27.0) 332 51,885
High School 1,248 67.8 (64.7-70.8) 309 18.3 (15.8-21.1) 89 4.6 ( 3.5- 6.2) 224 9.2 ( 7.7-11.0) 1,870 308,410
Some College 1,267 66.3 (63.3-69.2) 378 22.2 (19.6-25.0) 80 3.9 ( 3.0- 5.2) 199 7.5 ( 6.3- 9.0) 1,924 289,164
College 1,619 67.2 (64.7-69.6) 520 22.2 (20.0-24.5) 102 4.1 ( 3.2- 5.3) 185 6.5 ( 5.3- 7.8) 2,426 330,084
Unknown/Refused - - - - -- -
EMPLOYMENT
Employed 2,769 68.8 (66.8-70.8) 842 22.0 (20.2-23.9) 172 4.0 ( 3.3- 4.8) 247 5.2 ( 4.4- 6.1) 4,030 633,359
Unemployed - - - - - - - - - - - -
Student/Homemaker 295 62.9 (56.6-68.7) 111 28.2 (22.7-34.4) 17 3.4 ( 1.9- 6.1) 35 5.5 ( 3.6- 8.3) 458 89,892
Retired/Can't work 1,166 63.5 (60.5-66.4) 276 14.1 (12.1-16.4) 89 4.8 ( 3.6- 6.2) 359 17.6 (15.4-20.0) 1,890 225,884
Unknown/Refused - - - - -- -
HOUSEHOLD INCOME
<$15,000 246 52.0 (44.9-58.9) 92 22.1 (16.4-29.0) 25 4.4 ( 2.6- 7.4) 123 21.5 (16.5-27.6) 486 57,321
$15,000-24,999 522 66.3 (61.6-70.6) 138 17.1 (13.7-21.0) 38 3.8 ( 2.4- 6.0) 123 12.9 (10.2-16.1) 821 103,353
$25,000-49,999 1,252 66.5 (63.5-69.5) 367 21.0 (18.5-23.7) 85 4.2 ( 3.2- 5.6) 181 8.3 ( 6.8-10.0) 1,885 278,144
$50,000-74,999 742 67.0 (63.1-70.8) 233 22.8 (19.4-26.6) 49 4.6 ( 3.2- 6.5) 78 5.6 ( 4.2- 7.3) 1,102 169,674
>=$75,000 1,281 70.9 (68.1-73.6) 353 20.2 (17.8-22.8) 71 3.5 ( 2.6- 4.6) 113 5.4 ( 4.3- 6.7) 1,818 285,925
Unknown/Refused 301 66.4 (59.8-72.4) 74 17.9 (13.2-23.7) 21 6.1 ( 3.6-10.3) 53 9.7 ( 6.6-13.8) 449 86,760
Percentages are weighted to population characteristics.N = Cell Sample Size, % = Percentage, 95% C.I. = Confidence Interval at 95 percent probability level
Rows with Sample Size less than 50 or containing half-width of 95% CI greater than 10 have been suppressed.
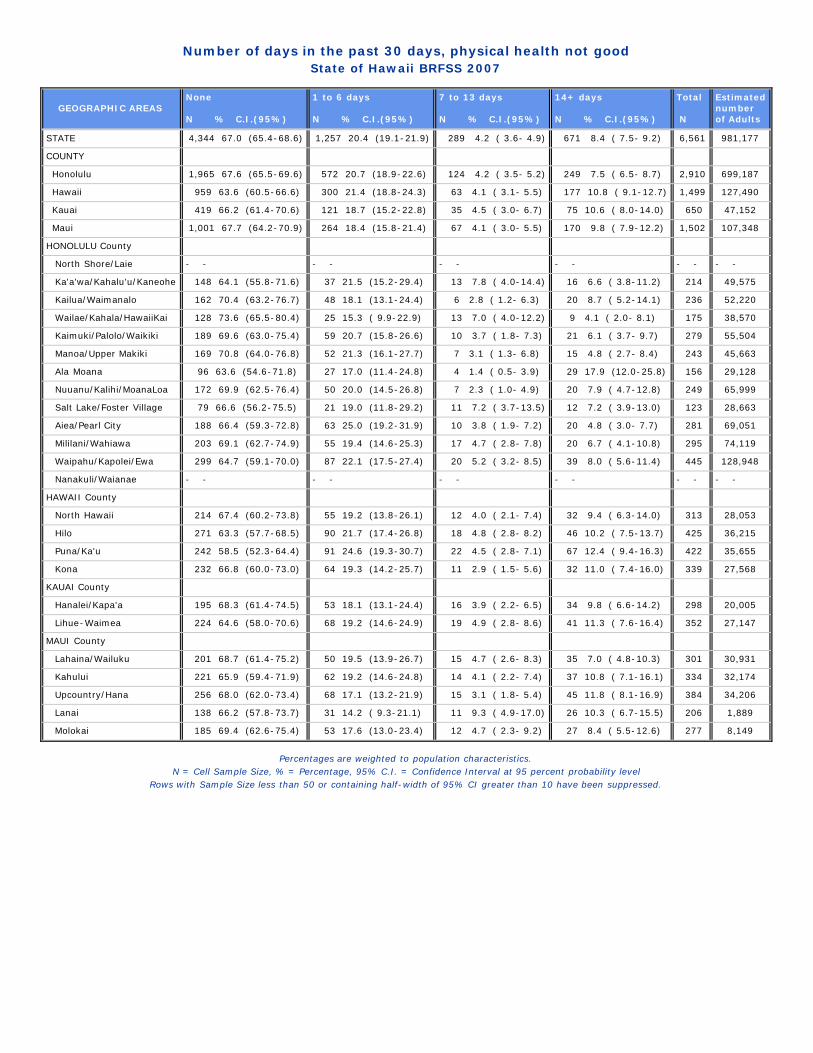
Number of days in the past 30 days, physical health not goodState of Hawaii BRFSS 2007
GEOGRAPHIC AREAS None N % C.I.(95%)
1 to 6 days N % C.I.(95%)
7 to 13 days N % C.I.(95%)
14+ days N % C.I.(95%)
Total N
Estimatednumberof Adults
STATE 4,344 67.0 (65.4-68.6) 1,257 20.4 (19.1-21.9) 289 4.2 ( 3.6- 4.9) 671 8.4 ( 7.5- 9.2) 6,561 981,177
COUNTY
Honolulu 1,965 67.6 (65.5-69.6) 572 20.7 (18.9-22.6) 124 4.2 ( 3.5- 5.2) 249 7.5 ( 6.5- 8.7) 2,910 699,187
Hawaii 959 63.6 (60.5-66.6) 300 21.4 (18.8-24.3) 63 4.1 ( 3.1- 5.5) 177 10.8 ( 9.1-12.7) 1,499 127,490
Kauai 419 66.2 (61.4-70.6) 121 18.7 (15.2-22.8) 35 4.5 ( 3.0- 6.7) 75 10.6 ( 8.0-14.0) 650 47,152
Maui 1,001 67.7 (64.2-70.9) 264 18.4 (15.8-21.4) 67 4.1 ( 3.0- 5.5) 170 9.8 ( 7.9-12.2) 1,502 107,348
HONOLULU County
North Shore/Laie - - - - - - - - - - - -
Ka'a'wa/Kahalu'u/Kaneohe 148 64.1 (55.8-71.6) 37 21.5 (15.2-29.4) 13 7.8 ( 4.0-14.4) 16 6.6 ( 3.8-11.2) 214 49,575
Kailua/Waimanalo 162 70.4 (63.2-76.7) 48 18.1 (13.1-24.4) 6 2.8 ( 1.2- 6.3) 20 8.7 ( 5.2-14.1) 236 52,220
Wailae/Kahala/HawaiiKai 128 73.6 (65.5-80.4) 25 15.3 ( 9.9-22.9) 13 7.0 ( 4.0-12.2) 9 4.1 ( 2.0- 8.1) 175 38,570
Kaimuki/Palolo/Waikiki 189 69.6 (63.0-75.4) 59 20.7 (15.8-26.6) 10 3.7 ( 1.8- 7.3) 21 6.1 ( 3.7- 9.7) 279 55,504
Manoa/Upper Makiki 169 70.8 (64.0-76.8) 52 21.3 (16.1-27.7) 7 3.1 ( 1.3- 6.8) 15 4.8 ( 2.7- 8.4) 243 45,663
Ala Moana 96 63.6 (54.6-71.8) 27 17.0 (11.4-24.8) 4 1.4 ( 0.5- 3.9) 29 17.9 (12.0-25.8) 156 29,128
Nuuanu/Kalihi/MoanaLoa 172 69.9 (62.5-76.4) 50 20.0 (14.5-26.8) 7 2.3 ( 1.0- 4.9) 20 7.9 ( 4.7-12.8) 249 65,999
Salt Lake/Foster Village 79 66.6 (56.2-75.5) 21 19.0 (11.8-29.2) 11 7.2 ( 3.7-13.5) 12 7.2 ( 3.9-13.0) 123 28,663
Aiea/Pearl City 188 66.4 (59.3-72.8) 63 25.0 (19.2-31.9) 10 3.8 ( 1.9- 7.2) 20 4.8 ( 3.0- 7.7) 281 69,051
Mililani/Wahiawa 203 69.1 (62.7-74.9) 55 19.4 (14.6-25.3) 17 4.7 ( 2.8- 7.8) 20 6.7 ( 4.1-10.8) 295 74,119
Waipahu/Kapolei/Ewa 299 64.7 (59.1-70.0) 87 22.1 (17.5-27.4) 20 5.2 ( 3.2- 8.5) 39 8.0 ( 5.6-11.4) 445 128,948
Nanakuli/Waianae - - - - - - - - - - - -
HAWAII County
North Hawaii 214 67.4 (60.2-73.8) 55 19.2 (13.8-26.1) 12 4.0 ( 2.1- 7.4) 32 9.4 ( 6.3-14.0) 313 28,053
Hilo 271 63.3 (57.7-68.5) 90 21.7 (17.4-26.8) 18 4.8 ( 2.8- 8.2) 46 10.2 ( 7.5-13.7) 425 36,215
Puna/Ka'u 242 58.5 (52.3-64.4) 91 24.6 (19.3-30.7) 22 4.5 ( 2.8- 7.1) 67 12.4 ( 9.4-16.3) 422 35,655
Kona 232 66.8 (60.0-73.0) 64 19.3 (14.2-25.7) 11 2.9 ( 1.5- 5.6) 32 11.0 ( 7.4-16.0) 339 27,568
KAUAI County
Hanalei/Kapa'a 195 68.3 (61.4-74.5) 53 18.1 (13.1-24.4) 16 3.9 ( 2.2- 6.5) 34 9.8 ( 6.6-14.2) 298 20,005
Lihue-Waimea 224 64.6 (58.0-70.6) 68 19.2 (14.6-24.9) 19 4.9 ( 2.8- 8.6) 41 11.3 ( 7.6-16.4) 352 27,147
MAUI County
Lahaina/Wailuku 201 68.7 (61.4-75.2) 50 19.5 (13.9-26.7) 15 4.7 ( 2.6- 8.3) 35 7.0 ( 4.8-10.3) 301 30,931
Kahului 221 65.9 (59.4-71.9) 62 19.2 (14.6-24.8) 14 4.1 ( 2.2- 7.4) 37 10.8 ( 7.1-16.1) 334 32,174
Upcountry/Hana 256 68.0 (62.0-73.4) 68 17.1 (13.2-21.9) 15 3.1 ( 1.8- 5.4) 45 11.8 ( 8.1-16.9) 384 34,206
Lanai 138 66.2 (57.8-73.7) 31 14.2 ( 9.3-21.1) 11 9.3 ( 4.9-17.0) 26 10.3 ( 6.7-15.5) 206 1,889
Molokai 185 69.4 (62.6-75.4) 53 17.6 (13.0-23.4) 12 4.7 ( 2.3- 9.2) 27 8.4 ( 5.5-12.6) 277 8,149
Percentages are weighted to population characteristics.N = Cell Sample Size, % = Percentage, 95% C.I. = Confidence Interval at 95 percent probability level
Rows with Sample Size less than 50 or containing half-width of 95% CI greater than 10 have been suppressed.

Average number of physically unhealthy days in the past 30 daysState of Hawaii BRFSS 2007
Demographic Characteristics
Average 95% C.I. Sample Size
TOTAL 2.9 2.7 - 3.1 6,561
AGE GROUP
18-24 Years 1.8 1.3 - 2.4 316
25-34 Years 2.1 1.7 - 2.6 710
35-44 Years 2.4 2.0 - 2.9 1,096
45-54 Years 3.1 2.6 - 3.5 1,460
55-64 Years 3.3 2.8 - 3.8 1,428
65+ Years 4.2 3.6 - 4.8 1,526
Unknown/Refused - - --
GENDER
Male 2.8 2.5 - 3.1 2,681
Female 2.9 2.7 - 3.2 3,880
ETHNICITY
White 3.2 2.8 - 3.6 2,695
Hawaiian 3.3 2.7 - 3.9 901
Filipino 2.5 2.0 - 3.0 866
Japanese 2.8 2.3 - 3.2 1,334
Others 2.5 2.0 - 3.0 741
Unknown/Refused - - --
MARITAL STATUS
Married 2.7 2.4 - 2.9 3,746
Unmarried 3.2 2.8 - 3.6 2,802
Unknown/Refused - - --
EDUCATION
<High School 5.7 4.2 - 7.2 332
High School 3.1 2.7 - 3.5 1,870
Some College 2.7 2.4 - 3.0 1,924
College 2.4 2.1 - 2.7 2,426
Unknown/Refused - - --
EMPLOYMENT
Employed 2.0 1.8 - 2.2 4,030
Unemployed 4.2 2.3 - 6.0 178
Student/Homemaker 2.3 1.8 - 2.8 458
Retired/Can't work 5.3 4.7 - 5.9 1,890
Unknown/Refused - - --
HOUSEHOLD INCOME
<$15,000 6.5 5.1 - 7.8 486
$15,000-24,999 4.0 3.3 - 4.8 821
$25,000-49,999 2.8 2.5 - 3.2 1,885
$50,000-74,999 2.3 1.9 - 2.7 1,102
>=$75,000 2.0 1.7 - 2.4 1,818
Unknown/Refused 3.2 2.4 - 4.1 449
The symbol '--' means cell size less than 50.95% C.I. = Confidence Interval at 95 percent probability level.
Means are weighted to population characteristics.

Average number of physically unhealthy days in the past 30 daysState of Hawaii BRFSS 2007
GEOGRAPHIC AREAS Average 95% C.I. Sample Size
STATE 2.9 2.7 - 3.1 6,561
COUNTY
Honolulu 2.7 2.4 - 2.9 2,910
Hawaii 3.6 3.1 - 4.0 1,499
Kauai 3.4 2.6 - 4.1 650
Maui 3.2 2.7 - 3.8 1,502
HONOLULU County
North Shore/Laie 2.5 1.1 - 3.9 88
Ka'a'wa/Kahalu'u/Kaneohe 2.7 1.8 - 3.6 214
Kailua/Waimanalo 3.0 1.9 - 4.1 236
Wailae/Kahala/HawaiiKai 1.8 1.1 - 2.6 175
Kaimuki/Palolo/Waikiki 2.3 1.5 - 3.0 279
Manoa/Upper Makiki 2.1 1.3 - 2.8 243
Ala Moana 5.6 3.6 - 7.6 156
Nuuanu/Kalihi/MoanaLoa 2.6 1.6 - 3.5 249
Salt Lake/Foster Village 2.5 1.5 - 3.5 123
Aiea/Pearl City 2.2 1.6 - 2.9 281
Mililani/Wahiawa 2.3 1.5 - 3.1 295
Waipahu/Kapolei/Ewa 2.6 2.0 - 3.3 445
Nanakuli/Waianae 4.2 2.5 - 5.9 126
HAWAII County
North Hawaii 3.3 2.2 - 4.3 313
Hilo 3.4 2.7 - 4.2 425
Puna/Ka'u 4.0 3.2 - 4.9 422
Kona 3.4 2.3 - 4.4 339
KAUAI County
Hanalei/Kapa'a 2.8 2.0 - 3.7 298
Lihue-Waimea 3.7 2.6 - 4.9 352
MAUI County
Lahaina/Wailuku 2.7 2.0 - 3.4 301
Kahului 3.6 2.4 - 4.7 334
Upcountry/Hana 3.5 2.4 - 4.6 384
Lanai 3.4 2.4 - 4.4 206
Molokai 2.8 1.9 - 3.7 277
The symbol '--' means cell size less than 50.95% C.I. = Confidence Interval at 95 percent probability level.
Means are weighted to population characteristics.
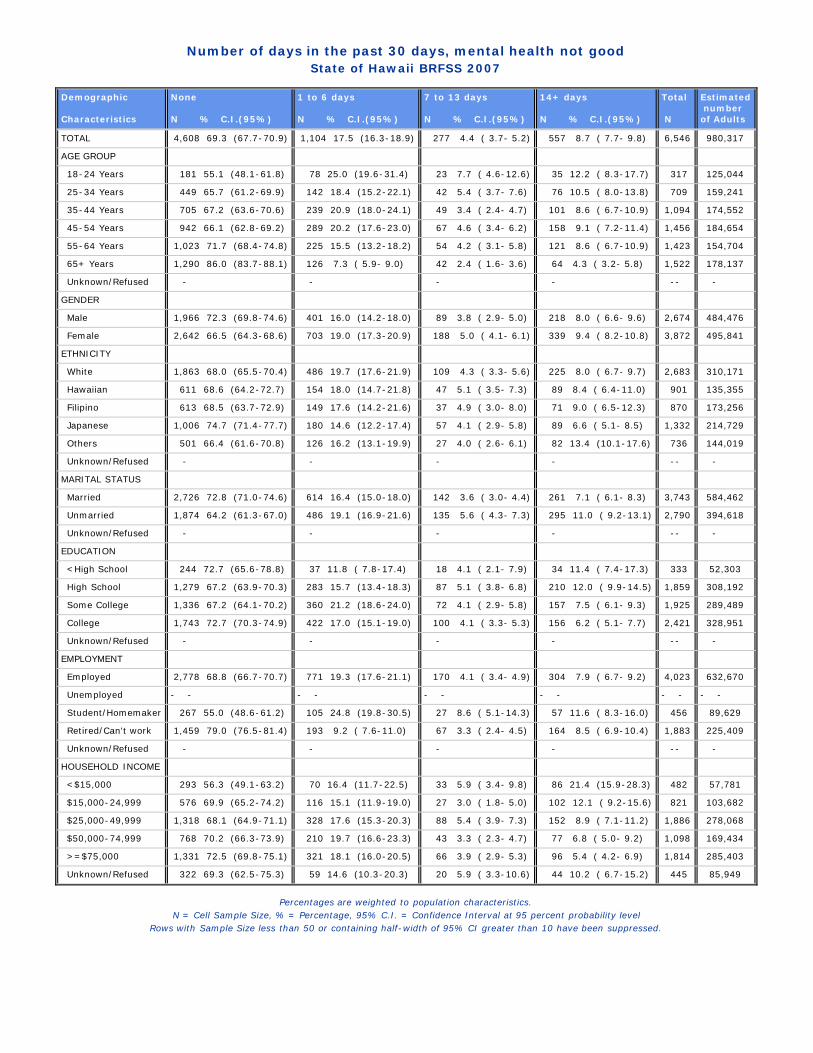
Number of days in the past 30 days, mental health not goodState of Hawaii BRFSS 2007
Demographic Characteristics
None N % C.I.(95%)
1 to 6 days N % C.I.(95%)
7 to 13 days N % C.I.(95%)
14+ days N % C.I.(95%)
Total N
Estimated numberof Adults
TOTAL 4,608 69.3 (67.7-70.9) 1,104 17.5 (16.3-18.9) 277 4.4 ( 3.7- 5.2) 557 8.7 ( 7.7- 9.8) 6,546 980,317
AGE GROUP
18-24 Years 181 55.1 (48.1-61.8) 78 25.0 (19.6-31.4) 23 7.7 ( 4.6-12.6) 35 12.2 ( 8.3-17.7) 317 125,044
25-34 Years 449 65.7 (61.2-69.9) 142 18.4 (15.2-22.1) 42 5.4 ( 3.7- 7.6) 76 10.5 ( 8.0-13.8) 709 159,241
35-44 Years 705 67.2 (63.6-70.6) 239 20.9 (18.0-24.1) 49 3.4 ( 2.4- 4.7) 101 8.6 ( 6.7-10.9) 1,094 174,552
45-54 Years 942 66.1 (62.8-69.2) 289 20.2 (17.6-23.0) 67 4.6 ( 3.4- 6.2) 158 9.1 ( 7.2-11.4) 1,456 184,654
55-64 Years 1,023 71.7 (68.4-74.8) 225 15.5 (13.2-18.2) 54 4.2 ( 3.1- 5.8) 121 8.6 ( 6.7-10.9) 1,423 154,704
65+ Years 1,290 86.0 (83.7-88.1) 126 7.3 ( 5.9- 9.0) 42 2.4 ( 1.6- 3.6) 64 4.3 ( 3.2- 5.8) 1,522 178,137
Unknown/Refused - - - - -- -
GENDER
Male 1,966 72.3 (69.8-74.6) 401 16.0 (14.2-18.0) 89 3.8 ( 2.9- 5.0) 218 8.0 ( 6.6- 9.6) 2,674 484,476
Female 2,642 66.5 (64.3-68.6) 703 19.0 (17.3-20.9) 188 5.0 ( 4.1- 6.1) 339 9.4 ( 8.2-10.8) 3,872 495,841
ETHNICITY
White 1,863 68.0 (65.5-70.4) 486 19.7 (17.6-21.9) 109 4.3 ( 3.3- 5.6) 225 8.0 ( 6.7- 9.7) 2,683 310,171
Hawaiian 611 68.6 (64.2-72.7) 154 18.0 (14.7-21.8) 47 5.1 ( 3.5- 7.3) 89 8.4 ( 6.4-11.0) 901 135,355
Filipino 613 68.5 (63.7-72.9) 149 17.6 (14.2-21.6) 37 4.9 ( 3.0- 8.0) 71 9.0 ( 6.5-12.3) 870 173,256
Japanese 1,006 74.7 (71.4-77.7) 180 14.6 (12.2-17.4) 57 4.1 ( 2.9- 5.8) 89 6.6 ( 5.1- 8.5) 1,332 214,729
Others 501 66.4 (61.6-70.8) 126 16.2 (13.1-19.9) 27 4.0 ( 2.6- 6.1) 82 13.4 (10.1-17.6) 736 144,019
Unknown/Refused - - - - -- -
MARITAL STATUS
Married 2,726 72.8 (71.0-74.6) 614 16.4 (15.0-18.0) 142 3.6 ( 3.0- 4.4) 261 7.1 ( 6.1- 8.3) 3,743 584,462
Unmarried 1,874 64.2 (61.3-67.0) 486 19.1 (16.9-21.6) 135 5.6 ( 4.3- 7.3) 295 11.0 ( 9.2-13.1) 2,790 394,618
Unknown/Refused - - - - -- -
EDUCATION
<High School 244 72.7 (65.6-78.8) 37 11.8 ( 7.8-17.4) 18 4.1 ( 2.1- 7.9) 34 11.4 ( 7.4-17.3) 333 52,303
High School 1,279 67.2 (63.9-70.3) 283 15.7 (13.4-18.3) 87 5.1 ( 3.8- 6.8) 210 12.0 ( 9.9-14.5) 1,859 308,192
Some College 1,336 67.2 (64.1-70.2) 360 21.2 (18.6-24.0) 72 4.1 ( 2.9- 5.8) 157 7.5 ( 6.1- 9.3) 1,925 289,489
College 1,743 72.7 (70.3-74.9) 422 17.0 (15.1-19.0) 100 4.1 ( 3.3- 5.3) 156 6.2 ( 5.1- 7.7) 2,421 328,951
Unknown/Refused - - - - -- -
EMPLOYMENT
Employed 2,778 68.8 (66.7-70.7) 771 19.3 (17.6-21.1) 170 4.1 ( 3.4- 4.9) 304 7.9 ( 6.7- 9.2) 4,023 632,670
Unemployed - - - - - - - - - - - -
Student/Homemaker 267 55.0 (48.6-61.2) 105 24.8 (19.8-30.5) 27 8.6 ( 5.1-14.3) 57 11.6 ( 8.3-16.0) 456 89,629
Retired/Can't work 1,459 79.0 (76.5-81.4) 193 9.2 ( 7.6-11.0) 67 3.3 ( 2.4- 4.5) 164 8.5 ( 6.9-10.4) 1,883 225,409
Unknown/Refused - - - - -- -
HOUSEHOLD INCOME
<$15,000 293 56.3 (49.1-63.2) 70 16.4 (11.7-22.5) 33 5.9 ( 3.4- 9.8) 86 21.4 (15.9-28.3) 482 57,781
$15,000-24,999 576 69.9 (65.2-74.2) 116 15.1 (11.9-19.0) 27 3.0 ( 1.8- 5.0) 102 12.1 ( 9.2-15.6) 821 103,682
$25,000-49,999 1,318 68.1 (64.9-71.1) 328 17.6 (15.3-20.3) 88 5.4 ( 3.9- 7.3) 152 8.9 ( 7.1-11.2) 1,886 278,068
$50,000-74,999 768 70.2 (66.3-73.9) 210 19.7 (16.6-23.3) 43 3.3 ( 2.3- 4.7) 77 6.8 ( 5.0- 9.2) 1,098 169,434
>=$75,000 1,331 72.5 (69.8-75.1) 321 18.1 (16.0-20.5) 66 3.9 ( 2.9- 5.3) 96 5.4 ( 4.2- 6.9) 1,814 285,403
Unknown/Refused 322 69.3 (62.5-75.3) 59 14.6 (10.3-20.3) 20 5.9 ( 3.3-10.6) 44 10.2 ( 6.7-15.2) 445 85,949
Percentages are weighted to population characteristics.N = Cell Sample Size, % = Percentage, 95% C.I. = Confidence Interval at 95 percent probability level
Rows with Sample Size less than 50 or containing half-width of 95% CI greater than 10 have been suppressed.

Number of days in the past 30 days, mental health not goodState of Hawaii BRFSS 2007
GEOGRAPHIC AREAS None N % C.I.(95%)
1 to 6 days N % C.I.(95%)
7 to 13 days N % C.I.(95%)
14+ days N % C.I.(95%)
Total N
Estimatednumberof Adults
STATE 4,608 69.3 (67.7-70.9) 1,104 17.5 (16.3-18.9) 277 4.4 ( 3.7- 5.2) 557 8.7 ( 7.7- 9.8) 6,546 980,317
COUNTY
Honolulu 2,045 69.0 (66.9-71.1) 510 17.9 (16.3-19.7) 117 4.3 ( 3.5- 5.4) 234 8.7 ( 7.5-10.2) 2,906 698,173
Hawaii 1,072 69.1 (66.0-72.1) 226 16.7 (14.2-19.4) 63 4.5 ( 3.3- 6.0) 141 9.7 ( 7.8-11.9) 1,502 128,225
Kauai 449 69.9 (65.2-74.2) 107 17.0 (13.6-20.9) 33 5.7 ( 3.6- 9.1) 54 7.4 ( 5.4-10.1) 643 46,728
Maui 1,042 71.6 (68.3-74.6) 261 16.2 (13.8-18.9) 64 4.4 ( 3.1- 6.2) 128 7.9 ( 6.3- 9.8) 1,495 107,190
HONOLULU County
North Shore/Laie - - - - - - - - - - - -
Ka'a'wa/Kahalu'u/Kaneohe 159 74.4 (66.8-80.7) 35 15.3 (10.6-21.6) 9 4.3 ( 2.0- 9.1) 10 6.0 ( 2.9-11.9) 213 49,491
Kailua/Waimanalo 173 74.2 (66.9-80.3) 44 16.5 (11.6-22.9) 4 2.2 ( 0.7- 6.5) 17 7.1 ( 4.0-12.4) 238 52,499
Wailae/Kahala/HawaiiKai 126 74.4 (66.7-80.9) 33 18.6 (13.0-25.9) 7 3.7 ( 1.7- 7.9) 7 3.2 ( 1.5- 6.8) 173 38,124
Kaimuki/Palolo/Waikiki 202 69.2 (61.6-75.9) 51 19.3 (14.1-25.8) 7 2.3 ( 1.0- 5.4) 21 9.2 ( 5.0-16.5) 281 56,006
Manoa/Upper Makiki 176 74.2 (67.3-80.1) 37 14.1 ( 9.9-19.7) 10 5.0 ( 2.2-11.0) 19 6.6 ( 4.0-10.9) 242 45,495
Ala Moana 109 64.8 (55.3-73.3) 22 17.6 (11.4-26.3) 9 5.6 ( 2.8-11.0) 15 11.9 ( 6.6-20.4) 155 29,017
Nuuanu/Kalihi/MoanaLoa 176 68.2 (60.4-75.1) 45 17.0 (12.2-23.2) 6 4.8 ( 1.7-13.1) 24 9.9 ( 6.3-15.2) 251 66,814
Salt Lake/Foster Village - - - - - - - - - - - -
Aiea/Pearl City 196 67.0 (59.8-73.5) 48 20.3 (14.9-27.0) 13 4.2 ( 2.3- 7.4) 22 8.6 ( 5.3-13.6) 279 68,265
Mililani/Wahiawa 207 69.0 (62.5-74.8) 50 16.1 (12.0-21.3) 12 4.4 ( 2.3- 8.3) 26 10.5 ( 6.9-15.6) 295 74,092
Waipahu/Kapolei/Ewa 303 66.8 (61.2-71.9) 76 18.2 (14.3-23.0) 26 5.8 ( 3.7- 9.1) 37 9.2 ( 6.2-13.3) 442 128,218
Nanakuli/Waianae - - - - - - - - - - - -
HAWAII County
North Hawaii 224 67.3 (59.9-73.9) 42 16.2 (11.1-23.1) 22 7.2 ( 4.3-11.8) 27 9.3 ( 5.7-14.9) 315 28,396
Hilo 310 70.8 (64.9-76.0) 65 17.4 (13.0-22.9) 16 3.7 ( 2.1- 6.4) 31 8.2 ( 5.3-12.3) 422 35,855
Puna/Ka'u 289 66.9 (60.8-72.6) 72 17.5 (13.2-22.8) 11 3.0 ( 1.4- 6.1) 53 12.6 ( 8.7-17.7) 425 36,160
Kona 249 71.8 (65.3-77.6) 47 15.1 (10.6-21.1) 14 4.7 ( 2.6- 8.6) 30 8.3 ( 5.4-12.6) 340 27,815
KAUAI County
Hanalei/Kapa'a 204 67.0 (59.7-73.7) 46 16.6 (11.9-22.7) 20 9.2 ( 5.2-15.8) 23 7.2 ( 4.5-11.3) 293 19,737
Lihue-Waimea 245 72.0 (65.8-77.5) 61 17.3 (12.9-22.8) 13 3.2 ( 1.4- 7.1) 31 7.5 ( 4.9-11.4) 350 26,991
MAUI County
Lahaina/Wailuku 199 70.7 (63.6-76.9) 54 15.8 (11.3-21.8) 15 5.4 ( 2.8-10.2) 31 8.1 ( 5.3-12.2) 299 30,789
Kahului 242 71.9 (65.7-77.4) 53 15.8 (11.7-21.0) 12 4.2 ( 2.2- 7.8) 27 8.1 ( 5.2-12.5) 334 32,276
Upcountry/Hana 262 72.1 (66.5-77.0) 67 16.3 (12.4-21.1) 17 3.8 ( 2.1- 6.7) 36 7.8 ( 5.4-11.1) 382 34,139
Lanai 138 65.2 (56.8-72.8) 43 23.0 (16.6-31.0) 8 3.2 ( 1.5- 6.5) 14 8.6 ( 4.9-14.8) 203 1,838
Molokai 201 72.5 (65.5-78.5) 44 17.2 (12.2-23.8) 12 4.2 ( 2.1- 8.5) 20 6.0 ( 3.6- 9.9) 277 8,149
Percentages are weighted to population characteristics.N = Cell Sample Size, % = Percentage, 95% C.I. = Confidence Interval at 95 percent probability level
Rows with Sample Size less than 50 or containing half-width of 95% CI greater than 10 have been suppressed.
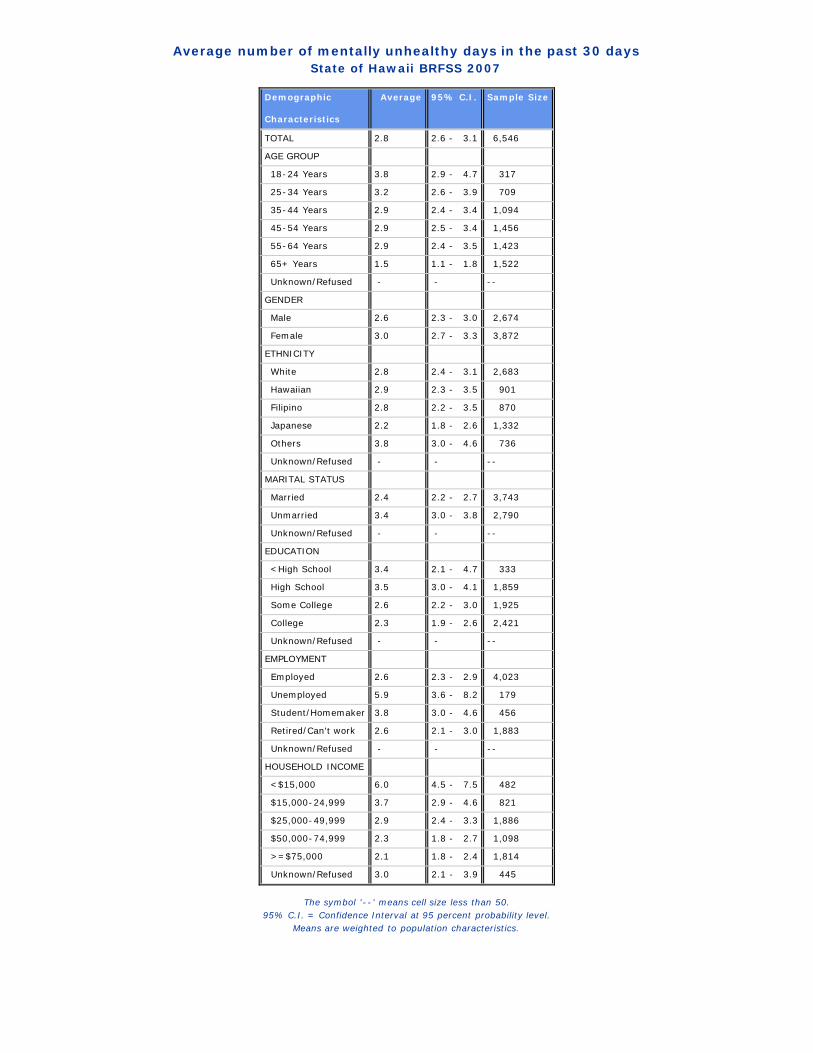
Average number of mentally unhealthy days in the past 30 daysState of Hawaii BRFSS 2007
Demographic Characteristics
Average 95% C.I. Sample Size
TOTAL 2.8 2.6 - 3.1 6,546
AGE GROUP
18-24 Years 3.8 2.9 - 4.7 317
25-34 Years 3.2 2.6 - 3.9 709
35-44 Years 2.9 2.4 - 3.4 1,094
45-54 Years 2.9 2.5 - 3.4 1,456
55-64 Years 2.9 2.4 - 3.5 1,423
65+ Years 1.5 1.1 - 1.8 1,522
Unknown/Refused - - --
GENDER
Male 2.6 2.3 - 3.0 2,674
Female 3.0 2.7 - 3.3 3,872
ETHNICITY
White 2.8 2.4 - 3.1 2,683
Hawaiian 2.9 2.3 - 3.5 901
Filipino 2.8 2.2 - 3.5 870
Japanese 2.2 1.8 - 2.6 1,332
Others 3.8 3.0 - 4.6 736
Unknown/Refused - - --
MARITAL STATUS
Married 2.4 2.2 - 2.7 3,743
Unmarried 3.4 3.0 - 3.8 2,790
Unknown/Refused - - --
EDUCATION
<High School 3.4 2.1 - 4.7 333
High School 3.5 3.0 - 4.1 1,859
Some College 2.6 2.2 - 3.0 1,925
College 2.3 1.9 - 2.6 2,421
Unknown/Refused - - --
EMPLOYMENT
Employed 2.6 2.3 - 2.9 4,023
Unemployed 5.9 3.6 - 8.2 179
Student/Homemaker 3.8 3.0 - 4.6 456
Retired/Can't work 2.6 2.1 - 3.0 1,883
Unknown/Refused - - --
HOUSEHOLD INCOME
<$15,000 6.0 4.5 - 7.5 482
$15,000-24,999 3.7 2.9 - 4.6 821
$25,000-49,999 2.9 2.4 - 3.3 1,886
$50,000-74,999 2.3 1.8 - 2.7 1,098
>=$75,000 2.1 1.8 - 2.4 1,814
Unknown/Refused 3.0 2.1 - 3.9 445
The symbol '--' means cell size less than 50.95% C.I. = Confidence Interval at 95 percent probability level.
Means are weighted to population characteristics.
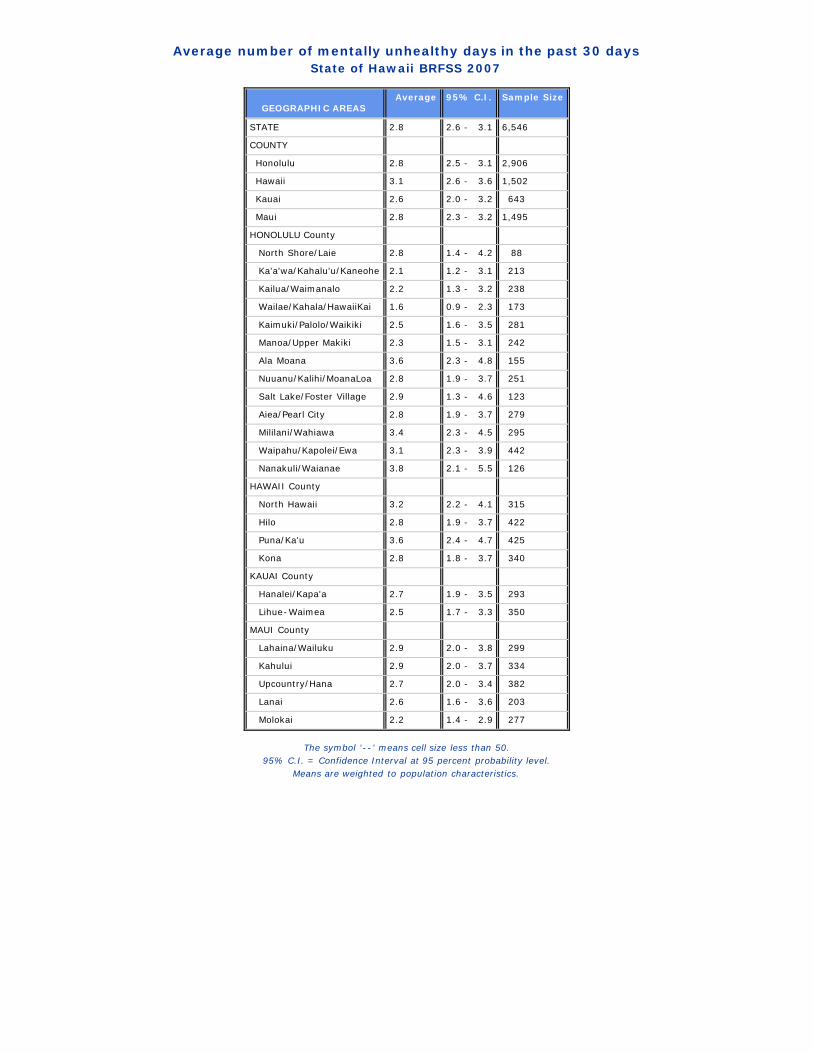
Average number of mentally unhealthy days in the past 30 daysState of Hawaii BRFSS 2007
GEOGRAPHIC AREAS Average 95% C.I. Sample Size
STATE 2.8 2.6 - 3.1 6,546
COUNTY
Honolulu 2.8 2.5 - 3.1 2,906
Hawaii 3.1 2.6 - 3.6 1,502
Kauai 2.6 2.0 - 3.2 643
Maui 2.8 2.3 - 3.2 1,495
HONOLULU County
North Shore/Laie 2.8 1.4 - 4.2 88
Ka'a'wa/Kahalu'u/Kaneohe 2.1 1.2 - 3.1 213
Kailua/Waimanalo 2.2 1.3 - 3.2 238
Wailae/Kahala/HawaiiKai 1.6 0.9 - 2.3 173
Kaimuki/Palolo/Waikiki 2.5 1.6 - 3.5 281
Manoa/Upper Makiki 2.3 1.5 - 3.1 242
Ala Moana 3.6 2.3 - 4.8 155
Nuuanu/Kalihi/MoanaLoa 2.8 1.9 - 3.7 251
Salt Lake/Foster Village 2.9 1.3 - 4.6 123
Aiea/Pearl City 2.8 1.9 - 3.7 279
Mililani/Wahiawa 3.4 2.3 - 4.5 295
Waipahu/Kapolei/Ewa 3.1 2.3 - 3.9 442
Nanakuli/Waianae 3.8 2.1 - 5.5 126
HAWAII County
North Hawaii 3.2 2.2 - 4.1 315
Hilo 2.8 1.9 - 3.7 422
Puna/Ka'u 3.6 2.4 - 4.7 425
Kona 2.8 1.8 - 3.7 340
KAUAI County
Hanalei/Kapa'a 2.7 1.9 - 3.5 293
Lihue-Waimea 2.5 1.7 - 3.3 350
MAUI County
Lahaina/Wailuku 2.9 2.0 - 3.8 299
Kahului 2.9 2.0 - 3.7 334
Upcountry/Hana 2.7 2.0 - 3.4 382
Lanai 2.6 1.6 - 3.6 203
Molokai 2.2 1.4 - 2.9 277
The symbol '--' means cell size less than 50.95% C.I. = Confidence Interval at 95 percent probability level.
Means are weighted to population characteristics.

Number of days in the past 30 days, physical or mental health not goodState of Hawaii BRFSS 2007
Demographic Characteristics
None N % C.I.(95%)
1 to 6 days N % C.I.(95%)
7 to 13 days N % C.I.(95%)
14+ days N % C.I.(95%)
Total N
Estimated #of Adults
TOTAL 3,396 51.3 (49.6-53.0) 1,579 25.4 (23.9-26.9) 488 7.6 ( 6.7- 8.6) 1,085 15.7 (14.5-16.9) 6,548 979,779
AGE GROUP
18-24 Years 132 42.0 (35.3-49.0) 104 32.0 (26.1-38.6) 30 10.0 ( 6.3-15.3) 50 16.1 (11.6-21.8) 316 124,766
25-34 Years 334 48.3 (43.6-53.1) 201 27.9 (23.9-32.3) 63 8.1 ( 6.1-10.8) 112 15.7 (12.6-19.4) 710 159,333
35-44 Years 517 49.4 (45.6-53.2) 331 30.4 (26.9-34.0) 85 6.3 ( 4.8- 8.1) 161 14.0 (11.6-16.7) 1,094 174,346
45-54 Years 692 48.7 (45.3-52.1) 392 27.6 (24.7-30.7) 113 7.9 ( 6.3- 9.9) 259 15.8 (13.5-18.5) 1,456 184,649
55-64 Years 771 55.2 (51.6-58.7) 306 20.5 (17.8-23.6) 107 9.0 ( 7.1-11.4) 243 15.3 (12.9-17.9) 1,427 154,912
65+ Years 933 61.3 (58.1-64.5) 242 16.2 (13.9-18.7) 89 5.4 ( 4.2- 6.9) 256 17.1 (14.7-19.8) 1,520 177,789
Unknown/Refused - - - - -- -
GENDER
Male 1,457 53.7 (51.1-56.3) 613 25.3 (23.1-27.6) 181 6.6 ( 5.5- 8.0) 423 14.4 (12.6-16.3) 2,674 484,072
Female 1,939 49.0 (46.8-51.1) 966 25.6 (23.6-27.6) 307 8.6 ( 7.3-10.0) 662 16.9 (15.3-18.6) 3,874 495,707
ETHNICITY
White 1,348 49.4 (46.9-52.0) 696 27.7 (25.4-30.2) 188 6.9 ( 5.8- 8.3) 453 15.9 (14.1-18.0) 2,685 310,234
Hawaiian 448 49.1 (44.5-53.8) 209 27.2 (23.1-31.7) 74 7.3 ( 5.4- 9.8) 170 16.4 (13.4-19.8) 901 135,461
Filipino 461 50.9 (46.0-55.8) 195 23.1 (19.3-27.4) 74 10.2 ( 7.3-13.9) 139 15.8 (12.7-19.6) 869 172,576
Japanese 764 56.5 (53.0-60.0) 278 22.5 (19.6-25.7) 100 7.9 ( 6.1-10.0) 188 13.1 (11.0-15.5) 1,330 214,386
Others 362 50.1 (45.3-54.9) 193 25.5 (21.7-29.8) 51 6.1 ( 4.5- 8.4) 133 18.2 (14.6-22.5) 739 144,334
Unknown/Refused - - - - -- -
MARITAL STATUS
Married 2,024 53.8 (51.7-55.8) 907 25.4 (23.6-27.3) 265 7.0 ( 6.1- 8.0) 544 13.8 (12.5-15.3) 3,740 583,985
Unmarried 1,364 47.6 (44.6-50.6) 669 25.4 (23.0-28.1) 223 8.6 ( 7.0-10.5) 539 18.4 (16.2-20.8) 2,795 394,558
Unknown/Refused - - - - -- -
EDUCATION
<High School 161 50.1 (42.6-57.5) 61 17.9 (13.0-24.0) 25 4.4 ( 2.6- 7.2) 83 27.7 (21.4-35.1) 330 51,809
High School 957 50.9 (47.6-54.2) 392 22.5 (19.9-25.4) 140 7.3 ( 5.8- 9.2) 375 19.2 (16.7-22.0) 1,864 308,596
Some College 984 49.2 (46.0-52.4) 477 27.9 (25.1-30.9) 143 8.5 ( 6.7-10.6) 320 14.4 (12.5-16.6) 1,924 289,294
College 1,289 53.6 (51.0-56.2) 646 27.2 (24.8-29.6) 180 7.7 ( 6.4- 9.2) 307 11.5 (10.0-13.3) 2,422 328,699
Unknown/Refused - - - - -- -
EMPLOYMENT
Employed 2,106 51.9 (49.7-54.1) 1,102 28.3 (26.4-30.3) 302 7.4 ( 6.4- 8.5) 511 12.4 (11.0-13.9) 4,021 632,303
Unemployed - - - - - - - - - - - -
Student/Homemaker 200 41.3 (35.3-47.6) 128 28.7 (23.5-34.5) 44 12.9 ( 8.5-19.1) 86 17.1 (13.2-21.9) 458 89,815
Retired/Can't work 1,016 55.2 (52.2-58.2) 309 16.0 (13.9-18.4) 119 6.1 ( 4.9- 7.7) 440 22.6 (20.2-25.3) 1,884 225,010
Unknown/Refused - - - - -- -
HOUSEHOLD INCOME
<$15,000 191 38.9 (32.3-46.0) 88 21.1 (15.7-27.8) 48 7.3 ( 4.9-10.6) 160 32.7 (26.4-39.6) 487 58,103
$15,000-24,999 413 51.5 (46.6-56.5) 157 19.5 (15.9-23.6) 55 6.5 ( 4.5- 9.3) 193 22.5 (18.8-26.8) 818 103,140
$25,000-49,999 971 49.8 (46.6-53.0) 458 25.9 (23.2-28.9) 150 8.4 ( 6.6-10.5) 302 15.9 (13.6-18.5) 1,881 277,334
$50,000-74,999 566 50.4 (46.3-54.4) 308 30.4 (26.6-34.4) 89 8.1 ( 6.2-10.5) 136 11.2 ( 8.9-13.9) 1,099 169,368
>=$75,000 1,014 55.8 (52.8-58.8) 482 26.7 (24.1-29.5) 115 6.7 ( 5.4- 8.3) 206 10.8 ( 9.1-12.7) 1,817 285,858
Unknown/Refused 241 51.1 (44.3-57.7) 86 19.7 (14.9-25.6) 31 9.0 ( 5.7-14.1) 88 20.2 (15.3-26.3) 446 85,975
Percentages are weighted to population characteristics.N = Cell Sample Size, % = Percentage, 95% C.I. = Confidence Interval at 95 percent probability level
Rows with Sample Size less than 50 or containing half-width of 95% CI greater than 10 have been suppressed.
Number of days in the past 30 days, physical or mental health not goodState of Hawaii BRFSS 2007
GEOGRAPHIC AREAS None N % C.I.(95%)
1 to 6 days N % C.I.(95%)
7 to 13 days N % C.I.(95%)
14+ days N % C.I.(95%)
Total N
Estimated #of Adults
STATE 3,396 51.3 (49.6-53.0) 1,579 25.4 (23.9-26.9) 488 7.6 ( 6.7- 8.6) 1,085 15.7 (14.5-16.9) 6,548 979,779
COUNTY
Honolulu 1,525 51.3 (49.1-53.6) 731 26.0 (24.1-28.0) 208 7.5 ( 6.4- 8.8) 442 15.2 (13.6-16.9) 2,906 698,082
Hawaii 765 49.6 (46.4-52.8) 348 24.7 (22.0-27.7) 113 8.1 ( 6.6-10.0) 272 17.5 (15.3-20.1) 1,498 127,610
Kauai 324 49.7 (44.8-54.6) 154 25.4 (21.3-29.9) 56 8.7 ( 6.1-12.3) 113 16.2 (13.0-20.0) 647 46,857
Maui 782 53.9 (50.3-57.5) 346 22.6 (19.9-25.6) 111 7.2 ( 5.6- 9.2) 258 16.3 (13.8-19.0) 1,497 107,230
HONOLULU County
North Shore/Laie - - - - - - - - - - - -
Ka'a'wa/Kahalu'u/Kaneohe 120 53.0 (45.0-60.9) 47 24.1 (17.7-32.0) 18 8.8 ( 5.1-14.8) 28 14.0 ( 9.3-20.7) 213 49,491
Kailua/Waimanalo 129 55.7 (48.0-63.1) 67 26.9 (20.6-34.2) 11 3.9 ( 2.0- 7.4) 30 13.5 ( 8.9-19.9) 237 52,388
Wailae/Kahala/HawaiiKai 100 58.7 (50.1-66.8) 45 26.9 (19.9-35.2) 12 6.6 ( 3.6-11.6) 17 7.9 ( 4.8-12.8) 174 38,317
Kaimuki/Palolo/Waikiki 154 53.3 (46.0-60.4) 73 26.7 (20.8-33.5) 12 4.6 ( 2.5- 8.4) 41 15.4 (10.2-22.5) 280 55,623
Manoa/Upper Makiki 133 56.1 (48.7-63.2) 61 24.1 (18.7-30.6) 19 9.5 ( 5.5-15.8) 29 10.3 ( 6.8-15.2) 242 45,495
Ala Moana 75 44.7 (35.8-53.9) 31 20.1 (13.8-28.2) 12 8.9 ( 4.8-16.0) 38 26.4 (18.8-35.6) 156 29,128
Nuuanu/Kalihi/MoanaLoa 132 51.9 (44.1-59.7) 65 25.1 (19.2-32.1) 13 6.7 ( 3.1-14.1) 40 16.3 (11.5-22.5) 250 66,746
Salt Lake/Foster Village - - - - - - - - - - - -
Aiea/Pearl City 146 50.3 (43.1-57.5) 73 29.0 (22.7-36.1) 22 7.8 ( 5.0-12.1) 38 12.9 ( 9.0-18.2) 279 68,265
Mililani/Wahiawa 154 52.7 (46.0-59.2) 76 24.8 (19.7-30.7) 22 7.2 ( 4.5-11.4) 42 15.3 (11.1-20.9) 294 74,019
Waipahu/Kapolei/Ewa 227 48.3 (42.8-54.0) 103 26.4 (21.6-31.8) 38 8.2 ( 5.7-11.7) 76 17.1 (13.2-21.8) 444 128,457
Nanakuli/Waianae - - - - - - - - - - - -
HAWAII County
North Hawaii 172 51.1 (44.0-58.1) 57 21.7 (15.8-28.9) 25 8.5 ( 5.5-13.1) 59 18.7 (13.8-25.0) 313 28,053
Hilo 208 46.8 (41.2-52.5) 122 30.4 (25.2-36.1) 30 7.5 ( 5.0-11.0) 64 15.3 (11.7-19.9) 424 36,137
Puna/Ka'u 199 47.5 (41.4-53.6) 90 22.9 (18.1-28.5) 37 9.5 ( 6.5-13.6) 97 20.2 (15.8-25.5) 423 35,921
Kona 186 54.5 (47.8-61.1) 79 22.9 (17.6-29.3) 21 6.8 ( 4.2-11.0) 52 15.7 (11.6-21.0) 338 27,498
KAUAI County
Hanalei/Kapa'a 146 47.5 (40.3-54.8) 73 27.2 (21.1-34.4) 26 9.7 ( 5.7-16.1) 51 15.6 (11.4-20.9) 296 19,825
Lihue-Waimea 178 51.4 (44.8-58.0) 81 24.0 (18.8-30.1) 30 8.0 ( 4.9-12.6) 62 16.6 (12.3-22.1) 351 27,032
MAUI County
Lahaina/Wailuku 150 55.1 (47.4-62.5) 70 22.4 (16.8-29.1) 23 9.0 ( 5.6-14.3) 57 13.5 ( 9.9-18.3) 300 30,819
Kahului 175 51.5 (45.0-58.0) 79 23.0 (18.2-28.7) 19 6.1 ( 3.6-10.0) 61 19.4 (14.5-25.5) 334 32,371
Upcountry/Hana 201 55.4 (49.1-61.5) 88 22.0 (17.5-27.3) 25 5.8 ( 3.7- 9.1) 67 16.8 (12.5-22.1) 381 34,034
Lanai 108 50.5 (42.2-58.8) 48 23.4 (16.9-31.4) 16 10.6 ( 6.1-17.7) 33 15.5 (10.6-22.1) 205 1,857
Molokai 148 53.3 (46.0-60.5) 61 24.5 (18.6-31.5) 28 9.9 ( 6.2-15.3) 40 12.3 ( 8.7-17.3) 277 8,149
Percentages are weighted to population characteristics.N = Cell Sample Size, % = Percentage, 95% C.I. = Confidence Interval at 95 percent probability level
Rows with Sample Size less than 50 or containing half-width of 95% CI greater than 10 have been suppressed.
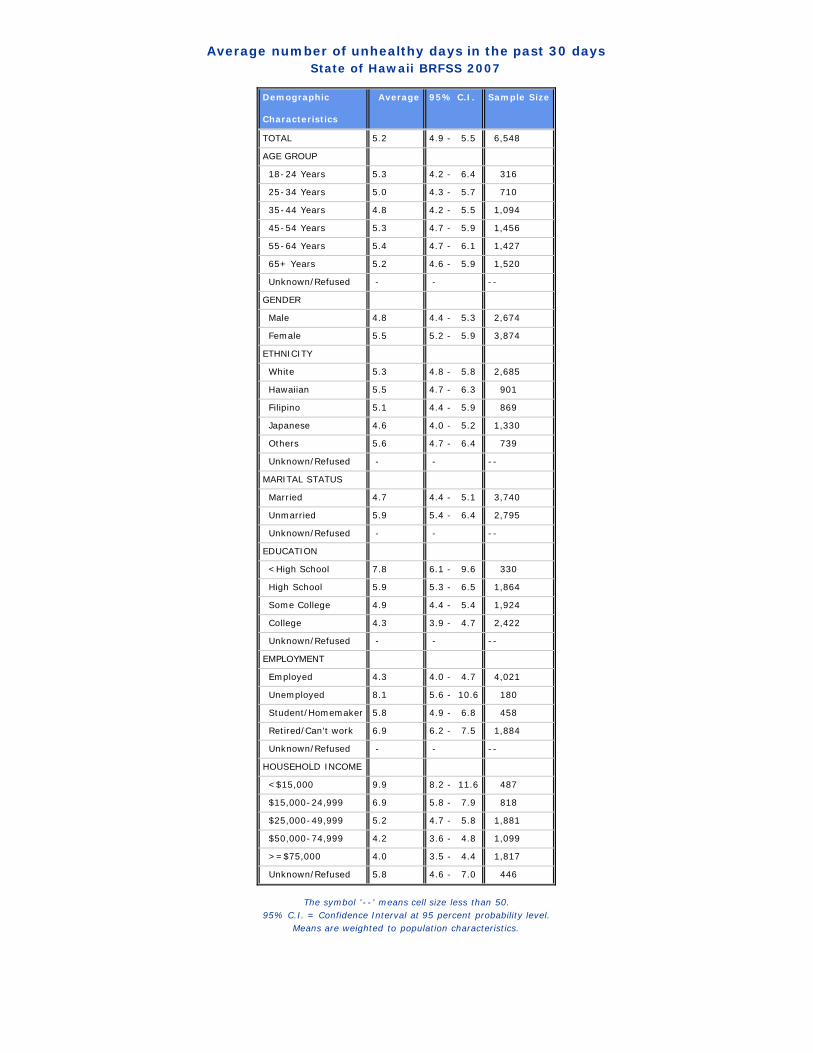
Average number of unhealthy days in the past 30 daysState of Hawaii BRFSS 2007
Demographic Characteristics
Average 95% C.I. Sample Size
TOTAL 5.2 4.9 - 5.5 6,548
AGE GROUP
18-24 Years 5.3 4.2 - 6.4 316
25-34 Years 5.0 4.3 - 5.7 710
35-44 Years 4.8 4.2 - 5.5 1,094
45-54 Years 5.3 4.7 - 5.9 1,456
55-64 Years 5.4 4.7 - 6.1 1,427
65+ Years 5.2 4.6 - 5.9 1,520
Unknown/Refused - - --
GENDER
Male 4.8 4.4 - 5.3 2,674
Female 5.5 5.2 - 5.9 3,874
ETHNICITY
White 5.3 4.8 - 5.8 2,685
Hawaiian 5.5 4.7 - 6.3 901
Filipino 5.1 4.4 - 5.9 869
Japanese 4.6 4.0 - 5.2 1,330
Others 5.6 4.7 - 6.4 739
Unknown/Refused - - --
MARITAL STATUS
Married 4.7 4.4 - 5.1 3,740
Unmarried 5.9 5.4 - 6.4 2,795
Unknown/Refused - - --
EDUCATION
<High School 7.8 6.1 - 9.6 330
High School 5.9 5.3 - 6.5 1,864
Some College 4.9 4.4 - 5.4 1,924
College 4.3 3.9 - 4.7 2,422
Unknown/Refused - - --
EMPLOYMENT
Employed 4.3 4.0 - 4.7 4,021
Unemployed 8.1 5.6 - 10.6 180
Student/Homemaker 5.8 4.9 - 6.8 458
Retired/Can't work 6.9 6.2 - 7.5 1,884
Unknown/Refused - - --
HOUSEHOLD INCOME
<$15,000 9.9 8.2 - 11.6 487
$15,000-24,999 6.9 5.8 - 7.9 818
$25,000-49,999 5.2 4.7 - 5.8 1,881
$50,000-74,999 4.2 3.6 - 4.8 1,099
>=$75,000 4.0 3.5 - 4.4 1,817
Unknown/Refused 5.8 4.6 - 7.0 446
The symbol '--' means cell size less than 50.95% C.I. = Confidence Interval at 95 percent probability level.
Means are weighted to population characteristics.
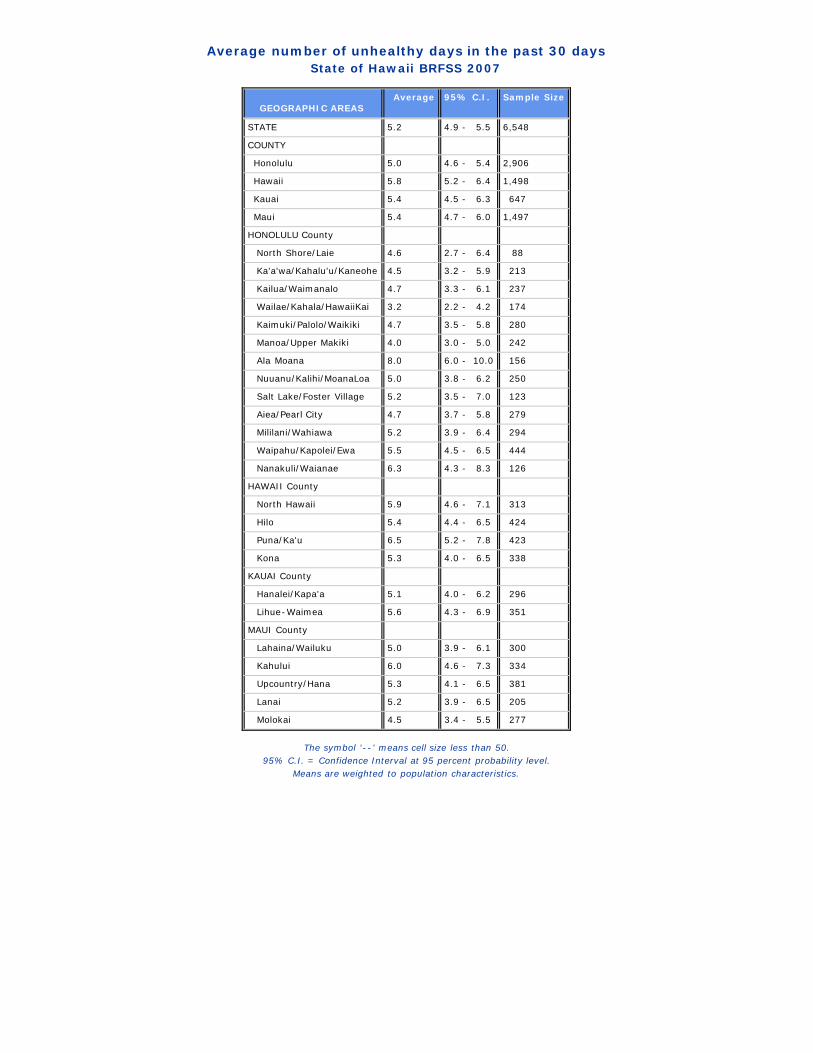
Average number of unhealthy days in the past 30 daysState of Hawaii BRFSS 2007
GEOGRAPHIC AREAS Average 95% C.I. Sample Size
STATE 5.2 4.9 - 5.5 6,548
COUNTY
Honolulu 5.0 4.6 - 5.4 2,906
Hawaii 5.8 5.2 - 6.4 1,498
Kauai 5.4 4.5 - 6.3 647
Maui 5.4 4.7 - 6.0 1,497
HONOLULU County
North Shore/Laie 4.6 2.7 - 6.4 88
Ka'a'wa/Kahalu'u/Kaneohe 4.5 3.2 - 5.9 213
Kailua/Waimanalo 4.7 3.3 - 6.1 237
Wailae/Kahala/HawaiiKai 3.2 2.2 - 4.2 174
Kaimuki/Palolo/Waikiki 4.7 3.5 - 5.8 280
Manoa/Upper Makiki 4.0 3.0 - 5.0 242
Ala Moana 8.0 6.0 - 10.0 156
Nuuanu/Kalihi/MoanaLoa 5.0 3.8 - 6.2 250
Salt Lake/Foster Village 5.2 3.5 - 7.0 123
Aiea/Pearl City 4.7 3.7 - 5.8 279
Mililani/Wahiawa 5.2 3.9 - 6.4 294
Waipahu/Kapolei/Ewa 5.5 4.5 - 6.5 444
Nanakuli/Waianae 6.3 4.3 - 8.3 126
HAWAII County
North Hawaii 5.9 4.6 - 7.1 313
Hilo 5.4 4.4 - 6.5 424
Puna/Ka'u 6.5 5.2 - 7.8 423
Kona 5.3 4.0 - 6.5 338
KAUAI County
Hanalei/Kapa'a 5.1 4.0 - 6.2 296
Lihue-Waimea 5.6 4.3 - 6.9 351
MAUI County
Lahaina/Wailuku 5.0 3.9 - 6.1 300
Kahului 6.0 4.6 - 7.3 334
Upcountry/Hana 5.3 4.1 - 6.5 381
Lanai 5.2 3.9 - 6.5 205
Molokai 4.5 3.4 - 5.5 277
The symbol '--' means cell size less than 50.95% C.I. = Confidence Interval at 95 percent probability level.
Means are weighted to population characteristics.

Number of days in the past 30 days, poor health keeps you from doing usual activitiesState of Hawaii BRFSS 2007
Demographic Characteristics
None N % C.I.(95%)
1 to 6 days N % C.I.(95%)
7 to 13 days N % C.I.(95%)
14+ days N % C.I.(95%)
Total N
Estimated numberof Adults
TOTAL 5,241 81.3 (80.0-82.6) 743 11.3 (10.3-12.4) 177 2.4 ( 2.0- 3.0) 413 4.9 ( 4.3- 5.6) 6,574 984,291
AGE GROUP
18-24 Years 245 78.8 (72.9-83.7) 50 15.7 (11.4-21.3) 8 2.3 ( 1.0- 5.4) 16 3.1 ( 1.8- 5.4) 319 125,816
25-34 Years 558 80.7 (76.9-84.0) 99 13.3 (10.5-16.8) 23 2.7 ( 1.6- 4.4) 30 3.3 ( 2.2- 5.1) 710 160,051
35-44 Years 859 81.0 (78.0-83.6) 165 13.4 (11.1-16.0) 26 1.7 ( 1.1- 2.6) 48 4.0 ( 2.8- 5.6) 1,098 175,127
45-54 Years 1,115 79.3 (76.5-81.9) 194 12.6 (10.5-15.1) 44 2.2 ( 1.5- 3.4) 108 5.8 ( 4.4- 7.5) 1,461 185,177
55-64 Years 1,147 82.7 (80.0-85.1) 144 9.1 ( 7.3-11.2) 32 2.0 ( 1.3- 3.2) 108 6.2 ( 4.7- 8.1) 1,431 155,177
65+ Years 1,294 84.7 (82.2-86.9) 90 5.1 ( 3.9- 6.7) 44 3.7 ( 2.5- 5.3) 103 6.6 ( 5.2- 8.4) 1,531 179,002
Unknown/Refused - - - - -- -
GENDER
Male 2,179 82.7 (80.7-84.6) 269 10.3 ( 8.8-12.1) 67 2.2 ( 1.6- 3.1) 169 4.7 ( 3.8- 5.7) 2,684 486,304
Female 3,062 80.0 (78.2-81.6) 474 12.3 (10.9-13.8) 110 2.6 ( 2.0- 3.4) 244 5.1 ( 4.3- 6.0) 3,890 497,987
ETHNICITY
White 2,097 80.1 (78.0-82.1) 342 12.7 (11.1-14.6) 82 2.7 ( 2.0- 3.7) 175 4.4 ( 3.6- 5.4) 2,696 311,616
Hawaiian 706 81.6 (78.2-84.6) 102 10.7 ( 8.4-13.7) 30 2.6 ( 1.7- 4.0) 64 5.0 ( 3.6- 6.9) 902 135,556
Filipino 720 81.7 (77.6-85.1) 91 12.1 ( 9.2-15.8) 14 1.4 ( 0.7- 2.8) 47 4.8 ( 3.3- 6.9) 872 173,210
Japanese 1,112 83.6 (80.8-86.1) 120 9.1 ( 7.2-11.4) 32 2.6 ( 1.6- 4.1) 70 4.7 ( 3.5- 6.2) 1,334 214,871
Others 585 79.7 (75.8-83.1) 85 11.2 ( 8.6-14.4) 19 2.7 ( 1.6- 4.5) 57 6.4 ( 4.6- 8.9) 746 146,250
Unknown/Refused - - - - -- -
MARITAL STATUS
Married 3,068 83.0 (81.4-84.4) 405 10.3 ( 9.2-11.6) 89 2.2 ( 1.7- 2.8) 184 4.5 ( 3.8- 5.4) 3,746 585,085
Unmarried 2,162 78.9 (76.5-81.1) 337 12.8 (10.9-14.9) 88 2.8 ( 2.1- 3.9) 228 5.5 ( 4.5- 6.6) 2,815 397,969
Unknown/Refused - - - - -- -
EDUCATION
<High School 256 76.2 (69.6-81.7) 31 9.3 ( 5.8-14.5) 13 4.6 ( 2.4- 8.8) 37 9.9 ( 6.7-14.5) 337 52,735
High School 1,471 81.3 (78.8-83.6) 192 9.8 ( 8.0-11.8) 60 2.8 ( 2.0- 4.1) 147 6.1 ( 4.9- 7.5) 1,870 309,953
Some College 1,547 80.7 (78.1-83.1) 223 13.1 (11.0-15.6) 32 1.4 ( 0.9- 2.2) 128 4.8 ( 3.8- 6.0) 1,930 289,521
College 1,959 82.7 (80.7-84.6) 296 11.5 ( 9.9-13.2) 72 2.6 ( 2.0- 3.6) 101 3.2 ( 2.4- 4.2) 2,428 330,448
Unknown/Refused - - - - -- -
EMPLOYMENT
Employed 3,306 83.1 (81.5-84.6) 507 12.1 (10.8-13.6) 90 1.9 ( 1.4- 2.5) 134 2.9 ( 2.3- 3.6) 4,037 635,325
Unemployed - - - - - - - - - - - -
Student/Homemaker 354 79.7 (74.7-83.9) 65 13.7 (10.2-18.1) 13 2.8 ( 1.3- 6.0) 29 3.9 ( 2.5- 6.0) 461 90,358
Retired/Can't work 1,460 79.0 (76.5-81.4) 144 7.1 ( 5.6- 8.9) 68 4.0 ( 2.9- 5.4) 219 9.9 ( 8.3-11.8) 1,891 225,958
Unknown/Refused - - - - -- -
HOUSEHOLD INCOME
<$15,000 309 64.2 (57.1-70.8) 53 14.0 ( 9.1-20.9) 26 3.8 ( 2.3- 6.3) 97 17.9 (13.3-23.6) 485 57,941
$15,000-24,999 625 77.1 (72.9-80.8) 98 11.8 ( 9.1-15.2) 24 2.3 ( 1.3- 3.9) 80 8.8 ( 6.6-11.8) 827 103,868
$25,000-49,999 1,511 80.3 (77.7-82.7) 228 12.8 (10.7-15.1) 48 2.8 ( 1.9- 4.1) 105 4.1 ( 3.2- 5.4) 1,892 279,504
$50,000-74,999 894 82.9 (79.7-85.7) 139 12.4 ( 9.9-15.5) 24 1.5 ( 0.9- 2.4) 44 3.2 ( 2.2- 4.6) 1,101 169,516
>=$75,000 1,533 85.8 (83.7-87.7) 188 9.5 ( 7.9-11.3) 36 1.6 ( 1.1- 2.5) 62 3.0 ( 2.2- 4.1) 1,819 286,447
Unknown/Refused 369 83.2 (78.0-87.3) 37 8.0 ( 5.2-12.3) 19 5.0 ( 2.8- 8.8) 25 3.8 ( 2.4- 5.9) 450 87,015
Percentages are weighted to population characteristics.N = Cell Sample Size, % = Percentage, 95% C.I. = Confidence Interval at 95 percent probability level
Rows with Sample Size less than 50 or containing half-width of 95% CI greater than 10 have been suppressed.

Number of days in the past 30 days, poor health keeps you from doing usual activitiesState of Hawaii BRFSS 2007
GEOGRAPHIC AREAS None N % C.I.(95%)
1 to 6 days N % C.I.(95%)
7 to 13 days N % C.I.(95%)
14+ days N % C.I.(95%)
Total N
Estimatednumberof Adults
STATE 5,241 81.3 (80.0-82.6) 743 11.3 (10.3-12.4) 177 2.4 ( 2.0- 3.0) 413 4.9 ( 4.3- 5.6) 6,574 984,291
COUNTY
Honolulu 2,397 82.5 (80.8-84.1) 309 11.0 ( 9.6-12.5) 74 2.3 ( 1.8- 3.1) 139 4.2 ( 3.5- 5.0) 2,919 701,748
Hawaii 1,169 76.7 (73.7-79.4) 180 12.8 (10.7-15.3) 44 3.2 ( 2.2- 4.6) 113 7.4 ( 5.8- 9.3) 1,506 128,367
Kauai 509 80.6 (76.5-84.1) 79 11.2 ( 8.6-14.3) 15 1.6 ( 0.9- 2.9) 44 6.7 ( 4.5- 9.8) 647 46,755
Maui 1,166 79.7 (76.8-82.2) 175 11.8 ( 9.7-14.2) 44 2.6 ( 1.7- 3.8) 117 6.0 ( 4.8- 7.6) 1,502 107,422
HONOLULU County
North Shore/Laie - - - - - - - - - - - -
Ka'a'wa/Kahalu'u/Kaneohe 184 85.2 (78.7-89.9) 14 7.0 ( 4.0-12.0) 9 4.6 ( 2.0-10.0) 8 3.3 ( 1.5- 6.9) 215 49,695
Kailua/Waimanalo 195 83.1 (76.9-87.9) 31 11.9 ( 7.8-17.6) 3 1.4 ( 0.4- 5.1) 10 3.6 ( 1.9- 6.7) 239 52,739
Wailae/Kahala/HawaiiKai 146 83.3 (75.8-88.8) 18 11.5 ( 6.9-18.7) 4 2.1 ( 0.7- 5.9) 7 3.0 ( 1.3- 6.9) 175 38,570
Kaimuki/Palolo/Waikiki 239 84.7 (79.0-89.1) 25 10.3 ( 6.6-15.7) 8 1.7 ( 0.8- 3.5) 9 3.3 ( 1.6- 6.6) 281 55,903
Manoa/Upper Makiki 207 86.0 (79.7-90.5) 20 7.8 ( 4.9-12.3) 8 4.1 ( 1.6-10.4) 6 2.1 ( 0.8- 5.0) 241 45,365
Ala Moana 121 75.6 (66.6-82.9) 17 9.2 ( 5.5-15.2) 7 7.4 ( 3.2-16.3) 11 7.7 ( 4.1-14.2) 156 29,128
Nuuanu/Kalihi/MoanaLoa 207 81.6 (75.0-86.8) 27 10.8 ( 6.9-16.7) 5 2.1 ( 0.9- 4.9) 13 5.5 ( 3.0-10.1) 252 67,173
Salt Lake/Foster Village 103 85.0 (75.3-91.3) 11 10.2 ( 4.9-20.1) 2 0.9 ( 0.2- 3.5) 7 4.0 ( 1.7- 9.0) 123 28,663
Aiea/Pearl City 231 84.9 (79.8-89.0) 32 10.7 ( 7.2-15.4) 6 1.5 ( 0.6- 3.6) 12 2.9 ( 1.5- 5.4) 281 69,051
Mililani/Wahiawa 248 85.3 (80.2-89.2) 29 8.8 ( 5.8-13.0) 7 2.2 ( 1.0- 4.9) 11 3.7 ( 1.9- 7.0) 295 73,953
Waipahu/Kapolei/Ewa 357 79.5 (74.6-83.7) 55 14.1 (10.5-18.7) 7 1.2 ( 0.5- 2.7) 27 5.2 ( 3.4- 7.8) 446 129,523
Nanakuli/Waianae 94 79.5 (69.6-86.8) 17 12.5 ( 6.6-22.4) 5 2.7 ( 1.1- 6.6) 10 5.3 ( 2.6-10.5) 126 39,503
HAWAII County
North Hawaii 245 76.2 (69.0-82.2) 37 11.9 ( 7.6-18.2) 9 2.9 ( 1.2- 7.0) 25 9.0 ( 5.4-14.6) 316 28,437
Hilo 343 79.3 (73.7-84.0) 45 12.4 ( 8.6-17.7) 12 3.2 ( 1.5- 6.5) 23 5.1 ( 3.1- 8.1) 423 35,990
Puna/Ka'u 300 70.1 (64.2-75.4) 59 15.0 (11.2-19.8) 16 4.0 ( 2.1- 7.2) 51 10.9 ( 7.6-15.5) 426 36,135
Kona 281 82.2 (76.0-87.0) 39 11.4 ( 7.4-17.0) 7 2.4 ( 1.0- 5.9) 14 4.0 ( 2.1- 7.7) 341 27,806
KAUAI County
Hanalei/Kapa'a 227 78.4 (72.3-83.5) 42 14.6 (10.3-20.4) 8 1.7 ( 0.8- 3.8) 20 5.2 ( 3.1- 8.6) 297 19,706
Lihue-Waimea 282 82.1 (76.5-86.7) 37 8.6 ( 5.9-12.5) 7 1.5 ( 0.7- 3.5) 24 7.7 ( 4.5-12.9) 350 27,048
MAUI County
Lahaina/Wailuku 220 79.2 (73.3-84.2) 40 11.9 ( 8.1-17.1) 13 2.9 ( 1.6- 5.4) 26 6.0 ( 3.7- 9.5) 299 30,767
Kahului 266 78.3 (72.3-83.3) 42 14.2 (10.1-19.8) 8 2.7 ( 1.1- 6.2) 19 4.8 ( 2.9- 7.9) 335 32,286
Upcountry/Hana 300 80.9 (76.0-84.9) 43 10.1 ( 7.1-14.1) 10 2.1 ( 1.0- 4.4) 32 6.9 ( 4.6-10.2) 385 34,331
Lanai 163 78.5 (70.9-84.5) 21 11.0 ( 6.7-17.5) 6 3.0 ( 1.2- 7.1) 16 7.6 ( 4.2-13.2) 206 1,889
Molokai 217 81.7 (76.0-86.4) 29 8.7 ( 5.6-13.3) 7 2.6 ( 1.0- 6.2) 24 7.0 ( 4.5-10.9) 277 8,149
Percentages are weighted to population characteristics.N = Cell Sample Size, % = Percentage, 95% C.I. = Confidence Interval at 95 percent probability level
Rows with Sample Size less than 50 or containing half-width of 95% CI greater than 10 have been suppressed.
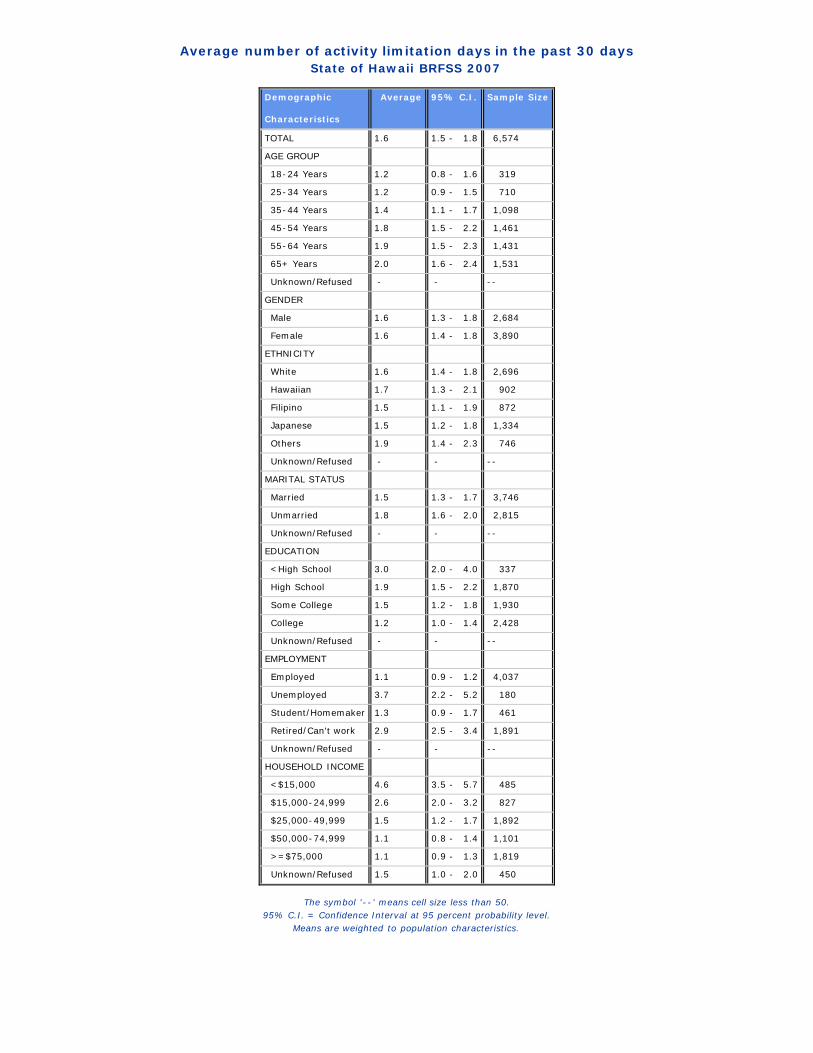
Average number of activity limitation days in the past 30 daysState of Hawaii BRFSS 2007
Demographic Characteristics
Average 95% C.I. Sample Size
TOTAL 1.6 1.5 - 1.8 6,574
AGE GROUP
18-24 Years 1.2 0.8 - 1.6 319
25-34 Years 1.2 0.9 - 1.5 710
35-44 Years 1.4 1.1 - 1.7 1,098
45-54 Years 1.8 1.5 - 2.2 1,461
55-64 Years 1.9 1.5 - 2.3 1,431
65+ Years 2.0 1.6 - 2.4 1,531
Unknown/Refused - - --
GENDER
Male 1.6 1.3 - 1.8 2,684
Female 1.6 1.4 - 1.8 3,890
ETHNICITY
White 1.6 1.4 - 1.8 2,696
Hawaiian 1.7 1.3 - 2.1 902
Filipino 1.5 1.1 - 1.9 872
Japanese 1.5 1.2 - 1.8 1,334
Others 1.9 1.4 - 2.3 746
Unknown/Refused - - --
MARITAL STATUS
Married 1.5 1.3 - 1.7 3,746
Unmarried 1.8 1.6 - 2.0 2,815
Unknown/Refused - - --
EDUCATION
<High School 3.0 2.0 - 4.0 337
High School 1.9 1.5 - 2.2 1,870
Some College 1.5 1.2 - 1.8 1,930
College 1.2 1.0 - 1.4 2,428
Unknown/Refused - - --
EMPLOYMENT
Employed 1.1 0.9 - 1.2 4,037
Unemployed 3.7 2.2 - 5.2 180
Student/Homemaker 1.3 0.9 - 1.7 461
Retired/Can't work 2.9 2.5 - 3.4 1,891
Unknown/Refused - - --
HOUSEHOLD INCOME
<$15,000 4.6 3.5 - 5.7 485
$15,000-24,999 2.6 2.0 - 3.2 827
$25,000-49,999 1.5 1.2 - 1.7 1,892
$50,000-74,999 1.1 0.8 - 1.4 1,101
>=$75,000 1.1 0.9 - 1.3 1,819
Unknown/Refused 1.5 1.0 - 2.0 450
The symbol '--' means cell size less than 50.95% C.I. = Confidence Interval at 95 percent probability level.
Means are weighted to population characteristics.
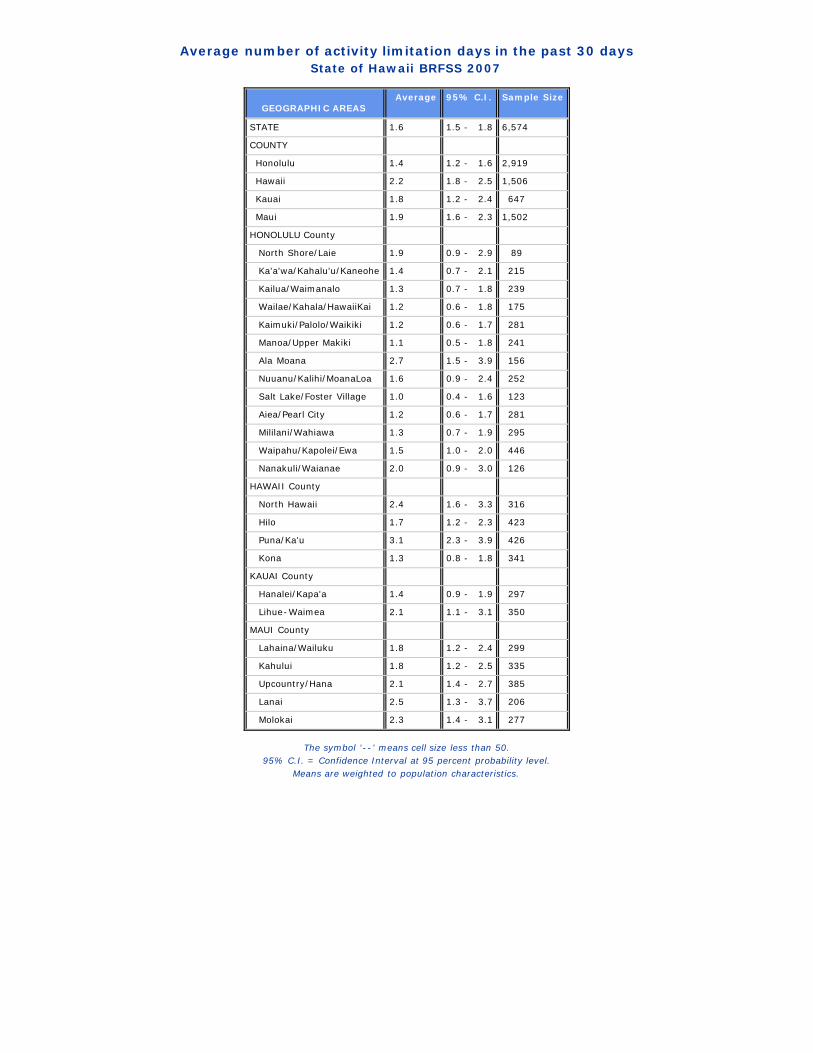
Average number of activity limitation days in the past 30 daysState of Hawaii BRFSS 2007
GEOGRAPHIC AREAS Average 95% C.I. Sample Size
STATE 1.6 1.5 - 1.8 6,574
COUNTY
Honolulu 1.4 1.2 - 1.6 2,919
Hawaii 2.2 1.8 - 2.5 1,506
Kauai 1.8 1.2 - 2.4 647
Maui 1.9 1.6 - 2.3 1,502
HONOLULU County
North Shore/Laie 1.9 0.9 - 2.9 89
Ka'a'wa/Kahalu'u/Kaneohe 1.4 0.7 - 2.1 215
Kailua/Waimanalo 1.3 0.7 - 1.8 239
Wailae/Kahala/HawaiiKai 1.2 0.6 - 1.8 175
Kaimuki/Palolo/Waikiki 1.2 0.6 - 1.7 281
Manoa/Upper Makiki 1.1 0.5 - 1.8 241
Ala Moana 2.7 1.5 - 3.9 156
Nuuanu/Kalihi/MoanaLoa 1.6 0.9 - 2.4 252
Salt Lake/Foster Village 1.0 0.4 - 1.6 123
Aiea/Pearl City 1.2 0.6 - 1.7 281
Mililani/Wahiawa 1.3 0.7 - 1.9 295
Waipahu/Kapolei/Ewa 1.5 1.0 - 2.0 446
Nanakuli/Waianae 2.0 0.9 - 3.0 126
HAWAII County
North Hawaii 2.4 1.6 - 3.3 316
Hilo 1.7 1.2 - 2.3 423
Puna/Ka'u 3.1 2.3 - 3.9 426
Kona 1.3 0.8 - 1.8 341
KAUAI County
Hanalei/Kapa'a 1.4 0.9 - 1.9 297
Lihue-Waimea 2.1 1.1 - 3.1 350
MAUI County
Lahaina/Wailuku 1.8 1.2 - 2.4 299
Kahului 1.8 1.2 - 2.5 335
Upcountry/Hana 2.1 1.4 - 2.7 385
Lanai 2.5 1.3 - 3.7 206
Molokai 2.3 1.4 - 3.1 277
The symbol '--' means cell size less than 50.95% C.I. = Confidence Interval at 95 percent probability level.
Means are weighted to population characteristics.
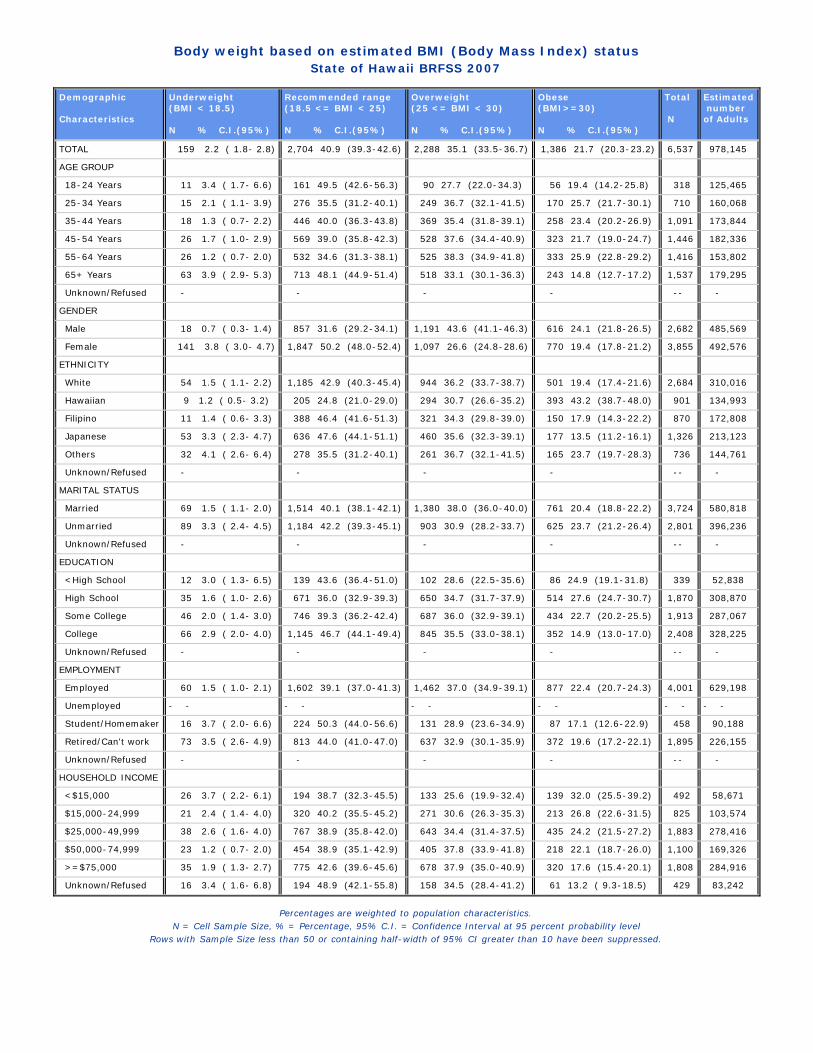
Body weight based on estimated BMI (Body Mass Index) statusState of Hawaii BRFSS 2007
Demographic Characteristics
Underweight(BMI < 18.5) N % C.I.(95%)
Recommended range(18.5 <= BMI < 25) N % C.I.(95%)
Overweight(25 <= BMI < 30) N % C.I.(95%)
Obese(BMI>=30) N % C.I.(95%)
Total N
Estimated numberof Adults
TOTAL 159 2.2 ( 1.8- 2.8) 2,704 40.9 (39.3-42.6) 2,288 35.1 (33.5-36.7) 1,386 21.7 (20.3-23.2) 6,537 978,145
AGE GROUP
18-24 Years 11 3.4 ( 1.7- 6.6) 161 49.5 (42.6-56.3) 90 27.7 (22.0-34.3) 56 19.4 (14.2-25.8) 318 125,465
25-34 Years 15 2.1 ( 1.1- 3.9) 276 35.5 (31.2-40.1) 249 36.7 (32.1-41.5) 170 25.7 (21.7-30.1) 710 160,068
35-44 Years 18 1.3 ( 0.7- 2.2) 446 40.0 (36.3-43.8) 369 35.4 (31.8-39.1) 258 23.4 (20.2-26.9) 1,091 173,844
45-54 Years 26 1.7 ( 1.0- 2.9) 569 39.0 (35.8-42.3) 528 37.6 (34.4-40.9) 323 21.7 (19.0-24.7) 1,446 182,336
55-64 Years 26 1.2 ( 0.7- 2.0) 532 34.6 (31.3-38.1) 525 38.3 (34.9-41.8) 333 25.9 (22.8-29.2) 1,416 153,802
65+ Years 63 3.9 ( 2.9- 5.3) 713 48.1 (44.9-51.4) 518 33.1 (30.1-36.3) 243 14.8 (12.7-17.2) 1,537 179,295
Unknown/Refused - - - - -- -
GENDER
Male 18 0.7 ( 0.3- 1.4) 857 31.6 (29.2-34.1) 1,191 43.6 (41.1-46.3) 616 24.1 (21.8-26.5) 2,682 485,569
Female 141 3.8 ( 3.0- 4.7) 1,847 50.2 (48.0-52.4) 1,097 26.6 (24.8-28.6) 770 19.4 (17.8-21.2) 3,855 492,576
ETHNICITY
White 54 1.5 ( 1.1- 2.2) 1,185 42.9 (40.3-45.4) 944 36.2 (33.7-38.7) 501 19.4 (17.4-21.6) 2,684 310,016
Hawaiian 9 1.2 ( 0.5- 3.2) 205 24.8 (21.0-29.0) 294 30.7 (26.6-35.2) 393 43.2 (38.7-48.0) 901 134,993
Filipino 11 1.4 ( 0.6- 3.3) 388 46.4 (41.6-51.3) 321 34.3 (29.8-39.0) 150 17.9 (14.3-22.2) 870 172,808
Japanese 53 3.3 ( 2.3- 4.7) 636 47.6 (44.1-51.1) 460 35.6 (32.3-39.1) 177 13.5 (11.2-16.1) 1,326 213,123
Others 32 4.1 ( 2.6- 6.4) 278 35.5 (31.2-40.1) 261 36.7 (32.1-41.5) 165 23.7 (19.7-28.3) 736 144,761
Unknown/Refused - - - - -- -
MARITAL STATUS
Married 69 1.5 ( 1.1- 2.0) 1,514 40.1 (38.1-42.1) 1,380 38.0 (36.0-40.0) 761 20.4 (18.8-22.2) 3,724 580,818
Unmarried 89 3.3 ( 2.4- 4.5) 1,184 42.2 (39.3-45.1) 903 30.9 (28.2-33.7) 625 23.7 (21.2-26.4) 2,801 396,236
Unknown/Refused - - - - -- -
EDUCATION
<High School 12 3.0 ( 1.3- 6.5) 139 43.6 (36.4-51.0) 102 28.6 (22.5-35.6) 86 24.9 (19.1-31.8) 339 52,838
High School 35 1.6 ( 1.0- 2.6) 671 36.0 (32.9-39.3) 650 34.7 (31.7-37.9) 514 27.6 (24.7-30.7) 1,870 308,870
Some College 46 2.0 ( 1.4- 3.0) 746 39.3 (36.2-42.4) 687 36.0 (32.9-39.1) 434 22.7 (20.2-25.5) 1,913 287,067
College 66 2.9 ( 2.0- 4.0) 1,145 46.7 (44.1-49.4) 845 35.5 (33.0-38.1) 352 14.9 (13.0-17.0) 2,408 328,225
Unknown/Refused - - - - -- -
EMPLOYMENT
Employed 60 1.5 ( 1.0- 2.1) 1,602 39.1 (37.0-41.3) 1,462 37.0 (34.9-39.1) 877 22.4 (20.7-24.3) 4,001 629,198
Unemployed - - - - - - - - - - - -
Student/Homemaker 16 3.7 ( 2.0- 6.6) 224 50.3 (44.0-56.6) 131 28.9 (23.6-34.9) 87 17.1 (12.6-22.9) 458 90,188
Retired/Can't work 73 3.5 ( 2.6- 4.9) 813 44.0 (41.0-47.0) 637 32.9 (30.1-35.9) 372 19.6 (17.2-22.1) 1,895 226,155
Unknown/Refused - - - - -- -
HOUSEHOLD INCOME
<$15,000 26 3.7 ( 2.2- 6.1) 194 38.7 (32.3-45.5) 133 25.6 (19.9-32.4) 139 32.0 (25.5-39.2) 492 58,671
$15,000-24,999 21 2.4 ( 1.4- 4.0) 320 40.2 (35.5-45.2) 271 30.6 (26.3-35.3) 213 26.8 (22.6-31.5) 825 103,574
$25,000-49,999 38 2.6 ( 1.6- 4.0) 767 38.9 (35.8-42.0) 643 34.4 (31.4-37.5) 435 24.2 (21.5-27.2) 1,883 278,416
$50,000-74,999 23 1.2 ( 0.7- 2.0) 454 38.9 (35.1-42.9) 405 37.8 (33.9-41.8) 218 22.1 (18.7-26.0) 1,100 169,326
>=$75,000 35 1.9 ( 1.3- 2.7) 775 42.6 (39.6-45.6) 678 37.9 (35.0-40.9) 320 17.6 (15.4-20.1) 1,808 284,916
Unknown/Refused 16 3.4 ( 1.6- 6.8) 194 48.9 (42.1-55.8) 158 34.5 (28.4-41.2) 61 13.2 ( 9.3-18.5) 429 83,242
Percentages are weighted to population characteristics.N = Cell Sample Size, % = Percentage, 95% C.I. = Confidence Interval at 95 percent probability level
Rows with Sample Size less than 50 or containing half-width of 95% CI greater than 10 have been suppressed.
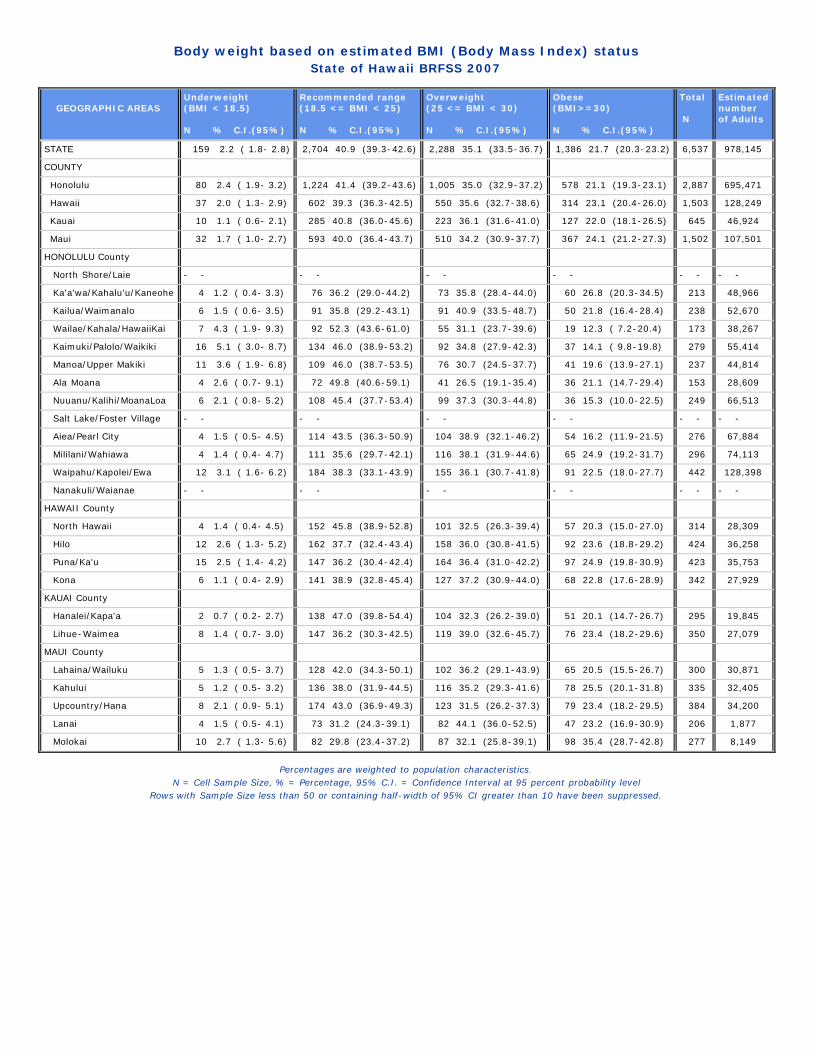
Body weight based on estimated BMI (Body Mass Index) statusState of Hawaii BRFSS 2007
GEOGRAPHIC AREAS Underweight(BMI < 18.5) N % C.I.(95%)
Recommended range(18.5 <= BMI < 25) N % C.I.(95%)
Overweight(25 <= BMI < 30) N % C.I.(95%)
Obese(BMI>=30) N % C.I.(95%)
Total N
Estimatednumberof Adults
STATE 159 2.2 ( 1.8- 2.8) 2,704 40.9 (39.3-42.6) 2,288 35.1 (33.5-36.7) 1,386 21.7 (20.3-23.2) 6,537 978,145
COUNTY
Honolulu 80 2.4 ( 1.9- 3.2) 1,224 41.4 (39.2-43.6) 1,005 35.0 (32.9-37.2) 578 21.1 (19.3-23.1) 2,887 695,471
Hawaii 37 2.0 ( 1.3- 2.9) 602 39.3 (36.3-42.5) 550 35.6 (32.7-38.6) 314 23.1 (20.4-26.0) 1,503 128,249
Kauai 10 1.1 ( 0.6- 2.1) 285 40.8 (36.0-45.6) 223 36.1 (31.6-41.0) 127 22.0 (18.1-26.5) 645 46,924
Maui 32 1.7 ( 1.0- 2.7) 593 40.0 (36.4-43.7) 510 34.2 (30.9-37.7) 367 24.1 (21.2-27.3) 1,502 107,501
HONOLULU County
North Shore/Laie - - - - - - - - - - - -
Ka'a'wa/Kahalu'u/Kaneohe 4 1.2 ( 0.4- 3.3) 76 36.2 (29.0-44.2) 73 35.8 (28.4-44.0) 60 26.8 (20.3-34.5) 213 48,966
Kailua/Waimanalo 6 1.5 ( 0.6- 3.5) 91 35.8 (29.2-43.1) 91 40.9 (33.5-48.7) 50 21.8 (16.4-28.4) 238 52,670
Wailae/Kahala/HawaiiKai 7 4.3 ( 1.9- 9.3) 92 52.3 (43.6-61.0) 55 31.1 (23.7-39.6) 19 12.3 ( 7.2-20.4) 173 38,267
Kaimuki/Palolo/Waikiki 16 5.1 ( 3.0- 8.7) 134 46.0 (38.9-53.2) 92 34.8 (27.9-42.3) 37 14.1 ( 9.8-19.8) 279 55,414
Manoa/Upper Makiki 11 3.6 ( 1.9- 6.8) 109 46.0 (38.7-53.5) 76 30.7 (24.5-37.7) 41 19.6 (13.9-27.1) 237 44,814
Ala Moana 4 2.6 ( 0.7- 9.1) 72 49.8 (40.6-59.1) 41 26.5 (19.1-35.4) 36 21.1 (14.7-29.4) 153 28,609
Nuuanu/Kalihi/MoanaLoa 6 2.1 ( 0.8- 5.2) 108 45.4 (37.7-53.4) 99 37.3 (30.3-44.8) 36 15.3 (10.0-22.5) 249 66,513
Salt Lake/Foster Village - - - - - - - - - - - -
Aiea/Pearl City 4 1.5 ( 0.5- 4.5) 114 43.5 (36.3-50.9) 104 38.9 (32.1-46.2) 54 16.2 (11.9-21.5) 276 67,884
Mililani/Wahiawa 4 1.4 ( 0.4- 4.7) 111 35.6 (29.7-42.1) 116 38.1 (31.9-44.6) 65 24.9 (19.2-31.7) 296 74,113
Waipahu/Kapolei/Ewa 12 3.1 ( 1.6- 6.2) 184 38.3 (33.1-43.9) 155 36.1 (30.7-41.8) 91 22.5 (18.0-27.7) 442 128,398
Nanakuli/Waianae - - - - - - - - - - - -
HAWAII County
North Hawaii 4 1.4 ( 0.4- 4.5) 152 45.8 (38.9-52.8) 101 32.5 (26.3-39.4) 57 20.3 (15.0-27.0) 314 28,309
Hilo 12 2.6 ( 1.3- 5.2) 162 37.7 (32.4-43.4) 158 36.0 (30.8-41.5) 92 23.6 (18.8-29.2) 424 36,258
Puna/Ka'u 15 2.5 ( 1.4- 4.2) 147 36.2 (30.4-42.4) 164 36.4 (31.0-42.2) 97 24.9 (19.8-30.9) 423 35,753
Kona 6 1.1 ( 0.4- 2.9) 141 38.9 (32.8-45.4) 127 37.2 (30.9-44.0) 68 22.8 (17.6-28.9) 342 27,929
KAUAI County
Hanalei/Kapa'a 2 0.7 ( 0.2- 2.7) 138 47.0 (39.8-54.4) 104 32.3 (26.2-39.0) 51 20.1 (14.7-26.7) 295 19,845
Lihue-Waimea 8 1.4 ( 0.7- 3.0) 147 36.2 (30.3-42.5) 119 39.0 (32.6-45.7) 76 23.4 (18.2-29.6) 350 27,079
MAUI County
Lahaina/Wailuku 5 1.3 ( 0.5- 3.7) 128 42.0 (34.3-50.1) 102 36.2 (29.1-43.9) 65 20.5 (15.5-26.7) 300 30,871
Kahului 5 1.2 ( 0.5- 3.2) 136 38.0 (31.9-44.5) 116 35.2 (29.3-41.6) 78 25.5 (20.1-31.8) 335 32,405
Upcountry/Hana 8 2.1 ( 0.9- 5.1) 174 43.0 (36.9-49.3) 123 31.5 (26.2-37.3) 79 23.4 (18.2-29.5) 384 34,200
Lanai 4 1.5 ( 0.5- 4.1) 73 31.2 (24.3-39.1) 82 44.1 (36.0-52.5) 47 23.2 (16.9-30.9) 206 1,877
Molokai 10 2.7 ( 1.3- 5.6) 82 29.8 (23.4-37.2) 87 32.1 (25.8-39.1) 98 35.4 (28.7-42.8) 277 8,149
Percentages are weighted to population characteristics.N = Cell Sample Size, % = Percentage, 95% C.I. = Confidence Interval at 95 percent probability level
Rows with Sample Size less than 50 or containing half-width of 95% CI greater than 10 have been suppressed.

Body weight status with 3 categories of obeseState of Hawaii BRFSS 2007
Demographic Characteristics
Underweight(BMI < 18.5) N % C.I.(95%)
Recommended range(18.5 <= BMI < 25) N % C.I.(95%)
Overweight(25 <= BMI < 30) N % C.I.(95%)
Obese I(30<=BMI<35) N % C.I.(95%)
Obese II(35<=BMI<40) N % C.I.(95%)
Obese III (Morbid)(40<=BMI) N % C.I.(95%)
Total N
Estimated numberof Adults
TOTAL 159 2.2 ( 1.8- 2.8) 2,704 40.9 (39.3-42.6) 2,288 35.1 (33.5-36.7) 849 12.9 (11.8-14.2) 351 5.5 ( 4.8- 6.4) 186 3.2 ( 2.6- 4.0) 6,537 978,145
AGE GROUP
18-24 Years 11 3.4 ( 1.7- 6.6) 161 49.5 (42.6-56.3) 90 27.7 (22.0-34.3) 34 11.0 ( 7.2-16.4) 15 6.1 ( 3.3-11.0) 7 2.3 ( 1.0- 5.6) 318 125,465
25-34 Years 15 2.1 ( 1.1- 3.9) 276 35.5 (31.2-40.1) 249 36.7 (32.1-41.5) 80 12.0 ( 9.2-15.5) 57 7.5 ( 5.4-10.2) 33 6.2 ( 4.1- 9.2) 710 160,068
35-44 Years 18 1.3 ( 0.7- 2.2) 446 40.0 (36.3-43.8) 369 35.4 (31.8-39.1) 156 14.5 (12.0-17.4) 60 4.7 ( 3.4- 6.4) 42 4.2 ( 2.6- 6.8) 1,091 173,844
45-54 Years 26 1.7 ( 1.0- 2.9) 569 39.0 (35.8-42.3) 528 37.6 (34.4-40.9) 196 12.8 (10.6-15.3) 86 6.6 ( 5.1- 8.6) 41 2.3 ( 1.5- 3.5) 1,446 182,336
55-64 Years 26 1.2 ( 0.7- 2.0) 532 34.6 (31.3-38.1) 525 38.3 (34.9-41.8) 217 17.3 (14.7-20.4) 72 5.3 ( 3.9- 7.1) 44 3.3 ( 2.2- 4.8) 1,416 153,802
65+ Years 63 3.9 ( 2.9- 5.3) 713 48.1 (44.9-51.4) 518 33.1 (30.1-36.3) 164 10.1 ( 8.3-12.2) 60 3.5 ( 2.4- 4.9) 19 1.3 ( 0.7- 2.2) 1,537 179,295
Unknown/Refused - - - - - - -- -
GENDER
Male 18 0.7 ( 0.3- 1.4) 857 31.6 (29.2-34.1) 1,191 43.6 (41.1-46.3) 405 15.0 (13.2-17.1) 137 5.7 ( 4.5- 7.2) 74 3.3 ( 2.4- 4.6) 2,682 485,569
Female 141 3.8 ( 3.0- 4.7) 1,847 50.2 (48.0-52.4) 1,097 26.6 (24.8-28.6) 444 10.9 ( 9.6-12.3) 214 5.4 ( 4.5- 6.4) 112 3.2 ( 2.5- 4.1) 3,855 492,576
ETHNICITY
White 54 1.5 ( 1.1- 2.2) 1,185 42.9 (40.3-45.4) 944 36.2 (33.7-38.7) 340 13.2 (11.6-15.1) 113 4.1 ( 3.2- 5.3) 48 2.1 ( 1.4- 3.1) 2,684 310,016
Hawaiian 9 1.2 ( 0.5- 3.2) 205 24.8 (21.0-29.0) 294 30.7 (26.6-35.2) 196 19.4 (16.0-23.3) 118 13.5 (10.7-16.8) 79 10.4 ( 7.5-14.2) 901 134,993
Filipino 11 1.4 ( 0.6- 3.3) 388 46.4 (41.6-51.3) 321 34.3 (29.8-39.0) 92 10.4 ( 7.8-13.7) 38 4.8 ( 2.9- 7.9) 20 2.7 ( 1.4- 5.0) 870 172,808
Japanese 53 3.3 ( 2.3- 4.7) 636 47.6 (44.1-51.1) 460 35.6 (32.3-39.1) 123 9.3 ( 7.6-11.5) 38 3.1 ( 1.9- 4.8) 16 1.0 ( 0.6- 1.9) 1,326 213,123
Others 32 4.1 ( 2.6- 6.4) 278 35.5 (31.2-40.1) 261 36.7 (32.1-41.5) 98 14.9 (11.4-19.2) 44 5.8 ( 4.0- 8.5) 23 3.0 ( 1.8- 5.0) 736 144,761
Unknown/Refused - - - - - - -- -
MARITAL STATUS
Married 69 1.5 ( 1.1- 2.0) 1,514 40.1 (38.1-42.1) 1,380 38.0 (36.0-40.0) 490 13.1 (11.7-14.5) 182 4.6 ( 3.8- 5.6) 89 2.8 ( 2.1- 3.6) 3,724 580,818
Unmarried 89 3.3 ( 2.4- 4.5) 1,184 42.2 (39.3-45.1) 903 30.9 (28.2-33.7) 359 12.8 (10.9-15.0) 169 6.9 ( 5.5- 8.6) 97 4.0 ( 2.9- 5.4) 2,801 396,236
Unknown/Refused - - - - - - -- -
EDUCATION
<High School 12 3.0 ( 1.3- 6.5) 139 43.6 (36.4-51.0) 102 28.6 (22.5-35.6) 51 14.2 ( 9.7-20.4) 21 6.7 ( 4.0-11.0) 14 4.0 ( 2.0- 7.8) 339 52,838
High School 35 1.6 ( 1.0- 2.6) 671 36.0 (32.9-39.3) 650 34.7 (31.7-37.9) 306 16.0 (13.6-18.7) 139 7.8 ( 6.2- 9.7) 69 3.8 ( 2.7- 5.5) 1,870 308,870
Some College 46 2.0 ( 1.4- 3.0) 746 39.3 (36.2-42.4) 687 36.0 (32.9-39.1) 254 13.1 (11.2-15.3) 111 5.2 ( 4.1- 6.7) 69 4.4 ( 3.1- 6.1) 1,913 287,067
College 66 2.9 ( 2.0- 4.0) 1,145 46.7 (44.1-49.4) 845 35.5 (33.0-38.1) 238 9.8 ( 8.3-11.4) 80 3.5 ( 2.4- 5.1) 34 1.6 ( 1.0- 2.5) 2,408 328,225
Unknown/Refused - - - - - - -- -
EMPLOYMENT
Employed 60 1.5 ( 1.0- 2.1) 1,602 39.1 (37.0-41.3) 1,462 37.0 (34.9-39.1) 528 12.9 (11.5-14.4) 231 5.9 ( 5.0- 7.0) 118 3.6 ( 2.8- 4.6) 4,001 629,198
Unemployed - - - - - - - - - - - - - - - -
Student/Homemaker 16 3.7 ( 2.0- 6.6) 224 50.3 (44.0-56.6) 131 28.9 (23.6-34.9) 56 9.5 ( 6.7-13.3) 21 4.8 ( 2.2-10.3) 10 2.7 ( 1.1- 6.7) 458 90,188
Retired/Can't work 73 3.5 ( 2.6- 4.9) 813 44.0 (41.0-47.0) 637 32.9 (30.1-35.9) 236 12.7 (10.8-15.0) 89 4.6 ( 3.4- 6.1) 47 2.3 ( 1.6- 3.2) 1,895 226,155
Unknown/Refused - - - - - - -- -
HOUSEHOLD INCOME
<$15,000 26 3.7 ( 2.2- 6.1) 194 38.7 (32.3-45.5) 133 25.6 (19.9-32.4) 68 17.2 (11.8-24.3) 40 7.2 ( 4.5-11.3) 31 7.6 ( 4.8-11.8) 492 58,671
$15,000-24,999 21 2.4 ( 1.4- 4.0) 320 40.2 (35.5-45.2) 271 30.6 (26.3-35.3) 132 15.7 (12.4-19.6) 55 7.5 ( 5.2-10.7) 26 3.7 ( 2.0- 6.6) 825 103,574
$25,000-49,999 38 2.6 ( 1.6- 4.0) 767 38.9 (35.8-42.0) 643 34.4 (31.4-37.5) 246 12.9 (10.9-15.2) 117 7.0 ( 5.4- 9.0) 72 4.3 ( 3.1- 6.0) 1,883 278,416
$50,000-74,999 23 1.2 ( 0.7- 2.0) 454 38.9 (35.1-42.9) 405 37.8 (33.9-41.8) 141 14.2 (11.3-17.7) 55 5.4 ( 3.8- 7.7) 22 2.5 ( 1.5- 4.4) 1,100 169,326
>=$75,000 35 1.9 ( 1.3- 2.7) 775 42.6 (39.6-45.6) 678 37.9 (35.0-40.9) 222 11.7 (10.0-13.6) 69 3.7 ( 2.7- 5.0) 29 2.3 ( 1.4- 3.9) 1,808 284,916
Unknown/Refused 16 3.4 ( 1.6- 6.8) 194 48.9 (42.1-55.8) 158 34.5 (28.4-41.2) 40 8.5 ( 5.4-13.1) 15 3.9 ( 1.9- 7.7) 6 0.8 ( 0.3- 2.1) 429 83,242
Percentages are weighted to population characteristics.N = Cell Sample Size, % = Percentage, 95% C.I. = Confidence Interval at 95 percent probability level
Rows with Sample Size less than 50 or containing half-width of 95% CI greater than 10 have been suppressed.

Body weight status with 3 categories of obeseState of Hawaii BRFSS 2007
GEOGRAPHIC AREAS Underweight(BMI < 18.5) N % C.I.(95%)
Recommended range(18.5 <= BMI < 25) N % C.I.(95%)
Overweight(25 <= BMI < 30) N % C.I.(95%)
Obese I(30<=BMI<35) N % C.I.(95%)
Obese II(35<=BMI<40) N % C.I.(95%)
Obese III (Morbid)(40<=BMI) N % C.I.(95%)
Total N
Estimatednumberof Adults
STATE 159 2.2 ( 1.8- 2.8) 2,704 40.9 (39.3-42.6) 2,288 35.1 (33.5-36.7) 849 12.9 (11.8-14.2) 351 5.5 ( 4.8- 6.4) 186 3.2 ( 2.6- 4.0) 6,537 978,145
COUNTY
Honolulu 80 2.4 ( 1.9- 3.2) 1,224 41.4 (39.2-43.6) 1,005 35.0 (32.9-37.2) 354 12.5 (11.0-14.1) 149 5.4 ( 4.4- 6.6) 75 3.2 ( 2.4- 4.2) 2,887 695,471
Hawaii 37 2.0 ( 1.3- 2.9) 602 39.3 (36.3-42.5) 550 35.6 (32.7-38.6) 203 14.6 (12.5-16.9) 73 5.6 ( 4.2- 7.5) 38 2.9 ( 1.9- 4.5) 1,503 128,249
Kauai 10 1.1 ( 0.6- 2.1) 285 40.8 (36.0-45.6) 223 36.1 (31.6-41.0) 74 13.3 (10.2-17.1) 35 5.8 ( 3.9- 8.6) 18 3.0 ( 1.6- 5.4) 645 46,924
Maui 32 1.7 ( 1.0- 2.7) 593 40.0 (36.4-43.7) 510 34.2 (30.9-37.7) 218 13.9 (11.7-16.5) 94 6.2 ( 4.8- 8.0) 55 4.0 ( 2.6- 6.1) 1,502 107,501
HONOLULU County
North Shore/Laie - - - - - - - - - - - - - - - -
Ka'a'wa/Kahalu'u/Kaneohe 4 1.2 ( 0.4- 3.3) 76 36.2 (29.0-44.2) 73 35.8 (28.4-44.0) 36 13.2 ( 9.0-19.0) 17 8.8 ( 5.1-14.8) 7 4.8 ( 2.0-11.0) 213 48,966
Kailua/Waimanalo 6 1.5 ( 0.6- 3.5) 91 35.8 (29.2-43.1) 91 40.9 (33.5-48.7) 34 14.7 (10.3-20.5) 11 4.5 ( 2.3- 8.6) 5 2.6 ( 1.0- 6.5) 238 52,670
Wailae/Kahala/HawaiiKai 7 4.3 ( 1.9- 9.3) 92 52.3 (43.6-61.0) 55 31.1 (23.7-39.6) 16 11.0 ( 6.1-19.1) 2 0.8 ( 0.2- 3.3) 1 0.5 ( 0.1- 3.7) 173 38,267
Kaimuki/Palolo/Waikiki 16 5.1 ( 3.0- 8.7) 134 46.0 (38.9-53.2) 92 34.8 (27.9-42.3) 25 9.5 ( 6.0-14.6) 10 3.7 ( 1.8- 7.2) 2 1.0 ( 0.2- 4.4) 279 55,414
Manoa/Upper Makiki 11 3.6 ( 1.9- 6.8) 109 46.0 (38.7-53.5) 76 30.7 (24.5-37.7) 26 9.4 ( 6.1-14.2) 12 8.0 ( 4.0-15.2) 3 2.3 ( 0.6- 8.1) 237 44,814
Ala Moana 4 2.6 ( 0.7- 9.1) 72 49.8 (40.6-59.1) 41 26.5 (19.1-35.4) 26 13.5 ( 8.9-19.9) 7 3.8 ( 1.7- 8.2) 3 3.8 ( 1.0-13.1) 153 28,609
Nuuanu/Kalihi/MoanaLoa 6 2.1 ( 0.8- 5.2) 108 45.4 (37.7-53.4) 99 37.3 (30.3-44.8) 22 8.3 ( 5.0-13.5) 8 4.4 ( 1.5-11.9) 6 2.5 ( 0.9- 6.8) 249 66,513
Salt Lake/Foster Village - - - - - - - - - - - - - - - -
Aiea/Pearl City 4 1.5 ( 0.5- 4.5) 114 43.5 (36.3-50.9) 104 38.9 (32.1-46.2) 30 9.6 ( 6.4-14.1) 18 4.8 ( 2.7- 8.4) 6 1.7 ( 0.7- 4.3) 276 67,884
Mililani/Wahiawa 4 1.4 ( 0.4- 4.7) 111 35.6 (29.7-42.1) 116 38.1 (31.9-44.6) 42 15.9 (11.2-22.0) 19 6.2 ( 3.8-10.2) 4 2.8 ( 0.9- 8.7) 296 74,113
Waipahu/Kapolei/Ewa 12 3.1 ( 1.6- 6.2) 184 38.3 (33.1-43.9) 155 36.1 (30.7-41.8) 49 12.6 ( 9.1-17.2) 23 6.0 ( 3.7- 9.4) 19 3.9 ( 2.4- 6.3) 442 128,398
Nanakuli/Waianae - - - - - - - - - - - - - - - -
HAWAII County
North Hawaii 4 1.4 ( 0.4- 4.5) 152 45.8 (38.9-52.8) 101 32.5 (26.3-39.4) 30 9.9 ( 6.2-15.5) 20 7.8 ( 4.6-13.1) 7 2.6 ( 1.1- 5.8) 314 28,309
Hilo 12 2.6 ( 1.3- 5.2) 162 37.7 (32.4-43.4) 158 36.0 (30.8-41.5) 66 15.9 (12.2-20.5) 17 4.7 ( 2.8- 7.8) 9 3.1 ( 1.0- 8.9) 424 36,258
Puna/Ka'u 15 2.5 ( 1.4- 4.2) 147 36.2 (30.4-42.4) 164 36.4 (31.0-42.2) 59 15.7 (11.7-20.7) 25 6.4 ( 3.5-11.5) 13 2.8 ( 1.5- 5.0) 423 35,753
Kona 6 1.1 ( 0.4- 2.9) 141 38.9 (32.8-45.4) 127 37.2 (30.9-44.0) 48 16.0 (11.7-21.5) 11 3.6 ( 1.8- 6.9) 9 3.2 ( 1.3- 7.6) 342 27,929
KAUAI County
Hanalei/Kapa'a 2 0.7 ( 0.2- 2.7) 138 47.0 (39.8-54.4) 104 32.3 (26.2-39.0) 32 11.2 ( 7.7-16.0) 13 5.7 ( 2.9-10.9) 6 3.2 ( 1.1- 8.8) 295 19,845
Lihue-Waimea 8 1.4 ( 0.7- 3.0) 147 36.2 (30.3-42.5) 119 39.0 (32.6-45.7) 42 14.8 (10.4-20.6) 22 5.9 ( 3.6- 9.5) 12 2.8 ( 1.4- 5.6) 350 27,079
MAUI County
Lahaina/Wailuku 5 1.3 ( 0.5- 3.7) 128 42.0 (34.3-50.1) 102 36.2 (29.1-43.9) 39 11.5 ( 8.0-16.4) 18 5.9 ( 3.4-10.0) 8 3.0 ( 1.3- 7.0) 300 30,871
Kahului 5 1.2 ( 0.5- 3.2) 136 38.0 (31.9-44.5) 116 35.2 (29.3-41.6) 57 17.4 (13.0-22.9) 14 4.8 ( 2.7- 8.4) 7 3.3 ( 1.3- 8.1) 335 32,405
Upcountry/Hana 8 2.1 ( 0.9- 5.1) 174 43.0 (36.9-49.3) 123 31.5 (26.2-37.3) 43 11.2 ( 7.9-15.8) 27 7.2 ( 4.6-11.1) 9 4.9 ( 2.2-10.7) 384 34,200
Lanai 4 1.5 ( 0.5- 4.1) 73 31.2 (24.3-39.1) 82 44.1 (36.0-52.5) 28 14.5 ( 9.4-21.7) 10 5.5 ( 2.8-10.4) 9 3.2 ( 1.6- 6.4) 206 1,877
Molokai 10 2.7 ( 1.3- 5.6) 82 29.8 (23.4-37.2) 87 32.1 (25.8-39.1) 51 20.2 (14.6-27.3) 25 8.6 ( 5.4-13.4) 22 6.6 ( 4.0-10.6) 277 8,149
Percentages are weighted to population characteristics.N = Cell Sample Size, % = Percentage, 95% C.I. = Confidence Interval at 95 percent probability level
Rows with Sample Size less than 50 or containing half-width of 95% CI greater than 10 have been suppressed.
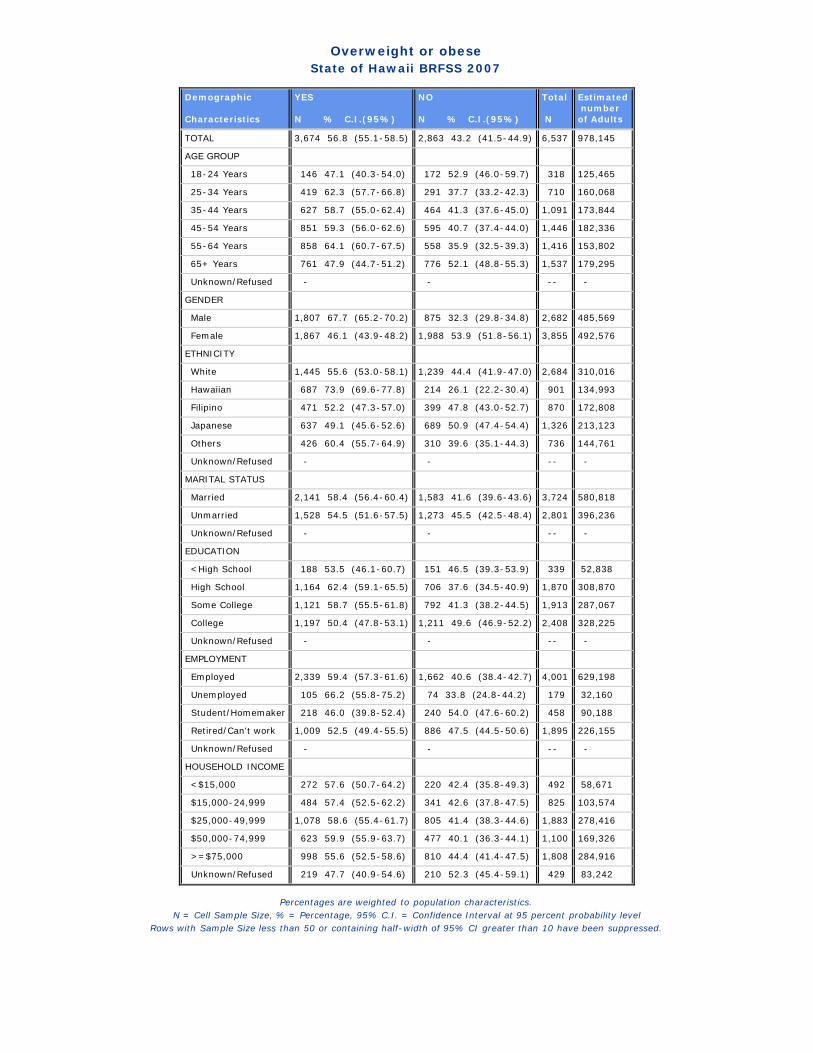
Overweight or obeseState of Hawaii BRFSS 2007
Demographic Characteristics
YES N % C.I.(95%)
NO N % C.I.(95%)
Total N
Estimated numberof Adults
TOTAL 3,674 56.8 (55.1-58.5) 2,863 43.2 (41.5-44.9) 6,537 978,145
AGE GROUP
18-24 Years 146 47.1 (40.3-54.0) 172 52.9 (46.0-59.7) 318 125,465
25-34 Years 419 62.3 (57.7-66.8) 291 37.7 (33.2-42.3) 710 160,068
35-44 Years 627 58.7 (55.0-62.4) 464 41.3 (37.6-45.0) 1,091 173,844
45-54 Years 851 59.3 (56.0-62.6) 595 40.7 (37.4-44.0) 1,446 182,336
55-64 Years 858 64.1 (60.7-67.5) 558 35.9 (32.5-39.3) 1,416 153,802
65+ Years 761 47.9 (44.7-51.2) 776 52.1 (48.8-55.3) 1,537 179,295
Unknown/Refused - - -- -
GENDER
Male 1,807 67.7 (65.2-70.2) 875 32.3 (29.8-34.8) 2,682 485,569
Female 1,867 46.1 (43.9-48.2) 1,988 53.9 (51.8-56.1) 3,855 492,576
ETHNICITY
White 1,445 55.6 (53.0-58.1) 1,239 44.4 (41.9-47.0) 2,684 310,016
Hawaiian 687 73.9 (69.6-77.8) 214 26.1 (22.2-30.4) 901 134,993
Filipino 471 52.2 (47.3-57.0) 399 47.8 (43.0-52.7) 870 172,808
Japanese 637 49.1 (45.6-52.6) 689 50.9 (47.4-54.4) 1,326 213,123
Others 426 60.4 (55.7-64.9) 310 39.6 (35.1-44.3) 736 144,761
Unknown/Refused - - -- -
MARITAL STATUS
Married 2,141 58.4 (56.4-60.4) 1,583 41.6 (39.6-43.6) 3,724 580,818
Unmarried 1,528 54.5 (51.6-57.5) 1,273 45.5 (42.5-48.4) 2,801 396,236
Unknown/Refused - - -- -
EDUCATION
<High School 188 53.5 (46.1-60.7) 151 46.5 (39.3-53.9) 339 52,838
High School 1,164 62.4 (59.1-65.5) 706 37.6 (34.5-40.9) 1,870 308,870
Some College 1,121 58.7 (55.5-61.8) 792 41.3 (38.2-44.5) 1,913 287,067
College 1,197 50.4 (47.8-53.1) 1,211 49.6 (46.9-52.2) 2,408 328,225
Unknown/Refused - - -- -
EMPLOYMENT
Employed 2,339 59.4 (57.3-61.6) 1,662 40.6 (38.4-42.7) 4,001 629,198
Unemployed 105 66.2 (55.8-75.2) 74 33.8 (24.8-44.2) 179 32,160
Student/Homemaker 218 46.0 (39.8-52.4) 240 54.0 (47.6-60.2) 458 90,188
Retired/Can't work 1,009 52.5 (49.4-55.5) 886 47.5 (44.5-50.6) 1,895 226,155
Unknown/Refused - - -- -
HOUSEHOLD INCOME
<$15,000 272 57.6 (50.7-64.2) 220 42.4 (35.8-49.3) 492 58,671
$15,000-24,999 484 57.4 (52.5-62.2) 341 42.6 (37.8-47.5) 825 103,574
$25,000-49,999 1,078 58.6 (55.4-61.7) 805 41.4 (38.3-44.6) 1,883 278,416
$50,000-74,999 623 59.9 (55.9-63.7) 477 40.1 (36.3-44.1) 1,100 169,326
>=$75,000 998 55.6 (52.5-58.6) 810 44.4 (41.4-47.5) 1,808 284,916
Unknown/Refused 219 47.7 (40.9-54.6) 210 52.3 (45.4-59.1) 429 83,242
Percentages are weighted to population characteristics.N = Cell Sample Size, % = Percentage, 95% C.I. = Confidence Interval at 95 percent probability level
Rows with Sample Size less than 50 or containing half-width of 95% CI greater than 10 have been suppressed.

Overweight or obeseState of Hawaii BRFSS 2007
GEOGRAPHIC AREAS YES N % C.I.(95%)
NO N % C.I.(95%)
Total N
Estimatednumberof Adults
STATE 3,674 56.8 (55.1-58.5) 2,863 43.2 (41.5-44.9) 6,537 978,145
COUNTY
Honolulu 1,583 56.2 (53.9-58.4) 1,304 43.8 (41.6-46.1) 2,887 695,471
Hawaii 864 58.7 (55.6-61.8) 639 41.3 (38.2-44.4) 1,503 128,249
Kauai 350 58.1 (53.2-62.9) 295 41.9 (37.1-46.8) 645 46,924
Maui 877 58.3 (54.6-61.9) 625 41.7 (38.1-45.4) 1,502 107,501
HONOLULU County
North Shore/Laie - - - - - - - -
Ka'a'wa/Kahalu'u/Kaneohe 133 62.6 (54.6-69.9) 80 37.4 (30.1-45.4) 213 48,966
Kailua/Waimanalo 141 62.7 (55.4-69.4) 97 37.3 (30.6-44.6) 238 52,670
Wailae/Kahala/HawaiiKai 74 43.4 (34.9-52.2) 99 56.6 (47.8-65.1) 173 38,267
Kaimuki/Palolo/Waikiki 129 48.9 (41.6-56.1) 150 51.1 (43.9-58.4) 279 55,414
Manoa/Upper Makiki 117 50.3 (42.9-57.8) 120 49.7 (42.2-57.1) 237 44,814
Ala Moana 77 47.6 (38.5-56.9) 76 52.4 (43.1-61.5) 153 28,609
Nuuanu/Kalihi/MoanaLoa 135 52.5 (44.6-60.3) 114 47.5 (39.7-55.4) 249 66,513
Salt Lake/Foster Village - - - - - - - -
Aiea/Pearl City 158 55.1 (47.7-62.3) 118 44.9 (37.7-52.3) 276 67,884
Mililani/Wahiawa 181 63.0 (56.5-69.1) 115 37.0 (30.9-43.5) 296 74,113
Waipahu/Kapolei/Ewa 246 58.5 (52.9-63.9) 196 41.5 (36.1-47.1) 442 128,398
Nanakuli/Waianae - - - - - - - -
HAWAII County
North Hawaii 158 52.8 (45.8-59.8) 156 47.2 (40.2-54.2) 314 28,309
Hilo 250 59.6 (54.0-65.1) 174 40.4 (34.9-46.0) 424 36,258
Puna/Ka'u 261 61.4 (55.1-67.2) 162 38.6 (32.8-44.9) 423 35,753
Kona 195 60.0 (53.5-66.1) 147 40.0 (33.9-46.5) 342 27,929
KAUAI County
Hanalei/Kapa'a 155 52.3 (45.0-59.6) 140 47.7 (40.4-55.0) 295 19,845
Lihue-Waimea 195 62.4 (56.0-68.4) 155 37.6 (31.6-44.0) 350 27,079
MAUI County
Lahaina/Wailuku 167 56.7 (48.6-64.4) 133 43.3 (35.6-51.4) 300 30,871
Kahului 194 60.7 (54.2-66.9) 141 39.3 (33.1-45.8) 335 32,405
Upcountry/Hana 202 54.9 (48.6-61.0) 182 45.1 (39.0-51.4) 384 34,200
Lanai 129 67.3 (59.3-74.3) 77 32.7 (25.7-40.7) 206 1,877
Molokai 185 67.5 (60.1-74.1) 92 32.5 (25.9-39.9) 277 8,149
Percentages are weighted to population characteristics.N = Cell Sample Size, % = Percentage, 95% C.I. = Confidence Interval at 95 percent probability level
Rows with Sample Size less than 50 or containing half-width of 95% CI greater than 10 have been suppressed.

Are you limited in any way because of health problems?State of Hawaii BRFSS 2007
Demographic Characteristics
YES N % C.I.(95%)
NO N % C.I.(95%)
Total N
Estimated numberof Adults
TOTAL 1,252 15.3 (14.2-16.5) 5,311 84.7 (83.5-85.8) 6,563 980,792
AGE GROUP
18-24 Years 28 8.9 ( 5.8-13.5) 291 91.1 (86.5-94.2) 319 125,816
25-34 Years 78 9.6 ( 7.3-12.5) 632 90.4 (87.5-92.7) 710 159,797
35-44 Years 134 10.3 ( 8.4-12.6) 955 89.7 (87.4-91.6) 1,089 173,478
45-54 Years 264 16.2 (13.8-18.9) 1,195 83.8 (81.1-86.2) 1,459 185,086
55-64 Years 357 22.1 (19.3-25.0) 1,066 77.9 (75.0-80.7) 1,423 153,765
65+ Years 389 23.4 (20.8-26.2) 1,150 76.6 (73.8-79.2) 1,539 179,315
Unknown/Refused - - -- -
GENDER
Male 522 15.6 (13.9-17.5) 2,151 84.4 (82.5-86.1) 2,673 483,292
Female 730 15.0 (13.7-16.5) 3,160 85.0 (83.5-86.3) 3,890 497,500
ETHNICITY
White 629 19.9 (17.9-22.0) 2,063 80.1 (78.0-82.1) 2,692 310,234
Hawaiian 160 15.1 (12.3-18.4) 746 84.9 (81.6-87.7) 906 135,916
Filipino 98 8.7 ( 6.6-11.4) 771 91.3 (88.6-93.4) 869 172,848
Japanese 216 14.0 (11.9-16.5) 1,115 86.0 (83.5-88.1) 1,331 213,607
Others 148 15.8 (12.9-19.3) 594 84.2 (80.7-87.1) 742 145,822
Unknown/Refused - - -- -
MARITAL STATUS
Married 587 14.2 (12.9-15.6) 3,153 85.8 (84.4-87.1) 3,740 582,920
Unmarried 664 17.1 (15.2-19.1) 2,146 82.9 (80.9-84.8) 2,810 396,636
Unknown/Refused - - -- -
EDUCATION
<High School 82 22.1 (16.7-28.6) 258 77.9 (71.4-83.3) 340 52,757
High School 359 16.6 (14.4-19.0) 1,517 83.4 (81.0-85.6) 1,876 309,825
Some College 368 14.4 (12.6-16.5) 1,550 85.6 (83.5-87.4) 1,918 287,996
College 442 13.9 (12.4-15.6) 1,978 86.1 (84.4-87.6) 2,420 328,580
Unknown/Refused - - -- -
EMPLOYMENT
Employed 512 10.3 ( 9.2-11.5) 3,512 89.7 (88.5-90.8) 4,024 632,293
Unemployed - - - - - - - -
Student/Homemaker 78 11.2 ( 8.3-14.9) 383 88.8 (85.1-91.7) 461 90,390
Retired/Can't work 602 28.4 (25.8-31.1) 1,292 71.6 (68.9-74.2) 1,894 225,516
Unknown/Refused - - -- -
HOUSEHOLD INCOME
<$15,000 200 31.8 (25.9-38.3) 290 68.2 (61.7-74.1) 490 58,426
$15,000-24,999 202 21.0 (17.5-25.0) 624 79.0 (75.0-82.5) 826 103,627
$25,000-49,999 363 16.2 (14.2-18.5) 1,525 83.8 (81.5-85.8) 1,888 278,429
$50,000-74,999 168 10.7 ( 8.8-12.9) 931 89.3 (87.1-91.2) 1,099 168,776
>=$75,000 237 11.0 ( 9.3-12.9) 1,576 89.0 (87.1-90.7) 1,813 285,036
Unknown/Refused 82 18.0 (13.5-23.5) 365 82.0 (76.5-86.5) 447 86,499
Percentages are weighted to population characteristics.N = Cell Sample Size, % = Percentage, 95% C.I. = Confidence Interval at 95 percent probability level
Rows with Sample Size less than 50 or containing half-width of 95% CI greater than 10 have been suppressed.
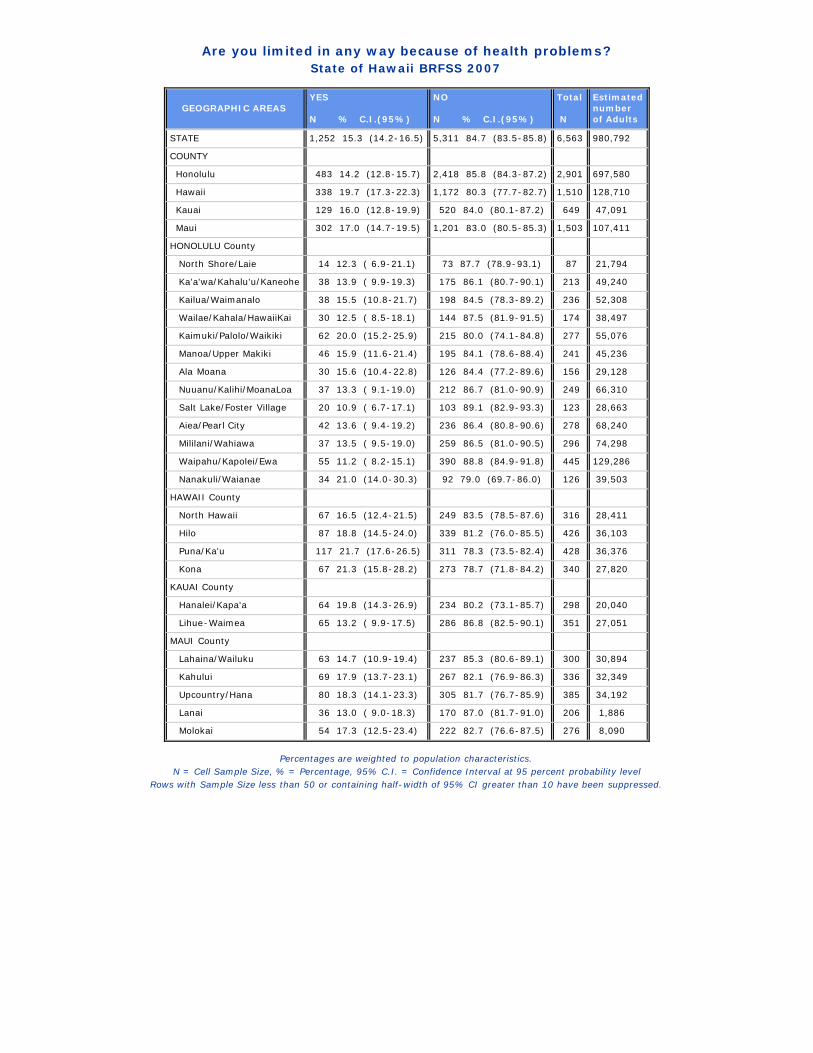
Are you limited in any way because of health problems?State of Hawaii BRFSS 2007
GEOGRAPHIC AREAS YES N % C.I.(95%)
NO N % C.I.(95%)
Total N
Estimatednumberof Adults
STATE 1,252 15.3 (14.2-16.5) 5,311 84.7 (83.5-85.8) 6,563 980,792
COUNTY
Honolulu 483 14.2 (12.8-15.7) 2,418 85.8 (84.3-87.2) 2,901 697,580
Hawaii 338 19.7 (17.3-22.3) 1,172 80.3 (77.7-82.7) 1,510 128,710
Kauai 129 16.0 (12.8-19.9) 520 84.0 (80.1-87.2) 649 47,091
Maui 302 17.0 (14.7-19.5) 1,201 83.0 (80.5-85.3) 1,503 107,411
HONOLULU County
North Shore/Laie 14 12.3 ( 6.9-21.1) 73 87.7 (78.9-93.1) 87 21,794
Ka'a'wa/Kahalu'u/Kaneohe 38 13.9 ( 9.9-19.3) 175 86.1 (80.7-90.1) 213 49,240
Kailua/Waimanalo 38 15.5 (10.8-21.7) 198 84.5 (78.3-89.2) 236 52,308
Wailae/Kahala/HawaiiKai 30 12.5 ( 8.5-18.1) 144 87.5 (81.9-91.5) 174 38,497
Kaimuki/Palolo/Waikiki 62 20.0 (15.2-25.9) 215 80.0 (74.1-84.8) 277 55,076
Manoa/Upper Makiki 46 15.9 (11.6-21.4) 195 84.1 (78.6-88.4) 241 45,236
Ala Moana 30 15.6 (10.4-22.8) 126 84.4 (77.2-89.6) 156 29,128
Nuuanu/Kalihi/MoanaLoa 37 13.3 ( 9.1-19.0) 212 86.7 (81.0-90.9) 249 66,310
Salt Lake/Foster Village 20 10.9 ( 6.7-17.1) 103 89.1 (82.9-93.3) 123 28,663
Aiea/Pearl City 42 13.6 ( 9.4-19.2) 236 86.4 (80.8-90.6) 278 68,240
Mililani/Wahiawa 37 13.5 ( 9.5-19.0) 259 86.5 (81.0-90.5) 296 74,298
Waipahu/Kapolei/Ewa 55 11.2 ( 8.2-15.1) 390 88.8 (84.9-91.8) 445 129,286
Nanakuli/Waianae 34 21.0 (14.0-30.3) 92 79.0 (69.7-86.0) 126 39,503
HAWAII County
North Hawaii 67 16.5 (12.4-21.5) 249 83.5 (78.5-87.6) 316 28,411
Hilo 87 18.8 (14.5-24.0) 339 81.2 (76.0-85.5) 426 36,103
Puna/Ka'u 117 21.7 (17.6-26.5) 311 78.3 (73.5-82.4) 428 36,376
Kona 67 21.3 (15.8-28.2) 273 78.7 (71.8-84.2) 340 27,820
KAUAI County
Hanalei/Kapa'a 64 19.8 (14.3-26.9) 234 80.2 (73.1-85.7) 298 20,040
Lihue-Waimea 65 13.2 ( 9.9-17.5) 286 86.8 (82.5-90.1) 351 27,051
MAUI County
Lahaina/Wailuku 63 14.7 (10.9-19.4) 237 85.3 (80.6-89.1) 300 30,894
Kahului 69 17.9 (13.7-23.1) 267 82.1 (76.9-86.3) 336 32,349
Upcountry/Hana 80 18.3 (14.1-23.3) 305 81.7 (76.7-85.9) 385 34,192
Lanai 36 13.0 ( 9.0-18.3) 170 87.0 (81.7-91.0) 206 1,886
Molokai 54 17.3 (12.5-23.4) 222 82.7 (76.6-87.5) 276 8,090
Percentages are weighted to population characteristics.N = Cell Sample Size, % = Percentage, 95% C.I. = Confidence Interval at 95 percent probability level
Rows with Sample Size less than 50 or containing half-width of 95% CI greater than 10 have been suppressed.

Do you have any health problem that requires you to use special equipment?State of Hawaii BRFSS 2007
Demographic Characteristics
YES N % C.I.(95%)
NO N % C.I.(95%)
Total N
Estimated numberof Adults
TOTAL 424 5.6 ( 4.9- 6.3) 6,141 94.4 (93.7-95.1) 6,565 980,975
AGE GROUP
18-24 Years 3 1.3 ( 0.3- 5.1) 316 98.7 (94.9-99.7) 319 125,816
25-34 Years 16 2.5 ( 1.4- 4.5) 693 97.5 (95.5-98.6) 709 159,727
35-44 Years 27 2.3 ( 1.5- 3.6) 1,061 97.7 (96.4-98.5) 1,088 173,212
45-54 Years 59 3.8 ( 2.7- 5.4) 1,400 96.2 (94.6-97.3) 1,459 185,086
55-64 Years 93 6.1 ( 4.7- 7.9) 1,332 93.9 (92.1-95.3) 1,425 153,950
65+ Years 225 15.8 (13.5-18.4) 1,317 84.2 (81.6-86.5) 1,542 179,690
Unknown/Refused - - -- -
GENDER
Male 153 4.5 ( 3.6- 5.6) 2,524 95.5 (94.4-96.4) 2,677 483,674
Female 271 6.6 ( 5.6- 7.7) 3,617 93.4 (92.3-94.4) 3,888 497,300
ETHNICITY
White 181 5.8 ( 4.7- 7.1) 2,509 94.2 (92.9-95.3) 2,690 310,040
Hawaiian 66 6.9 ( 5.1- 9.3) 839 93.1 (90.7-94.9) 905 135,748
Filipino 35 3.4 ( 2.2- 5.3) 836 96.6 (94.7-97.8) 871 173,023
Japanese 99 7.0 ( 5.4- 8.9) 1,235 93.0 (91.1-94.6) 1,334 214,074
Others 43 4.4 ( 3.0- 6.4) 699 95.6 (93.6-97.0) 742 145,724
Unknown/Refused - - -- -
MARITAL STATUS
Married 180 4.9 ( 4.1- 5.9) 3,561 95.1 (94.1-95.9) 3,741 582,779
Unmarried 243 6.4 ( 5.4- 7.7) 2,568 93.6 (92.3-94.6) 2,811 396,960
Unknown/Refused - - -- -
EDUCATION
<High School 54 14.0 (10.0-19.1) 284 86.0 (80.9-90.0) 338 52,264
High School 141 6.7 ( 5.3- 8.3) 1,736 93.3 (91.7-94.7) 1,877 310,024
Some College 119 4.9 ( 3.9- 6.2) 1,800 95.1 (93.8-96.1) 1,919 288,252
College 109 3.8 ( 3.0- 4.8) 2,313 96.2 (95.2-97.0) 2,422 328,800
Unknown/Refused - - -- -
EMPLOYMENT
Employed 82 2.0 ( 1.5- 2.6) 3,941 98.0 (97.4-98.5) 4,023 632,279
Unemployed 13 7.7 ( 3.0-18.3) 166 92.3 (81.7-97.0) 179 32,120
Student/Homemaker 24 3.2 ( 1.9- 5.3) 435 96.8 (94.7-98.1) 459 89,970
Retired/Can't work 305 16.3 (14.2-18.7) 1,594 83.7 (81.3-85.8) 1,899 226,134
Unknown/Refused - - -- -
HOUSEHOLD INCOME
<$15,000 91 14.3 (10.8-18.6) 399 85.7 (81.4-89.2) 490 58,300
$15,000-24,999 71 7.8 ( 5.7-10.4) 755 92.2 (89.6-94.3) 826 103,627
$25,000-49,999 125 6.2 ( 4.9- 7.8) 1,765 93.8 (92.2-95.1) 1,890 278,667
$50,000-74,999 37 2.8 ( 1.8- 4.4) 1,061 97.2 (95.6-98.2) 1,098 168,710
>=$75,000 64 3.0 ( 2.3- 4.0) 1,749 97.0 (96.0-97.7) 1,813 284,979
Unknown/Refused 36 8.8 ( 5.6-13.5) 412 91.2 (86.5-94.4) 448 86,692
Percentages are weighted to population characteristics.N = Cell Sample Size, % = Percentage, 95% C.I. = Confidence Interval at 95 percent probability level
Rows with Sample Size less than 50 or containing half-width of 95% CI greater than 10 have been suppressed.

Do you have any health problem that requires you to use special equipment?State of Hawaii BRFSS 2007
GEOGRAPHIC AREAS YES N % C.I.(95%)
NO N % C.I.(95%)
Total N
Estimatednumberof Adults
STATE 424 5.6 ( 4.9- 6.3) 6,141 94.4 (93.7-95.1) 6,565 980,975
COUNTY
Honolulu 195 5.7 ( 4.8- 6.7) 2,705 94.3 (93.3-95.2) 2,900 697,367
Hawaii 95 5.3 ( 4.2- 6.6) 1,417 94.7 (93.4-95.8) 1,512 128,947
Kauai 28 3.0 ( 1.9- 4.6) 619 97.0 (95.4-98.1) 647 46,979
Maui 106 6.1 ( 4.7- 7.8) 1,400 93.9 (92.2-95.3) 1,506 107,681
HONOLULU County
North Shore/Laie 9 7.6 ( 3.6-15.1) 78 92.4 (84.9-96.4) 87 21,794
Ka'a'wa/Kahalu'u/Kaneohe 14 5.8 ( 3.0-10.9) 199 94.2 (89.1-97.0) 213 49,240
Kailua/Waimanalo 14 4.4 ( 2.4- 7.8) 222 95.6 (92.2-97.6) 236 52,308
Wailae/Kahala/HawaiiKai 7 3.2 ( 1.4- 7.1) 166 96.8 (92.9-98.6) 173 38,256
Kaimuki/Palolo/Waikiki 20 7.8 ( 4.7-12.5) 256 92.2 (87.5-95.3) 276 54,883
Manoa/Upper Makiki 15 5.0 ( 2.9- 8.5) 227 95.0 (91.5-97.1) 242 45,373
Ala Moana 18 11.1 ( 6.5-18.3) 138 88.9 (81.7-93.5) 156 29,128
Nuuanu/Kalihi/MoanaLoa 12 3.8 ( 2.0- 6.9) 238 96.2 (93.1-98.0) 250 66,562
Salt Lake/Foster Village 5 2.1 ( 0.8- 5.4) 118 97.9 (94.6-99.2) 123 28,663
Aiea/Pearl City 17 4.4 ( 2.6- 7.5) 261 95.6 (92.5-97.4) 278 68,240
Mililani/Wahiawa 20 6.2 ( 3.8-10.1) 275 93.8 (89.9-96.2) 295 74,130
Waipahu/Kapolei/Ewa 25 5.5 ( 3.4- 8.8) 420 94.5 (91.2-96.6) 445 129,286
Nanakuli/Waianae 19 10.4 ( 6.2-17.1) 107 89.6 (82.9-93.8) 126 39,503
HAWAII County
North Hawaii 20 5.2 ( 3.2- 8.4) 296 94.8 (91.6-96.8) 316 28,411
Hilo 24 4.7 ( 3.0- 7.3) 403 95.3 (92.7-97.0) 427 36,257
Puna/Ka'u 35 6.4 ( 4.3- 9.4) 393 93.6 (90.6-95.7) 428 36,376
Kona 16 4.6 ( 2.6- 8.2) 325 95.4 (91.8-97.4) 341 27,903
KAUAI County
Hanalei/Kapa'a 15 3.2 ( 1.8- 5.7) 282 96.8 (94.3-98.2) 297 19,971
Lihue-Waimea 13 2.8 ( 1.5- 5.2) 337 97.2 (94.8-98.5) 350 27,008
MAUI County
Lahaina/Wailuku 22 4.8 ( 2.9- 7.7) 280 95.2 (92.3-97.1) 302 31,038
Kahului 28 6.9 ( 4.6-10.5) 309 93.1 (89.5-95.4) 337 32,515
Upcountry/Hana 25 6.9 ( 4.3-11.1) 359 93.1 (88.9-95.7) 384 34,144
Lanai 17 6.4 ( 3.8-10.6) 190 93.6 (89.4-96.2) 207 1,895
Molokai 14 3.9 ( 2.1- 7.1) 262 96.1 (92.9-97.9) 276 8,090
Percentages are weighted to population characteristics.N = Cell Sample Size, % = Percentage, 95% C.I. = Confidence Interval at 95 percent probability level
Rows with Sample Size less than 50 or containing half-width of 95% CI greater than 10 have been suppressed.
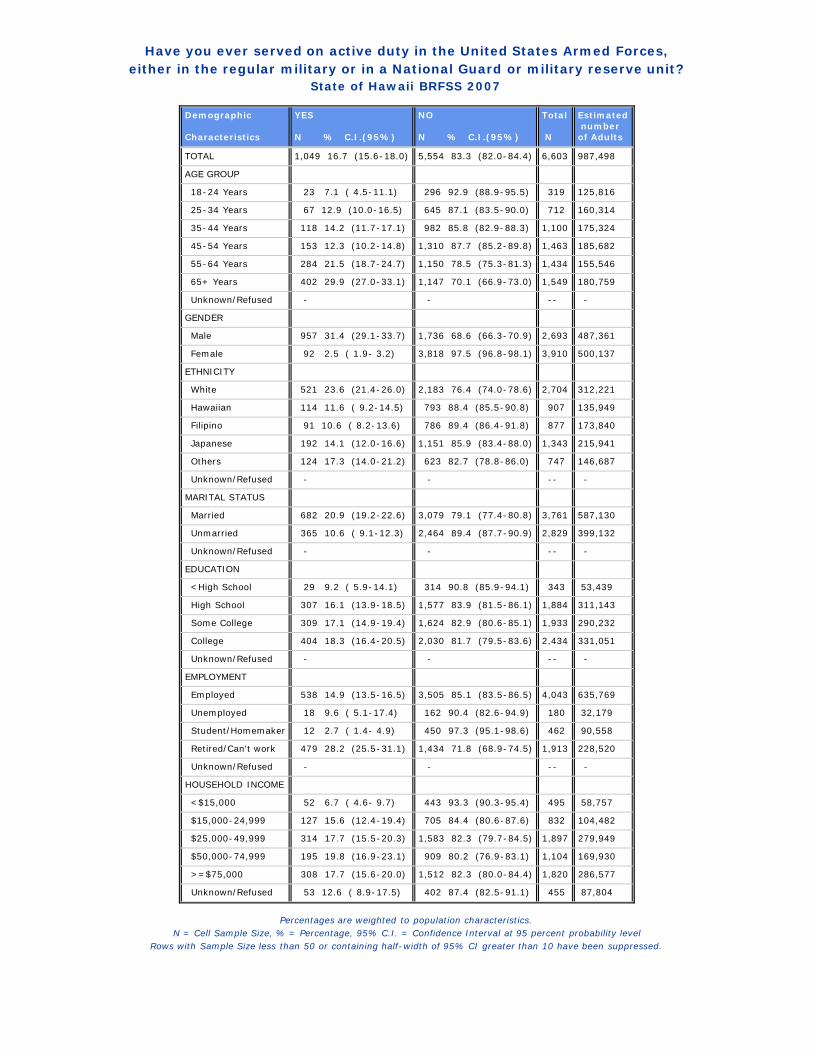
Have you ever served on active duty in the United States Armed Forces,either in the regular military or in a National Guard or military reserve unit?
State of Hawaii BRFSS 2007
Demographic Characteristics
YES N % C.I.(95%)
NO N % C.I.(95%)
Total N
Estimated numberof Adults
TOTAL 1,049 16.7 (15.6-18.0) 5,554 83.3 (82.0-84.4) 6,603 987,498
AGE GROUP
18-24 Years 23 7.1 ( 4.5-11.1) 296 92.9 (88.9-95.5) 319 125,816
25-34 Years 67 12.9 (10.0-16.5) 645 87.1 (83.5-90.0) 712 160,314
35-44 Years 118 14.2 (11.7-17.1) 982 85.8 (82.9-88.3) 1,100 175,324
45-54 Years 153 12.3 (10.2-14.8) 1,310 87.7 (85.2-89.8) 1,463 185,682
55-64 Years 284 21.5 (18.7-24.7) 1,150 78.5 (75.3-81.3) 1,434 155,546
65+ Years 402 29.9 (27.0-33.1) 1,147 70.1 (66.9-73.0) 1,549 180,759
Unknown/Refused - - -- -
GENDER
Male 957 31.4 (29.1-33.7) 1,736 68.6 (66.3-70.9) 2,693 487,361
Female 92 2.5 ( 1.9- 3.2) 3,818 97.5 (96.8-98.1) 3,910 500,137
ETHNICITY
White 521 23.6 (21.4-26.0) 2,183 76.4 (74.0-78.6) 2,704 312,221
Hawaiian 114 11.6 ( 9.2-14.5) 793 88.4 (85.5-90.8) 907 135,949
Filipino 91 10.6 ( 8.2-13.6) 786 89.4 (86.4-91.8) 877 173,840
Japanese 192 14.1 (12.0-16.6) 1,151 85.9 (83.4-88.0) 1,343 215,941
Others 124 17.3 (14.0-21.2) 623 82.7 (78.8-86.0) 747 146,687
Unknown/Refused - - -- -
MARITAL STATUS
Married 682 20.9 (19.2-22.6) 3,079 79.1 (77.4-80.8) 3,761 587,130
Unmarried 365 10.6 ( 9.1-12.3) 2,464 89.4 (87.7-90.9) 2,829 399,132
Unknown/Refused - - -- -
EDUCATION
<High School 29 9.2 ( 5.9-14.1) 314 90.8 (85.9-94.1) 343 53,439
High School 307 16.1 (13.9-18.5) 1,577 83.9 (81.5-86.1) 1,884 311,143
Some College 309 17.1 (14.9-19.4) 1,624 82.9 (80.6-85.1) 1,933 290,232
College 404 18.3 (16.4-20.5) 2,030 81.7 (79.5-83.6) 2,434 331,051
Unknown/Refused - - -- -
EMPLOYMENT
Employed 538 14.9 (13.5-16.5) 3,505 85.1 (83.5-86.5) 4,043 635,769
Unemployed 18 9.6 ( 5.1-17.4) 162 90.4 (82.6-94.9) 180 32,179
Student/Homemaker 12 2.7 ( 1.4- 4.9) 450 97.3 (95.1-98.6) 462 90,558
Retired/Can't work 479 28.2 (25.5-31.1) 1,434 71.8 (68.9-74.5) 1,913 228,520
Unknown/Refused - - -- -
HOUSEHOLD INCOME
<$15,000 52 6.7 ( 4.6- 9.7) 443 93.3 (90.3-95.4) 495 58,757
$15,000-24,999 127 15.6 (12.4-19.4) 705 84.4 (80.6-87.6) 832 104,482
$25,000-49,999 314 17.7 (15.5-20.3) 1,583 82.3 (79.7-84.5) 1,897 279,949
$50,000-74,999 195 19.8 (16.9-23.1) 909 80.2 (76.9-83.1) 1,104 169,930
>=$75,000 308 17.7 (15.6-20.0) 1,512 82.3 (80.0-84.4) 1,820 286,577
Unknown/Refused 53 12.6 ( 8.9-17.5) 402 87.4 (82.5-91.1) 455 87,804
Percentages are weighted to population characteristics.N = Cell Sample Size, % = Percentage, 95% C.I. = Confidence Interval at 95 percent probability level
Rows with Sample Size less than 50 or containing half-width of 95% CI greater than 10 have been suppressed.

Have you ever served on active duty in the United States Armed Forces,either in the regular military or in a National Guard or military reserve unit?
State of Hawaii BRFSS 2007
GEOGRAPHIC AREAS YES N % C.I.(95%)
NO N % C.I.(95%)
Total N
Estimatednumberof Adults
STATE 1,049 16.7 (15.6-18.0) 5,554 83.3 (82.0-84.4) 6,603 987,498
COUNTY
Honolulu 538 18.1 (16.6-19.8) 2,387 81.9 (80.2-83.4) 2,925 702,974
Hawaii 234 15.1 (13.1-17.4) 1,282 84.9 (82.6-86.9) 1,516 129,247
Kauai 85 13.0 (10.1-16.5) 567 87.0 (83.5-89.9) 652 47,286
Maui 192 11.3 ( 9.4-13.5) 1,318 88.7 (86.5-90.6) 1,510 107,991
HONOLULU County
North Shore/Laie 14 14.4 ( 7.6-25.7) 75 85.6 (74.3-92.4) 89 22,482
Ka'a'wa/Kahalu'u/Kaneohe 41 22.3 (16.0-30.3) 174 77.7 (69.7-84.0) 215 49,695
Kailua/Waimanalo 52 25.5 (19.5-32.6) 187 74.5 (67.4-80.5) 239 52,739
Wailae/Kahala/HawaiiKai 32 19.2 (13.2-27.0) 143 80.8 (73.0-86.8) 175 38,570
Kaimuki/Palolo/Waikiki 44 14.1 (10.1-19.3) 238 85.9 (80.7-89.9) 282 56,103
Manoa/Upper Makiki 35 16.1 (11.4-22.3) 208 83.9 (77.7-88.6) 243 45,663
Ala Moana 25 14.7 ( 9.8-21.5) 131 85.3 (78.5-90.2) 156 29,128
Nuuanu/Kalihi/MoanaLoa 29 8.9 ( 5.9-13.1) 223 91.1 (86.9-94.1) 252 67,173
Salt Lake/Foster Village 34 29.8 (21.4-40.0) 89 70.2 (60.0-78.6) 123 28,663
Aiea/Pearl City 49 17.2 (12.8-22.9) 232 82.8 (77.1-87.2) 281 69,051
Mililani/Wahiawa 69 23.5 (18.5-29.3) 228 76.5 (70.7-81.5) 297 74,550
Waipahu/Kapolei/Ewa 88 17.7 (14.1-21.9) 359 82.3 (78.1-85.9) 447 129,653
Nanakuli/Waianae 26 14.6 ( 9.1-22.6) 100 85.4 (77.4-90.9) 126 39,503
HAWAII County
North Hawaii 36 13.5 ( 9.1-19.7) 281 86.5 (80.3-90.9) 317 28,520
Hilo 71 16.8 (13.1-21.3) 357 83.2 (78.7-86.9) 428 36,390
Puna/Ka'u 67 13.4 (10.2-17.4) 362 86.6 (82.6-89.8) 429 36,409
Kona 60 16.9 (12.7-22.1) 282 83.1 (77.9-87.3) 342 27,929
KAUAI County
Hanalei/Kapa'a 42 15.4 (10.8-21.5) 258 84.6 (78.5-89.2) 300 20,139
Lihue-Waimea 43 11.2 ( 7.9-15.6) 309 88.8 (84.4-92.1) 352 27,147
MAUI County
Lahaina/Wailuku 30 8.2 ( 5.2-12.8) 273 91.8 (87.2-94.8) 303 31,052
Kahului 39 11.1 ( 7.7-15.7) 298 88.9 (84.3-92.3) 337 32,515
Upcountry/Hana 54 13.6 (10.2-18.0) 332 86.4 (82.0-89.8) 386 34,380
Lanai 32 11.9 ( 8.1-17.2) 175 88.1 (82.8-91.9) 207 1,895
Molokai 37 13.5 ( 9.3-19.3) 240 86.5 (80.7-90.7) 277 8,149
Percentages are weighted to population characteristics.N = Cell Sample Size, % = Percentage, 95% C.I. = Confidence Interval at 95 percent probability level
Rows with Sample Size less than 50 or containing half-width of 95% CI greater than 10 have been suppressed.

How often do you get the social/emotional support you need?State of Hawaii BRFSS 2007
Demographic Characteristics
Always N % C.I.(95%)
Usually N % C.I.(95%)
Sometimes N % C.I.(95%)
Rarely N % C.I.(95%)
Never N % C.I.(95%)
Total N
Estimated numberof Adults
TOTAL 3,355 52.8 (51.1-54.6) 1,531 22.1 (20.8-23.5) 910 15.5 (14.2-16.8) 261 3.6 ( 3.1- 4.3) 355 5.9 ( 5.1- 6.9) 6,412 958,984
AGE GROUP
18-24 Years 152 47.7 (40.8-54.6) 89 25.1 (19.8-31.2) 51 19.3 (14.3-25.5) 13 4.3 ( 2.2- 8.2) 8 3.6 ( 1.5- 8.6) 313 123,645
25-34 Years 391 56.3 (51.5-61.1) 174 22.5 (18.9-26.4) 86 14.3 (11.1-18.3) 17 1.9 ( 1.1- 3.4) 27 4.9 ( 3.2- 7.6) 695 156,467
35-44 Years 543 52.9 (49.0-56.7) 275 24.2 (21.1-27.5) 160 15.5 (12.8-18.8) 41 2.9 ( 2.0- 4.3) 41 4.5 ( 3.0- 6.8) 1,060 168,494
45-54 Years 728 51.8 (48.4-55.2) 354 22.5 (19.9-25.3) 205 15.2 (12.9-17.9) 59 3.7 ( 2.6- 5.3) 81 6.7 ( 4.9- 9.0) 1,427 181,445
55-64 Years 725 54.5 (50.9-58.1) 361 24.0 (21.1-27.0) 168 11.7 ( 9.5-14.2) 59 3.7 ( 2.6- 5.2) 80 6.1 ( 4.4- 8.5) 1,393 150,899
65+ Years 810 53.4 (50.1-56.7) 273 15.8 (13.7-18.1) 235 17.1 (14.7-19.9) 71 5.0 ( 3.8- 6.7) 116 8.6 ( 6.8-10.9) 1,505 175,102
Unknown/Refused - - - - - -- -
GENDER
Male 1,339 51.2 (48.5-53.8) 601 21.6 (19.7-23.7) 355 16.3 (14.2-18.5) 119 3.9 ( 3.0- 5.0) 202 7.1 ( 5.8- 8.6) 2,616 474,217
Female 2,016 54.5 (52.3-56.7) 930 22.6 (20.9-24.5) 555 14.7 (13.2-16.3) 142 3.4 ( 2.7- 4.2) 153 4.8 ( 3.8- 5.9) 3,796 484,768
ETHNICITY
White 1,393 54.6 (52.0-57.1) 778 28.6 (26.3-30.9) 283 10.2 ( 8.8-11.9) 95 3.0 ( 2.3- 4.0) 95 3.7 ( 2.6- 5.0) 2,644 304,880
Hawaiian 501 56.5 (51.7-61.2) 168 19.2 (15.8-23.1) 125 14.9 (11.6-18.8) 47 4.3 ( 2.9- 6.5) 42 5.1 ( 3.3- 8.0) 883 132,747
Filipino 388 44.0 (39.1-49.0) 133 16.1 (12.8-20.0) 206 26.9 (22.7-31.6) 32 3.5 ( 2.0- 6.0) 85 9.5 ( 7.1-12.6) 844 167,838
Japanese 710 57.2 (53.6-60.6) 287 20.9 (18.3-23.8) 167 12.4 (10.2-14.9) 46 3.5 ( 2.5- 5.0) 88 6.0 ( 4.4- 8.2) 1,298 209,439
Others 352 49.7 (44.8-54.6) 158 20.0 (16.5-24.0) 127 18.5 (14.8-22.7) 40 4.8 ( 3.3- 6.9) 45 7.1 ( 4.9-10.3) 722 141,944
Unknown/Refused - - - - - -- -
MARITAL STATUS
Married 2,071 55.7 (53.7-57.8) 865 22.7 (21.0-24.4) 454 13.5 (12.1-15.1) 95 2.8 ( 2.2- 3.5) 178 5.3 ( 4.4- 6.4) 3,663 570,587
Unmarried 1,278 48.6 (45.6-51.6) 665 21.4 (19.2-23.8) 454 18.3 (16.0-20.9) 165 4.9 ( 3.9- 6.3) 176 6.7 ( 5.3- 8.5) 2,738 387,358
Unknown/Refused - - - - - -- -
EDUCATION
<High School 134 39.1 (32.1-46.7) 26 10.5 ( 6.2-17.2) 90 28.9 (22.5-36.3) 21 6.4 ( 3.8-10.6) 49 15.1 (10.7-20.9) 320 50,080
High School 915 50.7 (47.3-54.0) 356 17.8 (15.5-20.3) 321 19.2 (16.6-22.1) 93 4.5 ( 3.3- 6.1) 138 7.8 ( 6.0-10.1) 1,823 302,416
Some College 1,015 52.7 (49.4-55.9) 448 23.5 (20.9-26.3) 259 16.2 (13.8-18.9) 73 3.5 ( 2.6- 4.7) 85 4.1 ( 3.1- 5.6) 1,880 281,739
College 1,288 57.2 (54.5-59.8) 700 26.8 (24.6-29.2) 239 9.3 ( 7.8-10.9) 74 2.5 ( 1.9- 3.4) 82 4.2 ( 3.1- 5.6) 2,383 323,669
Unknown/Refused - - - - - -- -
EMPLOYMENT
Employed 2,041 52.7 (50.5-54.9) 1,058 24.8 (23.1-26.7) 503 14.2 (12.6-16.0) 137 3.1 ( 2.4- 3.9) 181 5.1 ( 4.2- 6.4) 3,920 616,450
Unemployed - - - - - - - - - - - - - -
Student/Homemaker 232 51.9 (45.6-58.2) 108 23.9 (19.0-29.7) 83 19.2 (14.7-24.6) 10 1.1 ( 0.5- 2.7) 18 3.8 ( 2.1- 6.7) 451 88,877
Retired/Can't work 994 54.6 (51.5-57.6) 325 14.3 (12.5-16.3) 295 17.4 (15.1-19.9) 104 5.5 ( 4.3- 7.1) 145 8.2 ( 6.6-10.2) 1,863 221,998
Unknown/Refused - - - - - -- -
HOUSEHOLD INCOME
<$15,000 170 34.1 (27.8-41.1) 82 14.6 (10.5-20.0) 115 28.0 (21.8-35.2) 50 8.4 ( 5.5-12.5) 54 14.9 (10.0-21.5) 471 56,667
$15,000-24,999 388 43.2 (38.4-48.2) 143 18.4 (14.7-22.6) 163 23.4 (19.2-28.2) 48 5.7 ( 3.9- 8.2) 67 9.3 ( 6.8-12.8) 809 101,693
$25,000-49,999 941 50.7 (47.4-54.0) 436 21.6 (19.1-24.4) 284 18.1 (15.5-21.0) 74 3.2 ( 2.3- 4.4) 114 6.4 ( 5.0- 8.2) 1,849 272,068
$50,000-74,999 606 57.7 (53.5-61.7) 265 21.9 (18.8-25.3) 136 13.0 (10.4-16.1) 31 3.7 ( 2.2- 6.1) 36 3.7 ( 2.3- 6.0) 1,074 164,123
>=$75,000 1,041 58.7 (55.6-61.6) 511 27.3 (24.7-30.0) 152 8.7 ( 7.1-10.6) 40 2.1 ( 1.5- 3.1) 49 3.2 ( 2.1- 5.0) 1,793 281,970
Unknown/Refused 209 55.3 (48.4-62.0) 94 16.4 (12.7-21.0) 60 16.6 (12.0-22.6) 18 4.4 ( 2.5- 7.6) 35 7.3 ( 4.4-11.7) 416 82,463
Percentages are weighted to population characteristics.N = Cell Sample Size, % = Percentage, 95% C.I. = Confidence Interval at 95 percent probability level
Rows with Sample Size less than 50 or containing half-width of 95% CI greater than 10 have been suppressed.
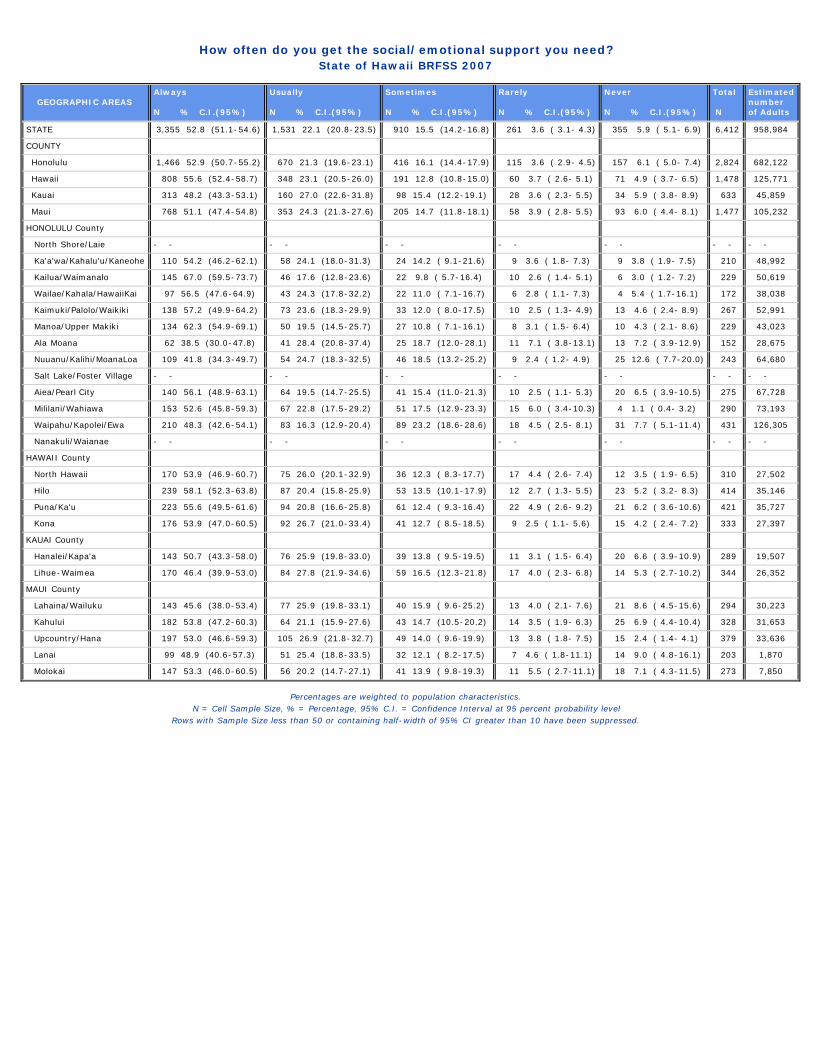
How often do you get the social/emotional support you need?State of Hawaii BRFSS 2007
GEOGRAPHIC AREAS Always N % C.I.(95%)
Usually N % C.I.(95%)
Sometimes N % C.I.(95%)
Rarely N % C.I.(95%)
Never N % C.I.(95%)
Total N
Estimatednumberof Adults
STATE 3,355 52.8 (51.1-54.6) 1,531 22.1 (20.8-23.5) 910 15.5 (14.2-16.8) 261 3.6 ( 3.1- 4.3) 355 5.9 ( 5.1- 6.9) 6,412 958,984
COUNTY
Honolulu 1,466 52.9 (50.7-55.2) 670 21.3 (19.6-23.1) 416 16.1 (14.4-17.9) 115 3.6 ( 2.9- 4.5) 157 6.1 ( 5.0- 7.4) 2,824 682,122
Hawaii 808 55.6 (52.4-58.7) 348 23.1 (20.5-26.0) 191 12.8 (10.8-15.0) 60 3.7 ( 2.6- 5.1) 71 4.9 ( 3.7- 6.5) 1,478 125,771
Kauai 313 48.2 (43.3-53.1) 160 27.0 (22.6-31.8) 98 15.4 (12.2-19.1) 28 3.6 ( 2.3- 5.5) 34 5.9 ( 3.8- 8.9) 633 45,859
Maui 768 51.1 (47.4-54.8) 353 24.3 (21.3-27.6) 205 14.7 (11.8-18.1) 58 3.9 ( 2.8- 5.5) 93 6.0 ( 4.4- 8.1) 1,477 105,232
HONOLULU County
North Shore/Laie - - - - - - - - - - - - - -
Ka'a'wa/Kahalu'u/Kaneohe 110 54.2 (46.2-62.1) 58 24.1 (18.0-31.3) 24 14.2 ( 9.1-21.6) 9 3.6 ( 1.8- 7.3) 9 3.8 ( 1.9- 7.5) 210 48,992
Kailua/Waimanalo 145 67.0 (59.5-73.7) 46 17.6 (12.8-23.6) 22 9.8 ( 5.7-16.4) 10 2.6 ( 1.4- 5.1) 6 3.0 ( 1.2- 7.2) 229 50,619
Wailae/Kahala/HawaiiKai 97 56.5 (47.6-64.9) 43 24.3 (17.8-32.2) 22 11.0 ( 7.1-16.7) 6 2.8 ( 1.1- 7.3) 4 5.4 ( 1.7-16.1) 172 38,038
Kaimuki/Palolo/Waikiki 138 57.2 (49.9-64.2) 73 23.6 (18.3-29.9) 33 12.0 ( 8.0-17.5) 10 2.5 ( 1.3- 4.9) 13 4.6 ( 2.4- 8.9) 267 52,991
Manoa/Upper Makiki 134 62.3 (54.9-69.1) 50 19.5 (14.5-25.7) 27 10.8 ( 7.1-16.1) 8 3.1 ( 1.5- 6.4) 10 4.3 ( 2.1- 8.6) 229 43,023
Ala Moana 62 38.5 (30.0-47.8) 41 28.4 (20.8-37.4) 25 18.7 (12.0-28.1) 11 7.1 ( 3.8-13.1) 13 7.2 ( 3.9-12.9) 152 28,675
Nuuanu/Kalihi/MoanaLoa 109 41.8 (34.3-49.7) 54 24.7 (18.3-32.5) 46 18.5 (13.2-25.2) 9 2.4 ( 1.2- 4.9) 25 12.6 ( 7.7-20.0) 243 64,680
Salt Lake/Foster Village - - - - - - - - - - - - - -
Aiea/Pearl City 140 56.1 (48.9-63.1) 64 19.5 (14.7-25.5) 41 15.4 (11.0-21.3) 10 2.5 ( 1.1- 5.3) 20 6.5 ( 3.9-10.5) 275 67,728
Mililani/Wahiawa 153 52.6 (45.8-59.3) 67 22.8 (17.5-29.2) 51 17.5 (12.9-23.3) 15 6.0 ( 3.4-10.3) 4 1.1 ( 0.4- 3.2) 290 73,193
Waipahu/Kapolei/Ewa 210 48.3 (42.6-54.1) 83 16.3 (12.9-20.4) 89 23.2 (18.6-28.6) 18 4.5 ( 2.5- 8.1) 31 7.7 ( 5.1-11.4) 431 126,305
Nanakuli/Waianae - - - - - - - - - - - - - -
HAWAII County
North Hawaii 170 53.9 (46.9-60.7) 75 26.0 (20.1-32.9) 36 12.3 ( 8.3-17.7) 17 4.4 ( 2.6- 7.4) 12 3.5 ( 1.9- 6.5) 310 27,502
Hilo 239 58.1 (52.3-63.8) 87 20.4 (15.8-25.9) 53 13.5 (10.1-17.9) 12 2.7 ( 1.3- 5.5) 23 5.2 ( 3.2- 8.3) 414 35,146
Puna/Ka'u 223 55.6 (49.5-61.6) 94 20.8 (16.6-25.8) 61 12.4 ( 9.3-16.4) 22 4.9 ( 2.6- 9.2) 21 6.2 ( 3.6-10.6) 421 35,727
Kona 176 53.9 (47.0-60.5) 92 26.7 (21.0-33.4) 41 12.7 ( 8.5-18.5) 9 2.5 ( 1.1- 5.6) 15 4.2 ( 2.4- 7.2) 333 27,397
KAUAI County
Hanalei/Kapa'a 143 50.7 (43.3-58.0) 76 25.9 (19.8-33.0) 39 13.8 ( 9.5-19.5) 11 3.1 ( 1.5- 6.4) 20 6.6 ( 3.9-10.9) 289 19,507
Lihue-Waimea 170 46.4 (39.9-53.0) 84 27.8 (21.9-34.6) 59 16.5 (12.3-21.8) 17 4.0 ( 2.3- 6.8) 14 5.3 ( 2.7-10.2) 344 26,352
MAUI County
Lahaina/Wailuku 143 45.6 (38.0-53.4) 77 25.9 (19.8-33.1) 40 15.9 ( 9.6-25.2) 13 4.0 ( 2.1- 7.6) 21 8.6 ( 4.5-15.6) 294 30,223
Kahului 182 53.8 (47.2-60.3) 64 21.1 (15.9-27.6) 43 14.7 (10.5-20.2) 14 3.5 ( 1.9- 6.3) 25 6.9 ( 4.4-10.4) 328 31,653
Upcountry/Hana 197 53.0 (46.6-59.3) 105 26.9 (21.8-32.7) 49 14.0 ( 9.6-19.9) 13 3.8 ( 1.8- 7.5) 15 2.4 ( 1.4- 4.1) 379 33,636
Lanai 99 48.9 (40.6-57.3) 51 25.4 (18.8-33.5) 32 12.1 ( 8.2-17.5) 7 4.6 ( 1.8-11.1) 14 9.0 ( 4.8-16.1) 203 1,870
Molokai 147 53.3 (46.0-60.5) 56 20.2 (14.7-27.1) 41 13.9 ( 9.8-19.3) 11 5.5 ( 2.7-11.1) 18 7.1 ( 4.3-11.5) 273 7,850
Percentages are weighted to population characteristics.N = Cell Sample Size, % = Percentage, 95% C.I. = Confidence Interval at 95 percent probability level
Rows with Sample Size less than 50 or containing half-width of 95% CI greater than 10 have been suppressed.

In general, how satisfied are you with your life?State of Hawaii BRFSS 2007
Demographic Characteristics
Very satisfied N % C.I.(95%)
Satisfied N % C.I.(95%)
Dissatisfied N % C.I.(95%)
Very dissatisfied N % C.I.(95%)
Total N
Estimated numberof Adults
TOTAL 3,062 45.0 (43.3-46.7) 3,112 51.3 (49.6-53.0) 210 3.0 ( 2.5- 3.7) 51 0.7 ( 0.4- 1.0) 6,435 961,393
AGE GROUP
18-24 Years 114 32.1 (26.1-38.6) 187 63.0 (56.2-69.3) 11 4.3 ( 2.2- 8.2) 2 0.6 ( 0.1- 2.5) 314 124,136
25-34 Years 321 44.0 (39.3-48.9) 349 52.5 (47.7-57.3) 23 3.0 ( 1.8- 5.1) 2 0.5 ( 0.1- 1.9) 695 156,337
35-44 Years 464 45.5 (41.6-49.4) 555 50.9 (47.0-54.8) 34 3.0 ( 2.0- 4.5) 9 0.6 ( 0.3- 1.5) 1,062 168,917
45-54 Years 676 47.4 (44.0-50.8) 675 48.5 (45.1-51.9) 55 2.9 ( 2.0- 4.2) 18 1.1 ( 0.5- 2.6) 1,424 180,605
55-64 Years 721 49.4 (45.8-53.0) 615 47.0 (43.4-50.6) 45 2.4 ( 1.7- 3.4) 18 1.2 ( 0.6- 2.2) 1,399 151,622
65+ Years 762 48.7 (45.4-52.0) 714 48.4 (45.1-51.7) 42 2.8 ( 1.9- 4.1) 2 0.1 ( 0.0- 0.2) 1,520 176,626
Unknown/Refused - - - - -- -
GENDER
Male 1,208 43.1 (40.5-45.7) 1,301 52.8 (50.2-55.5) 97 3.5 ( 2.6- 4.6) 20 0.7 ( 0.3- 1.3) 2,626 475,416
Female 1,854 46.9 (44.7-49.1) 1,811 49.8 (47.6-52.1) 113 2.6 ( 2.0- 3.4) 31 0.7 ( 0.4- 1.1) 3,809 485,977
ETHNICITY
White 1,397 50.6 (48.0-53.2) 1,134 46.1 (43.5-48.8) 94 2.5 ( 2.0- 3.3) 24 0.7 ( 0.4- 1.3) 2,649 305,363
Hawaiian 412 44.6 (40.0-49.3) 431 50.1 (45.3-54.8) 35 4.4 ( 2.8- 7.0) 9 0.9 ( 0.4- 2.2) 887 133,585
Filipino 342 37.8 (33.2-42.7) 482 58.9 (54.0-63.7) 23 3.1 ( 1.9- 5.2) 2 0.1 ( 0.0- 0.5) 849 168,415
Japanese 594 46.2 (42.7-49.8) 676 50.6 (47.0-54.1) 28 2.7 ( 1.6- 4.5) 7 0.5 ( 0.2- 1.3) 1,305 209,940
Others 308 39.8 (35.3-44.5) 376 55.8 (51.0-60.5) 29 3.0 ( 1.8- 5.1) 9 1.4 ( 0.5- 3.4) 722 141,796
Unknown/Refused - - - - -- -
MARITAL STATUS
Married 1,978 51.1 (49.0-53.2) 1,618 46.8 (44.7-48.8) 66 1.8 ( 1.3- 2.5) 10 0.3 ( 0.1- 0.8) 3,672 571,238
Unmarried 1,079 36.0 (33.3-38.9) 1,488 58.0 (55.0-60.9) 144 4.8 ( 3.7- 6.1) 41 1.2 ( 0.8- 1.9) 2,752 389,116
Unknown/Refused - - - - -- -
EDUCATION
<High School 112 35.5 (28.7-42.9) 197 55.8 (48.2-63.2) 14 6.5 ( 3.1-13.1) 5 2.2 ( 0.8- 6.4) 328 50,755
High School 725 35.9 (32.9-39.1) 1,013 59.3 (56.0-62.4) 74 3.9 ( 2.8- 5.3) 16 0.9 ( 0.4- 1.9) 1,828 302,486
Some College 881 43.8 (40.6-46.9) 936 53.2 (50.0-56.4) 56 2.6 ( 1.7- 3.8) 17 0.4 ( 0.3- 0.8) 1,890 283,657
College 1,339 55.9 (53.3-58.6) 963 41.6 (39.0-44.3) 66 2.1 ( 1.5- 2.8) 13 0.4 ( 0.2- 0.8) 2,381 323,079
Unknown/Refused - - - - -- -
EMPLOYMENT
Employed 1,890 45.2 (43.0-47.3) 1,924 51.9 (49.7-54.0) 98 2.5 ( 1.9- 3.3) 18 0.5 ( 0.3- 1.0) 3,930 618,191
Unemployed - - - - - - - - - - - -
Student/Homemaker 218 45.1 (39.0-51.4) 218 52.2 (45.9-58.4) 15 2.3 ( 1.1- 4.7) 2 0.5 ( 0.1- 2.2) 453 88,800
Retired/Can't work 906 47.0 (43.9-50.0) 864 48.2 (45.1-51.3) 81 3.9 ( 2.9- 5.3) 23 1.0 ( 0.5- 1.7) 1,874 222,804
Unknown/Refused - - - - -- -
HOUSEHOLD INCOME
<$15,000 125 21.3 (16.7-26.9) 291 62.8 (55.8-69.4) 45 11.0 ( 6.8-17.2) 16 4.9 ( 2.3- 9.9) 477 57,489
$15,000-24,999 293 33.9 (29.4-38.6) 463 60.0 (55.1-64.7) 37 4.6 ( 3.0- 7.1) 15 1.5 ( 0.7- 3.0) 808 100,513
$25,000-49,999 791 38.6 (35.5-41.8) 997 58.5 (55.3-61.6) 55 2.5 ( 1.8- 3.5) 12 0.4 ( 0.2- 1.0) 1,855 273,242
$50,000-74,999 561 50.5 (46.4-54.7) 483 46.7 (42.6-50.9) 31 2.5 ( 1.6- 3.8) 3 0.3 ( 0.1- 0.8) 1,078 164,515
>=$75,000 1,106 59.1 (56.0-62.1) 656 39.5 (36.5-42.6) 26 1.2 ( 0.7- 2.1) 4 0.2 ( 0.0- 0.6) 1,792 281,644
Unknown/Refused 186 37.0 (30.9-43.5) 222 58.4 (51.7-64.8) 16 4.4 ( 2.2- 8.6) 1 0.2 ( 0.0- 1.2) 425 83,989
Percentages are weighted to population characteristics.N = Cell Sample Size, % = Percentage, 95% C.I. = Confidence Interval at 95 percent probability level
Rows with Sample Size less than 50 or containing half-width of 95% CI greater than 10 have been suppressed.

In general, how satisfied are you with your life?State of Hawaii BRFSS 2007
GEOGRAPHIC AREAS Very satisfied N % C.I.(95%)
Satisfied N % C.I.(95%)
Dissatisfied N % C.I.(95%)
Very dissatisfied N % C.I.(95%)
Total N
Estimatednumberof Adults
STATE 3,062 45.0 (43.3-46.7) 3,112 51.3 (49.6-53.0) 210 3.0 ( 2.5- 3.7) 51 0.7 ( 0.4- 1.0) 6,435 961,393
COUNTY
Honolulu 1,328 44.3 (42.1-46.5) 1,402 52.2 (49.9-54.4) 86 2.8 ( 2.2- 3.7) 20 0.7 ( 0.4- 1.2) 2,836 683,885
Hawaii 691 44.2 (41.1-47.4) 723 50.7 (47.6-53.9) 54 4.3 ( 2.9- 6.2) 16 0.8 ( 0.4- 1.5) 1,484 126,133
Kauai 298 45.0 (40.2-49.9) 309 51.6 (46.7-56.5) 22 2.7 ( 1.6- 4.6) 6 0.6 ( 0.3- 1.5) 635 45,799
Maui 745 50.4 (46.7-54.1) 678 46.3 (42.6-50.0) 48 2.9 ( 2.0- 4.1) 9 0.4 ( 0.2- 0.9) 1,480 105,576
HONOLULU County
North Shore/Laie - - - - - - - - - - - -
Ka'a'wa/Kahalu'u/Kaneohe 117 52.0 (43.9-59.9) 86 44.8 (36.9-53.0) 7 2.5 ( 1.1- 5.6) 1 0.7 ( 0.1- 5.0) 211 49,072
Kailua/Waimanalo 141 60.3 (52.5-67.7) 80 37.0 (29.7-44.9) 7 2.5 ( 1.1- 5.5) 1 0.1 ( 0.0- 1.0) 229 50,785
Wailae/Kahala/HawaiiKai 97 56.4 (47.6-64.9) 69 41.3 (32.9-50.3) 5 1.7 ( 0.6- 4.4) 1 0.5 ( 0.1- 3.7) 172 38,038
Kaimuki/Palolo/Waikiki 126 45.3 (38.2-52.6) 141 53.1 (45.8-60.3) 3 1.0 ( 0.2- 3.9) 1 0.6 ( 0.1- 4.2) 271 53,785
Manoa/Upper Makiki 111 50.6 (43.0-58.2) 110 47.5 (40.0-55.2) 6 1.9 ( 0.8- 4.3) 227 42,694
Ala Moana 52 31.9 (23.9-41.0) 92 63.2 (54.0-71.6) 8 4.4 ( 2.0- 9.4) 1 0.5 ( 0.1- 3.5) 153 28,795
Nuuanu/Kalihi/MoanaLoa 96 35.0 (27.9-42.7) 135 59.2 (51.3-66.7) 11 4.1 ( 2.0- 8.3) 3 1.7 ( 0.4- 6.8) 245 64,689
Salt Lake/Foster Village - - - - - - - - - - - -
Aiea/Pearl City 122 45.5 (38.4-52.8) 145 51.8 (44.5-59.0) 7 2.4 ( 0.9- 6.4) 2 0.4 ( 0.1- 1.6) 276 68,021
Mililani/Wahiawa 127 42.1 (35.7-48.8) 151 52.2 (45.5-58.8) 8 4.4 ( 2.1- 9.1) 4 1.3 ( 0.4- 4.1) 290 73,087
Waipahu/Kapolei/Ewa 186 38.1 (32.8-43.6) 233 58.7 (53.1-64.1) 13 3.1 ( 1.6- 6.1) 1 0.1 ( 0.0- 0.6) 433 126,359
Nanakuli/Waianae - - - - - - - - - - - -
HAWAII County
North Hawaii 136 39.1 (32.7-45.9) 162 57.1 (50.3-63.7) 11 3.0 ( 1.5- 5.9) 4 0.8 ( 0.3- 2.2) 313 27,677
Hilo 195 46.4 (40.7-52.2) 203 48.7 (42.9-54.5) 13 3.9 ( 2.1- 7.2) 4 1.0 ( 0.3- 3.9) 415 35,160
Puna/Ka'u 186 42.7 (36.8-48.8) 208 50.1 (44.0-56.2) 21 6.5 ( 3.3-12.6) 6 0.7 ( 0.3- 1.6) 421 35,727
Kona 174 48.6 (42.0-55.3) 150 47.7 (41.1-54.5) 9 3.0 ( 1.4- 6.7) 2 0.6 ( 0.1- 2.4) 335 27,569
KAUAI County
Hanalei/Kapa'a 142 44.9 (37.9-52.2) 135 50.8 (43.5-58.1) 10 3.5 ( 1.6- 7.4) 3 0.7 ( 0.2- 2.5) 290 19,406
Lihue-Waimea 156 45.0 (38.6-51.7) 174 52.2 (45.6-58.8) 12 2.2 ( 1.1- 4.4) 3 0.5 ( 0.2- 1.8) 345 26,393
MAUI County
Lahaina/Wailuku 147 52.6 (44.6-60.3) 136 45.6 (37.9-53.5) 8 1.6 ( 0.7- 3.2) 2 0.3 ( 0.1- 1.1) 293 30,207
Kahului 161 47.7 (41.2-54.3) 153 47.5 (41.0-54.1) 11 3.9 ( 2.0- 7.5) 4 0.8 ( 0.3- 2.2) 329 31,702
Upcountry/Hana 199 51.0 (44.7-57.3) 161 45.4 (39.1-51.8) 19 3.3 ( 2.0- 5.7) 2 0.3 ( 0.1- 1.3) 381 33,943
Lanai 94 42.2 (34.3-50.4) 107 57.1 (48.8-65.0) 2 0.5 ( 0.1- 1.9) 1 0.2 ( 0.0- 1.7) 204 1,875
Molokai 144 52.5 (45.2-59.6) 121 45.1 (38.0-52.4) 8 2.4 ( 1.1- 5.3) 273 7,850
Percentages are weighted to population characteristics.N = Cell Sample Size, % = Percentage, 95% C.I. = Confidence Interval at 95 percent probability level
Rows with Sample Size less than 50 or containing half-width of 95% CI greater than 10 have been suppressed.
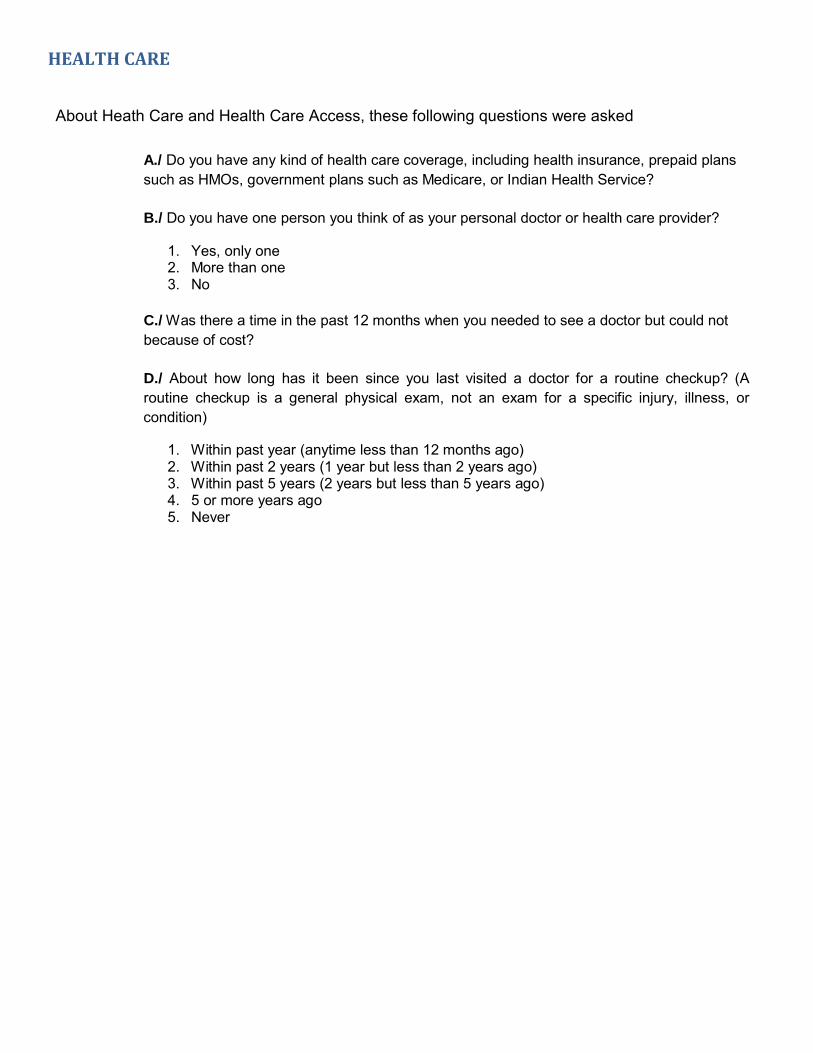
HEALTH CARE
About Heath Care and Health Care Access, these following questions were asked
A./ Do you have any kind of health care coverage, including health insurance, prepaid plans such as HMOs, government plans such as Medicare, or Indian Health Service?
B./ Do you have one person you think of as your personal doctor or health care provider?
1. Yes, only one 2. More than one 3. No
C./ Was there a time in the past 12 months when you needed to see a doctor but could not because of cost?
D./ About how long has it been since you last visited a doctor for a routine checkup? (A routine checkup is a general physical exam, not an exam for a specific injury, illness, or condition)
1. Within past year (anytime less than 12 months ago) 2. Within past 2 years (1 year but less than 2 years ago) 3. Within past 5 years (2 years but less than 5 years ago) 4. 5 or more years ago 5. Never

Do you have any kind of health care coverage?State of Hawaii BRFSS 2007
Demographic Characteristics
YES N % C.I.(95%)
NO N % C.I.(95%)
Total N
Estimated numberof Adults
TOTAL 6,195 94.0 (93.1-94.9) 401 6.0 ( 5.1- 6.9) 6,596 986,558
AGE GROUP
18-24 Years 272 87.4 (81.9-91.4) 43 12.6 ( 8.6-18.1) 315 125,110
25-34 Years 657 92.4 (89.2-94.7) 55 7.6 ( 5.3-10.8) 712 160,314
35-44 Years 1,025 94.7 (92.8-96.1) 75 5.3 ( 3.9- 7.2) 1,100 175,324
45-54 Years 1,345 93.7 (92.0-95.1) 117 6.3 ( 4.9- 8.0) 1,462 185,563
55-64 Years 1,333 94.6 (92.8-95.9) 100 5.4 ( 4.1- 7.2) 1,433 155,475
65+ Years 1,537 99.1 (98.4-99.6) 11 0.9 ( 0.4- 1.6) 1,548 180,715
Unknown/Refused - - -- -
GENDER
Male 2,482 92.7 (91.0-94.0) 206 7.3 ( 6.0- 9.0) 2,688 486,490
Female 3,713 95.4 (94.2-96.3) 195 4.6 ( 3.7- 5.8) 3,908 500,069
ETHNICITY
White 2,496 92.7 (91.0-94.1) 207 7.3 ( 5.9- 9.0) 2,703 312,140
Hawaiian 848 93.4 (90.4-95.5) 57 6.6 ( 4.5- 9.6) 905 135,759
Filipino 837 95.0 (91.6-97.1) 39 5.0 ( 2.9- 8.4) 876 173,815
Japanese 1,308 96.7 (95.1-97.7) 35 3.3 ( 2.3- 4.9) 1,343 215,941
Others 684 92.4 (89.3-94.7) 60 7.6 ( 5.3-10.7) 744 146,042
Unknown/Refused - - -- -
MARITAL STATUS
Married 3,620 96.6 (95.7-97.3) 140 3.4 ( 2.7- 4.3) 3,760 587,011
Unmarried 2,563 90.3 (88.2-92.0) 261 9.7 ( 8.0-11.8) 2,824 398,355
Unknown/Refused - - -- -
EDUCATION
<High School 318 93.3 (88.7-96.1) 24 6.7 ( 3.9-11.3) 342 53,328
High School 1,758 92.3 (89.9-94.2) 122 7.7 ( 5.8-10.1) 1,880 310,848
Some College 1,789 93.0 (91.1-94.5) 143 7.0 ( 5.5- 8.9) 1,932 289,742
College 2,322 96.7 (95.8-97.4) 111 3.3 ( 2.6- 4.2) 2,433 331,007
Unknown/Refused - - -- -
EMPLOYMENT
Employed 3,772 94.4 (93.3-95.4) 268 5.6 ( 4.6- 6.7) 4,040 635,087
Unemployed - - - - - - - -
Student/Homemaker 421 91.2 (87.0-94.2) 40 8.8 ( 5.8-13.0) 461 90,534
Retired/Can't work 1,863 97.0 (95.7-98.0) 49 3.0 ( 2.0- 4.3) 1,912 228,449
Unknown/Refused - - -- -
HOUSEHOLD INCOME
<$15,000 438 89.5 (85.0-92.7) 56 10.5 ( 7.3-15.0) 494 58,638
$15,000-24,999 719 86.5 (82.5-89.6) 112 13.5 (10.4-17.5) 831 104,411
$25,000-49,999 1,777 94.2 (92.5-95.6) 119 5.8 ( 4.4- 7.5) 1,896 279,868
$50,000-74,999 1,055 94.7 (92.1-96.5) 49 5.3 ( 3.5- 7.9) 1,104 169,930
>=$75,000 1,781 97.7 (96.5-98.5) 39 2.3 ( 1.5- 3.5) 1,820 286,577
Unknown/Refused 425 92.0 (85.1-95.8) 26 8.0 ( 4.2-14.9) 451 87,134
Percentages are weighted to population characteristics.N = Cell Sample Size, % = Percentage, 95% C.I. = Confidence Interval at 95 percent probability level
Rows with Sample Size less than 50 or containing half-width of 95% CI greater than 10 have been suppressed.

Do you have any kind of health care coverage?State of Hawaii BRFSS 2007
GEOGRAPHIC AREAS YES N % C.I.(95%)
NO N % C.I.(95%)
Total N
Estimatednumberof Adults
STATE 6,195 94.0 (93.1-94.9) 401 6.0 ( 5.1- 6.9) 6,596 986,558
COUNTY
Honolulu 2,808 94.8 (93.4-95.8) 116 5.2 ( 4.2- 6.6) 2,924 702,483
Hawaii 1,395 92.2 (90.4-93.7) 118 7.8 ( 6.3- 9.6) 1,513 129,005
Kauai 597 92.7 (89.8-94.8) 55 7.3 ( 5.2-10.2) 652 47,286
Maui 1,395 92.0 (89.8-93.7) 112 8.0 ( 6.3-10.2) 1,507 107,785
HONOLULU County
North Shore/Laie 87 97.5 (87.9-99.5) 2 2.5 ( 0.5-12.1) 89 22,482
Ka'a'wa/Kahalu'u/Kaneohe 205 93.5 (87.7-96.6) 10 6.5 ( 3.4-12.3) 215 49,695
Kailua/Waimanalo 234 97.7 (94.3-99.1) 5 2.3 ( 0.9- 5.7) 239 52,739
Wailae/Kahala/HawaiiKai 169 96.3 (90.0-98.7) 6 3.7 ( 1.3-10.0) 175 38,570
Kaimuki/Palolo/Waikiki 270 96.6 (93.6-98.2) 12 3.4 ( 1.8- 6.4) 282 56,103
Manoa/Upper Makiki 236 97.4 (94.4-98.9) 7 2.6 ( 1.1- 5.6) 243 45,663
Ala Moana 148 96.1 (92.0-98.1) 8 3.9 ( 1.9- 8.0) 156 29,128
Nuuanu/Kalihi/MoanaLoa 246 97.9 (94.7-99.2) 6 2.1 ( 0.8- 5.3) 252 67,173
Salt Lake/Foster Village 119 97.4 (91.8-99.2) 3 2.6 ( 0.8- 8.2) 122 28,172
Aiea/Pearl City 272 93.6 (85.4-97.3) 9 6.4 ( 2.7-14.6) 281 69,051
Mililani/Wahiawa 284 94.0 (89.3-96.7) 13 6.0 ( 3.3-10.7) 297 74,550
Waipahu/Kapolei/Ewa 424 94.0 (90.6-96.2) 23 6.0 ( 3.8- 9.4) 447 129,653
Nanakuli/Waianae - - - - - - - -
HAWAII County
North Hawaii 299 94.9 (91.3-97.1) 17 5.1 ( 2.9- 8.7) 316 28,439
Hilo 404 96.2 (93.7-97.7) 22 3.8 ( 2.3- 6.3) 426 36,227
Puna/Ka'u 370 84.9 (79.9-88.8) 59 15.1 (11.2-20.1) 429 36,409
Kona 322 94.0 (90.3-96.4) 20 6.0 ( 3.6- 9.7) 342 27,929
KAUAI County
Hanalei/Kapa'a 264 90.0 (85.4-93.3) 36 10.0 ( 6.7-14.6) 300 20,139
Lihue-Waimea 333 94.7 (90.4-97.1) 19 5.3 ( 2.9- 9.6) 352 27,147
MAUI County
Lahaina/Wailuku 287 93.4 (88.4-96.4) 16 6.6 ( 3.6-11.6) 303 31,052
Kahului 319 94.9 (90.8-97.2) 18 5.1 ( 2.8- 9.2) 337 32,515
Upcountry/Hana 344 88.7 (84.2-92.0) 41 11.3 ( 8.0-15.8) 385 34,309
Lanai 196 94.7 (89.8-97.3) 10 5.3 ( 2.7-10.2) 206 1,871
Molokai 249 88.0 (80.9-92.7) 27 12.0 ( 7.3-19.1) 276 8,038
Percentages are weighted to population characteristics.N = Cell Sample Size, % = Percentage, 95% C.I. = Confidence Interval at 95 percent probability level
Rows with Sample Size less than 50 or containing half-width of 95% CI greater than 10 have been suppressed.
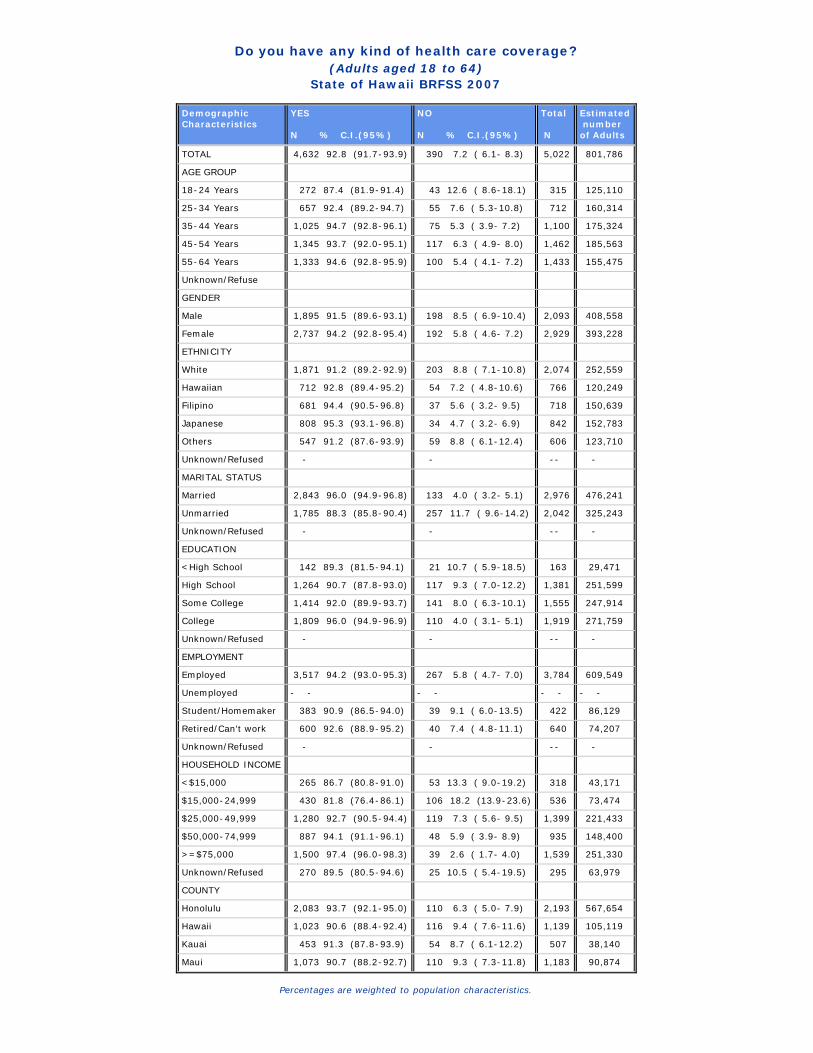
Do you have any kind of health care coverage?(Adults aged 18 to 64)
State of Hawaii BRFSS 2007
DemographicCharacteristics
YES N % C.I.(95%)
NO N % C.I.(95%)
Total N
Estimated numberof Adults
TOTAL 4,632 92.8 (91.7-93.9) 390 7.2 ( 6.1- 8.3) 5,022 801,786
AGE GROUP
18-24 Years 272 87.4 (81.9-91.4) 43 12.6 ( 8.6-18.1) 315 125,110
25-34 Years 657 92.4 (89.2-94.7) 55 7.6 ( 5.3-10.8) 712 160,314
35-44 Years 1,025 94.7 (92.8-96.1) 75 5.3 ( 3.9- 7.2) 1,100 175,324
45-54 Years 1,345 93.7 (92.0-95.1) 117 6.3 ( 4.9- 8.0) 1,462 185,563
55-64 Years 1,333 94.6 (92.8-95.9) 100 5.4 ( 4.1- 7.2) 1,433 155,475
Unknown/Refuse
GENDER
Male 1,895 91.5 (89.6-93.1) 198 8.5 ( 6.9-10.4) 2,093 408,558
Female 2,737 94.2 (92.8-95.4) 192 5.8 ( 4.6- 7.2) 2,929 393,228
ETHNICITY
White 1,871 91.2 (89.2-92.9) 203 8.8 ( 7.1-10.8) 2,074 252,559
Hawaiian 712 92.8 (89.4-95.2) 54 7.2 ( 4.8-10.6) 766 120,249
Filipino 681 94.4 (90.5-96.8) 37 5.6 ( 3.2- 9.5) 718 150,639
Japanese 808 95.3 (93.1-96.8) 34 4.7 ( 3.2- 6.9) 842 152,783
Others 547 91.2 (87.6-93.9) 59 8.8 ( 6.1-12.4) 606 123,710
Unknown/Refused - - -- -
MARITAL STATUS
Married 2,843 96.0 (94.9-96.8) 133 4.0 ( 3.2- 5.1) 2,976 476,241
Unmarried 1,785 88.3 (85.8-90.4) 257 11.7 ( 9.6-14.2) 2,042 325,243
Unknown/Refused - - -- -
EDUCATION
<High School 142 89.3 (81.5-94.1) 21 10.7 ( 5.9-18.5) 163 29,471
High School 1,264 90.7 (87.8-93.0) 117 9.3 ( 7.0-12.2) 1,381 251,599
Some College 1,414 92.0 (89.9-93.7) 141 8.0 ( 6.3-10.1) 1,555 247,914
College 1,809 96.0 (94.9-96.9) 110 4.0 ( 3.1- 5.1) 1,919 271,759
Unknown/Refused - - -- -
EMPLOYMENT
Employed 3,517 94.2 (93.0-95.3) 267 5.8 ( 4.7- 7.0) 3,784 609,549
Unemployed - - - - - - - -
Student/Homemaker 383 90.9 (86.5-94.0) 39 9.1 ( 6.0-13.5) 422 86,129
Retired/Can't work 600 92.6 (88.9-95.2) 40 7.4 ( 4.8-11.1) 640 74,207
Unknown/Refused - - -- -
HOUSEHOLD INCOME
<$15,000 265 86.7 (80.8-91.0) 53 13.3 ( 9.0-19.2) 318 43,171
$15,000-24,999 430 81.8 (76.4-86.1) 106 18.2 (13.9-23.6) 536 73,474
$25,000-49,999 1,280 92.7 (90.5-94.4) 119 7.3 ( 5.6- 9.5) 1,399 221,433
$50,000-74,999 887 94.1 (91.1-96.1) 48 5.9 ( 3.9- 8.9) 935 148,400
>=$75,000 1,500 97.4 (96.0-98.3) 39 2.6 ( 1.7- 4.0) 1,539 251,330
Unknown/Refused 270 89.5 (80.5-94.6) 25 10.5 ( 5.4-19.5) 295 63,979
COUNTY
Honolulu 2,083 93.7 (92.1-95.0) 110 6.3 ( 5.0- 7.9) 2,193 567,654
Hawaii 1,023 90.6 (88.4-92.4) 116 9.4 ( 7.6-11.6) 1,139 105,119
Kauai 453 91.3 (87.8-93.9) 54 8.7 ( 6.1-12.2) 507 38,140
Maui 1,073 90.7 (88.2-92.7) 110 9.3 ( 7.3-11.8) 1,183 90,874
Percentages are weighted to population characteristics.

Do you have one person or more than one you think of as your personal doctor(s) / health careprovider?
State of Hawaii BRFSS 2007
Demographic Characteristics
Yes, only one N % C.I.(95%)
Yes, more than one N % C.I.(95%)
None N % C.I.(95%)
Total N
Estimated numberof Adults
TOTAL 4,667 69.7 (68.1-71.3) 1,193 18.4 (17.1-19.7) 735 11.9 (10.7-13.1) 6,595 986,335
AGE GROUP
18-24 Years 169 53.5 (46.6-60.2) 68 21.3 (16.3-27.3) 79 25.3 (19.8-31.7) 316 125,043
25-34 Years 444 64.5 (59.8-68.9) 138 17.5 (14.4-21.1) 130 18.0 (14.4-22.2) 712 160,314
35-44 Years 763 70.9 (67.4-74.1) 192 16.8 (14.3-19.7) 145 12.3 (10.1-14.9) 1,100 175,324
45-54 Years 1,062 75.4 (72.5-78.1) 233 15.1 (12.9-17.6) 166 9.5 ( 7.8-11.4) 1,461 185,625
55-64 Years 1,054 76.0 (73.0-78.8) 240 16.8 (14.4-19.6) 139 7.2 ( 5.8- 8.9) 1,433 155,511
65+ Years 1,159 73.3 (70.3-76.2) 314 23.2 (20.4-26.2) 74 3.5 ( 2.6- 4.6) 1,547 180,460
Unknown/Refused - - - -- -
GENDER
Male 1,867 68.3 (65.8-70.8) 426 15.9 (14.2-17.9) 395 15.7 (13.7-17.9) 2,688 486,558
Female 2,800 71.1 (69.0-73.0) 767 20.8 (19.1-22.6) 340 8.2 ( 7.0- 9.5) 3,907 499,776
ETHNICITY
White 1,823 63.8 (61.2-66.3) 499 21.1 (19.0-23.3) 382 15.1 (13.2-17.3) 2,704 312,221
Hawaiian 658 72.3 (68.0-76.2) 139 14.3 (11.5-17.6) 107 13.4 (10.5-17.0) 904 135,850
Filipino 638 71.2 (66.4-75.5) 168 18.6 (15.3-22.5) 68 10.2 ( 7.1-14.4) 874 173,178
Japanese 1,016 76.0 (72.8-79.0) 252 17.4 (15.0-20.1) 75 6.6 ( 4.7- 9.2) 1,343 215,941
Others 514 68.7 (64.2-73.0) 133 17.9 (14.5-21.8) 98 13.4 (10.5-16.9) 745 146,283
Unknown/Refused - - - -- -
MARITAL STATUS
Married 2,718 72.8 (71.0-74.5) 715 19.3 (17.7-20.9) 326 7.9 ( 6.9- 9.1) 3,759 586,827
Unmarried 1,940 65.2 (62.2-68.0) 475 17.1 (15.0-19.4) 408 17.7 (15.4-20.3) 2,823 398,271
Unknown/Refused - - - -- -
EDUCATION
<High School 237 69.3 (62.1-75.6) 65 21.6 (16.0-28.6) 39 9.1 ( 6.0-13.5) 341 53,322
High School 1,306 66.9 (63.7-70.0) 344 19.5 (17.0-22.3) 230 13.6 (11.3-16.1) 1,880 310,994
Some College 1,346 68.2 (65.0-71.2) 362 18.1 (15.9-20.5) 223 13.8 (11.4-16.6) 1,931 289,335
College 1,773 73.9 (71.6-76.1) 419 16.9 (15.1-18.9) 242 9.1 ( 7.7-10.8) 2,434 331,051
Unknown/Refused - - - -- -
EMPLOYMENT
Employed 2,846 70.4 (68.4-72.4) 657 15.9 (14.5-17.5) 534 13.7 (12.1-15.3) 4,037 634,956
Unemployed - - - - - - - - - -
Student/Homemaker 300 63.1 (56.8-69.0) 101 24.9 (19.7-30.9) 60 12.0 ( 8.6-16.6) 461 90,501
Retired/Can't work 1,411 73.3 (70.6-75.9) 402 22.7 (20.2-25.3) 99 4.0 ( 3.1- 5.2) 1,912 228,227
Unknown/Refused - - - -- -
HOUSEHOLD INCOME
<$15,000 339 65.7 (58.8-71.9) 92 21.4 (16.0-27.9) 64 13.0 ( 9.3-17.7) 495 58,757
$15,000-24,999 543 64.7 (59.8-69.2) 152 18.1 (14.8-21.8) 134 17.3 (13.6-21.7) 829 104,391
$25,000-49,999 1,357 70.9 (67.9-73.8) 317 16.7 (14.5-19.1) 221 12.4 (10.3-14.9) 1,895 279,338
$50,000-74,999 809 73.0 (69.2-76.4) 193 18.2 (15.3-21.7) 102 8.8 ( 6.9-11.2) 1,104 169,930
>=$75,000 1,324 70.7 (67.7-73.6) 327 17.8 (15.7-20.1) 169 11.5 ( 9.2-14.2) 1,820 286,577
Unknown/Refused 295 65.0 (58.4-71.1) 112 24.5 (19.3-30.6) 45 10.5 ( 6.9-15.6) 452 87,343
Percentages are weighted to population characteristics.N = Cell Sample Size, % = Percentage, 95% C.I. = Confidence Interval at 95 percent probability level
Rows with Sample Size less than 50 or containing half-width of 95% CI greater than 10 have been suppressed.
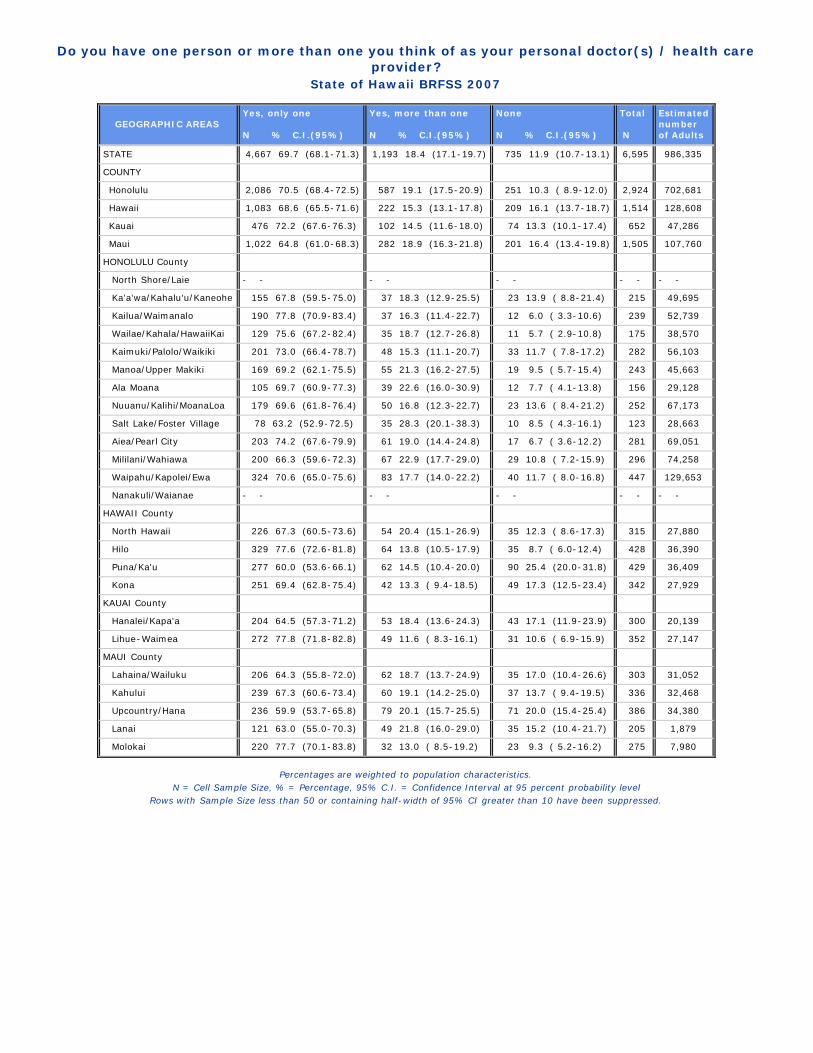
Do you have one person or more than one you think of as your personal doctor(s) / health careprovider?
State of Hawaii BRFSS 2007
GEOGRAPHIC AREAS Yes, only one N % C.I.(95%)
Yes, more than one N % C.I.(95%)
None N % C.I.(95%)
Total N
Estimatednumberof Adults
STATE 4,667 69.7 (68.1-71.3) 1,193 18.4 (17.1-19.7) 735 11.9 (10.7-13.1) 6,595 986,335
COUNTY
Honolulu 2,086 70.5 (68.4-72.5) 587 19.1 (17.5-20.9) 251 10.3 ( 8.9-12.0) 2,924 702,681
Hawaii 1,083 68.6 (65.5-71.6) 222 15.3 (13.1-17.8) 209 16.1 (13.7-18.7) 1,514 128,608
Kauai 476 72.2 (67.6-76.3) 102 14.5 (11.6-18.0) 74 13.3 (10.1-17.4) 652 47,286
Maui 1,022 64.8 (61.0-68.3) 282 18.9 (16.3-21.8) 201 16.4 (13.4-19.8) 1,505 107,760
HONOLULU County
North Shore/Laie - - - - - - - - - -
Ka'a'wa/Kahalu'u/Kaneohe 155 67.8 (59.5-75.0) 37 18.3 (12.9-25.5) 23 13.9 ( 8.8-21.4) 215 49,695
Kailua/Waimanalo 190 77.8 (70.9-83.4) 37 16.3 (11.4-22.7) 12 6.0 ( 3.3-10.6) 239 52,739
Wailae/Kahala/HawaiiKai 129 75.6 (67.2-82.4) 35 18.7 (12.7-26.8) 11 5.7 ( 2.9-10.8) 175 38,570
Kaimuki/Palolo/Waikiki 201 73.0 (66.4-78.7) 48 15.3 (11.1-20.7) 33 11.7 ( 7.8-17.2) 282 56,103
Manoa/Upper Makiki 169 69.2 (62.1-75.5) 55 21.3 (16.2-27.5) 19 9.5 ( 5.7-15.4) 243 45,663
Ala Moana 105 69.7 (60.9-77.3) 39 22.6 (16.0-30.9) 12 7.7 ( 4.1-13.8) 156 29,128
Nuuanu/Kalihi/MoanaLoa 179 69.6 (61.8-76.4) 50 16.8 (12.3-22.7) 23 13.6 ( 8.4-21.2) 252 67,173
Salt Lake/Foster Village 78 63.2 (52.9-72.5) 35 28.3 (20.1-38.3) 10 8.5 ( 4.3-16.1) 123 28,663
Aiea/Pearl City 203 74.2 (67.6-79.9) 61 19.0 (14.4-24.8) 17 6.7 ( 3.6-12.2) 281 69,051
Mililani/Wahiawa 200 66.3 (59.6-72.3) 67 22.9 (17.7-29.0) 29 10.8 ( 7.2-15.9) 296 74,258
Waipahu/Kapolei/Ewa 324 70.6 (65.0-75.6) 83 17.7 (14.0-22.2) 40 11.7 ( 8.0-16.8) 447 129,653
Nanakuli/Waianae - - - - - - - - - -
HAWAII County
North Hawaii 226 67.3 (60.5-73.6) 54 20.4 (15.1-26.9) 35 12.3 ( 8.6-17.3) 315 27,880
Hilo 329 77.6 (72.6-81.8) 64 13.8 (10.5-17.9) 35 8.7 ( 6.0-12.4) 428 36,390
Puna/Ka'u 277 60.0 (53.6-66.1) 62 14.5 (10.4-20.0) 90 25.4 (20.0-31.8) 429 36,409
Kona 251 69.4 (62.8-75.4) 42 13.3 ( 9.4-18.5) 49 17.3 (12.5-23.4) 342 27,929
KAUAI County
Hanalei/Kapa'a 204 64.5 (57.3-71.2) 53 18.4 (13.6-24.3) 43 17.1 (11.9-23.9) 300 20,139
Lihue-Waimea 272 77.8 (71.8-82.8) 49 11.6 ( 8.3-16.1) 31 10.6 ( 6.9-15.9) 352 27,147
MAUI County
Lahaina/Wailuku 206 64.3 (55.8-72.0) 62 18.7 (13.7-24.9) 35 17.0 (10.4-26.6) 303 31,052
Kahului 239 67.3 (60.6-73.4) 60 19.1 (14.2-25.0) 37 13.7 ( 9.4-19.5) 336 32,468
Upcountry/Hana 236 59.9 (53.7-65.8) 79 20.1 (15.7-25.5) 71 20.0 (15.4-25.4) 386 34,380
Lanai 121 63.0 (55.0-70.3) 49 21.8 (16.0-29.0) 35 15.2 (10.4-21.7) 205 1,879
Molokai 220 77.7 (70.1-83.8) 32 13.0 ( 8.5-19.2) 23 9.3 ( 5.2-16.2) 275 7,980
Percentages are weighted to population characteristics.N = Cell Sample Size, % = Percentage, 95% C.I. = Confidence Interval at 95 percent probability level
Rows with Sample Size less than 50 or containing half-width of 95% CI greater than 10 have been suppressed.

Was there a time in the past 12 months you needed to see a doctor, but could not because of the cost?State of Hawaii BRFSS 2007
Demographic Characteristics
YES N % C.I.(95%)
NO N % C.I.(95%)
Total N
Estimated numberof Adults
TOTAL 476 6.5 ( 5.7- 7.3) 6,124 93.5 (92.7-94.3) 6,600 987,385
AGE GROUP
18-24 Years 32 7.5 ( 4.9-11.5) 287 92.5 (88.5-95.1) 319 125,816
25-34 Years 65 9.0 ( 6.6-12.3) 647 91.0 (87.7-93.4) 712 160,314
35-44 Years 81 6.0 ( 4.5- 7.9) 1,018 94.0 (92.1-95.5) 1,099 175,318
45-54 Years 161 9.2 ( 7.4-11.4) 1,301 90.8 (88.6-92.6) 1,462 185,643
55-64 Years 96 4.8 ( 3.7- 6.3) 1,337 95.2 (93.7-96.3) 1,433 155,478
65+ Years 41 2.5 ( 1.7- 3.7) 1,508 97.5 (96.3-98.3) 1,549 180,759
Unknown/Refused - - -- -
GENDER
Male 188 6.3 ( 5.1- 7.6) 2,505 93.7 (92.4-94.9) 2,693 487,361
Female 288 6.6 ( 5.6- 7.8) 3,619 93.4 (92.2-94.4) 3,907 500,024
ETHNICITY
White 216 6.0 ( 5.0- 7.2) 2,488 94.0 (92.8-95.0) 2,704 312,221
Hawaiian 89 9.5 ( 7.2-12.4) 817 90.5 (87.6-92.8) 906 135,910
Filipino 63 6.2 ( 4.2- 8.9) 813 93.8 (91.1-95.8) 876 173,771
Japanese 33 3.0 ( 1.9- 4.5) 1,310 97.0 (95.5-98.1) 1,343 215,941
Others 74 10.2 ( 7.6-13.6) 672 89.8 (86.4-92.4) 746 146,681
Unknown/Refused - - -- -
MARITAL STATUS
Married 194 4.9 ( 4.1- 5.9) 3,565 95.1 (94.1-95.9) 3,759 587,055
Unmarried 281 8.8 ( 7.3-10.5) 2,547 91.2 (89.5-92.7) 2,828 399,093
Unknown/Refused - - -- -
EDUCATION
<High School 35 10.3 ( 6.5-16.0) 307 89.7 (84.0-93.5) 342 53,400
High School 168 7.9 ( 6.4- 9.7) 1,715 92.1 (90.3-93.6) 1,883 311,074
Some College 141 6.6 ( 5.1- 8.4) 1,792 93.4 (91.6-94.9) 1,933 290,232
College 131 4.3 ( 3.4- 5.5) 2,302 95.7 (94.5-96.6) 2,433 331,045
Unknown/Refused - - -- -
EMPLOYMENT
Employed 291 6.1 ( 5.2- 7.2) 3,749 93.9 (92.8-94.8) 4,040 635,656
Unemployed 41 19.2 (11.9-29.5) 139 80.8 (70.5-88.1) 180 32,179
Student/Homemaker 47 8.2 ( 5.5-11.9) 415 91.8 (88.1-94.5) 462 90,558
Retired/Can't work 97 5.0 ( 3.8- 6.5) 1,816 95.0 (93.5-96.2) 1,913 228,520
Unknown/Refused - - -- -
HOUSEHOLD INCOME
<$15,000 95 19.1 (14.2-25.0) 400 80.9 (75.0-85.8) 495 58,757
$15,000-24,999 126 13.3 (10.5-16.8) 705 86.7 (83.2-89.5) 831 104,414
$25,000-49,999 148 7.1 ( 5.6- 9.0) 1,747 92.9 (91.0-94.4) 1,895 279,904
$50,000-74,999 43 4.3 ( 2.9- 6.3) 1,061 95.7 (93.7-97.1) 1,104 169,930
>=$75,000 42 2.6 ( 1.7- 4.0) 1,778 97.4 (96.0-98.3) 1,820 286,577
Unknown/Refused 22 4.5 ( 2.5- 7.9) 433 95.5 (92.1-97.5) 455 87,804
Percentages are weighted to population characteristics.N = Cell Sample Size, % = Percentage, 95% C.I. = Confidence Interval at 95 percent probability level
Rows with Sample Size less than 50 or containing half-width of 95% CI greater than 10 have been suppressed.
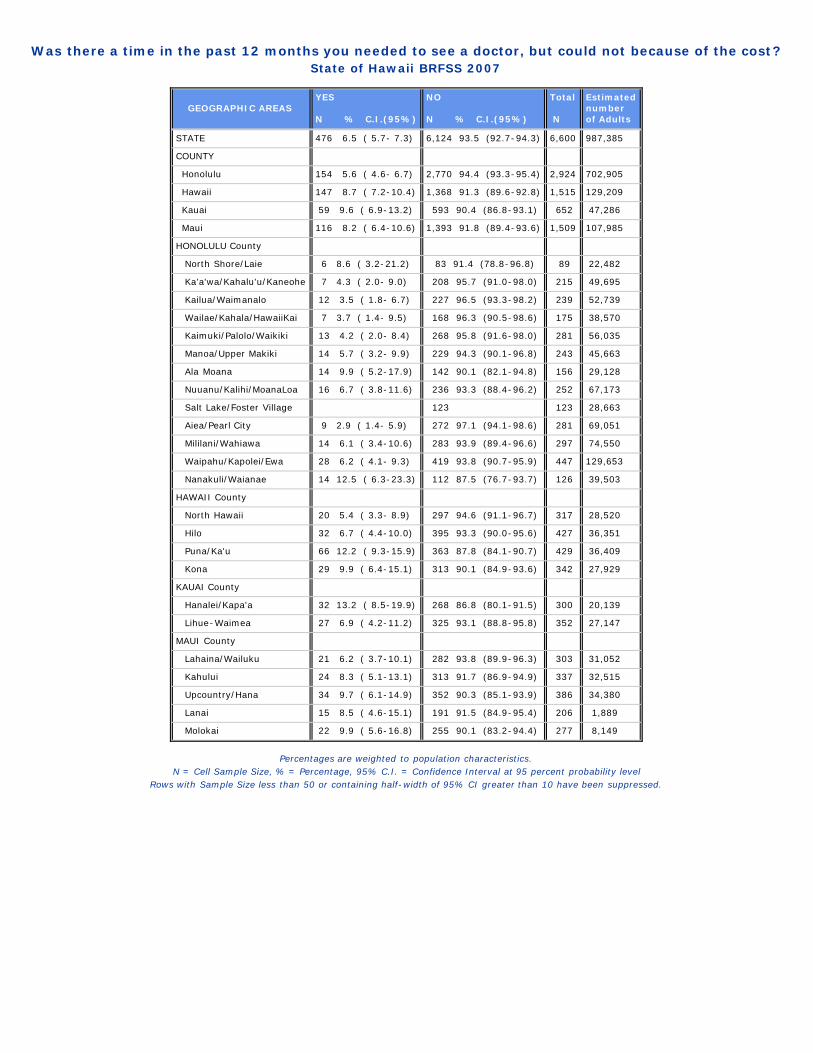
Was there a time in the past 12 months you needed to see a doctor, but could not because of the cost?State of Hawaii BRFSS 2007
GEOGRAPHIC AREAS YES N % C.I.(95%)
NO N % C.I.(95%)
Total N
Estimatednumberof Adults
STATE 476 6.5 ( 5.7- 7.3) 6,124 93.5 (92.7-94.3) 6,600 987,385
COUNTY
Honolulu 154 5.6 ( 4.6- 6.7) 2,770 94.4 (93.3-95.4) 2,924 702,905
Hawaii 147 8.7 ( 7.2-10.4) 1,368 91.3 (89.6-92.8) 1,515 129,209
Kauai 59 9.6 ( 6.9-13.2) 593 90.4 (86.8-93.1) 652 47,286
Maui 116 8.2 ( 6.4-10.6) 1,393 91.8 (89.4-93.6) 1,509 107,985
HONOLULU County
North Shore/Laie 6 8.6 ( 3.2-21.2) 83 91.4 (78.8-96.8) 89 22,482
Ka'a'wa/Kahalu'u/Kaneohe 7 4.3 ( 2.0- 9.0) 208 95.7 (91.0-98.0) 215 49,695
Kailua/Waimanalo 12 3.5 ( 1.8- 6.7) 227 96.5 (93.3-98.2) 239 52,739
Wailae/Kahala/HawaiiKai 7 3.7 ( 1.4- 9.5) 168 96.3 (90.5-98.6) 175 38,570
Kaimuki/Palolo/Waikiki 13 4.2 ( 2.0- 8.4) 268 95.8 (91.6-98.0) 281 56,035
Manoa/Upper Makiki 14 5.7 ( 3.2- 9.9) 229 94.3 (90.1-96.8) 243 45,663
Ala Moana 14 9.9 ( 5.2-17.9) 142 90.1 (82.1-94.8) 156 29,128
Nuuanu/Kalihi/MoanaLoa 16 6.7 ( 3.8-11.6) 236 93.3 (88.4-96.2) 252 67,173
Salt Lake/Foster Village 123 123 28,663
Aiea/Pearl City 9 2.9 ( 1.4- 5.9) 272 97.1 (94.1-98.6) 281 69,051
Mililani/Wahiawa 14 6.1 ( 3.4-10.6) 283 93.9 (89.4-96.6) 297 74,550
Waipahu/Kapolei/Ewa 28 6.2 ( 4.1- 9.3) 419 93.8 (90.7-95.9) 447 129,653
Nanakuli/Waianae 14 12.5 ( 6.3-23.3) 112 87.5 (76.7-93.7) 126 39,503
HAWAII County
North Hawaii 20 5.4 ( 3.3- 8.9) 297 94.6 (91.1-96.7) 317 28,520
Hilo 32 6.7 ( 4.4-10.0) 395 93.3 (90.0-95.6) 427 36,351
Puna/Ka'u 66 12.2 ( 9.3-15.9) 363 87.8 (84.1-90.7) 429 36,409
Kona 29 9.9 ( 6.4-15.1) 313 90.1 (84.9-93.6) 342 27,929
KAUAI County
Hanalei/Kapa'a 32 13.2 ( 8.5-19.9) 268 86.8 (80.1-91.5) 300 20,139
Lihue-Waimea 27 6.9 ( 4.2-11.2) 325 93.1 (88.8-95.8) 352 27,147
MAUI County
Lahaina/Wailuku 21 6.2 ( 3.7-10.1) 282 93.8 (89.9-96.3) 303 31,052
Kahului 24 8.3 ( 5.1-13.1) 313 91.7 (86.9-94.9) 337 32,515
Upcountry/Hana 34 9.7 ( 6.1-14.9) 352 90.3 (85.1-93.9) 386 34,380
Lanai 15 8.5 ( 4.6-15.1) 191 91.5 (84.9-95.4) 206 1,889
Molokai 22 9.9 ( 5.6-16.8) 255 90.1 (83.2-94.4) 277 8,149
Percentages are weighted to population characteristics.N = Cell Sample Size, % = Percentage, 95% C.I. = Confidence Interval at 95 percent probability level
Rows with Sample Size less than 50 or containing half-width of 95% CI greater than 10 have been suppressed.

When was your last visit to a doctor for a routine checkup?State of Hawaii BRFSS 2007
Demographic Characteristics
Within 1 year N % C.I.(95%)
1 to <2 years ago N % C.I.(95%)
2 to <5 years ago N % C.I.(95%)
5+ years ago N % C.I.(95%)
Never N % C.I.(95%)
Total N
Estimated numberof Adults
TOTAL 4,502 67.5 (65.8-69.1) 805 13.3 (12.2-14.6) 585 9.7 ( 8.6-10.9) 568 7.8 ( 7.0- 8.8) 93 1.7 ( 1.2- 2.3) 6,553 980,739
AGE GROUP
18-24 Years 181 54.2 (47.3-61.0) 57 19.0 (14.1-25.1) 54 18.6 (13.6-24.9) 18 5.8 ( 3.1-10.6) 8 2.4 ( 1.1- 5.2) 318 125,723
25-34 Years 409 58.3 (53.5-63.0) 112 14.5 (11.6-18.0) 81 11.7 ( 9.0-15.2) 85 11.9 ( 9.2-15.2) 17 3.5 ( 1.6- 7.5) 704 158,479
35-44 Years 659 61.4 (57.6-65.0) 150 14.3 (11.8-17.1) 127 11.4 ( 9.2-14.1) 136 11.0 ( 8.9-13.5) 21 2.0 ( 1.1- 3.3) 1,093 174,383
45-54 Years 928 66.5 (63.3-69.5) 217 15.6 (13.3-18.2) 150 9.6 ( 7.8-11.7) 143 7.4 ( 6.0- 9.1) 20 1.0 ( 0.5- 1.7) 1,458 185,389
55-64 Years 1,027 74.5 (71.3-77.5) 140 10.9 ( 8.7-13.6) 123 6.6 ( 5.2- 8.3) 121 7.2 ( 5.7- 9.2) 16 0.8 ( 0.5- 1.5) 1,427 154,662
65+ Years 1,280 85.7 (83.3-87.9) 125 7.1 ( 5.6- 9.0) 49 3.0 ( 2.1- 4.2) 63 3.5 ( 2.4- 5.0) 11 0.7 ( 0.3- 1.5) 1,528 178,264
Unknown/Refused - - - - - -- -
GENDER
Male 1,761 63.7 (61.1-66.3) 309 12.6 (10.9-14.5) 275 12.2 (10.4-14.2) 296 9.5 ( 8.1-11.2) 35 2.0 ( 1.1- 3.3) 2,676 485,035
Female 2,741 71.1 (69.1-73.1) 496 14.1 (12.5-15.8) 310 7.2 ( 6.2- 8.5) 272 6.2 ( 5.2- 7.3) 58 1.4 ( 1.0- 1.9) 3,877 495,703
ETHNICITY
White 1,781 65.2 (62.6-67.6) 341 14.2 (12.4-16.3) 258 10.5 ( 8.9-12.2) 279 9.0 ( 7.6-10.5) 34 1.1 ( 0.7- 1.8) 2,693 311,140
Hawaiian 589 66.4 (61.8-70.7) 106 10.8 ( 8.2-14.0) 102 11.5 ( 8.7-15.0) 84 8.9 ( 6.7-11.8) 15 2.4 ( 1.1- 5.0) 896 134,992
Filipino 604 65.3 (60.1-70.0) 110 14.6 (11.4-18.6) 75 10.2 ( 7.3-14.1) 53 6.2 ( 4.0- 9.5) 25 3.7 ( 1.8- 7.2) 867 171,639
Japanese 987 71.2 (67.7-74.4) 144 12.2 ( 9.9-14.8) 93 8.5 ( 6.4-11.2) 95 7.4 ( 5.8- 9.4) 10 0.8 ( 0.4- 1.5) 1,329 213,959
Others 525 70.2 (65.6-74.5) 102 14.1 (11.0-17.8) 53 7.6 ( 5.2-10.8) 54 7.0 ( 4.9- 9.9) 9 1.1 ( 0.5- 2.6) 743 146,148
Unknown/Refused - - - - - -- -
MARITAL STATUS
Married 2,647 71.2 (69.3-73.1) 446 12.7 (11.3-14.2) 319 8.1 ( 7.0- 9.2) 273 6.9 ( 5.9- 8.0) 48 1.2 ( 0.8- 1.7) 3,733 583,291
Unmarried 1,846 61.9 (58.9-64.9) 358 14.3 (12.2-16.6) 263 12.1 (10.0-14.5) 295 9.3 ( 7.8-11.1) 45 2.4 ( 1.4- 4.0) 2,807 396,211
Unknown/Refused - - - - - -- -
EDUCATION
<High School 241 69.5 (62.2-75.9) 36 12.7 ( 8.5-18.6) 27 9.8 ( 5.9-15.8) 25 5.5 ( 3.2- 9.4) 7 2.5 ( 1.1- 5.6) 336 52,444
High School 1,280 66.8 (63.5-69.9) 242 14.2 (11.9-16.7) 145 9.7 ( 7.7-12.1) 165 7.1 ( 5.6- 9.0) 35 2.3 ( 1.4- 3.6) 1,867 309,490
Some College 1,320 65.9 (62.6-69.0) 231 13.5 (11.3-16.0) 183 10.6 ( 8.6-13.0) 162 8.3 ( 6.7-10.2) 24 1.7 ( 0.8- 3.9) 1,920 287,902
College 1,657 69.3 (66.7-71.7) 295 12.5 (10.8-14.4) 229 8.9 ( 7.4-10.6) 215 8.5 ( 7.1-10.1) 27 0.9 ( 0.6- 1.5) 2,423 329,568
Unknown/Refused - - - - - -- -
EMPLOYMENT
Employed 2,541 63.0 (60.9-65.1) 561 14.8 (13.3-16.5) 438 10.9 ( 9.6-12.4) 420 9.4 ( 8.2-10.7) 63 1.9 ( 1.2- 2.9) 4,023 632,267
Unemployed - - - - - - - - - - - - - -
Student/Homemaker 301 62.6 (56.2-68.6) 77 16.8 (12.7-21.9) 43 14.0 ( 9.5-20.1) 28 4.4 ( 2.6- 7.3) 10 2.2 ( 1.0- 4.5) 459 90,382
Retired/Can't work 1,559 84.3 (81.9-86.4) 141 6.8 ( 5.4- 8.5) 76 3.2 ( 2.4- 4.4) 96 4.9 ( 3.6- 6.6) 15 0.8 ( 0.4- 1.6) 1,887 225,540
Unknown/Refused - - - - - -- -
HOUSEHOLD INCOME
<$15,000 327 66.8 (59.6-73.2) 66 11.9 ( 8.5-16.4) 38 12.4 ( 7.6-19.6) 45 7.2 ( 4.6-11.1) 8 1.7 ( 0.6- 4.7) 484 57,441
$15,000-24,999 549 69.1 (64.3-73.5) 109 14.5 (11.2-18.5) 60 7.0 ( 4.7-10.5) 85 6.7 ( 4.9- 9.1) 18 2.7 ( 1.4- 4.9) 821 103,514
$25,000-49,999 1,299 65.9 (62.5-69.0) 208 12.0 ( 9.8-14.5) 173 10.7 ( 8.6-13.3) 174 9.2 ( 7.5-11.3) 33 2.2 ( 1.4- 3.5) 1,887 278,136
$50,000-74,999 743 67.1 (63.1-70.8) 133 14.1 (11.3-17.4) 109 10.0 ( 7.8-12.8) 103 8.2 ( 6.4-10.5) 10 0.6 ( 0.3- 1.2) 1,098 169,304
>=$75,000 1,269 68.2 (65.2-71.1) 235 14.1 (12.1-16.3) 166 9.3 ( 7.6-11.3) 129 7.1 ( 5.7- 8.8) 17 1.3 ( 0.5- 3.6) 1,816 285,838
Unknown/Refused 315 69.4 (62.4-75.5) 54 13.3 ( 9.1-19.0) 39 8.6 ( 5.6-12.9) 32 6.9 ( 3.6-12.8) 7 1.9 ( 0.6- 5.6) 447 86,505
Percentages are weighted to population characteristics.N = Cell Sample Size, % = Percentage, 95% C.I. = Confidence Interval at 95 percent probability level
Rows with Sample Size less than 50 or containing half-width of 95% CI greater than 10 have been suppressed.
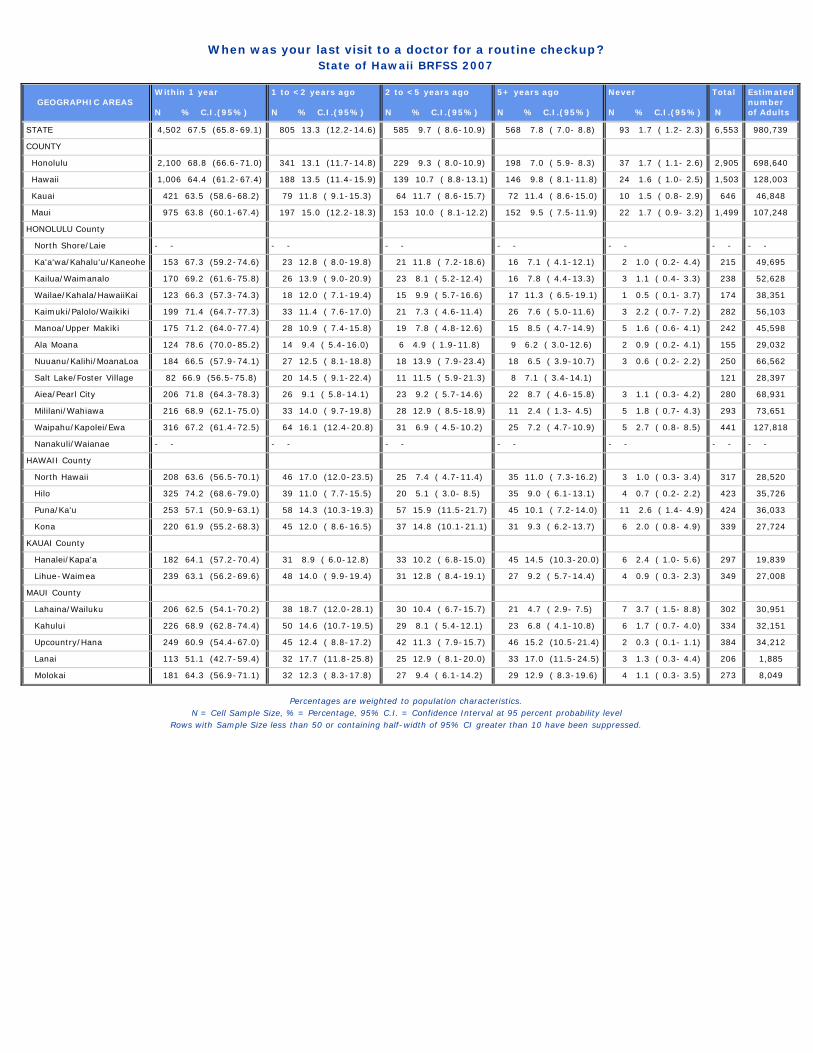
When was your last visit to a doctor for a routine checkup?State of Hawaii BRFSS 2007
GEOGRAPHIC AREAS Within 1 year N % C.I.(95%)
1 to <2 years ago N % C.I.(95%)
2 to <5 years ago N % C.I.(95%)
5+ years ago N % C.I.(95%)
Never N % C.I.(95%)
Total N
Estimatednumberof Adults
STATE 4,502 67.5 (65.8-69.1) 805 13.3 (12.2-14.6) 585 9.7 ( 8.6-10.9) 568 7.8 ( 7.0- 8.8) 93 1.7 ( 1.2- 2.3) 6,553 980,739
COUNTY
Honolulu 2,100 68.8 (66.6-71.0) 341 13.1 (11.7-14.8) 229 9.3 ( 8.0-10.9) 198 7.0 ( 5.9- 8.3) 37 1.7 ( 1.1- 2.6) 2,905 698,640
Hawaii 1,006 64.4 (61.2-67.4) 188 13.5 (11.4-15.9) 139 10.7 ( 8.8-13.1) 146 9.8 ( 8.1-11.8) 24 1.6 ( 1.0- 2.5) 1,503 128,003
Kauai 421 63.5 (58.6-68.2) 79 11.8 ( 9.1-15.3) 64 11.7 ( 8.6-15.7) 72 11.4 ( 8.6-15.0) 10 1.5 ( 0.8- 2.9) 646 46,848
Maui 975 63.8 (60.1-67.4) 197 15.0 (12.2-18.3) 153 10.0 ( 8.1-12.2) 152 9.5 ( 7.5-11.9) 22 1.7 ( 0.9- 3.2) 1,499 107,248
HONOLULU County
North Shore/Laie - - - - - - - - - - - - - -
Ka'a'wa/Kahalu'u/Kaneohe 153 67.3 (59.2-74.6) 23 12.8 ( 8.0-19.8) 21 11.8 ( 7.2-18.6) 16 7.1 ( 4.1-12.1) 2 1.0 ( 0.2- 4.4) 215 49,695
Kailua/Waimanalo 170 69.2 (61.6-75.8) 26 13.9 ( 9.0-20.9) 23 8.1 ( 5.2-12.4) 16 7.8 ( 4.4-13.3) 3 1.1 ( 0.4- 3.3) 238 52,628
Wailae/Kahala/HawaiiKai 123 66.3 (57.3-74.3) 18 12.0 ( 7.1-19.4) 15 9.9 ( 5.7-16.6) 17 11.3 ( 6.5-19.1) 1 0.5 ( 0.1- 3.7) 174 38,351
Kaimuki/Palolo/Waikiki 199 71.4 (64.7-77.3) 33 11.4 ( 7.6-17.0) 21 7.3 ( 4.6-11.4) 26 7.6 ( 5.0-11.6) 3 2.2 ( 0.7- 7.2) 282 56,103
Manoa/Upper Makiki 175 71.2 (64.0-77.4) 28 10.9 ( 7.4-15.8) 19 7.8 ( 4.8-12.6) 15 8.5 ( 4.7-14.9) 5 1.6 ( 0.6- 4.1) 242 45,598
Ala Moana 124 78.6 (70.0-85.2) 14 9.4 ( 5.4-16.0) 6 4.9 ( 1.9-11.8) 9 6.2 ( 3.0-12.6) 2 0.9 ( 0.2- 4.1) 155 29,032
Nuuanu/Kalihi/MoanaLoa 184 66.5 (57.9-74.1) 27 12.5 ( 8.1-18.8) 18 13.9 ( 7.9-23.4) 18 6.5 ( 3.9-10.7) 3 0.6 ( 0.2- 2.2) 250 66,562
Salt Lake/Foster Village 82 66.9 (56.5-75.8) 20 14.5 ( 9.1-22.4) 11 11.5 ( 5.9-21.3) 8 7.1 ( 3.4-14.1) 121 28,397
Aiea/Pearl City 206 71.8 (64.3-78.3) 26 9.1 ( 5.8-14.1) 23 9.2 ( 5.7-14.6) 22 8.7 ( 4.6-15.8) 3 1.1 ( 0.3- 4.2) 280 68,931
Mililani/Wahiawa 216 68.9 (62.1-75.0) 33 14.0 ( 9.7-19.8) 28 12.9 ( 8.5-18.9) 11 2.4 ( 1.3- 4.5) 5 1.8 ( 0.7- 4.3) 293 73,651
Waipahu/Kapolei/Ewa 316 67.2 (61.4-72.5) 64 16.1 (12.4-20.8) 31 6.9 ( 4.5-10.2) 25 7.2 ( 4.7-10.9) 5 2.7 ( 0.8- 8.5) 441 127,818
Nanakuli/Waianae - - - - - - - - - - - - - -
HAWAII County
North Hawaii 208 63.6 (56.5-70.1) 46 17.0 (12.0-23.5) 25 7.4 ( 4.7-11.4) 35 11.0 ( 7.3-16.2) 3 1.0 ( 0.3- 3.4) 317 28,520
Hilo 325 74.2 (68.6-79.0) 39 11.0 ( 7.7-15.5) 20 5.1 ( 3.0- 8.5) 35 9.0 ( 6.1-13.1) 4 0.7 ( 0.2- 2.2) 423 35,726
Puna/Ka'u 253 57.1 (50.9-63.1) 58 14.3 (10.3-19.3) 57 15.9 (11.5-21.7) 45 10.1 ( 7.2-14.0) 11 2.6 ( 1.4- 4.9) 424 36,033
Kona 220 61.9 (55.2-68.3) 45 12.0 ( 8.6-16.5) 37 14.8 (10.1-21.1) 31 9.3 ( 6.2-13.7) 6 2.0 ( 0.8- 4.9) 339 27,724
KAUAI County
Hanalei/Kapa'a 182 64.1 (57.2-70.4) 31 8.9 ( 6.0-12.8) 33 10.2 ( 6.8-15.0) 45 14.5 (10.3-20.0) 6 2.4 ( 1.0- 5.6) 297 19,839
Lihue-Waimea 239 63.1 (56.2-69.6) 48 14.0 ( 9.9-19.4) 31 12.8 ( 8.4-19.1) 27 9.2 ( 5.7-14.4) 4 0.9 ( 0.3- 2.3) 349 27,008
MAUI County
Lahaina/Wailuku 206 62.5 (54.1-70.2) 38 18.7 (12.0-28.1) 30 10.4 ( 6.7-15.7) 21 4.7 ( 2.9- 7.5) 7 3.7 ( 1.5- 8.8) 302 30,951
Kahului 226 68.9 (62.8-74.4) 50 14.6 (10.7-19.5) 29 8.1 ( 5.4-12.1) 23 6.8 ( 4.1-10.8) 6 1.7 ( 0.7- 4.0) 334 32,151
Upcountry/Hana 249 60.9 (54.4-67.0) 45 12.4 ( 8.8-17.2) 42 11.3 ( 7.9-15.7) 46 15.2 (10.5-21.4) 2 0.3 ( 0.1- 1.1) 384 34,212
Lanai 113 51.1 (42.7-59.4) 32 17.7 (11.8-25.8) 25 12.9 ( 8.1-20.0) 33 17.0 (11.5-24.5) 3 1.3 ( 0.3- 4.4) 206 1,885
Molokai 181 64.3 (56.9-71.1) 32 12.3 ( 8.3-17.8) 27 9.4 ( 6.1-14.2) 29 12.9 ( 8.3-19.6) 4 1.1 ( 0.3- 3.5) 273 8,049
Percentages are weighted to population characteristics.N = Cell Sample Size, % = Percentage, 95% C.I. = Confidence Interval at 95 percent probability level
Rows with Sample Size less than 50 or containing half-width of 95% CI greater than 10 have been suppressed.
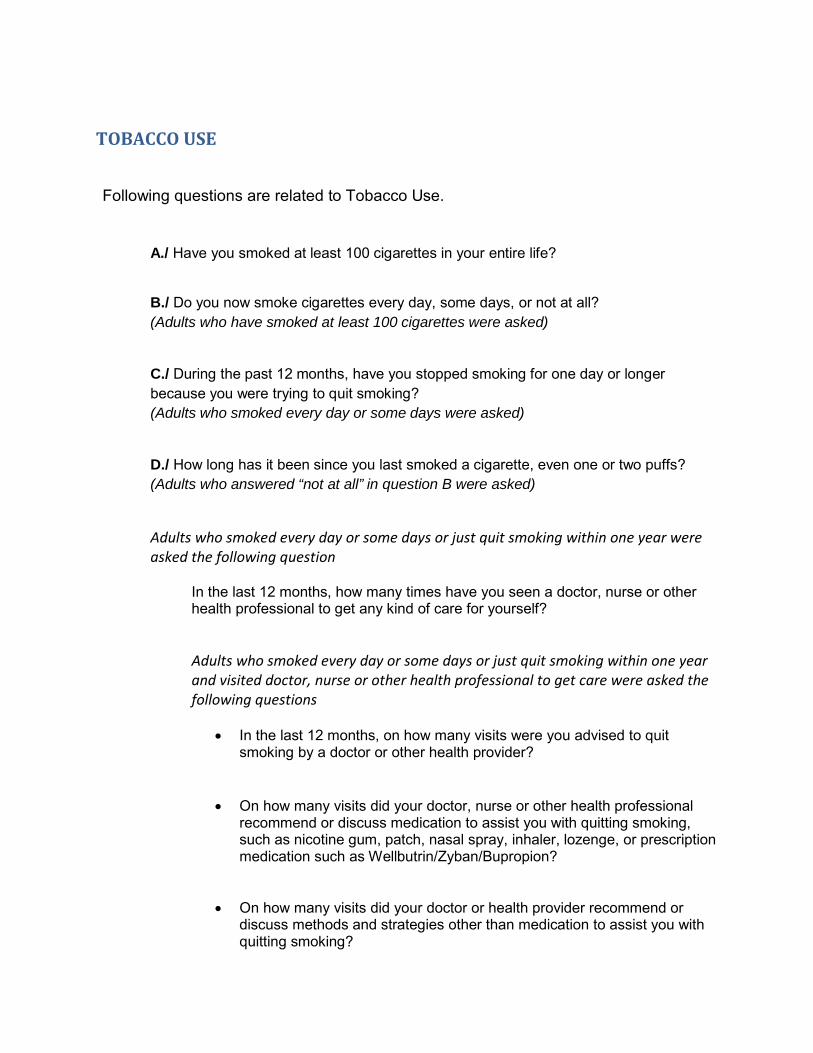
TOBACCO USE
Following questions are related to Tobacco Use.
A./ Have you smoked at least 100 cigarettes in your entire life?
B./ Do you now smoke cigarettes every day, some days, or not at all? (Adults who have smoked at least 100 cigarettes were asked)
C./ During the past 12 months, have you stopped smoking for one day or longer because you were trying to quit smoking? (Adults who smoked every day or some days were asked)
D./ How long has it been since you last smoked a cigarette, even one or two puffs? (Adults who answered “not at all” in question B were asked)
Adults who smoked every day or some days or just quit smoking within one year were asked the following question
In the last 12 months, how many times have you seen a doctor, nurse or other health professional to get any kind of care for yourself? Adults who smoked every day or some days or just quit smoking within one year and visited doctor, nurse or other health professional to get care were asked the following questions
• In the last 12 months, on how many visits were you advised to quit smoking by a doctor or other health provider?
• On how many visits did your doctor, nurse or other health professional recommend or discuss medication to assist you with quitting smoking, such as nicotine gum, patch, nasal spray, inhaler, lozenge, or prescription medication such as Wellbutrin/Zyban/Bupropion?
• On how many visits did your doctor or health provider recommend or discuss methods and strategies other than medication to assist you with quitting smoking?
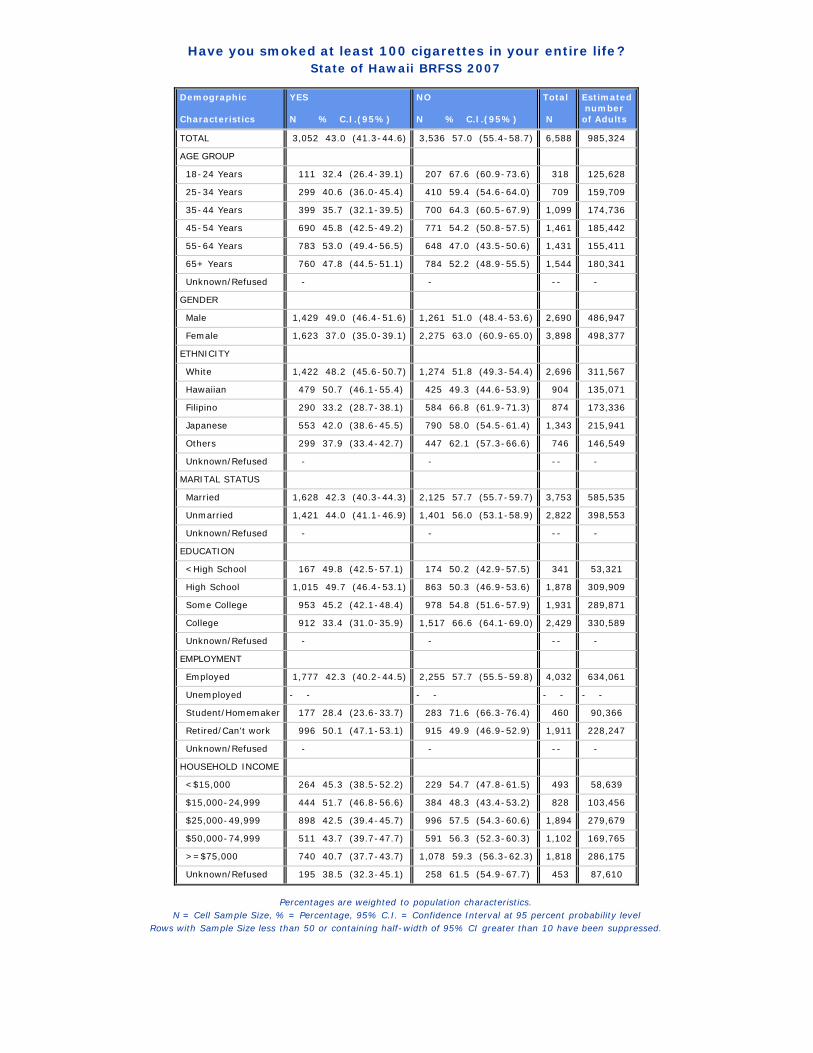
Have you smoked at least 100 cigarettes in your entire life?State of Hawaii BRFSS 2007
Demographic Characteristics
YES N % C.I.(95%)
NO N % C.I.(95%)
Total N
Estimated numberof Adults
TOTAL 3,052 43.0 (41.3-44.6) 3,536 57.0 (55.4-58.7) 6,588 985,324
AGE GROUP
18-24 Years 111 32.4 (26.4-39.1) 207 67.6 (60.9-73.6) 318 125,628
25-34 Years 299 40.6 (36.0-45.4) 410 59.4 (54.6-64.0) 709 159,709
35-44 Years 399 35.7 (32.1-39.5) 700 64.3 (60.5-67.9) 1,099 174,736
45-54 Years 690 45.8 (42.5-49.2) 771 54.2 (50.8-57.5) 1,461 185,442
55-64 Years 783 53.0 (49.4-56.5) 648 47.0 (43.5-50.6) 1,431 155,411
65+ Years 760 47.8 (44.5-51.1) 784 52.2 (48.9-55.5) 1,544 180,341
Unknown/Refused - - -- -
GENDER
Male 1,429 49.0 (46.4-51.6) 1,261 51.0 (48.4-53.6) 2,690 486,947
Female 1,623 37.0 (35.0-39.1) 2,275 63.0 (60.9-65.0) 3,898 498,377
ETHNICITY
White 1,422 48.2 (45.6-50.7) 1,274 51.8 (49.3-54.4) 2,696 311,567
Hawaiian 479 50.7 (46.1-55.4) 425 49.3 (44.6-53.9) 904 135,071
Filipino 290 33.2 (28.7-38.1) 584 66.8 (61.9-71.3) 874 173,336
Japanese 553 42.0 (38.6-45.5) 790 58.0 (54.5-61.4) 1,343 215,941
Others 299 37.9 (33.4-42.7) 447 62.1 (57.3-66.6) 746 146,549
Unknown/Refused - - -- -
MARITAL STATUS
Married 1,628 42.3 (40.3-44.3) 2,125 57.7 (55.7-59.7) 3,753 585,535
Unmarried 1,421 44.0 (41.1-46.9) 1,401 56.0 (53.1-58.9) 2,822 398,553
Unknown/Refused - - -- -
EDUCATION
<High School 167 49.8 (42.5-57.1) 174 50.2 (42.9-57.5) 341 53,321
High School 1,015 49.7 (46.4-53.1) 863 50.3 (46.9-53.6) 1,878 309,909
Some College 953 45.2 (42.1-48.4) 978 54.8 (51.6-57.9) 1,931 289,871
College 912 33.4 (31.0-35.9) 1,517 66.6 (64.1-69.0) 2,429 330,589
Unknown/Refused - - -- -
EMPLOYMENT
Employed 1,777 42.3 (40.2-44.5) 2,255 57.7 (55.5-59.8) 4,032 634,061
Unemployed - - - - - - - -
Student/Homemaker 177 28.4 (23.6-33.7) 283 71.6 (66.3-76.4) 460 90,366
Retired/Can't work 996 50.1 (47.1-53.1) 915 49.9 (46.9-52.9) 1,911 228,247
Unknown/Refused - - -- -
HOUSEHOLD INCOME
<$15,000 264 45.3 (38.5-52.2) 229 54.7 (47.8-61.5) 493 58,639
$15,000-24,999 444 51.7 (46.8-56.6) 384 48.3 (43.4-53.2) 828 103,456
$25,000-49,999 898 42.5 (39.4-45.7) 996 57.5 (54.3-60.6) 1,894 279,679
$50,000-74,999 511 43.7 (39.7-47.7) 591 56.3 (52.3-60.3) 1,102 169,765
>=$75,000 740 40.7 (37.7-43.7) 1,078 59.3 (56.3-62.3) 1,818 286,175
Unknown/Refused 195 38.5 (32.3-45.1) 258 61.5 (54.9-67.7) 453 87,610
Percentages are weighted to population characteristics.N = Cell Sample Size, % = Percentage, 95% C.I. = Confidence Interval at 95 percent probability level
Rows with Sample Size less than 50 or containing half-width of 95% CI greater than 10 have been suppressed.

Have you smoked at least 100 cigarettes in your entire life?State of Hawaii BRFSS 2007
GEOGRAPHIC AREAS YES N % C.I.(95%)
NO N % C.I.(95%)
Total N
Estimatednumberof Adults
STATE 3,052 43.0 (41.3-44.6) 3,536 57.0 (55.4-58.7) 6,588 985,324
COUNTY
Honolulu 1,247 41.5 (39.3-43.7) 1,674 58.5 (56.3-60.7) 2,921 701,798
Hawaii 775 48.7 (45.6-51.9) 736 51.3 (48.1-54.4) 1,511 128,896
Kauai 299 43.9 (39.2-48.8) 351 56.1 (51.2-60.8) 650 47,070
Maui 731 45.2 (41.7-48.8) 775 54.8 (51.2-58.3) 1,506 107,560
HONOLULU County
North Shore/Laie - - - - - - - -
Ka'a'wa/Kahalu'u/Kaneohe 99 43.2 (35.6-51.2) 116 56.8 (48.8-64.4) 215 49,695
Kailua/Waimanalo 98 34.3 (28.0-41.3) 141 65.7 (58.7-72.0) 239 52,739
Wailae/Kahala/HawaiiKai 62 38.0 (29.7-47.1) 113 62.0 (52.9-70.3) 175 38,570
Kaimuki/Palolo/Waikiki 128 45.6 (38.5-53.0) 154 54.4 (47.0-61.5) 282 56,103
Manoa/Upper Makiki 105 45.0 (37.8-52.5) 138 55.0 (47.5-62.2) 243 45,663
Ala Moana 58 31.9 (24.4-40.4) 98 68.1 (59.6-75.6) 156 29,128
Nuuanu/Kalihi/MoanaLoa 104 38.1 (31.1-45.7) 148 61.9 (54.3-68.9) 252 67,173
Salt Lake/Foster Village - - - - - - - -
Aiea/Pearl City 129 45.4 (38.3-52.7) 152 54.6 (47.3-61.7) 281 69,051
Mililani/Wahiawa 120 39.9 (33.6-46.5) 176 60.1 (53.5-66.4) 296 74,250
Waipahu/Kapolei/Ewa 192 42.6 (37.2-48.3) 254 57.4 (51.7-62.8) 446 129,588
Nanakuli/Waianae - - - - - - - -
HAWAII County
North Hawaii 149 42.9 (36.2-49.9) 166 57.1 (50.1-63.8) 315 28,326
Hilo 204 47.3 (41.6-53.0) 222 52.7 (47.0-58.4) 426 36,284
Puna/Ka'u 235 52.9 (46.8-58.9) 193 47.1 (41.1-53.2) 428 36,358
Kona 187 51.0 (44.4-57.6) 155 49.0 (42.4-55.6) 342 27,929
KAUAI County
Hanalei/Kapa'a 136 43.6 (36.6-50.8) 163 56.4 (49.2-63.4) 299 20,112
Lihue-Waimea 163 44.2 (37.8-50.8) 188 55.8 (49.2-62.2) 351 26,959
MAUI County
Lahaina/Wailuku 126 38.1 (31.1-45.6) 175 61.9 (54.4-68.9) 301 30,813
Kahului 170 47.3 (40.8-53.8) 166 52.7 (46.2-59.2) 336 32,376
Upcountry/Hana 197 48.4 (42.2-54.6) 188 51.6 (45.4-57.8) 385 34,327
Lanai 95 51.2 (43.0-59.3) 112 48.8 (40.7-57.0) 207 1,895
Molokai 143 49.5 (42.1-56.8) 134 50.5 (43.2-57.9) 277 8,149
Percentages are weighted to population characteristics.N = Cell Sample Size, % = Percentage, 95% C.I. = Confidence Interval at 95 percent probability level
Rows with Sample Size less than 50 or containing half-width of 95% CI greater than 10 have been suppressed.

Smoking status (4 levels)State of Hawaii BRFSS 2007
Demographic Characteristics
Current smoker (smokes everyday) N % C.I.(95%)
Current smoker (smokes some days) N % C.I.(95%)
Former smoker N % C.I.(95%)
Never smoked N % C.I.(95%)
Total N
Estimated numberof Adults
TOTAL 801 12.9 (11.7-14.2) 258 4.1 ( 3.4- 4.8) 1,993 26.0 (24.6-27.4) 3,536 57.0 (55.4-58.7) 6,588 985,324
AGE GROUP
18-24 Years 47 14.9 (10.4-20.9) 26 6.8 ( 4.3-10.6) 38 10.7 ( 7.4-15.4) 207 67.6 (60.9-73.6) 318 125,628
25-34 Years 119 18.3 (14.7-22.7) 39 6.0 ( 3.9- 9.1) 141 16.3 (13.3-19.8) 410 59.4 (54.6-64.0) 709 159,709
35-44 Years 146 13.2 (10.8-16.2) 47 3.8 ( 2.6- 5.6) 206 18.6 (15.8-21.8) 700 64.3 (60.5-67.9) 1,099 174,736
45-54 Years 199 13.5 (11.4-15.9) 74 4.2 ( 3.0- 5.8) 417 28.2 (25.2-31.3) 771 54.2 (50.8-57.5) 1,461 185,442
55-64 Years 181 12.2 (10.0-14.7) 50 3.0 ( 2.1- 4.3) 552 37.8 (34.4-41.3) 648 47.0 (43.5-50.6) 1,431 155,411
65+ Years 108 6.7 ( 5.2- 8.7) 22 1.5 ( 0.8- 2.8) 630 39.5 (36.4-42.7) 784 52.2 (48.9-55.5) 1,544 180,341
Unknown/Refused - - - - -- -
GENDER
Male 377 15.3 (13.3-17.5) 108 4.4 ( 3.4- 5.7) 944 29.3 (27.1-31.6) 1,261 51.0 (48.4-53.6) 2,690 486,947
Female 424 10.6 ( 9.4-12.0) 150 3.7 ( 2.9- 4.7) 1,049 22.7 (21.1-24.5) 2,275 63.0 (60.9-65.0) 3,898 498,377
ETHNICITY
White 313 11.9 (10.3-13.7) 100 3.5 ( 2.7- 4.6) 1,009 32.7 (30.5-35.1) 1,274 51.8 (49.3-54.4) 2,696 311,567
Hawaiian 168 18.4 (15.1-22.2) 56 5.9 ( 4.2- 8.4) 255 26.4 (22.6-30.7) 425 49.3 (44.6-53.9) 904 135,071
Filipino 101 13.4 (10.0-17.8) 26 3.0 ( 1.6- 5.4) 163 16.9 (13.8-20.4) 584 66.8 (61.9-71.3) 874 173,336
Japanese 127 10.1 ( 8.1-12.4) 40 3.6 ( 2.3- 5.5) 386 28.4 (25.4-31.5) 790 58.0 (54.5-61.4) 1,343 215,941
Others 91 13.9 (10.6-18.0) 35 5.5 ( 3.6- 8.5) 173 18.5 (15.3-22.2) 447 62.1 (57.3-66.6) 746 146,549
Unknown/Refused - - - - -- -
MARITAL STATUS
Married 354 10.2 ( 9.0-11.5) 120 3.1 ( 2.5- 3.9) 1,154 29.0 (27.2-30.9) 2,125 57.7 (55.7-59.7) 3,753 585,535
Unmarried 447 17.0 (14.7-19.5) 138 5.5 ( 4.2- 7.1) 836 21.5 (19.5-23.7) 1,401 56.0 (53.1-58.9) 2,822 398,553
Unknown/Refused - - - - -- -
EDUCATION
<High School 59 21.9 (16.1-29.1) 13 4.7 ( 2.2- 9.8) 95 23.2 (18.0-29.3) 174 50.2 (42.9-57.5) 341 53,321
High School 335 18.0 (15.5-20.8) 96 5.2 ( 3.9- 6.9) 584 26.5 (23.9-29.3) 863 50.3 (46.9-53.6) 1,878 309,909
Some College 250 13.4 (11.3-15.9) 83 4.0 ( 2.9- 5.5) 620 27.8 (25.2-30.6) 978 54.8 (51.6-57.9) 1,931 289,871
College 156 6.3 ( 5.1- 7.7) 65 2.9 ( 2.0- 4.2) 691 24.3 (22.2-26.5) 1,517 66.6 (64.1-69.0) 2,429 330,589
Unknown/Refused - - - - -- -
EMPLOYMENT
Employed 511 14.1 (12.5-15.9) 188 4.9 ( 4.0- 6.1) 1,078 23.2 (21.6-25.0) 2,255 57.7 (55.5-59.8) 4,032 634,061
Unemployed - - - - - - - - - - - -
Student/Homemaker 56 10.0 ( 7.3-13.6) 18 3.4 ( 1.9- 5.9) 103 15.0 (11.6-19.2) 283 71.6 (66.3-76.4) 460 90,366
Retired/Can't work 186 9.2 ( 7.5-11.2) 44 2.2 ( 1.4- 3.2) 766 38.7 (35.9-41.7) 915 49.9 (46.9-52.9) 1,911 228,247
Unknown/Refused - - - - -- -
HOUSEHOLD INCOME
<$15,000 93 19.2 (14.0-25.8) 32 7.0 ( 4.0-11.9) 139 19.1 (15.2-23.7) 229 54.7 (47.8-61.5) 493 58,639
$15,000-24,999 161 21.8 (17.9-26.3) 35 3.7 ( 2.4- 5.8) 248 26.2 (22.2-30.6) 384 48.3 (43.4-53.2) 828 103,456
$25,000-49,999 252 14.1 (11.9-16.6) 84 4.8 ( 3.6- 6.6) 562 23.6 (21.2-26.2) 996 57.5 (54.3-60.6) 1,894 279,679
$50,000-74,999 113 9.8 ( 7.7-12.5) 35 2.8 ( 1.7- 4.4) 363 31.1 (27.6-34.9) 591 56.3 (52.3-60.3) 1,102 169,765
>=$75,000 127 8.5 ( 6.7-10.8) 56 3.7 ( 2.6- 5.3) 557 28.4 (25.8-31.2) 1,078 59.3 (56.3-62.3) 1,818 286,175
Unknown/Refused 55 14.9 (10.2-21.1) 16 3.7 ( 1.7- 7.7) 124 20.0 (15.9-24.8) 258 61.5 (54.9-67.7) 453 87,610
Percentages are weighted to population characteristics.N = Cell Sample Size, % = Percentage, 95% C.I. = Confidence Interval at 95 percent probability level
Rows with Sample Size less than 50 or containing half-width of 95% CI greater than 10 have been suppressed.

Smoking status (4 levels)State of Hawaii BRFSS 2007
GEOGRAPHIC AREAS Current smoker (smokes everyday) N % C.I.(95%)
Current smoker (smokes some days) N % C.I.(95%)
Former smoker N % C.I.(95%)
Never smoked N % C.I.(95%)
Total N
Estimatednumberof Adults
STATE 801 12.9 (11.7-14.2) 258 4.1 ( 3.4- 4.8) 1,993 26.0 (24.6-27.4) 3,536 57.0 (55.4-58.7) 6,588 985,324
COUNTY
Honolulu 342 12.8 (11.3-14.5) 91 3.7 ( 2.9- 4.7) 814 25.0 (23.2-26.9) 1,674 58.5 (56.3-60.7) 2,921 701,798
Hawaii 209 15.0 (12.7-17.6) 56 4.3 ( 3.1- 6.1) 510 29.4 (26.7-32.2) 736 51.3 (48.1-54.4) 1,511 128,896
Kauai 71 12.9 ( 9.7-17.0) 27 4.5 ( 2.9- 7.0) 201 26.4 (22.7-30.6) 351 56.1 (51.2-60.8) 650 47,070
Maui 179 11.3 ( 9.2-13.9) 84 5.8 ( 4.2- 8.0) 468 28.1 (25.1-31.2) 775 54.8 (51.2-58.3) 1,506 107,560
HONOLULU County
North Shore/Laie - - - - - - - - - - - -
Ka'a'wa/Kahalu'u/Kaneohe 17 7.9 ( 4.8-13.0) 8 5.9 ( 2.5-12.9) 74 29.4 (23.1-36.6) 116 56.8 (48.8-64.4) 215 49,695
Kailua/Waimanalo 17 5.3 ( 3.1- 8.8) 8 2.9 ( 1.4- 6.2) 73 26.1 (20.5-32.6) 141 65.7 (58.7-72.0) 239 52,739
Wailae/Kahala/HawaiiKai 6 6.5 ( 2.5-15.9) 5 2.0 ( 0.8- 4.8) 51 29.5 (22.1-38.1) 113 62.0 (52.9-70.3) 175 38,570
Kaimuki/Palolo/Waikiki 38 17.0 (11.4-24.7) 9 4.0 ( 1.7- 8.7) 81 24.7 (19.2-31.1) 154 54.4 (47.0-61.5) 282 56,103
Manoa/Upper Makiki 27 11.3 ( 7.4-16.9) 6 3.1 ( 0.9-10.0) 72 30.6 (24.3-37.7) 138 55.0 (47.5-62.2) 243 45,663
Ala Moana 13 8.0 ( 4.3-14.4) 6 3.4 ( 1.4- 8.4) 39 20.5 (14.7-27.8) 98 68.1 (59.6-75.6) 156 29,128
Nuuanu/Kalihi/MoanaLoa 34 11.0 ( 7.4-16.3) 11 6.0 ( 3.0-11.7) 59 21.0 (15.9-27.3) 148 61.9 (54.3-68.9) 252 67,173
Salt Lake/Foster Village - - - - - - - - - - - -
Aiea/Pearl City 39 15.8 (10.6-23.0) 6 1.8 ( 0.7- 4.5) 84 27.8 (22.0-34.5) 152 54.6 (47.3-61.7) 281 69,051
Mililani/Wahiawa 38 13.4 ( 9.4-18.7) 10 4.5 ( 2.3- 8.6) 72 22.0 (17.2-27.7) 176 60.1 (53.5-66.4) 296 74,250
Waipahu/Kapolei/Ewa 66 17.1 (12.8-22.4) 12 3.1 ( 1.6- 6.0) 114 22.4 (18.3-27.1) 254 57.4 (51.7-62.8) 446 129,588
Nanakuli/Waianae - - - - - - - - - - - -
HAWAII County
North Hawaii 30 9.8 ( 6.3-14.8) 12 5.5 ( 2.3-12.6) 107 27.7 (22.5-33.6) 166 57.1 (50.1-63.8) 315 28,326
Hilo 55 15.0 (10.8-20.4) 12 3.2 ( 1.7- 5.9) 137 29.1 (24.5-34.2) 222 52.7 (47.0-58.4) 426 36,284
Puna/Ka'u 82 19.8 (15.2-25.4) 20 5.1 ( 2.9- 8.7) 133 28.0 (22.9-33.7) 193 47.1 (41.1-53.2) 428 36,358
Kona 42 14.1 ( 9.8-19.7) 12 3.7 ( 2.0- 6.9) 133 33.3 (27.5-39.6) 155 49.0 (42.4-55.6) 342 27,929
KAUAI County
Hanalei/Kapa'a 29 13.0 ( 8.2-20.0) 13 4.5 ( 2.5- 7.9) 94 26.1 (20.9-32.0) 163 56.4 (49.2-63.4) 299 20,112
Lihue-Waimea 42 12.9 ( 8.9-18.3) 14 4.6 ( 2.4- 8.6) 107 26.7 (21.6-32.6) 188 55.8 (49.2-62.2) 351 26,959
MAUI County
Lahaina/Wailuku 32 11.8 ( 7.5-18.3) 12 4.1 ( 2.1- 7.8) 82 22.1 (17.0-28.3) 175 61.9 (54.4-68.9) 301 30,813
Kahului 35 10.6 ( 7.2-15.4) 14 4.7 ( 2.2- 9.7) 121 32.0 (26.5-38.0) 166 52.7 (46.2-59.2) 336 32,376
Upcountry/Hana 37 10.0 ( 7.0-14.2) 27 7.7 ( 4.5-12.8) 133 30.7 (25.4-36.5) 188 51.6 (45.4-57.8) 385 34,327
Lanai 28 17.6 (11.6-25.9) 14 9.1 ( 5.0-16.1) 53 24.5 (18.3-31.8) 112 48.8 (40.7-57.0) 207 1,895
Molokai 47 16.5 (11.7-22.7) 17 8.2 ( 4.9-13.3) 79 24.8 (19.2-31.4) 134 50.5 (43.2-57.9) 277 8,149
Percentages are weighted to population characteristics.N = Cell Sample Size, % = Percentage, 95% C.I. = Confidence Interval at 95 percent probability level
Rows with Sample Size less than 50 or containing half-width of 95% CI greater than 10 have been suppressed.

Smoking status (3 levels)State of Hawaii BRFSS 2007
Demographic Characteristics
Current smoker N % C.I.(95%)
Former smoker N % C.I.(95%)
Never smoked N % C.I.(95%)
Total N
Estimated numberof Adults
TOTAL 1,059 17.0 (15.7-18.4) 1,993 26.0 (24.6-27.4) 3,536 57.0 (55.4-58.7) 6,588 985,324
AGE GROUP
18-24 Years 73 21.7 (16.5-28.0) 38 10.7 ( 7.4-15.4) 207 67.6 (60.9-73.6) 318 125,628
25-34 Years 158 24.3 (20.2-29.0) 141 16.3 (13.3-19.8) 410 59.4 (54.6-64.0) 709 159,709
35-44 Years 193 17.1 (14.3-20.3) 206 18.6 (15.8-21.8) 700 64.3 (60.5-67.9) 1,099 174,736
45-54 Years 273 17.7 (15.3-20.3) 417 28.2 (25.2-31.3) 771 54.2 (50.8-57.5) 1,461 185,442
55-64 Years 231 15.2 (12.8-17.8) 552 37.8 (34.4-41.3) 648 47.0 (43.5-50.6) 1,431 155,411
65+ Years 130 8.3 ( 6.5-10.4) 630 39.5 (36.4-42.7) 784 52.2 (48.9-55.5) 1,544 180,341
Unknown/Refused - - - -- -
GENDER
Male 485 19.7 (17.5-22.1) 944 29.3 (27.1-31.6) 1,261 51.0 (48.4-53.6) 2,690 486,947
Female 574 14.3 (12.9-15.9) 1,049 22.7 (21.1-24.5) 2,275 63.0 (60.9-65.0) 3,898 498,377
ETHNICITY
White 413 15.4 (13.6-17.4) 1,009 32.7 (30.5-35.1) 1,274 51.8 (49.3-54.4) 2,696 311,567
Hawaiian 224 24.3 (20.6-28.5) 255 26.4 (22.6-30.7) 425 49.3 (44.6-53.9) 904 135,071
Filipino 127 16.4 (12.7-20.9) 163 16.9 (13.8-20.4) 584 66.8 (61.9-71.3) 874 173,336
Japanese 167 13.6 (11.3-16.4) 386 28.4 (25.4-31.5) 790 58.0 (54.5-61.4) 1,343 215,941
Others 126 19.4 (15.6-23.9) 173 18.5 (15.3-22.2) 447 62.1 (57.3-66.6) 746 146,549
Unknown/Refused - - - -- -
MARITAL STATUS
Married 474 13.3 (11.9-14.8) 1,154 29.0 (27.2-30.9) 2,125 57.7 (55.7-59.7) 3,753 585,535
Unmarried 585 22.4 (19.9-25.2) 836 21.5 (19.5-23.7) 1,401 56.0 (53.1-58.9) 2,822 398,553
Unknown/Refused - - - -- -
EDUCATION
<High School 72 26.6 (20.3-34.1) 95 23.2 (18.0-29.3) 174 50.2 (42.9-57.5) 341 53,321
High School 431 23.2 (20.4-26.2) 584 26.5 (23.9-29.3) 863 50.3 (46.9-53.6) 1,878 309,909
Some College 333 17.4 (15.0-20.1) 620 27.8 (25.2-30.6) 978 54.8 (51.6-57.9) 1,931 289,871
College 221 9.1 ( 7.6-10.9) 691 24.3 (22.2-26.5) 1,517 66.6 (64.1-69.0) 2,429 330,589
Unknown/Refused - - - -- -
EMPLOYMENT
Employed 699 19.1 (17.3-21.0) 1,078 23.2 (21.6-25.0) 2,255 57.7 (55.5-59.8) 4,032 634,061
Unemployed - - - - - - - - - -
Student/Homemaker 74 13.4 (10.2-17.4) 103 15.0 (11.6-19.2) 283 71.6 (66.3-76.4) 460 90,366
Retired/Can't work 230 11.4 ( 9.5-13.5) 766 38.7 (35.9-41.7) 915 49.9 (46.9-52.9) 1,911 228,247
Unknown/Refused - - - -- -
HOUSEHOLD INCOME
<$15,000 125 26.2 (20.2-33.2) 139 19.1 (15.2-23.7) 229 54.7 (47.8-61.5) 493 58,639
$15,000-24,999 196 25.6 (21.5-30.2) 248 26.2 (22.2-30.6) 384 48.3 (43.4-53.2) 828 103,456
$25,000-49,999 336 18.9 (16.5-21.7) 562 23.6 (21.2-26.2) 996 57.5 (54.3-60.6) 1,894 279,679
$50,000-74,999 148 12.6 (10.1-15.5) 363 31.1 (27.6-34.9) 591 56.3 (52.3-60.3) 1,102 169,765
>=$75,000 183 12.2 (10.0-14.8) 557 28.4 (25.8-31.2) 1,078 59.3 (56.3-62.3) 1,818 286,175
Unknown/Refused 71 18.5 (13.4-25.1) 124 20.0 (15.9-24.8) 258 61.5 (54.9-67.7) 453 87,610
Percentages are weighted to population characteristics.N = Cell Sample Size, % = Percentage, 95% C.I. = Confidence Interval at 95 percent probability level
Rows with Sample Size less than 50 or containing half-width of 95% CI greater than 10 have been suppressed.
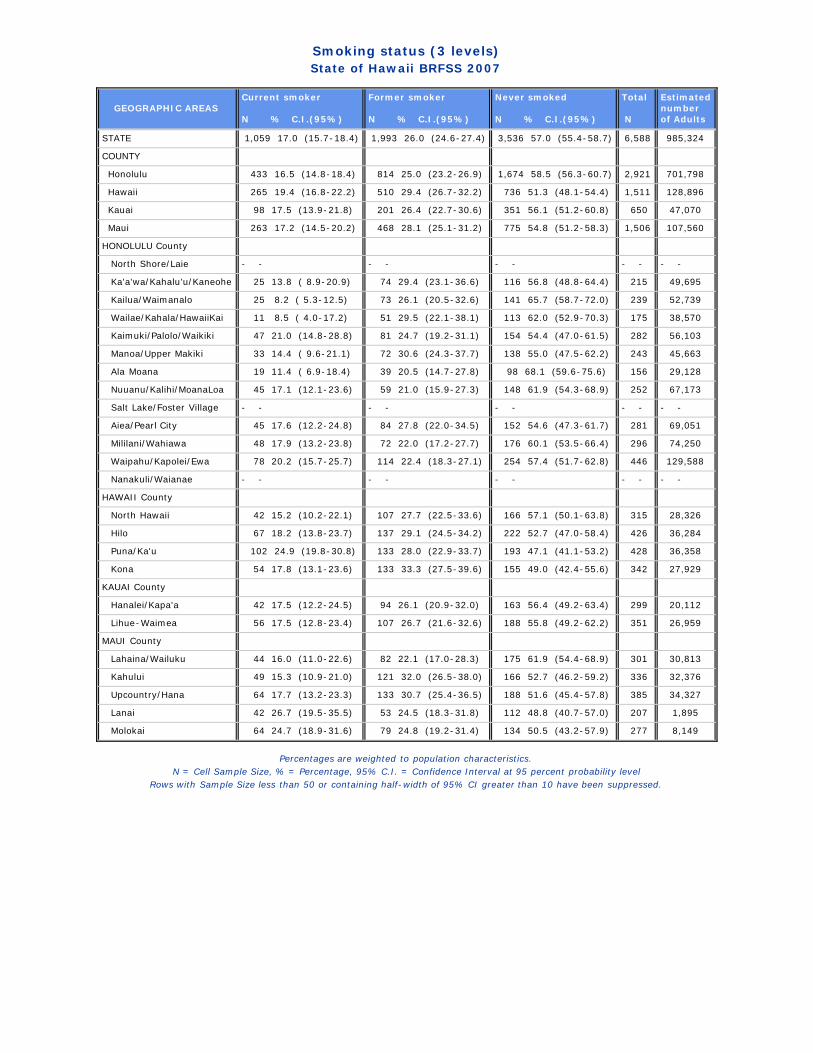
Smoking status (3 levels)State of Hawaii BRFSS 2007
GEOGRAPHIC AREAS Current smoker N % C.I.(95%)
Former smoker N % C.I.(95%)
Never smoked N % C.I.(95%)
Total N
Estimatednumberof Adults
STATE 1,059 17.0 (15.7-18.4) 1,993 26.0 (24.6-27.4) 3,536 57.0 (55.4-58.7) 6,588 985,324
COUNTY
Honolulu 433 16.5 (14.8-18.4) 814 25.0 (23.2-26.9) 1,674 58.5 (56.3-60.7) 2,921 701,798
Hawaii 265 19.4 (16.8-22.2) 510 29.4 (26.7-32.2) 736 51.3 (48.1-54.4) 1,511 128,896
Kauai 98 17.5 (13.9-21.8) 201 26.4 (22.7-30.6) 351 56.1 (51.2-60.8) 650 47,070
Maui 263 17.2 (14.5-20.2) 468 28.1 (25.1-31.2) 775 54.8 (51.2-58.3) 1,506 107,560
HONOLULU County
North Shore/Laie - - - - - - - - - -
Ka'a'wa/Kahalu'u/Kaneohe 25 13.8 ( 8.9-20.9) 74 29.4 (23.1-36.6) 116 56.8 (48.8-64.4) 215 49,695
Kailua/Waimanalo 25 8.2 ( 5.3-12.5) 73 26.1 (20.5-32.6) 141 65.7 (58.7-72.0) 239 52,739
Wailae/Kahala/HawaiiKai 11 8.5 ( 4.0-17.2) 51 29.5 (22.1-38.1) 113 62.0 (52.9-70.3) 175 38,570
Kaimuki/Palolo/Waikiki 47 21.0 (14.8-28.8) 81 24.7 (19.2-31.1) 154 54.4 (47.0-61.5) 282 56,103
Manoa/Upper Makiki 33 14.4 ( 9.6-21.1) 72 30.6 (24.3-37.7) 138 55.0 (47.5-62.2) 243 45,663
Ala Moana 19 11.4 ( 6.9-18.4) 39 20.5 (14.7-27.8) 98 68.1 (59.6-75.6) 156 29,128
Nuuanu/Kalihi/MoanaLoa 45 17.1 (12.1-23.6) 59 21.0 (15.9-27.3) 148 61.9 (54.3-68.9) 252 67,173
Salt Lake/Foster Village - - - - - - - - - -
Aiea/Pearl City 45 17.6 (12.2-24.8) 84 27.8 (22.0-34.5) 152 54.6 (47.3-61.7) 281 69,051
Mililani/Wahiawa 48 17.9 (13.2-23.8) 72 22.0 (17.2-27.7) 176 60.1 (53.5-66.4) 296 74,250
Waipahu/Kapolei/Ewa 78 20.2 (15.7-25.7) 114 22.4 (18.3-27.1) 254 57.4 (51.7-62.8) 446 129,588
Nanakuli/Waianae - - - - - - - - - -
HAWAII County
North Hawaii 42 15.2 (10.2-22.1) 107 27.7 (22.5-33.6) 166 57.1 (50.1-63.8) 315 28,326
Hilo 67 18.2 (13.8-23.7) 137 29.1 (24.5-34.2) 222 52.7 (47.0-58.4) 426 36,284
Puna/Ka'u 102 24.9 (19.8-30.8) 133 28.0 (22.9-33.7) 193 47.1 (41.1-53.2) 428 36,358
Kona 54 17.8 (13.1-23.6) 133 33.3 (27.5-39.6) 155 49.0 (42.4-55.6) 342 27,929
KAUAI County
Hanalei/Kapa'a 42 17.5 (12.2-24.5) 94 26.1 (20.9-32.0) 163 56.4 (49.2-63.4) 299 20,112
Lihue-Waimea 56 17.5 (12.8-23.4) 107 26.7 (21.6-32.6) 188 55.8 (49.2-62.2) 351 26,959
MAUI County
Lahaina/Wailuku 44 16.0 (11.0-22.6) 82 22.1 (17.0-28.3) 175 61.9 (54.4-68.9) 301 30,813
Kahului 49 15.3 (10.9-21.0) 121 32.0 (26.5-38.0) 166 52.7 (46.2-59.2) 336 32,376
Upcountry/Hana 64 17.7 (13.2-23.3) 133 30.7 (25.4-36.5) 188 51.6 (45.4-57.8) 385 34,327
Lanai 42 26.7 (19.5-35.5) 53 24.5 (18.3-31.8) 112 48.8 (40.7-57.0) 207 1,895
Molokai 64 24.7 (18.9-31.6) 79 24.8 (19.2-31.4) 134 50.5 (43.2-57.9) 277 8,149
Percentages are weighted to population characteristics.N = Cell Sample Size, % = Percentage, 95% C.I. = Confidence Interval at 95 percent probability level
Rows with Sample Size less than 50 or containing half-width of 95% CI greater than 10 have been suppressed.

During the past 12 months, have you stopped smoking for one day or longer trying to quit smoking?State of Hawaii BRFSS 2007
Demographic Characteristics
YES N % C.I.(95%)
NO N % C.I.(95%)
Total N
Estimated numberof Adults
TOTAL 586 61.8 (57.5-65.9) 472 38.2 (34.1-42.5) 1,058 167,301
AGE GROUP
18-24 Years 55 81.3 (69.6-89.2) 18 18.7 (10.8-30.4) 73 27,247
25-34 Years 102 72.1 (61.1-81.0) 56 27.9 (19.0-38.9) 158 38,854
35-44 Years 107 58.7 (49.2-67.6) 86 41.3 (32.4-50.8) 193 29,834
45-54 Years 149 54.0 (46.1-61.6) 124 46.0 (38.4-53.9) 273 32,781
55-64 Years 116 48.2 (39.4-57.1) 114 51.8 (42.9-60.6) 230 23,533
65+ Years - - - - - - - -
Unknown/Refused - - -- -
GENDER
Male 282 64.8 (58.5-70.6) 202 35.2 (29.4-41.5) 484 96,034
Female 304 57.8 (52.2-63.2) 270 42.2 (36.8-47.8) 574 71,267
ETHNICITY
White 220 58.2 (51.6-64.5) 193 41.8 (35.5-48.4) 413 48,063
Hawaiian 134 67.1 (58.3-74.7) 89 32.9 (25.3-41.7) 223 32,807
Filipino - - - - - - - -
Japanese 78 52.3 (42.3-62.2) 89 47.7 (37.8-57.7) 167 29,409
Others 77 68.8 (58.1-77.9) 49 31.2 (22.1-41.9) 126 28,495
Unknown/Refused - - -- -
MARITAL STATUS
Married 262 60.3 (54.6-65.7) 212 39.7 (34.3-45.4) 474 77,880
Unmarried 324 63.1 (56.8-69.1) 260 36.9 (30.9-43.2) 584 89,421
Unknown/Refused
EDUCATION
<High School - - - - - - - -
High School 232 64.2 (57.7-70.2) 198 35.8 (29.8-42.3) 430 71,909
Some College 187 60.1 (51.8-67.8) 146 39.9 (32.2-48.2) 333 50,475
College 120 58.3 (49.1-67.0) 101 41.7 (33.0-50.9) 221 30,219
Unknown/Refused - - -- -
EMPLOYMENT
Employed 387 62.9 (57.6-67.8) 312 37.1 (32.2-42.4) 699 120,897
Unemployed - - - - - - - -
Student/Homemaker - - - - - - - -
Retired/Can't work 121 53.8 (44.4-63.0) 108 46.2 (37.0-55.6) 229 25,904
Unknown/Refused - - -- -
HOUSEHOLD INCOME
<$15,000 - - - - - - - -
$15,000-24,999 114 58.7 (48.9-67.9) 82 41.3 (32.1-51.1) 196 26,466
$25,000-49,999 184 63.3 (56.1-69.9) 152 36.7 (30.1-43.9) 336 52,984
$50,000-74,999 - - - - - - - -
>=$75,000 - - - - - - - -
Unknown/Refused - - - - - - - -
COUNTY
Honolulu 234 61.5 (55.7-67.0) 199 38.5 (33.0-44.3) 433 115,692
Hawaii 158 66.9 (59.8-73.4) 106 33.1 (26.6-40.2) 264 24,908
Kauai - - - - - - - -
Maui 143 57.8 (48.8-66.3) 120 42.2 (33.7-51.2) 263 18,465
Percentages are weighted to population characteristics.
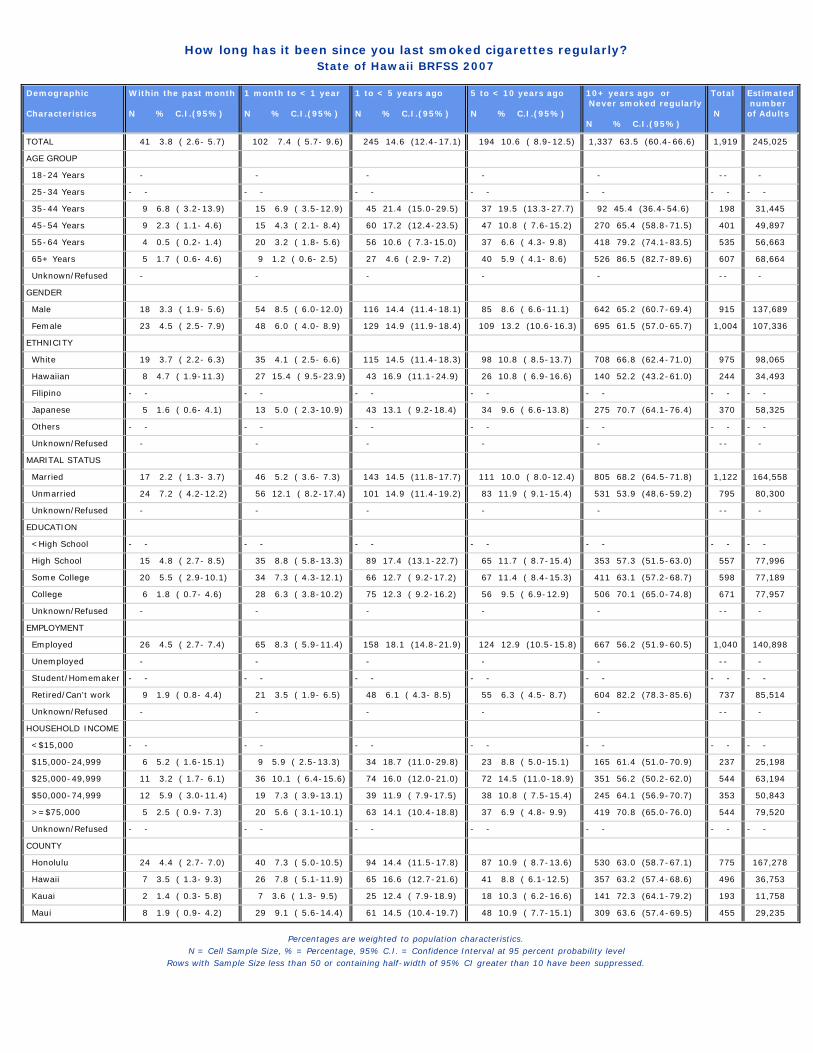
How long has it been since you last smoked cigarettes regularly?State of Hawaii BRFSS 2007
Demographic Characteristics
Within the past month N % C.I.(95%)
1 month to < 1 year N % C.I.(95%)
1 to < 5 years ago N % C.I.(95%)
5 to < 10 years ago N % C.I.(95%)
10+ years ago or Never smoked regularly N % C.I.(95%)
Total N
Estimated numberof Adults
TOTAL 41 3.8 ( 2.6- 5.7) 102 7.4 ( 5.7- 9.6) 245 14.6 (12.4-17.1) 194 10.6 ( 8.9-12.5) 1,337 63.5 (60.4-66.6) 1,919 245,025
AGE GROUP
18-24 Years - - - - - -- -
25-34 Years - - - - - - - - - - - - - -
35-44 Years 9 6.8 ( 3.2-13.9) 15 6.9 ( 3.5-12.9) 45 21.4 (15.0-29.5) 37 19.5 (13.3-27.7) 92 45.4 (36.4-54.6) 198 31,445
45-54 Years 9 2.3 ( 1.1- 4.6) 15 4.3 ( 2.1- 8.4) 60 17.2 (12.4-23.5) 47 10.8 ( 7.6-15.2) 270 65.4 (58.8-71.5) 401 49,897
55-64 Years 4 0.5 ( 0.2- 1.4) 20 3.2 ( 1.8- 5.6) 56 10.6 ( 7.3-15.0) 37 6.6 ( 4.3- 9.8) 418 79.2 (74.1-83.5) 535 56,663
65+ Years 5 1.7 ( 0.6- 4.6) 9 1.2 ( 0.6- 2.5) 27 4.6 ( 2.9- 7.2) 40 5.9 ( 4.1- 8.6) 526 86.5 (82.7-89.6) 607 68,664
Unknown/Refused - - - - - -- -
GENDER
Male 18 3.3 ( 1.9- 5.6) 54 8.5 ( 6.0-12.0) 116 14.4 (11.4-18.1) 85 8.6 ( 6.6-11.1) 642 65.2 (60.7-69.4) 915 137,689
Female 23 4.5 ( 2.5- 7.9) 48 6.0 ( 4.0- 8.9) 129 14.9 (11.9-18.4) 109 13.2 (10.6-16.3) 695 61.5 (57.0-65.7) 1,004 107,336
ETHNICITY
White 19 3.7 ( 2.2- 6.3) 35 4.1 ( 2.5- 6.6) 115 14.5 (11.4-18.3) 98 10.8 ( 8.5-13.7) 708 66.8 (62.4-71.0) 975 98,065
Hawaiian 8 4.7 ( 1.9-11.3) 27 15.4 ( 9.5-23.9) 43 16.9 (11.1-24.9) 26 10.8 ( 6.9-16.6) 140 52.2 (43.2-61.0) 244 34,493
Filipino - - - - - - - - - - - - - -
Japanese 5 1.6 ( 0.6- 4.1) 13 5.0 ( 2.3-10.9) 43 13.1 ( 9.2-18.4) 34 9.6 ( 6.6-13.8) 275 70.7 (64.1-76.4) 370 58,325
Others - - - - - - - - - - - - - -
Unknown/Refused - - - - - -- -
MARITAL STATUS
Married 17 2.2 ( 1.3- 3.7) 46 5.2 ( 3.6- 7.3) 143 14.5 (11.8-17.7) 111 10.0 ( 8.0-12.4) 805 68.2 (64.5-71.8) 1,122 164,558
Unmarried 24 7.2 ( 4.2-12.2) 56 12.1 ( 8.2-17.4) 101 14.9 (11.4-19.2) 83 11.9 ( 9.1-15.4) 531 53.9 (48.6-59.2) 795 80,300
Unknown/Refused - - - - - -- -
EDUCATION
<High School - - - - - - - - - - - - - -
High School 15 4.8 ( 2.7- 8.5) 35 8.8 ( 5.8-13.3) 89 17.4 (13.1-22.7) 65 11.7 ( 8.7-15.4) 353 57.3 (51.5-63.0) 557 77,996
Some College 20 5.5 ( 2.9-10.1) 34 7.3 ( 4.3-12.1) 66 12.7 ( 9.2-17.2) 67 11.4 ( 8.4-15.3) 411 63.1 (57.2-68.7) 598 77,189
College 6 1.8 ( 0.7- 4.6) 28 6.3 ( 3.8-10.2) 75 12.3 ( 9.2-16.2) 56 9.5 ( 6.9-12.9) 506 70.1 (65.0-74.8) 671 77,957
Unknown/Refused - - - - - -- -
EMPLOYMENT
Employed 26 4.5 ( 2.7- 7.4) 65 8.3 ( 5.9-11.4) 158 18.1 (14.8-21.9) 124 12.9 (10.5-15.8) 667 56.2 (51.9-60.5) 1,040 140,898
Unemployed - - - - - -- -
Student/Homemaker - - - - - - - - - - - - - -
Retired/Can't work 9 1.9 ( 0.8- 4.4) 21 3.5 ( 1.9- 6.5) 48 6.1 ( 4.3- 8.5) 55 6.3 ( 4.5- 8.7) 604 82.2 (78.3-85.6) 737 85,514
Unknown/Refused - - - - - -- -
HOUSEHOLD INCOME
<$15,000 - - - - - - - - - - - - - -
$15,000-24,999 6 5.2 ( 1.6-15.1) 9 5.9 ( 2.5-13.3) 34 18.7 (11.0-29.8) 23 8.8 ( 5.0-15.1) 165 61.4 (51.0-70.9) 237 25,198
$25,000-49,999 11 3.2 ( 1.7- 6.1) 36 10.1 ( 6.4-15.6) 74 16.0 (12.0-21.0) 72 14.5 (11.0-18.9) 351 56.2 (50.2-62.0) 544 63,194
$50,000-74,999 12 5.9 ( 3.0-11.4) 19 7.3 ( 3.9-13.1) 39 11.9 ( 7.9-17.5) 38 10.8 ( 7.5-15.4) 245 64.1 (56.9-70.7) 353 50,843
>=$75,000 5 2.5 ( 0.9- 7.3) 20 5.6 ( 3.1-10.1) 63 14.1 (10.4-18.8) 37 6.9 ( 4.8- 9.9) 419 70.8 (65.0-76.0) 544 79,520
Unknown/Refused - - - - - - - - - - - - - -
COUNTY
Honolulu 24 4.4 ( 2.7- 7.0) 40 7.3 ( 5.0-10.5) 94 14.4 (11.5-17.8) 87 10.9 ( 8.7-13.6) 530 63.0 (58.7-67.1) 775 167,278
Hawaii 7 3.5 ( 1.3- 9.3) 26 7.8 ( 5.1-11.9) 65 16.6 (12.7-21.6) 41 8.8 ( 6.1-12.5) 357 63.2 (57.4-68.6) 496 36,753
Kauai 2 1.4 ( 0.3- 5.8) 7 3.6 ( 1.3- 9.5) 25 12.4 ( 7.9-18.9) 18 10.3 ( 6.2-16.6) 141 72.3 (64.1-79.2) 193 11,758
Maui 8 1.9 ( 0.9- 4.2) 29 9.1 ( 5.6-14.4) 61 14.5 (10.4-19.7) 48 10.9 ( 7.7-15.1) 309 63.6 (57.4-69.5) 455 29,235
Percentages are weighted to population characteristics.N = Cell Sample Size, % = Percentage, 95% C.I. = Confidence Interval at 95 percent probability level
Rows with Sample Size less than 50 or containing half-width of 95% CI greater than 10 have been suppressed.

Number of times you saw a doctor/nurse/health professional to get any kind of care for yourself in thepast 12 months
State of Hawaii BRFSS 2007
Demographic Characteristics
None N % C.I.(95%)
Once N % C.I.(95%)
Twice N % C.I.(95%)
Three times or more N % C.I.(95%)
Total N
Estimated numberof Adults
TOTAL 416 40.0 (35.7-44.4) 216 17.6 (14.7-20.9) 126 11.2 ( 8.8-14.0) 394 31.2 (27.5-35.2) 1,152 184,795
AGE GROUP
18-24 Years - - - - - - - - - - - -
25-34 Years 79 47.6 (37.9-57.5) 31 17.2 (11.3-25.3) 25 11.3 ( 7.0-18.0) 52 23.9 (16.7-32.8) 187 44,827
35-44 Years 80 38.4 (29.7-48.0) 42 17.7 (12.0-25.5) 18 8.6 ( 4.7-15.0) 64 35.3 (26.9-44.6) 204 32,173
45-54 Years 98 36.5 (29.6-44.1) 59 21.1 (15.6-27.9) 30 11.0 ( 6.9-17.1) 96 31.4 (24.9-38.8) 283 34,075
55-64 Years 66 25.4 (18.7-33.5) 50 19.4 (13.6-26.8) 28 12.2 ( 7.6-19.2) 103 43.0 (34.7-51.7) 247 24,358
65+ Years - - - - - - - - - - - -
Unknown/Refused - - - - -- -
GENDER
Male 218 47.0 (40.8-53.4) 101 15.9 (12.1-20.6) 57 9.5 ( 6.8-13.2) 156 27.6 (22.6-33.2) 532 106,475
Female 198 30.4 (25.6-35.7) 115 19.9 (15.8-24.8) 69 13.4 ( 9.8-18.2) 238 36.2 (31.1-41.7) 620 78,320
ETHNICITY
White 142 32.1 (26.4-38.3) 91 17.9 (13.8-23.0) 52 12.7 ( 8.9-17.7) 168 37.3 (31.1-43.9) 453 54,120
Hawaiian 100 40.0 (31.8-48.8) 47 18.6 (12.7-26.3) 31 12.3 ( 7.8-18.7) 74 29.1 (22.0-37.4) 252 38,777
Filipino - - - - - - - - - - - -
Japanese 61 31.6 (23.2-41.5) 29 18.2 (11.3-28.0) 17 12.3 ( 7.1-20.4) 66 37.9 (28.6-48.2) 173 30,809
Others - - - - - - - - - - - -
Unknown/Refused - - - - -- -
MARITAL STATUS
Married 175 35.5 (30.3-41.1) 104 18.2 (14.5-22.7) 62 12.1 ( 9.0-16.1) 175 34.1 (29.2-39.5) 516 84,669
Unmarried 241 43.8 (37.4-50.4) 112 17.1 (13.0-22.1) 64 10.4 ( 7.2-14.6) 219 28.8 (23.6-34.6) 636 100,126
Unknown/Refused
EDUCATION
<High School - - - - - - - - - - - -
High School 180 44.9 (38.1-52.0) 94 19.0 (14.4-24.7) 46 10.5 ( 7.3-15.0) 139 25.5 (20.5-31.4) 459 78,468
Some College 130 39.1 (31.5-47.2) 67 16.1 (11.7-21.8) 45 12.4 ( 8.3-18.3) 128 32.4 (25.7-39.8) 370 56,879
College 74 30.9 (23.2-39.8) 41 16.5 (11.0-24.0) 29 10.5 ( 6.3-16.9) 104 42.1 (33.6-51.1) 248 35,700
Unknown/Refused - - - - -- -
EMPLOYMENT
Employed 297 41.8 (36.5-47.3) 154 19.1 (15.5-23.4) 80 9.8 ( 7.2-13.2) 223 29.3 (24.9-34.2) 754 131,948
Unemployed - - - - - - - - - - - -
Student/Homemaker - - - - - - - - - - - -
Retired/Can't work 69 32.6 (24.6-41.7) 34 11.2 ( 7.2-16.9) 28 15.6 ( 9.9-23.7) 119 40.6 (32.5-49.3) 250 28,117
Unknown/Refused - - - - -- -
HOUSEHOLD INCOME
<$15,000 - - - - - - - - - - - -
$15,000-24,999 67 40.1 (30.5-50.4) 37 16.0 (10.2-24.2) 23 16.4 (10.0-25.8) 74 27.5 (20.3-36.1) 201 27,577
$25,000-49,999 149 44.0 (36.7-51.6) 74 18.8 (13.8-25.2) 32 8.5 ( 5.4-13.0) 112 28.7 (22.7-35.5) 367 58,569
$50,000-74,999 - - - - - - - - - - - -
>=$75,000 - - - - - - - - - - - -
Unknown/Refused - - - - - - - - - - - -
COUNTY
Honolulu 169 40.9 (35.2-46.9) 86 17.5 (13.7-22.1) 53 11.2 ( 8.2-15.1) 161 30.4 (25.5-35.7) 469 127,537
Hawaii 103 38.6 (31.4-46.4) 55 16.3 (11.9-21.9) 26 10.1 ( 6.5-15.4) 108 35.0 (28.2-42.3) 292 28,103
Kauai - - - - - - - - - - - -
Maui 99 35.2 (27.4-44.0) 52 17.5 (12.2-24.5) 39 14.1 ( 9.2-21.1) 96 33.1 (25.6-41.6) 286 20,421
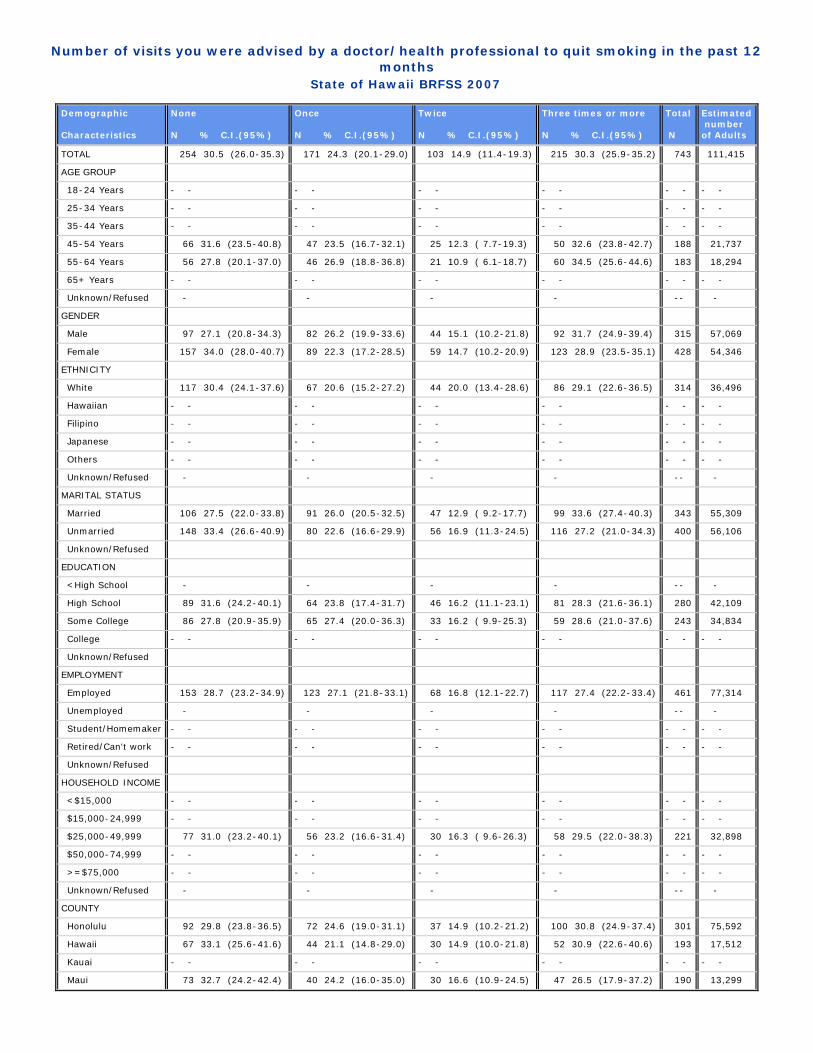
Number of visits you were advised by a doctor/health professional to quit smoking in the past 12months
State of Hawaii BRFSS 2007
Demographic Characteristics
None N % C.I.(95%)
Once N % C.I.(95%)
Twice N % C.I.(95%)
Three times or more N % C.I.(95%)
Total N
Estimated numberof Adults
TOTAL 254 30.5 (26.0-35.3) 171 24.3 (20.1-29.0) 103 14.9 (11.4-19.3) 215 30.3 (25.9-35.2) 743 111,415
AGE GROUP
18-24 Years - - - - - - - - - - - -
25-34 Years - - - - - - - - - - - -
35-44 Years - - - - - - - - - - - -
45-54 Years 66 31.6 (23.5-40.8) 47 23.5 (16.7-32.1) 25 12.3 ( 7.7-19.3) 50 32.6 (23.8-42.7) 188 21,737
55-64 Years 56 27.8 (20.1-37.0) 46 26.9 (18.8-36.8) 21 10.9 ( 6.1-18.7) 60 34.5 (25.6-44.6) 183 18,294
65+ Years - - - - - - - - - - - -
Unknown/Refused - - - - -- -
GENDER
Male 97 27.1 (20.8-34.3) 82 26.2 (19.9-33.6) 44 15.1 (10.2-21.8) 92 31.7 (24.9-39.4) 315 57,069
Female 157 34.0 (28.0-40.7) 89 22.3 (17.2-28.5) 59 14.7 (10.2-20.9) 123 28.9 (23.5-35.1) 428 54,346
ETHNICITY
White 117 30.4 (24.1-37.6) 67 20.6 (15.2-27.2) 44 20.0 (13.4-28.6) 86 29.1 (22.6-36.5) 314 36,496
Hawaiian - - - - - - - - - - - -
Filipino - - - - - - - - - - - -
Japanese - - - - - - - - - - - -
Others - - - - - - - - - - - -
Unknown/Refused - - - - -- -
MARITAL STATUS
Married 106 27.5 (22.0-33.8) 91 26.0 (20.5-32.5) 47 12.9 ( 9.2-17.7) 99 33.6 (27.4-40.3) 343 55,309
Unmarried 148 33.4 (26.6-40.9) 80 22.6 (16.6-29.9) 56 16.9 (11.3-24.5) 116 27.2 (21.0-34.3) 400 56,106
Unknown/Refused
EDUCATION
<High School - - - - -- -
High School 89 31.6 (24.2-40.1) 64 23.8 (17.4-31.7) 46 16.2 (11.1-23.1) 81 28.3 (21.6-36.1) 280 42,109
Some College 86 27.8 (20.9-35.9) 65 27.4 (20.0-36.3) 33 16.2 ( 9.9-25.3) 59 28.6 (21.0-37.6) 243 34,834
College - - - - - - - - - - - -
Unknown/Refused
EMPLOYMENT
Employed 153 28.7 (23.2-34.9) 123 27.1 (21.8-33.1) 68 16.8 (12.1-22.7) 117 27.4 (22.2-33.4) 461 77,314
Unemployed - - - - -- -
Student/Homemaker - - - - - - - - - - - -
Retired/Can't work - - - - - - - - - - - -
Unknown/Refused
HOUSEHOLD INCOME
<$15,000 - - - - - - - - - - - -
$15,000-24,999 - - - - - - - - - - - -
$25,000-49,999 77 31.0 (23.2-40.1) 56 23.2 (16.6-31.4) 30 16.3 ( 9.6-26.3) 58 29.5 (22.0-38.3) 221 32,898
$50,000-74,999 - - - - - - - - - - - -
>=$75,000 - - - - - - - - - - - -
Unknown/Refused - - - - -- -
COUNTY
Honolulu 92 29.8 (23.8-36.5) 72 24.6 (19.0-31.1) 37 14.9 (10.2-21.2) 100 30.8 (24.9-37.4) 301 75,592
Hawaii 67 33.1 (25.6-41.6) 44 21.1 (14.8-29.0) 30 14.9 (10.0-21.8) 52 30.9 (22.6-40.6) 193 17,512
Kauai - - - - - - - - - - - -
Maui 73 32.7 (24.2-42.4) 40 24.2 (16.0-35.0) 30 16.6 (10.9-24.5) 47 26.5 (17.9-37.2) 190 13,299

Number of visits in the past 12 months, on which doctor, or health professional discussed medication toassist quitting smoking
State of Hawaii BRFSS 2007
Demographic Characteristics
None N % C.I.(95%)
Once N % C.I.(95%)
Twice N % C.I.(95%)
Three times or more N % C.I.(95%)
Total N
Estimated numberof Adults
TOTAL 449 59.9 (54.8-64.8) 136 20.8 (16.8-25.4) 58 7.3 ( 5.3-10.2) 99 12.0 ( 9.3-15.3) 742 112,443
AGE GROUP
18-24 Years - - - - - - - - - - - -
25-34 Years - - - - - - - - - - - -
35-44 Years - - - - - - - - - - - -
45-54 Years 103 48.8 (39.3-58.4) 42 27.3 (19.3-37.0) 18 11.6 ( 6.7-19.5) 24 12.3 ( 7.7-19.0) 187 22,190
55-64 Years 105 53.5 (43.5-63.2) 38 20.7 (13.6-30.2) 9 4.8 ( 2.1-10.5) 31 21.0 (13.4-31.2) 183 18,406
65+ Years - - - - - - - - - - - -
Unknown/Refused - - - - -- -
GENDER
Male 174 57.5 (49.8-64.8) 67 21.8 (16.1-28.7) 29 8.8 ( 5.8-13.2) 46 12.0 ( 8.2-17.1) 316 57,539
Female 275 62.4 (55.6-68.8) 69 19.7 (14.5-26.2) 29 5.8 ( 3.3- 9.9) 53 12.1 ( 8.6-16.7) 426 54,904
ETHNICITY
White 196 58.7 (50.7-66.3) 61 22.3 (16.1-30.1) 18 6.5 ( 3.6-11.5) 39 12.4 ( 8.2-18.4) 314 37,070
Hawaiian - - - - - - - - - - - -
Filipino - - - - - - - - - - - -
Japanese - - - - - - - - - - - -
Others - - - - - - - - - - - -
Unknown/Refused - - - - -- -
MARITAL STATUS
Married 190 54.3 (47.6-60.9) 77 22.1 (17.1-28.0) 32 8.8 ( 5.8-13.2) 45 14.8 (10.6-20.2) 344 55,762
Unmarried 259 65.4 (57.7-72.3) 59 19.5 (13.7-26.9) 26 5.9 ( 3.4-10.0) 54 9.3 ( 6.3-13.4) 398 56,680
Unknown/Refused
EDUCATION
<High School - - - - -- -
High School 157 55.4 (47.1-63.3) 54 19.5 (14.0-26.4) 27 9.2 ( 5.5-15.0) 43 16.0 (11.0-22.8) 281 43,383
Some College 161 64.1 (54.8-72.5) 41 21.3 (14.2-30.7) 12 5.7 ( 2.9-10.9) 26 8.9 ( 5.4-14.3) 240 34,720
College - - - - - - - - - - - -
Unknown/Refused
EMPLOYMENT
Employed 284 58.7 (52.3-64.9) 94 23.4 (18.3-29.5) 37 7.4 ( 4.8-11.2) 47 10.4 ( 7.3-14.7) 462 77,546
Unemployed - - - - -- -
Student/Homemaker - - - - - - - - - - - -
Retired/Can't work - - - - - - - - - - - -
Unknown/Refused
HOUSEHOLD INCOME
<$15,000 - - - - - - - - - - - -
$15,000-24,999 - - - - - - - - - - - -
$25,000-49,999 125 52.6 (43.3-61.8) 48 26.6 (18.9-36.2) 15 5.6 ( 2.4-12.3) 32 15.2 ( 9.8-22.9) 220 32,891
$50,000-74,999 - - - - - - - - - - - -
>=$75,000 - - - - - - - - - - - -
Unknown/Refused - - - - -- -
COUNTY
Honolulu 173 59.5 (52.7-66.0) 62 21.7 (16.5-28.0) 22 6.9 ( 4.3-11.0) 46 11.9 ( 8.6-16.2) 303 76,672
Hawaii 124 62.8 (53.5-71.3) 27 12.9 ( 8.4-19.4) 17 8.5 ( 5.0-14.1) 24 15.7 ( 9.1-25.7) 192 17,461
Kauai - - - - - - - - - - - -
Maui - - - - - - - - - - - -

Number of visits in the past 12 months, on which doctor, or health professional discussed method andstrategies other than medication to assist quitting smoking
State of Hawaii BRFSS 2007
Demographic Characteristics
None N % C.I.(95%)
Once N % C.I.(95%)
Twice N % C.I.(95%)
Three times or more N % C.I.(95%)
Total N
Estimated numberof Adults
TOTAL 477 64.6 (59.6-69.4) 101 14.9 (11.5-19.2) 63 8.2 ( 5.9-11.2) 93 12.2 ( 9.4-15.8) 734 111,313
AGE GROUP
18-24 Years - - - - - - - - - - - -
25-34 Years - - - - - - - - - - - -
35-44 Years - - - - - - - - - - - -
45-54 Years 114 56.4 (46.6-65.6) 31 18.5 (12.0-27.4) 20 13.4 ( 8.0-21.5) 22 11.8 ( 6.9-19.3) 187 22,132
55-64 Years 118 64.5 (54.0-73.7) 23 14.3 ( 8.1-23.9) 16 9.1 ( 4.6-17.4) 24 12.1 ( 6.8-20.7) 181 18,135
65+ Years - - - - - - - - - - - -
Unknown/Refused - - - - -- -
GENDER
Male 188 61.1 (53.4-68.4) 48 15.4 (10.4-22.0) 33 11.2 ( 7.3-16.7) 41 12.3 ( 8.4-17.8) 310 56,753
Female 289 68.3 (61.7-74.1) 53 14.5 (10.2-20.2) 30 5.1 ( 3.2- 8.0) 52 12.1 ( 8.4-17.2) 424 54,560
ETHNICITY
White 209 63.0 (54.9-70.5) 43 15.4 (10.0-22.9) 19 7.2 ( 4.1-12.3) 39 14.4 ( 9.8-20.7) 310 36,709
Hawaiian - - - - - - - - - - - -
Filipino - - - - - - - - - - - -
Japanese - - - - - - - - - - - -
Others - - - - - - - - - - - -
Unknown/Refused - - - - -- -
MARITAL STATUS
Married 207 58.1 (51.2-64.7) 56 16.9 (12.2-23.0) 38 10.7 ( 7.3-15.5) 39 14.2 ( 9.9-20.0) 340 55,240
Unmarried 270 71.0 (63.8-77.4) 45 13.0 ( 8.5-19.4) 25 5.7 ( 3.2-10.0) 54 10.2 ( 6.9-14.9) 394 56,073
Unknown/Refused
EDUCATION
<High School - - - - -- -
High School 166 61.6 (53.4-69.1) 44 15.6 (10.8-22.1) 27 7.6 ( 4.6-12.4) 41 15.2 (10.3-22.0) 278 42,724
Some College 170 71.1 (62.6-78.3) 29 12.5 ( 7.6-19.9) 17 8.4 ( 4.8-14.5) 22 7.9 ( 4.7-13.1) 238 34,558
College - - - - - - - - - - - -
Unknown/Refused
EMPLOYMENT
Employed 299 65.4 (59.2-71.2) 68 15.6 (11.5-20.8) 39 8.0 ( 5.2-12.0) 51 11.0 ( 7.8-15.3) 457 76,899
Unemployed - - - - -- -
Student/Homemaker - - - - - - - - - - - -
Retired/Can't work - - - - - - - - - - - -
Unknown/Refused
HOUSEHOLD INCOME
<$15,000 - - - - - - - - - - - -
$15,000-24,999 - - - - - - - - - - - -
$25,000-49,999 147 66.8 (57.3-75.0) 30 13.8 ( 8.2-22.4) 11 3.3 ( 1.5- 7.0) 30 16.1 (10.3-24.3) 218 32,773
$50,000-74,999 - - - - - - - - - - - -
>=$75,000 92 71.4 (61.3-79.7) 22 15.7 ( 9.6-24.5) 12 7.4 ( 3.7-14.2) 11 5.6 ( 2.8-10.9) 137 25,008
Unknown/Refused - - - - -- -
COUNTY
Honolulu 188 63.8 (57.0-70.1) 41 15.1 (10.7-21.0) 24 8.0 ( 5.1-12.3) 46 13.1 ( 9.4-18.0) 299 76,019
Hawaii 124 65.6 (56.2-73.9) 27 13.2 ( 8.2-20.4) 20 10.6 ( 6.5-16.6) 18 10.7 ( 5.2-20.6) 189 17,176
Kauai - - - - - - - - - - - -
Maui 128 71.6 (62.0-79.7) 25 15.4 ( 9.1-24.9) 15 6.0 ( 3.0-11.5) 19 7.0 ( 4.0-11.8) 187 13,152

ALCOHOL USE
There are four questions asked relevant to alcohol consumption.
A./ During the past 30 days, have you had at least one drink of any alcoholic beverage such as beer, wine, a malt beverage or liquor?
B./ During the past 30 days, how many days per week or per month did you have at least one drink of any alcoholic beverage?
C./ One drink is equivalent to a 12-ounce beer, a 5-ounce glass of wine, or a drink with one shot of liquor. During the past 30 days, on the days when you drank, about how many drinks did you drink? NOTE: A 40 ounce beer would count as 3 drinks or a cocktail drink with 2 shots would count as 2 drinks. D./ Considering all types of alcoholic beverages, how many times during the past 30 days did you have X (X = 5 for men, X = 4 for women) or more drinks on an occasion? E./ During the past 30 days, what is the largest number of drinks you had on any occasion?
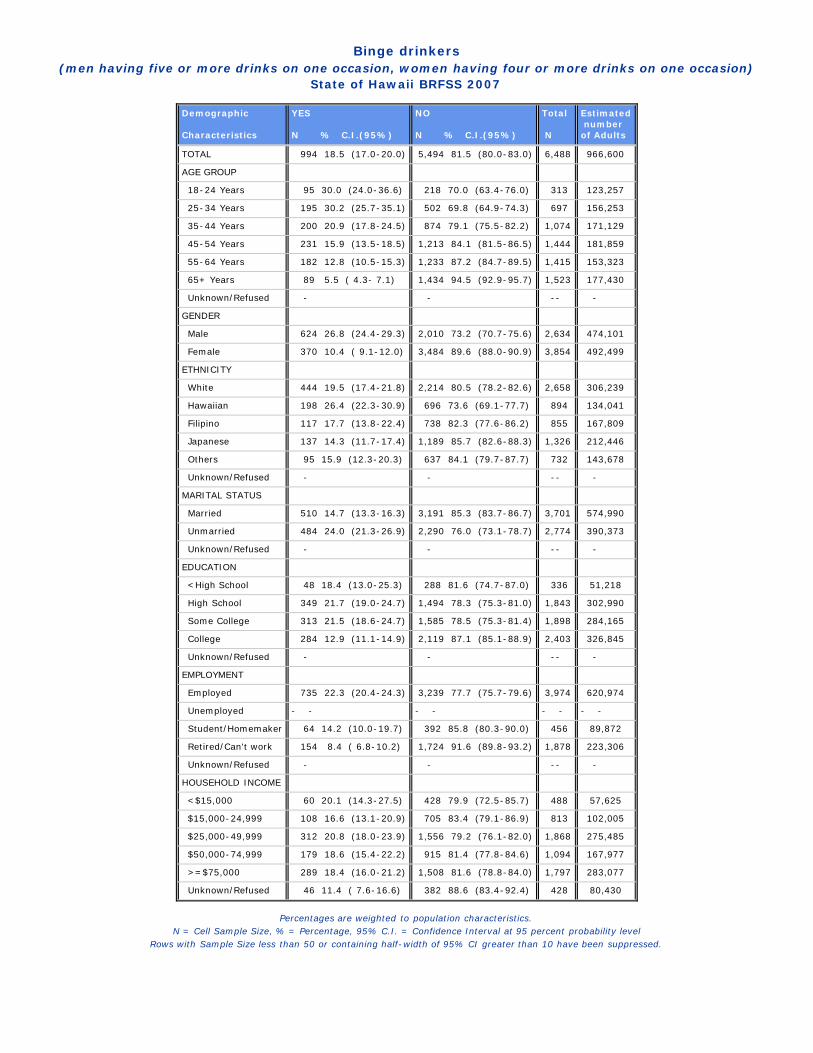
Binge drinkers(men having five or more drinks on one occasion, women having four or more drinks on one occasion)
State of Hawaii BRFSS 2007
Demographic Characteristics
YES N % C.I.(95%)
NO N % C.I.(95%)
Total N
Estimated numberof Adults
TOTAL 994 18.5 (17.0-20.0) 5,494 81.5 (80.0-83.0) 6,488 966,600
AGE GROUP
18-24 Years 95 30.0 (24.0-36.6) 218 70.0 (63.4-76.0) 313 123,257
25-34 Years 195 30.2 (25.7-35.1) 502 69.8 (64.9-74.3) 697 156,253
35-44 Years 200 20.9 (17.8-24.5) 874 79.1 (75.5-82.2) 1,074 171,129
45-54 Years 231 15.9 (13.5-18.5) 1,213 84.1 (81.5-86.5) 1,444 181,859
55-64 Years 182 12.8 (10.5-15.3) 1,233 87.2 (84.7-89.5) 1,415 153,323
65+ Years 89 5.5 ( 4.3- 7.1) 1,434 94.5 (92.9-95.7) 1,523 177,430
Unknown/Refused - - -- -
GENDER
Male 624 26.8 (24.4-29.3) 2,010 73.2 (70.7-75.6) 2,634 474,101
Female 370 10.4 ( 9.1-12.0) 3,484 89.6 (88.0-90.9) 3,854 492,499
ETHNICITY
White 444 19.5 (17.4-21.8) 2,214 80.5 (78.2-82.6) 2,658 306,239
Hawaiian 198 26.4 (22.3-30.9) 696 73.6 (69.1-77.7) 894 134,041
Filipino 117 17.7 (13.8-22.4) 738 82.3 (77.6-86.2) 855 167,809
Japanese 137 14.3 (11.7-17.4) 1,189 85.7 (82.6-88.3) 1,326 212,446
Others 95 15.9 (12.3-20.3) 637 84.1 (79.7-87.7) 732 143,678
Unknown/Refused - - -- -
MARITAL STATUS
Married 510 14.7 (13.3-16.3) 3,191 85.3 (83.7-86.7) 3,701 574,990
Unmarried 484 24.0 (21.3-26.9) 2,290 76.0 (73.1-78.7) 2,774 390,373
Unknown/Refused - - -- -
EDUCATION
<High School 48 18.4 (13.0-25.3) 288 81.6 (74.7-87.0) 336 51,218
High School 349 21.7 (19.0-24.7) 1,494 78.3 (75.3-81.0) 1,843 302,990
Some College 313 21.5 (18.6-24.7) 1,585 78.5 (75.3-81.4) 1,898 284,165
College 284 12.9 (11.1-14.9) 2,119 87.1 (85.1-88.9) 2,403 326,845
Unknown/Refused - - -- -
EMPLOYMENT
Employed 735 22.3 (20.4-24.3) 3,239 77.7 (75.7-79.6) 3,974 620,974
Unemployed - - - - - - - -
Student/Homemaker 64 14.2 (10.0-19.7) 392 85.8 (80.3-90.0) 456 89,872
Retired/Can't work 154 8.4 ( 6.8-10.2) 1,724 91.6 (89.8-93.2) 1,878 223,306
Unknown/Refused - - -- -
HOUSEHOLD INCOME
<$15,000 60 20.1 (14.3-27.5) 428 79.9 (72.5-85.7) 488 57,625
$15,000-24,999 108 16.6 (13.1-20.9) 705 83.4 (79.1-86.9) 813 102,005
$25,000-49,999 312 20.8 (18.0-23.9) 1,556 79.2 (76.1-82.0) 1,868 275,485
$50,000-74,999 179 18.6 (15.4-22.2) 915 81.4 (77.8-84.6) 1,094 167,977
>=$75,000 289 18.4 (16.0-21.2) 1,508 81.6 (78.8-84.0) 1,797 283,077
Unknown/Refused 46 11.4 ( 7.6-16.6) 382 88.6 (83.4-92.4) 428 80,430
Percentages are weighted to population characteristics.N = Cell Sample Size, % = Percentage, 95% C.I. = Confidence Interval at 95 percent probability level
Rows with Sample Size less than 50 or containing half-width of 95% CI greater than 10 have been suppressed.

Binge drinkers(men having five or more drinks on one occasion, women having four or more drinks on one occasion)
State of Hawaii BRFSS 2007
GEOGRAPHIC AREAS YES N % C.I.(95%)
NO N % C.I.(95%)
Total N
Estimatednumberof Adults
STATE 994 18.5 (17.0-20.0) 5,494 81.5 (80.0-83.0) 6,488 966,600
COUNTY
Honolulu 417 18.3 (16.4-20.3) 2,453 81.7 (79.7-83.6) 2,870 687,698
Hawaii 226 18.1 (15.5-21.0) 1,261 81.9 (79.0-84.5) 1,487 125,709
Kauai 96 19.3 (15.2-24.1) 546 80.7 (75.9-84.8) 642 46,702
Maui 255 19.7 (16.8-23.1) 1,234 80.3 (76.9-83.2) 1,489 106,492
HONOLULU County
North Shore/Laie 16 18.0 (10.5-29.3) 69 82.0 (70.7-89.5) 85 20,876
Ka'a'wa/Kahalu'u/Kaneohe 26 16.2 (10.6-23.9) 187 83.8 (76.1-89.4) 213 49,247
Kailua/Waimanalo 27 14.5 ( 9.6-21.3) 207 85.5 (78.7-90.4) 234 51,769
Wailae/Kahala/HawaiiKai 18 13.6 ( 8.2-21.6) 156 86.4 (78.4-91.8) 174 38,183
Kaimuki/Palolo/Waikiki 36 16.5 (10.8-24.5) 237 83.5 (75.5-89.2) 273 54,100
Manoa/Upper Makiki 32 15.4 (10.6-21.9) 208 84.6 (78.1-89.4) 240 45,013
Ala Moana 15 10.8 ( 6.2-17.9) 139 89.2 (82.1-93.8) 154 28,846
Nuuanu/Kalihi/MoanaLoa 37 20.1 (14.1-27.8) 212 79.9 (72.2-85.9) 249 66,518
Salt Lake/Foster Village 17 17.6 (10.6-27.8) 102 82.4 (72.2-89.4) 119 27,038
Aiea/Pearl City 42 16.4 (11.7-22.6) 233 83.6 (77.4-88.3) 275 67,525
Mililani/Wahiawa 45 18.1 (13.3-24.3) 248 81.9 (75.7-86.7) 293 73,333
Waipahu/Kapolei/Ewa 74 22.6 (17.7-28.5) 362 77.4 (71.5-82.3) 436 126,579
Nanakuli/Waianae 32 28.8 (19.8-39.7) 93 71.2 (60.3-80.2) 125 38,670
HAWAII County
North Hawaii 55 22.5 (16.3-30.3) 259 77.5 (69.7-83.7) 314 28,205
Hilo 53 16.6 (12.1-22.3) 367 83.4 (77.7-87.9) 420 35,658
Puna/Ka'u 67 18.0 (13.8-23.1) 349 82.0 (76.9-86.2) 416 34,540
Kona 51 15.7 (11.5-21.0) 286 84.3 (79.0-88.5) 337 27,306
KAUAI County
Hanalei/Kapa'a 40 16.8 (11.5-23.9) 256 83.2 (76.1-88.5) 296 19,989
Lihue-Waimea 56 21.1 (15.6-27.9) 290 78.9 (72.1-84.4) 346 26,712
MAUI County
Lahaina/Wailuku 49 20.1 (14.2-27.7) 250 79.9 (72.3-85.8) 299 30,697
Kahului 44 16.3 (11.6-22.4) 285 83.7 (77.6-88.4) 329 31,894
Upcountry/Hana 63 21.0 (15.9-27.2) 320 79.0 (72.8-84.1) 383 34,050
Lanai 44 28.6 (21.3-37.2) 161 71.4 (62.8-78.7) 205 1,862
Molokai 55 24.2 (18.3-31.3) 218 75.8 (68.7-81.7) 273 7,988
Percentages are weighted to population characteristics.N = Cell Sample Size, % = Percentage, 95% C.I. = Confidence Interval at 95 percent probability level
Rows with Sample Size less than 50 or containing half-width of 95% CI greater than 10 have been suppressed.
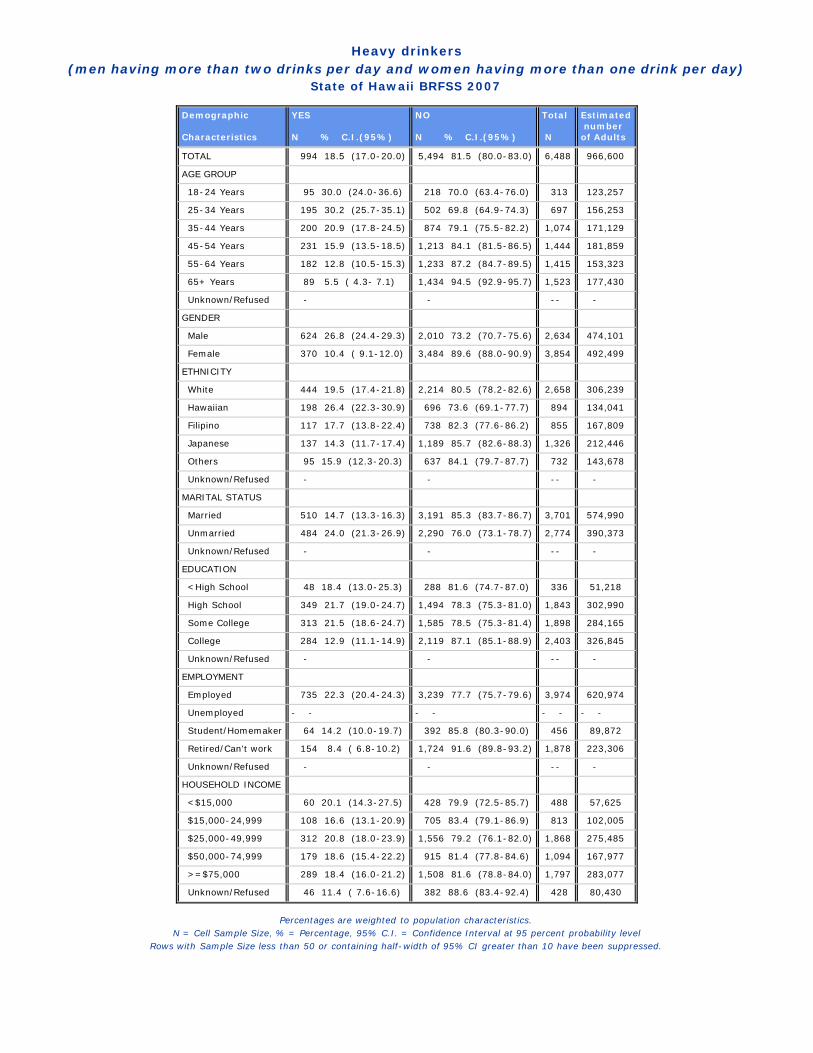
Heavy drinkers(men having more than two drinks per day and women having more than one drink per day)
State of Hawaii BRFSS 2007
Demographic Characteristics
YES N % C.I.(95%)
NO N % C.I.(95%)
Total N
Estimated numberof Adults
TOTAL 994 18.5 (17.0-20.0) 5,494 81.5 (80.0-83.0) 6,488 966,600
AGE GROUP
18-24 Years 95 30.0 (24.0-36.6) 218 70.0 (63.4-76.0) 313 123,257
25-34 Years 195 30.2 (25.7-35.1) 502 69.8 (64.9-74.3) 697 156,253
35-44 Years 200 20.9 (17.8-24.5) 874 79.1 (75.5-82.2) 1,074 171,129
45-54 Years 231 15.9 (13.5-18.5) 1,213 84.1 (81.5-86.5) 1,444 181,859
55-64 Years 182 12.8 (10.5-15.3) 1,233 87.2 (84.7-89.5) 1,415 153,323
65+ Years 89 5.5 ( 4.3- 7.1) 1,434 94.5 (92.9-95.7) 1,523 177,430
Unknown/Refused - - -- -
GENDER
Male 624 26.8 (24.4-29.3) 2,010 73.2 (70.7-75.6) 2,634 474,101
Female 370 10.4 ( 9.1-12.0) 3,484 89.6 (88.0-90.9) 3,854 492,499
ETHNICITY
White 444 19.5 (17.4-21.8) 2,214 80.5 (78.2-82.6) 2,658 306,239
Hawaiian 198 26.4 (22.3-30.9) 696 73.6 (69.1-77.7) 894 134,041
Filipino 117 17.7 (13.8-22.4) 738 82.3 (77.6-86.2) 855 167,809
Japanese 137 14.3 (11.7-17.4) 1,189 85.7 (82.6-88.3) 1,326 212,446
Others 95 15.9 (12.3-20.3) 637 84.1 (79.7-87.7) 732 143,678
Unknown/Refused - - -- -
MARITAL STATUS
Married 510 14.7 (13.3-16.3) 3,191 85.3 (83.7-86.7) 3,701 574,990
Unmarried 484 24.0 (21.3-26.9) 2,290 76.0 (73.1-78.7) 2,774 390,373
Unknown/Refused - - -- -
EDUCATION
<High School 48 18.4 (13.0-25.3) 288 81.6 (74.7-87.0) 336 51,218
High School 349 21.7 (19.0-24.7) 1,494 78.3 (75.3-81.0) 1,843 302,990
Some College 313 21.5 (18.6-24.7) 1,585 78.5 (75.3-81.4) 1,898 284,165
College 284 12.9 (11.1-14.9) 2,119 87.1 (85.1-88.9) 2,403 326,845
Unknown/Refused - - -- -
EMPLOYMENT
Employed 735 22.3 (20.4-24.3) 3,239 77.7 (75.7-79.6) 3,974 620,974
Unemployed - - - - - - - -
Student/Homemaker 64 14.2 (10.0-19.7) 392 85.8 (80.3-90.0) 456 89,872
Retired/Can't work 154 8.4 ( 6.8-10.2) 1,724 91.6 (89.8-93.2) 1,878 223,306
Unknown/Refused - - -- -
HOUSEHOLD INCOME
<$15,000 60 20.1 (14.3-27.5) 428 79.9 (72.5-85.7) 488 57,625
$15,000-24,999 108 16.6 (13.1-20.9) 705 83.4 (79.1-86.9) 813 102,005
$25,000-49,999 312 20.8 (18.0-23.9) 1,556 79.2 (76.1-82.0) 1,868 275,485
$50,000-74,999 179 18.6 (15.4-22.2) 915 81.4 (77.8-84.6) 1,094 167,977
>=$75,000 289 18.4 (16.0-21.2) 1,508 81.6 (78.8-84.0) 1,797 283,077
Unknown/Refused 46 11.4 ( 7.6-16.6) 382 88.6 (83.4-92.4) 428 80,430
Percentages are weighted to population characteristics.N = Cell Sample Size, % = Percentage, 95% C.I. = Confidence Interval at 95 percent probability level
Rows with Sample Size less than 50 or containing half-width of 95% CI greater than 10 have been suppressed.

Heavy drinkers(men having more than two drinks per day and women having more than one drink per day)
State of Hawaii BRFSS 2007
GEOGRAPHIC AREAS YES N % C.I.(95%)
NO N % C.I.(95%)
Total N
Estimatednumberof Adults
STATE 994 18.5 (17.0-20.0) 5,494 81.5 (80.0-83.0) 6,488 966,600
COUNTY
Honolulu 417 18.3 (16.4-20.3) 2,453 81.7 (79.7-83.6) 2,870 687,698
Hawaii 226 18.1 (15.5-21.0) 1,261 81.9 (79.0-84.5) 1,487 125,709
Kauai 96 19.3 (15.2-24.1) 546 80.7 (75.9-84.8) 642 46,702
Maui 255 19.7 (16.8-23.1) 1,234 80.3 (76.9-83.2) 1,489 106,492
HONOLULU County
North Shore/Laie 16 18.0 (10.5-29.3) 69 82.0 (70.7-89.5) 85 20,876
Ka'a'wa/Kahalu'u/Kaneohe 26 16.2 (10.6-23.9) 187 83.8 (76.1-89.4) 213 49,247
Kailua/Waimanalo 27 14.5 ( 9.6-21.3) 207 85.5 (78.7-90.4) 234 51,769
Wailae/Kahala/HawaiiKai 18 13.6 ( 8.2-21.6) 156 86.4 (78.4-91.8) 174 38,183
Kaimuki/Palolo/Waikiki 36 16.5 (10.8-24.5) 237 83.5 (75.5-89.2) 273 54,100
Manoa/Upper Makiki 32 15.4 (10.6-21.9) 208 84.6 (78.1-89.4) 240 45,013
Ala Moana 15 10.8 ( 6.2-17.9) 139 89.2 (82.1-93.8) 154 28,846
Nuuanu/Kalihi/MoanaLoa 37 20.1 (14.1-27.8) 212 79.9 (72.2-85.9) 249 66,518
Salt Lake/Foster Village 17 17.6 (10.6-27.8) 102 82.4 (72.2-89.4) 119 27,038
Aiea/Pearl City 42 16.4 (11.7-22.6) 233 83.6 (77.4-88.3) 275 67,525
Mililani/Wahiawa 45 18.1 (13.3-24.3) 248 81.9 (75.7-86.7) 293 73,333
Waipahu/Kapolei/Ewa 74 22.6 (17.7-28.5) 362 77.4 (71.5-82.3) 436 126,579
Nanakuli/Waianae 32 28.8 (19.8-39.7) 93 71.2 (60.3-80.2) 125 38,670
HAWAII County
North Hawaii 55 22.5 (16.3-30.3) 259 77.5 (69.7-83.7) 314 28,205
Hilo 53 16.6 (12.1-22.3) 367 83.4 (77.7-87.9) 420 35,658
Puna/Ka'u 67 18.0 (13.8-23.1) 349 82.0 (76.9-86.2) 416 34,540
Kona 51 15.7 (11.5-21.0) 286 84.3 (79.0-88.5) 337 27,306
KAUAI County
Hanalei/Kapa'a 40 16.8 (11.5-23.9) 256 83.2 (76.1-88.5) 296 19,989
Lihue-Waimea 56 21.1 (15.6-27.9) 290 78.9 (72.1-84.4) 346 26,712
MAUI County
Lahaina/Wailuku 49 20.1 (14.2-27.7) 250 79.9 (72.3-85.8) 299 30,697
Kahului 44 16.3 (11.6-22.4) 285 83.7 (77.6-88.4) 329 31,894
Upcountry/Hana 63 21.0 (15.9-27.2) 320 79.0 (72.8-84.1) 383 34,050
Lanai 44 28.6 (21.3-37.2) 161 71.4 (62.8-78.7) 205 1,862
Molokai 55 24.2 (18.3-31.3) 218 75.8 (68.7-81.7) 273 7,988
Percentages are weighted to population characteristics.N = Cell Sample Size, % = Percentage, 95% C.I. = Confidence Interval at 95 percent probability level
Rows with Sample Size less than 50 or containing half-width of 95% CI greater than 10 have been suppressed.
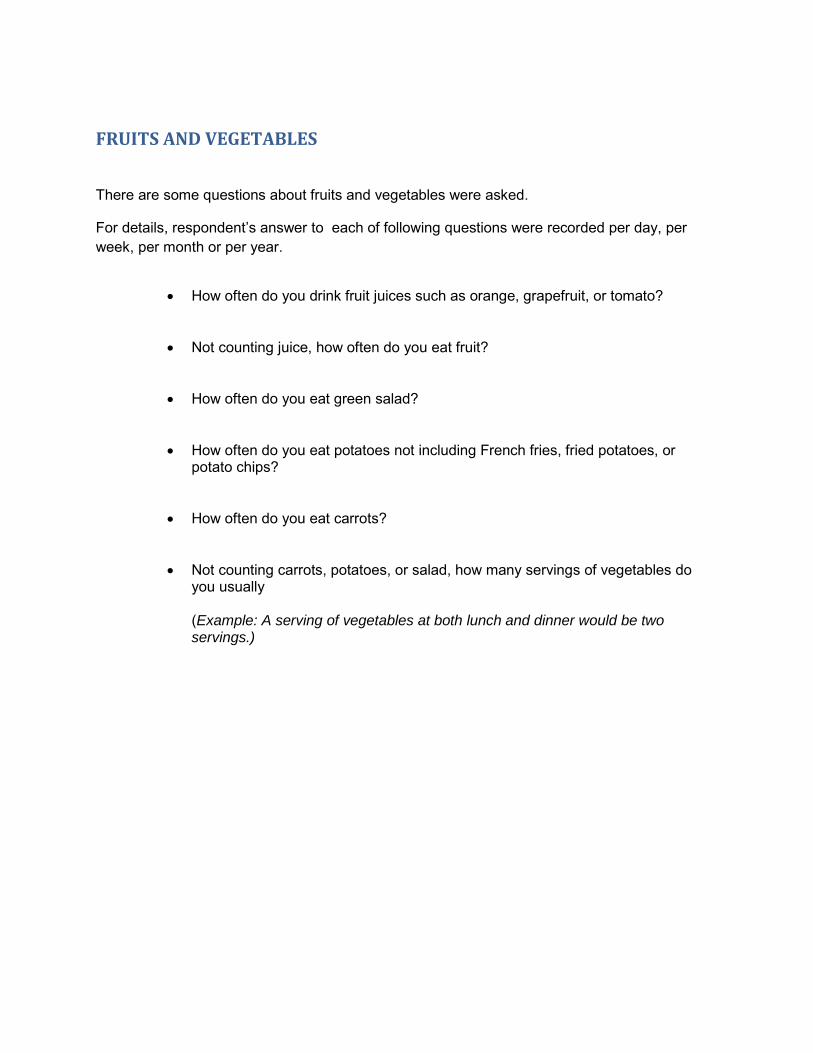
FRUITS AND VEGETABLES
There are some questions about fruits and vegetables were asked.
For details, respondent’s answer to each of following questions were recorded per day, per week, per month or per year.
• How often do you drink fruit juices such as orange, grapefruit, or tomato?
• Not counting juice, how often do you eat fruit?
• How often do you eat green salad?
• How often do you eat potatoes not including French fries, fried potatoes, or potato chips?
• How often do you eat carrots?
• Not counting carrots, potatoes, or salad, how many servings of vegetables do you usually (Example: A serving of vegetables at both lunch and dinner would be two servings.)
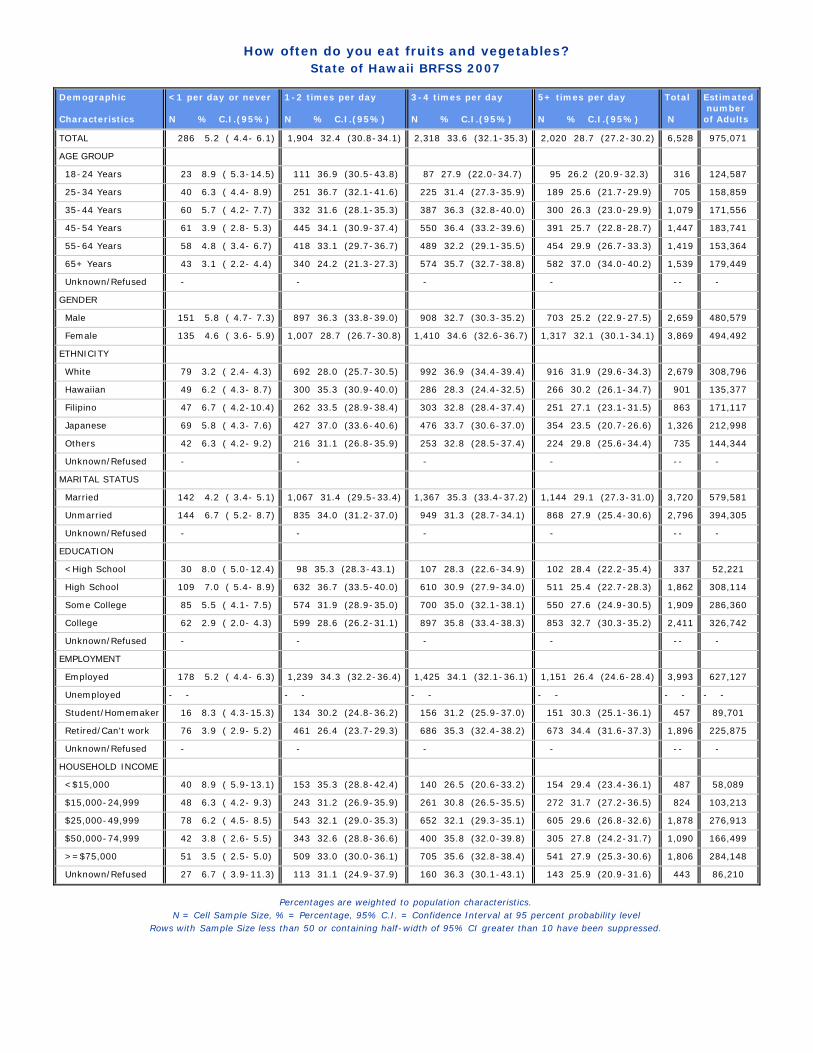
How often do you eat fruits and vegetables?State of Hawaii BRFSS 2007
Demographic Characteristics
<1 per day or never N % C.I.(95%)
1-2 times per day N % C.I.(95%)
3-4 times per day N % C.I.(95%)
5+ times per day N % C.I.(95%)
Total N
Estimated numberof Adults
TOTAL 286 5.2 ( 4.4- 6.1) 1,904 32.4 (30.8-34.1) 2,318 33.6 (32.1-35.3) 2,020 28.7 (27.2-30.2) 6,528 975,071
AGE GROUP
18-24 Years 23 8.9 ( 5.3-14.5) 111 36.9 (30.5-43.8) 87 27.9 (22.0-34.7) 95 26.2 (20.9-32.3) 316 124,587
25-34 Years 40 6.3 ( 4.4- 8.9) 251 36.7 (32.1-41.6) 225 31.4 (27.3-35.9) 189 25.6 (21.7-29.9) 705 158,859
35-44 Years 60 5.7 ( 4.2- 7.7) 332 31.6 (28.1-35.3) 387 36.3 (32.8-40.0) 300 26.3 (23.0-29.9) 1,079 171,556
45-54 Years 61 3.9 ( 2.8- 5.3) 445 34.1 (30.9-37.4) 550 36.4 (33.2-39.6) 391 25.7 (22.8-28.7) 1,447 183,741
55-64 Years 58 4.8 ( 3.4- 6.7) 418 33.1 (29.7-36.7) 489 32.2 (29.1-35.5) 454 29.9 (26.7-33.3) 1,419 153,364
65+ Years 43 3.1 ( 2.2- 4.4) 340 24.2 (21.3-27.3) 574 35.7 (32.7-38.8) 582 37.0 (34.0-40.2) 1,539 179,449
Unknown/Refused - - - - -- -
GENDER
Male 151 5.8 ( 4.7- 7.3) 897 36.3 (33.8-39.0) 908 32.7 (30.3-35.2) 703 25.2 (22.9-27.5) 2,659 480,579
Female 135 4.6 ( 3.6- 5.9) 1,007 28.7 (26.7-30.8) 1,410 34.6 (32.6-36.7) 1,317 32.1 (30.1-34.1) 3,869 494,492
ETHNICITY
White 79 3.2 ( 2.4- 4.3) 692 28.0 (25.7-30.5) 992 36.9 (34.4-39.4) 916 31.9 (29.6-34.3) 2,679 308,796
Hawaiian 49 6.2 ( 4.3- 8.7) 300 35.3 (30.9-40.0) 286 28.3 (24.4-32.5) 266 30.2 (26.1-34.7) 901 135,377
Filipino 47 6.7 ( 4.2-10.4) 262 33.5 (28.9-38.4) 303 32.8 (28.4-37.4) 251 27.1 (23.1-31.5) 863 171,117
Japanese 69 5.8 ( 4.3- 7.6) 427 37.0 (33.6-40.6) 476 33.7 (30.6-37.0) 354 23.5 (20.7-26.6) 1,326 212,998
Others 42 6.3 ( 4.2- 9.2) 216 31.1 (26.8-35.9) 253 32.8 (28.5-37.4) 224 29.8 (25.6-34.4) 735 144,344
Unknown/Refused - - - - -- -
MARITAL STATUS
Married 142 4.2 ( 3.4- 5.1) 1,067 31.4 (29.5-33.4) 1,367 35.3 (33.4-37.2) 1,144 29.1 (27.3-31.0) 3,720 579,581
Unmarried 144 6.7 ( 5.2- 8.7) 835 34.0 (31.2-37.0) 949 31.3 (28.7-34.1) 868 27.9 (25.4-30.6) 2,796 394,305
Unknown/Refused - - - - -- -
EDUCATION
<High School 30 8.0 ( 5.0-12.4) 98 35.3 (28.3-43.1) 107 28.3 (22.6-34.9) 102 28.4 (22.2-35.4) 337 52,221
High School 109 7.0 ( 5.4- 8.9) 632 36.7 (33.5-40.0) 610 30.9 (27.9-34.0) 511 25.4 (22.7-28.3) 1,862 308,114
Some College 85 5.5 ( 4.1- 7.5) 574 31.9 (28.9-35.0) 700 35.0 (32.1-38.1) 550 27.6 (24.9-30.5) 1,909 286,360
College 62 2.9 ( 2.0- 4.3) 599 28.6 (26.2-31.1) 897 35.8 (33.4-38.3) 853 32.7 (30.3-35.2) 2,411 326,742
Unknown/Refused - - - - -- -
EMPLOYMENT
Employed 178 5.2 ( 4.4- 6.3) 1,239 34.3 (32.2-36.4) 1,425 34.1 (32.1-36.1) 1,151 26.4 (24.6-28.4) 3,993 627,127
Unemployed - - - - - - - - - - - -
Student/Homemaker 16 8.3 ( 4.3-15.3) 134 30.2 (24.8-36.2) 156 31.2 (25.9-37.0) 151 30.3 (25.1-36.1) 457 89,701
Retired/Can't work 76 3.9 ( 2.9- 5.2) 461 26.4 (23.7-29.3) 686 35.3 (32.4-38.2) 673 34.4 (31.6-37.3) 1,896 225,875
Unknown/Refused - - - - -- -
HOUSEHOLD INCOME
<$15,000 40 8.9 ( 5.9-13.1) 153 35.3 (28.8-42.4) 140 26.5 (20.6-33.2) 154 29.4 (23.4-36.1) 487 58,089
$15,000-24,999 48 6.3 ( 4.2- 9.3) 243 31.2 (26.9-35.9) 261 30.8 (26.5-35.5) 272 31.7 (27.2-36.5) 824 103,213
$25,000-49,999 78 6.2 ( 4.5- 8.5) 543 32.1 (29.0-35.3) 652 32.1 (29.3-35.1) 605 29.6 (26.8-32.6) 1,878 276,913
$50,000-74,999 42 3.8 ( 2.6- 5.5) 343 32.6 (28.8-36.6) 400 35.8 (32.0-39.8) 305 27.8 (24.2-31.7) 1,090 166,499
>=$75,000 51 3.5 ( 2.5- 5.0) 509 33.0 (30.0-36.1) 705 35.6 (32.8-38.4) 541 27.9 (25.3-30.6) 1,806 284,148
Unknown/Refused 27 6.7 ( 3.9-11.3) 113 31.1 (24.9-37.9) 160 36.3 (30.1-43.1) 143 25.9 (20.9-31.6) 443 86,210
Percentages are weighted to population characteristics.N = Cell Sample Size, % = Percentage, 95% C.I. = Confidence Interval at 95 percent probability level
Rows with Sample Size less than 50 or containing half-width of 95% CI greater than 10 have been suppressed.
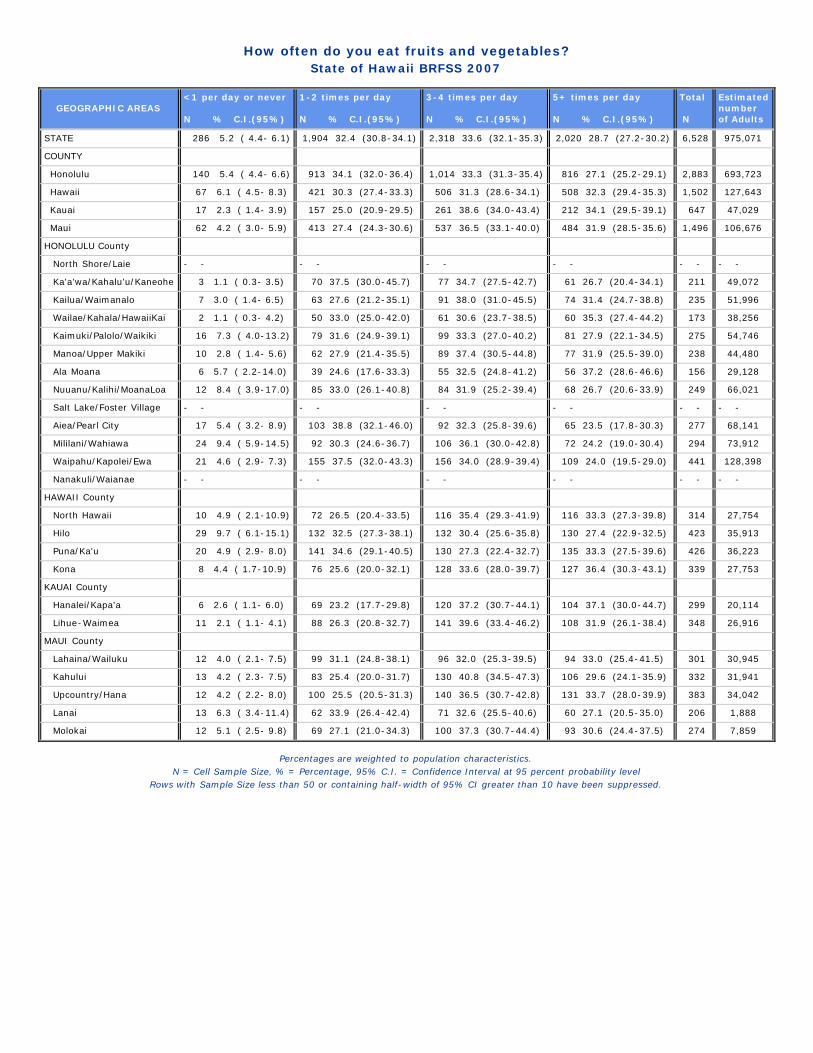
How often do you eat fruits and vegetables?State of Hawaii BRFSS 2007
GEOGRAPHIC AREAS <1 per day or never N % C.I.(95%)
1-2 times per day N % C.I.(95%)
3-4 times per day N % C.I.(95%)
5+ times per day N % C.I.(95%)
Total N
Estimatednumberof Adults
STATE 286 5.2 ( 4.4- 6.1) 1,904 32.4 (30.8-34.1) 2,318 33.6 (32.1-35.3) 2,020 28.7 (27.2-30.2) 6,528 975,071
COUNTY
Honolulu 140 5.4 ( 4.4- 6.6) 913 34.1 (32.0-36.4) 1,014 33.3 (31.3-35.4) 816 27.1 (25.2-29.1) 2,883 693,723
Hawaii 67 6.1 ( 4.5- 8.3) 421 30.3 (27.4-33.3) 506 31.3 (28.6-34.1) 508 32.3 (29.4-35.3) 1,502 127,643
Kauai 17 2.3 ( 1.4- 3.9) 157 25.0 (20.9-29.5) 261 38.6 (34.0-43.4) 212 34.1 (29.5-39.1) 647 47,029
Maui 62 4.2 ( 3.0- 5.9) 413 27.4 (24.3-30.6) 537 36.5 (33.1-40.0) 484 31.9 (28.5-35.6) 1,496 106,676
HONOLULU County
North Shore/Laie - - - - - - - - - - - -
Ka'a'wa/Kahalu'u/Kaneohe 3 1.1 ( 0.3- 3.5) 70 37.5 (30.0-45.7) 77 34.7 (27.5-42.7) 61 26.7 (20.4-34.1) 211 49,072
Kailua/Waimanalo 7 3.0 ( 1.4- 6.5) 63 27.6 (21.2-35.1) 91 38.0 (31.0-45.5) 74 31.4 (24.7-38.8) 235 51,996
Wailae/Kahala/HawaiiKai 2 1.1 ( 0.3- 4.2) 50 33.0 (25.0-42.0) 61 30.6 (23.7-38.5) 60 35.3 (27.4-44.2) 173 38,256
Kaimuki/Palolo/Waikiki 16 7.3 ( 4.0-13.2) 79 31.6 (24.9-39.1) 99 33.3 (27.0-40.2) 81 27.9 (22.1-34.5) 275 54,746
Manoa/Upper Makiki 10 2.8 ( 1.4- 5.6) 62 27.9 (21.4-35.5) 89 37.4 (30.5-44.8) 77 31.9 (25.5-39.0) 238 44,480
Ala Moana 6 5.7 ( 2.2-14.0) 39 24.6 (17.6-33.3) 55 32.5 (24.8-41.2) 56 37.2 (28.6-46.6) 156 29,128
Nuuanu/Kalihi/MoanaLoa 12 8.4 ( 3.9-17.0) 85 33.0 (26.1-40.8) 84 31.9 (25.2-39.4) 68 26.7 (20.6-33.9) 249 66,021
Salt Lake/Foster Village - - - - - - - - - - - -
Aiea/Pearl City 17 5.4 ( 3.2- 8.9) 103 38.8 (32.1-46.0) 92 32.3 (25.8-39.6) 65 23.5 (17.8-30.3) 277 68,141
Mililani/Wahiawa 24 9.4 ( 5.9-14.5) 92 30.3 (24.6-36.7) 106 36.1 (30.0-42.8) 72 24.2 (19.0-30.4) 294 73,912
Waipahu/Kapolei/Ewa 21 4.6 ( 2.9- 7.3) 155 37.5 (32.0-43.3) 156 34.0 (28.9-39.4) 109 24.0 (19.5-29.0) 441 128,398
Nanakuli/Waianae - - - - - - - - - - - -
HAWAII County
North Hawaii 10 4.9 ( 2.1-10.9) 72 26.5 (20.4-33.5) 116 35.4 (29.3-41.9) 116 33.3 (27.3-39.8) 314 27,754
Hilo 29 9.7 ( 6.1-15.1) 132 32.5 (27.3-38.1) 132 30.4 (25.6-35.8) 130 27.4 (22.9-32.5) 423 35,913
Puna/Ka'u 20 4.9 ( 2.9- 8.0) 141 34.6 (29.1-40.5) 130 27.3 (22.4-32.7) 135 33.3 (27.5-39.6) 426 36,223
Kona 8 4.4 ( 1.7-10.9) 76 25.6 (20.0-32.1) 128 33.6 (28.0-39.7) 127 36.4 (30.3-43.1) 339 27,753
KAUAI County
Hanalei/Kapa'a 6 2.6 ( 1.1- 6.0) 69 23.2 (17.7-29.8) 120 37.2 (30.7-44.1) 104 37.1 (30.0-44.7) 299 20,114
Lihue-Waimea 11 2.1 ( 1.1- 4.1) 88 26.3 (20.8-32.7) 141 39.6 (33.4-46.2) 108 31.9 (26.1-38.4) 348 26,916
MAUI County
Lahaina/Wailuku 12 4.0 ( 2.1- 7.5) 99 31.1 (24.8-38.1) 96 32.0 (25.3-39.5) 94 33.0 (25.4-41.5) 301 30,945
Kahului 13 4.2 ( 2.3- 7.5) 83 25.4 (20.0-31.7) 130 40.8 (34.5-47.3) 106 29.6 (24.1-35.9) 332 31,941
Upcountry/Hana 12 4.2 ( 2.2- 8.0) 100 25.5 (20.5-31.3) 140 36.5 (30.7-42.8) 131 33.7 (28.0-39.9) 383 34,042
Lanai 13 6.3 ( 3.4-11.4) 62 33.9 (26.4-42.4) 71 32.6 (25.5-40.6) 60 27.1 (20.5-35.0) 206 1,888
Molokai 12 5.1 ( 2.5- 9.8) 69 27.1 (21.0-34.3) 100 37.3 (30.7-44.4) 93 30.6 (24.4-37.5) 274 7,859
Percentages are weighted to population characteristics.N = Cell Sample Size, % = Percentage, 95% C.I. = Confidence Interval at 95 percent probability level
Rows with Sample Size less than 50 or containing half-width of 95% CI greater than 10 have been suppressed.

Average number of daily servings of fruits and vegetablesState of Hawaii BRFSS 2007
Demographic Characteristics
Average 95% C.I. Sample Size
TOTAL 4.0 3.9 - 4.1 6,528
AGE GROUP
18-24 Years 3.9 3.5 - 4.2 316
25-34 Years 4.0 3.7 - 4.2 705
35-44 Years 3.9 3.7 - 4.0 1,079
45-54 Years 4.0 3.8 - 4.1 1,447
55-64 Years 4.1 3.9 - 4.3 1,419
65+ Years 4.4 4.2 - 4.5 1,539
Unknown/Refused - - --
GENDER
Male 3.8 3.7 - 3.9 2,659
Female 4.2 4.1 - 4.4 3,869
ETHNICITY
White 4.2 4.1 - 4.4 2,679
Hawaiian 4.1 3.9 - 4.4 901
Filipino 4.0 3.7 - 4.2 863
Japanese 3.7 3.5 - 3.9 1,326
Others 4.1 3.9 - 4.3 735
Unknown/Refused - - --
MARITAL STATUS
Married 4.1 4.0 - 4.2 3,720
Unmarried 4.0 3.8 - 4.1 2,796
Unknown/Refused - - --
EDUCATION
<High School 3.9 3.5 - 4.2 337
High School 3.8 3.7 - 4.0 1,862
Some College 4.0 3.8 - 4.1 1,909
College 4.3 4.2 - 4.4 2,411
Unknown/Refused - - --
EMPLOYMENT
Employed 4.0 3.8 - 4.1 3,993
Unemployed 4.0 3.3 - 4.6 178
Student/Homemaker 4.0 3.7 - 4.4 457
Retired/Can't work 4.3 4.1 - 4.4 1,896
Unknown/Refused - - --
HOUSEHOLD INCOME
<$15,000 3.8 3.5 - 4.2 487
$15,000-24,999 4.2 3.9 - 4.4 824
$25,000-49,999 4.0 3.9 - 4.2 1,878
$50,000-74,999 4.1 3.9 - 4.3 1,090
>=$75,000 4.0 3.9 - 4.1 1,806
Unknown/Refused 3.9 3.6 - 4.2 443
The symbol '--' means cell size less than 50.95% C.I. = Confidence Interval at 95 percent probability level.
Means are weighted to population characteristics.
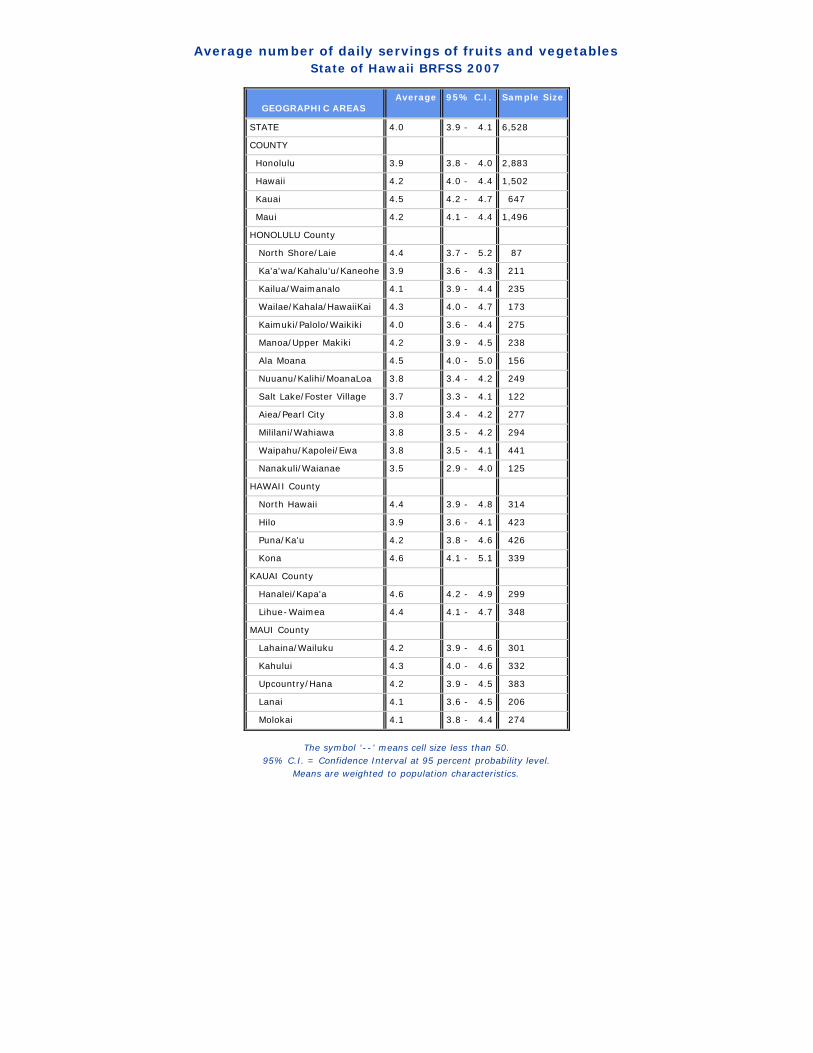
Average number of daily servings of fruits and vegetablesState of Hawaii BRFSS 2007
GEOGRAPHIC AREAS Average 95% C.I. Sample Size
STATE 4.0 3.9 - 4.1 6,528
COUNTY
Honolulu 3.9 3.8 - 4.0 2,883
Hawaii 4.2 4.0 - 4.4 1,502
Kauai 4.5 4.2 - 4.7 647
Maui 4.2 4.1 - 4.4 1,496
HONOLULU County
North Shore/Laie 4.4 3.7 - 5.2 87
Ka'a'wa/Kahalu'u/Kaneohe 3.9 3.6 - 4.3 211
Kailua/Waimanalo 4.1 3.9 - 4.4 235
Wailae/Kahala/HawaiiKai 4.3 4.0 - 4.7 173
Kaimuki/Palolo/Waikiki 4.0 3.6 - 4.4 275
Manoa/Upper Makiki 4.2 3.9 - 4.5 238
Ala Moana 4.5 4.0 - 5.0 156
Nuuanu/Kalihi/MoanaLoa 3.8 3.4 - 4.2 249
Salt Lake/Foster Village 3.7 3.3 - 4.1 122
Aiea/Pearl City 3.8 3.4 - 4.2 277
Mililani/Wahiawa 3.8 3.5 - 4.2 294
Waipahu/Kapolei/Ewa 3.8 3.5 - 4.1 441
Nanakuli/Waianae 3.5 2.9 - 4.0 125
HAWAII County
North Hawaii 4.4 3.9 - 4.8 314
Hilo 3.9 3.6 - 4.1 423
Puna/Ka'u 4.2 3.8 - 4.6 426
Kona 4.6 4.1 - 5.1 339
KAUAI County
Hanalei/Kapa'a 4.6 4.2 - 4.9 299
Lihue-Waimea 4.4 4.1 - 4.7 348
MAUI County
Lahaina/Wailuku 4.2 3.9 - 4.6 301
Kahului 4.3 4.0 - 4.6 332
Upcountry/Hana 4.2 3.9 - 4.5 383
Lanai 4.1 3.6 - 4.5 206
Molokai 4.1 3.8 - 4.4 274
The symbol '--' means cell size less than 50.95% C.I. = Confidence Interval at 95 percent probability level.
Means are weighted to population characteristics.

PHYSICAL ACTIVITY
These following questions were asked about exercise and physical activity.
A./ During the past month, other than your regular job, did you participate in any physical activities or exercises such as running, calisthenics, golf, gardening, or walking for exercise? B./ When you are at work, which of the following best describes what you do? Would you say … If respondent has multiple jobs, include all jobs.
1. Mostly sitting or standing 2. Mostly walking 3. Mostly heavy labor or physically demanding work
We are interested in two types of physical activity - vigorous and moderate. Vigorous activities cause large increases in breathing or heart rate while moderate activities cause small increases in breathing or heart rate. C./ Now, thinking about the moderate activities you do, when you are not working, in a usual week, do you do moderate activities for at least 10 minutes at a time, such as brisk walking, bicycling, vacuuming, gardening, or anything else that causes some increase in breathing or heart rate? If YES then ask
• How many days per week do you do these moderate activities for at least 10 minutes at a time?
• On days when you do moderate activities for at least 10 minutes at a
time, how much total time per day do you spend doing these activities?
D./ Now, thinking about the vigorous activities you do, when you are not working, in a usual week, do you do vigorous activities for at least 10 minutes at a time, such as running, aerobics, heavy yard work, or anything else that causes large increases in breathing or heart rate? If YES then ask
How many days per week do you do these vigorous activities for at least 10 minutes at a time?
On days when you do vigorous activities for at least 10 minutes at a time,
how much total time per day do you spend doing these activities?

Do you have any leisure time exercise or physical activity during the past 30 days?State of Hawaii BRFSS 2007
Demographic Characteristics
YES N % C.I.(95%)
NO N % C.I.(95%)
Total N
Estimated numberof Adults
TOTAL 5,454 82.0 (80.6-83.2) 1,149 18.0 (16.8-19.4) 6,603 987,498
AGE GROUP
18-24 Years 276 85.8 (80.3-89.9) 43 14.2 (10.1-19.7) 319 125,816
25-34 Years 585 81.9 (78.1-85.2) 127 18.1 (14.8-21.9) 712 160,314
35-44 Years 921 84.8 (81.9-87.2) 179 15.2 (12.8-18.1) 1,100 175,324
45-54 Years 1,233 82.0 (79.0-84.6) 230 18.0 (15.4-21.0) 1,463 185,682
55-64 Years 1,202 82.2 (79.3-84.8) 232 17.8 (15.2-20.7) 1,434 155,546
65+ Years 1,221 76.8 (73.8-79.4) 328 23.2 (20.6-26.2) 1,549 180,759
Unknown/Refused - - -- -
GENDER
Male 2,316 85.8 (83.9-87.6) 377 14.2 (12.4-16.1) 2,693 487,361
Female 3,138 78.2 (76.3-79.9) 772 21.8 (20.1-23.7) 3,910 500,137
ETHNICITY
White 2,381 88.3 (86.6-89.8) 323 11.7 (10.2-13.4) 2,704 312,221
Hawaiian 713 78.7 (74.8-82.2) 194 21.3 (17.8-25.2) 907 135,949
Filipino 658 75.5 (71.3-79.3) 219 24.5 (20.7-28.7) 877 173,840
Japanese 1,072 80.7 (77.9-83.2) 271 19.3 (16.8-22.1) 1,343 215,941
Others 606 80.6 (76.6-84.2) 141 19.4 (15.8-23.4) 747 146,687
Unknown/Refused - - -- -
MARITAL STATUS
Married 3,149 82.5 (80.9-84.0) 612 17.5 (16.0-19.1) 3,761 587,130
Unmarried 2,292 81.1 (78.8-83.2) 537 18.9 (16.8-21.2) 2,829 399,132
Unknown/Refused - - -- -
EDUCATION
<High School 228 67.2 (60.0-73.6) 115 32.8 (26.4-40.0) 343 53,439
High School 1,449 77.1 (74.3-79.6) 435 22.9 (20.4-25.7) 1,884 311,143
Some College 1,612 82.6 (80.0-84.9) 321 17.4 (15.1-20.0) 1,933 290,232
College 2,157 88.4 (86.6-90.0) 277 11.6 (10.0-13.4) 2,434 331,051
Unknown/Refused - - -- -
EMPLOYMENT
Employed 3,410 83.5 (81.8-85.0) 633 16.5 (15.0-18.2) 4,043 635,769
Unemployed - - - - - - - -
Student/Homemaker 396 86.9 (82.6-90.3) 66 13.1 ( 9.7-17.4) 462 90,558
Retired/Can't work 1,511 77.0 (74.3-79.5) 402 23.0 (20.5-25.7) 1,913 228,520
Unknown/Refused - - -- -
HOUSEHOLD INCOME
<$15,000 342 65.9 (58.8-72.4) 153 34.1 (27.6-41.2) 495 58,757
$15,000-24,999 637 74.2 (69.7-78.2) 195 25.8 (21.8-30.3) 832 104,482
$25,000-49,999 1,551 80.0 (77.3-82.4) 346 20.0 (17.6-22.7) 1,897 279,949
$50,000-74,999 938 84.6 (81.6-87.2) 166 15.4 (12.8-18.4) 1,104 169,930
>=$75,000 1,630 90.1 (88.2-91.7) 190 9.9 ( 8.3-11.8) 1,820 286,577
Unknown/Refused 356 76.6 (70.7-81.5) 99 23.4 (18.5-29.3) 455 87,804
Percentages are weighted to population characteristics.N = Cell Sample Size, % = Percentage, 95% C.I. = Confidence Interval at 95 percent probability level
Rows with Sample Size less than 50 or containing half-width of 95% CI greater than 10 have been suppressed.

Do you have any leisure time exercise or physical activity during the past 30 days?State of Hawaii BRFSS 2007
GEOGRAPHIC AREAS YES N % C.I.(95%)
NO N % C.I.(95%)
Total N
Estimatednumberof Adults
STATE 5,454 82.0 (80.6-83.2) 1,149 18.0 (16.8-19.4) 6,603 987,498
COUNTY
Honolulu 2,402 82.1 (80.4-83.8) 523 17.9 (16.2-19.6) 2,925 702,974
Hawaii 1,252 82.1 (79.4-84.4) 264 17.9 (15.6-20.6) 1,516 129,247
Kauai 558 84.0 (79.9-87.4) 94 16.0 (12.6-20.1) 652 47,286
Maui 1,242 79.6 (76.0-82.8) 268 20.4 (17.2-24.0) 1,510 107,991
HONOLULU County
North Shore/Laie - - - - - - - -
Ka'a'wa/Kahalu'u/Kaneohe 178 81.6 (74.6-87.0) 37 18.4 (13.0-25.4) 215 49,695
Kailua/Waimanalo 212 89.1 (84.0-92.7) 27 10.9 ( 7.3-16.0) 239 52,739
Wailae/Kahala/HawaiiKai 161 92.7 (87.4-95.8) 14 7.3 ( 4.2-12.6) 175 38,570
Kaimuki/Palolo/Waikiki 242 86.4 (81.3-90.3) 40 13.6 ( 9.7-18.7) 282 56,103
Manoa/Upper Makiki 218 91.0 (86.3-94.2) 25 9.0 ( 5.8-13.7) 243 45,663
Ala Moana 127 80.4 (71.7-86.8) 29 19.6 (13.2-28.3) 156 29,128
Nuuanu/Kalihi/MoanaLoa 181 75.2 (68.5-80.8) 71 24.8 (19.2-31.5) 252 67,173
Salt Lake/Foster Village 97 81.1 (72.3-87.6) 26 18.9 (12.4-27.7) 123 28,663
Aiea/Pearl City 224 82.8 (77.4-87.0) 57 17.2 (13.0-22.6) 281 69,051
Mililani/Wahiawa 245 81.5 (75.7-86.2) 52 18.5 (13.8-24.3) 297 74,550
Waipahu/Kapolei/Ewa 357 80.2 (75.5-84.1) 90 19.8 (15.9-24.5) 447 129,653
Nanakuli/Waianae 91 75.2 (64.7-83.3) 35 24.8 (16.7-35.3) 126 39,503
HAWAII County
North Hawaii 269 85.1 (80.0-89.0) 48 14.9 (11.0-20.0) 317 28,520
Hilo 358 84.3 (79.8-87.9) 70 15.7 (12.1-20.2) 428 36,390
Puna/Ka'u 332 75.5 (69.4-80.7) 97 24.5 (19.3-30.6) 429 36,409
Kona 293 84.8 (78.9-89.2) 49 15.2 (10.8-21.1) 342 27,929
KAUAI County
Hanalei/Kapa'a 274 90.7 (85.3-94.2) 26 9.3 ( 5.8-14.7) 300 20,139
Lihue-Waimea 284 79.1 (73.0-84.1) 68 20.9 (15.9-27.0) 352 27,147
MAUI County
Lahaina/Wailuku 255 79.5 (70.5-86.3) 48 20.5 (13.7-29.5) 303 31,052
Kahului 274 77.3 (71.0-82.6) 63 22.7 (17.4-29.0) 337 32,515
Upcountry/Hana 328 82.0 (76.0-86.8) 58 18.0 (13.2-24.0) 386 34,380
Lanai 164 79.0 (71.4-85.0) 43 21.0 (15.0-28.6) 207 1,895
Molokai 221 79.6 (73.4-84.7) 56 20.4 (15.3-26.6) 277 8,149
Percentages are weighted to population characteristics.N = Cell Sample Size, % = Percentage, 95% C.I. = Confidence Interval at 95 percent probability level
Rows with Sample Size less than 50 or containing half-width of 95% CI greater than 10 have been suppressed.

Best description of what you do at workState of Hawaii BRFSS 2007
Demographic Characteristics
Mostly sitting/standing N % C.I.(95%)
Mostly walking N % C.I.(95%)
Mostly heavy labor N % C.I.(95%)
Total N
Estimated numberof Adults
TOTAL 2,534 62.4 (60.2-64.5) 819 21.4 (19.6-23.3) 599 16.3 (14.6-18.0) 3,952 622,930
AGE GROUP
18-24 Years 90 51.8 (42.6-60.9) 43 25.9 (18.9-34.6) 43 22.3 (15.7-30.6) 176 72,907
25-34 Years 312 56.0 (50.5-61.3) 125 22.2 (17.9-27.2) 116 21.8 (17.7-26.7) 553 127,769
35-44 Years 576 62.7 (58.4-66.7) 191 21.6 (18.3-25.3) 138 15.7 (12.7-19.4) 905 144,934
45-54 Years 766 65.6 (62.0-69.0) 250 19.4 (16.7-22.4) 180 15.0 (12.4-18.1) 1,196 153,134
55-64 Years 613 71.5 (67.0-75.5) 161 19.4 (15.8-23.7) 102 9.1 ( 7.0-11.7) 876 99,829
65+ Years 163 67.7 (59.3-75.1) 48 23.3 (16.8-31.3) 19 9.0 ( 5.3-15.0) 230 21,886
Unknown/Refused - - - -- -
GENDER
Male 970 55.5 (52.3-58.7) 361 21.1 (18.5-23.9) 430 23.4 (20.8-26.3) 1,761 343,156
Female 1,564 70.8 (68.0-73.4) 458 21.8 (19.4-24.3) 169 7.5 ( 6.0- 9.3) 2,191 279,774
ETHNICITY
White 1,046 65.9 (62.7-69.0) 311 18.6 (16.2-21.4) 253 15.4 (13.2-18.0) 1,610 192,271
Hawaiian 330 52.4 (46.5-58.3) 129 22.2 (17.8-27.4) 116 25.4 (20.1-31.5) 575 90,514
Filipino 340 52.8 (47.0-58.6) 172 30.6 (25.4-36.3) 96 16.6 (12.9-21.1) 608 120,154
Japanese 505 70.7 (65.8-75.1) 106 16.6 (13.3-20.5) 78 12.7 ( 9.4-17.0) 689 123,482
Others 302 65.5 (59.4-71.1) 98 20.9 (16.4-26.3) 55 13.6 ( 9.8-18.5) 455 94,883
Unknown/Refused - - - -- -
MARITAL STATUS
Married 1,600 65.7 (63.2-68.2) 448 19.3 (17.3-21.5) 314 14.9 (13.0-17.1) 2,362 383,158
Unmarried 931 57.0 (53.0-60.9) 370 24.6 (21.4-28.2) 284 18.4 (15.5-21.7) 1,585 239,360
Unknown/Refused - - - -- -
EDUCATION
<High School - - - - - - - - - -
High School 543 50.2 (45.7-54.6) 243 24.3 (20.8-28.1) 248 25.6 (21.8-29.8) 1,034 188,482
Some College 736 61.8 (57.7-65.7) 253 22.6 (19.2-26.4) 191 15.6 (13.0-18.6) 1,180 182,364
College 1,198 73.9 (70.8-76.7) 293 18.0 (15.6-20.8) 129 8.1 ( 6.4-10.2) 1,620 231,751
Unknown/Refused - - - -- -
EMPLOYMENT
Employed 2,534 62.4 (60.2-64.5) 819 21.4 (19.6-23.3) 599 16.3 (14.6-18.0) 3,952 622,930
Unemployed
Student/Homemaker
Retired/Can't work
Unknown/Refused
HOUSEHOLD INCOME
<$15,000 - - - - - - - - - -
$15,000-24,999 195 45.8 (38.5-53.3) 95 26.3 (20.3-33.5) 85 27.9 (21.0-36.0) 375 52,774
$25,000-49,999 635 54.1 (49.9-58.2) 288 26.9 (23.4-30.7) 215 19.0 (16.0-22.5) 1,138 173,410
$50,000-74,999 526 64.5 (59.6-69.2) 135 18.2 (14.6-22.5) 122 17.2 (13.8-21.4) 783 121,326
>=$75,000 1,004 73.3 (69.7-76.5) 224 16.7 (14.0-19.7) 119 10.1 ( 7.8-13.0) 1,347 216,881
Unknown/Refused - - - - - - - - - -
Percentages are weighted to population characteristics.N = Cell Sample Size, % = Percentage, 95% C.I. = Confidence Interval at 95 percent probability level
Rows with Sample Size less than 50 or containing half-width of 95% CI greater than 10 have been suppressed.
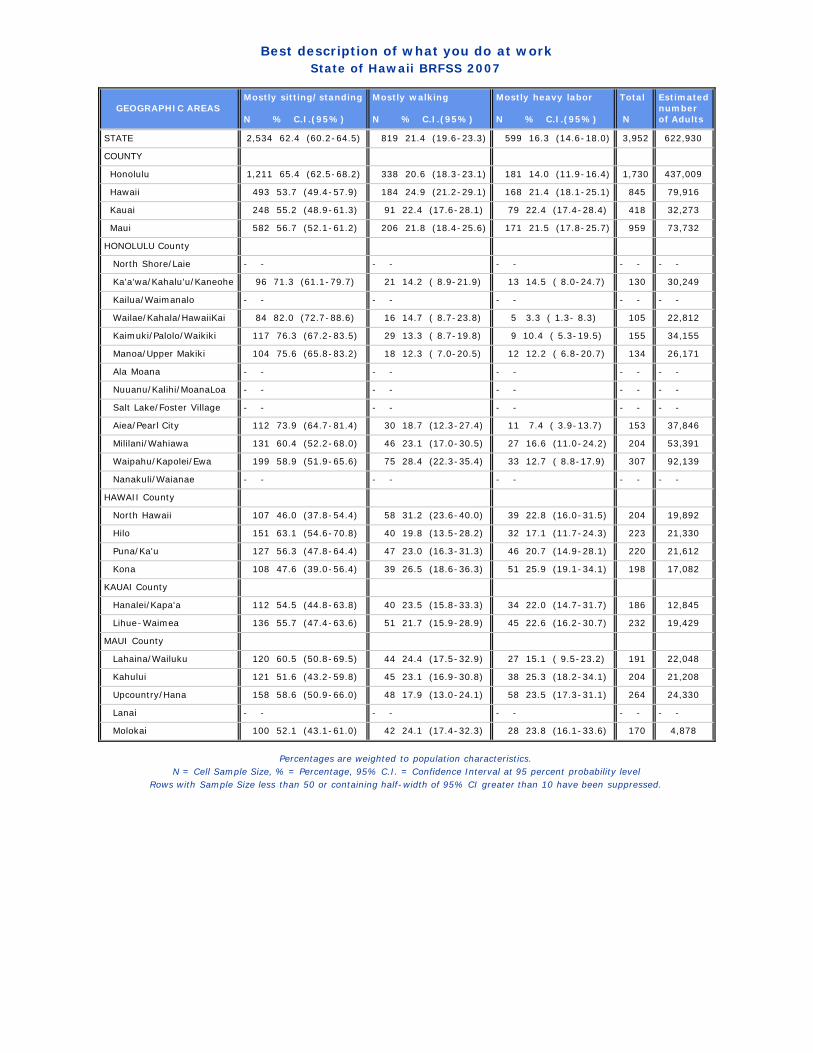
Best description of what you do at workState of Hawaii BRFSS 2007
GEOGRAPHIC AREAS Mostly sitting/standing N % C.I.(95%)
Mostly walking N % C.I.(95%)
Mostly heavy labor N % C.I.(95%)
Total N
Estimatednumberof Adults
STATE 2,534 62.4 (60.2-64.5) 819 21.4 (19.6-23.3) 599 16.3 (14.6-18.0) 3,952 622,930
COUNTY
Honolulu 1,211 65.4 (62.5-68.2) 338 20.6 (18.3-23.1) 181 14.0 (11.9-16.4) 1,730 437,009
Hawaii 493 53.7 (49.4-57.9) 184 24.9 (21.2-29.1) 168 21.4 (18.1-25.1) 845 79,916
Kauai 248 55.2 (48.9-61.3) 91 22.4 (17.6-28.1) 79 22.4 (17.4-28.4) 418 32,273
Maui 582 56.7 (52.1-61.2) 206 21.8 (18.4-25.6) 171 21.5 (17.8-25.7) 959 73,732
HONOLULU County
North Shore/Laie - - - - - - - - - -
Ka'a'wa/Kahalu'u/Kaneohe 96 71.3 (61.1-79.7) 21 14.2 ( 8.9-21.9) 13 14.5 ( 8.0-24.7) 130 30,249
Kailua/Waimanalo - - - - - - - - - -
Wailae/Kahala/HawaiiKai 84 82.0 (72.7-88.6) 16 14.7 ( 8.7-23.8) 5 3.3 ( 1.3- 8.3) 105 22,812
Kaimuki/Palolo/Waikiki 117 76.3 (67.2-83.5) 29 13.3 ( 8.7-19.8) 9 10.4 ( 5.3-19.5) 155 34,155
Manoa/Upper Makiki 104 75.6 (65.8-83.2) 18 12.3 ( 7.0-20.5) 12 12.2 ( 6.8-20.7) 134 26,171
Ala Moana - - - - - - - - - -
Nuuanu/Kalihi/MoanaLoa - - - - - - - - - -
Salt Lake/Foster Village - - - - - - - - - -
Aiea/Pearl City 112 73.9 (64.7-81.4) 30 18.7 (12.3-27.4) 11 7.4 ( 3.9-13.7) 153 37,846
Mililani/Wahiawa 131 60.4 (52.2-68.0) 46 23.1 (17.0-30.5) 27 16.6 (11.0-24.2) 204 53,391
Waipahu/Kapolei/Ewa 199 58.9 (51.9-65.6) 75 28.4 (22.3-35.4) 33 12.7 ( 8.8-17.9) 307 92,139
Nanakuli/Waianae - - - - - - - - - -
HAWAII County
North Hawaii 107 46.0 (37.8-54.4) 58 31.2 (23.6-40.0) 39 22.8 (16.0-31.5) 204 19,892
Hilo 151 63.1 (54.6-70.8) 40 19.8 (13.5-28.2) 32 17.1 (11.7-24.3) 223 21,330
Puna/Ka'u 127 56.3 (47.8-64.4) 47 23.0 (16.3-31.3) 46 20.7 (14.9-28.1) 220 21,612
Kona 108 47.6 (39.0-56.4) 39 26.5 (18.6-36.3) 51 25.9 (19.1-34.1) 198 17,082
KAUAI County
Hanalei/Kapa'a 112 54.5 (44.8-63.8) 40 23.5 (15.8-33.3) 34 22.0 (14.7-31.7) 186 12,845
Lihue-Waimea 136 55.7 (47.4-63.6) 51 21.7 (15.9-28.9) 45 22.6 (16.2-30.7) 232 19,429
MAUI County
Lahaina/Wailuku 120 60.5 (50.8-69.5) 44 24.4 (17.5-32.9) 27 15.1 ( 9.5-23.2) 191 22,048
Kahului 121 51.6 (43.2-59.8) 45 23.1 (16.9-30.8) 38 25.3 (18.2-34.1) 204 21,208
Upcountry/Hana 158 58.6 (50.9-66.0) 48 17.9 (13.0-24.1) 58 23.5 (17.3-31.1) 264 24,330
Lanai - - - - - - - - - -
Molokai 100 52.1 (43.1-61.0) 42 24.1 (17.4-32.3) 28 23.8 (16.1-33.6) 170 4,878
Percentages are weighted to population characteristics.N = Cell Sample Size, % = Percentage, 95% C.I. = Confidence Interval at 95 percent probability level
Rows with Sample Size less than 50 or containing half-width of 95% CI greater than 10 have been suppressed.

Estimated physical activity levelState of Hawaii BRFSS 2007
Demographic Characteristics
Meet recommendation for physical activity N % C.I.(95%)
Some physical activitiesbut still notmeet recommendation N % C.I.(95%)
Physically inactive N % C.I.(95%)
Total N
Estimated numberof Adults
TOTAL 3,319 51.0 (49.3-52.8) 2,353 36.8 (35.1-38.4) 737 12.2 (11.1-13.4) 6,409 958,347
AGE GROUP
18-24 Years 192 60.1 (53.1-66.6) 100 31.2 (25.2-37.9) 22 8.7 ( 5.4-13.9) 314 123,500
25-34 Years 382 53.9 (49.0-58.7) 254 35.9 (31.5-40.6) 58 10.2 ( 7.1-14.4) 694 156,698
35-44 Years 555 52.6 (48.7-56.5) 417 38.3 (34.6-42.1) 86 9.1 ( 7.0-11.7) 1,058 168,676
45-54 Years 705 46.9 (43.6-50.3) 564 40.0 (36.7-43.4) 161 13.1 (10.7-15.9) 1,430 180,968
55-64 Years 732 51.8 (48.2-55.4) 512 37.6 (34.1-41.2) 146 10.6 ( 8.6-13.0) 1,390 150,425
65+ Years 744 44.5 (41.3-47.8) 499 35.8 (32.6-39.1) 258 19.7 (17.2-22.5) 1,501 174,709
Unknown/Refused - - - -- -
GENDER
Male 1,445 54.6 (52.0-57.3) 907 34.6 (32.1-37.2) 264 10.8 ( 9.1-12.7) 2,616 473,186
Female 1,874 47.5 (45.3-49.7) 1,446 38.8 (36.7-41.0) 473 13.6 (12.1-15.3) 3,793 485,161
ETHNICITY
White 1,543 60.1 (57.5-62.6) 875 32.5 (30.1-34.9) 218 7.5 ( 6.3- 8.9) 2,636 304,187
Hawaiian 445 49.8 (45.1-54.6) 324 36.3 (32.0-41.0) 115 13.8 (10.9-17.3) 884 132,639
Filipino 368 44.2 (39.4-49.2) 359 38.1 (33.5-43.0) 120 17.6 (13.8-22.3) 847 168,469
Japanese 593 44.9 (41.4-48.5) 519 42.0 (38.6-45.6) 188 13.1 (11.1-15.4) 1,300 209,694
Others 357 50.0 (45.1-54.8) 269 37.0 (32.5-41.8) 93 13.0 (10.0-16.7) 719 141,064
Unknown/Refused - - - -- -
MARITAL STATUS
Married 1,915 51.5 (49.4-53.6) 1,391 38.0 (36.0-40.0) 357 10.5 ( 9.2-11.8) 3,663 571,264
Unmarried 1,397 50.3 (47.3-53.3) 960 34.9 (32.1-37.8) 378 14.8 (12.7-17.1) 2,735 386,044
Unknown/Refused - - - -- -
EDUCATION
<High School 134 39.2 (32.3-46.6) 115 35.4 (28.5-43.0) 75 25.4 (19.3-32.8) 324 50,218
High School 875 47.4 (44.0-50.7) 679 37.5 (34.3-40.8) 271 15.1 (12.9-17.7) 1,825 302,046
Some College 965 50.8 (47.6-54.1) 713 37.3 (34.2-40.4) 202 11.9 ( 9.7-14.5) 1,880 282,522
College 1,340 56.5 (53.8-59.1) 845 35.9 (33.4-38.5) 187 7.6 ( 6.4- 9.1) 2,372 322,010
Unknown/Refused - - - -- -
EMPLOYMENT
Employed 2,010 50.7 (48.5-52.9) 1,562 39.1 (37.0-41.2) 355 10.2 ( 8.8-11.8) 3,927 617,480
Unemployed - - - - - - - - - -
Student/Homemaker 269 61.7 (55.3-67.7) 146 29.5 (24.1-35.6) 39 8.8 ( 5.7-13.4) 454 89,379
Retired/Can't work 954 47.5 (44.4-50.6) 584 33.8 (30.9-36.8) 312 18.7 (16.4-21.3) 1,850 220,345
Unknown/Refused - - - -- -
HOUSEHOLD INCOME
<$15,000 196 41.2 (34.3-48.5) 173 36.2 (29.8-43.1) 105 22.6 (17.3-29.0) 474 56,374
$15,000-24,999 376 42.2 (37.4-47.2) 302 40.1 (35.3-45.2) 122 17.7 (14.1-22.0) 800 101,083
$25,000-49,999 951 49.4 (46.1-52.7) 674 37.4 (34.3-40.6) 225 13.3 (11.2-15.7) 1,850 272,048
$50,000-74,999 556 54.1 (49.9-58.1) 434 39.0 (35.0-43.1) 87 7.0 ( 5.4- 9.0) 1,077 164,785
>=$75,000 1,027 56.1 (53.0-59.2) 646 36.6 (33.7-39.6) 114 7.3 ( 5.6- 9.5) 1,787 281,012
Unknown/Refused 213 50.8 (43.9-57.7) 124 27.1 (21.7-33.2) 84 22.1 (16.8-28.4) 421 83,045
Percentages are weighted to population characteristics.N = Cell Sample Size, % = Percentage, 95% C.I. = Confidence Interval at 95 percent probability level
Rows with Sample Size less than 50 or containing half-width of 95% CI greater than 10 have been suppressed.

Estimated physical activity levelState of Hawaii BRFSS 2007
GEOGRAPHIC AREAS Meet recommendation for physical activity N % C.I.(95%)
Some physical activitiesbut still notmeet recommendation N % C.I.(95%)
Physically inactive N % C.I.(95%)
Total N
Estimatednumberof Adults
STATE 3,319 51.0 (49.3-52.8) 2,353 36.8 (35.1-38.4) 737 12.2 (11.1-13.4) 6,409 958,347
COUNTY
Honolulu 1,403 50.1 (47.9-52.4) 1,065 37.3 (35.2-39.5) 365 12.5 (11.1-14.2) 2,833 682,008
Hawaii 781 52.5 (49.3-55.7) 534 35.8 (32.8-38.9) 156 11.7 ( 9.5-14.3) 1,471 125,193
Kauai 345 55.5 (50.6-60.3) 233 35.7 (31.2-40.5) 62 8.8 ( 6.5-11.8) 640 46,574
Maui 790 53.2 (49.4-56.9) 521 34.7 (31.3-38.3) 154 12.1 ( 9.5-15.4) 1,465 104,572
HONOLULU County
North Shore/Laie - - - - - - - - - -
Ka'a'wa/Kahalu'u/Kaneohe 94 44.3 (36.5-52.5) 84 43.9 (36.0-52.2) 30 11.7 ( 7.9-17.1) 208 48,323
Kailua/Waimanalo 121 56.2 (48.6-63.4) 90 36.4 (29.6-43.7) 19 7.4 ( 4.6-11.9) 230 50,820
Wailae/Kahala/HawaiiKai 103 59.9 (51.3-68.0) 59 34.7 (27.0-43.3) 11 5.4 ( 2.8-10.0) 173 38,256
Kaimuki/Palolo/Waikiki 146 56.5 (49.1-63.5) 87 29.7 (23.8-36.4) 36 13.8 ( 9.4-20.0) 269 53,399
Manoa/Upper Makiki 108 51.4 (43.8-58.9) 94 39.3 (32.2-46.8) 25 9.4 ( 6.0-14.3) 227 42,822
Ala Moana 77 50.8 (41.6-59.9) 55 33.1 (25.3-42.0) 22 16.1 (10.1-24.8) 154 28,863
Nuuanu/Kalihi/MoanaLoa 105 40.8 (33.3-48.8) 94 43.5 (35.7-51.7) 45 15.7 (11.1-21.7) 244 64,079
Salt Lake/Foster Village 68 64.1 (54.1-73.1) 33 22.1 (15.4-30.8) 18 13.7 ( 8.2-22.2) 119 27,788
Aiea/Pearl City 121 46.4 (39.2-53.8) 112 40.8 (34.0-48.0) 43 12.8 ( 9.1-17.7) 276 67,973
Mililani/Wahiawa 143 49.4 (42.7-56.2) 122 42.9 (36.3-49.7) 24 7.7 ( 4.8-12.2) 289 72,585
Waipahu/Kapolei/Ewa 215 48.3 (42.7-54.0) 164 36.4 (31.1-42.0) 57 15.3 (11.2-20.5) 436 126,807
Nanakuli/Waianae - - - - - - - - - -
HAWAII County
North Hawaii 178 58.0 (51.0-64.7) 101 31.5 (25.5-38.3) 29 10.5 ( 6.7-16.1) 308 27,430
Hilo 203 50.3 (44.5-56.0) 158 36.9 (31.6-42.5) 55 12.9 ( 9.6-17.1) 416 35,352
Puna/Ka'u 223 51.5 (45.3-57.6) 148 36.0 (30.3-42.0) 44 12.6 ( 8.2-18.8) 415 35,051
Kona 177 51.2 (44.5-57.9) 127 38.4 (32.1-45.2) 28 10.4 ( 6.2-16.8) 332 27,360
KAUAI County
Hanalei/Kapa'a 175 60.5 (53.2-67.2) 100 33.0 (26.7-40.1) 18 6.5 ( 3.8-10.9) 293 19,707
Lihue-Waimea 170 51.8 (45.2-58.4) 133 37.6 (31.5-44.2) 44 10.5 ( 7.3-14.9) 347 26,866
MAUI County
Lahaina/Wailuku 160 52.0 (43.9-60.0) 98 34.0 (27.2-41.6) 32 14.0 ( 7.8-23.8) 290 29,893
Kahului 175 53.3 (46.7-59.8) 121 36.9 (30.7-43.5) 30 9.8 ( 6.7-14.1) 326 31,490
Upcountry/Hana 207 52.8 (46.4-59.1) 126 34.0 (28.2-40.3) 44 13.2 ( 9.5-18.2) 377 33,521
Lanai 94 51.3 (42.9-59.6) 86 39.1 (31.3-47.4) 21 9.6 ( 5.9-15.2) 201 1,852
Molokai 154 59.1 (51.9-65.9) 90 30.5 (24.6-37.1) 27 10.4 ( 6.7-15.9) 271 7,816
Percentages are weighted to population characteristics.N = Cell Sample Size, % = Percentage, 95% C.I. = Confidence Interval at 95 percent probability level
Rows with Sample Size less than 50 or containing half-width of 95% CI greater than 10 have been suppressed.

Risk factor for moderate physical activity defined as:(M. Activity >=30 min/d on 5+ d/w) or (V. Activity >=20 min/d on 3+ d/w)
State of Hawaii BRFSS 2007
Demographic Characteristics
NOT AT RISK N % C.I.(95%)
AT RISK N % C.I.(95%)
Total N
Estimated numberof Adults
TOTAL 3,319 51.0 (49.3-52.8) 3,090 49.0 (47.2-50.7) 6,409 958,347
AGE GROUP
18-24 Years 192 60.1 (53.1-66.6) 122 39.9 (33.4-46.9) 314 123,500
25-34 Years 382 53.9 (49.0-58.7) 312 46.1 (41.3-51.0) 694 156,698
35-44 Years 555 52.6 (48.7-56.5) 503 47.4 (43.5-51.3) 1,058 168,676
45-54 Years 705 46.9 (43.6-50.3) 725 53.1 (49.7-56.4) 1,430 180,968
55-64 Years 732 51.8 (48.2-55.4) 658 48.2 (44.6-51.8) 1,390 150,425
65+ Years 744 44.5 (41.3-47.8) 757 55.5 (52.2-58.7) 1,501 174,709
Unknown/Refused - - -- -
GENDER
Male 1,445 54.6 (52.0-57.3) 1,171 45.4 (42.7-48.0) 2,616 473,186
Female 1,874 47.5 (45.3-49.7) 1,919 52.5 (50.3-54.7) 3,793 485,161
ETHNICITY
White 1,543 60.1 (57.5-62.6) 1,093 39.9 (37.4-42.5) 2,636 304,187
Hawaiian 445 49.8 (45.1-54.6) 439 50.2 (45.4-54.9) 884 132,639
Filipino 368 44.2 (39.4-49.2) 479 55.8 (50.8-60.6) 847 168,469
Japanese 593 44.9 (41.4-48.5) 707 55.1 (51.5-58.6) 1,300 209,694
Others 357 50.0 (45.1-54.8) 362 50.0 (45.2-54.9) 719 141,064
Unknown/Refused - - -- -
MARITAL STATUS
Married 1,915 51.5 (49.4-53.6) 1,748 48.5 (46.4-50.6) 3,663 571,264
Unmarried 1,397 50.3 (47.3-53.3) 1,338 49.7 (46.7-52.7) 2,735 386,044
Unknown/Refused - - -- -
EDUCATION
<High School 134 39.2 (32.3-46.6) 190 60.8 (53.4-67.7) 324 50,218
High School 875 47.4 (44.0-50.7) 950 52.6 (49.3-56.0) 1,825 302,046
Some College 965 50.8 (47.6-54.1) 915 49.2 (45.9-52.4) 1,880 282,522
College 1,340 56.5 (53.8-59.1) 1,032 43.5 (40.9-46.2) 2,372 322,010
Unknown/Refused - - -- -
EMPLOYMENT
Employed 2,010 50.7 (48.5-52.9) 1,917 49.3 (47.1-51.5) 3,927 617,480
Unemployed - - - - - - - -
Student/Homemaker 269 61.7 (55.3-67.7) 185 38.3 (32.3-44.7) 454 89,379
Retired/Can't work 954 47.5 (44.4-50.6) 896 52.5 (49.4-55.6) 1,850 220,345
Unknown/Refused - - -- -
HOUSEHOLD INCOME
<$15,000 196 41.2 (34.3-48.5) 278 58.8 (51.5-65.7) 474 56,374
$15,000-24,999 376 42.2 (37.4-47.2) 424 57.8 (52.8-62.6) 800 101,083
$25,000-49,999 951 49.4 (46.1-52.7) 899 50.6 (47.3-53.9) 1,850 272,048
$50,000-74,999 556 54.1 (49.9-58.1) 521 45.9 (41.9-50.1) 1,077 164,785
>=$75,000 1,027 56.1 (53.0-59.2) 760 43.9 (40.8-47.0) 1,787 281,012
Unknown/Refused 213 50.8 (43.9-57.7) 208 49.2 (42.3-56.1) 421 83,045
Percentages are weighted to population characteristics.N = Cell Sample Size, % = Percentage, 95% C.I. = Confidence Interval at 95 percent probability level
Rows with Sample Size less than 50 or containing half-width of 95% CI greater than 10 have been suppressed.
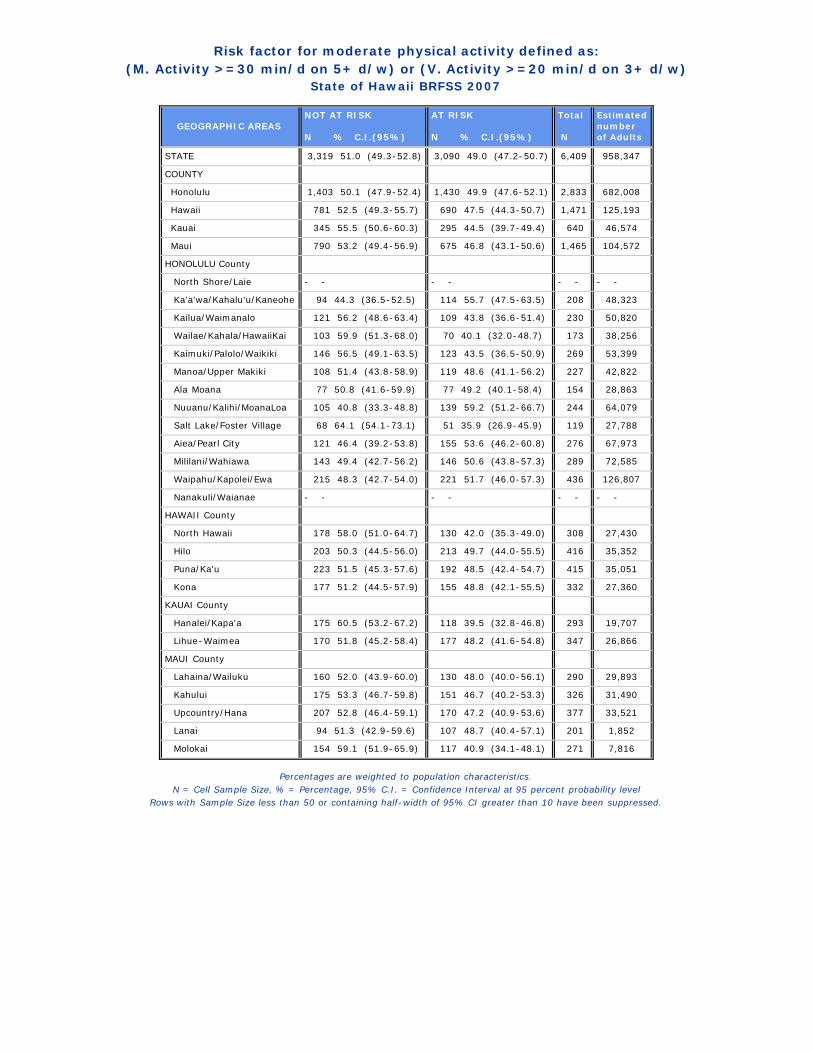
Risk factor for moderate physical activity defined as:(M. Activity >=30 min/d on 5+ d/w) or (V. Activity >=20 min/d on 3+ d/w)
State of Hawaii BRFSS 2007
GEOGRAPHIC AREAS NOT AT RISK N % C.I.(95%)
AT RISK N % C.I.(95%)
Total N
Estimatednumberof Adults
STATE 3,319 51.0 (49.3-52.8) 3,090 49.0 (47.2-50.7) 6,409 958,347
COUNTY
Honolulu 1,403 50.1 (47.9-52.4) 1,430 49.9 (47.6-52.1) 2,833 682,008
Hawaii 781 52.5 (49.3-55.7) 690 47.5 (44.3-50.7) 1,471 125,193
Kauai 345 55.5 (50.6-60.3) 295 44.5 (39.7-49.4) 640 46,574
Maui 790 53.2 (49.4-56.9) 675 46.8 (43.1-50.6) 1,465 104,572
HONOLULU County
North Shore/Laie - - - - - - - -
Ka'a'wa/Kahalu'u/Kaneohe 94 44.3 (36.5-52.5) 114 55.7 (47.5-63.5) 208 48,323
Kailua/Waimanalo 121 56.2 (48.6-63.4) 109 43.8 (36.6-51.4) 230 50,820
Wailae/Kahala/HawaiiKai 103 59.9 (51.3-68.0) 70 40.1 (32.0-48.7) 173 38,256
Kaimuki/Palolo/Waikiki 146 56.5 (49.1-63.5) 123 43.5 (36.5-50.9) 269 53,399
Manoa/Upper Makiki 108 51.4 (43.8-58.9) 119 48.6 (41.1-56.2) 227 42,822
Ala Moana 77 50.8 (41.6-59.9) 77 49.2 (40.1-58.4) 154 28,863
Nuuanu/Kalihi/MoanaLoa 105 40.8 (33.3-48.8) 139 59.2 (51.2-66.7) 244 64,079
Salt Lake/Foster Village 68 64.1 (54.1-73.1) 51 35.9 (26.9-45.9) 119 27,788
Aiea/Pearl City 121 46.4 (39.2-53.8) 155 53.6 (46.2-60.8) 276 67,973
Mililani/Wahiawa 143 49.4 (42.7-56.2) 146 50.6 (43.8-57.3) 289 72,585
Waipahu/Kapolei/Ewa 215 48.3 (42.7-54.0) 221 51.7 (46.0-57.3) 436 126,807
Nanakuli/Waianae - - - - - - - -
HAWAII County
North Hawaii 178 58.0 (51.0-64.7) 130 42.0 (35.3-49.0) 308 27,430
Hilo 203 50.3 (44.5-56.0) 213 49.7 (44.0-55.5) 416 35,352
Puna/Ka'u 223 51.5 (45.3-57.6) 192 48.5 (42.4-54.7) 415 35,051
Kona 177 51.2 (44.5-57.9) 155 48.8 (42.1-55.5) 332 27,360
KAUAI County
Hanalei/Kapa'a 175 60.5 (53.2-67.2) 118 39.5 (32.8-46.8) 293 19,707
Lihue-Waimea 170 51.8 (45.2-58.4) 177 48.2 (41.6-54.8) 347 26,866
MAUI County
Lahaina/Wailuku 160 52.0 (43.9-60.0) 130 48.0 (40.0-56.1) 290 29,893
Kahului 175 53.3 (46.7-59.8) 151 46.7 (40.2-53.3) 326 31,490
Upcountry/Hana 207 52.8 (46.4-59.1) 170 47.2 (40.9-53.6) 377 33,521
Lanai 94 51.3 (42.9-59.6) 107 48.7 (40.4-57.1) 201 1,852
Molokai 154 59.1 (51.9-65.9) 117 40.9 (34.1-48.1) 271 7,816
Percentages are weighted to population characteristics.N = Cell Sample Size, % = Percentage, 95% C.I. = Confidence Interval at 95 percent probability level
Rows with Sample Size less than 50 or containing half-width of 95% CI greater than 10 have been suppressed.
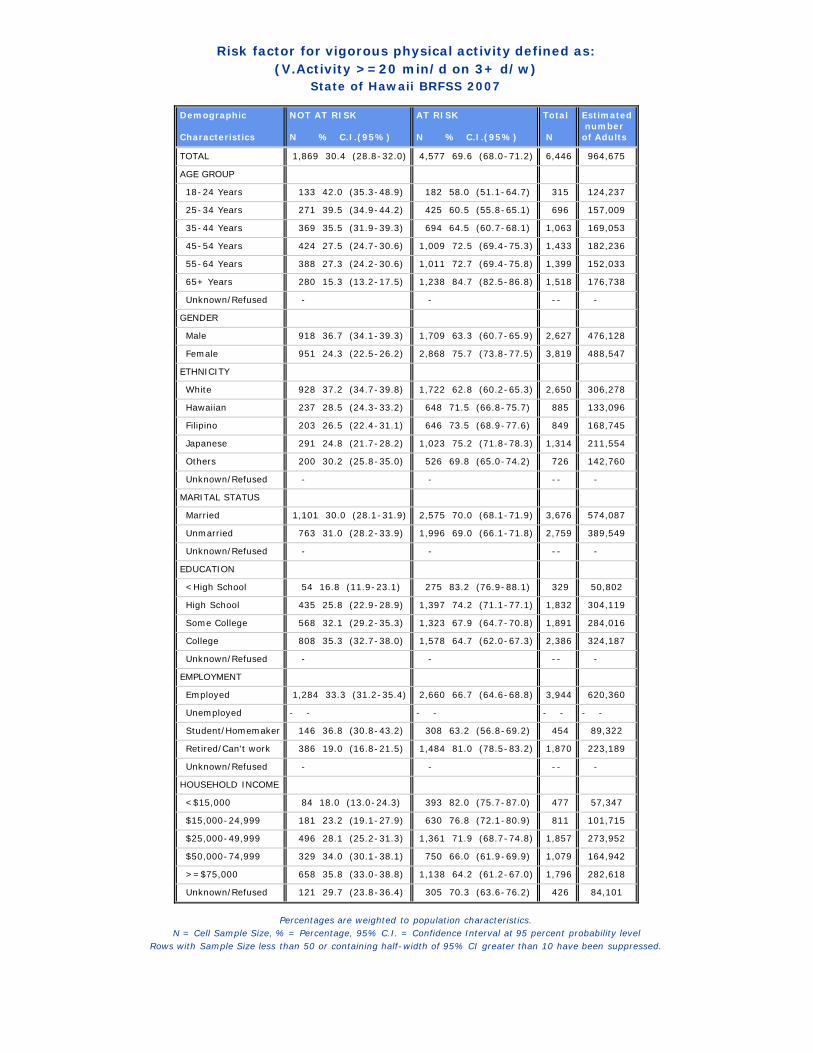
Risk factor for vigorous physical activity defined as:(V.Activity >=20 min/d on 3+ d/w)
State of Hawaii BRFSS 2007
Demographic Characteristics
NOT AT RISK N % C.I.(95%)
AT RISK N % C.I.(95%)
Total N
Estimated numberof Adults
TOTAL 1,869 30.4 (28.8-32.0) 4,577 69.6 (68.0-71.2) 6,446 964,675
AGE GROUP
18-24 Years 133 42.0 (35.3-48.9) 182 58.0 (51.1-64.7) 315 124,237
25-34 Years 271 39.5 (34.9-44.2) 425 60.5 (55.8-65.1) 696 157,009
35-44 Years 369 35.5 (31.9-39.3) 694 64.5 (60.7-68.1) 1,063 169,053
45-54 Years 424 27.5 (24.7-30.6) 1,009 72.5 (69.4-75.3) 1,433 182,236
55-64 Years 388 27.3 (24.2-30.6) 1,011 72.7 (69.4-75.8) 1,399 152,033
65+ Years 280 15.3 (13.2-17.5) 1,238 84.7 (82.5-86.8) 1,518 176,738
Unknown/Refused - - -- -
GENDER
Male 918 36.7 (34.1-39.3) 1,709 63.3 (60.7-65.9) 2,627 476,128
Female 951 24.3 (22.5-26.2) 2,868 75.7 (73.8-77.5) 3,819 488,547
ETHNICITY
White 928 37.2 (34.7-39.8) 1,722 62.8 (60.2-65.3) 2,650 306,278
Hawaiian 237 28.5 (24.3-33.2) 648 71.5 (66.8-75.7) 885 133,096
Filipino 203 26.5 (22.4-31.1) 646 73.5 (68.9-77.6) 849 168,745
Japanese 291 24.8 (21.7-28.2) 1,023 75.2 (71.8-78.3) 1,314 211,554
Others 200 30.2 (25.8-35.0) 526 69.8 (65.0-74.2) 726 142,760
Unknown/Refused - - -- -
MARITAL STATUS
Married 1,101 30.0 (28.1-31.9) 2,575 70.0 (68.1-71.9) 3,676 574,087
Unmarried 763 31.0 (28.2-33.9) 1,996 69.0 (66.1-71.8) 2,759 389,549
Unknown/Refused - - -- -
EDUCATION
<High School 54 16.8 (11.9-23.1) 275 83.2 (76.9-88.1) 329 50,802
High School 435 25.8 (22.9-28.9) 1,397 74.2 (71.1-77.1) 1,832 304,119
Some College 568 32.1 (29.2-35.3) 1,323 67.9 (64.7-70.8) 1,891 284,016
College 808 35.3 (32.7-38.0) 1,578 64.7 (62.0-67.3) 2,386 324,187
Unknown/Refused - - -- -
EMPLOYMENT
Employed 1,284 33.3 (31.2-35.4) 2,660 66.7 (64.6-68.8) 3,944 620,360
Unemployed - - - - - - - -
Student/Homemaker 146 36.8 (30.8-43.2) 308 63.2 (56.8-69.2) 454 89,322
Retired/Can't work 386 19.0 (16.8-21.5) 1,484 81.0 (78.5-83.2) 1,870 223,189
Unknown/Refused - - -- -
HOUSEHOLD INCOME
<$15,000 84 18.0 (13.0-24.3) 393 82.0 (75.7-87.0) 477 57,347
$15,000-24,999 181 23.2 (19.1-27.9) 630 76.8 (72.1-80.9) 811 101,715
$25,000-49,999 496 28.1 (25.2-31.3) 1,361 71.9 (68.7-74.8) 1,857 273,952
$50,000-74,999 329 34.0 (30.1-38.1) 750 66.0 (61.9-69.9) 1,079 164,942
>=$75,000 658 35.8 (33.0-38.8) 1,138 64.2 (61.2-67.0) 1,796 282,618
Unknown/Refused 121 29.7 (23.8-36.4) 305 70.3 (63.6-76.2) 426 84,101
Percentages are weighted to population characteristics.N = Cell Sample Size, % = Percentage, 95% C.I. = Confidence Interval at 95 percent probability level
Rows with Sample Size less than 50 or containing half-width of 95% CI greater than 10 have been suppressed.

Risk factor for vigorous physical activity defined as:(V.Activity >=20 min/d on 3+ d/w)
State of Hawaii BRFSS 2007
GEOGRAPHIC AREAS NOT AT RISK N % C.I.(95%)
AT RISK N % C.I.(95%)
Total N
Estimatednumberof Adults
STATE 1,869 30.4 (28.8-32.0) 4,577 69.6 (68.0-71.2) 6,446 964,675
COUNTY
Honolulu 789 30.0 (27.9-32.1) 2,063 70.0 (67.9-72.1) 2,852 687,006
Hawaii 429 29.7 (27.0-32.6) 1,053 70.3 (67.4-73.0) 1,482 125,883
Kauai 189 31.9 (27.3-36.8) 447 68.1 (63.2-72.7) 636 46,416
Maui 462 33.4 (30.0-36.9) 1,014 66.6 (63.1-70.0) 1,476 105,371
HONOLULU County
North Shore/Laie - - - - - - - -
Ka'a'wa/Kahalu'u/Kaneohe 60 31.3 (24.1-39.5) 149 68.7 (60.5-75.9) 209 48,541
Kailua/Waimanalo 66 32.7 (25.5-40.9) 165 67.3 (59.1-74.5) 231 51,059
Wailae/Kahala/HawaiiKai 58 33.6 (25.9-42.3) 115 66.4 (57.7-74.1) 173 38,256
Kaimuki/Palolo/Waikiki 73 32.7 (25.6-40.6) 197 67.3 (59.4-74.4) 270 53,447
Manoa/Upper Makiki 51 24.4 (18.1-32.1) 181 75.6 (67.9-81.9) 232 43,517
Ala Moana 32 24.0 (16.8-33.0) 122 76.0 (67.0-83.2) 154 28,863
Nuuanu/Kalihi/MoanaLoa 58 23.7 (17.5-31.2) 190 76.3 (68.8-82.5) 248 65,423
Salt Lake/Foster Village - - - - - - - -
Aiea/Pearl City 65 26.2 (20.3-33.3) 212 73.8 (66.7-79.7) 277 68,141
Mililani/Wahiawa 87 30.9 (25.0-37.5) 204 69.1 (62.5-75.0) 291 73,409
Waipahu/Kapolei/Ewa 141 32.5 (27.5-37.9) 298 67.5 (62.1-72.5) 439 127,857
Nanakuli/Waianae - - - - - - - -
HAWAII County
North Hawaii 107 32.6 (26.7-39.1) 205 67.4 (60.9-73.3) 312 27,626
Hilo 104 29.2 (24.1-34.9) 314 70.8 (65.1-75.9) 418 35,435
Puna/Ka'u 110 26.4 (21.6-31.8) 309 73.6 (68.2-78.4) 419 35,414
Kona 108 31.8 (26.1-38.1) 225 68.2 (61.9-73.9) 333 27,408
KAUAI County
Hanalei/Kapa'a 97 37.2 (30.0-45.0) 194 62.8 (55.0-70.0) 291 19,602
Lihue-Waimea 92 28.0 (22.4-34.4) 253 72.0 (65.6-77.6) 345 26,814
MAUI County
Lahaina/Wailuku 97 34.6 (27.5-42.5) 195 65.4 (57.5-72.5) 292 30,033
Kahului 111 35.5 (29.4-42.1) 218 64.5 (57.9-70.6) 329 31,702
Upcountry/Hana 123 30.7 (25.4-36.7) 258 69.3 (63.3-74.6) 381 33,943
Lanai 52 29.1 (21.9-37.7) 150 70.9 (62.3-78.1) 202 1,863
Molokai 79 32.0 (25.4-39.4) 193 68.0 (60.6-74.6) 272 7,831
Percentages are weighted to population characteristics.N = Cell Sample Size, % = Percentage, 95% C.I. = Confidence Interval at 95 percent probability level
Rows with Sample Size less than 50 or containing half-width of 95% CI greater than 10 have been suppressed.

IMMUNIZATION For Immunization, following questions were asked.
Seasonal flu
Now I will ask you questions about seasonal flu. A flu shot is an influenza vaccine injected into your arm.
A./ During the past 12 months, have you had a seasonal flu shot?
B./ The seasonal flu vaccine sprayed in the nose is also called FluMist™. During the past 12 months, have you had a seasonal flu vaccine that was sprayed in your nose?
Pneumonia
A pneumonia shot or pneumococcal vaccine is usually given only once or twice in a person’s lifetime and is different from the flu shot.
Have you ever had a pneumonia shot?
Hepatitis B (The hepatitis B vaccine is completed after the third shot is given)
Have you EVER received the hepatitis B vaccine? The next question is about behaviors related to Hepatitis B.
Please tell me if ANY of these statements is true for YOU. Do NOT tell me WHICH statement or statements are true for you, just if ANY of them are:
• You have hemophilia and have received clotting factor concentrate • You have had sex with a man who has had sex with other men, even just one time • You have taken street drugs by needle, even just one time • You traded sex for money or drugs, even just one time • You have tested positive for HIV • You have had sex (even just one time) with someone who would answer "yes" to any of • these statements • You had more than two sex partners in the past year
Are any of these statements true for you?
1./ Yes, at least one statement is true 2./ No, none of these statements is true

Have you had a flu shot in last 12 months?State of Hawaii BRFSS 2007
Demographic Characteristics
YES N % C.I.(95%)
NO N % C.I.(95%)
Total N
Estimated numberof Adults
TOTAL 2,989 44.8 (43.1-46.4) 3,583 55.2 (53.6-56.9) 6,572 979,769
AGE GROUP
18-24 Years 90 30.9 (24.7-37.9) 223 69.1 (62.1-75.3) 313 121,997
25-34 Years 202 30.4 (26.3-34.9) 503 69.6 (65.1-73.7) 705 158,281
35-44 Years 338 32.4 (28.9-36.1) 758 67.6 (63.9-71.1) 1,096 174,822
45-54 Years 512 39.1 (35.8-42.5) 946 60.9 (57.5-64.2) 1,458 185,103
55-64 Years 671 51.5 (47.9-55.0) 759 48.5 (45.0-52.1) 1,430 155,044
65+ Years 1,163 78.5 (75.8-81.0) 381 21.5 (19.0-24.2) 1,544 180,465
Unknown/Refused - - -- -
GENDER
Male 1,157 41.6 (39.0-44.1) 1,523 58.4 (55.9-61.0) 2,680 483,798
Female 1,832 47.9 (45.7-50.0) 2,060 52.1 (50.0-54.3) 3,892 495,971
ETHNICITY
White 1,077 40.8 (38.3-43.3) 1,621 59.2 (56.7-61.7) 2,698 311,502
Hawaiian 387 39.3 (34.9-43.9) 509 60.7 (56.1-65.1) 896 132,941
Filipino 405 45.7 (41.0-50.6) 467 54.3 (49.4-59.0) 872 172,076
Japanese 783 53.9 (50.4-57.4) 557 46.1 (42.6-49.6) 1,340 215,181
Others 326 43.1 (38.5-47.9) 415 56.9 (52.1-61.5) 741 145,208
Unknown/Refused - - -- -
MARITAL STATUS
Married 1,747 47.3 (45.3-49.4) 1,999 52.7 (50.6-54.7) 3,746 584,663
Unmarried 1,235 40.9 (38.1-43.8) 1,578 59.1 (56.2-61.9) 2,813 393,870
Unknown/Refused - - -- -
EDUCATION
<High School 190 53.6 (46.2-60.8) 149 46.4 (39.2-53.8) 339 52,937
High School 817 41.6 (38.4-44.9) 1,054 58.4 (55.1-61.6) 1,871 307,785
Some College 862 44.9 (41.8-48.0) 1,061 55.1 (52.0-58.2) 1,923 286,821
College 1,116 46.2 (43.6-48.9) 1,314 53.8 (51.1-56.4) 2,430 330,592
Unknown/Refused - - -- -
EMPLOYMENT
Employed 1,462 37.0 (35.0-39.1) 2,565 63.0 (60.9-65.0) 4,027 632,769
Unemployed - - - - - - - -
Student/Homemaker 153 32.0 (26.4-38.3) 304 68.0 (61.7-73.6) 457 88,075
Retired/Can't work 1,312 72.1 (69.3-74.7) 595 27.9 (25.3-30.7) 1,907 227,807
Unknown/Refused - - -- -
HOUSEHOLD INCOME
<$15,000 226 41.7 (35.0-48.7) 262 58.3 (51.3-65.0) 488 57,732
$15,000-24,999 375 44.6 (39.8-49.6) 451 55.4 (50.4-60.2) 826 103,429
$25,000-49,999 881 46.8 (43.6-50.0) 1,009 53.2 (50.0-56.4) 1,890 277,859
$50,000-74,999 465 42.4 (38.5-46.5) 636 57.6 (53.5-61.5) 1,101 168,939
>=$75,000 808 42.9 (40.0-45.9) 1,008 57.1 (54.1-60.0) 1,816 284,988
Unknown/Refused 234 51.0 (44.3-57.6) 217 49.0 (42.4-55.7) 451 86,822
Percentages are weighted to population characteristics.N = Cell Sample Size, % = Percentage, 95% C.I. = Confidence Interval at 95 percent probability level
Rows with Sample Size less than 50 or containing half-width of 95% CI greater than 10 have been suppressed.
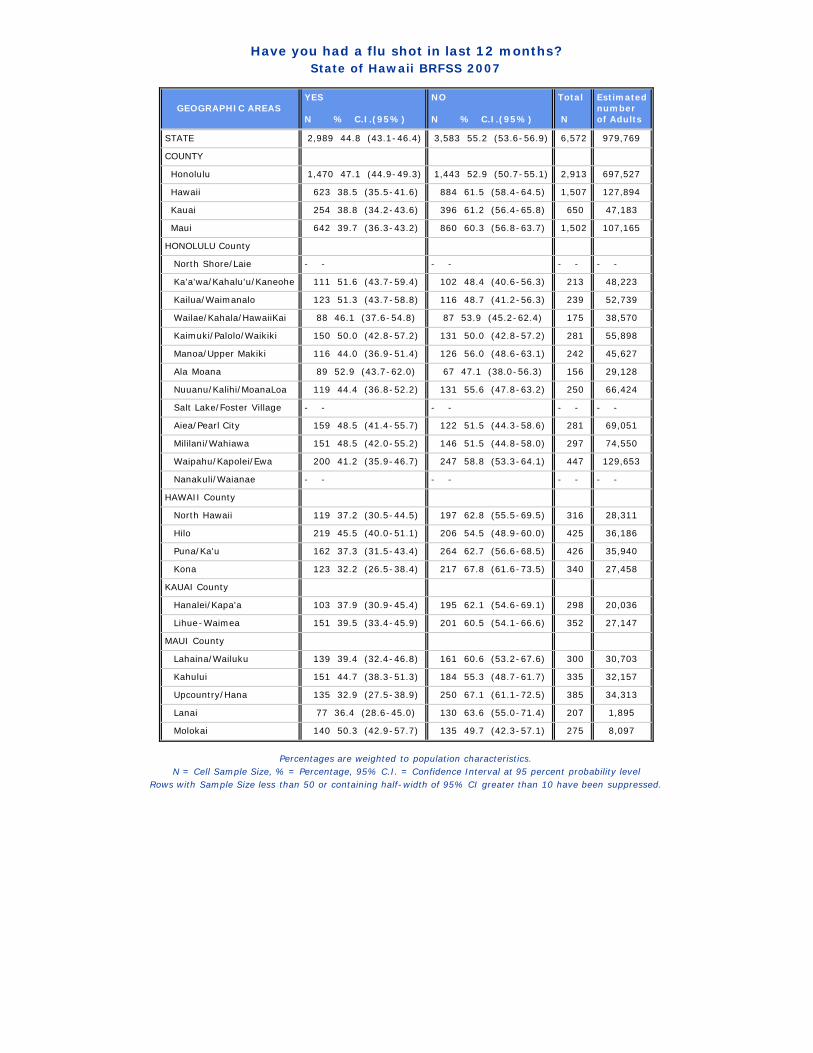
Have you had a flu shot in last 12 months?State of Hawaii BRFSS 2007
GEOGRAPHIC AREAS YES N % C.I.(95%)
NO N % C.I.(95%)
Total N
Estimatednumberof Adults
STATE 2,989 44.8 (43.1-46.4) 3,583 55.2 (53.6-56.9) 6,572 979,769
COUNTY
Honolulu 1,470 47.1 (44.9-49.3) 1,443 52.9 (50.7-55.1) 2,913 697,527
Hawaii 623 38.5 (35.5-41.6) 884 61.5 (58.4-64.5) 1,507 127,894
Kauai 254 38.8 (34.2-43.6) 396 61.2 (56.4-65.8) 650 47,183
Maui 642 39.7 (36.3-43.2) 860 60.3 (56.8-63.7) 1,502 107,165
HONOLULU County
North Shore/Laie - - - - - - - -
Ka'a'wa/Kahalu'u/Kaneohe 111 51.6 (43.7-59.4) 102 48.4 (40.6-56.3) 213 48,223
Kailua/Waimanalo 123 51.3 (43.7-58.8) 116 48.7 (41.2-56.3) 239 52,739
Wailae/Kahala/HawaiiKai 88 46.1 (37.6-54.8) 87 53.9 (45.2-62.4) 175 38,570
Kaimuki/Palolo/Waikiki 150 50.0 (42.8-57.2) 131 50.0 (42.8-57.2) 281 55,898
Manoa/Upper Makiki 116 44.0 (36.9-51.4) 126 56.0 (48.6-63.1) 242 45,627
Ala Moana 89 52.9 (43.7-62.0) 67 47.1 (38.0-56.3) 156 29,128
Nuuanu/Kalihi/MoanaLoa 119 44.4 (36.8-52.2) 131 55.6 (47.8-63.2) 250 66,424
Salt Lake/Foster Village - - - - - - - -
Aiea/Pearl City 159 48.5 (41.4-55.7) 122 51.5 (44.3-58.6) 281 69,051
Mililani/Wahiawa 151 48.5 (42.0-55.2) 146 51.5 (44.8-58.0) 297 74,550
Waipahu/Kapolei/Ewa 200 41.2 (35.9-46.7) 247 58.8 (53.3-64.1) 447 129,653
Nanakuli/Waianae - - - - - - - -
HAWAII County
North Hawaii 119 37.2 (30.5-44.5) 197 62.8 (55.5-69.5) 316 28,311
Hilo 219 45.5 (40.0-51.1) 206 54.5 (48.9-60.0) 425 36,186
Puna/Ka'u 162 37.3 (31.5-43.4) 264 62.7 (56.6-68.5) 426 35,940
Kona 123 32.2 (26.5-38.4) 217 67.8 (61.6-73.5) 340 27,458
KAUAI County
Hanalei/Kapa'a 103 37.9 (30.9-45.4) 195 62.1 (54.6-69.1) 298 20,036
Lihue-Waimea 151 39.5 (33.4-45.9) 201 60.5 (54.1-66.6) 352 27,147
MAUI County
Lahaina/Wailuku 139 39.4 (32.4-46.8) 161 60.6 (53.2-67.6) 300 30,703
Kahului 151 44.7 (38.3-51.3) 184 55.3 (48.7-61.7) 335 32,157
Upcountry/Hana 135 32.9 (27.5-38.9) 250 67.1 (61.1-72.5) 385 34,313
Lanai 77 36.4 (28.6-45.0) 130 63.6 (55.0-71.4) 207 1,895
Molokai 140 50.3 (42.9-57.7) 135 49.7 (42.3-57.1) 275 8,097
Percentages are weighted to population characteristics.N = Cell Sample Size, % = Percentage, 95% C.I. = Confidence Interval at 95 percent probability level
Rows with Sample Size less than 50 or containing half-width of 95% CI greater than 10 have been suppressed.
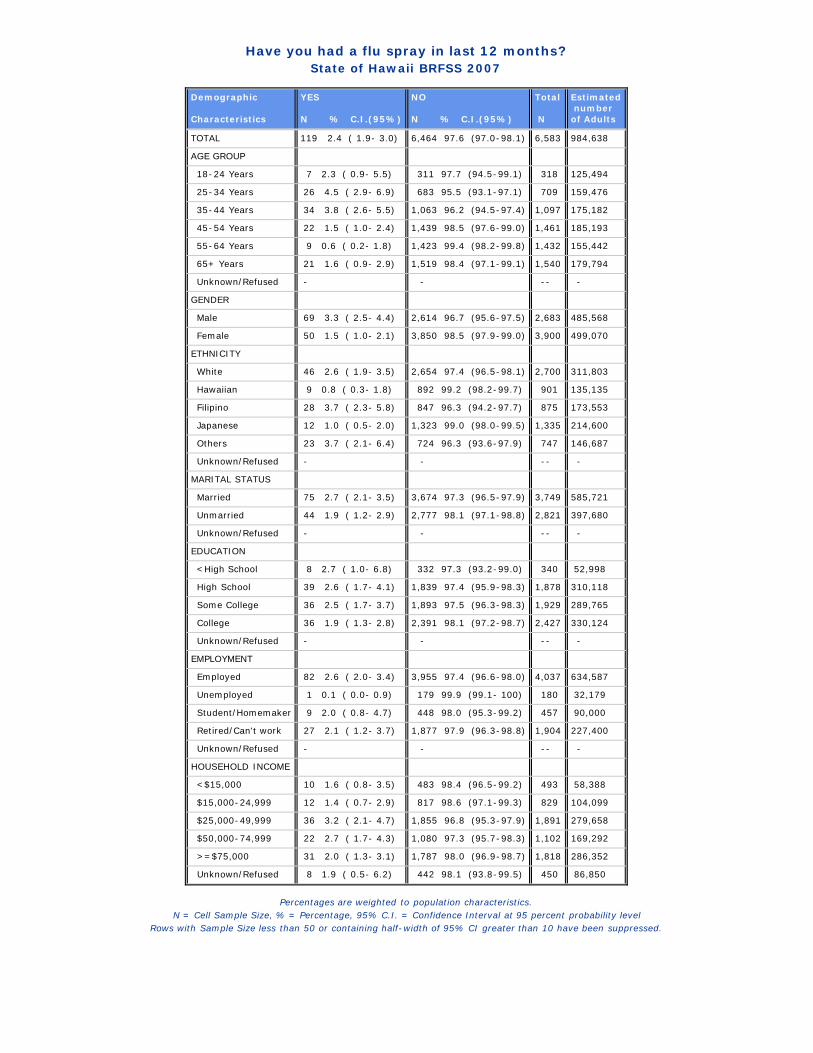
Have you had a flu spray in last 12 months?State of Hawaii BRFSS 2007
Demographic Characteristics
YES N % C.I.(95%)
NO N % C.I.(95%)
Total N
Estimated numberof Adults
TOTAL 119 2.4 ( 1.9- 3.0) 6,464 97.6 (97.0-98.1) 6,583 984,638
AGE GROUP
18-24 Years 7 2.3 ( 0.9- 5.5) 311 97.7 (94.5-99.1) 318 125,494
25-34 Years 26 4.5 ( 2.9- 6.9) 683 95.5 (93.1-97.1) 709 159,476
35-44 Years 34 3.8 ( 2.6- 5.5) 1,063 96.2 (94.5-97.4) 1,097 175,182
45-54 Years 22 1.5 ( 1.0- 2.4) 1,439 98.5 (97.6-99.0) 1,461 185,193
55-64 Years 9 0.6 ( 0.2- 1.8) 1,423 99.4 (98.2-99.8) 1,432 155,442
65+ Years 21 1.6 ( 0.9- 2.9) 1,519 98.4 (97.1-99.1) 1,540 179,794
Unknown/Refused - - -- -
GENDER
Male 69 3.3 ( 2.5- 4.4) 2,614 96.7 (95.6-97.5) 2,683 485,568
Female 50 1.5 ( 1.0- 2.1) 3,850 98.5 (97.9-99.0) 3,900 499,070
ETHNICITY
White 46 2.6 ( 1.9- 3.5) 2,654 97.4 (96.5-98.1) 2,700 311,803
Hawaiian 9 0.8 ( 0.3- 1.8) 892 99.2 (98.2-99.7) 901 135,135
Filipino 28 3.7 ( 2.3- 5.8) 847 96.3 (94.2-97.7) 875 173,553
Japanese 12 1.0 ( 0.5- 2.0) 1,323 99.0 (98.0-99.5) 1,335 214,600
Others 23 3.7 ( 2.1- 6.4) 724 96.3 (93.6-97.9) 747 146,687
Unknown/Refused - - -- -
MARITAL STATUS
Married 75 2.7 ( 2.1- 3.5) 3,674 97.3 (96.5-97.9) 3,749 585,721
Unmarried 44 1.9 ( 1.2- 2.9) 2,777 98.1 (97.1-98.8) 2,821 397,680
Unknown/Refused - - -- -
EDUCATION
<High School 8 2.7 ( 1.0- 6.8) 332 97.3 (93.2-99.0) 340 52,998
High School 39 2.6 ( 1.7- 4.1) 1,839 97.4 (95.9-98.3) 1,878 310,118
Some College 36 2.5 ( 1.7- 3.7) 1,893 97.5 (96.3-98.3) 1,929 289,765
College 36 1.9 ( 1.3- 2.8) 2,391 98.1 (97.2-98.7) 2,427 330,124
Unknown/Refused - - -- -
EMPLOYMENT
Employed 82 2.6 ( 2.0- 3.4) 3,955 97.4 (96.6-98.0) 4,037 634,587
Unemployed 1 0.1 ( 0.0- 0.9) 179 99.9 (99.1- 100) 180 32,179
Student/Homemaker 9 2.0 ( 0.8- 4.7) 448 98.0 (95.3-99.2) 457 90,000
Retired/Can't work 27 2.1 ( 1.2- 3.7) 1,877 97.9 (96.3-98.8) 1,904 227,400
Unknown/Refused - - -- -
HOUSEHOLD INCOME
<$15,000 10 1.6 ( 0.8- 3.5) 483 98.4 (96.5-99.2) 493 58,388
$15,000-24,999 12 1.4 ( 0.7- 2.9) 817 98.6 (97.1-99.3) 829 104,099
$25,000-49,999 36 3.2 ( 2.1- 4.7) 1,855 96.8 (95.3-97.9) 1,891 279,658
$50,000-74,999 22 2.7 ( 1.7- 4.3) 1,080 97.3 (95.7-98.3) 1,102 169,292
>=$75,000 31 2.0 ( 1.3- 3.1) 1,787 98.0 (96.9-98.7) 1,818 286,352
Unknown/Refused 8 1.9 ( 0.5- 6.2) 442 98.1 (93.8-99.5) 450 86,850
Percentages are weighted to population characteristics.N = Cell Sample Size, % = Percentage, 95% C.I. = Confidence Interval at 95 percent probability level
Rows with Sample Size less than 50 or containing half-width of 95% CI greater than 10 have been suppressed.
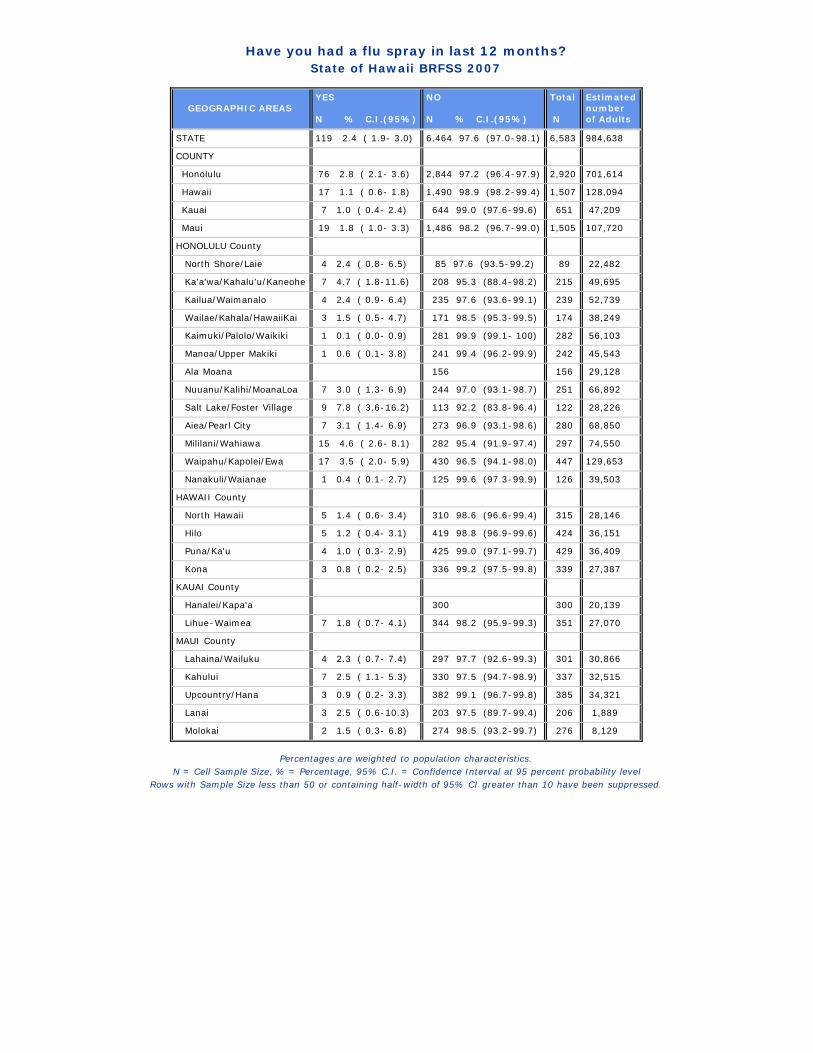
Have you had a flu spray in last 12 months?State of Hawaii BRFSS 2007
GEOGRAPHIC AREAS YES N % C.I.(95%)
NO N % C.I.(95%)
Total N
Estimatednumberof Adults
STATE 119 2.4 ( 1.9- 3.0) 6,464 97.6 (97.0-98.1) 6,583 984,638
COUNTY
Honolulu 76 2.8 ( 2.1- 3.6) 2,844 97.2 (96.4-97.9) 2,920 701,614
Hawaii 17 1.1 ( 0.6- 1.8) 1,490 98.9 (98.2-99.4) 1,507 128,094
Kauai 7 1.0 ( 0.4- 2.4) 644 99.0 (97.6-99.6) 651 47,209
Maui 19 1.8 ( 1.0- 3.3) 1,486 98.2 (96.7-99.0) 1,505 107,720
HONOLULU County
North Shore/Laie 4 2.4 ( 0.8- 6.5) 85 97.6 (93.5-99.2) 89 22,482
Ka'a'wa/Kahalu'u/Kaneohe 7 4.7 ( 1.8-11.6) 208 95.3 (88.4-98.2) 215 49,695
Kailua/Waimanalo 4 2.4 ( 0.9- 6.4) 235 97.6 (93.6-99.1) 239 52,739
Wailae/Kahala/HawaiiKai 3 1.5 ( 0.5- 4.7) 171 98.5 (95.3-99.5) 174 38,249
Kaimuki/Palolo/Waikiki 1 0.1 ( 0.0- 0.9) 281 99.9 (99.1- 100) 282 56,103
Manoa/Upper Makiki 1 0.6 ( 0.1- 3.8) 241 99.4 (96.2-99.9) 242 45,543
Ala Moana 156 156 29,128
Nuuanu/Kalihi/MoanaLoa 7 3.0 ( 1.3- 6.9) 244 97.0 (93.1-98.7) 251 66,892
Salt Lake/Foster Village 9 7.8 ( 3.6-16.2) 113 92.2 (83.8-96.4) 122 28,226
Aiea/Pearl City 7 3.1 ( 1.4- 6.9) 273 96.9 (93.1-98.6) 280 68,850
Mililani/Wahiawa 15 4.6 ( 2.6- 8.1) 282 95.4 (91.9-97.4) 297 74,550
Waipahu/Kapolei/Ewa 17 3.5 ( 2.0- 5.9) 430 96.5 (94.1-98.0) 447 129,653
Nanakuli/Waianae 1 0.4 ( 0.1- 2.7) 125 99.6 (97.3-99.9) 126 39,503
HAWAII County
North Hawaii 5 1.4 ( 0.6- 3.4) 310 98.6 (96.6-99.4) 315 28,146
Hilo 5 1.2 ( 0.4- 3.1) 419 98.8 (96.9-99.6) 424 36,151
Puna/Ka'u 4 1.0 ( 0.3- 2.9) 425 99.0 (97.1-99.7) 429 36,409
Kona 3 0.8 ( 0.2- 2.5) 336 99.2 (97.5-99.8) 339 27,387
KAUAI County
Hanalei/Kapa'a 300 300 20,139
Lihue-Waimea 7 1.8 ( 0.7- 4.1) 344 98.2 (95.9-99.3) 351 27,070
MAUI County
Lahaina/Wailuku 4 2.3 ( 0.7- 7.4) 297 97.7 (92.6-99.3) 301 30,866
Kahului 7 2.5 ( 1.1- 5.3) 330 97.5 (94.7-98.9) 337 32,515
Upcountry/Hana 3 0.9 ( 0.2- 3.3) 382 99.1 (96.7-99.8) 385 34,321
Lanai 3 2.5 ( 0.6-10.3) 203 97.5 (89.7-99.4) 206 1,889
Molokai 2 1.5 ( 0.3- 6.8) 274 98.5 (93.2-99.7) 276 8,129
Percentages are weighted to population characteristics.N = Cell Sample Size, % = Percentage, 95% C.I. = Confidence Interval at 95 percent probability level
Rows with Sample Size less than 50 or containing half-width of 95% CI greater than 10 have been suppressed.
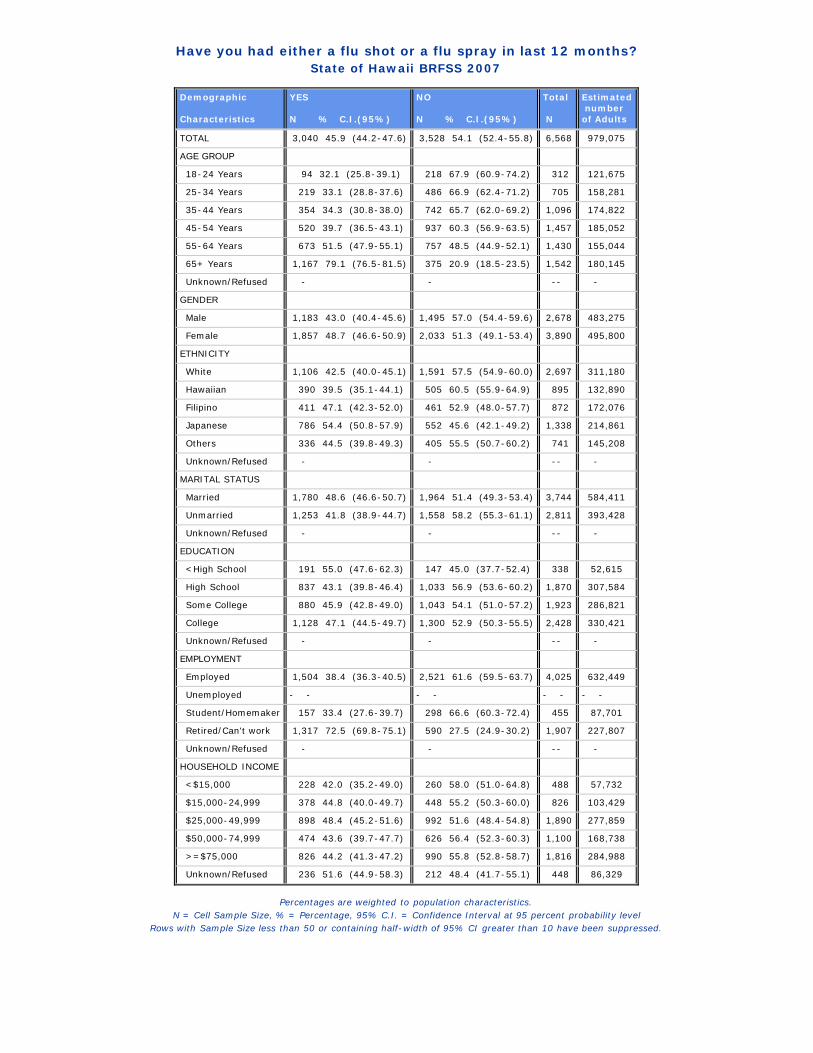
Have you had either a flu shot or a flu spray in last 12 months?State of Hawaii BRFSS 2007
Demographic Characteristics
YES N % C.I.(95%)
NO N % C.I.(95%)
Total N
Estimated numberof Adults
TOTAL 3,040 45.9 (44.2-47.6) 3,528 54.1 (52.4-55.8) 6,568 979,075
AGE GROUP
18-24 Years 94 32.1 (25.8-39.1) 218 67.9 (60.9-74.2) 312 121,675
25-34 Years 219 33.1 (28.8-37.6) 486 66.9 (62.4-71.2) 705 158,281
35-44 Years 354 34.3 (30.8-38.0) 742 65.7 (62.0-69.2) 1,096 174,822
45-54 Years 520 39.7 (36.5-43.1) 937 60.3 (56.9-63.5) 1,457 185,052
55-64 Years 673 51.5 (47.9-55.1) 757 48.5 (44.9-52.1) 1,430 155,044
65+ Years 1,167 79.1 (76.5-81.5) 375 20.9 (18.5-23.5) 1,542 180,145
Unknown/Refused - - -- -
GENDER
Male 1,183 43.0 (40.4-45.6) 1,495 57.0 (54.4-59.6) 2,678 483,275
Female 1,857 48.7 (46.6-50.9) 2,033 51.3 (49.1-53.4) 3,890 495,800
ETHNICITY
White 1,106 42.5 (40.0-45.1) 1,591 57.5 (54.9-60.0) 2,697 311,180
Hawaiian 390 39.5 (35.1-44.1) 505 60.5 (55.9-64.9) 895 132,890
Filipino 411 47.1 (42.3-52.0) 461 52.9 (48.0-57.7) 872 172,076
Japanese 786 54.4 (50.8-57.9) 552 45.6 (42.1-49.2) 1,338 214,861
Others 336 44.5 (39.8-49.3) 405 55.5 (50.7-60.2) 741 145,208
Unknown/Refused - - -- -
MARITAL STATUS
Married 1,780 48.6 (46.6-50.7) 1,964 51.4 (49.3-53.4) 3,744 584,411
Unmarried 1,253 41.8 (38.9-44.7) 1,558 58.2 (55.3-61.1) 2,811 393,428
Unknown/Refused - - -- -
EDUCATION
<High School 191 55.0 (47.6-62.3) 147 45.0 (37.7-52.4) 338 52,615
High School 837 43.1 (39.8-46.4) 1,033 56.9 (53.6-60.2) 1,870 307,584
Some College 880 45.9 (42.8-49.0) 1,043 54.1 (51.0-57.2) 1,923 286,821
College 1,128 47.1 (44.5-49.7) 1,300 52.9 (50.3-55.5) 2,428 330,421
Unknown/Refused - - -- -
EMPLOYMENT
Employed 1,504 38.4 (36.3-40.5) 2,521 61.6 (59.5-63.7) 4,025 632,449
Unemployed - - - - - - - -
Student/Homemaker 157 33.4 (27.6-39.7) 298 66.6 (60.3-72.4) 455 87,701
Retired/Can't work 1,317 72.5 (69.8-75.1) 590 27.5 (24.9-30.2) 1,907 227,807
Unknown/Refused - - -- -
HOUSEHOLD INCOME
<$15,000 228 42.0 (35.2-49.0) 260 58.0 (51.0-64.8) 488 57,732
$15,000-24,999 378 44.8 (40.0-49.7) 448 55.2 (50.3-60.0) 826 103,429
$25,000-49,999 898 48.4 (45.2-51.6) 992 51.6 (48.4-54.8) 1,890 277,859
$50,000-74,999 474 43.6 (39.7-47.7) 626 56.4 (52.3-60.3) 1,100 168,738
>=$75,000 826 44.2 (41.3-47.2) 990 55.8 (52.8-58.7) 1,816 284,988
Unknown/Refused 236 51.6 (44.9-58.3) 212 48.4 (41.7-55.1) 448 86,329
Percentages are weighted to population characteristics.N = Cell Sample Size, % = Percentage, 95% C.I. = Confidence Interval at 95 percent probability level
Rows with Sample Size less than 50 or containing half-width of 95% CI greater than 10 have been suppressed.

Have you had either a flu shot or a flu spray in last 12 months?State of Hawaii BRFSS 2007
GEOGRAPHIC AREAS YES N % C.I.(95%)
NO N % C.I.(95%)
Total N
Estimatednumberof Adults
STATE 3,040 45.9 (44.2-47.6) 3,528 54.1 (52.4-55.8) 6,568 979,075
COUNTY
Honolulu 1,507 48.5 (46.3-50.7) 1,404 51.5 (49.3-53.7) 2,911 697,207
Hawaii 630 39.1 (36.0-42.2) 875 60.9 (57.8-64.0) 1,505 127,521
Kauai 256 39.0 (34.3-43.8) 394 61.0 (56.2-65.7) 650 47,183
Maui 647 40.0 (36.6-43.6) 855 60.0 (56.4-63.4) 1,502 107,165
HONOLULU County
North Shore/Laie - - - - - - - -
Ka'a'wa/Kahalu'u/Kaneohe 116 53.9 (46.0-61.7) 97 46.1 (38.3-54.0) 213 48,223
Kailua/Waimanalo 127 53.7 (46.1-61.1) 112 46.3 (38.9-53.9) 239 52,739
Wailae/Kahala/HawaiiKai 89 46.7 (38.2-55.4) 86 53.3 (44.6-61.8) 175 38,570
Kaimuki/Palolo/Waikiki 151 50.1 (42.9-57.3) 130 49.9 (42.7-57.1) 281 55,898
Manoa/Upper Makiki 117 44.7 (37.6-52.1) 124 55.3 (47.9-62.4) 241 45,507
Ala Moana 89 52.9 (43.7-62.0) 67 47.1 (38.0-56.3) 156 29,128
Nuuanu/Kalihi/MoanaLoa 123 45.9 (38.2-53.7) 127 54.1 (46.3-61.8) 250 66,424
Salt Lake/Foster Village - - - - - - - -
Aiea/Pearl City 162 50.1 (42.9-57.3) 118 49.9 (42.7-57.1) 280 68,850
Mililani/Wahiawa 156 50.6 (43.9-57.2) 141 49.4 (42.8-56.1) 297 74,550
Waipahu/Kapolei/Ewa 207 42.7 (37.3-48.2) 240 57.3 (51.8-62.7) 447 129,653
Nanakuli/Waianae - - - - - - - -
HAWAII County
North Hawaii 121 38.3 (31.6-45.6) 193 61.7 (54.4-68.4) 314 27,937
Hilo 221 46.0 (40.5-51.7) 204 54.0 (48.3-59.5) 425 36,186
Puna/Ka'u 164 37.8 (32.0-43.9) 262 62.2 (56.1-68.0) 426 35,940
Kona 124 32.4 (26.7-38.6) 216 67.6 (61.4-73.3) 340 27,458
KAUAI County
Hanalei/Kapa'a 103 37.9 (30.9-45.4) 195 62.1 (54.6-69.1) 298 20,036
Lihue-Waimea 153 39.8 (33.7-46.2) 199 60.2 (53.8-66.3) 352 27,147
MAUI County
Lahaina/Wailuku 139 39.4 (32.4-46.8) 161 60.6 (53.2-67.6) 300 30,703
Kahului 153 45.4 (39.0-52.0) 182 54.6 (48.0-61.0) 335 32,157
Upcountry/Hana 136 33.1 (27.6-39.0) 249 66.9 (61.0-72.4) 385 34,313
Lanai 78 36.7 (28.9-45.3) 129 63.3 (54.7-71.1) 207 1,895
Molokai 141 51.4 (44.1-58.8) 134 48.6 (41.2-55.9) 275 8,097
Percentages are weighted to population characteristics.N = Cell Sample Size, % = Percentage, 95% C.I. = Confidence Interval at 95 percent probability level
Rows with Sample Size less than 50 or containing half-width of 95% CI greater than 10 have been suppressed.
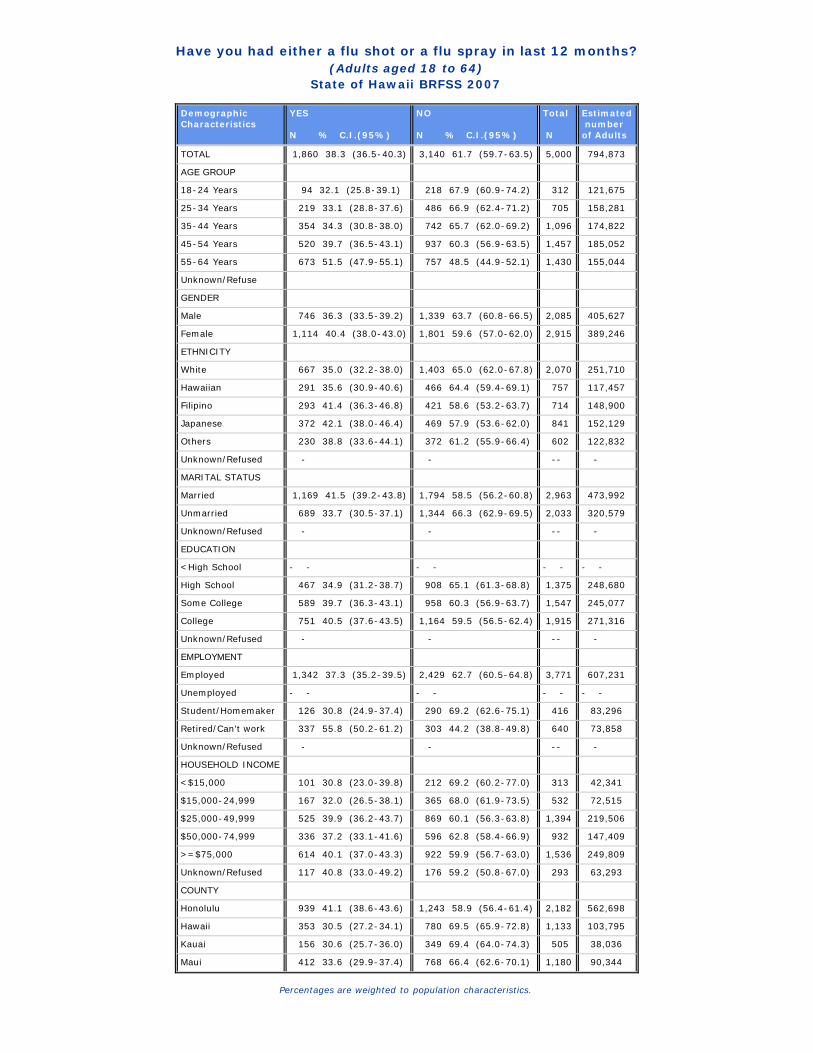
Have you had either a flu shot or a flu spray in last 12 months?(Adults aged 18 to 64)
State of Hawaii BRFSS 2007
DemographicCharacteristics
YES N % C.I.(95%)
NO N % C.I.(95%)
Total N
Estimated numberof Adults
TOTAL 1,860 38.3 (36.5-40.3) 3,140 61.7 (59.7-63.5) 5,000 794,873
AGE GROUP
18-24 Years 94 32.1 (25.8-39.1) 218 67.9 (60.9-74.2) 312 121,675
25-34 Years 219 33.1 (28.8-37.6) 486 66.9 (62.4-71.2) 705 158,281
35-44 Years 354 34.3 (30.8-38.0) 742 65.7 (62.0-69.2) 1,096 174,822
45-54 Years 520 39.7 (36.5-43.1) 937 60.3 (56.9-63.5) 1,457 185,052
55-64 Years 673 51.5 (47.9-55.1) 757 48.5 (44.9-52.1) 1,430 155,044
Unknown/Refuse
GENDER
Male 746 36.3 (33.5-39.2) 1,339 63.7 (60.8-66.5) 2,085 405,627
Female 1,114 40.4 (38.0-43.0) 1,801 59.6 (57.0-62.0) 2,915 389,246
ETHNICITY
White 667 35.0 (32.2-38.0) 1,403 65.0 (62.0-67.8) 2,070 251,710
Hawaiian 291 35.6 (30.9-40.6) 466 64.4 (59.4-69.1) 757 117,457
Filipino 293 41.4 (36.3-46.8) 421 58.6 (53.2-63.7) 714 148,900
Japanese 372 42.1 (38.0-46.4) 469 57.9 (53.6-62.0) 841 152,129
Others 230 38.8 (33.6-44.1) 372 61.2 (55.9-66.4) 602 122,832
Unknown/Refused - - -- -
MARITAL STATUS
Married 1,169 41.5 (39.2-43.8) 1,794 58.5 (56.2-60.8) 2,963 473,992
Unmarried 689 33.7 (30.5-37.1) 1,344 66.3 (62.9-69.5) 2,033 320,579
Unknown/Refused - - -- -
EDUCATION
<High School - - - - - - - -
High School 467 34.9 (31.2-38.7) 908 65.1 (61.3-68.8) 1,375 248,680
Some College 589 39.7 (36.3-43.1) 958 60.3 (56.9-63.7) 1,547 245,077
College 751 40.5 (37.6-43.5) 1,164 59.5 (56.5-62.4) 1,915 271,316
Unknown/Refused - - -- -
EMPLOYMENT
Employed 1,342 37.3 (35.2-39.5) 2,429 62.7 (60.5-64.8) 3,771 607,231
Unemployed - - - - - - - -
Student/Homemaker 126 30.8 (24.9-37.4) 290 69.2 (62.6-75.1) 416 83,296
Retired/Can't work 337 55.8 (50.2-61.2) 303 44.2 (38.8-49.8) 640 73,858
Unknown/Refused - - -- -
HOUSEHOLD INCOME
<$15,000 101 30.8 (23.0-39.8) 212 69.2 (60.2-77.0) 313 42,341
$15,000-24,999 167 32.0 (26.5-38.1) 365 68.0 (61.9-73.5) 532 72,515
$25,000-49,999 525 39.9 (36.2-43.7) 869 60.1 (56.3-63.8) 1,394 219,506
$50,000-74,999 336 37.2 (33.1-41.6) 596 62.8 (58.4-66.9) 932 147,409
>=$75,000 614 40.1 (37.0-43.3) 922 59.9 (56.7-63.0) 1,536 249,809
Unknown/Refused 117 40.8 (33.0-49.2) 176 59.2 (50.8-67.0) 293 63,293
COUNTY
Honolulu 939 41.1 (38.6-43.6) 1,243 58.9 (56.4-61.4) 2,182 562,698
Hawaii 353 30.5 (27.2-34.1) 780 69.5 (65.9-72.8) 1,133 103,795
Kauai 156 30.6 (25.7-36.0) 349 69.4 (64.0-74.3) 505 38,036
Maui 412 33.6 (29.9-37.4) 768 66.4 (62.6-70.1) 1,180 90,344
Percentages are weighted to population characteristics.

Have you had either a flu shot or a flu spray in last 12 months?(Adults aged 65 years old and older)
State of Hawaii BRFSS 2007
DemographicCharacteristics
YES N % C.I.(95%)
NO N % C.I.(95%)
Total N
Estimated numberof Adults
TOTAL 1,167 79.1 (76.5-81.5) 375 20.9 (18.5-23.5) 1,542 180,145
GENDER
Male 432 78.8 (74.4-82.5) 149 21.2 (17.5-25.6) 581 75,203
Female 735 79.4 (75.9-82.4) 226 20.6 (17.6-24.1) 961 104,942
ETHNICITY
White 438 75.1 (70.7-79.0) 183 24.9 (21.0-29.3) 621 58,577
Hawaiian - - - - - - - -
Filipino 117 83.6 (75.2-89.5) 40 16.4 (10.5-24.8) 157 23,098
Japanese 410 84.2 (79.9-87.7) 82 15.8 (12.3-20.1) 492 61,939
Others 104 78.2 (68.6-85.6) 30 21.8 (14.4-31.4) 134 21,342
Unknown/Refused - - -- -
MARITAL STATUS
Married 602 79.8 (76.2-83.0) 167 20.2 (17.0-23.8) 769 107,862
Unmarried 561 78.0 (73.9-81.5) 207 22.0 (18.5-26.1) 768 71,805
Unknown/Refused - - -- -
EDUCATION
<High School 139 76.9 (67.3-84.4) 40 23.1 (15.6-32.7) 179 23,857
High School 366 77.6 (72.6-82.0) 124 22.4 (18.0-27.4) 490 58,039
Some College 289 83.8 (79.0-87.6) 81 16.2 (12.4-21.0) 370 40,731
College 371 78.1 (73.5-82.1) 130 21.9 (17.9-26.5) 501 57,354
Unknown/Refused - - -- -
EMPLOYMENT
Employed 153 68.0 (59.8-75.3) 82 32.0 (24.7-40.2) 235 22,110
Unemployed - - -- -
Student/Homemaker - - -- -
Retired/Can't work 977 80.6 (77.7-83.1) 285 19.4 (16.9-22.3) 1,262 153,249
Unknown/Refused - - -- -
HOUSEHOLD INCOME
<$15,000 127 73.4 (63.1-81.6) 47 26.6 (18.4-36.9) 174 15,245
$15,000-24,999 210 75.3 (68.3-81.2) 81 24.7 (18.8-31.7) 291 30,615
$25,000-49,999 371 80.2 (75.7-84.0) 123 19.8 (16.0-24.3) 494 58,008
$50,000-74,999 135 87.8 (81.4-92.2) 30 12.2 ( 7.8-18.6) 165 20,813
>=$75,000 212 74.5 (67.4-80.5) 66 25.5 (19.5-32.6) 278 34,659
Unknown/Refused 112 85.0 (77.3-90.4) 28 15.0 ( 9.6-22.7) 140 20,806
COUNTY
Honolulu 558 80.4 (77.0-83.4) 152 19.6 (16.6-23.0) 710 130,909
Hawaii 276 76.8 (71.8-81.1) 93 23.2 (18.9-28.2) 369 23,518
Kauai 99 74.4 (65.6-81.5) 43 25.6 (18.5-34.4) 142 8,901
Maui 234 74.8 (68.1-80.6) 87 25.2 (19.4-31.9) 321 16,817
Percentages are weighted to population characteristics.N = Cell Sample Size, % = Percentage, 95% C.I. = Confidence Interval at 95 percent probability level
Rows with Sample Size less than 50 or containing half-width of 95% CI greater than 10 have been suppressed.

Have you had a pneumonia shot?State of Hawaii BRFSS 2007
Demographic Characteristics
YES N % C.I.(95%)
NO N % C.I.(95%)
Total N
Estimated numberof Adults
TOTAL 1,738 26.4 (24.9-27.9) 4,237 73.6 (72.1-75.1) 5,975 877,405
AGE GROUP
18-24 Years 50 20.1 (14.3-27.4) 201 79.9 (72.6-85.7) 251 101,577
25-34 Years 86 14.1 (11.0-18.0) 512 85.9 (82.0-89.0) 598 134,808
35-44 Years 102 11.4 ( 9.0-14.3) 872 88.6 (85.7-91.0) 974 154,875
45-54 Years 190 14.1 (11.8-16.8) 1,154 85.9 (83.2-88.2) 1,344 170,770
55-64 Years 303 21.9 (19.1-24.9) 1,017 78.1 (75.1-80.9) 1,320 140,866
65+ Years 1,001 69.4 (66.1-72.4) 464 30.6 (27.6-33.9) 1,465 171,023
Unknown/Refused - - -- -
GENDER
Male 680 25.8 (23.5-28.3) 1,695 74.2 (71.7-76.5) 2,375 427,924
Female 1,058 26.9 (25.0-28.8) 2,542 73.1 (71.2-75.0) 3,600 449,480
ETHNICITY
White 712 27.3 (25.0-29.6) 1,760 72.7 (70.4-75.0) 2,472 279,818
Hawaiian 185 19.9 (16.3-24.1) 612 80.1 (75.9-83.7) 797 115,857
Filipino 179 21.4 (17.6-25.8) 607 78.6 (74.2-82.4) 786 155,819
Japanese 481 34.8 (31.4-38.3) 739 65.2 (61.7-68.6) 1,220 190,956
Others 177 23.8 (20.0-28.0) 499 76.2 (72.0-80.0) 676 132,168
Unknown/Refused - - -- -
MARITAL STATUS
Married 948 26.3 (24.5-28.1) 2,478 73.7 (71.9-75.5) 3,426 528,911
Unmarried 785 26.5 (23.9-29.2) 1,751 73.5 (70.8-76.1) 2,536 347,257
Unknown/Refused - - -- -
EDUCATION
<High School 120 32.9 (26.5-40.0) 190 67.1 (60.0-73.5) 310 46,781
High School 506 25.9 (23.0-29.0) 1,188 74.1 (71.0-77.0) 1,694 275,115
Some College 509 27.0 (24.3-29.9) 1,249 73.0 (70.1-75.7) 1,758 258,201
College 602 25.3 (23.0-27.6) 1,604 74.7 (72.4-77.0) 2,206 296,007
Unknown/Refused - - -- -
EMPLOYMENT
Employed 590 16.1 (14.4-17.9) 3,016 83.9 (82.1-85.6) 3,606 559,219
Unemployed 27 16.8 ( 9.8-27.3) 131 83.2 (72.7-90.2) 158 27,341
Student/Homemaker 75 16.6 (12.5-21.7) 333 83.4 (78.3-87.5) 408 75,996
Retired/Can't work 1,044 57.8 (54.7-60.9) 754 42.2 (39.1-45.3) 1,798 214,377
Unknown/Refused - - -- -
HOUSEHOLD INCOME
<$15,000 151 25.4 (20.4-31.1) 292 74.6 (68.9-79.6) 443 51,578
$15,000-24,999 262 30.7 (26.3-35.4) 502 69.3 (64.6-73.7) 764 96,228
$25,000-49,999 548 31.5 (28.5-34.6) 1,164 68.5 (65.4-71.5) 1,712 244,888
$50,000-74,999 259 21.9 (18.8-25.4) 753 78.1 (74.6-81.2) 1,012 154,328
>=$75,000 366 20.6 (18.1-23.2) 1,261 79.4 (76.8-81.9) 1,627 250,983
Unknown/Refused 152 32.9 (26.7-39.8) 265 67.1 (60.2-73.3) 417 79,400
Percentages are weighted to population characteristics.N = Cell Sample Size, % = Percentage, 95% C.I. = Confidence Interval at 95 percent probability level
Rows with Sample Size less than 50 or containing half-width of 95% CI greater than 10 have been suppressed.

Have you had a pneumonia shot?State of Hawaii BRFSS 2007
GEOGRAPHIC AREAS YES N % C.I.(95%)
NO N % C.I.(95%)
Total N
Estimatednumberof Adults
STATE 1,738 26.4 (24.9-27.9) 4,237 73.6 (72.1-75.1) 5,975 877,405
COUNTY
Honolulu 794 26.8 (24.8-28.8) 1,816 73.2 (71.2-75.2) 2,610 621,472
Hawaii 405 25.9 (23.3-28.7) 989 74.1 (71.3-76.7) 1,394 116,726
Kauai 161 25.9 (21.9-30.4) 446 74.1 (69.6-78.1) 607 43,344
Maui 378 24.4 (21.2-27.9) 986 75.6 (72.1-78.8) 1,364 95,864
HONOLULU County
North Shore/Laie 27 25.6 (16.8-36.8) 57 74.4 (63.2-83.2) 84 21,410
Ka'a'wa/Kahalu'u/Kaneohe 59 26.2 (19.9-33.6) 137 73.8 (66.4-80.1) 196 45,179
Kailua/Waimanalo 67 31.5 (24.7-39.2) 141 68.5 (60.8-75.3) 208 45,027
Wailae/Kahala/HawaiiKai 50 32.0 (23.7-41.5) 100 68.0 (58.5-76.3) 150 34,136
Kaimuki/Palolo/Waikiki 90 28.5 (22.8-35.0) 170 71.5 (65.0-77.2) 260 51,222
Manoa/Upper Makiki 70 28.6 (22.6-35.5) 149 71.4 (64.5-77.4) 219 39,668
Ala Moana 59 38.7 (30.1-48.1) 75 61.3 (51.9-69.9) 134 24,505
Nuuanu/Kalihi/MoanaLoa 77 29.9 (23.1-37.7) 156 70.1 (62.3-76.9) 233 61,917
Salt Lake/Foster Village 20 15.9 ( 9.6-25.2) 87 84.1 (74.8-90.4) 107 24,830
Aiea/Pearl City 86 30.6 (23.9-38.2) 166 69.4 (61.8-76.1) 252 60,571
Mililani/Wahiawa 65 24.7 (19.2-31.3) 196 75.3 (68.7-80.8) 261 64,640
Waipahu/Kapolei/Ewa 92 20.2 (16.2-25.0) 299 79.8 (75.0-83.8) 391 111,751
Nanakuli/Waianae 32 24.8 (16.2-36.1) 83 75.2 (63.9-83.8) 115 36,616
HAWAII County
North Hawaii 80 25.1 (19.3-32.0) 217 74.9 (68.0-80.7) 297 25,905
Hilo 136 28.9 (24.3-34.1) 263 71.1 (65.9-75.7) 399 34,233
Puna/Ka'u 104 24.4 (19.7-29.9) 277 75.6 (70.1-80.3) 381 31,673
Kona 85 24.3 (19.3-30.1) 232 75.7 (69.9-80.7) 317 24,915
KAUAI County
Hanalei/Kapa'a 72 29.1 (22.7-36.4) 206 70.9 (63.6-77.3) 278 18,393
Lihue-Waimea 89 23.6 (18.8-29.2) 240 76.4 (70.8-81.2) 329 24,950
MAUI County
Lahaina/Wailuku 88 28.9 (21.3-37.9) 186 71.1 (62.1-78.7) 274 27,342
Kahului 87 22.7 (17.9-28.4) 218 77.3 (71.6-82.1) 305 28,925
Upcountry/Hana 86 22.3 (17.6-27.8) 266 77.7 (72.2-82.4) 352 30,527
Lanai 52 24.9 (18.0-33.3) 123 75.1 (66.7-82.0) 175 1,549
Molokai 65 22.5 (17.1-29.1) 193 77.5 (70.9-82.9) 258 7,521
Percentages are weighted to population characteristics.N = Cell Sample Size, % = Percentage, 95% C.I. = Confidence Interval at 95 percent probability level
Rows with Sample Size less than 50 or containing half-width of 95% CI greater than 10 have been suppressed.
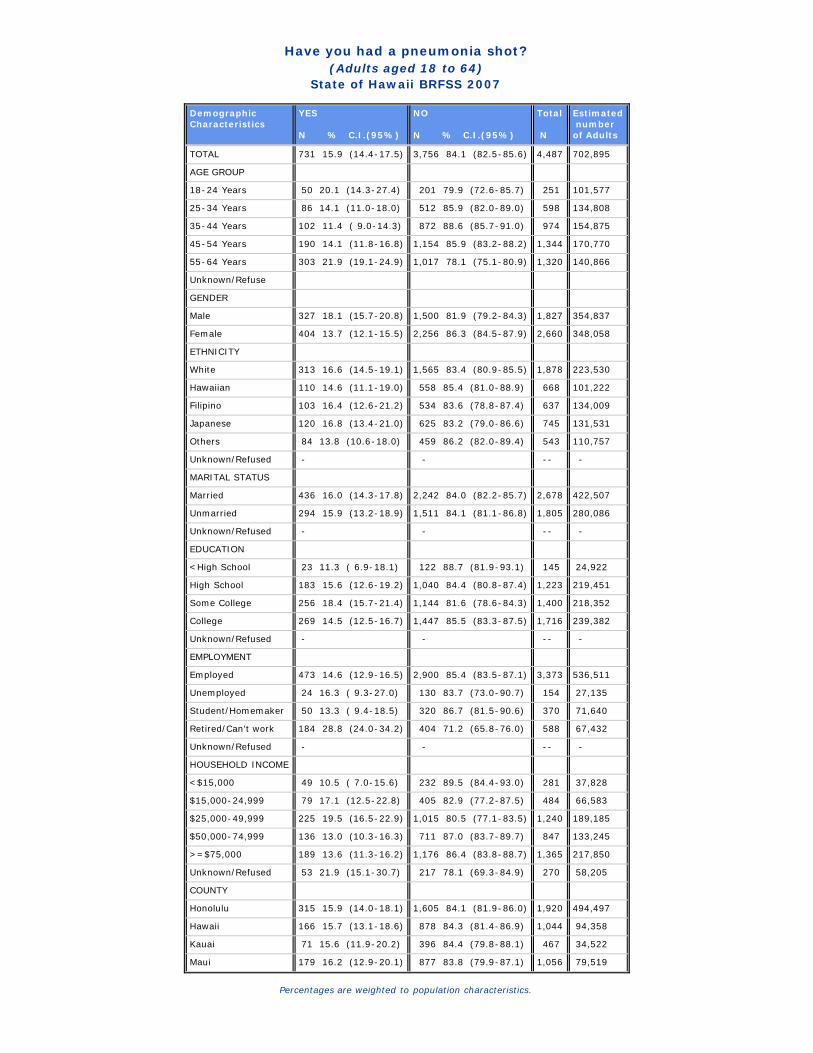
Have you had a pneumonia shot?(Adults aged 18 to 64)
State of Hawaii BRFSS 2007
DemographicCharacteristics
YES N % C.I.(95%)
NO N % C.I.(95%)
Total N
Estimated numberof Adults
TOTAL 731 15.9 (14.4-17.5) 3,756 84.1 (82.5-85.6) 4,487 702,895
AGE GROUP
18-24 Years 50 20.1 (14.3-27.4) 201 79.9 (72.6-85.7) 251 101,577
25-34 Years 86 14.1 (11.0-18.0) 512 85.9 (82.0-89.0) 598 134,808
35-44 Years 102 11.4 ( 9.0-14.3) 872 88.6 (85.7-91.0) 974 154,875
45-54 Years 190 14.1 (11.8-16.8) 1,154 85.9 (83.2-88.2) 1,344 170,770
55-64 Years 303 21.9 (19.1-24.9) 1,017 78.1 (75.1-80.9) 1,320 140,866
Unknown/Refuse
GENDER
Male 327 18.1 (15.7-20.8) 1,500 81.9 (79.2-84.3) 1,827 354,837
Female 404 13.7 (12.1-15.5) 2,256 86.3 (84.5-87.9) 2,660 348,058
ETHNICITY
White 313 16.6 (14.5-19.1) 1,565 83.4 (80.9-85.5) 1,878 223,530
Hawaiian 110 14.6 (11.1-19.0) 558 85.4 (81.0-88.9) 668 101,222
Filipino 103 16.4 (12.6-21.2) 534 83.6 (78.8-87.4) 637 134,009
Japanese 120 16.8 (13.4-21.0) 625 83.2 (79.0-86.6) 745 131,531
Others 84 13.8 (10.6-18.0) 459 86.2 (82.0-89.4) 543 110,757
Unknown/Refused - - -- -
MARITAL STATUS
Married 436 16.0 (14.3-17.8) 2,242 84.0 (82.2-85.7) 2,678 422,507
Unmarried 294 15.9 (13.2-18.9) 1,511 84.1 (81.1-86.8) 1,805 280,086
Unknown/Refused - - -- -
EDUCATION
<High School 23 11.3 ( 6.9-18.1) 122 88.7 (81.9-93.1) 145 24,922
High School 183 15.6 (12.6-19.2) 1,040 84.4 (80.8-87.4) 1,223 219,451
Some College 256 18.4 (15.7-21.4) 1,144 81.6 (78.6-84.3) 1,400 218,352
College 269 14.5 (12.5-16.7) 1,447 85.5 (83.3-87.5) 1,716 239,382
Unknown/Refused - - -- -
EMPLOYMENT
Employed 473 14.6 (12.9-16.5) 2,900 85.4 (83.5-87.1) 3,373 536,511
Unemployed 24 16.3 ( 9.3-27.0) 130 83.7 (73.0-90.7) 154 27,135
Student/Homemaker 50 13.3 ( 9.4-18.5) 320 86.7 (81.5-90.6) 370 71,640
Retired/Can't work 184 28.8 (24.0-34.2) 404 71.2 (65.8-76.0) 588 67,432
Unknown/Refused - - -- -
HOUSEHOLD INCOME
<$15,000 49 10.5 ( 7.0-15.6) 232 89.5 (84.4-93.0) 281 37,828
$15,000-24,999 79 17.1 (12.5-22.8) 405 82.9 (77.2-87.5) 484 66,583
$25,000-49,999 225 19.5 (16.5-22.9) 1,015 80.5 (77.1-83.5) 1,240 189,185
$50,000-74,999 136 13.0 (10.3-16.3) 711 87.0 (83.7-89.7) 847 133,245
>=$75,000 189 13.6 (11.3-16.2) 1,176 86.4 (83.8-88.7) 1,365 217,850
Unknown/Refused 53 21.9 (15.1-30.7) 217 78.1 (69.3-84.9) 270 58,205
COUNTY
Honolulu 315 15.9 (14.0-18.1) 1,605 84.1 (81.9-86.0) 1,920 494,497
Hawaii 166 15.7 (13.1-18.6) 878 84.3 (81.4-86.9) 1,044 94,358
Kauai 71 15.6 (11.9-20.2) 396 84.4 (79.8-88.1) 467 34,522
Maui 179 16.2 (12.9-20.1) 877 83.8 (79.9-87.1) 1,056 79,519
Percentages are weighted to population characteristics.
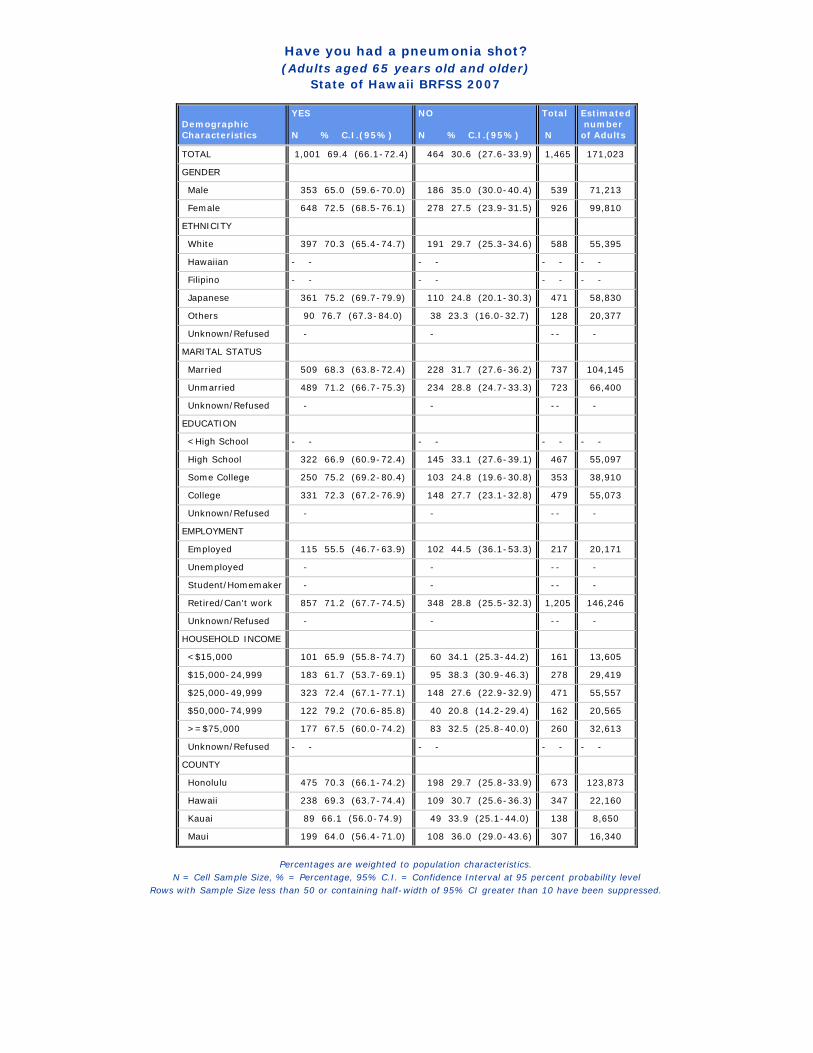
Have you had a pneumonia shot?(Adults aged 65 years old and older)
State of Hawaii BRFSS 2007
DemographicCharacteristics
YES N % C.I.(95%)
NO N % C.I.(95%)
Total N
Estimated numberof Adults
TOTAL 1,001 69.4 (66.1-72.4) 464 30.6 (27.6-33.9) 1,465 171,023
GENDER
Male 353 65.0 (59.6-70.0) 186 35.0 (30.0-40.4) 539 71,213
Female 648 72.5 (68.5-76.1) 278 27.5 (23.9-31.5) 926 99,810
ETHNICITY
White 397 70.3 (65.4-74.7) 191 29.7 (25.3-34.6) 588 55,395
Hawaiian - - - - - - - -
Filipino - - - - - - - -
Japanese 361 75.2 (69.7-79.9) 110 24.8 (20.1-30.3) 471 58,830
Others 90 76.7 (67.3-84.0) 38 23.3 (16.0-32.7) 128 20,377
Unknown/Refused - - -- -
MARITAL STATUS
Married 509 68.3 (63.8-72.4) 228 31.7 (27.6-36.2) 737 104,145
Unmarried 489 71.2 (66.7-75.3) 234 28.8 (24.7-33.3) 723 66,400
Unknown/Refused - - -- -
EDUCATION
<High School - - - - - - - -
High School 322 66.9 (60.9-72.4) 145 33.1 (27.6-39.1) 467 55,097
Some College 250 75.2 (69.2-80.4) 103 24.8 (19.6-30.8) 353 38,910
College 331 72.3 (67.2-76.9) 148 27.7 (23.1-32.8) 479 55,073
Unknown/Refused - - -- -
EMPLOYMENT
Employed 115 55.5 (46.7-63.9) 102 44.5 (36.1-53.3) 217 20,171
Unemployed - - -- -
Student/Homemaker - - -- -
Retired/Can't work 857 71.2 (67.7-74.5) 348 28.8 (25.5-32.3) 1,205 146,246
Unknown/Refused - - -- -
HOUSEHOLD INCOME
<$15,000 101 65.9 (55.8-74.7) 60 34.1 (25.3-44.2) 161 13,605
$15,000-24,999 183 61.7 (53.7-69.1) 95 38.3 (30.9-46.3) 278 29,419
$25,000-49,999 323 72.4 (67.1-77.1) 148 27.6 (22.9-32.9) 471 55,557
$50,000-74,999 122 79.2 (70.6-85.8) 40 20.8 (14.2-29.4) 162 20,565
>=$75,000 177 67.5 (60.0-74.2) 83 32.5 (25.8-40.0) 260 32,613
Unknown/Refused - - - - - - - -
COUNTY
Honolulu 475 70.3 (66.1-74.2) 198 29.7 (25.8-33.9) 673 123,873
Hawaii 238 69.3 (63.7-74.4) 109 30.7 (25.6-36.3) 347 22,160
Kauai 89 66.1 (56.0-74.9) 49 33.9 (25.1-44.0) 138 8,650
Maui 199 64.0 (56.4-71.0) 108 36.0 (29.0-43.6) 307 16,340
Percentages are weighted to population characteristics.N = Cell Sample Size, % = Percentage, 95% C.I. = Confidence Interval at 95 percent probability level
Rows with Sample Size less than 50 or containing half-width of 95% CI greater than 10 have been suppressed.

Have you EVER received the hepatitis B vaccine?State of Hawaii BRFSS 2007
Demographic Characteristics
YES N % C.I.(95%)
NO N % C.I.(95%)
Total N
Estimated numberof Adults
TOTAL 2,114 42.2 (40.3-44.0) 3,756 57.8 (56.0-59.7) 5,870 877,205
AGE GROUP
18-24 Years 217 73.8 (66.8-79.7) 72 26.2 (20.3-33.2) 289 116,558
25-34 Years 354 60.5 (55.3-65.5) 243 39.5 (34.5-44.7) 597 136,059
35-44 Years 426 46.2 (42.1-50.3) 508 53.8 (49.7-57.9) 934 150,884
45-54 Years 503 39.3 (35.9-42.8) 813 60.7 (57.2-64.1) 1,316 167,365
55-64 Years 377 27.6 (24.4-31.0) 936 72.4 (69.0-75.6) 1,313 141,408
65+ Years 228 15.7 (13.5-18.3) 1,172 84.3 (81.7-86.5) 1,400 161,408
Unknown/Refused - - -- -
GENDER
Male 844 42.5 (39.7-45.4) 1,535 57.5 (54.6-60.3) 2,379 434,395
Female 1,270 41.8 (39.5-44.2) 2,221 58.2 (55.8-60.5) 3,491 442,810
ETHNICITY
White 875 43.7 (41.0-46.4) 1,581 56.3 (53.6-59.0) 2,456 282,291
Hawaiian 306 43.1 (38.2-48.3) 490 56.9 (51.7-61.8) 796 119,085
Filipino 318 47.6 (42.4-52.8) 460 52.4 (47.2-57.6) 778 154,145
Japanese 345 33.4 (29.8-37.3) 827 66.6 (62.7-70.2) 1,172 190,713
Others 259 43.7 (38.6-48.9) 389 56.3 (51.1-61.4) 648 128,571
Unknown/Refused - - -- -
MARITAL STATUS
Married 1,260 40.3 (38.1-42.4) 2,078 59.7 (57.6-61.9) 3,338 523,730
Unmarried 848 44.9 (41.7-48.2) 1,672 55.1 (51.8-58.3) 2,520 352,426
Unknown/Refused - - -- -
EDUCATION
<High School 60 30.6 (23.3-39.0) 235 69.4 (61.0-76.7) 295 45,725
High School 529 39.8 (36.3-43.4) 1,154 60.2 (56.6-63.7) 1,683 278,025
Some College 628 44.2 (40.8-47.6) 1,083 55.8 (52.4-59.2) 1,711 260,606
College 893 44.4 (41.6-47.2) 1,281 55.6 (52.8-58.4) 2,174 291,380
Unknown/Refused - - -- -
EMPLOYMENT
Employed 1,476 46.5 (44.2-48.9) 2,100 53.5 (51.1-55.8) 3,576 562,515
Unemployed - - - - - - - -
Student/Homemaker 202 62.5 (56.3-68.3) 205 37.5 (31.7-43.7) 407 81,338
Retired/Can't work 383 22.5 (19.8-25.4) 1,347 77.5 (74.6-80.2) 1,730 205,587
Unknown/Refused - - -- -
HOUSEHOLD INCOME
<$15,000 112 37.5 (30.2-45.5) 331 62.5 (54.5-69.8) 443 52,428
$15,000-24,999 213 35.1 (30.1-40.5) 537 64.9 (59.5-69.9) 750 94,341
$25,000-49,999 579 39.5 (36.1-42.9) 1,118 60.5 (57.1-63.9) 1,697 250,104
$50,000-74,999 384 42.6 (38.4-47.0) 593 57.4 (53.0-61.6) 977 151,604
>=$75,000 683 47.0 (43.8-50.3) 917 53.0 (49.7-56.2) 1,600 249,958
Unknown/Refused 143 45.9 (38.9-53.1) 260 54.1 (46.9-61.1) 403 78,771
Percentages are weighted to population characteristics.N = Cell Sample Size, % = Percentage, 95% C.I. = Confidence Interval at 95 percent probability level
Rows with Sample Size less than 50 or containing half-width of 95% CI greater than 10 have been suppressed.

Have you EVER received the hepatitis B vaccine?State of Hawaii BRFSS 2007
GEOGRAPHIC AREAS YES N % C.I.(95%)
NO N % C.I.(95%)
Total N
Estimatednumberof Adults
STATE 2,114 42.2 (40.3-44.0) 3,756 57.8 (56.0-59.7) 5,870 877,205
COUNTY
Honolulu 1,018 44.1 (41.7-46.5) 1,564 55.9 (53.5-58.3) 2,582 627,075
Hawaii 438 37.1 (33.8-40.5) 932 62.9 (59.5-66.2) 1,370 114,511
Kauai 174 34.0 (29.2-39.2) 411 66.0 (60.8-70.8) 585 41,395
Maui 484 38.9 (35.1-42.7) 849 61.1 (57.3-64.9) 1,333 94,225
HONOLULU County
North Shore/Laie - - - - - - - -
Ka'a'wa/Kahalu'u/Kaneohe 75 43.9 (35.5-52.7) 110 56.1 (47.3-64.5) 185 42,709
Kailua/Waimanalo 76 39.1 (31.6-47.1) 137 60.9 (52.9-68.4) 213 48,296
Wailae/Kahala/HawaiiKai 58 41.2 (32.3-50.7) 99 58.8 (49.3-67.7) 157 35,181
Kaimuki/Palolo/Waikiki 70 31.9 (24.6-40.2) 184 68.1 (59.8-75.4) 254 50,381
Manoa/Upper Makiki 72 37.7 (30.1-45.9) 135 62.3 (54.1-69.9) 207 38,639
Ala Moana 36 26.8 (19.1-36.2) 94 73.2 (63.8-80.9) 130 24,292
Nuuanu/Kalihi/MoanaLoa 85 46.5 (38.3-54.9) 144 53.5 (45.1-61.7) 229 62,167
Salt Lake/Foster Village - - - - - - - -
Aiea/Pearl City 106 45.4 (38.0-53.1) 149 54.6 (46.9-62.0) 255 62,559
Mililani/Wahiawa 122 52.8 (45.7-59.9) 136 47.2 (40.1-54.3) 258 65,856
Waipahu/Kapolei/Ewa 185 48.9 (42.9-55.0) 207 51.1 (45.0-57.1) 392 116,390
Nanakuli/Waianae - - - - - - - -
HAWAII County
North Hawaii 98 41.6 (34.2-49.4) 183 58.4 (50.6-65.8) 281 24,789
Hilo 125 36.6 (30.9-42.7) 254 63.4 (57.3-69.1) 379 31,582
Puna/Ka'u 121 37.4 (31.2-44.1) 267 62.6 (55.9-68.8) 388 32,683
Kona 94 33.0 (26.6-40.0) 228 67.0 (60.0-73.4) 322 25,456
KAUAI County
Hanalei/Kapa'a 70 28.4 (22.1-35.6) 205 71.6 (64.4-77.9) 275 18,020
Lihue-Waimea 104 38.4 (31.7-45.6) 206 61.6 (54.4-68.3) 310 23,375
MAUI County
Lahaina/Wailuku 83 36.2 (28.4-44.7) 177 63.8 (55.3-71.6) 260 26,720
Kahului 93 36.3 (29.8-43.3) 207 63.7 (56.7-70.2) 300 28,368
Upcountry/Hana 119 40.7 (34.3-47.4) 222 59.3 (52.6-65.7) 341 30,055
Lanai 73 40.5 (32.1-49.5) 109 59.5 (50.5-67.9) 182 1,628
Molokai 116 50.7 (42.9-58.4) 134 49.3 (41.6-57.1) 250 7,454
Percentages are weighted to population characteristics.N = Cell Sample Size, % = Percentage, 95% C.I. = Confidence Interval at 95 percent probability level
Rows with Sample Size less than 50 or containing half-width of 95% CI greater than 10 have been suppressed.
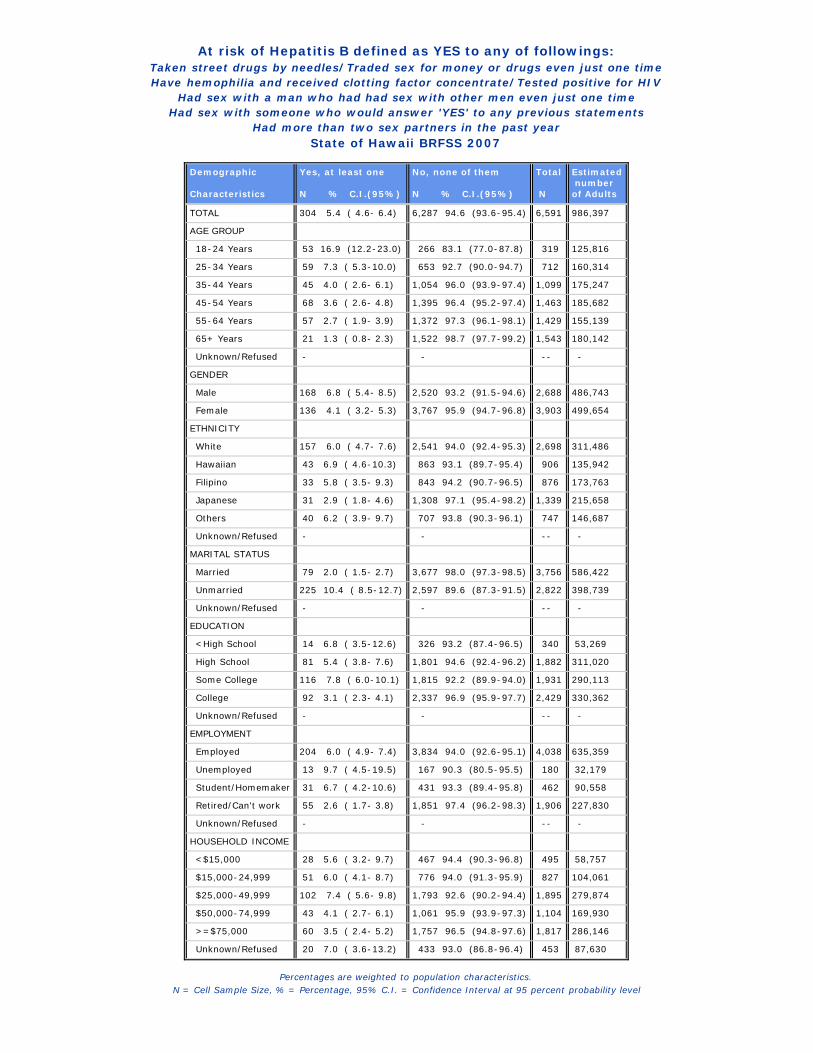
At risk of Hepatitis B defined as YES to any of followings:Taken street drugs by needles/Traded sex for money or drugs even just one timeHave hemophilia and received clotting factor concentrate/Tested positive for HIV
Had sex with a man who had had sex with other men even just one timeHad sex with someone who would answer 'YES' to any previous statements
Had more than two sex partners in the past yearState of Hawaii BRFSS 2007
Demographic Characteristics
Yes, at least one N % C.I.(95%)
No, none of them N % C.I.(95%)
Total N
Estimated numberof Adults
TOTAL 304 5.4 ( 4.6- 6.4) 6,287 94.6 (93.6-95.4) 6,591 986,397
AGE GROUP
18-24 Years 53 16.9 (12.2-23.0) 266 83.1 (77.0-87.8) 319 125,816
25-34 Years 59 7.3 ( 5.3-10.0) 653 92.7 (90.0-94.7) 712 160,314
35-44 Years 45 4.0 ( 2.6- 6.1) 1,054 96.0 (93.9-97.4) 1,099 175,247
45-54 Years 68 3.6 ( 2.6- 4.8) 1,395 96.4 (95.2-97.4) 1,463 185,682
55-64 Years 57 2.7 ( 1.9- 3.9) 1,372 97.3 (96.1-98.1) 1,429 155,139
65+ Years 21 1.3 ( 0.8- 2.3) 1,522 98.7 (97.7-99.2) 1,543 180,142
Unknown/Refused - - -- -
GENDER
Male 168 6.8 ( 5.4- 8.5) 2,520 93.2 (91.5-94.6) 2,688 486,743
Female 136 4.1 ( 3.2- 5.3) 3,767 95.9 (94.7-96.8) 3,903 499,654
ETHNICITY
White 157 6.0 ( 4.7- 7.6) 2,541 94.0 (92.4-95.3) 2,698 311,486
Hawaiian 43 6.9 ( 4.6-10.3) 863 93.1 (89.7-95.4) 906 135,942
Filipino 33 5.8 ( 3.5- 9.3) 843 94.2 (90.7-96.5) 876 173,763
Japanese 31 2.9 ( 1.8- 4.6) 1,308 97.1 (95.4-98.2) 1,339 215,658
Others 40 6.2 ( 3.9- 9.7) 707 93.8 (90.3-96.1) 747 146,687
Unknown/Refused - - -- -
MARITAL STATUS
Married 79 2.0 ( 1.5- 2.7) 3,677 98.0 (97.3-98.5) 3,756 586,422
Unmarried 225 10.4 ( 8.5-12.7) 2,597 89.6 (87.3-91.5) 2,822 398,739
Unknown/Refused - - -- -
EDUCATION
<High School 14 6.8 ( 3.5-12.6) 326 93.2 (87.4-96.5) 340 53,269
High School 81 5.4 ( 3.8- 7.6) 1,801 94.6 (92.4-96.2) 1,882 311,020
Some College 116 7.8 ( 6.0-10.1) 1,815 92.2 (89.9-94.0) 1,931 290,113
College 92 3.1 ( 2.3- 4.1) 2,337 96.9 (95.9-97.7) 2,429 330,362
Unknown/Refused - - -- -
EMPLOYMENT
Employed 204 6.0 ( 4.9- 7.4) 3,834 94.0 (92.6-95.1) 4,038 635,359
Unemployed 13 9.7 ( 4.5-19.5) 167 90.3 (80.5-95.5) 180 32,179
Student/Homemaker 31 6.7 ( 4.2-10.6) 431 93.3 (89.4-95.8) 462 90,558
Retired/Can't work 55 2.6 ( 1.7- 3.8) 1,851 97.4 (96.2-98.3) 1,906 227,830
Unknown/Refused - - -- -
HOUSEHOLD INCOME
<$15,000 28 5.6 ( 3.2- 9.7) 467 94.4 (90.3-96.8) 495 58,757
$15,000-24,999 51 6.0 ( 4.1- 8.7) 776 94.0 (91.3-95.9) 827 104,061
$25,000-49,999 102 7.4 ( 5.6- 9.8) 1,793 92.6 (90.2-94.4) 1,895 279,874
$50,000-74,999 43 4.1 ( 2.7- 6.1) 1,061 95.9 (93.9-97.3) 1,104 169,930
>=$75,000 60 3.5 ( 2.4- 5.2) 1,757 96.5 (94.8-97.6) 1,817 286,146
Unknown/Refused 20 7.0 ( 3.6-13.2) 433 93.0 (86.8-96.4) 453 87,630
Percentages are weighted to population characteristics.N = Cell Sample Size, % = Percentage, 95% C.I. = Confidence Interval at 95 percent probability level
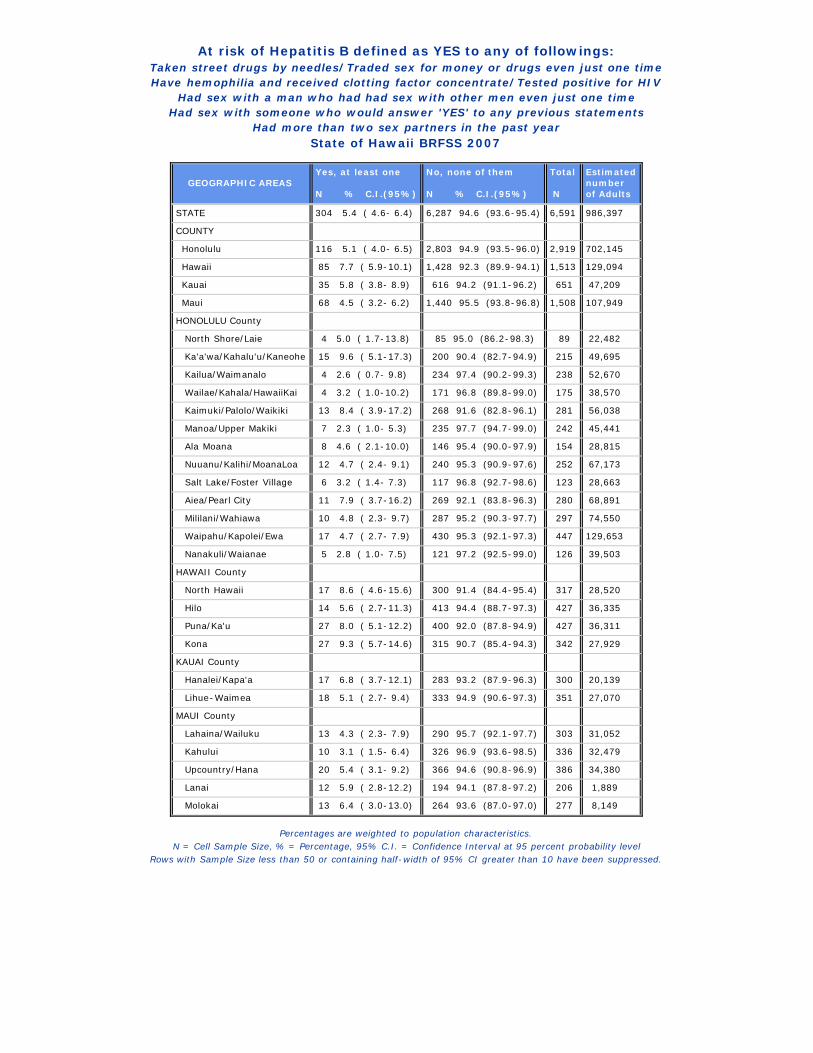
At risk of Hepatitis B defined as YES to any of followings:Taken street drugs by needles/Traded sex for money or drugs even just one timeHave hemophilia and received clotting factor concentrate/Tested positive for HIV
Had sex with a man who had had sex with other men even just one timeHad sex with someone who would answer 'YES' to any previous statements
Had more than two sex partners in the past yearState of Hawaii BRFSS 2007
GEOGRAPHIC AREAS Yes, at least one N % C.I.(95%)
No, none of them N % C.I.(95%)
Total N
Estimatednumberof Adults
STATE 304 5.4 ( 4.6- 6.4) 6,287 94.6 (93.6-95.4) 6,591 986,397
COUNTY
Honolulu 116 5.1 ( 4.0- 6.5) 2,803 94.9 (93.5-96.0) 2,919 702,145
Hawaii 85 7.7 ( 5.9-10.1) 1,428 92.3 (89.9-94.1) 1,513 129,094
Kauai 35 5.8 ( 3.8- 8.9) 616 94.2 (91.1-96.2) 651 47,209
Maui 68 4.5 ( 3.2- 6.2) 1,440 95.5 (93.8-96.8) 1,508 107,949
HONOLULU County
North Shore/Laie 4 5.0 ( 1.7-13.8) 85 95.0 (86.2-98.3) 89 22,482
Ka'a'wa/Kahalu'u/Kaneohe 15 9.6 ( 5.1-17.3) 200 90.4 (82.7-94.9) 215 49,695
Kailua/Waimanalo 4 2.6 ( 0.7- 9.8) 234 97.4 (90.2-99.3) 238 52,670
Wailae/Kahala/HawaiiKai 4 3.2 ( 1.0-10.2) 171 96.8 (89.8-99.0) 175 38,570
Kaimuki/Palolo/Waikiki 13 8.4 ( 3.9-17.2) 268 91.6 (82.8-96.1) 281 56,038
Manoa/Upper Makiki 7 2.3 ( 1.0- 5.3) 235 97.7 (94.7-99.0) 242 45,441
Ala Moana 8 4.6 ( 2.1-10.0) 146 95.4 (90.0-97.9) 154 28,815
Nuuanu/Kalihi/MoanaLoa 12 4.7 ( 2.4- 9.1) 240 95.3 (90.9-97.6) 252 67,173
Salt Lake/Foster Village 6 3.2 ( 1.4- 7.3) 117 96.8 (92.7-98.6) 123 28,663
Aiea/Pearl City 11 7.9 ( 3.7-16.2) 269 92.1 (83.8-96.3) 280 68,891
Mililani/Wahiawa 10 4.8 ( 2.3- 9.7) 287 95.2 (90.3-97.7) 297 74,550
Waipahu/Kapolei/Ewa 17 4.7 ( 2.7- 7.9) 430 95.3 (92.1-97.3) 447 129,653
Nanakuli/Waianae 5 2.8 ( 1.0- 7.5) 121 97.2 (92.5-99.0) 126 39,503
HAWAII County
North Hawaii 17 8.6 ( 4.6-15.6) 300 91.4 (84.4-95.4) 317 28,520
Hilo 14 5.6 ( 2.7-11.3) 413 94.4 (88.7-97.3) 427 36,335
Puna/Ka'u 27 8.0 ( 5.1-12.2) 400 92.0 (87.8-94.9) 427 36,311
Kona 27 9.3 ( 5.7-14.6) 315 90.7 (85.4-94.3) 342 27,929
KAUAI County
Hanalei/Kapa'a 17 6.8 ( 3.7-12.1) 283 93.2 (87.9-96.3) 300 20,139
Lihue-Waimea 18 5.1 ( 2.7- 9.4) 333 94.9 (90.6-97.3) 351 27,070
MAUI County
Lahaina/Wailuku 13 4.3 ( 2.3- 7.9) 290 95.7 (92.1-97.7) 303 31,052
Kahului 10 3.1 ( 1.5- 6.4) 326 96.9 (93.6-98.5) 336 32,479
Upcountry/Hana 20 5.4 ( 3.1- 9.2) 366 94.6 (90.8-96.9) 386 34,380
Lanai 12 5.9 ( 2.8-12.2) 194 94.1 (87.8-97.2) 206 1,889
Molokai 13 6.4 ( 3.0-13.0) 264 93.6 (87.0-97.0) 277 8,149
Percentages are weighted to population characteristics.N = Cell Sample Size, % = Percentage, 95% C.I. = Confidence Interval at 95 percent probability level
Rows with Sample Size less than 50 or containing half-width of 95% CI greater than 10 have been suppressed.

CHRONIC HEALTH CONDITION
To gather information about Chronic Health Conditions among Hawaii population, these following questions were asked.
Cardiovascular diseases
Has a doctor, nurse, or other health professional EVER told you that you had …?
• a heart attack also called a myocardial infarction • angina or coronary heart disease • a stroke
Hypertension
• Have you EVER been told by a doctor, nurse, or other health professional that you have high bloodpressure?
• Are you currently taking medicine for your high blood pressure?
Blood cholesterol
Blood cholesterol is a fatty substance found in the blood.
• Have you EVER had your blood cholesterol checked?
• About how long has it been since you had your last blood cholesterol checked? 1. Within a past year (anytime less than 12 months ago) 2. Within the past 2 years (1 year but less than 2 years ago) 3. Within the past 5 years (2 year but less than 5 years ago) 4. 5 or more years ago
• Have you EVER been told by a doctor, nurse, or other health professional that your
blood cholesterol is high?
Asthma
For adults
A./ Has a doctor, nurse, or other health professional EVER told you had asthma?
B./ Do you still have asthma?

For children
If the residence of respondent has children, a random child was selected. Then, following questions were asked in addition with questions about the child’s age, gender and ethnicity. If there was only one child, then the questions were asked about that child.
A./ Has a doctor, nurse or other health professional EVER said that the child has asthma?
B./ Does the child still have asthma?
Diabetes
A./ Has a doctor, nurse, or other health professional EVER told you that you have diabetes?
If “Yes” and respondent is female, ask: “Was this only when you were pregnant?”
If “No” or female respondents who only had diabetes during pregnancy, the next two questions were asked,
Adults who were told they had diabetes were asked the following questions
• How old were you when you were told you have diabetes?
• Are you now taking insulin?
• About how often do you check your blood for glucose or sugar? Include times when checked by a family member or friend, but do NOT include times when checked by a health professional
• About how often do you check your feet for any sores or irritations? Include times
when checked by a family member or friend, but do NOT include times when checked by a health professional.
• About how many times in the past 12 months have you seen a doctor, nurse, or
other health professional for your diabetes?
• A test for "A one C" measures the average level of blood sugar over the past three months. About how many times in the past 12 months has a doctor, nurse, or other
• health professional checked you for "A one C"?
• About how many times in the past 12 months has a health professional checked your feet for any sores or irritations?

• When was the last time you had an eye exam in which the pupils were dilated? This would have made you temporarily sensitive to bright light.
• Has a doctor ever told you that diabetes has affected your eyes or that you had
retinopathy? • Have you ever taken a course or class in how to manage your diabetes yourself?
Arthritis
There are some questions about to the joints in the body but not include the back or the neck.
• During the past 30 days, have you had symptoms of pain, aching, or stiffness in or around a joint?
• Did your joint symptoms first begin more than 3 months ago?
• Have you ever seen a doctor or other health professional for these joint symptoms?
• Have you ever been told by a doctor or other health professional that you have some
form of arthritis, rheumatoid arthritis, gout, lupus, or fibromyalgia?
Arthritis diagnoses include:
rheumatism, polymyalgia rheumatica
osteoarthritis (not osteoporosis)
tendonitis, bursitis, bunion, tennis elbow
carpal tunnel syndrome, tarsal tunnel syndrome
joint infection, Reiter’s syndrome
ankylosing spondylitis; spondylosis
rotator cuff syndrome
connective tissue disease, scleroderma, polymyositis, Raynaud’s syndrome
vasculitis (giant cell arteritis, Henoch-Schonlein purpura, Wegener’s
granulomatosis, polyarteritis nodosa)
• Are you now limited in any way in any of your usual activities because of arthritis or joint
symptoms?

Ever been told by a doctor, nurse, or other health professional that you had a heart attack, also called amyocardial infarction
State of Hawaii BRFSS 2007
Demographic Characteristics
YES N % C.I.(95%)
NO N % C.I.(95%)
Total N
Estimated numberof Adults
TOTAL 271 3.6 ( 3.1- 4.3) 6,307 96.4 (95.7-96.9) 6,578 982,850
AGE GROUP
18-24 Years 1 0.4 ( 0.1- 2.7) 316 99.6 (97.3-99.9) 317 125,023
25-34 Years 710 710 159,502
35-44 Years 9 0.7 ( 0.3- 1.4) 1,090 99.3 (98.6-99.7) 1,099 174,423
45-54 Years 36 1.8 ( 1.2- 2.8) 1,422 98.2 (97.2-98.8) 1,458 184,964
55-64 Years 74 6.1 ( 4.5- 8.3) 1,353 93.9 (91.7-95.5) 1,427 154,799
65+ Years 150 11.8 ( 9.7-14.3) 1,391 88.2 (85.7-90.3) 1,541 180,081
Unknown/Refused - - -- -
GENDER
Male 163 4.7 ( 3.8- 5.8) 2,519 95.3 (94.2-96.2) 2,682 484,459
Female 108 2.6 ( 2.0- 3.3) 3,788 97.4 (96.7-98.0) 3,896 498,391
ETHNICITY
White 122 4.4 ( 3.5- 5.4) 2,574 95.6 (94.6-96.5) 2,696 311,675
Hawaiian 46 3.8 ( 2.5- 5.9) 855 96.2 (94.1-97.5) 901 134,132
Filipino 31 2.7 ( 1.6- 4.4) 843 97.3 (95.6-98.4) 874 173,172
Japanese 51 4.0 ( 2.9- 5.5) 1,285 96.0 (94.5-97.1) 1,336 214,542
Others 21 2.6 ( 1.5- 4.7) 725 97.4 (95.3-98.5) 746 146,468
Unknown/Refused - - -- -
MARITAL STATUS
Married 148 4.1 ( 3.4- 5.1) 3,606 95.9 (94.9-96.6) 3,754 585,364
Unmarried 122 2.9 ( 2.3- 3.7) 2,689 97.1 (96.3-97.7) 2,811 396,250
Unknown/Refused - - -- -
EDUCATION
<High School 29 7.8 ( 4.8-12.4) 313 92.2 (87.6-95.2) 342 53,259
High School 98 3.8 ( 2.9- 5.0) 1,770 96.2 (95.0-97.1) 1,868 307,971
Some College 71 3.5 ( 2.6- 4.7) 1,856 96.5 (95.3-97.4) 1,927 289,156
College 73 3.0 ( 2.3- 4.0) 2,359 97.0 (96.0-97.7) 2,432 330,830
Unknown/Refused - - -- -
EMPLOYMENT
Employed 71 1.4 ( 1.0- 2.0) 3,961 98.6 (98.0-99.0) 4,032 634,050
Unemployed 7 3.1 ( 1.0- 9.0) 171 96.9 (91.0-99.0) 178 31,240
Student/Homemaker 4 0.3 ( 0.1- 1.1) 456 99.7 (98.9-99.9) 460 89,909
Retired/Can't work 189 11.2 ( 9.4-13.4) 1,714 88.8 (86.6-90.6) 1,903 227,180
Unknown/Refused - - -- -
HOUSEHOLD INCOME
<$15,000 42 6.0 ( 4.0- 9.0) 445 94.0 (91.0-96.0) 487 57,780
$15,000-24,999 41 5.1 ( 3.5- 7.3) 787 94.9 (92.7-96.5) 828 104,054
$25,000-49,999 87 3.9 ( 2.9- 5.3) 1,805 96.1 (94.7-97.1) 1,892 278,288
$50,000-74,999 34 3.5 ( 2.2- 5.4) 1,069 96.5 (94.6-97.8) 1,103 169,831
>=$75,000 48 2.6 ( 1.9- 3.7) 1,768 97.4 (96.3-98.1) 1,816 285,483
Unknown/Refused 19 3.2 ( 1.8- 5.5) 433 96.8 (94.5-98.2) 452 87,413
Percentages are weighted to population characteristics.N = Cell Sample Size, % = Percentage, 95% C.I. = Confidence Interval at 95 percent probability level
Rows with Sample Size less than 50 or containing half-width of 95% CI greater than 10 have been suppressed.

Ever been told by a doctor, nurse, or other health professional that you had a heart attack, also called amyocardial infarction
State of Hawaii BRFSS 2007
GEOGRAPHIC AREAS YES N % C.I.(95%)
NO N % C.I.(95%)
Total N
Estimatednumberof Adults
STATE 271 3.6 ( 3.1- 4.3) 6,307 96.4 (95.7-96.9) 6,578 982,850
COUNTY
Honolulu 125 3.8 ( 3.1- 4.6) 2,790 96.2 (95.4-96.9) 2,915 699,250
Hawaii 61 3.6 ( 2.8- 4.8) 1,448 96.4 (95.2-97.2) 1,509 128,738
Kauai 22 3.5 ( 2.2- 5.4) 627 96.5 (94.6-97.8) 649 47,203
Maui 63 2.8 ( 2.0- 4.0) 1,442 97.2 (96.0-98.0) 1,505 107,660
HONOLULU County
North Shore/Laie 7 8.1 ( 3.3-18.8) 82 91.9 (81.2-96.7) 89 22,482
Ka'a'wa/Kahalu'u/Kaneohe 7 1.9 ( 0.8- 4.2) 207 98.1 (95.8-99.2) 214 49,476
Kailua/Waimanalo 21 8.2 ( 5.1-13.0) 217 91.8 (87.0-94.9) 238 52,545
Wailae/Kahala/HawaiiKai 9 6.3 ( 2.7-13.6) 165 93.7 (86.4-97.3) 174 37,669
Kaimuki/Palolo/Waikiki 12 4.3 ( 2.3- 7.6) 270 95.7 (92.4-97.7) 282 56,103
Manoa/Upper Makiki 11 3.9 ( 2.1- 7.3) 232 96.1 (92.7-97.9) 243 45,663
Ala Moana 6 5.9 ( 2.4-13.9) 150 94.1 (86.1-97.6) 156 29,128
Nuuanu/Kalihi/MoanaLoa 13 4.2 ( 2.2- 7.9) 239 95.8 (92.1-97.8) 252 67,173
Salt Lake/Foster Village 3 2.2 ( 0.6- 7.6) 119 97.8 (92.4-99.4) 122 28,365
Aiea/Pearl City 11 2.8 ( 1.4- 5.5) 266 97.2 (94.5-98.6) 277 67,866
Mililani/Wahiawa 6 2.1 ( 0.9- 4.8) 290 97.9 (95.2-99.1) 296 73,896
Waipahu/Kapolei/Ewa 15 2.7 ( 1.5- 4.7) 432 97.3 (95.3-98.5) 447 129,653
Nanakuli/Waianae 4 2.2 ( 0.8- 5.9) 121 97.8 (94.1-99.2) 125 39,230
HAWAII County
North Hawaii 9 2.4 ( 1.2- 4.8) 308 97.6 (95.2-98.8) 317 28,520
Hilo 20 3.7 ( 2.3- 6.0) 406 96.3 (94.0-97.7) 426 36,319
Puna/Ka'u 19 4.0 ( 2.4- 6.3) 407 96.0 (93.7-97.6) 426 36,113
Kona 13 4.4 ( 2.5- 7.8) 327 95.6 (92.2-97.5) 340 27,786
KAUAI County
Hanalei/Kapa'a 6 1.6 ( 0.7- 4.0) 293 98.4 (96.0-99.3) 299 20,112
Lihue-Waimea 16 4.8 ( 2.8- 8.0) 334 95.2 (92.0-97.2) 350 27,091
MAUI County
Lahaina/Wailuku 10 1.6 ( 0.8- 3.2) 292 98.4 (96.8-99.2) 302 31,004
Kahului 14 4.1 ( 2.2- 7.4) 322 95.9 (92.6-97.8) 336 32,466
Upcountry/Hana 12 2.3 ( 1.2- 4.5) 372 97.7 (95.5-98.8) 384 34,157
Lanai 9 2.5 ( 1.3- 4.9) 198 97.5 (95.1-98.7) 207 1,895
Molokai 18 4.4 ( 2.6- 7.3) 258 95.6 (92.7-97.4) 276 8,138
Percentages are weighted to population characteristics.N = Cell Sample Size, % = Percentage, 95% C.I. = Confidence Interval at 95 percent probability level
Rows with Sample Size less than 50 or containing half-width of 95% CI greater than 10 have been suppressed.

Ever been told by a doctor, nurse, or other health professional that you had angina or coronary heartdisease
State of Hawaii BRFSS 2007
Demographic Characteristics
YES N % C.I.(95%)
NO N % C.I.(95%)
Total N
Estimated numberof Adults
TOTAL 241 3.0 ( 2.5- 3.5) 6,307 97.0 (96.5-97.5) 6,548 978,994
AGE GROUP
18-24 Years 2 0.5 ( 0.1- 2.4) 316 99.5 (97.6-99.9) 318 125,677
25-34 Years 2 0.5 ( 0.1- 1.8) 705 99.5 (98.2-99.9) 707 158,162
35-44 Years 10 0.6 ( 0.3- 1.3) 1,087 99.4 (98.7-99.7) 1,097 174,386
45-54 Years 32 1.6 ( 1.0- 2.5) 1,419 98.4 (97.5-99.0) 1,451 183,575
55-64 Years 63 4.6 ( 3.3- 6.3) 1,362 95.4 (93.7-96.7) 1,425 154,888
65+ Years 132 9.4 ( 7.7-11.6) 1,392 90.6 (88.4-92.3) 1,524 178,250
Unknown/Refused - - -- -
GENDER
Male 136 4.0 ( 3.2- 4.9) 2,528 96.0 (95.1-96.8) 2,664 481,952
Female 105 2.0 ( 1.6- 2.6) 3,779 98.0 (97.4-98.4) 3,884 497,042
ETHNICITY
White 98 2.8 ( 2.2- 3.6) 2,591 97.2 (96.4-97.8) 2,689 310,622
Hawaiian 35 2.7 ( 1.8- 4.2) 862 97.3 (95.8-98.2) 897 133,934
Filipino 29 2.3 ( 1.4- 3.8) 837 97.7 (96.2-98.6) 866 171,136
Japanese 51 3.8 ( 2.7- 5.2) 1,277 96.2 (94.8-97.3) 1,328 214,643
Others 27 3.0 ( 1.9- 4.7) 716 97.0 (95.3-98.1) 743 145,799
Unknown/Refused - - -- -
MARITAL STATUS
Married 127 3.3 ( 2.7- 4.1) 3,612 96.7 (95.9-97.3) 3,739 582,406
Unmarried 114 2.5 ( 1.9- 3.2) 2,682 97.5 (96.8-98.1) 2,796 395,352
Unknown/Refused - - -- -
EDUCATION
<High School 19 3.8 ( 2.2- 6.6) 319 96.2 (93.4-97.8) 338 52,948
High School 73 3.0 ( 2.2- 4.1) 1,786 97.0 (95.9-97.8) 1,859 306,394
Some College 72 2.5 ( 1.8- 3.3) 1,846 97.5 (96.7-98.2) 1,918 288,365
College 75 3.2 ( 2.4- 4.2) 2,349 96.8 (95.8-97.6) 2,424 329,653
Unknown/Refused - - -- -
EMPLOYMENT
Employed 62 1.2 ( 0.9- 1.7) 3,962 98.8 (98.3-99.1) 4,024 632,778
Unemployed 8 4.4 ( 1.8-10.5) 166 95.6 (89.5-98.2) 174 30,747
Student/Homemaker 9 1.5 ( 0.7- 3.4) 449 98.5 (96.6-99.3) 458 89,427
Retired/Can't work 162 8.4 ( 6.9-10.2) 1,725 91.6 (89.8-93.1) 1,887 225,571
Unknown/Refused - - -- -
HOUSEHOLD INCOME
<$15,000 37 5.1 ( 3.4- 7.6) 444 94.9 (92.4-96.6) 481 57,622
$15,000-24,999 34 3.5 ( 2.3- 5.3) 790 96.5 (94.7-97.7) 824 103,521
$25,000-49,999 69 2.9 ( 2.2- 3.9) 1,810 97.1 (96.1-97.8) 1,879 275,561
$50,000-74,999 28 2.7 ( 1.7- 4.2) 1,074 97.3 (95.8-98.3) 1,102 169,846
>=$75,000 56 3.0 ( 2.1- 4.2) 1,757 97.0 (95.8-97.9) 1,813 285,454
Unknown/Refused 17 1.9 ( 1.1- 3.3) 432 98.1 (96.7-98.9) 449 86,991
Percentages are weighted to population characteristics.N = Cell Sample Size, % = Percentage, 95% C.I. = Confidence Interval at 95 percent probability level
Rows with Sample Size less than 50 or containing half-width of 95% CI greater than 10 have been suppressed.

Ever been told by a doctor, nurse, or other health professional that you had angina or coronary heartdisease
State of Hawaii BRFSS 2007
GEOGRAPHIC AREAS YES N % C.I.(95%)
NO N % C.I.(95%)
Total N
Estimatednumberof Adults
STATE 241 3.0 ( 2.5- 3.5) 6,307 97.0 (96.5-97.5) 6,548 978,994
COUNTY
Honolulu 100 2.9 ( 2.3- 3.6) 2,802 97.1 (96.4-97.7) 2,902 696,901
Hawaii 60 3.3 ( 2.5- 4.3) 1,438 96.7 (95.7-97.5) 1,498 127,704
Kauai 23 3.6 ( 2.2- 5.6) 627 96.4 (94.4-97.8) 650 47,260
Maui 58 3.0 ( 2.2- 4.2) 1,440 97.0 (95.8-97.8) 1,498 107,129
HONOLULU County
North Shore/Laie 3 2.0 ( 0.6- 6.2) 86 98.0 (93.8-99.4) 89 22,482
Ka'a'wa/Kahalu'u/Kaneohe 7 1.9 ( 0.9- 4.2) 208 98.1 (95.8-99.1) 215 49,695
Kailua/Waimanalo 10 3.4 ( 1.6- 6.9) 227 96.6 (93.1-98.4) 237 52,467
Wailae/Kahala/HawaiiKai 6 3.0 ( 1.2- 7.0) 165 97.0 (93.0-98.8) 171 37,233
Kaimuki/Palolo/Waikiki 12 4.3 ( 2.3- 8.0) 267 95.7 (92.0-97.7) 279 55,693
Manoa/Upper Makiki 9 3.9 ( 1.9- 7.8) 232 96.1 (92.2-98.1) 241 45,202
Ala Moana 3 3.2 ( 0.9-10.3) 151 96.8 (89.7-99.1) 154 28,949
Nuuanu/Kalihi/MoanaLoa 7 1.9 ( 0.8- 4.3) 243 98.1 (95.7-99.2) 250 66,531
Salt Lake/Foster Village 6 4.6 ( 1.9-10.7) 117 95.4 (89.3-98.1) 123 28,663
Aiea/Pearl City 16 4.2 ( 2.4- 7.5) 263 95.8 (92.5-97.6) 279 68,239
Mililani/Wahiawa 4 1.0 ( 0.4- 3.0) 291 99.0 (97.0-99.6) 295 74,049
Waipahu/Kapolei/Ewa 13 2.8 ( 1.6- 5.1) 430 97.2 (94.9-98.4) 443 128,195
Nanakuli/Waianae 4 2.2 ( 0.8- 6.1) 122 97.8 (93.9-99.2) 126 39,503
HAWAII County
North Hawaii 10 1.7 ( 0.9- 3.4) 305 98.3 (96.6-99.1) 315 28,363
Hilo 20 4.0 ( 2.5- 6.2) 400 96.0 (93.8-97.5) 420 35,927
Puna/Ka'u 17 2.9 ( 1.7- 4.8) 405 97.1 (95.2-98.3) 422 35,905
Kona 13 4.6 ( 2.5- 8.1) 328 95.4 (91.9-97.5) 341 27,510
KAUAI County
Hanalei/Kapa'a 10 3.6 ( 1.7- 7.5) 289 96.4 (92.5-98.3) 299 20,125
Lihue-Waimea 13 3.5 ( 2.0- 6.3) 338 96.5 (93.7-98.0) 351 27,135
MAUI County
Lahaina/Wailuku 13 2.2 ( 1.2- 3.9) 288 97.8 (96.1-98.8) 301 30,801
Kahului 13 3.7 ( 2.0- 7.0) 321 96.3 (93.0-98.0) 334 32,178
Upcountry/Hana 14 3.0 ( 1.7- 5.3) 370 97.0 (94.7-98.3) 384 34,163
Lanai 7 3.4 ( 1.3- 8.8) 197 96.6 (91.2-98.7) 204 1,868
Molokai 11 3.3 ( 1.7- 6.5) 264 96.7 (93.5-98.3) 275 8,119
Percentages are weighted to population characteristics.N = Cell Sample Size, % = Percentage, 95% C.I. = Confidence Interval at 95 percent probability level
Rows with Sample Size less than 50 or containing half-width of 95% CI greater than 10 have been suppressed.

Ever been told by a doctor, nurse, or other health professional that you had a strokeState of Hawaii BRFSS 2007
Demographic Characteristics
YES N % C.I.(95%)
NO N % C.I.(95%)
Total N
Estimated numberof Adults
TOTAL 206 2.5 ( 2.1- 3.0) 6,382 97.5 (97.0-97.9) 6,588 983,860
AGE GROUP
18-24 Years 3 1.2 ( 0.3- 3.9) 316 98.8 (96.1-99.7) 319 125,816
25-34 Years 1 0.3 ( 0.0- 1.9) 708 99.7 (98.1- 100) 709 159,083
35-44 Years 3 0.2 ( 0.1- 0.5) 1,096 99.8 (99.5-99.9) 1,099 174,423
45-54 Years 28 1.6 ( 1.0- 2.6) 1,432 98.4 (97.4-99.0) 1,460 185,096
55-64 Years 63 4.6 ( 3.3- 6.3) 1,368 95.4 (93.7-96.7) 1,431 154,908
65+ Years 108 6.9 ( 5.5- 8.6) 1,436 93.1 (91.4-94.5) 1,544 180,478
Unknown/Refused - - -- -
GENDER
Male 82 2.5 ( 1.9- 3.4) 2,604 97.5 (96.6-98.1) 2,686 485,382
Female 124 2.5 ( 2.0- 3.1) 3,778 97.5 (96.9-98.0) 3,902 498,479
ETHNICITY
White 74 2.6 ( 1.9- 3.6) 2,626 97.4 (96.4-98.1) 2,700 311,889
Hawaiian 37 2.5 ( 1.7- 3.8) 866 97.5 (96.2-98.3) 903 134,319
Filipino 16 1.2 ( 0.6- 2.6) 858 98.8 (97.4-99.4) 874 172,987
Japanese 58 3.5 ( 2.6- 4.8) 1,284 96.5 (95.2-97.4) 1,342 215,898
Others 19 2.0 ( 1.1- 3.5) 725 98.0 (96.5-98.9) 744 145,908
Unknown/Refused - - -- -
MARITAL STATUS
Married 94 2.1 ( 1.6- 2.7) 3,661 97.9 (97.3-98.4) 3,755 585,433
Unmarried 112 3.1 ( 2.5- 4.0) 2,708 96.9 (96.0-97.5) 2,820 397,191
Unknown/Refused - - -- -
EDUCATION
<High School 17 3.7 ( 2.1- 6.4) 323 96.3 (93.6-97.9) 340 53,250
High School 83 3.3 ( 2.5- 4.5) 1,794 96.7 (95.5-97.5) 1,877 308,718
Some College 52 2.0 ( 1.4- 2.8) 1,877 98.0 (97.2-98.6) 1,929 289,345
College 54 2.0 ( 1.4- 2.9) 2,379 98.0 (97.1-98.6) 2,433 330,914
Unknown/Refused - - -- -
EMPLOYMENT
Employed 53 1.1 ( 0.8- 1.5) 3,987 98.9 (98.5-99.2) 4,040 635,483
Unemployed 7 5.7 ( 2.0-15.0) 171 94.3 (85.0-98.0) 178 31,085
Student/Homemaker 9 1.1 ( 0.5- 2.7) 449 98.9 (97.3-99.5) 458 89,163
Retired/Can't work 136 6.7 ( 5.4- 8.2) 1,771 93.3 (91.8-94.6) 1,907 227,657
Unknown/Refused - - -- -
HOUSEHOLD INCOME
<$15,000 34 5.2 ( 3.4- 8.0) 459 94.8 (92.0-96.6) 493 58,353
$15,000-24,999 38 4.4 ( 3.0- 6.4) 791 95.6 (93.6-97.0) 829 103,952
$25,000-49,999 63 2.6 ( 1.9- 3.6) 1,827 97.4 (96.4-98.1) 1,890 277,821
$50,000-74,999 19 1.7 ( 0.9- 3.0) 1,085 98.3 (97.0-99.1) 1,104 169,930
>=$75,000 33 1.4 ( 0.9- 2.2) 1,787 98.6 (97.8-99.1) 1,820 286,577
Unknown/Refused 19 3.1 ( 1.6- 6.0) 433 96.9 (94.0-98.4) 452 87,228
Percentages are weighted to population characteristics.N = Cell Sample Size, % = Percentage, 95% C.I. = Confidence Interval at 95 percent probability level
Rows with Sample Size less than 50 or containing half-width of 95% CI greater than 10 have been suppressed.
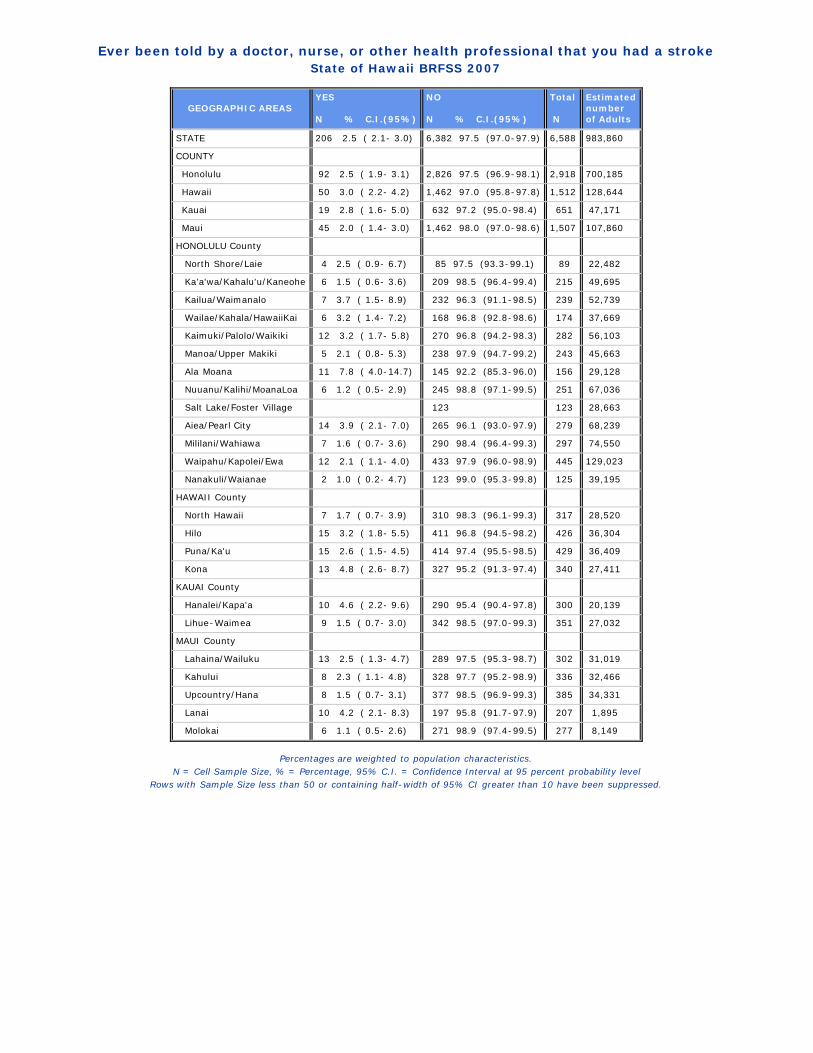
Ever been told by a doctor, nurse, or other health professional that you had a strokeState of Hawaii BRFSS 2007
GEOGRAPHIC AREAS YES N % C.I.(95%)
NO N % C.I.(95%)
Total N
Estimatednumberof Adults
STATE 206 2.5 ( 2.1- 3.0) 6,382 97.5 (97.0-97.9) 6,588 983,860
COUNTY
Honolulu 92 2.5 ( 1.9- 3.1) 2,826 97.5 (96.9-98.1) 2,918 700,185
Hawaii 50 3.0 ( 2.2- 4.2) 1,462 97.0 (95.8-97.8) 1,512 128,644
Kauai 19 2.8 ( 1.6- 5.0) 632 97.2 (95.0-98.4) 651 47,171
Maui 45 2.0 ( 1.4- 3.0) 1,462 98.0 (97.0-98.6) 1,507 107,860
HONOLULU County
North Shore/Laie 4 2.5 ( 0.9- 6.7) 85 97.5 (93.3-99.1) 89 22,482
Ka'a'wa/Kahalu'u/Kaneohe 6 1.5 ( 0.6- 3.6) 209 98.5 (96.4-99.4) 215 49,695
Kailua/Waimanalo 7 3.7 ( 1.5- 8.9) 232 96.3 (91.1-98.5) 239 52,739
Wailae/Kahala/HawaiiKai 6 3.2 ( 1.4- 7.2) 168 96.8 (92.8-98.6) 174 37,669
Kaimuki/Palolo/Waikiki 12 3.2 ( 1.7- 5.8) 270 96.8 (94.2-98.3) 282 56,103
Manoa/Upper Makiki 5 2.1 ( 0.8- 5.3) 238 97.9 (94.7-99.2) 243 45,663
Ala Moana 11 7.8 ( 4.0-14.7) 145 92.2 (85.3-96.0) 156 29,128
Nuuanu/Kalihi/MoanaLoa 6 1.2 ( 0.5- 2.9) 245 98.8 (97.1-99.5) 251 67,036
Salt Lake/Foster Village 123 123 28,663
Aiea/Pearl City 14 3.9 ( 2.1- 7.0) 265 96.1 (93.0-97.9) 279 68,239
Mililani/Wahiawa 7 1.6 ( 0.7- 3.6) 290 98.4 (96.4-99.3) 297 74,550
Waipahu/Kapolei/Ewa 12 2.1 ( 1.1- 4.0) 433 97.9 (96.0-98.9) 445 129,023
Nanakuli/Waianae 2 1.0 ( 0.2- 4.7) 123 99.0 (95.3-99.8) 125 39,195
HAWAII County
North Hawaii 7 1.7 ( 0.7- 3.9) 310 98.3 (96.1-99.3) 317 28,520
Hilo 15 3.2 ( 1.8- 5.5) 411 96.8 (94.5-98.2) 426 36,304
Puna/Ka'u 15 2.6 ( 1.5- 4.5) 414 97.4 (95.5-98.5) 429 36,409
Kona 13 4.8 ( 2.6- 8.7) 327 95.2 (91.3-97.4) 340 27,411
KAUAI County
Hanalei/Kapa'a 10 4.6 ( 2.2- 9.6) 290 95.4 (90.4-97.8) 300 20,139
Lihue-Waimea 9 1.5 ( 0.7- 3.0) 342 98.5 (97.0-99.3) 351 27,032
MAUI County
Lahaina/Wailuku 13 2.5 ( 1.3- 4.7) 289 97.5 (95.3-98.7) 302 31,019
Kahului 8 2.3 ( 1.1- 4.8) 328 97.7 (95.2-98.9) 336 32,466
Upcountry/Hana 8 1.5 ( 0.7- 3.1) 377 98.5 (96.9-99.3) 385 34,331
Lanai 10 4.2 ( 2.1- 8.3) 197 95.8 (91.7-97.9) 207 1,895
Molokai 6 1.1 ( 0.5- 2.6) 271 98.9 (97.4-99.5) 277 8,149
Percentages are weighted to population characteristics.N = Cell Sample Size, % = Percentage, 95% C.I. = Confidence Interval at 95 percent probability level
Rows with Sample Size less than 50 or containing half-width of 95% CI greater than 10 have been suppressed.

Ever been told by a doctor, nurse, or other health professional that you had high blood pressureState of Hawaii BRFSS 2007
Demographic Characteristics
Yes N % C.I.(95%)
Yes,during pregnancy N % C.I.(95%)
No N % C.I.(95%)
Told borderlineor pre-hypertensive N % C.I.(95%)
Total N
Estimated numberof Adults
TOTAL 2,100 28.8 (27.3-30.3) 40 0.7 ( 0.5- 1.1) 4,297 68.1 (66.5-69.6) 157 2.4 ( 1.9- 3.0) 6,594 986,015
AGE GROUP
18-24 Years 18 5.2 ( 2.9- 9.2) 6 1.8 ( 0.6- 5.0) 292 92.6 (88.2-95.4) 2 0.5 ( 0.1- 1.8) 318 125,677
25-34 Years 67 11.6 ( 8.7-15.4) 16 1.7 ( 0.8- 3.3) 618 84.8 (80.8-88.1) 11 1.9 ( 0.9- 3.9) 712 160,314
35-44 Years 178 17.5 (14.7-20.8) 8 0.7 ( 0.3- 1.6) 889 78.8 (75.2-81.9) 25 3.1 ( 1.7- 5.4) 1,100 175,324
45-54 Years 408 29.6 (26.6-32.8) 3 0.2 ( 0.1- 0.8) 1,016 67.8 (64.5-70.9) 34 2.4 ( 1.6- 3.7) 1,461 185,602
55-64 Years 581 44.0 (40.4-47.6) 5 0.4 ( 0.1- 0.9) 806 52.4 (48.8-56.0) 38 3.2 ( 2.1- 4.9) 1,430 154,726
65+ Years 843 57.8 (54.7-61.0) 2 0.1 ( 0.0- 0.3) 656 39.2 (36.1-42.3) 46 2.9 ( 2.0- 4.1) 1,547 180,315
Unknown/Refused - - - - -- -
GENDER
Male 922 29.9 (27.7-32.3) 1,683 66.9 (64.5-69.2) 84 3.2 ( 2.3- 4.2) 2,689 486,336
Female 1,178 27.6 (25.8-29.5) 40 1.4 ( 0.9- 2.3) 2,614 69.3 (67.3-71.2) 73 1.7 ( 1.3- 2.2) 3,905 499,678
ETHNICITY
White 709 23.7 (21.7-25.9) 16 0.6 ( 0.3- 1.0) 1,925 74.1 (71.9-76.2) 51 1.6 ( 1.1- 2.2) 2,701 311,884
Hawaiian 336 31.8 (27.9-36.1) 9 0.9 ( 0.4- 2.0) 541 64.5 (60.1-68.7) 21 2.7 ( 1.4- 5.4) 907 135,949
Filipino 283 28.7 (24.7-33.0) 5 0.9 ( 0.2- 3.1) 563 67.6 (63.1-71.8) 26 2.9 ( 1.7- 4.9) 877 173,840
Japanese 556 37.7 (34.4-41.1) 5 0.5 ( 0.1- 1.7) 738 58.7 (55.3-62.1) 42 3.1 ( 2.2- 4.5) 1,341 215,221
Others 215 24.2 (20.7-28.1) 5 1.1 ( 0.4- 3.3) 506 72.4 (68.3-76.2) 17 2.3 ( 1.2- 4.3) 743 146,261
Unknown/Refused - - - - -- -
MARITAL STATUS
Married 1,173 30.6 (28.7-32.5) 29 0.7 ( 0.4- 1.1) 2,462 65.8 (63.9-67.8) 93 2.9 ( 2.2- 3.8) 3,757 586,330
Unmarried 924 26.1 (23.8-28.5) 11 0.8 ( 0.3- 1.8) 1,825 71.4 (68.9-73.8) 64 1.7 ( 1.2- 2.3) 2,824 398,449
Unknown/Refused - - - - -- -
EDUCATION
<High School 152 40.7 (33.8-48.0) 176 55.2 (47.9-62.3) 14 4.1 ( 2.0- 8.2) 342 53,302
High School 673 29.7 (26.9-32.6) 15 1.1 ( 0.5- 2.4) 1,153 66.8 (63.7-69.7) 41 2.4 ( 1.5- 3.8) 1,882 310,423
Some College 602 28.5 (25.9-31.2) 17 1.0 ( 0.5- 1.9) 1,259 68.3 (65.4-71.0) 51 2.3 ( 1.6- 3.2) 1,929 289,686
College 670 26.2 (24.0-28.6) 8 0.3 ( 0.1- 0.5) 1,703 71.2 (68.8-73.6) 51 2.3 ( 1.6- 3.3) 2,432 330,971
Unknown/Refused - - - - -- -
EMPLOYMENT
Employed 1,002 22.6 (20.9-24.3) 25 0.8 ( 0.4- 1.4) 2,921 74.2 (72.3-76.0) 93 2.5 ( 1.9- 3.3) 4,041 635,689
Unemployed - - - - - - - - - - - -
Student/Homemaker 84 12.2 ( 9.1-16.1) 10 1.6 ( 0.7- 3.4) 365 85.8 (81.7-89.1) 3 0.4 ( 0.1- 1.3) 462 90,558
Retired/Can't work 962 52.5 (49.4-55.5) 3 0.2 ( 0.1- 0.6) 890 44.5 (41.5-47.5) 53 2.9 ( 2.0- 4.1) 1,908 227,449
Unknown/Refused - - - - -- -
HOUSEHOLD INCOME
<$15,000 187 32.9 (26.9-39.4) 3 1.8 ( 0.4- 7.6) 289 63.3 (56.6-69.6) 13 2.0 ( 1.1- 3.9) 492 58,324
$15,000-24,999 297 32.3 (28.1-36.8) 4 0.5 ( 0.2- 1.5) 508 64.6 (60.0-69.0) 22 2.6 ( 1.5- 4.4) 831 104,149
$25,000-49,999 653 30.9 (28.1-33.9) 17 1.0 ( 0.5- 1.9) 1,181 66.3 (63.3-69.2) 42 1.8 ( 1.2- 2.6) 1,893 279,239
$50,000-74,999 333 29.1 (25.6-32.8) 9 0.8 ( 0.4- 1.7) 739 68.0 (64.2-71.6) 23 2.1 ( 1.2- 3.6) 1,104 169,930
>=$75,000 484 25.0 (22.6-27.6) 5 0.2 ( 0.1- 0.4) 1,279 71.2 (68.4-73.8) 51 3.7 ( 2.5- 5.3) 1,819 286,570
Unknown/Refused 146 26.4 (21.5-32.0) 2 1.1 ( 0.2- 6.8) 301 71.4 (65.5-76.6) 6 1.1 ( 0.4- 2.6) 455 87,804
Percentages are weighted to population characteristics.N = Cell Sample Size, % = Percentage, 95% C.I. = Confidence Interval at 95 percent probability level
Rows with Sample Size less than 50 or containing half-width of 95% CI greater than 10 have been suppressed.

Ever been told by a doctor, nurse, or other health professional that you had high blood pressureState of Hawaii BRFSS 2007
GEOGRAPHIC AREAS Yes N % C.I.(95%)
Yes,during pregnancy N % C.I.(95%)
No N % C.I.(95%)
Told borderlineor pre-hypertensive N % C.I.(95%)
Total N
Estimatednumberof Adults
STATE 2,100 28.8 (27.3-30.3) 40 0.7 ( 0.5- 1.1) 4,297 68.1 (66.5-69.6) 157 2.4 ( 1.9- 3.0) 6,594 986,015
COUNTY
Honolulu 944 29.2 (27.3-31.2) 22 0.8 ( 0.5- 1.4) 1,879 67.5 (65.4-69.5) 73 2.5 ( 1.9- 3.3) 2,918 701,637
Hawaii 477 27.5 (24.9-30.2) 9 0.7 ( 0.3- 1.4) 994 69.4 (66.6-72.1) 35 2.5 ( 1.6- 3.7) 1,515 129,108
Kauai 210 30.6 (26.4-35.1) 6 1.2 ( 0.5- 2.9) 422 66.2 (61.6-70.5) 14 2.0 ( 1.1- 3.4) 652 47,286
Maui 469 26.4 (23.4-29.5) 3 0.1 ( 0.0- 0.4) 1,002 71.4 (68.1-74.4) 35 2.2 ( 1.4- 3.3) 1,509 107,984
HONOLULU County
North Shore/Laie - - - - - - - - - - - -
Ka'a'wa/Kahalu'u/Kaneohe 81 35.4 (28.3-43.1) 2 0.6 ( 0.2- 2.6) 125 62.5 (54.7-69.7) 5 1.5 ( 0.6- 3.8) 213 49,171
Kailua/Waimanalo 76 31.7 (25.2-38.9) 5 2.8 ( 1.0- 7.4) 150 62.9 (55.5-69.7) 8 2.7 ( 1.3- 5.5) 239 52,739
Wailae/Kahala/HawaiiKai 46 25.4 (18.4-34.0) 125 73.9 (65.3-80.9) 3 0.7 ( 0.2- 2.3) 174 38,458
Kaimuki/Palolo/Waikiki 104 32.7 (26.7-39.3) 1 0.1 ( 0.0- 0.8) 171 64.9 (58.2-71.1) 6 2.3 ( 1.0- 5.3) 282 56,103
Manoa/Upper Makiki 71 27.8 (21.7-34.9) 168 70.7 (63.6-76.9) 3 1.5 ( 0.4- 5.3) 242 45,590
Ala Moana 59 33.9 (26.1-42.6) 1 0.5 ( 0.1- 3.5) 94 64.8 (56.0-72.7) 2 0.8 ( 0.2- 3.2) 156 29,128
Nuuanu/Kalihi/MoanaLoa 80 24.9 (19.5-31.4) 2 0.6 ( 0.2- 2.6) 157 70.0 (63.1-76.1) 12 4.4 ( 2.2- 8.8) 251 66,839
Salt Lake/Foster Village 32 19.2 (13.0-27.5) 2 0.7 ( 0.2- 2.8) 88 79.7 (71.4-86.0) 1 0.4 ( 0.1- 2.9) 123 28,663
Aiea/Pearl City 103 32.3 (26.2-38.9) 2 0.3 ( 0.1- 1.3) 169 64.5 (57.7-70.8) 7 2.9 ( 1.3- 6.5) 281 69,051
Mililani/Wahiawa 88 28.0 (22.4-34.3) 2 0.7 ( 0.2- 2.7) 199 68.7 (62.3-74.5) 8 2.6 ( 1.3- 5.3) 297 74,550
Waipahu/Kapolei/Ewa 129 28.6 (23.8-33.9) 3 1.0 ( 0.3- 3.7) 300 67.8 (62.4-72.8) 13 2.6 ( 1.4- 4.7) 445 129,357
Nanakuli/Waianae - - - - - - - - - - - -
HAWAII County
North Hawaii 75 20.4 (15.9-25.7) 2 0.5 ( 0.1- 2.0) 231 76.0 (70.2-81.0) 9 3.1 ( 1.3- 7.1) 317 28,520
Hilo 166 36.0 (30.8-41.7) 1 0.2 ( 0.0- 1.6) 251 61.6 (55.9-67.0) 10 2.1 ( 1.0- 4.4) 428 36,390
Puna/Ka'u 141 27.9 (23.3-33.1) 4 1.4 ( 0.5- 3.9) 274 67.7 (62.1-72.7) 10 3.0 ( 1.4- 6.2) 429 36,409
Kona 95 22.9 (18.3-28.2) 2 0.5 ( 0.1- 2.0) 238 75.1 (69.7-79.8) 6 1.5 ( 0.6- 3.7) 341 27,789
KAUAI County
Hanalei/Kapa'a 98 33.2 (26.9-40.3) 2 0.8 ( 0.2- 3.0) 196 64.6 (57.5-71.1) 4 1.4 ( 0.5- 3.7) 300 20,139
Lihue-Waimea 112 28.7 (23.4-34.7) 4 1.5 ( 0.5- 4.5) 226 67.4 (61.2-73.0) 10 2.4 ( 1.2- 4.7) 352 27,147
MAUI County
Lahaina/Wailuku 87 22.2 (17.2-28.2) 213 77.4 (71.4-82.5) 3 0.4 ( 0.1- 1.3) 303 31,052
Kahului 108 28.2 (22.9-34.1) 2 0.4 ( 0.1- 1.4) 220 68.9 (62.8-74.4) 7 2.6 ( 1.1- 5.8) 337 32,515
Upcountry/Hana 97 26.8 (21.4-33.0) 275 69.8 (63.6-75.4) 14 3.4 ( 1.9- 6.2) 386 34,380
Lanai 80 34.6 (27.3-42.5) 120 63.1 (55.1-70.5) 6 2.3 ( 0.9- 5.5) 206 1,889
Molokai 97 31.2 (25.1-37.9) 1 0.2 ( 0.0- 1.7) 174 66.7 (59.8-73.0) 5 1.9 ( 0.7- 5.1) 277 8,149
Percentages are weighted to population characteristics.N = Cell Sample Size, % = Percentage, 95% C.I. = Confidence Interval at 95 percent probability level
Rows with Sample Size less than 50 or containing half-width of 95% CI greater than 10 have been suppressed.

Are you currently taking medicine for your high blood pressure?State of Hawaii BRFSS 2007
Demographic Characteristics
YES N % C.I.(95%)
NO N % C.I.(95%)
Total N
Estimated numberof Adults
TOTAL 1,676 77.4 (74.6-80.0) 420 22.6 (20.0-25.4) 2,096 282,316
AGE GROUP
18-24 Years - - -- -
25-34 Years - - - - - - - -
35-44 Years 104 60.7 (51.1-69.5) 74 39.3 (30.5-48.9) 178 30,691
45-54 Years 296 75.4 (69.6-80.4) 112 24.6 (19.6-30.4) 408 54,869
55-64 Years 476 84.1 (79.6-87.8) 105 15.9 (12.2-20.4) 581 68,017
65+ Years 773 91.8 (88.8-94.1) 68 8.2 ( 5.9-11.2) 841 104,213
Unknown/Refused - - -- -
GENDER
Male 691 70.1 (65.6-74.2) 229 29.9 (25.8-34.4) 920 144,520
Female 985 85.1 (82.1-87.7) 191 14.9 (12.3-17.9) 1,176 137,796
ETHNICITY
White 553 75.0 (70.0-79.3) 154 25.0 (20.7-30.0) 707 73,631
Hawaiian 254 74.4 (67.2-80.6) 82 25.6 (19.4-32.8) 336 43,269
Filipino 227 75.7 (67.1-82.7) 56 24.3 (17.3-32.9) 283 49,805
Japanese 474 81.8 (76.4-86.2) 80 18.2 (13.8-23.6) 554 80,226
Others 167 78.6 (71.0-84.7) 48 21.4 (15.3-29.0) 215 35,358
Unknown/Refused - - -- -
MARITAL STATUS
Married 947 79.2 (75.9-82.2) 224 20.8 (17.8-24.1) 1,171 178,893
Unmarried 726 74.2 (69.1-78.7) 196 25.8 (21.3-30.9) 922 103,150
Unknown/Refused - - -- -
EDUCATION
<High School - - - - - - - -
High School 541 75.9 (70.3-80.7) 130 24.1 (19.3-29.7) 671 91,853
Some College 478 76.5 (71.3-81.0) 123 23.5 (19.0-28.7) 601 82,447
College 536 80.8 (76.4-84.5) 133 19.2 (15.5-23.6) 669 85,941
Unknown/Refused - - -- -
EMPLOYMENT
Employed 728 69.2 (64.9-73.2) 272 30.8 (26.8-35.1) 1,000 142,238
Unemployed - - - - - - - -
Student/Homemaker - - - - - - - -
Retired/Can't work 859 89.7 (86.6-92.1) 102 10.3 ( 7.9-13.4) 961 119,251
Unknown/Refused - - -- -
HOUSEHOLD INCOME
<$15,000 - - - - - - - -
$15,000-24,999 235 76.7 (69.0-83.0) 61 23.3 (17.0-31.0) 296 33,648
$25,000-49,999 516 76.3 (70.8-81.0) 136 23.7 (19.0-29.2) 652 86,107
$50,000-74,999 267 79.0 (72.3-84.4) 66 21.0 (15.6-27.7) 333 49,402
>=$75,000 396 79.1 (73.5-83.7) 87 20.9 (16.3-26.5) 483 70,835
Unknown/Refused 117 80.0 (69.2-87.7) 28 20.0 (12.3-30.8) 145 23,151
COUNTY
Honolulu 770 78.0 (74.3-81.2) 171 22.0 (18.8-25.7) 941 203,956
Hawaii 370 74.7 (69.2-79.5) 106 25.3 (20.5-30.8) 476 35,422
Kauai 168 80.9 (73.5-86.7) 42 19.1 (13.3-26.5) 210 14,477
Maui 368 75.2 (68.5-80.9) 101 24.8 (19.1-31.5) 469 28,460
Percentages are weighted to population characteristics.

Ever had your blood cholesterol checkedState of Hawaii BRFSS 2007
Demographic Characteristics
YES N % C.I.(95%)
NO N % C.I.(95%)
Total N
Estimated numberof Adults
TOTAL 5,492 78.7 (77.0-80.3) 989 21.3 (19.7-23.0) 6,481 960,453
AGE GROUP
18-24 Years 117 39.7 (32.9-46.8) 171 60.3 (53.2-67.1) 288 115,751
25-34 Years 423 60.5 (55.6-65.2) 264 39.5 (34.8-44.4) 687 152,888
35-44 Years 839 77.8 (74.5-80.9) 244 22.2 (19.1-25.5) 1,083 172,984
45-54 Years 1,265 88.4 (86.0-90.5) 176 11.6 ( 9.5-14.0) 1,441 181,919
55-64 Years 1,350 95.6 (93.9-96.9) 72 4.4 ( 3.1- 6.1) 1,422 154,912
65+ Years 1,473 95.8 (94.3-97.0) 61 4.2 ( 3.0- 5.7) 1,534 177,943
Unknown/Refused - - -- -
GENDER
Male 2,198 76.2 (73.5-78.7) 436 23.8 (21.3-26.5) 2,634 471,990
Female 3,294 81.2 (79.1-83.1) 553 18.8 (16.9-20.9) 3,847 488,464
ETHNICITY
White 2,352 83.9 (81.6-86.0) 315 16.1 (14.0-18.4) 2,667 306,333
Hawaiian 683 70.8 (65.9-75.2) 192 29.2 (24.8-34.1) 875 129,033
Filipino 643 65.5 (60.2-70.5) 215 34.5 (29.5-39.8) 858 168,526
Japanese 1,209 88.6 (85.6-91.0) 116 11.4 ( 9.0-14.4) 1,325 210,609
Others 584 75.6 (70.9-79.7) 148 24.4 (20.3-29.1) 732 143,118
Unknown/Refused - - -- -
MARITAL STATUS
Married 3,250 85.7 (84.1-87.2) 466 14.3 (12.8-15.9) 3,716 578,364
Unmarried 2,229 68.1 (64.8-71.2) 523 31.9 (28.8-35.2) 2,752 380,853
Unknown/Refused - - -- -
EDUCATION
<High School 261 74.9 (67.6-81.0) 69 25.1 (19.0-32.4) 330 50,711
High School 1,424 69.4 (65.9-72.7) 412 30.6 (27.3-34.1) 1,836 299,930
Some College 1,607 77.0 (73.6-80.1) 293 23.0 (19.9-26.4) 1,900 282,840
College 2,193 89.5 (87.5-91.2) 213 10.5 ( 8.8-12.5) 2,406 325,339
Unknown/Refused - - -- -
EMPLOYMENT
Employed 3,265 77.5 (75.3-79.5) 692 22.5 (20.5-24.7) 3,957 615,744
Unemployed - - - - - - - -
Student/Homemaker 309 57.6 (51.0-64.0) 142 42.4 (36.0-49.0) 451 87,695
Retired/Can't work 1,797 93.2 (91.3-94.8) 99 6.8 ( 5.2- 8.7) 1,896 225,603
Unknown/Refused - - -- -
HOUSEHOLD INCOME
<$15,000 374 69.8 (62.0-76.6) 100 30.2 (23.4-38.0) 474 56,304
$15,000-24,999 638 70.2 (64.9-75.0) 178 29.8 (25.0-35.1) 816 101,629
$25,000-49,999 1,539 75.5 (72.2-78.6) 328 24.5 (21.4-27.8) 1,867 271,960
$50,000-74,999 932 79.4 (75.4-83.0) 160 20.6 (17.0-24.6) 1,092 167,389
>=$75,000 1,646 88.6 (85.9-90.9) 146 11.4 ( 9.1-14.1) 1,792 278,913
Unknown/Refused 363 71.2 (63.7-77.7) 77 28.8 (22.3-36.3) 440 84,259
Percentages are weighted to population characteristics.N = Cell Sample Size, % = Percentage, 95% C.I. = Confidence Interval at 95 percent probability level
Rows with Sample Size less than 50 or containing half-width of 95% CI greater than 10 have been suppressed.

Ever had your blood cholesterol checkedState of Hawaii BRFSS 2007
GEOGRAPHIC AREAS YES N % C.I.(95%)
NO N % C.I.(95%)
Total N
Estimatednumberof Adults
STATE 5,492 78.7 (77.0-80.3) 989 21.3 (19.7-23.0) 6,481 960,453
COUNTY
Honolulu 2,468 79.4 (77.2-81.5) 402 20.6 (18.5-22.8) 2,870 684,452
Hawaii 1,252 76.8 (73.7-79.7) 240 23.2 (20.3-26.3) 1,492 126,028
Kauai 541 77.1 (72.1-81.5) 105 22.9 (18.5-27.9) 646 46,631
Maui 1,231 77.3 (73.3-80.8) 242 22.7 (19.2-26.7) 1,473 103,342
HONOLULU County
North Shore/Laie - - - - - - - -
Ka'a'wa/Kahalu'u/Kaneohe 187 85.5 (78.9-90.3) 26 14.5 ( 9.7-21.1) 213 49,167
Kailua/Waimanalo 217 86.6 (78.2-92.1) 19 13.4 ( 7.9-21.8) 236 51,890
Wailae/Kahala/HawaiiKai 155 87.9 (79.8-93.0) 15 12.1 ( 7.0-20.2) 170 37,118
Kaimuki/Palolo/Waikiki 248 86.0 (79.6-90.6) 30 14.0 ( 9.4-20.4) 278 54,756
Manoa/Upper Makiki 221 91.7 (86.5-95.0) 17 8.3 ( 5.0-13.5) 238 43,513
Ala Moana 133 82.5 (73.5-88.8) 21 17.5 (11.2-26.5) 154 28,759
Nuuanu/Kalihi/MoanaLoa 193 70.6 (61.8-78.1) 54 29.4 (21.9-38.2) 247 65,784
Salt Lake/Foster Village 99 76.2 (65.3-84.5) 22 23.8 (15.5-34.7) 121 28,212
Aiea/Pearl City 251 82.4 (74.2-88.5) 26 17.6 (11.5-25.8) 277 68,544
Mililani/Wahiawa 240 76.6 (69.7-82.4) 50 23.4 (17.6-30.3) 290 71,806
Waipahu/Kapolei/Ewa 362 74.9 (68.8-80.2) 74 25.1 (19.8-31.2) 436 125,195
Nanakuli/Waianae - - - - - - - -
HAWAII County
North Hawaii 265 77.2 (70.3-82.9) 50 22.8 (17.1-29.7) 315 28,357
Hilo 366 82.3 (76.9-86.6) 55 17.7 (13.4-23.1) 421 35,737
Puna/Ka'u 335 73.5 (67.3-79.0) 82 26.5 (21.0-32.7) 417 34,373
Kona 286 73.5 (65.8-80.0) 53 26.5 (20.0-34.2) 339 27,561
KAUAI County
Hanalei/Kapa'a 245 76.4 (68.8-82.6) 53 23.6 (17.4-31.2) 298 19,947
Lihue-Waimea 296 77.6 (70.7-83.3) 52 22.4 (16.7-29.3) 348 26,684
MAUI County
Lahaina/Wailuku 245 73.1 (63.4-81.0) 50 26.9 (19.0-36.6) 295 29,481
Kahului 278 77.4 (70.7-83.0) 51 22.6 (17.0-29.3) 329 31,358
Upcountry/Hana 325 81.2 (74.4-86.6) 53 18.8 (13.4-25.6) 378 33,016
Lanai 163 74.5 (66.1-81.4) 41 25.5 (18.6-33.9) 204 1,851
Molokai 220 76.3 (68.7-82.6) 47 23.7 (17.4-31.3) 267 7,636
Percentages are weighted to population characteristics.N = Cell Sample Size, % = Percentage, 95% C.I. = Confidence Interval at 95 percent probability level
Rows with Sample Size less than 50 or containing half-width of 95% CI greater than 10 have been suppressed.

When was your last cholesterol checked?State of Hawaii BRFSS 2007
Demographic Characteristics
Within past 5 years N % C.I.(95%)
More than 5 years ago N % C.I.(95%)
Never N % C.I.(95%)
Total N
Estimated numberof Adults
TOTAL 5,197 74.8 (73.1-76.4) 263 3.8 ( 3.3- 4.5) 989 21.4 (19.8-23.1) 6,449 956,275
AGE GROUP
18-24 Years 101 33.7 (27.4-40.7) 14 5.8 ( 3.3-10.0) 171 60.5 (53.3-67.2) 286 115,503
25-34 Years 397 57.2 (52.3-61.9) 24 3.2 ( 2.0- 5.1) 264 39.6 (34.9-44.6) 685 152,469
35-44 Years 767 72.7 (69.2-76.0) 67 5.1 ( 3.8- 6.8) 244 22.2 (19.1-25.6) 1,078 172,547
45-54 Years 1,197 84.9 (82.3-87.2) 60 3.5 ( 2.5- 4.8) 176 11.6 ( 9.5-14.1) 1,433 181,306
55-64 Years 1,271 90.5 (88.2-92.5) 73 5.1 ( 3.7- 7.0) 72 4.4 ( 3.1- 6.1) 1,416 153,933
65+ Years 1,440 94.5 (92.9-95.8) 24 1.3 ( 0.8- 2.1) 61 4.2 ( 3.1- 5.7) 1,525 176,461
Unknown/Refused - - - -- -
GENDER
Male 2,075 72.4 (69.6-75.0) 110 3.8 ( 2.9- 4.8) 436 23.9 (21.3-26.6) 2,621 470,012
Female 3,122 77.1 (75.0-79.1) 153 3.9 ( 3.2- 4.9) 553 18.9 (17.0-21.0) 3,828 486,263
ETHNICITY
White 2,184 78.7 (76.2-81.0) 152 5.1 ( 4.1- 6.4) 315 16.2 (14.1-18.5) 2,651 304,572
Hawaiian 653 67.9 (63.0-72.4) 27 2.8 ( 1.7- 4.8) 192 29.3 (24.8-34.2) 872 128,764
Filipino 629 63.9 (58.6-68.9) 10 1.4 ( 0.6- 3.0) 215 34.7 (29.7-40.0) 854 167,529
Japanese 1,159 84.1 (80.9-86.9) 45 4.5 ( 3.1- 6.4) 116 11.4 ( 9.0-14.4) 1,320 210,021
Others 551 71.3 (66.5-75.7) 29 4.1 ( 2.6- 6.5) 148 24.5 (20.4-29.3) 728 142,555
Unknown/Refused - - - -- -
MARITAL STATUS
Married 3,095 82.1 (80.4-83.7) 141 3.5 ( 2.8- 4.3) 466 14.4 (12.9-16.0) 3,702 576,145
Unmarried 2,089 63.5 (60.3-66.6) 122 4.4 ( 3.3- 5.7) 523 32.1 (29.0-35.3) 2,734 378,893
Unknown/Refused - - - -- -
EDUCATION
<High School 248 71.0 (63.6-77.5) 11 3.6 ( 1.6- 7.9) 69 25.3 (19.1-32.7) 328 50,272
High School 1,353 65.8 (62.2-69.1) 59 3.5 ( 2.4- 5.0) 412 30.8 (27.5-34.3) 1,824 298,029
Some College 1,532 73.8 (70.4-76.9) 67 3.1 ( 2.3- 4.3) 293 23.1 (20.0-26.5) 1,892 281,861
College 2,057 84.6 (82.4-86.5) 126 4.9 ( 3.9- 6.1) 213 10.5 ( 8.8-12.5) 2,396 324,479
Unknown/Refused - - - -- -
EMPLOYMENT
Employed 3,059 73.3 (71.1-75.4) 189 4.1 ( 3.4- 4.9) 692 22.6 (20.6-24.8) 3,940 614,137
Unemployed - - - - - - - - - -
Student/Homemaker 283 51.0 (44.6-57.4) 22 6.3 ( 3.7-10.5) 142 42.7 (36.3-49.4) 447 87,006
Retired/Can't work 1,745 91.2 (89.1-92.9) 42 2.0 ( 1.3- 3.0) 99 6.8 ( 5.3- 8.8) 1,886 224,204
Unknown/Refused - - - -- -
HOUSEHOLD INCOME
<$15,000 359 66.7 (58.9-73.6) 14 3.1 ( 1.3- 6.9) 100 30.3 (23.4-38.1) 473 56,224
$15,000-24,999 599 65.8 (60.5-70.8) 33 4.2 ( 2.4- 7.0) 178 30.0 (25.2-35.3) 810 100,854
$25,000-49,999 1,451 71.3 (68.0-74.4) 81 4.1 ( 3.1- 5.6) 328 24.6 (21.5-27.9) 1,860 271,094
$50,000-74,999 882 75.5 (71.4-79.2) 44 3.9 ( 2.6- 5.7) 160 20.6 (17.1-24.7) 1,086 166,824
>=$75,000 1,568 84.7 (81.9-87.2) 73 3.9 ( 2.9- 5.2) 146 11.4 ( 9.2-14.1) 1,787 277,962
Unknown/Refused 338 67.9 (60.3-74.5) 18 3.0 ( 1.4- 6.3) 77 29.2 (22.6-36.7) 433 83,317
Percentages are weighted to population characteristics.N = Cell Sample Size, % = Percentage, 95% C.I. = Confidence Interval at 95 percent probability level
Rows with Sample Size less than 50 or containing half-width of 95% CI greater than 10 have been suppressed.
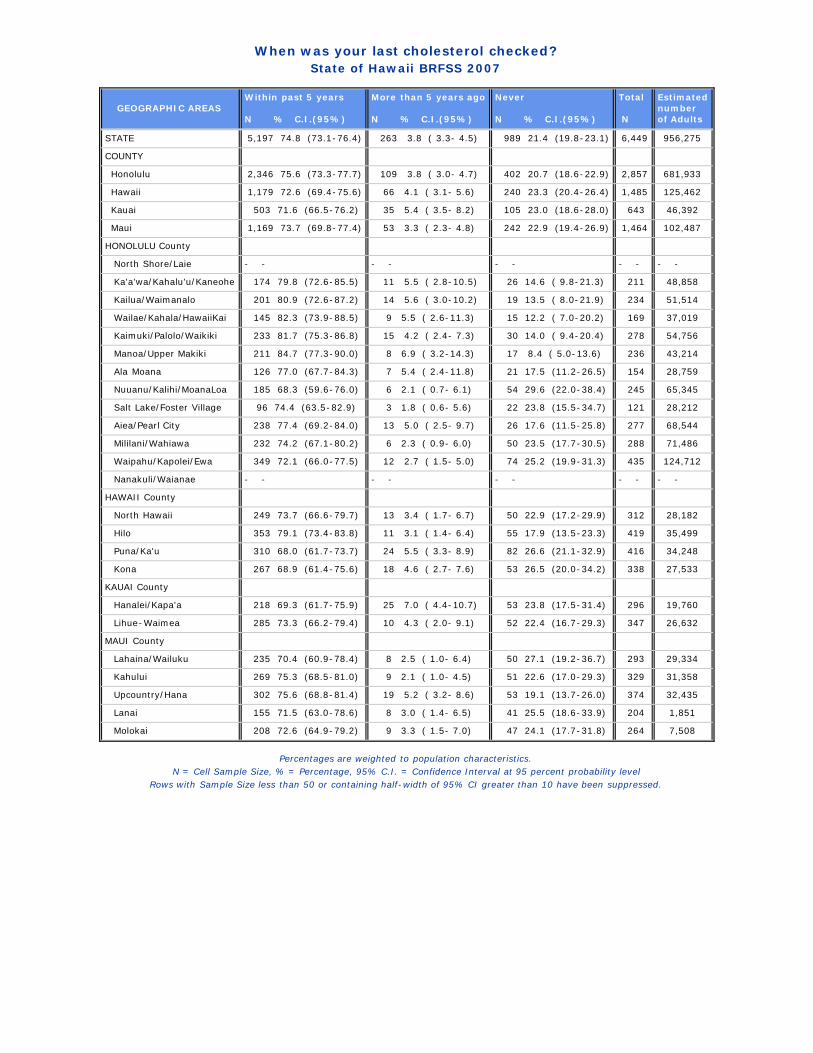
When was your last cholesterol checked?State of Hawaii BRFSS 2007
GEOGRAPHIC AREAS Within past 5 years N % C.I.(95%)
More than 5 years ago N % C.I.(95%)
Never N % C.I.(95%)
Total N
Estimatednumberof Adults
STATE 5,197 74.8 (73.1-76.4) 263 3.8 ( 3.3- 4.5) 989 21.4 (19.8-23.1) 6,449 956,275
COUNTY
Honolulu 2,346 75.6 (73.3-77.7) 109 3.8 ( 3.0- 4.7) 402 20.7 (18.6-22.9) 2,857 681,933
Hawaii 1,179 72.6 (69.4-75.6) 66 4.1 ( 3.1- 5.6) 240 23.3 (20.4-26.4) 1,485 125,462
Kauai 503 71.6 (66.5-76.2) 35 5.4 ( 3.5- 8.2) 105 23.0 (18.6-28.0) 643 46,392
Maui 1,169 73.7 (69.8-77.4) 53 3.3 ( 2.3- 4.8) 242 22.9 (19.4-26.9) 1,464 102,487
HONOLULU County
North Shore/Laie - - - - - - - - - -
Ka'a'wa/Kahalu'u/Kaneohe 174 79.8 (72.6-85.5) 11 5.5 ( 2.8-10.5) 26 14.6 ( 9.8-21.3) 211 48,858
Kailua/Waimanalo 201 80.9 (72.6-87.2) 14 5.6 ( 3.0-10.2) 19 13.5 ( 8.0-21.9) 234 51,514
Wailae/Kahala/HawaiiKai 145 82.3 (73.9-88.5) 9 5.5 ( 2.6-11.3) 15 12.2 ( 7.0-20.2) 169 37,019
Kaimuki/Palolo/Waikiki 233 81.7 (75.3-86.8) 15 4.2 ( 2.4- 7.3) 30 14.0 ( 9.4-20.4) 278 54,756
Manoa/Upper Makiki 211 84.7 (77.3-90.0) 8 6.9 ( 3.2-14.3) 17 8.4 ( 5.0-13.6) 236 43,214
Ala Moana 126 77.0 (67.7-84.3) 7 5.4 ( 2.4-11.8) 21 17.5 (11.2-26.5) 154 28,759
Nuuanu/Kalihi/MoanaLoa 185 68.3 (59.6-76.0) 6 2.1 ( 0.7- 6.1) 54 29.6 (22.0-38.4) 245 65,345
Salt Lake/Foster Village 96 74.4 (63.5-82.9) 3 1.8 ( 0.6- 5.6) 22 23.8 (15.5-34.7) 121 28,212
Aiea/Pearl City 238 77.4 (69.2-84.0) 13 5.0 ( 2.5- 9.7) 26 17.6 (11.5-25.8) 277 68,544
Mililani/Wahiawa 232 74.2 (67.1-80.2) 6 2.3 ( 0.9- 6.0) 50 23.5 (17.7-30.5) 288 71,486
Waipahu/Kapolei/Ewa 349 72.1 (66.0-77.5) 12 2.7 ( 1.5- 5.0) 74 25.2 (19.9-31.3) 435 124,712
Nanakuli/Waianae - - - - - - - - - -
HAWAII County
North Hawaii 249 73.7 (66.6-79.7) 13 3.4 ( 1.7- 6.7) 50 22.9 (17.2-29.9) 312 28,182
Hilo 353 79.1 (73.4-83.8) 11 3.1 ( 1.4- 6.4) 55 17.9 (13.5-23.3) 419 35,499
Puna/Ka'u 310 68.0 (61.7-73.7) 24 5.5 ( 3.3- 8.9) 82 26.6 (21.1-32.9) 416 34,248
Kona 267 68.9 (61.4-75.6) 18 4.6 ( 2.7- 7.6) 53 26.5 (20.0-34.2) 338 27,533
KAUAI County
Hanalei/Kapa'a 218 69.3 (61.7-75.9) 25 7.0 ( 4.4-10.7) 53 23.8 (17.5-31.4) 296 19,760
Lihue-Waimea 285 73.3 (66.2-79.4) 10 4.3 ( 2.0- 9.1) 52 22.4 (16.7-29.3) 347 26,632
MAUI County
Lahaina/Wailuku 235 70.4 (60.9-78.4) 8 2.5 ( 1.0- 6.4) 50 27.1 (19.2-36.7) 293 29,334
Kahului 269 75.3 (68.5-81.0) 9 2.1 ( 1.0- 4.5) 51 22.6 (17.0-29.3) 329 31,358
Upcountry/Hana 302 75.6 (68.8-81.4) 19 5.2 ( 3.2- 8.6) 53 19.1 (13.7-26.0) 374 32,435
Lanai 155 71.5 (63.0-78.6) 8 3.0 ( 1.4- 6.5) 41 25.5 (18.6-33.9) 204 1,851
Molokai 208 72.6 (64.9-79.2) 9 3.3 ( 1.5- 7.0) 47 24.1 (17.7-31.8) 264 7,508
Percentages are weighted to population characteristics.N = Cell Sample Size, % = Percentage, 95% C.I. = Confidence Interval at 95 percent probability level
Rows with Sample Size less than 50 or containing half-width of 95% CI greater than 10 have been suppressed.
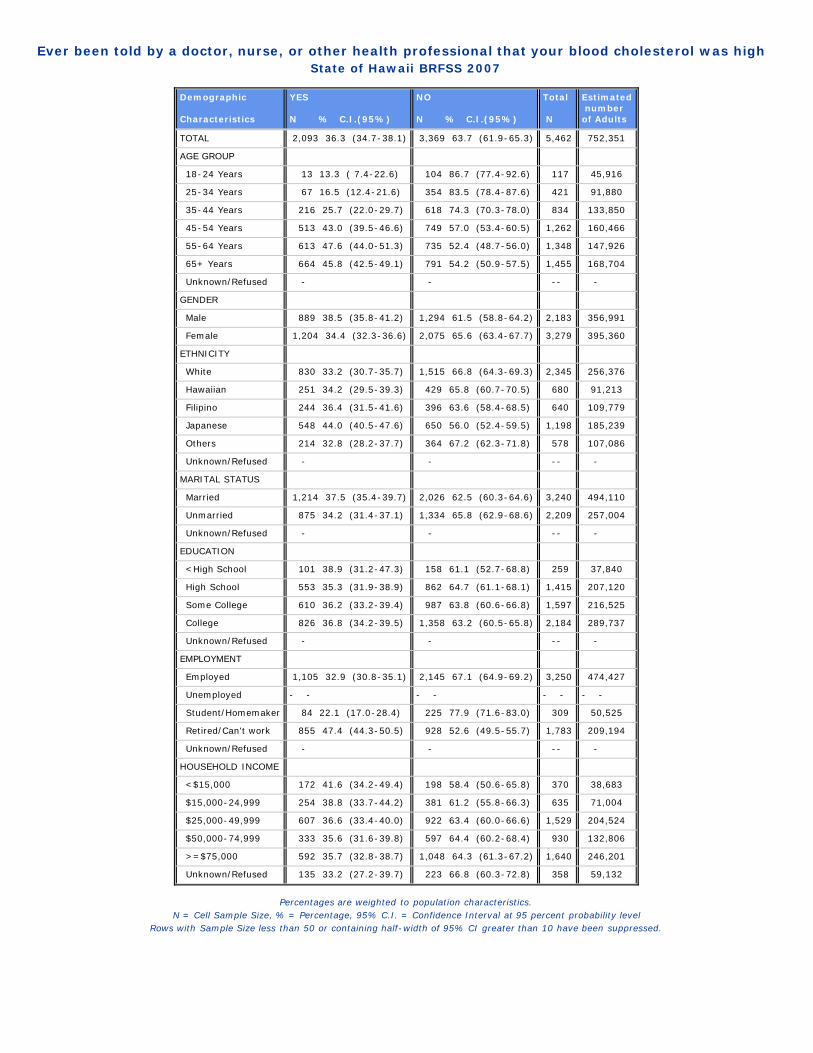
Ever been told by a doctor, nurse, or other health professional that your blood cholesterol was highState of Hawaii BRFSS 2007
Demographic Characteristics
YES N % C.I.(95%)
NO N % C.I.(95%)
Total N
Estimated numberof Adults
TOTAL 2,093 36.3 (34.7-38.1) 3,369 63.7 (61.9-65.3) 5,462 752,351
AGE GROUP
18-24 Years 13 13.3 ( 7.4-22.6) 104 86.7 (77.4-92.6) 117 45,916
25-34 Years 67 16.5 (12.4-21.6) 354 83.5 (78.4-87.6) 421 91,880
35-44 Years 216 25.7 (22.0-29.7) 618 74.3 (70.3-78.0) 834 133,850
45-54 Years 513 43.0 (39.5-46.6) 749 57.0 (53.4-60.5) 1,262 160,466
55-64 Years 613 47.6 (44.0-51.3) 735 52.4 (48.7-56.0) 1,348 147,926
65+ Years 664 45.8 (42.5-49.1) 791 54.2 (50.9-57.5) 1,455 168,704
Unknown/Refused - - -- -
GENDER
Male 889 38.5 (35.8-41.2) 1,294 61.5 (58.8-64.2) 2,183 356,991
Female 1,204 34.4 (32.3-36.6) 2,075 65.6 (63.4-67.7) 3,279 395,360
ETHNICITY
White 830 33.2 (30.7-35.7) 1,515 66.8 (64.3-69.3) 2,345 256,376
Hawaiian 251 34.2 (29.5-39.3) 429 65.8 (60.7-70.5) 680 91,213
Filipino 244 36.4 (31.5-41.6) 396 63.6 (58.4-68.5) 640 109,779
Japanese 548 44.0 (40.5-47.6) 650 56.0 (52.4-59.5) 1,198 185,239
Others 214 32.8 (28.2-37.7) 364 67.2 (62.3-71.8) 578 107,086
Unknown/Refused - - -- -
MARITAL STATUS
Married 1,214 37.5 (35.4-39.7) 2,026 62.5 (60.3-64.6) 3,240 494,110
Unmarried 875 34.2 (31.4-37.1) 1,334 65.8 (62.9-68.6) 2,209 257,004
Unknown/Refused - - -- -
EDUCATION
<High School 101 38.9 (31.2-47.3) 158 61.1 (52.7-68.8) 259 37,840
High School 553 35.3 (31.9-38.9) 862 64.7 (61.1-68.1) 1,415 207,120
Some College 610 36.2 (33.2-39.4) 987 63.8 (60.6-66.8) 1,597 216,525
College 826 36.8 (34.2-39.5) 1,358 63.2 (60.5-65.8) 2,184 289,737
Unknown/Refused - - -- -
EMPLOYMENT
Employed 1,105 32.9 (30.8-35.1) 2,145 67.1 (64.9-69.2) 3,250 474,427
Unemployed - - - - - - - -
Student/Homemaker 84 22.1 (17.0-28.4) 225 77.9 (71.6-83.0) 309 50,525
Retired/Can't work 855 47.4 (44.3-50.5) 928 52.6 (49.5-55.7) 1,783 209,194
Unknown/Refused - - -- -
HOUSEHOLD INCOME
<$15,000 172 41.6 (34.2-49.4) 198 58.4 (50.6-65.8) 370 38,683
$15,000-24,999 254 38.8 (33.7-44.2) 381 61.2 (55.8-66.3) 635 71,004
$25,000-49,999 607 36.6 (33.4-40.0) 922 63.4 (60.0-66.6) 1,529 204,524
$50,000-74,999 333 35.6 (31.6-39.8) 597 64.4 (60.2-68.4) 930 132,806
>=$75,000 592 35.7 (32.8-38.7) 1,048 64.3 (61.3-67.2) 1,640 246,201
Unknown/Refused 135 33.2 (27.2-39.7) 223 66.8 (60.3-72.8) 358 59,132
Percentages are weighted to population characteristics.N = Cell Sample Size, % = Percentage, 95% C.I. = Confidence Interval at 95 percent probability level
Rows with Sample Size less than 50 or containing half-width of 95% CI greater than 10 have been suppressed.
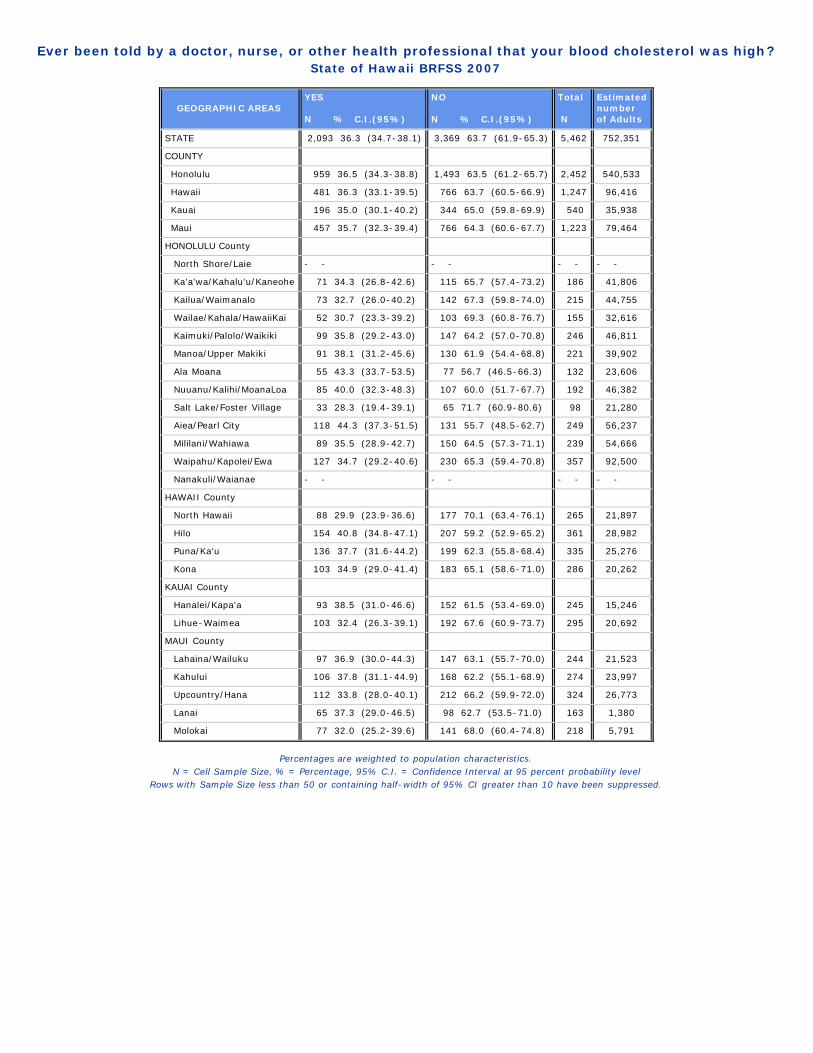
Ever been told by a doctor, nurse, or other health professional that your blood cholesterol was high?State of Hawaii BRFSS 2007
GEOGRAPHIC AREAS YES N % C.I.(95%)
NO N % C.I.(95%)
Total N
Estimatednumberof Adults
STATE 2,093 36.3 (34.7-38.1) 3,369 63.7 (61.9-65.3) 5,462 752,351
COUNTY
Honolulu 959 36.5 (34.3-38.8) 1,493 63.5 (61.2-65.7) 2,452 540,533
Hawaii 481 36.3 (33.1-39.5) 766 63.7 (60.5-66.9) 1,247 96,416
Kauai 196 35.0 (30.1-40.2) 344 65.0 (59.8-69.9) 540 35,938
Maui 457 35.7 (32.3-39.4) 766 64.3 (60.6-67.7) 1,223 79,464
HONOLULU County
North Shore/Laie - - - - - - - -
Ka'a'wa/Kahalu'u/Kaneohe 71 34.3 (26.8-42.6) 115 65.7 (57.4-73.2) 186 41,806
Kailua/Waimanalo 73 32.7 (26.0-40.2) 142 67.3 (59.8-74.0) 215 44,755
Wailae/Kahala/HawaiiKai 52 30.7 (23.3-39.2) 103 69.3 (60.8-76.7) 155 32,616
Kaimuki/Palolo/Waikiki 99 35.8 (29.2-43.0) 147 64.2 (57.0-70.8) 246 46,811
Manoa/Upper Makiki 91 38.1 (31.2-45.6) 130 61.9 (54.4-68.8) 221 39,902
Ala Moana 55 43.3 (33.7-53.5) 77 56.7 (46.5-66.3) 132 23,606
Nuuanu/Kalihi/MoanaLoa 85 40.0 (32.3-48.3) 107 60.0 (51.7-67.7) 192 46,382
Salt Lake/Foster Village 33 28.3 (19.4-39.1) 65 71.7 (60.9-80.6) 98 21,280
Aiea/Pearl City 118 44.3 (37.3-51.5) 131 55.7 (48.5-62.7) 249 56,237
Mililani/Wahiawa 89 35.5 (28.9-42.7) 150 64.5 (57.3-71.1) 239 54,666
Waipahu/Kapolei/Ewa 127 34.7 (29.2-40.6) 230 65.3 (59.4-70.8) 357 92,500
Nanakuli/Waianae - - - - - - - -
HAWAII County
North Hawaii 88 29.9 (23.9-36.6) 177 70.1 (63.4-76.1) 265 21,897
Hilo 154 40.8 (34.8-47.1) 207 59.2 (52.9-65.2) 361 28,982
Puna/Ka'u 136 37.7 (31.6-44.2) 199 62.3 (55.8-68.4) 335 25,276
Kona 103 34.9 (29.0-41.4) 183 65.1 (58.6-71.0) 286 20,262
KAUAI County
Hanalei/Kapa'a 93 38.5 (31.0-46.6) 152 61.5 (53.4-69.0) 245 15,246
Lihue-Waimea 103 32.4 (26.3-39.1) 192 67.6 (60.9-73.7) 295 20,692
MAUI County
Lahaina/Wailuku 97 36.9 (30.0-44.3) 147 63.1 (55.7-70.0) 244 21,523
Kahului 106 37.8 (31.1-44.9) 168 62.2 (55.1-68.9) 274 23,997
Upcountry/Hana 112 33.8 (28.0-40.1) 212 66.2 (59.9-72.0) 324 26,773
Lanai 65 37.3 (29.0-46.5) 98 62.7 (53.5-71.0) 163 1,380
Molokai 77 32.0 (25.2-39.6) 141 68.0 (60.4-74.8) 218 5,791
Percentages are weighted to population characteristics.N = Cell Sample Size, % = Percentage, 95% C.I. = Confidence Interval at 95 percent probability level
Rows with Sample Size less than 50 or containing half-width of 95% CI greater than 10 have been suppressed.
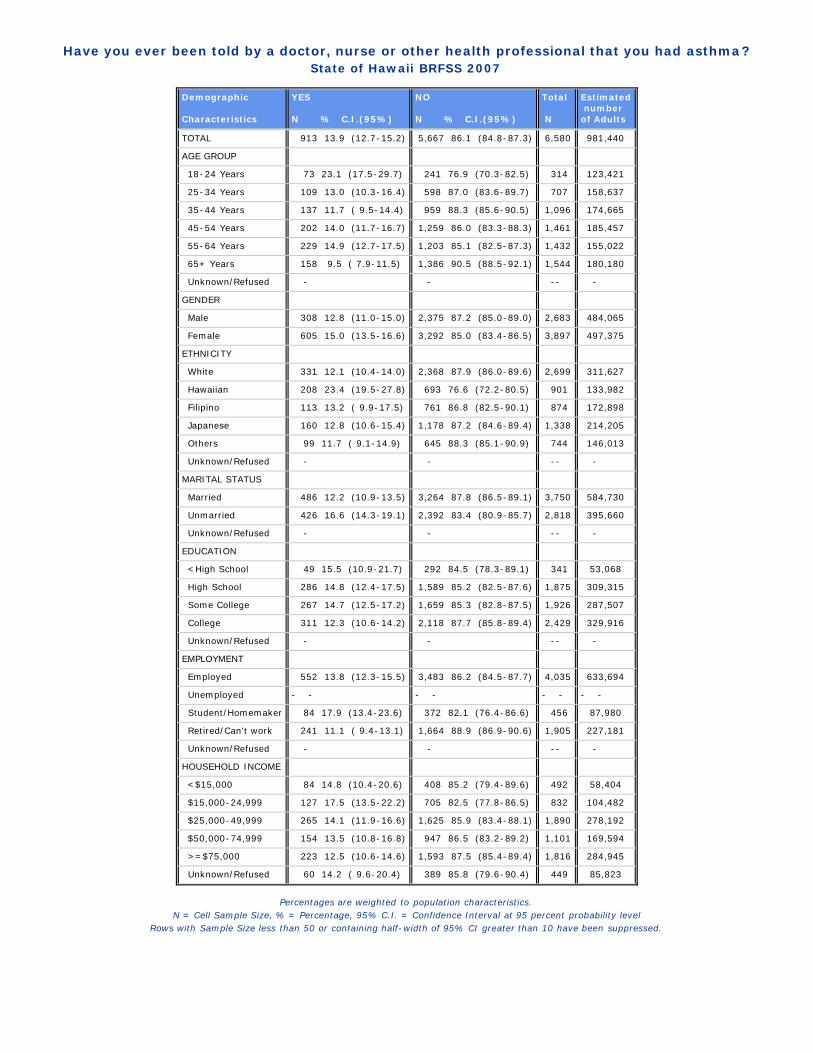
Have you ever been told by a doctor, nurse or other health professional that you had asthma?State of Hawaii BRFSS 2007
Demographic Characteristics
YES N % C.I.(95%)
NO N % C.I.(95%)
Total N
Estimated numberof Adults
TOTAL 913 13.9 (12.7-15.2) 5,667 86.1 (84.8-87.3) 6,580 981,440
AGE GROUP
18-24 Years 73 23.1 (17.5-29.7) 241 76.9 (70.3-82.5) 314 123,421
25-34 Years 109 13.0 (10.3-16.4) 598 87.0 (83.6-89.7) 707 158,637
35-44 Years 137 11.7 ( 9.5-14.4) 959 88.3 (85.6-90.5) 1,096 174,665
45-54 Years 202 14.0 (11.7-16.7) 1,259 86.0 (83.3-88.3) 1,461 185,457
55-64 Years 229 14.9 (12.7-17.5) 1,203 85.1 (82.5-87.3) 1,432 155,022
65+ Years 158 9.5 ( 7.9-11.5) 1,386 90.5 (88.5-92.1) 1,544 180,180
Unknown/Refused - - -- -
GENDER
Male 308 12.8 (11.0-15.0) 2,375 87.2 (85.0-89.0) 2,683 484,065
Female 605 15.0 (13.5-16.6) 3,292 85.0 (83.4-86.5) 3,897 497,375
ETHNICITY
White 331 12.1 (10.4-14.0) 2,368 87.9 (86.0-89.6) 2,699 311,627
Hawaiian 208 23.4 (19.5-27.8) 693 76.6 (72.2-80.5) 901 133,982
Filipino 113 13.2 ( 9.9-17.5) 761 86.8 (82.5-90.1) 874 172,898
Japanese 160 12.8 (10.6-15.4) 1,178 87.2 (84.6-89.4) 1,338 214,205
Others 99 11.7 ( 9.1-14.9) 645 88.3 (85.1-90.9) 744 146,013
Unknown/Refused - - -- -
MARITAL STATUS
Married 486 12.2 (10.9-13.5) 3,264 87.8 (86.5-89.1) 3,750 584,730
Unmarried 426 16.6 (14.3-19.1) 2,392 83.4 (80.9-85.7) 2,818 395,660
Unknown/Refused - - -- -
EDUCATION
<High School 49 15.5 (10.9-21.7) 292 84.5 (78.3-89.1) 341 53,068
High School 286 14.8 (12.4-17.5) 1,589 85.2 (82.5-87.6) 1,875 309,315
Some College 267 14.7 (12.5-17.2) 1,659 85.3 (82.8-87.5) 1,926 287,507
College 311 12.3 (10.6-14.2) 2,118 87.7 (85.8-89.4) 2,429 329,916
Unknown/Refused - - -- -
EMPLOYMENT
Employed 552 13.8 (12.3-15.5) 3,483 86.2 (84.5-87.7) 4,035 633,694
Unemployed - - - - - - - -
Student/Homemaker 84 17.9 (13.4-23.6) 372 82.1 (76.4-86.6) 456 87,980
Retired/Can't work 241 11.1 ( 9.4-13.1) 1,664 88.9 (86.9-90.6) 1,905 227,181
Unknown/Refused - - -- -
HOUSEHOLD INCOME
<$15,000 84 14.8 (10.4-20.6) 408 85.2 (79.4-89.6) 492 58,404
$15,000-24,999 127 17.5 (13.5-22.2) 705 82.5 (77.8-86.5) 832 104,482
$25,000-49,999 265 14.1 (11.9-16.6) 1,625 85.9 (83.4-88.1) 1,890 278,192
$50,000-74,999 154 13.5 (10.8-16.8) 947 86.5 (83.2-89.2) 1,101 169,594
>=$75,000 223 12.5 (10.6-14.6) 1,593 87.5 (85.4-89.4) 1,816 284,945
Unknown/Refused 60 14.2 ( 9.6-20.4) 389 85.8 (79.6-90.4) 449 85,823
Percentages are weighted to population characteristics.N = Cell Sample Size, % = Percentage, 95% C.I. = Confidence Interval at 95 percent probability level
Rows with Sample Size less than 50 or containing half-width of 95% CI greater than 10 have been suppressed.

Have you ever been told by a doctor, nurse or other health professional that you had asthma?State of Hawaii BRFSS 2007
GEOGRAPHIC AREAS YES N % C.I.(95%)
NO N % C.I.(95%)
Total N
Estimatednumberof Adults
STATE 913 13.9 (12.7-15.2) 5,667 86.1 (84.8-87.3) 6,580 981,440
COUNTY
Honolulu 374 13.5 (11.9-15.2) 2,538 86.5 (84.8-88.1) 2,912 698,107
Hawaii 217 14.3 (12.1-16.7) 1,295 85.7 (83.3-87.9) 1,512 128,544
Kauai 87 15.0 (11.7-19.0) 564 85.0 (81.0-88.3) 651 47,213
Maui 235 16.1 (13.6-18.9) 1,270 83.9 (81.1-86.4) 1,505 107,576
HONOLULU County
North Shore/Laie 19 16.9 (10.4-26.1) 70 83.1 (73.9-89.6) 89 22,482
Ka'a'wa/Kahalu'u/Kaneohe 29 14.0 ( 9.3-20.4) 183 86.0 (79.6-90.7) 212 48,440
Kailua/Waimanalo 34 17.4 (11.7-25.1) 205 82.6 (74.9-88.3) 239 52,739
Wailae/Kahala/HawaiiKai 17 11.8 ( 6.7-19.9) 158 88.2 (80.1-93.3) 175 38,570
Kaimuki/Palolo/Waikiki 25 8.2 ( 4.9-13.5) 256 91.8 (86.5-95.1) 281 55,717
Manoa/Upper Makiki 38 13.8 ( 9.8-19.0) 205 86.2 (81.0-90.2) 243 45,663
Ala Moana 12 6.8 ( 3.5-12.9) 144 93.2 (87.1-96.5) 156 29,128
Nuuanu/Kalihi/MoanaLoa 27 12.1 ( 7.4-19.0) 225 87.9 (81.0-92.6) 252 67,173
Salt Lake/Foster Village 16 13.2 ( 7.5-22.2) 107 86.8 (77.8-92.5) 123 28,663
Aiea/Pearl City 43 16.9 (11.4-24.2) 234 83.1 (75.8-88.6) 277 67,357
Mililani/Wahiawa 37 13.0 ( 9.1-18.4) 257 87.0 (81.6-90.9) 294 73,824
Waipahu/Kapolei/Ewa 55 13.7 (10.0-18.6) 390 86.3 (81.4-90.0) 445 128,849
Nanakuli/Waianae 22 16.0 ( 9.5-25.7) 104 84.0 (74.3-90.5) 126 39,503
HAWAII County
North Hawaii 47 16.6 (11.5-23.4) 270 83.4 (76.6-88.5) 317 28,520
Hilo 51 11.8 ( 8.6-16.1) 377 88.2 (83.9-91.4) 428 36,390
Puna/Ka'u 65 15.2 (11.3-20.2) 362 84.8 (79.8-88.7) 427 36,264
Kona 54 13.7 (10.0-18.6) 286 86.3 (81.4-90.0) 340 27,370
KAUAI County
Hanalei/Kapa'a 41 17.0 (11.8-23.8) 258 83.0 (76.2-88.2) 299 20,066
Lihue-Waimea 46 13.5 ( 9.5-18.7) 306 86.5 (81.3-90.5) 352 27,147
MAUI County
Lahaina/Wailuku 44 13.5 ( 9.5-19.0) 257 86.5 (81.0-90.5) 301 30,792
Kahului 49 15.7 (11.5-20.9) 287 84.3 (79.1-88.5) 336 32,369
Upcountry/Hana 54 17.9 (13.1-24.0) 332 82.1 (76.0-86.9) 386 34,380
Lanai 37 18.3 (12.4-26.1) 168 81.7 (73.9-87.6) 205 1,886
Molokai 51 18.9 (13.3-26.1) 226 81.1 (73.9-86.7) 277 8,149
Percentages are weighted to population characteristics.N = Cell Sample Size, % = Percentage, 95% C.I. = Confidence Interval at 95 percent probability level
Rows with Sample Size less than 50 or containing half-width of 95% CI greater than 10 have been suppressed.

Adult asthma statusState of Hawaii BRFSS 2007
Demographic Characteristics
Current asthma N % C.I.(95%)
No more asthma N % C.I.(95%)
Never had asthma N % C.I.(95%)
Total N
Estimated numberof Adults
TOTAL 539 8.0 ( 7.1- 9.1) 359 5.8 ( 5.0- 6.7) 5,667 86.2 (84.9-87.4) 6,565 979,885
AGE GROUP
18-24 Years 31 12.5 ( 8.2-18.8) 41 10.4 ( 7.1-15.2) 241 77.0 (70.3-82.6) 313 123,300
25-34 Years 65 7.8 ( 5.7-10.5) 40 5.0 ( 3.3- 7.5) 598 87.2 (83.9-89.9) 703 158,206
35-44 Years 83 6.2 ( 4.7- 8.3) 53 5.4 ( 3.9- 7.6) 959 88.3 (85.6-90.6) 1,095 174,581
45-54 Years 126 8.8 ( 6.8-11.1) 74 5.1 ( 3.8- 6.8) 1,259 86.1 (83.4-88.4) 1,459 185,232
55-64 Years 138 8.6 ( 6.9-10.6) 87 6.1 ( 4.6- 7.9) 1,203 85.3 (82.8-87.6) 1,428 154,520
65+ Years 95 5.5 ( 4.3- 7.0) 60 3.9 ( 2.8- 5.4) 1,386 90.6 (88.6-92.2) 1,541 179,989
Unknown/Refused - - - -- -
GENDER
Male 142 6.5 ( 5.1- 8.4) 158 6.1 ( 4.9- 7.6) 2,375 87.4 (85.2-89.2) 2,675 483,098
Female 397 9.4 ( 8.3-10.7) 201 5.5 ( 4.5- 6.6) 3,292 85.1 (83.5-86.6) 3,890 496,787
ETHNICITY
White 202 7.6 ( 6.3- 9.3) 122 4.2 ( 3.3- 5.4) 2,368 88.2 (86.3-89.8) 2,692 310,804
Hawaiian 124 12.7 ( 9.8-16.3) 82 10.6 ( 7.9-14.2) 693 76.7 (72.3-80.6) 899 133,863
Filipino 67 8.3 ( 5.6-12.1) 46 5.0 ( 3.2- 7.8) 761 86.8 (82.5-90.1) 874 172,898
Japanese 80 6.1 ( 4.6- 8.2) 76 6.6 ( 5.0- 8.5) 1,178 87.3 (84.7-89.5) 1,334 213,856
Others 66 7.1 ( 5.1- 9.8) 31 4.4 ( 2.9- 6.7) 645 88.5 (85.2-91.1) 742 145,749
Unknown/Refused - - - -- -
MARITAL STATUS
Married 282 7.0 ( 6.0- 8.1) 196 5.0 ( 4.2- 6.0) 3,264 88.0 (86.6-89.2) 3,742 583,825
Unmarried 257 9.5 ( 7.8-11.7) 162 6.9 ( 5.5- 8.7) 2,392 83.6 (81.1-85.8) 2,811 395,010
Unknown/Refused - - - -- -
EDUCATION
<High School 33 9.0 ( 5.7-14.0) 16 6.5 ( 3.6-11.7) 292 84.5 (78.3-89.1) 341 53,068
High School 173 8.9 ( 6.9-11.4) 106 5.7 ( 4.4- 7.3) 1,589 85.4 (82.7-87.8) 1,868 308,613
Some College 161 8.9 ( 7.2-11.1) 101 5.7 ( 4.3- 7.3) 1,659 85.4 (82.9-87.6) 1,921 287,187
College 172 6.3 ( 5.1- 7.6) 136 5.9 ( 4.6- 7.5) 2,118 87.8 (85.9-89.5) 2,426 329,383
Unknown/Refused - - - -- -
EMPLOYMENT
Employed 310 8.0 ( 6.7- 9.4) 234 5.7 ( 4.8- 6.7) 3,483 86.3 (84.7-87.8) 4,027 632,579
Unemployed - - - - - - - - - -
Student/Homemaker 49 9.3 ( 6.3-13.4) 34 8.6 ( 5.2-13.7) 372 82.1 (76.4-86.7) 455 87,897
Retired/Can't work 159 7.1 ( 5.7- 8.7) 77 4.0 ( 3.0- 5.3) 1,664 89.0 (87.0-90.7) 1,900 226,909
Unknown/Refused - - - -- -
HOUSEHOLD INCOME
<$15,000 66 11.7 ( 7.6-17.5) 15 2.9 ( 1.6- 5.4) 408 85.4 (79.5-89.8) 489 58,278
$15,000-24,999 73 10.2 ( 7.2-14.4) 51 6.8 ( 4.4-10.4) 705 82.9 (78.2-86.8) 829 103,987
$25,000-49,999 148 7.1 ( 5.6- 8.9) 114 6.9 ( 5.3- 9.0) 1,625 86.0 (83.5-88.2) 1,887 277,998
$50,000-74,999 89 7.4 ( 5.3-10.2) 65 6.1 ( 4.4- 8.4) 947 86.5 (83.2-89.2) 1,101 169,594
>=$75,000 128 7.3 ( 5.9- 9.1) 91 5.0 ( 3.9- 6.4) 1,593 87.7 (85.6-89.5) 1,812 284,445
Unknown/Refused 35 9.2 ( 5.3-15.7) 23 4.7 ( 2.8- 7.7) 389 86.0 (79.8-90.6) 447 85,582
Percentages are weighted to population characteristics.N = Cell Sample Size, % = Percentage, 95% C.I. = Confidence Interval at 95 percent probability level
Rows with Sample Size less than 50 or containing half-width of 95% CI greater than 10 have been suppressed.

Adult asthma statusState of Hawaii BRFSS 2007
GEOGRAPHIC AREAS Current asthma N % C.I.(95%)
No more asthma N % C.I.(95%)
Never had asthma N % C.I.(95%)
Total N
Estimatednumberof Adults
STATE 539 8.0 ( 7.1- 9.1) 359 5.8 ( 5.0- 6.7) 5,667 86.2 (84.9-87.4) 6,565 979,885
COUNTY
Honolulu 229 8.2 ( 6.9- 9.6) 139 5.2 ( 4.3- 6.4) 2,538 86.6 (84.9-88.2) 2,906 697,306
Hawaii 122 7.1 ( 5.6- 8.9) 90 6.9 ( 5.3- 8.8) 1,295 86.0 (83.6-88.1) 1,507 128,142
Kauai 45 6.4 ( 4.6- 8.8) 41 8.4 ( 5.8-12.2) 564 85.2 (81.1-88.5) 650 47,132
Maui 143 8.8 ( 7.0-11.1) 89 7.0 ( 5.4- 9.1) 1,270 84.2 (81.3-86.6) 1,502 107,304
HONOLULU County
North Shore/Laie 13 12.0 ( 6.8-20.5) 6 4.8 ( 2.1-10.9) 70 83.1 (73.9-89.6) 89 22,482
Ka'a'wa/Kahalu'u/Kaneohe 17 8.0 ( 4.6-13.6) 12 6.0 ( 3.2-10.9) 183 86.0 (79.6-90.7) 212 48,440
Kailua/Waimanalo 21 11.5 ( 6.8-18.7) 11 5.5 ( 2.5-11.5) 205 83.0 (75.2-88.8) 237 52,461
Wailae/Kahala/HawaiiKai 7 3.9 ( 1.7- 8.6) 10 7.9 ( 3.7-16.1) 158 88.2 (80.1-93.3) 175 38,570
Kaimuki/Palolo/Waikiki 18 6.1 ( 3.3-11.1) 6 2.0 ( 0.8- 5.2) 256 91.9 (86.6-95.2) 280 55,652
Manoa/Upper Makiki 19 5.9 ( 3.6- 9.4) 18 7.7 ( 4.7-12.4) 205 86.5 (81.2-90.4) 242 45,543
Ala Moana 9 4.3 ( 2.1- 8.7) 3 2.6 ( 0.7- 9.2) 144 93.2 (87.1-96.5) 156 29,128
Nuuanu/Kalihi/MoanaLoa 15 5.8 ( 3.2-10.5) 12 6.2 ( 2.8-13.1) 225 87.9 (81.0-92.6) 252 67,173
Salt Lake/Foster Village 9 8.1 ( 3.7-16.7) 7 5.2 ( 2.2-11.4) 107 86.8 (77.8-92.5) 123 28,663
Aiea/Pearl City 28 10.3 ( 5.9-17.3) 14 6.3 ( 3.4-11.4) 234 83.4 (76.0-88.8) 276 67,164
Mililani/Wahiawa 19 5.8 ( 3.4- 9.6) 17 7.1 ( 4.2-11.9) 257 87.1 (81.8-91.1) 293 73,678
Waipahu/Kapolei/Ewa 38 10.2 ( 6.9-14.9) 17 3.5 ( 2.1- 5.9) 390 86.3 (81.4-90.0) 445 128,849
Nanakuli/Waianae 16 12.5 ( 6.7-22.1) 6 3.5 ( 1.3- 9.0) 104 84.0 (74.3-90.5) 126 39,503
HAWAII County
North Hawaii 26 8.3 ( 4.6-14.6) 21 8.3 ( 5.0-13.4) 270 83.4 (76.6-88.5) 317 28,520
Hilo 33 6.8 ( 4.6-10.1) 16 4.7 ( 2.7- 8.3) 377 88.4 (84.2-91.6) 426 36,271
Puna/Ka'u 35 7.1 ( 4.8-10.4) 29 8.0 ( 5.0-12.5) 362 85.0 (80.0-88.8) 426 36,180
Kona 28 6.2 ( 4.1- 9.2) 24 6.9 ( 4.1-11.3) 286 86.9 (82.1-90.6) 338 27,170
KAUAI County
Hanalei/Kapa'a 17 5.4 ( 3.3- 8.7) 24 11.6 ( 7.1-18.6) 258 83.0 (76.2-88.2) 299 20,066
Lihue-Waimea 28 7.1 ( 4.6-10.9) 17 6.1 ( 3.3-10.8) 306 86.8 (81.5-90.7) 351 27,066
MAUI County
Lahaina/Wailuku 24 5.7 ( 3.6- 9.1) 20 7.8 ( 4.6-12.8) 257 86.5 (81.0-90.5) 301 30,792
Kahului 29 8.4 ( 5.6-12.4) 20 7.2 ( 4.4-11.8) 287 84.3 (79.1-88.5) 336 32,369
Upcountry/Hana 29 10.7 ( 6.7-16.4) 24 6.7 ( 4.2-10.6) 332 82.7 (76.6-87.4) 385 34,161
Lanai 26 11.0 ( 7.0-16.9) 11 7.3 ( 3.4-14.9) 168 81.7 (73.9-87.6) 205 1,886
Molokai 35 13.9 ( 8.9-21.1) 14 4.5 ( 2.4- 8.3) 226 81.7 (74.4-87.2) 275 8,096
Percentages are weighted to population characteristics.N = Cell Sample Size, % = Percentage, 95% C.I. = Confidence Interval at 95 percent probability level
Rows with Sample Size less than 50 or containing half-width of 95% CI greater than 10 have been suppressed.
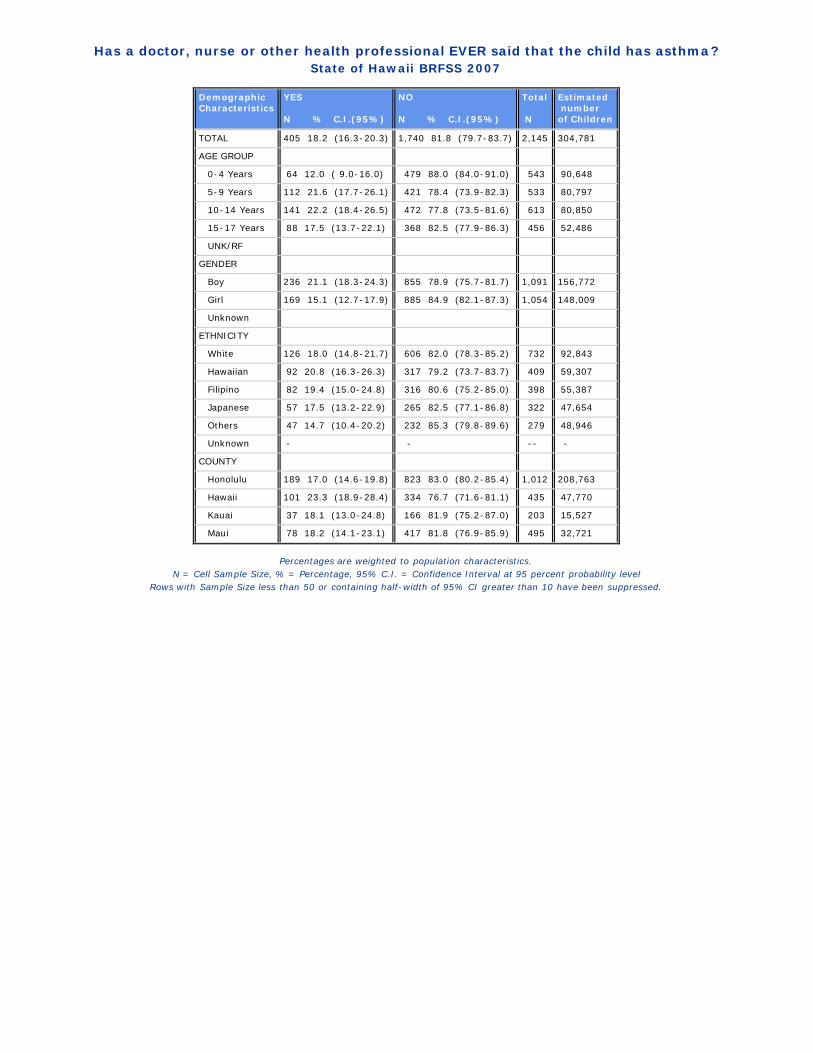
Has a doctor, nurse or other health professional EVER said that the child has asthma?State of Hawaii BRFSS 2007
DemographicCharacteristics
YES N % C.I.(95%)
NO N % C.I.(95%)
Total N
Estimated numberof Children
TOTAL 405 18.2 (16.3-20.3) 1,740 81.8 (79.7-83.7) 2,145 304,781
AGE GROUP
0-4 Years 64 12.0 ( 9.0-16.0) 479 88.0 (84.0-91.0) 543 90,648
5-9 Years 112 21.6 (17.7-26.1) 421 78.4 (73.9-82.3) 533 80,797
10-14 Years 141 22.2 (18.4-26.5) 472 77.8 (73.5-81.6) 613 80,850
15-17 Years 88 17.5 (13.7-22.1) 368 82.5 (77.9-86.3) 456 52,486
UNK/RF
GENDER
Boy 236 21.1 (18.3-24.3) 855 78.9 (75.7-81.7) 1,091 156,772
Girl 169 15.1 (12.7-17.9) 885 84.9 (82.1-87.3) 1,054 148,009
Unknown
ETHNICITY
White 126 18.0 (14.8-21.7) 606 82.0 (78.3-85.2) 732 92,843
Hawaiian 92 20.8 (16.3-26.3) 317 79.2 (73.7-83.7) 409 59,307
Filipino 82 19.4 (15.0-24.8) 316 80.6 (75.2-85.0) 398 55,387
Japanese 57 17.5 (13.2-22.9) 265 82.5 (77.1-86.8) 322 47,654
Others 47 14.7 (10.4-20.2) 232 85.3 (79.8-89.6) 279 48,946
Unknown - - -- -
COUNTY
Honolulu 189 17.0 (14.6-19.8) 823 83.0 (80.2-85.4) 1,012 208,763
Hawaii 101 23.3 (18.9-28.4) 334 76.7 (71.6-81.1) 435 47,770
Kauai 37 18.1 (13.0-24.8) 166 81.9 (75.2-87.0) 203 15,527
Maui 78 18.2 (14.1-23.1) 417 81.8 (76.9-85.9) 495 32,721
Percentages are weighted to population characteristics.N = Cell Sample Size, % = Percentage, 95% C.I. = Confidence Interval at 95 percent probability level
Rows with Sample Size less than 50 or containing half-width of 95% CI greater than 10 have been suppressed.
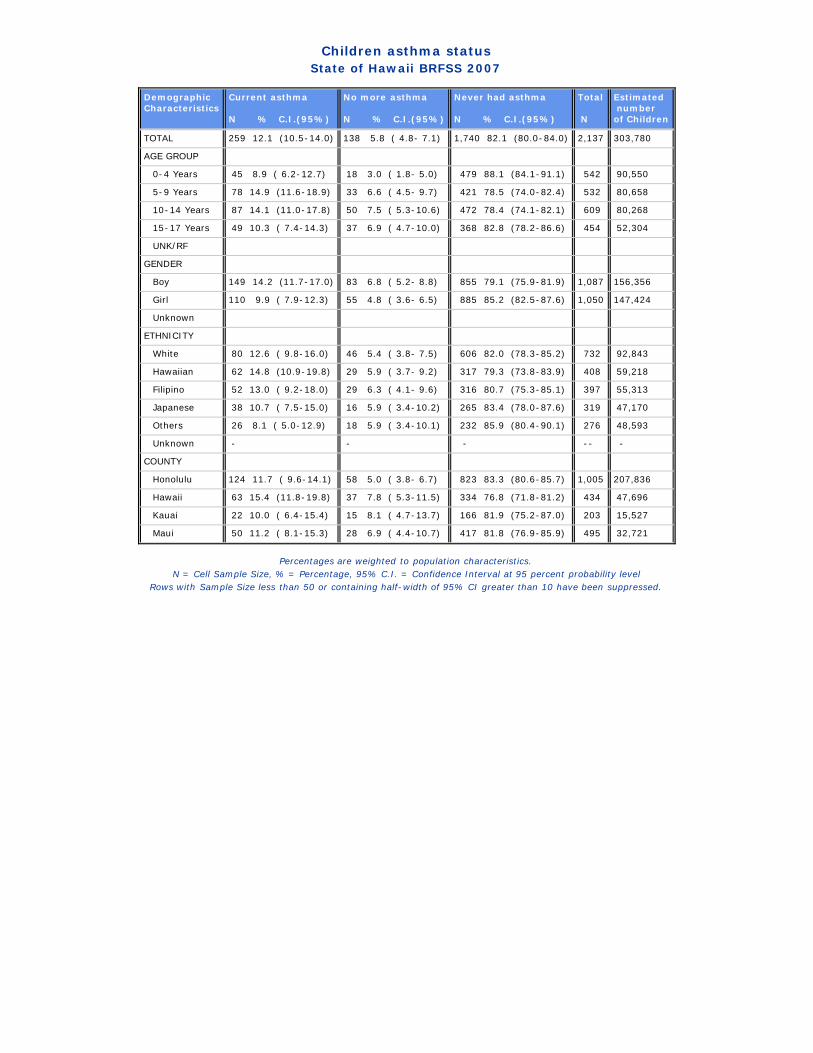
Children asthma statusState of Hawaii BRFSS 2007
DemographicCharacteristics
Current asthma N % C.I.(95%)
No more asthma N % C.I.(95%)
Never had asthma N % C.I.(95%)
Total N
Estimated numberof Children
TOTAL 259 12.1 (10.5-14.0) 138 5.8 ( 4.8- 7.1) 1,740 82.1 (80.0-84.0) 2,137 303,780
AGE GROUP
0-4 Years 45 8.9 ( 6.2-12.7) 18 3.0 ( 1.8- 5.0) 479 88.1 (84.1-91.1) 542 90,550
5-9 Years 78 14.9 (11.6-18.9) 33 6.6 ( 4.5- 9.7) 421 78.5 (74.0-82.4) 532 80,658
10-14 Years 87 14.1 (11.0-17.8) 50 7.5 ( 5.3-10.6) 472 78.4 (74.1-82.1) 609 80,268
15-17 Years 49 10.3 ( 7.4-14.3) 37 6.9 ( 4.7-10.0) 368 82.8 (78.2-86.6) 454 52,304
UNK/RF
GENDER
Boy 149 14.2 (11.7-17.0) 83 6.8 ( 5.2- 8.8) 855 79.1 (75.9-81.9) 1,087 156,356
Girl 110 9.9 ( 7.9-12.3) 55 4.8 ( 3.6- 6.5) 885 85.2 (82.5-87.6) 1,050 147,424
Unknown
ETHNICITY
White 80 12.6 ( 9.8-16.0) 46 5.4 ( 3.8- 7.5) 606 82.0 (78.3-85.2) 732 92,843
Hawaiian 62 14.8 (10.9-19.8) 29 5.9 ( 3.7- 9.2) 317 79.3 (73.8-83.9) 408 59,218
Filipino 52 13.0 ( 9.2-18.0) 29 6.3 ( 4.1- 9.6) 316 80.7 (75.3-85.1) 397 55,313
Japanese 38 10.7 ( 7.5-15.0) 16 5.9 ( 3.4-10.2) 265 83.4 (78.0-87.6) 319 47,170
Others 26 8.1 ( 5.0-12.9) 18 5.9 ( 3.4-10.1) 232 85.9 (80.4-90.1) 276 48,593
Unknown - - - -- -
COUNTY
Honolulu 124 11.7 ( 9.6-14.1) 58 5.0 ( 3.8- 6.7) 823 83.3 (80.6-85.7) 1,005 207,836
Hawaii 63 15.4 (11.8-19.8) 37 7.8 ( 5.3-11.5) 334 76.8 (71.8-81.2) 434 47,696
Kauai 22 10.0 ( 6.4-15.4) 15 8.1 ( 4.7-13.7) 166 81.9 (75.2-87.0) 203 15,527
Maui 50 11.2 ( 8.1-15.3) 28 6.9 ( 4.4-10.7) 417 81.8 (76.9-85.9) 495 32,721
Percentages are weighted to population characteristics.N = Cell Sample Size, % = Percentage, 95% C.I. = Confidence Interval at 95 percent probability level
Rows with Sample Size less than 50 or containing half-width of 95% CI greater than 10 have been suppressed.
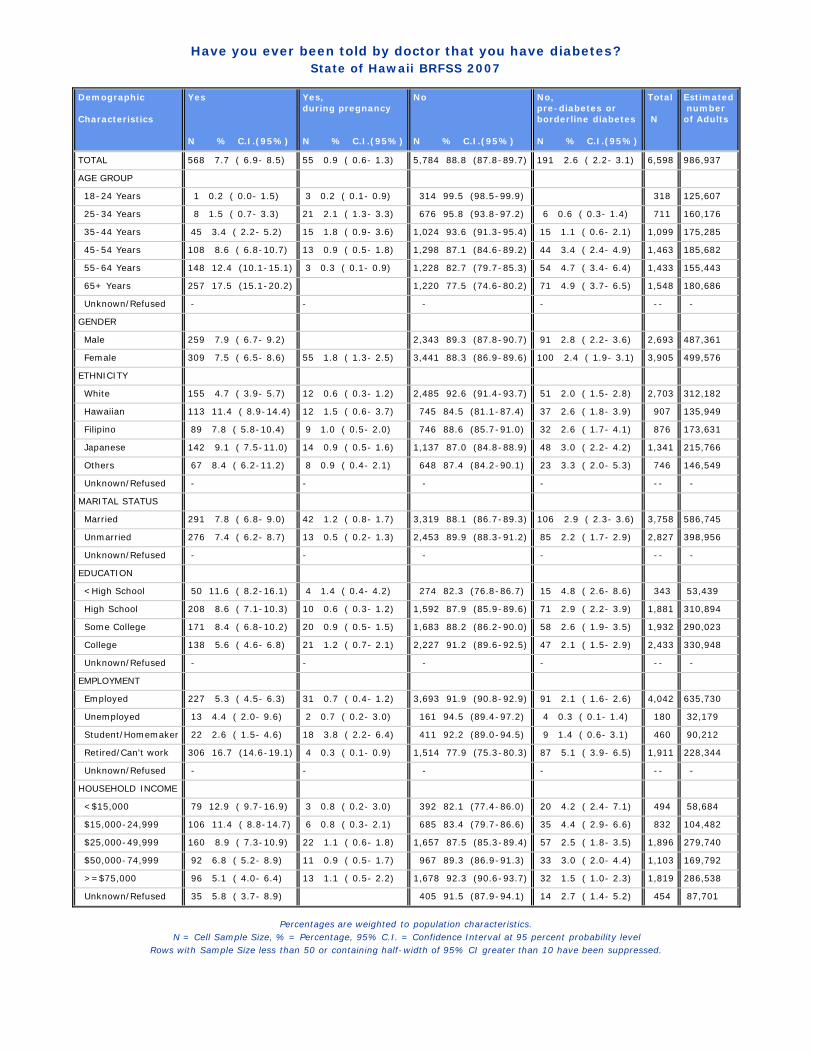
Have you ever been told by doctor that you have diabetes?State of Hawaii BRFSS 2007
Demographic Characteristics
Yes N % C.I.(95%)
Yes,during pregnancy N % C.I.(95%)
No N % C.I.(95%)
No,pre-diabetes orborderline diabetes N % C.I.(95%)
Total N
Estimated numberof Adults
TOTAL 568 7.7 ( 6.9- 8.5) 55 0.9 ( 0.6- 1.3) 5,784 88.8 (87.8-89.7) 191 2.6 ( 2.2- 3.1) 6,598 986,937
AGE GROUP
18-24 Years 1 0.2 ( 0.0- 1.5) 3 0.2 ( 0.1- 0.9) 314 99.5 (98.5-99.9) 318 125,607
25-34 Years 8 1.5 ( 0.7- 3.3) 21 2.1 ( 1.3- 3.3) 676 95.8 (93.8-97.2) 6 0.6 ( 0.3- 1.4) 711 160,176
35-44 Years 45 3.4 ( 2.2- 5.2) 15 1.8 ( 0.9- 3.6) 1,024 93.6 (91.3-95.4) 15 1.1 ( 0.6- 2.1) 1,099 175,285
45-54 Years 108 8.6 ( 6.8-10.7) 13 0.9 ( 0.5- 1.8) 1,298 87.1 (84.6-89.2) 44 3.4 ( 2.4- 4.9) 1,463 185,682
55-64 Years 148 12.4 (10.1-15.1) 3 0.3 ( 0.1- 0.9) 1,228 82.7 (79.7-85.3) 54 4.7 ( 3.4- 6.4) 1,433 155,443
65+ Years 257 17.5 (15.1-20.2) 1,220 77.5 (74.6-80.2) 71 4.9 ( 3.7- 6.5) 1,548 180,686
Unknown/Refused - - - - -- -
GENDER
Male 259 7.9 ( 6.7- 9.2) 2,343 89.3 (87.8-90.7) 91 2.8 ( 2.2- 3.6) 2,693 487,361
Female 309 7.5 ( 6.5- 8.6) 55 1.8 ( 1.3- 2.5) 3,441 88.3 (86.9-89.6) 100 2.4 ( 1.9- 3.1) 3,905 499,576
ETHNICITY
White 155 4.7 ( 3.9- 5.7) 12 0.6 ( 0.3- 1.2) 2,485 92.6 (91.4-93.7) 51 2.0 ( 1.5- 2.8) 2,703 312,182
Hawaiian 113 11.4 ( 8.9-14.4) 12 1.5 ( 0.6- 3.7) 745 84.5 (81.1-87.4) 37 2.6 ( 1.8- 3.9) 907 135,949
Filipino 89 7.8 ( 5.8-10.4) 9 1.0 ( 0.5- 2.0) 746 88.6 (85.7-91.0) 32 2.6 ( 1.7- 4.1) 876 173,631
Japanese 142 9.1 ( 7.5-11.0) 14 0.9 ( 0.5- 1.6) 1,137 87.0 (84.8-88.9) 48 3.0 ( 2.2- 4.2) 1,341 215,766
Others 67 8.4 ( 6.2-11.2) 8 0.9 ( 0.4- 2.1) 648 87.4 (84.2-90.1) 23 3.3 ( 2.0- 5.3) 746 146,549
Unknown/Refused - - - - -- -
MARITAL STATUS
Married 291 7.8 ( 6.8- 9.0) 42 1.2 ( 0.8- 1.7) 3,319 88.1 (86.7-89.3) 106 2.9 ( 2.3- 3.6) 3,758 586,745
Unmarried 276 7.4 ( 6.2- 8.7) 13 0.5 ( 0.2- 1.3) 2,453 89.9 (88.3-91.2) 85 2.2 ( 1.7- 2.9) 2,827 398,956
Unknown/Refused - - - - -- -
EDUCATION
<High School 50 11.6 ( 8.2-16.1) 4 1.4 ( 0.4- 4.2) 274 82.3 (76.8-86.7) 15 4.8 ( 2.6- 8.6) 343 53,439
High School 208 8.6 ( 7.1-10.3) 10 0.6 ( 0.3- 1.2) 1,592 87.9 (85.9-89.6) 71 2.9 ( 2.2- 3.9) 1,881 310,894
Some College 171 8.4 ( 6.8-10.2) 20 0.9 ( 0.5- 1.5) 1,683 88.2 (86.2-90.0) 58 2.6 ( 1.9- 3.5) 1,932 290,023
College 138 5.6 ( 4.6- 6.8) 21 1.2 ( 0.7- 2.1) 2,227 91.2 (89.6-92.5) 47 2.1 ( 1.5- 2.9) 2,433 330,948
Unknown/Refused - - - - -- -
EMPLOYMENT
Employed 227 5.3 ( 4.5- 6.3) 31 0.7 ( 0.4- 1.2) 3,693 91.9 (90.8-92.9) 91 2.1 ( 1.6- 2.6) 4,042 635,730
Unemployed 13 4.4 ( 2.0- 9.6) 2 0.7 ( 0.2- 3.0) 161 94.5 (89.4-97.2) 4 0.3 ( 0.1- 1.4) 180 32,179
Student/Homemaker 22 2.6 ( 1.5- 4.6) 18 3.8 ( 2.2- 6.4) 411 92.2 (89.0-94.5) 9 1.4 ( 0.6- 3.1) 460 90,212
Retired/Can't work 306 16.7 (14.6-19.1) 4 0.3 ( 0.1- 0.9) 1,514 77.9 (75.3-80.3) 87 5.1 ( 3.9- 6.5) 1,911 228,344
Unknown/Refused - - - - -- -
HOUSEHOLD INCOME
<$15,000 79 12.9 ( 9.7-16.9) 3 0.8 ( 0.2- 3.0) 392 82.1 (77.4-86.0) 20 4.2 ( 2.4- 7.1) 494 58,684
$15,000-24,999 106 11.4 ( 8.8-14.7) 6 0.8 ( 0.3- 2.1) 685 83.4 (79.7-86.6) 35 4.4 ( 2.9- 6.6) 832 104,482
$25,000-49,999 160 8.9 ( 7.3-10.9) 22 1.1 ( 0.6- 1.8) 1,657 87.5 (85.3-89.4) 57 2.5 ( 1.8- 3.5) 1,896 279,740
$50,000-74,999 92 6.8 ( 5.2- 8.9) 11 0.9 ( 0.5- 1.7) 967 89.3 (86.9-91.3) 33 3.0 ( 2.0- 4.4) 1,103 169,792
>=$75,000 96 5.1 ( 4.0- 6.4) 13 1.1 ( 0.5- 2.2) 1,678 92.3 (90.6-93.7) 32 1.5 ( 1.0- 2.3) 1,819 286,538
Unknown/Refused 35 5.8 ( 3.7- 8.9) 405 91.5 (87.9-94.1) 14 2.7 ( 1.4- 5.2) 454 87,701
Percentages are weighted to population characteristics.N = Cell Sample Size, % = Percentage, 95% C.I. = Confidence Interval at 95 percent probability level
Rows with Sample Size less than 50 or containing half-width of 95% CI greater than 10 have been suppressed.
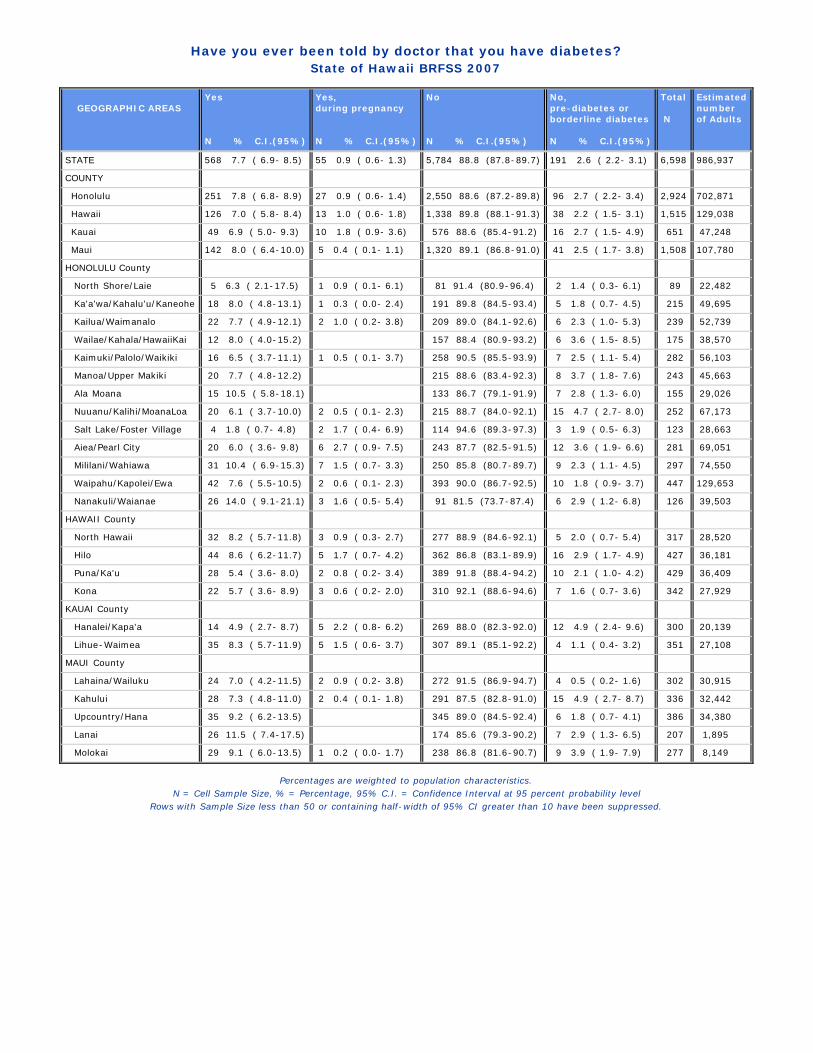
Have you ever been told by doctor that you have diabetes?State of Hawaii BRFSS 2007
GEOGRAPHIC AREAS Yes N % C.I.(95%)
Yes,during pregnancy N % C.I.(95%)
No N % C.I.(95%)
No,pre-diabetes orborderline diabetes N % C.I.(95%)
Total N
Estimatednumberof Adults
STATE 568 7.7 ( 6.9- 8.5) 55 0.9 ( 0.6- 1.3) 5,784 88.8 (87.8-89.7) 191 2.6 ( 2.2- 3.1) 6,598 986,937
COUNTY
Honolulu 251 7.8 ( 6.8- 8.9) 27 0.9 ( 0.6- 1.4) 2,550 88.6 (87.2-89.8) 96 2.7 ( 2.2- 3.4) 2,924 702,871
Hawaii 126 7.0 ( 5.8- 8.4) 13 1.0 ( 0.6- 1.8) 1,338 89.8 (88.1-91.3) 38 2.2 ( 1.5- 3.1) 1,515 129,038
Kauai 49 6.9 ( 5.0- 9.3) 10 1.8 ( 0.9- 3.6) 576 88.6 (85.4-91.2) 16 2.7 ( 1.5- 4.9) 651 47,248
Maui 142 8.0 ( 6.4-10.0) 5 0.4 ( 0.1- 1.1) 1,320 89.1 (86.8-91.0) 41 2.5 ( 1.7- 3.8) 1,508 107,780
HONOLULU County
North Shore/Laie 5 6.3 ( 2.1-17.5) 1 0.9 ( 0.1- 6.1) 81 91.4 (80.9-96.4) 2 1.4 ( 0.3- 6.1) 89 22,482
Ka'a'wa/Kahalu'u/Kaneohe 18 8.0 ( 4.8-13.1) 1 0.3 ( 0.0- 2.4) 191 89.8 (84.5-93.4) 5 1.8 ( 0.7- 4.5) 215 49,695
Kailua/Waimanalo 22 7.7 ( 4.9-12.1) 2 1.0 ( 0.2- 3.8) 209 89.0 (84.1-92.6) 6 2.3 ( 1.0- 5.3) 239 52,739
Wailae/Kahala/HawaiiKai 12 8.0 ( 4.0-15.2) 157 88.4 (80.9-93.2) 6 3.6 ( 1.5- 8.5) 175 38,570
Kaimuki/Palolo/Waikiki 16 6.5 ( 3.7-11.1) 1 0.5 ( 0.1- 3.7) 258 90.5 (85.5-93.9) 7 2.5 ( 1.1- 5.4) 282 56,103
Manoa/Upper Makiki 20 7.7 ( 4.8-12.2) 215 88.6 (83.4-92.3) 8 3.7 ( 1.8- 7.6) 243 45,663
Ala Moana 15 10.5 ( 5.8-18.1) 133 86.7 (79.1-91.9) 7 2.8 ( 1.3- 6.0) 155 29,026
Nuuanu/Kalihi/MoanaLoa 20 6.1 ( 3.7-10.0) 2 0.5 ( 0.1- 2.3) 215 88.7 (84.0-92.1) 15 4.7 ( 2.7- 8.0) 252 67,173
Salt Lake/Foster Village 4 1.8 ( 0.7- 4.8) 2 1.7 ( 0.4- 6.9) 114 94.6 (89.3-97.3) 3 1.9 ( 0.5- 6.3) 123 28,663
Aiea/Pearl City 20 6.0 ( 3.6- 9.8) 6 2.7 ( 0.9- 7.5) 243 87.7 (82.5-91.5) 12 3.6 ( 1.9- 6.6) 281 69,051
Mililani/Wahiawa 31 10.4 ( 6.9-15.3) 7 1.5 ( 0.7- 3.3) 250 85.8 (80.7-89.7) 9 2.3 ( 1.1- 4.5) 297 74,550
Waipahu/Kapolei/Ewa 42 7.6 ( 5.5-10.5) 2 0.6 ( 0.1- 2.3) 393 90.0 (86.7-92.5) 10 1.8 ( 0.9- 3.7) 447 129,653
Nanakuli/Waianae 26 14.0 ( 9.1-21.1) 3 1.6 ( 0.5- 5.4) 91 81.5 (73.7-87.4) 6 2.9 ( 1.2- 6.8) 126 39,503
HAWAII County
North Hawaii 32 8.2 ( 5.7-11.8) 3 0.9 ( 0.3- 2.7) 277 88.9 (84.6-92.1) 5 2.0 ( 0.7- 5.4) 317 28,520
Hilo 44 8.6 ( 6.2-11.7) 5 1.7 ( 0.7- 4.2) 362 86.8 (83.1-89.9) 16 2.9 ( 1.7- 4.9) 427 36,181
Puna/Ka'u 28 5.4 ( 3.6- 8.0) 2 0.8 ( 0.2- 3.4) 389 91.8 (88.4-94.2) 10 2.1 ( 1.0- 4.2) 429 36,409
Kona 22 5.7 ( 3.6- 8.9) 3 0.6 ( 0.2- 2.0) 310 92.1 (88.6-94.6) 7 1.6 ( 0.7- 3.6) 342 27,929
KAUAI County
Hanalei/Kapa'a 14 4.9 ( 2.7- 8.7) 5 2.2 ( 0.8- 6.2) 269 88.0 (82.3-92.0) 12 4.9 ( 2.4- 9.6) 300 20,139
Lihue-Waimea 35 8.3 ( 5.7-11.9) 5 1.5 ( 0.6- 3.7) 307 89.1 (85.1-92.2) 4 1.1 ( 0.4- 3.2) 351 27,108
MAUI County
Lahaina/Wailuku 24 7.0 ( 4.2-11.5) 2 0.9 ( 0.2- 3.8) 272 91.5 (86.9-94.7) 4 0.5 ( 0.2- 1.6) 302 30,915
Kahului 28 7.3 ( 4.8-11.0) 2 0.4 ( 0.1- 1.8) 291 87.5 (82.8-91.0) 15 4.9 ( 2.7- 8.7) 336 32,442
Upcountry/Hana 35 9.2 ( 6.2-13.5) 345 89.0 (84.5-92.4) 6 1.8 ( 0.7- 4.1) 386 34,380
Lanai 26 11.5 ( 7.4-17.5) 174 85.6 (79.3-90.2) 7 2.9 ( 1.3- 6.5) 207 1,895
Molokai 29 9.1 ( 6.0-13.5) 1 0.2 ( 0.0- 1.7) 238 86.8 (81.6-90.7) 9 3.9 ( 1.9- 7.9) 277 8,149
Percentages are weighted to population characteristics.N = Cell Sample Size, % = Percentage, 95% C.I. = Confidence Interval at 95 percent probability level
Rows with Sample Size less than 50 or containing half-width of 95% CI greater than 10 have been suppressed.

Average age when told diabeticState of Hawaii BRFSS 2007
Demographic Characteristics
Average 95% C.I. Sample Size
TOTAL 48.5 46.9 - 50.2 550
AGE GROUP
18-24 Years - - --
25-34 Years - - --
35-44 Years - - --
45-54 Years 42.4 40.7 - 44.1 106
55-64 Years 48.7 46.5 - 51.0 144
65+ Years 57.6 55.5 - 59.8 245
Unknown/Refused - - --
GENDER
Male 49.0 46.8 - 51.2 252
Female 48.0 45.5 - 50.5 298
ETHNICITY
White 49.7 46.7 - 52.7 152
Hawaiian 42.9 39.3 - 46.4 111
Filipino 48.5 44.7 - 52.3 87
Japanese 53.1 49.9 - 56.3 135
Others 47.3 42.6 - 51.9 63
Unknown/Refused - - --
MARITAL STATUS
Married 48.9 47.1 - 50.8 284
Unmarried 47.7 44.6 - 50.9 265
Unknown/Refused - - --
EDUCATION
<High School - - --
High School 50.8 48.4 - 53.3 199
Some College 43.5 40.6 - 46.4 167
College 49.4 46.8 - 52.1 136
Unknown/Refused - - --
EMPLOYMENT
Employed 42.8 40.7 - 44.9 223
Unemployed - - --
Student/Homemaker - - --
Retired/Can't work 54.8 52.8 - 56.9 293
Unknown/Refused - - --
HOUSEHOLD INCOME
<$15,000 51.7 45.7 - 57.7 77
$15,000-24,999 51.1 46.4 - 55.9 106
$25,000-49,999 47.5 44.2 - 50.9 154
$50,000-74,999 46.3 43.6 - 49.0 90
>=$75,000 48.6 46.0 - 51.3 94
Unknown/Refused - - --
COUNTY
Honolulu 48.3 46.2 - 50.4 244
Hawaii 51.9 49.0 - 54.9 119
Kauai - - --
Maui 46.7 42.5 - 50.9 140
The symbol '--' means cell size less than 50.

Are you now taking insulin?State of Hawaii BRFSS 2007
Demographic Characteristics
YES N % C.I.(95%)
NO N % C.I.(95%)
Total N
Estimated numberof Adults
TOTAL 107 19.5 (15.4-24.3) 461 80.5 (75.7-84.6) 568 75,630
AGE GROUP
18-24 Years - - -- -
25-34 Years - - -- -
35-44 Years - - -- -
45-54 Years 19 17.4 (10.0-28.5) 89 82.6 (71.5-90.0) 108 15,887
55-64 Years 32 24.9 (16.3-36.1) 116 75.1 (63.9-83.7) 148 19,227
65+ Years 42 15.5 (10.6-22.1) 215 84.5 (77.9-89.4) 257 31,660
Unknown/Refused - - -- -
GENDER
Male 50 22.6 (16.3-30.5) 209 77.4 (69.5-83.7) 259 38,302
Female 57 16.3 (11.8-22.1) 252 83.7 (77.9-88.2) 309 37,329
ETHNICITY
White 33 22.8 (15.3-32.4) 122 77.2 (67.6-84.7) 155 14,598
Hawaiian 19 11.8 ( 6.7-20.1) 94 88.2 (79.9-93.3) 113 15,456
Filipino - - - - - - - -
Japanese 19 15.4 ( 8.9-25.3) 123 84.6 (74.7-91.1) 142 19,627
Others - - - - - - - -
Unknown/Refused - - -- -
MARITAL STATUS
Married 60 21.2 (15.7-27.9) 231 78.8 (72.1-84.3) 291 45,940
Unmarried 47 17.0 (11.6-24.2) 229 83.0 (75.8-88.4) 276 29,503
Unknown/Refused - - -- -
EDUCATION
<High School 7 12.0 ( 5.0-26.2) 43 88.0 (73.8-95.0) 50 6,190
High School 41 22.7 (15.6-31.8) 167 77.3 (68.2-84.4) 208 26,667
Some College 35 19.4 (12.6-28.7) 136 80.6 (71.3-87.4) 171 24,228
College 24 17.6 (10.7-27.5) 114 82.4 (72.5-89.3) 138 18,462
Unknown/Refused - - -- -
EMPLOYMENT
Employed 41 20.8 (14.3-29.1) 186 79.2 (70.9-85.7) 227 33,620
Unemployed - - -- -
Student/Homemaker - - -- -
Retired/Can't work 55 17.4 (12.6-23.5) 251 82.6 (76.5-87.4) 306 38,195
Unknown/Refused
HOUSEHOLD INCOME
<$15,000 - - - - - - - -
$15,000-24,999 - - - - - - - -
$25,000-49,999 25 20.0 (12.5-30.3) 135 80.0 (69.7-87.5) 160 24,920
$50,000-74,999 - - - - - - - -
>=$75,000 16 17.5 ( 9.9-29.2) 80 82.5 (70.8-90.1) 96 14,540
Unknown/Refused - - -- -
COUNTY
Honolulu 45 19.5 (14.4-26.0) 206 80.5 (74.0-85.6) 251 54,740
Hawaii 21 16.1 (10.3-24.3) 105 83.9 (75.7-89.7) 126 8,997
Kauai - - -- -
Maui 32 24.0 (15.8-34.8) 110 76.0 (65.2-84.2) 142 8,656
Percentages are weighted to population characteristics.

Number of times diabetic check blood for glucose or sugarState of Hawaii BRFSS 2007
Demographic Characteristics
Daily or more N % C.I.(95%)
1-6 times/week N % C.I.(95%)
1-3 times/month N % C.I.(95%)
<Once/month N % C.I.(95%)
Never N % C.I.(95%)
Total N
Estimated numberof Adults
TOTAL 288 48.5 (42.9-54.0) 88 15.6 (12.1-20.0) 27 4.9 ( 3.0- 7.9) 20 4.5 ( 2.6- 7.8) 135 26.5 (21.7-31.9) 558 74,635
AGE GROUP
18-24 Years - - - - - -- -
25-34 Years - - - - - -- -
35-44 Years - - - - - -- -
45-54 Years - - - - - - - - - - - - - -
55-64 Years - - - - - - - - - - - - - -
65+ Years 138 51.0 (42.8-59.1) 37 15.2 (10.1-22.3) 6 1.4 ( 0.6- 3.4) 6 4.3 ( 1.6-11.0) 65 28.1 (21.1-36.4) 252 31,108
Unknown/Refused - - - - - -- -
GENDER
Male 126 48.6 (40.5-56.8) 44 17.9 (12.5-24.9) 12 4.1 ( 1.8- 8.9) 9 3.0 ( 1.4- 6.1) 65 26.4 (19.6-34.7) 256 38,025
Female 162 48.3 (41.0-55.8) 44 13.3 ( 9.2-18.9) 15 5.7 ( 3.0-10.4) 11 6.2 ( 2.9-12.5) 70 26.5 (20.2-33.9) 302 36,610
ETHNICITY
White 86 54.9 (45.1-64.3) 25 18.8 (11.9-28.3) 8 4.0 ( 1.8- 8.4) 5 3.0 ( 0.9- 9.3) 30 19.4 (12.8-28.1) 154 14,543
Hawaiian - - - - - - - - - - - - - -
Filipino - - - - - - - - - - - - - -
Japanese - - - - - - - - - - - - - -
Others - - - - - - - - - - - - - -
Unknown/Refused - - - - - -- -
MARITAL STATUS
Married 153 47.2 (40.1-54.5) 48 17.1 (12.3-23.2) 12 5.1 ( 2.7- 9.4) 9 3.0 ( 1.4- 6.1) 66 27.6 (21.2-35.1) 288 45,663
Unmarried 135 50.7 (42.1-59.3) 40 13.5 ( 8.9-20.0) 15 4.6 ( 2.1- 9.8) 11 7.0 ( 3.2-14.7) 68 24.2 (17.7-32.1) 269 28,784
Unknown/Refused - - - - - -- -
EDUCATION
<High School - - - - - -- -
High School 109 42.6 (33.8-51.8) 30 17.1 (10.7-26.1) 8 3.5 ( 1.6- 7.4) 6 4.8 ( 1.7-13.0) 52 32.1 (23.2-42.5) 205 26,526
Some College - - - - - - - - - - - - - -
College - - - - - - - - - - - - - -
Unknown/Refused - - - - - -- -
EMPLOYMENT
Employed 113 49.3 (40.6-58.0) 31 14.0 ( 9.2-20.7) 15 8.5 ( 4.6-15.0) 10 3.4 ( 1.7- 6.9) 53 24.9 (18.0-33.4) 222 33,236
Unemployed - - - - - -- -
Student/Homemaker - - - - - -- -
Retired/Can't work 158 47.8 (40.5-55.3) 52 16.8 (11.9-23.3) 9 1.5 ( 0.7- 3.3) 7 4.3 ( 1.8-10.1) 75 29.4 (22.7-37.3) 301 37,583
Unknown/Refused
HOUSEHOLD INCOME
<$15,000 - - - - - - - - - - - - - -
$15,000-24,999 - - - - - - - - - - - - - -
$25,000-49,999 - - - - - - - - - - - - - -
$50,000-74,999 - - - - - - - - - - - - - -
>=$75,000 - - - - - - - - - - - - - -
Unknown/Refused - - - - - -- -
COUNTY
Honolulu 121 46.0 (38.9-53.2) 37 15.5 (11.1-21.3) 11 4.4 ( 2.2- 8.6) 12 5.4 ( 2.9-10.0) 67 28.7 (22.5-35.8) 248 54,217
Hawaii 61 50.1 (40.5-59.7) 21 17.0 (10.8-25.8) 5 3.4 ( 1.2- 9.0) 5 3.1 ( 1.2- 7.5) 31 26.4 (18.8-35.7) 123 8,746
Kauai - - - - - -- -
Maui - - - - - - - - - - - - - -
Percentages are weighted to population characteristics.N = Cell Sample Size, % = Percentage, 95% C.I. = Confidence Interval at 95 percent probability level
Rows with Sample Size less than 50 or containing half-width of 95% CI greater than 10 have been suppressed.

Number of times checked for (Glycosylated) Hemoglobin "A one C" in the past 12 monthsState of Hawaii BRFSS 2007
Demographic Characteristics
None N % C.I.(95%)
1-4 times N % C.I.(95%)
5+ times N % C.I.(95%)
Never heard ofthis kind of test N % C.I.(95%)
Total N
Estimated numberof Adults
TOTAL 36 6.9 ( 4.3-10.8) 406 76.0 (70.6-80.7) 30 6.0 ( 3.7- 9.5) 62 11.2 ( 7.9-15.5) 534 70,382
AGE GROUP
18-24 Years - - - - -- -
25-34 Years - - - - -- -
35-44 Years - - - - -- -
45-54 Years - - - - - - - - - - - -
55-64 Years 4 1.3 ( 0.5- 3.9) 110 77.2 (66.6-85.2) 11 9.2 ( 4.1-19.6) 17 12.2 ( 6.9-20.7) 142 18,608
65+ Years 18 8.9 ( 4.8-16.0) 178 74.6 (66.8-81.0) 12 4.2 ( 2.2- 7.8) 33 12.4 ( 8.2-18.2) 241 29,774
Unknown/Refused - - - - -- -
GENDER
Male 10 3.3 ( 1.4- 7.2) 180 74.7 (66.4-81.5) 18 7.8 ( 4.3-13.8) 33 14.2 ( 8.9-21.9) 241 34,935
Female 26 10.5 ( 6.1-17.4) 226 77.2 (69.9-83.2) 12 4.2 ( 1.9- 8.9) 29 8.2 ( 5.2-12.6) 293 35,447
ETHNICITY
White 9 4.4 ( 2.2- 9.0) 113 78.0 (69.2-84.8) 9 5.1 ( 2.3-10.7) 17 12.5 ( 7.3-20.7) 148 13,941
Hawaiian - - - - - - - - - - - -
Filipino - - - - - - - - - - - -
Japanese 7 5.5 ( 2.2-13.3) 102 72.8 (62.0-81.5) 10 11.2 ( 5.4-21.8) 15 10.5 ( 5.8-18.2) 134 18,340
Others - - - - - - - - - - - -
Unknown/Refused - - - - -- -
MARITAL STATUS
Married 14 3.6 ( 1.9- 7.1) 225 83.2 (77.2-87.9) 19 6.8 ( 3.8-11.9) 19 6.3 ( 3.7-10.5) 277 42,799
Unmarried 22 12.0 ( 6.7-20.7) 181 65.2 (55.7-73.6) 11 4.7 ( 2.0-10.4) 42 18.2 (11.7-27.0) 256 27,395
Unknown/Refused - - - - -- -
EDUCATION
<High School - - - - -- -
High School 17 7.3 ( 3.8-13.7) 146 77.9 (69.7-84.4) 9 4.0 ( 1.8- 8.4) 26 10.8 ( 6.5-17.3) 198 25,565
Some College - - - - - - - - - - - -
College 4 5.4 ( 1.7-15.9) 106 78.6 (67.0-86.9) 6 7.3 ( 2.6-19.1) 12 8.7 ( 4.5-16.2) 128 17,011
Unknown/Refused - - - - -- -
EMPLOYMENT
Employed 12 3.8 ( 1.7- 8.1) 173 80.6 (71.4-87.4) 12 7.9 ( 3.9-15.3) 17 7.7 ( 3.4-16.5) 214 30,869
Unemployed - - - - -- -
Student/Homemaker - - - - -- -
Retired/Can't work 19 7.7 ( 4.1-13.9) 214 74.6 (67.4-80.7) 18 5.0 ( 2.8- 8.6) 36 12.7 ( 8.6-18.4) 287 35,739
Unknown/Refused
HOUSEHOLD INCOME
<$15,000 - - - - - - - - - - - -
$15,000-24,999 - - - - - - - - - - - -
$25,000-49,999 - - - - - - - - - - - -
$50,000-74,999 - - - - - - - - - - - -
>=$75,000 4 5.0 ( 1.2-18.5) 80 88.6 (76.6-94.9) 4 4.7 ( 1.5-13.7) 2 1.7 ( 0.3- 8.2) 90 13,684
Unknown/Refused - - - - -- -
COUNTY
Honolulu 12 6.7 ( 3.6-12.2) 182 76.7 (69.5-82.6) 12 5.8 ( 3.1-10.7) 29 10.7 ( 6.8-16.6) 235 50,848
Hawaii 10 6.0 ( 3.1-11.5) 89 76.5 (67.2-83.9) 5 4.2 ( 1.6-10.3) 14 13.2 ( 7.6-22.0) 118 8,349
Kauai - - - - -- -
Maui - - - - - - - - - - - -

Number of times diabetic check feet for sores or irritationsState of Hawaii BRFSS 2007
Demographic Characteristics
Daily or more N % C.I.(95%)
1-6 times/week N % C.I.(95%)
1-3 times/month N % C.I.(95%)
< 1 time/month N % C.I.(95%)
Never N % C.I.(95%)
Total N
Estimated numberof Adults
TOTAL 355 63.7 (58.1-68.9) 49 7.4 ( 5.1-10.7) 23 4.5 ( 2.8- 7.1) 21 4.8 ( 2.9- 7.7) 106 19.6 (15.4-24.7) 554 74,365
AGE GROUP
18-24 Years - - - - - -- -
25-34 Years - - - - - -- -
35-44 Years - - - - - -- -
45-54 Years - - - - - - - - - - - - - -
55-64 Years 96 68.4 (58.2-77.2) 9 2.6 ( 1.1- 6.0) 8 5.9 ( 2.7-12.7) 8 5.5 ( 2.5-11.8) 24 17.5 (10.9-26.8) 145 19,061
65+ Years 166 69.2 (61.4-76.1) 18 6.1 ( 3.5-10.5) 9 3.4 ( 1.6- 7.1) 4 2.8 ( 0.8- 9.0) 51 18.5 (13.1-25.4) 248 30,869
Unknown/Refused - - - - - -- -
GENDER
Male 153 61.2 (52.9-68.9) 25 6.5 ( 3.9-10.8) 5 2.1 ( 0.9- 5.2) 10 5.3 ( 2.6-10.5) 59 24.8 (18.1-33.0) 252 37,809
Female 202 66.2 (58.8-72.9) 24 8.3 ( 4.8-13.9) 18 6.9 ( 4.0-11.7) 11 4.3 ( 2.2- 8.1) 47 14.3 ( 9.8-20.3) 302 36,556
ETHNICITY
White 104 67.7 (57.9-76.1) 16 11.8 ( 6.6-20.1) 5 3.4 ( 1.2- 8.9) 2 1.8 ( 0.4- 6.7) 23 15.4 ( 9.6-23.8) 150 14,102
Hawaiian - - - - - - - - - - - - - -
Filipino - - - - - - - - - - - - - -
Japanese 85 60.7 (50.5-70.0) 11 6.6 ( 3.2-13.0) 4 3.9 ( 1.4-10.2) 5 3.1 ( 1.1- 8.0) 35 25.8 (17.9-35.7) 140 19,500
Others - - - - - - - - - - - - - -
Unknown/Refused - - - - - -- -
MARITAL STATUS
Married 187 66.6 (59.6-72.9) 23 7.3 ( 4.4-11.9) 11 3.8 ( 2.0- 7.1) 12 5.3 ( 2.8- 9.8) 53 17.0 (12.5-22.8) 286 45,407
Unmarried 168 59.6 (50.5-68.0) 26 7.6 ( 4.3-13.0) 12 5.6 ( 2.8-11.0) 9 4.0 ( 1.9- 8.4) 52 23.3 (15.8-32.9) 267 28,770
Unknown/Refused - - - - - -- -
EDUCATION
<High School - - - - - -- -
High School 127 61.5 (51.8-70.4) 14 6.2 ( 2.8-13.3) 12 6.2 ( 3.1-12.1) 8 6.2 ( 2.8-13.1) 41 19.9 (13.2-28.7) 202 26,370
Some College - - - - - - - - - - - - - -
College 86 66.7 (56.9-75.3) 18 10.6 ( 6.2-17.5) 3 1.7 ( 0.4- 6.3) 5 3.8 ( 1.5- 9.3) 23 17.2 (11.0-25.9) 135 18,244
Unknown/Refused
EMPLOYMENT
Employed 130 57.7 (48.9-66.1) 23 7.3 ( 4.4-11.7) 7 4.2 ( 1.8- 9.2) 16 7.7 ( 4.5-13.0) 47 23.1 (16.0-32.1) 223 33,175
Unemployed - - - - - -- -
Student/Homemaker - - - - - -- -
Retired/Can't work 202 68.9 (61.6-75.4) 22 6.7 ( 3.7-11.8) 14 4.6 ( 2.5- 8.4) 5 2.7 ( 0.9- 7.6) 54 17.1 (12.3-23.3) 297 37,398
Unknown/Refused
HOUSEHOLD INCOME
<$15,000 - - - - - - - - - - - - - -
$15,000-24,999 - - - - - - - - - - - - - -
$25,000-49,999 - - - - - - - - - - - - - -
$50,000-74,999 - - - - - - - - - - - - - -
>=$75,000 - - - - - - - - - - - - - -
Unknown/Refused - - - - - -- -
COUNTY
Honolulu 161 65.0 (57.8-71.6) 20 7.1 ( 4.2-11.6) 11 4.0 ( 2.1- 7.6) 9 3.9 ( 1.9- 7.8) 47 19.9 (14.6-26.7) 248 54,263
Hawaii 80 66.7 (56.9-75.2) 8 5.7 ( 2.7-11.7) 6 5.4 ( 2.3-12.0) 4 5.3 ( 1.9-13.9) 22 16.9 (11.0-25.1) 120 8,607
Kauai - - - - - -- -
Maui - - - - - - - - - - - - - -
Percentages are weighted to population characteristics.N = Cell Sample Size, % = Percentage, 95% C.I. = Confidence Interval at 95 percent probability level
Rows with Sample Size less than 50 or containing half-width of 95% CI greater than 10 have been suppressed.
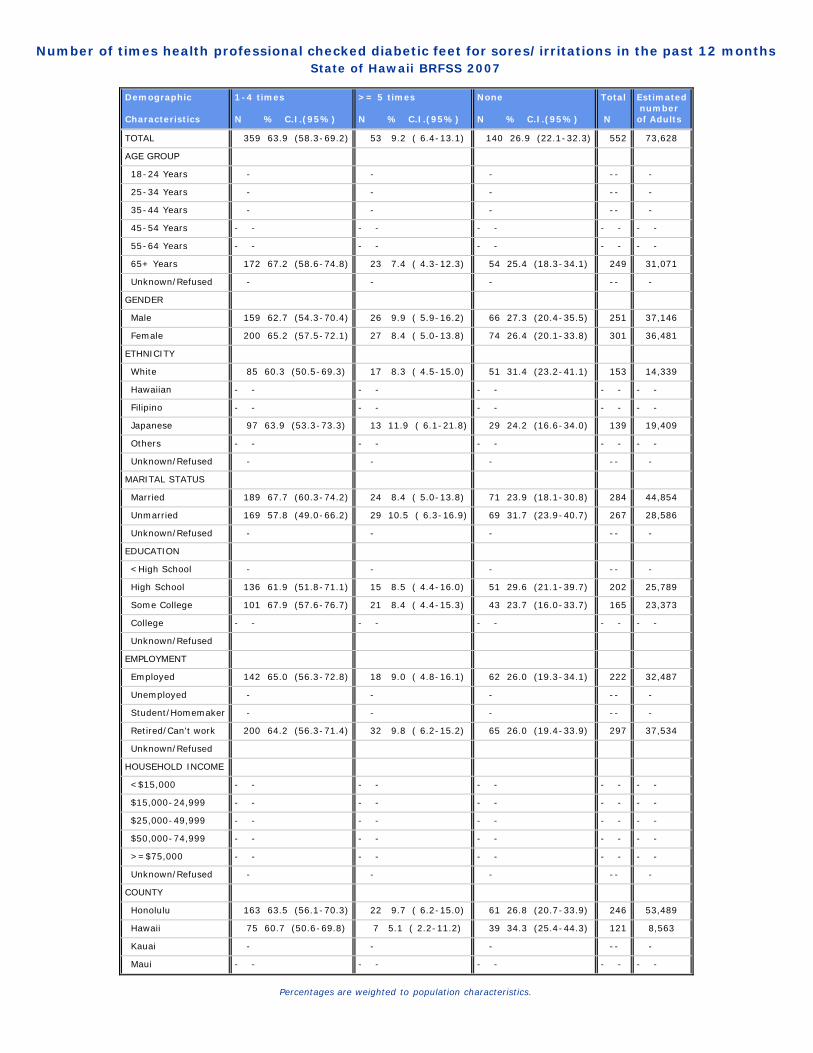
Number of times health professional checked diabetic feet for sores/irritations in the past 12 monthsState of Hawaii BRFSS 2007
Demographic Characteristics
1-4 times N % C.I.(95%)
>= 5 times N % C.I.(95%)
None N % C.I.(95%)
Total N
Estimated numberof Adults
TOTAL 359 63.9 (58.3-69.2) 53 9.2 ( 6.4-13.1) 140 26.9 (22.1-32.3) 552 73,628
AGE GROUP
18-24 Years - - - -- -
25-34 Years - - - -- -
35-44 Years - - - -- -
45-54 Years - - - - - - - - - -
55-64 Years - - - - - - - - - -
65+ Years 172 67.2 (58.6-74.8) 23 7.4 ( 4.3-12.3) 54 25.4 (18.3-34.1) 249 31,071
Unknown/Refused - - - -- -
GENDER
Male 159 62.7 (54.3-70.4) 26 9.9 ( 5.9-16.2) 66 27.3 (20.4-35.5) 251 37,146
Female 200 65.2 (57.5-72.1) 27 8.4 ( 5.0-13.8) 74 26.4 (20.1-33.8) 301 36,481
ETHNICITY
White 85 60.3 (50.5-69.3) 17 8.3 ( 4.5-15.0) 51 31.4 (23.2-41.1) 153 14,339
Hawaiian - - - - - - - - - -
Filipino - - - - - - - - - -
Japanese 97 63.9 (53.3-73.3) 13 11.9 ( 6.1-21.8) 29 24.2 (16.6-34.0) 139 19,409
Others - - - - - - - - - -
Unknown/Refused - - - -- -
MARITAL STATUS
Married 189 67.7 (60.3-74.2) 24 8.4 ( 5.0-13.8) 71 23.9 (18.1-30.8) 284 44,854
Unmarried 169 57.8 (49.0-66.2) 29 10.5 ( 6.3-16.9) 69 31.7 (23.9-40.7) 267 28,586
Unknown/Refused - - - -- -
EDUCATION
<High School - - - -- -
High School 136 61.9 (51.8-71.1) 15 8.5 ( 4.4-16.0) 51 29.6 (21.1-39.7) 202 25,789
Some College 101 67.9 (57.6-76.7) 21 8.4 ( 4.4-15.3) 43 23.7 (16.0-33.7) 165 23,373
College - - - - - - - - - -
Unknown/Refused
EMPLOYMENT
Employed 142 65.0 (56.3-72.8) 18 9.0 ( 4.8-16.1) 62 26.0 (19.3-34.1) 222 32,487
Unemployed - - - -- -
Student/Homemaker - - - -- -
Retired/Can't work 200 64.2 (56.3-71.4) 32 9.8 ( 6.2-15.2) 65 26.0 (19.4-33.9) 297 37,534
Unknown/Refused
HOUSEHOLD INCOME
<$15,000 - - - - - - - - - -
$15,000-24,999 - - - - - - - - - -
$25,000-49,999 - - - - - - - - - -
$50,000-74,999 - - - - - - - - - -
>=$75,000 - - - - - - - - - -
Unknown/Refused - - - -- -
COUNTY
Honolulu 163 63.5 (56.1-70.3) 22 9.7 ( 6.2-15.0) 61 26.8 (20.7-33.9) 246 53,489
Hawaii 75 60.7 (50.6-69.8) 7 5.1 ( 2.2-11.2) 39 34.3 (25.4-44.3) 121 8,563
Kauai - - - -- -
Maui - - - - - - - - - -
Percentages are weighted to population characteristics.

Number of times diabetic visited health professional last yearState of Hawaii BRFSS 2007
Demographic Characteristics
1-4 times N % C.I.(95%)
5+ times N % C.I.(95%)
None N % C.I.(95%)
Total N
Estimated numberof Adults
TOTAL 412 73.7 (68.2-78.4) 107 20.6 (16.2-25.7) 40 5.8 ( 3.7- 9.0) 559 74,187
AGE GROUP
18-24 Years - - - -- -
25-34 Years - - - -- -
35-44 Years - - - -- -
45-54 Years - - - - - - - - - -
55-64 Years 113 79.8 (69.4-87.3) 23 17.4 (10.2-28.0) 11 2.9 ( 1.4- 5.6) 147 19,124
65+ Years 189 75.2 (67.5-81.6) 46 18.7 (13.1-25.9) 17 6.1 ( 3.2-11.4) 252 31,167
Unknown/Refused - - - -- -
GENDER
Male 189 73.8 (65.5-80.6) 51 22.1 (15.5-30.4) 16 4.2 ( 2.2- 7.7) 256 37,283
Female 223 73.5 (66.2-79.8) 56 19.0 (13.8-25.6) 24 7.4 ( 4.0-13.4) 303 36,904
ETHNICITY
White 110 74.7 (65.3-82.2) 33 19.5 (12.8-28.5) 11 5.9 ( 2.8-11.9) 154 14,500
Hawaiian - - - - - - - - - -
Filipino - - - - - - - - - -
Japanese 112 77.9 (67.8-85.6) 23 20.0 (12.6-30.2) 5 2.1 ( 0.8- 5.7) 140 19,495
Others - - - - - - - - - -
Unknown/Refused - - - -- -
MARITAL STATUS
Married 221 78.5 (71.9-83.9) 53 18.6 (13.5-25.1) 15 2.9 ( 1.4- 5.7) 289 45,654
Unmarried 191 65.8 (56.7-73.9) 54 23.7 (16.6-32.7) 25 10.4 ( 5.9-17.8) 270 28,533
Unknown/Refused
EDUCATION
<High School - - - -- -
High School 155 75.5 (66.4-82.7) 39 20.5 (13.8-29.4) 13 4.0 ( 1.8- 8.7) 207 26,590
Some College 121 72.8 (61.8-81.6) 34 20.6 (12.8-31.4) 14 6.6 ( 2.9-14.4) 169 23,492
College 103 72.3 (61.3-81.1) 22 19.4 (11.9-29.9) 10 8.3 ( 3.7-17.5) 135 17,989
Unknown/Refused - - - -- -
EMPLOYMENT
Employed 177 76.0 (66.9-83.2) 33 20.0 (13.2-29.2) 15 4.1 ( 2.0- 8.1) 225 32,788
Unemployed - - - -- -
Student/Homemaker - - - -- -
Retired/Can't work 215 72.9 (65.7-79.1) 66 20.9 (15.5-27.6) 19 6.2 ( 3.3-11.4) 300 37,599
Unknown/Refused
HOUSEHOLD INCOME
<$15,000 - - - - - - - - - -
$15,000-24,999 - - - - - - - - - -
$25,000-49,999 - - - - - - - - - -
$50,000-74,999 69 80.2 (68.7-88.2) 16 14.1 ( 7.9-23.9) 7 5.7 ( 1.8-16.6) 92 11,603
>=$75,000 75 81.3 (69.5-89.3) 12 11.8 ( 6.0-21.9) 7 6.9 ( 2.4-18.2) 94 14,265
Unknown/Refused - - - -- -
COUNTY
Honolulu 187 73.4 (66.2-79.5) 46 21.3 (15.7-28.2) 14 5.3 ( 2.8- 9.9) 247 53,708
Hawaii 93 79.8 (71.5-86.2) 20 12.9 ( 8.0-20.2) 10 7.3 ( 3.7-13.8) 123 8,788
Kauai - - - -- -
Maui - - - - - - - - - -
Percentages are weighted to population characteristics.
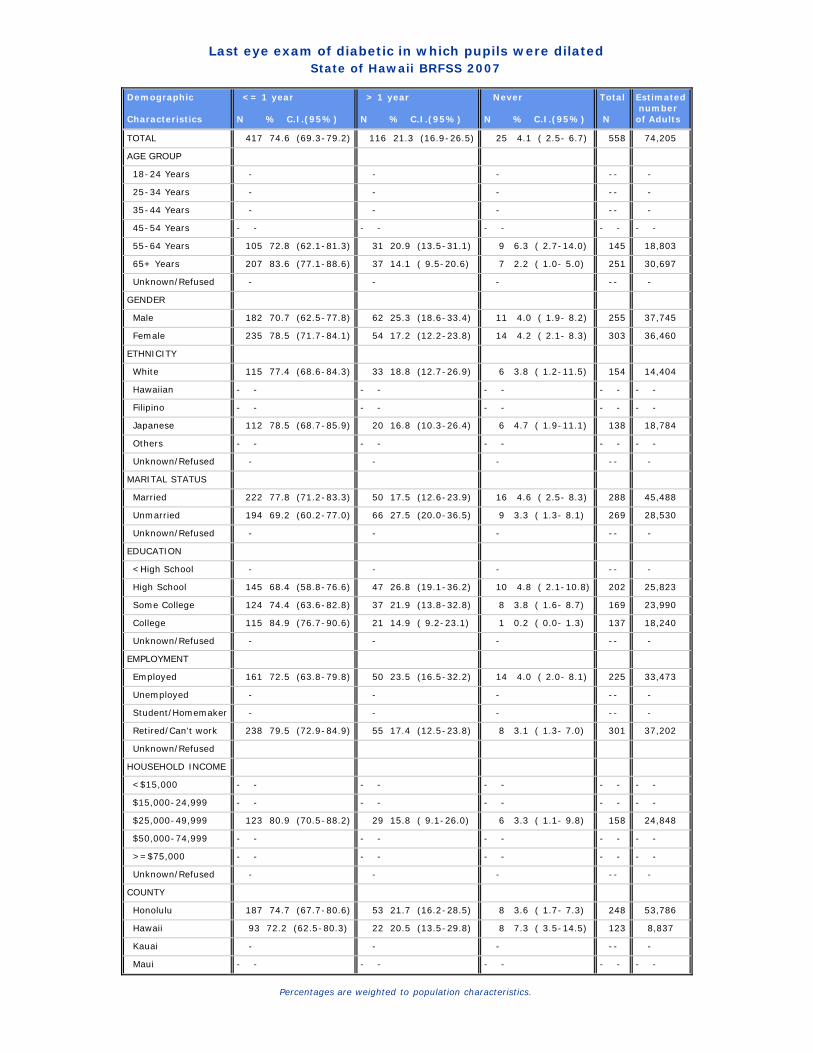
Last eye exam of diabetic in which pupils were dilatedState of Hawaii BRFSS 2007
Demographic Characteristics
<= 1 year N % C.I.(95%)
> 1 year N % C.I.(95%)
Never N % C.I.(95%)
Total N
Estimated numberof Adults
TOTAL 417 74.6 (69.3-79.2) 116 21.3 (16.9-26.5) 25 4.1 ( 2.5- 6.7) 558 74,205
AGE GROUP
18-24 Years - - - -- -
25-34 Years - - - -- -
35-44 Years - - - -- -
45-54 Years - - - - - - - - - -
55-64 Years 105 72.8 (62.1-81.3) 31 20.9 (13.5-31.1) 9 6.3 ( 2.7-14.0) 145 18,803
65+ Years 207 83.6 (77.1-88.6) 37 14.1 ( 9.5-20.6) 7 2.2 ( 1.0- 5.0) 251 30,697
Unknown/Refused - - - -- -
GENDER
Male 182 70.7 (62.5-77.8) 62 25.3 (18.6-33.4) 11 4.0 ( 1.9- 8.2) 255 37,745
Female 235 78.5 (71.7-84.1) 54 17.2 (12.2-23.8) 14 4.2 ( 2.1- 8.3) 303 36,460
ETHNICITY
White 115 77.4 (68.6-84.3) 33 18.8 (12.7-26.9) 6 3.8 ( 1.2-11.5) 154 14,404
Hawaiian - - - - - - - - - -
Filipino - - - - - - - - - -
Japanese 112 78.5 (68.7-85.9) 20 16.8 (10.3-26.4) 6 4.7 ( 1.9-11.1) 138 18,784
Others - - - - - - - - - -
Unknown/Refused - - - -- -
MARITAL STATUS
Married 222 77.8 (71.2-83.3) 50 17.5 (12.6-23.9) 16 4.6 ( 2.5- 8.3) 288 45,488
Unmarried 194 69.2 (60.2-77.0) 66 27.5 (20.0-36.5) 9 3.3 ( 1.3- 8.1) 269 28,530
Unknown/Refused - - - -- -
EDUCATION
<High School - - - -- -
High School 145 68.4 (58.8-76.6) 47 26.8 (19.1-36.2) 10 4.8 ( 2.1-10.8) 202 25,823
Some College 124 74.4 (63.6-82.8) 37 21.9 (13.8-32.8) 8 3.8 ( 1.6- 8.7) 169 23,990
College 115 84.9 (76.7-90.6) 21 14.9 ( 9.2-23.1) 1 0.2 ( 0.0- 1.3) 137 18,240
Unknown/Refused - - - -- -
EMPLOYMENT
Employed 161 72.5 (63.8-79.8) 50 23.5 (16.5-32.2) 14 4.0 ( 2.0- 8.1) 225 33,473
Unemployed - - - -- -
Student/Homemaker - - - -- -
Retired/Can't work 238 79.5 (72.9-84.9) 55 17.4 (12.5-23.8) 8 3.1 ( 1.3- 7.0) 301 37,202
Unknown/Refused
HOUSEHOLD INCOME
<$15,000 - - - - - - - - - -
$15,000-24,999 - - - - - - - - - -
$25,000-49,999 123 80.9 (70.5-88.2) 29 15.8 ( 9.1-26.0) 6 3.3 ( 1.1- 9.8) 158 24,848
$50,000-74,999 - - - - - - - - - -
>=$75,000 - - - - - - - - - -
Unknown/Refused - - - -- -
COUNTY
Honolulu 187 74.7 (67.7-80.6) 53 21.7 (16.2-28.5) 8 3.6 ( 1.7- 7.3) 248 53,786
Hawaii 93 72.2 (62.5-80.3) 22 20.5 (13.5-29.8) 8 7.3 ( 3.5-14.5) 123 8,837
Kauai - - - -- -
Maui - - - - - - - - - -
Percentages are weighted to population characteristics.

Ever told diabetes has affected eyesState of Hawaii BRFSS 2007
Demographic Characteristics
YES N % C.I.(95%)
NO N % C.I.(95%)
Total N
Estimated numberof Adults
TOTAL 142 25.1 (20.6-30.3) 417 74.9 (69.7-79.4) 559 74,513
AGE GROUP
18-24 Years - - -- -
25-34 Years - - -- -
35-44 Years - - -- -
45-54 Years - - - - - - - -
55-64 Years - - - - - - - -
65+ Years 65 24.0 (18.0-31.3) 188 76.0 (68.7-82.0) 253 31,044
Unknown/Refused - - -- -
GENDER
Male 69 27.8 (20.9-35.9) 185 72.2 (64.1-79.1) 254 37,613
Female 73 22.5 (17.0-29.1) 232 77.5 (70.9-83.0) 305 36,900
ETHNICITY
White 31 18.2 (11.9-27.0) 120 81.8 (73.0-88.1) 151 14,230
Hawaiian - - - - - - - -
Filipino - - - - - - - -
Japanese 28 19.2 (12.8-27.7) 112 80.8 (72.3-87.2) 140 19,182
Others - - - - - - - -
Unknown/Refused - - -- -
MARITAL STATUS
Married 82 28.2 (22.0-35.4) 205 71.8 (64.6-78.0) 287 45,236
Unmarried 60 20.5 (14.7-27.7) 211 79.5 (72.3-85.3) 271 29,090
Unknown/Refused - - -- -
EDUCATION
<High School - - -- -
High School 57 29.8 (21.9-39.1) 148 70.2 (60.9-78.1) 205 26,405
Some College 36 22.2 (14.4-32.5) 132 77.8 (67.5-85.6) 168 23,675
College 27 18.7 (11.8-28.2) 110 81.3 (71.8-88.2) 137 18,240
Unknown/Refused - - -- -
EMPLOYMENT
Employed 50 25.8 (18.7-34.4) 175 74.2 (65.6-81.3) 225 33,444
Unemployed - - -- -
Student/Homemaker - - -- -
Retired/Can't work 85 25.7 (19.8-32.6) 217 74.3 (67.4-80.2) 302 37,586
Unknown/Refused
HOUSEHOLD INCOME
<$15,000 - - - - - - - -
$15,000-24,999 - - - - - - - -
$25,000-49,999 40 24.2 (16.5-34.1) 117 75.8 (65.9-83.5) 157 24,615
$50,000-74,999 - - - - - - - -
>=$75,000 17 16.3 ( 9.4-26.9) 78 83.7 (73.1-90.6) 95 14,317
Unknown/Refused - - -- -
COUNTY
Honolulu 58 25.6 (19.7-32.4) 188 74.4 (67.6-80.3) 246 53,835
Hawaii 25 17.9 (12.0-25.9) 98 82.1 (74.1-88.0) 123 8,793
Kauai - - -- -
Maui 48 30.2 (21.2-41.1) 93 69.8 (58.9-78.8) 141 8,646
Percentages are weighted to population characteristics.
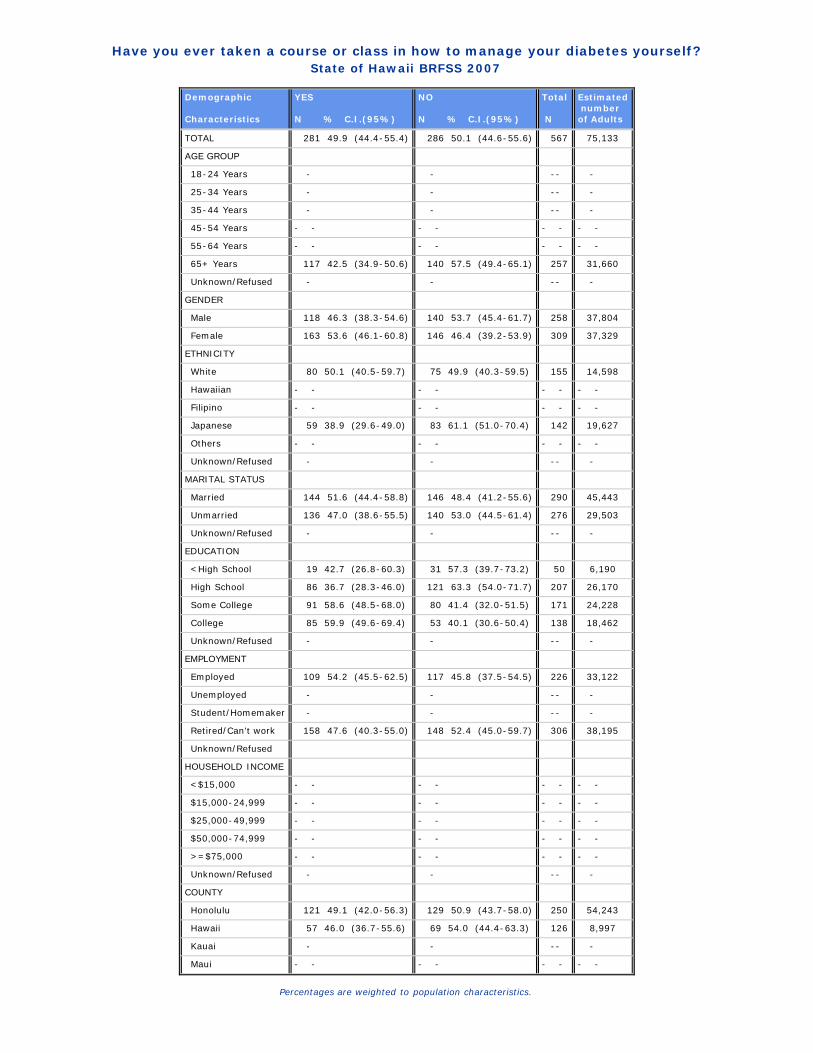
Have you ever taken a course or class in how to manage your diabetes yourself?State of Hawaii BRFSS 2007
Demographic Characteristics
YES N % C.I.(95%)
NO N % C.I.(95%)
Total N
Estimated numberof Adults
TOTAL 281 49.9 (44.4-55.4) 286 50.1 (44.6-55.6) 567 75,133
AGE GROUP
18-24 Years - - -- -
25-34 Years - - -- -
35-44 Years - - -- -
45-54 Years - - - - - - - -
55-64 Years - - - - - - - -
65+ Years 117 42.5 (34.9-50.6) 140 57.5 (49.4-65.1) 257 31,660
Unknown/Refused - - -- -
GENDER
Male 118 46.3 (38.3-54.6) 140 53.7 (45.4-61.7) 258 37,804
Female 163 53.6 (46.1-60.8) 146 46.4 (39.2-53.9) 309 37,329
ETHNICITY
White 80 50.1 (40.5-59.7) 75 49.9 (40.3-59.5) 155 14,598
Hawaiian - - - - - - - -
Filipino - - - - - - - -
Japanese 59 38.9 (29.6-49.0) 83 61.1 (51.0-70.4) 142 19,627
Others - - - - - - - -
Unknown/Refused - - -- -
MARITAL STATUS
Married 144 51.6 (44.4-58.8) 146 48.4 (41.2-55.6) 290 45,443
Unmarried 136 47.0 (38.6-55.5) 140 53.0 (44.5-61.4) 276 29,503
Unknown/Refused - - -- -
EDUCATION
<High School 19 42.7 (26.8-60.3) 31 57.3 (39.7-73.2) 50 6,190
High School 86 36.7 (28.3-46.0) 121 63.3 (54.0-71.7) 207 26,170
Some College 91 58.6 (48.5-68.0) 80 41.4 (32.0-51.5) 171 24,228
College 85 59.9 (49.6-69.4) 53 40.1 (30.6-50.4) 138 18,462
Unknown/Refused - - -- -
EMPLOYMENT
Employed 109 54.2 (45.5-62.5) 117 45.8 (37.5-54.5) 226 33,122
Unemployed - - -- -
Student/Homemaker - - -- -
Retired/Can't work 158 47.6 (40.3-55.0) 148 52.4 (45.0-59.7) 306 38,195
Unknown/Refused
HOUSEHOLD INCOME
<$15,000 - - - - - - - -
$15,000-24,999 - - - - - - - -
$25,000-49,999 - - - - - - - -
$50,000-74,999 - - - - - - - -
>=$75,000 - - - - - - - -
Unknown/Refused - - -- -
COUNTY
Honolulu 121 49.1 (42.0-56.3) 129 50.9 (43.7-58.0) 250 54,243
Hawaii 57 46.0 (36.7-55.6) 69 54.0 (44.4-63.3) 126 8,997
Kauai - - -- -
Maui - - - - - - - -
Percentages are weighted to population characteristics.

During the past 30 days, have you had symptoms of pain, aching, or stiffness in or around a joint?State of Hawaii BRFSS 2007
Demographic Characteristics
YES N % C.I.(95%)
NO N % C.I.(95%)
Total N
Estimated numberof Adults
TOTAL 2,686 36.5 (34.9-38.1) 3,852 63.5 (61.9-65.1) 6,538 976,788
AGE GROUP
18-24 Years 68 23.4 (17.9-30.1) 250 76.6 (69.9-82.1) 318 125,211
25-34 Years 174 24.8 (21.0-29.1) 533 75.2 (70.9-79.0) 707 159,155
35-44 Years 361 33.2 (29.6-36.9) 721 66.8 (63.1-70.4) 1,082 172,366
45-54 Years 637 39.4 (36.2-42.7) 815 60.6 (57.3-63.8) 1,452 184,326
55-64 Years 710 48.0 (44.5-51.6) 708 52.0 (48.4-55.5) 1,418 153,324
65+ Years 730 46.2 (42.9-49.4) 809 53.8 (50.6-57.1) 1,539 179,039
Unknown/Refused - - -- -
GENDER
Male 1,078 36.6 (34.1-39.2) 1,586 63.4 (60.8-65.9) 2,664 481,365
Female 1,608 36.3 (34.3-38.4) 2,266 63.7 (61.6-65.7) 3,874 495,422
ETHNICITY
White 1,216 41.2 (38.7-43.7) 1,467 58.8 (56.3-61.3) 2,683 309,262
Hawaiian 354 35.4 (31.2-39.9) 548 64.6 (60.1-68.8) 902 135,529
Filipino 301 29.3 (25.3-33.7) 562 70.7 (66.3-74.7) 863 171,065
Japanese 505 36.6 (33.2-40.1) 823 63.4 (59.9-66.8) 1,328 213,313
Others 304 35.9 (31.5-40.7) 434 64.1 (59.3-68.5) 738 145,179
Unknown/Refused - - -- -
MARITAL STATUS
Married 1,501 37.4 (35.4-39.3) 2,229 62.6 (60.7-64.6) 3,730 581,190
Unmarried 1,183 35.2 (32.5-38.0) 1,614 64.8 (62.0-67.5) 2,797 394,562
Unknown/Refused - - -- -
EDUCATION
<High School 155 43.5 (36.4-50.9) 181 56.5 (49.1-63.6) 336 51,817
High School 756 36.4 (33.3-39.6) 1,111 63.6 (60.4-66.7) 1,867 308,638
Some College 807 36.8 (33.8-39.8) 1,105 63.2 (60.2-66.2) 1,912 287,124
College 967 35.3 (32.9-37.8) 1,447 64.7 (62.2-67.1) 2,414 327,574
Unknown/Refused - - -- -
EMPLOYMENT
Employed 1,529 33.7 (31.7-35.7) 2,475 66.3 (64.3-68.3) 4,004 629,145
Unemployed - - - - - - - -
Student/Homemaker 148 26.4 (21.2-32.3) 310 73.6 (67.7-78.8) 458 89,869
Retired/Can't work 931 47.1 (44.1-50.2) 964 52.9 (49.8-55.9) 1,895 225,360
Unknown/Refused - - -- -
HOUSEHOLD INCOME
<$15,000 255 47.4 (40.5-54.5) 232 52.6 (45.5-59.5) 487 58,105
$15,000-24,999 382 42.4 (37.7-47.3) 444 57.6 (52.7-62.3) 826 103,400
$25,000-49,999 778 36.9 (33.9-40.1) 1,103 63.1 (59.9-66.1) 1,881 276,927
$50,000-74,999 426 33.9 (30.3-37.7) 668 66.1 (62.3-69.7) 1,094 167,906
>=$75,000 695 34.7 (31.9-37.7) 1,113 65.3 (62.3-68.1) 1,808 284,414
Unknown/Refused 150 31.1 (25.3-37.6) 292 68.9 (62.4-74.7) 442 86,035
Percentages are weighted to population characteristics.N = Cell Sample Size, % = Percentage, 95% C.I. = Confidence Interval at 95 percent probability level
Rows with Sample Size less than 50 or containing half-width of 95% CI greater than 10 have been suppressed.

During the past 30 days, have you had symptoms of pain, aching, or stiffness in or around a joint?State of Hawaii BRFSS 2007
GEOGRAPHIC AREAS YES N % C.I.(95%)
NO N % C.I.(95%)
Total N
Estimatednumberof Adults
STATE 2,686 36.5 (34.9-38.1) 3,852 63.5 (61.9-65.1) 6,538 976,788
COUNTY
Honolulu 1,111 36.0 (33.9-38.2) 1,776 64.0 (61.8-66.1) 2,887 695,006
Hawaii 666 39.0 (36.1-42.1) 840 61.0 (57.9-63.9) 1,506 127,828
Kauai 283 38.9 (34.3-43.6) 365 61.1 (56.4-65.7) 648 47,072
Maui 626 35.3 (32.1-38.6) 871 64.7 (61.4-67.9) 1,497 106,881
HONOLULU County
North Shore/Laie - - - - - - - -
Ka'a'wa/Kahalu'u/Kaneohe 81 37.9 (30.4-45.9) 132 62.1 (54.1-69.6) 213 49,240
Kailua/Waimanalo 106 39.3 (32.5-46.6) 130 60.7 (53.4-67.5) 236 52,308
Wailae/Kahala/HawaiiKai 60 31.9 (24.7-40.1) 113 68.1 (59.9-75.3) 173 38,256
Kaimuki/Palolo/Waikiki 110 39.6 (32.6-47.1) 165 60.4 (52.9-67.4) 275 54,746
Manoa/Upper Makiki 90 36.1 (29.3-43.6) 148 63.9 (56.4-70.7) 238 44,724
Ala Moana 73 44.9 (36.1-54.1) 83 55.1 (45.9-63.9) 156 29,128
Nuuanu/Kalihi/MoanaLoa 90 34.4 (27.3-42.4) 159 65.6 (57.6-72.7) 249 66,203
Salt Lake/Foster Village 34 22.5 (15.6-31.4) 88 77.5 (68.6-84.4) 122 28,566
Aiea/Pearl City 113 38.5 (31.9-45.6) 164 61.5 (54.4-68.1) 277 68,141
Mililani/Wahiawa 96 31.5 (25.8-37.9) 199 68.5 (62.1-74.2) 295 74,130
Waipahu/Kapolei/Ewa 160 34.1 (29.0-39.5) 283 65.9 (60.5-71.0) 443 128,902
Nanakuli/Waianae - - - - - - - -
HAWAII County
North Hawaii 134 37.7 (31.5-44.3) 180 62.3 (55.7-68.5) 314 27,754
Hilo 192 42.4 (36.9-48.1) 233 57.6 (51.9-63.1) 425 36,090
Puna/Ka'u 199 38.4 (33.0-44.1) 227 61.6 (55.9-67.0) 426 36,081
Kona 141 36.9 (30.9-43.3) 200 63.1 (56.7-69.1) 341 27,903
KAUAI County
Hanalei/Kapa'a 132 41.2 (34.4-48.3) 167 58.8 (51.7-65.6) 299 20,114
Lihue-Waimea 151 37.1 (31.2-43.5) 198 62.9 (56.5-68.8) 349 26,959
MAUI County
Lahaina/Wailuku 124 33.5 (27.1-40.5) 176 66.5 (59.5-72.9) 300 30,879
Kahului 130 37.1 (31.2-43.5) 203 62.9 (56.5-68.8) 333 31,985
Upcountry/Hana 166 35.0 (29.7-40.7) 217 65.0 (59.3-70.3) 383 34,042
Lanai 88 40.7 (32.7-49.2) 117 59.3 (50.8-67.3) 205 1,885
Molokai 118 34.6 (28.4-41.4) 158 65.4 (58.6-71.6) 276 8,090
Percentages are weighted to population characteristics.N = Cell Sample Size, % = Percentage, 95% C.I. = Confidence Interval at 95 percent probability level
Rows with Sample Size less than 50 or containing half-width of 95% CI greater than 10 have been suppressed.
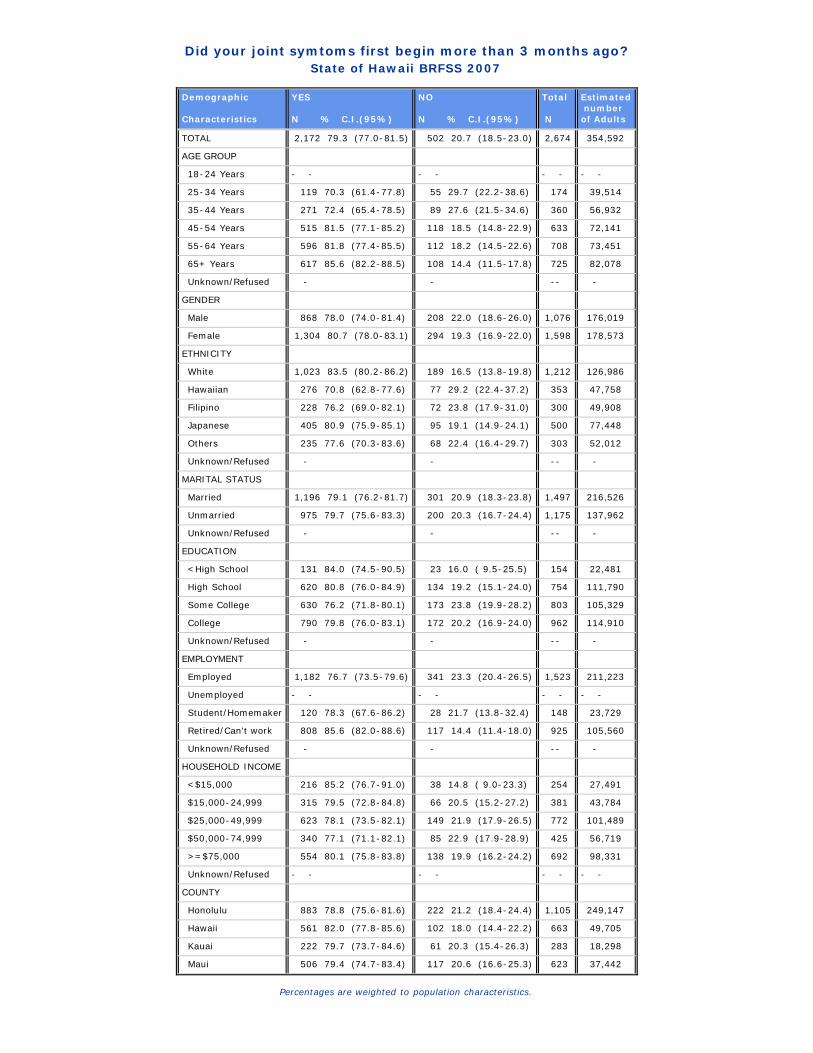
Did your joint symtoms first begin more than 3 months ago?State of Hawaii BRFSS 2007
Demographic Characteristics
YES N % C.I.(95%)
NO N % C.I.(95%)
Total N
Estimated numberof Adults
TOTAL 2,172 79.3 (77.0-81.5) 502 20.7 (18.5-23.0) 2,674 354,592
AGE GROUP
18-24 Years - - - - - - - -
25-34 Years 119 70.3 (61.4-77.8) 55 29.7 (22.2-38.6) 174 39,514
35-44 Years 271 72.4 (65.4-78.5) 89 27.6 (21.5-34.6) 360 56,932
45-54 Years 515 81.5 (77.1-85.2) 118 18.5 (14.8-22.9) 633 72,141
55-64 Years 596 81.8 (77.4-85.5) 112 18.2 (14.5-22.6) 708 73,451
65+ Years 617 85.6 (82.2-88.5) 108 14.4 (11.5-17.8) 725 82,078
Unknown/Refused - - -- -
GENDER
Male 868 78.0 (74.0-81.4) 208 22.0 (18.6-26.0) 1,076 176,019
Female 1,304 80.7 (78.0-83.1) 294 19.3 (16.9-22.0) 1,598 178,573
ETHNICITY
White 1,023 83.5 (80.2-86.2) 189 16.5 (13.8-19.8) 1,212 126,986
Hawaiian 276 70.8 (62.8-77.6) 77 29.2 (22.4-37.2) 353 47,758
Filipino 228 76.2 (69.0-82.1) 72 23.8 (17.9-31.0) 300 49,908
Japanese 405 80.9 (75.9-85.1) 95 19.1 (14.9-24.1) 500 77,448
Others 235 77.6 (70.3-83.6) 68 22.4 (16.4-29.7) 303 52,012
Unknown/Refused - - -- -
MARITAL STATUS
Married 1,196 79.1 (76.2-81.7) 301 20.9 (18.3-23.8) 1,497 216,526
Unmarried 975 79.7 (75.6-83.3) 200 20.3 (16.7-24.4) 1,175 137,962
Unknown/Refused - - -- -
EDUCATION
<High School 131 84.0 (74.5-90.5) 23 16.0 ( 9.5-25.5) 154 22,481
High School 620 80.8 (76.0-84.9) 134 19.2 (15.1-24.0) 754 111,790
Some College 630 76.2 (71.8-80.1) 173 23.8 (19.9-28.2) 803 105,329
College 790 79.8 (76.0-83.1) 172 20.2 (16.9-24.0) 962 114,910
Unknown/Refused - - -- -
EMPLOYMENT
Employed 1,182 76.7 (73.5-79.6) 341 23.3 (20.4-26.5) 1,523 211,223
Unemployed - - - - - - - -
Student/Homemaker 120 78.3 (67.6-86.2) 28 21.7 (13.8-32.4) 148 23,729
Retired/Can't work 808 85.6 (82.0-88.6) 117 14.4 (11.4-18.0) 925 105,560
Unknown/Refused - - -- -
HOUSEHOLD INCOME
<$15,000 216 85.2 (76.7-91.0) 38 14.8 ( 9.0-23.3) 254 27,491
$15,000-24,999 315 79.5 (72.8-84.8) 66 20.5 (15.2-27.2) 381 43,784
$25,000-49,999 623 78.1 (73.5-82.1) 149 21.9 (17.9-26.5) 772 101,489
$50,000-74,999 340 77.1 (71.1-82.1) 85 22.9 (17.9-28.9) 425 56,719
>=$75,000 554 80.1 (75.8-83.8) 138 19.9 (16.2-24.2) 692 98,331
Unknown/Refused - - - - - - - -
COUNTY
Honolulu 883 78.8 (75.6-81.6) 222 21.2 (18.4-24.4) 1,105 249,147
Hawaii 561 82.0 (77.8-85.6) 102 18.0 (14.4-22.2) 663 49,705
Kauai 222 79.7 (73.7-84.6) 61 20.3 (15.4-26.3) 283 18,298
Maui 506 79.4 (74.7-83.4) 117 20.6 (16.6-25.3) 623 37,442
Percentages are weighted to population characteristics.

Have you ever seen a doctor or other health professional for these joint symptoms?(Adults with joint symtoms first began more than 3 months ago)
State of Hawaii BRFSS 2007
Demographic Characteristics
YES N % C.I.(95%)
NO N % C.I.(95%)
Total N
Estimated numberof Adults
TOTAL 1,557 71.4 (68.6-74.1) 612 28.6 (25.9-31.4) 2,169 280,413
AGE GROUP
18-24 Years - - -- -
25-34 Years - - - - - - - -
35-44 Years 172 62.1 (54.5-69.1) 99 37.9 (30.9-45.5) 271 41,243
45-54 Years 350 68.2 (62.7-73.2) 165 31.8 (26.8-37.3) 515 58,790
55-64 Years 440 75.9 (70.9-80.2) 155 24.1 (19.8-29.1) 595 60,028
65+ Years 491 81.7 (77.5-85.2) 126 18.3 (14.8-22.5) 617 70,296
Unknown/Refused - - -- -
GENDER
Male 610 69.7 (65.0-74.1) 257 30.3 (25.9-35.0) 867 136,719
Female 947 73.0 (69.7-76.1) 355 27.0 (23.9-30.3) 1,302 143,694
ETHNICITY
White 735 71.4 (67.4-75.1) 287 28.6 (24.9-32.6) 1,022 105,484
Hawaiian 204 78.0 (71.2-83.6) 71 22.0 (16.4-28.8) 275 33,508
Filipino 155 68.7 (59.3-76.8) 73 31.3 (23.2-40.7) 228 38,011
Japanese 291 70.8 (64.5-76.4) 114 29.2 (23.6-35.5) 405 62,672
Others 169 69.5 (59.7-77.8) 65 30.5 (22.2-40.3) 234 40,309
Unknown/Refused - - -- -
MARITAL STATUS
Married 877 74.2 (70.9-77.2) 319 25.8 (22.8-29.1) 1,196 171,216
Unmarried 680 67.1 (61.9-71.9) 292 32.9 (28.1-38.1) 972 109,157
Unknown/Refused - - -- -
EDUCATION
<High School 96 76.9 (65.7-85.3) 34 23.1 (14.7-34.3) 130 18,399
High School 435 67.6 (61.8-73.0) 184 32.4 (27.0-38.2) 619 90,069
Some College 453 73.0 (67.7-77.7) 176 27.0 (22.3-32.3) 629 80,179
College 573 72.7 (68.3-76.6) 217 27.3 (23.4-31.7) 790 91,683
Unknown/Refused - - -- -
EMPLOYMENT
Employed 790 66.2 (62.2-70.0) 391 33.8 (30.0-37.8) 1,181 161,664
Unemployed - - - - - - - -
Student/Homemaker - - - - - - - -
Retired/Can't work 648 81.4 (77.6-84.7) 159 18.6 (15.3-22.4) 807 90,294
Unknown/Refused - - -- -
HOUSEHOLD INCOME
<$15,000 164 79.0 (70.3-85.6) 51 21.0 (14.4-29.7) 215 22,944
$15,000-24,999 233 72.7 (65.0-79.2) 82 27.3 (20.8-35.0) 315 34,791
$25,000-49,999 440 69.7 (63.7-75.2) 181 30.3 (24.8-36.3) 621 78,903
$50,000-74,999 242 71.4 (64.9-77.2) 98 28.6 (22.8-35.1) 340 43,714
>=$75,000 393 71.8 (66.7-76.5) 161 28.2 (23.5-33.3) 554 78,775
Unknown/Refused - - - - - - - -
COUNTY
Honolulu 641 71.6 (67.7-75.2) 239 28.4 (24.8-32.3) 880 195,344
Hawaii 395 70.1 (65.4-74.3) 166 29.9 (25.7-34.6) 561 40,760
Kauai 149 68.6 (60.7-75.6) 73 31.4 (24.4-39.3) 222 14,582
Maui 372 73.3 (67.8-78.2) 134 26.7 (21.8-32.2) 506 29,727
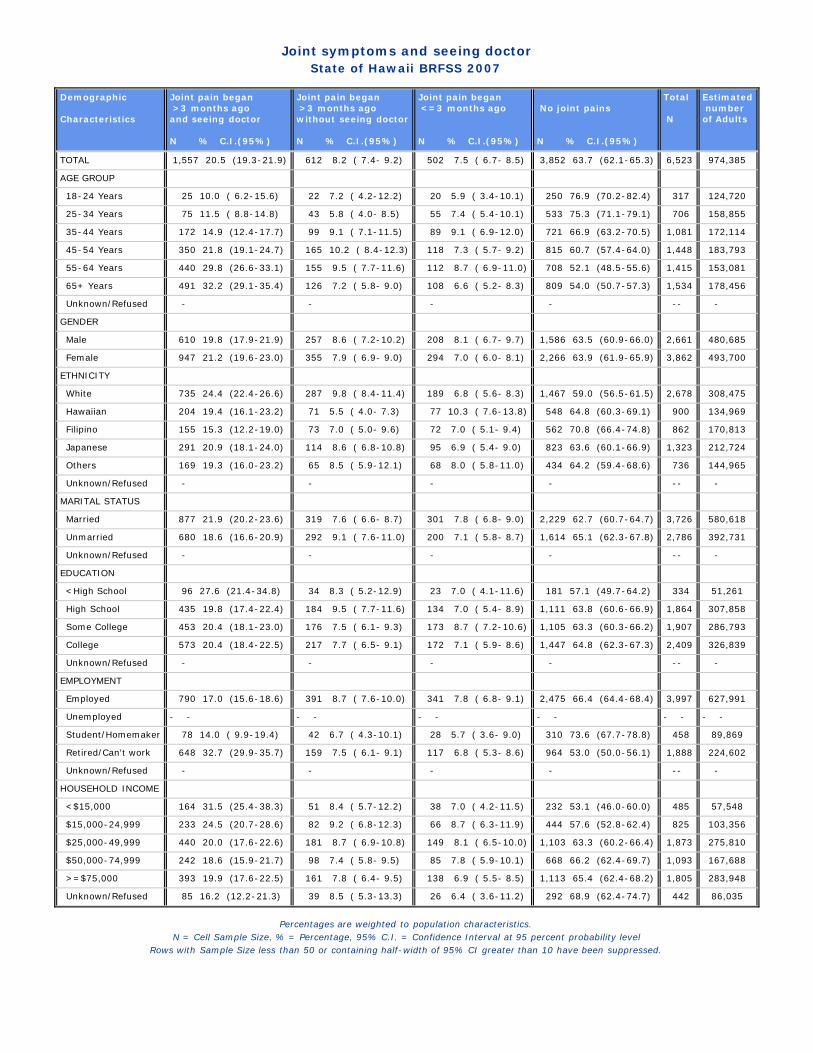
Joint symptoms and seeing doctorState of Hawaii BRFSS 2007
Demographic Characteristics
Joint pain began >3 months agoand seeing doctor N % C.I.(95%)
Joint pain began >3 months agowithout seeing doctor N % C.I.(95%)
Joint pain began <=3 months ago N % C.I.(95%)
No joint pains N % C.I.(95%)
Total N
Estimated numberof Adults
TOTAL 1,557 20.5 (19.3-21.9) 612 8.2 ( 7.4- 9.2) 502 7.5 ( 6.7- 8.5) 3,852 63.7 (62.1-65.3) 6,523 974,385
AGE GROUP
18-24 Years 25 10.0 ( 6.2-15.6) 22 7.2 ( 4.2-12.2) 20 5.9 ( 3.4-10.1) 250 76.9 (70.2-82.4) 317 124,720
25-34 Years 75 11.5 ( 8.8-14.8) 43 5.8 ( 4.0- 8.5) 55 7.4 ( 5.4-10.1) 533 75.3 (71.1-79.1) 706 158,855
35-44 Years 172 14.9 (12.4-17.7) 99 9.1 ( 7.1-11.5) 89 9.1 ( 6.9-12.0) 721 66.9 (63.2-70.5) 1,081 172,114
45-54 Years 350 21.8 (19.1-24.7) 165 10.2 ( 8.4-12.3) 118 7.3 ( 5.7- 9.2) 815 60.7 (57.4-64.0) 1,448 183,793
55-64 Years 440 29.8 (26.6-33.1) 155 9.5 ( 7.7-11.6) 112 8.7 ( 6.9-11.0) 708 52.1 (48.5-55.6) 1,415 153,081
65+ Years 491 32.2 (29.1-35.4) 126 7.2 ( 5.8- 9.0) 108 6.6 ( 5.2- 8.3) 809 54.0 (50.7-57.3) 1,534 178,456
Unknown/Refused - - - - -- -
GENDER
Male 610 19.8 (17.9-21.9) 257 8.6 ( 7.2-10.2) 208 8.1 ( 6.7- 9.7) 1,586 63.5 (60.9-66.0) 2,661 480,685
Female 947 21.2 (19.6-23.0) 355 7.9 ( 6.9- 9.0) 294 7.0 ( 6.0- 8.1) 2,266 63.9 (61.9-65.9) 3,862 493,700
ETHNICITY
White 735 24.4 (22.4-26.6) 287 9.8 ( 8.4-11.4) 189 6.8 ( 5.6- 8.3) 1,467 59.0 (56.5-61.5) 2,678 308,475
Hawaiian 204 19.4 (16.1-23.2) 71 5.5 ( 4.0- 7.3) 77 10.3 ( 7.6-13.8) 548 64.8 (60.3-69.1) 900 134,969
Filipino 155 15.3 (12.2-19.0) 73 7.0 ( 5.0- 9.6) 72 7.0 ( 5.1- 9.4) 562 70.8 (66.4-74.8) 862 170,813
Japanese 291 20.9 (18.1-24.0) 114 8.6 ( 6.8-10.8) 95 6.9 ( 5.4- 9.0) 823 63.6 (60.1-66.9) 1,323 212,724
Others 169 19.3 (16.0-23.2) 65 8.5 ( 5.9-12.1) 68 8.0 ( 5.8-11.0) 434 64.2 (59.4-68.6) 736 144,965
Unknown/Refused - - - - -- -
MARITAL STATUS
Married 877 21.9 (20.2-23.6) 319 7.6 ( 6.6- 8.7) 301 7.8 ( 6.8- 9.0) 2,229 62.7 (60.7-64.7) 3,726 580,618
Unmarried 680 18.6 (16.6-20.9) 292 9.1 ( 7.6-11.0) 200 7.1 ( 5.8- 8.7) 1,614 65.1 (62.3-67.8) 2,786 392,731
Unknown/Refused - - - - -- -
EDUCATION
<High School 96 27.6 (21.4-34.8) 34 8.3 ( 5.2-12.9) 23 7.0 ( 4.1-11.6) 181 57.1 (49.7-64.2) 334 51,261
High School 435 19.8 (17.4-22.4) 184 9.5 ( 7.7-11.6) 134 7.0 ( 5.4- 8.9) 1,111 63.8 (60.6-66.9) 1,864 307,858
Some College 453 20.4 (18.1-23.0) 176 7.5 ( 6.1- 9.3) 173 8.7 ( 7.2-10.6) 1,105 63.3 (60.3-66.2) 1,907 286,793
College 573 20.4 (18.4-22.5) 217 7.7 ( 6.5- 9.1) 172 7.1 ( 5.9- 8.6) 1,447 64.8 (62.3-67.3) 2,409 326,839
Unknown/Refused - - - - -- -
EMPLOYMENT
Employed 790 17.0 (15.6-18.6) 391 8.7 ( 7.6-10.0) 341 7.8 ( 6.8- 9.1) 2,475 66.4 (64.4-68.4) 3,997 627,991
Unemployed - - - - - - - - - - - -
Student/Homemaker 78 14.0 ( 9.9-19.4) 42 6.7 ( 4.3-10.1) 28 5.7 ( 3.6- 9.0) 310 73.6 (67.7-78.8) 458 89,869
Retired/Can't work 648 32.7 (29.9-35.7) 159 7.5 ( 6.1- 9.1) 117 6.8 ( 5.3- 8.6) 964 53.0 (50.0-56.1) 1,888 224,602
Unknown/Refused - - - - -- -
HOUSEHOLD INCOME
<$15,000 164 31.5 (25.4-38.3) 51 8.4 ( 5.7-12.2) 38 7.0 ( 4.2-11.5) 232 53.1 (46.0-60.0) 485 57,548
$15,000-24,999 233 24.5 (20.7-28.6) 82 9.2 ( 6.8-12.3) 66 8.7 ( 6.3-11.9) 444 57.6 (52.8-62.4) 825 103,356
$25,000-49,999 440 20.0 (17.6-22.6) 181 8.7 ( 6.9-10.8) 149 8.1 ( 6.5-10.0) 1,103 63.3 (60.2-66.4) 1,873 275,810
$50,000-74,999 242 18.6 (15.9-21.7) 98 7.4 ( 5.8- 9.5) 85 7.8 ( 5.9-10.1) 668 66.2 (62.4-69.7) 1,093 167,688
>=$75,000 393 19.9 (17.6-22.5) 161 7.8 ( 6.4- 9.5) 138 6.9 ( 5.5- 8.5) 1,113 65.4 (62.4-68.2) 1,805 283,948
Unknown/Refused 85 16.2 (12.2-21.3) 39 8.5 ( 5.3-13.3) 26 6.4 ( 3.6-11.2) 292 68.9 (62.4-74.7) 442 86,035
Percentages are weighted to population characteristics.N = Cell Sample Size, % = Percentage, 95% C.I. = Confidence Interval at 95 percent probability level
Rows with Sample Size less than 50 or containing half-width of 95% CI greater than 10 have been suppressed.

Joint symptoms and seeing doctorState of Hawaii BRFSS 2007
GEOGRAPHIC AREAS Joint pain began >3 months agoand seeing doctor N % C.I.(95%)
Joint pain began >3 months agowithout seeing doctor N % C.I.(95%)
Joint pain began <=3 months ago N % C.I.(95%)
No joint pains N % C.I.(95%)
Total N
Estimatednumberof Adults
STATE 1,557 20.5 (19.3-21.9) 612 8.2 ( 7.4- 9.2) 502 7.5 ( 6.7- 8.5) 3,852 63.7 (62.1-65.3) 6,523 974,385
COUNTY
Honolulu 641 20.2 (18.5-22.0) 239 8.0 ( 6.9- 9.3) 222 7.6 ( 6.5- 8.9) 1,776 64.2 (62.0-66.3) 2,878 693,072
Hawaii 395 22.4 (20.0-24.9) 166 9.6 ( 8.0-11.3) 102 7.0 ( 5.5- 8.8) 840 61.1 (58.0-64.0) 1,503 127,635
Kauai 149 21.3 (17.6-25.4) 73 9.7 ( 7.4-12.7) 61 7.9 ( 5.9-10.5) 365 61.1 (56.4-65.7) 648 47,072
Maui 372 20.5 (18.0-23.2) 134 7.4 ( 5.9- 9.3) 117 7.2 ( 5.7- 9.1) 871 64.9 (61.6-68.1) 1,494 106,606
HONOLULU County
North Shore/Laie - - - - - - - - - - - -
Ka'a'wa/Kahalu'u/Kaneohe 45 18.7 (13.4-25.5) 14 5.7 ( 3.2- 9.7) 20 13.1 ( 8.0-20.5) 132 62.6 (54.5-70.0) 211 48,871
Kailua/Waimanalo 57 21.0 (15.9-27.2) 20 7.3 ( 4.5-11.7) 29 11.0 ( 7.4-16.0) 130 60.7 (53.4-67.5) 236 52,308
Wailae/Kahala/HawaiiKai 34 16.7 (11.6-23.4) 15 8.7 ( 4.8-15.1) 10 6.3 ( 3.3-11.5) 113 68.4 (60.1-75.6) 172 38,110
Kaimuki/Palolo/Waikiki 69 24.5 (19.0-31.1) 26 10.9 ( 6.3-18.3) 14 4.0 ( 2.2- 7.2) 165 60.5 (53.1-67.6) 274 54,616
Manoa/Upper Makiki 60 21.0 (15.9-27.1) 13 6.5 ( 3.3-12.6) 16 8.3 ( 4.7-14.2) 148 64.2 (56.7-71.0) 237 44,505
Ala Moana 45 27.3 (20.0-36.2) 14 8.5 ( 4.8-14.7) 14 9.1 ( 5.2-15.4) 83 55.1 (45.9-63.9) 156 29,128
Nuuanu/Kalihi/MoanaLoa 44 19.2 (13.2-27.2) 27 8.6 ( 5.6-13.0) 19 6.6 ( 3.8-11.3) 159 65.6 (57.6-72.7) 249 66,203
Salt Lake/Foster Village 15 10.5 ( 5.9-18.0) 9 6.7 ( 3.3-13.2) 9 5.1 ( 2.4-10.4) 88 77.6 (68.7-84.6) 121 28,497
Aiea/Pearl City 66 22.2 (16.9-28.5) 21 7.1 ( 4.3-11.6) 26 9.2 ( 6.0-14.0) 164 61.5 (54.4-68.1) 277 68,141
Mililani/Wahiawa 55 17.7 (13.2-23.3) 20 7.1 ( 4.4-11.3) 19 6.0 ( 3.6- 9.7) 199 69.2 (62.8-74.9) 293 73,387
Waipahu/Kapolei/Ewa 90 18.2 (14.5-22.7) 40 9.1 ( 6.3-13.0) 30 6.7 ( 4.4-10.2) 283 65.9 (60.5-71.0) 443 128,902
Nanakuli/Waianae - - - - - - - - - - - -
HAWAII County
North Hawaii 76 18.7 (14.5-23.6) 39 11.3 ( 8.0-15.8) 19 7.7 ( 4.4-13.3) 180 62.3 (55.7-68.5) 314 27,754
Hilo 116 26.6 (21.7-32.2) 38 7.9 ( 5.5-11.3) 37 7.7 ( 5.4-10.9) 233 57.7 (52.0-63.3) 424 36,006
Puna/Ka'u 127 24.1 (19.8-29.0) 46 8.4 ( 5.9-11.6) 24 5.7 ( 3.6- 9.0) 227 61.8 (56.1-67.2) 424 35,972
Kona 76 18.4 (14.3-23.3) 43 11.5 ( 8.2-15.9) 22 7.0 ( 4.0-12.0) 200 63.1 (56.7-69.1) 341 27,903
KAUAI County
Hanalei/Kapa'a 75 26.3 (20.5-33.1) 26 6.8 ( 4.2-10.7) 31 8.1 ( 5.3-12.3) 167 58.8 (51.7-65.6) 299 20,114
Lihue-Waimea 74 17.5 (13.2-22.8) 47 11.9 ( 8.5-16.5) 30 7.7 ( 5.2-11.2) 198 62.9 (56.5-68.8) 349 26,959
MAUI County
Lahaina/Wailuku 72 17.7 (13.3-23.2) 27 8.0 ( 5.1-12.3) 24 7.6 ( 4.6-12.1) 176 66.7 (59.7-73.1) 299 30,773
Kahului 82 23.3 (18.4-29.1) 26 7.2 ( 4.6-11.0) 21 6.4 ( 3.9-10.3) 203 63.1 (56.7-69.0) 332 31,884
Upcountry/Hana 97 20.3 (16.2-25.0) 35 7.1 ( 4.8-10.3) 33 7.6 ( 5.2-10.9) 217 65.1 (59.4-70.4) 382 33,974
Lanai 46 20.1 (14.3-27.6) 23 11.4 ( 7.2-17.8) 19 9.1 ( 5.0-16.0) 117 59.3 (50.8-67.3) 205 1,885
Molokai 75 20.4 (15.8-26.0) 23 7.0 ( 4.2-11.2) 20 7.2 ( 4.4-11.7) 158 65.4 (58.6-71.6) 276 8,090
Percentages are weighted to population characteristics.N = Cell Sample Size, % = Percentage, 95% C.I. = Confidence Interval at 95 percent probability level
Rows with Sample Size less than 50 or containing half-width of 95% CI greater than 10 have been suppressed.

Ever been told by a doctor/health professional you have some form of arthritisState of Hawaii BRFSS 2007
Demographic Characteristics
YES N % C.I.(95%)
NO N % C.I.(95%)
Total N
Estimated numberof Adults
TOTAL 1,885 24.1 (22.8-25.5) 4,638 75.9 (74.5-77.2) 6,523 975,811
AGE GROUP
18-24 Years 12 4.4 ( 2.2- 8.6) 306 95.6 (91.4-97.8) 318 125,211
25-34 Years 60 9.0 ( 6.7-11.9) 642 91.0 (88.1-93.3) 702 158,618
35-44 Years 162 15.2 (12.6-18.2) 920 84.8 (81.8-87.4) 1,082 172,583
45-54 Years 363 24.2 (21.4-27.2) 1,085 75.8 (72.8-78.6) 1,448 184,090
55-64 Years 552 38.8 (35.4-42.4) 861 61.2 (57.6-64.6) 1,413 152,726
65+ Years 731 47.5 (44.2-50.8) 806 52.5 (49.2-55.8) 1,537 179,067
Unknown/Refused - - -- -
GENDER
Male 719 21.8 (19.9-23.9) 1,940 78.2 (76.1-80.1) 2,659 480,988
Female 1,166 26.4 (24.6-28.2) 2,698 73.6 (71.8-75.4) 3,864 494,823
ETHNICITY
White 815 26.1 (24.0-28.2) 1,857 73.9 (71.8-76.0) 2,672 308,144
Hawaiian 247 23.2 (19.7-27.2) 653 76.8 (72.8-80.3) 900 135,435
Filipino 224 21.7 (18.2-25.6) 642 78.3 (74.4-81.8) 866 171,680
Japanese 396 26.2 (23.3-29.2) 931 73.8 (70.8-76.7) 1,327 213,247
Others 197 20.9 (17.5-24.6) 538 79.1 (75.4-82.5) 735 144,895
Unknown/Refused - - -- -
MARITAL STATUS
Married 1,037 26.1 (24.3-27.9) 2,683 73.9 (72.1-75.7) 3,720 580,124
Unmarried 847 21.3 (19.3-23.5) 1,944 78.7 (76.5-80.7) 2,791 394,502
Unknown/Refused - - -- -
EDUCATION
<High School 135 38.4 (31.3-45.9) 200 61.6 (54.1-68.7) 335 51,958
High School 556 24.2 (21.7-26.9) 1,308 75.8 (73.1-78.3) 1,864 308,537
Some College 564 23.6 (21.3-26.1) 1,347 76.4 (73.9-78.7) 1,911 287,148
College 629 22.3 (20.3-24.5) 1,775 77.7 (75.5-79.7) 2,404 326,535
Unknown/Refused - - -- -
EMPLOYMENT
Employed 850 18.1 (16.6-19.7) 3,143 81.9 (80.3-83.4) 3,993 628,249
Unemployed 49 17.3 (11.7-24.8) 129 82.7 (75.2-88.3) 178 32,093
Student/Homemaker 90 13.8 (10.6-17.7) 364 86.2 (82.3-89.4) 454 89,511
Retired/Can't work 895 46.0 (42.9-49.0) 999 54.0 (51.0-57.1) 1,894 225,538
Unknown/Refused - - -- -
HOUSEHOLD INCOME
<$15,000 197 33.2 (27.3-39.8) 290 66.8 (60.2-72.7) 487 58,194
$15,000-24,999 283 31.0 (26.7-35.6) 536 69.0 (64.4-73.3) 819 102,854
$25,000-49,999 579 25.9 (23.4-28.6) 1,302 74.1 (71.4-76.6) 1,881 277,365
$50,000-74,999 269 20.8 (17.9-24.0) 822 79.2 (76.0-82.1) 1,091 167,610
>=$75,000 448 20.9 (18.7-23.3) 1,356 79.1 (76.7-81.3) 1,804 283,946
Unknown/Refused 109 21.2 (16.3-27.0) 332 78.8 (73.0-83.7) 441 85,842
Percentages are weighted to population characteristics.N = Cell Sample Size, % = Percentage, 95% C.I. = Confidence Interval at 95 percent probability level
Rows with Sample Size less than 50 or containing half-width of 95% CI greater than 10 have been suppressed.

Ever been told by a doctor/health professional you have some form of arthritisState of Hawaii BRFSS 2007
GEOGRAPHIC AREAS YES N % C.I.(95%)
NO N % C.I.(95%)
Total N
Estimatednumberof Adults
STATE 1,885 24.1 (22.8-25.5) 4,638 75.9 (74.5-77.2) 6,523 975,811
COUNTY
Honolulu 808 24.1 (22.3-25.9) 2,075 75.9 (74.1-77.7) 2,883 694,626
Hawaii 449 24.5 (22.1-27.0) 1,055 75.5 (73.0-77.9) 1,504 127,922
Kauai 195 26.5 (22.6-30.8) 447 73.5 (69.2-77.4) 642 46,764
Maui 433 23.2 (20.5-26.2) 1,061 76.8 (73.8-79.5) 1,494 106,499
HONOLULU County
North Shore/Laie - - - - - - - -
Ka'a'wa/Kahalu'u/Kaneohe 57 20.8 (15.5-27.3) 156 79.2 (72.7-84.5) 213 49,240
Kailua/Waimanalo 82 33.8 (26.9-41.4) 153 66.2 (58.6-73.1) 235 52,148
Wailae/Kahala/HawaiiKai 38 18.2 (13.0-24.9) 134 81.8 (75.1-87.0) 172 38,051
Kaimuki/Palolo/Waikiki 80 28.1 (22.3-34.8) 193 71.9 (65.2-77.7) 273 54,415
Manoa/Upper Makiki 73 25.3 (19.9-31.6) 165 74.7 (68.4-80.1) 238 44,719
Ala Moana 47 26.1 (19.1-34.7) 109 73.9 (65.3-80.9) 156 29,128
Nuuanu/Kalihi/MoanaLoa 64 22.1 (16.7-28.7) 186 77.9 (71.3-83.3) 250 66,562
Salt Lake/Foster Village 27 18.9 (12.5-27.6) 95 81.1 (72.4-87.5) 122 28,566
Aiea/Pearl City 90 26.7 (21.2-32.9) 184 73.3 (67.1-78.8) 274 67,758
Mililani/Wahiawa 70 21.2 (16.5-26.8) 225 78.8 (73.2-83.5) 295 74,130
Waipahu/Kapolei/Ewa 106 20.8 (16.9-25.3) 337 79.2 (74.7-83.1) 443 128,902
Nanakuli/Waianae 43 27.6 (19.2-38.0) 82 72.4 (62.0-80.8) 125 39,213
HAWAII County
North Hawaii 84 21.4 (16.9-26.9) 230 78.6 (73.1-83.1) 314 27,754
Hilo 135 26.6 (22.2-31.5) 288 73.4 (68.5-77.8) 423 35,999
Puna/Ka'u 132 25.4 (20.9-30.5) 294 74.6 (69.5-79.1) 426 36,266
Kona 98 23.7 (18.9-29.3) 243 76.3 (70.7-81.1) 341 27,903
KAUAI County
Hanalei/Kapa'a 87 30.6 (24.2-37.8) 209 69.4 (62.2-75.8) 296 20,010
Lihue-Waimea 108 23.4 (18.9-28.6) 238 76.6 (71.4-81.1) 346 26,753
MAUI County
Lahaina/Wailuku 85 21.9 (16.9-27.9) 214 78.1 (72.1-83.1) 299 30,799
Kahului 103 27.1 (21.9-33.0) 228 72.9 (67.0-78.1) 331 31,748
Upcountry/Hana 94 20.9 (16.4-26.3) 288 79.1 (73.7-83.6) 382 33,974
Lanai 74 33.1 (25.7-41.4) 132 66.9 (58.6-74.3) 206 1,888
Molokai 77 20.5 (15.9-26.0) 199 79.5 (74.0-84.1) 276 8,090
Percentages are weighted to population characteristics.N = Cell Sample Size, % = Percentage, 95% C.I. = Confidence Interval at 95 percent probability level
Rows with Sample Size less than 50 or containing half-width of 95% CI greater than 10 have been suppressed.

Joint symptoms and arthritisState of Hawaii BRFSS 2007
Demographic Characteristics
Have joint symptomsand have been toldof arthritis N % C.I.(95%)
Have joint symptomsbut have NOT been toldof arthritis N % C.I.(95%)
No joint symptoms but have been toldof arthritis N % C.I.(95%)
No joint symptomsand have not been toldof arthritis N % C.I.(95%)
Total N
Estimated numberof Adults
TOTAL 1,325 16.2 (15.1-17.4) 1,347 20.2 (18.8-21.6) 557 7.9 ( 7.0- 8.8) 3,286 55.7 (54.0-57.4) 6,515 974,653
AGE GROUP
18-24 Years 8 2.4 ( 1.0- 5.6) 60 21.0 (15.7-27.6) 4 2.0 ( 0.7- 6.0) 246 74.5 (67.7-80.3) 318 125,211
25-34 Years 31 4.7 ( 3.0- 7.1) 140 20.0 (16.5-24.0) 29 4.3 ( 2.8- 6.4) 502 71.0 (66.6-75.1) 702 158,618
35-44 Years 110 10.4 ( 8.3-13.0) 249 22.7 (19.6-26.2) 52 4.8 ( 3.3- 6.9) 669 62.1 (58.3-65.8) 1,080 172,238
45-54 Years 264 16.3 (14.0-19.0) 370 23.0 (20.4-25.9) 98 7.8 ( 6.2- 9.9) 715 52.8 (49.4-56.1) 1,447 184,052
55-64 Years 405 27.3 (24.2-30.5) 301 20.7 (18.0-23.7) 146 11.5 ( 9.3-14.2) 559 40.5 (37.0-44.1) 1,411 152,654
65+ Years 504 32.4 (29.3-35.6) 224 13.8 (11.8-16.1) 226 15.0 (12.8-17.6) 581 38.8 (35.7-42.0) 1,535 178,514
Unknown/Refused - - - - -- -
GENDER
Male 495 14.2 (12.6-15.9) 578 22.4 (20.2-24.8) 224 7.7 ( 6.5- 9.2) 1,359 55.7 (53.1-58.3) 2,656 480,579
Female 830 18.3 (16.8-19.9) 769 18.0 (16.5-19.6) 333 8.0 ( 7.0- 9.2) 1,927 55.7 (53.6-57.8) 3,859 494,074
ETHNICITY
White 589 18.1 (16.3-20.0) 623 23.1 (21.0-25.4) 226 8.0 ( 6.7- 9.4) 1,233 50.8 (48.2-53.4) 2,671 307,994
Hawaiian 180 15.8 (13.0-19.0) 171 19.6 (16.0-23.7) 67 7.5 ( 5.3-10.5) 481 57.2 (52.5-61.7) 899 135,346
Filipino 153 14.0 (11.3-17.3) 148 15.3 (12.2-19.0) 69 7.5 ( 5.5-10.3) 492 63.2 (58.5-67.6) 862 171,022
Japanese 249 16.4 (14.0-19.0) 254 20.2 (17.3-23.3) 147 9.8 ( 8.1-12.0) 676 53.7 (50.1-57.1) 1,326 213,052
Others 150 15.3 (12.5-18.7) 150 20.4 (16.6-24.9) 46 5.5 ( 3.9- 7.7) 388 58.8 (54.0-63.4) 734 144,826
Unknown/Refused - - - - -- -
MARITAL STATUS
Married 724 17.6 (16.1-19.1) 772 19.8 (18.2-21.4) 313 8.5 ( 7.5- 9.7) 1,911 54.2 (52.1-56.2) 3,720 580,124
Unmarried 601 14.4 (12.8-16.1) 573 20.8 (18.4-23.4) 243 6.9 ( 5.7- 8.4) 1,367 58.0 (55.0-60.8) 2,784 393,493
Unknown/Refused - - - - -- -
EDUCATION
<High School 92 24.1 (18.4-31.0) 61 19.1 (13.9-25.7) 42 13.9 ( 9.1-20.5) 138 42.9 (35.8-50.3) 333 51,511
High School 381 16.2 (14.2-18.5) 369 20.0 (17.4-22.9) 173 8.0 ( 6.5- 9.8) 937 55.7 (52.4-59.0) 1,860 307,978
Some College 408 16.4 (14.4-18.5) 398 20.4 (18.0-23.1) 156 7.3 ( 6.0- 8.9) 947 55.9 (52.8-59.0) 1,909 286,995
College 444 15.0 (13.4-16.8) 518 20.3 (18.2-22.5) 185 7.3 ( 6.1- 8.8) 1,257 57.4 (54.8-60.0) 2,404 326,535
Unknown/Refused - - - - -- -
EMPLOYMENT
Employed 594 11.9 (10.7-13.2) 928 21.8 (20.1-23.6) 255 6.2 ( 5.3- 7.4) 2,213 60.1 (58.0-62.2) 3,990 627,920
Unemployed - - - - - - - - - - - -
Student/Homemaker 64 9.6 ( 7.0-13.1) 80 16.5 (12.0-22.3) 26 4.2 ( 2.6- 6.5) 284 69.7 (63.7-75.1) 454 89,511
Retired/Can't work 632 31.6 (28.8-34.5) 297 15.6 (13.5-17.9) 262 14.4 (12.3-16.7) 700 38.5 (35.6-41.5) 1,891 224,835
Unknown/Refused - - - - -- -
HOUSEHOLD INCOME
<$15,000 157 27.5 (22.0-33.8) 97 19.9 (14.7-26.4) 38 5.6 ( 3.4- 9.2) 192 46.9 (39.9-54.0) 484 57,999
$15,000-24,999 204 20.9 (17.4-24.8) 172 21.2 (17.5-25.5) 79 10.1 ( 7.3-13.8) 364 47.8 (42.9-52.8) 819 102,854
$25,000-49,999 397 16.8 (14.8-19.0) 380 20.2 (17.5-23.0) 181 9.1 ( 7.5-11.0) 919 54.0 (50.7-57.2) 1,877 276,551
$50,000-74,999 183 12.5 (10.4-15.0) 240 21.3 (18.3-24.6) 86 8.3 ( 6.4-10.6) 582 57.9 (54.0-61.8) 1,091 167,610
>=$75,000 307 14.0 (12.2-16.0) 386 20.7 (18.2-23.3) 141 6.9 ( 5.6- 8.4) 970 58.4 (55.4-61.4) 1,804 283,946
Unknown/Refused 77 15.9 (11.7-21.3) 72 15.2 (10.9-20.7) 32 5.3 ( 3.1- 8.9) 259 63.6 (57.0-69.8) 440 85,692
Percentages are weighted to population characteristics.N = Cell Sample Size, % = Percentage, 95% C.I. = Confidence Interval at 95 percent probability level
Rows with Sample Size less than 50 or containing half-width of 95% CI greater than 10 have been suppressed.

Joint symptoms and arthritisState of Hawaii BRFSS 2007
GEOGRAPHIC AREAS Have joint symptomsand have been toldof arthritis N % C.I.(95%)
Have joint symptomsbut have NOT been toldof arthritis N % C.I.(95%)
No joint symptoms but have been toldof arthritis N % C.I.(95%)
No joint symptomsand have not been toldof arthritis N % C.I.(95%)
Total N
Estimatednumberof Adults
STATE 1,325 16.2 (15.1-17.4) 1,347 20.2 (18.8-21.6) 557 7.9 ( 7.0- 8.8) 3,286 55.7 (54.0-57.4) 6,515 974,653
COUNTY
Honolulu 531 15.7 (14.2-17.2) 575 20.3 (18.5-22.2) 275 8.4 ( 7.3- 9.6) 1,498 55.7 (53.4-57.9) 2,879 693,854
Hawaii 341 18.6 (16.5-20.9) 322 20.4 (18.0-23.0) 107 6.0 ( 4.8- 7.4) 732 55.1 (52.0-58.1) 1,502 127,627
Kauai 141 19.4 (16.0-23.2) 140 19.4 (16.0-23.4) 54 7.1 ( 5.1- 9.8) 307 54.1 (49.2-58.9) 642 46,764
Maui 312 15.9 (13.8-18.4) 310 19.2 (16.7-22.0) 121 7.3 ( 5.7- 9.4) 749 57.6 (54.0-61.0) 1,492 106,408
HONOLULU County
North Shore/Laie - - - - - - - - - - - -
Ka'a'wa/Kahalu'u/Kaneohe 37 14.0 ( 9.7-19.7) 44 23.9 (17.4-31.8) 20 6.8 ( 4.0-11.3) 112 55.4 (47.3-63.1) 213 49,240
Kailua/Waimanalo 53 20.0 (15.0-26.1) 53 19.5 (14.6-25.5) 29 13.8 ( 8.8-21.0) 100 46.7 (39.2-54.4) 235 52,148
Wailae/Kahala/HawaiiKai 24 10.6 ( 6.9-16.0) 36 21.4 (15.2-29.2) 14 7.6 ( 4.3-13.0) 98 60.4 (51.8-68.3) 172 38,051
Kaimuki/Palolo/Waikiki 56 18.6 (13.9-24.4) 52 20.6 (14.7-28.2) 24 9.5 ( 6.1-14.5) 141 51.3 (43.9-58.5) 273 54,415
Manoa/Upper Makiki 47 15.7 (11.5-21.1) 42 20.3 (14.5-27.6) 25 9.5 ( 6.3-14.0) 123 54.5 (47.1-61.8) 237 44,651
Ala Moana 33 20.1 (13.6-28.5) 40 24.9 (18.1-33.2) 14 6.1 ( 3.5-10.3) 69 49.0 (39.9-58.2) 156 29,128
Nuuanu/Kalihi/MoanaLoa 41 13.6 ( 9.5-19.1) 49 20.9 (14.7-28.8) 22 8.1 ( 4.9-13.1) 137 57.4 (49.5-65.0) 249 66,203
Salt Lake/Foster Village 15 8.9 ( 5.0-15.4) 19 13.7 ( 8.3-21.6) 12 10.0 ( 5.5-17.7) 76 67.4 (57.6-75.9) 122 28,566
Aiea/Pearl City 62 19.4 (14.8-25.0) 49 18.9 (13.8-25.5) 28 7.3 ( 4.6-11.4) 135 54.4 (47.1-61.5) 274 67,758
Mililani/Wahiawa 36 10.4 ( 7.3-14.6) 60 21.1 (16.1-27.1) 34 10.8 ( 7.3-15.6) 165 57.7 (51.1-64.1) 295 74,130
Waipahu/Kapolei/Ewa 71 14.7 (11.4-18.8) 89 19.4 (15.3-24.2) 35 6.1 ( 4.1- 8.8) 248 59.8 (54.3-65.1) 443 128,902
Nanakuli/Waianae - - - - - - - - - - - -
HAWAII County
North Hawaii 60 14.1 (10.7-18.5) 74 23.5 (18.3-29.8) 24 7.3 ( 4.5-11.5) 156 55.0 (48.2-61.6) 314 27,754
Hilo 99 19.9 (16.1-24.4) 92 22.5 (17.8-28.0) 36 6.7 ( 4.6- 9.5) 196 50.9 (45.2-56.6) 423 35,999
Puna/Ka'u 109 21.3 (17.2-26.1) 88 16.9 (13.3-21.2) 22 4.2 ( 2.6- 6.7) 205 57.6 (51.7-63.2) 424 35,971
Kona 73 17.8 (13.5-22.9) 68 19.1 (14.6-24.5) 25 5.9 ( 3.8- 9.1) 175 57.2 (50.7-63.5) 341 27,903
KAUAI County
Hanalei/Kapa'a 65 23.7 (18.0-30.5) 66 17.6 (13.3-22.8) 22 6.9 ( 3.9-11.8) 143 51.9 (44.6-59.0) 296 20,010
Lihue-Waimea 76 16.1 (12.4-20.6) 74 20.8 (16.0-26.6) 32 7.3 ( 4.9-10.8) 164 55.8 (49.2-62.1) 346 26,753
MAUI County
Lahaina/Wailuku 60 14.0 (10.3-18.8) 62 19.1 (14.2-25.2) 25 7.9 ( 5.0-12.4) 151 58.9 (51.4-66.0) 298 30,711
Kahului 71 19.8 (15.2-25.3) 58 17.3 (13.1-22.6) 32 7.3 ( 5.0-10.7) 170 55.5 (49.1-61.8) 331 31,748
Upcountry/Hana 72 13.9 (10.7-17.8) 93 21.0 (16.7-26.0) 22 7.0 ( 3.9-12.1) 195 58.1 (52.0-64.0) 382 33,974
Lanai 46 19.0 (13.5-26.1) 42 21.7 (15.3-29.8) 28 14.1 ( 9.0-21.5) 89 45.2 (37.1-53.6) 205 1,885
Molokai 63 16.0 (12.1-20.8) 55 18.7 (13.9-24.7) 14 4.5 ( 2.5- 8.0) 144 60.8 (53.8-67.4) 276 8,090
Percentages are weighted to population characteristics.N = Cell Sample Size, % = Percentage, 95% C.I. = Confidence Interval at 95 percent probability level
Rows with Sample Size less than 50 or containing half-width of 95% CI greater than 10 have been suppressed.
GASTROINSTESTINAL DISEASE
There are three questions about diarrhea and medical care for diarrheal illness.
Diarrhea is defined as 3 or more loose stools or bowel movements in a 24-hour period.
1. In the past 30 days, did you have diarrhea that began within the 30 day period?
Adults who answered “YES” were asked
2. Did you visit a doctor, nurse or other health professional for this diarrheal illness?
(Note: Do not answer “Yes” if you just had telephone contact with a health professional.)
Adults who answered “YES” were asked
3. When you visited your health care professional, did you provide a stool sample for
testing?
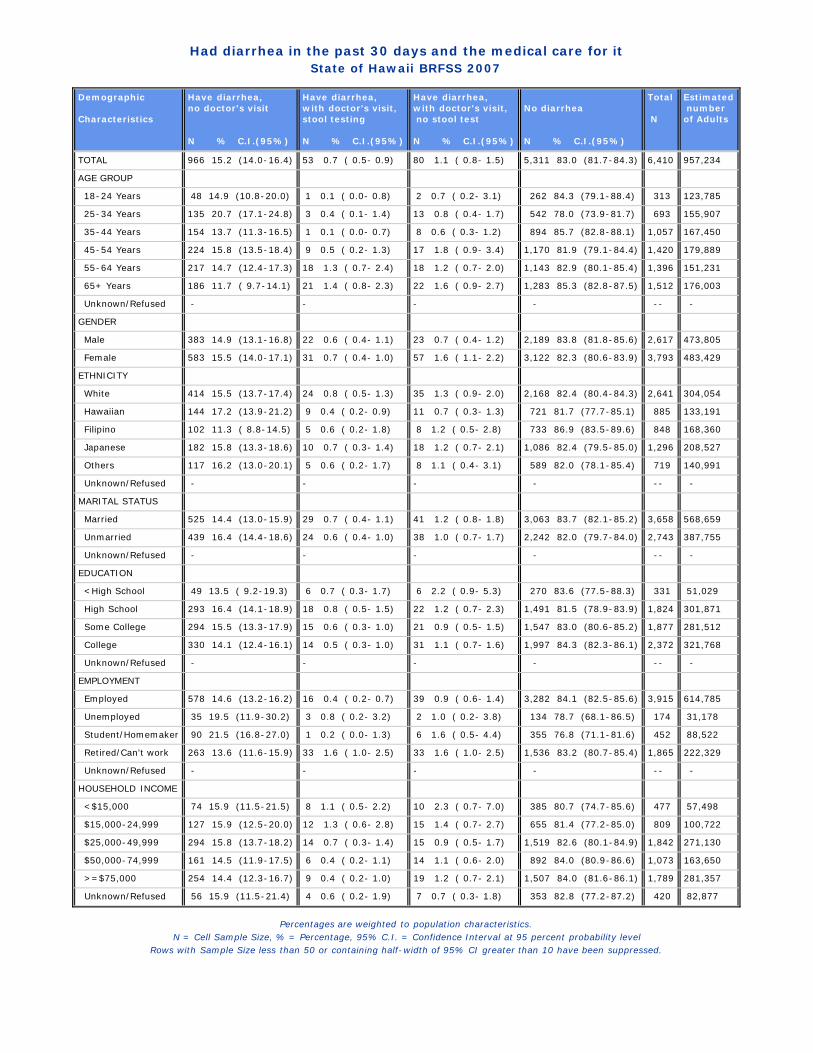
Had diarrhea in the past 30 days and the medical care for itState of Hawaii BRFSS 2007
Demographic Characteristics
Have diarrhea,no doctor's visit N % C.I.(95%)
Have diarrhea,with doctor's visit,stool testing N % C.I.(95%)
Have diarrhea,with doctor's visit, no stool test N % C.I.(95%)
No diarrhea N % C.I.(95%)
Total N
Estimated numberof Adults
TOTAL 966 15.2 (14.0-16.4) 53 0.7 ( 0.5- 0.9) 80 1.1 ( 0.8- 1.5) 5,311 83.0 (81.7-84.3) 6,410 957,234
AGE GROUP
18-24 Years 48 14.9 (10.8-20.0) 1 0.1 ( 0.0- 0.8) 2 0.7 ( 0.2- 3.1) 262 84.3 (79.1-88.4) 313 123,785
25-34 Years 135 20.7 (17.1-24.8) 3 0.4 ( 0.1- 1.4) 13 0.8 ( 0.4- 1.7) 542 78.0 (73.9-81.7) 693 155,907
35-44 Years 154 13.7 (11.3-16.5) 1 0.1 ( 0.0- 0.7) 8 0.6 ( 0.3- 1.2) 894 85.7 (82.8-88.1) 1,057 167,450
45-54 Years 224 15.8 (13.5-18.4) 9 0.5 ( 0.2- 1.3) 17 1.8 ( 0.9- 3.4) 1,170 81.9 (79.1-84.4) 1,420 179,889
55-64 Years 217 14.7 (12.4-17.3) 18 1.3 ( 0.7- 2.4) 18 1.2 ( 0.7- 2.0) 1,143 82.9 (80.1-85.4) 1,396 151,231
65+ Years 186 11.7 ( 9.7-14.1) 21 1.4 ( 0.8- 2.3) 22 1.6 ( 0.9- 2.7) 1,283 85.3 (82.8-87.5) 1,512 176,003
Unknown/Refused - - - - -- -
GENDER
Male 383 14.9 (13.1-16.8) 22 0.6 ( 0.4- 1.1) 23 0.7 ( 0.4- 1.2) 2,189 83.8 (81.8-85.6) 2,617 473,805
Female 583 15.5 (14.0-17.1) 31 0.7 ( 0.4- 1.0) 57 1.6 ( 1.1- 2.2) 3,122 82.3 (80.6-83.9) 3,793 483,429
ETHNICITY
White 414 15.5 (13.7-17.4) 24 0.8 ( 0.5- 1.3) 35 1.3 ( 0.9- 2.0) 2,168 82.4 (80.4-84.3) 2,641 304,054
Hawaiian 144 17.2 (13.9-21.2) 9 0.4 ( 0.2- 0.9) 11 0.7 ( 0.3- 1.3) 721 81.7 (77.7-85.1) 885 133,191
Filipino 102 11.3 ( 8.8-14.5) 5 0.6 ( 0.2- 1.8) 8 1.2 ( 0.5- 2.8) 733 86.9 (83.5-89.6) 848 168,360
Japanese 182 15.8 (13.3-18.6) 10 0.7 ( 0.3- 1.4) 18 1.2 ( 0.7- 2.1) 1,086 82.4 (79.5-85.0) 1,296 208,527
Others 117 16.2 (13.0-20.1) 5 0.6 ( 0.2- 1.7) 8 1.1 ( 0.4- 3.1) 589 82.0 (78.1-85.4) 719 140,991
Unknown/Refused - - - - -- -
MARITAL STATUS
Married 525 14.4 (13.0-15.9) 29 0.7 ( 0.4- 1.1) 41 1.2 ( 0.8- 1.8) 3,063 83.7 (82.1-85.2) 3,658 568,659
Unmarried 439 16.4 (14.4-18.6) 24 0.6 ( 0.4- 1.0) 38 1.0 ( 0.7- 1.7) 2,242 82.0 (79.7-84.0) 2,743 387,755
Unknown/Refused - - - - -- -
EDUCATION
<High School 49 13.5 ( 9.2-19.3) 6 0.7 ( 0.3- 1.7) 6 2.2 ( 0.9- 5.3) 270 83.6 (77.5-88.3) 331 51,029
High School 293 16.4 (14.1-18.9) 18 0.8 ( 0.5- 1.5) 22 1.2 ( 0.7- 2.3) 1,491 81.5 (78.9-83.9) 1,824 301,871
Some College 294 15.5 (13.3-17.9) 15 0.6 ( 0.3- 1.0) 21 0.9 ( 0.5- 1.5) 1,547 83.0 (80.6-85.2) 1,877 281,512
College 330 14.1 (12.4-16.1) 14 0.5 ( 0.3- 1.0) 31 1.1 ( 0.7- 1.6) 1,997 84.3 (82.3-86.1) 2,372 321,768
Unknown/Refused - - - - -- -
EMPLOYMENT
Employed 578 14.6 (13.2-16.2) 16 0.4 ( 0.2- 0.7) 39 0.9 ( 0.6- 1.4) 3,282 84.1 (82.5-85.6) 3,915 614,785
Unemployed 35 19.5 (11.9-30.2) 3 0.8 ( 0.2- 3.2) 2 1.0 ( 0.2- 3.8) 134 78.7 (68.1-86.5) 174 31,178
Student/Homemaker 90 21.5 (16.8-27.0) 1 0.2 ( 0.0- 1.3) 6 1.6 ( 0.5- 4.4) 355 76.8 (71.1-81.6) 452 88,522
Retired/Can't work 263 13.6 (11.6-15.9) 33 1.6 ( 1.0- 2.5) 33 1.6 ( 1.0- 2.5) 1,536 83.2 (80.7-85.4) 1,865 222,329
Unknown/Refused - - - - -- -
HOUSEHOLD INCOME
<$15,000 74 15.9 (11.5-21.5) 8 1.1 ( 0.5- 2.2) 10 2.3 ( 0.7- 7.0) 385 80.7 (74.7-85.6) 477 57,498
$15,000-24,999 127 15.9 (12.5-20.0) 12 1.3 ( 0.6- 2.8) 15 1.4 ( 0.7- 2.7) 655 81.4 (77.2-85.0) 809 100,722
$25,000-49,999 294 15.8 (13.7-18.2) 14 0.7 ( 0.3- 1.4) 15 0.9 ( 0.5- 1.7) 1,519 82.6 (80.1-84.9) 1,842 271,130
$50,000-74,999 161 14.5 (11.9-17.5) 6 0.4 ( 0.2- 1.1) 14 1.1 ( 0.6- 2.0) 892 84.0 (80.9-86.6) 1,073 163,650
>=$75,000 254 14.4 (12.3-16.7) 9 0.4 ( 0.2- 1.0) 19 1.2 ( 0.7- 2.1) 1,507 84.0 (81.6-86.1) 1,789 281,357
Unknown/Refused 56 15.9 (11.5-21.4) 4 0.6 ( 0.2- 1.9) 7 0.7 ( 0.3- 1.8) 353 82.8 (77.2-87.2) 420 82,877
Percentages are weighted to population characteristics.N = Cell Sample Size, % = Percentage, 95% C.I. = Confidence Interval at 95 percent probability level
Rows with Sample Size less than 50 or containing half-width of 95% CI greater than 10 have been suppressed.

Had diarrhea in the past 30 days and the medical care for itState of Hawaii BRFSS 2007
GEOGRAPHIC AREAS Have diarrhea,no doctor's visit N % C.I.(95%)
Have diarrhea,with doctor's visit,stool testing N % C.I.(95%)
Have diarrhea,with doctor's visit, no stool test N % C.I.(95%)
No diarrhea N % C.I.(95%)
Total N
Estimatednumberof Adults
STATE 966 15.2 (14.0-16.4) 53 0.7 ( 0.5- 0.9) 80 1.1 ( 0.8- 1.5) 5,311 83.0 (81.7-84.3) 6,410 957,234
COUNTY
Honolulu 437 15.5 (14.0-17.2) 20 0.5 ( 0.3- 0.9) 34 1.2 ( 0.8- 1.7) 2,331 82.8 (81.0-84.4) 2,822 680,514
Hawaii 230 15.8 (13.6-18.4) 15 1.1 ( 0.6- 2.0) 18 1.1 ( 0.7- 1.9) 1,216 82.0 (79.3-84.3) 1,479 125,807
Kauai 84 13.0 (10.1-16.6) 4 0.6 ( 0.2- 1.6) 7 0.6 ( 0.2- 1.3) 538 85.9 (82.2-88.9) 633 45,713
Maui 215 13.1 (11.0-15.6) 14 0.9 ( 0.5- 1.8) 21 1.3 ( 0.7- 2.2) 1,226 84.7 (82.1-87.0) 1,476 105,200
HONOLULU County
North Shore/Laie 13 14.5 ( 7.8-25.2) 2 1.9 ( 0.5- 7.5) 1 0.5 ( 0.1- 3.4) 69 83.1 (72.3-90.3) 85 21,427
Ka'a'wa/Kahalu'u/Kaneohe 38 21.4 (15.1-29.3) 3 1.6 ( 0.5- 5.1) 168 77.0 (69.1-83.4) 209 48,612
Kailua/Waimanalo 32 12.4 ( 8.4-18.1) 1 0.4 ( 0.0- 2.5) 1 0.5 ( 0.1- 3.3) 196 86.7 (81.0-90.9) 230 50,858
Wailae/Kahala/HawaiiKai 21 12.8 ( 7.7-20.4) 2 1.3 ( 0.3- 5.2) 3 1.6 ( 0.5- 4.8) 146 84.4 (76.6-89.9) 172 38,038
Kaimuki/Palolo/Waikiki 43 16.9 (12.2-23.0) 2 0.7 ( 0.2- 2.9) 4 1.2 ( 0.5- 3.3) 217 81.1 (74.9-86.1) 266 52,624
Manoa/Upper Makiki 29 13.4 ( 8.8-19.8) 4 0.9 ( 0.3- 2.4) 197 85.7 (79.4-90.4) 230 43,084
Ala Moana 19 11.7 ( 6.9-19.2) 3 1.5 ( 0.5- 4.8) 127 86.8 (79.2-91.8) 149 28,200
Nuuanu/Kalihi/MoanaLoa 44 17.0 (12.2-23.2) 2 0.7 ( 0.2- 3.2) 3 1.7 ( 0.4- 6.7) 194 80.5 (73.9-85.8) 243 64,220
Salt Lake/Foster Village 19 14.2 ( 8.6-22.6) 1 0.7 ( 0.1- 4.8) 1 1.3 ( 0.2- 8.7) 96 83.8 (75.1-89.9) 117 27,570
Aiea/Pearl City 43 16.2 (11.5-22.2) 2 0.3 ( 0.1- 1.8) 3 0.5 ( 0.2- 1.6) 227 83.0 (76.9-87.7) 275 67,731
Mililani/Wahiawa 36 11.7 ( 8.1-16.5) 1 0.2 ( 0.0- 1.4) 3 1.5 ( 0.4- 5.3) 249 86.6 (81.5-90.5) 289 72,789
Waipahu/Kapolei/Ewa 76 17.4 (13.7-21.9) 3 0.6 ( 0.2- 2.3) 9 1.7 ( 0.8- 3.4) 344 80.3 (75.7-84.2) 432 126,149
Nanakuli/Waianae 24 17.6 (10.8-27.2) 101 82.4 (72.8-89.2) 125 39,213
HAWAII County
North Hawaii 36 13.1 ( 8.9-18.9) 5 2.1 ( 0.7- 6.4) 4 1.1 ( 0.4- 3.0) 267 83.6 (77.5-88.4) 312 27,658
Hilo 55 14.9 (11.2-19.5) 5 1.2 ( 0.5- 3.0) 6 1.3 ( 0.5- 3.4) 349 82.6 (77.8-86.6) 415 35,144
Puna/Ka'u 79 17.7 (13.3-23.1) 4 0.8 ( 0.2- 2.4) 5 1.4 ( 0.5- 3.6) 332 80.1 (74.6-84.7) 420 35,617
Kona 60 17.4 (12.7-23.4) 1 0.1 ( 0.0- 1.1) 3 0.6 ( 0.2- 2.0) 268 81.8 (75.8-86.6) 332 27,387
KAUAI County
Hanalei/Kapa'a 40 14.6 (10.0-20.7) 2 0.8 ( 0.2- 3.4) 1 0.1 ( 0.0- 0.8) 245 84.5 (78.3-89.2) 288 19,327
Lihue-Waimea 44 11.8 ( 8.4-16.5) 2 0.4 ( 0.1- 1.6) 6 0.9 ( 0.3- 2.2) 293 86.9 (82.2-90.5) 345 26,387
MAUI County
Lahaina/Wailuku 48 14.3 ( 9.9-20.1) 3 0.7 ( 0.2- 2.1) 4 1.4 ( 0.4- 4.8) 239 83.6 (77.6-88.3) 294 30,229
Kahului 51 14.4 (10.5-19.6) 4 1.4 ( 0.4- 4.6) 5 1.1 ( 0.4- 2.9) 266 83.0 (77.6-87.3) 326 31,533
Upcountry/Hana 48 10.4 ( 7.7-14.0) 5 0.8 ( 0.3- 1.9) 7 1.4 ( 0.6- 3.0) 320 87.4 (83.7-90.5) 380 33,713
Lanai 29 15.7 (10.3-23.2) 1 1.7 ( 0.2-10.8) 2 2.1 ( 0.4-10.3) 171 80.5 (72.1-86.9) 203 1,875
Molokai 39 14.2 ( 9.9-20.1) 1 0.2 ( 0.0- 1.4) 3 0.7 ( 0.2- 2.3) 230 84.9 (79.0-89.3) 273 7,850
Percentages are weighted to population characteristics.N = Cell Sample Size, % = Percentage, 95% C.I. = Confidence Interval at 95 percent probability level
Rows with Sample Size less than 50 or containing half-width of 95% CI greater than 10 have been suppressed.
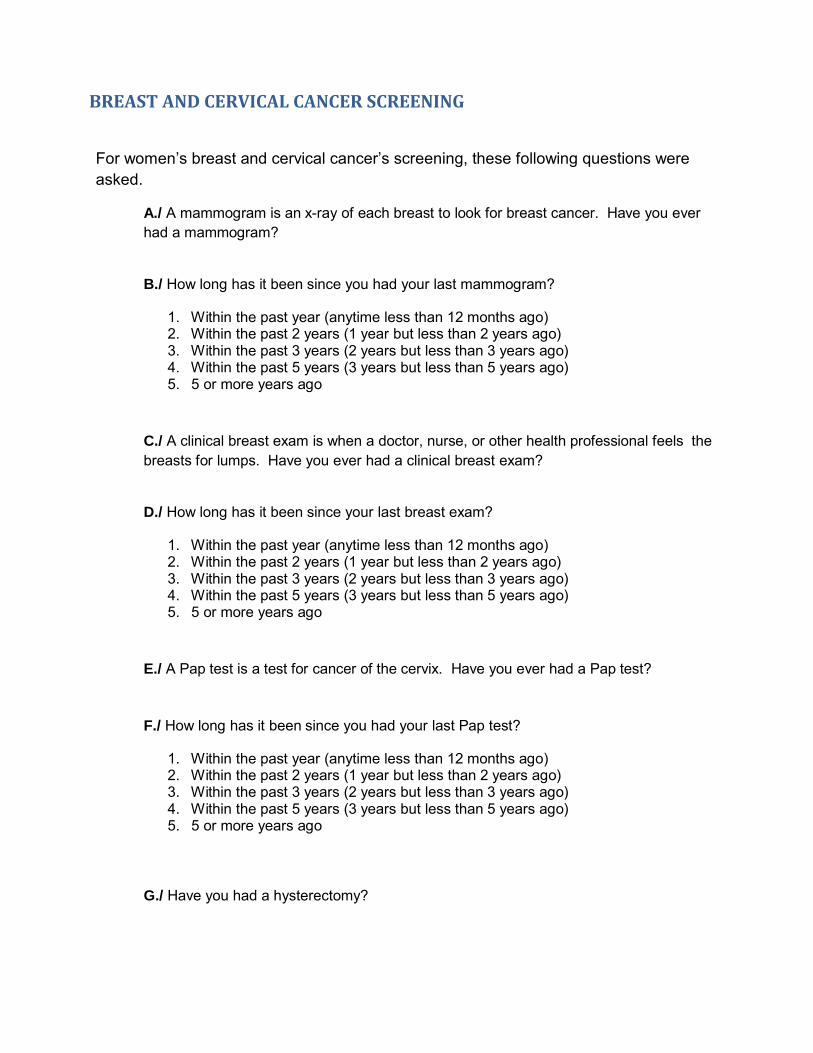
BREAST AND CERVICAL CANCER SCREENING
For women’s breast and cervical cancer’s screening, these following questions were asked.
A./ A mammogram is an x-ray of each breast to look for breast cancer. Have you ever had a mammogram?
B./ How long has it been since you had your last mammogram?
1. Within the past year (anytime less than 12 months ago) 2. Within the past 2 years (1 year but less than 2 years ago) 3. Within the past 3 years (2 years but less than 3 years ago) 4. Within the past 5 years (3 years but less than 5 years ago) 5. 5 or more years ago
C./ A clinical breast exam is when a doctor, nurse, or other health professional feels the breasts for lumps. Have you ever had a clinical breast exam?
D./ How long has it been since your last breast exam?
1. Within the past year (anytime less than 12 months ago) 2. Within the past 2 years (1 year but less than 2 years ago) 3. Within the past 3 years (2 years but less than 3 years ago) 4. Within the past 5 years (3 years but less than 5 years ago) 5. 5 or more years ago
E./ A Pap test is a test for cancer of the cervix. Have you ever had a Pap test?
F./ How long has it been since you had your last Pap test?
1. Within the past year (anytime less than 12 months ago) 2. Within the past 2 years (1 year but less than 2 years ago) 3. Within the past 3 years (2 years but less than 3 years ago) 4. Within the past 5 years (3 years but less than 5 years ago) 5. 5 or more years ago
G./ Have you had a hysterectomy?

Ever had a mammogram among women aged 18+State of Hawaii BRFSS 2007
DemographicCharacteristics
YES N % C.I.(95%)
NO N % C.I.(95%)
Total N
Estimated numberof Adults
TOTAL 2,892 67.7 (65.5-69.9) 913 32.3 (30.1-34.5) 3,805 485,470
AGE GROUP
18-24 Years 33 21.7 (14.6-31.1) 139 78.3 (68.9-85.4) 172 55,985
25-34 Years 60 13.8 (10.1-18.7) 359 86.2 (81.3-89.9) 419 73,718
35-44 Years 358 55.0 (50.0-59.8) 286 45.0 (40.2-50.0) 644 83,196
45-54 Years 777 94.5 (91.9-96.3) 59 5.5 ( 3.7- 8.1) 836 93,078
55-64 Years 741 95.3 (92.8-96.9) 39 4.7 ( 3.1- 7.2) 780 76,216
65+ Years 913 96.9 (95.4-98.0) 31 3.1 ( 2.0- 4.6) 944 102,122
Unknown/Refused - - -- -
ETHNICITY
White 1,189 70.7 (67.2-74.1) 309 29.3 (25.9-32.8) 1,498 149,052
Hawaiian 376 58.2 (52.2-64.0) 188 41.8 (36.0-47.8) 564 73,009
Filipino 369 61.9 (55.5-68.0) 165 38.1 (32.0-44.5) 534 86,590
Japanese 660 78.8 (74.6-82.4) 123 21.2 (17.6-25.4) 783 106,375
Others 290 61.5 (55.0-67.6) 124 38.5 (32.4-45.0) 414 69,490
Unknown/Refused - - -- -
MARITAL STATUS
Married 1,566 70.7 (68.0-73.2) 512 29.3 (26.8-32.0) 2,078 282,814
Unmarried 1,321 63.6 (59.7-67.3) 401 36.4 (32.7-40.3) 1,722 202,217
Unknown/Refused - - -- -
EDUCATION
<High School 157 68.0 (58.0-76.6) 44 32.0 (23.4-42.0) 201 28,749
High School 771 67.0 (62.6-71.1) 265 33.0 (28.9-37.4) 1,036 139,631
Some College 846 63.1 (58.7-67.4) 298 36.9 (32.6-41.3) 1,144 148,459
College 1,115 72.5 (69.2-75.6) 304 27.5 (24.4-30.8) 1,419 167,635
Unknown/Refused - - -- -
EMPLOYMENT
Employed 1,559 63.8 (60.8-66.7) 613 36.2 (33.3-39.2) 2,172 276,363
Unemployed - - - - - - - -
Student/Homemaker 209 42.7 (36.4-49.2) 202 57.3 (50.8-63.6) 411 72,563
Retired/Can't work 1,063 92.5 (89.3-94.8) 59 7.5 ( 5.2-10.7) 1,122 124,083
Unknown/Refused - - -- -
HOUSEHOLD INCOME
<$15,000 245 68.3 (59.9-75.6) 81 31.7 (24.4-40.1) 326 35,516
$15,000-24,999 379 65.5 (59.3-71.2) 139 34.5 (28.8-40.7) 518 56,855
$25,000-49,999 808 63.6 (59.1-67.9) 272 36.4 (32.1-40.9) 1,080 136,157
$50,000-74,999 449 66.9 (61.2-72.2) 155 33.1 (27.8-38.8) 604 75,035
>=$75,000 797 72.5 (68.5-76.1) 209 27.5 (23.9-31.5) 1,006 136,167
Unknown/Refused 214 69.5 (60.5-77.3) 57 30.5 (22.7-39.5) 271 45,739
Percentages are weighted to population characteristics.N = Cell Sample Size, % = Percentage, 95% C.I. = Confidence Interval at 95 percent probability level
Rows with Sample Size less than 50 or containing half-width of 95% CI greater than 10 have been suppressed.

Ever had a mammogram among women aged 18+State of Hawaii BRFSS 2007
GEOGRAPHIC AREAS YES N % C.I.(95%)
NO N % C.I.(95%)
Total N
Estimatednumberof Adults
STATE 2,892 67.7 (65.5-69.9) 913 32.3 (30.1-34.5) 3,805 485,470
COUNTY
Honolulu 1,257 67.6 (64.6-70.5) 409 32.4 (29.5-35.4) 1,666 344,288
Hawaii 674 67.3 (63.2-71.1) 207 32.7 (28.9-36.8) 881 64,346
Kauai 295 67.4 (60.6-73.5) 84 32.6 (26.5-39.4) 379 23,483
Maui 666 69.2 (64.4-73.6) 213 30.8 (26.4-35.6) 879 53,354
HONOLULU County
North Shore/Laie - - - - - - - -
Ka'a'wa/Kahalu'u/Kaneohe 110 75.9 (65.2-84.1) 24 24.1 (15.9-34.8) 134 25,962
Kailua/Waimanalo 113 68.5 (58.3-77.2) 35 31.5 (22.8-41.7) 148 28,623
Wailae/Kahala/HawaiiKai - - - - - - - -
Kaimuki/Palolo/Waikiki 139 78.8 (68.5-86.4) 24 21.2 (13.6-31.5) 163 27,839
Manoa/Upper Makiki 116 81.4 (70.7-88.8) 16 18.6 (11.2-29.3) 132 20,874
Ala Moana - - - - - - - -
Nuuanu/Kalihi/MoanaLoa - - - - - - - -
Salt Lake/Foster Village - - - - - - - -
Aiea/Pearl City 139 76.1 (66.8-83.5) 33 23.9 (16.5-33.2) 172 36,253
Mililani/Wahiawa 100 54.2 (44.9-63.2) 58 45.8 (36.8-55.1) 158 33,283
Waipahu/Kapolei/Ewa 165 61.7 (54.3-68.7) 84 38.3 (31.3-45.7) 249 61,446
Nanakuli/Waianae - - - - - - - -
HAWAII County
North Hawaii 155 69.8 (61.3-77.2) 43 30.2 (22.8-38.7) 198 14,662
Hilo 197 74.1 (66.5-80.4) 46 25.9 (19.6-33.5) 243 18,254
Puna/Ka'u 167 55.9 (48.2-63.3) 79 44.1 (36.7-51.8) 246 17,775
Kona 155 70.3 (61.1-78.2) 39 29.7 (21.8-38.9) 194 13,655
KAUAI County
Hanalei/Kapa'a - - - - - - - -
Lihue-Waimea 161 67.7 (58.9-75.3) 51 32.3 (24.7-41.1) 212 13,336
MAUI County
Lahaina/Wailuku 136 63.9 (54.8-72.2) 50 36.1 (27.8-45.2) 186 15,968
Kahului 146 72.3 (62.0-80.7) 36 27.7 (19.3-38.0) 182 14,595
Upcountry/Hana 182 73.9 (64.9-81.2) 40 26.1 (18.8-35.1) 222 17,496
Lanai - - - - - - - -
Molokai 119 59.7 (50.5-68.2) 60 40.3 (31.8-49.5) 179 4,489
Percentages are weighted to population characteristics.N = Cell Sample Size, % = Percentage, 95% C.I. = Confidence Interval at 95 percent probability level
Rows with Sample Size less than 50 or containing half-width of 95% CI greater than 10 have been suppressed.
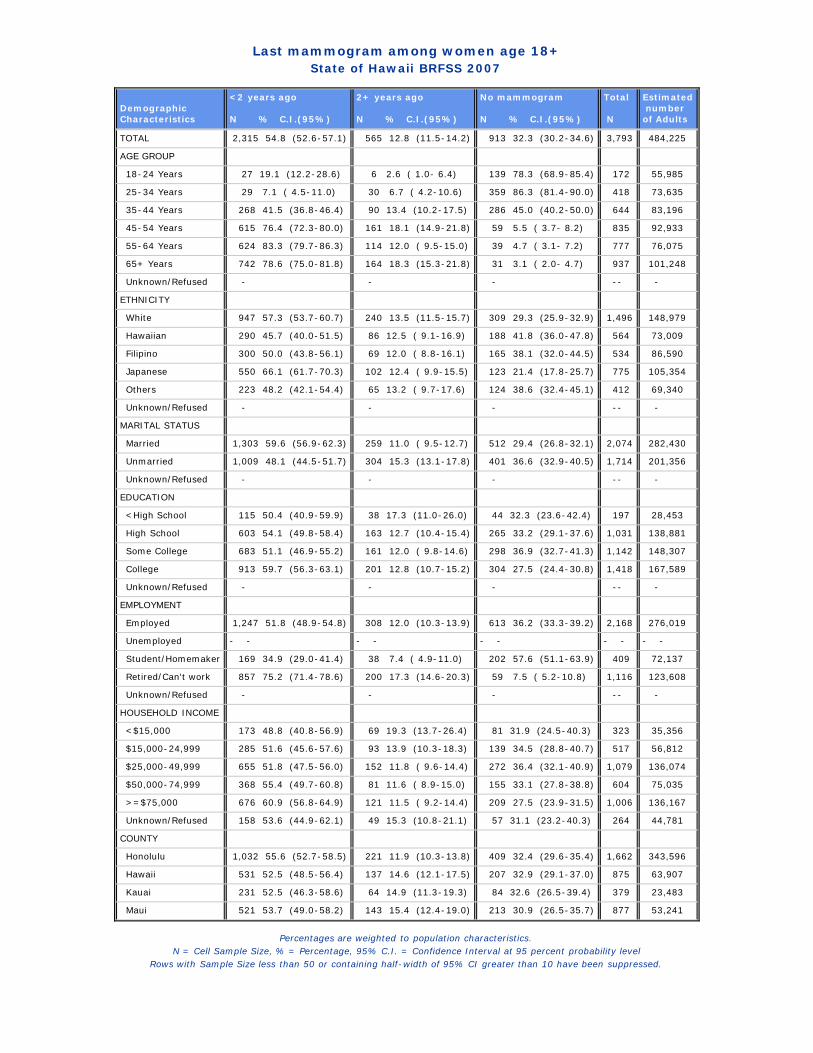
Last mammogram among women age 18+State of Hawaii BRFSS 2007
DemographicCharacteristics
<2 years ago N % C.I.(95%)
2+ years ago N % C.I.(95%)
No mammogram N % C.I.(95%)
Total N
Estimated numberof Adults
TOTAL 2,315 54.8 (52.6-57.1) 565 12.8 (11.5-14.2) 913 32.3 (30.2-34.6) 3,793 484,225
AGE GROUP
18-24 Years 27 19.1 (12.2-28.6) 6 2.6 ( 1.0- 6.4) 139 78.3 (68.9-85.4) 172 55,985
25-34 Years 29 7.1 ( 4.5-11.0) 30 6.7 ( 4.2-10.6) 359 86.3 (81.4-90.0) 418 73,635
35-44 Years 268 41.5 (36.8-46.4) 90 13.4 (10.2-17.5) 286 45.0 (40.2-50.0) 644 83,196
45-54 Years 615 76.4 (72.3-80.0) 161 18.1 (14.9-21.8) 59 5.5 ( 3.7- 8.2) 835 92,933
55-64 Years 624 83.3 (79.7-86.3) 114 12.0 ( 9.5-15.0) 39 4.7 ( 3.1- 7.2) 777 76,075
65+ Years 742 78.6 (75.0-81.8) 164 18.3 (15.3-21.8) 31 3.1 ( 2.0- 4.7) 937 101,248
Unknown/Refused - - - -- -
ETHNICITY
White 947 57.3 (53.7-60.7) 240 13.5 (11.5-15.7) 309 29.3 (25.9-32.9) 1,496 148,979
Hawaiian 290 45.7 (40.0-51.5) 86 12.5 ( 9.1-16.9) 188 41.8 (36.0-47.8) 564 73,009
Filipino 300 50.0 (43.8-56.1) 69 12.0 ( 8.8-16.1) 165 38.1 (32.0-44.5) 534 86,590
Japanese 550 66.1 (61.7-70.3) 102 12.4 ( 9.9-15.5) 123 21.4 (17.8-25.7) 775 105,354
Others 223 48.2 (42.1-54.4) 65 13.2 ( 9.7-17.6) 124 38.6 (32.4-45.1) 412 69,340
Unknown/Refused - - - -- -
MARITAL STATUS
Married 1,303 59.6 (56.9-62.3) 259 11.0 ( 9.5-12.7) 512 29.4 (26.8-32.1) 2,074 282,430
Unmarried 1,009 48.1 (44.5-51.7) 304 15.3 (13.1-17.8) 401 36.6 (32.9-40.5) 1,714 201,356
Unknown/Refused - - - -- -
EDUCATION
<High School 115 50.4 (40.9-59.9) 38 17.3 (11.0-26.0) 44 32.3 (23.6-42.4) 197 28,453
High School 603 54.1 (49.8-58.4) 163 12.7 (10.4-15.4) 265 33.2 (29.1-37.6) 1,031 138,881
Some College 683 51.1 (46.9-55.2) 161 12.0 ( 9.8-14.6) 298 36.9 (32.7-41.3) 1,142 148,307
College 913 59.7 (56.3-63.1) 201 12.8 (10.7-15.2) 304 27.5 (24.4-30.8) 1,418 167,589
Unknown/Refused - - - -- -
EMPLOYMENT
Employed 1,247 51.8 (48.9-54.8) 308 12.0 (10.3-13.9) 613 36.2 (33.3-39.2) 2,168 276,019
Unemployed - - - - - - - - - -
Student/Homemaker 169 34.9 (29.0-41.4) 38 7.4 ( 4.9-11.0) 202 57.6 (51.1-63.9) 409 72,137
Retired/Can't work 857 75.2 (71.4-78.6) 200 17.3 (14.6-20.3) 59 7.5 ( 5.2-10.8) 1,116 123,608
Unknown/Refused - - - -- -
HOUSEHOLD INCOME
<$15,000 173 48.8 (40.8-56.9) 69 19.3 (13.7-26.4) 81 31.9 (24.5-40.3) 323 35,356
$15,000-24,999 285 51.6 (45.6-57.6) 93 13.9 (10.3-18.3) 139 34.5 (28.8-40.7) 517 56,812
$25,000-49,999 655 51.8 (47.5-56.0) 152 11.8 ( 9.6-14.4) 272 36.4 (32.1-40.9) 1,079 136,074
$50,000-74,999 368 55.4 (49.7-60.8) 81 11.6 ( 8.9-15.0) 155 33.1 (27.8-38.8) 604 75,035
>=$75,000 676 60.9 (56.8-64.9) 121 11.5 ( 9.2-14.4) 209 27.5 (23.9-31.5) 1,006 136,167
Unknown/Refused 158 53.6 (44.9-62.1) 49 15.3 (10.8-21.1) 57 31.1 (23.2-40.3) 264 44,781
COUNTY
Honolulu 1,032 55.6 (52.7-58.5) 221 11.9 (10.3-13.8) 409 32.4 (29.6-35.4) 1,662 343,596
Hawaii 531 52.5 (48.5-56.4) 137 14.6 (12.1-17.5) 207 32.9 (29.1-37.0) 875 63,907
Kauai 231 52.5 (46.3-58.6) 64 14.9 (11.3-19.3) 84 32.6 (26.5-39.4) 379 23,483
Maui 521 53.7 (49.0-58.2) 143 15.4 (12.4-19.0) 213 30.9 (26.5-35.7) 877 53,241
Percentages are weighted to population characteristics.N = Cell Sample Size, % = Percentage, 95% C.I. = Confidence Interval at 95 percent probability level
Rows with Sample Size less than 50 or containing half-width of 95% CI greater than 10 have been suppressed.

Ever had a mammogram among women aged 40+State of Hawaii BRFSS 2007
DemographicCharacteristics
YES N % C.I.(95%)
NO N % C.I.(95%)
Total N
Estimated numberof Adults
TOTAL 2,691 92.6 (91.2-93.8) 215 7.4 ( 6.2- 8.8) 2,906 316,641
AGE GROUP
40-44 Years 260 74.1 (67.8-79.5) 86 25.9 (20.5-32.2) 346 45,224
45-54 Years 777 94.5 (91.9-96.3) 59 5.5 ( 3.7- 8.1) 836 93,078
55-64 Years 741 95.3 (92.8-96.9) 39 4.7 ( 3.1- 7.2) 780 76,216
65+ Years 913 96.9 (95.4-98.0) 31 3.1 ( 2.0- 4.6) 944 102,122
Unknown/Refused
ETHNICITY
White 1,125 93.1 (90.9-94.8) 84 6.9 ( 5.2- 9.1) 1,209 103,409
Hawaiian 335 91.8 (87.6-94.7) 34 8.2 ( 5.3-12.4) 369 39,188
Filipino 335 90.9 (85.4-94.4) 35 9.1 ( 5.6-14.6) 370 49,007
Japanese 640 94.5 (91.9-96.3) 32 5.5 ( 3.7- 8.1) 672 85,525
Others 250 90.0 (84.9-93.5) 27 10.0 ( 6.5-15.1) 277 38,919
Unknown/Refused - - -- -
MARITAL STATUS
Married 1,467 92.4 (90.6-93.9) 120 7.6 ( 6.1- 9.4) 1,587 200,664
Unmarried 1,220 92.8 (90.4-94.6) 95 7.2 ( 5.4- 9.6) 1,315 115,647
Unknown/Refused - - -- -
EDUCATION
<High School 151 86.4 (77.1-92.3) 21 13.6 ( 7.7-22.9) 172 21,188
High School 698 92.3 (89.5-94.4) 63 7.7 ( 5.6-10.5) 761 85,405
Some College 784 93.9 (91.4-95.7) 57 6.1 ( 4.3- 8.6) 841 88,121
College 1,056 93.0 (90.7-94.8) 73 7.0 ( 5.2- 9.3) 1,129 121,341
Unknown/Refused - - -- -
EMPLOYMENT
Employed 1,408 90.7 (88.5-92.5) 141 9.3 ( 7.5-11.5) 1,549 167,497
Unemployed - - - - - - - -
Student/Homemaker 178 89.8 (83.8-93.8) 20 10.2 ( 6.2-16.2) 198 25,531
Retired/Can't work 1,055 96.5 (94.8-97.7) 38 3.5 ( 2.3- 5.2) 1,093 117,577
Unknown/Refused - - -- -
HOUSEHOLD INCOME
<$15,000 223 86.5 (79.7-91.3) 36 13.5 ( 8.7-20.3) 259 22,295
$15,000-24,999 351 88.3 (82.7-92.3) 39 11.7 ( 7.7-17.3) 390 37,345
$25,000-49,999 755 93.0 (90.0-95.1) 57 7.0 ( 4.9-10.0) 812 84,093
$50,000-74,999 419 94.5 (91.6-96.4) 29 5.5 ( 3.6- 8.4) 448 48,869
>=$75,000 750 94.6 (92.2-96.3) 40 5.4 ( 3.7- 7.8) 790 95,861
Unknown/Refused 193 91.5 (84.9-95.4) 14 8.5 ( 4.6-15.1) 207 28,179
Percentages are weighted to population characteristics.N = Cell Sample Size, % = Percentage, 95% C.I. = Confidence Interval at 95 percent probability level
Rows with Sample Size less than 50 or containing half-width of 95% CI greater than 10 have been suppressed.

Ever had a mammogram among women aged 40+State of Hawaii BRFSS 2007
GEOGRAPHIC AREAS YES N % C.I.(95%)
NO N % C.I.(95%)
Total N
Estimatednumberof Adults
STATE 2,691 92.6 (91.2-93.8) 215 7.4 ( 6.2- 8.8) 2,906 316,641
COUNTY
Honolulu 1,173 93.0 (91.1-94.5) 83 7.0 ( 5.5- 8.9) 1,256 224,643
Hawaii 629 90.9 (87.8-93.2) 54 9.1 ( 6.8-12.2) 683 41,584
Kauai 281 92.7 (88.1-95.6) 20 7.3 ( 4.4-11.9) 301 15,784
Maui 608 92.0 (88.7-94.4) 58 8.0 ( 5.6-11.3) 666 34,631
HONOLULU County
North Shore/Laie - - -- -
Ka'a'wa/Kahalu'u/Kaneohe 103 91.7 (83.4-96.1) 8 8.3 ( 3.9-16.6) 111 19,458
Kailua/Waimanalo 104 91.5 (83.7-95.8) 9 8.5 ( 4.2-16.3) 113 19,258
Wailae/Kahala/HawaiiKai 71 91.3 (81.3-96.2) 6 8.7 ( 3.8-18.7) 77 13,226
Kaimuki/Palolo/Waikiki 134 94.0 (88.3-97.1) 9 6.0 ( 2.9-11.7) 143 22,275
Manoa/Upper Makiki 112 95.6 (88.6-98.4) 4 4.4 ( 1.6-11.4) 116 17,055
Ala Moana 66 96.4 (88.7-98.9) 3 3.6 ( 1.1-11.3) 69 10,180
Nuuanu/Kalihi/MoanaLoa 99 90.8 (80.8-95.8) 10 9.2 ( 4.2-19.2) 109 20,389
Salt Lake/Foster Village - - -- -
Aiea/Pearl City 126 97.2 (93.3-98.9) 5 2.8 ( 1.1- 6.7) 131 24,631
Mililani/Wahiawa 93 94.2 (85.1-97.9) 5 5.8 ( 2.1-14.9) 98 17,750
Waipahu/Kapolei/Ewa 151 90.4 (83.8-94.5) 16 9.6 ( 5.5-16.2) 167 36,828
Nanakuli/Waianae - - -- -
HAWAII County
North Hawaii 143 94.8 (89.7-97.5) 8 5.2 ( 2.5-10.3) 151 9,068
Hilo 190 94.1 (87.6-97.3) 8 5.9 ( 2.7-12.4) 198 13,234
Puna/Ka'u 152 84.4 (77.3-89.6) 26 15.6 (10.4-22.7) 178 10,337
Kona 144 89.7 (81.0-94.6) 12 10.3 ( 5.4-19.0) 156 8,945
KAUAI County
Hanalei/Kapa'a 128 92.5 (82.8-96.9) 7 7.5 ( 3.1-17.2) 135 6,779
Lihue-Waimea 153 92.8 (87.5-96.0) 13 7.2 ( 4.0-12.5) 166 9,005
MAUI County
Lahaina/Wailuku 123 90.7 (82.4-95.3) 10 9.3 ( 4.7-17.6) 133 9,670
Kahului 128 93.7 (88.1-96.8) 10 6.3 ( 3.2-11.9) 138 9,464
Upcountry/Hana 168 93.8 (86.1-97.3) 10 6.2 ( 2.7-13.9) 178 12,186
Lanai - - - - - - - -
Molokai 108 83.2 (74.5-89.3) 22 16.8 (10.7-25.5) 130 2,724
Percentages are weighted to population characteristics.N = Cell Sample Size, % = Percentage, 95% C.I. = Confidence Interval at 95 percent probability level
Rows with Sample Size less than 50 or containing half-width of 95% CI greater than 10 have been suppressed.
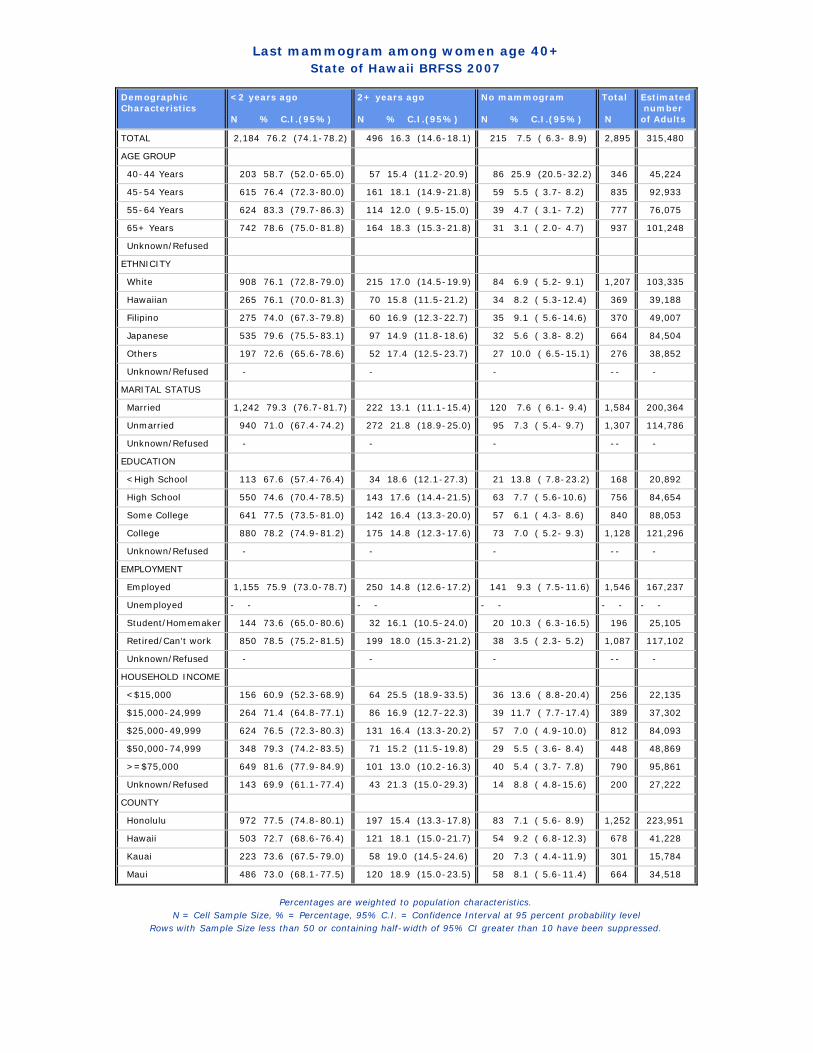
Last mammogram among women age 40+State of Hawaii BRFSS 2007
DemographicCharacteristics
<2 years ago N % C.I.(95%)
2+ years ago N % C.I.(95%)
No mammogram N % C.I.(95%)
Total N
Estimated numberof Adults
TOTAL 2,184 76.2 (74.1-78.2) 496 16.3 (14.6-18.1) 215 7.5 ( 6.3- 8.9) 2,895 315,480
AGE GROUP
40-44 Years 203 58.7 (52.0-65.0) 57 15.4 (11.2-20.9) 86 25.9 (20.5-32.2) 346 45,224
45-54 Years 615 76.4 (72.3-80.0) 161 18.1 (14.9-21.8) 59 5.5 ( 3.7- 8.2) 835 92,933
55-64 Years 624 83.3 (79.7-86.3) 114 12.0 ( 9.5-15.0) 39 4.7 ( 3.1- 7.2) 777 76,075
65+ Years 742 78.6 (75.0-81.8) 164 18.3 (15.3-21.8) 31 3.1 ( 2.0- 4.7) 937 101,248
Unknown/Refused
ETHNICITY
White 908 76.1 (72.8-79.0) 215 17.0 (14.5-19.9) 84 6.9 ( 5.2- 9.1) 1,207 103,335
Hawaiian 265 76.1 (70.0-81.3) 70 15.8 (11.5-21.2) 34 8.2 ( 5.3-12.4) 369 39,188
Filipino 275 74.0 (67.3-79.8) 60 16.9 (12.3-22.7) 35 9.1 ( 5.6-14.6) 370 49,007
Japanese 535 79.6 (75.5-83.1) 97 14.9 (11.8-18.6) 32 5.6 ( 3.8- 8.2) 664 84,504
Others 197 72.6 (65.6-78.6) 52 17.4 (12.5-23.7) 27 10.0 ( 6.5-15.1) 276 38,852
Unknown/Refused - - - -- -
MARITAL STATUS
Married 1,242 79.3 (76.7-81.7) 222 13.1 (11.1-15.4) 120 7.6 ( 6.1- 9.4) 1,584 200,364
Unmarried 940 71.0 (67.4-74.2) 272 21.8 (18.9-25.0) 95 7.3 ( 5.4- 9.7) 1,307 114,786
Unknown/Refused - - - -- -
EDUCATION
<High School 113 67.6 (57.4-76.4) 34 18.6 (12.1-27.3) 21 13.8 ( 7.8-23.2) 168 20,892
High School 550 74.6 (70.4-78.5) 143 17.6 (14.4-21.5) 63 7.7 ( 5.6-10.6) 756 84,654
Some College 641 77.5 (73.5-81.0) 142 16.4 (13.3-20.0) 57 6.1 ( 4.3- 8.6) 840 88,053
College 880 78.2 (74.9-81.2) 175 14.8 (12.3-17.6) 73 7.0 ( 5.2- 9.3) 1,128 121,296
Unknown/Refused - - - -- -
EMPLOYMENT
Employed 1,155 75.9 (73.0-78.7) 250 14.8 (12.6-17.2) 141 9.3 ( 7.5-11.6) 1,546 167,237
Unemployed - - - - - - - - - -
Student/Homemaker 144 73.6 (65.0-80.6) 32 16.1 (10.5-24.0) 20 10.3 ( 6.3-16.5) 196 25,105
Retired/Can't work 850 78.5 (75.2-81.5) 199 18.0 (15.3-21.2) 38 3.5 ( 2.3- 5.2) 1,087 117,102
Unknown/Refused - - - -- -
HOUSEHOLD INCOME
<$15,000 156 60.9 (52.3-68.9) 64 25.5 (18.9-33.5) 36 13.6 ( 8.8-20.4) 256 22,135
$15,000-24,999 264 71.4 (64.8-77.1) 86 16.9 (12.7-22.3) 39 11.7 ( 7.7-17.4) 389 37,302
$25,000-49,999 624 76.5 (72.3-80.3) 131 16.4 (13.3-20.2) 57 7.0 ( 4.9-10.0) 812 84,093
$50,000-74,999 348 79.3 (74.2-83.5) 71 15.2 (11.5-19.8) 29 5.5 ( 3.6- 8.4) 448 48,869
>=$75,000 649 81.6 (77.9-84.9) 101 13.0 (10.2-16.3) 40 5.4 ( 3.7- 7.8) 790 95,861
Unknown/Refused 143 69.9 (61.1-77.4) 43 21.3 (15.0-29.3) 14 8.8 ( 4.8-15.6) 200 27,222
COUNTY
Honolulu 972 77.5 (74.8-80.1) 197 15.4 (13.3-17.8) 83 7.1 ( 5.6- 8.9) 1,252 223,951
Hawaii 503 72.7 (68.6-76.4) 121 18.1 (15.0-21.7) 54 9.2 ( 6.8-12.3) 678 41,228
Kauai 223 73.6 (67.5-79.0) 58 19.0 (14.5-24.6) 20 7.3 ( 4.4-11.9) 301 15,784
Maui 486 73.0 (68.1-77.5) 120 18.9 (15.0-23.5) 58 8.1 ( 5.6-11.4) 664 34,518
Percentages are weighted to population characteristics.N = Cell Sample Size, % = Percentage, 95% C.I. = Confidence Interval at 95 percent probability level
Rows with Sample Size less than 50 or containing half-width of 95% CI greater than 10 have been suppressed.
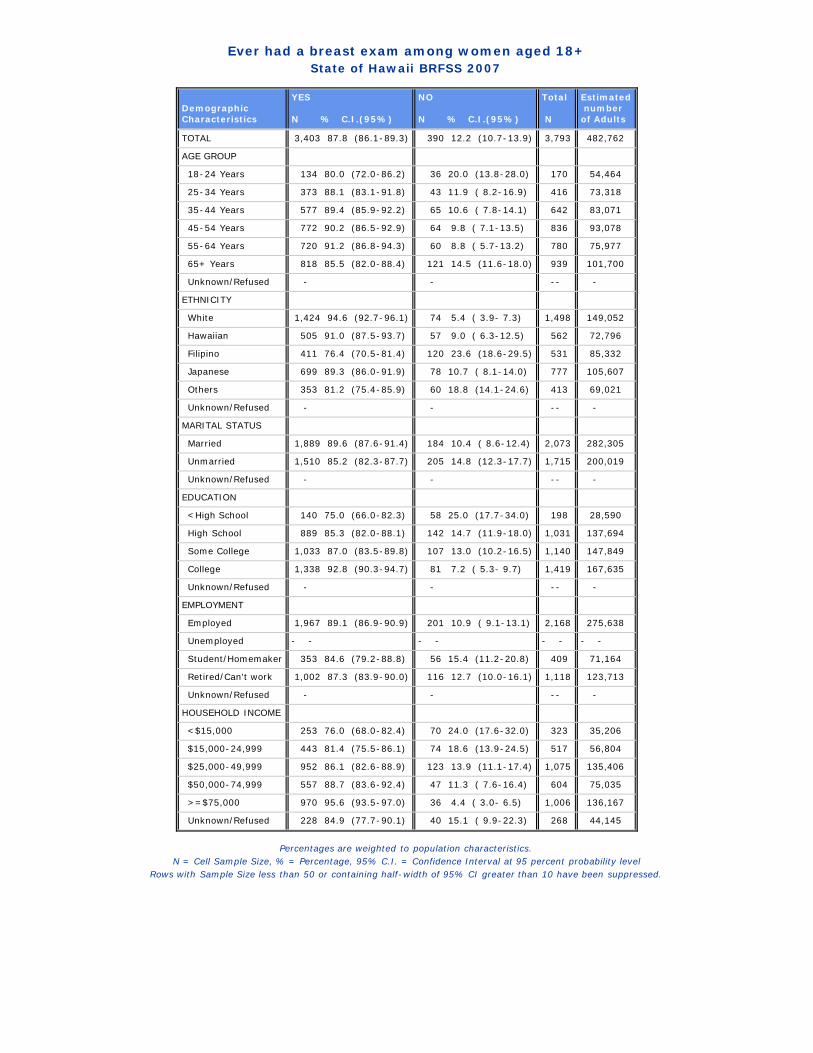
Ever had a breast exam among women aged 18+State of Hawaii BRFSS 2007
DemographicCharacteristics
YES N % C.I.(95%)
NO N % C.I.(95%)
Total N
Estimated numberof Adults
TOTAL 3,403 87.8 (86.1-89.3) 390 12.2 (10.7-13.9) 3,793 482,762
AGE GROUP
18-24 Years 134 80.0 (72.0-86.2) 36 20.0 (13.8-28.0) 170 54,464
25-34 Years 373 88.1 (83.1-91.8) 43 11.9 ( 8.2-16.9) 416 73,318
35-44 Years 577 89.4 (85.9-92.2) 65 10.6 ( 7.8-14.1) 642 83,071
45-54 Years 772 90.2 (86.5-92.9) 64 9.8 ( 7.1-13.5) 836 93,078
55-64 Years 720 91.2 (86.8-94.3) 60 8.8 ( 5.7-13.2) 780 75,977
65+ Years 818 85.5 (82.0-88.4) 121 14.5 (11.6-18.0) 939 101,700
Unknown/Refused - - -- -
ETHNICITY
White 1,424 94.6 (92.7-96.1) 74 5.4 ( 3.9- 7.3) 1,498 149,052
Hawaiian 505 91.0 (87.5-93.7) 57 9.0 ( 6.3-12.5) 562 72,796
Filipino 411 76.4 (70.5-81.4) 120 23.6 (18.6-29.5) 531 85,332
Japanese 699 89.3 (86.0-91.9) 78 10.7 ( 8.1-14.0) 777 105,607
Others 353 81.2 (75.4-85.9) 60 18.8 (14.1-24.6) 413 69,021
Unknown/Refused - - -- -
MARITAL STATUS
Married 1,889 89.6 (87.6-91.4) 184 10.4 ( 8.6-12.4) 2,073 282,305
Unmarried 1,510 85.2 (82.3-87.7) 205 14.8 (12.3-17.7) 1,715 200,019
Unknown/Refused - - -- -
EDUCATION
<High School 140 75.0 (66.0-82.3) 58 25.0 (17.7-34.0) 198 28,590
High School 889 85.3 (82.0-88.1) 142 14.7 (11.9-18.0) 1,031 137,694
Some College 1,033 87.0 (83.5-89.8) 107 13.0 (10.2-16.5) 1,140 147,849
College 1,338 92.8 (90.3-94.7) 81 7.2 ( 5.3- 9.7) 1,419 167,635
Unknown/Refused - - -- -
EMPLOYMENT
Employed 1,967 89.1 (86.9-90.9) 201 10.9 ( 9.1-13.1) 2,168 275,638
Unemployed - - - - - - - -
Student/Homemaker 353 84.6 (79.2-88.8) 56 15.4 (11.2-20.8) 409 71,164
Retired/Can't work 1,002 87.3 (83.9-90.0) 116 12.7 (10.0-16.1) 1,118 123,713
Unknown/Refused - - -- -
HOUSEHOLD INCOME
<$15,000 253 76.0 (68.0-82.4) 70 24.0 (17.6-32.0) 323 35,206
$15,000-24,999 443 81.4 (75.5-86.1) 74 18.6 (13.9-24.5) 517 56,804
$25,000-49,999 952 86.1 (82.6-88.9) 123 13.9 (11.1-17.4) 1,075 135,406
$50,000-74,999 557 88.7 (83.6-92.4) 47 11.3 ( 7.6-16.4) 604 75,035
>=$75,000 970 95.6 (93.5-97.0) 36 4.4 ( 3.0- 6.5) 1,006 136,167
Unknown/Refused 228 84.9 (77.7-90.1) 40 15.1 ( 9.9-22.3) 268 44,145
Percentages are weighted to population characteristics.N = Cell Sample Size, % = Percentage, 95% C.I. = Confidence Interval at 95 percent probability level
Rows with Sample Size less than 50 or containing half-width of 95% CI greater than 10 have been suppressed.
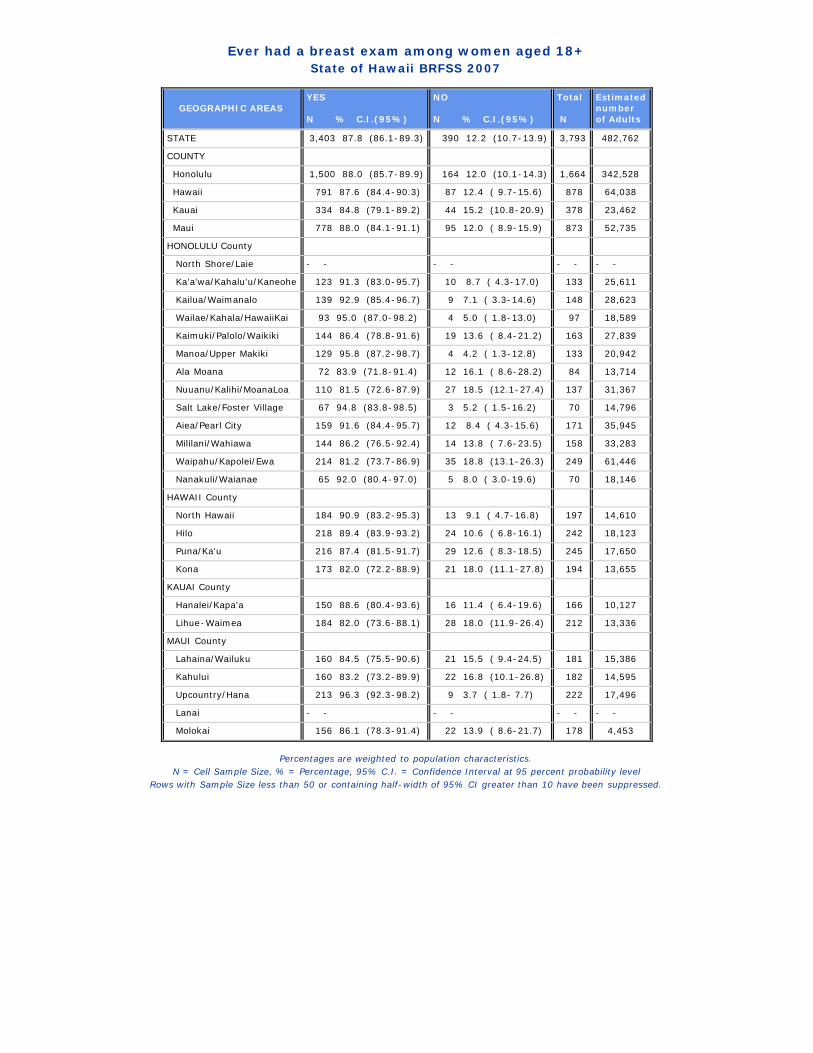
Ever had a breast exam among women aged 18+State of Hawaii BRFSS 2007
GEOGRAPHIC AREAS YES N % C.I.(95%)
NO N % C.I.(95%)
Total N
Estimatednumberof Adults
STATE 3,403 87.8 (86.1-89.3) 390 12.2 (10.7-13.9) 3,793 482,762
COUNTY
Honolulu 1,500 88.0 (85.7-89.9) 164 12.0 (10.1-14.3) 1,664 342,528
Hawaii 791 87.6 (84.4-90.3) 87 12.4 ( 9.7-15.6) 878 64,038
Kauai 334 84.8 (79.1-89.2) 44 15.2 (10.8-20.9) 378 23,462
Maui 778 88.0 (84.1-91.1) 95 12.0 ( 8.9-15.9) 873 52,735
HONOLULU County
North Shore/Laie - - - - - - - -
Ka'a'wa/Kahalu'u/Kaneohe 123 91.3 (83.0-95.7) 10 8.7 ( 4.3-17.0) 133 25,611
Kailua/Waimanalo 139 92.9 (85.4-96.7) 9 7.1 ( 3.3-14.6) 148 28,623
Wailae/Kahala/HawaiiKai 93 95.0 (87.0-98.2) 4 5.0 ( 1.8-13.0) 97 18,589
Kaimuki/Palolo/Waikiki 144 86.4 (78.8-91.6) 19 13.6 ( 8.4-21.2) 163 27,839
Manoa/Upper Makiki 129 95.8 (87.2-98.7) 4 4.2 ( 1.3-12.8) 133 20,942
Ala Moana 72 83.9 (71.8-91.4) 12 16.1 ( 8.6-28.2) 84 13,714
Nuuanu/Kalihi/MoanaLoa 110 81.5 (72.6-87.9) 27 18.5 (12.1-27.4) 137 31,367
Salt Lake/Foster Village 67 94.8 (83.8-98.5) 3 5.2 ( 1.5-16.2) 70 14,796
Aiea/Pearl City 159 91.6 (84.4-95.7) 12 8.4 ( 4.3-15.6) 171 35,945
Mililani/Wahiawa 144 86.2 (76.5-92.4) 14 13.8 ( 7.6-23.5) 158 33,283
Waipahu/Kapolei/Ewa 214 81.2 (73.7-86.9) 35 18.8 (13.1-26.3) 249 61,446
Nanakuli/Waianae 65 92.0 (80.4-97.0) 5 8.0 ( 3.0-19.6) 70 18,146
HAWAII County
North Hawaii 184 90.9 (83.2-95.3) 13 9.1 ( 4.7-16.8) 197 14,610
Hilo 218 89.4 (83.9-93.2) 24 10.6 ( 6.8-16.1) 242 18,123
Puna/Ka'u 216 87.4 (81.5-91.7) 29 12.6 ( 8.3-18.5) 245 17,650
Kona 173 82.0 (72.2-88.9) 21 18.0 (11.1-27.8) 194 13,655
KAUAI County
Hanalei/Kapa'a 150 88.6 (80.4-93.6) 16 11.4 ( 6.4-19.6) 166 10,127
Lihue-Waimea 184 82.0 (73.6-88.1) 28 18.0 (11.9-26.4) 212 13,336
MAUI County
Lahaina/Wailuku 160 84.5 (75.5-90.6) 21 15.5 ( 9.4-24.5) 181 15,386
Kahului 160 83.2 (73.2-89.9) 22 16.8 (10.1-26.8) 182 14,595
Upcountry/Hana 213 96.3 (92.3-98.2) 9 3.7 ( 1.8- 7.7) 222 17,496
Lanai - - - - - - - -
Molokai 156 86.1 (78.3-91.4) 22 13.9 ( 8.6-21.7) 178 4,453
Percentages are weighted to population characteristics.N = Cell Sample Size, % = Percentage, 95% C.I. = Confidence Interval at 95 percent probability level
Rows with Sample Size less than 50 or containing half-width of 95% CI greater than 10 have been suppressed.

Last clinical breast exam among women aged 18+State of Hawaii BRFSS 2007
DemographicCharacteristics
<1 year ago N % C.I.(95%)
1 to <2 years ago N % C.I.(95%)
2 or more years ago N % C.I.(95%)
No breast exam N % C.I.(95%)
Total N
Estimated numberof Adults
TOTAL 2,382 63.7 (61.5-65.9) 462 12.0 (10.6-13.6) 530 12.0 (10.7-13.4) 390 12.3 (10.8-14.0) 3,764 478,914
AGE GROUP
18-24 Years 96 59.7 (50.2-68.5) 19 11.9 ( 6.5-21.0) 18 8.3 ( 4.8-14.1) 36 20.0 (13.8-28.1) 169 54,325
25-34 Years 265 63.9 (57.6-69.7) 64 14.7 (10.8-19.8) 43 9.5 ( 6.3-14.1) 43 11.9 ( 8.3-17.0) 415 72,867
35-44 Years 397 63.9 (59.0-68.6) 87 12.8 ( 9.7-16.7) 92 12.7 ( 9.7-16.4) 65 10.6 ( 7.8-14.1) 641 83,027
45-54 Years 533 63.9 (59.3-68.2) 117 14.4 (11.5-17.9) 118 11.9 ( 9.3-15.0) 64 9.9 ( 7.1-13.6) 832 92,423
55-64 Years 523 70.1 (65.4-74.5) 78 8.4 ( 6.3-11.0) 115 12.7 (10.1-15.9) 60 8.8 ( 5.7-13.2) 776 75,702
65+ Years 561 60.5 (56.2-64.6) 96 9.9 ( 7.8-12.6) 143 14.7 (12.0-17.8) 121 14.9 (11.9-18.4) 921 99,416
Unknown/Refused - - - - -- -
ETHNICITY
White 994 69.2 (65.8-72.3) 200 13.4 (11.0-16.1) 221 12.1 (10.2-14.3) 74 5.4 ( 4.0- 7.3) 1,489 148,064
Hawaiian 338 61.5 (55.6-67.2) 80 13.8 (10.0-18.8) 85 15.7 (11.7-20.7) 57 9.0 ( 6.3-12.6) 560 72,623
Filipino 289 53.8 (47.6-60.0) 59 12.2 ( 8.4-17.3) 58 10.1 ( 7.2-14.1) 120 23.8 (18.8-29.8) 526 84,371
Japanese 525 70.9 (66.8-74.7) 67 7.6 ( 5.8- 9.9) 96 10.6 ( 8.3-13.4) 78 10.9 ( 8.2-14.2) 766 104,240
Others 232 55.8 (49.5-61.9) 55 13.5 ( 9.7-18.4) 64 11.9 ( 8.9-15.8) 60 18.9 (14.2-24.7) 411 68,662
Unknown/Refused - - - - -- -
MARITAL STATUS
Married 1,398 68.1 (65.4-70.7) 247 11.3 ( 9.7-13.2) 235 10.2 ( 8.7-11.9) 184 10.4 ( 8.6-12.5) 2,064 281,074
Unmarried 983 57.6 (54.0-61.2) 214 12.9 (10.5-15.8) 293 14.4 (12.3-16.9) 205 15.0 (12.5-18.0) 1,695 197,401
Unknown/Refused - - - - -- -
EDUCATION
<High School 87 49.6 (39.9-59.2) 18 9.8 ( 5.6-16.5) 26 14.8 ( 8.8-23.8) 58 25.8 (18.4-35.1) 189 27,650
High School 599 60.1 (55.8-64.2) 123 11.8 ( 9.1-15.1) 160 13.4 (10.9-16.3) 142 14.8 (12.0-18.2) 1,024 136,539
Some College 719 61.6 (57.4-65.7) 145 13.3 (10.5-16.6) 163 12.0 ( 9.8-14.8) 107 13.1 (10.2-16.6) 1,134 146,995
College 976 71.1 (67.8-74.2) 176 11.5 ( 9.4-13.8) 179 10.2 ( 8.5-12.2) 81 7.2 ( 5.4- 9.7) 1,412 166,734
Unknown/Refused - - - - -- -
EMPLOYMENT
Employed 1,367 64.3 (61.4-67.1) 301 13.5 (11.6-15.8) 292 11.2 ( 9.5-13.1) 201 11.0 ( 9.1-13.2) 2,161 274,412
Unemployed - - - - - - - - - - - -
Student/Homemaker 251 63.3 (56.9-69.2) 48 11.2 ( 7.8-15.8) 52 10.1 ( 7.0-14.3) 56 15.4 (11.2-20.9) 407 71,048
Retired/Can't work 715 64.3 (60.4-68.1) 101 8.4 ( 6.5-10.7) 167 14.3 (11.9-17.1) 116 13.0 (10.2-16.4) 1,099 121,346
Unknown/Refused - - - - -- -
HOUSEHOLD INCOME
<$15,000 152 50.3 (42.1-58.5) 35 9.2 ( 5.8-14.4) 62 16.2 (11.1-23.2) 70 24.2 (17.7-32.2) 319 34,967
$15,000-24,999 283 57.0 (50.9-62.9) 73 10.9 ( 8.1-14.4) 80 13.2 ( 9.6-17.8) 74 18.9 (14.2-24.9) 510 55,769
$25,000-49,999 653 60.7 (56.4-64.8) 138 13.2 (10.4-16.5) 156 12.2 ( 9.9-14.9) 123 14.0 (11.1-17.5) 1,070 134,609
$50,000-74,999 386 63.8 (58.1-69.1) 83 12.4 ( 9.2-16.5) 85 12.5 ( 9.4-16.4) 47 11.4 ( 7.7-16.5) 601 74,520
>=$75,000 756 75.0 (71.4-78.3) 110 11.1 ( 8.9-13.9) 101 9.4 ( 7.4-12.0) 36 4.4 ( 3.0- 6.5) 1,003 135,817
Unknown/Refused 152 57.2 (48.4-65.5) 23 13.9 ( 8.0-23.2) 46 13.5 ( 9.4-19.1) 40 15.4 (10.1-22.7) 261 43,233
COUNTY
Honolulu 1,112 65.7 (62.8-68.5) 195 11.9 (10.1-14.1) 179 10.2 ( 8.6-12.0) 164 12.1 (10.2-14.4) 1,650 339,706
Hawaii 523 58.2 (54.3-62.1) 117 13.0 (10.6-15.8) 146 16.3 (13.7-19.4) 87 12.5 ( 9.8-15.7) 873 63,587
Kauai 232 60.0 (53.9-65.8) 42 9.8 ( 7.0-13.3) 59 15.0 (11.4-19.6) 44 15.2 (10.8-20.9) 377 23,421
Maui 515 58.9 (54.2-63.4) 108 12.2 ( 9.5-15.4) 146 16.9 (13.5-20.8) 95 12.1 ( 9.0-16.0) 864 52,201
Percentages are weighted to population characteristics.N = Cell Sample Size, % = Percentage, 95% C.I. = Confidence Interval at 95 percent probability level
Rows with Sample Size less than 50 or containing half-width of 95% CI greater than 10 have been suppressed.

Ever had a breast exam among women aged 40+State of Hawaii BRFSS 2007
DemographicCharacteristics
YES N % C.I.(95%)
NO N % C.I.(95%)
Total N
Estimated numberof Adults
TOTAL 2,621 88.6 (86.7-90.3) 279 11.4 ( 9.7-13.3) 2,900 315,943
AGE GROUP
40-44 Years 311 88.1 (82.6-92.0) 34 11.9 ( 8.0-17.4) 345 45,187
45-54 Years 772 90.2 (86.5-92.9) 64 9.8 ( 7.1-13.5) 836 93,078
55-64 Years 720 91.2 (86.8-94.3) 60 8.8 ( 5.7-13.2) 780 75,977
65+ Years 818 85.5 (82.0-88.4) 121 14.5 (11.6-18.0) 939 101,700
Unknown/Refused
ETHNICITY
White 1,152 94.8 (92.8-96.3) 57 5.2 ( 3.7- 7.2) 1,209 103,409
Hawaiian 334 91.6 (86.9-94.8) 35 8.4 ( 5.2-13.1) 369 39,188
Filipino 285 75.7 (68.1-81.9) 83 24.3 (18.1-31.9) 368 48,918
Japanese 602 90.3 (87.2-92.8) 66 9.7 ( 7.2-12.8) 668 85,154
Others 239 81.5 (74.1-87.1) 38 18.5 (12.9-25.9) 277 38,679
Unknown/Refused - - -- -
MARITAL STATUS
Married 1,441 89.1 (86.6-91.2) 143 10.9 ( 8.8-13.4) 1,584 200,430
Unmarried 1,176 87.7 (84.6-90.2) 136 12.3 ( 9.8-15.4) 1,312 115,183
Unknown/Refused - - -- -
EDUCATION
<High School 120 75.4 (65.4-83.2) 50 24.6 (16.8-34.6) 170 21,117
High School 658 85.0 (81.0-88.3) 101 15.0 (11.7-19.0) 759 85,218
Some College 767 89.0 (85.4-91.8) 72 11.0 ( 8.2-14.6) 839 87,682
College 1,074 93.3 (90.2-95.5) 55 6.7 ( 4.5- 9.8) 1,129 121,341
Unknown/Refused - - -- -
EMPLOYMENT
Employed 1,416 89.6 (86.8-91.8) 131 10.4 ( 8.2-13.2) 1,547 167,169
Unemployed 55 88.2 (76.5-94.5) 9 11.8 ( 5.5-23.5) 64 5,965
Student/Homemaker 170 84.9 (76.9-90.4) 28 15.1 ( 9.6-23.1) 198 25,531
Retired/Can't work 978 88.1 (84.9-90.7) 111 11.9 ( 9.3-15.1) 1,089 117,207
Unknown/Refused - - -- -
HOUSEHOLD INCOME
<$15,000 200 73.1 (64.1-80.6) 58 26.9 (19.4-35.9) 258 22,197
$15,000-24,999 331 79.4 (72.1-85.2) 58 20.6 (14.8-27.9) 389 37,294
$25,000-49,999 727 87.4 (83.4-90.4) 82 12.6 ( 9.6-16.6) 809 83,616
$50,000-74,999 416 90.5 (84.2-94.5) 32 9.5 ( 5.5-15.8) 448 48,869
>=$75,000 767 96.4 (94.1-97.9) 23 3.6 ( 2.1- 5.9) 790 95,861
Unknown/Refused 180 87.0 (79.8-91.9) 26 13.0 ( 8.1-20.2) 206 28,106
Percentages are weighted to population characteristics.N = Cell Sample Size, % = Percentage, 95% C.I. = Confidence Interval at 95 percent probability level
Rows with Sample Size less than 50 or containing half-width of 95% CI greater than 10 have been suppressed.

Ever had a breast exam among women aged 40+State of Hawaii BRFSS 2007
GEOGRAPHIC AREAS YES N % C.I.(95%)
NO N % C.I.(95%)
Total N
Estimatednumberof Adults
STATE 2,621 88.6 (86.7-90.3) 279 11.4 ( 9.7-13.3) 2,900 315,943
COUNTY
Honolulu 1,135 88.1 (85.5-90.3) 121 11.9 ( 9.7-14.5) 1,256 224,403
Hawaii 620 89.8 (86.6-92.3) 61 10.2 ( 7.7-13.4) 681 41,401
Kauai 268 86.9 (81.3-91.0) 32 13.1 ( 9.0-18.7) 300 15,764
Maui 598 91.4 (87.8-94.0) 65 8.6 ( 6.0-12.2) 663 34,375
HONOLULU County
North Shore/Laie - - -- -
Ka'a'wa/Kahalu'u/Kaneohe 102 90.8 (81.6-95.7) 9 9.2 ( 4.3-18.4) 111 19,458
Kailua/Waimanalo 106 93.7 (87.0-97.0) 7 6.3 ( 3.0-13.0) 113 19,258
Wailae/Kahala/HawaiiKai 76 98.2 (88.3-99.7) 1 1.8 ( 0.3-11.7) 77 13,226
Kaimuki/Palolo/Waikiki 127 86.4 (77.9-92.0) 16 13.6 ( 8.0-22.1) 143 22,275
Manoa/Upper Makiki 114 97.6 (92.1-99.3) 3 2.4 ( 0.7- 7.9) 117 17,123
Ala Moana 61 89.5 (79.6-94.9) 8 10.5 ( 5.1-20.4) 69 10,180
Nuuanu/Kalihi/MoanaLoa 87 78.7 (67.9-86.6) 22 21.3 (13.4-32.1) 109 20,389
Salt Lake/Foster Village - - -- -
Aiea/Pearl City 120 90.9 (83.1-95.3) 10 9.1 ( 4.7-16.9) 130 24,323
Mililani/Wahiawa - - - - - - - -
Waipahu/Kapolei/Ewa 143 80.2 (70.6-87.3) 24 19.8 (12.7-29.4) 167 36,828
Nanakuli/Waianae - - -- -
HAWAII County
North Hawaii 141 92.0 (83.2-96.4) 9 8.0 ( 3.6-16.8) 150 9,017
Hilo 178 90.0 (84.0-93.9) 19 10.0 ( 6.1-16.0) 197 13,103
Puna/Ka'u 158 88.5 (82.2-92.7) 20 11.5 ( 7.3-17.8) 178 10,337
Kona 143 88.7 (79.8-94.0) 13 11.3 ( 6.0-20.2) 156 8,945
KAUAI County
Hanalei/Kapa'a 122 89.0 (79.7-94.4) 12 11.0 ( 5.6-20.3) 134 6,759
Lihue-Waimea 146 85.3 (77.6-90.6) 20 14.7 ( 9.4-22.4) 166 9,005
MAUI County
Lahaina/Wailuku 119 88.5 (77.6-94.5) 12 11.5 ( 5.5-22.4) 131 9,452
Kahului 124 89.9 (83.1-94.1) 14 10.1 ( 5.9-16.9) 138 9,464
Upcountry/Hana 170 95.4 (90.0-97.9) 8 4.6 ( 2.1-10.0) 178 12,186
Lanai - - - - - - - -
Molokai 116 91.9 (86.0-95.5) 13 8.1 ( 4.5-14.0) 129 2,687
Percentages are weighted to population characteristics.N = Cell Sample Size, % = Percentage, 95% C.I. = Confidence Interval at 95 percent probability level
Rows with Sample Size less than 50 or containing half-width of 95% CI greater than 10 have been suppressed.

Last clinical breast exam among women aged 40+State of Hawaii BRFSS 2007
DemographicCharacteristics
<1 year ago N % C.I.(95%)
1 to <2 years ago N % C.I.(95%)
2 or more years ago N % C.I.(95%)
No breast exam N % C.I.(95%)
Total N
Estimated numberof Adults
TOTAL 1,837 64.4 (62.0-66.8) 332 11.0 ( 9.6-12.6) 425 13.1 (11.6-14.7) 279 11.5 ( 9.8-13.4) 2,873 312,685
AGE GROUP
40-44 Years 220 64.6 (57.9-70.9) 41 11.0 ( 7.3-16.3) 49 12.5 ( 8.7-17.5) 34 11.9 ( 8.0-17.4) 344 45,143
45-54 Years 533 63.9 (59.3-68.2) 117 14.4 (11.5-17.9) 118 11.9 ( 9.3-15.0) 64 9.9 ( 7.1-13.6) 832 92,423
55-64 Years 523 70.1 (65.4-74.5) 78 8.4 ( 6.3-11.0) 115 12.7 (10.1-15.9) 60 8.8 ( 5.7-13.2) 776 75,702
65+ Years 561 60.5 (56.2-64.6) 96 9.9 ( 7.8-12.6) 143 14.7 (12.0-17.8) 121 14.9 (11.9-18.4) 921 99,416
Unknown/Refused
ETHNICITY
White 803 69.3 (65.8-72.6) 152 11.8 ( 9.6-14.5) 188 13.6 (11.4-16.2) 57 5.2 ( 3.7- 7.3) 1,200 102,421
Hawaiian 231 65.1 (58.1-71.5) 48 13.3 ( 9.0-19.2) 54 13.2 ( 9.2-18.5) 35 8.4 ( 5.3-13.2) 368 39,154
Filipino 201 52.0 (44.8-59.1) 38 11.2 ( 7.7-16.2) 42 12.2 ( 8.3-17.5) 83 24.6 (18.3-32.2) 364 48,409
Japanese 451 71.2 (66.8-75.2) 54 7.4 ( 5.4- 9.9) 86 11.6 ( 9.0-14.9) 66 9.8 ( 7.4-13.0) 657 83,787
Others 149 52.2 (44.9-59.5) 39 14.0 ( 9.6-20.0) 49 15.1 (10.8-20.6) 38 18.7 (13.0-26.1) 275 38,319
Unknown/Refused - - - - -- -
MARITAL STATUS
Married 1,075 68.3 (65.2-71.3) 175 10.5 ( 8.7-12.6) 182 10.3 ( 8.6-12.2) 143 10.9 ( 8.8-13.5) 1,575 199,200
Unmarried 761 57.7 (54.0-61.4) 156 11.9 ( 9.8-14.5) 241 17.8 (15.2-20.8) 136 12.5 ( 9.9-15.6) 1,294 113,155
Unknown/Refused - - - - -- -
EDUCATION
<High School - - - - - - - - - - - -
High School 445 60.2 (55.4-64.8) 85 10.2 ( 7.8-13.3) 123 14.5 (11.5-18.1) 101 15.1 (11.7-19.1) 754 84,653
Some College 541 63.7 (59.2-68.1) 95 12.2 ( 9.4-15.8) 125 12.9 (10.3-16.1) 72 11.1 ( 8.3-14.7) 833 86,828
College 778 70.7 (67.0-74.2) 136 10.9 ( 8.9-13.4) 153 11.6 ( 9.5-14.1) 55 6.7 ( 4.5- 9.9) 1,122 120,441
Unknown/Refused - - - - -- -
EMPLOYMENT
Employed 986 65.3 (62.0-68.5) 207 12.6 (10.7-14.9) 217 11.6 ( 9.7-13.8) 131 10.5 ( 8.2-13.2) 1,541 166,394
Unemployed - - - - - - - - - - - -
Student/Homemaker 122 61.5 (52.1-70.1) 19 11.6 ( 6.1-20.9) 27 11.7 ( 7.4-17.9) 28 15.2 ( 9.7-23.2) 196 25,415
Retired/Can't work 696 64.5 (60.5-68.2) 98 8.6 ( 6.7-10.9) 165 14.8 (12.4-17.7) 111 12.1 ( 9.5-15.4) 1,070 114,840
Unknown/Refused - - - - -- -
HOUSEHOLD INCOME
<$15,000 118 46.6 (38.1-55.3) 22 6.7 ( 4.0-11.0) 56 19.5 (13.8-26.9) 58 27.2 (19.6-36.3) 254 21,958
$15,000-24,999 210 55.4 (48.3-62.3) 52 10.9 ( 7.7-15.1) 64 12.9 ( 9.2-18.0) 58 20.8 (15.0-28.3) 384 36,849
$25,000-49,999 498 60.8 (56.1-65.3) 102 12.9 (10.0-16.5) 122 13.5 (10.8-16.8) 82 12.8 ( 9.6-16.7) 804 82,819
$50,000-74,999 287 64.2 (57.8-70.1) 62 12.2 ( 9.0-16.3) 64 14.1 (10.4-18.8) 32 9.6 ( 5.6-16.0) 445 48,353
>=$75,000 606 76.6 (72.6-80.2) 78 10.2 ( 7.7-13.2) 80 9.6 ( 7.4-12.5) 23 3.6 ( 2.2- 6.0) 787 95,511
Unknown/Refused 118 59.9 (50.8-68.3) 16 9.9 ( 5.4-17.4) 39 16.8 (11.5-24.0) 26 13.4 ( 8.4-20.9) 199 27,194
COUNTY
Honolulu 831 65.7 (62.6-68.8) 143 10.9 ( 9.1-13.0) 148 11.4 ( 9.5-13.5) 121 12.0 ( 9.8-14.6) 1,243 222,032
Hawaii 418 61.0 (56.8-65.1) 82 11.0 ( 8.8-13.8) 116 17.7 (14.6-21.2) 61 10.3 ( 7.8-13.5) 677 41,089
Kauai 187 60.3 (53.9-66.4) 34 11.3 ( 7.9-15.8) 46 15.2 (11.2-20.3) 32 13.2 ( 9.1-18.7) 299 15,722
Maui 401 61.9 (56.6-66.9) 73 11.8 ( 8.7-15.7) 115 17.6 (13.8-22.2) 65 8.8 ( 6.1-12.4) 654 33,841
Percentages are weighted to population characteristics.N = Cell Sample Size, % = Percentage, 95% C.I. = Confidence Interval at 95 percent probability level
Rows with Sample Size less than 50 or containing half-width of 95% CI greater than 10 have been suppressed.
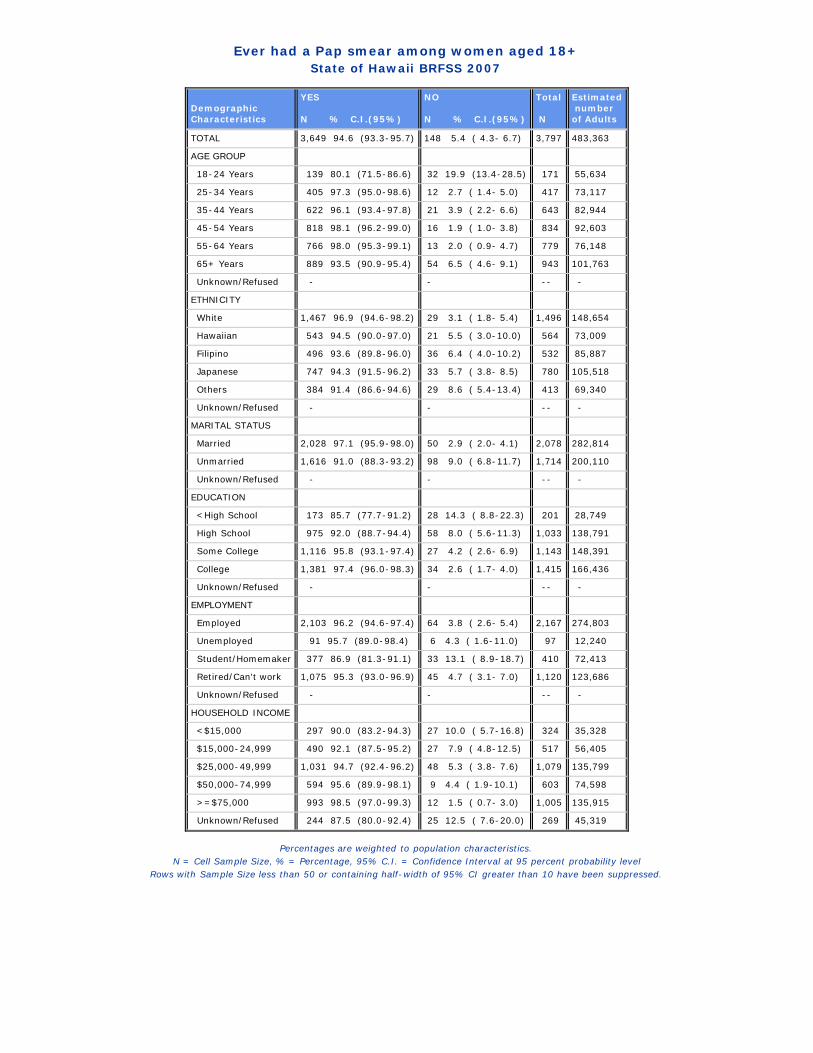
Ever had a Pap smear among women aged 18+State of Hawaii BRFSS 2007
DemographicCharacteristics
YES N % C.I.(95%)
NO N % C.I.(95%)
Total N
Estimated numberof Adults
TOTAL 3,649 94.6 (93.3-95.7) 148 5.4 ( 4.3- 6.7) 3,797 483,363
AGE GROUP
18-24 Years 139 80.1 (71.5-86.6) 32 19.9 (13.4-28.5) 171 55,634
25-34 Years 405 97.3 (95.0-98.6) 12 2.7 ( 1.4- 5.0) 417 73,117
35-44 Years 622 96.1 (93.4-97.8) 21 3.9 ( 2.2- 6.6) 643 82,944
45-54 Years 818 98.1 (96.2-99.0) 16 1.9 ( 1.0- 3.8) 834 92,603
55-64 Years 766 98.0 (95.3-99.1) 13 2.0 ( 0.9- 4.7) 779 76,148
65+ Years 889 93.5 (90.9-95.4) 54 6.5 ( 4.6- 9.1) 943 101,763
Unknown/Refused - - -- -
ETHNICITY
White 1,467 96.9 (94.6-98.2) 29 3.1 ( 1.8- 5.4) 1,496 148,654
Hawaiian 543 94.5 (90.0-97.0) 21 5.5 ( 3.0-10.0) 564 73,009
Filipino 496 93.6 (89.8-96.0) 36 6.4 ( 4.0-10.2) 532 85,887
Japanese 747 94.3 (91.5-96.2) 33 5.7 ( 3.8- 8.5) 780 105,518
Others 384 91.4 (86.6-94.6) 29 8.6 ( 5.4-13.4) 413 69,340
Unknown/Refused - - -- -
MARITAL STATUS
Married 2,028 97.1 (95.9-98.0) 50 2.9 ( 2.0- 4.1) 2,078 282,814
Unmarried 1,616 91.0 (88.3-93.2) 98 9.0 ( 6.8-11.7) 1,714 200,110
Unknown/Refused - - -- -
EDUCATION
<High School 173 85.7 (77.7-91.2) 28 14.3 ( 8.8-22.3) 201 28,749
High School 975 92.0 (88.7-94.4) 58 8.0 ( 5.6-11.3) 1,033 138,791
Some College 1,116 95.8 (93.1-97.4) 27 4.2 ( 2.6- 6.9) 1,143 148,391
College 1,381 97.4 (96.0-98.3) 34 2.6 ( 1.7- 4.0) 1,415 166,436
Unknown/Refused - - -- -
EMPLOYMENT
Employed 2,103 96.2 (94.6-97.4) 64 3.8 ( 2.6- 5.4) 2,167 274,803
Unemployed 91 95.7 (89.0-98.4) 6 4.3 ( 1.6-11.0) 97 12,240
Student/Homemaker 377 86.9 (81.3-91.1) 33 13.1 ( 8.9-18.7) 410 72,413
Retired/Can't work 1,075 95.3 (93.0-96.9) 45 4.7 ( 3.1- 7.0) 1,120 123,686
Unknown/Refused - - -- -
HOUSEHOLD INCOME
<$15,000 297 90.0 (83.2-94.3) 27 10.0 ( 5.7-16.8) 324 35,328
$15,000-24,999 490 92.1 (87.5-95.2) 27 7.9 ( 4.8-12.5) 517 56,405
$25,000-49,999 1,031 94.7 (92.4-96.2) 48 5.3 ( 3.8- 7.6) 1,079 135,799
$50,000-74,999 594 95.6 (89.9-98.1) 9 4.4 ( 1.9-10.1) 603 74,598
>=$75,000 993 98.5 (97.0-99.3) 12 1.5 ( 0.7- 3.0) 1,005 135,915
Unknown/Refused 244 87.5 (80.0-92.4) 25 12.5 ( 7.6-20.0) 269 45,319
Percentages are weighted to population characteristics.N = Cell Sample Size, % = Percentage, 95% C.I. = Confidence Interval at 95 percent probability level
Rows with Sample Size less than 50 or containing half-width of 95% CI greater than 10 have been suppressed.

Ever had a Pap smear among women aged 18+State of Hawaii BRFSS 2007
GEOGRAPHIC AREAS YES N % C.I.(95%)
NO N % C.I.(95%)
Total N
Estimatednumberof Adults
STATE 3,649 94.6 (93.3-95.7) 148 5.4 ( 4.3- 6.7) 3,797 483,363
COUNTY
Honolulu 1,593 94.4 (92.6-95.8) 66 5.6 ( 4.2- 7.4) 1,659 342,220
Hawaii 850 95.6 (93.3-97.2) 30 4.4 ( 2.8- 6.7) 880 64,307
Kauai 364 93.0 (87.4-96.2) 15 7.0 ( 3.8-12.6) 379 23,483
Maui 842 95.3 (92.3-97.1) 37 4.7 ( 2.9- 7.7) 879 53,354
HONOLULU County
North Shore/Laie 47 91.3 (77.1-97.0) 4 8.7 ( 3.0-22.9) 51 12,227
Ka'a'wa/Kahalu'u/Kaneohe 129 97.5 (93.0-99.1) 4 2.5 ( 0.9- 7.0) 133 25,611
Kailua/Waimanalo 145 95.5 (82.8-99.0) 3 4.5 ( 1.0-17.2) 148 28,623
Wailae/Kahala/HawaiiKai 95 97.6 (90.0-99.5) 2 2.4 ( 0.5-10.0) 97 18,589
Kaimuki/Palolo/Waikiki 152 91.0 (83.4-95.3) 11 9.0 ( 4.7-16.6) 163 27,839
Manoa/Upper Makiki 128 96.0 (86.9-98.9) 3 4.0 ( 1.1-13.1) 131 20,723
Ala Moana 78 90.6 (77.9-96.3) 5 9.4 ( 3.7-22.1) 83 13,645
Nuuanu/Kalihi/MoanaLoa 127 90.3 (79.9-95.6) 10 9.7 ( 4.4-20.1) 137 31,367
Salt Lake/Foster Village 68 97.5 (84.3-99.6) 1 2.5 ( 0.4-15.7) 69 14,358
Aiea/Pearl City 169 97.5 (88.7-99.5) 2 2.5 ( 0.5-11.3) 171 35,803
Mililani/Wahiawa 148 92.5 (83.9-96.7) 8 7.5 ( 3.3-16.1) 156 32,672
Waipahu/Kapolei/Ewa 237 93.2 (88.0-96.3) 12 6.8 ( 3.7-12.0) 249 61,446
Nanakuli/Waianae 70 98.8 (91.6-99.8) 1 1.2 ( 0.2- 8.4) 71 19,316
HAWAII County
North Hawaii 197 99.7 (97.9- 100) 1 0.3 ( 0.0- 2.1) 198 14,662
Hilo 233 95.1 (90.1-97.6) 10 4.9 ( 2.4- 9.9) 243 18,254
Puna/Ka'u 237 96.4 (92.6-98.3) 8 3.6 ( 1.7- 7.4) 245 17,737
Kona 183 90.9 (82.3-95.6) 11 9.1 ( 4.4-17.7) 194 13,655
KAUAI County
Hanalei/Kapa'a 161 93.1 (83.9-97.2) 6 6.9 ( 2.8-16.1) 167 10,147
Lihue-Waimea 203 93.0 (84.5-97.0) 9 7.0 ( 3.0-15.5) 212 13,336
MAUI County
Lahaina/Wailuku 179 93.7 (85.6-97.4) 7 6.3 ( 2.6-14.4) 186 15,968
Kahului 176 95.4 (88.4-98.2) 6 4.6 ( 1.8-11.6) 182 14,595
Upcountry/Hana 218 97.4 (90.6-99.3) 4 2.6 ( 0.7- 9.4) 222 17,496
Lanai - - - - - - - -
Molokai 170 93.9 (86.8-97.3) 9 6.1 ( 2.7-13.2) 179 4,489
Percentages are weighted to population characteristics.N = Cell Sample Size, % = Percentage, 95% C.I. = Confidence Interval at 95 percent probability level
Rows with Sample Size less than 50 or containing half-width of 95% CI greater than 10 have been suppressed.

Last Pap smear among women aged 18+State of Hawaii BRFSS 2007
DemographicCharacteristics
<3 years ago N % C.I.(95%)
3+ years ago N % C.I.(95%)
No pap smear N % C.I.(95%)
Total N
Estimated numberof Adults
TOTAL 3,052 82.4 (80.7-84.0) 578 12.2 (10.9-13.5) 148 5.4 ( 4.4- 6.8) 3,778 481,198
AGE GROUP
18-24 Years 137 79.5 (70.9-86.0) 2 0.7 ( 0.1- 3.1) 32 19.9 (13.4-28.5) 171 55,634
25-34 Years 384 92.5 (88.4-95.3) 20 4.8 ( 2.6- 8.8) 12 2.7 ( 1.4- 5.0) 416 73,026
35-44 Years 557 87.8 (84.1-90.7) 65 8.3 ( 6.0-11.4) 21 3.9 ( 2.2- 6.6) 643 82,944
45-54 Years 700 84.9 (81.4-87.9) 116 13.1 (10.3-16.5) 16 1.9 ( 1.0- 3.8) 832 92,423
55-64 Years 628 83.7 (79.9-86.9) 134 14.3 (11.4-17.7) 13 2.0 ( 0.9- 4.7) 775 75,497
65+ Years 636 68.7 (64.7-72.5) 241 24.7 (21.3-28.4) 54 6.6 ( 4.7- 9.2) 931 100,521
Unknown/Refused - - - -- -
ETHNICITY
White 1,206 83.3 (80.6-85.7) 256 13.6 (11.6-15.7) 29 3.1 ( 1.8- 5.4) 1,491 148,185
Hawaiian 456 82.2 (77.0-86.4) 85 12.3 ( 9.0-16.5) 21 5.6 ( 3.0-10.1) 562 72,770
Filipino 427 82.7 (77.8-86.7) 68 10.9 ( 7.9-15.0) 36 6.4 ( 4.0-10.2) 531 85,845
Japanese 626 82.1 (78.5-85.2) 113 12.1 ( 9.7-15.0) 33 5.8 ( 3.9- 8.6) 772 104,555
Others 329 80.8 (75.5-85.3) 52 10.5 ( 7.6-14.4) 29 8.7 ( 5.5-13.5) 410 68,889
Unknown/Refused - - - -- -
MARITAL STATUS
Married 1,791 87.3 (85.4-89.0) 231 9.8 ( 8.3-11.4) 50 2.9 ( 2.0- 4.1) 2,072 281,811
Unmarried 1,257 75.4 (72.2-78.4) 347 15.5 (13.4-17.9) 98 9.0 ( 6.9-11.8) 1,702 199,068
Unknown/Refused - - - -- -
EDUCATION
<High School 123 67.3 (57.8-75.6) 43 18.2 (11.9-26.7) 28 14.5 ( 9.0-22.6) 194 28,317
High School 801 79.5 (75.8-82.8) 169 12.4 (10.1-15.1) 58 8.1 ( 5.7-11.4) 1,028 137,943
Some College 928 83.1 (79.8-86.0) 186 12.6 (10.4-15.3) 27 4.3 ( 2.6- 7.0) 1,141 148,064
College 1,197 86.8 (84.5-88.8) 179 10.5 ( 8.8-12.6) 34 2.6 ( 1.7- 4.0) 1,410 165,879
Unknown/Refused - - - -- -
EMPLOYMENT
Employed 1,837 87.0 (84.9-88.9) 261 9.2 ( 7.8-10.8) 64 3.8 ( 2.6- 5.4) 2,162 274,281
Unemployed - - - - - - - - - -
Student/Homemaker 335 80.9 (75.1-85.6) 41 6.0 ( 4.0- 9.1) 33 13.1 ( 8.9-18.7) 409 72,345
Retired/Can't work 806 73.3 (69.6-76.6) 256 22.0 (19.0-25.3) 45 4.7 ( 3.1- 7.1) 1,107 122,111
Unknown/Refused - - - -- -
HOUSEHOLD INCOME
<$15,000 210 69.8 (61.9-76.7) 83 20.1 (14.7-26.9) 27 10.0 ( 5.8-16.9) 320 35,107
$15,000-24,999 393 78.4 (73.0-82.9) 93 13.7 (10.4-17.9) 27 7.9 ( 4.9-12.6) 513 56,015
$25,000-49,999 835 80.4 (77.2-83.3) 193 14.2 (11.8-17.0) 48 5.4 ( 3.8- 7.6) 1,076 135,402
$50,000-74,999 505 82.7 (77.5-86.9) 88 12.9 ( 9.8-16.7) 9 4.4 ( 1.9-10.1) 602 74,564
>=$75,000 909 91.5 (89.2-93.4) 83 7.0 ( 5.4- 9.1) 12 1.5 ( 0.7- 3.0) 1,004 135,883
Unknown/Refused 200 75.0 (66.9-81.7) 38 12.1 ( 8.0-17.9) 25 12.9 ( 7.8-20.5) 263 44,228
Percentages are weighted to population characteristics.N = Cell Sample Size, % = Percentage, 95% C.I. = Confidence Interval at 95 percent probability level
Rows with Sample Size less than 50 or containing half-width of 95% CI greater than 10 have been suppressed.

Last Pap smear among women aged 18+State of Hawaii BRFSS 2007
GEOGRAPHIC AREAS <3 years ago N % C.I.(95%)
3+ years ago N % C.I.(95%)
No pap smear N % C.I.(95%)
Total N
Estimatednumberof Adults
STATE 3,052 82.4 (80.7-84.0) 578 12.2 (10.9-13.5) 148 5.4 ( 4.4- 6.8) 3,778 481,198
COUNTY
Honolulu 1,377 83.4 (81.1-85.5) 207 11.0 ( 9.4-12.8) 66 5.6 ( 4.3- 7.4) 1,650 340,637
Hawaii 710 81.2 (78.0-84.1) 139 14.4 (12.0-17.2) 30 4.4 ( 2.8- 6.7) 879 64,263
Kauai 290 77.4 (71.8-82.2) 72 15.6 (12.2-19.7) 15 7.0 ( 3.8-12.6) 377 23,421
Maui 675 79.8 (75.9-83.1) 160 15.5 (12.7-18.7) 37 4.8 ( 2.9- 7.8) 872 52,877
HONOLULU County
North Shore/Laie - - - - - - - - - -
Ka'a'wa/Kahalu'u/Kaneohe 109 82.5 (74.2-88.5) 20 15.0 ( 9.4-23.0) 4 2.5 ( 0.9- 7.0) 133 25,611
Kailua/Waimanalo 127 84.6 (74.9-91.0) 16 10.9 ( 6.4-17.9) 3 4.5 ( 1.1-17.3) 146 28,411
Wailae/Kahala/HawaiiKai 85 89.2 (80.5-94.3) 9 8.4 ( 4.1-16.3) 2 2.4 ( 0.5-10.0) 96 18,444
Kaimuki/Palolo/Waikiki 116 70.9 (61.8-78.6) 34 19.9 (13.6-28.1) 11 9.2 ( 4.8-16.8) 161 27,412
Manoa/Upper Makiki 109 82.9 (74.2-89.2) 19 13.1 ( 8.1-20.5) 3 4.0 ( 1.1-13.1) 131 20,723
Ala Moana - - - - - - - - - -
Nuuanu/Kalihi/MoanaLoa 109 79.0 (68.9-86.5) 18 11.3 ( 6.6-18.5) 10 9.7 ( 4.4-20.1) 137 31,367
Salt Lake/Foster Village 64 92.9 (82.1-97.4) 4 4.6 ( 1.5-13.3) 1 2.5 ( 0.4-15.7) 69 14,358
Aiea/Pearl City 148 87.3 (79.9-92.2) 20 10.2 ( 6.3-16.3) 2 2.5 ( 0.5-11.4) 170 35,623
Mililani/Wahiawa 133 84.6 (76.1-90.4) 14 7.8 ( 4.4-13.5) 8 7.6 ( 3.4-16.3) 155 32,380
Waipahu/Kapolei/Ewa 209 83.2 (76.8-88.1) 27 10.0 ( 6.4-15.4) 12 6.8 ( 3.7-12.0) 248 61,241
Nanakuli/Waianae 64 92.5 (82.2-97.1) 6 6.2 ( 2.2-16.5) 1 1.2 ( 0.2- 8.4) 71 19,316
HAWAII County
North Hawaii 170 86.8 (80.4-91.4) 27 12.9 ( 8.3-19.3) 1 0.3 ( 0.0- 2.1) 198 14,662
Hilo 201 82.6 (76.2-87.6) 32 12.4 ( 8.4-18.1) 10 4.9 ( 2.4- 9.9) 243 18,254
Puna/Ka'u 187 79.3 (73.3-84.2) 49 17.1 (12.7-22.6) 8 3.6 ( 1.7- 7.4) 244 17,693
Kona 152 75.7 (67.1-82.6) 31 15.2 (10.3-21.9) 11 9.1 ( 4.4-17.7) 194 13,655
KAUAI County
Hanalei/Kapa'a 121 73.5 (64.6-80.9) 39 19.5 (13.9-26.8) 6 6.9 ( 2.8-16.1) 166 10,127
Lihue-Waimea 169 80.4 (72.7-86.3) 33 12.6 ( 8.7-17.8) 9 7.0 ( 3.0-15.6) 211 13,294
MAUI County
Lahaina/Wailuku 141 76.3 (67.8-83.1) 38 17.4 (12.0-24.6) 7 6.3 ( 2.6-14.4) 186 15,968
Kahului 138 77.3 (69.2-83.7) 35 18.1 (12.6-25.2) 6 4.7 ( 1.8-11.7) 179 14,388
Upcountry/Hana 185 86.6 (80.2-91.1) 29 10.8 ( 7.1-16.0) 4 2.6 ( 0.7- 9.6) 218 17,227
Lanai - - - - - - - - - -
Molokai 132 75.9 (67.9-82.4) 38 18.1 (12.7-24.9) 9 6.1 ( 2.7-13.2) 179 4,489
Percentages are weighted to population characteristics.N = Cell Sample Size, % = Percentage, 95% C.I. = Confidence Interval at 95 percent probability level
Rows with Sample Size less than 50 or containing half-width of 95% CI greater than 10 have been suppressed.
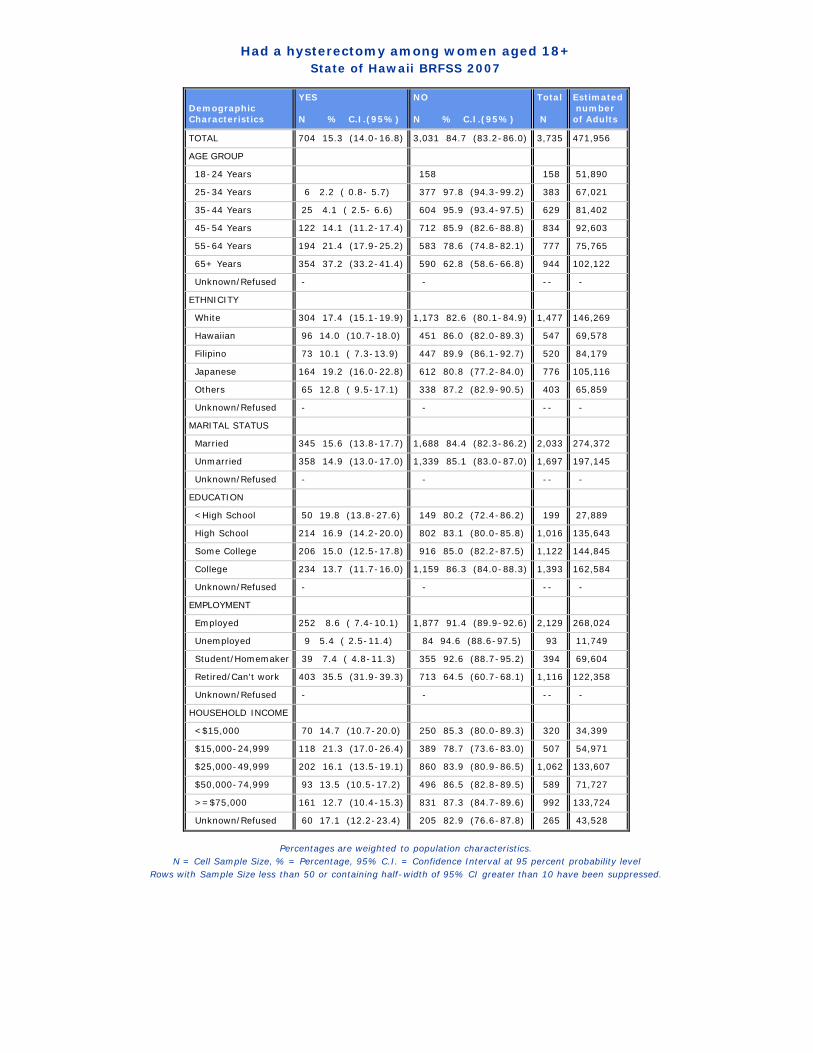
Had a hysterectomy among women aged 18+State of Hawaii BRFSS 2007
DemographicCharacteristics
YES N % C.I.(95%)
NO N % C.I.(95%)
Total N
Estimated numberof Adults
TOTAL 704 15.3 (14.0-16.8) 3,031 84.7 (83.2-86.0) 3,735 471,956
AGE GROUP
18-24 Years 158 158 51,890
25-34 Years 6 2.2 ( 0.8- 5.7) 377 97.8 (94.3-99.2) 383 67,021
35-44 Years 25 4.1 ( 2.5- 6.6) 604 95.9 (93.4-97.5) 629 81,402
45-54 Years 122 14.1 (11.2-17.4) 712 85.9 (82.6-88.8) 834 92,603
55-64 Years 194 21.4 (17.9-25.2) 583 78.6 (74.8-82.1) 777 75,765
65+ Years 354 37.2 (33.2-41.4) 590 62.8 (58.6-66.8) 944 102,122
Unknown/Refused - - -- -
ETHNICITY
White 304 17.4 (15.1-19.9) 1,173 82.6 (80.1-84.9) 1,477 146,269
Hawaiian 96 14.0 (10.7-18.0) 451 86.0 (82.0-89.3) 547 69,578
Filipino 73 10.1 ( 7.3-13.9) 447 89.9 (86.1-92.7) 520 84,179
Japanese 164 19.2 (16.0-22.8) 612 80.8 (77.2-84.0) 776 105,116
Others 65 12.8 ( 9.5-17.1) 338 87.2 (82.9-90.5) 403 65,859
Unknown/Refused - - -- -
MARITAL STATUS
Married 345 15.6 (13.8-17.7) 1,688 84.4 (82.3-86.2) 2,033 274,372
Unmarried 358 14.9 (13.0-17.0) 1,339 85.1 (83.0-87.0) 1,697 197,145
Unknown/Refused - - -- -
EDUCATION
<High School 50 19.8 (13.8-27.6) 149 80.2 (72.4-86.2) 199 27,889
High School 214 16.9 (14.2-20.0) 802 83.1 (80.0-85.8) 1,016 135,643
Some College 206 15.0 (12.5-17.8) 916 85.0 (82.2-87.5) 1,122 144,845
College 234 13.7 (11.7-16.0) 1,159 86.3 (84.0-88.3) 1,393 162,584
Unknown/Refused - - -- -
EMPLOYMENT
Employed 252 8.6 ( 7.4-10.1) 1,877 91.4 (89.9-92.6) 2,129 268,024
Unemployed 9 5.4 ( 2.5-11.4) 84 94.6 (88.6-97.5) 93 11,749
Student/Homemaker 39 7.4 ( 4.8-11.3) 355 92.6 (88.7-95.2) 394 69,604
Retired/Can't work 403 35.5 (31.9-39.3) 713 64.5 (60.7-68.1) 1,116 122,358
Unknown/Refused - - -- -
HOUSEHOLD INCOME
<$15,000 70 14.7 (10.7-20.0) 250 85.3 (80.0-89.3) 320 34,399
$15,000-24,999 118 21.3 (17.0-26.4) 389 78.7 (73.6-83.0) 507 54,971
$25,000-49,999 202 16.1 (13.5-19.1) 860 83.9 (80.9-86.5) 1,062 133,607
$50,000-74,999 93 13.5 (10.5-17.2) 496 86.5 (82.8-89.5) 589 71,727
>=$75,000 161 12.7 (10.4-15.3) 831 87.3 (84.7-89.6) 992 133,724
Unknown/Refused 60 17.1 (12.2-23.4) 205 82.9 (76.6-87.8) 265 43,528
Percentages are weighted to population characteristics.N = Cell Sample Size, % = Percentage, 95% C.I. = Confidence Interval at 95 percent probability level
Rows with Sample Size less than 50 or containing half-width of 95% CI greater than 10 have been suppressed.

Had a hysterectomy among women aged 18+State of Hawaii BRFSS 2007
GEOGRAPHIC AREAS YES N % C.I.(95%)
NO N % C.I.(95%)
Total N
Estimatednumberof Adults
STATE 704 15.3 (14.0-16.8) 3,031 84.7 (83.2-86.0) 3,735 471,956
COUNTY
Honolulu 274 14.5 (12.7-16.5) 1,359 85.5 (83.5-87.3) 1,633 334,374
Hawaii 179 17.7 (15.1-20.6) 683 82.3 (79.4-84.9) 862 62,493
Kauai 83 18.8 (14.9-23.5) 290 81.2 (76.5-85.1) 373 22,928
Maui 168 16.4 (13.5-19.8) 699 83.6 (80.2-86.5) 867 52,161
HONOLULU County
North Shore/Laie - - -- -
Ka'a'wa/Kahalu'u/Kaneohe 23 16.4 (10.5-24.7) 111 83.6 (75.3-89.5) 134 25,962
Kailua/Waimanalo 26 17.0 (11.4-24.5) 121 83.0 (75.5-88.6) 147 28,423
Wailae/Kahala/HawaiiKai 13 11.8 ( 6.6-20.1) 83 88.2 (79.9-93.4) 96 18,421
Kaimuki/Palolo/Waikiki 32 18.3 (12.3-26.3) 128 81.7 (73.7-87.7) 160 27,248
Manoa/Upper Makiki 16 13.8 ( 8.0-22.9) 115 86.2 (77.1-92.0) 131 20,041
Ala Moana - - - - - - - -
Nuuanu/Kalihi/MoanaLoa 22 12.5 ( 7.9-19.2) 112 87.5 (80.8-92.1) 134 30,394
Salt Lake/Foster Village 7 8.8 ( 3.7-19.5) 59 91.2 (80.5-96.3) 66 13,590
Aiea/Pearl City 33 17.9 (12.1-25.7) 134 82.1 (74.3-87.9) 167 33,731
Mililani/Wahiawa 19 10.2 ( 6.0-16.7) 132 89.8 (83.3-94.0) 151 31,535
Waipahu/Kapolei/Ewa 41 13.0 ( 9.3-17.9) 205 87.0 (82.1-90.7) 246 61,046
Nanakuli/Waianae 14 13.4 ( 6.9-24.5) 55 86.6 (75.5-93.1) 69 18,614
HAWAII County
North Hawaii 42 17.2 (12.4-23.4) 153 82.8 (76.6-87.6) 195 14,258
Hilo 51 20.2 (14.9-26.8) 186 79.8 (73.2-85.1) 237 17,698
Puna/Ka'u 44 14.3 (10.4-19.2) 196 85.7 (80.8-89.6) 240 17,183
Kona 42 19.3 (13.8-26.3) 148 80.7 (73.7-86.2) 190 13,354
KAUAI County
Hanalei/Kapa'a 34 17.8 (12.3-24.9) 130 82.2 (75.1-87.7) 164 9,923
Lihue-Waimea 49 19.6 (14.4-26.2) 160 80.4 (73.8-85.6) 209 13,005
MAUI County
Lahaina/Wailuku 34 14.5 ( 9.6-21.3) 149 85.5 (78.7-90.4) 183 15,509
Kahului 41 18.7 (13.2-25.7) 138 81.3 (74.3-86.8) 179 14,331
Upcountry/Hana 40 16.8 (11.6-23.7) 179 83.2 (76.3-88.4) 219 17,194
Lanai - - - - - - - -
Molokai 33 13.4 ( 9.1-19.3) 143 86.6 (80.7-90.9) 176 4,321
Percentages are weighted to population characteristics.N = Cell Sample Size, % = Percentage, 95% C.I. = Confidence Interval at 95 percent probability level
Rows with Sample Size less than 50 or containing half-width of 95% CI greater than 10 have been suppressed.

PROSTATE CANCER SCREENING With men aged 40 years old or older, for prostate cancer screening, these questions were asked.
A./ A Prostate-Specific Antigen test, also called a PSA test, is a blood test used to check men for prostate cancer. Have you EVER HAD a PSA test?
B./ How long has it been since you had your last PSA test?
1. Within the past year (anytime less than 12 months ago) 2. Within the past 2 years (1 year but less than 2 years) 3. Within the past 3 years (2 years but less than 3 years) 4. Within the past 5 years (3 years but less than 5 years) 5. 5 or more years ago
C./ A digital rectal exam is an exam in which a doctor, nurse, or other health professional places a gloved finger into the rectum to feel the size, shape, and hardness of the prostate gland. Have you ever had a digital rectal exam?
D./ How long has it been since your last digital rectal exam?
1. Within the past year (anytime less than 12 months ago) 2. Within the past 2 years (1 year but less than 2 years) 3. Within the past 3 years (2 years but less than 3 years) 4. Within the past 5 years (3 years but less than 5 years) 5. 5 or more years ago
E./ Have you ever been told by a doctor, nurse, or other health professional that you had prostate cancer?

Ever had a PSA test (men aged 40+)State of Hawaii BRFSS 2007
DemographicCharacteristics
YES N % C.I.(95%)
NO N % C.I.(95%)
Total N
Estimated numberof Adults
TOTAL 1,135 55.5 (52.5-58.4) 778 44.5 (41.6-47.5) 1,913 268,396
AGE GROUP
40-44 Years 51 25.2 (18.9-32.8) 169 74.8 (67.2-81.1) 220 43,986
45-54 Years 217 38.6 (33.6-43.9) 334 61.4 (56.1-66.4) 551 81,633
55-64 Years 423 69.3 (63.9-74.2) 168 30.7 (25.8-36.1) 591 71,928
65+ Years 440 80.8 (75.9-84.9) 101 19.2 (15.1-24.1) 541 69,299
Unknown/Refused - - -- -
ETHNICITY
White 589 64.7 (60.4-68.8) 286 35.3 (31.2-39.6) 875 96,116
Hawaiian 95 46.1 (37.2-55.2) 117 53.9 (44.8-62.8) 212 29,822
Filipino 74 35.5 (27.5-44.4) 115 64.5 (55.6-72.5) 189 34,754
Japanese 252 58.2 (52.4-63.8) 172 41.8 (36.2-47.6) 424 70,264
Others 119 52.5 (43.7-61.2) 85 47.5 (38.8-56.3) 204 36,601
Unknown/Refused - - -- -
MARITAL STATUS
Married 764 57.8 (54.3-61.3) 476 42.2 (38.7-45.7) 1,240 201,562
Unmarried 368 48.2 (43.0-53.5) 301 51.8 (46.5-57.0) 669 66,530
Unknown/Refused - - -- -
EDUCATION
<High School - - - - - - - -
High School 258 46.3 (40.5-52.1) 254 53.7 (47.9-59.5) 512 73,916
Some College 300 52.2 (46.6-57.7) 223 47.8 (42.3-53.4) 523 69,935
College 528 65.1 (60.7-69.2) 248 34.9 (30.8-39.3) 776 110,114
Unknown/Refused - - -- -
EMPLOYMENT
Employed 581 46.6 (42.9-50.3) 590 53.4 (49.7-57.1) 1,171 171,960
Unemployed - - -- -
Student/Homemaker - - -- -
Retired/Can't work 534 75.6 (70.8-79.8) 158 24.4 (20.2-29.2) 692 87,974
Unknown/Refused - - -- -
HOUSEHOLD INCOME
<$15,000 - - - - - - - -
$15,000-24,999 120 48.0 (39.2-56.9) 109 52.0 (43.1-60.8) 229 27,294
$25,000-49,999 307 51.3 (45.6-57.0) 217 48.7 (43.0-54.4) 524 68,393
$50,000-74,999 198 54.4 (47.7-61.0) 149 45.6 (39.0-52.3) 347 53,534
>=$75,000 395 61.3 (56.4-66.1) 212 38.7 (33.9-43.6) 607 94,200
Unknown/Refused - - - - - - - -
COUNTY
Honolulu 469 55.5 (51.6-59.4) 330 44.5 (40.6-48.4) 799 185,554
Hawaii 299 60.8 (55.6-65.7) 166 39.2 (34.3-44.4) 465 36,928
Kauai 113 48.7 (40.4-57.0) 86 51.3 (43.0-59.6) 199 13,869
Maui 254 52.0 (46.0-57.9) 196 48.0 (42.1-54.0) 450 32,045
Percentages are weighted to population characteristics.N = Cell Sample Size, % = Percentage, 95% C.I. = Confidence Interval at 95 percent probability level
Rows with Sample Size less than 50 or containing half-width of 95% CI greater than 10 have been suppressed.
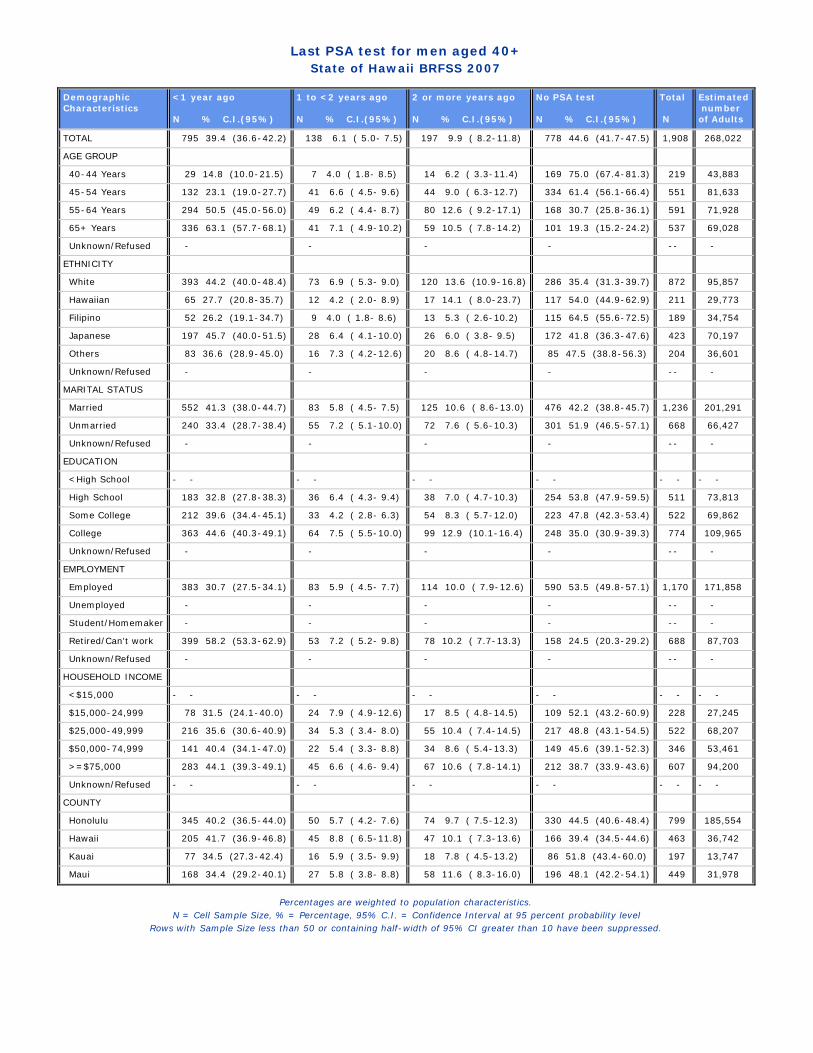
Last PSA test for men aged 40+State of Hawaii BRFSS 2007
DemographicCharacteristics
<1 year ago N % C.I.(95%)
1 to <2 years ago N % C.I.(95%)
2 or more years ago N % C.I.(95%)
No PSA test N % C.I.(95%)
Total N
Estimated numberof Adults
TOTAL 795 39.4 (36.6-42.2) 138 6.1 ( 5.0- 7.5) 197 9.9 ( 8.2-11.8) 778 44.6 (41.7-47.5) 1,908 268,022
AGE GROUP
40-44 Years 29 14.8 (10.0-21.5) 7 4.0 ( 1.8- 8.5) 14 6.2 ( 3.3-11.4) 169 75.0 (67.4-81.3) 219 43,883
45-54 Years 132 23.1 (19.0-27.7) 41 6.6 ( 4.5- 9.6) 44 9.0 ( 6.3-12.7) 334 61.4 (56.1-66.4) 551 81,633
55-64 Years 294 50.5 (45.0-56.0) 49 6.2 ( 4.4- 8.7) 80 12.6 ( 9.2-17.1) 168 30.7 (25.8-36.1) 591 71,928
65+ Years 336 63.1 (57.7-68.1) 41 7.1 ( 4.9-10.2) 59 10.5 ( 7.8-14.2) 101 19.3 (15.2-24.2) 537 69,028
Unknown/Refused - - - - -- -
ETHNICITY
White 393 44.2 (40.0-48.4) 73 6.9 ( 5.3- 9.0) 120 13.6 (10.9-16.8) 286 35.4 (31.3-39.7) 872 95,857
Hawaiian 65 27.7 (20.8-35.7) 12 4.2 ( 2.0- 8.9) 17 14.1 ( 8.0-23.7) 117 54.0 (44.9-62.9) 211 29,773
Filipino 52 26.2 (19.1-34.7) 9 4.0 ( 1.8- 8.6) 13 5.3 ( 2.6-10.2) 115 64.5 (55.6-72.5) 189 34,754
Japanese 197 45.7 (40.0-51.5) 28 6.4 ( 4.1-10.0) 26 6.0 ( 3.8- 9.5) 172 41.8 (36.3-47.6) 423 70,197
Others 83 36.6 (28.9-45.0) 16 7.3 ( 4.2-12.6) 20 8.6 ( 4.8-14.7) 85 47.5 (38.8-56.3) 204 36,601
Unknown/Refused - - - - -- -
MARITAL STATUS
Married 552 41.3 (38.0-44.7) 83 5.8 ( 4.5- 7.5) 125 10.6 ( 8.6-13.0) 476 42.2 (38.8-45.7) 1,236 201,291
Unmarried 240 33.4 (28.7-38.4) 55 7.2 ( 5.1-10.0) 72 7.6 ( 5.6-10.3) 301 51.9 (46.5-57.1) 668 66,427
Unknown/Refused - - - - -- -
EDUCATION
<High School - - - - - - - - - - - -
High School 183 32.8 (27.8-38.3) 36 6.4 ( 4.3- 9.4) 38 7.0 ( 4.7-10.3) 254 53.8 (47.9-59.5) 511 73,813
Some College 212 39.6 (34.4-45.1) 33 4.2 ( 2.8- 6.3) 54 8.3 ( 5.7-12.0) 223 47.8 (42.3-53.4) 522 69,862
College 363 44.6 (40.3-49.1) 64 7.5 ( 5.5-10.0) 99 12.9 (10.1-16.4) 248 35.0 (30.9-39.3) 774 109,965
Unknown/Refused - - - - -- -
EMPLOYMENT
Employed 383 30.7 (27.5-34.1) 83 5.9 ( 4.5- 7.7) 114 10.0 ( 7.9-12.6) 590 53.5 (49.8-57.1) 1,170 171,858
Unemployed - - - - -- -
Student/Homemaker - - - - -- -
Retired/Can't work 399 58.2 (53.3-62.9) 53 7.2 ( 5.2- 9.8) 78 10.2 ( 7.7-13.3) 158 24.5 (20.3-29.2) 688 87,703
Unknown/Refused - - - - -- -
HOUSEHOLD INCOME
<$15,000 - - - - - - - - - - - -
$15,000-24,999 78 31.5 (24.1-40.0) 24 7.9 ( 4.9-12.6) 17 8.5 ( 4.8-14.5) 109 52.1 (43.2-60.9) 228 27,245
$25,000-49,999 216 35.6 (30.6-40.9) 34 5.3 ( 3.4- 8.0) 55 10.4 ( 7.4-14.5) 217 48.8 (43.1-54.5) 522 68,207
$50,000-74,999 141 40.4 (34.1-47.0) 22 5.4 ( 3.3- 8.8) 34 8.6 ( 5.4-13.3) 149 45.6 (39.1-52.3) 346 53,461
>=$75,000 283 44.1 (39.3-49.1) 45 6.6 ( 4.6- 9.4) 67 10.6 ( 7.8-14.1) 212 38.7 (33.9-43.6) 607 94,200
Unknown/Refused - - - - - - - - - - - -
COUNTY
Honolulu 345 40.2 (36.5-44.0) 50 5.7 ( 4.2- 7.6) 74 9.7 ( 7.5-12.3) 330 44.5 (40.6-48.4) 799 185,554
Hawaii 205 41.7 (36.9-46.8) 45 8.8 ( 6.5-11.8) 47 10.1 ( 7.3-13.6) 166 39.4 (34.5-44.6) 463 36,742
Kauai 77 34.5 (27.3-42.4) 16 5.9 ( 3.5- 9.9) 18 7.8 ( 4.5-13.2) 86 51.8 (43.4-60.0) 197 13,747
Maui 168 34.4 (29.2-40.1) 27 5.8 ( 3.8- 8.8) 58 11.6 ( 8.3-16.0) 196 48.1 (42.2-54.1) 449 31,978
Percentages are weighted to population characteristics.N = Cell Sample Size, % = Percentage, 95% C.I. = Confidence Interval at 95 percent probability level
Rows with Sample Size less than 50 or containing half-width of 95% CI greater than 10 have been suppressed.
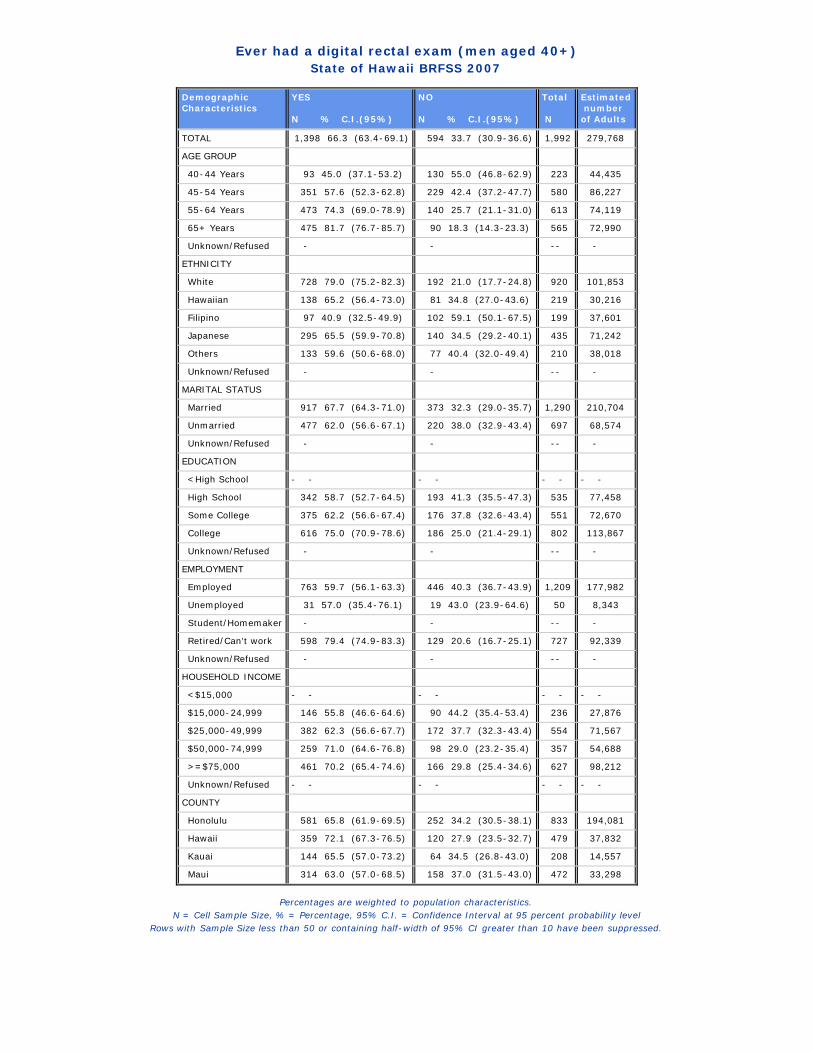
Ever had a digital rectal exam (men aged 40+)State of Hawaii BRFSS 2007
DemographicCharacteristics
YES N % C.I.(95%)
NO N % C.I.(95%)
Total N
Estimated numberof Adults
TOTAL 1,398 66.3 (63.4-69.1) 594 33.7 (30.9-36.6) 1,992 279,768
AGE GROUP
40-44 Years 93 45.0 (37.1-53.2) 130 55.0 (46.8-62.9) 223 44,435
45-54 Years 351 57.6 (52.3-62.8) 229 42.4 (37.2-47.7) 580 86,227
55-64 Years 473 74.3 (69.0-78.9) 140 25.7 (21.1-31.0) 613 74,119
65+ Years 475 81.7 (76.7-85.7) 90 18.3 (14.3-23.3) 565 72,990
Unknown/Refused - - -- -
ETHNICITY
White 728 79.0 (75.2-82.3) 192 21.0 (17.7-24.8) 920 101,853
Hawaiian 138 65.2 (56.4-73.0) 81 34.8 (27.0-43.6) 219 30,216
Filipino 97 40.9 (32.5-49.9) 102 59.1 (50.1-67.5) 199 37,601
Japanese 295 65.5 (59.9-70.8) 140 34.5 (29.2-40.1) 435 71,242
Others 133 59.6 (50.6-68.0) 77 40.4 (32.0-49.4) 210 38,018
Unknown/Refused - - -- -
MARITAL STATUS
Married 917 67.7 (64.3-71.0) 373 32.3 (29.0-35.7) 1,290 210,704
Unmarried 477 62.0 (56.6-67.1) 220 38.0 (32.9-43.4) 697 68,574
Unknown/Refused - - -- -
EDUCATION
<High School - - - - - - - -
High School 342 58.7 (52.7-64.5) 193 41.3 (35.5-47.3) 535 77,458
Some College 375 62.2 (56.6-67.4) 176 37.8 (32.6-43.4) 551 72,670
College 616 75.0 (70.9-78.6) 186 25.0 (21.4-29.1) 802 113,867
Unknown/Refused - - -- -
EMPLOYMENT
Employed 763 59.7 (56.1-63.3) 446 40.3 (36.7-43.9) 1,209 177,982
Unemployed 31 57.0 (35.4-76.1) 19 43.0 (23.9-64.6) 50 8,343
Student/Homemaker - - -- -
Retired/Can't work 598 79.4 (74.9-83.3) 129 20.6 (16.7-25.1) 727 92,339
Unknown/Refused - - -- -
HOUSEHOLD INCOME
<$15,000 - - - - - - - -
$15,000-24,999 146 55.8 (46.6-64.6) 90 44.2 (35.4-53.4) 236 27,876
$25,000-49,999 382 62.3 (56.6-67.7) 172 37.7 (32.3-43.4) 554 71,567
$50,000-74,999 259 71.0 (64.6-76.8) 98 29.0 (23.2-35.4) 357 54,688
>=$75,000 461 70.2 (65.4-74.6) 166 29.8 (25.4-34.6) 627 98,212
Unknown/Refused - - - - - - - -
COUNTY
Honolulu 581 65.8 (61.9-69.5) 252 34.2 (30.5-38.1) 833 194,081
Hawaii 359 72.1 (67.3-76.5) 120 27.9 (23.5-32.7) 479 37,832
Kauai 144 65.5 (57.0-73.2) 64 34.5 (26.8-43.0) 208 14,557
Maui 314 63.0 (57.0-68.5) 158 37.0 (31.5-43.0) 472 33,298
Percentages are weighted to population characteristics.N = Cell Sample Size, % = Percentage, 95% C.I. = Confidence Interval at 95 percent probability level
Rows with Sample Size less than 50 or containing half-width of 95% CI greater than 10 have been suppressed.

Last digital rectal exam for men aged 40+State of Hawaii BRFSS 2007
DemographicCharacteristics
<1 year N % C.I.(95%)
1 to <2 years N % C.I.(95%)
2 or more years N % C.I.(95%)
No exam N % C.I.(95%)
Total N
Estimated numberof Adults
TOTAL 648 31.6 (29.0-34.3) 236 11.1 ( 9.5-12.9) 507 23.5 (21.3-26.0) 594 33.8 (31.0-36.7) 1,985 279,002
AGE GROUP
40-44 Years 31 15.0 (10.2-21.5) 18 7.8 ( 4.7-12.7) 44 22.2 (16.0-30.1) 130 55.0 (46.8-62.9) 223 44,435
45-54 Years 131 23.7 (19.6-28.3) 67 10.7 ( 8.0-14.1) 150 23.0 (19.1-27.5) 229 42.6 (37.4-47.9) 577 85,791
55-64 Years 222 36.7 (31.6-42.1) 76 11.5 ( 8.6-15.3) 175 26.0 (21.7-30.8) 140 25.7 (21.1-31.0) 613 74,119
65+ Years 261 45.6 (40.4-50.8) 73 13.3 (10.2-17.1) 137 22.7 (18.7-27.2) 90 18.4 (14.3-23.4) 561 72,659
Unknown/Refused - - - - -- -
ETHNICITY
White 329 37.2 (33.2-41.3) 123 13.5 (10.9-16.5) 272 28.2 (24.7-32.1) 192 21.1 (17.8-24.9) 916 101,292
Hawaiian 63 28.5 (21.2-37.2) 26 11.2 ( 6.9-17.6) 48 25.3 (17.8-34.7) 81 34.9 (27.1-43.7) 218 30,154
Filipino 41 18.0 (12.0-26.1) 17 8.3 ( 4.8-13.9) 38 14.4 ( 9.5-21.3) 102 59.3 (50.3-67.7) 198 37,482
Japanese 145 33.2 (28.1-38.8) 46 9.4 ( 6.6-13.2) 103 22.9 (18.5-28.0) 140 34.5 (29.2-40.1) 434 71,217
Others 66 29.1 (22.2-37.0) 22 10.3 ( 6.3-16.4) 45 20.3 (14.6-27.5) 77 40.4 (32.0-49.4) 210 38,018
Unknown/Refused - - - - -- -
MARITAL STATUS
Married 445 33.3 (30.2-36.6) 158 11.3 ( 9.4-13.5) 309 23.0 (20.3-25.9) 373 32.4 (29.1-35.8) 1,285 210,024
Unmarried 200 26.2 (22.1-30.7) 78 10.5 ( 7.9-13.9) 197 25.3 (21.1-29.9) 220 38.1 (32.9-43.5) 695 68,487
Unknown/Refused - - - - -- -
EDUCATION
<High School - - - - - - - - - - - -
High School 138 24.7 (20.3-29.7) 72 11.5 ( 8.6-15.2) 129 22.4 (18.1-27.4) 193 41.4 (35.6-47.4) 532 77,253
Some College 159 28.3 (23.6-33.4) 60 9.8 ( 7.2-13.3) 154 23.9 (19.9-28.5) 176 38.0 (32.7-43.6) 549 72,352
College 319 38.6 (34.4-42.9) 96 11.8 ( 9.3-14.8) 199 24.5 (21.0-28.5) 186 25.1 (21.5-29.1) 800 113,623
Unknown/Refused - - - - -- -
EMPLOYMENT
Employed 328 26.8 (23.7-30.1) 139 10.3 ( 8.4-12.6) 293 22.5 (19.7-25.6) 446 40.4 (36.8-44.0) 1,206 177,546
Unemployed 9 20.9 ( 9.9-38.8) 3 1.1 ( 0.3- 3.6) 19 35.0 (17.8-57.3) 19 43.0 (23.9-64.6) 50 8,343
Student/Homemaker - - - - -- -
Retired/Can't work 310 41.9 (37.3-46.7) 92 13.2 (10.4-16.6) 192 24.3 (20.6-28.4) 129 20.6 (16.7-25.2) 723 92,008
Unknown/Refused - - - - -- -
HOUSEHOLD INCOME
<$15,000 - - - - - - - - - - - -
$15,000-24,999 64 24.5 (18.2-32.1) 33 14.4 ( 9.4-21.4) 49 17.0 (11.9-23.7) 90 44.2 (35.4-53.4) 236 27,876
$25,000-49,999 170 26.1 (21.8-30.9) 64 11.1 ( 8.2-14.8) 145 25.0 (20.5-30.1) 172 37.8 (32.4-43.6) 551 71,341
$50,000-74,999 121 34.4 (28.4-40.9) 37 9.7 ( 6.5-14.3) 101 26.9 (21.7-32.9) 98 29.0 (23.2-35.4) 357 54,688
>=$75,000 229 35.2 (30.7-39.9) 78 11.8 ( 9.1-15.0) 151 23.2 (19.3-27.5) 166 29.9 (25.5-34.8) 624 97,734
Unknown/Refused - - - - - - - - - - - -
COUNTY
Honolulu 286 32.4 (29.0-36.1) 93 10.3 ( 8.3-12.7) 200 23.0 (20.0-26.3) 252 34.3 (30.6-38.1) 831 193,722
Hawaii 163 31.4 (27.1-36.0) 58 13.1 ( 9.9-17.1) 135 27.4 (23.1-32.1) 120 28.1 (23.8-33.0) 476 37,512
Kauai 56 26.2 (19.8-33.8) 31 15.7 (10.5-22.9) 56 23.6 (17.9-30.5) 64 34.5 (26.8-43.1) 207 14,532
Maui 143 29.2 (24.3-34.5) 54 11.4 ( 8.4-15.4) 116 22.3 (17.9-27.4) 158 37.1 (31.5-43.1) 471 33,236
Percentages are weighted to population characteristics.N = Cell Sample Size, % = Percentage, 95% C.I. = Confidence Interval at 95 percent probability level
Rows with Sample Size less than 50 or containing half-width of 95% CI greater than 10 have been suppressed.

Ever been told by a doctor, nurse or other health professional that you had prostate cancer (men aged40+)
State of Hawaii BRFSS 2007
DemographicCharacteristics
YES N % C.I.(95%)
NO N % C.I.(95%)
Total N
Estimated numberof Adults
TOTAL 82 4.5 ( 3.4- 6.0) 1,925 95.5 (94.0-96.6) 2,007 282,352
AGE GROUP
40-44 Years 1 0.8 ( 0.1- 5.7) 224 99.2 (94.3-99.9) 225 44,734
45-54 Years 3 0.4 ( 0.1- 2.1) 584 99.6 (97.9-99.9) 587 87,402
55-64 Years 19 3.8 ( 2.1- 6.9) 595 96.2 (93.1-97.9) 614 74,490
65+ Years 59 12.4 ( 9.0-16.8) 511 87.6 (83.2-91.0) 570 73,728
Unknown/Refused - - -- -
ETHNICITY
White 42 4.7 ( 3.2- 6.9) 880 95.3 (93.1-96.8) 922 102,129
Hawaiian 11 3.9 ( 1.9- 7.9) 213 96.1 (92.1-98.1) 224 31,090
Filipino 9 7.0 ( 3.0-15.3) 191 93.0 (84.7-97.0) 200 37,629
Japanese 15 4.2 ( 2.4- 7.3) 426 95.8 (92.7-97.6) 441 72,555
Others 5 2.7 ( 1.0- 6.7) 206 97.3 (93.3-99.0) 211 38,110
Unknown/Refused - - -- -
MARITAL STATUS
Married 47 4.3 ( 3.0- 6.1) 1,251 95.7 (93.9-97.0) 1,298 212,699
Unmarried 34 5.2 ( 3.4- 7.9) 670 94.8 (92.1-96.6) 704 69,162
Unknown/Refused - - -- -
EDUCATION
<High School - - - - - - - -
High School 26 5.8 ( 3.6- 9.1) 515 94.2 (90.9-96.4) 541 78,410
Some College 13 2.5 ( 1.3- 4.7) 537 97.5 (95.3-98.7) 550 72,483
College 34 4.2 ( 2.7- 6.3) 776 95.8 (93.7-97.3) 810 115,455
Unknown/Refused - - -- -
EMPLOYMENT
Employed 14 1.0 ( 0.5- 1.9) 1,206 99.0 (98.1-99.5) 1,220 180,168
Unemployed 1 0.5 ( 0.1- 3.4) 50 99.5 (96.6-99.9) 51 8,492
Student/Homemaker - - -- -
Retired/Can't work 67 11.9 ( 8.8-15.8) 663 88.1 (84.2-91.2) 730 92,587
Unknown/Refused - - -- -
HOUSEHOLD INCOME
<$15,000 9 6.0 ( 2.7-12.8) 114 94.0 (87.2-97.3) 123 12,423
$15,000-24,999 15 8.4 ( 4.5-15.2) 222 91.6 (84.8-95.5) 237 28,098
$25,000-49,999 22 4.4 ( 2.5- 7.4) 534 95.6 (92.6-97.5) 556 71,948
$50,000-74,999 9 2.8 ( 1.3- 5.8) 355 97.2 (94.2-98.7) 364 56,068
>=$75,000 20 3.1 ( 1.8- 5.2) 610 96.9 (94.8-98.2) 630 98,583
Unknown/Refused - - - - - - - -
COUNTY
Honolulu 40 5.0 ( 3.5- 7.0) 802 95.0 (93.0-96.5) 842 196,182
Hawaii 16 3.0 ( 1.7- 5.0) 465 97.0 (95.0-98.3) 481 38,052
Kauai 6 1.9 ( 0.8- 4.3) 204 98.1 (95.7-99.2) 210 14,696
Maui 20 4.9 ( 2.6- 9.0) 454 95.1 (91.0-97.4) 474 33,422
Percentages are weighted to population characteristics.N = Cell Sample Size, % = Percentage, 95% C.I. = Confidence Interval at 95 percent probability level
Rows with Sample Size less than 50 or containing half-width of 95% CI greater than 10 have been suppressed.
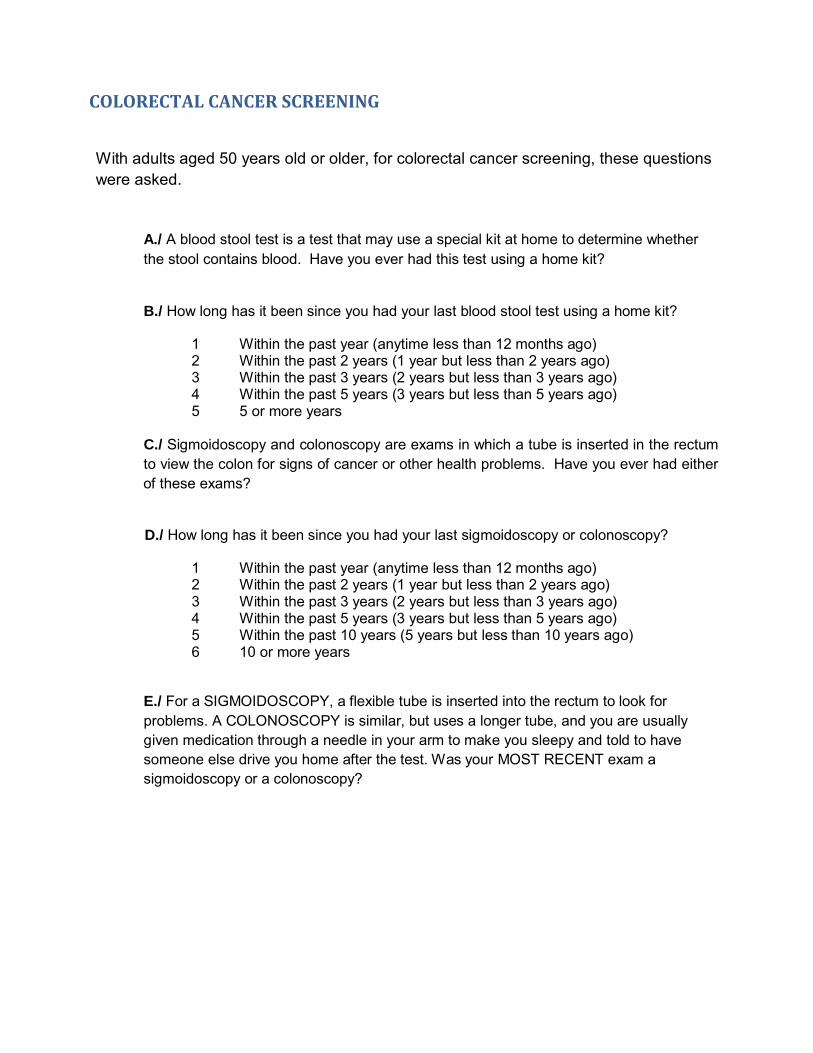
COLORECTAL CANCER SCREENING
With adults aged 50 years old or older, for colorectal cancer screening, these questions were asked.
A./ A blood stool test is a test that may use a special kit at home to determine whether the stool contains blood. Have you ever had this test using a home kit?
B./ How long has it been since you had your last blood stool test using a home kit?
1 Within the past year (anytime less than 12 months ago) 2 Within the past 2 years (1 year but less than 2 years ago) 3 Within the past 3 years (2 years but less than 3 years ago) 4 Within the past 5 years (3 years but less than 5 years ago) 5 5 or more years
C./ Sigmoidoscopy and colonoscopy are exams in which a tube is inserted in the rectum to view the colon for signs of cancer or other health problems. Have you ever had either of these exams?
D./ How long has it been since you had your last sigmoidoscopy or colonoscopy?
1 Within the past year (anytime less than 12 months ago) 2 Within the past 2 years (1 year but less than 2 years ago) 3 Within the past 3 years (2 years but less than 3 years ago) 4 Within the past 5 years (3 years but less than 5 years ago) 5 Within the past 10 years (5 years but less than 10 years ago) 6 10 or more years
E./ For a SIGMOIDOSCOPY, a flexible tube is inserted into the rectum to look for problems. A COLONOSCOPY is similar, but uses a longer tube, and you are usually given medication through a needle in your arm to make you sleepy and told to have someone else drive you home after the test. Was your MOST RECENT exam a sigmoidoscopy or a colonoscopy?

Ever had a blood stool test using a home kit among people aged 50+State of Hawaii BRFSS 2007
Demographic Characteristics
YES N % C.I.(95%)
NO N % C.I.(95%)
Total N
Estimated numberof Adults
TOTAL 1,813 49.5 (47.3-51.7) 1,830 50.5 (48.3-52.7) 3,643 418,081
AGE GROUP
50-54 Years 237 37.0 (32.4-41.9) 495 63.0 (58.1-67.6) 732 90,417
55-64 Years 702 51.2 (47.5-54.8) 685 48.8 (45.2-52.5) 1,387 150,190
65+ Years 868 55.0 (51.7-58.3) 635 45.0 (41.7-48.3) 1,503 174,323
Unknown - - -- -
SEX
Male 707 47.0 (43.7-50.4) 781 53.0 (49.6-56.3) 1,488 193,212
Female 1,106 51.7 (48.8-54.5) 1,049 48.3 (45.5-51.2) 2,155 224,870
ETHNICITY
White 844 51.8 (48.6-54.9) 794 48.2 (45.1-51.4) 1,638 146,150
Hawaiian 186 47.4 (41.0-53.9) 226 52.6 (46.1-59.0) 412 44,745
Filipino 152 41.1 (34.4-48.2) 219 58.9 (51.8-65.6) 371 57,634
Japanese 471 53.6 (49.3-57.8) 397 46.4 (42.2-50.7) 868 118,031
Others 157 45.5 (38.9-52.3) 183 54.5 (47.7-61.1) 340 50,320
Unknown/Refused - - -- -
MARITAL STATUS
Married 1,050 50.7 (47.9-53.5) 978 49.3 (46.5-52.1) 2,028 279,891
Unmarried 761 47.2 (43.9-50.6) 846 52.8 (49.4-56.1) 1,607 137,401
Unknown/Refused - - -- -
EDUCATION
<High School 78 30.8 (23.5-39.1) 154 69.2 (60.9-76.5) 232 30,053
High School 441 44.0 (39.8-48.2) 528 56.0 (51.8-60.2) 969 114,814
Some College 523 52.1 (48.1-56.2) 502 47.9 (43.8-51.9) 1,025 112,862
College 770 55.2 (51.8-58.6) 643 44.8 (41.4-48.2) 1,413 159,978
Unknown/Refused - - -- -
EMPLOYMENT
Employed 729 43.6 (40.4-46.8) 966 56.4 (53.2-59.6) 1,695 196,248
Unemployed - - - - - - - -
Student/Homemaker - - - - - - - -
Retired/Can't work 1,009 55.6 (52.5-58.7) 754 44.4 (41.3-47.5) 1,763 201,589
Unknown/Refused - - -- -
HOUSEHOLD INCOME
<$15,000 129 40.5 (32.8-48.6) 183 59.5 (51.4-67.2) 312 26,030
$15,000-24,999 229 44.2 (38.4-50.2) 287 55.8 (49.8-61.6) 516 51,512
$25,000-49,999 518 46.9 (42.9-51.0) 531 53.1 (49.0-57.1) 1,049 113,118
$50,000-74,999 280 51.4 (45.8-56.9) 280 48.6 (43.1-54.2) 560 70,045
>=$75,000 535 56.5 (52.4-60.5) 409 43.5 (39.5-47.6) 944 121,223
Unknown/Refused 122 44.6 (36.8-52.7) 140 55.4 (47.3-63.2) 262 36,153
Percentages are weighted to population characteristics.N = Cell Sample Size, % = Percentage, 95% C.I. = Confidence Interval at 95 percent probability level
Rows with Sample Size less than 50 or containing half-width of 95% CI greater than 10 have been suppressed.

Ever had a blood stool test using a home kit among people aged 50+State of Hawaii BRFSS 2007
GEOGRAPHIC AREAS YES N % C.I.(95%)
NO N % C.I.(95%)
Total N
Estimatednumberof Adults
STATE 1,813 49.5 (47.3-51.7) 1,830 50.5 (48.3-52.7) 3,643 418,081
COUNTY
Honolulu 796 50.9 (48.0-53.8) 725 49.1 (46.2-52.0) 1,521 291,959
Hawaii 428 45.9 (42.3-49.6) 467 54.1 (50.4-57.7) 895 57,144
Kauai 179 44.5 (38.9-50.2) 220 55.5 (49.8-61.1) 399 22,746
Maui 410 47.8 (43.3-52.3) 418 52.2 (47.7-56.7) 828 46,232
HONOLULU County
North Shore/Laie - - -- -
Ka'a'wa/Kahalu'u/Kaneohe 67 54.9 (44.8-64.6) 59 45.1 (35.4-55.2) 126 24,379
Kailua/Waimanalo 76 55.6 (45.7-65.0) 55 44.4 (35.0-54.3) 131 24,699
Wailae/Kahala/HawaiiKai - - - - - - - -
Kaimuki/Palolo/Waikiki 99 49.4 (41.3-57.6) 86 50.6 (42.4-58.7) 185 31,050
Manoa/Upper Makiki 83 52.4 (43.5-61.2) 67 47.6 (38.8-56.5) 150 23,769
Ala Moana - - - - - - - -
Nuuanu/Kalihi/MoanaLoa 59 42.9 (33.7-52.6) 74 57.1 (47.4-66.3) 133 25,897
Salt Lake/Foster Village - - -- -
Aiea/Pearl City 93 60.0 (51.1-68.3) 65 40.0 (31.7-48.9) 158 31,694
Mililani/Wahiawa - - - - - - - -
Waipahu/Kapolei/Ewa 83 46.8 (38.5-55.4) 95 53.2 (44.6-61.5) 178 42,553
Nanakuli/Waianae - - - - - - - -
HAWAII County
North Hawaii 81 44.3 (36.4-52.5) 97 55.7 (47.5-63.6) 178 11,321
Hilo 132 49.5 (42.7-56.4) 122 50.5 (43.6-57.3) 254 17,275
Puna/Ka'u 126 51.2 (44.3-58.1) 122 48.8 (41.9-55.7) 248 14,900
Kona 89 37.0 (30.3-44.3) 126 63.0 (55.7-69.7) 215 13,647
KAUAI County
Hanalei/Kapa'a 86 44.8 (36.8-53.0) 110 55.2 (47.0-63.2) 196 10,910
Lihue-Waimea 93 44.3 (36.5-52.3) 110 55.7 (47.7-63.5) 203 11,836
MAUI County
Lahaina/Wailuku 92 54.3 (44.9-63.3) 70 45.7 (36.7-55.1) 162 11,796
Kahului 96 45.8 (37.6-54.3) 84 54.2 (45.7-62.4) 180 14,171
Upcountry/Hana 105 45.9 (38.2-53.7) 118 54.1 (46.3-61.8) 223 16,184
Lanai - - - - - - - -
Molokai 75 45.8 (37.1-54.8) 80 54.2 (45.2-62.9) 155 3,289
Percentages are weighted to population characteristics.N = Cell Sample Size, % = Percentage, 95% C.I. = Confidence Interval at 95 percent probability level
Rows with Sample Size less than 50 or containing half-width of 95% CI greater than 10 have been suppressed.
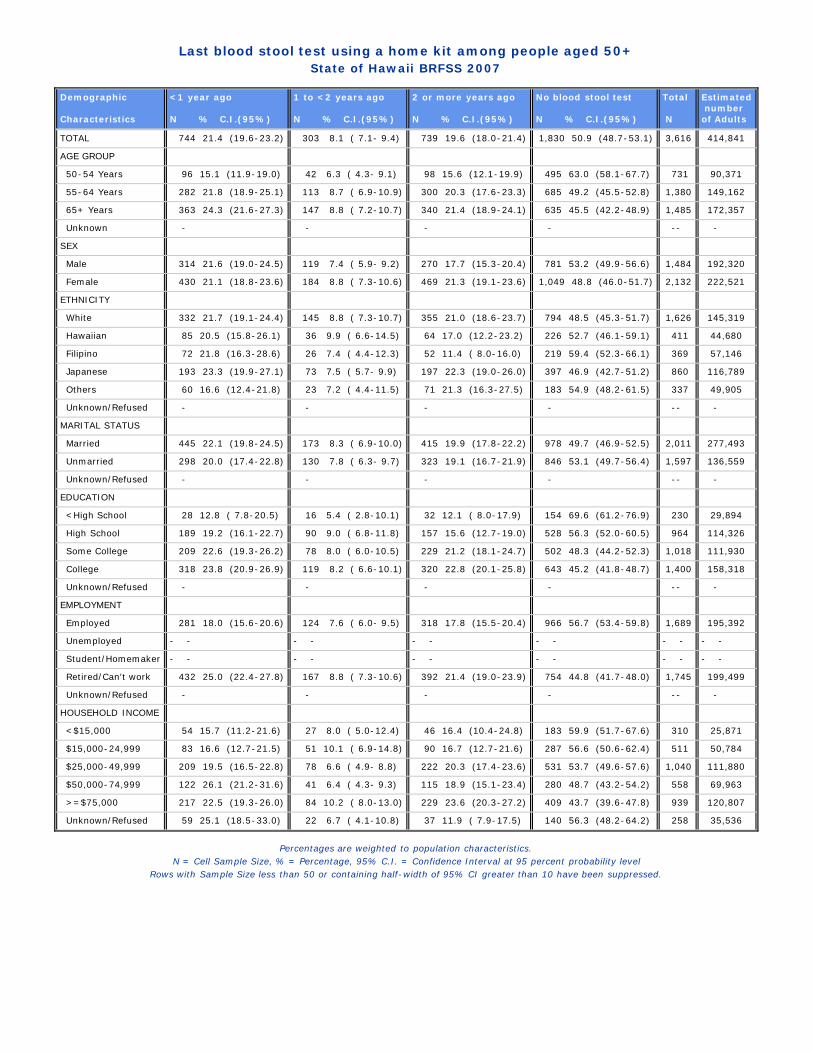
Last blood stool test using a home kit among people aged 50+State of Hawaii BRFSS 2007
Demographic Characteristics
<1 year ago N % C.I.(95%)
1 to <2 years ago N % C.I.(95%)
2 or more years ago N % C.I.(95%)
No blood stool test N % C.I.(95%)
Total N
Estimated numberof Adults
TOTAL 744 21.4 (19.6-23.2) 303 8.1 ( 7.1- 9.4) 739 19.6 (18.0-21.4) 1,830 50.9 (48.7-53.1) 3,616 414,841
AGE GROUP
50-54 Years 96 15.1 (11.9-19.0) 42 6.3 ( 4.3- 9.1) 98 15.6 (12.1-19.9) 495 63.0 (58.1-67.7) 731 90,371
55-64 Years 282 21.8 (18.9-25.1) 113 8.7 ( 6.9-10.9) 300 20.3 (17.6-23.3) 685 49.2 (45.5-52.8) 1,380 149,162
65+ Years 363 24.3 (21.6-27.3) 147 8.8 ( 7.2-10.7) 340 21.4 (18.9-24.1) 635 45.5 (42.2-48.9) 1,485 172,357
Unknown - - - - -- -
SEX
Male 314 21.6 (19.0-24.5) 119 7.4 ( 5.9- 9.2) 270 17.7 (15.3-20.4) 781 53.2 (49.9-56.6) 1,484 192,320
Female 430 21.1 (18.8-23.6) 184 8.8 ( 7.3-10.6) 469 21.3 (19.1-23.6) 1,049 48.8 (46.0-51.7) 2,132 222,521
ETHNICITY
White 332 21.7 (19.1-24.4) 145 8.8 ( 7.3-10.7) 355 21.0 (18.6-23.7) 794 48.5 (45.3-51.7) 1,626 145,319
Hawaiian 85 20.5 (15.8-26.1) 36 9.9 ( 6.6-14.5) 64 17.0 (12.2-23.2) 226 52.7 (46.1-59.1) 411 44,680
Filipino 72 21.8 (16.3-28.6) 26 7.4 ( 4.4-12.3) 52 11.4 ( 8.0-16.0) 219 59.4 (52.3-66.1) 369 57,146
Japanese 193 23.3 (19.9-27.1) 73 7.5 ( 5.7- 9.9) 197 22.3 (19.0-26.0) 397 46.9 (42.7-51.2) 860 116,789
Others 60 16.6 (12.4-21.8) 23 7.2 ( 4.4-11.5) 71 21.3 (16.3-27.5) 183 54.9 (48.2-61.5) 337 49,905
Unknown/Refused - - - - -- -
MARITAL STATUS
Married 445 22.1 (19.8-24.5) 173 8.3 ( 6.9-10.0) 415 19.9 (17.8-22.2) 978 49.7 (46.9-52.5) 2,011 277,493
Unmarried 298 20.0 (17.4-22.8) 130 7.8 ( 6.3- 9.7) 323 19.1 (16.7-21.9) 846 53.1 (49.7-56.4) 1,597 136,559
Unknown/Refused - - - - -- -
EDUCATION
<High School 28 12.8 ( 7.8-20.5) 16 5.4 ( 2.8-10.1) 32 12.1 ( 8.0-17.9) 154 69.6 (61.2-76.9) 230 29,894
High School 189 19.2 (16.1-22.7) 90 9.0 ( 6.8-11.8) 157 15.6 (12.7-19.0) 528 56.3 (52.0-60.5) 964 114,326
Some College 209 22.6 (19.3-26.2) 78 8.0 ( 6.0-10.5) 229 21.2 (18.1-24.7) 502 48.3 (44.2-52.3) 1,018 111,930
College 318 23.8 (20.9-26.9) 119 8.2 ( 6.6-10.1) 320 22.8 (20.1-25.8) 643 45.2 (41.8-48.7) 1,400 158,318
Unknown/Refused - - - - -- -
EMPLOYMENT
Employed 281 18.0 (15.6-20.6) 124 7.6 ( 6.0- 9.5) 318 17.8 (15.5-20.4) 966 56.7 (53.4-59.8) 1,689 195,392
Unemployed - - - - - - - - - - - -
Student/Homemaker - - - - - - - - - - - -
Retired/Can't work 432 25.0 (22.4-27.8) 167 8.8 ( 7.3-10.6) 392 21.4 (19.0-23.9) 754 44.8 (41.7-48.0) 1,745 199,499
Unknown/Refused - - - - -- -
HOUSEHOLD INCOME
<$15,000 54 15.7 (11.2-21.6) 27 8.0 ( 5.0-12.4) 46 16.4 (10.4-24.8) 183 59.9 (51.7-67.6) 310 25,871
$15,000-24,999 83 16.6 (12.7-21.5) 51 10.1 ( 6.9-14.8) 90 16.7 (12.7-21.6) 287 56.6 (50.6-62.4) 511 50,784
$25,000-49,999 209 19.5 (16.5-22.8) 78 6.6 ( 4.9- 8.8) 222 20.3 (17.4-23.6) 531 53.7 (49.6-57.6) 1,040 111,880
$50,000-74,999 122 26.1 (21.2-31.6) 41 6.4 ( 4.3- 9.3) 115 18.9 (15.1-23.4) 280 48.7 (43.2-54.2) 558 69,963
>=$75,000 217 22.5 (19.3-26.0) 84 10.2 ( 8.0-13.0) 229 23.6 (20.3-27.2) 409 43.7 (39.6-47.8) 939 120,807
Unknown/Refused 59 25.1 (18.5-33.0) 22 6.7 ( 4.1-10.8) 37 11.9 ( 7.9-17.5) 140 56.3 (48.2-64.2) 258 35,536
Percentages are weighted to population characteristics.N = Cell Sample Size, % = Percentage, 95% C.I. = Confidence Interval at 95 percent probability level
Rows with Sample Size less than 50 or containing half-width of 95% CI greater than 10 have been suppressed.
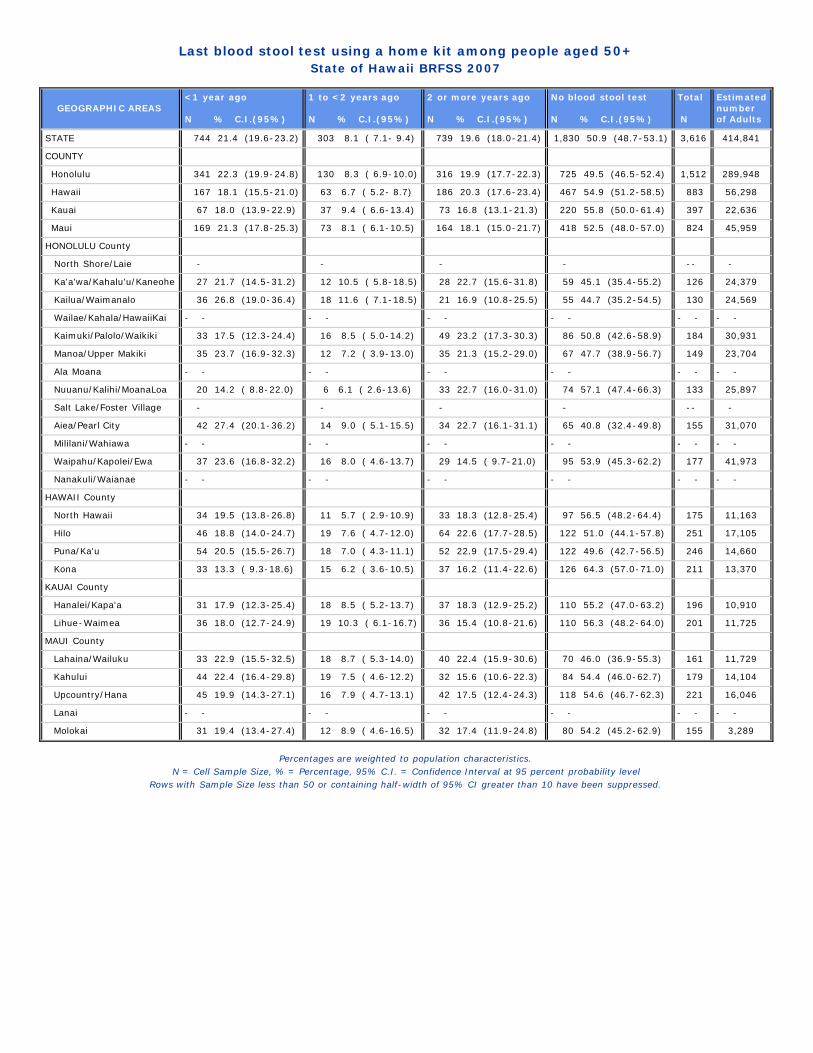
Last blood stool test using a home kit among people aged 50+State of Hawaii BRFSS 2007
GEOGRAPHIC AREAS <1 year ago N % C.I.(95%)
1 to <2 years ago N % C.I.(95%)
2 or more years ago N % C.I.(95%)
No blood stool test N % C.I.(95%)
Total N
Estimatednumberof Adults
STATE 744 21.4 (19.6-23.2) 303 8.1 ( 7.1- 9.4) 739 19.6 (18.0-21.4) 1,830 50.9 (48.7-53.1) 3,616 414,841
COUNTY
Honolulu 341 22.3 (19.9-24.8) 130 8.3 ( 6.9-10.0) 316 19.9 (17.7-22.3) 725 49.5 (46.5-52.4) 1,512 289,948
Hawaii 167 18.1 (15.5-21.0) 63 6.7 ( 5.2- 8.7) 186 20.3 (17.6-23.4) 467 54.9 (51.2-58.5) 883 56,298
Kauai 67 18.0 (13.9-22.9) 37 9.4 ( 6.6-13.4) 73 16.8 (13.1-21.3) 220 55.8 (50.0-61.4) 397 22,636
Maui 169 21.3 (17.8-25.3) 73 8.1 ( 6.1-10.5) 164 18.1 (15.0-21.7) 418 52.5 (48.0-57.0) 824 45,959
HONOLULU County
North Shore/Laie - - - - -- -
Ka'a'wa/Kahalu'u/Kaneohe 27 21.7 (14.5-31.2) 12 10.5 ( 5.8-18.5) 28 22.7 (15.6-31.8) 59 45.1 (35.4-55.2) 126 24,379
Kailua/Waimanalo 36 26.8 (19.0-36.4) 18 11.6 ( 7.1-18.5) 21 16.9 (10.8-25.5) 55 44.7 (35.2-54.5) 130 24,569
Wailae/Kahala/HawaiiKai - - - - - - - - - - - -
Kaimuki/Palolo/Waikiki 33 17.5 (12.3-24.4) 16 8.5 ( 5.0-14.2) 49 23.2 (17.3-30.3) 86 50.8 (42.6-58.9) 184 30,931
Manoa/Upper Makiki 35 23.7 (16.9-32.3) 12 7.2 ( 3.9-13.0) 35 21.3 (15.2-29.0) 67 47.7 (38.9-56.7) 149 23,704
Ala Moana - - - - - - - - - - - -
Nuuanu/Kalihi/MoanaLoa 20 14.2 ( 8.8-22.0) 6 6.1 ( 2.6-13.6) 33 22.7 (16.0-31.0) 74 57.1 (47.4-66.3) 133 25,897
Salt Lake/Foster Village - - - - -- -
Aiea/Pearl City 42 27.4 (20.1-36.2) 14 9.0 ( 5.1-15.5) 34 22.7 (16.1-31.1) 65 40.8 (32.4-49.8) 155 31,070
Mililani/Wahiawa - - - - - - - - - - - -
Waipahu/Kapolei/Ewa 37 23.6 (16.8-32.2) 16 8.0 ( 4.6-13.7) 29 14.5 ( 9.7-21.0) 95 53.9 (45.3-62.2) 177 41,973
Nanakuli/Waianae - - - - - - - - - - - -
HAWAII County
North Hawaii 34 19.5 (13.8-26.8) 11 5.7 ( 2.9-10.9) 33 18.3 (12.8-25.4) 97 56.5 (48.2-64.4) 175 11,163
Hilo 46 18.8 (14.0-24.7) 19 7.6 ( 4.7-12.0) 64 22.6 (17.7-28.5) 122 51.0 (44.1-57.8) 251 17,105
Puna/Ka'u 54 20.5 (15.5-26.7) 18 7.0 ( 4.3-11.1) 52 22.9 (17.5-29.4) 122 49.6 (42.7-56.5) 246 14,660
Kona 33 13.3 ( 9.3-18.6) 15 6.2 ( 3.6-10.5) 37 16.2 (11.4-22.6) 126 64.3 (57.0-71.0) 211 13,370
KAUAI County
Hanalei/Kapa'a 31 17.9 (12.3-25.4) 18 8.5 ( 5.2-13.7) 37 18.3 (12.9-25.2) 110 55.2 (47.0-63.2) 196 10,910
Lihue-Waimea 36 18.0 (12.7-24.9) 19 10.3 ( 6.1-16.7) 36 15.4 (10.8-21.6) 110 56.3 (48.2-64.0) 201 11,725
MAUI County
Lahaina/Wailuku 33 22.9 (15.5-32.5) 18 8.7 ( 5.3-14.0) 40 22.4 (15.9-30.6) 70 46.0 (36.9-55.3) 161 11,729
Kahului 44 22.4 (16.4-29.8) 19 7.5 ( 4.6-12.2) 32 15.6 (10.6-22.3) 84 54.4 (46.0-62.7) 179 14,104
Upcountry/Hana 45 19.9 (14.3-27.1) 16 7.9 ( 4.7-13.1) 42 17.5 (12.4-24.3) 118 54.6 (46.7-62.3) 221 16,046
Lanai - - - - - - - - - - - -
Molokai 31 19.4 (13.4-27.4) 12 8.9 ( 4.6-16.5) 32 17.4 (11.9-24.8) 80 54.2 (45.2-62.9) 155 3,289
Percentages are weighted to population characteristics.N = Cell Sample Size, % = Percentage, 95% C.I. = Confidence Interval at 95 percent probability level
Rows with Sample Size less than 50 or containing half-width of 95% CI greater than 10 have been suppressed.
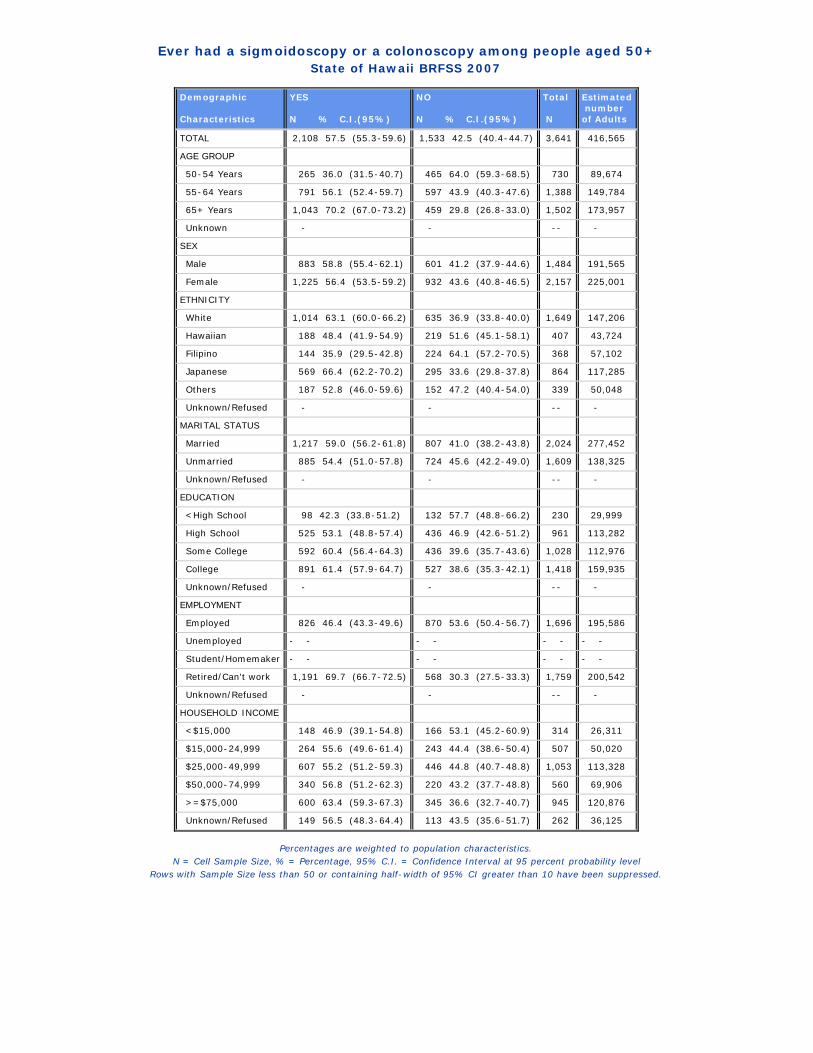
Ever had a sigmoidoscopy or a colonoscopy among people aged 50+State of Hawaii BRFSS 2007
Demographic Characteristics
YES N % C.I.(95%)
NO N % C.I.(95%)
Total N
Estimated numberof Adults
TOTAL 2,108 57.5 (55.3-59.6) 1,533 42.5 (40.4-44.7) 3,641 416,565
AGE GROUP
50-54 Years 265 36.0 (31.5-40.7) 465 64.0 (59.3-68.5) 730 89,674
55-64 Years 791 56.1 (52.4-59.7) 597 43.9 (40.3-47.6) 1,388 149,784
65+ Years 1,043 70.2 (67.0-73.2) 459 29.8 (26.8-33.0) 1,502 173,957
Unknown - - -- -
SEX
Male 883 58.8 (55.4-62.1) 601 41.2 (37.9-44.6) 1,484 191,565
Female 1,225 56.4 (53.5-59.2) 932 43.6 (40.8-46.5) 2,157 225,001
ETHNICITY
White 1,014 63.1 (60.0-66.2) 635 36.9 (33.8-40.0) 1,649 147,206
Hawaiian 188 48.4 (41.9-54.9) 219 51.6 (45.1-58.1) 407 43,724
Filipino 144 35.9 (29.5-42.8) 224 64.1 (57.2-70.5) 368 57,102
Japanese 569 66.4 (62.2-70.2) 295 33.6 (29.8-37.8) 864 117,285
Others 187 52.8 (46.0-59.6) 152 47.2 (40.4-54.0) 339 50,048
Unknown/Refused - - -- -
MARITAL STATUS
Married 1,217 59.0 (56.2-61.8) 807 41.0 (38.2-43.8) 2,024 277,452
Unmarried 885 54.4 (51.0-57.8) 724 45.6 (42.2-49.0) 1,609 138,325
Unknown/Refused - - -- -
EDUCATION
<High School 98 42.3 (33.8-51.2) 132 57.7 (48.8-66.2) 230 29,999
High School 525 53.1 (48.8-57.4) 436 46.9 (42.6-51.2) 961 113,282
Some College 592 60.4 (56.4-64.3) 436 39.6 (35.7-43.6) 1,028 112,976
College 891 61.4 (57.9-64.7) 527 38.6 (35.3-42.1) 1,418 159,935
Unknown/Refused - - -- -
EMPLOYMENT
Employed 826 46.4 (43.3-49.6) 870 53.6 (50.4-56.7) 1,696 195,586
Unemployed - - - - - - - -
Student/Homemaker - - - - - - - -
Retired/Can't work 1,191 69.7 (66.7-72.5) 568 30.3 (27.5-33.3) 1,759 200,542
Unknown/Refused - - -- -
HOUSEHOLD INCOME
<$15,000 148 46.9 (39.1-54.8) 166 53.1 (45.2-60.9) 314 26,311
$15,000-24,999 264 55.6 (49.6-61.4) 243 44.4 (38.6-50.4) 507 50,020
$25,000-49,999 607 55.2 (51.2-59.3) 446 44.8 (40.7-48.8) 1,053 113,328
$50,000-74,999 340 56.8 (51.2-62.3) 220 43.2 (37.7-48.8) 560 69,906
>=$75,000 600 63.4 (59.3-67.3) 345 36.6 (32.7-40.7) 945 120,876
Unknown/Refused 149 56.5 (48.3-64.4) 113 43.5 (35.6-51.7) 262 36,125
Percentages are weighted to population characteristics.N = Cell Sample Size, % = Percentage, 95% C.I. = Confidence Interval at 95 percent probability level
Rows with Sample Size less than 50 or containing half-width of 95% CI greater than 10 have been suppressed.
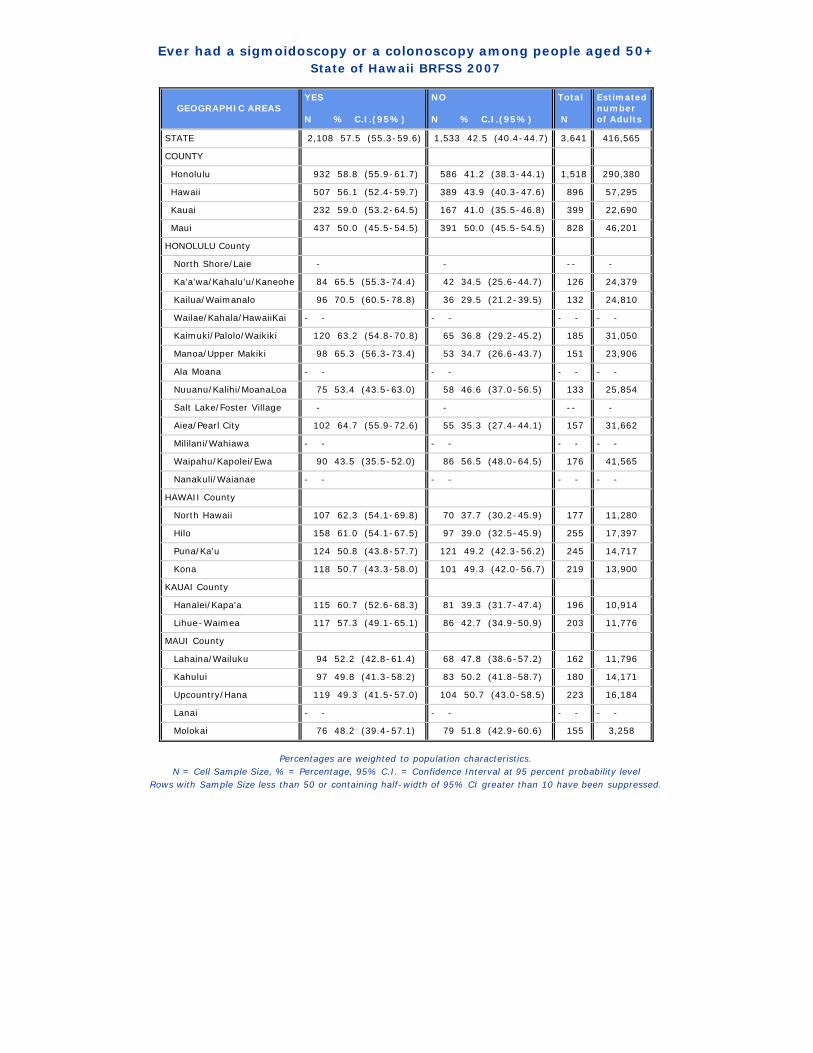
Ever had a sigmoidoscopy or a colonoscopy among people aged 50+State of Hawaii BRFSS 2007
GEOGRAPHIC AREAS YES N % C.I.(95%)
NO N % C.I.(95%)
Total N
Estimatednumberof Adults
STATE 2,108 57.5 (55.3-59.6) 1,533 42.5 (40.4-44.7) 3,641 416,565
COUNTY
Honolulu 932 58.8 (55.9-61.7) 586 41.2 (38.3-44.1) 1,518 290,380
Hawaii 507 56.1 (52.4-59.7) 389 43.9 (40.3-47.6) 896 57,295
Kauai 232 59.0 (53.2-64.5) 167 41.0 (35.5-46.8) 399 22,690
Maui 437 50.0 (45.5-54.5) 391 50.0 (45.5-54.5) 828 46,201
HONOLULU County
North Shore/Laie - - -- -
Ka'a'wa/Kahalu'u/Kaneohe 84 65.5 (55.3-74.4) 42 34.5 (25.6-44.7) 126 24,379
Kailua/Waimanalo 96 70.5 (60.5-78.8) 36 29.5 (21.2-39.5) 132 24,810
Wailae/Kahala/HawaiiKai - - - - - - - -
Kaimuki/Palolo/Waikiki 120 63.2 (54.8-70.8) 65 36.8 (29.2-45.2) 185 31,050
Manoa/Upper Makiki 98 65.3 (56.3-73.4) 53 34.7 (26.6-43.7) 151 23,906
Ala Moana - - - - - - - -
Nuuanu/Kalihi/MoanaLoa 75 53.4 (43.5-63.0) 58 46.6 (37.0-56.5) 133 25,854
Salt Lake/Foster Village - - -- -
Aiea/Pearl City 102 64.7 (55.9-72.6) 55 35.3 (27.4-44.1) 157 31,662
Mililani/Wahiawa - - - - - - - -
Waipahu/Kapolei/Ewa 90 43.5 (35.5-52.0) 86 56.5 (48.0-64.5) 176 41,565
Nanakuli/Waianae - - - - - - - -
HAWAII County
North Hawaii 107 62.3 (54.1-69.8) 70 37.7 (30.2-45.9) 177 11,280
Hilo 158 61.0 (54.1-67.5) 97 39.0 (32.5-45.9) 255 17,397
Puna/Ka'u 124 50.8 (43.8-57.7) 121 49.2 (42.3-56.2) 245 14,717
Kona 118 50.7 (43.3-58.0) 101 49.3 (42.0-56.7) 219 13,900
KAUAI County
Hanalei/Kapa'a 115 60.7 (52.6-68.3) 81 39.3 (31.7-47.4) 196 10,914
Lihue-Waimea 117 57.3 (49.1-65.1) 86 42.7 (34.9-50.9) 203 11,776
MAUI County
Lahaina/Wailuku 94 52.2 (42.8-61.4) 68 47.8 (38.6-57.2) 162 11,796
Kahului 97 49.8 (41.3-58.2) 83 50.2 (41.8-58.7) 180 14,171
Upcountry/Hana 119 49.3 (41.5-57.0) 104 50.7 (43.0-58.5) 223 16,184
Lanai - - - - - - - -
Molokai 76 48.2 (39.4-57.1) 79 51.8 (42.9-60.6) 155 3,258
Percentages are weighted to population characteristics.N = Cell Sample Size, % = Percentage, 95% C.I. = Confidence Interval at 95 percent probability level
Rows with Sample Size less than 50 or containing half-width of 95% CI greater than 10 have been suppressed.

Last sigmoidoscopy or colonoscopy among people aged 50+State of Hawaii BRFSS 2007
Demographic Characteristics
<1 year ago N % C.I.(95%)
1 to <2 years ago N % C.I.(95%)
2 or more years ago N % C.I.(95%)
Neither sigmoidoscopynor colonoscopy N % C.I.(95%)
Total N
Estimated numberof Adults
TOTAL 570 16.6 (15.0-18.3) 394 11.1 ( 9.9-12.5) 1,127 29.5 (27.7-31.5) 1,533 42.7 (40.6-44.9) 3,624 414,241
AGE GROUP
50-54 Years 98 13.3 (10.5-16.7) 53 6.9 ( 5.0- 9.5) 112 15.6 (12.4-19.6) 465 64.1 (59.4-68.6) 728 89,519
55-64 Years 201 16.2 (13.6-19.2) 140 10.4 ( 8.4-12.8) 448 29.5 (26.4-32.7) 597 43.9 (40.3-47.6) 1,386 149,697
65+ Years 270 18.8 (16.3-21.6) 197 13.9 (11.8-16.3) 564 37.1 (34.0-40.3) 459 30.1 (27.1-33.4) 1,490 172,073
Unknown - - - - -- -
SEX
Male 251 18.5 (16.0-21.4) 183 12.1 (10.2-14.3) 443 28.0 (25.2-31.0) 601 41.3 (38.0-44.7) 1,478 190,957
Female 319 14.9 (13.0-17.0) 211 10.3 ( 8.7-12.1) 684 30.8 (28.3-33.5) 932 44.0 (41.1-46.9) 2,146 223,283
ETHNICITY
White 263 16.9 (14.6-19.5) 197 13.1 (11.1-15.4) 550 33.0 (30.2-36.0) 635 37.0 (33.9-40.1) 1,645 146,837
Hawaiian 66 17.3 (13.0-22.7) 37 8.7 ( 5.9-12.7) 85 22.3 (17.1-28.7) 219 51.6 (45.1-58.1) 407 43,724
Filipino 41 13.3 ( 8.9-19.4) 20 4.3 ( 2.3- 7.9) 81 18.0 (13.6-23.5) 224 64.3 (57.4-70.7) 366 56,916
Japanese 151 18.5 (15.4-22.1) 100 12.6 (10.0-15.8) 309 34.8 (31.0-38.9) 295 34.1 (30.1-38.2) 855 115,881
Others 48 14.1 (10.2-19.4) 39 12.0 ( 8.5-16.8) 99 26.5 (21.2-32.6) 152 47.3 (40.6-54.2) 338 49,881
Unknown/Refused - - - - -- -
MARITAL STATUS
Married 347 17.6 (15.6-19.9) 238 11.5 ( 9.9-13.4) 627 29.7 (27.3-32.3) 807 41.1 (38.3-43.9) 2,019 276,721
Unmarried 222 14.5 (12.3-17.0) 154 10.2 ( 8.4-12.4) 497 29.2 (26.4-32.1) 724 46.1 (42.8-49.5) 1,597 136,731
Unknown/Refused - - - - -- -
EDUCATION
<High School 28 13.3 ( 7.8-21.8) 20 9.1 ( 5.3-15.3) 47 19.2 (13.5-26.6) 132 58.4 (49.4-66.9) 227 29,662
High School 158 17.4 (14.4-20.8) 98 9.6 ( 7.5-12.2) 262 25.7 (22.3-29.4) 436 47.3 (43.0-51.7) 954 112,170
Some College 159 17.5 (14.5-21.0) 97 10.4 ( 8.2-13.1) 332 32.4 (28.7-36.2) 436 39.8 (35.9-43.8) 1,024 112,439
College 225 16.0 (13.7-18.6) 178 13.1 (11.0-15.6) 485 32.2 (29.2-35.4) 527 38.7 (35.4-42.2) 1,415 159,596
Unknown/Refused - - - - -- -
EMPLOYMENT
Employed 230 14.2 (12.1-16.6) 164 9.5 ( 7.9-11.4) 430 22.7 (20.2-25.4) 870 53.6 (50.4-56.8) 1,694 195,432
Unemployed - - - - - - - - - - - -
Student/Homemaker - - - - - - - - - - - -
Retired/Can't work 307 19.0 (16.6-21.7) 217 13.3 (11.3-15.5) 654 37.1 (34.2-40.1) 568 30.6 (27.8-33.6) 1,746 198,619
Unknown/Refused - - - - -- -
HOUSEHOLD INCOME
<$15,000 46 12.7 ( 8.8-18.0) 28 10.9 ( 6.8-17.0) 72 23.0 (17.2-30.1) 166 53.3 (45.4-61.1) 312 26,197
$15,000-24,999 83 19.0 (14.7-24.2) 53 8.7 ( 6.1-12.2) 124 27.4 (22.2-33.2) 243 45.0 (39.0-51.0) 503 49,422
$25,000-49,999 166 16.1 (13.3-19.2) 99 10.2 ( 8.1-12.8) 338 28.9 (25.5-32.4) 446 44.9 (40.9-49.0) 1,049 113,002
$50,000-74,999 88 17.0 (13.1-21.8) 56 8.6 ( 6.2-11.7) 195 31.3 (26.5-36.4) 220 43.2 (37.7-48.8) 559 69,866
>=$75,000 155 16.7 (13.9-20.0) 129 14.7 (12.0-17.9) 316 31.9 (28.3-35.8) 345 36.6 (32.7-40.7) 945 120,876
Unknown/Refused 32 16.2 (10.4-24.2) 29 10.7 ( 7.0-16.2) 82 28.0 (21.7-35.4) 113 45.1 (37.0-53.4) 256 34,877
Percentages are weighted to population characteristics.N = Cell Sample Size, % = Percentage, 95% C.I. = Confidence Interval at 95 percent probability level
Rows with Sample Size less than 50 or containing half-width of 95% CI greater than 10 have been suppressed.
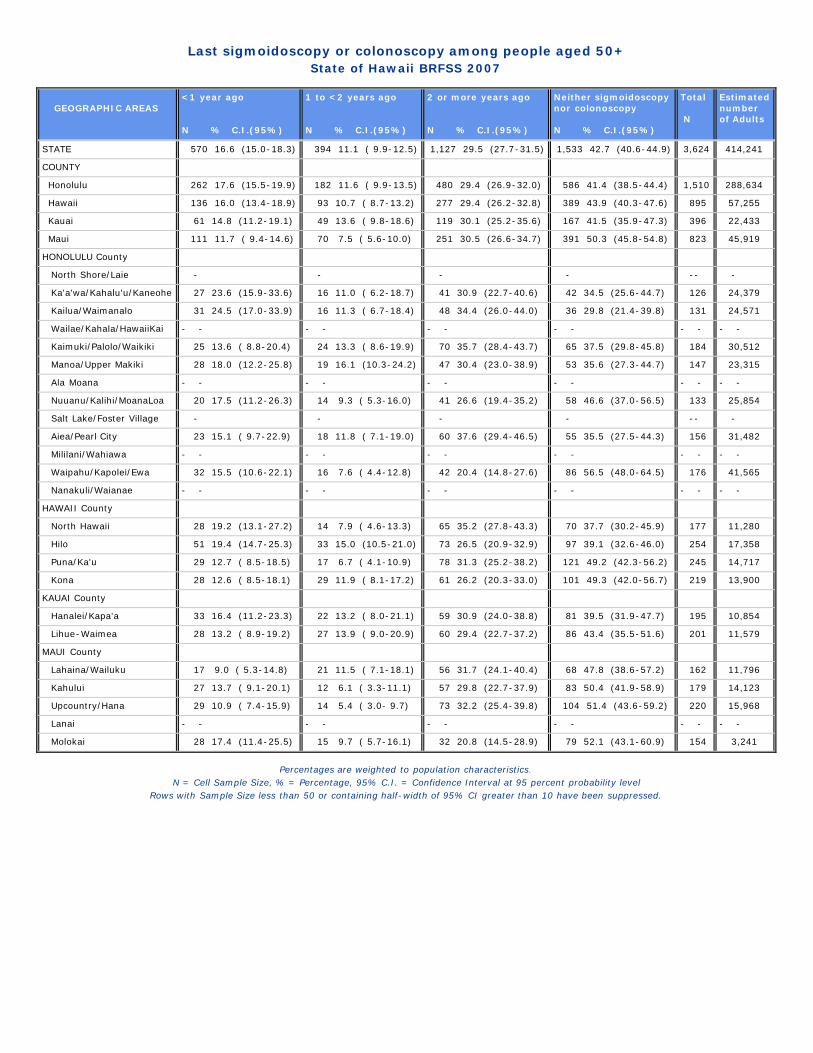
Last sigmoidoscopy or colonoscopy among people aged 50+State of Hawaii BRFSS 2007
GEOGRAPHIC AREAS <1 year ago N % C.I.(95%)
1 to <2 years ago N % C.I.(95%)
2 or more years ago N % C.I.(95%)
Neither sigmoidoscopynor colonoscopy N % C.I.(95%)
Total N
Estimatednumberof Adults
STATE 570 16.6 (15.0-18.3) 394 11.1 ( 9.9-12.5) 1,127 29.5 (27.7-31.5) 1,533 42.7 (40.6-44.9) 3,624 414,241
COUNTY
Honolulu 262 17.6 (15.5-19.9) 182 11.6 ( 9.9-13.5) 480 29.4 (26.9-32.0) 586 41.4 (38.5-44.4) 1,510 288,634
Hawaii 136 16.0 (13.4-18.9) 93 10.7 ( 8.7-13.2) 277 29.4 (26.2-32.8) 389 43.9 (40.3-47.6) 895 57,255
Kauai 61 14.8 (11.2-19.1) 49 13.6 ( 9.8-18.6) 119 30.1 (25.2-35.6) 167 41.5 (35.9-47.3) 396 22,433
Maui 111 11.7 ( 9.4-14.6) 70 7.5 ( 5.6-10.0) 251 30.5 (26.6-34.7) 391 50.3 (45.8-54.8) 823 45,919
HONOLULU County
North Shore/Laie - - - - -- -
Ka'a'wa/Kahalu'u/Kaneohe 27 23.6 (15.9-33.6) 16 11.0 ( 6.2-18.7) 41 30.9 (22.7-40.6) 42 34.5 (25.6-44.7) 126 24,379
Kailua/Waimanalo 31 24.5 (17.0-33.9) 16 11.3 ( 6.7-18.4) 48 34.4 (26.0-44.0) 36 29.8 (21.4-39.8) 131 24,571
Wailae/Kahala/HawaiiKai - - - - - - - - - - - -
Kaimuki/Palolo/Waikiki 25 13.6 ( 8.8-20.4) 24 13.3 ( 8.6-19.9) 70 35.7 (28.4-43.7) 65 37.5 (29.8-45.8) 184 30,512
Manoa/Upper Makiki 28 18.0 (12.2-25.8) 19 16.1 (10.3-24.2) 47 30.4 (23.0-38.9) 53 35.6 (27.3-44.7) 147 23,315
Ala Moana - - - - - - - - - - - -
Nuuanu/Kalihi/MoanaLoa 20 17.5 (11.2-26.3) 14 9.3 ( 5.3-16.0) 41 26.6 (19.4-35.2) 58 46.6 (37.0-56.5) 133 25,854
Salt Lake/Foster Village - - - - -- -
Aiea/Pearl City 23 15.1 ( 9.7-22.9) 18 11.8 ( 7.1-19.0) 60 37.6 (29.4-46.5) 55 35.5 (27.5-44.3) 156 31,482
Mililani/Wahiawa - - - - - - - - - - - -
Waipahu/Kapolei/Ewa 32 15.5 (10.6-22.1) 16 7.6 ( 4.4-12.8) 42 20.4 (14.8-27.6) 86 56.5 (48.0-64.5) 176 41,565
Nanakuli/Waianae - - - - - - - - - - - -
HAWAII County
North Hawaii 28 19.2 (13.1-27.2) 14 7.9 ( 4.6-13.3) 65 35.2 (27.8-43.3) 70 37.7 (30.2-45.9) 177 11,280
Hilo 51 19.4 (14.7-25.3) 33 15.0 (10.5-21.0) 73 26.5 (20.9-32.9) 97 39.1 (32.6-46.0) 254 17,358
Puna/Ka'u 29 12.7 ( 8.5-18.5) 17 6.7 ( 4.1-10.9) 78 31.3 (25.2-38.2) 121 49.2 (42.3-56.2) 245 14,717
Kona 28 12.6 ( 8.5-18.1) 29 11.9 ( 8.1-17.2) 61 26.2 (20.3-33.0) 101 49.3 (42.0-56.7) 219 13,900
KAUAI County
Hanalei/Kapa'a 33 16.4 (11.2-23.3) 22 13.2 ( 8.0-21.1) 59 30.9 (24.0-38.8) 81 39.5 (31.9-47.7) 195 10,854
Lihue-Waimea 28 13.2 ( 8.9-19.2) 27 13.9 ( 9.0-20.9) 60 29.4 (22.7-37.2) 86 43.4 (35.5-51.6) 201 11,579
MAUI County
Lahaina/Wailuku 17 9.0 ( 5.3-14.8) 21 11.5 ( 7.1-18.1) 56 31.7 (24.1-40.4) 68 47.8 (38.6-57.2) 162 11,796
Kahului 27 13.7 ( 9.1-20.1) 12 6.1 ( 3.3-11.1) 57 29.8 (22.7-37.9) 83 50.4 (41.9-58.9) 179 14,123
Upcountry/Hana 29 10.9 ( 7.4-15.9) 14 5.4 ( 3.0- 9.7) 73 32.2 (25.4-39.8) 104 51.4 (43.6-59.2) 220 15,968
Lanai - - - - - - - - - - - -
Molokai 28 17.4 (11.4-25.5) 15 9.7 ( 5.7-16.1) 32 20.8 (14.5-28.9) 79 52.1 (43.1-60.9) 154 3,241
Percentages are weighted to population characteristics.N = Cell Sample Size, % = Percentage, 95% C.I. = Confidence Interval at 95 percent probability level
Rows with Sample Size less than 50 or containing half-width of 95% CI greater than 10 have been suppressed.
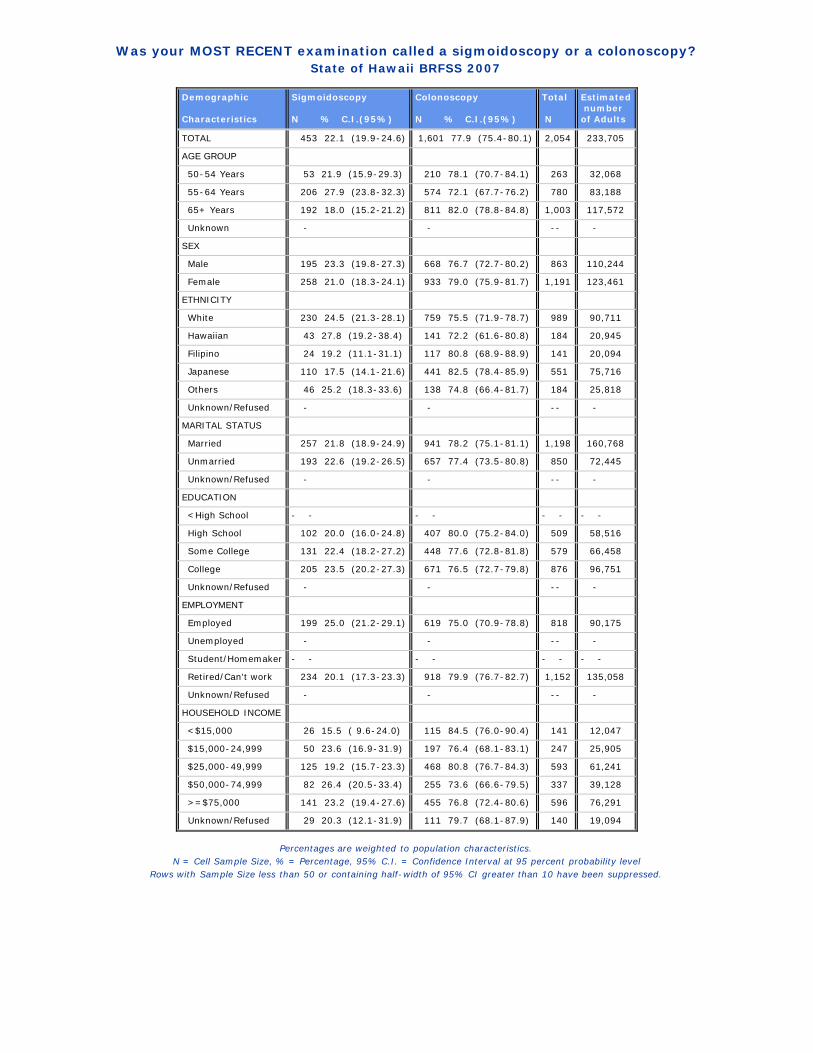
Was your MOST RECENT examination called a sigmoidoscopy or a colonoscopy?State of Hawaii BRFSS 2007
Demographic Characteristics
Sigmoidoscopy N % C.I.(95%)
Colonoscopy N % C.I.(95%)
Total N
Estimated numberof Adults
TOTAL 453 22.1 (19.9-24.6) 1,601 77.9 (75.4-80.1) 2,054 233,705
AGE GROUP
50-54 Years 53 21.9 (15.9-29.3) 210 78.1 (70.7-84.1) 263 32,068
55-64 Years 206 27.9 (23.8-32.3) 574 72.1 (67.7-76.2) 780 83,188
65+ Years 192 18.0 (15.2-21.2) 811 82.0 (78.8-84.8) 1,003 117,572
Unknown - - -- -
SEX
Male 195 23.3 (19.8-27.3) 668 76.7 (72.7-80.2) 863 110,244
Female 258 21.0 (18.3-24.1) 933 79.0 (75.9-81.7) 1,191 123,461
ETHNICITY
White 230 24.5 (21.3-28.1) 759 75.5 (71.9-78.7) 989 90,711
Hawaiian 43 27.8 (19.2-38.4) 141 72.2 (61.6-80.8) 184 20,945
Filipino 24 19.2 (11.1-31.1) 117 80.8 (68.9-88.9) 141 20,094
Japanese 110 17.5 (14.1-21.6) 441 82.5 (78.4-85.9) 551 75,716
Others 46 25.2 (18.3-33.6) 138 74.8 (66.4-81.7) 184 25,818
Unknown/Refused - - -- -
MARITAL STATUS
Married 257 21.8 (18.9-24.9) 941 78.2 (75.1-81.1) 1,198 160,768
Unmarried 193 22.6 (19.2-26.5) 657 77.4 (73.5-80.8) 850 72,445
Unknown/Refused - - -- -
EDUCATION
<High School - - - - - - - -
High School 102 20.0 (16.0-24.8) 407 80.0 (75.2-84.0) 509 58,516
Some College 131 22.4 (18.2-27.2) 448 77.6 (72.8-81.8) 579 66,458
College 205 23.5 (20.2-27.3) 671 76.5 (72.7-79.8) 876 96,751
Unknown/Refused - - -- -
EMPLOYMENT
Employed 199 25.0 (21.2-29.1) 619 75.0 (70.9-78.8) 818 90,175
Unemployed - - -- -
Student/Homemaker - - - - - - - -
Retired/Can't work 234 20.1 (17.3-23.3) 918 79.9 (76.7-82.7) 1,152 135,058
Unknown/Refused - - -- -
HOUSEHOLD INCOME
<$15,000 26 15.5 ( 9.6-24.0) 115 84.5 (76.0-90.4) 141 12,047
$15,000-24,999 50 23.6 (16.9-31.9) 197 76.4 (68.1-83.1) 247 25,905
$25,000-49,999 125 19.2 (15.7-23.3) 468 80.8 (76.7-84.3) 593 61,241
$50,000-74,999 82 26.4 (20.5-33.4) 255 73.6 (66.6-79.5) 337 39,128
>=$75,000 141 23.2 (19.4-27.6) 455 76.8 (72.4-80.6) 596 76,291
Unknown/Refused 29 20.3 (12.1-31.9) 111 79.7 (68.1-87.9) 140 19,094
Percentages are weighted to population characteristics.N = Cell Sample Size, % = Percentage, 95% C.I. = Confidence Interval at 95 percent probability level
Rows with Sample Size less than 50 or containing half-width of 95% CI greater than 10 have been suppressed.
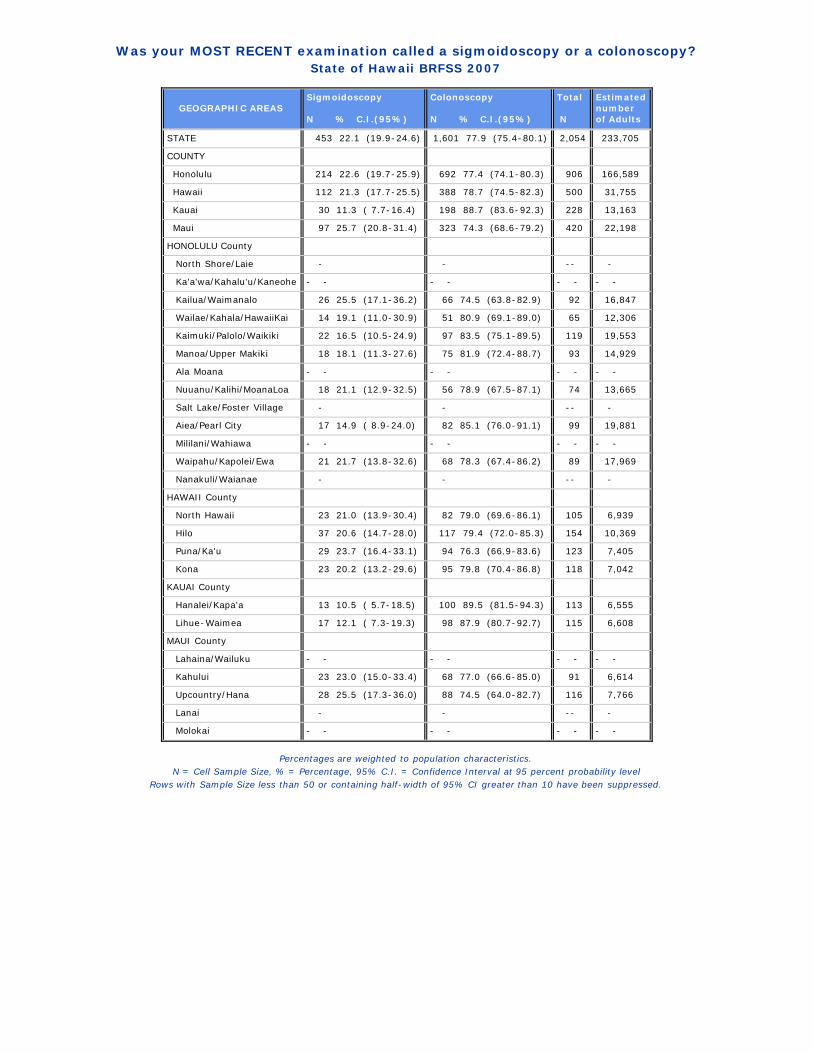
Was your MOST RECENT examination called a sigmoidoscopy or a colonoscopy?State of Hawaii BRFSS 2007
GEOGRAPHIC AREAS Sigmoidoscopy N % C.I.(95%)
Colonoscopy N % C.I.(95%)
Total N
Estimatednumberof Adults
STATE 453 22.1 (19.9-24.6) 1,601 77.9 (75.4-80.1) 2,054 233,705
COUNTY
Honolulu 214 22.6 (19.7-25.9) 692 77.4 (74.1-80.3) 906 166,589
Hawaii 112 21.3 (17.7-25.5) 388 78.7 (74.5-82.3) 500 31,755
Kauai 30 11.3 ( 7.7-16.4) 198 88.7 (83.6-92.3) 228 13,163
Maui 97 25.7 (20.8-31.4) 323 74.3 (68.6-79.2) 420 22,198
HONOLULU County
North Shore/Laie - - -- -
Ka'a'wa/Kahalu'u/Kaneohe - - - - - - - -
Kailua/Waimanalo 26 25.5 (17.1-36.2) 66 74.5 (63.8-82.9) 92 16,847
Wailae/Kahala/HawaiiKai 14 19.1 (11.0-30.9) 51 80.9 (69.1-89.0) 65 12,306
Kaimuki/Palolo/Waikiki 22 16.5 (10.5-24.9) 97 83.5 (75.1-89.5) 119 19,553
Manoa/Upper Makiki 18 18.1 (11.3-27.6) 75 81.9 (72.4-88.7) 93 14,929
Ala Moana - - - - - - - -
Nuuanu/Kalihi/MoanaLoa 18 21.1 (12.9-32.5) 56 78.9 (67.5-87.1) 74 13,665
Salt Lake/Foster Village - - -- -
Aiea/Pearl City 17 14.9 ( 8.9-24.0) 82 85.1 (76.0-91.1) 99 19,881
Mililani/Wahiawa - - - - - - - -
Waipahu/Kapolei/Ewa 21 21.7 (13.8-32.6) 68 78.3 (67.4-86.2) 89 17,969
Nanakuli/Waianae - - -- -
HAWAII County
North Hawaii 23 21.0 (13.9-30.4) 82 79.0 (69.6-86.1) 105 6,939
Hilo 37 20.6 (14.7-28.0) 117 79.4 (72.0-85.3) 154 10,369
Puna/Ka'u 29 23.7 (16.4-33.1) 94 76.3 (66.9-83.6) 123 7,405
Kona 23 20.2 (13.2-29.6) 95 79.8 (70.4-86.8) 118 7,042
KAUAI County
Hanalei/Kapa'a 13 10.5 ( 5.7-18.5) 100 89.5 (81.5-94.3) 113 6,555
Lihue-Waimea 17 12.1 ( 7.3-19.3) 98 87.9 (80.7-92.7) 115 6,608
MAUI County
Lahaina/Wailuku - - - - - - - -
Kahului 23 23.0 (15.0-33.4) 68 77.0 (66.6-85.0) 91 6,614
Upcountry/Hana 28 25.5 (17.3-36.0) 88 74.5 (64.0-82.7) 116 7,766
Lanai - - -- -
Molokai - - - - - - - -
Percentages are weighted to population characteristics.N = Cell Sample Size, % = Percentage, 95% C.I. = Confidence Interval at 95 percent probability level
Rows with Sample Size less than 50 or containing half-width of 95% CI greater than 10 have been suppressed.
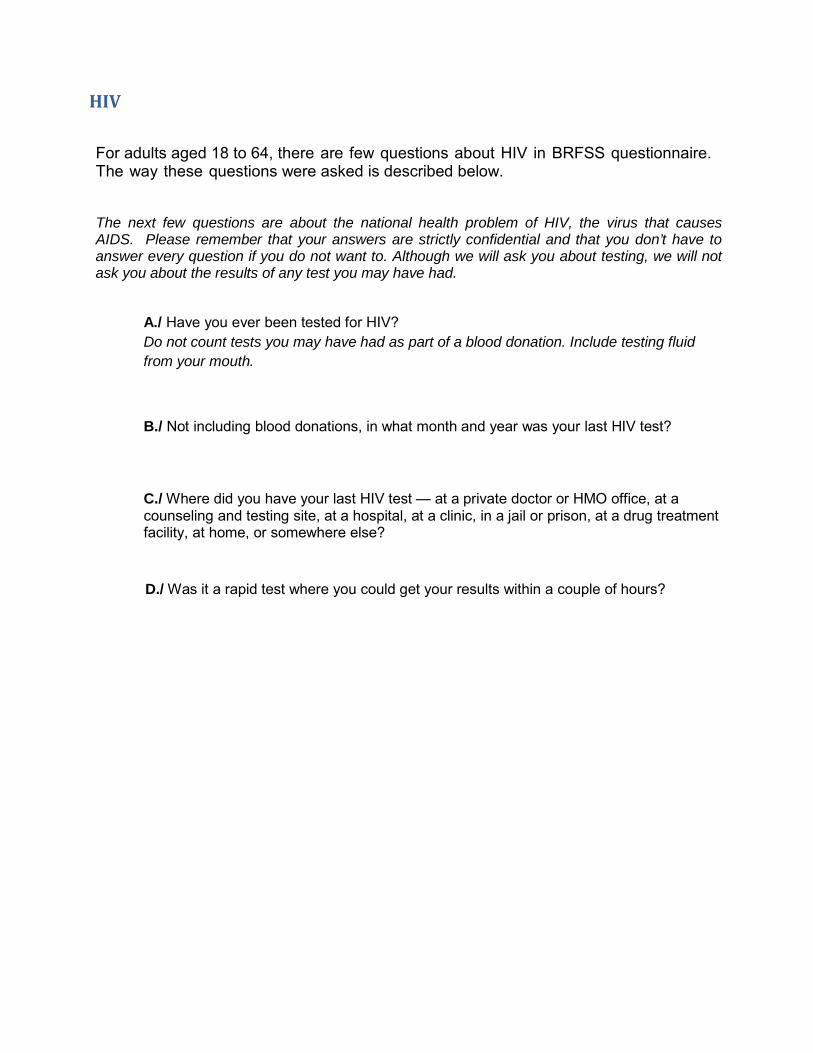
HIV For adults aged 18 to 64, there are few questions about HIV in BRFSS questionnaire. The way these questions were asked is described below.
The next few questions are about the national health problem of HIV, the virus that causes AIDS. Please remember that your answers are strictly confidential and that you don’t have to answer every question if you do not want to. Although we will ask you about testing, we will not ask you about the results of any test you may have had.
A./ Have you ever been tested for HIV? Do not count tests you may have had as part of a blood donation. Include testing fluid from your mouth.
B./ Not including blood donations, in what month and year was your last HIV test?
C./ Where did you have your last HIV test — at a private doctor or HMO office, at a counseling and testing site, at a hospital, at a clinic, in a jail or prison, at a drug treatment facility, at home, or somewhere else?
D./ Was it a rapid test where you could get your results within a couple of hours?

Have you ever been tested for HIV, (not counting blood donation test)?State of Hawaii BRFSS 2007
DemographicCharacteristics
YES N % C.I.(95%)
NO N % C.I.(95%)
Total N
Estimated numberof Adults
TOTAL 1,833 35.6 (33.7-37.5) 3,022 64.4 (62.5-66.3) 4,855 775,222
AGE GROUP
18-24 Years 109 29.1 (23.4-35.5) 200 70.9 (64.5-76.6) 309 121,642
25-34 Years 380 48.5 (43.7-53.4) 309 51.5 (46.6-56.3) 689 155,638
35-44 Years 498 45.7 (41.9-49.6) 551 54.3 (50.4-58.1) 1,049 167,101
45-54 Years 502 32.6 (29.5-35.8) 909 67.4 (64.2-70.5) 1,411 178,405
55-64 Years 337 19.6 (17.1-22.3) 1,040 80.4 (77.7-82.9) 1,377 149,358
Unknown/Refuse - - -- -
GENDER
Male 746 33.5 (30.8-36.3) 1,284 66.5 (63.7-69.2) 2,030 397,967
Female 1,087 37.8 (35.4-40.3) 1,738 62.2 (59.7-64.6) 2,825 377,256
ETHNICITY
White 969 49.2 (46.2-52.2) 1,039 50.8 (47.8-53.8) 2,008 243,691
Hawaiian 245 30.9 (26.5-35.7) 498 69.1 (64.3-73.5) 743 116,466
Filipino 179 23.9 (19.7-28.6) 508 76.1 (71.4-80.3) 687 144,126
Japanese 197 24.0 (20.5-28.0) 609 76.0 (72.0-79.5) 806 147,561
Others 232 40.2 (35.1-45.6) 360 59.8 (54.4-64.9) 592 121,468
Unknown/Refused - - -- -
MARITAL STATUS
Married 1,021 36.4 (34.2-38.7) 1,849 63.6 (61.3-65.8) 2,870 459,751
Unmarried 810 34.4 (31.2-37.6) 1,169 65.6 (62.4-68.8) 1,979 314,910
Unknown/Refused - - -- -
EDUCATION
<High School - - - - - - - -
High School 417 29.5 (26.2-33.1) 907 70.5 (66.9-73.8) 1,324 241,579
Some College 613 38.6 (35.2-42.1) 890 61.4 (57.9-64.8) 1,503 239,898
College 756 39.0 (36.1-42.0) 1,113 61.0 (58.0-63.9) 1,869 264,692
Unknown/Refused - - -- -
EMPLOYMENT
Employed 1,372 35.9 (33.8-38.1) 2,283 64.1 (61.9-66.2) 3,655 588,592
Unemployed 72 31.0 (22.3-41.2) 93 69.0 (58.8-77.7) 165 30,546
Student/Homemaker 181 38.8 (32.8-45.2) 230 61.2 (54.8-67.2) 411 84,149
Retired/Can't work 207 30.9 (25.7-36.6) 414 69.1 (63.4-74.3) 621 71,559
Unknown/Refused - - -- -
HOUSEHOLD INCOME
<$15,000 129 36.6 (28.6-45.5) 173 63.4 (54.5-71.4) 302 41,973
$15,000-24,999 219 35.4 (29.8-41.4) 302 64.6 (58.6-70.2) 521 71,172
$25,000-49,999 492 35.7 (32.1-39.5) 854 64.3 (60.5-67.9) 1,346 214,087
$50,000-74,999 320 33.0 (29.1-37.2) 585 67.0 (62.8-70.9) 905 142,498
>=$75,000 593 38.6 (35.5-41.9) 905 61.4 (58.1-64.5) 1,498 244,475
Unknown/Refused 80 28.5 (21.7-36.5) 203 71.5 (63.5-78.3) 283 61,017
Percentages are weighted to population characteristics.N = Cell Sample Size, % = Percentage, 95% C.I. = Confidence Interval at 95 percent probability level
Rows with Sample Size less than 50 or containing half-width of 95% CI greater than 10 have been suppressed.

Have you ever been tested for HIV, (not counting blood donation test)?State of Hawaii BRFSS 2007
GEOGRAPHIC AREAS YES N % C.I.(95%)
NO N % C.I.(95%)
Total N
Estimatednumberof Adults
STATE 1,833 35.6 (33.7-37.5) 3,022 64.4 (62.5-66.3) 4,855 775,222
COUNTY
Honolulu 791 35.3 (32.9-37.8) 1,324 64.7 (62.2-67.1) 2,115 549,582
Hawaii 437 36.6 (33.2-40.1) 669 63.4 (59.9-66.8) 1,106 101,580
Kauai 178 35.5 (30.2-41.2) 311 64.5 (58.8-69.8) 489 36,790
Maui 427 36.1 (32.4-40.1) 718 63.9 (59.9-67.6) 1,145 87,269
HONOLULU County
North Shore/Laie - - - - - - - -
Ka'a'wa/Kahalu'u/Kaneohe 61 39.9 (31.2-49.3) 96 60.1 (50.7-68.8) 157 39,862
Kailua/Waimanalo 61 33.4 (25.8-42.0) 103 66.6 (58.0-74.2) 164 38,195
Wailae/Kahala/HawaiiKai 42 35.2 (25.9-45.7) 79 64.8 (54.3-74.1) 121 27,864
Kaimuki/Palolo/Waikiki 59 28.7 (21.5-37.1) 111 71.3 (62.9-78.5) 170 37,193
Manoa/Upper Makiki 53 30.0 (22.6-38.7) 105 70.0 (61.3-77.4) 158 31,314
Ala Moana - - - - - - - -
Nuuanu/Kalihi/MoanaLoa 61 32.9 (24.9-42.0) 119 67.1 (58.0-75.1) 180 53,024
Salt Lake/Foster Village - - - - - - - -
Aiea/Pearl City 66 35.5 (27.8-44.1) 130 64.5 (55.9-72.2) 196 52,803
Mililani/Wahiawa 110 44.5 (37.5-51.7) 142 55.5 (48.3-62.5) 252 65,810
Waipahu/Kapolei/Ewa 152 36.8 (31.2-42.8) 207 63.2 (57.2-68.8) 359 109,805
Nanakuli/Waianae - - - - - - - -
HAWAII County
North Hawaii 97 39.4 (32.1-47.2) 140 60.6 (52.8-67.9) 237 22,913
Hilo 82 29.4 (23.4-36.2) 197 70.6 (63.8-76.6) 279 25,849
Puna/Ka'u 147 41.0 (34.5-47.8) 182 59.0 (52.2-65.5) 329 30,116
Kona 111 36.0 (29.4-43.3) 150 64.0 (56.7-70.6) 261 22,703
KAUAI County
Hanalei/Kapa'a 84 40.8 (32.4-49.7) 137 59.2 (50.3-67.6) 221 15,085
Lihue-Waimea 94 31.9 (25.4-39.1) 174 68.1 (60.9-74.6) 268 21,705
MAUI County
Lahaina/Wailuku 76 31.6 (24.4-39.8) 144 68.4 (60.2-75.6) 220 25,514
Kahului 87 38.3 (31.1-46.1) 149 61.7 (53.9-68.9) 236 24,596
Upcountry/Hana 135 37.8 (31.5-44.4) 179 62.2 (55.6-68.5) 314 28,798
Lanai 47 31.9 (23.5-41.6) 108 68.1 (58.4-76.5) 155 1,510
Molokai 82 39.1 (31.5-47.2) 138 60.9 (52.8-68.5) 220 6,851
Percentages are weighted to population characteristics.N = Cell Sample Size, % = Percentage, 95% C.I. = Confidence Interval at 95 percent probability level
Rows with Sample Size less than 50 or containing half-width of 95% CI greater than 10 have been suppressed.

Period of last HIV testingState of Hawaii BRFSS 2007
DemographicCharacteristics
1985 to 2000 N % C.I.(95%)
2001 to 2005 N % C.I.(95%)
in 2006 N % C.I.(95%)
in 2007 N % C.I.(95%)
Total N
Estimated numberof Adults
TOTAL 619 30.2 (27.5-33.1) 557 32.1 (29.1-35.2) 306 22.2 (19.5-25.2) 195 15.5 (13.0-18.4) 1,677 254,941
AGE GROUP
18-24 Years - - - - - - - - - - - -
25-34 Years 70 18.0 (13.8-23.2) 142 35.6 (29.7-41.9) 100 28.2 (22.7-34.4) 52 18.2 (13.2-24.7) 364 72,696
35-44 Years 199 39.5 (34.0-45.2) 152 31.9 (26.6-37.6) 71 16.7 (12.9-21.3) 53 12.0 ( 8.6-16.6) 475 73,455
45-54 Years 203 44.5 (38.6-50.5) 151 34.5 (28.9-40.5) 51 11.6 ( 8.4-15.8) 35 9.5 ( 6.2-14.1) 440 48,850
55-64 Years 144 51.7 (43.9-59.5) 77 23.7 (17.9-30.7) 38 12.9 ( 8.7-18.7) 30 11.6 ( 7.2-18.2) 289 24,809
Unknown/Refuse - - - - -- -
GENDER
Male 208 25.7 (21.9-29.9) 221 29.3 (25.0-33.9) 136 24.3 (20.1-29.1) 111 20.8 (16.7-25.6) 676 122,347
Female 411 34.5 (30.7-38.4) 336 34.7 (30.7-39.0) 170 20.2 (16.8-24.1) 84 10.6 ( 7.9-14.1) 1,001 132,594
ETHNICITY
White 363 33.3 (29.5-37.3) 285 30.3 (26.5-34.3) 152 22.6 (18.9-26.8) 94 13.8 (10.7-17.6) 894 111,208
Hawaiian 68 32.3 (24.5-41.3) 72 29.3 (21.7-38.2) 52 21.2 (15.0-29.0) 30 17.2 (10.8-26.2) 222 32,713
Filipino - - - - - - - - - - - -
Japanese 72 32.7 (25.0-41.4) 64 37.0 (28.5-46.4) 24 20.9 (13.2-31.5) 18 9.4 ( 5.5-15.4) 178 32,278
Others 65 23.8 (17.8-31.1) 70 30.3 (22.9-38.9) 39 22.5 (15.6-31.3) 36 23.4 (16.2-32.5) 210 45,272
Unknown/Refused - - - - -- -
MARITAL STATUS
Married 387 34.8 (31.2-38.5) 289 31.8 (28.2-35.6) 163 20.2 (17.1-23.7) 96 13.2 (10.6-16.5) 935 154,643
Unmarried 231 23.2 (19.2-27.7) 268 32.6 (27.5-38.1) 143 25.3 (20.4-30.8) 99 18.9 (14.4-24.5) 741 100,258
Unknown/Refused - - - - -- -
EDUCATION
<High School - - - - -- -
High School 116 20.2 (16.0-25.1) 125 32.6 (26.5-39.4) 85 30.2 (23.7-37.6) 53 17.0 (11.6-24.2) 379 64,500
Some College 211 29.6 (25.1-34.6) 180 30.1 (25.0-35.7) 116 25.9 (21.2-31.3) 59 14.4 (10.5-19.4) 566 87,357
College 280 37.7 (33.2-42.6) 233 33.2 (28.7-38.0) 98 14.1 (11.1-17.7) 79 15.0 (11.6-19.3) 690 94,822
Unknown/Refused - - - - -- -
EMPLOYMENT
Employed 463 31.0 (27.9-34.4) 430 31.5 (28.2-35.1) 220 21.2 (18.1-24.6) 149 16.2 (13.3-19.6) 1,262 195,928
Unemployed - - - - - - - - - - - -
Student/Homemaker 50 21.9 (15.7-29.7) 59 39.0 (29.5-49.4) 46 27.3 (19.9-36.3) 19 11.7 ( 6.8-19.5) 174 31,388
Retired/Can't work - - - - - - - - - - - -
Unknown/Refused - - - - -- -
HOUSEHOLD INCOME
<$15,000 - - - - - - - - - - - -
$15,000-24,999 61 25.6 (18.5-34.2) 84 39.3 (30.0-49.5) 30 21.5 (13.6-32.3) 20 13.5 ( 7.4-23.4) 195 22,558
$25,000-49,999 149 24.0 (19.4-29.4) 148 35.1 (28.8-41.9) 102 26.0 (20.7-32.2) 57 14.9 (10.3-20.9) 456 72,325
$50,000-74,999 120 34.0 (27.7-40.9) 96 30.0 (23.8-37.1) 51 18.3 (13.4-24.5) 29 17.7 (11.5-26.1) 296 43,862
>=$75,000 235 38.2 (33.3-43.4) 171 31.1 (26.5-36.2) 83 18.8 (14.7-23.6) 57 11.9 ( 8.8-15.7) 546 87,946
Unknown/Refused - - - - - - - - - - - -
COUNTY
Honolulu 241 27.9 (24.4-31.7) 228 31.4 (27.5-35.6) 152 23.2 (19.6-27.2) 105 17.5 (14.2-21.4) 726 179,754
Hawaii 164 36.9 (31.5-42.7) 140 35.9 (30.3-41.8) 61 18.5 (14.1-23.9) 36 8.7 ( 5.8-12.8) 401 34,554
Kauai - - - - - - - - - - - -
Maui 152 36.2 (30.2-42.6) 134 31.5 (25.8-37.7) 68 21.5 (16.2-28.0) 38 10.8 ( 7.1-16.0) 392 28,850
Percentages are weighted to population characteristics.N = Cell Sample Size, % = Percentage, 95% C.I. = Confidence Interval at 95 percent probability level
Rows with Sample Size less than 50 or containing half-width of 95% CI greater than 10 have been suppressed.

Was your test for HIV a rapid test?(People who had HIV test within the last 12 months)
State of Hawaii BRFSS 2007
DemographicCharacteristics
YES N % C.I.(95%)
NO N % C.I.(95%)
Total N
Estimated numberof Adults
TOTAL 48 11.2 ( 7.6-16.0) 370 88.8 (84.0-92.4) 418 79,627
AGE GROUP
18-24 Years 5 6.4 ( 2.4-15.9) 49 93.6 (84.1-97.6) 54 19,205
25-34 Years 13 13.6 ( 6.8-25.2) 116 86.4 (74.8-93.2) 129 29,016
35-44 Years 8 5.4 ( 2.1-12.8) 93 94.6 (87.2-97.9) 101 16,847
45-54 Years - - - - - - - -
55-64 Years - - - - - - - -
Unknown/Refuse - - -- -
GENDER
Male 29 14.1 ( 8.8-21.9) 183 85.9 (78.1-91.2) 212 46,713
Female 19 6.9 ( 4.1-11.5) 187 93.1 (88.5-95.9) 206 32,914
ETHNICITY
White 19 6.6 ( 3.8-11.2) 184 93.4 (88.8-96.2) 203 33,191
Hawaiian - - - - - - - -
Filipino - - -- -
Japanese - - -- -
Others - - - - - - - -
Unknown/Refused - - -- -
MARITAL STATUS
Married 25 11.8 ( 7.5-18.1) 186 88.2 (81.9-92.5) 211 42,250
Unmarried 23 10.5 ( 5.5-19.0) 184 89.5 (81.0-94.5) 207 37,378
Unknown/Refused
EDUCATION
<High School - - -- -
High School 13 12.2 ( 5.7-24.2) 104 87.8 (75.8-94.3) 117 26,029
Some College 14 11.1 ( 5.9-20.0) 129 88.9 (80.0-94.1) 143 26,836
College 19 9.5 ( 5.3-16.3) 131 90.5 (83.7-94.7) 150 24,410
Unknown/Refused
EMPLOYMENT
Employed 36 12.0 ( 7.8-18.1) 276 88.0 (81.9-92.2) 312 61,054
Unemployed - - -- -
Student/Homemaker - - -- -
Retired/Can't work - - -- -
Unknown/Refused - - -- -
HOUSEHOLD INCOME
<$15,000 - - -- -
$15,000-24,999 - - -- -
$25,000-49,999 15 11.4 ( 6.2-19.8) 112 88.6 (80.2-93.8) 127 22,565
$50,000-74,999 - - - - - - - -
>=$75,000 13 7.8 ( 4.1-14.2) 105 92.2 (85.8-95.9) 118 21,714
Unknown/Refused - - -- -
COUNTY
Honolulu 22 10.1 ( 6.0-16.4) 192 89.9 (83.6-94.0) 214 60,744
Hawaii 11 13.6 ( 7.0-24.9) 68 86.4 (75.1-93.0) 79 7,012
Kauai - - -- -
Maui - - - - - - - -
Percentages are weighted to population characteristics.
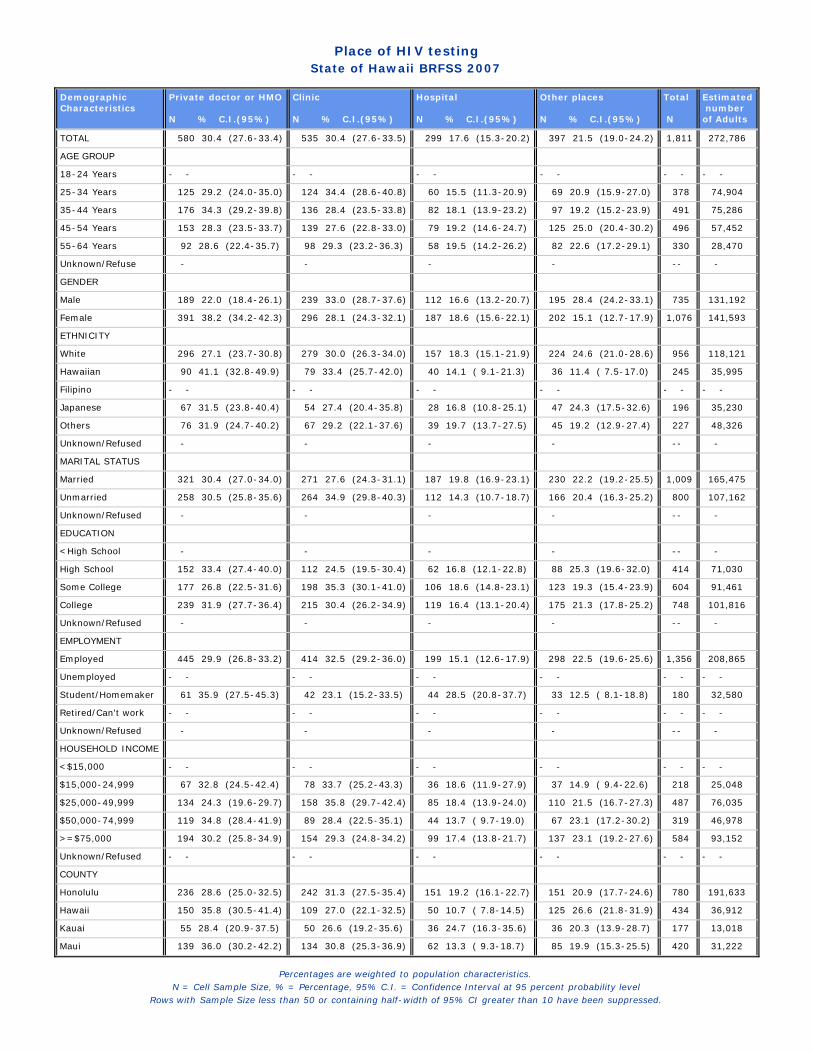
Place of HIV testingState of Hawaii BRFSS 2007
DemographicCharacteristics
Private doctor or HMO N % C.I.(95%)
Clinic N % C.I.(95%)
Hospital N % C.I.(95%)
Other places N % C.I.(95%)
Total N
Estimated numberof Adults
TOTAL 580 30.4 (27.6-33.4) 535 30.4 (27.6-33.5) 299 17.6 (15.3-20.2) 397 21.5 (19.0-24.2) 1,811 272,786
AGE GROUP
18-24 Years - - - - - - - - - - - -
25-34 Years 125 29.2 (24.0-35.0) 124 34.4 (28.6-40.8) 60 15.5 (11.3-20.9) 69 20.9 (15.9-27.0) 378 74,904
35-44 Years 176 34.3 (29.2-39.8) 136 28.4 (23.5-33.8) 82 18.1 (13.9-23.2) 97 19.2 (15.2-23.9) 491 75,286
45-54 Years 153 28.3 (23.5-33.7) 139 27.6 (22.8-33.0) 79 19.2 (14.6-24.7) 125 25.0 (20.4-30.2) 496 57,452
55-64 Years 92 28.6 (22.4-35.7) 98 29.3 (23.2-36.3) 58 19.5 (14.2-26.2) 82 22.6 (17.2-29.1) 330 28,470
Unknown/Refuse - - - - -- -
GENDER
Male 189 22.0 (18.4-26.1) 239 33.0 (28.7-37.6) 112 16.6 (13.2-20.7) 195 28.4 (24.2-33.1) 735 131,192
Female 391 38.2 (34.2-42.3) 296 28.1 (24.3-32.1) 187 18.6 (15.6-22.1) 202 15.1 (12.7-17.9) 1,076 141,593
ETHNICITY
White 296 27.1 (23.7-30.8) 279 30.0 (26.3-34.0) 157 18.3 (15.1-21.9) 224 24.6 (21.0-28.6) 956 118,121
Hawaiian 90 41.1 (32.8-49.9) 79 33.4 (25.7-42.0) 40 14.1 ( 9.1-21.3) 36 11.4 ( 7.5-17.0) 245 35,995
Filipino - - - - - - - - - - - -
Japanese 67 31.5 (23.8-40.4) 54 27.4 (20.4-35.8) 28 16.8 (10.8-25.1) 47 24.3 (17.5-32.6) 196 35,230
Others 76 31.9 (24.7-40.2) 67 29.2 (22.1-37.6) 39 19.7 (13.7-27.5) 45 19.2 (12.9-27.4) 227 48,326
Unknown/Refused - - - - -- -
MARITAL STATUS
Married 321 30.4 (27.0-34.0) 271 27.6 (24.3-31.1) 187 19.8 (16.9-23.1) 230 22.2 (19.2-25.5) 1,009 165,475
Unmarried 258 30.5 (25.8-35.6) 264 34.9 (29.8-40.3) 112 14.3 (10.7-18.7) 166 20.4 (16.3-25.2) 800 107,162
Unknown/Refused - - - - -- -
EDUCATION
<High School - - - - -- -
High School 152 33.4 (27.4-40.0) 112 24.5 (19.5-30.4) 62 16.8 (12.1-22.8) 88 25.3 (19.6-32.0) 414 71,030
Some College 177 26.8 (22.5-31.6) 198 35.3 (30.1-41.0) 106 18.6 (14.8-23.1) 123 19.3 (15.4-23.9) 604 91,461
College 239 31.9 (27.7-36.4) 215 30.4 (26.2-34.9) 119 16.4 (13.1-20.4) 175 21.3 (17.8-25.2) 748 101,816
Unknown/Refused - - - - -- -
EMPLOYMENT
Employed 445 29.9 (26.8-33.2) 414 32.5 (29.2-36.0) 199 15.1 (12.6-17.9) 298 22.5 (19.6-25.6) 1,356 208,865
Unemployed - - - - - - - - - - - -
Student/Homemaker 61 35.9 (27.5-45.3) 42 23.1 (15.2-33.5) 44 28.5 (20.8-37.7) 33 12.5 ( 8.1-18.8) 180 32,580
Retired/Can't work - - - - - - - - - - - -
Unknown/Refused - - - - -- -
HOUSEHOLD INCOME
<$15,000 - - - - - - - - - - - -
$15,000-24,999 67 32.8 (24.5-42.4) 78 33.7 (25.2-43.3) 36 18.6 (11.9-27.9) 37 14.9 ( 9.4-22.6) 218 25,048
$25,000-49,999 134 24.3 (19.6-29.7) 158 35.8 (29.7-42.4) 85 18.4 (13.9-24.0) 110 21.5 (16.7-27.3) 487 76,035
$50,000-74,999 119 34.8 (28.4-41.9) 89 28.4 (22.5-35.1) 44 13.7 ( 9.7-19.0) 67 23.1 (17.2-30.2) 319 46,978
>=$75,000 194 30.2 (25.8-34.9) 154 29.3 (24.8-34.2) 99 17.4 (13.8-21.7) 137 23.1 (19.2-27.6) 584 93,152
Unknown/Refused - - - - - - - - - - - -
COUNTY
Honolulu 236 28.6 (25.0-32.5) 242 31.3 (27.5-35.4) 151 19.2 (16.1-22.7) 151 20.9 (17.7-24.6) 780 191,633
Hawaii 150 35.8 (30.5-41.4) 109 27.0 (22.1-32.5) 50 10.7 ( 7.8-14.5) 125 26.6 (21.8-31.9) 434 36,912
Kauai 55 28.4 (20.9-37.5) 50 26.6 (19.2-35.6) 36 24.7 (16.3-35.6) 36 20.3 (13.9-28.7) 177 13,018
Maui 139 36.0 (30.2-42.2) 134 30.8 (25.3-36.9) 62 13.3 ( 9.3-18.7) 85 19.9 (15.3-25.5) 420 31,222
Percentages are weighted to population characteristics.N = Cell Sample Size, % = Percentage, 95% C.I. = Confidence Interval at 95 percent probability level
Rows with Sample Size less than 50 or containing half-width of 95% CI greater than 10 have been suppressed.