2007 FOOD CHEM. Caballero-Ortega Et Al
6
HPLC quantification of major active components from 11 different saffron (Crocus sativus L.) sources Heriberto Caballero-Ortega a , Rogelio Pereda-Miranda b , Fikrat I. Abdullaev a, * a Laboratorio de Oncologı ´a Experimental, Instituto Nacional de Pediatrı ´a, Avenida del Ima ´ n # 1, Torre de Investigacio ´n, 6° piso, 04530 DF, Mexico City, Mexico b Departamento de Farmacia, Facultad de Quı ´mica, Universidad Nacional Auto ´noma de Me ´xico, 04510 DF, Mexico City, Mexico Received 28 July 2005; received in revised form 17 November 2005; accepted 17 November 2005 Abstract Eleven certified saffron samples (Crocus sativus L.), one each from Azerbaijan, China, Greece, France, India, Iran, Italy, New Zea- land, Spain, Turkey and the Sigma Chemical Company, were analyzed by using an HPLC photodiode array detection method. This anal- ysis quantified the 10 major saffron compounds in each sample and their concentration was analyzed at three different wavelengths. Results indicated that the Greek, Indian, New Zealand, and Spanish saffron extracts possessed the highest concentrations of water-sol- uble glycosidic carotenoids (P8.0%) suggesting that they could be a good source of this type of metabolites for further biological evaluation. Ó 2005 Elsevier Ltd. All rights reserved. Keywords: Saffron; Crocus sativus L.; Quantitative analysis; HPLC; Glycosidic carotenoids; Crocins 1. Introduction Saffron is the dried stigmas of a flower scientifically identified as Crocus sativus L. Although the source of saf- fron is unknown, it apparently originated in the area of Iran, Turkey and Greece, but now it is also successfully cul- tivated in such European countries as Spain, Italy, France, and Switzerland, as well as in Morocco, Egypt, Israel, Azerbaijan, Pakistan, India, New Zealand, Australia and Japan. While the world’s total annual saffron production is estimated to be 190 tons, Iran produces about 90% of the total (Fernandez, 2004; Negbi, 1999; Xuabin, 1992). Since ancient times, saffron has been used as a medicinal plant and a culinary spice (Basker & Negbi, 1983; Rios, Recio, Giner, & Man ˜ ez, 1996; Zhou, Sun, & Zhang, 1978). The stigmas contain carbohydrates, minerals, vita- mins and such pigments as carotenes, and flavonoids (Abdullaev, 1993; Winterhalter & Straubinger, 2000). The bitter-taste is produced by the picrocrocin (C 16 H 26 O 7 ), a monoterpene glycoside precursor of safranal (C 10 H 14 O), the main volatile oil responsible for the aroma. b-Glucosi- dase action on picrocrocin liberates the aglycone, 4-hydroxy-2,6,6-trimethyl-1-cyclohexene-1-carboxaldehyde (HTCC, C 10 H 16 O 2 ; MW 168), which is then transformed to safranal by dehydration during the drying process of the plant material (Lozano, Delgado, Go ´ mez, Rubio, & Iborra, 2000; Sujata, Ravishankar, & Venkataraman, 1992). The colour of saffron comes from the water-soluble gly- cosidic cis- and trans-carotenoids crocins, glucosyl esters of crocetin (8,8 0 -diapocarotene-8,8 0 -dioic acid; C 20 H 24 O 4 ). For commercial purposes the quality of the colouring power of a saffron sample depends on the quantification of the crocin analogues by colorimetric (Li, Lin, Kwan, & Min, 1999) and chromatographic techniques, such as TLC, GC-MS, and HPLC (Zareena, Variyar, Gholap, & Bongirwar, 2001). 0308-8146/$ - see front matter Ó 2005 Elsevier Ltd. All rights reserved. doi:10.1016/j.foodchem.2005.11.020 * Corresponding author. Tel.: +52 55 10 84 09 00x1474; fax: +52 55 10 84 38 83. E-mail addresses: fi[email protected], fi[email protected] (F.I. Abdullaev). www.elsevier.com/locate/foodchem Food Chemistry 100 (2007) 1126–1131 Food Chemistry
description
2007 FOOD CHEM. Caballero-Ortega Et Al 2007 FOOD CHEM. Caballero-Ortega Et Al
Transcript of 2007 FOOD CHEM. Caballero-Ortega Et Al

www.elsevier.com/locate/foodchem
Food Chemistry 100 (2007) 1126–1131
FoodChemistry
HPLC quantification of major active components from 11different saffron (Crocus sativus L.) sources
Heriberto Caballero-Ortega a, Rogelio Pereda-Miranda b, Fikrat I. Abdullaev a,*
a Laboratorio de Oncologıa Experimental, Instituto Nacional de Pediatrıa, Avenida del Iman # 1, Torre de Investigacion, 6� piso, 04530
DF, Mexico City, Mexicob Departamento de Farmacia, Facultad de Quımica, Universidad Nacional Autonoma de Mexico, 04510 DF, Mexico City, Mexico
Received 28 July 2005; received in revised form 17 November 2005; accepted 17 November 2005
Abstract
Eleven certified saffron samples (Crocus sativus L.), one each from Azerbaijan, China, Greece, France, India, Iran, Italy, New Zea-land, Spain, Turkey and the Sigma Chemical Company, were analyzed by using an HPLC photodiode array detection method. This anal-ysis quantified the 10 major saffron compounds in each sample and their concentration was analyzed at three different wavelengths.Results indicated that the Greek, Indian, New Zealand, and Spanish saffron extracts possessed the highest concentrations of water-sol-uble glycosidic carotenoids (P8.0%) suggesting that they could be a good source of this type of metabolites for further biologicalevaluation.� 2005 Elsevier Ltd. All rights reserved.
Keywords: Saffron; Crocus sativus L.; Quantitative analysis; HPLC; Glycosidic carotenoids; Crocins
1. Introduction
Saffron is the dried stigmas of a flower scientificallyidentified as Crocus sativus L. Although the source of saf-fron is unknown, it apparently originated in the area ofIran, Turkey and Greece, but now it is also successfully cul-tivated in such European countries as Spain, Italy, France,and Switzerland, as well as in Morocco, Egypt, Israel,Azerbaijan, Pakistan, India, New Zealand, Australia andJapan. While the world’s total annual saffron productionis estimated to be 190 tons, Iran produces about 90% ofthe total (Fernandez, 2004; Negbi, 1999; Xuabin, 1992).
Since ancient times, saffron has been used as a medicinalplant and a culinary spice (Basker & Negbi, 1983; Rios,Recio, Giner, & Manez, 1996; Zhou, Sun, & Zhang,1978). The stigmas contain carbohydrates, minerals, vita-
0308-8146/$ - see front matter � 2005 Elsevier Ltd. All rights reserved.
doi:10.1016/j.foodchem.2005.11.020
* Corresponding author. Tel.: +52 55 10 84 09 00x1474; fax: +52 55 1084 38 83.
E-mail addresses: [email protected], [email protected] (F.I.Abdullaev).
mins and such pigments as carotenes, and flavonoids(Abdullaev, 1993; Winterhalter & Straubinger, 2000). Thebitter-taste is produced by the picrocrocin (C16H26O7), amonoterpene glycoside precursor of safranal (C10H14O),the main volatile oil responsible for the aroma. b-Glucosi-dase action on picrocrocin liberates the aglycone,4-hydroxy-2,6,6-trimethyl-1-cyclohexene-1-carboxaldehyde(HTCC, C10H16O2; MW 168), which is then transformed tosafranal by dehydration during the drying process of theplant material (Lozano, Delgado, Gomez, Rubio, &Iborra, 2000; Sujata, Ravishankar, & Venkataraman,1992).
The colour of saffron comes from the water-soluble gly-cosidic cis- and trans-carotenoids crocins, glucosyl esters ofcrocetin (8,8 0-diapocarotene-8,8 0-dioic acid; C20H24O4).For commercial purposes the quality of the colouringpower of a saffron sample depends on the quantificationof the crocin analogues by colorimetric (Li, Lin, Kwan,& Min, 1999) and chromatographic techniques, such asTLC, GC-MS, and HPLC (Zareena, Variyar, Gholap, &Bongirwar, 2001).

H. Caballero-Ortega et al. / Food Chemistry 100 (2007) 1126–1131 1127
Several methodologies have been described using dif-ferent analytical tools to establish purification protocolsfor the bioactive constituents of saffron, i.e. picrocrocin,safranal and crocins (Castellar, Montijano, Manjon, &Iborra, 1993; Iborra, Castellar, Canovas, & Manjon,1992; Sujata et al., 1992; Tarantilis, Polissiou, & Man-fait, 1994; Tarantilis, Tsoupras, & Polissiou, 1995). Thechemical composition of saffron samples from Spain(Iborra et al., 1992; Lozano, Castellar, Simancas, &Iborra, 1999; Lozano et al., 2000), Greece (Kanakis,Daferera, Tarantilis, & Polissiou, 2004; Tarantilis et al.,1994; Tarantilis & Polissiou, 1997; Tarantilis et al.,1995), China (Li & Wu, 2002; Li et al., 1999), India (Suj-ata et al., 1992; Zareena et al., 2001), Germany (typeElectus pulvis) (Straubinger, Bau, Eckstein, Fink, & Win-terhalter, 1998; Straubinger, Jezussek, Waibel, & Winter-halter, 1997), and Iran (Bolhasani, Bathaie, Yavari,Moosavi-Movahedi, & Ghaffari, 2005) indicated thatthe estimated amounts of constituents strongly dependedon the methods employed for drying, extraction, separa-tion and quantification.
There are however, no reports analysing and compar-ing the chemical composition of four or more saffronsamples originating from different locations (Li et al.,1999; Lozano et al., 1999; Zalacaın, Dıaz-Plaza, Blaz-quez, Carmona, & Alonso, 2004). Therefore, the aim ofthe present investigation was to develop an HPLC ana-lytical protocol useful for the identification and quantifi-cation of the major components in 11 commercialsamples of saffron from different countries for qualitycontrol comparison. Up-scaling the same protocol per-mits preparative level isolation of the major compoundsfor biological activity investigation.
2. Materials and methods
2.1. Plant materials and chemicals
Certified dried saffron stigma samples were obtainedfrom plants harvested in 2003 from each of the followingcountries: Azerbaijan (Belgya, Apsheron), China (Tibetansaffron), France (Poitou), Greece (Krokos Kozanis), India(Baby Brand), Iran (Abbaszadeh, Reg. No. 70070), Italy(Cooperativa Altopiano di Navelli), New Zealand (EightMoon Saffron, Rangiora), Spain (La Mancha) and Turkey(No brand name). All samples were directly provided bylocal expert saffron growers in order to avoid any adultera-tion with foreign plant material. In addition, a commercialsample was purchased from Sigma (Product S8381, Sigma–Aldrich Corp., St. Louis, MO, USA). The material wasstored in our laboratory in the dark at 4 �C until processed.2-Nitroaniline (Sigma) was used as the internal standardfor HPLC analysis. Methanol and acetonitrile were ofHPLC grade (Merck KGaA, Darmstadt, Germany). Waterwas distilled, deionized and further purified through anultrafiltration system (Easypure RF, Barnstead Thermo-lyne, Dubuque, IA, USA).
2.2. Extraction
Saffron stigmas (50 mg) were suspended in 10 ml ofmethanol–water (50:50, v/v) and magnetically stirred dur-ing 24 h at 4 �C in the dark. After extraction, samples werecentrifuged at 30,000g for 20 min to eliminate plant residuesand then the supernatant was collected and filtered througha nylon membrane (Acrodisc 13, 0.45 lm pore size · 13 mmdiameter, Waters, Milford, MA, USA) (Lozano et al.,1999). Before quantitative chromatographic analysis, 1 mlof 2-nitroaniline (0.5 mg/ml) was added as an internal stan-dard to 1 ml of each tested sample (Caballero-Ortega et al.,2004). For preparative HPLC, 20 mg of the Greek samplewere pulverized and suspended in 1 ml of methanol–water(50:50, v/v) and extracted as described above.
2.3. HPLC equipment
HPLC analysis was performed on a multisolvent deliverysystem (Waters, Milford, MA, USA) equipped with a pump(Model 600E), a multiple UV wavelength photo-diodearray detector (Model 996), linked to a computer system(Optiflex GX280, Dell Computer Corp.). Empower Software2002 (Waters) was used for equipment control, data acqui-sition, and processing of the chromatographic information.
2.4. Quantitative determination
A Spherisorb RP C18 column (Waters, Milford, MA,USA, 25 cm length, 4.6 mm internal diameter, 10 lm parti-cle size with a pore diameter of 80 A) was used for all anal-yses. A linear gradient of methanol (10–100%) in water(15% of acetonitrile) was used as a mobile phase with aflow-rate of 1.0 ml/min for a maximum elution time of60 min at room temperature. The sample size was 50 llof the test solution (Abdullaev et al., 2002). The analyseswere triplicated for each sample. Picrocrocin, HTCC andkaempferol were detected at 250 nm, safranal at 310 nmand all crocins at 440 nm, whereas the internal standardwas detected at the above three mentioned wavelengths(Lozano et al., 1999). For the internal standard, a calibra-tion curve was prepared using final concentrations of 0.015,0.031, 0.062, 0.125, 0.25, 0.5, and 1.0 mg/ml in triplicate(Lindsay, 1992). Quantitative determinations were madetaking into account the molecular coefficient absorbanceof each peak obtained at the wavelength of maximumabsorbance of the respective ingredient as previouslyreported (Lozano et al., 1999) and they are expressed inmilligrams per gram of saffron stigmas. The R2 range wasfrom 0.9833 to 0.9990 and the slope R.S.D. values betweeninjected samples were lower than 5%.
2.5. Preparative analysis and spectrometric identification of
pure compounds
A Spherisorb RP C18 column (Waters, 25 cm length,20 mm internal diameter, 10 lm particle size with a pore

Fig. 1. HPLC fingerprint chromatograms of saffron samples from Greece(cultivated sample) [A], Sigma Product S8381 [B], and China (non-cultivated sample) [C], recorded at three wavelengths. A Waters Spher-isorb C18 column, a linear gradient of methanol (10–100%) in water (15%of acetonitrile), and a flow rate of 1.0 ml/min were used for quantitativedeterminations. Saffron components: picrocrocin (peak 1); HTCC (peak2); 3-gentiobiosyl-kaempferol (peak 3); trans-crocin 4 (peak 4); trans-crocin 3 (peak 5); trans-crocin 2 0 (peak 6); safranal (peak 7); cis-crocin 4(peak 8); trans-crocin 2 (peak 9); cis-crocin 2 (peak 10). IS: internalstandard, 2-nitroaniline.
1128 H. Caballero-Ortega et al. / Food Chemistry 100 (2007) 1126–1131
diameter of 80 A) was used for this analysis. The above-men-tioned linear gradient was used with a flow-rate of 10 ml/minduring an elution time of 60 min. The amount of sampleinjected was 500 ll of the test solution. Eluates across thepeaks with tR of 8.3 (picrocrocin), 16.0 (HTCC), 17.8 (3-gen-tiobiosyl-kaempferol), 25.4 (trans-crocin 4), 28.7 (trans-cro-cin 3), 31.9 (trans-crocin 2 0), 35.0 (cis-crocin 4), 35.9(safranal), 38.1 (trans-crocin 2), and 44.4 (cis-crocin 2) werecollected by the technique of heart cutting (Hostettmann,Marston, & Hostettmann, 1998). Each collected peak wasrapidly evaporated under vacuum using a centrifugal solventevaporator system (CentriVap, Labconco, MO, USA) andfurther submitted to low resolution fast atom bombardmentmass spectrometry (LRFAB-MS) analysis. Positive-ionLRFAB-MS was registered using a glycerol matrix on aSX102A spectrometer (JEOL, Tokyo, Japan). Xenon wasused as collision gas. The accelerating voltage was 10 keV,and the resolving power was 3000. Mass spectra were deter-mined in duplicate and the pseudomolecular ion [M + Na]+
was detected for each peak. The observed fragmentation pat-tern was used for crocin identification by comparison withpreviously reported spectra (Carmona et al., 2005).
3. Results and discussion
3.1. Qualitative analysis
The chemical composition of saffron samples from 11different sources was determined using reverse phase C18
HPLC. The chromatographic conditions employed allowedidentification of 10 major components in each sample and awell-resolved baseline separation was obtained. Each com-ponent was identified by comparison of its retention timeas previously described in the literature (Li et al., 1999;Lozano et al., 1999; Tarantilis et al., 1995) as well as byLRFAB-MS analysis through the detection (m/z) of its cor-responding pseudomolecular ion (M + H)+ (Carmonaet al., 2005; Tarantilis et al., 1995). Fig. 1 shows three rep-resentative chromatograms, one with the highest concen-tration of analysed glycosidic carotenoids (1A), thesecond as an example for the Sigma product (1B) and athird one showing the profile for the Tibetan sample(1C). The peak identification is as follows: number 1, 2and 3 detected at 250 nm were picrocrocin, HTCC and 3-gentiobiosyl-kaempferol, respectively; peak number 7(310 nm) was safranal and peak numbers 4 to 6, and 8 to10 (440 nm) were trans-crocin 4, trans-crocin 3, trans-crocin 2 0, cis-crocin 4, tran-crocin 2, and cis-crocin 2,respectively. According to our analysis different saffronsamples did not differ in their chemical composition, butdid differ in the concentration of each component.
3.2. Quantitative analysis
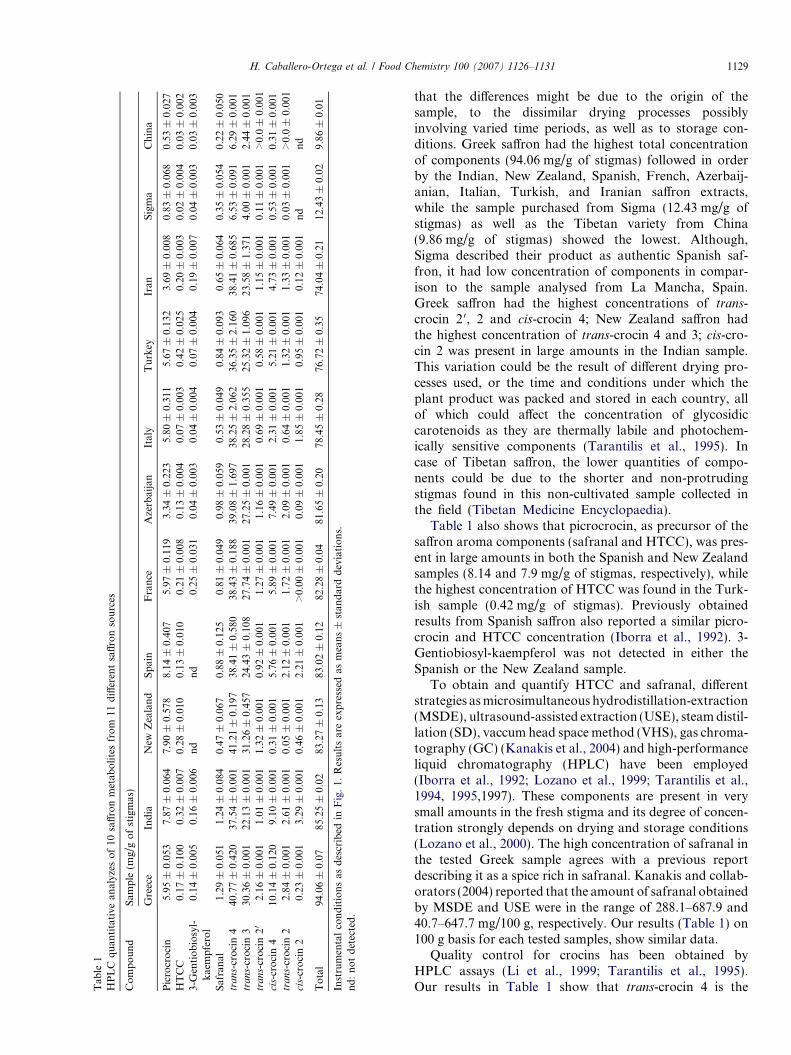
Table 1 shows the concentration of each detectedcompound in the 11 tested samples. The results indicate
Tab
le1
HP
LC
qu
anti
tati
vean
alyz
eso
f10
saff
ron
met
abo
lite
sfr
om
11d
iffer
ent
saff
ron
sou
rces
Co
mp
ou
nd
Sam
ple
(mg/
go
fst
igm
as)
Gre
ece
Ind
iaN
ewZ
eala
nd
Sp
ain
Fra
nce
Aze
rbai
jan
Ital
yT
urk
eyIr
anS
igm
aC
hin
a
Pic
rocr
oci
n5.
95±
0.05
37.
87±
0.06
47.
90±
0.57
88.
14±
0.40
75.
97±
0.11
93.
34±
0.22
35.
80±
0.31
15.
67±
0.13
23.
69±
0.00
80.
83±
0.06
80.
53±
0.02
7H
TC
C0.
17±
0.10
00.
32±
0.00
70.
28±
0.01
00.
13±
0.01
00.
21±
0.00
80.
13±
0.00
40.
07±
0.00
30.
42±
0.02
50.
20±
0.00
30.
02±
0.00
40.
03±
0.00
23-
Gen
tio
bio
syl-
kae
mp
fero
l0.
14±
0.00
50.
16±
0.00
6n
dn
d0.
25±
0.03
10.
04±
0.00
30.
04±
0.00
40.
07±
0.00
40.
19±
0.00
70.
04±
0.00
30.
03±
0.00
3
Saf
ran
al1.
29±
0.05
11.
24±
0.08
40.
47±
0.06
70.
88±
0.12
50.
81±
0.04
90.
98±
0.05
90.
53±
0.04
90.
84±
0.09
30.
65±
0.06
40.
35±
0.05
40.
22±
0.05
0tr
an
s-cr
oci
n4
40.7
7±
0.42
037
.54
±0.
001
41.2
1±
0.19
738
.41
±0.
580
38.4
3±
0.18
839
.08
±1.
697
38.2
5±
2.06
236
.35
±2.
160
38.4
1±
0.68
56.
53±
0.09
16.
29±
0.00
1tr
an
s-cr
oci
n3
30.3
6±
0.00
122
.13
±0.
001
31.2
6±
0.45
724
.43
±0.
108
27.7
4±
0.00
127
.25
±0.
001
28.2
8±
0.35
525
.32
±1.
096
23.5
8±
1.37
14.
00±
0.00
12.
44±
0.00
1tr
an
s-cr
oci
n20
2.16
±0.
001
1.01
±0.
001
1.32
±0.
001
0.92
±0.
001
1.27
±0.
001
1.16
±0.
001
0.69
±0.
001
0.58
±0.
001
1.15
±0.
001
0.11
±0.
001
>0.
0±
0.00
1ci
s-cr
oci
n4
10.1
4±
0.12
09.
10±
0.00
10.
31±
0.00
15.
76±
0.00
15.
89±
0.00
17.
49±
0.00
12.
31±
0.00
15.
21±
0.00
14.
73±
0.00
10.
53±
0.00
10.
31±
0.00
1tr
an
s-cr
oci
n2
2.84
±0.
001
2.61
±0.
001
0.05
±0.
001
2.12
±0.
001
1.72
±0.
001
2.09
±0.
001
0.64
±0.
001
1.32
±0.
001
1.33
±0.
001
0.03
±0.
001
>0.
0±
0.00
1ci
s-cr
oci
n2
0.23
±0.
001
3.29
±0.
001
0.46
±0.
001
2.21
±0.
001
>0.
00±
0.00
10.
09±
0.00
11.
85±
0.00
10.
95±
0.00
10.
12±
0.00
1n
dn
d
To
tal
94.0
6±
0.07
85.2
5±
0.02
83.2
7±
0.13
83.0
2±
0.12
82.2
8±
0.04
81.6
5±
0.20
78.4
5±
0.28
76.7
2±
0.35
74.0
4±
0.21
12.4
3±
0.02
9.86
±0.
01
Inst
rum
enta
lco
nd
itio
ns
asd
escr
ibed
inF
ig.
1.R
esu
lts
are
exp
ress
edas
mea
ns
±st
and
ard
dev
iati
on
s.n
d:
no
td
etec
ted
.
H. Caballero-Ortega et al. / Food Chemistry 100 (2007) 1126–1131 1129
that the differences might be due to the origin of thesample, to the dissimilar drying processes possiblyinvolving varied time periods, as well as to storage con-ditions. Greek saffron had the highest total concentrationof components (94.06 mg/g of stigmas) followed in orderby the Indian, New Zealand, Spanish, French, Azerbaij-anian, Italian, Turkish, and Iranian saffron extracts,while the sample purchased from Sigma (12.43 mg/g ofstigmas) as well as the Tibetan variety from China(9.86 mg/g of stigmas) showed the lowest. Although,Sigma described their product as authentic Spanish saf-fron, it had low concentration of components in compar-ison to the sample analysed from La Mancha, Spain.Greek saffron had the highest concentrations of trans-crocin 2 0, 2 and cis-crocin 4; New Zealand saffron hadthe highest concentration of trans-crocin 4 and 3; cis-cro-cin 2 was present in large amounts in the Indian sample.This variation could be the result of different drying pro-cesses used, or the time and conditions under which theplant product was packed and stored in each country, allof which could affect the concentration of glycosidiccarotenoids as they are thermally labile and photochem-ically sensitive components (Tarantilis et al., 1995). Incase of Tibetan saffron, the lower quantities of compo-nents could be due to the shorter and non-protrudingstigmas found in this non-cultivated sample collected inthe field (Tibetan Medicine Encyclopaedia).
Table 1 also shows that picrocrocin, as precursor of thesaffron aroma components (safranal and HTCC), was pres-ent in large amounts in both the Spanish and New Zealandsamples (8.14 and 7.9 mg/g of stigmas, respectively), whilethe highest concentration of HTCC was found in the Turk-ish sample (0.42 mg/g of stigmas). Previously obtainedresults from Spanish saffron also reported a similar picro-crocin and HTCC concentration (Iborra et al., 1992). 3-Gentiobiosyl-kaempferol was not detected in either theSpanish or the New Zealand sample.
To obtain and quantify HTCC and safranal, differentstrategies as microsimultaneous hydrodistillation-extraction(MSDE), ultrasound-assisted extraction (USE), steam distil-lation (SD), vaccum head space method (VHS), gas chroma-tography (GC) (Kanakis et al., 2004) and high-performanceliquid chromatography (HPLC) have been employed(Iborra et al., 1992; Lozano et al., 1999; Tarantilis et al.,1994, 1995,1997). These components are present in verysmall amounts in the fresh stigma and its degree of concen-tration strongly depends on drying and storage conditions(Lozano et al., 2000). The high concentration of safranal inthe tested Greek sample agrees with a previous reportdescribing it as a spice rich in safranal. Kanakis and collab-orators (2004) reported that the amount of safranal obtainedby MSDE and USE were in the range of 288.1–687.9 and40.7–647.7 mg/100 g, respectively. Our results (Table 1) on100 g basis for each tested samples, show similar data.
Quality control for crocins has been obtained byHPLC assays (Li et al., 1999; Tarantilis et al., 1995).Our results in Table 1 show that trans-crocin 4 is the

1130 H. Caballero-Ortega et al. / Food Chemistry 100 (2007) 1126–1131
most abundant ingredient in all saffron samples followedby trans-crocin 3 and cis-crocin 4, although present in allof the cultivated samples, trans-crocin 2, 2 0, and cis-cro-cin 2 were produced in lower concentrations. Crocins, asother carotenoids, are stable only in their natural formand are subject to considerable degradation when iso-lated (Tarantilis et al., 1994), perhaps explaining the dif-ferent component ratios found in the tested samples. It isevident that a relationship between the country of originand the composition based only on our results is notpossible since environmental, genetic (e.g. varieties) andcultivation practices affect the chemical composition ofsaffron. Investigations demonstrated that crocins inhibitdifferent types of tumor cell growth (Abdullaev, 2002;Abdullaev et al., 2002, 2003, 2004), which could suggestthat saffron with high carotenoid concentration may be asource for antitumor agents. New biotechnological tech-niques and approaches should be used to produce highquality saffron in large quantities at reduced productioncost. Finally, the simple and specific HPLC methodwhich this study developed can be used for the qualitycontrol that allows for quantification of the major bio-logically active glycosidic carotenoids in different saffronsamples.
Acknowledgements
We are grateful to Hasan Kuliev (Azerbaijan), Suk YiCheung (China), J.M. Thiercelin (France), Maria Tsimidou(Greece), Farkhad Saharkhiz (Iran), Manohar Singh (In-dia), Daniele Naviglio (Italy), Errol Hitt (New Zealand),Hasan Vurdu (Turkey) and Antonio Garcia (Spain) forproviding the analysed saffron samples. Thanks are dueto Mabel Fragoso-Serrano (Facultad de Quımica, UNAM)for HPLC technical assistance. This work was partiallysupported by ‘‘Consejo Nacional de Ciencia y Tecnologıa’’(Project 28513-N).
References
Abdullaev, F. I. (1993). Biological effects of saffron. BioFactors, 4, 83–86.Abdullaev, F. I. (2002). Cancer chemopreventive and tumoricidal prop-
erties of saffron (Crocus sativus L.). Experimental Biology and
Medicine, 227, 20–25.Abdullaev, F. I., Caballero-Ortega, H., Riveron-Negrete, L., Pereda-
Miranda, R., Rivera-Luna, R., Hernandez, J. M., et al. (2002).Evaluacion in vitro del potencial quimiopreventivo del azafran. Revista
de Investigacion Clınica, 54, 430–436.Abdullaev, F. I., & Espinosa-Aguirre, J. J. (2004). Biomedical properties
of saffron and its potential use in cancer therapy and chemopreventiontrials. Cancer Detection and Prevention, 28, 426–432.
Abdullaev, F. I., Riveron-Negrete, L., Caballero-Ortega, H., Hernandez,J. M., Perez-Lopez, I., Pereda-Miranda, R., et al. (2003). Use ofin vitro assays to assess the potencial antigenotoxic and cytotoxiceffects of saffron (Crocus sativus L.). Toxicology In Vitro, 17, 731–736.
Basker, D., & Negbi, M. (1983). The use of saffron. Economic Botany, 37,228–236.
Bolhasani, A., Bathaie, S. Z., Yavari, I., Moosavi-Movahedi, A. A., &Ghaffari, M. (2005). Separation and purification of some components.Asian Journal of Chemistry, 17, 725–729.
Caballero-Ortega, H., Pereda-Miranda, R., Riveron-Negrete, L., Hernan-dez, J. M., Medecigo-Rıos, M., Castillo-Villanueva, A., et al. (2004).Chemical composition of saffron (Crocus sativus L.) from fourcountries. In J. A. Fernandez & F. I. Abdullaev (Eds.), Proceedings
of the first international symposium on saffron biology and biotechnol-
ogy. Acta Horticulturae (Vol. 650, pp. 321–326). Leuven, Spain:International Society for Horticultural Science.
Carmona, M., Zalacain, A., Pardo, J. E., Lopez, E., Alvarruiz, A., &Alonso, G. L. (2005). Influence of different drying and agingconditions on saffron constituents. Journal of Agricultural and Food
Chemistry, 53, 3974–3979.Castellar, M. R., Montijano, H., Manjon, A., & Iborra, J. L. (1993).
Preparative high-performance liquid chromatography purification ofsaffron secondary metabolites. Journal of Chromatography, 648,187–190.
Fernandez, J. A. (2004). Biology, biotechnology and biomedicine ofsaffron. Recent Research of Development in Plant Science, 2, 127–159.
Hostettmann, K., Marston, A., & Hostettmann, M. (1998). Preparativechromatography techniques. In Applications in natural products isola-
tion (pp. 67–69). Berlin: Springer-Verlag.Iborra, J. L., Castellar, M. R., Canovas, M., & Manjon, A. (1992). TLC
preparative purification of picrocrocin, HTCC and crocin fromsaffron. Journal of Food Science, 57, 714–716.
Kanakis, C. D., Daferera, D. J., Tarantilis, P. A., & Polissiou, M. G.(2004). Qualitative determination of volatile compounds and quanti-tative evaluation of safranal and 4-hydroxy-2,6,6-thimethyl-1-cyclo-hexene-1-carboxaldehyde (HTCC) in Greek saffron. Journal of
Agricultural and Food Chemistry, 52, 4515–4521.Li, C. Y., & Wu, T. S. (2002). Constituents of the stigmas of Crocus sativus
and their tyrosinase inhibitory activity. Journal of Natural Products,
65, 1452–1456.Li, N., Lin, G., Kwan, Y. W., & Min, Z. D. (1999). Simultaneous
quantification of five major biologically active ingredients of saffron byhigh-performance liquid chromatography. Journal of Chromatography
A, 849, 349–355.Lindsay, S. (1992). High-performance liquid chromatography. In J. Wiley
(Ed.), ACOL series, 2nd ed. (pp. 229–250). Chichester: John Wiley &Sons.
Lozano, P., Castellar, M. J., Simancas, M. J., & Iborra, J. L. (1999).Quantitative high-performance liquid chromatography method toanalyze commercial saffron (Crocus sativus L.) products. Journal of
Chromatography A, 830, 477–483.Lozano, P., Delgado, D., Gomez, D., Rubio, M., & Iborra, J. L.
(2000). A non-destructive method to determine the safranal contentof saffron (Crocus sativus L.) by supercritical carbon dioxideextraction combined with high-performance liquid chromatographyand gas chromatography. Journal of Biochemical and Biophysical
Methods, 43, 367–378.Negbi, M. (1999). Saffron cultivation: Past, present and future prospects.
In M. Negbi (Ed.), Saffron Crocus sativus L. (pp. 1–17). Amsterdam:Harwood Academic Publishers.
Rios, J. L., Recio, M. C., Giner, R. M., & Manez, S. (1996). An updatereview of saffron and its active compounds. Phytotherapy Research, 10,189–193.
Straubinger, M., Bau, B., Eckstein, S., Fink, M., & Winterhalter, P.(1998). Identification of novel glycosidic aroma precursors in saffron(Crocus sativus L.). Journal of Agricultural and Food Chemistry, 46,3238–3243.
Straubinger, M., Jezussek, M., Waibel, R., & Winterhalter, P. (1997).Novel glucosidic constituents from saffron. Journal of Agricultural and
Food Chemistry, 45, 1678–1681.Sujata, V., Ravishankar, G. A., & Venkataraman, L. V. (1992). Methods
for the analysis of the saffron metabolites crocin, crocetin, picrocrocinand safranal for the determination of the quality of spice using thin-layer chromatography, HPLC and GC. Journal of Chromatography A,
624, 497–502.Tarantilis, P. A., Polissiou, M., & Manfait, M. (1994). Separation of
picrocrocin, cis–trans-crocins and safranal of saffron using high-
H. Caballero-Ortega et al. / Food Chemistry 100 (2007) 1126–1131 1131
performance liquid chromatography with photodiode-array detection.Journal of Chromatography A, 664, 55–61.
Tarantilis, P. A., & Polissiou, M. G. (1997). Isolation and identification ofthe aroma components from saffron (Crocus sativus L.). Journal of
Agricultural and Food Chemistry, 45, 459–462.Tarantilis, P. A., Tsoupras, G., & Polissiou, M. (1995). Determination
of saffron (Crocus sativus L.) components in crude plant extractusing high-performance liquid chromatography–UV–Vis photodiode-array detection-mass spectrometry. Journal of Chromatography A,
699, 107–118.Tibetan Medicine Encyclopaedia. www.doctorgarma.com/rst/crocus_sat-
ivus/.Winterhalter, P., & Straubinger, M. (2000). Saffron-renewed interest in an
ancient spice. Food Reviews International, 16, 39–59.
Xuabin, N. (1992). Research progresses on the saffron crocus (Crocus
sativus). Zhongcaoyao, 23, 100–107.Zalacaın, A., Dıaz-Plaza, E.M., Blazquez, I., Carmona, M., Alonso, G.L.
FT-NIR spectrometry approach for determining saffron origin. InFernandez, J.A. & Abdullaev F.I. (Eds.), Proceedings of the first
international symposium on saffron biology and biotechnology (pp. 327–329). Acta Horticulturae: Vol. 650. Leuven, Spain: Internationalsociety for horticultural science.
Zareena, A. V., Variyar, P. S., Gholap, A. S., & Bongirwar, D. R.(2001). Chemical investigation of gamma-irradiated saffron (Crocus
sativus L.). Journal of Agricultural and Food Chemistry, 49,687–691.
Zhou, Q., Sun, Y., & Zhang, X. (1978). Saffron, Crocus sativus L.. Journal
of the Tradition Chinese Medicine, 28, 59–61.