
2007 Field day book final2 - Ohio State University · Luke Case Research Associate Dept. of...
78
-
Upload
phungkhuong -
Category
Documents
-
view
213 -
download
0
Transcript of 2007 Field day book final2 - Ohio State University · Luke Case Research Associate Dept. of...

i
ii
Disclaimer
This publication reports pesticide use in research trials and these uses may not conform to the pesticide label. These reported uses are not provided as recommendations. It is always the responsibility of the pesticide applicator, by law, to follow current label directions for the specific pesticide being used. No endorsement is intended for products mentioned, nor is lack of endorsement meant for products not mentioned. The authors and The Ohio State University assume no liability resulting from the use of pesticide applications detailed in this report.

iii
Table of Contents Table of Contents .......................................................................................................................... i 2007 Turfgrass, Nursery, and Landscape Personnel .................................................................... ii Turfgrass Research Support – 2007 ............................................................................................ vi Turfgrass Research Acknowledgement .................................................................................... viii
Impact of Double Cutting and Primo MAXX® on Green Speed and Turf Quality ......................1
Comparison of the F355 and Clegg Impact Testers in Measuring the Hardness of Synthetic Turfgrass Systems..........................................................................................................2
Influence of Carpet, Shock Pad, Infill and Wear on the Hardness of a Synthetic Turfgrass System ...........................................................................................................................4
Surface Temperatures of Synthetic Turf........................................................................................6
The effects of various sources of Nitrogen and Trinexepac-ethyl on creeping bentgrass Agrostis palustris grown in three different light conditions ..........................................7
The Effect of Nitrogen Fertilizer Application Timing on Plant Available Phosphorus ................9
The Effect of Trinexapac-ethyl and MegAlex on Three Shaded Turfgrass Species ..................11
Controlling Weeds in Turfgrass Established from Seed..............................................................12
MegAlex Broadleaf Weed Control Study....................................................................................13
Fungicides Evaluation for the Control of Dollar Spot in Creeping Bentgrass – 2006 ................14
Fungicides Evaluated for the Control of Brown Patch in Creeping Bentgrass - 2006 ................16
Summary of Turfgrass Insect Control Studies – 2007.................................................................18
Overseeding Mixtures for Heavily Trafficked Native Soil Athletic Fields.................................20
Trinexapac-ethyl & Wear Tolerance ...........................................................................................23
The Effects of Zeba Coating & Fungicide Treatments on Perennial Ryegrass Seed Germination & Establishment......................................................................................................25
Low Input Sustainable Turfgrass Trial: A Regional Cooperative Research Project ..................27
Bermudagrass Fall Color Retention and Spring Green-up as Affected by Topdressing and Covers...............................................................................................................29
Mesotrione for Control of Nimblewill 2005 - 2006.....................................................................32
Nitrogen Source, Rate, Timing/Fungicide Study - 2006 .............................................................34
Poa trivialis Control in Creeping Bentgrass with Certainty Herbicide .......................................41
Poa trivialis Control in Kentucky Bluegrass with Certainty Herbicide – 2006 ..........................44
Tall Fescue Control in Kentucky Bluegrass with Certainty Herbicide – 2006............................46
Mesotrione for Control of Creeping Bentgrass in Kentucky Bluegrass ......................................51
Influence of Nitrogen Source / Rate and PGR Combinations on Creeping Bentgrass Color and Dollar Spot Incidence and Severity ............................................................................54
Tree Liner Study in Waterman Field ...........................................................................................59
Evaluation of the Influence of Postemergent Herbicides and Fertility in Nursery Tree Bark Cracking........................................................................................................60
Field Evaluation of Various Herbicide Formulations Combined with Mulches .........................62
Turfgrass Sample Form

iv
2007 OSU Turfgrass Personnel
Alejandra Acuna Graduate Student Dept. of Horticulture and Crop Science Alfred Alumai Graduate Student Dept. of Entomology Ruisheng An Graduate Student Dept. of Entomology Jennifer Andon Graduate Student Dept. of Entomology Evan Binkley Student Research Assistant Dept. of Horticulture and Crop Science Michael Boehm Professor and Chair Dept. of Plant Pathology Tanner Boes Student Research Assistant Dept. of Horticulture and Crop Science Shabeg Briar Graduate Research Assistant Dept. of Entomology Matt Celik Student Research Assistant Dept. of Horticulture and Crop Science Zhiqiang Cheng Graduate Student Dept. of Entomology Karl Danneberger Professor Dept. of Horticulture and Crop Science
Marc Danneberger Student Research Assistant Dept. of Horticulture and Crop Science Elizabeth DeNardo Post Doctoral Researcher Dept. of Entomology Dan Digman Graduate Research Assistant Dept. of Entomology Arly Drake Student Research Assistant Dept. of Horticulture and Crop Science David Gardner Associate Professor Dept. of Horticulture and Crop Science Parwinder Grewal Professor Dept. of Entomology Todd Hicks Research Assistant Dept. of Plant Pathology Deborah Holdren Research Associate Dept. of Horticulture and Crop Science Emily Horner Graduate Student Dept. of Horticulture and Crop Science Ganpati Jagdale Post Doctoral Researcher Dept. of Entomology Peter Koumas Student Research Assistant Dept. of Horticulture and Crop Science

v
John Koenig Student Research Assistant Dept. of Plant Pathology Charles Mancino Research Associate Dept. of Horticulture and Crop Science Ainhoa Martinez Medina Visiting Ph.D. Student Dept. of Plant Pathology Universidad de Murcia Murcia, Spain Edward McCoy Associate Professor School of Natural Resources Ryan Morrison Student Research Assistant Dept. of Horticulture and Crop Science Ed Nangle Graduate Student Dept. of Horticulture and Crop Science Gretchen Nicol Master Gardener Volunteer Dept. of Horticulture and Crop Science Harry Niemczyk Professor Emeritus Dept. of Entomology Viviana Barrera Perez Visiting Student Dept. of Plant Pathology Pontificia Universidad Catolica de Chile Santiago, Chile Kevin Power Research Associate Dept. of Entomology
William Remmele Student Research Assistant Dept. of Horticulture and Crop Science Joseph Rimelspach Program Specialist Dept. of Plant Pathology Jeff Ritzert Student Research Assistant Dept. of Horticulture and Crop Science Amr Tag El-din Saeb Graduate Student Dept. of Plant Pathology Seppo Salminen Post Doctoral Researcher Dept. of Entomology Sukhinder K. Sandhu Graduate Student Dept. of Entomology Pamela Sherratt Extension Specialist Dept. of Horticulture and Crop Science David Shetlar Associate Professor Dept. of Entomology Mamta Singh Graduate Student Dept. of Entomology John Street Associate Professor Dept. of Horticulture and Crop Science

vi
Aneta Studzinska Graduate Student Dept. of Horticulture and Crop Science Rosie Wendt Master Gardener Volunteer Dept. of Horticulture and Crop Science Matt Williams Program Coordinator Dept. of Horticulture and Crop Science Corrie Yoder Graduate Student Dept. of Entomology

vii
2007 Research Day – OSU Nursery & Landscape Presenters Meghan Blake Graduate Research Associate Dept. of Horticulture & Crop Science Luke Case Research Associate Dept. of Horticulture & Crop Science Rodrigo Chorbadjian Graduate Research Associate OARDC Entomology Kyle Daniel Graduate Research Associate Dept. of Horticulture & Crop Science Dr. Pablo Jourdan Associate Professor Dept. of Horticulture & Crop Science Dr. Hannah Mathers Associate Professor Dept. of Horticulture & Crop Science Jon Sammons Graduate Research Associate Dept. of Horticulture & Crop Science Upender Somireddy Graduate Research Associate Dept. of Horticulture & Crop Science Dr. Dan Struve Professor Dept. of Horticulture & Crop Science Peter Zale Graduate Research Associate Dept. of Horticulture & Crop Science Randy Zondag Assistant Professor OSU Extension

viii
Turfgrass Research Support – 2007
The following companies, associations, and foundations have generously supported turfgrass research at The Ohio State University, through the Ohio Agricultural Research and Development Center and the Ohio State Extension Service, during 2007.
Financial Support
American Cyanamid Company Aquatrols Arysta Life Science BASF Bayer Specialty Products Central Farm and Garden Cerexagri Cheminova Dow AgroSciences Dry Ject Heartland DuPont EaglePicher Minerals FMC Gowan Greater Pittsburgh GCSAA Griffin LLC Hoechst-Roussel ICI Corporation Johnson Seed Land-O-Lakes Lebanon Chemical Company Lesco Monsanto Corporation Motz Sports Group N-Viro International, Inc. NAIAD National Turfgrass Evaluation Program
NuFarm, Inc. Ohio Lawn Care Association Ohio Turfgrass Foundation Ohio Master Gardeners Olglebay Norton Sands OSU Athletics OSU College of Food, Agricultural and Environmental Sciences OSU Extension OSU-OARDC PBI Gordon Pittsburg GCSAA Plant Health Care, Inc. Precision Labs Pursell Industries Riverdale Chemical Company Sipcam Agro USA, Inc. Smith Seeds Syngenta Corporation Tessenderlo Kerley The Motz Group The Royal Barenbrug Group The Scotts Company TruGreen/Chemlawn Valent USA Verdicon W.A. Cleary Chemical Corporation Wolf Creek Irrigation

ix
In – Kind Support
Accu Products, International Acorn Farms Agro-culture Solutions Agri-Urban Ampac Seed Aquatrols Arysta Life Science Baker Vehicle System Barenbrug, Inc Barnes Nursery BASF Bayer Environmental Science Becker Underwood Bio Safe Systems Bobcat Enterprises Buckeye Power Sales Buckeye Tree Farm CLC LABS Central Farm and Garden Century Equipment City of Columbus/Com-Til Central Ohio GCSAA Covermaster Cushman Dow AgroSciences Eastside Nursery Emerald Isle Emmett Equipment Company Fairmount Materials FMC Corporation Futura Garden Ridge Nursery GM Powertrain Great Plains Mfg. Greater Cincinnati GCSAA Green Velvet Sod Farms Hayward Distributing Hunter Jacobsen/Textron John Deere and Company John Deere One Source Johnston Seed Jones Fuel J.R. Simplot Company/Jacklin Seed Div. Kurtz Bros., Inc
Lang Stone LESCO Livingston Seed Lofts Seed Mainline of North America Mogavero Equipment Monsanto Murfield Village Golf Club Northern Ohio GCSAA Oakland Irrigation Oglebay-Norton Ohio Lawn Care Association Ohio Turfgrass Foundation OLICA Oliger Seed PBI Gordon Preferred Pump Rain One Irrigation Systems R & R Turf Supply Ransomes America/Textron River Valley Solutions Ryan by Jacobsen Schaefer Ornamental Iron Seed Research of Oregon SISIS Inc. Slanker Sports Turf Drainage Smith Seeds Strategic Turf Syngenta Textron The Andersons The Motz Group The Seed Center The Toro Corporation Turfco, Inc. Turfgrass South Turf Seed Inc. United Horticultural Supply Verdicon W.A. Cleary Chemical Corporation Western Reserve Farm Corporation Wolf Creek Company/Rainbird Xenia Power Equipment Zeoponix

x
We would like to acknowledge the following companies for their generous equipment loans to
The OSU/OTF Research and Education Facility during 2007.
Buckeye Power Sales
John Deere/Xenia Power Equipment
LESCO
SISIS
Baker Vehicle Systems
Toro/Turfco/Century Equipment

xi
The Ohio State University and The Ohio Turfgrass Foundation recognize the following
companies for generous donations to the landscaping of The OTF Research and Education Facility, 1996-2000.
Buckeye Tree Farm
Century Equipment/Toro
Eastside Nursery
Green Velvet Sod Farms
Kurtz Brothers, Inc.
Lang Stone
Medalist America
United Horticultural Supply
Wolf Creek Company/Rainbird

1
Impact of Double Cutting and Primo MAXX® on Green Speed and Turf Quality
A. Studzinska, T.K. Danneberger, and T. Estes
Dept. of Horticulture and Crop Science, The Ohio State University Emphasis on green speed led to the situation where achieving smooth hard greens is a major goal of golf course superintendents. Cultural methods commonly utilized to enhance green speed include: frequent mowing at reduced mowing heights, double cutting, rolling, reduced fertilization and watering. Recently, light frequent applications of plant growth regulators (PGRs) to golf greens to increase ball roll has become a popular practice. The use of PGRs, which reduces growth and produces a smooth, uniform turf, is believed to increase ball roll. Two independent studies were conducted to evaluate green speed and turf visual quality as affected by double cutting and PGR- trinexapac-ethyl (Primo MAXX®) applications. Field experiments were conducted at the Ohio Turfgrass Foundation (OTF) Research & Education Facility from May 1st to Jun 30th, 2006, and from July 6th to August 10th, 2007 on ‘Penncross’ creeping bentgrass (Agrostis palustris) putting greens. Greens were constructed in the early 1970s according to USGA recommendations. Turf was maintained at a mowing height of 0.125 inches.
2006 RESULTS In 2006 turf was subjected to two mowing treatments (perpendicular and backcutting) which were split by Primo Maxx® applications (0.125 oz/1000 square feet/week versus no Primo MAXX®). Ball roll distances were measured daily using USGA Stimpmeter taking the average of three ball rolls. The measurements were taken between 8 am and 11 am about one hour after mowing. Ball roll distances on turf mowed perpendicularly and parallel in counter directions for the study averaged 9.05 and 9.16 feet, respectively. Statistically no differences between the mowing treatments were observed. However, turf quality declined the greatest in the counter-cutting method over duration of this study. Primo MAXX® did not have any effect on ball roll. 2007 Results: In 2007, the study has been modified with respect to mowing. The main plot treatments were single and double cutting. As in the previous study, turf was treated with Primo MAXX® (sup plots) at the rate of 0.125 oz/100 square feet/week. Ball roll measurements were taken daily in the morning and evening with a modified USGA Stimpmeter. Results will be given at field day.

2
Comparison of the F355 and Clegg Impact Testers in Measuring the Hardness of Synthetic Turfgrass Systems
C.F. Mancino, J.R. Street and D.D. Holdren
Dept. of Horticulture and Crop Science, The Ohio State University
This study compares the Gmax hardness values of an ASTM F355 impact tester (the synthetic turf hardness standard) and a Clegg impact tester (the natural turf standard). The study area has various carpet types and infill mixtures with or without a shock pad. One half of every treatment plot receives simulated football wear. The project is funded by The Motz Group (Cincinnati, OH). A total of 184 pairs of data (F355 and Clegg) were collected in 2006. Paired data was collected as follows – a test location was chosen on the carpet, the Clegg missile was dropped in the center of the test location, the Clegg tester was removed and three F355 drops were performed as per the ASTM 1936 test procedure. The F355 unit was moved and the center of the test location was again tested with the Clegg hammer. The first Clegg drop was paired with the first F355 drop and the second Clegg drop was paired with the final F355 drop. Regression analysis was used to determine the ability of the Clegg unit to predict the F355 value. A highly significant linear relationship does exist between the two methods (R2 = 0.747; P <0.0001, n = 184) (Figure 1). Linear equations can predict the F355 value and the 95% upper and lower confidence limits (i.e. 95% of the time the real F355 value will lie somewhere between these two lines). Table 1 shows predicted F355 values after inserting actual Clegg values into the equations. For example, a Clegg reading of 50 gives a predicted F355 value of 70 with the actual F355 value being somewhere between 60 and 79. Results:
• Clegg values are lower than predicted F355 values when Clegg values are < 110. • Clegg and predicted F355 values are equal at a Clegg value of 110. • Clegg values are higher than predicted F355 values when Clegg values are >110.
It is speculated that the lighter Clegg missile cannot compress the surface as well as the heavier F355 missile when the surface is harder. This gives a higher Clegg Gmax value because the missile decelerates more quickly than the F355 missile. Studies on synthetic surfaces have shown that children experience a greater impact force than adults do because their body weight cannot compress the surface as well and take advantage of the shock-absorbing ability of the surface. More work needs to be conducted to accurately predict the F355 value from a Clegg impact value. The Clegg impact tester can be useful in tracking changes in surface hardness, but the actual F355 value could be 10 or more Gmax units higher or lower than the predicted F355 value. As such, the F355 unit should still be used to measure synthetic turf hardness for warranty purposes and as official hardness documentation in case of user injury.

3
Table 1. Predicted F355 Gmax values and upper and lower 95% confidence limit values derived from a Clegg Impact Tester equipped with a 0.5 kg missile.
95% Confidence Limits Clegg
(actual) F355 (predicted) Lower Upper 50 70 60 79 60 76 66 87 70 83 72 94 80 90 78 101 90 96 84 108
100 103 91 116 110 110 97 123 120 116 103 130 130 123 109 137 140 130 115 145 150 137 121 152 160 143 127 159 170 150 133 166 180 157 139 174 190 163 146 181 200 170 152 188 210 177 158 195
PREDICTING F355 USING A 0.5 kg CLEGG IMPACT TESTER
50
70
90
110
130
150
170
190
50 60 70 80 90 100 110 120 130 140 150 160 170 180 190 200
CLEGG Gmax (ACTUAL)
ACTUAL F355 VALUEF355 (PREDICTED) = 0.6674(Clegg) + 36.395
Lower Limit = 0.6105(Clegg) + 29.5404
Upper Limit = 0.7244 (Clegg) + 43.2502
F355
Gm
ax (P
red.
)

4
Influence of Carpet, Shock Pad, Infill and Wear on the Hardness of a Synthetic Turfgrass System
C.F. Mancino J.R. Street and D.D. Holdren
Dept. of Horticulture and Crop Science, The Ohio State University
The primary objective of this study is to evaluate the influence of synthetic carpet type, infill mixture, shock pad and wear on shock absorption. This study is funded by The Motz Group (Cincinnati, OH). Three carpet types (48 oz XPS, 42 oz XPS and 48 oz Monofilament) were installed in August 2005. Another carpet, 24/7, had previously been installed in Fall 2003 by The Motz Group. The 24/7 carpet infill was 100% crumb rubber (CR, 10/20 mesh), while each of the three other carpets contained an 85:25, 75:25 and 65:35 CR:Sand (coarse mason) infill mixture. One-half of each plot was underlain with a 10 mm granulated rubber pad. Baseline data was collected on August 8, 2006. A Brouwer Wear Machine was used to apply four football games per week beginning on August 31, 2006. Gmax data was collected using an F355 impact tester on October 18 and 19 after 28 simulated football games had been applied. Beginning on July 2, 2007, wear is being applied at a rate of 18 games per week. Plot layout is shown in Figure 1. The influence of main effects (carpet type, pad, wear and infill mix) are shown in Figure 2. Highlights of individual treatments are listed below.
RESULTS • 24/7 provided the lowest Gmax measured. 24/7 had a 100% crumb rubber (CR) infill.
The monofilament carpet had the highest Gmax values measured. It is speculated that monofilament fibers are matted and maintain a more dense infill resulting in a harder surface.
• The shock pad had a very large effect on Gmax. Gmax was about 16 units lower for 24/7 with the pad, but up to 30 to 40 units lower in combination with the other treatments (carpet type, infill mixture and wear). Pad often removed differences due to the infill mixtures, even after 28 games of wear.
• 100% CR infill resulted in the lowest Gmax values of any infill mixtures with next lowest being the 85% CR treatment. The 75% and 65% CR treatments were harder than the two other treatments, especially in the absence of a pad. The latter two treatments were almost always equal to one another in hardness.
• 28 games of wear did increase surface hardness, but this increase was small (5 Gmax units). Carpet hardness changed by only 5 to 10 Gmax units when wear was applied. Wear increased the hardness of the 100% and 85% infill mixtures by only about 2 Gmax units, and only about 8 units for the 75% and 65% infill mixtures. Both pad and no pad treatments increased in hardness by 5 Gmax units due to 28 games of wear.

5
Figure 1. Plot plan for synthetic turf infill mixture study.
INSTALLED: August 9, 2005
PAD
85/15 75/25 65/35 85/15 75/25 65/35 85/15 75/25 65/35 100/0
NO
PA
D
42 oz XPS 48 oz MONOFILAMENT
48 oz XPS 24/7
Figure 2. F355 Gmax following 28 simulated football games (4 games/week)
0
20
40
60
80
100
120
140
160
24/7
48 O
Z. X
PS48
OZ.
MO
NO
42 O
Z. X
PS
PAD
NO
PA
D
NO
WEA
RW
EAR
100%
CR
85%
CR
75%
CR
65%
CR
Gm
ax

6
Surface Temperatures of Synthetic Turf
C.F. Mancino, J.R. Street, and D.D. Holdren Dept. of Horticulture and Crop Science, The Ohio State University
Surface temperatures of two synthetic turf infilled carpets, an irrigated and non-irrigated natural turf, bare sand soil and asphalt were measured on two hot sunny days (June 26 and July 9, 2007). An infrared thermometer (Raytek MiniTemp) was used to determine the temperature, while a digital thermometer measured air temperature at three feet above the ground in the shade. The data is presented as the difference between surface temperature and air temperature. This project is funded by The Motz Group (Cincinnati, OH). The range of temperatures during the monitoring was: Air: 88 to 92 oF Synthetic Turf A (a 48 oz. slit-film carpet): 88 to 156 oF Synthetic Turf B (a 48 oz. monofiliament carpet): 87 to 163 oF Irrigated Turf: 82 to 108 oF Non-Irrigated Turf (brown, dormant): 82 to 123 oF Bare Sand Soil: 83 to 141 oF Asphalt (light colored): 111 to 140 oF Maximum surface temperatures occurred primarily between 2 and 4 p.m. when air temperature was no longer increasing significantly. The figure shows the differences between the surface temperatures and the corresponding air temperatures. The two synthetic turf surfaces could be as high as 60 to 70 o above air temperature. Bare soil and asphalt were up to 50 o hotter. The maximum temperature differential for non-irrigated, non-transpiring brown turf was 27o, while irrigated, transpiring turf never got warmer than 15 o above air temperature. Utilizing synthetic fields during hot, midsummer afternoons could pose a serious health threat to users. A future study will examine how temperature is regulated using syringing.
SURFACE TEMPERATURE MINUS AIR TEMPERATURE (F)
0
10
20
30
40
50
60
70
80
1 3 5 7 9 11 13 15 17 19 21 23 25 27 29 31OBSERVATION
TEM
PERA
TURE
DIF
FER
ENCE
SYNTHETIC TURF ASYNTHETIC TURF BIRRIGATED TURFNON-IRRIGATED TURFBARE SOILASPHALT

7
The effects of various sources of Nitrogen and Trinexepac- Ethyl on creeping bent grass Agrostis palustris grown in
three different light conditions
E.J Nangle, D.S. Gardner, J.R. Street, T.K. Danneberger, J.S. Metzger Dept. of Horticulture and Crop Science, The Ohio State University
Three golf greens were built to California greens specifications, on an 80/20 medium fine USGA sand root zone by volume. The turfgrass was sodded onto the root zone with a granular application of phosphate applied at a rate of 3lbs/1000 sq ft prior to sodding. The turf under the tree shade was installed within 24 hours of the turf being covered with the 90% reduced light shade cloth. The shade cloth density was determined using a Li-Cor 700 light meter; and on average, under the tree canopy, there was 90% or greater reduced light. The turf was allowed to acclimate for two weeks, and applications of three sources of Nitrogen then commenced. The hypothesis behind the research is that foliarly applied materials - in particular, the ammoniacal based fertilizers - will help to create an improved turfgrass sward on a canopy maintained at a height of 0.5 inches. It is hoped next year that the height of the turfgrass can be reduced further thus allowing for more complete results in relation to maintaining greens height turfgrass under heavily shaded conditions. The ammonium is believed to require less energy on the plant to create proteins and amino acids thus allowing for more energy or carbohydrates to be used in maintaining general plant health. Calcium nitrate Ca (NO3)2, Ammonium sulfate (NH4)2SO4 and Urea (NH2)2CO were all applied on a weekly basis at a rate of 0.1 lbs per 1,000 sq ft and there was a bi weekly treatment to half the plots of Primo at a rate of 0.125 oz per 1,000 sq ft. The use of the primo is being tested also to look at its effects under reduced red:far red ratio light conditions, as it is believed that by helping to inhibit giberellic acid synthesis the quantity of lush elongated turfgrass plants that we all find under the trees can be reduced-thus helping to improve wear and disease tolerance of the plants. The greens are being also maintained under general maintenance practices and have received topdressing and are also on irrigation schedules to replace 80 – 90% ET. The next page shows the layout of the trial plots for the east field where the green under full sun and the green under the shade canopy can be found side by side.

8
North Plot size 912 sq ft
Name: Ed Nangle Light Environment: Shade ClothTitle: Creeping bentgrass interactions with Primo and various sources of N in various shade areasLocation: Zone 2 East Field Date: 2006
Treatments:
8. Check4. Ca(NO3)2 + Primo
7. Ca(NO3)2 No Primo3. (NH4)2SO4 + Primo
6. (NH4)2SO4 No Primo2. Urea + Primo
5. Ca(NO3)2 No Primo1. Primo No fertilizer
8 72 35 61 4
6 2784
374812 6 5
5 3 1
Plot size 912 sq ft
Name: Ed Nangle Light Environment: Full SunTitle: Creeping bentgrass interactions with Primo and various sources of N in various shade areasLocation : Zone 2 East field Date: 2006
Treatments:
North
3 45 67 18 2
8 4517
581364 7 2
3 2 6
8. Check4. Ca(NO 3)2 + Primo
7. Urea No Primo3. (NH 4)2SO 4 + Primo
6. (NH 4)2SO 4 No Primo2. Primo + Urea
5. Ca(NO 3)2 No Primo1. Primo No fertilizer
Plot size 912 sq ft

9
The Effect of Nitrogen Fertilizer Application Timing on Plant Available Phosphorus
E.R. Horner and D.S. Gardner
Dept. of Horticulture and Crop Science, The Ohio State University
INTRODUCTION Phosphorus in the soil is found in plant available inorganic forms such as phosphates and also much of the phosphorus in the soil is organic which plants cannot use. Phosphorus constantly changes forms from inorganic to organic and vice versa through processes preformed by microorganisms and enzymes. The dynamics of phosphorus transformations among the different phosphorus forms is not completely understood. It is clear however that there are many natural factors involved that vary from soil to soil such as pH, other nutrients and minerals, such as iron, aluminum, nitrogen, and carbon. Also, critical is soil type, temperature, and moisture. The presence or absence of certain microorganisms also plays an important role in transformations by the breakdown of complex organic phosphorus compounds through the secretion of enzymes. Due to all of these factors, the amount of phosphorus in the soil that is available for plants to use is constantly changing. In recent years there has been increasing controversy in the use of phosphorus on turf. It is believed that phosphorus run-off contributes to the eutrophication of lakes and streams. Though there has been sufficient research on phosphorus run-off from turf that shows it not to be a significant contributor to this pollution, the use of phosphorus on turf has been ‘banned’ in a few states. Ohio has not banned the use of phosphorus on turf yet, but if or when these restrictions occur, knowledge of ways to maximize the utilization of phosphorus that already exists in the soil will help prolong the onset of phosphorus deficiencies in turf.
OBJECTIVES The objectives of this research project are to focus on two factors that determine changes in plant available phosphorus in the soil – temperature and nitrogen applications. Increasing soil temperature is thought to increase enzyme activity in the soil that aids in the mineralization of organic phosphorus forms into plant available inorganic phosphates. The presence of fertilizer nitrogen in the soil is thought to stimulate a flush in microorganism activity that produces these enzymes that breakdown organic phosphorus compounds.
MATERIALS AND METHODS Two different nitrogen fertilizers, ammonium sulfate and calcium nitrate, are to be applied at different times thoughout the season. Soil samples are taken every two weeks and analyzed for plant available phosphorus. Changes in phosphorus in fertilized plots are compared to the phosphorus levels of the unfertilized plots. Overall changes in soil phosphorus levels will be compared to soil temperature changes.

10
TREATMENTS
Plot # Treatment
1, 4, 7 Calcium nitrate (1lb N/1000 sq ft) 4 applications per year
2, 5, 8 Ammonium sulfate (1lb N/1000 sq ft) 4 applications per year
10, 13, 16 Calcium Nitrate (1lb N/1000 sq ft) April application only
11, 14, 17 Ammonium sulfate (1lb N/1000 sq ft) April application only
19, 22, 25 Calcium Nitrate (1lb N/1000 sq ft) June application only
20, 23, 26 Ammonium sulfate (1lb N/1000 sq ft) June application only
28, 31, 34 Calcium Nitrate (1lb N/1000 sq ft) September application only
29, 32, 35 Ammonium sulfate (1lb N/1000 sq ft) September application only
37, 40, 43 Calcium Nitrate (1lb N/1000 sq ft) November application only
38, 41, 44 Ammonium sulfate (1lb N/1000 sq ft) November application only
3, 6, 9, 12, 15, 18, 21, 24, 27, 30, 33, 36, 39, 42, 45 Control - No fertilizer application
PLOT PLAN N →
13 42 34 14 17 7 32 31 5 35 29 2 39 26 15 36 16 8 30 4 33 43 19 40 25 12 21 23 27 45 9 10 22 6 41 18 20 44 28 37 38 24 1 11 3

11
The Effects of Trinexapac-ethyl and MegAlex Used in Combination on Three Turfgrass Species
E.R. Horner and D.S. Gardner
Dept. of Horticulture and Crop Science, The Ohio State University
When plants that are not adapted to low light environments are grown in shaded situations, physiological adaptations occur in the plant to minimize stress and enable survival in such low light conditions. For turfgrasses that are not shade tolerant, these adaptations include increased growth height (called etiolation) and decreased leaf blade surface area. This results in a weak, spindly turfgrass plant that creates an unhealthy, thin stand of turf. In this study, two products are being researched to aid in the growth of turfgrasses grown in the shade. The first is trinexapac-ethyl or Primo. Previous studies have been done using this plant growth regulator on grasses grown in low light conditions in order to prevent the grass from growing tall and spindly. The other product being tested in this study is called MegAlex. It is a foliar carbohydrate additive containing 3% nitrogen from urea, magnesium, iron and manganese. MegAlex is thought to help plants stand up to stresses such as shade stress by increasing the rate of photosynthesis. The study includes the application of Primo only, MegAlex only, and the combination of Primo and MegAlex to Fine fescue (Festuca ovina), Tall fescue (Festuca arundinacea), and Rough bluegrass (Poa trivialis) plots in the shade. Clippings are taken every two weeks, dried, weighed, and compared.
TREATMENTS N ↑
Control - FF
MLEX - RB
TE - TF
TE - FF
MLEX - TF
MLEX - FF
MLEX/ TE - RB
MLEX/ TE - TF
TE - FF
Control - TF
MLEX/ TE - RB
MLEX/ TE - FF
MLEX/ TE - RB
MLEX/ TE - FF
TE - RB
MLEX - TF
MLEX - RB
TE - RB
Control - FF
Control - TF
MLEX - FF
TE - RB
MLEX - TF
TE - TF
MLEX/ TE - TF
Control - RB
MLEX - FF
Control - TF
MLEX/ TE - FF
Control - RB
TE - TF
TE - FF
Control - RB
MLEX/ TE - TF
Control - FF
MLEX - RB
CTRL – Control MLEX – MegAlex TE – Trinexapac-ethyl MLEX/TE – Combination MegAlex and Trinexapac-ethyl FF - Fine fescue TF – Tall fescue RB – Rough bluegrass

12
Controlling Weeds in Turfgrass Established from Seed
D.S. Gardner and D.D. Holdren Dept. of Horticulture and Crop Science, The Ohio State University
One of the many reasons that fall is the recommended time to establish turfgrass from seed is that there is a decrease in competition from weeds. However, weeds are occasionally a problem when turf is established in the fall. In spring, establishment from seed is much more difficult. In some cases, an area established from seed in the spring may exceed 80% crabgrass and other annual weeds. Until recently there were few options available to turfgrass managers who needed to control weeds at establishment. Siduron is a preemergence herbicide that has been available for many years for the control of crabgrass and certain other weeds preemergence and is safe for use on seedling turfgrass. Another herbicide, bromoxynil, has been available for selective control of broadleaf weeds in seedling turf. The protox inhibitor herbicides carfentrazone and sulfentrzone have shown good safety when applied to seven day-old turfgrass seedlings. The Quicksilver (carfentrzone) label has been updated to allow applications on seedling turf for control of annual broadleaf weeds. Quinclorac has also shown good safety on seedlings and can be used when establishing certain species. A new herbicide, Tenacity, containing the active ingredient mesotrione, is scheduled for release this fall. It can be applied at seeding and has resulted in nearly 100% control of crabgrass, goosegrass, yellow foxtail, nutsedge, spurge, purslane, and other broadleaf weeds in trials conducted at The Ohio State University. Plot Plan: N
9
5
4
7
2
10
6
3
1
8
Treatments Applied July 25
TREATMENT RATE DATE 1. Untreated / No fertilizer 2. Starter Fertilizer Only At seeding 3. Mesotrione 4SC 2.5 oz ai / acre At seeding 4. Mesotrione 4SC 3 oz ai / acre At seeding 5. Mesotrione 4SC 4 oz ai / acre At seeding 6. Siduron 6 lb ai / acre At seeding 7. Dismiss 4F 0.125 lb ai / acre 7 Days after ryegrass emergence 8. Quicksilver 0.031 lb ai / acre 7 Days after ryegrass emergence 9. Drive 0.75 lb ai / acre 7 Days after ryegrass emergence 10. Trimec 4 pts / acre 7 Days after ryegrass emergence

13
MegAlex Broadleaf Weed Control Study
D.S. Gardner and D.D. Holdren Dept. of Horticulture and Crop Science, The Ohio State University
MegAlex is a foliar additive that contains 3% nitrogen and also magnesium, manganese and iron. It also contains a carbohydrate additive (C7H14O6) that is reported to accelerate the uptake and translocation of other materials in a tank mix. If verified this could result in significant reductions in the requirements for pesticides and fertilizers applied to turfgrass. A study was initiated to test whether the addition of MegAlex could enhance the initial control of broadleaf weeds when combined with either Trimec (2,4-D, MCPP, and dicamba) or Millennium Ultra (2,4-D, clopyralid, and dicamba). A problem of springtime herbicide applications can be re-growth later in the season. This study also tests the hypothesis that increased translocation of the herbicide may result in longer control and less re-growth. N
6
5
3
2
12
13
9
7
11
10
1
8
4
2
9
4
11
3
12
13
1
7
5
10
6
8
5
10
1
13
4
11
3
12
6
9
8
7
2
TRT Treatment Rate 1 Trimec 4 pts / acre 2 Trimec 2 pts / acre 3 Trimec+MegAlex 4 pts + 20 pts / acre 4 Trimec+MegAlex 4 pts + 10 pts / acre 5 Trimec+MegAlex 2 pts + 20 pts / acre 6 Trimec+MegAlex 2 pts + 10 pts / acre 7 Millenium 3 pts / acre 8 Millenium 1.5 pts / acre 9 Millenium+MegAlex 3 pts + 20 pts / acre 10 Millenium+MegAlex 3 pts + 10 pts / acre 11 Millenium+MegAlex 1.5 pts + 20 pts / acre 12 Millenium+MegAlex 1.5 pts + 10 pts / acre 13 Untreated

14
Fungicides Evaluation for the Control of Dollar Spot in Creeping Bentgrass – 2006
J.W. Rimelspach, T.E. Hicks, and M.J. Boehm
Dept. of Plant Pathology, The Ohio State University
MATERIALS AND METHODS The test was conducted at The Ohio State University Turfgrass Research Center, Columbus, OH on a stand of creeping bentgrass (Agrostis palustris ‘L-93’) established in 1997. Mowing height was 0.17-in. with clippings removed and the area was irrigated as needed. The condition of the sward was good with fair color, minimal thatch and good density. A single 0.125 lb N liquid fertilizer application of 30-10-10 was made 4 Apr. The soil was Crosby B silt loam, pH 7.3. Treatment plots measured 3 ft x 5 ft with 1 ft alleys between plots, and 2 ft between blocks, and were arranged in a randomized complete block design, with four replications. All treatments were initiated on June 13. Applications were made with a hand-held, CO2-powered boom sprayer using 6503 TeeJet nozzles at a pressure of 40 psi, (water equivalent to 2.0 gal water/1000 sq ft) for all treatments. Applications were made at 7, 14, 21, or 28 day intervals. Visual counting of dollar spot infection centers were done weekly. The average maximum and minimum air temperatures (°F) and total precipitation (in.) for each month respectively were: May 71.1, 51.1 and 3.25; June 78.9, 59.6 and 4.30; July 85.7, 67.4 and 5.77; and August 84.8, 66.8 and 2.94, respectively. Data were transformed by arcsine square root (y) and analyzed using analysis of variance with Duncan's New MRT least significant difference (LSD) (α=0.05).
RESULTS Environmental conditions were favorable for dollar spot (Sclerotinia homoeocarpa) development from natural inoculum in mid-June through late August, and the disease was active at the start of the study. Moderate levels of disease symptoms were expressed early in the evaluations period, severity was consistent across the test area and disease pressure remained relatively consistent through the trial. The following treatments provided excellent control of dollar spot; Emerald 70WG (0.13 oz 14 days), all treatments that contained Banner MAXX 1.3ME (0.5, 1.0 or 2.0 fl oz at 14 days), V-10116 50WG (both rates at 14 days), Bayleton 50DF (high and low rate at 14 days) and PEX60021 SC (both rates at 14 days) and Eagle 20EW (1.2 or 2.4 fl oz). No phytotoxicity symptoms were observed during the trial. Details of treatments and results are in the following table.

15
Number of dollar spot infection centers per plot z, y Treatment (formulation and rate per 1000 sq ft)
Interval (days) June 13 June 23 July 7 July 11
Untreated control.…………………....… - 17.34 Ab 18.52 abc 27.08 a 27.81 ab
Emerald 70WG 0.13 oz.............……..… 14 13.71 Abc 2.87 fgh 0.00 h 0.00 i
Emerald 70WG 0.18 oz...…………....… 21 11.71 Abc 3.23 fgh 5.70 fgh 3.23 ghi
Emerald 70WG 0.18 oz...……………… 28 16.08 Abc 7.99 d-h 3.54 gh 1.43 hi
Emerald 70WG 0.13 oz + Manicure 82.5WG 3.2 oz ……………... 14 11.62 abc 2.49 gh 0.00 h 0.00 i Manicure 82.5WG 3.2 oz x ……………. 7 Emerald 70WG 0.13 oz ……………….. 14 13.96 abc 4.32 fgh 6.04 fgh 6.14 f-i Rhapsody F 5 fl oz……………….......… 14 10.34 abc 11.88 b-g 12.22 c-g 14.77 c-f Daconil Ultrex 82.5WG 1.8 oz…..…..... 14 14.66 abc 8.95 c-h 13.58 c-f 19.68 b-e Rhapsody F 5 fl oz w …………………... 14 Daconil Ultrex 82.5WG..………..…..… 14 8.29 bc 16.07 a-e 6.04 fgh 11.01 e-h Rhapsody F 5 FL oz v …………………. 14 Banner MAXX 1.3ME 0.5 fl oz…..…… 14 11.66 abc 13.32 a-f 19.46 abc 20.85 abc Echo 720SC 3.6 fl oz…….…….....…… 14 14.80 abc 10.36 b-h 4.53 fgh 7.30 f-i Echo Ultimate 82.5WG 3.25 oz…..…… 14 15.2 5 abc 7.01 d-h 1.43 h 7.86 f-i Propensity 1.3ME 2 fl oz………..…..… 14 10.53 abc 0.00 h 1.43 h 0.00 i Disarm 480SC 0.36 fl oz………........…. 14 15.7 0 abc 17.16 a-d 18.42 a-d 19.57 b-e Disarm 480SC 0.18 FL oz + Banner MAXX 1.3E 1 fl oz………....… 14 13.3 3 abc 4.67 fgh 0.00 h 0.00 i Disarm 480SC 0.18 fl oz + Daconil Ultrex 82.5WG 1.8 oz……….... 14 13.77 abc 8.59 c-h 4.30 fgh 6.33 f-i Disarm 480SC 0.18 fl oz + Banner MAXX 1.3ME 1 fl oz + Vital Sign SC 4 fl oz……….........…..… 14 18.32 a 9.83 b-h 0.00 h 0.00 i PEX6015 WG 1.8 oz………………...… 14 12.99 abc 10.71 b-g 16.35 b-e 21.49 abc PEX6016 SC 2 FL oz…...……..….…… 14 13.92 abc 12.08 b-g 18.31 a-d 20.38 bcd Daconil Weatherstik SC 2 fl oz….….… 14 18.17 a 19.47 ab 24.42 ab 26.05 ab Daconil Ultrex 82.5WG 1.8 oz…..……. 14 19.52 a 12.57 a-g 9.58 d-h 11.50 d-g PEX6015 WG 3.25 oz…………..…...… 14 13.73 abc 6.93 e-h 1.43 h 4.67 ghi PEX6016 SC 3.6 fl oz……………....…. 14 12.37 abc 3.93 fgh 0.00 h 4.11 ghi Daconil Weatherstik SC 3.6 fl oz…..….. 14 15.54 abc 8.61 c-h 8.30 e-h 10.13 f-i Daconil Ultrex 82.5WG 3.25 oz…….…. 14 6.72 c 4.67 fgh 0.00 h 4.36 ghi PEX60021 SC 4 fl oz……………..…... 14 13.49 abc 3.47 fgh 0.00 h 0.00 i PEX60021 SC 8 fl oz……………..….... 14 13.22 abc 6.42 e-h 0.00 h 0.00 i Banner MAXX 1.3ME 0.5 fl oz + Spotrete 75WG 2.5 oz……………..…... 14 10.64 abc 3.47 fgh 0.00 h 0.00 i Banner MAXX 1.3ME 1 fl oz + Spotrete 75WG 5 oz…………..……….. 14 16.80 ab 7.41 d-h 0.00 h 1.43 hi V-10116 50WG 0.18 oz…………..…… 14 18.28 a 6.41 e-h 0.00 h 0.00 i V-10116 50WG 0.37 oz…………..…… 14 1766 ab 5.50 fgh 0.00 h 0.00 i Banner MAXX 1.3ME 0.5 fl oz……… 14 13.52 abc 4.90 gh 0.00 h 0.00 i Banner MAXX 1.3ME 1 fl oz…...…….. 14 14.09 abc 6.33 e-h 0.00 h 0.00 i Banner MAXX 1.3ME 2 fl oz……..….. 14 12.97 abc 5.50 fgh 0.00 h 0.00 i Bayleton 50DF 1 oz……….........……… 14 14.79 abc 5.74 fgh 1.43 h 0.00 i Bayleton 50DF 2 oz…………….......…. 14 18.70 a 3.47 fgh 2.03 h 0.00 i Eagle 20EW 1.2 fl oz…………..…........ 14 12.37 abc 7.40 d-h 0.00 h 0.00 i Eagle 20EW 2.4 fl oz……………..……. 14 17.64 ab 21.83 a 4.07 fgh 2.49 ghi z Average number of infection centers in four plots. y Treatments followed by different letters indicate significantly differences between each treatment, based on data transformed by arcsine square root analyzed using analysis of variance with Duncan's New MRT least significant difference (LSD) (α=0.05) x First application was Manicure 82.5WG 3.2 oz, then in 7 days Emerald 70WG 0.13 oz was applied, then in 14 days Manicure 82.5WG 3.2 oz applied, this rotation was continued throughout the trial w First application was Rhapsody F 5 fl oz, then in 14 days Daconil Ultrex 82.5WG applied, this rotation was continued throughout the trial. v First application was Rhapsody F 5 fl oz, then in 14 Banner MAXX 1.3ME 0.5 fl oz applied, this rotation was continued throughout the trial.

16
Fungicides Evaluated for the Control of Brown Patch in Creeping Bentgrass - 2006
J.W. Rimelspach, T.E. Hicks, and M.J. Boehm
Dept. of Plant Pathology, The Ohio State University
MATERIALS AND METHODS The test was conducted at The Ohio State University Turfgrass Research Center, Columbus, OH on a stand of creeping bentgrass (Agrostis palustris ‘L-93’) established in 1997. Mowing height was 0.17-in. with clippings removed and the area was irrigated as needed. The condition of the sward was good with fair color, minimal thatch and good density. A single 0.125 lb N liquid fertilizer application of 30-10-10 was made April 4. The soil was Crosby B silt loam, pH 7.3. Treatment plots measured 3 ft x 5 ft with 1 ft alleys between plots and 2 ft between blocks, and were arranged in a randomized complete block design, with four replications. All treatments were initiated on July 14. Applications were made with a hand-held, CO2-powered boom sprayer using 6503 TeeJet nozzles at a pressure of 40 psi (water equivalent to 2.0 gal water/1000 sq ft) for all treatments. Applications were made at 14 or 21 day intervals. Disease ratings for brown patch (Rhizoctonia solani) were made as a percent of plot area blighted and assessed visually on a linear scale of 0 to 100% scale where 0 = no blight and 100 = entire plot blighted. The average maximum and minimum air temperatures (°F) and total precipitation (in.) for each month were: June 78.9, 59.6 and 4.30; July 85.7, 67.4 and 5.77; and August 84.8, 66.8 and 2.94, respectively. Data were transformed by arcsine square root (y) and analyzed using analysis of variance with Duncan's New MRT least significant difference (LSD) (α=0.05). Environmental conditions were favorable for brown patch development from natural inoculum, and a high level of disease symptoms were expressed at the onset of the trial and continued into mid-Aug. Since the disease was active at the beginning of the evaluation, the curative efficacy of fungicide treatments could be tested.
RESULTS The fastest reduction of brown patch was noted one week after applications and was achieved with 3.25 oz Manicure Ultra, 0.36 fl oz Disarm, and 0.9 oz Insignia. In addition, by 14 days, in addition to the previously mentioned treatments 3.6 oz Echo 720, 0.18 oz Disarm applied at 14 day-intervals, Disarm plus Banner 1 fl oz Maxx and 0.5 oz Insignia also achieved good disease reduction. No phytotoxicity symptoms were observed during the trial. Details of treatments and results are in the following table.

17
Disease Severity x , y Treatments (formulation, & rate per 1000 sq ft)
Interval (days) July 14 July 21 Aug 4 Aug 10
1. Untreated check………………… - 44.25 a-d 53.23 a 42.39 a 33.16 a 2. Echo 720SC 3.6 fl oz…………… 14 46.48 abc 22.78 cd 4.67 c 3.47 ef 3. Echo Ultimate WG 3.25 oz……... 14 38.93 a-e 26.19 cd 10.68 bc 19.11 b 4. Propensity 1.3ME 2 fl oz……….. 14 41.40 a-d 44.88 abc 19.37 b 13.35 b-e 5. Spectator Ultra 1.3ME 2 fl oz…... 21 30.00 de 33.61 a-d 13.78 bc 18.06 bc 6. Manicure Ultra 82.5WG 3.25 oz... 14 44.35 a-d 16.91 d 3.23 c 16.33 bcd 7. Spectator Ultra 1.3ME 2 fl oz x 14 Manicure Ultra 82.5WG 3.25 oz... 14 25.81 E 14.91 d 0.00 c 0.00 f 8. Disarm 480SC 0.18 fl…………... 14 39.83 a-e 25.61 cd 1.43 c 1.43 ef 9. Disarm 480SC 0.18 fl oz………... 21 51.62 A 22.72 cd 7.84 bc 0.00 f 10. Disarm 480SC 0.36 fl oz………. 28 37.08 a-e 13.98 d 0.00 c 0.00 f 11. Disarm 480SC 0.18 fl oz + Banner Maxx 1.3ME 1 fl oz…... 21 35.84 b-e 27.98 bcd 2.03 c 0.00 f 12. Disarm 480SC 0.18 fl oz + Banner Maxx 1.3ME 1 fl oz + Vital Sign F 4 fl oz…………….. 21 49.45 ab 49.59 ab 0.00 c 6.04 c-f 13. Insignia 20WG 0.5 oz…………. 14 33.23 cde 26.65 cd 0.00 c 0.00 f 14. Insignia 20WG 0.9 oz………… 28 31.79 cde 20.41 d 4.32 c 4.67 def
z Average percent-area affected by disease in four replicated plots, visually rated 0 to 100% with 0 equal to no disease and 100 equal to entire area diseased. y Different letters indicate significantly differences between treatments within each data. x First application was Spectator Ultra 1.3ME 2 fl oz then in 14 days Manicure Ultra 82.5WG 3.25 oz was applied and this rotation was continued throughout the trial.

18
Summary of Turfgrass Insect Control Studies – 2007
D.J. Shetlar, D. Digman and J. Andon Dept. of Entomology, The Ohio State University
Over the last several seasons, Ohio lawns have experienced increases in billbug, hairy chinch bug and white grub damage. The dry summer of 2007 has exaggerated the billbug and chinch bug damage but may reduce white grub populations, especially in non-irrigated turf. In this article, we wish to present some of our field data whereby newer insecticides have been used to control these three pests. Table 1. Bluegrass billbug larvae + pupae + teneral adults recovered at 33 DAT (curative treatments) from treated Kentucky bluegrass plots, OSU-OTF Turfgrass Research and Education Center, Columbus, OH, 2006.
Treatment/a Rate # per 4 samples /plotb Ave/c Formulation lbAI/a Rep 1 Rep 2 Rep 3 Rep 4 ft2 % control
Merit 0.5G 0.187 0-0-0 0-0-0 2-2-0 2-2-0 6.8 63.6 bc Merit 0.5G 0.25 2-0-0 0-0-0 0-1-0 2-1-0 5.1 72.7 bcd Merit 75 WP 0.30 0-0-0 0-0-0 1-0-0 0-0-0 0.8 95.4 cd Arena 50 WDG 0.20 0-0-0 0-0-0 0-0-0 0-0-0 0.0 100.0 d Meridian 25 WDG 0.25 0-0-0 0-0-0 1-0-0 1-0-0 1.7 90.9 bcd Sevin Lawn 2G 7.80 2-0-0 1-0-0 1-0-0 2-0-0 5.1 72.7 bcd Triazicide G 0.50 1-0-0 2-0-0 4-0-0 2-0-0 7.6 59.1 b Check --- 3-0-0 4-0-0 9-0-0 6-0-0 18.6 ---a a Treatments applied 8 June to plots 5x5 ft, replicated 4x. b Data taken on 11July (33 DAT) from three 4.25-in “biased” cores taken from each plot. c Totals per plot analyzed by ANOVA (P<0.001). % Controls followed by the same letter are not significantly different using LSD @ 0.05 = 1.783 average billbugs per plot. Table 2. Bluegrass billbug larvae + pupae + teneral adults recovered at 43/44 DAT (late preventive treatments) from treated plots, OSU-OTF Turfgrass Research and Education Center, Columbus, OH, 2005.
Treatment/a Rate # per 4 samples /plotb Ave/c Formulation lbAI/a Rep 1 Rep 2 Rep 3 Rep 4 ft2 % control
Allectus SC 0.20-0.16 6-0-0 2-0-0 0-0-0 5-0-0 8.2 74 cd Allectus SC 0.25-0.20 0-0-0 0-0-0 3-0-0 0-0-0 1.9 94 d Allectus SC (24 May)+ Allectus SC (17 June)
0.14-0.11+ 0.14-0.11 1-0-0 6-0-0 2-0-0 0-0-0
5.7 82
cd
Merit 2F 0.30 1-0-0 11-0-0 1-0-0 0-0-0 8.9 71 cd Talstar One 0.10 15-3-0 1-1-0 5-0-0 6-0-0 19.7 37 abc Arena 50 WDG 0.20 0-0-0 0-0-0 0-0-0 0-0-0 0.0 100 d Check --- 14-5-0 10-0-0 10-1-0 9-0-0 31.1 ---a a Treatments applied 24 May (with on retreatment on 17 June) to plots 6x6 ft, replicated 4x. b Data taken on 6 & 7 July (43/44-19/20 DAT) from four 4.25-in “biased” cores taken from each plot. c Totals per plot analyzed by ANOVA (P=0.002). % Controls followed by same letter are not significantly different using LSD @ 0.05.

19
Table 3. Efficacy of various over-the-counter insecticides to control hairy chinch bugs (nymphs 1-3 - nymphs 4, 5 + adults) at 4 DAT in a Kentucky bluegrass home lawn, Pickerington, OH, 2005.
Treatment/a Rate # per 2 samples /plotb Ave/c Formulation lbAI/a Rep 1 Rep 2 Rep 3 Rep 4 ft2 % control
Season-Long Grub Control 0.2G (imidacloprid)
0.13 2-1 0-1 2-6 0-6 16.5 76.6 cd
Season-Long Grub Control 0.2G (imidacloprid)
0.10 1-3 1-14 0-29 0-7 50.4 28.6 ab
AE 1283742 0.1G (clothianidin)
0.06 0-5 1-5 0-6 0-21 34.8 50.6 bcd
AE 1283742 0.1G (clothianidin)
0.05 0-3 0-4 0-2 0-6 13.8 81.8 d
Season-Long Grub Control 0.2G + AE 1283742 0.1G
0.10+ 0.05
3-12 0-3 0-1 0-16 32.1 54.5 bcd
Triazicide 0.04G (lambda-cyhalothrin)
0.034 2-5 0-4 0-11 0-7 26.6 62.3 bcd
Grub Stop Once & Done 1.5G (halofenozide)
1.01 0-5 0-10 1-9 1-22 44.0 37.7 abc
Bayer Complete Insect Killer (0.15 imidac + 0.05 beta-cy)
0.15+ 0.04
4-8 0-11 0-2 1-2 34.8 63.6 bcd
Check --- 4-8 3-13 3-30 5-11 70.6 ---a a Treatments applied 21 July to plots 5x5 ft, replicated 4x. b Data taken on 25 July (4 DAT) from two 5-in “biased” flotation cylinders taken from centers of each plot. c Totals per plot analyzed by ANOVA (P=0.091). % Controls followed by same letter are not significantly different using LSD @ 0.10.
Ranked Efficacy of White Grub Insecticides - 1976-20051 (using Japanese Beetle and Masked Chafer Data)
rate ave range % of tests Insecticide lb.ai./a. % control # tests % control below 70% Carbaryl 8.0 72.8 43 13-100 40 (=Sevin) Clothianidina 0.3 100.0 1 100 0 (=Arena) 0.4 97.0 1 97 0 Halofenozide 1.5 91.2 65 10-100 12 (=MACH2) 2.0 89.6 53 56-100 9 Imidacloprid 0.25 98.8 5 96-100 0 (=Merit) 0.3 94.1 88 58-100 6 Permethrin 0.26 31.8 8 0-54 100 Thiamethoxamb 0.2 94.9 51 0-100 6 (=Meridian) 0.26 97.0 17 75-100 0 Trichlorfon 8.0 77.6 91 0-98 19 (=Dylox, Proxol) H. bacteriophora 0.3bill 96.0 1 96 0 0.5bill 57.7 3 15-92 67 S. glaseri 0.5bill 31.3 14 0-71 93 S. carpocapsae 1.0bill 21.5 10 0-61 100 1 Data from Insecticide and Acaricide Tests & Arthropod Management Tests, Entomological Society of America (using masked chafers and Japanese beetle evaluations 1977-2005 and label recommended application timing). Note, these data include tests up to 2004, not 2005 evaluations. a/ New product from Arysta, registration received December 2004 b/ New product from Syngenta, registration expected.

20
Overseeding Mixtures for Heavily Trafficked Native Soil Athletic Fields
P.J. Sherratt, J.R. Street, D. Holdren and, A. Drake
Dept. of Horticulture and Crop Science, The Ohio State University
Athletic fields in the cool-season zone are overseeded during the playing season to increase turf density in heavily trafficked areas of the field. The relative success of the overseeding depends upon many factors, such as competition from weeds, traffic damage during games, and amount of available soil moisture. Research undertaken by the sports turf group over the last 5 years has revealed the following:
• Kentucky bluegrass is not useful as an overseeding grass during heavy traffic. Perennial ryegrass, annual ryegrass, Festulolium and tall fescue have all shown some promise as overseeding grasses
• Under heavy traffic conditions, slit-seeding can cause major surface damage. Broadcast seeding prior to games appears to provide adequate grass cover and not cause surface damage
• Traditional seed rates of 5-8 lbs/M were not sufficient to maintain turf density. Seeding perennial ryegrass at 10lbs/M weekly was the best treatment in the 2005-2006 study
• In addition to perennial ryegrass, Festulolium (a forage grass at present) and turf-type annual ryegrass have also shown some efficacy as overseeding grasses
AIM OF THE 2007 STUDY To determine most effective seed mixtures for heavily used native soil athletic fields and to monitor turf quality and end-of-season turf composition. In addition, the study will evaluate the effectiveness of overseeding late in to the fall and early winter season.
MATERIALS AND METHODS A native soil (slit clay loam) area with 30% perennial ryegrass grass cover was established summer 2007 at The Ohio Turfgrass Foundation Research and Education Facility, Columbus, OH. All plots were irrigated to support healthy turf growth. Maintenance fertilizer was applied at ¾ lb N/M in May and July. Mowing height is 2-inches with clippings returned. Sports traffic was simulated with the SISIS wear machine (Figure 1), developed by the STRI in England. Seven passes each week = 5 games/week. Randomized complete block design, replicated 3 times.

21
Table 1. Seed Cultivar Treatments
1. Panterra (LM)
2. Barlennium (LP)
3. Barfest (FL)
4. Bargold (LP)
5. 75 Panterra / 25 Barlennium
6. 75 Panterra / 25 Bargold
7. 25 Panterra / 25 Barfest / 50 Barlennium
8. 25 Panterra / 25 Barfest / 50 Bargold
9. 50 Panterra / 50 Barlennium
10. 50 Panterra / 50 Bargold
11. 25 Panterra / 75 Barlennium
12. 25 Panterra / 75 Bargold
13. Untreated
Key: LP: Lolium perenne, LM: Lolium multiflorum, FL: Festulolium
Figure 1. The SISIS wear machine, developed by The Sports Turf Research Institute (STRI) in England

22
Treatments applied every two weeks at 10lbs/M from June-December (weather permitting). Continuing later in the season to evaluate low temperature germination. Seed applied by broadcast methods, prior to each traffic event. Application dates: June 26th, July 10th, July 24th, and August 7th Measurements:
• Percent cover taken every 2 weeks • Quality rating taken every 2 weeks • Sward composition taken at the end of the season or spring 2008
Figure 2. Plot plan for trial area. Zone 13 East Field

23
Trinexapac-ethyl & Wear Tolerance
P.J. Sherratt, J.R. Street, D. Holdren, and A. Drake Dept. of Horticulture and Crop Science, The Ohio State University
Trinexapac-ethyl (TE) is a plant growth regulator used predominantly in the golf course industry as a method of controlling turf growth and improving turfgrass quality. While there is still a lot to learn about the effect of TE on the wear tolerance and recuperative potential of heavily trafficked areas, the benefits of using Trinexapac-ethyl on athletic fields can be summarized as:
• Improved color and density • Increased tillering • Reduction in mowing & subsequent clippings • Reduction in dollar spot incidence • Extending the life of field marking paint
Athletic field managers across the country have been using TE to extend the life of painted lines and most recently, some have used TE on practice and game fields to see if TE can improve wear tolerance, quality and playability (“footing” and “speed”). Typical rates have been between 0.2 and 0.6oz/M every 2 weeks. Most of these athletic turf managers have been using TE prior to playing seasons and not during the playing season because of the concern about wear recovery. The aim of this study is to look at the effects of TE on the quality and wear tolerance of cool-season grasses used for athletic turf and to determine if applications of TE can “pre-condition” turf to be more wear-tolerant during the playing season.
MATERIALS AND METHODS Kentucky bluegrass turf on native soil (silt clay loam). All plots irrigated to support healthy turf growth. Maintenance fertilizer applied at 1lb N/M in May. Mowing height is 2-inches and clippings returned. Sports traffic in fall 2007 simulated with SISIS wear machine, developed by STRI. Number of events TBD. Randomized complete split block design. Two TE application methods – liquid & granular (Primo & Governor). Two rates of each (Figure 1). Application dates: May 18th, June 6th, June 21st, July 3rd, July 18th, August 1st and August 14th, 2007

24
Measurements: • Clipping Yields every 2 weeks • Quality ratings taken every 2 weeks • Percent cover every week just prior to, during and after fall wear treatment • Surface playability – traction, shear strength, ball roll and hardness
Figure 1: TE study plot plan Block 32

25
The Effects of Zeba Coating & Fungicide Treatments on Perennial Ryegrass Seed Germination & Establishment
P.J. Sherratt, J.R. Street, D. Holdren, and A. Drake
Dept. of Horticulture and Crop Science, The Ohio State University
The principal grass used for overseeding athletic fields is perennial ryegrass. Recent studies have indicated that high rates (10-15lbs/M) of perennial ryegrass may need to be applied in order to retain adequate grass cover under heavy traffic. In addition, it is commonly accepted that in order for seeds to germinate and establish, readily available moisture is needed. The combination of moisture and high seeding rates may encourage disease, particularly on perennial ryegrass which has a tendency to be susceptible to a whole range of seedling diseases such as damping off or seedling blight (causal agents Pythium, Rhizoctonia, Helmintho-sporium, Curvularia and Fusarium). There are many ways to try and prevent seedling diseases occurring; removing morning dew, watering judiciously, avoiding quick-release sources of N, and seeding at the correct rate to avoid seedling over-crowding. Fungicide seed coatings (e.g. Apron) are also sometimes used to prevent seedling diseases occurring. In addition to the fungicide seed coats, there are seed coatings that conserve moisture, thereby encouraging seed germination and growth. The aim of this study is to evaluate two seed coats: (1) Zeba for moisture control & (2) fungicide for seedling disease control. Seed germination, establishment, and turf health will be monitored.
MATERIALS AND METHODS Native soil area broadcast-seeded with perennial ryegrass July 2007.Two seed rates - 10lbs/1,000 sq.ft. (50g/M2) and 20 lbs/1,000 sq.ft. (100g/M2). Starter fertilizer applied at seeding at 1lb N/M, with a repeat application made 4 weeks after. Mowing height: 2-inches. Randomized complete split-plot design (Figure 1):
Treatments:
1. Zeba coated seed @ 10lbs/M 2. Fungicide coated seed @ 10lbs/M 3. Zeba + fungicide @ 10lbs/M 4. Untreated @ 10lbs/M 5. Zeba coated seed @ 20lbs/M 6. Fungicide coated seed @ 20lbs/M 7. Zeba + fungicide @ 20lbs/M 8. Untreated @ 20lbs/M
Split: plots syringed (lightly watered) 3 x day. Plots not syringed at all.

26
Measurements: • Days to germination • Establishment rate - % cover • Quality rating taken every 2 weeks • Disease occurrence
Figure 1: Plot plan of seed coat study, Zone 13 East Field

27
Low Input Sustainable Turfgrass Trial: A Regional Cooperative Research Project
A. Studzinska, D.S. Gardner, and D.D. Holdren
Dept. of Horticulture and Crop Science, The Ohio State University
OBJECTIVES To identify alternative species adapted to this region with minimum input and obtain information on best management practice for each species; obtain information that can be used for future breeding.
TREATMENT AND EXPERIMENTAL DESIGN Entry plot size will be 3’ X 5’. Three mowing heights at no mow, 2” and 4” will be applied to each species and will be randomized within each of the three blocks as 5- by 39-foot strips perpendicular to and across all entries (Table 1). Mowing frequency will be once every month during the growing season except for the no mow treatment.
ESTABLISHMENT There will be two approaches to establishing the plots. Five participating institutes will establish plots through dormant seeding (see appendix 2). Briefly, we need to prepare seed bed and then closely monitor the soil temperature at 2- inch depth until it reaches a point when it’s considered safe for dormant seeding (50F?).Once seeded, researchers need to cover the seeds with Futarra® blanket (http://www.conwedfibers.com/futerra/futerra.html) (Each researcher is responsible for purchasing this product). No starter fertilizers, irrigation or herbicides will be applied at this point. The rest of the participating institutions will establish their plots with a typical fall seeding procedure during early fall when winter injuries are unlikely to occur. Efforts will be made to ensure successful establishment in the fall. This includes the use of a starter fertilizer (P2O5 at 98kg per ha and 49 kg N per ha?) and irrigation. Trimec® Classic will be applied at each site to control broadleaf weeds in the spring following the establishment. No preemergent herbicides shall be applied.
DATA COLLECTION Persistence and uniformity will be the two primary criteria to determine quality for each plot. Quality data will be taken monthly by all collaborators during the growing season. Different ratings will be applied toward no mow, 2” and 4” mowing heights as they represent different situations. Other data including density, percent coverage and percent of other species will be taken during the months of May, July and September every year by each collaborator.

28
Figure 1. Field layout of Block 3 of the LIST project
3.5” Mowing Height
D
C
B
F
A
K
J
I
M
E
G
H
L
2“ Mowing Height
D
L
B
F
A
J
K
I
M
E
G
H
C
No Mowing
I
J
B
F
C
K
A
D
M
E
G
H
L
Species: (A) RoadCrest Crested Wheatgrass (B) Meadow Foxtail (Alopecurus pratensis) (C) Tuffed Hairgrass (Descampsia caespitosa) (D) 'Blacksheep' Sheep fescue (E) 'Berkshire' Hard fescue (F) Praire Junegrass (Koeleria cristata) (G) Alkaligrass (Puccinellia distans) (H) 'ThermalBlue' Heat tolerant hybrid bluegrass ( K. bluegrass X Texas bluegrass) (I) HB 329 Heat Tolerant Hybrid bluegrass ( Kentucky bluegrass X Texas bluegrass) (J) Crested dogs tail (Cynosurus cristatus) ShadeStar (K) Blue grama “Bad river” (L) Colonial bentgrass SR7150 or SR7000 (M) Grande II tall fescue Table 1. List of the institutions, primary contact person and establishment method Institution Contact person Establishment method Michigan state Suleiman Bughrara Normal fall seeding Iowa State Shui-zhang Fei Normal fall seeding North Dakota Deying Li Normal fall seeding Purdue Cale Bigelow Normal fall seeding Univ. of Missouri Barb Corwin Normal fall seeding Univ. of Wisc John Stier Dormant seeding South Dakota Leo Schleicher Dormant seeding Univ. of Minnesota Eric Watkins, Brian Horgan Dormant seeding Univ. of Illinois Tom Voigt Spring Seeding Ohio State Univ. David Gardner Spring Seeding Southern Illinois Univ. Ken Diesburg Spring Seeding

29
Bermudagrass Fall Color Retention and Spring Green-up as Affected by Topdressing and Covers
J.R. Street, D.D. Holdren, D.S. Gardner and P.J. Sherratt
Dept. of Horticulture and Crop Science, The Ohio State University
ABSTRACT Fall color retention and spring green-up of the winter hardy bermudagrass (Cynodon dactylon [L] Pers. cultivar ‘Riviera’ as affected by topdressing, cover and fertility treatments are being evaluated at The Ohio Turfgrass Foundation Research Facility, Columbus, OH. The Evergreen Covermaster (EC) cover extended bermudagrass green color into late November and 4 to 6 weeks beyond the untreated bermudagrass. Soil temperatures averaged 1.7 to 2.0°C (5 to 6°F) higher than the untreated bermudagrass. Crumb rubber and green sand topdressing only provided acceptable green color until early November, of 2005 and 3 to 4 weeks beyond the untreated bermudagrass. Soil temperatures of the topdressing treatments averaged only 0.335 to 0.67°C (1 to 2°F) higher than the untreated bermudagrass. Milorganite provided the second highest soil temperatures in October and November but discoloration due to a high nitrogen rate resulted in unacceptable color in November. Fertility treatments had no effect on fall color retention in November of 2005 or spring green-up in 2006. Bermudagrass (Cynodon dactylon [L.] Pers.) is a widely adapted warm-season turfgrass. With a temperature optimum of 26.8° to 31.8° C (80° to 90° F), bermudagrass is widely used as an athletic field turfgrass in the transition zone and the southern United States. The improved turf-type bermudagrasses form a very vigorous, aggressive turf with high shoot density. Bermudagrass produces both rhizomes and stolons providing excellent wear, drought, and heat tolerances. The root system is fibrous, extensive and relatively deep. Bermudagrass use in Ohio and other parts of the Midwest has been limited due to poor low temperature hardiness, delayed spring green up, and early loss of color in the fall. Bermudagrass growth stops when air temperatures drop below 60° F (15.6°C). Discoloration (browning) is reported to typically occur at soil temperatures below 50°F (10°C) and persists until the soil temperature rises above this level in the spring. Bermudagrass has been used recently in a few Midwest locations as a summer/fall sports field grass where temperatures typically drop to -15°F (-9.5°C) to -20°F (-6.7°C). Some bermudagrass kill has been reported. However, reports indicate that with 50% survival bermudagrass fields can be returned to full cover and playable by early summer. Many simply overseed bermudagrass in damaged areas in the spring for mid to late summer or fall play. The establishment rate is fairly rapid, and generous fertility is reported to enhance the establishment rate. When turf color is lost in the fall, many will provide green color by using turfgrass colorants.

30
This study is being conducted at the OTF Turfgrass Research and Education Facility at The Ohio State University, Columbus, Ohio. The bermudagrass cultivar, ‘Riviera’ was established by seed in mid June 2003 on native soil. Three blocks measuring 25ft by 20ft (7.6m by 6m) of the cultivar were seeded at 2lbs/ 1000 ft2. Water and starter fertilizer were applied at seeding and during the establishment period as needed. Maintenance fertilizer was applied at 0.75 lb N/1000 ft2 in July, August and September prior to treatment initiation. Topdressing, fertility treatments and the growth cover were initiated on September 30, 2005 to evaluate fall color retention and spring green-up. Topdressing materials ½”crumb rubber (CR), ½” green sand (GS), and ½” Milorganite (MIL) were applied and broomed in. The Evergreen cover (EC) was maintained consistently over the bermudagrass and only removed on warm days of >80°F, for mowing, and data collection. Fertility treatments consisted of Bulldog 28-8-18 plus Griggs PK Plus (B&G) 0.5 lbN + 0.3 lb K2O/1000 ft2, respectively. This research project is targeted to evaluate two weaknesses of bermudagrass in the cool-season zone: (1) fall color retention and (2) spring green-up. Best cultural practices/techniques to provide acceptable color and growth for the typical Midwest football season is the ultimate objective. Treatments include: (1) various topdressing materials, (2) a growth cover and (3) several fertility treatments. The study was a randomized complete block design with three replications. MegAlex (6 oz/1000ft2) and Ferrous Sulfate (FS) (8 oz/1000ft2) were applied every two weeks through November 15. MegAlex (3-0-0) is a foliar-applied liquid containing natural products claimed to reduce evapotranspiration and enhance photosynthesis and provide soluble nitrogen, iron and manganese. Soil temperature was monitored at 2” depth using an Oakton Thermistor Thermometer. Color ratings were taken every two weeks in the fall using a rating scale of 1-9 with 1 representing poor, 9 representing best, and 6 representing just acceptable. Spring green-up was rated using a rating scale of 0-100% with 0=no visible green tissue and 100=complete green cover. Fall color retention was best among all treatments with the Evergreen cover with acceptable color retention (i.e. ≥ 6.0) through the November 21 rating period. Crumb rubber and green sand topdressing treatments provided acceptable color retention until the November 4 rating period. Crumb rubber provided 1.5 to 2.0 higher color units than green sand during the October rating period. All the fertility treatments exhibited better color than the untreated bermudagrass during October. Color retention among the fertility treatments and the untreated bermudagrass all declined rapidly to less than acceptable color levels by November. Milorganite provided very good color (8.0) during October. However, discoloration exhibited as a yellow to orangish

31
foliage color from an excess nitrogen rate, caused color ratings to decline in November. The Milorganite also provided an unacceptable odor and the turf was observed to be consistently wet/soggy. In spring 2006, the crumb rubber, green sand, Milorganite, and Evergreen cover exhibited the most rapid spring green-up with 50-60% green cover by April 15 and 100% green cover by May 1. The fertility treatments and untreated bermudagrass exhibited similar rates of green-up with 20-30% green cover by April 15 and ≥ 90% by May 1. Figure 5 provides soil temperatures (5cm depth) as affected by the various treatments for October and November, 2005. The Evergreen cover consistently provided the highest soil temperatures, 1.7 to 2.0°C (5 to 6°F) higher than the rest of the treatments. Better fall color retention of the growth cover correlated with the higher soil temperatures. Soil temperatures for the Milorganite treatment were second highest with 1.0 to 2.0°C (3 to 6°F) and 0.335 to 0.77°C (1 to 2°F) higher soil temperatures in October and November than the untreated bermudagrass, respectively. The Milorganite treatment provided adequate color in October but declined in color in November due to the effect of excessive N. The crumb rubber and green sand treatments averaged soil temperatures only 0.335-0.770°C (1-2°F) higher than the untreated bermudagrass, but color retention was consistently better. Soil temperatures of the fertility treatments (Bulldog, Griggs, FS) did not differ from the untreated bermudagrass, resulting in no difference in color retention in November. Soil temperatures of the untreated bermudagrass ranged from 18 to 21°C (55 to 64°F) in October and 13 to 19°C (40 to 56°F) in November. The untreated bermudagrass color dropped below an acceptable level after the October 17 rating date and the fertilized treatments after the October 28 rating date. The Evergreen cover resulted in soil temperatures 1.7-2.0°C (5-6°F) higher than the untreated bermudagrass and it provided the best color retention in fall and extended ≥ acceptable color for 4-6 weeks. The Evergreen cover provided good color extension allowing acceptable aesthetics and growth of bermudagrass through most typical football seasons in the Midwest. Crumb rubber and green sand topdressing provided fall color extension through early November, approximately 3-4 weeks beyond untreated bermudagrass. Crumb rubber and green sand topdressing treatments alone would not appear to provide acceptable color extension through most typical football seasons in the Midwest. The necessary color extension for the topdressing regimens would require overseeding, painting, dyeing, or a topdressing/growth cover combination. Milorganite did provide higher soil temperatures than all the other treatments except the growth cover, however, the discoloration and wet, soggy surface would make it unacceptable at the volume/rate used. Fertility alone did not provide an acceptable extension of fall color or spring green-up at the rate and frequencies used in this study.
REFERENCES Goatley, J.M. Jr., V. Maddox, D. L. Lang, and K.K. Crouse. 1994. ‘Tifgreen’ bermudagrass response to late season application of nitrogen and potassium. Agronomy Journal. 86:7-10. Goatley, J.M. Jr., V. Maddox, D. L. Lang, R.E. Elmore, and B.R. Stewart, 2005. Temporary covers maintain fall bermudagrass quality, enhance spring greenup and increase stem carbohydrate levels. HortScience. 40(1) 227-231. Taliaferro, C.M., D.L. Martin, T.A. Anderson, M.P. Anderson, and A.C. Guenzi. 2001. Broadening the horizons of turf bermudagrass. USGA Turfgrass and Environmental Research online. 3(20):1-9. McCarty, L.B. and G. Miller, 2002. Managing bermudagrass turf: selection, construction, cultural practice, and best management strategies. Ann Arbor Press, MI. 221p.

32
Mesotrione for Control of Nimblewill 2005 - 2006
J.R. Street, D.D. Holdren, and T.K. Danneberger
Dept. of Horticulture and Crop Science, The Ohio State University
OBJECTIVE To remove nimblewill from lawns, sod farms, and golf courses. This study compares two rates and three timing strategies of Mesotrione (Table 1).
TREATMENTS Table 1. Trt Product Formulation Rate (lbs ai/A)
Frequency and Timing* 2005
1. Mesotrione 4 lb ai/G 0.15 1 app 8/9
2. Mesotrione 4 lb ai/G 0.15 14 day 2 apps 8/9, 8/23
3. Mesotrione 4 lb ai/G 0.15 14 day 3 apps 8/9, 8/23, 9/12
4. Mesotrione 4 lb ai/G 0.25 1 apps 8/9
5. Mesotrione 4 lb ai/G 0.25 14 day 2 apps 8/9, 8/23
6. Untreated -- -- -- -- -- * Initial application made on August 9, 2005. Application Methods:
1) Spray Volume 2 gallons per 1000 sq. ft. 2) Flat fan nozzle 3) Nozzle Pressure 40 psi 4) With hold irrigation for 24 hours 5) NIS at 0.25% v/v 6) Plot size 3’x 8’ 7) Randomized complete block design 8) Three replications
Turfgrass Phytotoxicity/Discoloration Turfgrass phytotoxicity/discoloration occurred as a bleaching or whitening of the leaves. Discoloration was scored on a scale of 1 to 9 with 9 = no discoloration or green and 1 = total whitening of the upper and lower leaves within the canopy. A discoloration rating of 5 still resulted in the presence of some green tissue in the lower canopy. Nimblewill discoloration is reported in Table 2.

33
Table 2. Mesotrione Efficacy for Control of Nimblewill.
Herbicide Rate Lbs ai/A Frequency 2005
Nimblewill Discoloration (%)2 Nimblewill Control (%)
8/16 8/22 8/31 9/15 9/22 10/5 10/20
1. Mesotrione 0.15 1 app 9.0a 6.3b 6.7b 7.0b 8.0b 8.0b 8.0b
2. Mesotrione 0.15 2 app – 14d 9.0a 6.7b 5.0c 5.0c 5.0c 5.7c 6.0d
3. Mesotrione 0.15 3 apps – 14d 9.0a 6.3b 5.0c 4.0d 3.0e 2.0e 2.0f
4. Mesotrione 0.25 1 app 9.0a 5.3c 5.0c 5.0c 5.0c 6.0c 7.0c
5. Mesotrione 0.25 2 app – 14d 9.0a 5.0c 4.0d 4.0d 4.0d 5.0d 5.0e
6. Untreated -- -- 9.0a 9.0a 9.0a 9.0a 9.0a 9.0a 9.0a
LSD -- -- 0 0.8 0.4 0 0 0.4 0 *Discoloration rated 1-9 with 9 = no discoloration and 1=complete whitening of the upper and lower leaves in the canopy.
RESULTS Nimblewill discoloration became evident as a bleaching or whitening of the leaves approximately 10-14 days after application. Discoloration was initially more severe at the highest mesotrione rate (i.e. 0.25 lbs ai/A). The mesotrione treatment at 0.15 lb ai/A – 1 application exhibited re-growth and recovery within approximately one month after application (i.e. 9/15). The mesotrione treatment at 0.25 lb ai/A – 1 application also began to show re-growth and recovery by early October. Mesotrione at 0.15 lb ai/A – 3 applications provided the most severe nimblewill discoloration with a final rating of 2. This latter treatment will have the best probability of providing some degree of nimblewill death/control. Death/control from all treatments will be determined at nimblewill green up in spring 2006.

34
Nitrogen Source, Rate, Timing/Fungicide Study - 2006
J.R. Street and D.D. Holdren Dept. of Horticulture and Crop Science, The Ohio State University
INTRODUCTION Dollar spot (DS) continues to be problematic on high-maintenance turfgrasses like bentgrass, annual bluegrass, Kentucky bluegrass, and perennial ryegrass. Golf course superintendents reportedly spend more money on fungicides to control dollar spot than for any other turfgrass disease (Vargas, 1994). Superintendents managing bentgrass fairways are reporting more intense dollar spot pressure and increased difficulty in dollar spot control. Many reasons have been hypothesized for these problems including resistance in field populations of S. homoeocarpa to chemicals, lower nitrogen fertility programs, fungicide interactions, and PGR use. Chlorothalonil has been used as a standard contact fungicide for dollar spot management over the years. Recently, chlorothalonil use by golf courses has been restricted to a certain seasonal limit. This restriction has significantly influenced superintendents’ fungicide usage programs and their chemical family alteration strategies for dollar spot management.
OBJECTIVES The purpose of this research project was to (1) determine the effect of various granular and liquid (foliar applied) nitrogen sources on dollar spot incidence and bentgrass color/quality, (2) evaluate these sources at various rates and frequencies (7-day versus 14-day application schedules and (3) determine the latter interactions on dollar spot incidence, fungicide efficacy, reduced fungicide rates and extended fungicide application intervals.
MATERIALS AND METHODS This study is being conducted on a mature stand of ‘Lopez’ creeping bentgrass at the OTF Turfgrass Research Center at The Ohio State University, Columbus, Ohio. The study consists of 13 treatments: four nitrogen sources, three nitrogen rates, two application methods (foliar and granular), and untreated. The 13 treatments are provided in Table 1.

35
Table 1. Fertilizer sources, rates, timing and method of application.
Fertilizer Source Analysis N Rate (lb N/M)
Application Frequency
Application Method
Bulldog 28-8-18 0.125 7 days Foliar
Ammonium Sulfate 21-0-0 0.125 7 days Foliar
Urea 46-0-0 0.125 7 days Foliar
Griggs 13-2-3 0.125 7 days Foliar
Ammonium Sulfate 21-0-0 0.25 14 days Granular
Urea 46-0-0 0.25 14 days Granular
Bulldog 28-8-18 0.25 7 days Foliar
Ammonium Sulfate 21-0-0 0.25 7 days Foliar
Urea 46-0-0 0.25 7 days Foliar
Griggs 13-2-3 0.25 7 days Foliar
Ammonium Sulfate 21-0-0 0.5 14 days Granular
Urea 46-0-0 0.5 14 days Granular
Untreated -- -- -- -- * Daconil Ultrex was split across the fertilizer source/rate/frequency treatments above at half rate on a monthly (30 day) basis. The fertilizer treatments are split with no fungicide and half rate fungicide (Daconil Ultrex 1.6 oz/M) applied on a monthly (30 day) basis. The resulted design is a randomized complete split block with 26 treatments and three replications. The fertilizer and fungicide treatments were initiated on May 23, 2006. Mowing is performed three times per week (Monday, Wednesday, and Friday) using a Toro 3100 triplex mower with a bench setting of ½” and clippings are removed. The site was irrigated on a regular basis to prevent wilt. Insecticide applications were made for black turfgrass ataenius and cutworms. Preemergence herbicide was applied in April. Dollar spot ratings were taken during active dollar spot periods. Dollar spot was active from mid-June through mid-September. Dollar spot was rated subjectively as an estimate of percent plot infected with 0 = no visible disease and 100% = total dollar spot cover. Turfgrass color ratings were taken approximately every two weeks (bi-weekly) using a scale of 1-9 with 1 representing poorest color, 6 representing just acceptable and 9 representing best (dark green).

36
Clippings were harvested on June 12, July 11, August 9, and September 21 by making a single pass down the center of each nitrogen treatment with a commercial walk-behind greens mower. Clippings were bagged, dried at 65° C for 72 hours and analyzed for total nitrogen content of clippings (% by weight) using the standard Kjeldahl method. Turfgrass Color/Quality Among all nitrogen source, rate, and application frequency/methods, turfgrass color was not influenced by the fungicide versus no fungicide treatments. For example, turfgrass color ratings for the Bulldog treatments at each comparative rate and frequency within each rating date were not significantly different whether fungicide was applied or not. This trend was consistent within each fertilizer source, rate, and frequency treatment throughout the season. All the fertilizer treatments consistently provided better color on every rating date throughout the growing season than unfertilized CB. All the nitrogen sources provided good to excellent initial green-up on June 1 and good to excellent color responses throughout the growing season, except for ammonium sulfate (sp) providing marginal responses on a few dates at both rates. On the 7-day frequency program, Griggs 13-2-3 provided color responses of 0.5 color units or slightly higher on several dates relative to Bulldog, AS (sp) and urea (sp) at the 0.125 lb N/M rate. Color responses between Bulldog and urea (sp) were similar for most rating dates throughout the season. Ammonium sulfate (sp) at the 0.125 lb N/M rate typically provided turf color responses that were 0.5 to 1.0 color unit less than Griggs 13-2-3, Bulldog, and urea (sp). Ammonium sulfate (sp) also caused an unacceptable color rating due to turfgrass burn on the August 28 rating date at the latter rate. All the nitrogen sources consistently provided higher color responses at the 0.25 lb N/M rate compared to the 0.125 lb N/M rate on the 7-day frequency program, with average color scores at 0.5 to 1.5 color units higher than at the 0.125 lb N/M rate. Average color ratings ranged from 7.5 to 8.5 and 6.5 to 7.5 at the 0.25 and 1.25 lb N/M rates, respectively. Again, Griggs 13-2-3 did provide color ratings of up to 0.5 units or slightly higher on several dates relative to Bulldog, AS (sp) and urea (sp) at the 0.25 lb N/M rate during the season. Color responses between Bulldog and urea (sp) at the 0.25 lb N/M rate (like the 0.125 lb N/M rate) were similar for most dates throughout the season. Ammonium sulfate (sp) at the latter rate provided turf color responses that were typically 0.5 – 1.0 color unit less than Bulldog, urea (sp) and Griggs 13-2-3. Ammonium sulfate (sp) color ratings did show a significant increase (i.e. 8.0-8.5) during September and October. Again, however, ammonium sulfate (sp) caused some unacceptable turfgrass burn on the August 28 rating date (i.e. 4.0). Only two granular nitrogen sources were compared: (1) ammonium sulfate (g) and (2) urea (g) at both the 0.25 and 0.5 lb N/M rates on a 14-day application frequency schedule. Color ratings for both sources were significantly higher at the 0.5 lb N/M rate with average seasonal ratings ranging from 8.0 to 8.5 and typically 0.5-1.5 color units higher than the lower rate. Ammonium sulfate (g) applied as a granular form provided consistently better color ratings than when applied in the AS (sp) liquid form and exhibited significantly less turf burn potential.

37
A general overall ranking of the performance of the fertilizer sources based on color response when applied in the liquid form (sp) on a 7-day frequency schedule are Griggs 13-2-3 >Bulldog = urea (sp) > ammonium sulfate (sp). Ammonium sulfate (g) and urea (g) when applied in the granular form provided similar color responses throughout the season.
RESULTS Dollar spot with NO fungicide There were two major outbreaks of DS in 2006. The first outbreak occurred in mid to late June and the second outbreak in late July to early August. Fertilizer and fungicide applications were applied initially on May 23, 2006. There was significant DS during both periods. DS incidence in the untreated CB (no fertilizer or fungicide) ranged from approximately 30 to 50% and 60 to 70% in July and August, respectively. DS was less with the fertilized CB compared to the unfertilized CB throughout the growing season. However, DS occurrence with no fungicide was severe with both the 0.125 and 0.25 lb N/M rates with the 7-day application frequency program. There were no differences in DS severity among the nitrogen sources at the 0.125 lb N/M rate on the 7-day frequency program. During peak DS pressure in July, DS incidence ranged from 20-30% (date dependent) with again no differences among nitrogen sources. There was a trend on a few rating dates during the growing season when AS (sp) exhibited slightly higher DS incidence than the other three nitrogen sources. At the 0.25 lb N/M rate with the 7-day application program, there were again few differences in DS severity among Bulldog, urea (sp) and Griggs 13-2-3 with peak DS severity ranging from approximately 15-30% and 25-35% in July and August, respectively. Again DS incidence was significantly higher for AS (sp) on several dates during July and August relative to the other nitrogen sources ranging from approximately 25-55%. Among the granular nitrogen source treatments ﴾(i.e. AS (g) and urea (g)﴿ DS incidence was also severe during the growing season. DS occurrence/incidence was similar between the 0.25 lb N/M rate (7-day frequency) and the 0.5 lb N/M rate (14-day frequency). DS severity with the granular treatments was comparable to the foliar treatments with DS ranging from approximately 25-40% and 40-45% in July and August, respectively. No consistent differences in DS severity were observed between the 0.125 and 0.25 lb N/M rates (7-day frequency) during June and July. However, in August and September under the second peak in DS pressure, the trend was for less DS severity at the 0.25 lb N/M rate. Dollar spot WITH fungicide CB treated with fungicide received a ½ “pre-disease” rate of Daconil Ultrex every 30 days starting May 23, 2006. Fungicide significantly reduced the amount of DS for all treatments including the untreated CB (no fertilizer) on every rating date throughout the season. The foliar-applied fertilizer sources at both rates (0.125 and 0.25 lb N/M) on the 7-day frequency exhibited significantly less DS than the unfertilized fungicide treated CB on most dates, especially when DS pressure was high. For example, DS incidence on August 20 ranged from

38
20-25% and 6-13% among nitrogen sources at the 0.125 and 0.25 lb N/M rates with fungicide, respectively. In comparison, DS incidence of the unfertilized fungicide treated CB was 35% on August 20. DS severity was consistently lower throughout the growing season for all the nitrogen sources at the 0.25 lb N/M rate (7-day frequency) with fungicide. For example, on August 20 when DS pressure was at its greatest peak of the season, DS severity among the nitrogen sources at the 0.25 lb N/M rate (7-day frequency) with fungicide only ranged from approximately 6-13% DS, whereas the no fungicide at the latter rate ranged from 30-50% DS. The DS severity with fungicide at the 0.125 lb N/M rate on August 20 was significantly higher than the 0.25 lb N/M rate with fungicide, ranging from approximately 30-50% DS. DS severity was also higher on several rating dates with AS (sp) with fungicide at both rates (i.e. 0.125 and 0.25 lb N/M rates and 7-day frequency) compared to the other three sources. The higher DS ratings of AS (sp) with fungicide reflects the same trend with AS (sp) without fungicide. Only two granular nitrogen sources were compared: (1) ammonium sulfate (g) and (2) urea (g) at the 0.25 and 0.5 lb N/M rates on a 14-day schedule. There were no consistent differences in DS severity between the granular urea (g) at the 0.25 lb N/M (14-day schedule) and urea (sp) foliarly applied at the 0.125 lb N/M (7-day frequency) with or without fungicide. The 0.5 lb N/M urea (g) (14-day frequency) treatments consistently exhibited greater DS severity than the 0.25 lb N/M urea (sp) (7 –day frequency) without fungicide. With fungicide, DS severity between the latter two treatments (i.e. 0.5 lb N/M urea (g) 14 – day frequency and the 0.25 lb N/M urea (sp) 7 - day frequency) resulted in little difference. There were several rating dates during the growing season when the AS (g) at the 0.5 lb N/M rate exhibited higher DS ratings than urea (g) at the 0.5 lb N/M rate. The AS (g) exhibited a similar trend as the AS (sp) for higher DS severity compared to the other three nitrogen sources at equivalent rate comparisons.
CONCLUSIONS There exists a very positive relationship between DS control/suppression, N source, N rate, application frequency, and application method. This research to date showed that CB color was not influenced by fungicide treatment. All fertilizer treatments consistently provided better color on every rating date throughout the growing season than unfertilized CB. Color responses typically ranged from 6.5 to 7.5 at the 0.125 lb N/M rate on a 7-day frequency program. Griggs 13-2-3 provided color responses 0.5 color units or slightly higher on several rating dates relative to Bulldog, AS (sp), and urea (sp). Color responses typically ranged from 7.5 to 8.5 at the 0.25 lb N/M rate and consistently higher by 1 to 1.5 color units than at the 0.125 lb N/M rate on the 7-day frequency program. Griggs 13-2-3 again did provide color ratings of 0.5 color units higher or slightly higher on several rating dates relative to the other sources.

39
Color responses between Bulldog and urea (sp) at equivalent N rates were similar on most dates. AS (sp) typically provided turf color responses 0.5 to 1.0 color units less than Griggs 13-2-3, Bulldog, and urea (sp) when compared at equivalent N rates. Burn potential was higher with AS (sp) than the other sources. Color ratings for both granular N sources were significantly higher at the 0.5 lb N/M rate 14-day frequency compared to the 0.25 lb N/M 14-day frequency with average seasonal ratings ranging from 8.0 to 8.5 at the higher rate and typically 0.5 to 1.5 color units higher than the lower rate. AS (g) provided consistently better color ratings than when applied in the AS (sp) liquid/foliar form and burn potential was minimized.
DOLLAR SPOT INCIDENCE/OCCURENCE Granular nitrogen sources with NO fungicide DS incidence/occurrence was severe with both N sources (i.e. 0.25 lb N/M or 0.5 lb N/M urea (g) and AS (g) on a 14-day frequency schedule). DS incidence/occurrence was similar between the two granular frequency programs. DS severity was also comparable between equivalent rates of granular (g) and foliar/liquid (sp) treatments, ranging from 25-45% and 40-80% in July and August, respectively. Granular nitrogen sources WITH fungicide DS severity between the urea (g) at the 0.25 lb N/M 14-day frequency and urea (sp) foliarly applied at 0.125 lb N/M 7 day frequency with or without fungicide showed no consistent difference. DS severity was consistently greater with the 0.5 lb N/M urea (g) 14-day frequency than the 0.25 lb N/M urea (sp) 7-day frequency program without fungicide. With fungicide, there were no differences between the latter treatments. Again, the AS (g) at the 0.5 lb N/M exhibited higher ratings than urea (g) at the same rate on several rating dates during the season. Dollar spot with NO fungicide (Foliar application 7-day frequency) Dollar spot was less with fertilized CB compared to unfertilized CB. DS severity with NO fungicide was severe at both the 0.125 and 0.25 lb N/M rates with the 7-day frequency program. There were no differences in DS severity among the N sources at the 0.125 lb N/M rate 7-day frequency with general DS ratings ranging from 20-30% and 35-40% in July and August, respectively. There were a few rating dates in late July and August where the 0.25 lb N/M rate 7-day frequency resulted in less DS than the 0.125 lb N/M rate but still DS occurrence ranged from 15-30% in July and 25-35% in August. Again, there was a trend on a few rating dates where AS (sp) at both N rates 7-day frequency exhibited higher DS incidence than the other N sources (range of 25-55%). Dollar spot WITH fungicide (Foliar application 7-day frequency) The N sources applied on the 7-day frequency foliar program at both rates resulted in significantly less DS than the unfertilized fungicide treated CB. DS incidence/occurrence in August for example ranged from 20-25%, 6-13%, and 35% at the 0.125 lb N/M, 0.25 lb N/M, and the unfertilized fungicide treatments, respectively. DS severity was consistently less for all N sources at the 0.25 lb N/M 7-day frequency rate with fungicide compared to all other treatments.

40
For example, on August 20 DS severity was 6-13% and 20-30% for the 0.25 and 0.125 lb N/M rates, respectively. With NO fungicide, DS severity was 30-50% and 40-55% for the 0.25 and 0.125 lb N/M rates, respectively. These latter DS comparisons clearly illustrate (1) the importance of N rate (2) the benefit of more frequent N applications over less frequent N applications at equivalent rate, (3) the benefit of foliar applications over granular applications, (4) the need for appropriate N rate/frequency programs in combination with fungicides, (5) the tendency to reduce fungicide rates with appropriate N rate/frequency programs and finally (6) a more definitive target N rate or N program to have a significant impact on DS suppression and/or control.

41
Poa trivialis Control in Creeping Bentgrass with Certainty Herbicide
J.R. Street and D.D. Holdren
Dept. of Horticulture and Crop Science, The Ohio State University
INTRODUCTION Poa trivialis infestation has recently been reported in bentgrass fairways, tees and greens in various golf courses in the cool-season turf areas of the U.S. The infestation has been alleged to come from contamination of seed sources used in the overseeding or renovation of golf course turf.
MATERIALS AND METHODS The study was conducted at the Ohio Turfgrass Foundation Research and Education Center at The Ohio State University in Columbus, Ohio. The soil type was a Brookston silty clay loam. The experiment was conducted on an established stand of creeping bentgrass that was maintained at a mowing height of 1.25” (3.17 cm). Irrigation was provided on a regular basis to maintain good quality turf and minimize stress. Two 12” x 12” squares of Poa trivialis (PT) were transferred into each plot spaced 12” apart and laid down the center on July 6, 2006. Individual plots were 3’ x 8’. The experimental design was a randomized complete block with 3 replications. The transferred PT squares were 2” thick and allowed to transition for 2 weeks before treatments were initiated. The treatments were initiated on July 20, 2006. The four treatments were: (1) Certainty (sulfosulfuron) at 0.0117 lb ai/A, (2) Certainty at 0.0117 lb ai/A plus a sequential application at 3 weeks, (3) Certainty at 0.0234 lb ai/A, and (4) untreated. The Certainty formulation was a 75 WG. Spray volume was 88 gal/A with a flat fan nozzle at 40 psi. Irrigation was withheld for 24 hours after herbicide application. CB discoloration/phytotoxicity was rated on a scale of 1 to 9, with 1 representing severe discoloration (yellowing and browning) and 9 representing no discoloration. PT control was rated on a scale of 0% to 100% with 0% representing no kill and 100% representing complete kill.
RESULTS AND DISCUSSION Creeping bentgrass (CB) discoloration/phytotoxicity was exhibited as a yellowing and stunting of growth (Table 1). The higher Certainty rate (0.0234 lb ai/A) resulted in the most severe discoloration/phytotoxicity which became noticeable within 7-10 days after application (i.e. 6.0) The yellowing and stunting of growth lasted approximately 3-4 weeks. CB had completely recovered from all Certainty treatments by September 1. Poa trivialis (PT) control appeared to be best at 80-90% control at the 0.0117 lb ai/A sequential rate on August 13 (3-4 weeks after application). The high single rate (0.0234 lb ai/A) application on August 13 appeared to provide 30-40% CB control. The low single rate application (0.0117 lb ai/A) never exhibited any reduction in PT

42
even though some discoloration as a yellowing-oranging color was evident. However, by September1 all treatments were beginning to show some recovery. By September 15 (8 weeks after application) Certainty at the sequential rate of 0.0117 lb ai/A provided best PT control, however it only resulted in 50-60% maximum control.

43
Table 1. Creeping bentgrass discoloration/phytotoxicity and Poa trivialis control with Certainty herbicide.
Treatment1 Rate (lb ai/A) CB discoloration2 % PT control3
8/3 8/13 8/21 9/1 9/15 8/3 8/13 8/21 9/1 9/15
Certainty 0.0117 7.0a 8.0b 8.0b 9.0a 9.0a 0.0b 3.3c 0.0c 0.0c 3.3c
Certainty 0.0117 + 0.0117(3 wks) 6.7a 7.0c 7.0c 9.0a 9.0a 10.0b 83.3a 83.3a 70.0a 53.3a
Certainty 0.0234 6.0b 8.0b 8.0b 9.0a 9.0a 23.3a 26.7b 23.3b 16.7b 20.0b
Untreated -- 0.0c 9.0a 9.0a 9.0a 9.0a 0.0b 0.0c 0.0c 0.0c 0.0c
LSD4 0.6 0.0 0.0 0.0 0.0 11.4 13.7 12.0 11.5 14.5 1 Initial treatments applied on July 20, 2006 and sequential applied on August 7, 2006. 2 Discoloration rated on a scale of 1 – 9 with 1 representing severe discoloration and 9 representing no injury. 3 Poa trivialis (PT) control based on a scale of 0% - 100% with 0% representing no PT kill and 100% rep
43

44
Poa trivialis Control in Kentucky Bluegrass with Certainty Herbicide – 2006
J.R. Street and D.D. Holdren
Dept. of Horticulture and Crop Science, The Ohio State University
INTRODUCTION Poa Trivialis infests Kentucky bluegrass (KB) fairways, roughs, athletic fields, landscapes, sod fields, and home lawns, allegedly coming from contamination of seed sources used in overseeding and renovation. Previous Monsanto and university research has shown excellent postemergent suppression and/or control of Poa trivialis with Certainty (sulfosulfuron) herbicide. The objective of this evaluation was to demonstrate Poa trivialis control and safety to Kentucky bluegrass from a single and sequential application of Certainty herbicide.
MATERIALS AND METHODS The study was conducted at The Ohio Turfgrass Foundation Research and Education Center at The Ohio State University in Columbus, Ohio. The soil type was a Brookston silty clay loam. The experiment was conducted on an established stand of Kentucky bluegrass that was maintained at a mowing height of 1.25” (3.18cm). Irrigation was provided on a regular basis to maintain good quality turf and minimize stress. Two 12” by 12”squares of Poa trivialis (PT) were transferred into each plot spaced 12 inches apart and laid down the center on July 6, 2006. Individual plots were 3 feet by 8 feet. The experimental design was a randomized complete block design with 3 replications. The transferred PT squares were 4” in depth and given two weeks to transition before treatment initiation. Treatments were initiated on July 20, 2006. There were two Certainty (Sulfosulfuron) treatments: (1) Certainty at 0.0234 lb ai/A, (2) Certainty at 0.0234 lb ai/A with a sequential at three weeks, and (3) untreated. The Certainty formulation was a 75 WG. Spray volume was 88 g/A with a flat fan nozzle at 40 psi. Irrigation was withheld for 24 hours following herbicide application. KB discoloration/phytotoxicity was rated on a scale of 1 to 9 with 1 representing severe discoloration and/or stunting of growth and 9 representing no discoloration. PT control was rated on a scale of 0% to 100%, with 0% representing no kill and 100% representing complete kill.
RESULTS AND DISCUSSION KB discoloration/phytotoxicity was exhibited as a blue-green to gray-green color (i.e. a drought like appearance) with some yellowing of the leaf blades at discoloration/phytotoxicity ratings of 5.0 or less. Growth stunting was evident at all Certainty rates. The sequential Certainty treatment resulted in the most severe discoloration/phytotoxicity which became noticeable in 7-10 days (Table 1). Discoloration and stunting of growth lasted approximately 3-4 weeks (i.e. September 15). Poa trivialis control was in the 60-70% range and 98-100% range at the Certainty 0.0234 lb ai/A rate with the single and sequential applications, respectively. Discoloration and growth stunting of KB will have to be expected as a potential occurrence for a period of several weeks after a Certainty application at these treatment rates.

45
Table 1. Kentucky bluegrass discoloration/phytotoxicity and Poa trivialis control with Certainty herbicide.
Treatment1 Rate (lb ai/A) KB discoloration2 % PT control3
8/3 8/15 8/22 9/1 9/15 8/3 8/15 8/22 9/1 9/15
Certainty 0.0234 8.0b4 7.0b 7.0b 7.0b 9.0a 10.0a 70.0b 70.0b 70.0b 66.7b
Certainty 0.0234 + 0.0234 8.0b 6.3c 5.7c 5.7c 9.0a 3.3a 90.0a 90.0a 93.3a 98.3a
Untreated -- 9.0a 9.0a 9.0a 9.0a 9.0a 0.0a 0.0c 0.0c 0.0c 0.0c
LSD5 0.0 0.37 0.75 0.75 0.0 26.62 16.03 13.08 11.94 9.25
1 Initial treatments applied on July 20, and sequential applied on Aug 7, 2006. 2 Discoloration rated on a scale of 1-9 with 1 representing severe discoloration and 9 representing no injury. 3 Poa trivialis (PT) control based on a scale of 0% to 100% with 0% representing no PT kill and 100% representing total kill/control. 4 Numbers followed by the same letter are not significantly different. 5 LSD = least significant difference.
45

46
Tall Fescue Control in Kentucky Bluegrass with Certainty Herbicide – 2006
J.R. Street and D.D. Holdren
Dept. of Horticulture and Crop Science, The Ohio State University
INTRODUCTION Tall fescue is a weed problem infesting Kentucky bluegrass fairways and roughs, athletic fields, landscapes, sod fields, and home lawns. Previous Monsanto and university trials showed excellent selective postemergent suppression and/or control of tall fescue with Certainty (sulfosulfuron) herbicide. The objective of this evaluation was to demonstrate tall fescue control and safety to Kentucky bluegrass from sequential applications of Certainty.
MATERIALS AND METHODS The study was conducted at the Ohio Turfgrass Foundation Research and Education Center at The Ohio State University, Columbus, Ohio. The soil type was a Brookston silty clay loam. The experiment was conducted on an established stand of Kentucky bluegrass that was maintained at a mowing height of 1.25” (3.18cm). Irrigation was provided on a regular basis to maintain good quality turf and minimize stress. Two 4” diameter plugs of tall fescue (TF) were transferred into each plot spaced 12 inches apart and laid down the center on July 6, 2006. Individual plots were 3 feet by 8 feet. The experimental design was a randomized complete block design with three replications. The transferred TF plugs were 4” in depth and given two weeks to transition before treatment initiation. Treatments were initiated on July 20, 2006. There were two Certainty (sulfosulfuron) treatments: (1) Certainty 0.035 lb ai/A with a sequential at three weeks, (2) Certainty at 0.047 lbs ai/A with a sequential at three weeks, and (3) untreated. The Certainty formulation was a 75 WG. Spray volume was 88 gal/A with a flat fan nozzle at 40 psi. Irrigation was withheld for 24 hours following herbicide application. KB discoloration/phytotoxicity was rated on a scale of 1 to 9, with 1 representing severe discoloration and/or stunting of growth and 9 representing no discoloration. PT control was rated on a scale of 0% to 100% with 0% representing no kill and 100% representing complete kill.
RESULTS AND DISCUSSION KB discoloration/phytotoxicity was exhibited as a blue-green to gray-green color (i.e. a drought like appearance) with a yellow to yellow-orangish color of the leaf blades at discoloration/phytotoxicity ratings of 5.0 or less. Growth/stunting of KB was evident with all Certainty treatments. Discoloration and slight stunting of KB growth was evident 7-10 days after Certainty application. Both treatments of Certainty resulted in very noticeable discoloration and stunting of KB at three to four weeks after application (i.e. Aug 15), with ratings of 5 and 6 at the high rate and low rate, respectively. The 5-6 discoloration/stunting ratings lasted for 4-5 weeks after Certainty application (i.e. Sep 1) before recovery was evident (i.e. Sep 15). TF control became very evident at approximately three weeks after Certainty application (i.e. Aug 15) with 50% and 77% control at the Certainty sequential rates of 0.035 and 0.047 lb ai/A,

47
respectively. TF control continued to increase through September 15 with final ratings of 87% and 93% for the sequential rates of 0.035 and 0.047 lb ai/A, respectively. KB completely recovered from the discoloration and stunting shortly after the September 15 rating and no thinning of the KB stand was ever evident at any rating date. TF control was good to excellent at these sequential rates (i.e. > 90%); however moderate discoloration and KB growth/stunting will remain noticeable for three to four weeks after Certainty application.
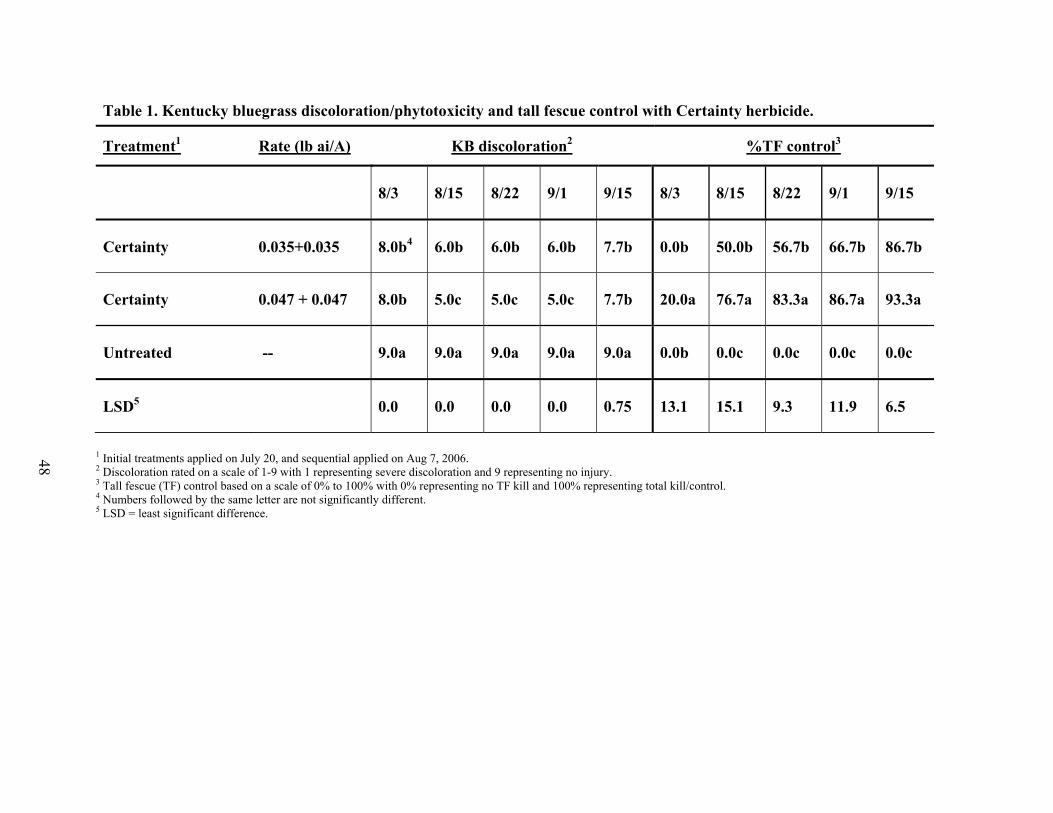
48
Table 1. Kentucky bluegrass discoloration/phytotoxicity and tall fescue control with Certainty herbicide.
Treatment1 Rate (lb ai/A) KB discoloration2 %TF control3
8/3 8/15 8/22 9/1 9/15 8/3 8/15 8/22 9/1 9/15
Certainty 0.035+0.035 8.0b4 6.0b 6.0b 6.0b 7.7b 0.0b 50.0b 56.7b 66.7b 86.7b
Certainty 0.047 + 0.047 8.0b 5.0c 5.0c 5.0c 7.7b 20.0a 76.7a 83.3a 86.7a 93.3a
Untreated -- 9.0a 9.0a 9.0a 9.0a 9.0a 0.0b 0.0c 0.0c 0.0c 0.0c
LSD5 0.0 0.0 0.0 0.0 0.75 13.1 15.1 9.3 11.9 6.5
1 Initial treatments applied on July 20, and sequential applied on Aug 7, 2006. 2 Discoloration rated on a scale of 1-9 with 1 representing severe discoloration and 9 representing no injury. 3 Tall fescue (TF) control based on a scale of 0% to 100% with 0% representing no TF kill and 100% representing total kill/control. 4 Numbers followed by the same letter are not significantly different. 5 LSD = least significant difference.
48

49
Attachment Tall fescue (TF) control was evaluated in the fall of 2006 at four treatments with the initial treatment on August 12, 2006 and the sequential application on September 9. The treatments were (1) Certainty at 0.0234 lbs ai/A with a sequential, (2) Certainty at 0.035 lb ai/A with a sequential, (3) Certainty at 0.047 lb ai/A with a sequential and (4) untreated. Treatments were applied to a mature stand of 100% Kentucky 31 Tall fescue. Table 2 provides discoloration and % TF control data using the same numeric scales as the previous TF study. Materials and Methods were similar to the previous study except this study was conducted on 100% Tall fescue. TF discoloration was rate dependant and consistently declined in color from August 12 through the final rating date of October 20. Certainty at 0.035 and 0.047 lb ai/A sequential resulted in total browning of the TF by October 20. These latter treatments also resulted in 96 – 100% TF control. Certainty at 0.0234 lb ai/A + sequential did not totally discolor TF (i.e 4.0) and resulted in only 50% TF control.

50
Table 2. Tall fescue discoloration/phytotoxicity and control/kill with Certainty from fall 2006 treatments.
Treatment1 Rate (lb ai/A) TF discoloration2 %TF control3
8/22 8/30 9/16 9/30 10/20 8/22 8/30 9/16 9/20 9/30
Certainty 0.0234+0.0234 8.0b4 6.0b 5.3a 5.0b 4.0a 0.0a 0.0a 10.0c 30.0c 50.0c
Certainty 0.035 + 0.035 7.0c 5.0c 4.3b 3.0c 1.0b 0.0a 0.0a 30.0b 76.7b 96.0b
Certainty 0.047+0.047 6.0d 4.0d 3.3c 2.0d 1.0b 0.0a 0.0a 53.3a 93.3a 99.7a
Untreated -- 9.0a 9.0a 0.0d 9.0a 0.0c 0.0a 0.0a 0.0d 0.0d 0.0d
LSD5 0.0 0.0 0.6 0.0 0.0 0.0 0.0 5.8 6.9 1.7
1 Initial treatments applied on August 12, and sequential applied on September 9, 2006. 2 Discoloration of Tall fescue rated on a scale of 1-9 with 1 representing severe discoloration (browning) and 9 representing no discoloration. 3 Tall fescue (TF) control based on a scale of 0% to 100% with 0% representing no TF control and 100% representing complete kill. 4 Numbers followed by the same letter are not significantly different. 5 LSD = least significant difference.
50
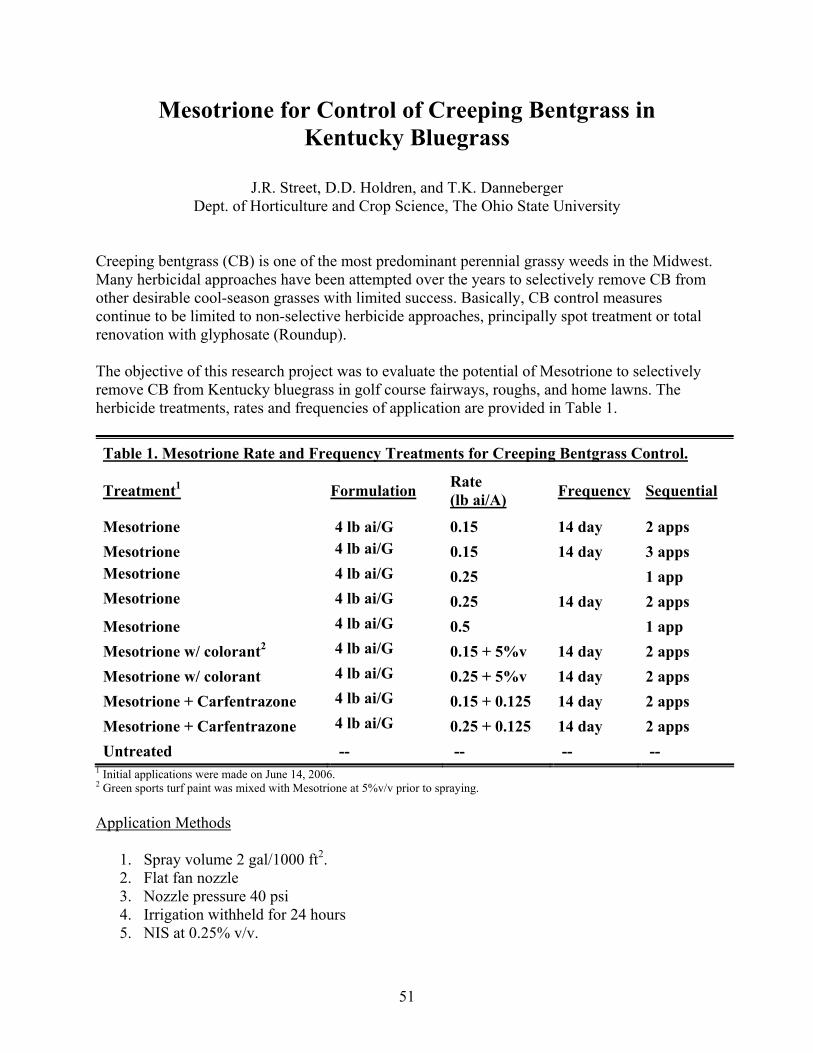
51
Mesotrione for Control of Creeping Bentgrass in Kentucky Bluegrass
J.R. Street, D.D. Holdren, and T.K. Danneberger
Dept. of Horticulture and Crop Science, The Ohio State University
Creeping bentgrass (CB) is one of the most predominant perennial grassy weeds in the Midwest. Many herbicidal approaches have been attempted over the years to selectively remove CB from other desirable cool-season grasses with limited success. Basically, CB control measures continue to be limited to non-selective herbicide approaches, principally spot treatment or total renovation with glyphosate (Roundup). The objective of this research project was to evaluate the potential of Mesotrione to selectively remove CB from Kentucky bluegrass in golf course fairways, roughs, and home lawns. The herbicide treatments, rates and frequencies of application are provided in Table 1.
Table 1. Mesotrione Rate and Frequency Treatments for Creeping Bentgrass Control.
Treatment1 Formulation Rate (lb ai/A) Frequency Sequential
Mesotrione 4 lb ai/G 0.15 14 day 2 apps Mesotrione 4 lb ai/G 0.15 14 day 3 apps Mesotrione 4 lb ai/G 0.25 1 app Mesotrione 4 lb ai/G 0.25 14 day 2 apps Mesotrione 4 lb ai/G 0.5 1 app Mesotrione w/ colorant2 4 lb ai/G 0.15 + 5%v 14 day 2 apps Mesotrione w/ colorant 4 lb ai/G 0.25 + 5%v 14 day 2 apps Mesotrione + Carfentrazone 4 lb ai/G 0.15 + 0.125 14 day 2 apps Mesotrione + Carfentrazone 4 lb ai/G 0.25 + 0.125 14 day 2 apps Untreated -- -- -- --
1 Initial applications were made on June 14, 2006. 2 Green sports turf paint was mixed with Mesotrione at 5%v/v prior to spraying. Application Methods
1. Spray volume 2 gal/1000 ft2. 2. Flat fan nozzle 3. Nozzle pressure 40 psi 4. Irrigation withheld for 24 hours 5. NIS at 0.25% v/v.

52
6. Plot size 3’X8’ 7. Randomized complete block design. 8. Three replications.
Bentgrass Phytotoxicity/Discoloration Kentucky bluegrass (KB) showed no signs of phytotoxicity or discoloration at any rate/frequency of treatments throughout the study so no KB data is reported. Creeping bentgrass (CB) injury became apparent within 3-5 days after application as a bleaching or whitening of the leaf blades. The phytotoxicity/discoloration was scored on a scale of 1 to 9, with 1 representing complete bleaching or whitening of the plot and 9 representing no discoloration (Table 2). A discoloration of 5 still resulted in the presence of some green leaf tissue in the lower canopy. Creeping bentgrass (CB) control was scored on a scale of 0 to 100%, with 0% representing no control and 100% representing complete kill or control (Table 2). CB bleaching/whitening of the leaf tissue became apparent within 3 to 5 days after herbicide application with higher application rates showing the most discoloration initially. All treatments resulted in a bleaching/whitening of the foliage of ≤ 5.0 by June 23 (i.e. 9 days after application). In general, the higher rates and multiple applications resulted in the greatest amount of discoloration. For example, Mesotrione at 0.25 lbs ai/A with 2 applications resulted in greater discoloration than 0.15 lbs ai/A with 2 applications. The greatest discoloration occurred with Mesotrione at 0.15 lb ai/A with 3 applications, 0.25 lb ai/A with 2 applications, 0.25 lb ai/A + 5% v/v colorant with 2 applications, and 0.25 lb ai/A + 0.125 lb ai/A Carfentrazone (i.e see July 9 – Table 2). By July 9, most treatments exhibited discoloration scores of ≤ 3.3; however not all these treatments provided acceptable CB control on the final rating date of August 15 (Table 2). Bentgrass Control with Mesotrione Best CB control with Mesotrione (i.e. > 90%) occurred at 0.15 lb ai/A with 3 applications, 0.25 lb ai/A with 2 applications, and 0.25 lb ai/A + 5% v/v colorant with 2 applications. The addition of colorant did not significantly reduce the degree of foliage bleaching or whitening nor did it have any positive or negative effect on efficacy. The addition of Carfentrazone at the 0.15 or 0.25 lb ai/A Mesotrione rates did not provide any positive or significant effect for CB control. In conclusion, CB control with Mesotrione will require multiple (Sequential) applications with 3 applications at the 0.15 lb ai/A rate and with 2 applications at the 0.25 lb ai/A rate.

53
53

54
Influence of Nitrogen Source/ Rate and PGR Combinations on Creeping Bentgrass Color and Dollar Spot
Incidence and Severity
J.R. Street and D.D. Holdren Dept. of Horticulture and Crop Science, The Ohio State University
INTRODUCTION Good turfgrass growth is dependant on an adequate supply of all of the essential nutrients, as well as other environmental and cultural factors. Of the essential nutrients, nitrogen is the element that receives the most attention in turfgrass fertilization programs. Several reasons for emphasis on nitrogen in turf fertilization strategies are: (1) color and growth responses from nitrogen are usually more dominant than any other element; (2) nitrogen is very dynamic in soils, with the concentration normally being depleted over time; (3) nitrogen assists in turf recuperation; and (4) nitrogen influences stress tolerances and disease. More specifically, methods of nitrogen feeding (foliar versus granular) and plant growth regulator use are also management strategies of interest to superintendents today. Foliar or liquid feeding has become a trend for spoon-feeding nutrients to greens and even fairways. PGRs are being used for a variety of potential benefits including plant growth management and possibly stress tolerance enhancement. Research, however, on the benefits of these latter practices and their interactions on turf performance, health, disease, and soil nutrient diagnosis is limited to date.
OBJECTIVES The purposes of this study are to determine the effects of nitrogen source and rate, and plant growth regulators and their interactions on creeping bentgrass color/quality and disease incidence, particularly dollar spot (DS). There still appears to be questions by superintendents on optimum foliar sources and rates, efficiencies of foliar versus granular programs, and PGR interactions. There are also questions on the impact of PGR’s on disease and DS incidence.
MATERIALS AND METHODS This study was conducted on a mature stand of ‘Lopez’ creeping bentgrass (CB) maintained at a fairway height of ½” (1.3 cm) at The Ohio State Turfgrass Research and Education Facility in Columbus, Ohio in 2006. The study consisted of three nitrogen programs, two foliar and one granular and an unfertilized check split across two PGRs. The nitrogen fertilizer programs were (1) Bulldog 28-8-18 (a soluble material applied foliarly) at 0.25 lbs N/1000 ft2 applied weekly, (a treatment that has performed well in suppressing DS in other OSU nitrogen/DS trials), (2) Bulldog 28-8-18 at 0.125 lb N/1000 ft2 weekly, (a more realistic rate/program being used by superintendents), and (3) Griggs Turf Rally 16-4-8 (granular) applied at 1 lb N/M in mid-May and September 1 and at 0.5 lb N/M on July1 and August 1. The fertilizer treatments/programs were split with the labeled

55
rates of Trimmit and Primo applied on a monthly basis. The resultant design was a randomized split block design with twelve treatments and three replications. Mowing was performed three times a week (Monday, Wednesday, and Friday) using a Toro 3100 triplex mower with a bench setting of 1.3 cm and clippings were removed. Irrigation was provided on a regular basis to prevent wilt. No fungicide applications were made on the study site in 2005. Turfgrass color ratings were taken periodically (Table 1) using a scale of 1 to 9 with 1 representing poorest, 9 representing best, and 6 representing just acceptable. DS ratings were visual assessments of dollar spot coverage of plots using a scale of 0% =no DS to 100%= complete DS infection (Table 2).
RESULTS AND DISCUSSION Creeping bentgrass (CB) color and dollar spot severity as affected by nitrogen source/rate and plant growth regulator (PGR) are presented in Table 1. Color and Dollar spot NO PGR Color NO PGR: All fertilizer treatments resulted in significantly better color than unfertilized CB (Table 1). All fertilizer treatments with no PGR (NPGR) provided acceptable color throughout the growing season. The granular Griggs 16-4-8/NPGR treatments provided a better initial color response than both Bulldog/NPGR treatments (i.e. June 1 and June 9). Bulldog/NPGR at 0.25 lb N/M provided consistently better color ratings that averaged 1-2 color units higher than either Bulldog/NPGR at 0.125 lb N/M or Griggs/NPGR throughout the season. Dollar Spot (DS) NO PGR: The first major outbreak of DS occurred in mid to late June, 2006. All the fertilizer/NPGR treatments resulted in less DS than the unfertilized/NPGR treatment. Differences in DS severity among the fertilizer/NPGR treatments were not dramatic during June and July. DS severity during the June/July period averaged between 25-35% DS among the fertilized/NPGR treatments (Table 1). DS pressure intensified again in late July/early August, 2006. The Bulldog/NPGR at 0.25 lb N/M exhibited the least amount of DS during August/September with a range of 10-16%. In contrast, DS severity was similar between the Bulldog/NPGR at 0.125 lb N/M and the granular Griggs/NPGR treatments with DS severity in August in the 50-60% range. The unfertilized/NPGR treatments in August reached over 80% DS cover.

56
Color and Dollar Spot (DS) with PGR Color PGR: All the fertilizer /PGR treatments resulted in significantly better CB color than the unfertilized/PGR CB. The Bulldog/PGR at 0.25 lb N/M with both PGRs consistently provided better color throughout the season than Bulldog/PGR at 0.125 lb N/M and the granular Griggs/PGR with average color ratings of 1-1.5 units higher. Both PGRs provided consistently better color than the NPGR treatments for all fertilizer treatments and even the unfertilized NPGR treatment averaging 0.5-1.0 units higher than the NO PGR treatments. Unlike the fertilizer NPGR treatments, the granular Griggs/PGR treatments did not provide a better initial color/quality response compared to the other Bulldog/PGR treatments. Dollar Spot (DS) PGR: In general, dollar spot (DS) severity was reduced with all fertilizer treatments under both PGR programs relative to the Trimmit and Primo no fertilizer treatments. Trimmit (paclobutrazol) resulted in significantly less DS for all fertilizer treatments compared to the unfertilized Trimmit and all the Primo treatments. For example, DS incidence for the Bulldog/Trimmit at 0.25 lb N/M ranged from only 0 to 13.3% and 6.7 to 31.7% with and without Trimmit throughout the season, respectively. Bulldog/Trimmit at 0.25 lb N/M resulted in the least amount of DS among all the fertilizer/PGR treatments. Primo (trinexepac-ethyl) provided only a slight decrease in DS on most dates for all fertilizer/Primo treatments compared to the equivalent fertilizer/NPGR treatments. Primo certainly did not exhibit any evidence of enhanced DS activity. In conclusion, the frequency and rate of nitrogen applications obviously has significant effect on CB color/quality and DS severity, although the fertilizer programs in this study provided acceptable color ratings throughout the season (i.e. ≥ 6.0). None of the fertilizer/NPGR treatments provided acceptable season-long DS control (Table 2). Bulldog/NPGR at 0.25 lb N/M exhibited a trend for less DS relative to the other fertilizer/NPGR treatments; however, DS incidence with the latter treatment was still too high to be acceptable by most superintendents. Trimmit provided a significant reduction in DS severity relative to the NPGR and Primo treatments and consistently low DS incidence (i.e. ≤ 13%) throughout the season.

57
N rateTreatment (lb/M) Timing 1-Jun 9-Jun 21-Jun 4-Jul 10-Jul 28-Jul1.)Bulldog/No PGR 0.125 wkly 6.0c‡ 6.5d 6.5d 6.5d 6.5f 7.0d2.)Bulldog/No PGR 0.25 wkly 7.5b 7.5c 7.5b 8.0b 8.2b 8.5b3.)Griggs/No PGR 3.0 annually 9.0a 8.7a 7.0c 6.5d 7.3de 7.0d4.)Check/No PGR -- -- 4.0d 4.0e 4.0f 3.3f 2.0i 4.0f5.)Bulldog/Trimmit 0.125 wkly 6.0c 6.8d 7.0c 7.0c 7.0e 7.5c6.)Bulldog/Trimmit 0.25 wkly 7.5b 8.0b 8.5a 8.5a 8.7a 9.0a7.)Griggs/Trimmit 3.0 annually 9.0a 9.0a 7.5b 7.0c 7.8bc 7.5c8.)Check/Trimmit -- -- 4.0d 4.0e 4.3e 4.0e 3.0h 4.5e9.)Bulldog/Primo 0.125 wkly 6.0c 6.7d 7.0c 7.0c 7.5cd 7.5c10.)Bulldog/Primo 0.25 wkly 7.5b 8.0b 8.5a 8.5a 8.8a 9.0a11.)Griggs/Primo 3.0 annually 9.0a 8.8a 7.0c 7.0c 7.8bc 7.5c12.)Check/Primo -- -- 4.0d 4.0e 4.3e 4.0e 3.5g 4.5eLSD 0 0.3 0.2 0.3 0.4 0
N rateTreatment (lb/M) Timing 7-Aug 18-Aug 28-Aug 5-Sep 20-Sep 17-Oct1.)Bulldog/No PGR 0.125 wkly 7.0d 7.0e 7.2e 7.5d 7.0d 7.0c2.)Bulldog/No PGR 0.25 wkly 8.0b 8.5b 8.5b 8.3b 8.0b 8.5a3.)Griggs/No PGR 3.0 annually 7.5c 7.5d 7.5d 7.5d 7.0d 7.5b4.)Check/No PGR -- -- 3.0f 3.0g 3.0g 3.0g 3.0e 2.5d5.)Bulldog/Trimmit 0.125 wkly 7.7c 8.0c 8.0c 8.3b 7.5c 7.0c6.)Bulldog/Trimmit 0.25 wkly 8.5a 8.5b 9.0a 9.0a 8.5a 8.5a7.)Griggs/Trimmit 3.0 annually 8.0b 8.0c 8.0c 9.0a 7.5c 7.5b8.)Check/Trimmit -- -- 4.0e 4.0f 4.0f 4.5e 3.0e 2.5d9.)Bulldog/Primo 0.125 wkly 7.7c 8.0c 8.0c 8.2c 7.5c 7.0c10.)Bulldog/Primo 0.25 wkly 8.5a 9.0a 9.0a 9.0a 8.5a 8.5a11.)Griggs/Primo 3.0 annually 8.0b 8.0c 8.0c 8.5b 7.5c 7.5b12.)Check/Primo -- -- 4.0e 4.0f 4.0f 4.0f 3.0e 2.5cLSD 0.2 0 0.1 0.2 0 0.0†Dollar spot ratings are a visual percentage of plot infected with DS
Table 1. Turfgrass color/quality as affected by nitrogen source,rate and growth regulator.
‡ numbers followed by the same letter are not significantly different.
color/quality†Table 1, continued;
color/quality†

58
N rateTreatment (lb/M) Timing 21-Jun 27-Jun 4-Jul 10-Jul 15-Jul 25-Jul 10-Aug 20-Aug 10-Sep1.)Bulldog/No PGR 0.125 wkly 5.0bcd‡ 23.3bc 30.0bc 36.7bc 41.7ab 46.7ab 50.0d 50.0d 18.3bc2.)Bulldog/No PGR 0.25 wkly 6.7abcd 28.3ab 25.0cd 30.0cd 31.7cd 25.0d 16.7g 13.3e 10.0ef3.)Griggs/No PGR 3.0 annually 10.0ab 28.3ab 36.7ab 28.3cd 33.3bc 50.0a 60.0c 66.7b 20.0b4.)Check/No PGR -- -- 13.3a 30.0a 40.0a 46.7a 48.3a 56.7a 80.0a 80.0a 31.7a5.)Bulldog/Trimmit 0.125 wkly 0.0d 1.7d 3.3e 10.0fg 13.3f 21.7d 26.7f 46.7d 13.3de6.)Bulldog/Trimmit 0.25 wkly 1.7cd 5.0d 3.3e 5.0g 6.7f 5.0e 10.0h 13.3e 0.0g7.)Griggs/Trimmit 3.0 annually 0.0d 5.0d 10.0d 6.7g 15.0ef 28.3cd 41.7e 53.3cd 10.0ef8.)Check/Trimmit -- -- 8.3abc 5.0d 6.7e 16.7ef 23.3de 28.3cd 50.0d 60.0bc 16.7bcd9.)Bulldog/Primo 0.125 wkly 6.7abcd 21.7c 25.0cd 26.7d 33.3bc 36.7bc 40.0e 50.0d 18.3bc10.)Bulldog/Primo 0.25 wkly 8.3abc 25.0abc 21.7d 26.7d 31.7cd 25.0d 20.0g 18.3e 8.3f11.)Griggs/Primo 3.0 annually 8.3abc 26.7abc 33.3ab 25.0de 31.7cd 50.0a 53.3d 65.0b 15.0cd12.)Check/Primo -- -- 11.7ab 30.0a 36.7ab 40.0ab 40.0abc 55.0a 70.0b 75.0a 31.7aLSD 6.9 5.8 7.0 8.8 8.8 10.7 6.2 7.3 3.9†Dollar spot ratings are a visual percentage of plot infected with DS
%Dollar Spot†Table 2. Dollar spot incidence/severity as affected by nitrogen source,rate and growth regulator.
‡ numbers followed by the same letter are not significantly different.
58

59
Dr. Hannah Mathers, OSU Extension Specialist - Nursery & Landscape
E A S TE3 RB 6 E2 O 3 E1 C 6 E1 C 9 E2 C 9 E2 O 9
N E3 RB 5 E2 O 2 E1 C 5 E1 C 8 E2 C 8 E2 O 8 SO E3 RB 4 E2 O 1 E1 C 4 E1 C 7 E2 C 7 E2 O 7 OR E1 C 3 E3 RB 9 E3 M 3 E2 M 9 E1 M 9 E1 O 12 E2 O 12 UT E1 C 2 E3 RB 8 E3 M 2 E2 M 8 E1 M 8 E1 O 11 E2 O 11 TH E1 C 1 E3 RB 7 E3 M 1 E2 M 7 E1 M 7 E1 O 10 E2 O 10 H
E2 RB 3 E1 O 6 E2 C 6 E1 M 6 E3 O 12 E1 C 12 E3 C 12E2 RB 2 E1 O 5 E2 C 5 E1 M 5 E3 O 11 E1 C 11 E3 C 11E2 RB 1 E1 O 4 E2 C 4 E1 M 4 E3 O 10 E1 C 10 E3 C 12E3 C 3 E3 O 6 E3 C 6 E2 M 6 E2 M 9 E1 RB 12 E2 RB 12E3 C 2 E3 O 5 E3 C 5 E2 M 5 E2 M 8 E1 RB 11 E2 RB 11E3 C 1 E3 O 4 E3 C 4 E2 M 4 E2 M 7 E1 RB 10 E2 RB 10E2 M 3 E1 O 3 E3 O 9 E1 RB 9 E2 O 6 E1 M 12 E2 C 12E2 M 2 E1 O 2 E3 O 8 E1 RB 8 E2 O 5 E1 M 11 E2 C 11E2 M 1 E1 O 1 E3 O 7 E1 RB 7 E2 O 4 E1 M 10 E2 C 10E1 RB 3 E2 C 3 E1 O 9 E1 RB 6 E3 M 6 E3 M 9 E3 M 12E1 RB 2 E2 C 2 E1 O 8 E1 RB 5 E3 M 5 E3 M 8 E3 M 11E1 RB 1 E2 C 1 E1 O 7 E1 RB 4 E3 M 4 E3 M 7 E3 M 10E3 RB 3 E3 O 3 E1 M 3 E2 RB 6 E2 RB 9 E3 RB 12 E3 C 9E3 RB 2 E3 O 2 E1 M 2 E2 RB 5 E2 RB 8 E3 RB 11 E3 C 8E3 RB1 E3 O 1 E1 M 1 E2 RB 4 E2 RB 7 E3 RB 10 E3 C 7
1 2 3 4 5 6 7
W E S T
12 feet between rows and 6 feet between trees in rows.(Dimension of the field is 120' x 72')E1=cravo grown liners RB=Red bud (Cercis)E2=outside grown liners M=Maple (Acer)E3=Liners from Oregon C=Crabapple (Malus)
O=Oak (Quercus)
Tree Liner Study in Waterman Field (2004)

60
Evaluation of the Influence of Postemergent Herbicides and Fertility in Nursery Tree Bark Cracking
Kyle Daniel, Dr. Hannah Mathers, Luke Case
Dept. of Horticulture and Crop Science, The Ohio State University
Bark cracking on nursery tree stock is an occurrence affecting growers across the country,
resulting in millions of dollars in losses (Mathers 2006). This phenomenon is not solely an
environmental problem. This is also attributed to the fact that the occurrence is increasing in severity
and it is occurring in so many varying locations, from the Southeast to the Northwest. Thin-barked
trees are more susceptible to developing a crack in the bark (Coder 2006). Butin and Shigo (1981)
stated that the actual cause of bark splitting is a preset wound. This wound can be induced by a
number of various factors, such as: excess fertilization, heavy pruning, late cultivation, spray injury,
and thin/sandy soils (Simons 1995). The cold injury is what makes the crack in the bark, but it is the
factor previously present that triggers the visible wound.
The purpose of this project is to investigate the role of tree guards, fertility, sucker removal
and timing by mechanical or chemical means, and postemergent herbicide applications (specifically
glyphosate) as possible causal agents that have contributed to this intensification of bark cracking
losses throughout the United States. Plants utilized in this study are Magnolia virginiana and Cornus
kousa. Treatments are: Roundup Original Max, Roundup Pro, Kleen Up Pro, mechanical, and control.
Visual readings and cold hardiness will be evaluated.
Project Funding: Horticultural Research Institute
Special Thanks: Heritage Seedlings Inc. and Klyn Nurseries Inc.

61
Evaluation of the Influence of Postemergent Herbicides and Fertility in Nursery Tree Bark Cracking
1 RU org. Max Fert. Plants Used (Magnolia virginiana and Cornus kousa )2 RU Pro 125 lbs 1 7 plants per species x 2 species3 Kleen Up Pro 250 lbs. 2 equals 14 plants per fertilizer/treatment combination.4 Mechanical (Total of 98 plants per row)5 Control
Row 1 Row 2 Row 3 Row 4 Row 5 Row 6 Row 7 Row 8Fert Trt Fert Trt Fert. Trt Fert Trt Fert Trt Fert Trt Fert Trt Fert Trt
1 1 2 2 2 1 1 5 2 2 2 4 2 1 1 41 3 2 3 1 4 1 1 2 5 2 5 2 5 1 5 2 1 1 5 1 4 1 2 2 2 2 21 4 2 5 1 1 1 2 1 3 2 1 1 31 2 2 2 1 3 2 1 1 4 2 3 1 12 5 2 3 1 2 2 3 1 5 2 4 1 22 4 2 4 1 3 2 4 1 1 2 3 1 5
61

62
Field Evaluation of Various Herbicide Formulations Combined with Mulches
Upender Somireddy, Hannah Mathers, and Luke Case
Dept. of Horticulture and Crop Science, The Ohio State University Weeds not only compete for resources like nutrients, light and space etc., but they also reduce
the aesthetics of plants and landscape. Different weed control strategies have been implemented, but none of them alone is effective. Chemical control is the most important method of controlling weeds in the nursery and landscape industry. Multiple applications per year are often needed. Some of the problems associated with the use of herbicides are phytotoxicity, leaching, spray drift, runoff, and herbicide resistance. Herbicide-treated mulches, an integrated weed management approach, can be a potential approach to control weeds for a longer period of time, while reducing weed control costs and herbicides in the environment. The objective of this study was to evaluate previously untested granular plus mulch combinations at various depths of mulching compared to liquid formulations of herbicides combined with mulches. In addition, two new granular + mulch combinations were evaluated in which one is currently commercially available.
Two types of mulches, hardwood and pine nuggets, were tried alone at different depths (1, 2.5, and 5 inches) and in combination with Snapshot 2.5TG [isoxaben + trifluralin at 1.0 lb ai/ac + 4 lb ai/ac respectively (Dow AgroSciences, Indianapolis, IN)] or a liquid formulation consisting of Treflan HFP (Dow AgroSciences) + Gallery (Dow AgroSciences) at 1.0 lb ai/ac + 4 lb ai/ac, respectively. The three mulching depths represent the recommended depth (2.5”), the depth previously evaluated (1”) and a depth closer approximating what is used in industry (5”). There were a total of 35 treatments including untreated mulches at three depths, herbicides applied alone, two commercially available herbicide treated mulches, and untreated control. Two experiments, one in October 2006 (fall) and another one in May 2007 (spring), were set up in randomized complete block design, and replicated five times. Visual readings were taken at 30, 90, 180 and 210 days after treatment (DAT) for the fall experiment and 30 DAT for the spring experiment. Visual readings were based on a scale of 0 (no control) to 10 (complete control), with 7 and above commercially acceptable. The visual ratings of 28 treatments were seven or above at 180 DAT for the fall experiment. The other seven treatments which have visual readings less than commercially acceptable level are Snapshot, Snapshot over PN @ 1-inch depth, Treflan + Gallery under pine nuggets @ 1-inch depth, Treflan + Gallery over hardwood @ 1-inch depth, Treflan + Gallery treated hardwood @ 1 inch, untreated hard wood @ 1 inch, and control. At 210 DAT, 20 treatments were found to be at or above commercially acceptable levels. All of those commercially acceptable except three are mulch and herbicide combined treatments. In the spring experiment at 30 DAT, the visual readings of 28 treatments were found to be ≥7. The above results indicated that to get effective long-term weed control, herbicides and mulches have to be applied together at least 2.5 inches thick or mulches alone can be applied at 5.0 inches deep, which is an expensive practice. Applying mulches at recommended depths combined with preemergent herbicides seems to be effective in controlling weeds. This practice could reduce weed control costs while keeping the environment healthy.

63

64
Experiment on Mulches: Experiment started on 20 October 2006 Treatments:
1. Snapshot 2. Snapshot over pine nuggets (PN) @ 1 inch depth 3. Snapshot over pine nuggets @ 2.5 inches depth 4. Snapshot over pine nuggets @ 5.0 inches depth 5. Snapshot over Hard wood (HW) @ 1 inch depth 6. Snapshot over Hard wood @ 2.5 inches depth 7. Snapshot over Hard wood @ 5.0 inches depth 8. Treflan + Gallery 9. Treflan + Gallery over pine nuggets @ 1 inch 10. Treflan + Gallery over pine nuggets @ 2.5 inches 11. Treflan + Gallery over pine nuggets @ 5.0 inches 12. Treflan + Gallery under pine nuggets @ 1 inch 13. Treflan + Gallery under pine nuggets @ 2.5 inch 14. Treflan + Gallery under pine nuggets @ 5.0 inch 15. Treflan + Gallery over HW @ 1 inch 16. Treflan + Gallery over HW @ 2.5 inch 17. Treflan + Gallery over HW @ 5.0 inch 18. Treflan + Gallery under HW @ 1 inch 19. Treflan + Gallery under HW @ 2.5 inch 20. Treflan + Gallery under HW @ 5.0 inch 21. Treflan + Gallery treated PN @ 1 inch 22. Treflan + Gallery treated PN @ 2.5 inches 23. Treflan + Gallery treated PN @ 5.0 inches 24. Treflan + Gallery treated HW @ 1 inches 25. Treflan + Gallery treated HW @ 2.5 inches 26. Treflan + Gallery treated HW @ 5.0 inches 27. Untreated PN @ 1.0 inch 28. Untreated PN @ 2.5 inch 29. Untreated PN @ 5.0 inch 30. Untreated HW @ 1.0 inch 31. Untreated HW @ 2.5 inches 32. Untreated HW @ 5.0 inches 33. Weedstop at recommended depth 34. Mulch with snapshot 35. Control

65

66
Experiment on Mulches: Experiment started on 15 May 2007 Treatments:
36. Snapshot 37. Snapshot over pine nuggets (PN) @ 1 inch depth 38. Snapshot over pine nuggets @ 2.5 inches depth 39. Snapshot over pine nuggets @ 5.0 inches depth 40. Snapshot over Hard wood (HW) @ 1 inch depth 41. Snapshot over Hard wood @ 2.5 inches depth 42. Snapshot over Hard wood @ 5.0 inches depth 43. Treflan + Gallery 44. Treflan + Gallery over pine nuggets @ 1 inch 45. Treflan + Gallery over pine nuggets @ 2.5 inches 46. Treflan + Gallery over pine nuggets @ 5.0 inches 47. Treflan + Gallery under pine nuggets @ 1 inch 48. Treflan + Gallery under pine nuggets @ 2.5 inch 49. Treflan + Gallery under pine nuggets @ 5.0 inch 50. Treflan + Gallery over HW @ 1 inch 51. Treflan + Gallery over HW @ 2.5 inch 52. Treflan + Gallery over HW @ 5.0 inch 53. Treflan + Gallery under HW @ 1 inch 54. Treflan + Gallery under HW @ 2.5 inch 55. Treflan + Gallery under HW @ 5.0 inch 56. Treflan + Gallery treated PN @ 1 inch 57. Treflan + Gallery treated PN @ 2.5 inches 58. Treflan + Gallery treated PN @ 5.0 inches 59. Treflan + Gallery treated HW @ 1 inches 60. Treflan + Gallery treated HW @ 2.5 inches 61. Treflan + Gallery treated HW @ 5.0 inches 62. Untreated PN @ 1.0 inch 63. Untreated PN @ 2.5 inch 64. Untreated PN @ 5.0 inch 65. Untreated HW @ 1.0 inch 66. Untreated HW @ 2.5 inches 67. Untreated HW @ 5.0 inches 68. Weedstop at recommended depth 69. Mulch with snapshot 70. Control


![Lenten Lamentations [Gorzkie Zale]](https://static.fdocuments.us/doc/165x107/577d2d491a28ab4e1ead58d7/lenten-lamentations-gorzkie-zale.jpg)
