2007 CDM Third Tranche Funding GHESI Mar 30 08 · For 2007, the TRC analysis at the Portfolio level...
70
2007 Annual Report, CDM Third Tranche Funding, Guelph Hydro Electric Systems Inc. RP-2004-0203\EB-2005-0203 March 31, 2008
Transcript of 2007 CDM Third Tranche Funding GHESI Mar 30 08 · For 2007, the TRC analysis at the Portfolio level...

2007 Annual Report, CDM Third Tranche Funding, Guelph
Hydro Electric Systems Inc.
RP-2004-0203\EB-2005-0203
March 31, 2008

Page i
Table of Contents
Page
1. Introduction 1
1.1. 2007 Objectives 1
1.2. Measurement 1
1.3. Discount Rate 2
2. Evaluation of the CDM Plan 2
2.1. TRC Results at the Portfolio Level 2
3. Discussions of Programs 3
3.1. Residential Programs 3
3.1.1. Education and Promotion 3
3.1.1.1. CDM Memberships and Workshops 3
3.1.1.2. Guelph Environmental Leadership 4
3.1.1.3. Operation Power Down 4
3.1.1.4. Kill-A-Watt 5
3.1.1.5. Earth Day 5
3.1.1.6. GEL Kiosk Benchmarking 6
3.1.1.7. Conservation Promotion 7
3.1.2. Low Income Programs 8
3.1.2.1. Seasonal Baskets 8
3.1.2.2. Light Up a Life 8
3.1.3. Technology, Research and Demonstration 9
3.1.3.1. Residential Solar 9
3.2. Commercial Programs 9
3.2.1.1. City Water Treatment Facility 9
3.3. Institutional Programs 10
3.3.1. School Board Load Control 10
3.3.2. University of Guelph Lighting 10
3.4. LDC Programs 11
3.4.1. LDC System Optimization 11
3.5. Smart Meters 12

Page ii
Page
4. Lessons Learned 12
4.1. Residential Programs 12
4.2. Commercial Programs 13
4.3. Institutional Programs 13
5. Conclusion 13
5.1. GHESI Budget and Costs 13
6. Appendices 16
6.1. Appendix A: 2007 Guelph Hydro – Evaluation of the CDM Plan 16
6.2. Appendix B: Discussion of the Programs 17
6.2.1. Residential Programs 17
6.2.1.1. Education and Promotion Programs 17
6.2.1.1.1. CDM Memberships and Workshops 17
6.2.1.1.2. Guelph Environmental Leadership 19
6.2.1.1.3. Operation Power Down 21
6.2.1.1.4. Kill-A-Watt 23
6.2.1.1.5. Earth Day 25
6.2.1.1.6. GEL Kiosk Benchmarking 27
6.2.1.1.7. Conservation Promotion 29
6.2.1.2. Low Income Programs 31
6.2.1.2.1. Seasonal Baskets 31
6.2.1.2.2. Light Up a Life 33
6.2.1.3. Technology Research & Innovation 35
6.2.1.3.1. Solar Meter 35
6.2.2. Commercial Programs 37
6.2.2.1.1. City Water Treatment 37
6.2.3. Institutional Programs 39
6.2.3.1. School Board Load Control 39
6.2.3.2. University of Guelph Lighting 39

Page iii
Page
6.2.4. LDC Programs 43
6.2.4.1. LDC System Optimization 43
6.2.5. Smart Meters 45
6.3. Appendix C: GHESI Program and Portfolio Totals 47
6.4. Appendix D: GEL Calendar Excerpts 54
6.5. Appendix E: Operation Power Down Press Release 58
6.6. Appendix F: Kill-A-Watt Sample Worksheet 59
6.7. Appendix G: Earth Day Article – Guelph Tribune June 29, 2007 60
6.8. Appendix H: Chamber of Commerce Advertisement 61
6.9. Appendix I: Thank You Letter from Salvation Army 62
6.10. Appendix J: Light Up a Life Article 63
6.11. Appendix K: School Board Load Control TRC Details 64
6.12. Appendix L: City Water Treatment Cogen TRC Details 65
6.13. Appendix M: LDC System Optimization TRC Details 66

Page 1
1. Introduction
On September 28, 2007, Guelph Hydro Electric Systems Inc. (GHESI) requested an extension to their Conservation and Demand Management (CDM) program in order to allow for several projects that faced delays to be completed. The Ontario Energy Board (OEB) subsequently approved this extension. Therefore, GHESI will be filing a 2008 CDM report by March 31, 2009.
1.1. 2007 Objectives
The ultimate goal of GHESI’s Conservation and Demand Management Plan is to create a “conservation culture” through sustained behavioural change in all of its customers. This goal is aligned with its vision,
“Delivering sustainability through innovative energy solutions and the most energy efficient customers”,
And also the vision of GHESI’s parent company, Guelph Hydro Inc.,
“Powering community well-being and environmental stewardship with energy and information solutions”.
GHESI’s objective is to provide an array of CDM programs over a broad cross-section of its customer base to continue to learn about the relative strengths and weaknesses of various approaches to stimulate a conservation culture locally. The CDM funded incentives in 2007 continued to support diverse programs ranging from educational programs to school board load control systems and lighting retrofits. Overall, the approach was to continue to encourage and stimulate a conservation culture while evaluating the cost effectiveness of various methods of achieving this goal. The learning around the cost effectiveness of various energy conservation and demand management initiatives will continue to assist GHESI in planning future CDM programs.
1.2. Measurement
GHESI used the measurements provided by the Ontario Energy Board (OEB) in the TRC Guidelines unless otherwise noted in Section 3, Discussions of Programs. Where a program or initiative did not have measurable results, GHESI provided as much tracking information as possible to support the success of the educational component of the initiatives.

Page 2
1.3. Discount Rate
The Net Present Value (NPV) discount rate used in the TRC analysis is 9.4% which is equal to 50% of the rate of return on deemed equity and 50% of the debt rate.
2. Evaluation of the CDM Plan
CDM Program Evaluation
GHESI’s CDM Plan was evaluated by following the OEB Total Resource Cost (TRC) Guide of October 14, 2005 as amended. A TRC analysis was done for each initiative and the initiative results were then reported in the required Appendices.
2.1. 2007 TRC Results at the Portfolio Level
For 2007, the TRC analysis at the Portfolio level is shown in Appendix A. This analysis covered all the CDM initiatives that were implemented in 2007. The benefit to cost ratio for the 2007 CDM portfolio is 1.21 and the Net TRC Benefit is $593,991. The 2007 CDM expenditures are shown in Appendix A and equal $533,056. The total electricity saved over the life cycle of the 2007 initiatives is 22,316,905 kilowatt-hours and total kW reductions for 2007 initiatives is 248 kW.
Program Analysis
The Residential programs had an overall TRC Benefit to Cost ratio of 1.31 with a cost to GHESI of $0.05 per kWh saved; the Commercial programs had an overall TRC Benefit to Cost ratio of 1.07; the Institutional programs had an overall TRC Benefit to Cost ratio of 2.40 with a cost to GHESI of $0.01 per kWh saved and the LDC programs had an overall TRC Benefit to Cost ratio of 2.33 with a cost to GHESI of $0.01 per kWh saved. Portfolio administration costs account for the difference between these program results and the overall results. Update on Smart Metering
Although there were no Smart Meters installed in 2007, GHESI did incur operating costs in 2007 that have been detailed in section 3.5.
CDM Budget Reallocations
As detailed in section 5 below, GHESI reallocated CDM Budget funds during 2007.

Page 3
3. Discussions of Programs
3.1. Residential Programs
3.1.1. Education and Promotion
An overview of GHESI’s Education and Promotion initiatives is provided below along with the CDM Budget expenditures and TRC Results at the Program level. An overview, a description of the actions taken, and a discussion of the applicable TRC results have been provided for each of the 2007 Education and Promotion initiatives.
Overview
Education and Promotion initiatives have the primary role of encouraging a sustainable conservation culture in the Guelph community.
Alternate methods of tracking have been provided for initiatives with no measurable conservation impact. However, some of these initiatives had components that were measurable, even when they were designed primarily as educational or promotional vehicles. In these cases, a TRC analysis was completed comparing the TRC costs of the initiative, including program costs, to the energy savings resulting from the measurable component(s). CDM Budget Expenditures
The Education and Promotion program has a CDM budget of $170,000 for the three-year period 2005 to 2007. GHESI spent $25,627 in 2007 for a year-to-life expenditure of $148,117 or 87%. During 2007, GHESI focused budget amounts on initiatives that were effective in achieving the goals of this program.
3.1.1.1. CDM Memberships and Workshops
Overview
Costs for memberships in associations and attendance at workshops related to CDM are included in this category. GHESI's goal is to ensure partnerships can be utilized whenever possible to reduce costs and to increase opportunities for CDM measures as well as to ensure staff has sufficient opportunity to learn from the CDM experiences of others.

Page 4
Description of Actions Taken
The annual fee of $1,500 for GHESI’s membership in the Canadian Energy Efficiency Alliance for 2007 has been included. TRC Results
There was no TRC completed for this initiative since there were no measurable benefits. However, the total CDM expenditures of $1,500 were included in the Residential program level TRC analysis.
3.1.1.2. Guelph Environmental Leadership
Overview
This initiative was a partnership with Guelph Environmental Leadership (GEL), a local public interest group. Description of Actions Taken
GEL produced a Guelph Environmental Leadership Calendar. GHESI sponsored two pages (February and August) of this 2008 calendar. These pages promote energy conservation through energy efficiency messaging, conservation tips, and a call to action for homeowners. GHESI’s contribution of $3,000 partially funded the creation and printing of 5,000 calendars. GHESI received 100 calendars for distribution to customers and employees. Copies of the sponsored pages have been provided in Appendix D. TRC Results
There was no TRC for this initiative since this was purely an educational initiative. The costs of $3,000 were included in the total Residential program TRC calculation.
3.1.1.3. Operation Power Down
Overview
A black out day challenge was held on August 13, 2007 in response to a friendly challenge from the City of Woodstock. The challenge was founded to commemorate the black-out of August 2003 and also creates awareness around energy conservation. A copy of the press release has been provided in Appendix E.

Page 5
Description of Actions Taken
Guelph’s total energy consumption during Operation Power Down was reduced by 2.4% of the baseline requirements for the city earning Guelph second place among the participating municipalities in Ontario. The IESO, who measured the reductions, estimated that the province of Ontario was able to avoid 1 million kWh of energy usage or about 0.5% of the province’s expected consumption during the voluntary blackout. CDM expenditures related to promotion and awareness of this event.
TRC Results
There was no TRC calculated for this awareness initiative. The costs of $2,279 were included in the total Residential program TRC calculation.
3.1.1.4. Kill-A-Watt
Overview
GHESI supplied Kill-A-Watt meters to the Guelph Public Library branches for residents to check out and use in their homes to learn about the electricity consumption of various appliances.
Description of Actions Taken
A total of 12 Kill-A-Watt meters were provided to the Guelph libraries initially. Due to the success of the program, and the large waiting list for lending the meters, the Library requested additional Kill-A-Watt meters for their branches. During the first 6 months, 114 Guelph residents borrowed the meters to learn more about their electricity consumption. A sample of the worksheet that residents were provided has been provided as Appendix F.
TRC Results
There was no TRC for this initiative since this was purely an educational initiative. The costs of $1,050 were included in the total Residential program TRC calculation.
3.1.1.5. Earth Day
Overview
GHESI partnered with Local Adult Rehabilitative Centre (ARC) Industries, a program of the Community Living Guelph Wellington, to build the Earth Day Kits that were sold by schools, libraries and at GHESI’s office. ARC Industries provides employment

Page 6
training and support to approximately one hundred and twenty five people who have an intellectual disability. The aim of the programs offered at ARC Industries is to encourage each participant to strive to attain their best possible level of employment, be it in the community or in the workshop. ARC Industries has a very supportive work environment where participants are encouraged to develop a sense of achievement, self-assurance and self-reliance.) The Guelph Tribune ran an article on June 29, 2007 on the Earth Day kits and ARC Industries that has been included as Appendix G. Description of Actions Taken
There were a total of 40,000 CFL bulbs purchased to fabricate 10,000 Earth Day Kits. Each kit includes 4 CFLs, a water flow measuring bag, toilet testing dye tabs, and a booklet with tips on saving energy in the home. The kits were provided to schools and the libraries to sell as a fundraiser. Each kit costs $20 and was sold for $10. For each kit sold, the schools kept $2 of the sale price for their fundraising efforts. The kits were also available for purchase at GHESI's offices. In the case of the GHESI and the libraries, they donated their $2 per kit to charity. GHESI’s charitable contributions were directed to “Adopt-A-Family” and the Guelph United Way. During 2007, 2,500 kits were sold and the remainder will be placed in inventory and sold during the upcoming year.
TRC Results
For TRC purposes, the total program costs of $137,179 related to all 10,000 kits were included while the benefits only included the 2,500 kits sold in 2007. The net TRC was $78,879 and the Benefit to Cost ratio was 1.83. The TRC results will improve once the remaining kits have been sold in 2008.
3.1.1.6. GEL Kiosk Benchmarking
Overview
GHESI contributed $25,000 toward the development of new software that allows customers to view their energy and water consumption patterns compared to various community benchmarks at kiosks to be located at various public locations in Guelph. Customers will be able to view their consumption compared to other similar sized households and homes in the community as well as other benchmarks enabling them to better understand how much energy they are using. In addition, the kiosk will provide information about their total carbon footprint including their automobile usage and other relevant energy expenditures. The other funding partners for this project include the OPA, the City of Guelph and the University of Guelph.

Page 7
Description of Actions Taken
In 2007, the University of Guelph was commissioned to develop the community benchmarking system software. A prototype was designed and developed, with GHESI providing aggregate customer electricity and water consumption information to refine the development of the benchmarking system. TRC Results
This is an educational tool that is being developed so there is no TRC. However, the $25,000 incentive provided by GHESI has been included in the TRC results at the Residential level.
3.1.1.7. Conservation Promotion
Overview
The conservation promotion initiatives for this program included advertising costs specific to CFL usage (as opposed to a particular program), an ad for the Chamber of Commerce showing 5 ways to manage energy costs and promoting CDM programs in general, small incidental costs related to the 2007 Switch to Cold Tide initiative as well as costs related to fridge temperature strips to help customers better understand their energy usage. Description of Actions Taken
GHESI promoted the use of CFLs through ads placed in the Guelph Mercury and Guelph Tribune newspapers. In addition, GHESI placed an ad with the Chamber of Commerce that described 5 steps to managing energy costs and promoting CDM programs to Guelph businesses. There was also an expenditure of $250 for Switch to Cold Tide. Finally, GHESI paid for refrigerator temperature strips to be made to help customers determine if their refrigerators were set to the ideal temperature range to store food (1 to 4 degrees Celsius or 34 to 40 degrees Fahrenheit). The Chamber of Commerce advertisement has been included as Appendix H. TRC Results
There was no TRC completed for this initiative since there were no measurable benefits. The CDM expenditure of $17,798 for the Conservation Promotion program was included in the Residential program level TRC analysis.
Page 8
3.1.2. Low Income Programs
The Low Income program addresses the needs of some of the more vulnerable residents in Guelph. Two initiatives undertaken in 2007 were Seasonal Baskets and Light Up a Life.
3.1.2.1. Seasonal Baskets
Overview
GHESI donated CFLs to be included in the Salvation Army’s Christmas Hamper program to provide relief to low-income families during the winter holidays. Description of Actions Taken GHESI’s contribution to the Seasonal Baskets consisted of one 13 Watt CFL to be included in each seasonal basket. GHESI donated a total of 550 CFLs for this annual program. The costs for the CFLs were reported in the 2005 annual report. A copy of the thank you letter from the Salvation Army has been provided as Appendix I. TRC Results
A TRC analysis was completed for the initiative comparing the total costs to the energy savings generated by the 13 watt CFLs provided in the baskets. The results of the analysis show a net TRC benefit of $10,606 and a TRC Benefit to Cost ratio of 11.71.
3.1.2.2. Light Up a Life
Overview
Rotary Club volunteers encouraged Canadian Tire patrons to donate CFLs or money to buy CFLs for low-income residents. GHESI agreed to match the donated CFLs. Description of Actions Taken
The Light Up a Life initiative was a partnership with the Rotary Club and resulted in the delivery of 400 CFLs to low income customers in Guelph. The CFL costs were included in 2005 and 2006. TRC Results
The Net TRC Benefits are $7,714 and the TRC Benefit Cost ratio is 11.71.

Page 9
3.1.3. Technology, Research and Demonstration
3.1.3.1. Solar Meter
Overview
During 2007 GHESI provided meter equipment at a solar demonstration site for a green residential community. Description of Actions Taken
The cost for the meter equipment at the solar demonstration project was $486. TRC Results
There was no TRC completed for this expenditure since the costs were incurred to showcase a new technology and did not generate any energy savings. However, the 2007 CDM expenditure of $486 was included in the Residential program level results.
3.2. Commercial Programs
3.2.1.1. City Water Treatment
Overview
The City of Guelph was offered a $100,000 incentive towards the upgrade of a co-generation facility at the City’s Waste Water Treatment facility. In 2007, a $50,000 partial payment of the incentive was awarded to the City, commensurate with the project milestones reached in 2007. An additional $50,000 has been committed upon completion of the project. The co-generation upgrade will be completed during 2008. Description of Actions Taken
The initial incentive payment of $50,000 reflects half of the total incentive promised to the City of Guelph for the co-generation upgrade at the water treatment facility. TRC Results
The 500 kW co-generation upgrade project will not be completed until 2008. The TRC was completed using assumptions including construction upgrade costs of $1.2 million, engineering costs of $250,000, annual heat recovered of 12,060 MMBtu, a 20 year equipment life, and an inflation rate of 2%. The TRC benefit to cost ratio is estimated

Page 10
to be 1.07. GHESI will work with the City of Guelph to obtain actual savings and cost data once this project has been completed.
3.3. Institutional Programs
3.3.1. School Board Load Control
Overview
GHESI provided an incentive to the Wellington District Catholic School Board toward completing automation system upgrades at two schools in 2007. One of the significant benefits of these projects was the ability for a 100-tonne chiller to be controlled that had previously run year round. Description of Actions Taken
The Wellington District Catholic School Board completed the repair and upgrade of the HVAC systems at two schools. The control systems were replaced, the heat pump loop plant was optimized, the boiler plant was optimized, and new control units were installed on all fan coil units, unit ventilators, heat pumps and Variable Air Volume units. Also, faulty valves and actuators were replaced. The chiller plant was optimized and new controls were installed. Finally, all outdoor lighting was added to proper controllers and is now being controlled by astronomical schedules. GHESI provided an incentive of $59,150 to the school board for these projects. TRC Results
Using a free rider assumption of 30%, the net TRC is $225,332 with a Benefit to Cost ratio of 3.08.
3.3.2. University of Guelph Lighting
Overview
The University of Guelph completed a lighting upgrade during 2007 to improve the energy efficiency of six buildings on campus. Description of Actions Taken
The university installed 3,557 higher efficiency lights as detailed in section 6.2.3.2. The lights replaced were chosen since they were at the end of their life expectancy. In cases where the exact technology was not in the OEB TRC measures list, the next closest technology was used for TRC purposes. For this project, the installed technologies that

Page 11
were not listed in the OEB TRC measures list were actually more energy efficient than those listed. TRC Results
The net TRC is $163,028 with a Benefit to Cost ratio of 1.96.
3.4. LDC Programs
3.4.1. LDC System Optimization
Overview
In order to obtain the greatest benefit from the installation of capacitor banks on GHESI's distribution system, GHESI studied the distribution feeders with temporary monitoring equipment to identify distribution feeders with a poor power factor. Based on the outcome of the monitoring study, GHESI identified seven 13.8 kV distribution feeders that were good candidates for capacitor bank installations. In order to estimate the anticipated energy savings due to improved power factor and hence reduced line losses, GHESI used a distribution system software modeling tool (DESS - "Distribution Engineering Simulation Software") to simulate feeder loading conditions before the addition of the capacitor banks, and compared the baseline results with the results simulating the installation of intelligent-control capacitor banks. The study concluded that strategic installation of the seven capacitor banks improved the average distribution feeder power factor from 0.88 to 0.93, resulted in demand savings of 62.75 kW, and annual energy savings of 428 MWh. Description of Actions Taken
Seven distribution feeders had intelligent-control capacitor banks installed under the CDM program at a total cost of $105,790. TRC Results
The TRC assumes that the capacitors have an equipment life of 20 years and the controllers have an equipment life of 10 years so a second set of controllers will be installed. The controller and installation costs of $8,400 have been escalated by 2% per year for inflation. The free ridership rate was assumed to be 30%. The net TRC is $104,415 with a Benefit to Cost ratio of 2.33.

Page 12
3.5. Smart Meters
Overview
These costs were incurred in support of the Smart Metering Pilot project undertaken in 2005/2006/2007. No additional equipment was installed in 2007, but operating costs were incurred as described below. Description of Actions Taken
No additional equipment was installed, but operating costs were incurred including the Hosting Service to provide system back-office daily operations for the duration of the pilot; Line & Maintenance Crew labour and vehicle costs to repair lost communications to meters through smart meter gateway; and metering labour and vehicle costs to effect repairs to smart metering system. Additional 2007 costs incurred included annual participation in an LDC Smart Metering consortium, which shares the results of various testing and experiences from other LDCs, to avoid duplication of effort in testing, evaluating and implementing Smart Metering, as well as the cost of local newspaper advertising to notify potential vendors of the then upcoming London RFP for Smart Meters and related communications technology, as required by the Ministry in a fair and transparent procurement process. TRC Results
There was no TRC completed for expenditure, however, the CDM expenditure for 2007 of $20,689 was included in the Smart Meter expenditures.
4. Lessons Learned
When dealing with agencies, school boards and municipalities, GHESI is not in control of the implementation timelines or project assessment and approval processes. GHESI encountered delays as noted in our request for extension to the third tranche CDM program that was subsequently approved by the OEB.
4.1. Residential Programs
Given the need to continue increasing awareness and participation in energy saving technology and behaviour, Education and Promotion programs were necessary in 2007.

Page 13
The purely educational initiatives continued to reach a large number of customers in a cost effective manner. Based on the objective of having a sustainable conservation culture in the Guelph Community, the interest demonstrated and the cost effective expenses incurred, GHESI was supportive of continuing to provide purely educational programs to its customers in 2007.
4.2. Commercial Programs
There are significant time requirements to develop commercial programs and commercial customers are not often able to make a commitment on GHESI’s timelines. This has been a significant hurdle in getting commercial projects implemented.
4.3. Institutional Programs
Through our work with the various school boards and the University, we have discovered that there is significant potential for energy efficiency improvements to be made. We have also found that these institutions will rely on incentives to make some of these upgrades happen. The projects at the schools boards were only possible with these Third Tranche incentives. In discussions with these institutions, we also note that in some cases the incentive levels considered by the institutions were still not sufficient to encourage the projects to proceed, and future program design may need to address this issue.
5. Conclusion
5.1. GHESI Budget and Costs
In addition to the positive results from the Portfolio TRC analysis and the energy and peak reductions achieved, GHESI remained within their budget tolerances during 2007 as can be seen in the tables below. The actual 2007 expenditures for the 2007 initiatives are shown in Table 1 on the following page. The expenditures to date for active programs have been provided in Table 2 provided after Table 1.

Page 14
Table 1: 2007 Active CDM Programs
** During 2005, these costs were reported across all programs. Starting in 2006 and continuing in 2007 the portfolio administration costs are reported separately.
1
Education & Promotion $0 $170,000 $170,000 $0 $25,627 $25,627
2 Low Income $0 $25,000 $25,000 $0 $0 $0
3
City Leadership - LED Lighting $0 $43,655 $43,655 $0 $0 $0
4 Metering Pilot $50,000 $25,000 $75,000 $0 $20,689 $20,689
5 Tech. & Research $40,000 $4,403 $44,403 $0 $486 $486
6 Air Conditioning $0 $7,446 $7,446
7
Distributed Energy $230,596 $1,958 $232,554 $0 $0 $0
8
City Leadership - Building Retrofit $0 $115 $115 $0 $0 $0
9 Load Control $0 $509 $509 $0 $0 $0
10
City Leadership - Water Treatment $0 $100,000 $100,000 $0 $50,000 $50,000
11
System Optimization $90,000 $18,000 $108,000 $105,790 $0 $105,790
12
Power Factor Correction $0 $0 $0 $0 $0 $0
13
University of Guelph $0 $20,625 $20,625 $0 $17,059 $17,059
14
Builder Partnership $0 $1,500 $1,500 $0 $0 $0
15
City Leadership - Community Energy Plan $0 $25,000 $25,000 $0 $0 $0
16 Residential REEP $0 $4,000 $4,000 $0 $0 $0
17
Earth Day Environmental Action $0 $75,000 $75,000 $0 $137,179 $137,179
18
Load Control - School Board $0 $125,300 $125,300 $0 $59,150 $59,150
19
GEL Energy Benchmarking $0 $25,000 $25,000 $0 $25,000 $25,000
19
Portfolio Administration ** $0 $108,402 $108,402 $0 $92,075 $92,075
Total $410,596 $780,913 $1,191,509 $105,790 $427,265 $533,056
Program Name
Budget GHESI Capital
Budget GHESI
Operating Budget Total
2007 GHESI Total
Expenditure
2007 GHESI Capital
Expenditure
2007 GHESI
Operating Expenditure

Page 15
Table 2: Comparison of CDM Budget and Life-to-Date Expenditures
1
Education & Promotion $0 $170,000 $170,000 $0 $148,117 $148,117
2 Low Income $0 $25,000 $25,000 $0 $25,822 $25,822
3
City Leadership - LED Lighting $0 $43,655 $43,655 $0 $41,655 $41,655
4 Metering Pilot $50,000 $25,000 $75,000 $54,902 $21,940 $76,842
5 Tech. & Research $40,000 $4,403 $44,403 $40,000 $6,040 $46,040
6 Air Conditioning $0 $7,446 $7,446 $0 $7,446 $7,446
7 Distributed Energy $230,596 $1,958 $232,554 $230,596 $458 $231,054
8
City Leadership - Building Retrofit $0 $115 $115 $0 $115 $115
9 Load Control $0 $509 $509 $0 $510 $510
10
City Leadership - Water Treatment $0 $100,000 $100,000 $0 $50,000 $50,000
11
System Optimization $90,000 $18,000 $108,000 $105,790 $0 $105,790
12
Power Factor Correction $0 $0 $0 $0 $0 $0
13
University of Guelph $0 $20,625 $20,625 $0 $17,059 $17,059
14
Builder Partnership $0 $1,500 $1,500 $0 $1,500 $1,500
15
City Leadership - Community Energy Plan $0 $25,000 $25,000 $0 $25,000 $25,000
16 Residential REEP $0 $4,000 $4,000 $0 $0 $0
17
Earth Day Environmental Action $0 $75,000 $75,000 $0 $137,179 $137,179
18
Load Control - School Board $0 $125,300 $125,300 $0 $59,150 $59,150
19
GEL Energy Benchmarking $0 $25,000 $25,000 $0 $25,000 $25,000
19
Portfolio Administration ** $0 $108,402 $108,402 $0 $115,206 $115,206
Total $410,596 $780,913 $1,191,509 $431,288 $682,197 $1,113,489
Budget GHESI Capital
Life-to-Date GHESI Total Expenditure
Life-to-Date GHESI Capital
Expenditure
Budget GHESI
OperatingBudget
Total
Life-to-Date GHESI
Operating ExpenditureProgram Name

Page 16
6. Appendices
6.1. Appendix A: 2007 Guelph Hydro – Evaluation of the CDM Plan
5 Cumulative Totals Life-to-date Total for 2007 Residential Commercial Institutional Industrial Agricultural LDC System 4 Smart Meters Other #1 Other #2
Net TRC value ($): $ 2,549,370 593,991$ 46,085$ 147,206$ 388,360$ -$ -$ 104,415$ -$ -$
Benefit to cost ratio: 1.52 1.21 1.31 1.07 2.40 0.00 0.00 2.33 0.00 0.00
Number of participants or units delivered: 46,655 20,009 20,008 1
Lifecycle (kWh) Savings: 59,544,023 22,316,905 3,447,288 0 10,309,617 0 0 8,560,000 0 0
Report Year Total kWh saved (kWh): 6,480,164 2,679,686 861,822 0 1,389,864 0 0 428,000 0 0
Total peak demand saved (kW): 1,012 248 0 0 185 0 0 63 0 0
Total kWh saved as a percentage of total kWh delivered (%):
0.40% 0.05% 0.05% 0.00%
Peak kW saved as a percentage of LDC peak kW load (%):
0.00% 0.00% 0.00%
1 Report Year Gross C&DM expenditures ($): $ 1,113,489 533,056$ 188,292$ 50,000$ 76,209$ -$ -$ 105,790$ 20,689$ -$ -$
2 Expenditures per KWh saved ($/kWh): 0.02 0.02$ 0.05$ -$ 0.01$ -$ -$ 0.01$ -$ -$
3 Expenditures per KW saved ($/kW): 1,100.26 2,149.21$ -$ -$ 411.33$ -$ -$ 1,685.90$ -$ -$
Utility discount rate (%): 9.4
Appendix A - Evaluation of the GHESI 2007 CDM Plan Highlighted boxes are to be completed manually, white boxes are linked to Appendix C and will be brought forward automatically.
Page 17 Page 17
6.2. Appendix B: GHESI Discussion of the Programs
6.2.1. Residential Programs
6.2.1.1. Education and Promotion Programs
6.2.1.1.1. CDM Memberships and Workshops
A. Name of the Program:
Description of the program (including intent, design, delivery, partnerships and evaluation):
Measure(s):
Measure 1 Measure 2 (if applicable)
Base case technology:
Efficient technology:
Number of participants or units delivered for reporting year:
Measure life (years):
Number of Participants or units delivered life to date
B. TRC Results: Reporting Year1 TRC Benefits ($): -$ 2 TRC Costs ($):
1,500.00$
-$
Total TRC costs: 1,500.00$ Net TRC (in year CDN $): 1,500.00-$
Benefit to Cost Ratio (TRC Benefits/TRC Costs): -$
C. Results: (one or more category may apply)
Conservation Programs:
Demand savings (kW): Summer
Winter
lifecycle in year
Cumulative Lifecycle
Cumulative Annual Savings
Energy saved (kWh):
Other resources saved :
Natural Gas (m3):
Other (specify):
Demand Management Programs:
Controlled load (kW)
Demand Response Programs:
Dispatchable load (kW):
Peak hours dispatched in year (hours):
Power Factor Correction Programs:
Amount of KVar installed (KVar):
Distribution system power factor at beginning of year (%):
Distribution system power factor at end of year (%):
Line Loss Reduction Programs:
Peak load savings (kW):
Energy shifted Mid-peak to Off-peak (kWh):
Energy shifted On-peak to Mid-peak (kWh):
Energy shifted On-peak to Off-peak (kWh):
5,777.25$ 5,777.25-$
-$
Cumulative Results:
Utility program cost (excluding incentives): 5,777.25$
Incremental Measure Costs (Equipment Costs) -$
Life-to-date TRC Results:
-$
Measure 3 (if applicable)
Appendix B - Discussion of the ProgramRES Education - C&DM Workshops and Memberships
RESIDENTIAL - Education: C&DM Workshops and Memberships
Costs for memberships in associations and attendance at workshops related to CDM are included in this category. GHESI's goal is to ensure partnerships can be utilized whenever possible to reduce costs and to increase opportunities for CDM measures as well as to ensure staff has sufficient opportunity to learn from the CDM experiences of others. The annual fee of $1,500 for GHESI’s membership in the Canadian Energy Efficiency Alliance for 2007 has been included.
Page 18 Page 18
Appendix B: CDM Memberships and Workshops (page 2)
lifecycle in year
Energy savings (kWh):
Distributed Generation and Load Displacement Programs:
Amount of DG installed (kW):
Energy generated (kWh):
Peak energy generated (kWh):
Fuel type:
Other Programs (specify):
Metric (specify):
D. Actual Program Costs: Reporting Year
Utility direct costs ($): Incremental capital: -$
Incremental O&M: 1,500.00$
Incentive: -$
Total: 1,500.00$
Utility indirect costs ($): Incremental capital: -$
Incremental O&M: -$
Total: -$
E. Assumptions & Comments:
-$
-$
5,777.25$
-$
5,777.25$
-$
Cumulative Life to Date
-$
Page 19 Page 19
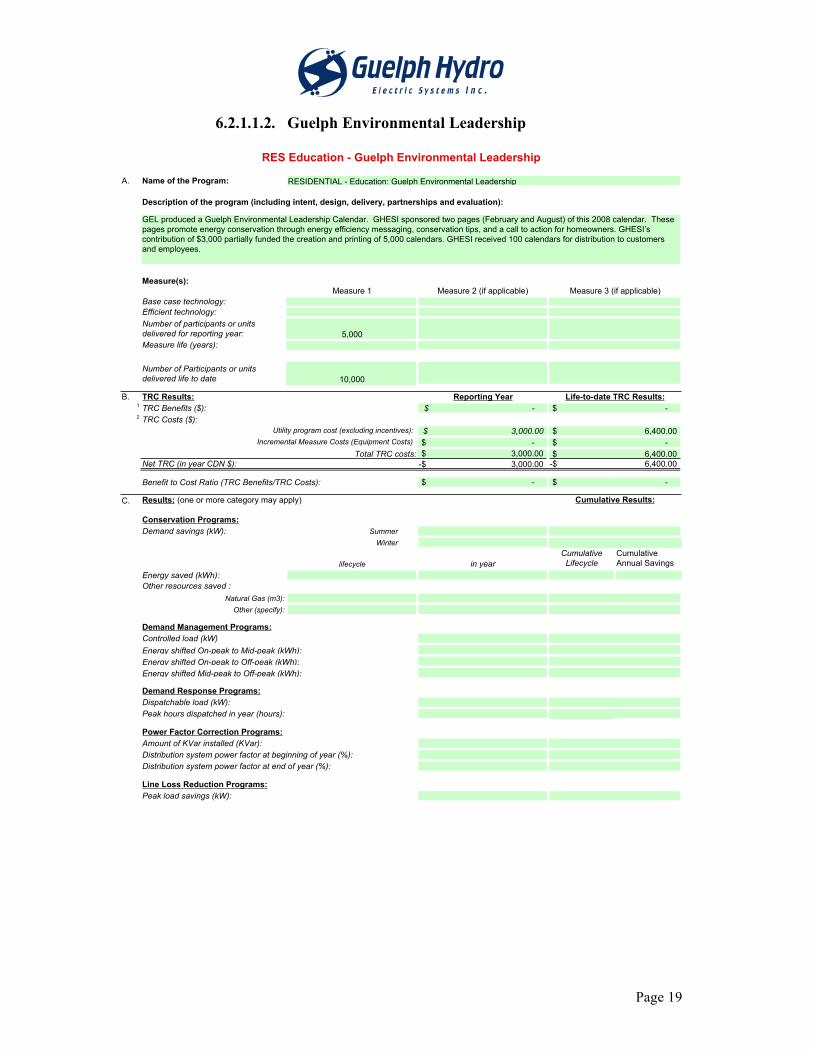
6.2.1.1.2. Guelph Environmental Leadership
A. Name of the Program:
Description of the program (including intent, design, delivery, partnerships and evaluation):
Measure(s):
Measure 1 Measure 2 (if applicable)
Base case technology:
Efficient technology:
Number of participants or units delivered for reporting year: 5,000
Measure life (years):
Number of Participants or units delivered life to date 10,000
B. TRC Results: Reporting Year1 TRC Benefits ($): -$ 2 TRC Costs ($):
3,000.00$
-$
Total TRC costs: 3,000.00$ Net TRC (in year CDN $): 3,000.00-$
Benefit to Cost Ratio (TRC Benefits/TRC Costs): -$
C. Results: (one or more category may apply)
Conservation Programs:
Demand savings (kW): Summer
Winter
lifecycle in year
Cumulative Lifecycle
Cumulative Annual Savings
Energy saved (kWh):
Other resources saved :
Natural Gas (m3):
Other (specify):
Demand Management Programs:
Controlled load (kW)
Demand Response Programs:
Dispatchable load (kW):
Peak hours dispatched in year (hours):
Power Factor Correction Programs:
Amount of KVar installed (KVar):
Distribution system power factor at beginning of year (%):
Distribution system power factor at end of year (%):
Line Loss Reduction Programs:
Peak load savings (kW):
Energy shifted On-peak to Off-peak (kWh):
Energy shifted Mid-peak to Off-peak (kWh):
Energy shifted On-peak to Mid-peak (kWh):
6,400.00$
-$
Cumulative Results:
6,400.00-$
Utility program cost (excluding incentives): 6,400.00$
Incremental Measure Costs (Equipment Costs) -$
Life-to-date TRC Results:
-$
Measure 3 (if applicable)
RES Education - Guelph Environmental Leadership
RESIDENTIAL - Education: Guelph Environmental Leadership
GEL produced a Guelph Environmental Leadership Calendar. GHESI sponsored two pages (February and August) of this 2008 calendar. These pages promote energy conservation through energy efficiency messaging, conservation tips, and a call to action for homeowners. GHESI’s contribution of $3,000 partially funded the creation and printing of 5,000 calendars. GHESI received 100 calendars for distribution to customers and employees.

Page 20 Page 20
Appendix B: Guelph Environmental Leadership (page 2)
lifecycle in year
Energy savings (kWh):
Distributed Generation and Load Displacement Programs:
Amount of DG installed (kW):
Energy generated (kWh):
Peak energy generated (kWh):
Fuel type:
Other Programs (specify):
Metric (specify):
D. Actual Program Costs: Reporting Year
Utility direct costs ($): Incremental capital: -$
Incremental O&M: 3,000.00$
Incentive: -$
Total: 3,000.00$
Utility indirect costs ($): Incremental capital: -$
Incremental O&M: -$
Total: -$
E. Assumptions & Comments:
-$
Cumulative Life to Date
-$
6,400.00$
6,400.00$
-$
-$
-$
This program is for educational initiatives and there are no TRC benefits. These costs are included in Appendix A as GHESI expenditure for 2007.

Page 21 Page 21
6.2.1.1.3. Operation Power Down
A. Name of the Program:
Description of the program (including intent, design, delivery, partnerships and evaluation):
Measure(s):
Measure 1 Measure 2 (if applicable)
Base case technology:
Efficient technology:
Number of participants or units delivered for reporting year:
Measure life (years):
Number of Participants or units delivered life to date
B. TRC Results: Reporting Year1 TRC Benefits ($): -$ 2 TRC Costs ($):
2,279.05$
-$
Total TRC costs: 2,279.05$
Net TRC (in year CDN $): 2,279.05-$
Benefit to Cost Ratio (TRC Benefits/TRC Costs): -$
C. Results: (one or more category may apply)
Conservation Programs:
Demand savings (kW): Summer
Winter
lifecycle in year
Cumulative Lifecycle
Cumulative Annual Savings
Energy saved (kWh):
Other resources saved :
Natural Gas (m3):
Other (specify):
Demand Management Programs:
Controlled load (kW)
Demand Response Programs:
Dispatchable load (kW):
Peak hours dispatched in year (hours):
Power Factor Correction Programs:
Amount of KVar installed (KVar):
Distribution system power factor at beginning of year (%):
Distribution system power factor at end of year (%):
Line Loss Reduction Programs:
Peak load savings (kW):
Appendix B - Discussion of the ProgramRES Education - Operation Power Down
RESIDENTIAL - Education: Operation Power Down
A black out day challenge was held on August 13, 2007 in response to a friendly challenge from the City of Woodstock. The challenge was founded to commemorate the black-out of August 2003 and also creates awareness around energy conservation. GHESI’s total energy reduction during Operation Power Down was reduced by 2.4% of baseline requirements and expenditures related to promotion and awareness of this event including radio advertisements.
Life-to-date TRC Results:
-$
Measure 3 (if applicable)
Utility program cost (excluding incentives): 9,385.88$
Incremental Measure Costs (Equipment Costs) -$
9,385.88$ 9,385.88-$
-$
Cumulative Results:
Energy shifted On-peak to Mid-peak (kWh):
Energy shifted On-peak to Off-peak (kWh):
Energy shifted Mid-peak to Off-peak (kWh):

Page 22 Page 22
Appendix B: Operation Power Down (page 2)
lifecycle in year
Energy savings (kWh):
Distributed Generation and Load Displacement Programs:
Amount of DG installed (kW):
Energy generated (kWh):
Peak energy generated (kWh):
Fuel type:
Other Programs (specify):
Metric (specify):
D. Actual Program Costs: Reporting Year
Utility direct costs ($): Incremental capital: -$
Incremental O&M: 2,279.05$
Incentive: -$
Total: 2,279.05$
Utility indirect costs ($): Incremental capital: -$
Incremental O&M: -$
Total: -$
E. Assumptions & Comments:
9,385.88$
-$
Cumulative Life to Date
-$
-$
-$
9,385.88$
-$

Page 23 Page 23
6.2.1.1.4. Kill-A-Watt
A. Name of the Program:
Description of the program (including intent, design, delivery, partnerships and evaluation):
Measure(s):
Measure 1 Measure 2 (if applicable)
Base case technology:
Efficient technology: Meters for check out
Number of participants or units delivered for reporting year: 6
Measure life (years):
Number of Participants or units delivered life to date 18
B. TRC Results: Reporting Year1 TRC Benefits ($): -$ 2 TRC Costs ($):
1,049.52$
-$
Total TRC costs: 1,049.52$ Net TRC (in year CDN $): 1,049.52-$
Benefit to Cost Ratio (TRC Benefits/TRC Costs): -$
C. Results: (one or more category may apply)
Conservation Programs:
Demand savings (kW): Summer
Winter
lifecycle in year
Cumulative Lifecycle
Cumulative Annual Savings
Energy saved (kWh):
Other resources saved :
Natural Gas (m3):
Other (specify):
Demand Management Programs:
Controlled load (kW)
Demand Response Programs:
Dispatchable load (kW):
Peak hours dispatched in year (hours):
Power Factor Correction Programs:
Amount of KVar installed (KVar):
Distribution system power factor at beginning of year (%):
Distribution system power factor at end of year (%):
Line Loss Reduction Programs:
Peak load savings (kW):
Appendix B - Discussion of the ProgramRES Education - Kill-A-Watt
RESIDENTIAL - Education: Kill-A-Watt
GHESI purchased meters for the Guelph libraries that can be checked out and used in the home to see which appliances are using the most energy. During 2007, GHESI purchased 6 additional meters for the libraries in Guelph.
Measure 3 (if applicable)
Energy shifted Mid-peak to Off-peak (kWh):
Energy shifted On-peak to Off-peak (kWh):
Incremental Measure Costs (Equipment Costs) -$
Energy shifted On-peak to Mid-peak (kWh):
1,049.52$
-$
Cumulative Results:
1,049.52-$
Life-to-date TRC Results:
-$
Utility program cost (excluding incentives): 1,049.52$

Page 24 Page 24
Appendix B: Kill-A-Watt (page 2)
lifecycle in year
Energy savings (kWh):
Distributed Generation and Load Displacement Programs:
Amount of DG installed (kW):
Energy generated (kWh):
Peak energy generated (kWh):
Fuel type:
Other Programs (specify):
Metric (specify):
D. Actual Program Costs: Reporting Year
Utility direct costs ($): Incremental capital: -$
Incremental O&M: 1,049.52$
Incentive: -$
Total: 1,049.52$
Utility indirect costs ($): Incremental capital: -$
Incremental O&M: -$
Total: -$
E. Assumptions & Comments:
-$
Cumulative Life to Date
-$
-$
1,049.52$
-$
1,049.52$
-$

Page 25 Page 25
6.2.1.1.5. Earth Day
A. Name of the Program:
Description of the program (including intent, design, delivery, partnerships and evaluation):
Measure(s):
Measure 1 Measure 2 (if applicable)
Base case technology: Incandesent light
Efficient technology: 13W CFL
Number of participants or units delivered for reporting year: 10,000
Measure life (years): 4
Number of Participants or units delivered life to date 10,000
10,000 in 2007, 15,000 in 2008 and 15,000 in 2009
B. TRC Results: Reporting Year1 TRC Benefits ($): 173,357.52$ 2 TRC Costs ($):
17,979.02$
76,500.00$
Total TRC costs: 94,479.02$ Net TRC (in year CDN $): 78,878.50$
Benefit to Cost Ratio (TRC Benefits/TRC Costs): 1.83$
C. Results: (one or more category may apply)
Conservation Programs:
Demand savings (kW): Summer
Winter
lifecycle in year
Cumulative Lifecycle
Cumulative Annual Savings
Energy saved (kWh): 3,090,240 772,560 3,090,240 772,560
Other resources saved :
Natural Gas (m3):
Other (specify):
Demand Management Programs:
Controlled load (kW)
Demand Response Programs:
Dispatchable load (kW):
Peak hours dispatched in year (hours):
Power Factor Correction Programs:
Amount of KVar installed (KVar):
Distribution system power factor at beginning of year (%):
Distribution system power factor at end of year (%):
Line Loss Reduction Programs:
Peak load savings (kW):
Energy shifted Mid-peak to Off-peak (kWh):
Energy shifted On-peak to Mid-peak (kWh):
Energy shifted On-peak to Off-peak (kWh):
94,479.02$ 78,878.50$
1.83$
Cumulative Results:
Utility program cost (excluding incentives): 17,979.02$
Incremental Measure Costs (Equipment Costs) 76,500.00$
Life-to-date TRC Results:
173,357.52$
Measure 3 (if applicable)
Appendix B - Discussion of the ProgramRES Education - Earth Day
RESIDENTIAL - Education - Earth Day
GHESI partnered with Local Adult Rehabilitative Centre (ARC) Industries, a program of the Community Living Guelph Wellington, to build the Earth Day Kits that were sold by schools, libraries and at GHESI’s office. There were a total of 40,000 CFL bulbs purchased to fabricate 10,000 Earth Day Kits. Each kit includes 4 CFLs, a water flow measuring bag, toilet testing dye tabs, and a booklet with tips on saving energy in the home. The kits were provided to schools and the libraries to sell as a fundraiser. Each kit cost $20 and was sold for $10. For each kit sold, the schools kept $2 of the sale price for their fundraising efforts. The kits were also available for purchase at GHESI's offices. In the case of the GHESI and the libraries, they donated their $2 per kit to charity. GHESI’s charitable contributions were directed to “Adopt-A-Family” and the Guelph United Way. During 2007, 2,500 kits were sold and the remainder will be placed in inventory and sold during the upcoming year.

Page 26 Page 26
Appendix B: Earth Day (page 2)
lifecycle in year
Energy savings (kWh):
Distributed Generation and Load Displacement Programs:
Amount of DG installed (kW):
Energy generated (kWh):
Peak energy generated (kWh):
Fuel type:
Other Programs (specify):
Metric (specify):
D. Actual Program Costs: Reporting Year
Utility direct costs ($): Incremental capital: -$
Incremental O&M: 137,179.02$
Incentive: -$
Total: 137,179.02$
Utility indirect costs ($): Incremental capital: -$
Incremental O&M: -$
Total: -$
E. Assumptions & Comments:
Cumulative Life to Date
-$
137,179.02$
-$
137,179.02$
-$
-$
-$

Page 27 Page 27
6.2.1.1.6. GEL Kiosk Benchmarking
A. Name of the Program:
Description of the program (including intent, design, delivery, partnerships and evaluation):
Measure(s):
Measure 1 Measure 2 (if applicable)
Base case technology:
Efficient technology:
Number of participants or units delivered for reporting year:
Measure life (years):
Number of Participants or units delivered life to date
B. TRC Results: Reporting Year1 TRC Benefits ($): -$ 2 TRC Costs ($):
25,000.00$
-$
Total TRC costs: 25,000.00$ Net TRC (in year CDN $): 25,000.00-$
Benefit to Cost Ratio (TRC Benefits/TRC Costs): -$
C. Results: (one or more category may apply)
Conservation Programs:
Demand savings (kW): Summer
Winter
lifecycle in year
Cumulative Lifecycle
Cumulative Annual Savings
Energy saved (kWh):
Other resources saved :
Natural Gas (m3):
Other (specify):
Demand Management Programs:
Controlled load (kW)
Demand Response Programs:
Dispatchable load (kW):
Peak hours dispatched in year (hours):
Power Factor Correction Programs:
Amount of KVar installed (KVar):
Distribution system power factor at beginning of year (%):
Distribution system power factor at end of year (%):
Line Loss Reduction Programs:
Peak load savings (kW):
Energy shifted Mid-peak to Off-peak (kWh):
Energy shifted On-peak to Mid-peak (kWh):
Energy shifted On-peak to Off-peak (kWh):
25,000.00$ 25,000.00-$
-$
Cumulative Results:
Utility program cost (excluding incentives): 25,000.00$
Incremental Measure Costs (Equipment Costs) -$
Life-to-date TRC Results:
-$
Measure 3 (if applicable)
Appendix B - Discussion of the ProgramRES Education - GEL Kiosk Benchmarking
RESIDENTIAL - Education GEL Kiosk Benchmarking
GHESI contributed $25,000 toward the development of new software that allows customers to view their energy and water consumption patterns compared to various community benchmarks at kiosks to be located at various public locations in Guelph. . Customers will be able to view their consumption compared to other similar sized households and homes in the community as well as other benchmarks enabling them to better understand how much energy they are using. In addition, the kiosk will provide information about their total carbon footprint including their automobile usage and other relevant energy expenditures. The other funding partners for this project include the OPA, the City of Guelph and the University of Guelph. This is an educational tool that is being developed so there is no TRC. However, the incentive has been included in the TRC results at a portfolio and market segment level.

Page 28 Page 28
Appendix B: GEL Kiosk Benchmarking (page 2)
lifecycle in year
Energy savings (kWh):
Distributed Generation and Load Displacement Programs:
Amount of DG installed (kW):
Energy generated (kWh):
Peak energy generated (kWh):
Fuel type:
Other Programs (specify):
Metric (specify):
D. Actual Program Costs: Reporting Year
Utility direct costs ($): Incremental capital: -$
Incremental O&M: 25,000.00$
Incentive: -$
Total: 25,000.00$
Utility indirect costs ($): Incremental capital: -$
Incremental O&M: -$
Total: -$
E. Assumptions & Comments:
-$
-$
25,000.00$
-$
25,000.00$
-$
Cumulative Life to Date
-$

Page 29 Page 29
6.2.1.1.7. Conservation Promotion
A. Name of the Program:
Description of the program (including intent, design, delivery, partnerships and evaluation):
Measure(s):
Measure 1 Measure 2 (if applicable)
Base case technology:
Efficient technology:
Number of participants or units delivered for reporting year:
Measure life (years):
Number of Participants or units delivered life to date
B. TRC Results: Reporting Year1 TRC Benefits ($): -$ 2 TRC Costs ($):
17,798.44$
-$
Total TRC costs: 17,798.44$ Net TRC (in year CDN $): 17,798.44-$
Benefit to Cost Ratio (TRC Benefits/TRC Costs): -$
C. Results: (one or more category may apply)
Conservation Programs:
Demand savings (kW): Summer
Winter
lifecycle in year
Cumulative Lifecycle
Cumulative Annual Savings
Energy saved (kWh):
Other resources saved :
Natural Gas (m3):
Other (specify):
Demand Management Programs:
Controlled load (kW)
Demand Response Programs:
Dispatchable load (kW):
Peak hours dispatched in year (hours):
Power Factor Correction Programs:
Amount of KVar installed (KVar):
Distribution system power factor at beginning of year (%):
Distribution system power factor at end of year (%):
Line Loss Reduction Programs:
Peak load savings (kW):
Energy shifted On-peak to Off-peak (kWh):
Energy shifted Mid-peak to Off-peak (kWh):
Energy shifted On-peak to Mid-peak (kWh):
17,798.44$
-$
Cumulative Results:
17,798.44-$
Utility program cost (excluding incentives): 17,798.44$
Incremental Measure Costs (Equipment Costs) -$
Life-to-date TRC Results:
-$
Measure 3 (if applicable)
Appendix B - Discussion of the ProgramRES Education - Conservation Promotion
RESIDENTIAL - Education - Conservation Promotion
The conservation promtion initiatives for this program included advertising costs specific to CFL usage (as opposed to a particular program), an ad for the Chamber of Commerce showing 5 ways to manage energy costs and promoting CDM programs in general, small incidental costs related to the 2007 Switch to Cold Tide initiative as well as fridge temperature strips to help customers better understand their energy usage. There are no TRC results for these intitiatives, however the costs have been included in the residential TRC results.

Page 30 Page 30
Appendix B: Conservation Promotion (page 2)
lifecycle in year
Energy savings (kWh):
Distributed Generation and Load Displacement Programs:
Amount of DG installed (kW):
Energy generated (kWh):
Peak energy generated (kWh):
Fuel type:
Other Programs (specify):
Metric (specify):
D. Actual Program Costs: Reporting Year
Utility direct costs ($): Incremental capital: -$
Incremental O&M: 17,798.44$
Incentive: -$
Total: 17,798.44$
Utility indirect costs ($): Incremental capital: -$
Incremental O&M: -$
Total: -$
E. Assumptions & Comments:
Cumulative Life to Date
-$
17,798.44$
-$
17,798.44$
-$
-$
-$

Page 31 Page 31
6.2.1.2. Low Income Programs
6.2.1.2.1. Seasonal Baskets
A. Name of the Program:
Description of the program (including intent, design, delivery, partnerships and evaluation):
Measure(s):
Measure 1 Measure 2 (if applicable)
Base case technology: Incandesent light
Efficient technology: 15W CFL
Number of participants or units delivered for reporting year: 550
Measure life (years): 4
Number of Participants or units delivered life to date 4,983
B. TRC Results: Reporting Year1 TRC Benefits ($): 11,596.21$ 2 TRC Costs ($):
-$
990.00$
Total TRC costs: 990.00$
Net TRC (in year CDN $): 10,606.21$
Benefit to Cost Ratio (TRC Benefits/TRC Costs): 11.71$
C. Results: (one or more category may apply)
Conservation Programs:
Demand savings (kW): Summer
Winter
lifecycle in year
Cumulative Lifecycle
Cumulative Annual Savings
Energy saved (kWh): 206,712 51,678 1,928,896 482,224
Other resources saved :
Natural Gas (m3):
Other (specify):
Demand Management Programs:
Controlled load (kW)
Demand Response Programs:
Dispatchable load (kW):
Peak hours dispatched in year (hours):
Power Factor Correction Programs:
Amount of KVar installed (KVar):
Distribution system power factor at beginning of year (%):
Distribution system power factor at end of year (%):
Line Loss Reduction Programs:
Peak load savings (kW):
Appendix B - Discussion of the ProgramRES Low Income - Seasonal Hampers
RESIDENTIAL - Low Income: Seasonal Hampers
GHESI donated CFLs to be included in the Salvation Army’s Christmas Hamper program to provide relief to low-income families during the winter holidays. GHESI’s contributions to the Seasonal Baskets consisted of one 13 Watt CFL. GHESI donated a total of 550 CFLs for this annual program. The costs of the CFLs were reported in the 2005 annual report.
Measure 3 (if applicable)
Life-to-date TRC Results:
112,089.56$
Utility program cost (excluding incentives): 6,359.96$
Incremental Measure Costs (Equipment Costs) 3,240.00$
9,599.96$ 102,489.60$
11.68$
Cumulative Results:
Energy shifted On-peak to Mid-peak (kWh):
Energy shifted On-peak to Off-peak (kWh):
Energy shifted Mid-peak to Off-peak (kWh):

Page 32 Page 32
Appendix B: Seasonal Baskets (page 2)
lifecycle in year
Energy savings (kWh):
Distributed Generation and Load Displacement Programs:
Amount of DG installed (kW):
Energy generated (kWh):
Peak energy generated (kWh):
Fuel type:
Other Programs (specify):
Metric (specify):
D. Actual Program Costs: Reporting Year
Utility direct costs ($): Incremental capital: -$
Incremental O&M: -$
Incentive: -$
Total: -$
Utility indirect costs ($): Incremental capital: -$
Incremental O&M: -$
Total: -$
E. Assumptions & Comments:
180.56$
180.56$
6,179.40$
3,140.14$
9,319.54$
-$
Cumulative Life to Date
-$

Page 33 Page 33
6.2.1.2.2. Light Up a Life
A. Name of the Program:
Description of the program (including intent, design, delivery, partnerships and evaluation):
Measure(s):
Measure 1 Measure 2 (if applicable)
Base case technology: incandescent lights
Efficient technology: 15W CFLs
Number of participants or units delivered for reporting year: 400
Measure life (years): 4
Number of Participants or units delivered life to date 837
B. TRC Results: Reporting Year1 TRC Benefits ($): 8,433.61$ 2 TRC Costs ($):
720.00$
Total TRC costs: 720.00$
Net TRC (in year CDN $): 7,713.61$
Benefit to Cost Ratio (TRC Benefits/TRC Costs): 11.71$
C. Results: (one or more category may apply)
Conservation Programs:
Demand savings (kW): Summer 0
Winter
lifecycle in year
Cumulative Lifecycle
Cumulative Annual Savings
Energy saved (kWh): 150,336 37,584 314,028 78,507
Other resources saved :
Natural Gas (m3):
Other (specify):
Demand Management Programs:
Controlled load (kW)
Demand Response Programs:
Dispatchable load (kW):
Peak hours dispatched in year (hours):
Power Factor Correction Programs:
Amount of KVar installed (KVar):
Distribution system power factor at beginning of year (%):
Distribution system power factor at end of year (%):
Line Loss Reduction Programs:
Peak load savings (kW):
Energy shifted Mid-peak to Off-peak (kWh):
Energy shifted On-peak to Mid-peak (kWh):
Energy shifted On-peak to Off-peak (kWh):
0
1,703.25$ 16,283.39$
10.56$
Cumulative Results:
Utility program cost (excluding incentives): -$
Incremental Measure Costs (Equipment Costs) 1,703.25$
Life-to-date TRC Results:
17,986.64$
Measure 3 (if applicable)
Appendix B - Discussion of the ProgramRES Low Income - Light Up A Life
RESIDENTIAL - Low Income Light Up A Life
Rotary Club volunteers encouraged Canadian Tire patrons to donate CFLs or money to buy CFLs for low-income residents. GHESI agreed to match the donated CFLs. The Light Up a Life initiative was a partnership with the Rotary Club and resulted in the delivery of 400 CFLs to low income customers in Guelph. The CFL costs were included in 2005 and 2006.

Page 34 Page 34
Appendix B: Light Up a Life (page 2)
lifecycle in year
Energy savings (kWh):
Distributed Generation and Load Displacement Programs:
Amount of DG installed (kW):
Energy generated (kWh):
Peak energy generated (kWh):
Fuel type:
Other Programs (specify):
Metric (specify):
D. Actual Program Costs: Reporting Year
Utility direct costs ($): Incremental capital: -$
Incremental O&M: -$
Incentive: -$
Total: -$
Utility indirect costs ($): Incremental capital: -$
Incremental O&M: -$
Total: -$
E. Assumptions & Comments:
Cumulative Life to Date
-$
-$
-$
-$
-$
-$
-$

Page 35 Page 35
6.2.1.3. Technology, Research and Demonstration Programs
6.2.1.3.1. Solar Meter
A. Name of the Program:
Description of the program (including intent, design, delivery, partnerships and evaluation):
Measure(s):
Measure 1 Measure 2 (if applicable)
Base case technology:
Efficient technology:
Number of participants or units delivered for reporting year: 1
Measure life (years):
Number of Participants or units delivered life to date 1
B. TRC Results: Reporting Year1 TRC Benefits ($): -$ 2 TRC Costs ($):
486.00$
-$
Total TRC costs: 486.00$
Net TRC (in year CDN $): 486.00-$
Benefit to Cost Ratio (TRC Benefits/TRC Costs): -$
C. Results: (one or more category may apply)
Conservation Programs:
Demand savings (kW): Summer
Winter
lifecycle in year
Cumulative Lifecycle
Cumulative Annual Savings
Energy saved (kWh):
Other resources saved :
Natural Gas (m3):
Other (specify):
Demand Management Programs:
Controlled load (kW)
Demand Response Programs:
Dispatchable load (kW):
Peak hours dispatched in year (hours):
Power Factor Correction Programs:
Amount of KVar installed (KVar):
Distribution system power factor at beginning of year (%):
Distribution system power factor at end of year (%):
Line Loss Reduction Programs:
Peak load savings (kW):
Energy shifted Mid-peak to Off-peak (kWh):
Energy shifted On-peak to Mid-peak (kWh):
Energy shifted On-peak to Off-peak (kWh):
486.00$ 486.00-$
-$
Cumulative Results:
Utility program cost (excluding incentives): 486.00$
Incremental Measure Costs (Equipment Costs) -$
Life-to-date TRC Results:
-$
Measure 3 (if applicable)
Appendix B - Discussion of the ProgramRESIDENTIAL - Technology, Research & Demonstration: Solar Meter
RESIDENTIAL - Technology, Research & Demonstration: Solar Meter
During 2007 GHESI provided meter equipment at a solar demonstration site for a green residential community.

Page 36 Page 36
Appendix B: Solar Meter (page 2)
lifecycle in year
Energy savings (kWh):
Distributed Generation and Load Displacement Programs:
Amount of DG installed (kW):
Energy generated (kWh):
Peak energy generated (kWh):
Fuel type:
Other Programs (specify):
Metric (specify):
D. Actual Program Costs: Reporting Year
Utility direct costs ($): Incremental capital: -$
Incremental O&M: 486.00$
Incentive: -$
Total: 486.00$
Utility indirect costs ($): Incremental capital: -$
Incremental O&M: -$
Total: -$
E. Assumptions & Comments:
-$
-$
486.00$
-$
486.00$
-$
Cumulative Life to Date
-$

Page 37 Page 37
6.2.2. Commercial Programs
6.2.2.1.1. City Water Treatment Facility
A. Name of the Program:
Description of the program (including intent, design, delivery, partnerships and evaluation):
Measure(s):
Measure 1 Measure 2 (if applicable)
Base case technology:
Efficient technology:
Number of participants or units delivered for reporting year: 1
Measure life (years): 20
Number of Participants or units delivered life to date 1
B. TRC Results: Reporting Year1 TRC Benefits ($): 2,410,210.00$ 2 TRC Costs ($):
-$
2,263,004.00$
Total TRC costs: 2,263,004.00$
Net TRC (in year CDN $): 147,206.00$
Benefit to Cost Ratio (TRC Benefits/TRC Costs): 1.07$
C. Results: (one or more category may apply)
Conservation Programs:
Demand savings (kW): Summer
Winter
lifecycle in year
Cumulative Lifecycle
Cumulative Annual Savings
Energy saved (kWh):
Other resources saved :
Natural Gas (m3):
Other (specify):
Demand Management Programs:
Controlled load (kW)
Demand Response Programs:
Dispatchable load (kW):
Peak hours dispatched in year (hours):
Power Factor Correction Programs:
Amount of KVar installed (KVar):
Distribution system power factor at beginning of year (%):
Distribution system power factor at end of year (%):
Line Loss Reduction Programs:
Peak load savings (kW):
Appendix B - Discussion of the ProgramCOMMERCIAL - City Water Treatment Facility
COMMERCIAL - City Water Treatment Facility
The City of Guelph was offered a $100,000 incentive towards the upgrade of a co-generation facility at the City’s Waste Water Treatment facility. In 2007, a $50,000 partial payment of the incentive was awarded to the City, commensurate with the project milestones reached in 2007. An additional $50,000 has been committed upon completion of the project. The co-generation upgrade will be completed during 2008.
Measure 3 (if applicable)
Energy shifted Mid-peak to Off-peak (kWh):
Energy shifted On-peak to Off-peak (kWh):
Incremental Measure Costs (Equipment Costs) 2,263,004.00$
Energy shifted On-peak to Mid-peak (kWh):
2,263,004.00$
1.07$
Cumulative Results:
147,206.00$
Life-to-date TRC Results:
2,410,210.00$
Utility program cost (excluding incentives): -$

Page 38 Page 38
Appendix B: City Water Treatment (page 2)
lifecycle in year
Energy savings (kWh):
Distributed Generation and Load Displacement Programs:
Amount of DG installed (kW): 500
Energy generated (kWh): 4020000
Peak energy generated (kWh):
Fuel type: Process methane
Other Programs (specify):
Metric (specify):
D. Actual Program Costs: Reporting Year
Utility direct costs ($): Incremental capital: -$
Incremental O&M: 50,000.00$
Incentive: -$
Total: 50,000.00$
Utility indirect costs ($): Incremental capital: -$
Incremental O&M: -$
Total: -$
E. Assumptions & Comments:
500
4020000
-$
50,000.00$
-$
50,000.00$
-$
-$
Cumulative Life to Date
-$

Page 39 Page 39
6.2.3. Institutional Programs
6.2.3.1. School Board Load Control
A. Name of the Program:
Description of the program (including intent, design, delivery, partnerships and evaluation):
Measure(s):
Measure 1 Measure 2 (if applicable)
Base case technology:
Efficient technology: HVAC Systems
Number of participants or units delivered for reporting year: 2
Measure life (years): 10
Number of Participants or units delivered life to date 2
B. TRC Results: Reporting Year1 TRC Benefits ($): 333,467.34$ 2 TRC Costs ($):
-$
108,135.28$
Total TRC costs: 108,135.28$ Net TRC (in year CDN $): 225,332.06$
Benefit to Cost Ratio (TRC Benefits/TRC Costs): 3.08$
C. Results: (one or more category may apply)
Conservation Programs:
Demand savings (kW): Summer
Winter
lifecycle in year
Cumulative Lifecycle
Cumulative Annual Savings
Energy saved (kWh): 5,021,070 502,107 5,021,070 502,107
Other resources saved :
Natural Gas (m3):
Other (specify):
Demand Management Programs:
Controlled load (kW)
Demand Response Programs:
Dispatchable load (kW):
Peak hours dispatched in year (hours):
Power Factor Correction Programs:
Amount of KVar installed (KVar):
Distribution system power factor at beginning of year (%):
Distribution system power factor at end of year (%):
Line Loss Reduction Programs:
Peak load savings (kW):
INSTITUTIONAL - School Board Load Control
INSTITUTIONAL - School Board Load Control
GHESI provided an incentive to the Wellington District Catholic School Board toward completing automation system upgrades at 2 schools in 2007. One of the significant benefits of these projects was the ability for a 100 tonne chiller to be controlled that had previously run year round. The control systems were replaced, heat pump loop plant was optimized, boiler plant was optimized, new control units on all fan coil units, unit ventilators, heat pumps and Variable Air Volume units. Faulty valves and actuators were replaced. Chiller plant optimized and new controlls installed. Outdoor lighting was all added to proper controllers and controlled by astronmical schedules. GHESI provided an incentive to the Wellington District Catholic School Board toward completing automation system upgrades at two schools in 2007.
Measure 3 (if applicable)
Energy shifted Mid-peak to Off-peak (kWh):
Energy shifted On-peak to Mid-peak (kWh):
Energy shifted On-peak to Off-peak (kWh):
108,135.28$ 225,332.06$
3.08$
Cumulative Results:
Utility program cost (excluding incentives): -$
Incremental Measure Costs (Equipment Costs) 108,135.28$
Life-to-date TRC Results:
333,467.34$

Page 40 Page 40
Appendix B: School Board Load Control (page 2)
lifecycle in year
Energy savings (kWh):
Distributed Generation and Load Displacement Programs:
Amount of DG installed (kW):
Energy generated (kWh):
Peak energy generated (kWh):
Fuel type:
Other Programs (specify):
Metric (specify):
D. Actual Program Costs: Reporting Year
Utility direct costs ($): Incremental capital: -$
Incremental O&M: 59,150.00$
Incentive: -$
Total: 59,150.00$
Utility indirect costs ($): Incremental capital: -$
Incremental O&M: -$
Total: -$
E. Assumptions & Comments:
-$
-$
59,150.00$
-$
59,150.00$
-$
Cumulative Life to Date
-$

Page 41 Page 41
6.2.3.2. University of Guelph Lighting
A. Name of the Program:
Description of the program (including intent, design, delivery, partnerships and evaluation):
Measure(s):
Measure 1 Measure 2 (if applicable)
Base case technology:
Efficient technology: 1-T8/2-T8/4-T8 15W CFL/18W CFL/26 W CFL
Number of participants or units delivered for reporting year: 1416/1520/62 98/82/152
Measure life (years): 5 2/2.5/2.5
Number of Participants or units delivered life to date 2998 332
B. TRC Results: Reporting Year1 TRC Benefits ($): 332,013.80$ 2 TRC Costs ($):
-$
168,985.96$
Total TRC costs: 168,985.96$ Net TRC (in year CDN $): 163,027.84$
Benefit to Cost Ratio (TRC Benefits/TRC Costs): 1.96$
C. Results: (one or more category may apply)
Conservation Programs:
Demand savings (kW): Summer 185.274
Winter
lifecycle in year
Cumulative Lifecycle
Cumulative Annual Savings
Energy saved (kWh): 5,288,547 887,757 5,288,547 887,757
Other resources saved :
Natural Gas (m3):
Other (specify):
Demand Management Programs:
Controlled load (kW)
Demand Response Programs:
Dispatchable load (kW):
Peak hours dispatched in year (hours):
Power Factor Correction Programs:
Amount of KVar installed (KVar):
Distribution system power factor at beginning of year (%):
Distribution system power factor at end of year (%):
Line Loss Reduction Programs:
Peak load savings (kW):
Energy shifted Mid-peak to Off-peak (kWh):
Energy shifted On-peak to Mid-peak (kWh):
Energy shifted On-peak to Off-peak (kWh):
185.274
168,985.96$ 163,027.84$
1.96$
Cumulative Results:
Utility program cost (excluding incentives): -$
Incremental Measure Costs (Equipment Costs) 168,985.96$
25
227
Life-to-date TRC Results:
332,013.80$
Measure 3 (if applicable)
LED Exit Signs
227
INSTITUTIONAL - University of Guelph Lighting
INSTITUTIONAL - University of Guelph Lighting
The University of Guelph completed a lighting upgrade during 2007 to improve the energy efficiency of six buildings on campus. Only lights in the buildings that were at the end of their life expectancy and scheduled for replacement were replaced by the new technology, saving on installation costs.

Page 42 Page 42
Appendix B: University of Guelph Lighting (page 2)
lifecycle in year
Energy savings (kWh):
Distributed Generation and Load Displacement Programs:
Amount of DG installed (kW):
Energy generated (kWh):
Peak energy generated (kWh):
Fuel type:
Other Programs (specify):
Metric (specify):
D. Actual Program Costs: Reporting Year
Utility direct costs ($): Incremental capital: -$
Incremental O&M: 17,058.90$
Incentive: -$
Total: 17,058.90$
Utility indirect costs ($): Incremental capital: -$
Incremental O&M: -$
Total: -$
E. Assumptions & Comments:
-$
-$
17,058.90$
-$
17,058.90$
-$
Cumulative Life to Date
-$

Page 43 Page 43
6.2.4. LDC Programs
6.2.4.1. LDC System Optimization
A. Name of the Program:
Description of the program (including intent, design, delivery, partnerships and evaluation):
Measure(s):
Measure 1 Measure 2 (if applicable)
Base case technology: Timer based Capacitor controls
Efficient technology: Capacitors Reactive sensing/Intelligent voltage controls
Number of participants or units delivered for reporting year: 7 7
Measure life (years): 20 10
Number of Participants or units delivered life to date 7 7
B. TRC Results: Reporting Year1 TRC Benefits ($): 183,061.45$ 2 TRC Costs ($):
-$
78,646.00$
Total TRC costs: 78,646.00$ Net TRC (in year CDN $): 104,415.45$
Benefit to Cost Ratio (TRC Benefits/TRC Costs): 2.33$
C. Results: (one or more category may apply)
Conservation Programs:
Demand savings (kW): Summer
Winter
lifecycle in year
Cumulative Lifecycle
Cumulative Annual Savings
Energy saved (kWh):
Other resources saved :
Natural Gas (m3):
Other (specify):
Demand Management Programs:
Controlled load (kW)
Demand Response Programs:
Dispatchable load (kW):
Peak hours dispatched in year (hours):
Power Factor Correction Programs:
Amount of KVar installed (KVar):
Distribution system power factor at beginning of year (%):
Distribution system power factor at end of year (%):
Line Loss Reduction Programs:
Peak load savings (kW): 62.75 62.75
Energy shifted Mid-peak to Off-peak (kWh):
Energy shifted On-peak to Mid-peak (kWh):
Energy shifted On-peak to Off-peak (kWh):
78,646.00$ 104,415.45$
2.33$
Cumulative Results:
Utility program cost (excluding incentives): -$
Incremental Measure Costs (Equipment Costs) 78,646.00$
Life-to-date TRC Results:
183,061.45$
Measure 3 (if applicable)
Appendix B - Discussion of the ProgramLDC - System Optimization
LDC - System Optimization
GHESI studied the distribution feeders to determine which had a poor power factor. Seven 13.8 kV distribution feeders were identified as good candidates for capacitor bank installations. The GHESI study concluded that strategic installation of the seven capacitor banks would improve the distribution feeder power factor from 0.88 to 0.93 and so these 7 were completed.

Page 44 Page 44
Appendix B: LDC System Optimization (page 2)
lifecycle in year lifecycle in year
Energy savings (kWh): 8,560,000 428,000 8,560,000 428,000
Distributed Generation and Load Displacement Programs:
Amount of DG installed (kW):
Energy generated (kWh):
Peak energy generated (kWh):
Fuel type:
Other Programs (specify):
Metric (specify):
D. Actual Program Costs: Reporting Year
Utility direct costs ($): Incremental capital: 105,790.42$
Incremental O&M: -$
Incentive: -$
Total: 105,790.42$
Utility indirect costs ($): Incremental capital: -$
Incremental O&M: -$
Total: -$
E. Assumptions & Comments:
-$
-$
-$
-$
105,790.42$
-$
Cumulative Life to Date
105,790.42$

Page 45 Page 45
6.2.5. Smart Meters
A. Name of the Program:
Description of the program (including intent, design, delivery, partnerships and evaluation):
Measure(s):
Measure 1 Measure 2 (if applicable)
Base case technology:
Efficient technology:
Number of participants or units delivered for reporting year:
Measure life (years):
Number of Participants or units delivered life to date
B. TRC Results: Reporting Year1 TRC Benefits ($): -$ 2 TRC Costs ($):
-$
Total TRC costs: -$
Net TRC (in year CDN $): -$
Benefit to Cost Ratio (TRC Benefits/TRC Costs): -$
C. Results: (one or more category may apply)
Conservation Programs:
Demand savings (kW): Summer
Winter
lifecycle in year
Cumulative Lifecycle
Cumulative Annual Savings
Energy saved (kWh):
Other resources saved :
Natural Gas (m3):
Other (specify):
Demand Management Programs:
Controlled load (kW)
Demand Response Programs:
Dispatchable load (kW):
Peak hours dispatched in year (hours):
Power Factor Correction Programs:
Amount of KVar installed (KVar):
Distribution system power factor at beginning of year (%):
Distribution system power factor at end of year (%):
Line Loss Reduction Programs:
Peak load savings (kW):
Energy shifted On-peak to Off-peak (kWh):
Energy shifted Mid-peak to Off-peak (kWh):
Energy shifted On-peak to Mid-peak (kWh):
Cumulative Results:
-$
-$ -$
-$
Utility program cost (excluding incentives): -$
Incremental Measure Costs (Equipment Costs)
Life-to-date TRC Results:
-$
Measure 3 (if applicable)
Appendix B - Discussion of the ProgramSmart Meters
Smart Meters
During 2007, GHESI incurred costs in support of the Smart Metering Pilot project undertaken during 2005, 2006 and 2007. No additional equipment was installed, but operating costs were incurred including the Hosting Service, line and mainenance crew costs to repair lost communications to meters through smart meter gateway and metering labour and vehicle costs to complete repairs to the smart metering system. In addition, the cost to participate in the LDC Smart Metering consortium and local newspaper ads required by the Ministry to notify vendors of the London RFP for Smart Meters.

Page 46 Page 46
Appendix B: Smart Meters (page 2)
lifecycle in year
Energy savings (kWh):
Distributed Generation and Load Displacement Programs:
Amount of DG installed (kW):
Energy generated (kWh):
Peak energy generated (kWh):
Fuel type:
Other Programs (specify):
Metric (specify):
D. Actual Program Costs: Reporting Year
Utility direct costs ($): Incremental capital: -$
Incremental O&M: 20,689.05$
Incentive: -$
Total: 20,689.05$
Utility indirect costs ($): Incremental capital: -$
Incremental O&M: -$
Total: -$
E. Assumptions & Comments:
Cumulative Life to Date
-$
20,689.05$
-$
20,689.05$
-$
-$
-$

Page 47
6.3. Appendix C: GHESI Program and Portfolio Totals

Page 48
Appendix C: GHESI Program and Portfolio Totals

Page 49
Appendix C: GHESI Program and Portfolio Totals
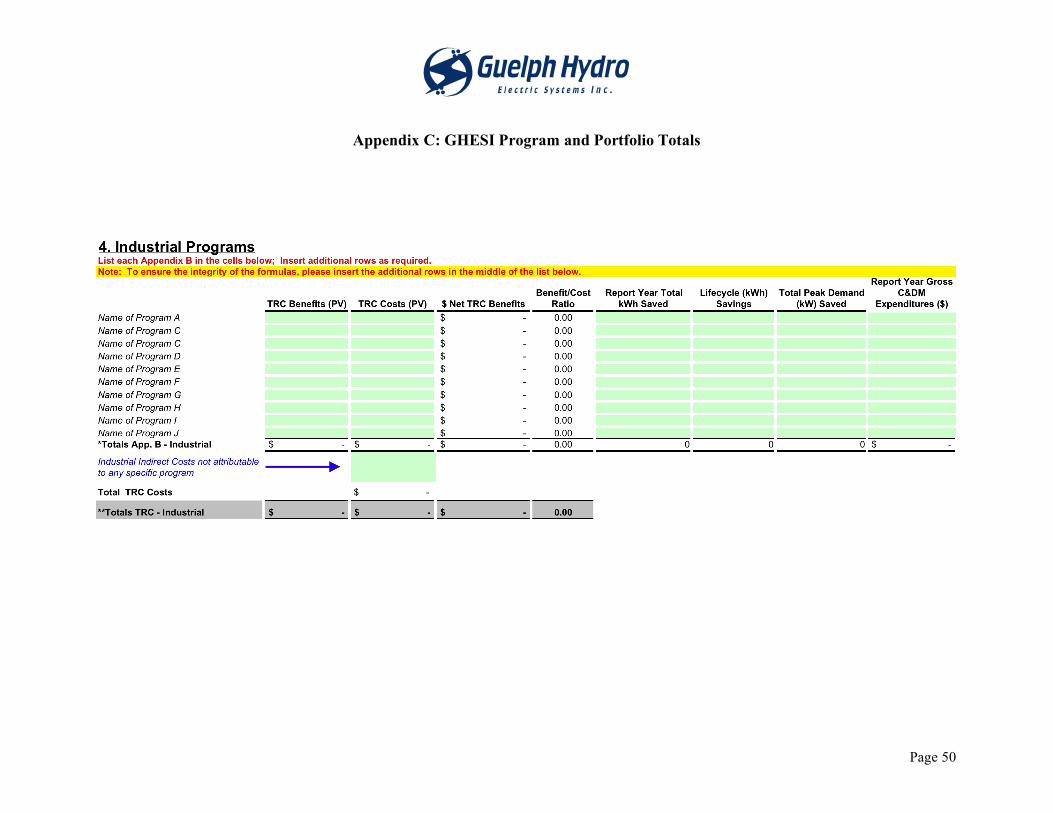
Page 50
Appendix C: GHESI Program and Portfolio Totals

Page 51
Appendix C: GHESI Program and Portfolio Totals

Page 52
Appendix C: GHESI Program and Portfolio Totals

Page 53
Appendix C: GHESI Program and Portfolio Totals

Page 54
6.4. Appendix D: GEL Calendar Pages

Page 55

Page 56

Page 57

Page 58
6.5. Appendix E: Operation Power Down Press Release

Page 59
6.6. Appendix F: Kill-A-Watt Worksheet
Kill A
Watt
Mete
r
Ap
plian
ce R
eco
rd
an
d C
alc
ula
tio
n
Ap
llia
nce
Vo
lts
Am
ps
VA
Po
we
rW
atts (
W)
kW
per
Ho
urs
Da
ys
Ho
urs
To
tal
Co
st
To
tal
Mo
nito
red
Facto
rR
eco
rde
dA
pp
lian
ce
per
day
pe
r p
er
kW
hp
er
Co
st
pe
r
(W/1
00
0)
usa
ge
We
ek
Year
per
year
kW
hY
ear
(a)
(b)
(c)
(d)
(e)
(f)
(g)
b x
c x
52
a x
de x
f
Ex.
TV
28
60
.28
65
.06
.51
,69
04
83
$0
.10
$4
8.3
3
1L
ap
top
11
90
.58
73
0.4
22
90
.02
91
67
5,8
24
16
9$
0.1
0$
16
.89
2$
0.1
0
3$
0.1
0
4$
0.1
0
5$
0.1
0
6$
0.1
0
7$
0.1
0
8$
0.1
0
9$
0.1
0
10
$0
.10
11
$0
.10
12
$0
.10
To
tals
0.3
15
$6
5.2
2
Assu
me
d a
ve
rag
e c
ost
pe
r kW
h =
$0
.10
/kW
h
No
te:
Reco
rd m
ete
r in
form
ati
on
pri
or
to u
np
lug
gin
g t
he m
ete
r fr
om
th
e o
utl
et
Ple
ase
no
te t
ha
t th
is c
alc
ula
tio
n i
s a
n e
stim
ate
an
d t
ha
t a
ctu
al
ho
ur
pe
r ye
ar
ma
y v
ary
Th
is e
xe
rcis
e i
s t
o b
e u
se
d a
s a
n e
stim
ate
of
usa
ge
with
in a
re
sid
en
ce
.T
he
en
d r
esu
lt i
s t
o r
ais
e e
ne
rgy a
wa
ren
ess w
ith
in a
ho
me
an
d t
o p
rom
ote
th
e u
se
an
d c
on
tro
l o
f e
ne
rgy e
ffic
ien
t p
rod
ucts
.

Page 60
6.7. Appendix G: Earth Day Article - Guelph Tribune June 29, 2007

Page 61
6.8. Appendix H: Chamber of Commerce Advertisement

Page 62
6.9. Appendix I: Thank You Letter from Salvation Army

Page 63
6.10 Appendix J: Light Up a Life Article

Page 64
6.11 Appendix K: School Board Load Control TRC Details
GHESI - 2007 School Board Load ControlLoad Control Upgrades
Interest Rate 9.40%Annual kWh Savings (20% of previous usage) 502,107
2007 2008 2009 2010 2011
Equipment Costs 169,000 - - - -
Total Equipment Costs 169,000 - - - -
Energy Savings $ 70,000 71,400 72,828 74,285 75,770 Total Benefit 70,000 71,400 72,828 74,285 75,770
2,012 2,013 2,014 2,015 2,016
Equipment Costs - - - - -
Total Equipment Costs - - - - -
Energy Savings $ 77,286 78,831 80,408 82,016 83,656 Total Benefit 77,286 78,831 80,408 82,016 83,656
Free Ridership RateCost (30% FR) Benefit (30% FR) B/C ratio
NPV 10 years $108,135.28 $333,467.34 3.08
30%

Page 65
6.12. Appendix L: City of Guelph Water Treatment Cogen TRC Details
GHESICity Wastewater Treatment Cogen
Interest Rate 9.00%Peak Reduction kW 500 1 2 3 4 5 6 7 8 9 10 11 12 13 14 15 16 17 18 19 20
2007 2008 2009 2010 2011 2012 2013 2014 2015 2016 2017 2018 2019 2020 2021 2022 2023 2024 2025 2026 2027Annual Capital Construction Upgrade 1,232,834.96 Engineering cost 250,000.00Media Replacement $2,911 $2,969 $3,029 $3,089 $3,151 $3,214 $3,278 $3,344 $3,411 $3,479 $3,548 $3,619 $3,692 $3,766 $3,841 $3,918 $3,996 $4,076 $4,158 $4,241Electricity $9,671 $9,961 $10,260 $10,568 $10,885 $11,211 $11,548 $11,894 $12,251 $12,618 $12,997 $13,387 $13,789 $14,202 $14,628 $15,067 $15,519 $15,985 $16,464 $16,958Annual Cogen O&M $80,400 $82,008 $83,648 $85,321 $87,028 $88,768 $90,543 $92,354 $94,201 $96,085 $98,007 $99,967 $101,967 $104,006 $106,086 $108,208 $110,372 $112,579 $114,831 $117,128TOTAL ANNUAL COST $1,482,800 $93,000 $94,900 $96,900 $99,000 $101,100 $103,200 $105,400 $107,600 $109,900 $112,200 $114,600 $117,000 $119,400 $122,000 $124,600 $127,200 $129,900 $132,600 $135,500 $138,300
Annual Inflation RateGeneral 2%Electricity 3%Period 20 years
Total 1,482,835 92,982 94,938 96,937 98,978 101,063 103,193 105,369 107,592 109,863 112,183 114,553 116,974 119,447 121,974 124,555 127,193 129,887 132,640 135,453 138,327
Avoided Generation Capacity cost $/kW/year - 145 147 149 150 152 154 156 158 160 162 164 167 169 171 173 175 178 180 182 185 Avoided Generation Capacity cost for 500kW - 72,421 73,348 74,277 75,206 76,135 77,125 78,116 79,109 80,103 81,164 82,219 83,288 84,371 85,468 86,579 87,704 88,844 89,999 91,169 92,355 Estimated Savings in Heat Recovered 160,800 164,016 167,296 170,642 174,055 177,536 181,087 184,709 188,403 192,171 196,014 199,935 203,933 208,012 212,172 216,416 220,744 225,159 229,662 234,255 Total Savings 233,221 237,364 241,573 245,848 250,190 254,661 259,203 263,818 268,506 273,335 278,233 283,223 288,304 293,480 298,751 304,120 309,588 315,158 320,831 326,610
Cost Benefit B/C ratioNPV 20 year $2,263,004 $2,410,210 1.07
Estimated Electricity ProductionAverage Energy Production 500 kWAnnual electricity production 4,020,000 kWh
Estimated Heat Recovery Factor 4000 btu/kWhEstimated Annual Heat Recovered 16080 MMBTUEstimated Annual Saving in Heat Recovered 160,800$ Estimated Cost of Gas in 2008 10 $/MMBTU
TRC 0 % free riders

Page 66
6.13. Appendix M: LDC System Optimization TRC Details
GHESI - 2007 System Optimization TRC
Interest Rate 9.40%
Annual kWh Savings 428,000
Inflation Rate 2%
2007 2008 2009 2010 2011 2012 2013 2014 2015 2016Capital Costs - Capacitors 55,937 - - - - - - - - -
Capital Costs - Controllers 26,093 - - - - - - - - -
Installation Costs 23,760 - - - - - - - - -
Total Equipment Cost 105,790 - - - - - - - - -
Avoided Energy cost $/kWh 0.06 0.06 0.06 0.06 0.06 0.07 0.07 0.07 0.07 0.07
Energy Savings $ 25,680 26,194 26,717 27,252 27,797 28,353 28,920 29,498 30,088 30,690
Total Benefit 25,680 26,194 26,717 27,252 27,797 28,353 28,920 29,498 30,088 30,690
2017 2018 2019 2020 2021 2022 2023 2024 2025 2026Capital Costs - Capacitors - - - - - - - - -
Capital Costs - Controllers 31,807 - - - - - - - - -
Installation Costs 10,240 - - - - - - - - -
Total Equipment Cost 42,046 - - - - - - - - -
Avoided Energy cost $/kWh 0.07 0.07 0.08 0.08 0.08 0.08 0.08 0.08 0.09 0.09
Energy Savings $ 31,304 31,930 32,568 33,220 33,884 34,562 35,253 35,958 36,677 37,411
Total Benefit 31,304 31,930 32,568 33,220 33,884 34,562 35,253 35,958 36,677 37,411
Free Ridership RateCost Benefit B/C ratio
NPV 20 year $78,646.00 $183,061.45 2.33
30%