1 Matters arising 1.Summary of last weeks lecture 2.The exercises 3.Your queries.
date post
21-Dec-2015Category
view
220download
1
©2007 Austin Troy
Lecture 7:
Introduction to GIS
1. Queries and table operations for a single layer in ArcGIS
2. Intro to queries in Access
Lecture by Austin Troy, University of Vermont
©2007 Austin Troy
Introduction to GIS
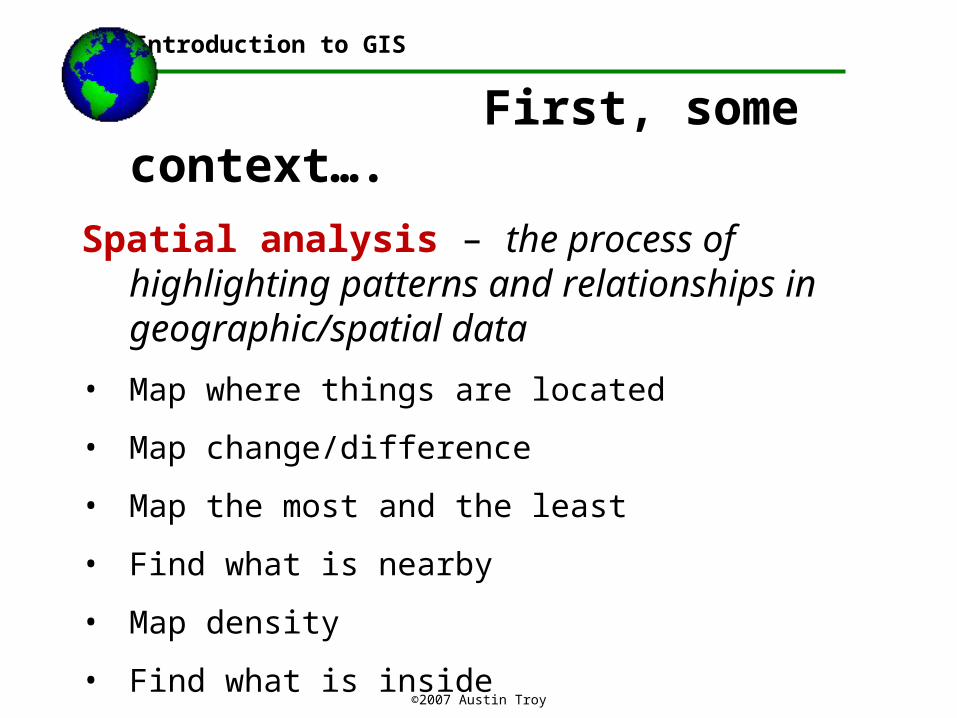
First, some context….
Spatial analysis – the process of highlighting patterns and relationships in geographic/spatial data
• Map where things are located
• Map change/difference
• Map the most and the least
• Find what is nearby
• Map density
• Find what is inside
Geoprocessing – perform spatial analysis using GIS software

©2007 Austin Troy
Introduction to GIS
Types of Vector Analyses• Measuring distances• Simple selection (Select Feature, Find, Identify)• Queries
• Selection by Attribute (attribute query)• Selection by Location (spatial query)
• Density• (Table) Joins and Relates• Proximity Analysis (Buffer, Near, Point Distance)• Spatial Join• Overlay (Intersect, Union, Identity….)• Pre/Post processing (append, dissolve, clip….)
Today’s lecture

©2007 Austin Troy
Introduction to GIS
1. Queries and table operations for a single layer

Fundamentals of GIS
Lecture slides by Austin Troy & Brian Voigt, University of Vermont, © 2011
What is a Query?
• A query is how we ask a question about data
• Queries use mathematical operators, like =, >, <
• For multiple criteria queries, we use logical operators, like AND, OR, NOT
• Queries can simply select records or perform more advanced operations with those selections, such as make new tables, or summarize values

©2007 Austin Troy
What is a query?Find a subset (selection) of features that meet specific criteria
Introduction to GIS
• ArcMap query tools
• Query functions (based on criteria)
• Attribute query (select by attributes)
• Spatial query (select by location)
Select feature interactively
Clear selectionIdentify Find Measure
©2007 Austin Troy
Introduction to GIS
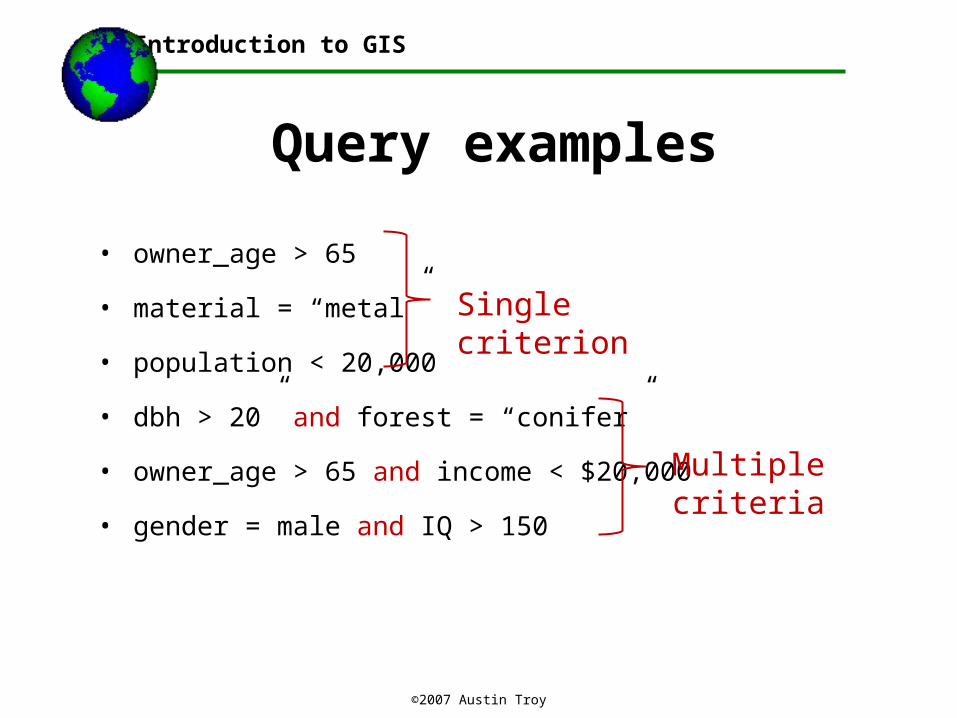
• owner_age > 65
• material = “metal”
• population < 20,000
• dbh > 20” and forest = “conifer”
• owner_age > 65 and income < $20,000
• gender = male and IQ > 150
Query examples
Single criterion
Multiple criteria

©2007 Austin Troy
Queries: New SelectionA simple query in ArcGIS PRICE > $250,000.
Introduction to GIS

©2007 Austin Troy
Queries: New SelectionThat results in the following selection on the map
Introduction to GIS

©2007 Austin Troy
Queries: New SelectionAnd it also selects the corresponding records in the attribute table
Introduction to GIS

©2007 Austin Troy
Introduction to GIS
Four query methods in ArcGIS

©2007 Austin Troy
Introduction to GIS
Building a query

©2007 Austin Troy
Queries: New SelectionHere’s an example with a polygon layer: Identify all census block groups with a population density of more than 250 people/square mile.
Introduction to GIS

©2007 Austin Troy
Multiple Criteria Query: The AND operatorHigh density block groups (>250 per/sq mi) where median household income is greater than $50,000/year
Introduction to GIS

©2007 Austin Troy
Multiple Criteria Query: Select from selected recordsHigh density block groups (>250 per/sq mi) where median household income is greater than $50,000/year
Introduction to GIS

©2007 Austin Troy
Introduction to GIS
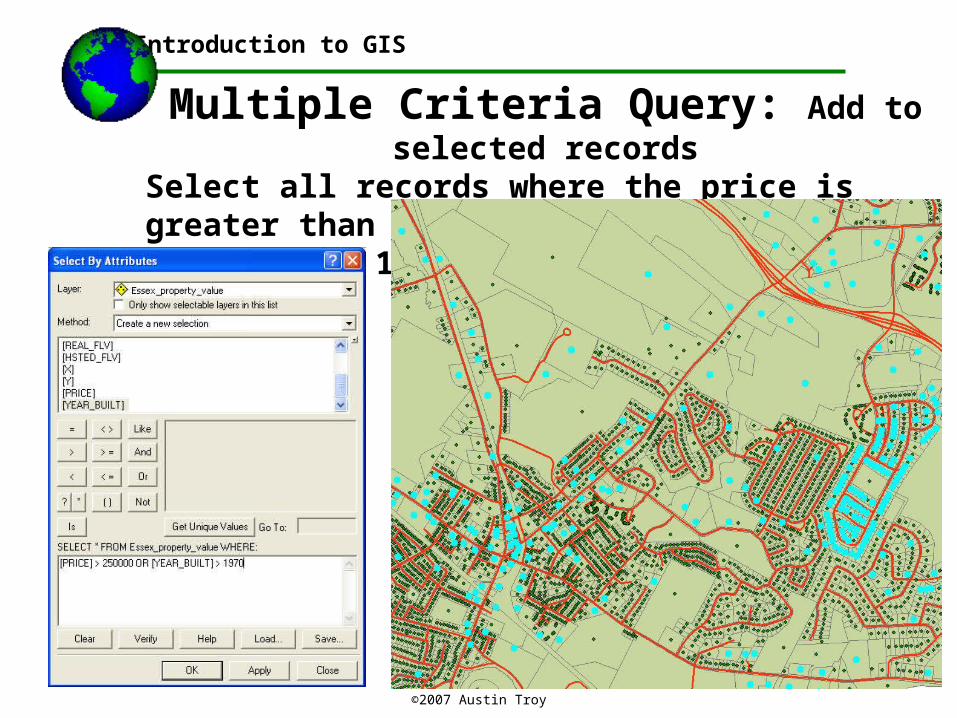
Multiple Criteria Query: The OR operatorSelect all records where the price is greater than $250,000 OR the house was built after 1970
©2007 Austin Troy
Introduction to GIS
Multiple Criteria Query: Add to selected recordsSelect all records where the price is greater than $250,000 OR the house was built after 1970

©2007 Austin Troy
Introduction to GIS
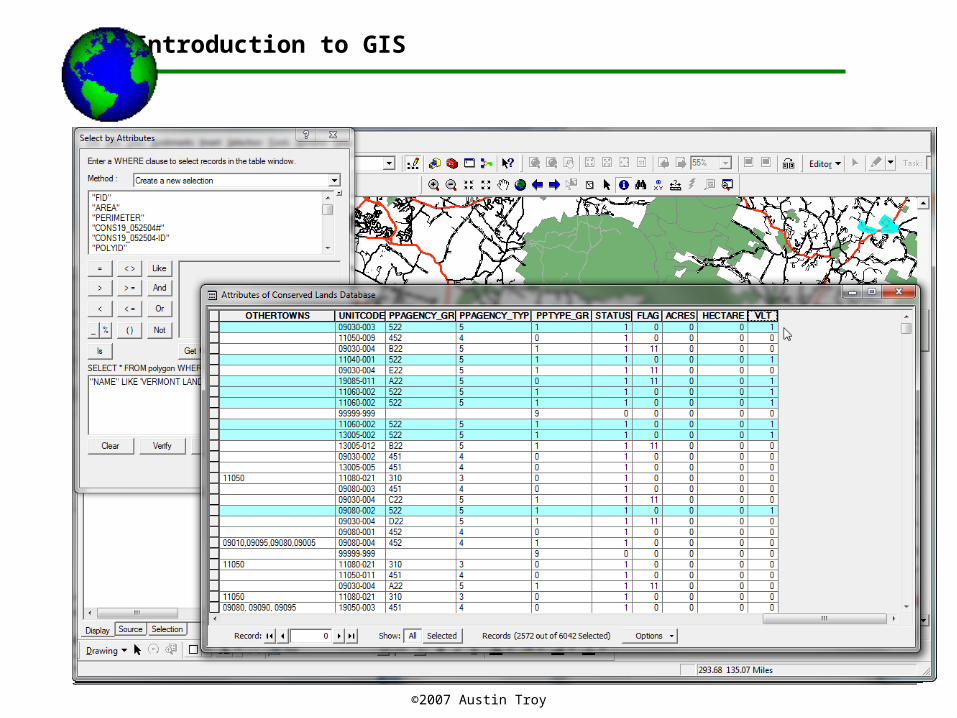
Queries: StringsQueries can also be made on text strings, but it is imperative to put the values in quotes. Here we query for both BLM and Parks and Rec land.

©2007 Austin Troy
Introduction to GIS
Queries: Strings and numbersString and number queries can be combined. For example, let’s say we’re looking for land for a suburban park and our criteria are that we need areas whose land use is classed as agricultural and that are bigger than 500,000 square feet.

©2007 Austin Troy
Introduction to GIS
Queries: Strings and numbersResults in:

©2007 Austin Troy
Introduction to GIS
Queries: Strings and numbersWhereas if our query asks for agricultural land use without the area criterion, we get:

©2007 Austin Troy
Introduction to GIS
Measurement Scales MatterCannot do math on alphanumeric (text) data (a.k.a. strings)!
forest = ‘conifer’
forest = ‘1’
forest > 1 ??

©2007 Austin Troy
Introduction to GIS
So what can ArcGIS do with queries?
A query selects records; once selected you can:• Look at the selection
• Requery the selection
• Switch the selection
• View statistics on the selection
• Create new field that recategorizes selected records
• Create new field by doing calculations across several fields
• Create a new dataset (or layer) from the selection
Careful! Not independent of original dataBetter
©2007 Austin Troy
Introduction to GIS

©2007 Austin Troy
Introduction to GIS
Examples
Let’s query high unemployment census tracts in LA

©2007 Austin Troy
Introduction to GIS
Right click on the heading to get this menu
Now let’s calculate “statistics” to determine the population in those areas. Answer: almost 5 million people live in tracts with 6%+ unemployment (see Sum). We can also see that there are 844 tracts meeting that description (see Count)

©2007 Austin Troy
Introduction to GIS
Another thing we can do is convert the selection to a new shapefile or geodatabase feature class
Right click data layer >> Data >> Export data
Feature class is better than shapefile!

©2007 Austin Troy
Introduction to GIS
Examples
Now, let’s say we wanted to prioritize inner city areas for urban redevelopment projects:
• Let’s query based on unemployment and home value
• Based on these we’ll create a new field that classes all tracts into High, Medium and Low priority areas
Tracts with median home value < $100,000 and unemployment > 12% are “High”

©2007 Austin Troy
Introduction to GIS
To reclassify, we create a new field, “priority”, activate the field heading and use the field calculator to set all selected records to “high”
Note: we must uses quotes with a text field

©2007 Austin Troy
Introduction to GIS
Identifying “medium” priority parcels is a bit more complex because we’re querying for records, say, between 8 and 12% unemployment and between $100,000 and $150,000 median value.
Spelling counts!!

©2007 Austin Troy
Introduction to GIS
Now, for the third class our task is easier—we just select everything that has not been selected yet. To do this we query for “priority”= ‘’
By putting empty quote marks, you’re querying for records with no values in them for that field. Now you’d set all those fields equal to “low.”

©2007 Austin Troy
Introduction to GIS
Now we can make a category map showing us that classification, which is based on two attributes—median value and unemployment

©2007 Austin Troy
Introduction to GIS
Another example:
This time, let’s take a vegetation layer and query for stands with crown fire potential

©2007 Austin Troy
Introduction to GIS
Then let’s calculate a fire hazard index for selected polygons equal to 0.5(rate of spread * flame length)
We’ll create a new field, “fireindex” (floating point) and calculate the values of the selected polygons

©2007 Austin Troy
Introduction to GIS
Finally, for all other polygons without crown fire potential, a different equation can be used, say .38(rate of spread * flame length). But first we have to take the inverse of the selection by using the “switch selection” function
Then we can do the new calculation on the new selection

©2007 Austin Troy
Introduction to GIS
Now we can plot out the map of fire index, plotted out using graduated color (quantity) mapping
©2007 Austin Troy
Introduction to GIS
2. Introduction to queries in Access

©2007 Austin Troy
Access and ArcGIS queriesYou can do all these queries and much much more in MS Access, which is a relational DBMS.
For the most part, you’ll use Access to manipulate and query your attribute tables from geodatabases
This can be done because a personal geodatabase is an MS Access file (.MDB)
There are six basic queries you can do in Access:Select, cross-tab, make table, update,append, delete
We’ll learn more about these in lab
Introduction to GIS
©2007 Austin Troy
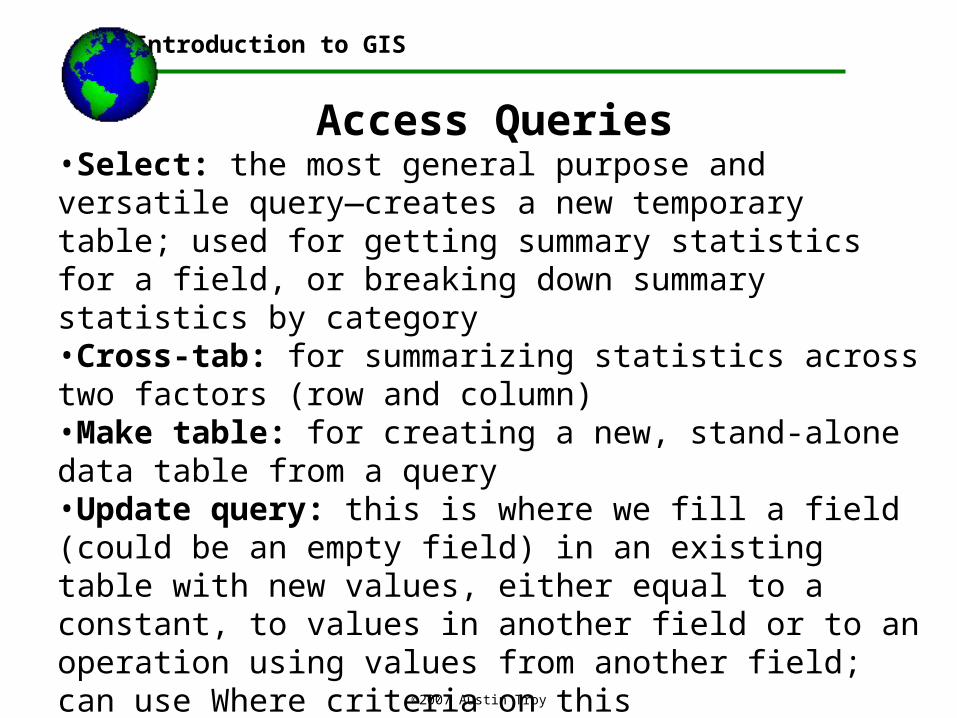
Access Queries•Select: the most general purpose and versatile query—creates a new temporary table; used for getting summary statistics for a field, or breaking down summary statistics by category•Cross-tab: for summarizing statistics across two factors (row and column)•Make table: for creating a new, stand-alone data table from a query•Update query: this is where we fill a field (could be an empty field) in an existing table with new values, either equal to a constant, to values in another field or to an operation using values from another field; can use Where criteria on this•Append/delete queries: query that defines rows to append to or delete from a table; append queries usually require another table.
Introduction to GIS

©2007 Austin Troy
Access QueriesQueries can be used to:
•Summarize information stored in one or many tables•(e.g. sales by year, sales by category, sales by salesperson, sales by
date, orders by date, orders by product type, orders by zip code)
•Create new fields•Using simple or complex expressions•Option of using criteria to specify which records will be filled in for
the new field
•Derive statistics, with or without criteria•averages, maxima/minima, sums, std deviations, counts
•Derive those same things for categories within a field
Introduction to GIS

©2007 Austin Troy
Access QueriesExample of query run to get sums of sales values across product categories:
Introduction to GIS

©2007 Austin Troy
Relational attribute queriesHere’s an Access select query; note how it queries across various linked tablesThis one asks for a summary of sales by category and product name for the dates between 1/1/1997 and 12/31/1997
Introduction to GIS

©2007 Austin Troy
Introduction to GIS
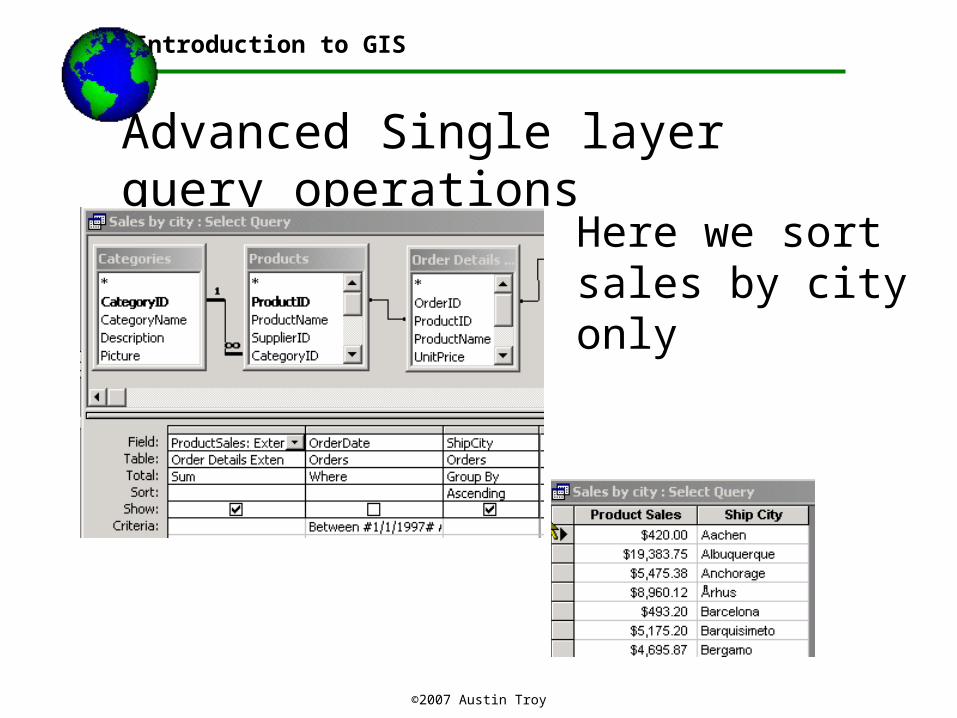
Advanced Single layer query operations
Queries can be used to return statistics: here we get the mean price from a database of housing sales

©2007 Austin Troy
Introduction to GIS
Advanced Single layer query operations
And here we summarize mean price by zip code

©2007 Austin Troy
Introduction to GIS
Remember the food database?

©2007 Austin Troy
Introduction to GIS
Advanced Single layer query operations
This simple select query yields a summary table of sales by category for a given year period: generates a mean value for each category
criteria
relates

©2007 Austin Troy
Introduction to GIS
Advanced Single layer query operations
This select query performs a math operation: it multiplies price and quantity, times a discount and delivers a table of order subtotals

©2007 Austin Troy
Introduction to GIS
Advanced Single layer query operations
Here we sort sales by product and city
operation
criteria
©2007 Austin Troy
Introduction to GIS
Advanced Single layer query operations
Here we sort sales by city only

©2007 Austin Troy
Introduction to GIS
Advanced Single layer query operations
Queries can also be used to make reports, like this invoice