2007 Annual Report - Investisfiles.investis.com/crh/reports/ar2007.pdfCRH Annual Report 2007...
135
CRH Annual Report 2007 PERFORMANCE AND GROWTH
-
Upload
truongdiep -
Category
Documents
-
view
215 -
download
0
Transcript of 2007 Annual Report - Investisfiles.investis.com/crh/reports/ar2007.pdfCRH Annual Report 2007...
CRH Annual Report 2007
P E R F O R M A N C E A N D G R O W T H

1CRH
CRH’s broad geographic, sectoral and product balance, together with its vigorous and consistent development strategy, once again delivered strong performance and growth in 2007. Sales, profits and earnings increased for the 15th consecutive year to new record levels.
2007 Highlights € million
Sales 20,992 +12%
EBITDA 2,860 +16%
Operating profit 2,086 +18%
Profit before tax 1,904 +19%
Basic earnings per share 262.7c +17%
Cash earnings per share 404.9c +15%
Dividend per share 68.0c +31%
Dividend cover (times) 3.9
EBITDA Interest cover (times) 9.4
EBIT Interest cover (times) 6.9
CRH shares are listed on the Irish (ISE) and London (LSE) Stock Exchanges and on the New York Stock Exchange (NYSE) in the form of American Depositary Receipts (ADRs).
The Group has consistently delivered superior long-term growth in total shareholder return, averaging 18% per annum since the Group was formed in 1970.

2 CRH
CRH is a diversified building materials group which manufactures and distributes building material products from the fundamentals of heavy materials and elements to construct the frame, through value-added products that complete the building envelope, to distribution channels which service construction fit-out and renewal.
Materials: The Fundamentals
Aggregates – crushed stone from quarries
Cement – primary binding agent
Asphalt – road and highway surfaces
Readymixed concrete – a mix of aggregates, sand and cement that can be poured into forms
Products: Constructing the Frame
Precast – structural elements cast into designed/highly-engineered forms: floors, beams, vaults ...
Architectural – concrete elements for residential and non-residential building: blocks, bricks, pavers ...
Construction accessories – components to assist in the building process

3CRH
Products: Completing the Envelope
Clay – traditional facing brick cladding products
Glass – engineered products for external and internal use
Insulation – to improve the comfort and energy efficiency
Fencing & Security – outdoor security and protection systems
Daylight & Ventilation – products to optimise climate control and daylight access
Roller, Shutters & Awnings – security and climate control
Distribution: Fit-out and Renewal
Merchants – channelling building material products to the
professional contractor
DIY – providing decorative and home improvement products to the consumer
4 CRH
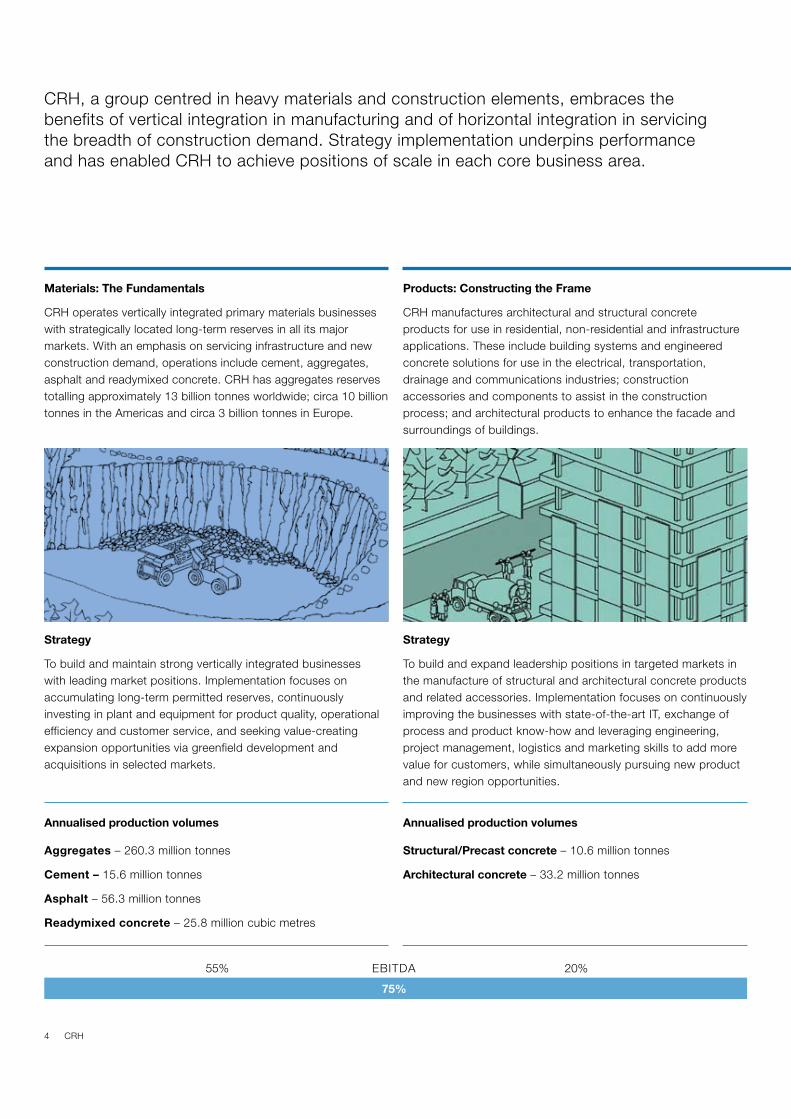
CRH, a group centred in heavy materials and construction elements, embraces the benefits of vertical integration in manufacturing and of horizontal integration in servicing the breadth of construction demand. Strategy implementation underpins performance and has enabled CRH to achieve positions of scale in each core business area.
Materials: The Fundamentals
CRH operates vertically integrated primary materials businesses with strategically located long-term reserves in all its major markets. With an emphasis on servicing infrastructure and new construction demand, operations include cement, aggregates, asphalt and readymixed concrete. CRH has aggregates reserves totalling approximately 13 billion tonnes worldwide; circa 10 billion tonnes in the Americas and circa 3 billion tonnes in Europe.
Strategy
To build and maintain strong vertically integrated businesses with leading market positions. Implementation focuses on accumulating long-term permitted reserves, continuously investing in plant and equipment for product quality, operational efficiency and customer service, and seeking value-creating expansion opportunities via greenfield development and acquisitions in selected markets.
Annualised production volumes
Aggregates – 260.3 million tonnes
Cement – 15.6 million tonnes
Asphalt – 56.3 million tonnes
Readymixed concrete – 25.8 million cubic metres
Products: Constructing the Frame
CRH manufactures architectural and structural concrete products for use in residential, non-residential and infrastructure applications. These include building systems and engineered concrete solutions for use in the electrical, transportation, drainage and communications industries; construction accessories and components to assist in the construction process; and architectural products to enhance the facade and surroundings of buildings.
Strategy
To build and expand leadership positions in targeted markets in the manufacture of structural and architectural concrete products and related accessories. Implementation focuses on continuously improving the businesses with state-of-the-art IT, exchange of process and product know-how and leveraging engineering, project management, logistics and marketing skills to add more value for customers, while simultaneously pursuing new product and new region opportunities.
Annualised production volumes
Structural/Precast concrete – 10.6 million tonnes
Architectural concrete – 33.2 million tonnes
55% EBITDA 20%
75%

5CRH
Products: Completing the Envelope
CRH produces a range of complementary value-added building products to complete the building envelope and optimise climate control and energy efficiency of buildings. Products include architectural glass, clay brick and block, insulation materials, systems for daylight and ventilation, fencing and security, and rollers, shutters and awnings, each of which serves to provide a balanced exposure to demand drivers.
Strategy
To develop current strong positions and seek new platforms for growth in these complementary product segments. Implementation focuses on increasing penetration for CRH product offerings, edge expansion into new architectural products and solutions, developing positions to benefit from scale and best practices, and creating competitive advantage through product, process and end-use innovation.
Annualised production volumes
Clay – 4.3 million tonnes
Glass/Rooflights – 13.7 million square metres
Insulation – 6.2 million cubic metres
Fencing & security – 14.2 million lineal metres
Distribution: Fit-out and Renewal
CRH distributes building materials to professional roofing/siding and interior products contractors in the United States and to general building contractors and Do-It-Yourself (DIY) customers in Europe. With an expanding network of 200 branches in the United States and 688 branches in Europe, CRH is now a leading international player in building materials distribution.
Strategy
To build and grow a strong network of professional builders merchants and DIY stores primarily in metropolitan areas. Implementation focuses on organisational initiatives and best-in-class IT to realise operational excellence, optimise the supply chain and provide superior customer service, while seeking opportunities to invest in new regions and other attractive segments of building materials distribution.
Outlets
Builders merchants – 648 stores
DIY – 240 stores
12% EBITDA 13%
25%
6 CRH
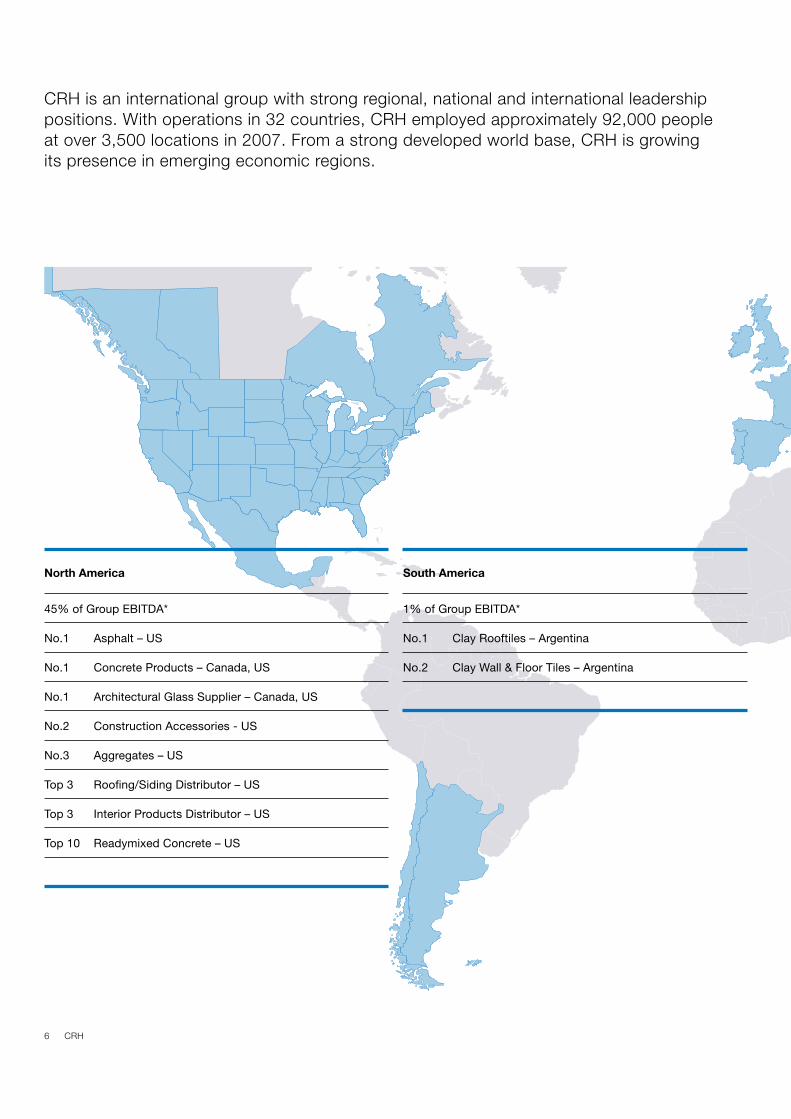
CRH is an international group with strong regional, national and international leadership positions. With operations in 32 countries, CRH employed approximately 92,000 people at over 3,500 locations in 2007. From a strong developed world base, CRH is growing its presence in emerging economic regions.
North America
45% of Group EBITDA*
No.1 Asphalt – US
No.1 Concrete Products – Canada, US
No.1 Architectural Glass Supplier – Canada, US
No.2 Construction Accessories - US
No.3 Aggregates – US
Top 3 Roofing/Siding Distributor – US
Top 3 Interior Products Distributor – US
Top 10 Readymixed Concrete – US
South America
1% of Group EBITDA*
No.1 Clay Rooftiles – Argentina
No.2 Clay Wall & Floor Tiles – Argentina
7CRH
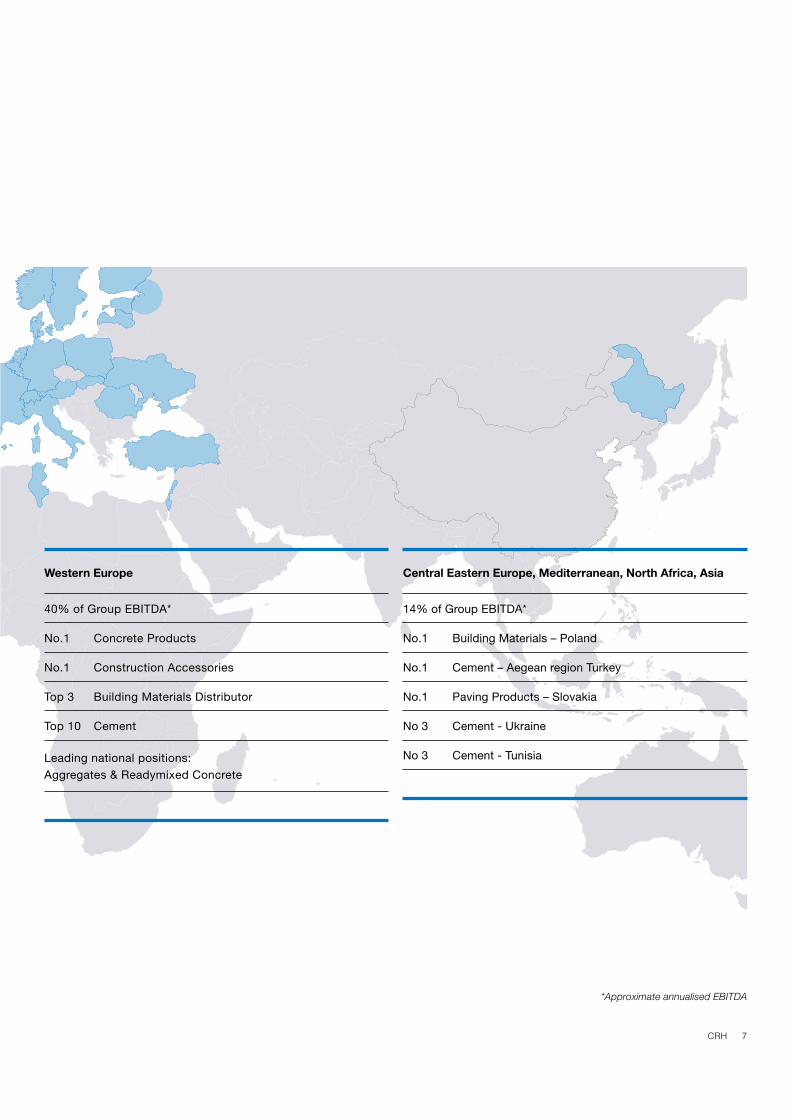
Western Europe
40% of Group EBITDA*
No.1 Concrete Products
No.1 Construction Accessories
Top 3 Building Materials Distributor
Top 10 Cement
Leading national positions: Aggregates & Readymixed Concrete
Central Eastern Europe, Mediterranean, North Africa, Asia
14% of Group EBITDA*
No.1 Building Materials – Poland
No.1 Cement – Aegean region Turkey
No.1 Paving Products – Slovakia
No 3 Cement - Ukraine
No 3 Cement - Tunisia
*Approximate annualised EBITDA

8 CRH
As an international leader in building materials, CRH is committed to operating ethically and responsibly. We are focused on embedding Corporate Social Responsibility (CSR) in all aspects of Group operations which relate to our employees, customers, local communities and all other stakeholders.
Corporate Governance
CRH is committed to the highest standards of corporate governance. Since 2003 it has implemented a Code of Business Conduct groupwide. In the context of growth into developing economies and increased legislative requirements, an updated Code is being launched during 2008. CRH’s excellence in corporate governance was recently rated at 10, the highest assigned by GMI (Governance Metrics International), putting CRH in the top 1% of GMI’s global research universe.
Environment
CRH is committed to good environmental stewardship in all its activities. In particular, it is addressing the challenges of climate change through major capital investment programmes at its cement plants in Finland, Ireland, Ukraine and Poland. The Ukraine project is the world’s first Joint Implementation Project (JI-0001) registered by the UNFCCC under the flexible mechanisms of the Kyoto Protocol, and will replace an old-technology wet-process plant with a state-of-the-art dry process plant.
CSR embraces four key aspects of our business, namely corporate governance, environment, health & safety and social performance. In each of these areas, we have clearly defined Group policies, objectives, implementation programmes, review procedures, feedback and reporting mechanisms.
The positive commitment to CSR is a defining characteristic of management in CRH. Much progress has been made and more remains to be achieved as we strive to meet the ever-increasing expectations of all our stakeholders. We believe that achieving these expectations will be positive for our businesses.
As part of our CSR commitments, we are actively addressing climate change through significant upgrading investments in our cement, lime and clay brick plants. In addition, we see climate change as an innovative driving force in all our activities and the associated challenges can become our future opportunities.
This section contains examples of some of our main CSR activities during the year. A detailed review of corporate governance is addressed on pages 42 to 45 of this Report and full details of our environmental, health & safety and social performance are published in our annual CSR Report, downloadable from our website www.crh.com.
9CRH
Health & Safety
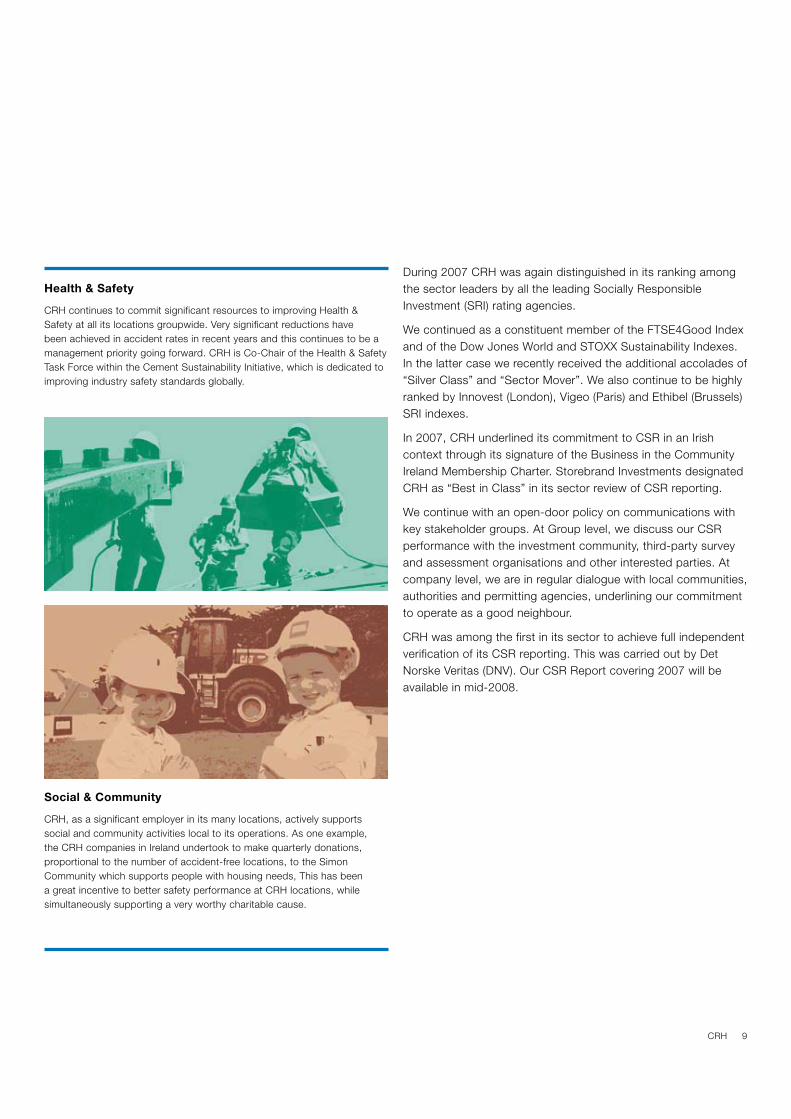
CRH continues to commit significant resources to improving Health & Safety at all its locations groupwide. Very significant reductions have been achieved in accident rates in recent years and this continues to be a management priority going forward. CRH is Co-Chair of the Health & Safety Task Force within the Cement Sustainability Initiative, which is dedicated to improving industry safety standards globally.
Social & Community
CRH, as a significant employer in its many locations, actively supports social and community activities local to its operations. As one example, the CRH companies in Ireland undertook to make quarterly donations, proportional to the number of accident-free locations, to the Simon Community which supports people with housing needs, This has been a great incentive to better safety performance at CRH locations, while simultaneously supporting a very worthy charitable cause.
During 2007 CRH was again distinguished in its ranking among the sector leaders by all the leading Socially Responsible Investment (SRI) rating agencies.
We continued as a constituent member of the FTSE4Good Index and of the Dow Jones World and STOXX Sustainability Indexes. In the latter case we recently received the additional accolades of “Silver Class” and “Sector Mover”. We also continue to be highly ranked by Innovest (London), Vigeo (Paris) and Ethibel (Brussels) SRI indexes.
In 2007, CRH underlined its commitment to CSR in an Irish context through its signature of the Business in the Community Ireland Membership Charter. Storebrand Investments designated CRH as “Best in Class” in its sector review of CSR reporting.
We continue with an open-door policy on communications with key stakeholder groups. At Group level, we discuss our CSR performance with the investment community, third-party survey and assessment organisations and other interested parties. At company level, we are in regular dialogue with local communities, authorities and permitting agencies, underlining our commitment to operate as a good neighbour.
CRH was among the first in its sector to achieve full independent verification of its CSR reporting. This was carried out by Det Norske Veritas (DNV). Our CSR Report covering 2007 will be available in mid-2008.

10 CRH
CRH strategy is consistent and clear – to sustain and build a balanced business with exposure to multiple demand drivers that can deliver CRH’s strategic vision to “be a responsible international leader in building materials delivering superior performance and growth”.
Building Materials is an inherently cyclical business linked primarily to GDP growth in local economies. Recognising the variability that cyclicality brings, CRH strategy is to build a balanced business with exposure to multiple demand drivers. Geographic and product balance serves to smooth out the effects of changing economic conditions and to provide multiple opportunities for growth. Sectoral and end-use balance reduces the effects of varying demand patterns across building and construction activity by maintaining a balanced portfolio of products, serving a broad customer base.
Our unique balance across regions, products and all building and construction sectors is one of the key drivers of CRH strategy. Together with the Group’s relentless focus on performance, multiple growth platforms from which to pursue value-creating opportunities, dedicated people with ambition to achieve, operating in an environment which values strong governance and prudent polices, these characteristics underpin the Group’s ability to deliver consistent performance.
In 2007, CRH was evenly balanced between the geographies of North America and Western Europe with a growing component of activity in the emerging regions of Central and Eastern Europe, the Mediterranean, North Africa, South and Central America and Asia. While product balance remains weighted towards the heavyside with 75% in materials and concrete products and 25% in lightside products and distribution, each of these businesses deliver strong returns on capital through the cycle. Sectoral balance remains stable at 40:35:25 and end-use balance, which tends to trend towards RMI in developed economies is counter-balanced by significant new build demand in developing economies.
Geography
Products
End-use
New/RMI
North America
45%
Western Europe
40%
Emerging
15%
Residential
40%
Non-residential
35%
Infrastructure
25%
New
60%
Repair, Maintenance and Improvement (RMI)
40%
Materials
55%
Distribution
13%
Concrete products
20%
Other products
12%
Approximate annualised EBITDA

11CRH
This strategy has enabled CRH to deliver consistent performance and consistent returns over the long-term. 2007 is CRH’s 15th consecutive year of earnings and profit growth despite a weaker economic backdrop in the early 2000’s – a significant achievement within our industry.
CRH has a track record of unbroken growth since 1992 when the global economy began to emerge from a severe recession caused primarily by the Gulf War and high energy prices. During 1990-1992 CRH also experienced a decline in demand and earnings, but strong cash flows enabled the business to recover rapidly as the world economies began to improve.
In the economic prosperity that followed, CRH developed extensively making significant steps in the United States and in Europe. From a largely Ireland and materials focus in 1990, CRH expanded through the decade to become a business with balanced exposure to Europe and the Americas, and balanced exposure to materials, products and distribution by 2000.
While CRH strategy has and will continue to evolve with the expansion and development of the Group, the solid foundation of a balanced business with an emphasis on performance delivery remains core. As we look to the future, CRH will continue to optimise its business positions in the developed world where returns are more predictable and business practices are more developed. In parallel, CRH will seek to establish, in a measured way, platforms for the future in emerging economies that show the potential for above-average growth.
During 2001-2003, the world economies experienced a slowdown albeit of lesser scale than in 1990, driven primarily by the dot.com crash and the tragedy of the September 11 atrocities in New York. Despite a weaker US Dollar and a marked decline in United States activity, the strength of the business balance provided CRH with a basis to continue to pursue growth opportunities and, with a culture of performance, CRH delivered modest growth each year through this period. In the four years from 2003-2007 profits and earnings grew strongly with an average compound annual growth of approximately 20% in earnings per share.
CRH is committed to meeting the future needs of its customer base. With its diverse yet balanced business, experience of managing through economic cycles, devolved organisation responsive to market conditions and strong focus on delivery, CRH has a sound basis on which to continue its strategy of delivering superior performance and growth.
90 91 92 95 98 02 0593 96 99 03 0694 97 0100 04 07
250c
200c
150c
100c
50c
0c
EPSGDP Western Europe GDP US GDP CRH EPS
5%
4%
3%
2%
1%
0%
-1%
12 CRH
Strong Growth in Difficult
Conditions
The Group once again performed strongly in 2007 to deliver record full year financial results with profits before tax of €1.9 billion and earnings per share of 262.7 cent, representing increases of 19% and 17% respectively.
These results were delivered against a background of particularly challenging trading conditions including a sharp drop in residential construction activity in the United States, continuing increases in energy costs, and reducing growth rates in some of our major European markets. We were also confronted with a steep decline in the US Dollar which had a significant adverse effect on the translation into euro of our United States operating profits.
The ability of CRH management and staff to achieve exceptional levels of operational performance in this environment is to be commended. The benefits of the balanced spread of operations across many geo-graphic regions and construction sectors were again demonstrated in these results.
Details of the performances of the Group’s Divisions are given in the Chief Executive’s Review and in the Operations and Finance Reviews which follow.
Profitability and Earnings
Profit before tax increased by 19% to €1.9 billion. Earnings per share increased by 17% to 262.7 cent. Cash earnings per share were 404.9 cent compared with 352.1 cent in the preceding year. Over the past five years, despite significant currency impacts and high energy
cost inflation, the Group has delivered annualised earnings per share growth of 17% per annum. We regard this as a very good outcome.
Dividend
As indicated in the 2006 Annual Report, the Board decided last year to move towards a higher payout ratio and reduced level of dividend cover over the three financial years 2006 to 2008, with the aim of achieving dividend cover of the order of 3.5 times for the 2008 financial year. Accordingly, in this the second year of our three year process, a final dividend of 48 cent per share (2006: 38.5 cent per share) is now being recommended by the Board. This, if approved by the Annual General Meeting on 7th May 2008, will result in a total dividend for 2007 of 68 cent, an increase of 31% over 2006, and representing 2007 dividend cover of 3.9 times.
This is CRH’s 24th consecutive year of dividend increase at a compound annual rate of 14%.
Development Activity
Full year development spend for 2007 amounted to €2.2 billion, a new record for CRH. The comparative figure for 2006 was €2.1 billion (net), and €1.3 billion and €1 billion for 2005 and 2004 respectively. The nature and extent of these investments will make an important contribution to delivering further growth for the Group in the years ahead.
First half expenditure of €1 billion comprised the acquisition of Swiss builders merchant Gétaz Romang completed in May; the purchase of a 50% stake in Denizli Cement in Turkey and the buyout of the
remaining 50% of Paver Systems in the United States announced in April; the acquisition of Harbin Sanling Cement in China announced in February plus 31 other initiatives announced in the Development Strategy Update of July 2007.
Second half spending of €1.2 billion included the August buyout of the remaining 55% of Cementbouw bv in the Netherlands; completion of four separate transactions by the Americas Materials Division as announced in September; the purchase of certain Cemex assets in Florida and Arizona announced in late November plus a strong flow of traditional CRH development opportunities outlined in the Development Strategy Update released in January 2008.
In addition during the year we commenced three major cement projects in Ireland, Poland and Ukraine. These combined with ongoing construction of our joint venture cement plant in Florida represent a total investment over three years of approximately €0.7 billion targeted at modernising and expanding cement production in three key European markets and providing CRH’s first investment in cement in the United States.
Corporate Governance
A detailed statement setting out CRH’s key governance principles and practices is provided on pages 42 to 45. The Board and Management of CRH are committed to achieving the highest standards of Corporate Governance and ethical business conduct, and are satisfied that appropriate systems of internal control are in place throughout the Group.
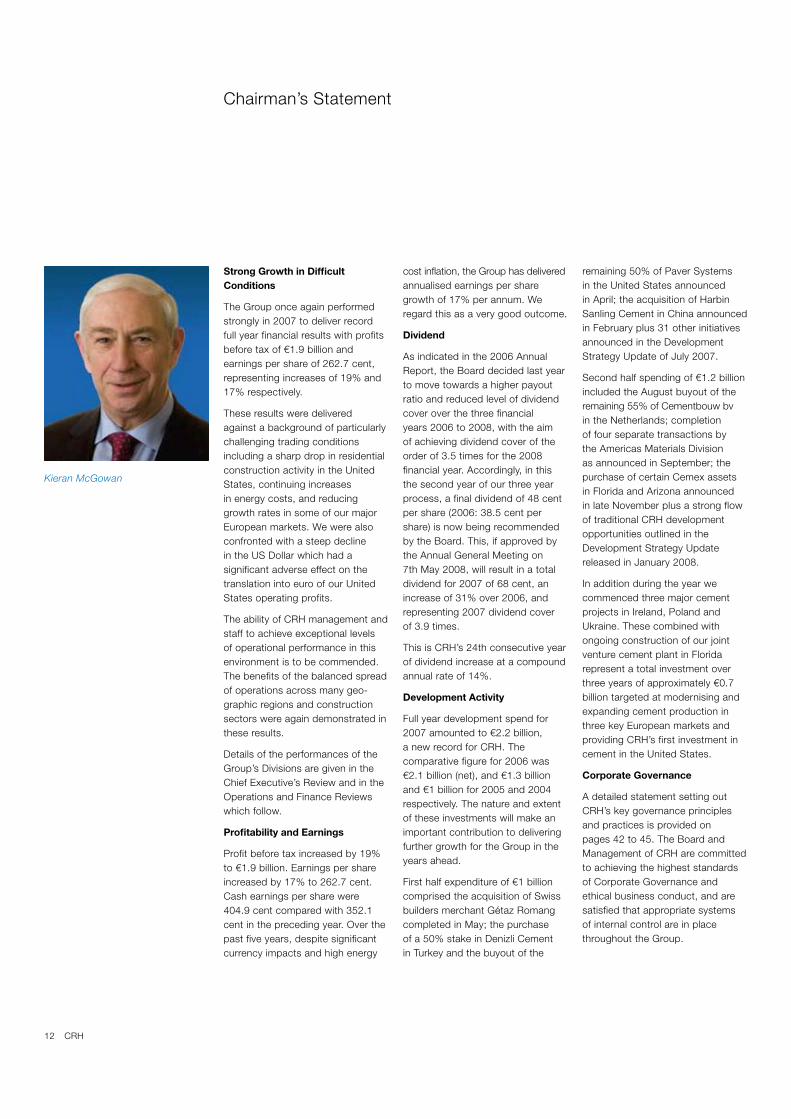
Chairman’s Statement
Kieran McGowan
13CRH
CRH’s unique culture of performance and achievement delivered another year of record results in 2007
Board and Senior Management
Pat Molloy retired from the Board and from the Chairmanship following the Annual General Meeting on 9th May 2007. Pat joined the Board in 1997 and became Chairman in May 2000. His leadership of the Board over the past seven years has been exceptional and he has made a huge contribution to the successful growth and development of the Group during that time. He is a great role model and I thank him sincerely for his valued inputs and wise counsel.
Declan Doyle retired from his role as Managing Director Europe Materials on 30th June 2007 after 39 years with CRH. He was a member of the Board since 2004 and was one of a number of extremely talented executives who built CRH to its present size and strength.
David Kennedy will retire from the Board on completion of the Annual General Meeting on 7th May 2008. David has been a non-executive Director since 1989 and has been Senior Independent Director and Chairman of the Remuneration Committee since May 2006. I thank David for his unique contributions to the effectiveness of the Board and to the development and success of CRH over the many years of his directorship.
In July 2007 we announced the co-option to the Board of Professor Utz-Hellmuth Felcht as a non-executive Director. Utz-Hellmuth Felcht, who is a German national, was until May of 2006 Chief Executive of Degussa GmbH, Germany’s third largest chemical company, with operations on all five continents and sales of
approximately €11 billion. He brings valuable international experience to the Board and his appointment continues the process of Board renewal at a pace which is consistent with the maintenance of the Board’s teamwork and core values.
As provided in the Company’s Articles of Association, Utz-Hellmuth Felcht is proposed for re-election at the Annual General Meeting on 7th May 2008. Also, in accordance with the Articles of Association and best practice in relation to re-election of directors, Nicky Hartery, Tom Hill, Joyce O’Connor and I will retire from the Board and seek re-election at the Annual General Meeting. I have conducted a formal evaluation of the performances of all Directors and can confirm that each of the Directors continues to perform effectively and to demonstrate commitment to the role.
Management and Staff
CRH’s management and staff have been the key element in differentiating the Group from its competitors. We have a quite exceptional management team. Their leadership and their ability to attract, develop and retain talented people is a fundamental strength of CRH. There is a unique culture of performance and achievement throughout the Group, and this will ensure that, whatever the business environment, CRH has the capacity to deliver superior performance and growth. On behalf of the Board, I thank Liam O’Mahony and all CRH employees for their commitment and loyalty to the success of the Group and I congratulate them on another great set of results in 2007.
Conclusion
Management’s views on the outlook for 2008 are set out more comprehensively in the Chief Executive’s Review and the various Operations Reviews. While trading conditions will be challenging in residential construction in the United States, and growth in some European markets will be slower than in 2007, it is expected that these will be balanced by continuing good activity levels in the infrastructure sector in the United States as well as by strong growth in Central and Eastern European economies. Continued relentless focus on price and cost effectiveness across the Group, the benefits of our record 2007 acquisition spend and our continuing focus on development will, we expect, enable the Group to deliver further progress in the current year.
14 CRH
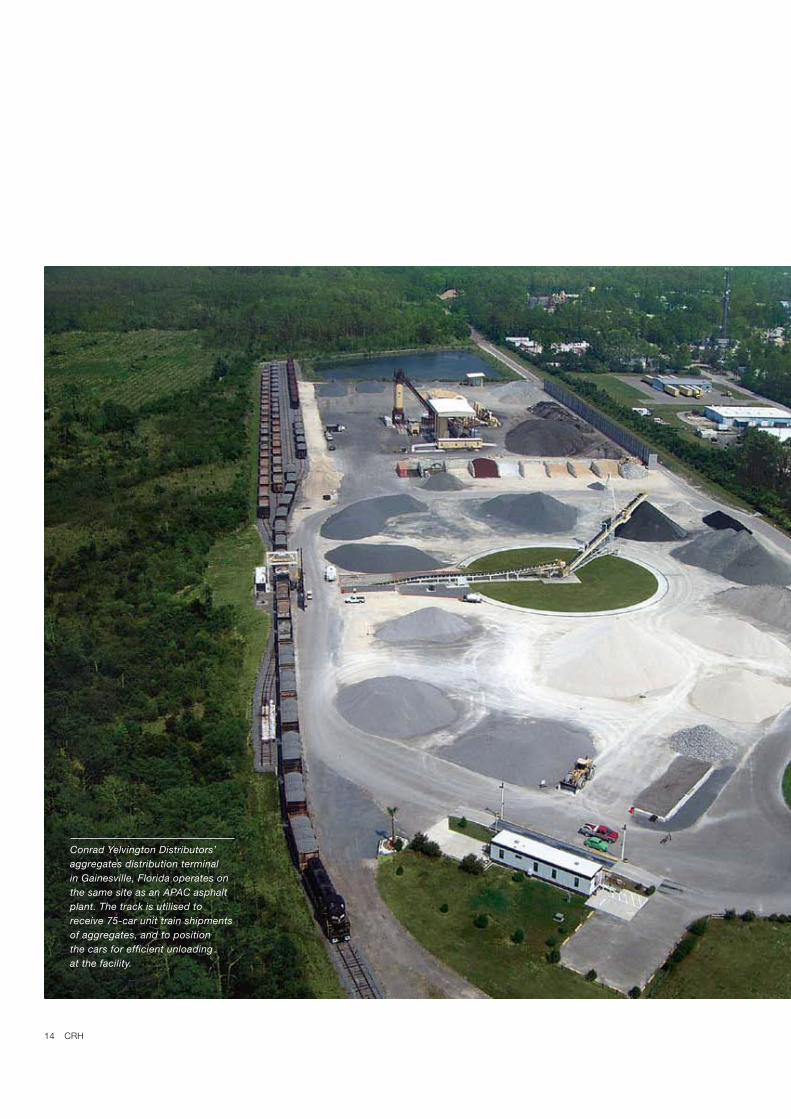
Conrad Yelvington Distributors’ aggregates distribution terminal in Gainesville, Florida operates on the same site as an APAC asphalt plant. The track is utilised to receive 75-car unit train shipments of aggregates, and to position the cars for efficient unloading at the facility.
15CRH
Overview
CRH’s broad geographic, sectoral and product balance, together with its vigorous and consistent development strategy, once again delivered strong performance and growth in 2007. Sales, profits and earnings increased for the 15th consecutive year to new record levels. As in previous years, 2007 growth came both from organic operations and acquisitions. Development activity was also at new record levels. This continued year-in-year-out delivery over such an extended period, is a striking testament to CRH’s strategy and to the talent and commitment of our 90,000-strong team across the world. My thanks to all throughout our organisation who have made this tremendous track record happen.
Some of the year’s significant highlights include:
Sales up 12% to €21 billion, exceeding the €20 billion mark for the first time.
EBITDA up 16% to €2.9 billion, operating profit up 18% to €2.1 billion, and profit before tax up 19% to €1.9 billion.
Profit on disposal of fixed assets up from €40 million to €57 million; it is expected that disposal of surplus properties will be an ongoing feature.
Earnings per share up 17% to 262.7 cent, the 15th consecutive year of earnings growth.
This significant increase in profits and earnings was achieved despite the translation impact of the further decline in the US Dollar in 2007, which had a negative impact of approximately 5% on profits and earnings.
Dividend per share up for the 24th consecutive year, a 31% increase to 68 cent. This follows a 33% increase in 2006, and is part of a 3-year programme of increasing payout to reduce dividend cover to a targeted 3.5 times for the 2008 financial year.
Operating margin (Operating Profit/Sales) increasing sharply to 9.9% (2006: 9.4%); a combination of good cost control and successful commercial focus. Return on capital employed (EBIT/Net Assets) up again to 16%.
Record acquisition spend of €2.2 billion, surpassing 2006’s €2.1 billion (net), spread across all Divisions and regions including taking us into Turkey and China for the first time.
Capital expenditure of €1 billion. In addition to normal replacements (approximately 90% of depreciation in 2007), this included €0.3 billion of development capital expenditure, building the base of our business for the future.
Continued strong cash flow, with a year-end EBITDA/Interest cover of 9.4 times. This has enabled CRH to launch a limited share buy-back programme in early 2008, while maintaining significant flexibility and capacity to continue to grow the Group through value-creating acquisitions.
2007 Operations
2007 was a year of robust delivery despite many challenges. Economic growth was strong in Eastern Europe, while in the core Eurozone countries a very busy first half was followed by a somewhat slower pace of growth in the second half.
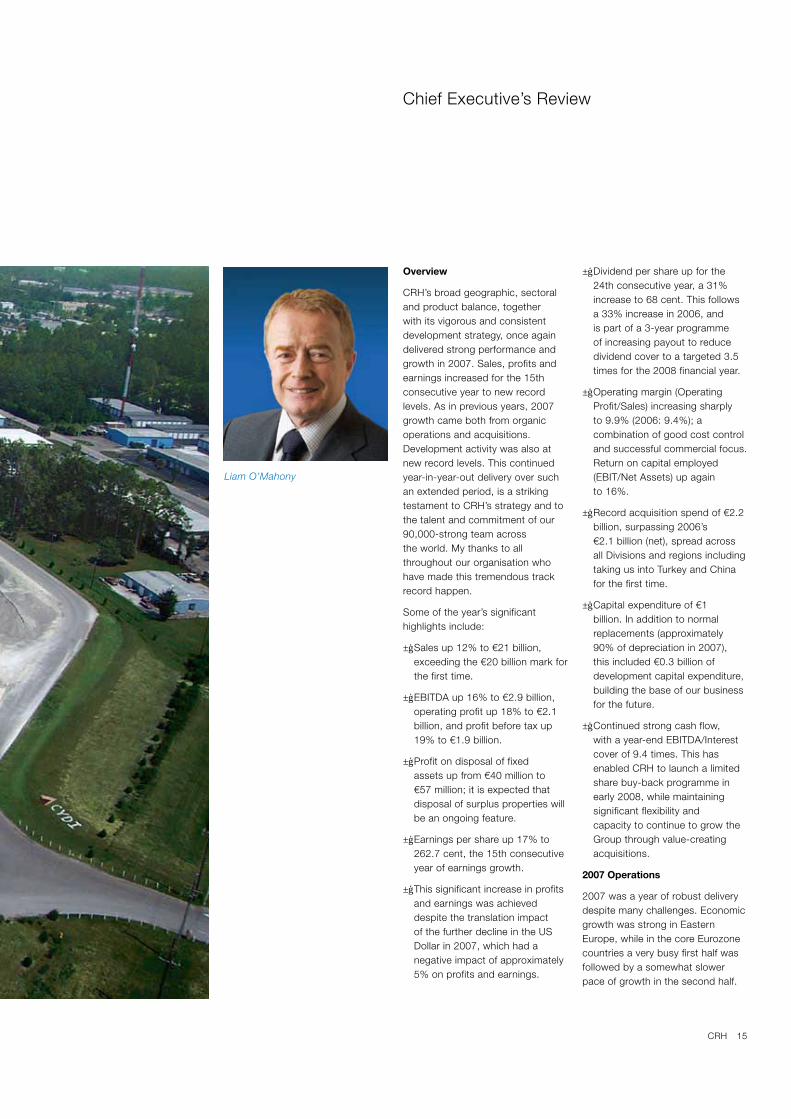
Chief Executive’s Review
Liam O’Mahony

16 CRH
In the United States the decline in new residential construction which started in 2006 accelerated considerably, exacerbated by the credit crisis, but the non-residential sector continued to grow while highway activity benefited from robust public funding programmes.
Europe Materials, which has leading positions in Ireland, Finland, the Baltics, Poland, Ukraine, Switzer-land, Spain, Portugal and the Eastern Mediterranean, enjoyed, with some exceptions, generally favourable economic conditions. Activity was particularly busy in Eastern Europe with strong volume and profit increases; profits also increased across the Western European network at a satisfactory pace with some volume growth and good price and cost discipline. Operating profit for the year grew by a strong 39%.
Europe Products & Distribution continued its recovery from the relatively anaemic markets of the early part of the decade, and operating profit grew by over 30%. There was a marked improvement in operating profit and margin in the first half, while the second half saw a slower pace of demand growth, particularly in Germany. The Eurozone is the largest region for Europe Products & Distribution and had a reasonable growth in activity. Denmark and Switzerland were strong, the UK was flat, while the Division also benefited from its small but growing exposure in Eastern Europe. The Concrete, Clay and Building Products businesses all delivered increased profits, as did Distribution, with a particularly strong initial eight-month contribution from Gétaz Romang in Switzerland.
Our Americas Materials business, which is a national leader in
aggregates, asphalt and readymixed concrete, delivered operating profits up 31% in dollar terms. Organic profits were up approximately 10%, while APAC, the major acquisition in 2006, performed very strongly. Infrastructure is the key end-use and highway funding was strong with good spend from the multi-year dedicated Federal programme and from State and local sources. As in recent years, recovery of energy cost increases through efficiency, cost and pricing initiatives was a priority; the successful push-through of the necessary price increases led to volume reductions but boosted profitability.
Our Americas Products & Distribution businesses sell principally to the residential and non-residential sectors. The significant decline in new residential construction led to difficult market conditions right across the country, but this was in part offset by continued strength in non-residential activity. MMI, the new platform acquired in 2006, was hardest hit among our Products businesses and had a poor year; various initiatives are in place to improve future profitability. The Architectural Products, Precast and Glass groups all performed satisfactorily. Distribution was also hit hard by the residential decline; while operating profit and margin were down from the record 2006 levels, a margin of 5.3% was resilient in the circumstances. Our operations in Canada, Argentina and Chile once again had strong outcomes. Overall operating profits for Americas Products & Distribution declined 6% in dollar terms.
Development
Following a record acquisition spend of €2.1 billion (net) in 2006, CRH continued the momentum
in 2007, spending €2.2 billion on 78 acquisitions which strengthen, expand, and add value to our network. In addition a further €0.7 billion 3-year programme of investment in cement plant modernisation and expansion was progressed.
As the above table shows, the acquisitions were well spread across all geographies and product groups.
Europe Materials acquired 50% of Denizli Cement, a 1.8 million tonne per annum modern cement plant in southwestern Turkey with a vertically integrated readymixed concrete business, and 100% of Harbin Sanling Cement, a modern 650,000 tonne cement plant in northeastern China. These represent our first ventures in those regions, and provide platforms for future growth – indeed since year-end we have signed a contract to acquire 26%, with an option to go to 49% in due course, of the leading cement manufacturer in northeastern China, Yatai Cement, with 9 million tonnes of cement capacity which is currently being expanded to 18 million tonnes.
In the Americas the largest deals were the acquisition of Conrad Yelvington Distributors, with a major network of depots and railcars for distributing aggregates in Florida; together with certain aggregates and readymixed concrete assets
acquired from Cemex in Florida and Arizona.
On the Products & Distribution side, the keynote European deal was the acquisition of Gétaz Romang, the leading building materials distributor in French-speaking Switzerland which, together with our existing operations in the German-speaking area, gives CRH strong national leadership.
In the western United States, the acquisition of Acoustical Materials Services brings leadership in the distribution of interior products, a growing sub-sector for our United States Distribution Division, while the acquisition of Vistawall enhances the product offering of our Glass group in architectural glazing systems.
The vast majority of our 2007 acquisitions are value-enhancing bolt-ons which continue to develop our cement and aggregates platforms, expand existing strong market positions for our Products operations and leverage our successful Distribution business model.
There were also a number of major cement development projects commenced and/or progressed during the year:
In Ireland a €200 million new state-of-the-art 1.3 million tonne plant at Platin, partly replacement, partly expansion; planned to come on-stream towards year-end.
2007 Acquisition Spend
€ billion Europe Americas Total
Materials 0.36 0.64 1.00
Products: – Concrete 0.19 0.22 0.41
– Other 0.03 0.14 0.17
Distribution 0.44 0.21 0.65
Total 1.02 1.21 2.23
Chief Executive’s Review continued
17CRH
In Ukraine a €210 million wet to dry conversion giving a new state-of-the-art 3 million tonne plant; planned to come on-stream in 2009.
In Poland a €200 million 1.8 million tonne capacity expansion to meet growing demand; planned to come on-stream in 2009.
In the United States, progress in the 50% joint venture cement plant announced in 2006; a US$200 million, 1.1 million tonne plant in Florida, which is planned to come on-stream towards year-end.
The combination of our acquisition and greenfield investment initiatives continues to underpin CRH’s future performance and growth.
Organisation and People
Following the significant evolution in our organisation in recent years, when a number of senior executives retired and were succeeded from within, 2007 was a year for consolidation. The new leaders have stepped up into their roles extremely well and the organisation is functioning very effectively, all of which augurs well for the future progress of the Group.
As mentioned in the 2006 Report, Declan Doyle, Managing Director Europe Materials, and Tony O’Loghlen, Chief Operating Officer, retired during the year and Albert Manifold and Henry Morris stepped up very successfully to succeed them. Declan and Tony have been at the heart of CRH for many years and we thank them for their enormous contributions to our success.
Corporate Social Responsibility
(CSR)
CRH’s commitment to CSR, which is embedded throughout the Group,
is set out elsewhere in this Report, and in the separate CSR Report on our website www.crh.com. The leading Socially Responsible Investment Rating Agencies rank CRH as a sector leader, and we are a member of the FTSE4Good and Dow Jones World and STOXX Sustainability indexes.
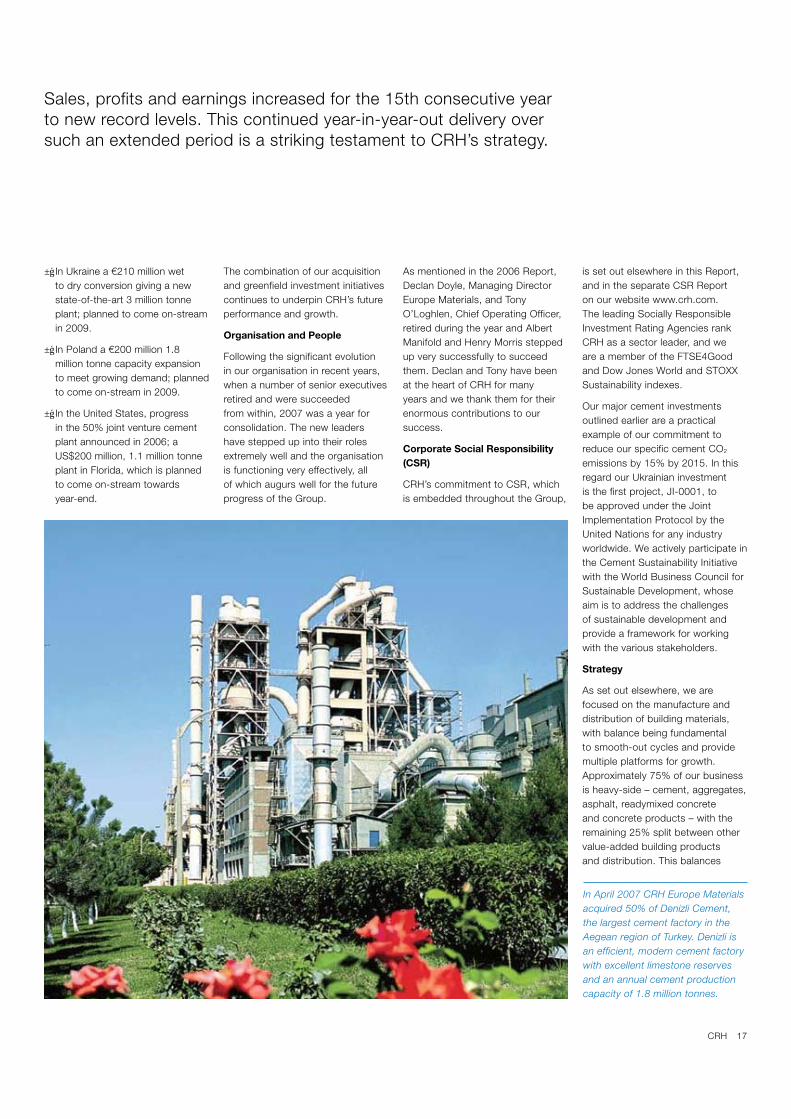
Our major cement investments outlined earlier are a practical example of our commitment to reduce our specific cement CO2
emissions by 15% by 2015. In this regard our Ukrainian investment is the first project, JI-0001, to be approved under the Joint Implementation Protocol by the United Nations for any industry worldwide. We actively participate in the Cement Sustainability Initiative with the World Business Council for Sustainable Development, whose aim is to address the challenges of sustainable development and provide a framework for working with the various stakeholders.
Strategy
As set out elsewhere, we are focused on the manufacture and distribution of building materials, with balance being fundamental to smooth-out cycles and provide multiple platforms for growth. Approximately 75% of our business is heavy-side – cement, aggregates, asphalt, readymixed concrete and concrete products – with the remaining 25% split between other value-added building products and distribution. This balances
In April 2007 CRH Europe Materials acquired 50% of Denizli Cement, the largest cement factory in the Aegean region of Turkey. Denizli is an efficient, modern cement factory with excellent limestone reserves and an annual cement production capacity of 1.8 million tonnes.
Sales, profits and earnings increased for the 15th consecutive year to new record levels. This continued year-in-year-out delivery over such an extended period is a striking testament to CRH’s strategy.

18 CRH
residential/non-residential/infrastructure end-uses, and also new build/RMI (repair, maintenance and improvement) end-uses, all of which operate in cycles of different timing, amplitude and duration. It also provides a unique perspective to understand and capitalise on market developments which benefits ongoing operations and enhances growth possibilities.
Geographically, CRH has traditionally been roughly 50/50 Western Europe/United States. While there are still significant growth opportunities in these developed markets, we have in recent years been increasing our focus on emerging markets which now comprise 15% of our end-use.
With a strong focus on operational performance, capital expenditure geared towards cost-effectiveness and expansion, and a broad-based acquisition programme which adds value to the existing network and provides platforms for future growth, CRH has uniquely delivered unbroken sales, profits and earnings growth since 1992. We believe we have significant continued momentum as we look to build on this successful track record into the future.
Outlook
CRH’s geographic, sectoral and product balance continued to deliver in 2007 both in terms of overall trading performance and development activity. While developments over recent months have added to economic uncertainties, CRH is well positioned across its operations to deal with the evolving market circumstances. Following record levels of acquisition activity in 2006 and 2007 and with an ongoing strong pipeline of opportunities, we are continuing to develop our Western European and North American businesses while building on our growing platforms in emerging markets. With a relentless emphasis on operational efficiency, and targeted cost reduction measures, we remain focused on our twin goals – performance and growth – and on delivering a sixteenth consecutive year of profit and earnings growth in 2008.
Chief Executive’s Review continued
19CRH
Materials Analysis of Change
Acquisitions
Exchangetranslation€ million
% of Group 2007 2006 Change Organic 2006 2007
Sales Revenue 18 3,651 2,967 +684 +457 +24 +210 -7
Operating Profit 28 586 421 +165 +125 +6 +34 -
Average Net Assets 2,611 2,125
Operating Profit Margin 16.1% 14.2%
Distribution Analysis of Change
Acquisitions Non-recurring
itemsExchangetranslation€ million
% of Group 2007 2006 Change Organic 2006 2007
Sales Revenue 16 3,435 2,786 +649 +76 +25 +566 - -18
Operating Profit 10 212 172 +40 +23 +1 +36 -19 -1
Average Net Assets 1,287 1,014
Operating Profit Margin 6.2% 6.2%
Excluding non-recurring 6.2% 5.5%
Products Analysis of Change
Acquisitions Non-recurring
itemsExchangetranslation€ million
% of Group 2007 2006 Change Organic 2006 2007
Sales Revenue 17 3,628 3,186 +442 +161 +196 +85 - -
Operating Profit 15 308 221 +87 +30 +20 +6 +31 -
Average Net Assets 2,392 2,081
Operating Profit Margin 8.5% 6.9%
Excluding non-recurring 8.5% 7.9%
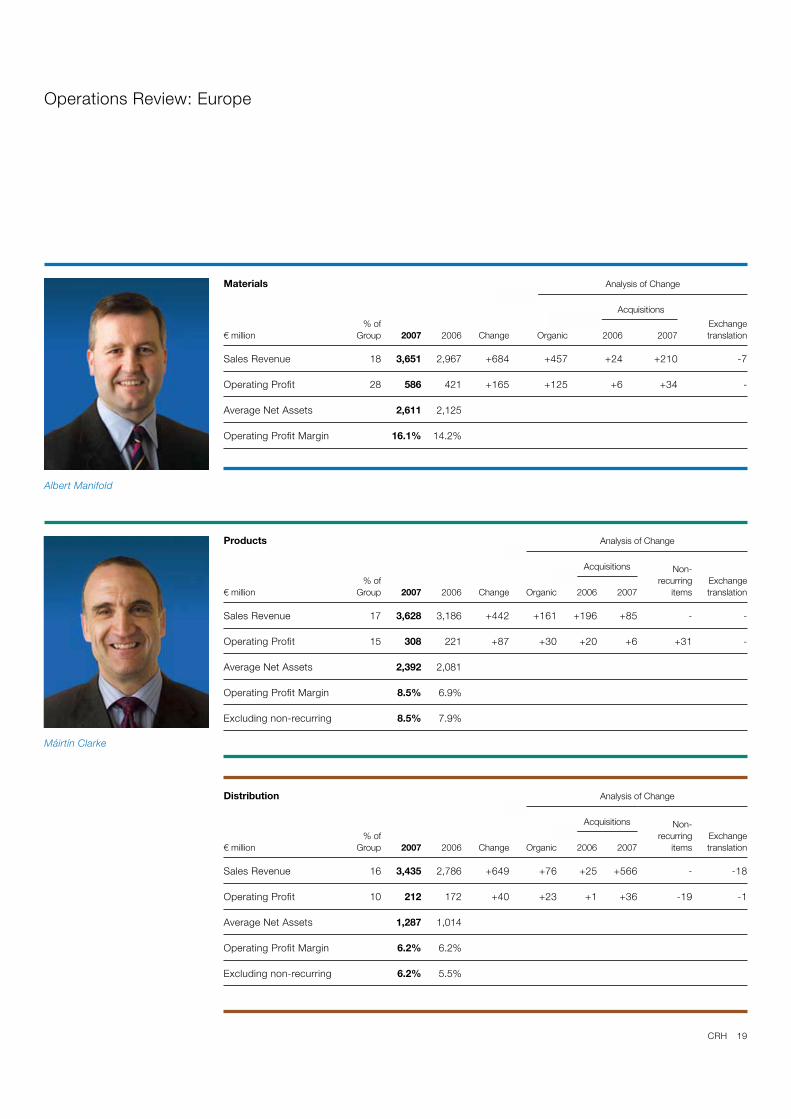
Albert Manifold
Máirtín Clarke
Operations Review: Europe

20 CRH
2007 Overview
Europe Materials continued to benefit from strong economic conditions and increased its profitability significantly during 2007, primarily through organic growth.
In Ireland we benefited from the high levels of infrastructure and non-residential activity which compensated for the decline in the residential sector that has emerged following record house completions in 2006.
The Finnish economy performed well with strong construction growth, particularly in the non-residential sector which posted a double-digit advance. The Baltic States eased in the second half, but St. Petersburg continued to grow at pace.
Strong growth in foreign direct investment led to high demand for construction materials in Poland, particularly in the industrial and commercial sectors. While there was a good level of activity in roads, this will grow in the years ahead as substantial European Union funding flows through into construction projects. High levels of demand helped the pricing environment for all products.
Following some difficult years, the Ukrainian economy grew strongly and construction activity benefited resulting in a significant increase in cement demand.
Switzerland continued on a stable path and CRH operations benefited from infrastructure projects in its regions.
In Spain housing demand eased, particularly in Madrid and the South. While volumes were weaker generally, good cost control led to better margins and profitability.
Portugal again saw a lower level of construction despite a recovery in the economy. Downstream activity, exports and a good performance in operations outside of Portugal resulted in an overall improved performance.
In August we bought out our partners in the Benelux cement trading, readymixed concrete and aggregates joint venture, Cementbouw bv. The company was reorganised to report under the Europe Materials Division and has performed to expectation since acquisition.
2007 saw the commencement of three major cement projects aimed at modernising and expanding our cement facilities in Ireland, Poland and Ukraine. With a combined value of approximately €0.6 billion, this investment programme demonstrates CRH’s commitment to investing for the future.
The focus on developing and emerging markets continued and the Division’s acquisition of a 100% stake in Harbin Sanling Cement, China and a 50% stake in Denizli Cement, Turkey, has created new platforms for growth.
Ireland
In Ireland construction demand continued to grow in the first half of 2007; however, the second half saw an accelerating decline in residential output. The National Development Plan continued to underpin demand in the road sector, while private investment remained strong particularly in commercial and retail projects. Agricultural construction recovered well, supported by environmental improvement grant aid. As a result overall demand for our products was at a similar level to 2006. The Northern Ireland business, particularly
quarry products and construction, benefited from the general sense of optimism in the economy.
Ongoing programmes to reduce operating costs and improve efficiency delivered further savings in 2007, particularly in the area of energy cost reduction. Commercially, the emphasis on cost recovery through price improvement continued. Profits were ahead of 2006.
Irish Cement commenced a €200 million investment project to modernise its Platin Works. The investment will create an ultra-modern, energy-efficient plant meeting world best practice emissions standards. It is due on-stream towards the end of 2008 and demonstrates CRH’s commitment to meeting the long-term needs of the Irish economy and construction sector.
Finland/Baltics
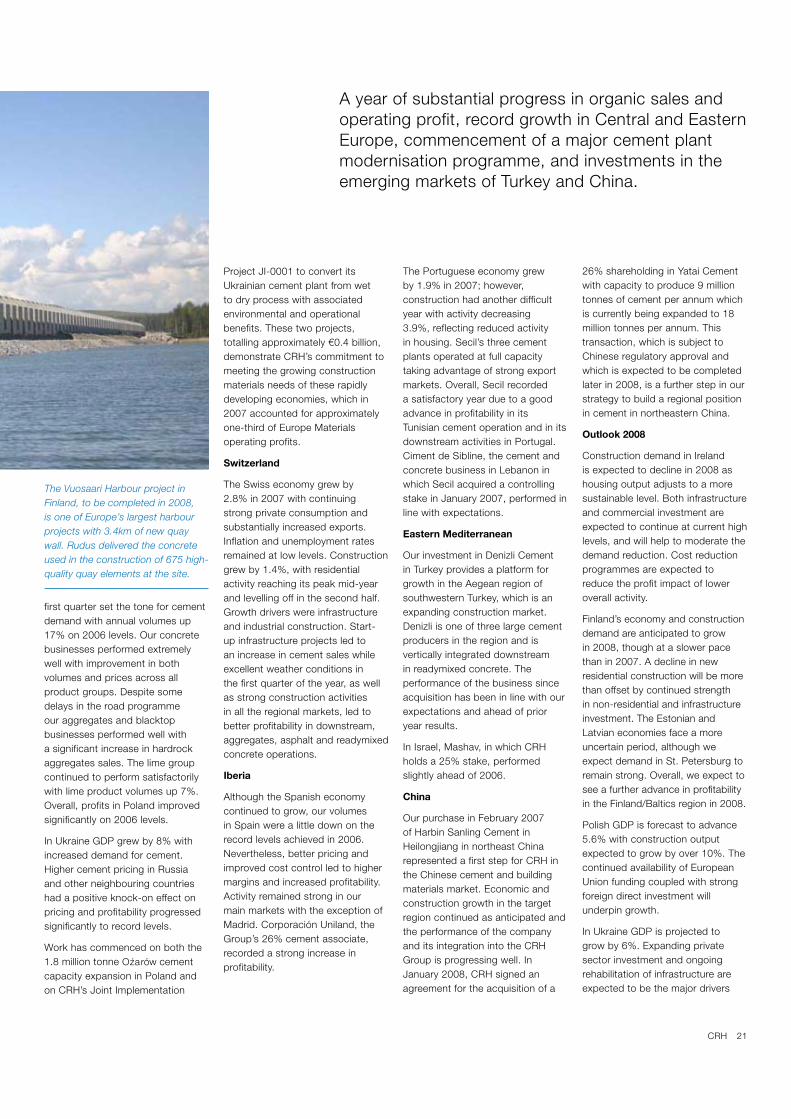
The Finnish economy grew by 4% in 2007. Broad-based strength in construction activity contributed to strong advances in cement, aggregates and readymixed concrete volumes. There was a particularly strong increase in new non-residential construction, which grew by over 20% when compared
with 2006 levels. Ongoing investments in infrastructure such as the Helsinki-Turku motorway and Vuosaari port, combined with a stable residential construction market, also underpinned volume growth. All products achieved improved pricing and this resulted in a very good uplift in operating performance. The new clinker line at the Lappeenranta cement plant, commissioned during the first half of 2007 has performed satisfactorily to date.
Sales volumes in Estonia, Latvia and St. Petersburg were generally ahead of 2006. Higher input costs remained a challenge, particularly in Russia, though good cost control and better pricing held overall profits in line with 2006 levels.
Overall, good volume growth and better pricing delivered improved profitability in the Finland/Baltic region in 2007.
Central Eastern Europe
2007 was another good year for the Polish economy with GDP growth at 6.5% and unemployment falling to a new low of 11.4%. Inflation, although low, rose to an average 2.5% while overall construction output increased by an estimated 16% on 2006. The unusually mild
Europe Materials
21CRH
first quarter set the tone for cement demand with annual volumes up 17% on 2006 levels. Our concrete businesses performed extremely well with improvement in both volumes and prices across all product groups. Despite some delays in the road programme our aggregates and blacktop businesses performed well with a significant increase in hardrock aggregates sales. The lime group continued to perform satisfactorily with lime product volumes up 7%. Overall, profits in Poland improved significantly on 2006 levels.
In Ukraine GDP grew by 8% with increased demand for cement. Higher cement pricing in Russia and other neighbouring countries had a positive knock-on effect on pricing and profitability progressed significantly to record levels.
Work has commenced on both the 1.8 million tonne Oz
.arów cement
capacity expansion in Poland and on CRH’s Joint Implementation
Project JI-0001 to convert its Ukrainian cement plant from wet to dry process with associated environmental and operational benefits. These two projects, totalling approximately €0.4 billion, demonstrate CRH’s commitment to meeting the growing construction materials needs of these rapidly developing economies, which in 2007 accounted for approximately one-third of Europe Materials operating profits.
Switzerland
The Swiss economy grew by 2.8% in 2007 with continuing strong private consumption and substantially increased exports. Inflation and unemployment rates remained at low levels. Construction grew by 1.4%, with residential activity reaching its peak mid-year and levelling off in the second half. Growth drivers were infrastructure and industrial construction. Start-up infrastructure projects led to an increase in cement sales while excellent weather conditions in the first quarter of the year, as well as strong construction activities in all the regional markets, led to better profitability in downstream, aggregates, asphalt and readymixed concrete operations.
Iberia
Although the Spanish economy continued to grow, our volumes in Spain were a little down on the record levels achieved in 2006. Nevertheless, better pricing and improved cost control led to higher margins and increased profitability. Activity remained strong in our main markets with the exception of Madrid. Corporación Uniland, the Group’s 26% cement associate, recorded a strong increase in profitability.
The Portuguese economy grew by 1.9% in 2007; however, construction had another difficult year with activity decreasing 3.9%, reflecting reduced activity in housing. Secil’s three cement plants operated at full capacity taking advantage of strong export markets. Overall, Secil recorded a satisfactory year due to a good advance in profitability in its Tunisian cement operation and in its downstream activities in Portugal. Ciment de Sibline, the cement and concrete business in Lebanon in which Secil acquired a controlling stake in January 2007, performed in line with expectations.
Eastern Mediterranean
Our investment in Denizli Cement in Turkey provides a platform for growth in the Aegean region of southwestern Turkey, which is an expanding construction market. Denizli is one of three large cement producers in the region and is vertically integrated downstream in readymixed concrete. The performance of the business since acquisition has been in line with our expectations and ahead of prior year results.
In Israel, Mashav, in which CRH holds a 25% stake, performed slightly ahead of 2006.
China
Our purchase in February 2007 of Harbin Sanling Cement in Heilongjiang in northeast China represented a first step for CRH in the Chinese cement and building materials market. Economic and construction growth in the target region continued as anticipated and the performance of the company and its integration into the CRH Group is progressing well. In January 2008, CRH signed an agreement for the acquisition of a
26% shareholding in Yatai Cement with capacity to produce 9 million tonnes of cement per annum which is currently being expanded to 18 million tonnes per annum. This transaction, which is subject to Chinese regulatory approval and which is expected to be completed later in 2008, is a further step in our strategy to build a regional position in cement in northeastern China.
Outlook 2008
Construction demand in Ireland is expected to decline in 2008 as housing output adjusts to a more sustainable level. Both infrastructure and commercial investment are expected to continue at current high levels, and will help to moderate the demand reduction. Cost reduction programmes are expected to reduce the profit impact of lower overall activity.
Finland’s economy and construction demand are anticipated to grow in 2008, though at a slower pace than in 2007. A decline in new residential construction will be more than offset by continued strength in non-residential and infrastructure investment. The Estonian and Latvian economies face a more uncertain period, although we expect demand in St. Petersburg to remain strong. Overall, we expect to see a further advance in profitability in the Finland/Baltics region in 2008.
Polish GDP is forecast to advance 5.6% with construction output expected to grow by over 10%. The continued availability of European Union funding coupled with strong foreign direct investment will underpin growth.
In Ukraine GDP is projected to grow by 6%. Expanding private sector investment and ongoing rehabilitation of infrastructure are expected to be the major drivers
A year of substantial progress in organic sales and operating profit, record growth in Central and Eastern Europe, commencement of a major cement plant modernisation programme, and investments in the emerging markets of Turkey and China.
The Vuosaari Harbour project in Finland, to be completed in 2008, is one of Europe’s largest harbour projects with 3.4km of new quay wall. Rudus delivered the concrete used in the construction of 675 high-quality quay elements at the site.
22 CRH
of economic growth with increased demand for all our building products.
GDP in Switzerland is forecast to grow in 2008 by 1.9% driven by a strong export performance, tourism and good internal consumption. Construction activity is anticipated to remain stable with further small declines in housing offset by growth in industrial and commercial work and a stable infrastructural sector.
In Spain a further decline in housing activity is anticipated. We expect volume reductions in all regions across the country with the exception of our principal market in Catalonia where road and rail infrastructural projects and commercial activity are expected to mitigate the impact of the housing decline. In Portugal construction is expected to show a modest recovery in 2008 due to an expected increase in public capital expenditure.
Continued growth is forecast for construction in Turkey next year with cement volumes rising accordingly. Denizli should once again operate to full capacity.
As in recent years, the home market in Israel should show modest growth but significant progress will depend on the political environment.
Cement demand in China is again expected to grow at close to 10% in 2008 and we believe that Harbin Sanling Cement will operate at full capacity.
Overall, the market outlook for 2008 is good. While organic growth is unlikely to be as strong as an outstanding 2007, we will benefit from acquisitions completed during the year, and the major cement capital expenditure projects underway will contribute strongly to the development of the Division in 2009 and beyond.
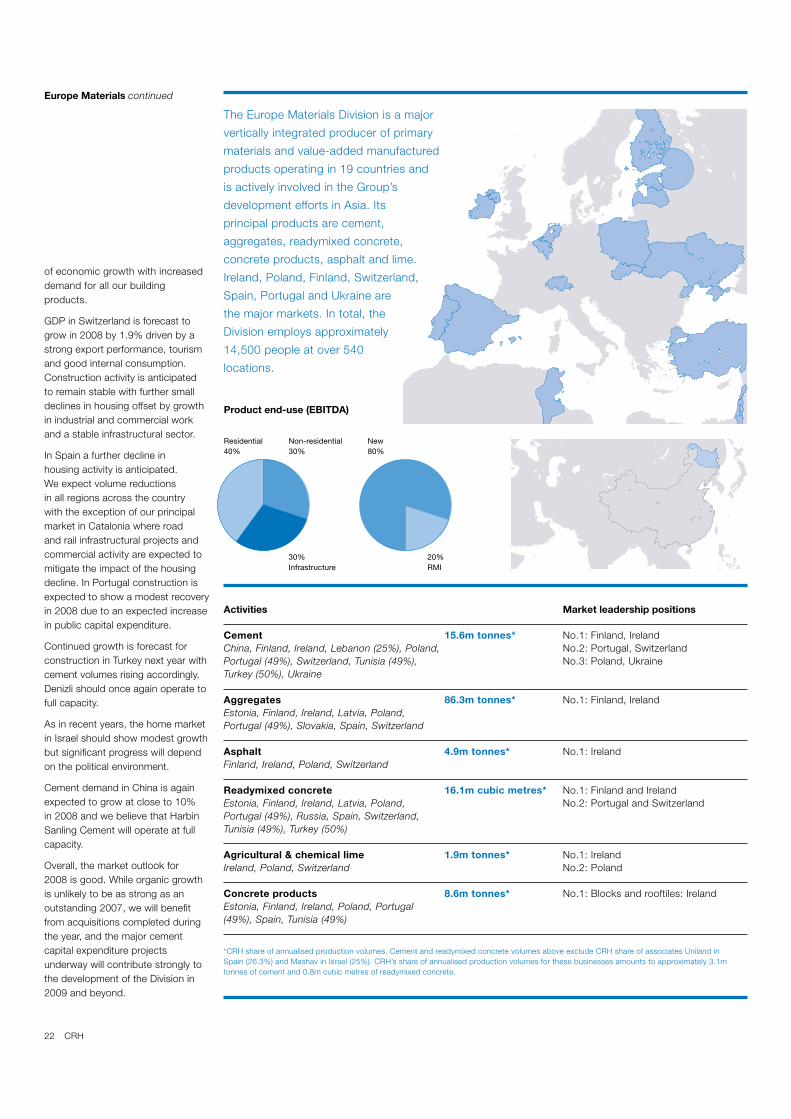
Activities
Cement
China, Finland, Ireland, Lebanon (25%), Poland, Portugal (49%), Switzerland, Tunisia (49%), Turkey (50%), Ukraine
Aggregates
Estonia, Finland, Ireland, Latvia, Poland, Portugal (49%), Slovakia, Spain, Switzerland
Asphalt
Finland, Ireland, Poland, Switzerland
Readymixed concrete
Estonia, Finland, Ireland, Latvia, Poland, Portugal (49%), Russia, Spain, Switzerland, Tunisia (49%), Turkey (50%)
Agricultural & chemical lime
Ireland, Poland, Switzerland
Concrete products
Estonia, Finland, Ireland, Poland, Portugal (49%), Spain, Tunisia (49%)
15.6m tonnes*
86.3m tonnes*
4.9m tonnes*
16.1m cubic metres*
1.9m tonnes*
8.6m tonnes*
Market leadership positions
No.1: Finland, Ireland No.2: Portugal, SwitzerlandNo.3: Poland, Ukraine
No.1: Finland, Ireland
No.1: Ireland
No.1: Finland and IrelandNo.2: Portugal and Switzerland
No.1: IrelandNo.2: Poland
No.1: Blocks and rooftiles: Ireland
*CRH share of annualised production volumes. Cement and readymixed concrete volumes above exclude CRH share of associates Uniland in Spain (26.3%) and Mashav in Israel (25%). CRH’s share of annualised production volumes for these businesses amounts to approximately 3.1m tonnes of cement and 0.8m cubic metres of readymixed concrete.
The Europe Materials Division is a major
vertically integrated producer of primary
materials and value-added manufactured
products operating in 19 countries and
is actively involved in the Group’s
development efforts in Asia. Its
principal products are cement,
aggregates, readymixed concrete,
concrete products, asphalt and lime.
Ireland, Poland, Finland, Switzerland,
Spain, Portugal and Ukraine are
the major markets. In total, the
Division employs approximately
14,500 people at over 540
locations.
Europe Materials continued
Residential40%
Non-residential30%
New80%
30%Infrastructure
20%RMI
Product end-use (EBITDA)
23CRH
2007 Overview
After a strong first half, housing demand in the Netherlands moderated later in the year. Germany also reported a robust start, but slowed somewhat in the latter months. Nordic markets witnessed significant growth while Belgium, Switzerland and France remained positive. The UK saw stable markets with operational efficiencies leading to good profit growth. Results in Eastern Europe were exceptional with strong growth and high margins.
During 2007 we invested €663 million in 26 acquisitions including the Builders Merchants business Gétaz Romang, a major addition to our Swiss distribution business. We also completed several strategically important bolt-on acquisitions in our various markets, in line with our strategy of building local leadership positions.
Overall, the Division once again achieved record sales and operating profits, up 18% and 32% respectively.
Concrete Products
This group manufactures concrete products for two principal end- uses: pavers, tiles and blocks for architectural use, and floor and wall elements, beams and vaults for structural use. In addition, sand-lime bricks are produced for the residential market. 2007 saw good progress on the development front with eight acquisitions which further consolidated our positions in existing Western European markets and expanded our operations in Eastern Europe, in particular in Poland and Romania. The group reported a solid underlying profit advance boosted by contributions from acquisitions.
ArchitecturalArchitectural operations performed ahead of 2006 despite difficult market conditions in several markets. Our Dutch and Belgian businesses continued to face tough competition due to market over-capacity and downward price pressure. The German business posted strong results despite a downturn in new residential construction. In France results improved driven by operational synergies. Our Danish and Slovakian businesses continued to perform strongly. Supreme in the UK, acquired in April 2006, contributed above expectations in its first full year. The architectural group made four acquisitions in 2007 including an add-on to Supreme in the UK, two bolt-ons to our water treatment and paving business in Belgium, and Elpreco, an entry into the Romanian market.
StructuralOur structural concrete operations again delivered excellent results driven by tight operational control and strong markets in Belgium, France, Denmark and Poland, in particular in the new non-residential sector. Our sand-lime brick business posted lower results reflecting slower activity levels in the Dutch residential market. The structural group expanded its product range and market position in Denmark with the acquisition of a concrete stairs business in March followed by the purchase of a lightweight wall panels and flooring manufacturer in August; this group also acquired a small add-on in France and completed the buyout of the remaining 75% of Ergon Poland.
Clay Products
The Clay Products group, with operations in the UK, the Netherlands, Germany, Poland and Belgium, principally produces
clay facing bricks, pavers, blocks and rooftiles. This group delivered increased profits for 2007.
UK brick industry volumes showed a welcome return to growth in the first half of 2007; however, with heavy rain across the UK in mid-summer, volumes for the year finished at a similar level to 2006. Ibstock profits advanced strongly due to operating and overhead efficiencies.
In the Netherlands our markets slowed as the year progressed and profitability declined slightly.
In Germany the initial early optimism was not sustained and our clay operations were restructured and capacity reduced. However, underlying results improved on 2006. Our Polish operation advanced strongly and profits increased sharply, as a result of good volume and price growth. In November, we expanded our presence with the acquisition of a clay brick, block and rooftile manufacturer in western Poland.
Building Products
The Building Products group is active in lightside building materials and focuses on three core business areas: Construction Accessories, Building Envelope Products and Insulation Products. Market conditions in 2007 were positive, particularly in non-residential sectors in Germany, the Benelux and the UK. All business units contributed to organic improvement, complemented by acquisitive growth.
Construction AccessoriesThis business unit, market leader in construction accessories in Europe, experienced another year of top performance and growth. The full year contribution of Halfen, acquired in May 2006, exceeded
Europe Products & Distribution
24 CRH
our expectations and all our other businesses showed solid operating results. We closed four small bolt-on acquisitions during the year, which performed as expected. With its main focus on non-residential construction and civil engineering, Construction Accessories is well positioned for further growth.
Building Envelope ProductsThis business unit comprises Fencing & Security (F&S), Daylight & Ventilation (D&V) and Roller Shutters & Awnings (RSA) businesses which specialise in entrance control and climate control products. All segments contributed to a stronger 2007 performance. F&S once again delivered record results. Despite difficult markets for our glass projects business, D&V showed a year of progress in operating results, mainly driven by an excellent performance in its German roof lights business. The first full year contribution from our RSA business, acquired in August 2006, exceeded expectations. The Building Envelope unit continues
to benefit from a growing market focus on repair, maintenance and improvement, safety and comfort.
Insulation ProductsInsulation Products had another year of organic improvement in both sales and operating profits. Good returns from recent restructuring initiatives and growing demand in our key markets, especially in Poland, underpinned a solid performance. The business is well positioned for further improvements, given the ongoing European legislation for energy management of buildings.
Distribution
2007 was another strong year with a further improvement in sales and operating profit. Good market conditions in most of our markets, a mild winter and a continued focus on margin improvement and cost control underpinned organic growth. This was supplemented by excellent contributions from the ten acquisitions completed in 2007.
Professional Builders Merchants With 448 locations in five countries, Professional Builders Merchants has strong market positions in all its regions and generated significant margin improvement in 2007.
The Netherlands: Following a good final quarter in 2006, this business performed very strongly in the first half of 2007, supported by a positive market and mild winter conditions. Although the global credit crunch impacted sentiment from mid-year, demand remained solid throughout the second half. This positive backdrop combined with a targeted “quality for quantity” margin improvement programme enabled our Dutch professional business to report strong sales and profit growth.
France: Our heritage operations in Ile-de-France (100%), Burgundy and Franche-Comté (58%) benefited from good market conditions resulting in improved sales and profits. LDP (100%), acquired in January 2007 with 17 locations in Normandy, delivered very satisfactory results exceeding our initial expectations.
Switzerland: Our acquisition (effective 1st May 2007) of Gétaz Romang, created the largest builders merchants business in Switzerland with more than 100 locations and annualised sales of approximately €1 billion. In addition to its traditional builders merchants business, the new group has a leading position in
a number of specialised builders merchants businesses including sanitary ware, tiles, kitchens and ironmongery. Organic improvement in the heritage Baubedarf and Richner operations, a performance well above initial expectations from Gétaz Romang and a successful integration of all three businesses, resulted in a highly satisfactory 2007 performance. In addition, two further acquisitions added three branches to the existing network.
Austria: Quester, our Austrian builders merchants company, failed to benefit in 2007 from the positive market conditions and from re-organisation measures taken in 2006. As a result, sales, operating profit and margins were lower than 2006. In response, further restructuring initiatives were implemented from mid-2007 which are expected to restore margins to appropriate levels. Taking account of these restructuring costs, Quester was loss-making at operating profit level in 2007.
Germany: Bauking, in which we have a 48% stake, operates primarily in the northwestern half of Germany. After a good start to the year due to mild winter weather, the expiry of home ownership grants and the increase in value added tax (VAT) effective 1st January 2007 began to impact from the second quarter. As a result, like-for-like sales were lower than in 2006. However, with relentless cost control, like-for-like operating profit was maintained and, with an active year on the development front, overall sales and operating profit advanced.
DIYThe DIY Europe platform has activities in five countries with 240 DIY stores. These stores are operated under five different
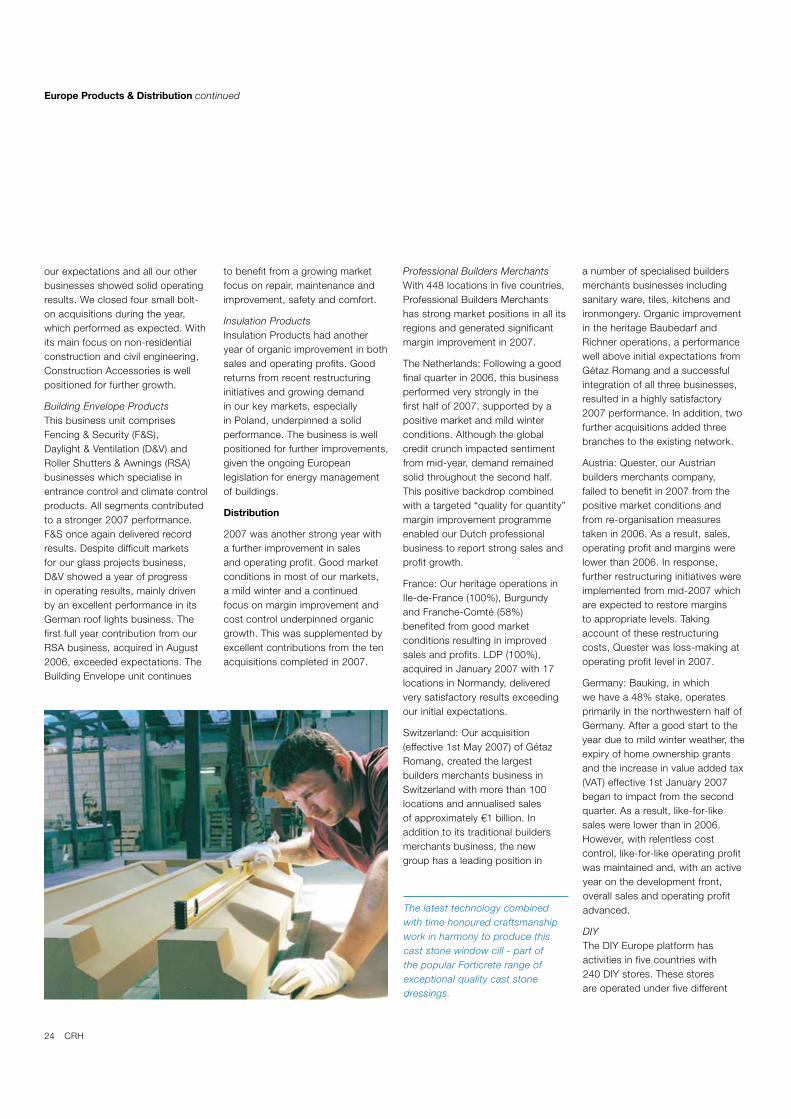
The latest technology combined with time honoured craftsmanship work in harmony to produce this cast stone window cill - part of the popular Forticrete range of exceptional quality cast stone dressings.
Europe Products & Distribution continued
25CRH
brands: Gamma (The Netherlands and Belgium), Karwei (The Netherlands), Hagebau (Germany), Maxmat (Portugal) and BricoHouse (Spain).
The Netherlands: After some flat years, 2007 saw a healthy increase in the total DIY market underpinned by increasing consumer confidence. The mild winter and sunny spring period resulted in a very successful garden season, while good promotional campaigns and sharp formula management resulted in an increase in market share. Organic sales and profit advanced strongly. In addition, two stores were added from one acquisition, and three greenfield stores were opened.
Belgium: Gamma Belgium showed a healthy increase in both sales and profits but, in the absence of new greenfield store openings, market share declined.
Germany: Bauking operates 54 DIY stores under the brand name Hagebau. In a very competitive market which was depressed by the effect of the VAT increase, Bauking’s Hagebau stores reported sales and profits in line with 2006. From two acquisitions Bauking added 14 Hagebau stores bringing its total network to 140 stores.
Portugal: Despite generally weak economic conditions, like-for-like sales at Maxmat remained at 2006 levels. With the lifting of legal limitations on new store openings, Maxmat greenfielded seven new stores in 2007 and introduced the
Maxgarden concept. Start-up losses for the new openings resulted in lower profits than in 2006.
Spain: We entered the Spanish DIY market in May 2007 with the acquisition of a 60% interest in a small business in the Alicante/Valencia region.
Outlook
Current forecasts for our European construction markets are for a slower pace of growth than in 2007. In the Netherlands, we expect the residential and non-residential sectors to be stable in 2008. In Belgium after several years of strong growth, the market is expected to vary somewhat by segment, with a slower new residential market, growth in non-residential spend and a stable infrastructure sector.
While we anticipate a slowdown in the new non-residential sector in France the residential markets are expected to remain stable.
After a long downturn, 2006 and 2007 saw the start of a modest
recovery in overall German construction activity. Although the residential sector remains weak, we expect that non-residential and infrastructure will continue growth into 2008.
Swiss construction output is anticipated to grow at a moderate pace in 2008 with a slight decrease in the new housing sector more than offset by a positive non-residential outlook.
In the UK despite recent reductions in interest rates, we expect the more cautious lending environment generally to dampen 2008 demand with the exception of non-residential, which is expected to remain relatively stable.
Strong growth is expected in Eastern Europe, with the current robust climate in Poland expected to continue. Strong but more moderate growth is still expected in Slovakia and we see a positive outlook to our newly acquired Romanian concrete operations. The growth we have experienced
in our Scandinavian businesses will be tempered somewhat by the slowdown in Danish new housing, but overall we consider the outlook for these markets to be positive.
Following successful delivery in 2006 and 2007, ongoing margin improvement through a combination of price recovery and cost reduction remains the key focus of our management teams. The search for acquisition opportunities in Europe across our full range of activities continues. We look to further success on the operational and development front in 2008 leading to further profit advances, despite a somewhat slower growth backdrop.
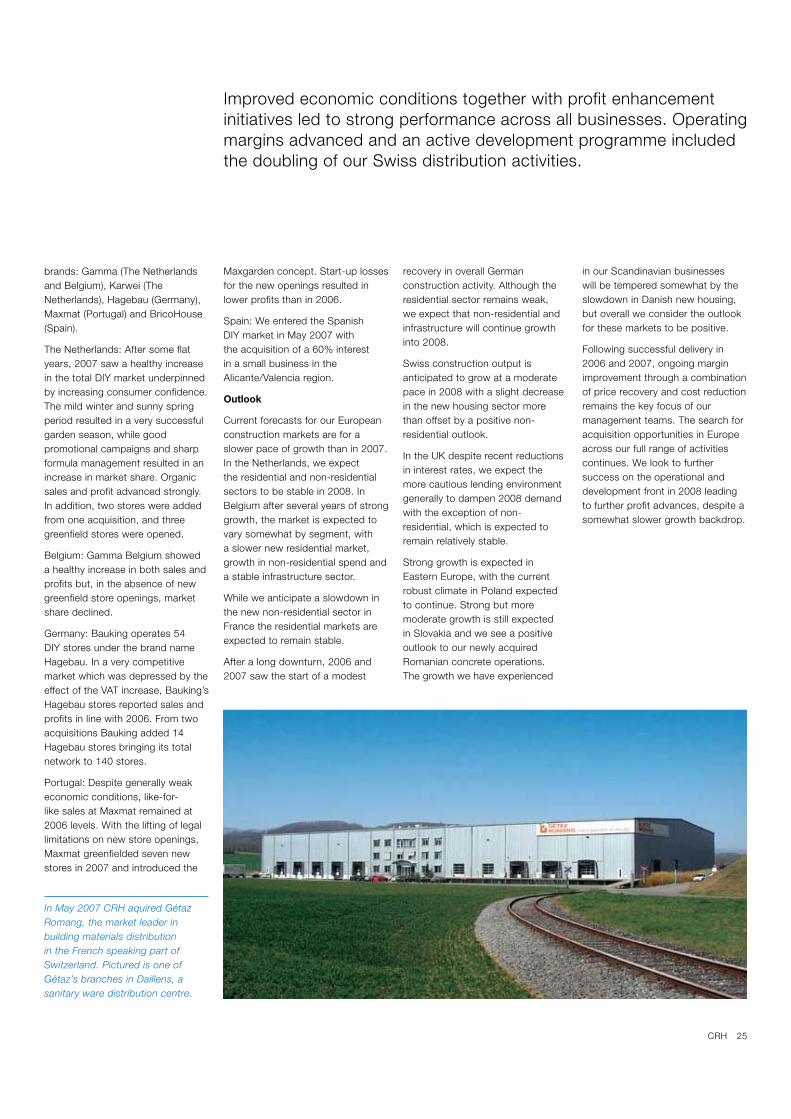
In May 2007 CRH aquired Gétaz Romang, the market leader in building materials distribution in the French speaking part of Switzerland. Pictured is one of Gétaz’s branches in Daillens, a sanitary ware distribution centre.
Improved economic conditions together with profit enhancement initiatives led to strong performance across all businesses. Operating margins advanced and an active development programme included the doubling of our Swiss distribution activities.
26 CRH
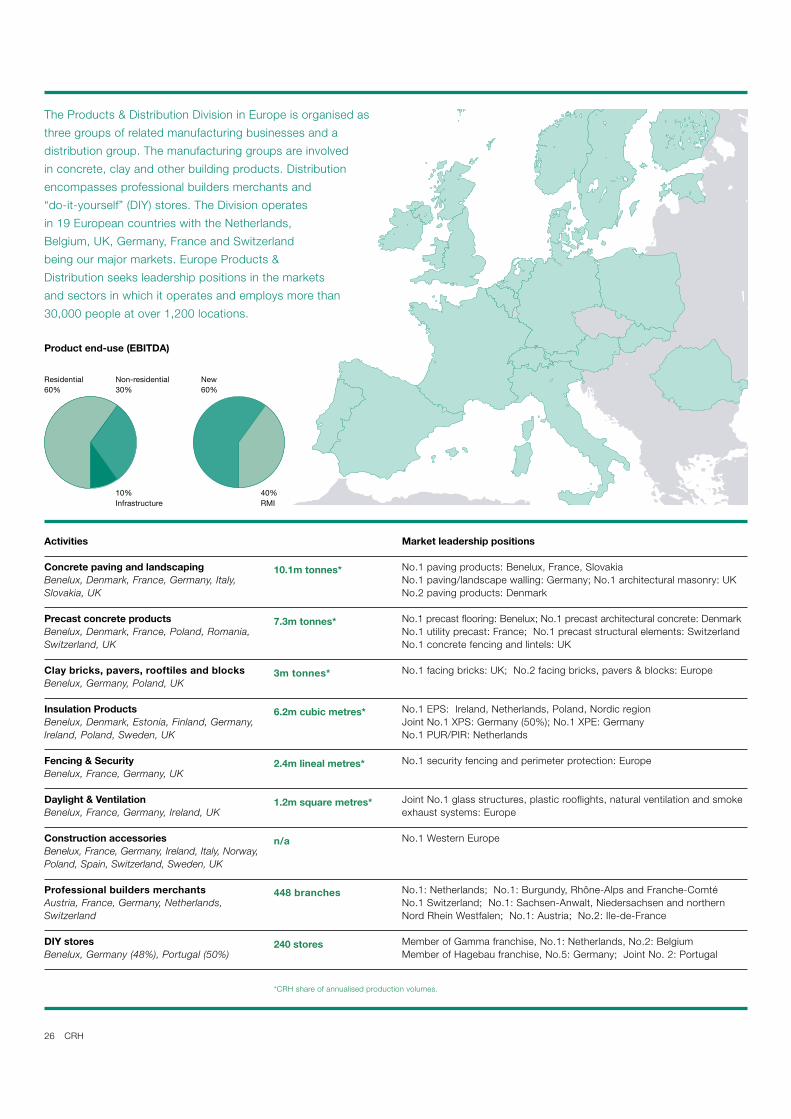
Activities
Concrete paving and landscaping
Benelux, Denmark, France, Germany, Italy, Slovakia, UK
Precast concrete products
Benelux, Denmark, France, Poland, Romania,Switzerland, UK
Clay bricks, pavers, rooftiles and blocks
Benelux, Germany, Poland, UK
Insulation Products
Benelux, Denmark, Estonia, Finland, Germany, Ireland, Poland, Sweden, UK
Fencing & Security
Benelux, France, Germany, UK
Daylight & Ventilation
Benelux, France, Germany, Ireland, UK
Construction accessories
Benelux, France, Germany, Ireland, Italy, Norway, Poland, Spain, Switzerland, Sweden, UK
Professional builders merchants
Austria, France, Germany, Netherlands, Switzerland
DIY stores
Benelux, Germany (48%), Portugal (50%)
10.1m tonnes*
7.3m tonnes*
3m tonnes*
6.2m cubic metres*
2.4m lineal metres*
1.2m square metres*
n/a
448 branches
240 stores
*CRH share of annualised production volumes.
Market leadership positions
No.1 paving products: Benelux, France, SlovakiaNo.1 paving/landscape walling: Germany; No.1 architectural masonry: UK No.2 paving products: Denmark
No.1 precast flooring: Benelux; No.1 precast architectural concrete: Denmark No.1 utility precast: France; No.1 precast structural elements: Switzerland No.1 concrete fencing and lintels: UK
No.1 facing bricks: UK; No.2 facing bricks, pavers & blocks: Europe
No.1 EPS: Ireland, Netherlands, Poland, Nordic regionJoint No.1 XPS: Germany (50%); No.1 XPE: GermanyNo.1 PUR/PIR: Netherlands
No.1 security fencing and perimeter protection: Europe
Joint No.1 glass structures, plastic rooflights, natural ventilation and smoke exhaust systems: Europe
No.1 Western Europe
No.1: Netherlands; No.1: Burgundy, Rhône-Alps and Franche-Comté No.1 Switzerland; No.1: Sachsen-Anwalt, Niedersachsen and northern Nord Rhein Westfalen; No.1: Austria; No.2: Ile-de-France
Member of Gamma franchise, No.1: Netherlands, No.2: Belgium Member of Hagebau franchise, No.5: Germany; Joint No. 2: Portugal
The Products & Distribution Division in Europe is organised as
three groups of related manufacturing businesses and a
distribution group. The manufacturing groups are involved
in concrete, clay and other building products. Distribution
encompasses professional builders merchants and
“do-it-yourself” (DIY) stores. The Division operates
in 19 European countries with the Netherlands,
Belgium, UK, Germany, France and Switzerland
being our major markets. Europe Products &
Distribution seeks leadership positions in the markets
and sectors in which it operates and employs more than
30,000 people at over 1,200 locations.
Product end-use (EBITDA)
Residential60%
Non-residential30%
New60%
40%RMI
10%Infrastructure

27CRH
Materials Analysis of Change
Acquisitions
Exchangetranslation€ million
% of Group 2007 2006 Change Organic 2006 2007
Sales Revenue 26 5,445 4,778 +667 -61 +1,002 +127 -401
Operating Profit 28 570 475 +95 +42 +80 +12 -39
Average Net Assets 4,169 3,671
Operating Profit Margin 10.5% 9.9%
Excluding APAC 12.1% 11.2%
Distribution Analysis of Change
Acquisitions
Exchangetranslation€ million
% of Group 2007 2006 Change Organic 2006 2007
Sales Revenue 6 1,323 1,448 -125 -209 +163 +42 -121
Operating Profit 3 70 103 -33 -39 +15 - -9
Average Net Assets 484 362
Operating Profit Margin 5.3% 7.1%
Products Analysis of Change
Acquisitions
Exchangetranslation€ million
% of Group 2007 2006 Change Organic 2006 2007
Sales Revenue 17 3,510 3,572 -62 -186 +226 +185 -287
Operating Profit 16 340 375 -35 -17 -1 +13 -30
Average Net Assets 1,931 1,764
Operating Profit Margin 9.7% 10.5%
Excluding MMI 11.0% 11.3%
Tom Hill
Operations Review: Americas

28 CRH
2007 Overview
Americas Materials had another good year, with continuing success in recovering higher energy and other input costs and in delivering an improvement in heritage operating profit margin for the third consecutive year. After a record net acquisition spend of €1.1 billion (US$1.4 billion) in 2006, our main development focus during the first half of 2007 was on integrating APAC, the major 2006 transaction, which performed well ahead of expectations in 2007. The significant incremental contribution from APAC, combined with a 2007 acquisition spend of €0.6 billion (US$0.9 billion) arising mainly in the second half of the year, and the strong organic heritage performance, resulted in another record year of sales and operating profit for the Division.
Despite record high crude oil prices bitumen costs increased a relatively modest 5%. Energy used at our asphalt plants, consisting of fuel oil, recycled oil and natural gas, had a composite cost decrease of 7%. The cost of diesel fuel and gasoline used to power our mobile fleet increased by 6%. Against this backdrop, overall prices increased 7% for aggregates, 8% for readymixed concrete and 12% for asphalt, the product most impacted by input cost increases.
Non-residential demand continued to improve and somewhat offset the significant decline in new residential construction. Overall funding available for highway projects showed further growth on 2006 levels. However, with relatively fixed highway budgets, the volume of activity was again impacted by the strong price increases necessary to recover continuing higher input costs. Total volumes, including
acquisition effects, increased 5% for aggregates, 2% for readymixed concrete and 14% for asphalt. Heritage volumes declined 7% for aggregates, 13% for readymixed concrete, and 13% for asphalt.
The overall 2007 Divisional margin of 10.5% (2006: 9.9%) again reflected the dampening effect of APAC’s profitable but lower margin business mix. The operating margin excluding APAC again advanced to 12.1% (2006: 11.2%).
The acquisition of APAC has resulted in an optimisation of our regional operating structure. The newly formed Mid-Atlantic region comprises our operations in Pennsylvania, Delaware and Michigan, which previously reported as part of our Central region. We have merged APAC’s operations in western North Carolina, eastern Tennessee and Virginia, which represent approximately 20% of APAC’s total operations, into a redefined Central operating region together with our heritage operations in Ohio, Kentucky, West Virginia, North Carolina and Virginia. We have created two APAC operating regions, the Southeast operations in Alabama, Florida, Georgia and Mississippi and the Southwest comprising operations in Arkansas, Missouri, Kansas, western Tennessee, Oklahoma and Texas.
With a total investment of approximately US$0.9 billion, 2007 was another very busy year in acquisition terms for the Division. Major transactions included the acquisition of Conrad Yelvington Distributors (CYDI) and the purchase of certain assets in Florida and Arizona formerly owned by Cemex. CYDI is the largest rail distributor of aggregates in the southeast United States and, with a major presence in
Florida, is a strong geographic and complementary fit with APAC’s Florida activities and also with CRH’s extensive local Precast and Architectural Products businesses in the southeast United States. The former Cemex assets fit well with our expanding interests in Florida and offer development opportunities in Arizona. In addition the Division completed 17 other transactions which included some significant moves in the western states and in Pennsylvania, and commencement of a bolt-on acquisitions programme across the APAC platform. Construction of the 1.1 million tonne joint venture greenfield cement plant in central Florida is progressing well with completion scheduled for end 2008.
New England
In 2007, New Hampshire and Vermont enjoyed good trading in solid markets. Massachusetts had another favourable year with good
demand and a continuing positive pricing environment. The states of Maine and Connecticut both reduced highway spending and higher prices impacted volumes at the municipal and local level resulting in profit declines in these areas. Overall, profits improved. September saw the acquisition of Burgess Brothers based in Bennington, Vermont, which establishes a presence for our business in a new market area in the state.
New York/New Jersey
Our New York/New Jersey businesses had record results mainly due to asphalt margin expansion. In Upstate New York, our Albany operations once again increased profits despite challenging market conditions. Recent years have seen significant contraction in the Rochester region with many large local employers continuing to scale back their activities. However,
Americas Materials
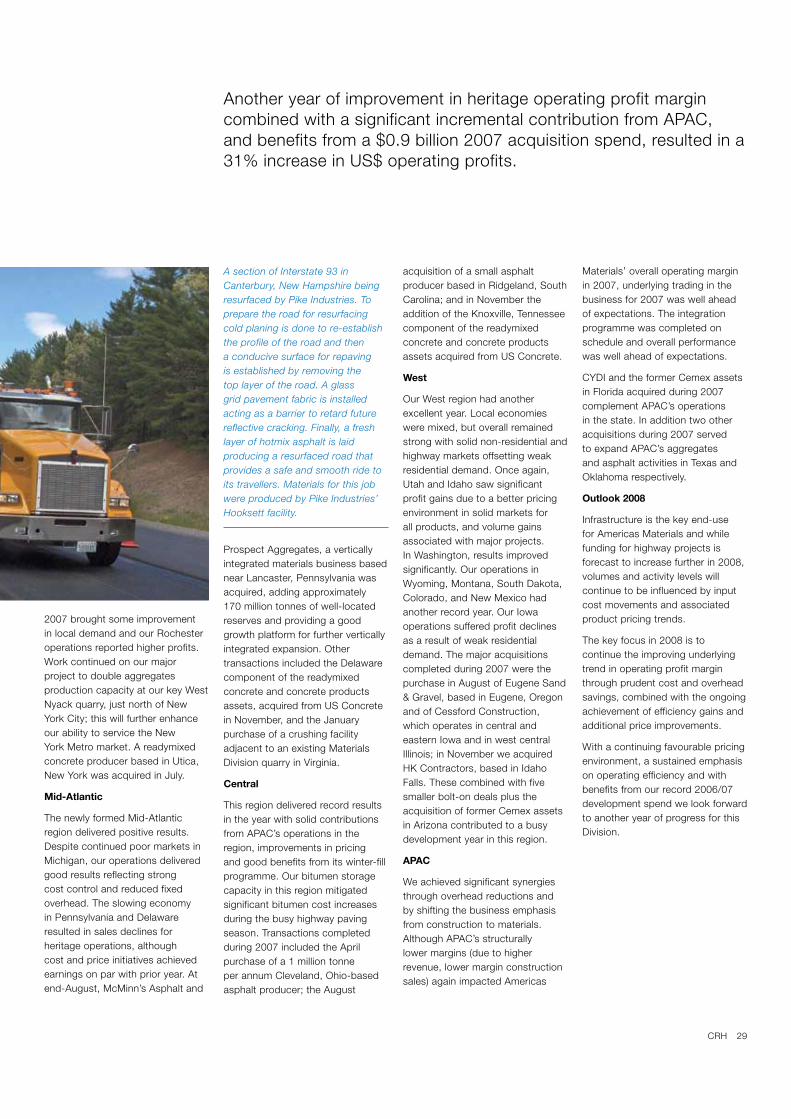
29CRH
2007 brought some improvement in local demand and our Rochester operations reported higher profits. Work continued on our major project to double aggregates production capacity at our key West Nyack quarry, just north of New York City; this will further enhance our ability to service the New York Metro market. A readymixed concrete producer based in Utica, New York was acquired in July.
Mid-Atlantic
The newly formed Mid-Atlantic region delivered positive results. Despite continued poor markets in Michigan, our operations delivered good results reflecting strong cost control and reduced fixed overhead. The slowing economy in Pennsylvania and Delaware resulted in sales declines for heritage operations, although cost and price initiatives achieved earnings on par with prior year. At end-August, McMinn’s Asphalt and
Prospect Aggregates, a vertically integrated materials business based near Lancaster, Pennsylvania was acquired, adding approximately 170 million tonnes of well-located reserves and providing a good growth platform for further vertically integrated expansion. Other transactions included the Delaware component of the readymixed concrete and concrete products assets, acquired from US Concrete in November, and the January purchase of a crushing facility adjacent to an existing Materials Division quarry in Virginia.
Central
This region delivered record results in the year with solid contributions from APAC’s operations in the region, improvements in pricing and good benefits from its winter-fill programme. Our bitumen storage capacity in this region mitigated significant bitumen cost increases during the busy highway paving season. Transactions completed during 2007 included the April purchase of a 1 million tonne per annum Cleveland, Ohio-based asphalt producer; the August
acquisition of a small asphalt producer based in Ridgeland, South Carolina; and in November the addition of the Knoxville, Tennessee component of the readymixed concrete and concrete products assets acquired from US Concrete.
West
Our West region had another excellent year. Local economies were mixed, but overall remained strong with solid non-residential and highway markets offsetting weak residential demand. Once again, Utah and Idaho saw significant profit gains due to a better pricing environment in solid markets for all products, and volume gains associated with major projects. In Washington, results improved significantly. Our operations in Wyoming, Montana, South Dakota, Colorado, and New Mexico had another record year. Our Iowa operations suffered profit declines as a result of weak residential demand. The major acquisitions completed during 2007 were the purchase in August of Eugene Sand & Gravel, based in Eugene, Oregon and of Cessford Construction, which operates in central and eastern Iowa and in west central Illinois; in November we acquired HK Contractors, based in Idaho Falls. These combined with five smaller bolt-on deals plus the acquisition of former Cemex assets in Arizona contributed to a busy development year in this region.
APAC
We achieved significant synergies through overhead reductions and by shifting the business emphasis from construction to materials. Although APAC’s structurally lower margins (due to higher revenue, lower margin construction sales) again impacted Americas
Materials’ overall operating margin in 2007, underlying trading in the business for 2007 was well ahead of expectations. The integration programme was completed on schedule and overall performance was well ahead of expectations.
CYDI and the former Cemex assets in Florida acquired during 2007 complement APAC’s operations in the state. In addition two other acquisitions during 2007 served to expand APAC’s aggregates and asphalt activities in Texas and Oklahoma respectively.
Outlook 2008
Infrastructure is the key end-use for Americas Materials and while funding for highway projects is forecast to increase further in 2008, volumes and activity levels will continue to be influenced by input cost movements and associated product pricing trends.
The key focus in 2008 is to continue the improving underlying trend in operating profit margin through prudent cost and overhead savings, combined with the ongoing achievement of efficiency gains and additional price improvements.
With a continuing favourable pricing environment, a sustained emphasis on operating efficiency and with benefits from our record 2006/07 development spend we look forward to another year of progress for this Division.
Another year of improvement in heritage operating profit margin combined with a significant incremental contribution from APAC, and benefits from a $0.9 billion 2007 acquisition spend, resulted in a 31% increase in US$ operating profits.
A section of Interstate 93 in Canterbury, New Hampshire being resurfaced by Pike Industries. To prepare the road for resurfacing cold planing is done to re-establish the profile of the road and then a conducive surface for repaving is established by removing the top layer of the road. A glass grid pavement fabric is installed acting as a barrier to retard future reflective cracking. Finally, a fresh layer of hotmix asphalt is laid producing a resurfaced road that provides a safe and smooth ride to its travellers. Materials for this job were produced by Pike Industries’ Hooksett facility.

30 CRH
Activities
Aggregates
United States
Asphalt
United States
Readymixed concrete
United States
174.0m tonnes*
51.4m tonnes*
9.7m cubic metres*
*CRH share of annualised production volumes.
Market leadership positions
No. 3 national producer
No. 1 national producer
Top 10 United States
The Americas Materials Division
operates in 44 states in the United
States through six regional business
units. CRH is the third largest
aggregates producer, the largest
asphalt producer and a top 10
readymixed concrete producer
in the United States. It owns
integrated aggregates and asphalt
operations thoughout the United
States with strategically located
long-term aggregates reserves.
Integrated readymixed concrete
operations are spread throughout
many states, with particular concentration
in the west. The Division is currently
developing a greenfield joint venture
cement plant in Florida. Americas
Materials employs approximately
23,500 people at over 1,200 locations.
Residential20%
Non-residential30%
New30%
50%Infrastructure
70%RMI
Product end-use (EBITDA)

31CRH
2007 Overview
Americas Products & Distribution faced a challenging year with the sharp decline in new residential construction and financial market turmoil from mid-year. Against this backdrop, our Products businesses delivered a resilient performance with continued growth in non-residential activity mitigating the impact of residential weakness, leaving full-year US$ operating profit only slightly below the record 2006 outcome. In Distribution, strong acquisition contributions were unable to compensate for an organic profit decline as residential demand weakened and Florida demand fell sharply from 2006 peak levels. Regionally, our Products & Distribution operations in the western and southern states performed relatively better; while the midwest and northeastern operations were noticeably weaker than 2006. Significant cost reduction measures were implemented in our residential-orientated businesses which mitigated the impact of volume declines. Overall, the Division recorded a 5% increase in sales and a 6% decline in operating profit before translation adjustments. We believe that this represents a very positive outcome and once again demonstrates the merits of the Division’s broad sectoral exposure and product diversity.
Architectural Products (APG)
APG, with 234 locations in 39 states and two Canadian provinces, is the leading North American producer of concrete products for the commercial masonry, professional landscaping and consumer DIY markets. The group is also a regional leader in clay brick, packaged dry-mixes, packaged decorative stone, mulches and soils.
APG faced difficult trading conditions in 2007 due to the sharp and continuing slowdown in the residential construction sector and weaker demand from the homecenter channel. These negative influences were partially offset by strong non-residential construction which limited the decline in like-for-like sales to approximately 10%. Despite the reduction in turnover, strong margin management, a significant turnaround in our Lawn & Garden bagged soil and mulch activities and a strong performance from our Canadian operations resulted in broadly maintained profits and an improved overall operating margin compared with 2006.
APG completed 12 acquisitions in 2007. These included the purchase of concrete block operations, masonry distribution businesses and other bolt-on acquisitions in masonry, packaged soils and mulches, and packaged specialty concrete products.
Precast
The Precast group is a leading manufacturer of precast, prestressed and polymer concrete products, small plastic box enclosures and concrete pipe in North America. The group operates from 81 locations in 26 states and the province of Québec.
The continued strength of the non-residential construction sector during the year was offset by a very weak residential sector. However, margins were sustained by good cost control and effective price management and profits were only slightly behind a record 2006. Backlog volumes and margins heading into 2008 are similar to 2007. Management’s focus will be on internal improvements and cost
reduction as we move into a more challenging environment.
Internal developments completed during 2007 included the commissioning of the new concrete pipe production plant in the Panhandle region of Florida and the completion of two major concrete pipe plant expansions in eastern Pennsylvania and Utah. Together these investments will result in increased capacity and lower manufacturing costs in three key markets.
Precast completed two acquisitions in 2007 – the acquisition of a plastic and polymer box manufacturer with plants in California, Kentucky and Ohio, expanding our national leadership position in concrete, polymer and concrete small box enclosures, and the purchase of a concrete manhole producer in Southern California, adding to our strong market position in that region.
Glass
The Glass group custom manufactures high-performance architectural glass and engineered aluminium glazing systems for multi-storey commercial, institutional and residential construction.
In June the Glass group acquired the Vistawall Group. With annual sales of US$323 million, Vistawall is a leading vertically-integrated manufacturer of a broad range of architectural aluminium glazing systems, including storefront systems, curtain wall, glass skylights, translucent roof and wall systems and operable windows. Headquartered in Terrell, Texas, Vistawall has 26 locations and a national footprint with sales in all 50 states. The acquisition of Vistawall provides scale and critical mass for Glass group’s growth strategy
Americas Products & Distribution
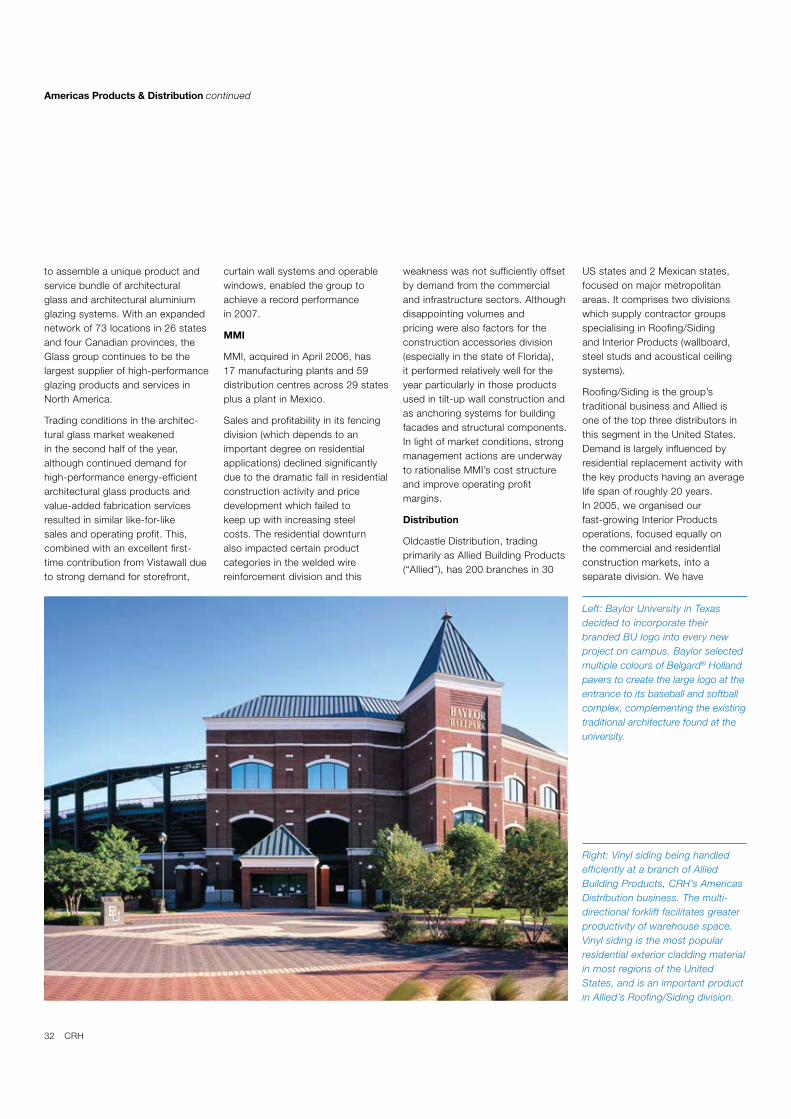
32 CRH
to assemble a unique product and service bundle of architectural glass and architectural aluminium glazing systems. With an expanded network of 73 locations in 26 states and four Canadian provinces, the Glass group continues to be the largest supplier of high-performance glazing products and services in North America.
Trading conditions in the architec-tural glass market weakened in the second half of the year, although continued demand for high-performance energy-efficient architectural glass products and value-added fabrication services resulted in similar like-for-like sales and operating profit. This, combined with an excellent first-time contribution from Vistawall due to strong demand for storefront,
curtain wall systems and operable windows, enabled the group to achieve a record performance in 2007.
MMI
MMI, acquired in April 2006, has 17 manufacturing plants and 59 distribution centres across 29 states plus a plant in Mexico.
Sales and profitability in its fencing division (which depends to an important degree on residential applications) declined significantly due to the dramatic fall in residential construction activity and price development which failed to keep up with increasing steel costs. The residential downturn also impacted certain product categories in the welded wire reinforcement division and this
weakness was not sufficiently offset by demand from the commercial and infrastructure sectors. Although disappointing volumes and pricing were also factors for the construction accessories division (especially in the state of Florida), it performed relatively well for the year particularly in those products used in tilt-up wall construction and as anchoring systems for building facades and structural components. In light of market conditions, strong management actions are underway to rationalise MMI’s cost structure and improve operating profit margins.
Distribution
Oldcastle Distribution, trading primarily as Allied Building Products (“Allied”), has 200 branches in 30
US states and 2 Mexican states, focused on major metropolitan areas. It comprises two divisions which supply contractor groups specialising in Roofing/Siding and Interior Products (wallboard, steel studs and acoustical ceiling systems).
Roofing/Siding is the group’s traditional business and Allied is one of the top three distributors in this segment in the United States. Demand is largely influenced by residential replacement activity with the key products having an averagelife span of roughly 20 years. In 2005, we organised our fast-growing Interior Products operations, focused equally on the commercial and residential construction markets, into a separate division. We have
Right: Vinyl siding being handled efficiently at a branch of Allied Building Products, CRH’s Americas Distribution business. The multi-directional forklift facilitates greater productivity of warehouse space. Vinyl siding is the most popular residential exterior cladding material in most regions of the United States, and is an important product in Allied’s Roofing/Siding division.
Americas Products & Distribution continued
Left: Baylor University in Texas decided to incorporate their branded BU logo into every new project on campus. Baylor selected multiple colours of Belgard® Holland pavers to create the large logo at the entrance to its baseball and softball complex, complementing the existing traditional architecture found at the university..

33CRH
significantly expanded this segment and, with the recent acquisition of Acoustical Materials Services in the western United States and Baja California, Mexico, Interior Products accounts for approximately 47% of annualised Distribution sales and we are now the third largest Interior Products distributor in the United States. Key to Oldcastle Distribution’s success is its well-trained, highly motivated workforce and strategically-focused organisational structure, supported by superior IT.
2007 was a challenging year for Americas Distribution in both its business sectors. Roofing/Siding demand declined in almost all areas reflecting the downturn in both new and remodel activity. Florida was
particularly impacted due to the absence of extensive 2006 roofing/siding repair activity which followed active hurricane seasons in both 2004 and 2005. Hawaii and the Pacific Northwest were the bright spots for the year. Interior Products performed well despite a generally weakening background and significant price deflation in gypsum wallboard and, with the benefits of good contributions from acquisition activity in recent years particularly in Hawaii, Texas and North Carolina, profits were maintained. Against this backdrop, full year operating profit for Americas Distribution declined by 26% before translation effects; while down from the record 2006 level, the operating margin of 5.3% was resilient in the circumstances.
South America
Our operations in Argentina and Chile had another record year in a robust regional economic environment. In Argentina, the recent capacity expansion made in our ceramic tile business resulted in further strong gains in sales and profits. Our Chilean glass business performed extremely well and the new state-of-the-art laminating facility remains on track for start up in March 2008.
Outlook 2008
New United States residential demand is forecast to show further declines in 2008 and the timing and pace of a recovery is not clear given the continued uncertainty in credit markets. Residential repair,
maintenance and improvement activity is historically less cyclical and is expected to remain close to 2007 levels. Following good momentum in 2007, non-residential construction looks likely to moderate later in 2008. Benefits from acquisitons, improvements made in 2007, and further targeted cost reductions measures will mitigate the effects of an overall weaker market, and we look to a slightly lower US$ outcome for our Products and Distribution activities.
Strong margin management and targeted cost reduction, combined with acquisition contributions, limited the decline in US$ operating profit to just 6% – a good outcome in tough circumstances.

34 CRH
Activities
Concrete masonry, patio products,
pavers and rooftiles
Canada, United States
Prepackaged concrete mixes
United States
Clay bricks, pavers and tiles
Argentina, United States
Precast concrete products
Canada, United States
Glass fabrication
Argentina, Canada, Chile, United States
Aluminium Glazing Systems
Canada, United States
Construction accessories
United States
Welded wire reinforcement
United States
Fencing products
United States
Roofing/Siding
United States
Interior products
Mexico, United States
13.4m tonnes*
2m tonnes*
1.3m tonnes*
2.4m tonnes*
12.5m square metres*
n/a
n/a
n/a
11.8m lineal metres
135 branches
65 branches
*CRH share of annualised production volumes.
Market leadership positions
No. 1 in masonry, paving and patio in United StatesNo. 1 in paving and patio in Canada
No. 2 United States
No. 1 brick producer in northeast and midwest United StatesNo. 1 in rooftiles in ArgentinaNo. 2 wall and floor tiles in Argentina
No. 1 United States
No. 1 in architectural glass fabrication in North America
No. 1 in custom-engineered aluminium glazing systems in North America
No. 1 United States
No. 2 fencing distributor and manufacturer United States
No. 3 roofing/siding distributor United States
No. 3 interior products distributor United States
Product end-use (EBITDA)
Residential45%
Non-residential45%
New60%
40%RMI
10%Infrastructure
The Americas Products & Distribution Division
operates primarily in the United States and
has a significant presence in Canada. Its
product groups – Architectural Products,
Precast, Glass, MMI and Distribution – all
have leading positions in national and regional
markets. The Division is also a leading producer
of clay tile products in Argentina and operates
glass fabrication businesses in Argentina and
Chile. Employees total approximately 24,000
at almost 600 locations.
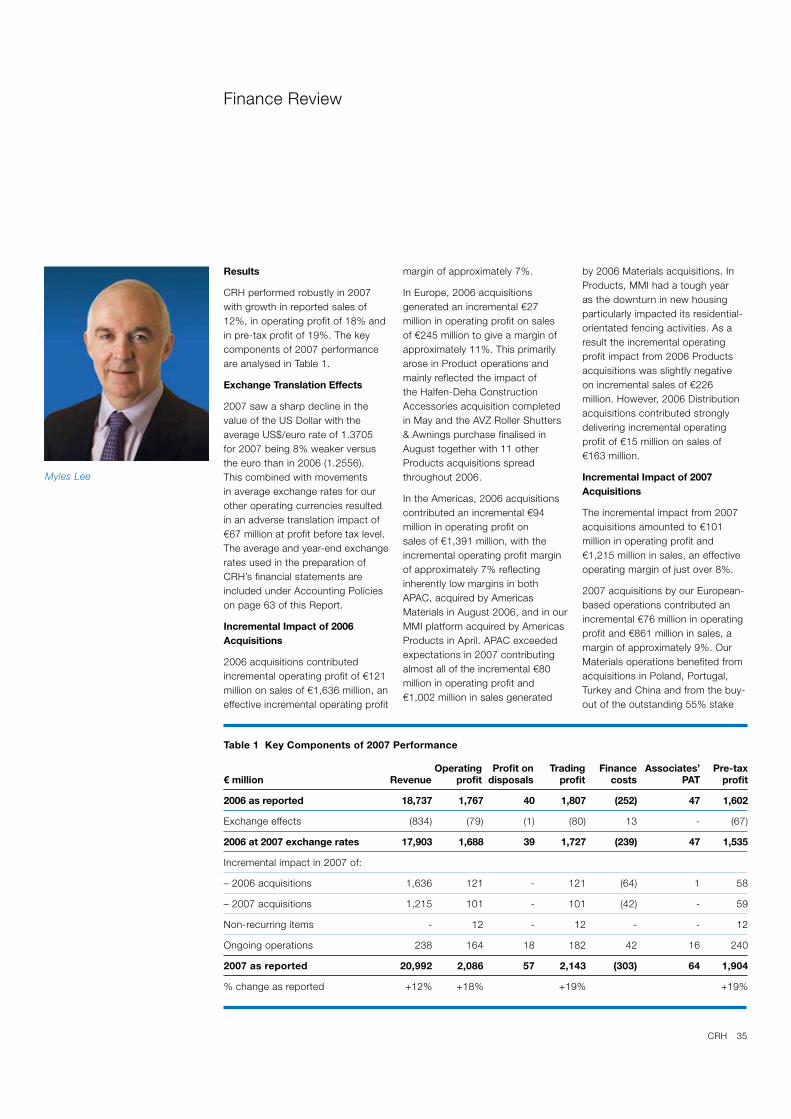
35CRH
Finance Review
Results
CRH performed robustly in 2007 with growth in reported sales of 12%, in operating profit of 18% and in pre-tax profit of 19%. The key components of 2007 performance are analysed in Table 1.
Exchange Translation Effects
2007 saw a sharp decline in the value of the US Dollar with the average US$/euro rate of 1.3705 for 2007 being 8% weaker versus the euro than in 2006 (1.2556). This combined with movements in average exchange rates for our other operating currencies resulted in an adverse translation impact of €67 million at profit before tax level. The average and year-end exchange rates used in the preparation of CRH’s financial statements are included under Accounting Policies on page 63 of this Report.
Incremental Impact of 2006
Acquisitions
2006 acquisitions contributed incremental operating profit of €121 million on sales of €1,636 million, an effective incremental operating profit
margin of approximately 7%.
In Europe, 2006 acquisitions generated an incremental €27 million in operating profit on sales of €245 million to give a margin of approximately 11%. This primarily arose in Product operations and mainly reflected the impact of the Halfen-Deha Construction Accessories acquisition completed in May and the AVZ Roller Shutters & Awnings purchase finalised in August together with 11 other Products acquisitions spread throughout 2006.
In the Americas, 2006 acquisitions contributed an incremental €94 million in operating profit on sales of €1,391 million, with the incremental operating profit margin of approximately 7% reflecting inherently low margins in both APAC, acquired by Americas Materials in August 2006, and in our MMI platform acquired by Americas Products in April. APAC exceeded expectations in 2007 contributing almost all of the incremental €80 million in operating profit and €1,002 million in sales generated
by 2006 Materials acquisitions. In Products, MMI had a tough year as the downturn in new housing particularly impacted its residential-orientated fencing activities. As a result the incremental operating profit impact from 2006 Products acquisitions was slightly negative on incremental sales of €226 million. However, 2006 Distribution acquisitions contributed strongly delivering incremental operating profit of €15 million on sales of €163 million.
Incremental Impact of 2007
Acquisitions
The incremental impact from 2007 acquisitions amounted to €101 million in operating profit and €1,215 million in sales, an effective operating margin of just over 8%.
2007 acquisitions by our European-based operations contributed an incremental €76 million in operating profit and €861 million in sales, a margin of approximately 9%. Our Materials operations benefited from acquisitions in Poland, Portugal, Turkey and China and from the buy-out of the outstanding 55% stake
Myles Lee
Table 1 Key Components of 2007 Performance
Operating Profit on Trading Finance Associates’ Pre-tax
€ million Revenue profit disposals profit costs PAT profit
2006 as reported 18,737 1,767 40 1,807 (252) 47 1,602
Exchange effects (834) (79) (1) (80) 13 - (67)
2006 at 2007 exchange rates 17,903 1,688 39 1,727 (239) 47 1,535
Incremental impact in 2007 of:
– 2006 acquisitions 1,636 121 - 121 (64) 1 58
– 2007 acquisitions 1,215 101 - 101 (42) - 59
Non-recurring items - 12 - 12 - - 12
Ongoing operations 238 164 18 182 42 16 240
2007 as reported 20,992 2,086 57 2,143 (303) 64 1,904
% change as reported +12% +18% +19% +19%
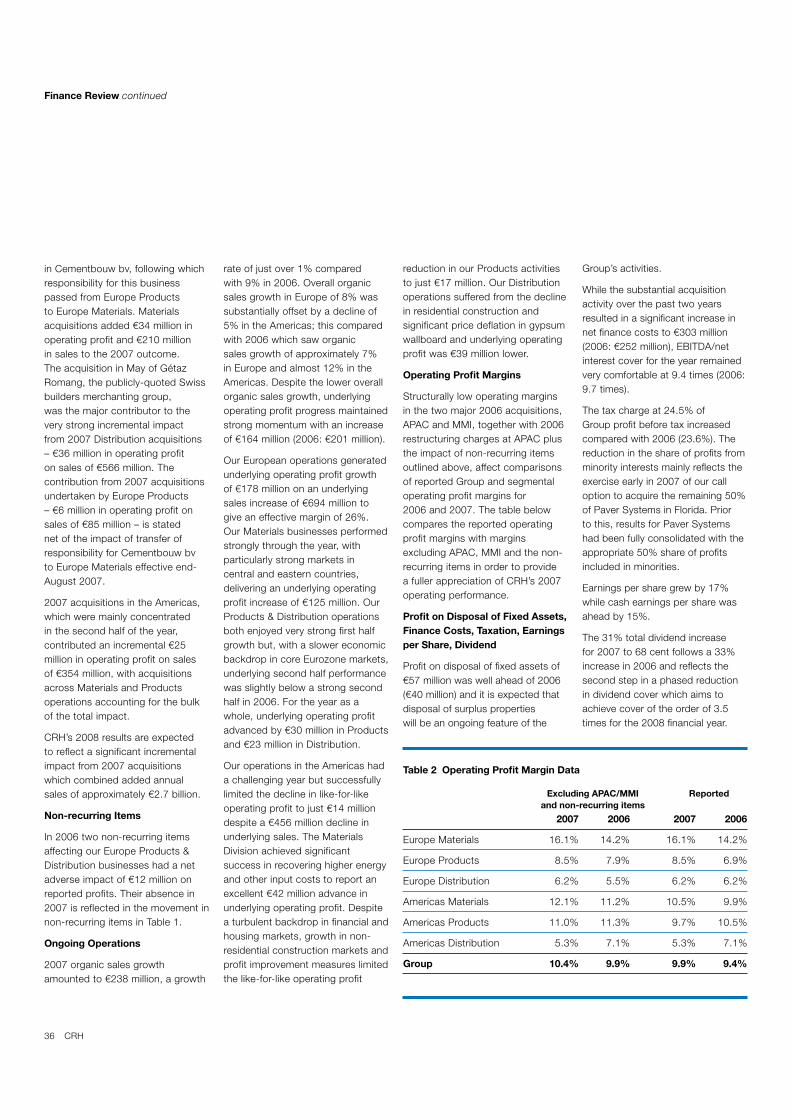
36 CRH
in Cementbouw bv, following which responsibility for this business passed from Europe Products to Europe Materials. Materials acquisitions added €34 million in operating profit and €210 million in sales to the 2007 outcome. The acquisition in May of Gétaz Romang, the publicly-quoted Swiss builders merchanting group, was the major contributor to the very strong incremental impact from 2007 Distribution acquisitions – €36 million in operating profit on sales of €566 million. The contribution from 2007 acquisitions undertaken by Europe Products – €6 million in operating profit on sales of €85 million – is stated net of the impact of transfer of responsibility for Cementbouw bv to Europe Materials effective end-August 2007.
2007 acquisitions in the Americas, which were mainly concentrated in the second half of the year, contributed an incremental €25 million in operating profit on sales of €354 million, with acquisitions across Materials and Products operations accounting for the bulk of the total impact.
CRH’s 2008 results are expected to reflect a significant incremental impact from 2007 acquisitions which combined added annual sales of approximately €2.7 billion.
Non-recurring Items
In 2006 two non-recurring items affecting our Europe Products & Distribution businesses had a net adverse impact of €12 million on reported profits. Their absence in 2007 is reflected in the movement in non-recurring items in Table 1.
Ongoing Operations
2007 organic sales growth amounted to €238 million, a growth
rate of just over 1% compared with 9% in 2006. Overall organic sales growth in Europe of 8% was substantially offset by a decline of 5% in the Americas; this compared with 2006 which saw organic sales growth of approximately 7% in Europe and almost 12% in the Americas. Despite the lower overall organic sales growth, underlying operating profit progress maintained strong momentum with an increase of €164 million (2006: €201 million).
Our European operations generated underlying operating profit growth of €178 million on an underlying sales increase of €694 million to give an effective margin of 26%. Our Materials businesses performed strongly through the year, with particularly strong markets in central and eastern countries, delivering an underlying operating profit increase of €125 million. Our Products & Distribution operations both enjoyed very strong first half growth but, with a slower economic backdrop in core Eurozone markets, underlying second half performance was slightly below a strong second half in 2006. For the year as a whole, underlying operating profit advanced by €30 million in Products and €23 million in Distribution.
Our operations in the Americas had a challenging year but successfully limited the decline in like-for-like operating profit to just €14 million despite a €456 million decline in underlying sales. The Materials Division achieved significant success in recovering higher energy and other input costs to report an excellent €42 million advance in underlying operating profit. Despite a turbulent backdrop in financial and housing markets, growth in non-residential construction markets and profit improvement measures limited the like-for-like operating profit
reduction in our Products activities to just €17 million. Our Distribution operations suffered from the decline in residential construction and significant price deflation in gypsum wallboard and underlying operating profit was €39 million lower.
Operating Profit Margins
Structurally low operating margins in the two major 2006 acquisitions, APAC and MMI, together with 2006 restructuring charges at APAC plus the impact of non-recurring items outlined above, affect comparisons of reported Group and segmental operating profit margins for 2006 and 2007. The table below compares the reported operating profit margins with margins excluding APAC, MMI and the non-recurring items in order to provide a fuller appreciation of CRH’s 2007 operating performance.
Profit on Disposal of Fixed Assets,
Finance Costs, Taxation, Earnings
per Share, Dividend
Profit on disposal of fixed assets of €57 million was well ahead of 2006 (€40 million) and it is expected that disposal of surplus properties will be an ongoing feature of the
Group’s activities.
While the substantial acquisition activity over the past two years resulted in a significant increase in net finance costs to €303 million (2006: €252 million), EBITDA/net interest cover for the year remained very comfortable at 9.4 times (2006: 9.7 times).
The tax charge at 24.5% of Group profit before tax increased compared with 2006 (23.6%). The reduction in the share of profits from minority interests mainly reflects the exercise early in 2007 of our call option to acquire the remaining 50% of Paver Systems in Florida. Prior to this, results for Paver Systems had been fully consolidated with the appropriate 50% share of profits included in minorities.
Earnings per share grew by 17% while cash earnings per share was ahead by 15%.
The 31% total dividend increase for 2007 to 68 cent follows a 33% increase in 2006 and reflects the second step in a phased reduction in dividend cover which aims to achieve cover of the order of 3.5 times for the 2008 financial year.
Table 2 Operating Profit Margin Data
Excluding APAC/MMI Reported
and non-recurring items
2007 2006 2007 2006
Europe Materials 16.1% 14.2% 16.1% 14.2%
Europe Products 8.5% 7.9% 8.5% 6.9%
Europe Distribution 6.2% 5.5% 6.2% 6.2%
Americas Materials 12.1% 11.2% 10.5% 9.9%
Americas Products 11.0% 11.3% 9.7% 10.5%
Americas Distribution 5.3% 7.1% 5.3% 7.1%
Group 10.4% 9.9% 9.9% 9.4%
Finance Review continued
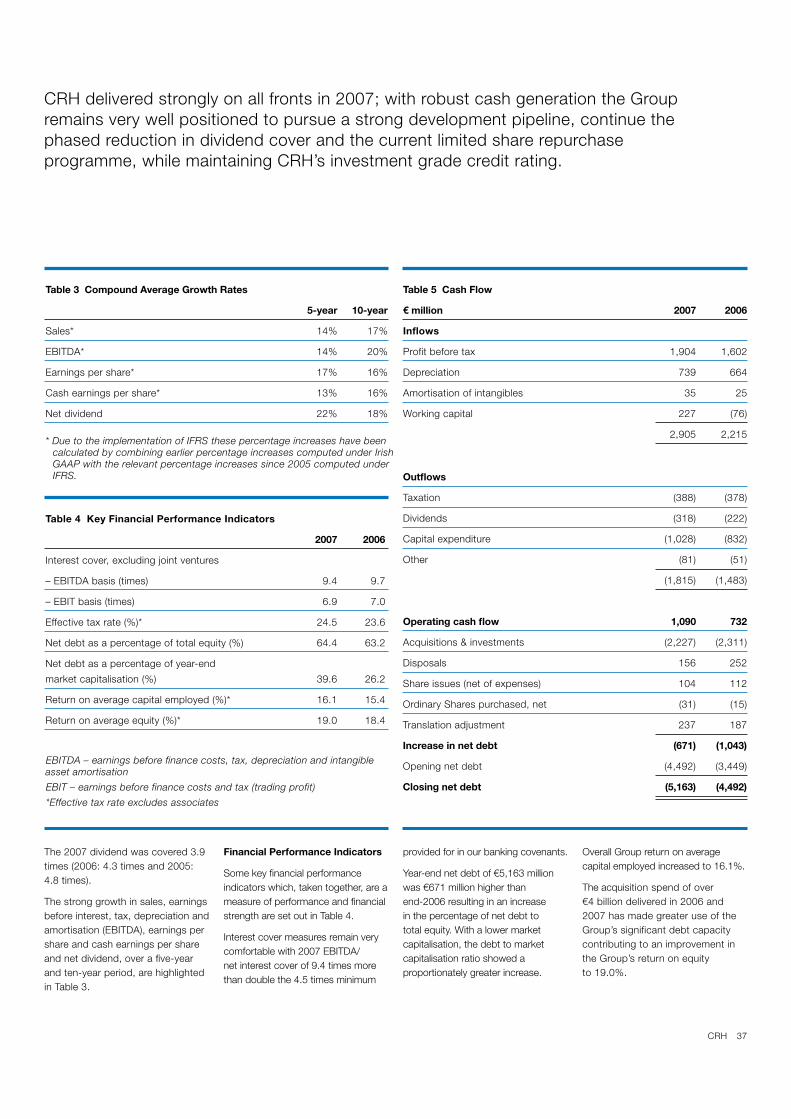
37CRH
Table 3 Compound Average Growth Rates
5-year 10-year
Sales* 14% 17%
EBITDA* 14% 20%
Earnings per share* 17% 16%
Cash earnings per share* 13% 16%
Net dividend 22% 18%
* Due to the implementation of IFRS these percentage increases have been calculated by combining earlier percentage increases computed under Irish GAAP with the relevant percentage increases since 2005 computed under IFRS.
Table 4 Key Financial Performance Indicators
2007 2006
Interest cover, excluding joint ventures
– EBITDA basis (times) 9.4 9.7
– EBIT basis (times) 6.9 7.0
Effective tax rate (%)* 24.5 23.6
Net debt as a percentage of total equity (%) 64.4 63.2
Net debt as a percentage of year-end
market capitalisation (%) 39.6 26.2
Return on average capital employed (%)* 16.1 15.4
Return on average equity (%)* 19.0 18.4
EBITDA – earnings before finance costs, tax, depreciation and intangible asset amortisation
EBIT – earnings before finance costs and tax (trading profit)
*Effective tax rate excludes associates
Table 5 Cash Flow
€ million 2007 2006
Inflows
Profit before tax 1,904 1,602
Depreciation 739 664
Amortisation of intangibles 35 25
Working capital 227 (76)
2,905 2,215
Outflows
Taxation (388) (378)
Dividends (318) (222)
Capital expenditure (1,028) (832)
Other (81) (51)
(1,815) (1,483)
Operating cash flow 1,090 732
Acquisitions & investments (2,227) (2,311)
Disposals 156 252
Share issues (net of expenses) 104 112
Ordinary Shares purchased, net (31) (15)
Translation adjustment 237 187
Increase in net debt (671) (1,043)
Opening net debt (4,492) (3,449)
Closing net debt (5,163) (4,492)
The 2007 dividend was covered 3.9 times (2006: 4.3 times and 2005: 4.8 times).
The strong growth in sales, earnings before interest, tax, depreciation and amortisation (EBITDA), earnings per share and cash earnings per share and net dividend, over a five-year and ten-year period, are highlighted in Table 3.
Financial Performance Indicators
Some key financial performance indicators which, taken together, are a measure of performance and financial strength are set out in Table 4.
Interest cover measures remain very comfortable with 2007 EBITDA/net interest cover of 9.4 times more than double the 4.5 times minimum
provided for in our banking covenants.
Year-end net debt of €5,163 million was €671 million higher than end-2006 resulting in an increase in the percentage of net debt to total equity. With a lower market capitalisation, the debt to market capitalisation ratio showed a proportionately greater increase.
Overall Group return on average capital employed increased to 16.1%.
The acquisition spend of over €4 billion delivered in 2006 and 2007 has made greater use of the Group’s significant debt capacity contributing to an improvement in the Group’s return on equity to 19.0%.
CRH delivered strongly on all fronts in 2007; with robust cash generation the Group remains very well positioned to pursue a strong development pipeline, continue the phased reduction in dividend cover and the current limited share repurchase programme, while maintaining CRH’s investment grade credit rating.

38 CRH
Cash Generation
While spending a total of over €3.25 billion on acquisitions, investments and capital projects, the strong cash generation characteristics of the Group limited the increase in net debt to €0.7 billion, helped by a positive translation adjustment of €0.2 billion. Table 5 summarises CRH’s cash flows for 2007 and 2006.
The increased charges for depreciation and amortisation of intangible assets mainly reflect the impact of acquisitions completed in 2006 and 2007.
A continuing strong focus on working capital management across the Group’s heritage operations combined with a significant reduction in working capital levels at APAC, associated with the scaling back of its low margin contracting activities, resulted in a working capital inflow for the year of €227 million compared with a €76 million outflow in 2006.
Taxation payments were slightly higher than in 2006.
The increase in dividend cost reflects the 39% increase in the final 2006 dividend and the 48% increase in the interim 2007 dividend both of which were paid during the course of 2007.
Capital expenditure of €1,028 million represented 4.9% of Group turnover (2006: 4.4%) and amounted to 1.39 times depreciation (2006: 1.25 times).Of the total capital expenditure 50% was invested in Europe with 50% in the Americas.
The caption denoted “Other” mainly reflects the elimination of non-cash income items, mainly share of associates’ profits and profit on disposal of fixed assets, and
non-cash expense items such as IFRS share based compensation expense, which are included in arriving at profit before tax.
2007 saw a record €2.2 billion spend on acquisitions and investments. This compared with a net €2.1 billion in 2006 after adjusting the reported gross spend of €2.3 billion for subsequent selective APAC asset disposals of approximately €0.2 billion.
Proceeds from share issues principally reflect the take-up of shares in lieu of dividends under the Company’s scrip dividend scheme (€68 million, 2006: €25 million) augmented by issues under Group share option and share participation schemes of €36 million (2006: €87 million).
Purchase of shares reflects the purchase of existing shares in respect of the Performance Share Plan (€10 million) and purchases to satisfy the exercise of share options during the year (€21 million net of proceeds from exercise of options). In 2006 shares were purchased in respect of the Performance Share Plan only.
Exchange rate movements during 2007 reduced the euro amount of net foreign currency debt by €237 million principally due to the 12% revaluation of the euro against the US Dollar from 1.3170 at end-2006 to 1.4721 at end-2007. The favourable translation adjustment in 2006 also reflected a 12% revaluation of the euro versus the US Dollar from 1.1797 at end-2005 to 1.3170 at end-2006.
Year-end net debt of €5,163 million (2006: €4,492 million) includes €164 million (2006: €248 million) in respect of the Group’s proportionate share of net debt in joint venture undertakings. The reduction reflects
the fact that following the August 2007 buy-out of the remaining 55% of Cementbouw bv its net debt is no longer included in the joint venture total.
Employee Benefits
In compliance with IFRS, the net assets and actuarial liabilities (excluding related deferred taxation) of the defined benefit pension schemes operated by various Group companies, computed in accordance with IAS 19, have been included on the face of the balance sheet under retirement benefit obligations. At end-2007, retirement benefit obligations amounted to €95 million (2006: €262 million); after deducting deferred tax the net liability amounted to €62 million (2006: €177 million). The net liability represented 0.5% of CRH’s year-end 2007 market capitalisation (2006: 1.0%).
Share Price and Share
Repurchase Programme
The Company’s Ordinary Shares traded in the range €21.92 to €38.20 during 2007. The year-end share price was €23.85 (2006: €31.54). Shareholders recorded a negative gross return of -23% (dividends and capital depreciation) during 2007 following returns of +29% in 2006, +28% in 2005 and +23% in 2004.
Subsequent to year-end, on 3rd January 2008, CRH introduced a share repurchase programme limited to 5% of the 547 million Ordinary Shares then in issue. To date, 6 million shares have been repurchased at an average price of €25. These shares are held as Treasury Shares.
CRH is one of six building materials companies included in the FTSE Eurotop 300, a market-
capitalisation-weighted index of Europe’s largest 300 companies. At year-end 2007 CRH’s market capitalisation of €13.1 billion (2006: €17.1 billion) placed it among the top 6 building materials companies worldwide.
Insurance
Group headquarters advises management on different aspects of risk and monitors overall safety and loss prevention performance; operational management is responsible for the day-to-day management of business risks. Insurance cover is held for all significant insurable risks and against major catastrophe. For any such events, the Group generally bears an initial cost before external cover begins.
Legal Proceedings
Group companies are parties to various legal proceedings, including some in which claims for damages have been asserted against the companies. The final outcome of all the legal proceedings to which Group companies are party cannot be accurately forecast. However, having taken appropriate advice, we believe that the aggregate outcome of such proceedings will not have a material effect on the Group’s financial condition, results of operations or liquidity.
Financial Risk Management
The Board of Directors sets the treasury policies and objectives of the Group, which include controls over the procedures used to manage financial market risks. These are set out in detail in note 23 to the financial statements.
Interest rate and debt/liquidity managementAt the end of 2007, 46% of the Group’s net debt was at interest
Finance Review continued
39CRH
rates which were fixed for an average period of 4.8 years. The euro accounted for approximately 38% of net debt at the end of 2007 and 48% of the euro component of net debt was at fixed rates. The US Dollar accounted for approximately 47% of net debt at the end of 2007 and 53% of the US Dollar component of net debt was at fixed rates.
The Group finished the year in a very strong financial position with 97% of the Group’s gross debt drawn under committed term facilities, 94% of which mature after more than one year. In addition, at year-end the Group held €1.6 billion of undrawn committed facilities, which had an average maturity of 1.3 years.
At year-end 2007, 92% of the Group’s cash, short-term deposits and liquid resources had a maturity of six months or less.
Currency managementThe bulk of the Group’s net worth is denominated in the world’s two largest currencies – the US Dollar and the euro – which accounted for 43% and 35% respectively of the Group’s net worth at end-2007.
2007 saw a negative €410 million currency translation effect on foreign currency net worth mainly arising on US Dollar net assets. This negative effect is stated net of a €237 million positive translation impact on net foreign currency debt.
Sarbanes-Oxley Act
As a result of its NYSE Listing, CRH is subject to the provisions of Section 404 of the Sarbanes-Oxley Act of 2002, which requires management to perform an annual assessment of the effectiveness of internal control over financial reporting and to report its
conclusions in the Company’s Annual Report on Form 20-F, filed with the Securities and Exchange Commission. For the year ended 31st December 2006, management concluded that the Company’s internal control over financial reporting was effective. As required by US law, Ernst & Young audited management’s assessment and the effectiveness of the Company’s controls over financial reporting and issued an unqualified opinion with regard to the effectiveness of management’s assessment and of the Company’s financial controls.
Management’s assessment and the auditors’ report on the effectiveness of internal controls for the year ended 31st December 2007 will be included in the 2007 Annual Report on Form 20-F which will be filed later in the year.
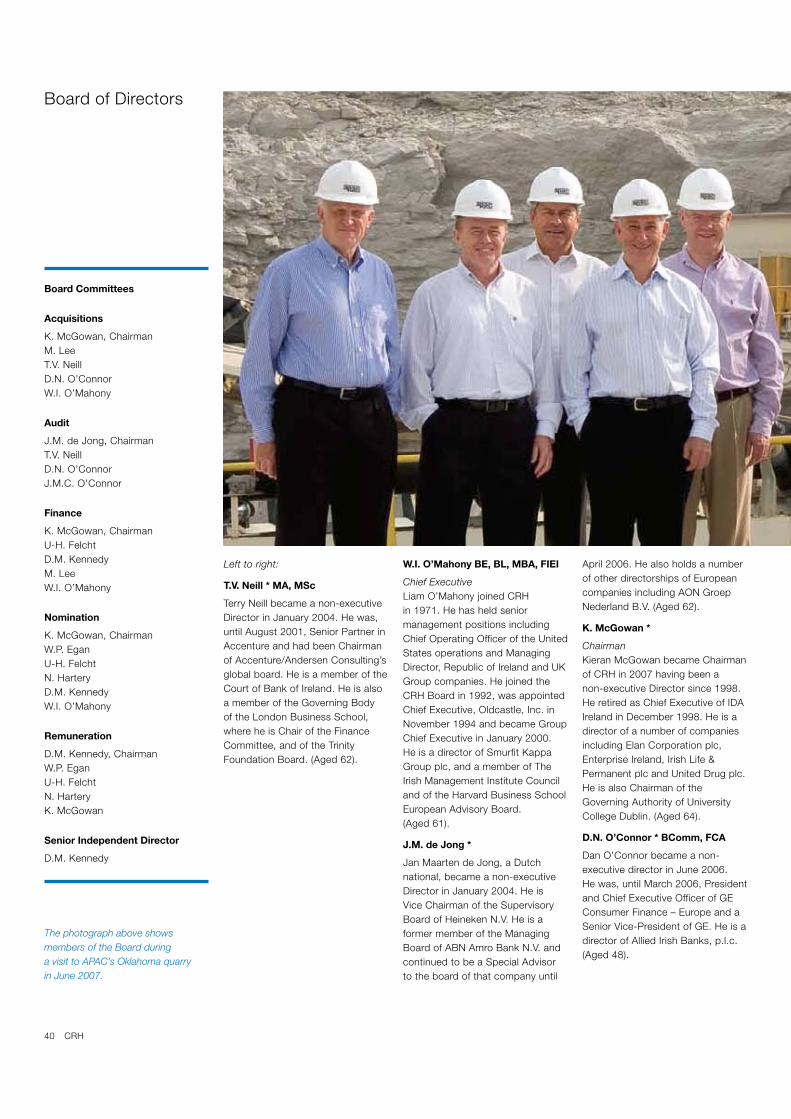
40 CRH
Board Committees
Acquisitions
K. McGowan, ChairmanM. LeeT.V. NeillD.N. O’ConnorW.I. O’Mahony
Audit
J.M. de Jong, ChairmanT.V. NeillD.N. O’ConnorJ.M.C. O’Connor
Finance
K. McGowan, ChairmanU-H. FelchtD.M. KennedyM. LeeW.I. O’Mahony
Nomination
K. McGowan, ChairmanW.P. EganU-H. FelchtN. HarteryD.M. KennedyW.I. O’Mahony
Remuneration
D.M. Kennedy, ChairmanW.P. EganU-H. FelchtN. HarteryK. McGowan
Senior Independent Director
D.M. Kennedy
Left to right:
T.V. Neill * MA, MSc
Terry Neill became a non-executive Director in January 2004. He was, until August 2001, Senior Partner in Accenture and had been Chairman of Accenture/Andersen Consulting’s global board. He is a member of the Court of Bank of Ireland. He is also a member of the Governing Body of the London Business School, where he is Chair of the Finance Committee, and of the Trinity Foundation Board. (Aged 62).
W.I. O’Mahony BE, BL, MBA, FIEI
Chief ExecutiveLiam O’Mahony joined CRH in 1971. He has held senior management positions including Chief Operating Officer of the United States operations and Managing Director, Republic of Ireland and UK Group companies. He joined the CRH Board in 1992, was appointed Chief Executive, Oldcastle, Inc. in November 1994 and became Group Chief Executive in January 2000. He is a director of Smurfit Kappa Group plc, and a member of The Irish Management Institute Council and of the Harvard Business School European Advisory Board. (Aged 61).
J.M. de Jong *
Jan Maarten de Jong, a Dutch national, became a non-executive Director in January 2004. He is Vice Chairman of the Supervisory Board of Heineken N.V. He is a former member of the Managing Board of ABN Amro Bank N.V. and continued to be a Special Advisor to the board of that company until
April 2006. He also holds a number of other directorships of European companies including AON Groep Nederland B.V. (Aged 62).
K. McGowan *
ChairmanKieran McGowan became Chairman of CRH in 2007 having been a non-executive Director since 1998. He retired as Chief Executive of IDA Ireland in December 1998. He is a director of a number of companies including Elan Corporation plc, Enterprise Ireland, Irish Life & Permanent plc and United Drug plc.He is also Chairman of the Governing Authority of University College Dublin. (Aged 64).
D.N. O’Connor * BComm, FCA
Dan O’Connor became a non-executive director in June 2006. He was, until March 2006, President and Chief Executive Officer of GE Consumer Finance – Europe and a Senior Vice-President of GE. He is a director of Allied Irish Banks, p.l.c. (Aged 48).
The photograph above shows members of the Board during a visit to APAC’s Oklahoma quarry in June 2007.
Board of Directors

41CRH
J.M.C. O’Connor * B.Soc.Sc.,
M.Soc.Sc., PhD
Joyce O’Connor became a non-executive Director in June 2004. She is President Emeritus of the National College of Ireland. She currently chairs the Digital Hub Development Agency, the National Guidance Forum and the Dublin Inner City Partnership. She is a non-executive director of the Hugh Lane Gallery and Caring for Carers Association. She is a board member of the National Centre for Partnership and Performance, a Council Member of the Dublin Chamber of Commerce and an Eisenhower Fellow. (Aged 60).
T.W. Hill BA, MBA
Chief Executive OfficerOldcastle, Inc.Tom Hill joined CRH in 1980. He was appointed President of Oldcastle Materials, Inc. in 1991 and became its Chief Executive Officer in January 2000. He was appointed to his current position with effect from July 2006. A United States citizen, he is responsible
for the Group’s materials, products and distribution businesses in the Americas. He was appointed a CRH Board Director in January 2002. (Aged 51).
W.P. Egan *
Bill Egan became a non-executive Director in January 2007. He is founder and general partner of Alta Communications, a venture capital company headquartered in Boston. He is Past President and Chairman of the National Venture Capital Association and is a trustee of the University of Pennsylvania and a member of the board of overseers of the Wharton School of Finance at the University of Pennsylvania. He is a director of Cephalon, Inc., the Irish venture capital company Delta Partners Limited and also serves on the boards of several privately held communications, cable and information technology companies. (Aged 62).
D.M. Kennedy * MSc
David Kennedy became a non-executive Director in 1989. He is a director of a number of companies in Ireland and overseas, including Bon Secours Health System Limited, Drury Communications Limited and Pimco Funds Global Investors Series plc. He was formerly Chief Executive of Aer Lingus plc. (Aged 69).
M. Lee BE, FCA
Finance DirectorMyles Lee joined CRH in 1982. Prior to this he worked in a professional accountancy practice and in the oil industry. He was appointed General Manager Finance in 1988 and became Finance Director in November 2003. (Aged 54).
U-H. Felcht *
Utz-Hellmuth Felcht became a non-executive Director in July 2007. A German national, he was, until May of 2006, Chief Executive of Degussa GmbH, Germany’s third largest chemical company. He is on the board of CIBA AG and is a partner in the private equity group One Equity Europe GmbH. He is a member of the Advisory Board of Hapag-Lloyd and of the Supervisory Board of SGL Carbon AG. (Aged 60).
N. Hartery * CEng, FIEI, MBA
Nicky Hartery became a non-executive Director in June 2004. He is Vice President of Manufacturing, Business Operations and Customer Experience for Dell Europe, the Middle East and Africa. Prior to joining Dell, he was Executive Vice President at Eastman Kodak and previously held the position of President and CEO at Verbatim Corporation, based in the United States. (Aged 56).
*Non-executive
42 CRH
Corporate Governance
CRH has primary listings on the Irish and London Stock Exchanges and its ADRs are listed on the New York Stock Exchange (NYSE).
The Directors are committed to maintaining the highest standards of corporate governance and this statement describes how CRH applies the main and supporting principles of section 1 of the Combined Code on Corporate Governance (June 2006) published by the Financial Reporting Council in the UK.
Board of Directors
RoleThe Board is responsible for the leadership and control of the Company. There is a formal schedule of matters reserved to the Board for consideration and decision. This includes Board appointments, approval of strategic plans for the Group, approval of financial statements, the annual budget, major acquisitions and significant capital expenditure, and review of the Group’s system of internal controls.
The Board has delegated responsibility for the management of the Group, through the Chief Executive, to executive management. The roles of Chairman and Chief Executive are not combined and there is a clear division of responsibilities between them, which is set out in writing and has been approved by the Board. The Chief Executive is accountable to the Board for all authority delegated to executive management.
The Board has also delegated some of its responsibilities to Committees of the Board. Individual Directors may seek independent professional advice, at the expense of the Company, in the furtherance of their duties as a Director.
The Group has a policy in place which indemnifies the Directors in respect of legal action taken against them.
MembershipIt is the practice of CRH that a majority of the Board comprises
non-executive Directors and that the Chairman be non-executive. At present, there are three executive and nine non-executive Directors. Biographical details are set out on pages 40 and 41. The Board considers that, between them, the Directors bring the range of skills, knowledge and experience, including international experience, necessary to lead the Company.
Directors are appointed for specified terms and subject to the Memorandum and Articles of Association of the Company.
All of the Directors bring independent judgement to bear on issues of strategy, performance, resources, key appointments and standards. The Board has determined that each of the non-executive Directors is independent. In reaching that conclusion, the Board considered the principles relating to independence contained in the Combined Code and the guidance provided by a number of shareholder voting agencies. Those principles and guidance address a number of factors that might appear to affect the independence of Directors, including former service as an executive, extended service on the Board and cross-directorships. However, they also make clear that a Director may be considered independent notwithstanding the presence of one or more of these factors. This reflects the Board’s view that independence is determined by a Director’s character, objectivity and integrity. Where relevant, the Board took account of these factors and in each case was satisfied that the Director’s independence was not compromised.
ChairmanMr. Kieran McGowan succeeded Mr. Pat Molloy as Chairman on Mr. Molloy’s retirement following the Annual General Meeting on 9th May 2007. On his appointment as Chairman, Mr. McGowan met the independence criteria set out in the Combined Code. The Chairman is responsible for the efficient and effective working of the Board. He ensures that Board agendas cover
the key strategic issues confronting the Group; that the Board reviews and approves management’s plans for the Group; and that Directors receive accurate, timely, clear and relevant information. While Mr. McGowan holds a number of other directorships (see details on page 40), the Board considers that these do not interfere with the discharge of his duties to CRH.
Senior Independent DirectorThe Board has appointed Mr. David Kennedy as the Senior Independent Director. Mr. Kennedy is available to shareholders who have concerns that cannot be addressed through the Chairman, Chief Executive or Finance Director. On Mr. Kennedy’s retirement from the Board on 7th May 2008, Mr. Nicky Hartery will take on the role of Senior Independent Director.
Company SecretaryThe appointment and removal of the Company Secretary is a matter for the Board. All Directors have access to the advice and services of the Company Secretary, who is responsible to the Board for ensuring that Board procedures are complied with.
Terms of appointmentThe standard terms of the letter of appointment of non-executive Directors is available, on request, from the Company Secretary.
Induction and developmentNew Directors are provided with extensive briefing materials on the Group and its operations. Directors meet with key executives and, in the course of twice-yearly visits by the Board to Group locations, see the businesses at first hand and meet with local management teams.
RemunerationDetails of remuneration paid to the Directors (executive and non-executive) are set out in the Report on Directors’ Remuneration on pages 48 to 55.
Share ownership and dealingDetails of the shares held by Directors are set out on page 55.
CRH has a policy on dealings in securities that applies to Directors
and senior management. Under the policy, Directors are required to obtain clearance from the Chairman and Chief Executive before dealing in CRH shares. Directors and senior management are prohibited from dealing in CRH shares during designated prohibited periods and at any time at which the individual is in possession of price-sensitive information. The policy adopts the terms of the Model Code, as set out in the Listing Rules published by the UK Listing Authority and the Irish Stock Exchange.
Performance appraisalThe Senior Independent Director conducts an annual review of corporate governance, the operation and performance of the Board and its Committees and the performance of the Chairman. This is achieved through discussion with each Director.
A review of individual Directors’ performance is conducted by the Chairman and each Director is provided with feedback gathered from other members of the Board. Performance is assessed against a number of measures, including the ability of the Director to contribute to the development of strategy, to understand the major risks affecting the Group, to contribute to the cohesion of the Board, to commit the time required to fulfil the role, and to listen to and respect the views of other Directors and the management team.
Directors’ retirement and re-electionThe Board has determined that when a non-executive Director has served on the Board for more than nine years, that Director will be subject to annual re-election. Of the remaining Directors, at least one-third retire at each Annual General Meeting and Directors must submit themselves to shareholders for re-election every three years. Re-appointment is not automatic. Directors who are seeking re-election are subject to a performance appraisal, which is overseen by the Nomination Committee.
43CRH
Directors appointed by the Board must submit themselves to shareholders for election at the Annual General Meeting following their appointment.
Board succession planningThe Board plans for its own succession with the assistance of the Nomination Committee. In so doing, the Board considers the skill, knowledge and experience necessary to allow it to meet the strategic vision for the Group.
The Board engages the services of independent consultants to undertake a search for suitable candidates to serve as non-executive Directors.
MeetingsThere were eight full meetings of the Board during 2007. Details of Directors’ attendance at those meetings are set out in the table on page 45. The Chairman sets the agenda for each meeting, in consultation with the Chief Executive and Company Secretary. Two visits are made each year by the Board to Group operations; one in Europe and one in North America. Each
days and incorporates a scheduled Board meeting. In 2007, these visits were to Poland and to Texas, Oklahoma and Arkansas in the United States. Additional meetings,
are held when and if required. Board papers are circulated to Directors in advance of meetings.
The non-executive Directors met twice during 2007 without executives being present.
Committees
permanent Committees to assist in the execution of its responsibilities. These are the Acquisitions Committee, the Audit Committee, the Finance Committee, the Nomination Committee and the Remuneration Committee. Ad hoc committees are formed from time to
Each of the permanent Committees has terms of reference, under which authority is delegated to them by the
Board. The terms of reference are available on the Group’s website, www.crh.com. The Chairman of each Committee reports to the Board on its deliberations and minutes of all Committee meetings are circulated to all Directors.
The current membership of each Committee is set out on page 40. Attendance at meetings held in 2007 is set out in the table on page 45.
Chairmen of the Committees attend the Annual General Meeting and are available to answer questions from shareholders.
During the year each of the relevant Committees reviewed its performance and terms of reference.
The role of the Acquisitions Committee is to approve acquisitions and capital expenditure projects within limits agreed by the Board.
The Audit Committee consists of four non-executive Directors, considered by the Board to be independent. The Board has determined that Mr. Jan Maarten de Jong, Mr. Terry Neill and Mr. Dan O’Connor are the Committee’s
from the Directors’ biographical details, appearing on pages 40 and 41, that the members of the Committee bring to it a wide range of experience and expertise.
The Committee met twelve times during the year under review. The Finance Director and the Head of Internal Audit normally attend meetings of the Committee, while the Chief Executive and other executive Directors attend when necessary. The external auditors attend as required and have direct access to the Committee Chairman at all times. During the year, the Committee met with the Head of Internal Audit and with the external auditors in the absence of management.
The main role and responsibilities are set out in written terms of reference and include:
monitoring the integrity of the
judgements contained therein;
reviewing the effectiveness of the
monitoring and reviewing the effectiveness of the Group’s internal auditors;
making recommendations to the Board on the appointment and removal of the external auditors and approving their remuneration and terms of engagement; and
monitoring and reviewing the external auditors’ independence, objectivity and effectiveness, taking into account professional and regulatory requirements.
These responsibilities are discharged as follows:
the Committee reviews the trading statements issued by the Company in January and July;
at a meeting in February, the Committee reviews the Company’s preliminary results announcement/Annual Report and accounts. The Committee receives reports at that meeting from the external auditors identifying any accounting or judgemental issues requiring its attention;
the Committee also meets with the external auditors to review the Annual Report on Form
the United States Securities and Exchange Commission;
in August, the Committee reviews the interim report;
the external auditors present their audit plans in advance to the Committee;
the Committee approves the annual internal audit plan;
regular reports are received from the Head of Internal Audit on reviews carried out; and
the Head of Internal Audit also reports to the Committee on other issues including, in the year under review, updates in relation to Section 404 of the
Sarbanes-Oxley Act 2002 and the arrangements in place to enable employees to raise concerns,
reporting or other matters.
As noted above, one of the duties of the Audit Committee is to make recommendations to the Board in relation to the appointment of the external auditors. A number of factors are taken into account by the Committee in assessing whether to recommend the auditors for re-appointment. These include:
the quality of reports provided to the Audit Committee and the Board, and the quality of advice given;
the level of understanding demonstrated of the Group’s business and industry; and
the objectivity of the auditors’
around the Group and their ability to co-ordinate a global audit, working to tight deadlines.
The Committee has put in place safeguards to ensure that the independence of the audit is not compromised. Such safeguards include:
the auditors are, in their professional judgement, independent from the Group;
obtaining from the external auditors an account of all relationships between the auditors and the Group;
monitoring the number of former employees of the external auditors currently employed in senior positions in the Group and assessing whether those appointments impair, or appear to impair, the auditors’ judgement or independence;
considering whether, taken as a whole, the various relationships between the Group and the external auditors impair, or appear to impair, the auditors’ judgement or independence; and
44 CRH
Corporate Governance continued
reviewing the economic importance of the Group to the external auditors and assessing whether that importance impairs, or appears to impair, the external auditors’ judgement or independence.
The Group has a policy governing the conduct of non-audit work by the auditors. Under that policy, the auditors are prohibited from performing services where the auditors:
may be required to audit their own work;
participate in activities that would normally be undertaken by management;
are remunerated through a ‘success fee’ structure, where success is dependent on the audit; or
act in an advocacy role for the Group.
Other than the above, the Group does not impose an automatic ban on the Group auditors undertaking non-audit work. The auditors are permitted to provide non-audit services that are not, or are not perceived to be, in conflict with auditor independence, providing they have the skill, competence and integrity to carry out the work and are considered by the Committee to be the most appropriate to undertake such work in the best interests of the Group. The engagement of the external auditors to provide any non-audit services must be pre-approved by the Audit Committee or entered into pursuant to pre-approval policies and procedures established by the Committee.
The Group audit engagement partner rotates every five years. Details of the amounts paid to the external auditors during the year for audit and other services are set out in note 4 to the financial statements on page 72.
The Finance Committee advises the Board on the financial requirements of the Group and on appropriate funding arrangements.
The Nomination Committee assists the Board in ensuring that the composition of the Board and its Committees is appropriate to the needs of the Group by:
assessing the skills, knowledge, experience and diversity required on the Board and the extent to which each are represented;
establishing processes for the identification of suitable candidates for appointment to the Board; and
overseeing succession planning for the Board and senior management.
To facilitate the search for suitable candidates to serve as non-executive Directors, the Committee uses the services of independent consultants.
During 2007, the Committee identified, and recommended to the Board, a suitable candidate for appointment as a non-executive Director. The Committee also reviewed succession planning at senior management level in the four operating Divisions.
The Remuneration Committee,which consists solely of non-executive Directors considered by the Board to be independent:
determines the Group’s policy on executive remuneration;
determines the remuneration of the executive Directors;
monitors the level and structure of remuneration for senior management; and
reviews and approves the design of all share incentive plans.
The Committee receives advice from leading independent firms of compensation and benefit consultants when necessary and the Chief Executive is fully consulted about remuneration proposals. The Committee oversees the preparation of the Report on Directors’ Remuneration.
In 2007, the Committee determined the salaries of the executive Directors and awards under the
performance-related incentive plans; set the remuneration of the Chairman; and reviewed the remuneration of senior management. It also approved the award of share options to the executive Directors and key management and the conditional allocation of shares under the Performance Share Plan.
A Succession Committee has been appointed to make recommendations to the Board in relation to the appointment of a new Chief Executive to succeed Mr. Liam O’Mahony, whose retirement at the end of 2008 has been announced. The members of this committee are Mr. Kieran McGowan, Mr. Nicky Hartery, Mr. Jan Maarten de Jong, Mr. David Kennedy and Mr. Terry Neill.
Corporate Social Responsibility
Corporate Social Responsibility is embedded in all CRH operations and activities. Excellence in environmental, health, safety and social performance is a daily key priority of line management. Group policies and implementation systems are summarised on pages 8 and 9 and are described in detail in the CSR Report on the Group’s website, www.crh.com. During 2007, CRH was again recognised by several key rating agencies as being among the leaders in its sector in respect of sustainability performance.
Code of Business Conduct
The CRH Code of Business Conduct is applicable to all Group employees and is supplemented by local codes throughout the Group’s operations. The Code is available on the Group’s website,www.crh.com. Regional hotline facilities are in place, to enable employees to report suspected breaches of the Code. The Board recently approved a new Code of Business Conduct, which will be rolled out to the operating companies during the course of 2008.
Communications with Shareholders
Communications with shareholders are given high priority and there is regular dialogue with institutional shareholders, as well as presentations at the time of the release of the annual and interim results. Conference calls are held following the issuance of trading statements and major announcements by the Group, which afford Directors the opportunity to hear investors’ reactions to the announcements and their views on other issues.
Trading statements are issued in January and July. Major acquisitions are notified to the Stock Exchanges in accordance with the requirements of the Listing Rules. In addition, development updates, giving details of other acquisitions completed and major capital expenditure projects, are issued in January and July each year.
During 2007, the Board received reports from management on the issues raised by investors in the course of presentations following the annual and interim results.
The Group’s website, www.crh.com, provides the full text of the Annual and Interim Reports, the Annual Report on Form 20-F, which is filed annually with the United States Securities and Exchange Commission, trading statements and copies of presentations to analysts and investors. News releases are made available in the News & Media section of the website immediately after release to the Stock Exchanges.
The Company’s Annual General Meeting affords individual shareholders the opportunity to question the Chairman and the Board. Notice of the Annual General Meeting is sent to shareholders at least 20 working days before the meeting. At the meeting, after each resolution has been dealt with, details are given of the level of proxy votes lodged, the balance for and against that

45CRH
resolution and the number of abstentions. This information is made available on the Company’s website following the meeting.
In addition, the Company responds throughout the year to numerous letters from shareholders on a wide range of issues.
Internal Control
The Directors have overall responsibility for the Group’s system of internal control and for reviewing its effectiveness. Such a system is designed to manage rather than eliminate the risk of failure to achieve business objectives and can provide only reasonable and not absolute assurance against material misstatement or loss.
The Directors confirm that the Group’s ongoing process for identifying, evaluating and managing its significant risks is in accordance with the updated Turnbull guidance (Internal Control: Revised Guidance for Directors on the Combined Code) published in October 2005. The process has been in place throughout the accounting period and up to the date of approval of the Annual Report and financial statements and is regularly reviewed by the Board.
Group management has responsibility for major strategic development and financing decisions. Responsibility for operational issues is devolved, subject to limits of authority, to product group and operating company management. Management at all levels is responsible for internal control over the respective business functions that have been delegated. This embedding of the system of internal control throughout the Group’s operations ensures that the organisation is capable of responding quickly to evolving business risks, and that significant internal control issues, should they arise, are reported promptly to appropriate levels of management.
The Board receives, on a regular basis, reports on the key risks to the business and the steps being
taken to manage such risks. It considers whether the significant risks faced by the Group are being identified, evaluated and appropriately managed, having regard to the balance of risk, cost and opportunity. In addition, the Audit Committee meets with internal auditors on a regular basis and satisfies itself as to the adequacy of the Group’s internal control system. The Audit Committee also meets with and receives reports from the external auditors. The Chairman of the Audit Committee reports to the Board on all significant issues considered by the Committee and the minutes of its meetings are circulated to all Directors.
The Directors confirm that they have conducted an annual review of the effectiveness of the system of internal control up to and including the date of approval of the financial statements. This had regard to the material risks that could affect the Group’s business (as outlined in the Directors’ Report on pages 46
and 47), the methods of managing those risks, the controls that are in place to contain them and the procedures to monitor them.
Going Concern
After making enquiries, the Directors have a reasonable expectation that the Company, and the Group as a whole, have adequate resources to continue in operational existence for the foreseeable future. For this reason, they continue to adopt the going concern basis in preparing the financial statements.
Compliance
In the period under review, CRH complied with the provisions set out in section 1 of the Combined Code. The Company also complied with the rules issued by the United States Securities and Exchange Commission to implement the Sarbanes-Oxley Act 2002, in so far as they apply to the Group.
Attendance at Board and Board Committee meetings during the year ended 31st December 2007
Board Acquisitions Audit Finance Nomination Remuneration
A B A B A B A B A B A B
D.W. Doyle *** 4 4
W.P. Egan * 8 8 2 2 3 3
U-H. Felcht **** 3 2 1 0 1 0
N. Hartery 8 7 3 3 5 5
T.W. Hill 8 8
J.M. de Jong 8 8 12 10
D.M. Kennedy 8 8 5 5 3 3 5 5
M. Lee 8 8 3 2 5 5
K. McGowan 8 8 3 3 5 5 3 3 2 2 3 3
P.J. Molloy ** 2 2 2 2 2 2 1 1
T.V. Neill 8 8 1 1 7 7 1 1 2 2
D.N. O’Connor 8 8 3 2 12 12
J.M.C. O’Connor 8 8 12 10
W.I. O’Mahony 8 8 3 3 5 5 3 3
* Appointed 1st January 2007** Retired 9th May 2007*** Retired 30th June 2007**** Appointed 25th July 2007
Column A - indicates the number of meetings held during the period the Director was a member of the Board and/or Committee.
Column B - indicates the number of meetings attended during the period the Director was a member of the Board and/or Committee.
46 CRH
Directors’ Report
The Directors submit their Report and Financial Statements for the year ended 31st December 2007.
Accounts and Dividends
Sales revenue at €20,992 million
before tax amounted to €1,904 million, an increase of €302 million (19%) on the previous year. After
million (2006: €1,224 million). Basic earnings per share amounted to 262.7c compared with 224.3c in the previous year, an increase of 17%.
An interim dividend of 20.0c (2006: 13.5c) per share was paid in November 2007. It is proposed
per share on 12th May 2008 to shareholders registered at close of business on 18th March 2008. The total dividend of 68c compares with a dividend of 52c for 2006, an increase of 31%. Shareholders will have the option of receiving new shares in lieu of cash dividends.
Other net expense recognised directly within equity in the year amounted to €317 million (2006: €233 million).
indicators are set out in the Finance Review on pages 35 to 39. The
ended 31st December 2007 are set out in detail on pages 58 to 115.
Books and Records
The Directors are responsible for ensuring that proper books and accounting records, as outlined in Section 202 of the Companies Act, 1990, are kept by the Company. The Directors have appointed appropriate accounting personnel,
Finance Director, in order to ensure that those requirements are met.
The books and accounting records of the Company are maintained at the principal
Castle, Clondalkin, Dublin 22.
Business Review
Full year acquisition spend for 2007 was a record €2.2 billion, compared with €2.1 billion (net) in 2006, and
€1.3 billion and €1 billion for 2005 and 2004 respectively. The nature and extent of these investments will make an important contribution to delivering further growth for the Group in the years ahead. First half expenditure of €1 billion comprised the acquisition of Swiss builders merchant Gétaz Romang completed in May; the purchase of a 50% stake in Denizli Cement in Turkey and the buyout of the remaining 50% of Paver Systems in the United States announced in April; the acquisition of Harbin Sanling Cement in China announced in February plus 31 other initiatives announced in the July Development Strategy Update. Second half spending of €1.2 billion included the August buyout of the remaining 55% of Cementbouw bv in the Netherlands; completion of four separate transactions by the Americas Materials Division as announced in September; the purchase of certain Cemex assets in Florida and Arizona announced
of traditional CRH development opportunities outlined in the Development Strategy Update released in January 2008.
CRH’s Materials Divisions in both Europe and the Americas achieved
2007, with strong organic growth
acquisitions. While the Products & Distribution Division in Europe also reported good organic and
of the Products & Distribution Division in the Americas were affected by the sharp decline in new residential construction in the United States. Comprehensive reviews of
operating performance of the Group during 2007 are set out in the Chief Executive’s Review on pages 15 to 18, the separate Operations Reviews for each of the Divisions on pages 19 to 34 and the Finance Review on pages 35 to 39 (including Key Financial Performance Indicators on page 37). The treasury policy and objectives of the Group are set out in
The Group is fully committed to operating ethically and responsibly in all aspects of its
business relating to employees, customers, neighbours and other stakeholders. The Corporate Social Responsibility (CSR) report available on the Group’s website at www.crh.com sets out CRH’s policies and performance relating to the Environment, Health & Safety and Social & Community matters.
Outlook 2008
CRH’s geographic, sectoral and product balance continued to deliver in 2007 both in terms of overall trading performance and development activity. While developments over recent months have added to economic uncertainties, CRH is well positioned across its operations to deal with the evolving market circumstances. Following record levels of acquisition activity in 2006 and 2007, and with an ongoing strong pipeline of opportunities, we are continuing to develop our Western European and North American businesses while building on our growing platforms in emerging markets. With a relentless
and targeted cost reduction measures, we remain focused on our twin goals - performance and growth - and on delivering a
and earnings growth in 2008.
Principal Risks and Uncertainties
Under Irish Company law (Regulation 37 of the European Communities (Companies: Group Accounts) Regulations 1992, as amended), the Group is required to give a description of the principal risks and uncertainties which it faces. These principal risks are set out below.
CRH operates in cyclical industries which are affected by factors beyond Group control such as the level of construction activity, fuel and raw material prices, which are in turn affected by the performance of national economies, the implementation of economic policies by sovereign governments and political developments.
The onset of a cycle of reduced economic growth in the countries in which CRH has
implementation of unfavourable governmental policies could adversely affect Group revenues and operating margins.
CRH pursues a strategy of growth through acquisitions. CRH may not be able to continue to grow as contemplated in its business plan if it is unable to identify attractive targets, complete the acquisition transactions and integrate the operations of the acquired businesses.
CRH faces strong competition in its various markets, and if CRH fails to compete successfully, market share will decline.
Existing products may be replaced by substitute products which CRH does not produce and, as a result, CRH may lose market share in the markets for these products.
Severe weather can reduce construction activity and lead to a decrease in demand for Group products in areas affected by adverse weather conditions.
CRH is subject to stringent and evolving environmental and health and safety laws, regulations and standards which could result in costs related to compliance and remediation efforts that may adversely affect Group results of
CRH may be adversely affected by governmental regulations.
Many of CRH’s subsidiaries operate in currencies other than the euro, and adverse changes in foreign exchange rates relative to the euro could adversely affect Group reported
The Group has long experience of coping with these risks while delivering superior performance and strong Total Shareholder Return.
Board of Directors
Mr. P.J. Molloy retired from the Board on 9th May 2007. Mr. D.W. Doyle retired from the Board on 30th June 2007.
Mr. N. Hartery, Mr. T.W. Hill, Mr. K. McGowan and Ms. J.M.C. O’Connor retire from the Board
47CRH
by rotation and, being eligible, offer themselves for re-election.
Mr. U-H. Felcht was appointed to the Board on 25th July 2007. In accordance with the provisions of Article 109, he retires and, being eligible, offers himself for re-election.
Mr. D.M. Kennedy will retire from the Board at the Annual General Meeting on 7th May 2008.
Disapplication of Pre-emption Rights
A special resolution will be proposed at the Annual General Meeting to renew the Directors’ authority to disapply statutory pre-emption rights in relation to allotments of shares for cash. In respect of allotments other than for rights issues to ordinary shareholders and employees’ share schemes, the authority is limited to Ordinary/Income Shares (excluding Treasury Shares) having a nominal value of €9,195,000, representing 5% approximately of the issued Ordinary/Income share capital at 3rd March 2008. This authority will expire on the earlier of the date of the Annual General Meeting in 2009 or 6th August 2009.
Purchase of Own Shares
At the Annual General Meeting held on 9th May 2007, authority was granted to purchase up to 54,348,665 of the Company’s Ordinary/Income Shares. On 3rd January 2008, the Company announced the introduction of a share repurchase programme of up to 5% of the 547,227,194 shares then in issue and the intention to hold the repurchased shares as Treasury Shares. In the period to 3rd March 2008, 6,422,583 Ordinary/Income Shares were purchased and 88,584 Treasury Shares were re-issued under the Group’s Share Schemes. As at 3rd March 2008, 547,227,194 Ordinary/Income Shares were in issue, of which 6,333,999 (1.16%) were held as Treasury Shares.
Special resolutions will be proposed at the Annual General Meeting to renew the authority of the Company, or any of its subsidiaries, to purchase up to 10% of the Company’s Ordinary/Income Shares in issue
at the date of the Annual General Meeting and in relation to the maximum and minimum prices at which Treasury Shares (effectively shares purchased and not cancelled) may be re-issued off-market by the Company. If granted, the authorities will expire on the earlier of the date of the Annual General Meeting in 2009 or 6th August 2009.
The minimum price which may be paid for shares purchased by the Company shall not be less than the nominal value of the shares and the maximum price will be 105% of the average market price of such shares over the preceding
a total of 24,475,051 Ordinary/Income Shares are outstanding, representing 4.47% of the issued Ordinary/Income share capital. If the authority to purchase Ordinary/Income Shares was used in full, the options would represent 4.97%.
The Directors will only exercise the power to purchase shares if they consider it to be in the best interests of the Company and its shareholders.
Memorandum and Articles of Association
Resolutions 8 and 9 to be proposed at the Annual General Meeting seek shareholders’ approval for certain changes to the Memorandum and Articles of Association.
Memorandum of AssociationClause 4 (21) of the Memorandum of Association deals with the Company’s powers to lend money and to provide guarantees and indemnities and the current clause has been in place since 1975. The proposed replacement clause, set out in Resolution 8, is more suited to the current structure and needs of the Group.
Articles of AssociationParagraph (i) of Resolution 9
in the Articles of Association, in line with current practice.
Article 12 deals with the Company’s power to pay commissions in connection with subscriptions for shares. It is necessary to amend this Article to take account of a change in Irish company law.
Article 89 deals with the Directors’ powers to borrow and secure indebtedness and places limits on these powers based on the consolidated audited balance sheet of the Company. It is proposed to amend this Article in respect of the calculation of the borrowing limits
take account of the Company’s purchase of its own shares.
Article 127 provides for the use of electronic communication between the Company and its shareholders. The revised Article, set out in paragraph (iv) of Resolution 9,
Corporate Governance
Statements by the Directors in relation to the Company’s appliance of corporate governance principles, compliance with the provisions of the Combined Code on Corporate Governance (June 2006), the Group’s system of internal controls and the adoption of the going concern basis in the preparation
set out on pages 42 to 45.
The Report on Directors’ Remuneration is set out on pages 48 to 55.
Details of the Company’s capital structure and of employee share schemes can be found in note
pages 105 to 106. Details regarding the appointment and replacement of Directors can be found in the section on Corporate Governance.
Subsidiary, Joint Venture and Associated Undertakings
The Group has over 1,100 subsidiary, joint venture and associated undertakings. The principal ones as at 31st December 2007 are listed on pages 120 to 125.
Auditors
The Auditors, Ernst & Young, Chartered Accountants, are willing
remuneration will be submitted to the Annual General Meeting.
Annual General Meeting
Your attention is drawn to the Notice of Meeting set out on pages 131 and 132.
Your Directors believe that the Resolutions to be proposed at the Meeting are in the best interests of the Company and its shareholders as a whole and, therefore, recommend you to vote in favour of the Resolutions. Your Directors intend to vote in favour of the Resolutions in respect of their
Shares, amounting in total, on 3rd March 2008, to 1,273,755 Ordinary Shares, representing approximately 0.23% of the issued Ordinary share capital of your Company.
On behalf of the Board,K. McGowan, W.I. O’Mahony, Directors3rd March 2008
Substantial Holdings
As at 3rd March 2008, the Company had received notification of the following interests in its Ordinary share capital:
Name Holding %
Bank of Ireland Asset Management Limited. 27,013,024 4.99
Capital Group International, Inc. 19,489,063 3.60
Capital Research and Management Company 22,939,982 4.24
FMR LLC and Fidelity International Limitedand their direct subsidiaries 16,806,463 3.10
UBS AG 26,380,604 4.87
Bank of Ireland Asset Management Limited, Capital Group International, Inc. and Capital Research and Management Company have stated that these shares are not beneficially owned by them.

48 CRH
Report on Directors’ Remuneration
The Remuneration Committee
The Remuneration Committeeof the Board consists of non-executive Directors of the Company. The terms of reference for the Remuneration Committee are to determine the Group’s policy on executive remuneration and to consider and approve salaries and other terms of the remuneration packages for the executive Directors. The Committee receives advice from leading independent firms of compensation and benefit consultants when necessary and the Chief Executive attends meetings except when his own remuneration is being discussed. Membership of the Remuneration Committee is set out on page 40.
Remuneration Policy
CRH is an international group of companies, with activities in 32 countries. Our policy on Directors’ remuneration is designed to attract and retain Directors of the highest calibre who can bring their experience and independent views to the policy, strategic decisions and governance of CRH.
In setting remuneration levels, the Remuneration Committeetakes into consideration the remuneration practices of other international companies of similar size and scope. Executive Directors must be properly rewarded and motivated to perform in the best interest of the shareholders. The spread of the Group’s operations requires that the remuneration packages in place in each geographical area are appropriate and competitive for that area.
Performance-related rewards, based on measured targets, are a key component of remuneration. CRH’s strategy of fostering entrepreneurship in its regional companies requires well-designed incentive plans that reward the creation of shareholder value through organic and acquisitive growth. The typical elements of the remuneration package for executive Directors are basic salary and benefits, a performance-related incentive plan, a contributory pension scheme and
participation in the share option plan. It is policy to grant options to key management to encourage identification with shareholders’ interests and to create a community of interest among different regions and nationalities.
The Group also operates share participation plans and savings-related share option schemes for eligible employees in all regions where the regulations permit the operation of such plans. In total there are approximately 6,700 employees of all categories who are shareholders in the Group.
Executive Directors’ Remuneration
Basic salary and benefitsThe basic salaries of executive Directors are reviewed annually having regard to personal performance, company performance, step changes in responsibilities and competitive market practice in the area of operation. Employment-related benefits relate principally to the use of company cars and medical/life assurance. No fees are payable to executive Directors.
Performance-related incentive planThe performance-related incentive plan is totally based on achieving clearly defined and stretch annual profit targets and strategic goals with an approximate weighting of 80% for profits and 20% for personal and strategic goals. At target performance payout is 80% of basic salary for Europe-based participants and 90% of basic salary for US-based participants. A maximum payout of 1.5 times these levels is payable for a level of performance well in excess of target.
The three components of the plan are:
(i) Individual performance
(ii) Earnings per share growth targets
(iii) Return on net assets targets
Up to one-third of the earned bonus in each year is receivable in CRH shares and deferred for a period
of three years, with forfeiture in the event of departure from the Group in certain circumstances during that time period.
In addition, the Chief Executive has a special long-term incentive plan incorporating targets set for the four-year period 2005-2008. The plan incorporates challenging goals in respect of Total Shareholder Return by comparison with a peer group, growth in earnings per share and the strategic development of the Group, with a total maximum earnings potential of 40% of aggregate basic salary. While accruals are made on an annual basis, there is no commitment to any payment until the end of the period. Details of the manner in which earnings are provided for under the plan are set out in note 2 to the table of Directors’ remuneration on page 50.
Performance Share Plan/Share Option SchemeLong-term incentive plans involving conditional awards of shares are now a common part of executive remuneration packages, motivating high performance and aligning the interests of executives and shareholders. The Performance Share Plan approved by shareholders in May 2006 is tied to Total Shareholder Return (TSR). Half of the award is assessed against TSR for a group of global building materials companies and the other half against TSR for the constituents of the Eurofirst 300 Index. An earnings per share growth underpin of the Irish Consumer Price Index plus 5% per annum is also applied.
The maximum award under the Performance Share Plan is 150% of basic salary per annum in the form of conditional shares and the vesting period is three years. The awards lapse if over the three-year period CRH’s TSR is below the median of the peer group/index; 30% of the award vests if CRH’s performance is equal to the median while 100% vests if CRH’s performance is equal to or greater than the 75th percentile; for TSR performance between the 50th and the 75th percentiles, between 30% and 100% of the
award vests on a straight-line basis. Participants in the Plan are not entitled to any dividends (or other distributions made) and have no right to vote in respect of the shares subject to the award, until such time as the shares vest. Details of awards to Directors under the Plan are provided on page 53.
Under the terms of the share option scheme approved by shareholders in May 2000, two tiers of options have been available subject to different performance conditions as set out below:
(i) Exercisable only when earnings per share (EPS) growth exceeds the growth of the Irish Consumer Price Index by 5% compounded over a period of at least three years subsequent to the granting of the options (Basic Tier).
(ii) Exercisable, if over a period of at least five years subsequent to the granting of the options, the growth in EPS exceeds the growth of the Irish Consumer Price Index by 10% compounded and places the Company in the top 25% of EPS performance of a peer group of international building materials and other manufacturing companies. If below the 75th percentile, these options are not exercisable (Second Tier).
With the introduction of the Performance Share Plan, the Remuneration Committee decided that no further Second Tier share options should be granted under the existing share option scheme; however, Basic Tier options continue to be issued. Subject to satisfactory performance, options are expected to be awarded annually, ensuring a smooth progression over the life of the share option scheme. Grants of share options are at the market price of the Company’s shares at the time of grant, and are made after the final results announcement ensuring transparency.

49CRH
The percentage of share capital which can be issued under the Performance Share Plan and share option schemes, and individual share option grant limits, comply with institutional guidelines.
Non-executive Directors’ Remuneration
The remuneration of non-executive Directors, including that of the Chairman, is determined by the Board of Directors as a whole. The fees paid to the Chairman and non-executive Directors are set at a level which will attract individuals with the necessary experience and ability to make a substantial contribution to the Company’s affairs and reflect the time and travel demands of their Board duties. They do not participate in any of the Company’s performance-related incentive plans or share schemes.
Pensions
The Irish-based executive Directors participate in a contributory defined benefit plan which is based on an accrual rate of 1/60th of pensionable salary for each year of pensionable service and is designed to provide two-thirds of salary at retirement for full service. There is provision for Mr. Lee to retire at 60 years of age. Mr. O’Mahony’s pension is fully funded, under arrangements which provided for his retirement on two-thirds salary at completion of five years in the role of Chief Executive at end 2004.
The Finance Act 2006 established a cap on pension provision by introducing a penalty tax charge on pension assets in excess of the higher of €5 million or the value of individual accrued pension entitlements as at 7th December 2005. As a result of these legislative changes, the Remuneration Committee has decided that Irish-based executive Directors should have the option of continuing to accrue pension benefits as previously, or of choosing an alternative arrangement – by accepting pension benefits limited by the cap – with a similar overall cost to Group. The Irish-based executive Directors chose to opt for the alternative arrangement
which involves capping their pensions in line with the provisions of the Finance Act and receiving a supplementary taxable non-pensionable cash allowance in lieu of pension benefits foregone. These allowances are similar in value to the reduction in the Company’s liability represented by the pension benefits foregone. They are calculated based on actuarial advice as the equivalent of the reduction in the Company’s liability to each individual and spread over the term to retirement as annual compensation allowances. The allowances for 2007 are detailed in note (ii) on page 51.
Mr. Hill participates in a defined contribution retirement plan in respect of basic salary; in addition he participates in an unfunded defined contribution Supplemental Executive Retirement Plan (SERP) also in respect of basic salary, to which contributions are made at an agreed rate, offset by contributions made to the other retirement plan.
Since 1991, it has been your Board’s policy that non-executive Directors do not receive pensions. A defined benefit scheme was in operation prior to 1991 in which one current non-executive Director still participates.
Directors’ Service Contracts
No executive Director has a service contract extending beyond twelve months.
Directors’ Remuneration and Interests in Share Capital
Details of Directors’ remuneration charged against profit in the year are given on page 50. Details of individual remuneration and pension benefits for the year ended 31st December 2007 are given on page 51. Directors’ share options and shareholdings are shown on page 53 and page 55 respectively.

50 CRH
Report on Directors’ Remuneration continued
Directors’ Remuneration
2007 2006Notes €000 €000 Executive Directors Basic salary 2,975 3,306 Performance-related incentive plan - cash element 2,414 2,669 - deferred shares element 785 905
399 497 Other remuneration - 43
96 104
1 6,669 7,5242 Provision for Chief Executive long-term incentive plan 536 496
Total executive Directors’ remuneration 7,205 8,020
Average number of executive Directors 3.50 4.32
Non-executive Directors Fees 571 455 Other remuneration 644 501
1 Total non-executive Directors’ remuneration 1,215 956
Average number of non-executive Directors 8.78 7.85
3 Payments to former Directors 98 95
Total Directors’ remuneration 8,518 9,071
Notes to Directors’ remuneration
1 See analysis of 2007 remuneration by individual on page 51.
2 As set out on page 48, the Chief Executive has a special long-term incentive plan tied to the achievement of exceptional growth and key strategic goals for the four-year period 2005 to 2008 with a total maximum earnings potential of 40% of aggregate basic salary. While accruals are made on an annual basis, there is no commitment to any payment until the end of the four-year period.
3 Consulting and other fees paid to a number of former directors.

51CRH
Individual remuneration for the year ended 31st December 2007
Incentive Plan Retirement
and fees element shares expense Remuneration Total(i) (i) (ii) (iii) (iv) 2007 2006
€000 €000 €000 €000 €000 €000 €000 €000Executive DirectorsD. W. Doyle (v) 305 366 - 53 - 12 736 1,344T.W. Hill 730 583 182 146 - 33 1,674 1,825M. Lee 600 453 187 200 - 25 1,465 1,411W. I. O’Mahony (vi) 1,340 1,012 416 - - 26 2,794 2,656J.L. Wittstock (vii) - - - - - - - 288
2,975 2,414 785 399 - 96 6,669 7,524
Non-executive DirectorsW.P. Egan (viii) 65 - - - 50 - 115 -U-H. Felcht (ix) 28 - - - 15 - 43 -N. Hartery 65 - - - 20 - 85 75J.M. de Jong 65 - - - 56 - 121 75D. M. Kennedy 65 - - - 62 - 127 103K. McGowan (x) 65 - - - 250 - 315 104P. J. Molloy (x) 23 - - - 131 - 154 375T. V. Neill 65 - - - 20 - 85 75A. O’Brien (xi) - - - - - - - 36D.N. O’Connor (xii) 65 - - - 20 - 85 38J.M.C. O’Connor 65 - - - 20 - 85 75
571 - - - 644 - 1,215 956
(i) Performance-related Incentive Plan Under the executive Directors’ incentive plan for 2007, a bonus is payable for meeting clearly defined and stretch profit targets and strategic goals. The structure of the 2007 incentive plan is set out on pages 48 and 49 and includes a cash element paid out when earned and an element receivable in CRH shares deferred for a period of three years, with forfeiture in the event of departure from the Group in certain circumstances during that time period.
(ii) The Irish Finance Act 2006 established a cap on pension provision by introducing a penalty tax charge on pension assets in excess of the higher of €5 million or the value of individual prospective pension entitlements as at 7th December 2005. As a result of these legislative changes,
executive Directors chose to opt for the alternative arrangement which involves capping their pensions in line with the provisions of the Finance Act and receiving
Company’s liability to each individual and spread over the term to retirement as annual compensation allowances. For 2007 the compensation allowances
(iii) Other Remuneration Executive Director: Expatriate and housing allowance for Mr. J.L. Wittstock in 2006. Non-executive Directors: Includes remuneration for Chairman and for Board Committee work.
(iv) These relate principally to the use of company cars and medical/life assurance.
(v) Mr. D.W. Doyle retired on 30th June 2007.
(vii) Mr. J.L. Wittstock resigned on 26th April 2006.
(viii) Mr. W.P. Egan became a Director on 1st January 2007.
(ix) Professor U-H. Felcht became a Director on 25th July 2007.
(x) Mr. K. McGowan became Chairman on 9th May 2007 succeeding Mr. P.J. Molloy who retired as a non-executive Director on the same date.
(xi) Mr. A. O’Brien retired on 3rd May 2006.
(xii) Mr. D.N. O’Connor became a Director on 28th June 2006.
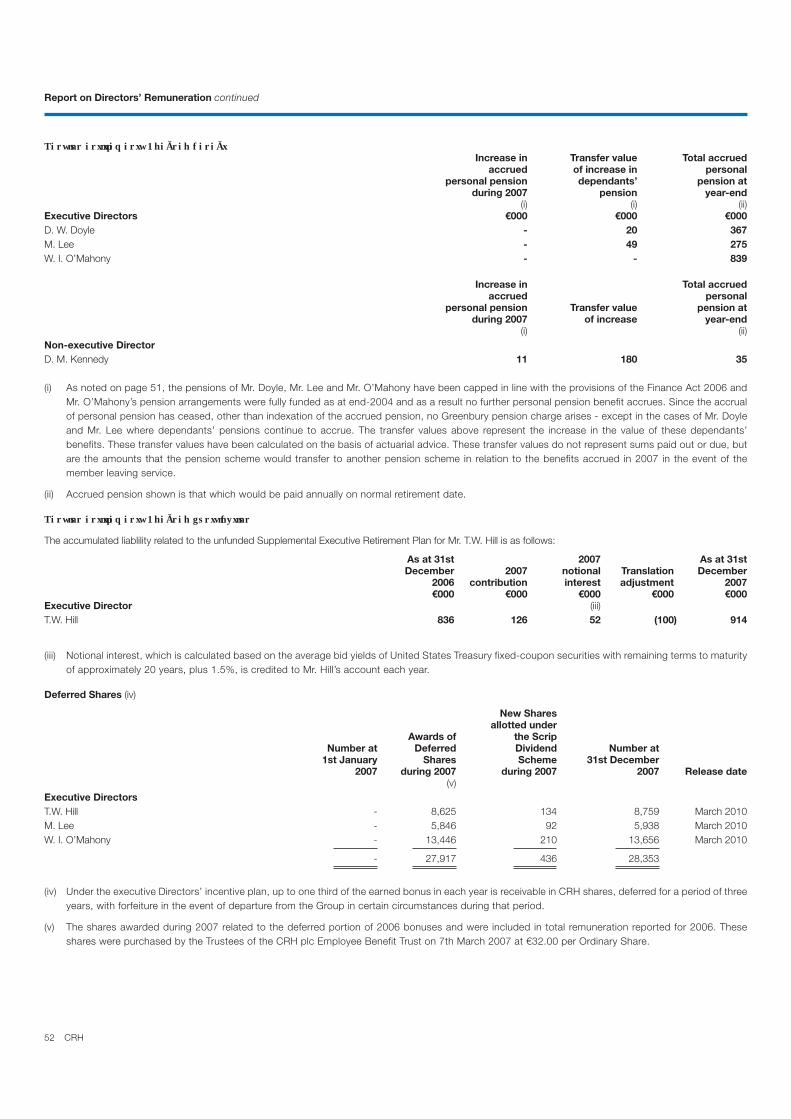
52 CRH
Report on Directors’ Remuneration continued
Increase in Transfer value Total accruedaccrued of increase in personal
personal pension dependants’ pension atduring 2007 pension year-end
(i) (i) (ii)Executive Directors €000 €000 €000D. W. Doyle - 20 367M. Lee - 49 275W. I. O’Mahony - - 839
Increase in Total accruedaccrued personal
personal pension Transfer value pension atduring 2007 of increase year-end
(i) (ii)Non-executive DirectorD. M. Kennedy 11 180 35
(i) As noted on page 51, the pensions of Mr. Doyle, Mr. Lee and Mr. O’Mahony have been capped in line with the provisions of the Finance Act 2006 and Mr. O’Mahony’s pension arrangements were fully funded as at end-2004 and as a result no further personal pension benefit accrues. Since the accrual of personal pension has ceased, other than indexation of the accrued pension, no Greenbury pension charge arises - except in the cases of Mr. Doyle and Mr. Lee where dependants’ pensions continue to accrue. The transfer values above represent the increase in the value of these dependants’ benefits. These transfer values have been calculated on the basis of actuarial advice. These transfer values do not represent sums paid out or due, but are the amounts that the pension scheme would transfer to another pension scheme in relation to the benefits accrued in 2007 in the event of the member leaving service.
(ii) Accrued pension shown is that which would be paid annually on normal retirement date.
The accumulated liablility related to the unfunded Supplemental Executive Retirement Plan for Mr. T.W. Hill is as follows:
As at 31st 2007 As at 31stDecember 2007 notional Translation December
2006 contribution interest adjustment 2007€000 €000 €000 €000 €000
Executive Director (iii)T.W. Hill 836 126 52 (100) 914
(iii) Notional interest, which is calculated based on the average bid yields of United States Treasury fixed-coupon securities with remaining terms to maturity of approximately 20 years, plus 1.5%, is credited to Mr. Hill’s account each year.
Deferred Shares (iv)
New Sharesallotted under
Awards of the ScripNumber at Deferred Dividend Number at
1st January Shares Scheme 31st December2007 during 2007 during 2007 2007 Release date
(v)Executive DirectorsT.W. Hill - 8,625 134 8,759 March 2010M. Lee - 5,846 92 5,938 March 2010W. I. O’Mahony - 13,446 210 13,656 March 2010
- 27,917 436 28,353
(iv) Under the executive Directors’ incentive plan, up to one third of the earned bonus in each year is receivable in CRH shares, deferred for a period of three years, with forfeiture in the event of departure from the Group in certain circumstances during that period.
(v) The shares awarded during 2007 related to the deferred portion of 2006 bonuses and were included in total remuneration reported for 2006. These shares were purchased by the Trustees of the CRH plc Employee Benefit Trust on 7th March 2007 at €32.00 per Ordinary Share.

53CRH
Directors’ awards under the Performance Share Plan (i)
31st 31st MarketDecember Granted in December Performance Release Price in euro
2006 2007 2007 Period Date on awardD.W. Doyle - - - - - -
T.W. Hill 30,000 - 30,000 01/01/06 - 31/12/08 March 2009 24.82 (ii)- 25,000 25,000 01/01/07 - 31/12/09 March 2010 33.55 (ii)
M. Lee 20,000 - 20,000 01/01/06 - 31/12/08 March 2009 24.82 (ii)- 18,000 18,000 01/01/07 - 31/12/09 March 2010 33.55 (ii)
W.I. O’Mahony 60,000 - 60,000 01/01/06 - 31/12/08 March 2009 24.82 (ii)
(i) This is a long term share incentive plan under which share awards are granted in the form of a provisional allocation of shares for which no exercise price is payable. The shares are scheduled for release in March 2009 and March 2010 to the extent that the relative TSR performance conditions are achieved. The structure of the Performance Share Plan is set out on pages 48 and 49.
(ii) The Trustees of the CRH plc Employee Benefit Trust purchased Ordinary Shares at €24.82 per share on 21st June 2006 in respect of the 2006 award, and at €33.55 per share on 11th April 2007 in respect of part of the 2007 award. No dividends are payable on these shares until such time as they are released to plan participants.
Directors’ interestsThe Company’s Register of Directors’ Interests contains full details of Directors’ shareholdings and options to subscribe for shares.
Directors’ share optionsDetails of movements on outstanding options and those exercised during the year are set out in the table below:
Options exercised during 2007
Weighted average Weighted Weighted option price at average average market
31st December Granted Exercised 31st December 31st December exercise price at date 2006 in 2007 in 2007 2007 2007 price of exercise
€ € € D.W. Doyle 61,476 - - 61,476 (a) 15.48
46,108 - - 46,108 (b) 15.66 185,000 - - 185,000 (c) 15.90 56,000 - - 56,000 (d) 19.28
T.W. Hill 82,335 - - 82,335 (b) 18.01 170,000 70,000 50,000 190,000 (c) 26.77 19.68 32.18 195,000 - - 195,000 (d) 17.07
M. Lee 40,454 - 40,454 - (a) - 17.26 34.13 13,228 - - 13,228 (b) 17.26
195,000 30,000 50,000 175,000 (c) 22.11 18.98 34.13125,000 - - 125,000 (d) 16.48
1,211 - 1,211 - (e) - 16.09 36.46 W.I. O’Mahony 203,093 - 27,445 175,648 (a) 15.97 7.10 31.95
241,516 - 54,890 186,626 (b) 14.83 7.10 31.95 520,000 - - 520,000 (c) 20.30 250,000 - - 250,000 (d) 18.84
2,385,421 100,000 224,000 2,261,421
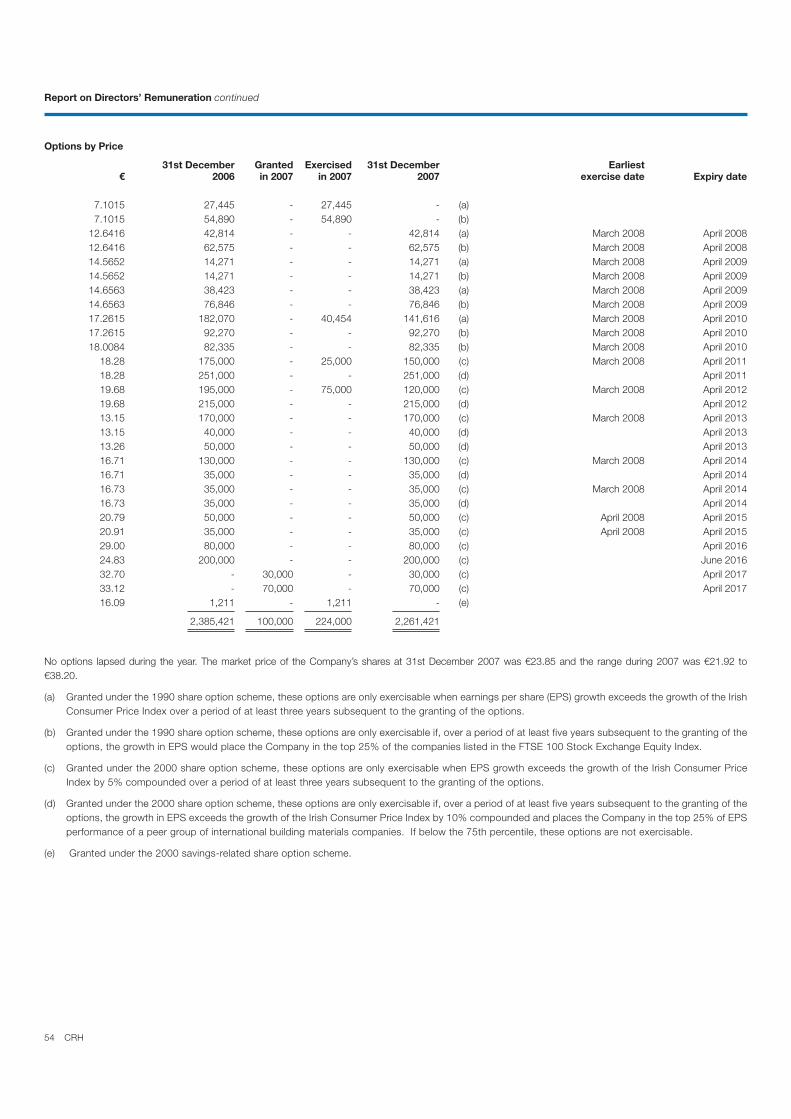
54 CRH
Report on Directors’ Remuneration continued
Options by Price
31st December Granted Exercised 31st December Earliest€ 2006 in 2007 in 2007 2007 exercise date Expiry date
7.1015 27,445 - 27,445 - (a)7.1015 54,890 - 54,890 - (b)
12.6416 42,814 - - 42,814 (a) March 2008 April 2008 12.6416 62,575 - - 62,575 (b) March 2008 April 2008 14.5652 14,271 - - 14,271 (a) March 2008 April 2009 14.5652 14,271 - - 14,271 (b) March 2008 April 2009 14.6563 38,423 - - 38,423 (a) March 2008 April 2009 14.6563 76,846 - - 76,846 (b) March 2008 April 2009 17.2615 182,070 - 40,454 141,616 (a) March 2008 April 2010 17.2615 92,270 - - 92,270 (b) March 2008 April 2010 18.0084 82,335 - - 82,335 (b) March 2008 April 2010
18.28 175,000 - 25,000 150,000 (c) March 2008 April 2011 18.28 251,000 - - 251,000 (d) April 2011 19.68 195,000 - 75,000 120,000 (c) March 2008 April 201219.68 215,000 - - 215,000 (d) April 2012 13.15 170,000 - - 170,000 (c) March 2008 April 2013 13.15 40,000 - - 40,000 (d) April 2013 13.26 50,000 - - 50,000 (d) April 2013 16.71 130,000 - - 130,000 (c) March 2008 April 2014 16.71 35,000 - - 35,000 (d) April 2014 16.73 35,000 - - 35,000 (c) March 2008 April 2014 16.73 35,000 - - 35,000 (d) April 2014 20.79 50,000 - - 50,000 (c) April 2008 April 2015 20.91 35,000 - - 35,000 (c) April 2008 April 2015 29.00 80,000 - - 80,000 (c) April 2016 24.83 200,000 - - 200,000 (c) June 2016 32.70 - 30,000 - 30,000 (c) April 2017 33.12 - 70,000 - 70,000 (c) April 201716.09 1,211 - 1,211 - (e)
2,385,421 100,000 224,000 2,261,421
No options lapsed during the year. The market price of the Company’s shares at 31st December 2007 was €23.85 and the range during 2007 was €21.92 to €38.20.
(a) Granted under the 1990 share option scheme, these options are only exercisable when earnings per share (EPS) growth exceeds the growth of the Irish Consumer Price Index over a period of at least three years subsequent to the granting of the options.
(b) Granted under the 1990 share option scheme, these options are only exercisable if, over a period of at least five years subsequent to the granting of the options, the growth in EPS would place the Company in the top 25% of the companies listed in the FTSE 100 Stock Exchange Equity Index.
(c) Granted under the 2000 share option scheme, these options are only exercisable when EPS growth exceeds the growth of the Irish Consumer Price Index by 5% compounded over a period of at least three years subsequent to the granting of the options.
(d) Granted under the 2000 share option scheme, these options are only exercisable if, over a period of at least five years subsequent to the granting of the options, the growth in EPS exceeds the growth of the Irish Consumer Price Index by 10% compounded and places the Company in the top 25% of EPS performance of a peer group of international building materials companies. If below the 75th percentile, these options are not exercisable.
(e) Granted under the 2000 savings-related share option scheme.
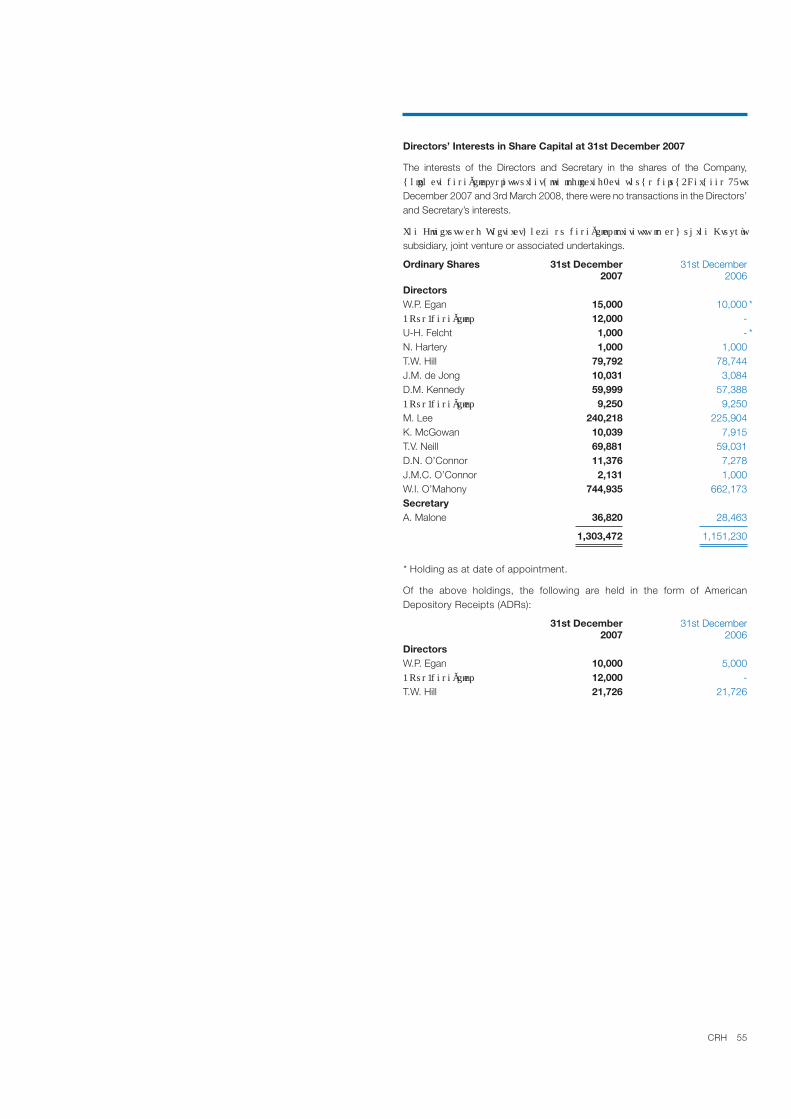
55CRH
Directors’ Interests in Share Capital at 31st December 2007
The interests of the Directors and Secretary in the shares of the Company,
December 2007 and 3rd March 2008, there were no transactions in the Directors’ and Secretary’s interests.
subsidiary, joint venture or associated undertakings.
Ordinary Shares 31st December 31st December2007 2006
DirectorsW.P. Egan 15,000 10,000 *
12,000 -U-H. Felcht 1,000 - *N. Hartery 1,000 1,000T.W. Hill 79,792 78,744J.M. de Jong 10,031 3,084D.M. Kennedy 59,999 57,388
9,250 9,250M. Lee 240,218 225,904K. McGowan 10,039 7,915T.V. Neill 69,881 59,031D.N. O’Connor 11,376 7,278J.M.C. O’Connor 2,131 1,000W.I. O’Mahony 744,935 662,173SecretaryA. Malone 36,820 28,463
1,303,472 1,151,230
* Holding as at date of appointment.
Of the above holdings, the following are held in the form of American Depository Receipts (ADRs):
31st December 31st December2007 2006
DirectorsW.P. Egan 10,000 5,000
12,000 -T.W. Hill 21,726 21,726

56 CRH
Company law in the Republic of Ireland requires the Directors to prepare financial statements for each financial year which give a true and fair view of the state of affairs of the Parent Company and of the Group and of the profit or loss of the Group for that period.
select suitable accounting policies and then apply them consistently;
make judgements and estimates that are reasonable and prudent;
comply with applicable International Financial Reporting Standards as adopted by the European Union, subject to any material departures disclosed and explained in the financial statements; and
prepare the financial statements on the going concern basis unless it is inappropriate to presume that the Group will continue in business.
The considerations set out above for the Group are also required to be addressed by the Directors in preparing the financial statements of the Parent Company (which are set out on pages 113 to 115), in respect of which the applicable accounting standards are those which are generally accepted in the Republic of Ireland.
The Directors have elected to prepare the Parent Company’s financial statements in accordance with generally accepted accounting practice in Ireland (Irish GAAP) comprising the financial reporting standards issued by the Accounting Standards Board and published by the Institute of Chartered Accountants in Ireland, together with the Companies Acts, 1963 to 2006.
The Directors are responsible for keeping proper books of account which disclose with reasonable accuracy at any time the financial position of the Parent Company and which enable them to ensure that the financial statements of the Group are prepared in accordance with applicable International Financial Reporting Standards as adopted by the European Union and comply with the provisions of the Companies Acts, 1963 to 2006, and Article 4 of the IAS Regulation. They are also responsible for safeguarding the assets of the Group and hence for taking reasonable steps for the prevention and detection of fraud and other irregularities.
Statement of Directors’ Responsibilities
57CRH
December 2007 which comprise the Group Income Statement, the Group Statement of Recognised Income and Expense, the Group and Company Balance Sheets, the Group Cash Flow Statement, the related notes 1 to 35
have been prepared under the accounting policies set out therein.
This Report is made solely to the Company’s members, as a body, in accordance with section 193 of the Companies Act, 1990. Our audit work has been undertaken so that we might state to the Company’s members those matters we are required to state to them in an auditors’ report and for no other purpose. To the fullest extent permitted by law, we do not accept or assume responsibility to anyone other than the Company and the Company’s members as a body, for our audit work, for this Report, or for the opinions we have formed.
Respective responsibilities of Directors and Auditors
statements in accordance with applicable Irish law and International Financial Reporting Standards (IFRSs) as adopted by the European Union, and for
applicable Irish law and Accounting Standards issued by the Accounting Standards Board and promulgated by the Institute of Chartered Accountants in Ireland (“Generally Accepted Accounting Practice in Ireland”) as set out in the Statement of Directors’ Responsibilities.
relevant legal and regulatory requirements and International Standards on Auditing (UK and Ireland).
a true and fair view and have been properly prepared in accordance with the Companies Acts, 1963 to 2006 and whether, in addition, the Group
4 of the IAS Regulation. We also report to you our opinion as to: whether proper books of account have been kept by the Company; whether, at the
convening of an extraordinary general meeting of the Company; and whether
statements. In addition, we state whether we have obtained all the information and explanations necessary for the purposes of our audit and whether the Company Balance Sheet is in agreement with the books of account.
Listing Rules of the Irish Stock Exchange regarding directors’ remuneration and other transactions is not disclosed and, where practicable, include such information in our Report.
Company’s compliance with the nine provisions of the 2006 Financial
Rules of the Irish Stock Exchange, and we report if it does not. We are not required to consider whether the Board’s statements on internal control cover all risks and controls, or form an opinion on the effectiveness of the Group’s corporate governance procedures or its risk and control procedures.
We read other information contained in the Annual Report and consider whether
comprises only the Directors’ Report, the Chairman’s Statement, Chief Executive’s Review, Operations Reviews, Finance Review and the Corporate Governance Statement. We consider the implications for our Report if we become aware of any apparent misstatements or material inconsistencies
information.
Basis of Audit Opinion
We conducted our audit in accordance with International Standards on Auditing (UK and Ireland) issued by the Auditing Practices Board. An audit includes examination, on a test basis, of evidence relevant to the amounts
are appropriate to the Group’s and Company’s circumstances, consistently applied and adequately disclosed.
We planned and performed our audit so as to obtain all the information and explanations which we considered necessary in order to provide us
statements are free from material misstatement, whether caused by fraud or other irregularity or error. In forming our opinion we also evaluated the overall
Opinion
accordance with IFRSs as adopted by the European Union, of the state
year then ended and have been properly prepared in accordance with the Companies Acts, 1963 to 2006 and Article 4 of the IAS Regulation.
accordance with Generally Accepted Accounting Practice in Ireland, of the state of affairs of the Company as at 31st December 2007 and have been properly prepared in accordance with the Companies Acts, 1963 to 2006.
We have obtained all the information and explanations we consider necessary for the purposes of our audit. In our opinion proper books of account have been kept by the Company. The Company Balance Sheet is in agreement with the books of account.
In our opinion the information given in the Directors’ Report is consistent with
situation which under section 40(1) of the Companies (Amendment) Act, 1983 would require the convening of an extraordinary general meeting of the Company.
Ernst & Young Registered AuditorsDublin3rd March 2008
Independent Auditors’ Reportto the members of CRH public limited company

58 CRH
Group Income Statement
2007 2006Notes €m €m
1 Revenue 20,992 18,737 Cost of sales (14,715) (13,123)
6,277 5,6143 Operating costs (4,191) (3,847)
1, 4, 5 2,086 1,76757 40
1 2,143 1,8078 Finance costs (473) (407)8 Finance revenue 170 155
64 47
1,904 1,60210 Income tax expense (466) (378)
1,438 1,224
Equity holders of the Company 1,430 1,21031 Minority interest 8 14
1,438 1,224
12 Basic earnings per Ordinary Share 262.7c 224.3c
12 Diluted earnings per Ordinary Share 260.4c 222.4c
Group Statement of Recognised Income and Expense
2007 2006Notes €m €m Items of income and expense recognised directly within equity
30 Currency translation effects (410) (371)159 155
8 (2)10 Tax on items taken directly to equity (74) (15)
Net expense recognised directly within equity (317) (233)
1,438 1,224
1,121 991
Attributable to: Equity holders of the Company 1,116 980 Minority interest 5 11
1,121 991
K. McGowan, W.I. O’Mahony, Directors
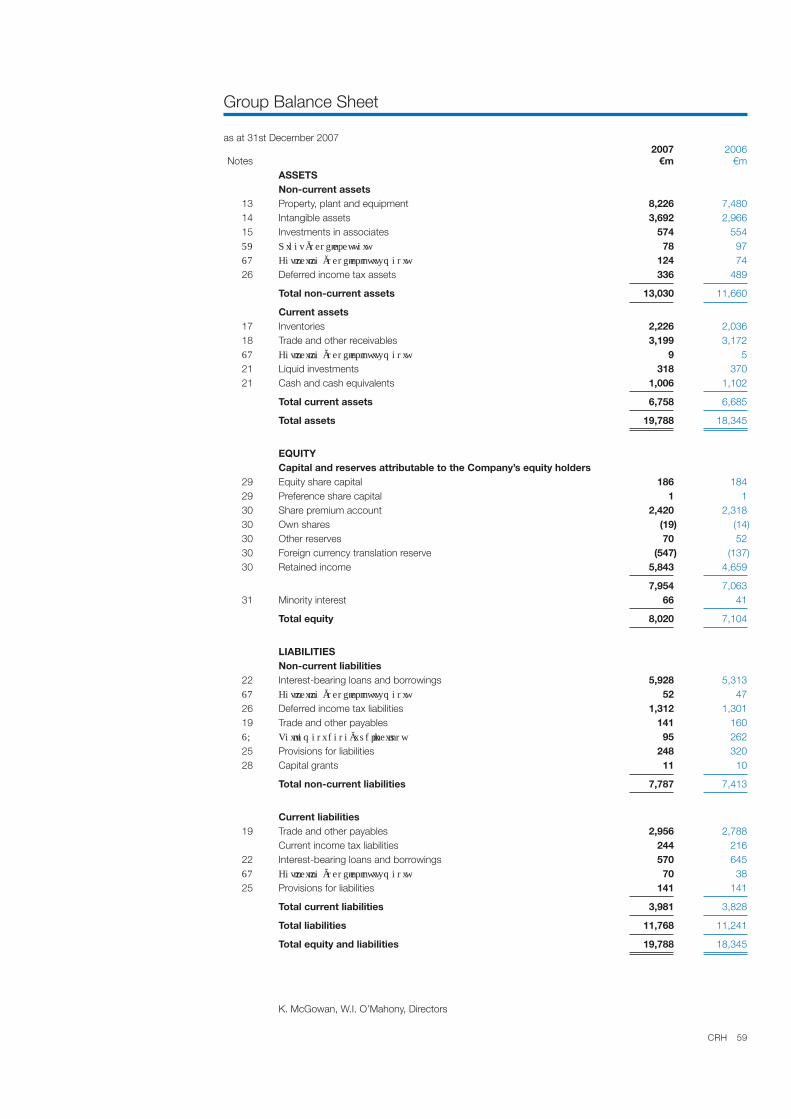
59CRH
Group Balance Sheet
as at 31st December 2007 2007 2006Notes €m €m
ASSETSNon-current assets
13 Property, plant and equipment 8,226 7,48014 Intangible assets 3,692 2,96615 Investments in associates 574 554
78 97124 74
26 Deferred income tax assets 336 489
Total non-current assets 13,030 11,660
Current assets17 Inventories 2,226 2,03618 Trade and other receivables 3,199 3,172
9 521 Liquid investments 318 37021 Cash and cash equivalents 1,006 1,102
Total current assets 6,758 6,685
Total assets 19,788 18,345
EQUITY Capital and reserves attributable to the Company’s equity holders
29 Equity share capital 186 18429 Preference share capital 1 130 Share premium account 2,420 2,31830 Own shares (19) (14)30 Other reserves 70 5230 Foreign currency translation reserve (547) (137)30 Retained income 5,843 4,659
7,954 7,06331 Minority interest 66 41
Total equity 8,020 7,104
LIABILITIES Non-current liabilities
22 Interest-bearing loans and borrowings 5,928 5,31352 47
26 Deferred income tax liabilities 1,312 1,30119 Trade and other payables 141 160
95 26225 Provisions for liabilities 248 32028 Capital grants 11 10
Total non-current liabilities 7,787 7,413
Current liabilities19 Trade and other payables 2,956 2,788
Current income tax liabilities 244 21622 Interest-bearing loans and borrowings 570 645
70 3825 Provisions for liabilities 141 141
Total current liabilities 3,981 3,828
Total liabilities 11,768 11,241
Total equity and liabilities 19,788 18,345
K. McGowan, W.I. O’Mahony, Directors

60 CRH
2007 2006Notes €m €m
1,904 1,602 Finance costs (net) 303 252
(64) (47)(57) (40)
2,086 1,76713 Depreciation charge 739 6647 Share-based payments 23 16
14 Amortisation of intangible assets 35 2528 Amortisation of capital grants (3) (2)
Other non-cash movements (2) 1025 Net movement on provisions (49) 1120 Decrease/(increase) in working capital 261 (132)
Cash generated from operations 3,090 2,359(352) (253)
Irish corporation tax paid (18) (20) Overseas corporation tax paid (370) (358)
2,350 1,728
156 252 Interest received 64 46
28 Capital grants received 3 - Dividends received from associates 30 22
253 320
13 Purchase of property, plant and equipment (1,028) (832)33 Acquisition of subsidiaries and joint ventures (1,858) (1,978)15 Investments in and advances to associates - (7)15 Advances to joint ventures and purchase of trade investments (40) (13)20 Deferred and contingent acquisition consideration paid (107) (74)
(3,033) (2,904)
(2,780) (2,584)
Proceeds from issue of shares 36 8731 Shares issued to minority interests - 324 Decrease in liquid investments 29 -
Increase in interest-bearing loans and borrowings 1,481 1,7082 3
1,548 1,801
30 Ordinary Shares purchased (own shares), net (31) (15)24 Increase in liquid investments - (35)
Repayment of interest-bearing loans and borrowings (753) (656)(27) (13)
(113) (29)11 Dividends paid to equity holders of the Company (250) (197)11 Dividends paid to minority interests (5) (12)
(1,179) (957)
369 844
Decrease in cash and cash equivalents (61) (12)
Reconciliation of opening to closing cash and cash equivalents24 Cash and cash equivalents at 1st January 1,102 1,14924 Translation adjustment (35) (35)
Decrease in cash and cash equivalents (61) (12)
24 Cash and cash equivalents at 31st December 1,006 1,102
K. McGowan, W.I. O’Mahony, Directors
Group Cash Flow Statement
61CRH
Accounting Policies
Statement of compliance
in accordance with International Financial Reporting Standards (IFRS) as adopted by the European Union, which comprise standards and interpretations approved by the International Accounting Standards Board (IASB).
CRH plc, the Parent Company, is a public limited company incorporated and domiciled in the Republic of Ireland.
IFRS as adopted by the European Union differ in certain respects from IFRS
been applied. References to IFRS hereafter should be construed as references to IFRS as adopted by the European Union.
Basis of preparation
of recognised assets and liabilities that are hedged are adjusted to record changes in the fair values attributable to the risks that are being hedged.
The accounting policies set out below have been applied consistently by all the Group’s subsidiaries, joint ventures and associates to all periods presented in
of certain critical accounting estimates. In addition, it requires management to exercise judgement in the process of applying the Company’s accounting policies. The areas involving a high degree of judgement or complexity, or
schemes, provisions for liabilities, property, plant and equipment, goodwill impairment and current and deferred tax and are documented in the relevant accounting policies below.
associates are co-terminous.
Adoption of IFRS and International Financial Reporting Interpretations Committee (IFRIC) Interpretations
The Group adopted the following standards and interpretations during the Financial Instruments: Disclosures; Amendment to IAS 1
Capital Disclosures; IFRIC Interpretation 8 Scope of IFRS 2; IFRIC Interpretation 9 Reassessment of Embedded Derivatives; and IFRIC Interpretation 10Interim Financial Reporting and Impairment. The adoption of IFRS 7 and the Amendment to IAS 1 have given rise to new disclosures in the current year together with the associated comparatives. None of the other standards or interpretations has had, or is expected to have, a material impact on the Group
IFRS and IFRIC Interpretations which are not yet effectiveThe Group has not applied the following standards and interpretations that have been issued but are not yet effective:
1st January 2009);
IFRS 2 Share-based Payments – Vesting Conditions and Cancellations
IFRS 3R Business Combinations and IAS 27R Consolidated and Separate
January 2010);
IAS 1 Presentation of Financial Statements (Revised) (effective date: CRH
beginning 1st January 2009);
Amendments to IAS 32 and IAS 1 Puttable Financial Instruments (effective
IFRIC Interpretation 11 Group and Treasury Share Transactions (effective
IFRIC Interpretation 12 Service Concession Arrangements (effective date:
IFRIC Interpretation 13 Customer Loyalty Programmes (effective date: CRH
Minimum Funding Requirements and their Interaction (effective date: CRH
The standards and interpretations addressed above will be applied for the
Whilst the application of IFRS 8 will result in amendments to the segment
amendments will not be of a recognition and measurement nature given the disclosure focus of the IFRS.
The application of IFRS 2 Share-based Payments – Vesting Conditions and Cancellations, IAS 23 Borrowing Costs (Revised), the Amendments to IAS 32 and IAS 1 Puttable Financial Instruments and IFRIC Interpretation 11 do not
IFRS 3R introduces a number of changes to the accounting for business combinations that will impact the amount of goodwill recognised, the reported results in the period when an acquisition occurs and future reported results. IAS 27R requires that a change in the ownership interest of a subsidiary is accounted for as an equity transaction. The application of IAS 1 Presentation of Financial Statements (Revised) will give rise to some presentational
by other IFRS.
IFRIC Interpretations 12 and 13 are not applicable in the context of the Group’s
the subsidiaries and joint ventures in the Group, IFRIC Interpretation 14 will only be of relevance where surpluses emerge and those surpluses are of a
Basis of consolidation
Company and all subsidiaries, joint ventures and associates, drawn up to 31st December each year.
Subsidiaries
on which control is transferred out of the Group. Control exists when the
activities. The existence and effect of potential voting rights that are currently exercisable or convertible are considered in determining the existence or otherwise of control.
62 CRH
Joint venturesIn line with IAS 31 Interests in Joint Ventures, the Group’s share of results and net assets of joint ventures (jointly controlled entities), which are entities in which the Group holds an interest on a long-term basis and which are jointly controlled by the Group and one or more other venturers under a contractual arrangement, are accounted for on the basis of proportionate consolidation from the date on which the contractual agreements stipulating joint control are finalised and derecognised when joint control ceases. The Group combines its share of the joint ventures’ individual income and expenses, assets and liabilities and cash flows on a line-by-line basis with similar items in the Group’s consolidated financial statements.
Loans to joint ventures are classified as loans and receivables within financial assets and are recorded at amortised cost.
AssociatesEntities other than subsidiaries and joint ventures in which the Group has a participating interest, and over whose operating and financial policies the Group is in a position to exercise significant influence, are accounted for as associates using the equity method and are included in the consolidated financial statements from the date on which significant influence is deemed to arise until the date on which such influence ceases to exist. If the Group’s share of losses exceeds the carrying amount of an associate, the carrying amount is reduced to nil and recognition of further losses is discontinued except to the extent that the Group has incurred obligations in respect of the associate.
Equity methodUnder the equity method, which is used in respect of accounting for the Group’s investments in associates, the Group Income Statement reflects the Group’s share of profit after tax of the related associates. Investments in associates are carried in the Group Balance Sheet at cost adjusted in respect of post-acquisition changes in the Group’s share of net assets, less any impairment in value. Where indicators of impairment arise in accordance with the requirements of IAS 39 Financial Instruments: Recognition and Measurement, the carrying amount of the investment is tested for impairment by comparing its recoverable amount with its carrying amount.
Transactions eliminated on consolidationIntra-group balances and transactions, and any unrealised gains arising from such transactions, are eliminated in preparing the consolidated financial statements. Unrealised gains arising from transactions with joint ventures and associates are eliminated to the extent of the Group’s interest in the entity. Unrealised losses are eliminated in the same manner as unrealised gains, but only to the extent that there is no evidence of impairment in the Group’s interest in the entity.
Revenue recognition
Revenue represents the value of goods and services supplied to external customers and excludes intercompany sales, trade discounts and value added tax/sales tax. Other than in the case of construction contracts, revenue is recognised to the extent that it is subject to reliable measurement, that it is probable that economic benefits will flow to the Group and that the significant risks and rewards of ownership have passed to the buyer. Revenue on construction contracts is recognised in accordance with the percentage-of-completion method with the completion percentage being computed on an input cost basis.
Contract costs are recognised as incurred. When the outcome of a construction contract cannot be estimated reliably, contract revenue is recognised only to the extent of contract costs incurred that are likely to be recoverable. When the outcome of a construction contract can be estimated reliably and it is probable that the contract will be profitable, contract revenue is recognised over the period of the contract. When it is probable that total contract
costs will exceed total contract revenue, the expected loss is immediately recognised as an expense. The percentage-of-completion method is used to determine the appropriate amount to recognise in a particular reporting period with the stage of completion assessed by reference to the proportion that contract costs incurred at the balance sheet date bear to the total estimated cost of the contract.
Segment reporting
A segment is a distinguishable component of the Group that is engaged either in providing products or services (business segment), or in providing products or services within a particular economic environment (geographical segment), which is subject to risks and returns different to those of other segments. Based on the Group’s internal organisational and management structure and its system of internal financial reporting, segmentation by business is regarded as being the predominant source and nature of the risks and returns facing the Group and is thus the primary segment under IAS 14 Segment Reporting. Geographical segmentation is therefore the secondary segment.
Foreign currency translation
Items included in the financial statements of each of the Group’s entities are measured using the currency of the primary economic environment in which the entity operates (“the functional currency”). The consolidated financial statements are presented in euro, which is the presentation currency of the Group and the functional currency of the Company.
Transactions in foreign currencies are recorded at the rate ruling at the date of the transaction. Monetary assets and liabilities denominated in foreign currencies are retranslated at the rate of exchange ruling at the balance sheet date. All currency translation differences are taken to the Group Income Statement with the exception of differences on foreign currency borrowings; to the extent that such borrowings are used to provide a hedge against foreign equity investments, the translation differences are taken directly to equity together with the translation differences on the carrying amount of the related investments. Translation differences applicable to foreign currency borrowings are taken directly to equity until disposal of the net investment, at which time they are recycled through the Group Income Statement.
Results and cash flows of subsidiaries, joint ventures and associates based in non-euro countries have been translated into euro at average exchange rates for the year, and the related balance sheets have been translated at the rates of exchange ruling at the balance sheet date. Adjustments arising on translation of the results of non-euro subsidiaries, joint ventures and associates at average rates, and on restatement of the opening net assets at closing rates, are dealt with in a separate translation reserve within equity, net of differences on related currency borrowings. All other translation differences are taken to the Group Income Statement.
On disposal of a foreign operation, accumulated currency translation differences are recognised in the Group Income Statement as part of the overall gain or loss on disposal. Goodwill and fair value adjustments arising on acquisition of a foreign operation are regarded as assets and liabilities of the foreign operation, are expressed in the functional currency of the foreign operation, are recorded in euro at the exchange rate at the date of the transaction and are subsequently retranslated at the applicable closing rates.
Accounting Policies continued

63CRH
The principal exchange rates used for the translation of results, cash flows and balance sheets into euro were as follows:
Average Year-endeuro 1 = 2007 2006 2007 2006
US Dollar 1.3705 1.2556 1.4721 1.3170Pound Sterling 0.6843 0.6817 0.7334 0.6715Polish Zloty 3.7837 3.8959 3.5935 3.8310Ukrainian Hryvnia 6.8982 6.3290 7.3588 6.6583Swiss Franc 1.6427 1.5729 1.6547 1.6069Canadian Dollar 1.4678 1.4237 1.4449 1.5281Argentine Peso 4.2718 3.8623 4.5948 4.0373Israeli Shekel 5.6270 5.5928 5.6201 5.5623
The Group operates defined contribution and defined benefit pension schemes in a number of its operating areas. In addition, the Group has also undertaken to provide certain additional post-employment healthcare and life assurance benefits, which are unfunded, to certain current and former employees in the United States.
Costs arising in respect of the Group’s defined contribution pension schemes are charged to the Group Income Statement in the period in which they are incurred. Under these schemes, the Group has no obligation, either legal or constructive, to pay further contributions in the event that the fund does not hold sufficient assets to meet its benefit commitments.
The liabilities and costs associated with the Group’s defined benefit pension schemes (both funded and unfunded) are assessed on the basis of the projected unit credit method by professionally qualified actuaries and are arrived at using actuarial assumptions based on market expectations at the balance sheet date. The discount rates employed in determining the present value of the schemes’ liabilities are determined by reference to market yields at the balance sheet date on high-quality corporate bonds of a currency and term consistent with the currency and term of the associated post-employment benefit obligations. When the benefits of a defined benefit scheme are improved, the portion of the increased benefit relating to past service by employees is recognised as an expense in the Group Income Statement on a straight-line basis over the average period until the benefits become vested. To the extent that the enhanced benefits vest immediately, the related expense is recognised immediately in the Group Income Statement. The net surplus or deficit arising on the Group’s defined benefit pension schemes, together with the liabilities associated with the unfunded schemes, are shown either within non-current assets or non-current liabilities on the face of the Group Balance Sheet. The deferred tax impact of pension scheme surpluses and deficits is disclosed separately within deferred tax assets or liabilities as appropriate. The Group has elected to recognise post transition date actuarial gains and losses immediately in the Statement of Recognised Income and Expense.
In relation to the Group’s defined benefit pension schemes, a full actuarial valuation is undertaken on an annual basis, where local requirements mandate that this be done, and at triennial intervals at a maximum in all other cases.
The defined benefit pension asset or liability in the Group Balance Sheet comprises the total for each plan of the present value of the defined benefit obligation (using a discount rate based on high-quality corporate bonds) less any past service cost not yet recognised and less the fair value of plan assets (measured at bid value) out of which the obligations are to be settled directly.
The Group’s obligation in respect of post-employment healthcare and life assurance benefits represents the amount of future benefit that employees have earned in return for service in the current and prior periods. The obligation is computed on the basis of the projected unit credit method and is discounted to present value using a discount rate equating to the market yield at the balance sheet date on high-quality corporate bonds of a currency and term consistent with the currency and estimated term of the post-employment obligations.
Share-based payments
The Group operates both Share Option Schemes and a Performance Share Plan. Its policy in relation to the granting of share options and the granting of awards under the Performance Share Plan together with the nature of the underlying market and non-market performance and other vesting conditions are addressed in the Report on Directors’ Remuneration on page 48.
Share optionsFor equity-settled share-based payment transactions (i.e. the issuance of share options), the Group measures the services received and the corresponding increase in equity at fair value at the measurement date (which is the grant date) using a recognised valuation methodology for the pricing of financial instruments (i.e. the trinomial model). Given that the share options granted do not vest until the completion of a specified period of service and are subject to the realisation of demanding performance conditions, the fair value is determined on the basis that the services to be rendered by employees as consideration for the granting of share options will be received over the vesting period, which is assessed as at the grant date.
The share options granted by the Company are not subject to market-based vesting conditions as defined in IFRS 2 Share-Based Payment. Non-market vesting conditions are not taken into account when estimating the fair value of share options as at the grant date; such conditions are taken into account through adjusting the number of equity instruments included in the measurement of the transaction amount so that, ultimately, the amount recognised equates to the number of equity instruments that actually vest. The expense in the Group Income Statement in relation to share options represents the product of the total number of options anticipated to vest and the fair value of those options; this amount is allocated to accounting periods on a straight-line basis over the vesting period. The cumulative charge to the Group Income Statement is reversed only where the performance condition is not met or where an employee in receipt of share options relinquishes service prior to completion of the expected vesting period.
The proceeds received net of any directly attributable transaction costs are credited to share capital (nominal value) and share premium when the options are exercised.
The measurement requirements of IFRS 2 have been implemented in respect of share options that were granted after 7th November 2002. In accordance with the standard, the disclosure requirements of IFRS 2 have been applied in relation to all outstanding share-based payments regardless of their grant date.
To the extent that the Group receives a tax deduction relating to the services paid in shares, deferred tax in respect of share options is provided on the basis of the difference between the market price of the underlying equity as at the date of the financial statements and the exercise price of the option; as a result, the deferred tax impact of share options will not directly correlate with the expense reported in the Group Income Statement.
The Group has no exposure in respect of cash-settled share-based payment transactions and share-based payment transactions with cash alternatives as defined in IFRS 2.
64 CRH
Awards under the Performance Share PlanThe fair value of shares awarded under the Performance Share Plan is determined using a Monte Carlo simulation technique. The Performance Share Plan contains inter alia a TSR-based (and hence market-based) vesting condition, and accordingly, the fair value assigned to the related equity instruments on initial application of IFRS 2 is adjusted so as to reflect the anticipated likelihood as at the grant date of achieving the market-based vesting condition.
Property, plant and equipment
With the exception of the one-time revaluation of land and buildings noted below, items of property, plant and equipment are stated at historical cost less any accumulated depreciation and any accumulated impairments.
Depreciation and depletionDepreciation is calculated to write off the book value of each item of property, plant and equipment over its useful economic life on a straight-line basis at the following rates:
Land and buildings: The book value of mineral-bearing land, less an estimate of its residual value, is depleted over the period of the mineral extraction in the proportion which production for the year bears to the latest estimates of mineral reserves. Land other than mineral-bearing land is not depreciated. In general, buildings are depreciated at 2.5% per annum (“p.a.”).
Plant and machinery: These are depreciated at rates ranging from 3.3% p.a. to 20% p.a. depending on the type of asset.
Transport: On average, transport equipment is depreciated at 20% p.a.
Certain items of property, plant and equipment that had been revalued to fair value prior to the date of transition to IFRS (1st January 2004) are measured on the basis of deemed cost, being the revalued amount as at the date the revaluation was performed.
The residual values and useful lives of property, plant and equipment are reviewed, and adjusted if appropriate, at each balance sheet date.
Impairment of property, plant and equipmentIn accordance with IAS 36 Impairment of Assets, the carrying values of items of property, plant and equipment are reviewed for impairment at each reporting date and are subject to impairment testing when events or changes in circumstances indicate that the carrying values may not be recoverable. Where the carrying values exceed the estimated recoverable amount (being the greater of fair value less costs to sell and value-in-use), the assets or cash-generating units are written-down to their recoverable amount. Fair value less costs to sell is defined as the amount obtainable from the sale of an asset or cash-generating unit in an arm’s length transaction between knowledgeable and willing parties, less the costs which would be incurred in disposal. Value-in-use is defined as the present value of the future cash flows expected to be derived through the continued use of an asset or cash-generating unit including those anticipated to be realised on its eventual disposal. In assessing value-in-use, the estimated future cash flows are discounted to their present value using a pre-tax discount rate that reflects current market assessments of the time value of money and the risks specific to the asset for which the future cash flow estimates have not been adjusted. The estimates of future cash flows exclude cash inflows or outflows attributable to financing activities and income tax. For an asset that does not generate largely independent cash inflows, the recoverable amount is determined by reference to the cash-generating unit to which the asset belongs.
Repair and maintenance expenditureRepair and maintenance expenditure is included in an asset’s carrying amount or recognised as a separate asset, as appropriate, only when it is probable that future economic benefits associated with the item will flow to
the Group and the cost of the item can be measured reliably. All other repair and maintenance expenditure is charged to the Group Income Statement during the financial period in which it is incurred.
Borrowing costsBorrowing costs incurred in the construction of major assets which take a substantial period of time to complete are capitalised in the financial period in which they are incurred.
Business combinations
The purchase method of accounting is employed in accounting for the acquisition of subsidiaries, joint ventures and associates by the Group.
The cost of a business combination is measured as the aggregate of the fair values at the date of exchange of assets given, liabilities incurred or assumed and equity instruments issued in exchange for control together with any directly attributable expenses. To the extent that settlement of all or any part of a business combination is deferred, the fair value of the deferred component is determined through discounting the amounts payable to their present value at the date of exchange. The discount component is unwound as an interest charge in the Group Income Statement over the life of the obligation.
Where a business combination agreement provides for an adjustment to the cost of the combination contingent on future events, the amount of the adjustment is included in the cost at the acquisition date if the adjustment is probable and can be reliably measured. Contingent consideration is included in the acquisition balance sheet on a discounted basis.
The assets and liabilities and contingent liabilities of a subsidiary are measured at their fair values at the date of acquisition. In the case of a business combination which is completed in stages, the fair values of the identifiable assets, liabilities and contingent liabilities are determined at the date of each exchange transaction.
When the initial accounting for a business combination is determined provisionally, any adjustments to the provisional values allocated to the identifiable assets, liabilities and contingent liabilities are made within twelve months of the acquisition date.
The interest of minority shareholders is stated at the minority’s proportion of the fair values of the assets and liabilities recognised; goodwill is not allocated to the minority interest. Subsequently, any losses applicable to the minority interest in excess of the minority interest are allocated against the interests of the parent.
Goodwill
Goodwill is the excess of the consideration paid over the fair value of the identifiable assets, liabilities and contingent liabilities in a business combination and relates to the future economic benefits arising from assets which are not capable of being individually identified and separately recognised.
The carrying amount of goodwill in respect of associates is included in investments in associates under the equity method in the Group Balance Sheet. Goodwill applicable to jointly controlled entities is accounted for on the basis of proportionate consolidation and is therefore included in the goodwill caption in the Group Balance Sheet, net of any impairments assessed in accordance with the methodology discussed below.
Where a subsidiary is disposed of or terminated through closure, the carrying value of any goodwill which arose on acquisition of that subsidiary, net of any impairments, is included in the determination of the net profit or loss on disposal/termination.
To the extent that the Group’s interest in the net fair value of the identifiable assets, liabilities and contingent liabilities acquired exceeds the cost of a business combination, the identification and measurement of the related
Accounting Policies continued

65CRH
assets, liabilities and contingent liabilities are revisited and the cost is reassessed and any remaining balance is recognised immediately in the Group Income Statement.
Goodwill acquired in a business combination is allocated, from the acquisition date, to the cash-generating units that are anticipated to benefit from the combination’s synergies. Following initial recognition, goodwill is measured at cost less any accumulated impairment losses. The cash-generating units represent the lowest level within the Group at which goodwill is monitored for internal management purposes and these units are not larger than the primary and secondary reporting segments determined in accordance with IAS 14 Segment Reporting. Goodwill is subject to impairment testing on an annual basis and at any time during the year if an indicator of impairment is considered to exist. In the year in which a business combination is effected, and where some or all of the goodwill allocated to a particular cash-generating unit arose in respect of that combination, the cash-generating unit is tested for impairment prior to the end of the relevant annual period. Impairment is determined by assessing the recoverable amount of the cash-generating unit to which the goodwill relates. Where the recoverable amount of the cash-generating unit is less than the carrying amount, an impairment loss is recognised. Impairment losses arising in respect of goodwill are not reversed once recognised.
When part of an operation within a cash-generating unit is disposed of, any goodwill associated with that operation is included in the carrying amount of the operation when determining the gain or loss on disposal. Goodwill disposed of in this circumstance is measured on the basis of the relative values of the operation disposed of and the portion of the cash-generating unit retained.
Intangible assets (other than goodwill) arising on business combinations
An intangible asset, which is an identifiable non-monetary asset without physical substance, is capitalised separately from goodwill as part of a business combination to the extent that it is probable that the expected future economic benefits attributable to the asset will flow to the Group and that its cost can be measured reliably. The asset is deemed to be identifiable when it is separable (i.e. capable of being divided from the entity and sold, transferred, licensed, rented or exchanged, either individually or together with a related contract, asset or liability) or when it arises from contractual or other legal rights, regardless of whether those rights are transferable or separable from the Group or from other rights and obligations.
Subsequent to initial recognition, intangible assets are carried at cost less any accumulated amortisation and any accumulated impairment losses. The carrying values of definite-lived intangible assets are reviewed for indicators of impairment at each reporting date and are subject to impairment testing when events or changes in circumstances indicate that the carrying values may not be recoverable.
The amortisation of intangible assets is calculated to write-off the book value of definite-lived intangible assets over their useful lives on a straight-line basis on the assumption of zero residual value. In general, definite-lived intangible assets are amortised over periods ranging from one to ten years, depending on the nature of the intangible asset.
Investments
All investments are initially recognised at the fair value of the consideration given net of any acquisition charges arising.
Where equity investments are actively traded in organised financial markets, fair value is determined by reference to Stock Exchange quoted market bid prices at the close of business on the balance sheet date. Where it is impracticable to determine fair value in accordance with IAS 39, unquoted equity investments are recorded at historical cost and are included within financial assets in the Group Balance Sheet.
Leases
Assets held under finance leases, which are leases where substantially all the risks and rewards of ownership of the asset have transferred to the Group, and hire purchase contracts are capitalised in the Group Balance Sheet and are depreciated over their useful lives with any impairment being recognised in accumulated depreciation. The asset is recorded at an amount equal to the lower of its fair value and the present value of the minimum lease payments at the inception of the finance lease. The capital elements of future obligations under leases and hire purchase contracts are included in liabilities in the Group Balance Sheet and analysed between current and non-current amounts. The interest elements of the rental obligations are charged to the Group Income Statement over the periods of the relevant agreements and represent a constant proportion of the balance of capital repayments outstanding in line with the implicit interest rate methodology.
Leases where the lessor retains substantially all the risks and rewards of ownership are classified as operating leases. Operating lease rentals are charged to the Group Income Statement on a straight-line basis over the lease term.
Inventories and construction contracts
Inventories are stated at the lower of cost and net realisable value. Cost is based on the first-in, first-out principle (and weighted average, where appropriate) and includes all expenditure incurred in acquiring the inventories and bringing them to their present location and condition. Raw materials are valued on the basis of purchase cost on a first-in, first-out basis. In the case of finished goods and work-in-progress, cost includes direct materials, direct labour and attributable overheads based on normal operating capacity and excludes borrowing costs. Net realisable value is the estimated proceeds of sale less all further costs to completion, and less all costs to be incurred in marketing, selling and distribution.
Amounts recoverable on construction contracts, which are included in debtors, are stated at the net sales value of the work done less amounts received as progress payments on account. Cumulative costs incurred, net of amounts transferred to cost of sales, after deducting foreseeable losses, provision for contingencies and payments on account not matched with revenue, are included as construction contract balances in inventories. Cost includes all expenditure related directly to specific projects and an allocation of fixed and variable overheads incurred in the Group’s contract activities based on normal operating capacity.
Trade and other receivables and payables
Trade and other receivables and payables are stated at cost, which approximates fair value given the short-dated nature of these assets and liabilities.
Trade receivables are carried at original invoice amount less an allowance for potentially uncollectible debts. Provision is made when there is objective evidence that the Group will not be in a position to collect the associated debts. Bad debts are written-off in the Group Income Statement on identification.
Cash and cash equivalents
Cash and cash equivalents comprise cash balances held for the purposes of meeting short-term cash commitments and investments which are readily convertible to a known amount of cash and are subject to an insignificant risk of changes in value. Where investments are categorised as cash equivalents, the related balances have a maturity of three months or less from the date of acquisition. Bank overdrafts are included within current interest-bearing loans and borrowings in the Group Balance Sheet. Where the overdrafts are repayable on demand and form an integral part of cash management, they are netted against cash and cash equivalents.

66 CRH
Liquid investments
Liquid investments comprise short-term deposits and current asset investments which are held as readily disposable stores of value and include investments in government gilts and commercial paper and deposits of less than one year in duration. The maturity of these investments falls outside the three months timeframe for classification as cash and cash equivalents under IAS 7 Cash Flow Statements, and accordingly these investments are treated as financial assets and are categorised as either “fair value through profit and loss” or “loans and receivables”. Regular way purchases of financial assets are recognised using settlement date accounting. The fair value of liquid investments is determined by reference to the traded value of actively traded instruments.
The Group employs derivative financial instruments (principally interest rate and currency swaps and forward foreign exchange contracts) to manage interest rate risks and to realise the desired currency profile of borrowings. In accordance with its treasury policy, the Group does not trade in financial instruments nor does it enter into leveraged derivative transactions.
At the inception of a transaction entailing the usage of derivatives, the Group documents the relationship between the hedged item and the hedging instrument together with its risk management objective and the strategy underlying the proposed transaction. The Group also documents its assessment, both at the inception of the hedging relationship and subsequently on an ongoing basis, of the effectiveness of the hedge in offsetting movements in the fair values or cash flows of the hedged items.
Derivative financial instruments are stated at fair value. Where derivatives do not fulfil the criteria for hedge accounting, they are classified as “held for trading” and changes in fair values are reported in the Group Income Statement. The fair value of interest rate and currency swaps is the estimated amount the Group would pay or receive to terminate the swap at the balance sheet date taking into account current interest and currency rates and the creditworthiness of the swap counterparties. The fair value of forward exchange contracts is calculated by reference to current forward exchange rates for contracts with similar maturity profiles and equates to the quoted market price at the balance sheet date (being the present value of the quoted forward price).
Hedging
Fair value and cash flow hedgesThe Group uses fair value hedges and cash flow hedges in its treasury activities. For the purposes of hedge accounting, hedges are classified either as fair value hedges (which entail hedging the exposure to movements in the fair value of a recognised asset or liability) or cash flow hedges (which hedge exposure to fluctuations in future cash flows derived from a particular risk associated with a recognised asset or liability, a firm commitment or a highly probable forecast transaction).
In the case of fair value hedges which satisfy the conditions for hedge accounting, any gain or loss stemming from the re-measurement of the hedging instrument to fair value is reported in the Group Income Statement. In addition, any gain or loss on the hedged item which is attributable to the hedged risk is adjusted against the carrying amount of the hedged item and reflected in the Group Income Statement. Where the adjustment is to the carrying amount of a hedged interest-bearing financial instrument, the adjustment is amortised to the Group Income Statement with the objective of achieving full amortisation by maturity.
Where a derivative financial instrument is designated as a hedge of the variability in cash flows of a recognised liability or a highly probable forecast transaction, the effective part of any gain or loss on the derivative financial
instrument is recognised as a separate component of equity with the ineffective portion being reported in the Group Income Statement. The associated gains or losses that had previously been recognised in equity are transferred to the Group Income Statement contemporaneously with the materialisation of the hedged transaction. Any gain or loss arising in respect of changes in the time value of the derivative financial instrument is excluded from the measurement of hedge effectiveness and is recognised immediately in the Group Income Statement.
Hedge accounting is discontinued when the hedging instrument expires or is sold, terminated or exercised, or no longer qualifies for hedge accounting. At that point in time, any cumulative gain or loss on the hedging instrument recognised as a separate component of equity remains in equity until the forecast transaction occurs. If a hedged transaction is no longer anticipated to occur, the net cumulative gain or loss recognised in equity is transferred to the Group Income Statement in the period.
Hedges of monetary assets and liabilitiesWhere a derivative financial instrument is used to hedge economically the foreign exchange exposure of a recognised monetary asset or liability, hedge accounting is not applied and any gain or loss accruing on the hedging instrument is recognised in the Group Income Statement.
Net investment hedgesWhere foreign currency borrowings provide a hedge against a net investment in a foreign operation, foreign exchange differences are taken directly to a foreign currency translation reserve (being a separate component of equity). Cumulative gains and losses remain in equity until disposal of the net investment in the foreign operation at which point the related differences are transferred to the Group Income Statement as part of the overall gain or loss on sale.
Interest-bearing loans and borrowings
All loans and borrowings are initially recorded at cost being the fair value of the consideration received net of attributable transaction costs.
Subsequent to initial recognition, current and non-current interest-bearing loans and borrowings are, in general, measured at amortised cost employing the effective interest yield methodology. Fixed rate term loans, which have been hedged to floating rates (using interest rate swaps), are measured at amortised cost adjusted for changes in value attributable to the hedged risks arising from changes in underlying market interest rates. The computation of amortised cost includes any issue costs and any discount or premium materialising on settlement. Borrowings are classified as current liabilities unless the Group has an unconditional right to defer settlement of the liability for at least 12 months after the balance sheet date.
Gains and losses are recognised in the Group Income Statement through amortisation on the basis of the period of the loans and borrowings and/or on impairment and derecognition of the associated loans and borrowings.
Borrowing costs arising on financial instruments are recognised as an expense in the period in which they are incurred.
Provisions for liabilities
A provision is recognised on a discounted basis when the Group has a present obligation (either legal or constructive) as a result of a past event; it is probable that a transfer of economic benefits will be required to settle the obligation; and a reliable estimate can be made of the amount of the obligation. Where the Group anticipates that a provision will be reimbursed, the reimbursement is recognised as a separate asset when it is virtually certain that the reimbursement will arise. Provisions are not recognised in respect of future operating losses.
Accounting Policies continued
67CRH
Provisions arising on business combination activity are accordingly recognised only to the extent that they would have qualified for recognition in the financial statements of the acquiree prior to acquisition.
Tax (current and deferred)
Current tax represents the expected tax payable (or recoverable) on the taxable
balance sheet date and taking into account any adjustments stemming from prior years. Any interest or penalties arising are included within current tax.
Deferred tax is provided on the basis of the balance sheet liability method on all temporary differences at the balance sheet date. Temporary differences are defined as the difference between the tax bases of assets and liabilities and their carrying amounts in the financial statements. Deferred tax assets and liabilities are not subject to discounting and are measured at the tax rates that are anticipated to apply in the period in which the asset is realised or the liability is settled based on tax rates and tax laws that have been enacted or substantively enacted at the balance sheet date.
Deferred tax liabilities are recognised for all taxable temporary differences (i.e. differences that will result in taxable amounts in future periods when the carrying amount of the asset or liability is recovered or settled) with the exception of the following:
where the deferred tax liability arises from the initial recognition of goodwill or the initial recognition of an asset or a liability in a transaction that is not a business combination and affects neither the accounting profit nor the taxable profit or loss at the time of the transaction; and
where, in respect of taxable temporary differences associated with investments in subsidiaries and joint ventures, the timing of the reversal of the temporary difference is subject to control by the Group and it is probable that reversal will not materialise in the foreseeable future.
Deferred tax assets are recognised in respect of all deductible temporary differences (i.e. differences that give rise to amounts which are deductible in determining taxable profits in future periods when the carrying amount of the asset or liability is recovered or settled), carry-forward of unused tax credits and unused tax losses to the extent that it is probable that taxable profits will be available against which to offset these items. The following exceptions apply in this instance:
where the deferred tax asset arises from the initial recognition of an asset or a liability in a transaction that is not a business combination and affects neither the accounting profit nor the taxable profit or loss at the time of the transaction; and
where, in respect of deductible temporary differences associated with investments in subsidiaries, joint ventures and associates, a deferred tax asset is recognised only if it is probable that the deductible temporary difference will reverse in the foreseeable future and that sufficient taxable profits will be available against which the temporary difference can be utilised.
The carrying amounts of deferred tax assets are subject to review at each balance sheet date and are reduced to the extent that future taxable profits are considered to be inadequate to allow all or part of any deferred tax asset to be utilised.
Where items are accounted for directly through equity (for example, in the context of certain derivative financial instruments and actuarial gains and losses on defined benefit pension schemes and share-based payments), the related income tax is charged or credited to equity. In all other circumstances, income tax is recognised in the Group Income Statement.
Capital grants
Capital grants are recognised at their fair value where there is reasonable assurance that the grant will be received and all attaching conditions have been complied with. When the grant relates to an expense item, it is recognised as income over the periods necessary to match the grant on a systematic basis to the costs that it is intended to compensate. Where the grant relates to an asset, the fair value is treated as a deferred credit and is released to the Income Statement over the expected useful life of the relevant asset through equal annual instalments.
Share capital
Own sharesOrdinary Shares purchased by the Company under the terms of the Performance Share Plan are recorded as a deduction from equity on the face of the Group Balance Sheet.
DividendsDividends on Ordinary Shares are recognised as a liability in the Group’s financial statements in the period in which they are declared by the Company.
Emission rights
Emission rights are accounted for such that a liability is recognised only in circumstances where emission rights have been exceeded from the perspective of the Group as a whole and the differential between actual and permitted emissions will have to be remedied through the purchase of the required additional rights at fair value; assets and liabilities arising in respect of under and over-utilisation of emission credits respectively are accordingly netted against one another in the preparation of the consolidated financial statements.
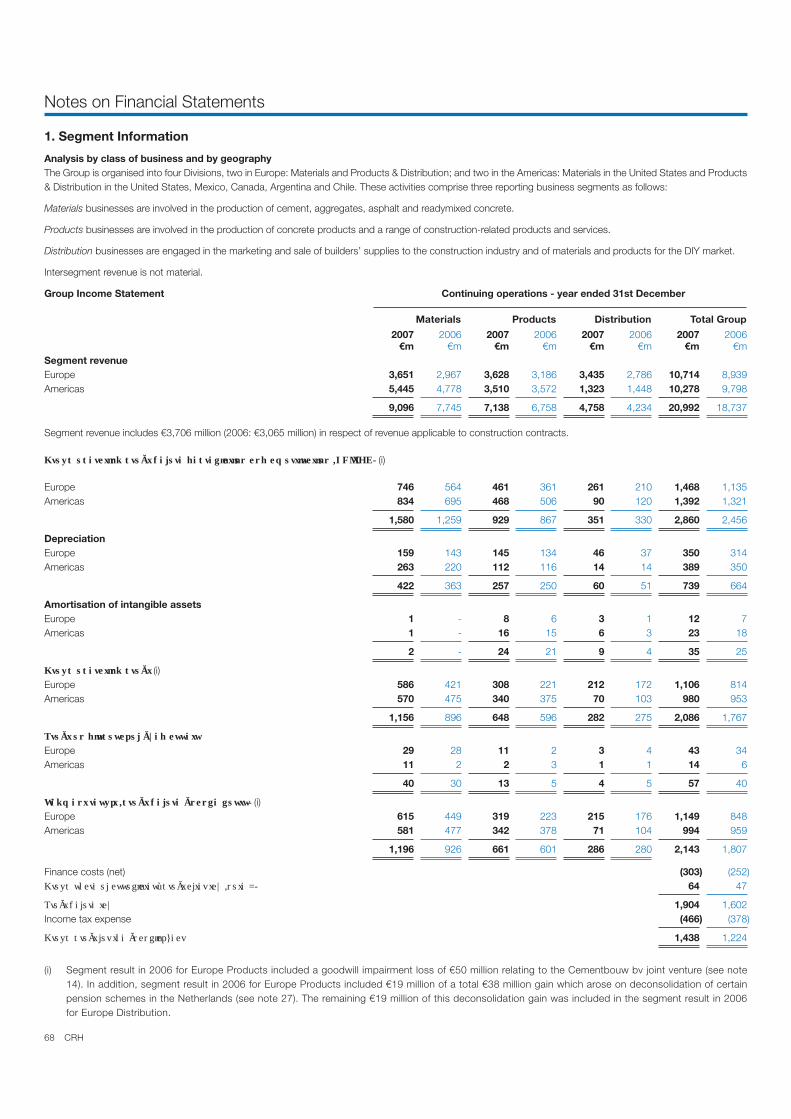
68 CRH
Notes on Financial Statements
1. Segment Information
Analysis by class of business and by geographyThe Group is organised into four Divisions, two in Europe: Materials and Products & Distribution; and two in the Americas: Materials in the United States and Products & Distribution in the United States, Mexico, Canada, Argentina and Chile. These activities comprise three reporting business segments as follows:
Materials businesses are involved in the production of cement, aggregates, asphalt and readymixed concrete.
Products businesses are involved in the production of concrete products and a range of construction-related products and services.
Distribution businesses are engaged in the marketing and sale of builders’ supplies to the construction industry and of materials and products for the DIY market.
Intersegment revenue is not material.
Group Income Statement Continuing operations - year ended 31st December
Materials Products Distribution Total Group
2007 2006 2007 2006 2007 2006 2007 2006 €m €m €m €m €m €m €m €m
Segment revenueEurope 3,651 2,967 3,628 3,186 3,435 2,786 10,714 8,939Americas 5,445 4,778 3,510 3,572 1,323 1,448 10,278 9,798
9,096 7,745 7,138 6,758 4,758 4,234 20,992 18,737
Segment revenue includes €3,706 million (2006: €3,065 million) in respect of revenue applicable to construction contracts.
(i)
Europe 746 564 461 361 261 210 1,468 1,135Americas 834 695 468 506 90 120 1,392 1,321
1,580 1,259 929 867 351 330 2,860 2,456
Depreciation Europe 159 143 145 134 46 37 350 314Americas 263 220 112 116 14 14 389 350
422 363 257 250 60 51 739 664
Amortisation of intangible assets Europe 1 - 8 6 3 1 12 7Americas 1 - 16 15 6 3 23 18
2 - 24 21 9 4 35 25
(i)Europe 586 421 308 221 212 172 1,106 814Americas 570 475 340 375 70 103 980 953
1,156 896 648 596 282 275 2,086 1,767
Europe 29 28 11 2 3 4 43 34Americas 11 2 2 3 1 1 14 6
40 30 13 5 4 5 57 40
(i) Europe 615 449 319 223 215 176 1,149 848Americas 581 477 342 378 71 104 994 959
1,196 926 661 601 286 280 2,143 1,807
Finance costs (net) (303) (252) 64 47
1,904 1,602Income tax expense (466) (378)
1,438 1,224
(i) Segment result in 2006 for Europe Products included a goodwill impairment loss of €50 million relating to the Cementbouw bv joint venture (see note 14). In addition, segment result in 2006 for Europe Products included €19 million of a total €38 million gain which arose on deconsolidation of certain pension schemes in the Netherlands (see note 27). The remaining €19 million of this deconsolidation gain was included in the segment result in 2006 for Europe Distribution.

69CRH
1. Segment Information continued
Group Balance Sheet Continuing operations - year ended 31st December
Materials Products Distribution Total Group
2007 2006 2007 2006 2007 2006 2007 2006Segment assets €m €m €m €m €m €m €m €m
Europe 3,815 2,982 3,295 3,142 1,939 1,376 9,049 7,500Americas 5,030 5,067 2,561 2,511 703 576 8,294 8,154
8,845 8,049 5,856 5,653 2,642 1,952 17,343 15,654
Reconciliation to total assets as reported in the Group Balance SheetInvestments in associates 574 554
78 97133 79
Deferred income tax assets 336 489Liquid investments 318 370Cash and cash equivalents 1,006 1,102
Total assets as reported in the Group Balance Sheet 19,788 18,345
Segment liabilities
Europe 823 753 777 877 405 337 2,005 1,967Americas 858 901 567 643 151 160 1,576 1,704
1,681 1,654 1,344 1,520 556 497 3,581 3,671
Reconciliation to total liabilities as reported in the Group Balance Sheet Interest-bearing loans and borrowings (current and non-current) 6,498 5,958
122 85Income tax liabilities (current and deferred) 1,556 1,517Capital grants 11 10
Total liabilities as reported in the Group Balance Sheet 11,768 11,241
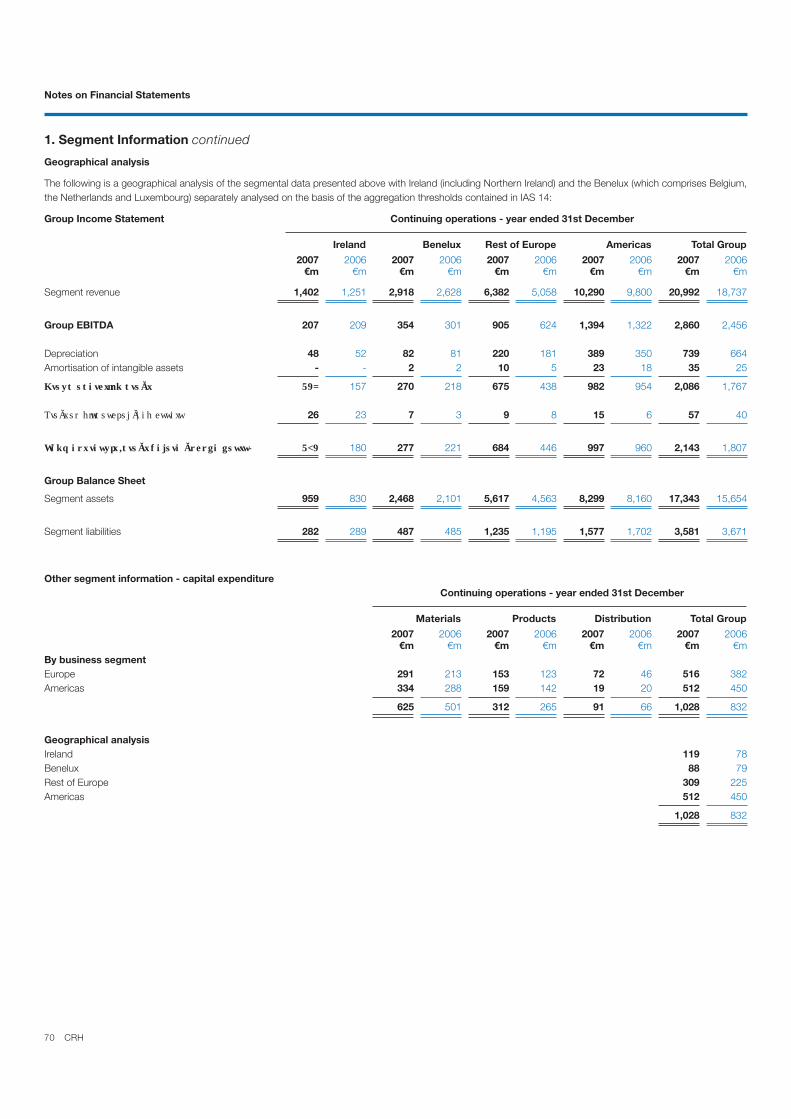
70 CRH
1. Segment Information continued
Geographical analysis
The following is a geographical analysis of the segmental data presented above with Ireland (including Northern Ireland) and the Benelux (which comprises Belgium, the Netherlands and Luxembourg) separately analysed on the basis of the aggregation thresholds contained in IAS 14:
Group Income Statement Continuing operations - year ended 31st December
Ireland Benelux Rest of Europe Americas Total Group
2007 2006 2007 2006 2007 2006 2007 2006 2007 2006€m €m €m €m €m €m €m €m €m €m
Segment revenue 1,402 1,251 2,918 2,628 6,382 5,058 10,290 9,800 20,992 18,737
Group EBITDA 207 209 354 301 905 624 1,394 1,322 2,860 2,456
Depreciation 48 52 82 81 220 181 389 350 739 664Amortisation of intangible assets - - 2 2 10 5 23 18 35 25
157 270 218 675 438 982 954 2,086 1,767
26 23 7 3 9 8 15 6 57 40
180 277 221 684 446 997 960 2,143 1,807
Group Balance Sheet
Segment assets 959 830 2,468 2,101 5,617 4,563 8,299 8,160 17,343 15,654
Segment liabilities 282 289 487 485 1,235 1,195 1,577 1,702 3,581 3,671
Other segment information - capital expenditureContinuing operations - year ended 31st December
Materials Products Distribution Total Group
2007 2006 2007 2006 2007 2006 2007 2006 €m €m €m €m €m €m €m €m
By business segmentEurope 291 213 153 123 72 46 516 382Americas 334 288 159 142 19 20 512 450
625 501 312 265 91 66 1,028 832
Geographical analysisIreland 119 78Benelux 88 79Rest of Europe 309 225Americas 512 450
1,028 832
Notes on Financial Statements

71CRH
2. Proportionate Consolidation of Joint Ventures Year ended 31st December
2007 2006Impact on Group Income Statement €m €m
Group share of:Revenue 1,076 901Cost of sales (734) (628)
342 273Operating costs (229) (180)Impairment of Cementbouw bv goodwill (note 14) - (50)
113 43- 4
113 47Finance costs (net) (14) (16)
99 31Income tax expense (25) (18)
13
Depreciation 43 37
Impact on Group Balance Sheet
Group share of:Non-current assets 1,002 806Current assets 380 289
Total assets 1,382 1,095
Total equity 835 553
Non-current liabilities 265 273Current liabilities 282 269
Total liabilities 547 542
Total equity and liabilities 1,382 1,095
Net debt included above (164) (248)
Impact on Group Cash Flow Statement
Group share of:106 87
(224) (75)145 (34)
Net increase/(decrease) in cash and cash equivalents 27 (22)Cash and cash equivalents at 1st January 51 74Translation adjustment (1) (1)
Cash and cash equivalents at 31st December 77 51
Reconciliation of cash and cash equivalents to net debtCash and cash equivalents as above 77 51Liquid investments 1 -
- 1Interest-bearing loans and borrowings (current and non-current) (242) (300)
Net debt at 31st December (164) (248)
The Group’s share of net debt in joint ventures is non-recourse to the Group.

72 CRH
3. Operating Costs 2007 2006 €m €m
Selling and distribution costs 2,675 2,496Administrative expenses 1,474 1,267Other operating expenses 58 96Other operating income (16) (12)
Total 4,191 3,847
Other operating expenses and income comprise the following charges/(credits):
Other operating expensesShare-based payments expense (note 7) 23 16Amortisation of intangible assets (note 14) 35 25Goodwill impairment loss (note 14) - 50
- 5
Total 58 96
Other operating income(4) (7)(5) (1)(4) (2)
Capital grants released (note 28) (3) (2)
Total (16) (12)
of amounts in joint ventures):
2007 2006 €m €mDepreciation- included in cost of sales 447 414- included in operating costs 292 250
Total 739 664
Foreign exchange gains and losses (net)- included in cost of sales 1 1
Operating lease rentals- hire of plant and machinery 109 82- land and buildings 120 99- other operating leases 39 40
Total 268 221
Auditors’ remuneration (included in administrative expenses)Audit fees, including Sarbanes-Oxley attestation 16 17Non-audit services comprising the following:
- 1- other advice 1 -
(i) In addition to the due diligence fees expensed in the Group Income Statement, further due diligence fees of €1.7 million (2006: €0.3 million) paid to the auditors have been included in the fair value of purchase consideration of business combinations for the respective periods.
Notes on Financial Statements
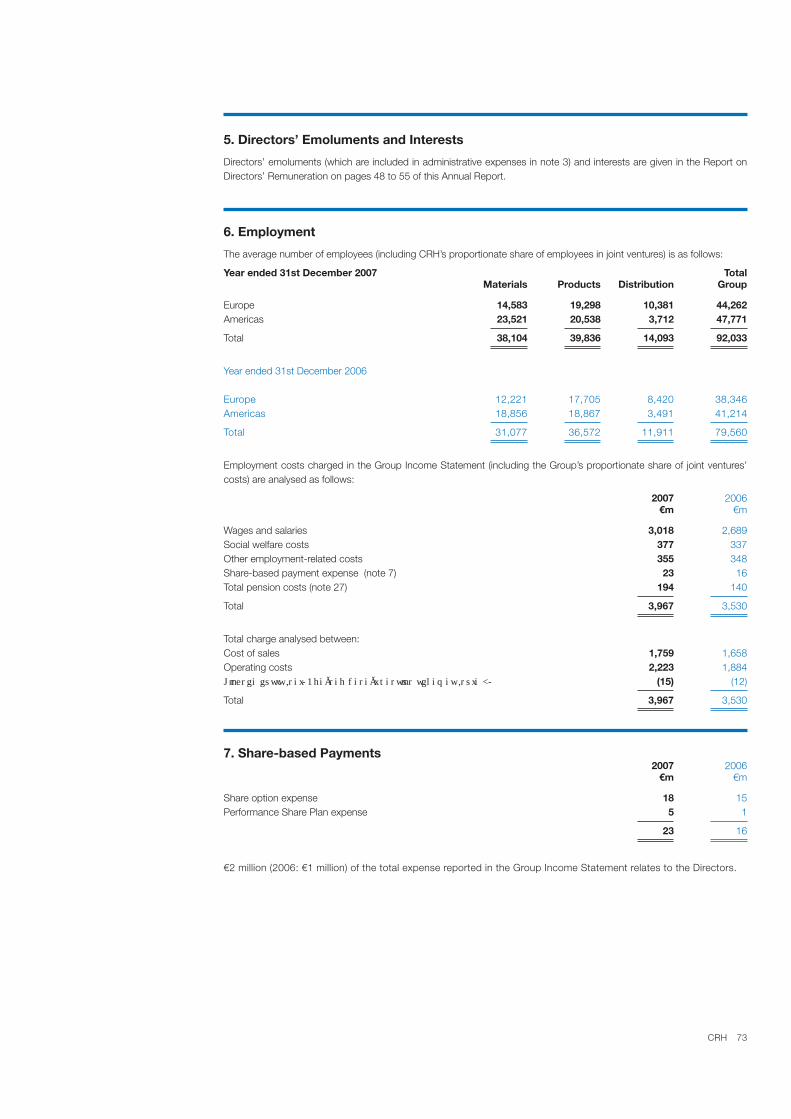
73CRH
5. Directors’ Emoluments and Interests
Directors’ emoluments (which are included in administrative expenses in note 3) and interests are given in the Report on Directors’ Remuneration on pages 48 to 55 of this Annual Report.
6. Employment
The average number of employees (including CRH’s proportionate share of employees in joint ventures) is as follows:
Year ended 31st December 2007 TotalMaterials Products Distribution Group
Europe 14,583 19,298 10,381 44,262Americas 23,521 20,538 3,712 47,771
Total 38,104 39,836 14,093 92,033
Year ended 31st December 2006
Europe 12,221 17,705 8,420 38,346Americas 18,856 18,867 3,491 41,214
Total 31,077 36,572 11,911 79,560
Employment costs charged in the Group Income Statement (including the Group’s proportionate share of joint ventures’ costs) are analysed as follows:
2007 2006€m €m
Wages and salaries 3,018 2,689Social welfare costs 377 337Other employment-related costs 355 348Share-based payment expense (note 7) 23 16Total pension costs (note 27) 194 140
Total 3,967 3,530
Total charge analysed between:Cost of sales 1,759 1,658Operating costs 2,223 1,884
(15) (12)
Total 3,967 3,530
7. Share-based Payments2007 2006
€m €m
Share option expense 18 15Performance Share Plan expense 5 1
23 16
€2 million (2006: €1 million) of the total expense reported in the Group Income Statement relates to the Directors.
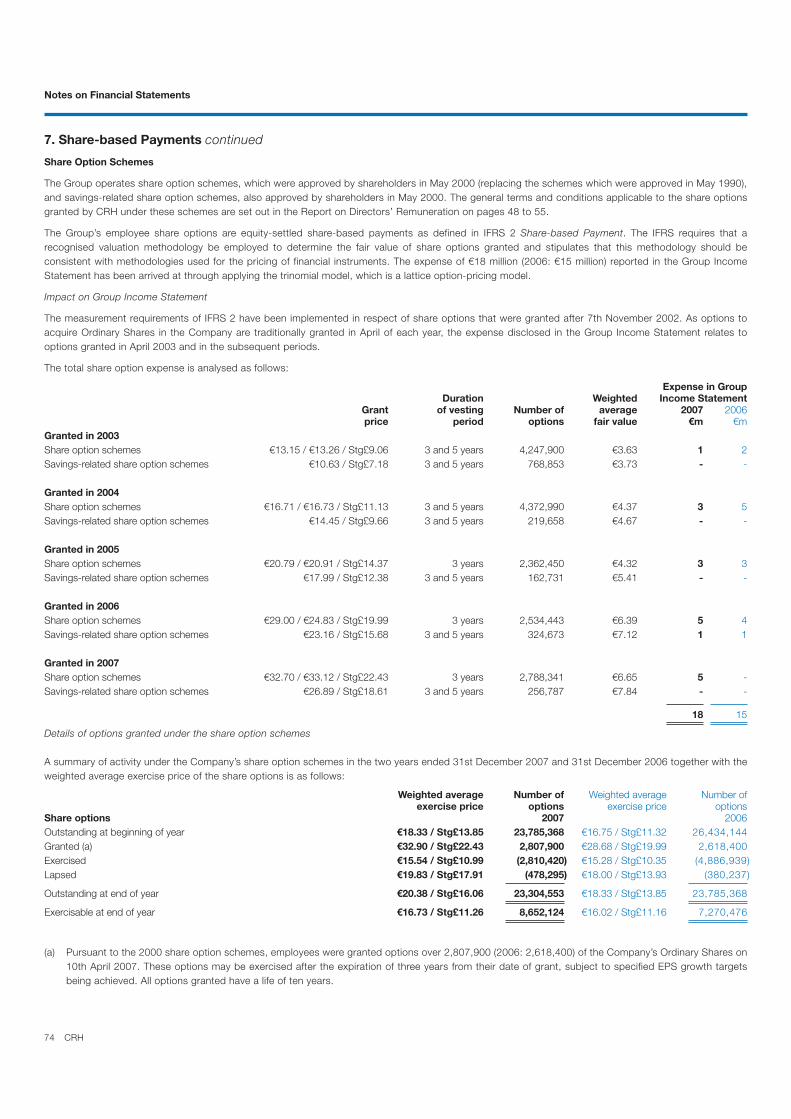
74 CRH
7. Share-based Payments continued
Share Option Schemes
The Group operates share option schemes, which were approved by shareholders in May 2000 (replacing the schemes which were approved in May 1990), and savings-related share option schemes, also approved by shareholders in May 2000. The general terms and conditions applicable to the share options granted by CRH under these schemes are set out in the Report on Directors’ Remuneration on pages 48 to 55.
The Group’s employee share options are equity-settled share-based payments as defined in IFRS 2 Share-based Payment. The IFRS requires that a recognised valuation methodology be employed to determine the fair value of share options granted and stipulates that this methodology should be consistent with methodologies used for the pricing of financial instruments. The expense of €18 million (2006: €15 million) reported in the Group Income Statement has been arrived at through applying the trinomial model, which is a lattice option-pricing model.
Impact on Group Income Statement
The measurement requirements of IFRS 2 have been implemented in respect of share options that were granted after 7th November 2002. As options to acquire Ordinary Shares in the Company are traditionally granted in April of each year, the expense disclosed in the Group Income Statement relates to options granted in April 2003 and in the subsequent periods.
The total share option expense is analysed as follows:
Expense in GroupDuration Weighted Income Statement
Grant of vesting Number of average 2007 2006price period options fair value €m €m
Granted in 2003Share option schemes €13.15 / €13.26 / Stg£9.06 3 and 5 years 4,247,900 €3.63 1 2Savings-related share option schemes €10.63 / Stg£7.18 3 and 5 years 768,853 €3.73 - -
Granted in 2004Share option schemes €16.71 / €16.73 / Stg£11.13 3 and 5 years 4,372,990 €4.37 3 5Savings-related share option schemes €14.45 / Stg£9.66 3 and 5 years 219,658 €4.67 - -
Granted in 2005Share option schemes €20.79 / €20.91 / Stg£14.37 3 years 2,362,450 €4.32 3 3 Savings-related share option schemes €17.99 / Stg£12.38 3 and 5 years 162,731 €5.41 - -
Granted in 2006Share option schemes €29.00 / €24.83 / Stg£19.99 3 years 2,534,443 €6.39 5 4Savings-related share option schemes €23.16 / Stg£15.68 3 and 5 years 324,673 €7.12 1 1
Granted in 2007Share option schemes €32.70 / €33.12 / Stg£22.43 3 years 2,788,341 €6.65 5 -Savings-related share option schemes €26.89 / Stg£18.61 3 and 5 years 256,787 €7.84 - -
18 15
Details of options granted under the share option schemes
A summary of activity under the Company’s share option schemes in the two years ended 31st December 2007 and 31st December 2006 together with the weighted average exercise price of the share options is as follows:
Weighted average Number of Weighted average Number ofexercise price options exercise price options
Share options 2007 2006Outstanding at beginning of year €18.33 / Stg£13.85 23,785,368 €16.75 / Stg£11.32 26,434,144 Granted (a) €32.90 / Stg£22.43 2,807,900 €28.68 / Stg£19.99 2,618,400 Exercised €15.54 / Stg£10.99 (2,810,420) €15.28 / Stg£10.35 (4,886,939)Lapsed €19.83 / Stg£17.91 (478,295) €18.00 / Stg£13.93 (380,237)
Outstanding at end of year €20.38 / Stg£16.06 23,304,553 €18.33 / Stg£13.85 23,785,368
Exercisable at end of year €16.73 / Stg£11.26 8,652,124 €16.02 / Stg£11.16 7,270,476
(a) Pursuant to the 2000 share option schemes, employees were granted options over 2,807,900 (2006: 2,618,400) of the Company’s Ordinary Shares on 10th April 2007. These options may be exercised after the expiration of three years from their date of grant, subject to specified EPS growth targets being achieved. All options granted have a life of ten years.
Notes on Financial Statements

75CRH
7. Share-based Payments continued
Analysis of share options - outstanding at end of year 31st December 2007 31st December 2006
Actual ActualExercise Number remaining Number remaining
prices of options life of options lifeOptions by exercise price€ options €7.09 - - 39,192 0.3
€7.10 - - 258,532 0.3€12.64 354,221 0.3 549,639 1.3€14.57 268,364 1.3 319,714 2.3€14.66 494,307 1.3 571,149 2.3€17.26 1,559,918 2.3 1,810,775 3.3
€18.01 1,505,809 2.3 1,621,136 3.3 €18.28 2,248,403 3.3 2,561,178 4.3€19.68 2,669,495 4.3 3,139,102 5.3
€13.15 1,555,943 5.3 1,793,707 6.3 €13.26 1,382,980 5.3 1,577,980 6.3 €16.71 1,983,221 6.3 2,517,799 7.3 €16.73 1,564,300 6.3 1,910,500 7.3€20.79 1,235,640 7.3 1,292,640 8.3
€20.91 1,073,000 7.3 1,095,000 8.3 €24.83 200,000 8.5 200,000 9.5 €29.00 2,301,070 8.3 2,370,711 9.3 €32.70 1,442,090 9.3 - - €33.12 1,317,500 9.3 - -
Stg£ options Stg£8.22 - - 975 1.3Stg£10.99 13,945 2.3 18,497 3.3
Stg£11.16 8,897 3.3 20,426 4.3Stg£12.04 17,580 4.3 22,880 5.3Stg£9.06 3,717 5.3 6,853 6.3
Stg£11.13 6,769 6.3 14,441 7.3Stg£14.37 37,010 7.3 39,010 8.3
Stg£19.99 31,623 8.3 33,532 9.3Stg£22.43 28,751 9.3 - -
Total outstanding as at 31st December 23,304,553 23,785,368
Analysis of share options - exercisable at end of year
Options by exercise price€ options €7.09 - - 39,192 0.3
€7.10 - - 258,532 0.3€12.64 354,221 0.3 549,639 1.3€14.57 268,364 1.3 319,714 2.3€14.66 494,307 1.3 571,149 2.3€17.26 1,559,918 2.3 776,045 3.3€18.01 1,505,809 2.3 764,307 3.3€18.28 939,903 3.3 1,184,178 4.3€19.68 922,895 4.3 1,283,502 5.3€13.15 587,443 5.3 785,607 6.3€13.26 504,480 5.3 668,980 6.3€16.71 812,076 6.3 - -€16.73 651,800 6.3 - -
Stg£ options Stg£8.22 - - 975 1.3Stg£10.99 13,945 2.3 18,497 3.3Stg£11.16 8,897 3.3 20,426 4.3Stg£12.04 17,580 4.3 22,880 5.3Stg£9.06 3,717 5.3 6,853 6.3
Stg£11.13 6,769 6.3 - -
Total exercisable as at 31st December 8,652,124 7,270,476
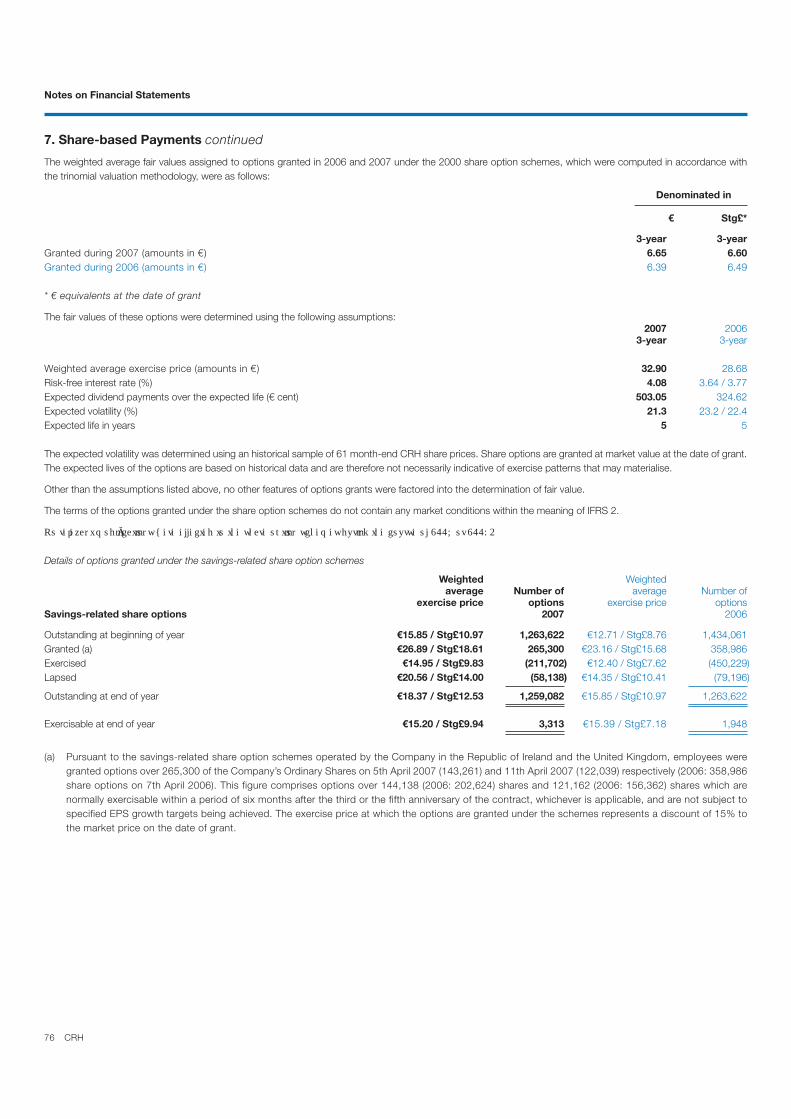
76 CRH
7. Share-based Payments continued
The weighted average fair values assigned to options granted in 2006 and 2007 under the 2000 share option schemes, which were computed in accordance with the trinomial valuation methodology, were as follows:
Denominated in
€ Stg£*
3-year 3-yearGranted during 2007 (amounts in €) 6.65 6.60Granted during 2006 (amounts in €) 6.39 6.49
* € equivalents at the date of grant
The fair values of these options were determined using the following assumptions:2007 2006
3-year 3-year
Weighted average exercise price (amounts in €) 32.90 28.68Risk-free interest rate (%) 4.08 3.64 / 3.77Expected dividend payments over the expected life (€ cent) 503.05 324.62Expected volatility (%) 21.3 23.2 / 22.4Expected life in years 5 5
The expected volatility was determined using an historical sample of 61 month-end CRH share prices. Share options are granted at market value at the date of grant. The expected lives of the options are based on historical data and are therefore not necessarily indicative of exercise patterns that may materialise.
Other than the assumptions listed above, no other features of options grants were factored into the determination of fair value.
The terms of the options granted under the share option schemes do not contain any market conditions within the meaning of IFRS 2.
Details of options granted under the savings-related share option schemes
Weighted Weightedaverage Number of average Number of
exercise price options exercise price optionsSavings-related share options 2007 2006
Outstanding at beginning of year €15.85 / Stg£10.97 1,263,622 €12.71 / Stg£8.76 1,434,061 Granted (a) €26.89 / Stg£18.61 265,300 €23.16 / Stg£15.68 358,986Exercised €14.95 / Stg£9.83 (211,702) €12.40 / Stg£7.62 (450,229)Lapsed €20.56 / Stg£14.00 (58,138) €14.35 / Stg£10.41 (79,196)
Outstanding at end of year €18.37 / Stg£12.53 1,259,082 €15.85 / Stg£10.97 1,263,622
Exercisable at end of year €15.20 / Stg£9.94 3,313 €15.39 / Stg£7.18 1,948
(a) Pursuant to the savings-related share option schemes operated by the Company in the Republic of Ireland and the United Kingdom, employees were granted options over 265,300 of the Company’s Ordinary Shares on 5th April 2007 (143,261) and 11th April 2007 (122,039) respectively (2006: 358,986 share options on 7th April 2006). This figure comprises options over 144,138 (2006: 202,624) shares and 121,162 (2006: 156,362) shares which are normally exercisable within a period of six months after the third or the fifth anniversary of the contract, whichever is applicable, and are not subject to specified EPS growth targets being achieved. The exercise price at which the options are granted under the schemes represents a discount of 15% to the market price on the date of grant.
Notes on Financial Statements
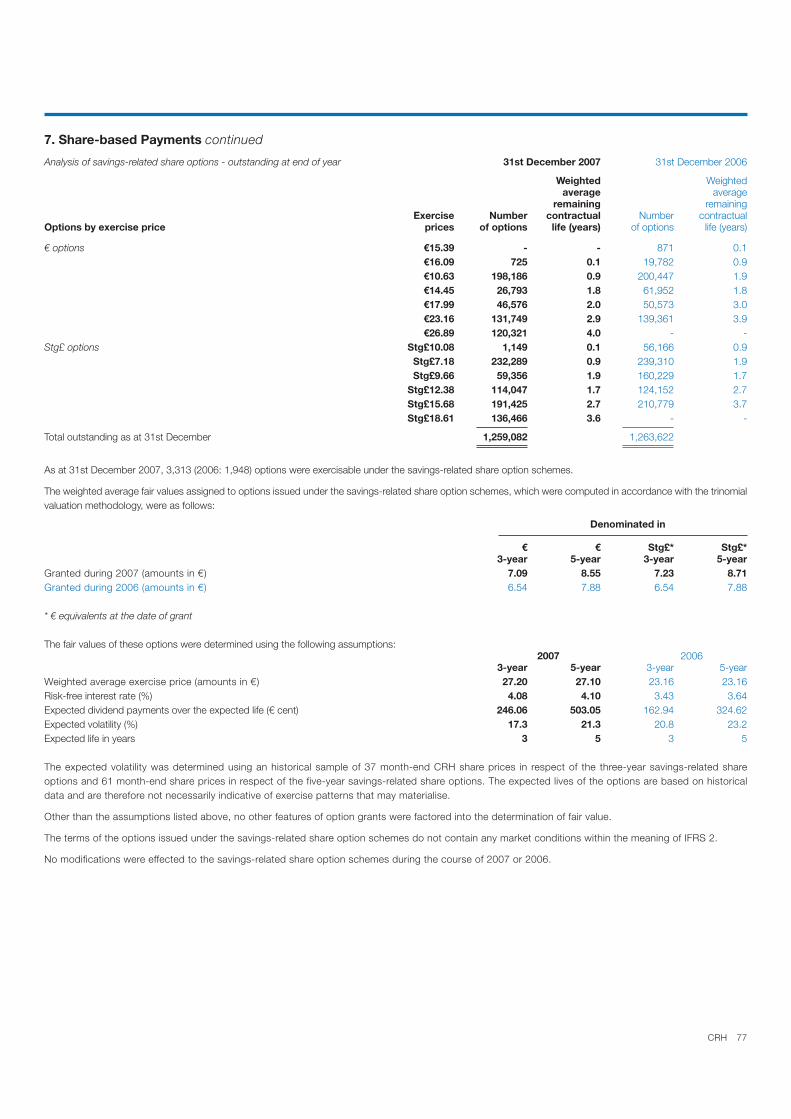
77CRH
7. Share-based Payments continued
Analysis of savings-related share options - outstanding at end of year 31st December 2007 31st December 2006
Weighted Weightedaverage average
remaining remainingExercise Number contractual Number contractual
Options by exercise price prices of options life (years) of options life (years)
€ options €15.39 - - 871 0.1€16.09 725 0.1 19,782 0.9€10.63 198,186 0.9 200,447 1.9€14.45 26,793 1.8 61,952 1.8€17.99 46,576 2.0 50,573 3.0€23.16 131,749 2.9 139,361 3.9€26.89 120,321 4.0 - -
Stg£ options Stg£10.08 1,149 0.1 56,166 0.9Stg£7.18 232,289 0.9 239,310 1.9Stg£9.66 59,356 1.9 160,229 1.7
Stg£12.38 114,047 1.7 124,152 2.7Stg£15.68 191,425 2.7 210,779 3.7Stg£18.61 136,466 3.6 - -
Total outstanding as at 31st December 1,259,082 1,263,622
As at 31st December 2007, 3,313 (2006: 1,948) options were exercisable under the savings-related share option schemes.
The weighted average fair values assigned to options issued under the savings-related share option schemes, which were computed in accordance with the trinomial valuation methodology, were as follows:
Denominated in
€ € Stg£* Stg£*3-year 5-year 3-year 5-year
Granted during 2007 (amounts in €) 7.09 8.55 7.23 8.71Granted during 2006 (amounts in €) 6.54 7.88 6.54 7.88
* € equivalents at the date of grant
The fair values of these options were determined using the following assumptions:2007 2006
3-year 5-year 3-year 5-yearWeighted average exercise price (amounts in €) 27.20 27.10 23.16 23.16Risk-free interest rate (%) 4.08 4.10 3.43 3.64Expected dividend payments over the expected life (€ cent) 246.06 503.05 162.94 324.62Expected volatility (%) 17.3 21.3 20.8 23.2Expected life in years 3 5 3 5
The expected volatility was determined using an historical sample of 37 month-end CRH share prices in respect of the three-year savings-related share options and 61 month-end share prices in respect of the five-year savings-related share options. The expected lives of the options are based on historical data and are therefore not necessarily indicative of exercise patterns that may materialise.
Other than the assumptions listed above, no other features of option grants were factored into the determination of fair value.
The terms of the options issued under the savings-related share option schemes do not contain any market conditions within the meaning of IFRS 2.
No modifications were effected to the savings-related share option schemes during the course of 2007 or 2006.
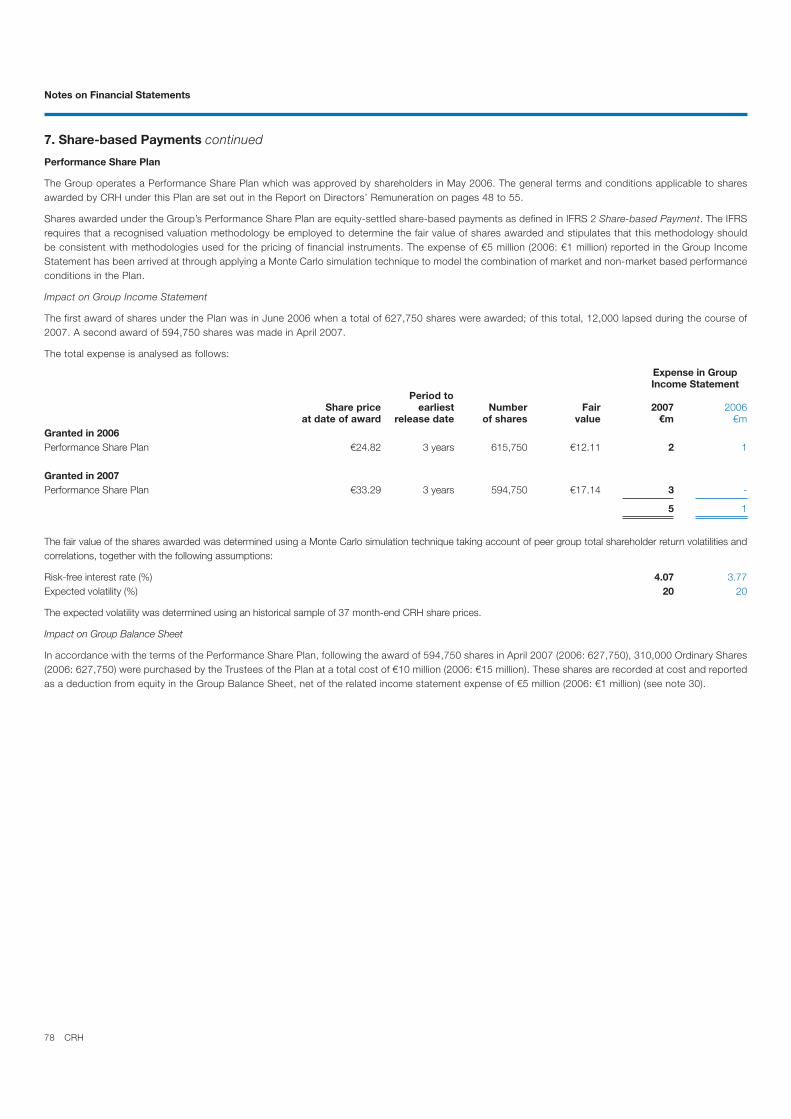
78 CRH
7. Share-based Payments continued
Performance Share Plan
The Group operates a Performance Share Plan which was approved by shareholders in May 2006. The general terms and conditions applicable to shares awarded by CRH under this Plan are set out in the Report on Directors’ Remuneration on pages 48 to 55.
Shares awarded under the Group’s Performance Share Plan are equity-settled share-based payments as defined in IFRS 2 Share-based Payment. The IFRS requires that a recognised valuation methodology be employed to determine the fair value of shares awarded and stipulates that this methodology should be consistent with methodologies used for the pricing of financial instruments. The expense of €5 million (2006: €1 million) reported in the Group Income Statement has been arrived at through applying a Monte Carlo simulation technique to model the combination of market and non-market based performance conditions in the Plan.
Impact on Group Income Statement
The first award of shares under the Plan was in June 2006 when a total of 627,750 shares were awarded; of this total, 12,000 lapsed during the course of 2007. A second award of 594,750 shares was made in April 2007.
The total expense is analysed as follows:
Expense in GroupIncome Statement
Period toShare price earliest Number Fair 2007 2006
at date of award release date of shares value €m €mGranted in 2006Performance Share Plan €24.82 3 years 615,750 €12.11 2 1
Granted in 2007Performance Share Plan €33.29 3 years 594,750 €17.14 3 -
5 1
The fair value of the shares awarded was determined using a Monte Carlo simulation technique taking account of peer group total shareholder return volatilities and correlations, together with the following assumptions:
Risk-free interest rate (%) 4.07 3.77Expected volatility (%) 20 20
The expected volatility was determined using an historical sample of 37 month-end CRH share prices.
Impact on Group Balance Sheet
In accordance with the terms of the Performance Share Plan, following the award of 594,750 shares in April 2007 (2006: 627,750), 310,000 Ordinary Shares (2006: 627,750) were purchased by the Trustees of the Plan at a total cost of €10 million (2006: €15 million). These shares are recorded at cost and reported as a deduction from equity in the Group Balance Sheet, net of the related income statement expense of €5 million (2006: €1 million) (see note 30).
Notes on Financial Statements

79CRH
8. Finance Costs and Finance Revenue 2007 2006 €m €mFinance costs
- by instalments 17 18- not by instalments 230 154
2 3Interest payable on other borrowings 137 160
Total interest payable 386 335Unwinding of discount element of provisions for liabilities (note 25) 17 19Unwinding of discount applicable to deferred and contingent acquisition consideration 5 8Income on interest rate and currency swaps (31) (51)Mark-to-market of designated fair value hedges and related debt and ineffectiveness of net investment hedges:- interest rate swaps (i) (90) 42- currency swaps and forward contracts 2 3
92 (42)92 93
473 407
Finance revenueInterest receivable on loans to joint ventures and associates (4) (5)Interest receivable on liquid investments (18) (15)Interest receivable on cash and cash equivalents (41) (30)
(63) (50)(107) (105)
(170) (155)
Finance costs (net) 303 252
(i) The Group uses interest rate swaps to convert fixed rate debt to floating rate. Fixed rate debt, which has been converted to floating rate through the use of interest rate swaps, is stated in the Group Balance Sheet at adjusted fair value to reflect movements in underlying fixed rates. The movement on this adjustment, together with the offsetting movement in the fair value of the related interest rate swaps, is taken to income in each reporting period.
The Group’s share of associates’ profit after tax is equity-accounted and is presented as a single-line item in the Group Income Statement. The Group’s share of profit after tax generated by associates is analysed as follows between the principal Group Income Statement captions:
2007 2006 €m €mGroup share of:Revenue 806 773
91 72Finance costs (net) (1) (2)
90 70Income tax expense (26) (23)
64 47
(i) The Group’s share of associates’ profit after tax comprises €52 million (2006: €36 million) in Europe Materials, €2 million (2006: €2 million) in Europe Products, €10 million (2006: €7 million) in Europe Distribution and €nil million (2006: €2 million) in Americas Materials.
The aggregated balance sheet data (analysed between current and non-current assets and liabilities) in respect of the Group’s investment in associates is presented in note 15.
80 CRH
10. Income Tax Expense 2007 2006 €m €mCurrent taxIrelandCorporation tax at 12.5% (2006: 12.5%) 17 22Less: manufacturing relief (4) (4)
13 18Overseas tax 398 298
15 12
Total current tax 426 328
Deferred taxOrigination and reversal of temporary differences:
8 10Share-based payments (4) 3
(1) -Other items 37 37
Total deferred tax 40 50
Income tax expense 466 378
Reconciliation of applicable tax rate to effective tax rate1,904 1,602
- current tax expense only 22.4% 20.5%- total income tax expense (current and deferred) 24.5% 23.6%
The following table reconciles the applicable Republic of Ireland statutory tax rate to the effective tax rate (current and deferred) of the Group:
Irish corporation tax rate 12.5 12.5Manufacturing relief in the Republic of Ireland (0.2) (0.3)Higher tax rates on overseas earnings 12.0 12.9Other items (comprising items not chargeable to tax/expenses not deductible for tax) 0.2 (1.5)
Total effective tax rate 24.5 23.6
Current and deferred tax movements applicable to items recognised directly within equity €m €mCurrent taxShare option exercises 13 -
Deferred tax(46) (42)
Share-based payments (39) 27(2) -
Total (74) (15)
Notes on Financial Statements

81CRH
10. Income Tax Expense continued
Factors that may affect future tax charges and other disclosure requirements
Excess of capital allowances over depreciationBased on current capital investment plans, the Group expects to continue to be in a position to claim capital allowances in excess of depreciation in future years.
Unremitted earnings in subsidiaries, joint ventures and associatesNo provision has been recognised in respect of the unremitted earnings of subsidiaries and joint ventures as there is no commitment to remit earnings. A deferred tax liability has been recognised in relation to unremitted earnings of associates on the basis that the exercise of significant influence would not necessarily prevent earnings being remitted by other shareholders in the undertaking.
Investments in subsidiaries and associates and interests in joint venturesNo provision has been made for temporary differences applicable to investments in subsidiaries and interests in joint ventures as the Group is in a position to control the timing of reversal of the temporary differences and it is probable that the temporary differences will not reverse in the foreseeable future. Due to the absence of control in the context of associates, deferred tax liabilities are recognised where appropriate in respect of CRH’s investments in these entities. Given that participation exemptions and tax credits would be available in the context of the Group’s investments in subsidiaries and joint ventures in the majority of the jurisdictions in which the Group operates, the aggregate amount of temporary differences in respect of which deferred tax liabilities have not been recognised would be immaterial.
Other considerationsThe total tax charge in future periods will be affected by any changes to the corporation tax rates in force in the countries in which the Group operates. The current tax charge will also be impacted by changes in the excess of tax depreciation (capital allowances) over accounting depreciation and the use of tax credits.
11. Dividends
As shown in note 29, the Company has various classes of share capital in issue comprising Ordinary Shares, 5% Cumulative Preference Shares and 7% ‘A’ Cumulative Preference Shares. The dividends paid and proposed in respect of these classes of share capital are as follows:
2007 2006Dividends to shareholders €m €mPreference 5% Cumulative Preference Shares €3,175 (2006: €3,175) - -7% ‘A’ Cumulative Preference Shares €77,521 (2006: €77,521) - -EquityFinal - paid 38.50c per Ordinary Share in May 2007 (27.75c paid in May 2006) 209 149Interim - paid 20.00c per Ordinary Share (2006: 13.50c) 109 73
Total 318 222
Dividends proposed (memorandum disclosure)EquityFinal 2007 - proposed 48.00c per Ordinary Share (2006: 38.50c) 260 209
Reconciliation to Cash Flow StatementDividends to shareholders 318 222Less: issue of shares in lieu of dividend (i) (68) (25)
Dividends paid to equity holders of the Company 250 197Dividends paid by subsidiaries to minority interests (note 31) 5 12
Total dividends paid 255 209
(i) In accordance with the scrip dividend scheme, shares to the value of €68 million (2006: €25 million) were issued in lieu of dividends.
82 CRH
12. Earnings per Ordinary Share 2007 2006 €m €mThe computation of basic and diluted earnings per Ordinary Share is set out below:
Numerator computations - basic and diluted earnings per Ordinary Share1,438 1,224
(8) (14)
1,430 1,210Preference dividends - -
1,430 1,210Amortisation of intangible assets 35 25
excluding amortisation of intangible assets 1,465 1,235Depreciation 739 664
Numerator for “cash” earnings per Ordinary Share (ii) 2,204 1,899
Denominator computationsDenominator for basic earnings per Ordinary ShareWeighted average number of Ordinary Shares (millions) outstanding for the year 544.3 539.4Effect of dilutive potential Ordinary Shares (employee share options) (millions) (i) 4.8 4.7
Denominator for diluted earnings per Ordinary Share 549.1 544.1
Basic earnings per Ordinary Share- including amortisation of intangible assets 262.7c 224.3c
- excluding amortisation of intangible assets 269.2c 229.0c
Diluted earnings per Ordinary Share- including amortisation of intangible assets 260.4c 222.4c
- excluding amortisation of intangible assets 266.8c 227.1c
“Cash” earnings per Ordinary Share (ii) 404.9c 352.1c
(i) The issue of certain Ordinary Shares in respect of employee share options is contingent upon satisfaction of specified performance conditions in addition to the passage of time. In accordance with IAS 33 Earnings per Share, these contingently issuable Ordinary Shares (totalling 14,652,429 at 31st December 2007 and 16,514,892 at 31st December 2006) are excluded from the computation of diluted earnings per Ordinary Share where the conditions governing exercisability have not been satisfied as at the end of the reporting period. Vesting of shares awarded under the Performance Share Plan is also contingent upon satisfaction of specified performance conditions and these shares have also been excluded from the computation of diluted earnings.
(ii) “Cash” earnings per Ordinary Share, which is computed through adding amortisation of intangible assets and depreciation to profit attributable to ordinary equity holders of the Company, is presented here for information as management believes it is a useful indicator of the Group’s ability to generate cash from operations. Cash earnings per share is not a recognised measure under generally accepted accounting principles.
Notes on Financial Statements

83CRH
13. Property, Plant and EquipmentAssets in
Land and Plant and course ofbuildings machinery Transport construction Total
31st December 2007 €m €m €m €m €m
At 1st January, net of accumulated depreciation 3,857 3,010 311 302 7,480Translation adjustment (233) (193) (24) (18) (468)
19 177 9 (205) -Additions at cost 148 473 91 316 1,028Arising on acquisition (note 33) 423 486 83 7 999Disposals at net carrying amount (38) (29) (7) - (74)Depreciation charge for year (146) (508) (85) - (739)
At 31st December, net of accumulated depreciation 4,030 3,416 378 402 8,226
At 31st December 2007Cost/deemed cost 4,963 6,303 731 402 12,399 Accumulated depreciation (933) (2,887) (353) - (4,173)
Net carrying amount 4,030 3,416 378 402 8,226
The equivalent disclosure for the prior year is as follows:
31st December 2006
At 1st January, net of accumulated depreciation 3,679 2,599 257 289 6,824 Translation adjustment (213) (156) (23) (15) (407)
Additions at cost 92 428 87 225 832 Arising on acquisition (note 33) 414 633 21 16 1,084 Disposals at net carrying amount (46) (119) (24) - (189) Depreciation charge for year (136) (456) (72) - (664)
At 31st December, net of accumulated depreciation 3,857 3,010 311 302 7,480
At 31st December 2006Cost/deemed cost 4,689 5,675 656 302 11,322Accumulated depreciation (832) (2,665) (345) - (3,842)
Net carrying amount 3,857 3,010 311 302 7,480
The carrying value of mineral-bearing land included in the land and buildings category above amounted to €1,690 million at the balance sheet date (2006: €1,793 million).
Borrowing costs capitalised during the financial year amounted to €3 million (2006: nil). The capitalisation rate employed was 5.5%.
Revaluation of land and buildings
Land and buildings purchased since 31st December 1980 are reflected at cost. Land and buildings (excluding buildings of a specialised nature) purchased prior to 31st December 1980 were revalued by professional valuers at that date on an existing use basis; this revaluation was carried forward as deemed cost under the transitional provisions of IFRS 1 First-time Adoption of International Financial Reporting Standards. Other than the aforementioned revaluation, all items of property, plant and equipment are recorded at cost.
The original historical cost of revalued assets cannot be obtained without unreasonable expense. The analysis of land and buildings assets held at deemed cost and at cost is as follows:
2007 2006€m €m
At deemed cost as at 31st December 1980 55 56 At cost post 31st December 1980 4,908 4,633
Total 4,963 4,689

84 CRH
13. Property, Plant and Equipment continued
are as follows:2007 2006
€m €mCost 101 88Accumulated depreciation (38) (23)
Net carrying amount 63 65
Depreciation charge for year 11 6
Future purchase commitments for property, plant and equipment612 340
Authorised by the Directors but not contracted for 466 286
14. Intangible AssetsOther intangible assets
Marketing- Customer- Contract-Goodwill related related based Total
31st December 2007 €m €m €m €m €m
At 1st January, net of accumulated impairment losses and amortisation 2,841 17 97 11 2,966 Translation adjustment (166) (1) (10) (1) (178)Arising on acquisition (note 33) 807 6 117 9 939Amortisation charge for year (i) - (4) (29) (2) (35)
At 31st December, net of accumulated impairment losses and amortisation 3,482 18 175 17 3,692
At 31st December 2007Cost 3,532 27 230 21 3,810Accumulated impairment losses and amortisation (50) (9) (55) (4) (118)
Net carrying amount 3,482 18 175 17 3,692
The equivalent disclosure for the prior year is as follows:
31st December 2006
At 1st January, net of accumulated amortisation 2,194 8 46 4 2,252 Translation adjustment (121) - (6) - (127)Arising on acquisition (note 33) 818 12 78 8 916 Impairment loss (50) - - - (50)Amortisation charge for year (i) - (3) (21) (1) (25)
At 31st December, net of accumulated impairment losses and amortisation 2,841 17 97 11 2,966
At 31st December 2006Cost 2,891 23 126 12 3,052 Accumulated impairment losses and amortisation (50) (6) (29) (1) (86)
Net carrying amount 2,841 17 97 11 2,966
(i) Goodwill is not subject to amortisation under IFRS. The useful lives of all other intangible assets are finite and, in general, range from one to ten years dependent on the nature of the asset.
As noted below, a goodwill impairment loss of €50 million was recognised in 2006 (2007: nil). No impairment losses have been recognised in respect of other intangible assets.
Due to the asset-intensive nature of operations in the Materials business segment (and the fact that goodwill arising on transactions in this segment is typically relatively
segments, wherein the majority of goodwill arises, do not exhibit the same level of asset intensity and hence give rise to the recognition of intangible assets.
Notes on Financial Statements
85CRH
14. Intangible Assets continued
Goodwill
The goodwill balances disclosed above include goodwill arising on the acquisition of joint ventures which are accounted for on the basis of proportionate consolidation. Goodwill arising in respect of investments in associates is included in investments in associates in the Group Balance Sheet (see note 15).
The net book value of goodwill capitalised under previous GAAP (Irish GAAP) as at the transition date to IFRS (1st January 2004) has been treated as deemed cost. Goodwill arising on acquisition since that date is capitalised at cost.
Impairment testing Goodwill is subject to impairment testing on an annual basis.
No impairment losses were recognised by the Group in 2007.
Testing in 2006 identified an impairment in respect of the Group’s 45% share of goodwill in Cementbouw bv, a joint venture which was established in 2003 in a leveraged buyout of Cementbouw’s materials trading and readymixed concrete operations in the Netherlands, undertaken in conjunction with CRH’s 100% purchase of Cementbouw’s distribution, concrete and clay products activities. An impairment loss of €50 million was recognised in the Group Income Statement for the 2006 financial year and included in the segment result for Europe Products in that year (note 1). During 2007, the Group acquired the remaining 55% of Cementbouw bv (see note 33).
Cash-generating unitsGoodwill acquired through business combination activity has been allocated to cash-generating units for the purposes of impairment testing based on the business segment into which the business combination will be assimilated. The cash-generating units represent the lowest level within the Group at which the associated goodwill is monitored for internal management purposes and are not larger than the primary and secondary segments determined in accordance with IAS 14 Segment Reporting. A total of 24 cash-generating units have been identified and these are analysed as follows between the six business segments in the Group:
Cash-generating unitsEurope Materials 7Europe Products 5Europe Distribution 1Americas Materials 5Americas Products 5Americas Distribution 1
Total cash-generating units 24
Impairment testing methodology and resultsThe recoverable amount of each of the 24 cash-generating units is determined based on a value-in-use computation. The cash flow forecasts employed for the value-in-use computation are extracted from a five-year strategic plan document formally approved by senior management and the Board of Directors and specifically exclude incremental profits and other cash flows stemming from future acquisition activity. The five-year cash flows obtained from this document are projected forward for an additional five years using the lower of historical compound annual growth and anticipated inflation as the relevant general growth factor. A 20-year annuity-based terminal value is calculated using the average of the last five years’ cash flows adjusted to take account of cumulative inflation to year 10 (being the end of the projection period); the terminal value specifically excludes any underlying growth assumption. The recoverable amount stemming from this exercise represents the present value of the future cash flows, including the terminal value, discounted at a before-tax weighted average cost of capital appropriate to the cash-generating unit being assessed for impairment; the before-tax discount rates range from 7.4% to 10.7% (2006: 7.4% to 10.6%). The average before-tax discount rate represents a premium of circa 0.5 percentage points on the Group’s estimated before-tax weighted average cost of capital.
Key assumptions include management’s estimates of future profitability, replacement capital expenditure requirements, trade working capital investment needs and tax considerations. The duration of the discounted cash flow model is a significant factor in determining the fair value of the cash-generating units and has been arrived at taking account of the Group’s strong financial position, its established history of earnings growth and cash flow generation, its proven ability to pursue and integrate value-enhancing acquisitions and the nature of the building materials industry where product obsolescence risk is very low.
Additional disclosures - significant goodwill amountsThe goodwill allocated to each of the 24 cash-generating units accounts for between 10% and 20% of the total carrying amount of €3,482 million in the case of Europe Distribution (within the Europe Products & Distribution Division) and less than 10% of the total carrying amount in all other cases. The additional disclosures required under IAS 36 Impairment of Assets in relation to significant goodwill amounts arising in Europe Distribution are as follows:
2007 2006Carrying amount of goodwill allocated to the cash-generating unit €342m €334m
Nil NilBasis on which recoverable amount of the cash-generating unit has been assessed Value-in-use Value-in-use
9.3% 9.4%Excess of value-in-use over carrying amount €593m €395m
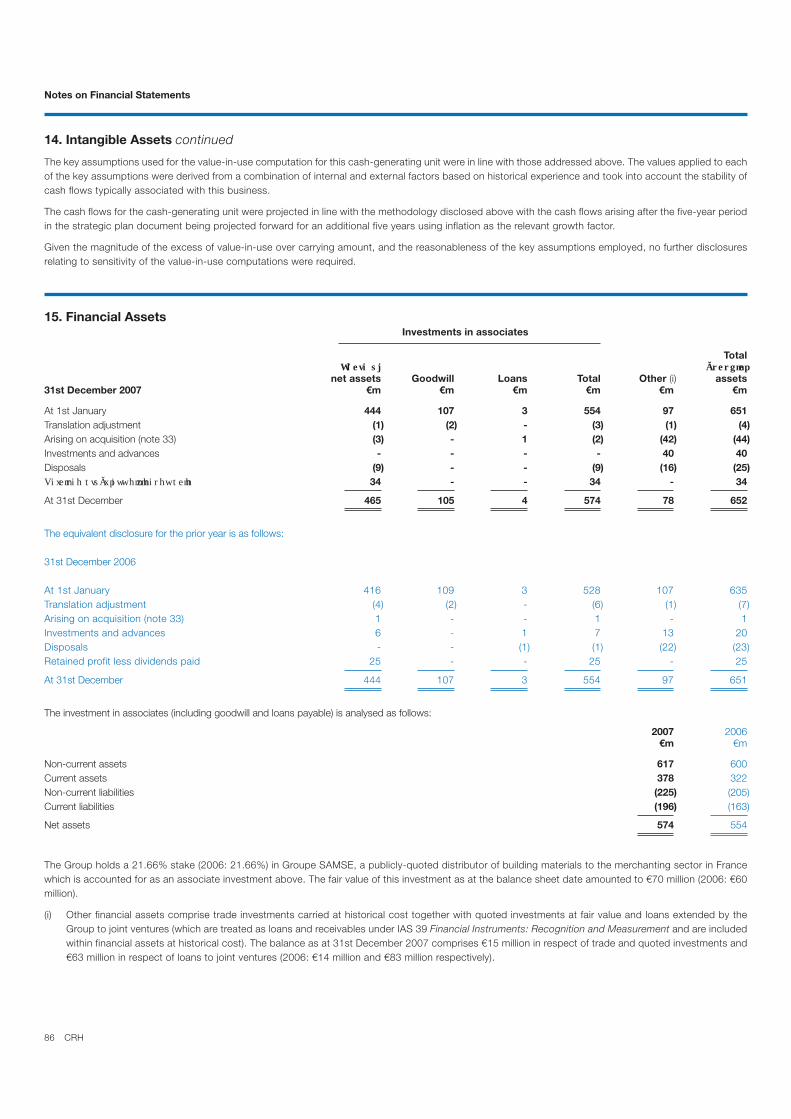
86 CRH
14. Intangible Assets continued
The key assumptions used for the value-in-use computation for this cash-generating unit were in line with those addressed above. The values applied to each of the key assumptions were derived from a combination of internal and external factors based on historical experience and took into account the stability of cash flows typically associated with this business.
The cash flows for the cash-generating unit were projected in line with the methodology disclosed above with the cash flows arising after the five-year period in the strategic plan document being projected forward for an additional five years using inflation as the relevant growth factor.
Given the magnitude of the excess of value-in-use over carrying amount, and the reasonableness of the key assumptions employed, no further disclosures relating to sensitivity of the value-in-use computations were required.
15. Financial AssetsInvestments in associates
Total
net assets Goodwill Loans Total Other (i) assets31st December 2007 €m €m €m €m €m €m
At 1st January 444 107 3 554 97 651Translation adjustment (1) (2) - (3) (1) (4)Arising on acquisition (note 33) (3) - 1 (2) (42) (44)Investments and advances - - - - 40 40Disposals (9) - - (9) (16) (25)
34 - - 34 - 34
At 31st December 465 105 4 574 78 652
The equivalent disclosure for the prior year is as follows:
31st December 2006
At 1st January 416 109 3 528 107 635 Translation adjustment (4) (2) - (6) (1) (7) Arising on acquisition (note 33) 1 - - 1 - 1 Investments and advances 6 - 1 7 13 20 Disposals - - (1) (1) (22) (23) Retained profit less dividends paid 25 - - 25 - 25
At 31st December 444 107 3 554 97 651
The investment in associates (including goodwill and loans payable) is analysed as follows:
2007 2006€m €m
Non-current assets 617 600 Current assets 378 322 Non-current liabilities (225) (205)Current liabilities (196) (163)
Net assets 574 554
The Group holds a 21.66% stake (2006: 21.66%) in Groupe SAMSE, a publicly-quoted distributor of building materials to the merchanting sector in France which is accounted for as an associate investment above. The fair value of this investment as at the balance sheet date amounted to €70 million (2006: €60 million).
(i) Other financial assets comprise trade investments carried at historical cost together with quoted investments at fair value and loans extended by the Group to joint ventures (which are treated as loans and receivables under IAS 39 Financial Instruments: Recognition and Measurement and are included within financial assets at historical cost). The balance as at 31st December 2007 comprises €15 million in respect of trade and quoted investments and €63 million in respect of loans to joint ventures (2006: €14 million and €83 million respectively).
Notes on Financial Statements
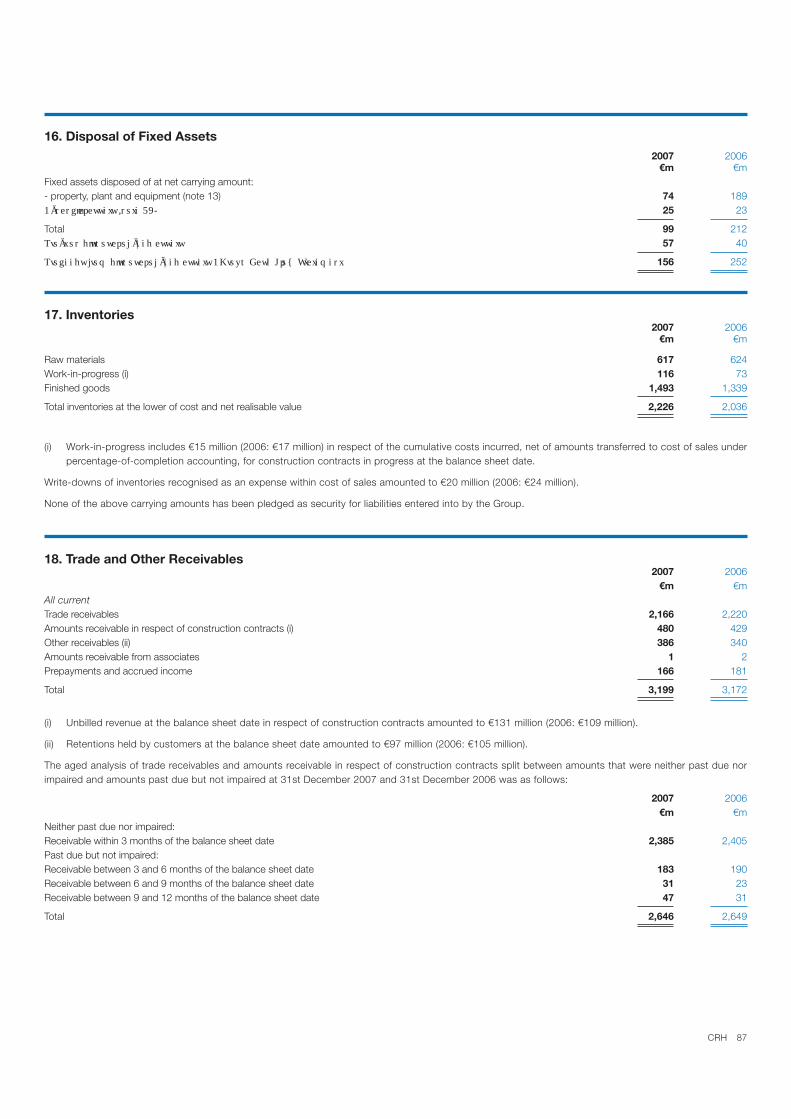
87CRH
16. Disposal of Fixed Assets2007 2006
€m €mFixed assets disposed of at net carrying amount:- property, plant and equipment (note 13) 74 189
25 23
Total 99 212 57 40
156 252
17. Inventories2007 2006
€m €m
Raw materials 617 624Work-in-progress (i) 116 73 Finished goods 1,493 1,339
Total inventories at the lower of cost and net realisable value 2,226 2,036
(i) Work-in-progress includes €15 million (2006: €17 million) in respect of the cumulative costs incurred, net of amounts transferred to cost of sales under percentage-of-completion accounting, for construction contracts in progress at the balance sheet date.
Write-downs of inventories recognised as an expense within cost of sales amounted to €20 million (2006: €24 million).
None of the above carrying amounts has been pledged as security for liabilities entered into by the Group.
18. Trade and Other Receivables2007 2006
€m €mAll currentTrade receivables 2,166 2,220 Amounts receivable in respect of construction contracts (i) 480 429 Other receivables (ii) 386 340 Amounts receivable from associates 1 2 Prepayments and accrued income 166 181
Total 3,199 3,172
(i) Unbilled revenue at the balance sheet date in respect of construction contracts amounted to €131 million (2006: €109 million).
(ii) Retentions held by customers at the balance sheet date amounted to €97 million (2006: €105 million).
The aged analysis of trade receivables and amounts receivable in respect of construction contracts split between amounts that were neither past due nor impaired and amounts past due but not impaired at 31st December 2007 and 31st December 2006 was as follows:
2007 2006€m €m
Neither past due nor impaired:Receivable within 3 months of the balance sheet date 2,385 2,405Past due but not impaired:Receivable between 3 and 6 months of the balance sheet date 183 190 Receivable between 6 and 9 months of the balance sheet date 31 23Receivable between 9 and 12 months of the balance sheet date 47 31
Total 2,646 2,649

88 CRH
18. Trade and Other Receivables continued
Trade receivables and amounts receivable in respect of construction contract activity are in general receivable within 90 days of the balance sheet date, are unsecured and are not interest-bearing. The figures disclosed above are stated net of provisions for impairment. The movements in the provision for impairment of receivables are as follows:
2007 2006€m €m
At 1st January 129 118Translation adjustment (6) (5) Arising on acquisition 30 16Provided during year 45 32 Written-off during year (32) (27) Recovered during year (8) (5)
At 31st December 158 129
A general discussion of the terms and conditions applicable to related party receivables is provided in note 34 to the financial statements.
19. Trade and Other Payables2007 2006
€m €mCurrentTrade payables 1,475 1,399 Irish employment-related taxes 5 5 Other employment-related taxes 70 51Value added tax 93 92 Deferred and contingent acquisition consideration 49 110 Other payables (i) 441 383 Accruals and deferred income 801 719 Amounts payable to associates 22 29
Subtotal - current 2,956 2,788
Non-currentOther payables 33 24 Deferred and contingent acquisition consideration (stated at net present cost) due as follows:- between one and two years 42 29
36 63 30 44
Subtotal - non-current 141 160
Total 3,097 2,948
(i) Billings in excess of costs incurred together with advances received from customers in respect of work to be performed under construction contracts and foreseeable losses thereon amounted to €216 million at the balance sheet date (2006: €188 million).
Notes on Financial Statements

89CRH
20. Movement in Working CapitalTrade and Trade and
other otherInventories receivables payables Total
31st December 2007 €m €m €m €m
At 1st January 2,036 3,172 (2,948) 2,260Translation adjustment (110) (149) 160 (99)Arising on acquisition (note 33) 263 411 (313) 361Deferred and contingent acquisition consideration:- arising on acquisition (note 33) - - (31) (31)- paid during the year - - 107 107Interest accruals - (1) (8) (9)Increase/(decrease) in working capital 37 (234) (64) (261)
At 31st December 2,226 3,199 (3,097) 2,328
The equivalent disclosure for the prior year is as follows:
At 1st January 1,723 2,476 (2,443) 1,756 Translation adjustment (101) (138) 125 (114) Arising on acquisition (note 33) 363 615 (438) 540 Deferred and contingent acquisition consideration:- arising on acquisition (note 33) - - (98) (98) - paid during the year - - 74 74 Interest accruals - 4 (39) (35) Reclassifications - - 5 5 Increase/(decrease) in working capital 51 215 (134) 132
At 31st December 2,036 3,172 (2,948) 2,260
21. Liquid Investments and Cash and Cash Equivalents
Liquid investmentsLiquid investments comprise short-term deposits and current asset investments which are held as readily disposable stores of value and include investments in government gilts and commercial paper and deposits of less than one year in duration. The maturity of these investments falls outside the three months timeframe for classification as cash and cash equivalents under IAS 7 Cash Flow Statements, and accordingly, the related balances have been separately reported in the Group Balance Sheet and have been categorised as either “held for trading” or “loans and receivables” in accordance with IAS 39 Financial Instruments: Recognition Measurement in the table below. The credit risk attaching to these items is documented in note 23.
2007 2006€m €m
316 366 Loans and receivables 2 4
Total 318 370
Cash and cash equivalentsIn accordance with IAS 7, cash and cash equivalents comprise cash balances held for the purposes of meeting short-term cash commitments and investments which are readily convertible to a known amount of cash and are subject to an insignificant risk of change in value. Where investments are categorised as cash equivalents, the related balances have a maturity of three months or less from the date of investment. Bank overdrafts are included within current interest-bearing loans and borrowings in the Group Balance Sheet.
Cash and cash equivalents are reported at fair value and are analysed as follows:
2007 2006€m €m
Cash at bank and in hand 592 719 Investments (short-term deposits) 414 383
Included in Group Balance Sheet and Group Cash Flow Statement 1,006 1,102
Cash at bank earns interest at floating rates based on daily deposit bank rates. Short-term deposits are made for varying periods of between one day and three months depending on the immediate cash requirements of the Group, and earn interest at the respective short-term deposit rates.
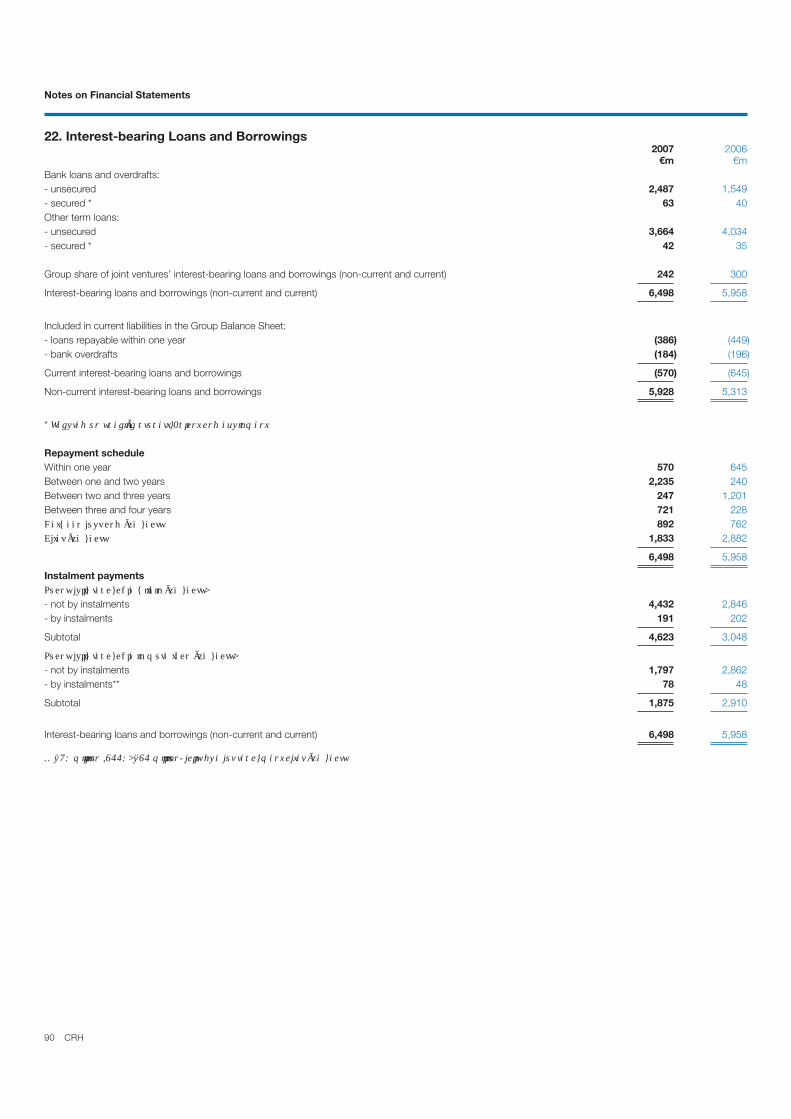
90 CRH
22. Interest-bearing Loans and Borrowings2007 2006
€m €mBank loans and overdrafts:- unsecured 2,487 1,549 - secured * 63 40Other term loans:- unsecured 3,664 4,034 - secured * 42 35
Group share of joint ventures’ interest-bearing loans and borrowings (non-current and current) 242 300
Interest-bearing loans and borrowings (non-current and current) 6,498 5,958
Included in current liabilities in the Group Balance Sheet:- loans repayable within one year (386) (449)- bank overdrafts (184) (196)
Current interest-bearing loans and borrowings (570) (645)
Non-current interest-bearing loans and borrowings 5,928 5,313
*
Repayment scheduleWithin one year 570 645Between one and two years 2,235 240Between two and three years 247 1,201Between three and four years 721 228
892 7621,833 2,882
6,498 5,958
Instalment payments
- not by instalments 4,432 2,846 - by instalments 191 202
Subtotal 4,623 3,048
- not by instalments 1,797 2,862- by instalments** 78 48
Subtotal 1,875 2,910
Interest-bearing loans and borrowings (non-current and current) 6,498 5,958
Notes on Financial Statements

91CRH
22. Interest-bearing Loans and Borrowings continued
Borrowing facilitiesThe Company manages its borrowing ability by entering into committed borrowing agreements. Revolving committed bank facilities are generally available to the Company for periods of up to five years from the date of inception. Various borrowing facilities are available to the Group. The undrawn committed facilities available as at 31st December 2007 and 31st December 2006, in respect of which all conditions precedent had been met, mature as follows:
2007 2006€m €m
Within one year 195 37Between one and two years 1,282 77
122 309- 4
1,599 427
Included in the figures above is an amount of €248 million in respect of the Group’s share of facilities available to joint ventures (2006: €137 million).
GuaranteesThe Company has given letters of guarantee to secure obligations of subsidiary undertakings as follows: €6,205 million in respect of loans, bank advances, derivative obligations and future lease obligations (2006: €5,536 million), €6 million in respect of deferred and contingent acquisition consideration (2006: €11 million), €284 million in respect of letters of credit (2006: €205 million) and €50 million in respect of other obligations (2006: €14 million).
Pursuant to the provisions of Section 17, Companies (Amendment) Act, 1986, the Company has guaranteed the liabilities of its wholly-owned subsidiary undertakings and of Concrete Building Systems Limited and the Oldcastle Finance Company general partnership in the Republic of Ireland for the financial year ended 31st December 2007 and, as a result, such subsidiary undertakings and the general partnership have been exempted from the filing provisions of Section 7, Companies (Amendment) Act, 1986 and Regulation 20 of the European Communities (Accounts Regulations), 1993 respectively.
The Company has not guaranteed any debt or other obligations of joint ventures or associates.
Lender covenantsThe Group’s major bank facilities and debt issued pursuant to Note Purchase Agreements in private placements require the Group to maintain its consolidated EBITDA/net interest cover (excluding share of joint ventures) at no lower than 4.5 times for twelve-month periods ending 30th June and 31st December. Non-compliance with financial covenants would give the relevant lenders the right to demand early repayment of the related debt thus altering the maturity profile of the Group’s debt and the Group’s liquidity.
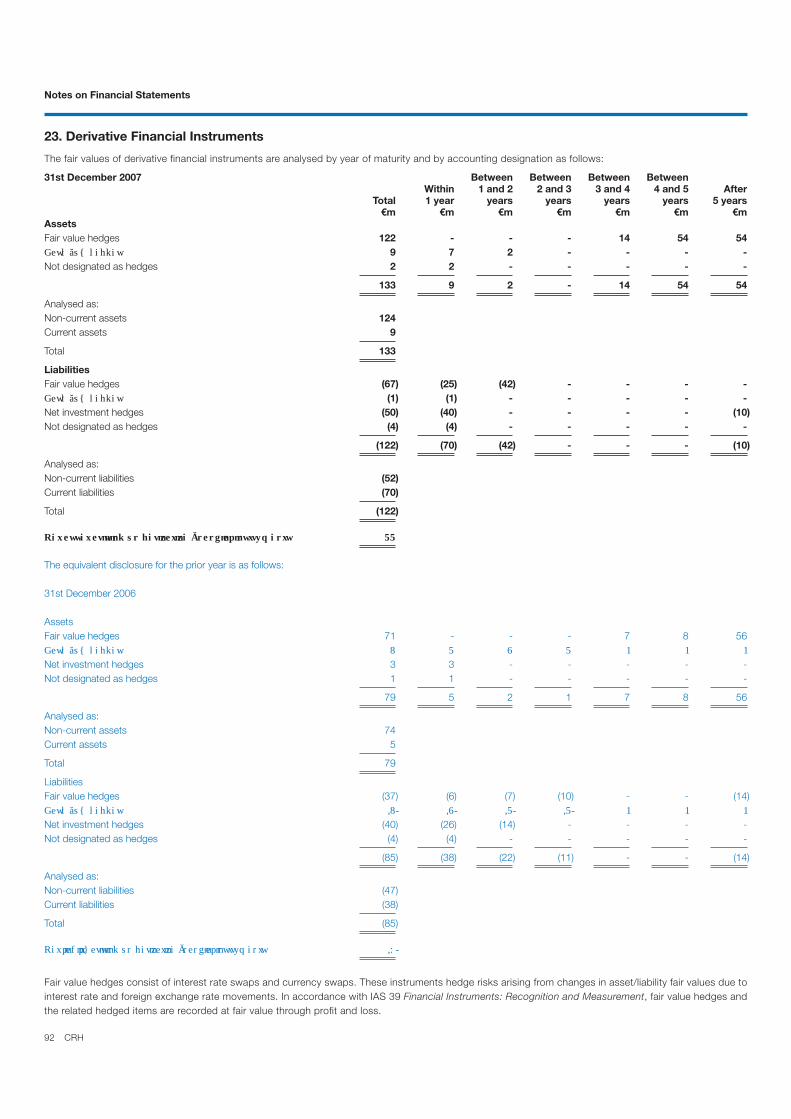
92 CRH
23. Derivative Financial Instruments
The fair values of derivative financial instruments are analysed by year of maturity and by accounting designation as follows:
31st December 2007 Between Between Between BetweenWithin 1 and 2 2 and 3 3 and 4 4 and 5 After
Total 1 year years years years years 5 years€m €m €m €m €m €m €m
AssetsFair value hedges 122 - - - 14 54 54
9 7 2 - - - -Not designated as hedges 2 2 - - - - -
133 9 2 - 14 54 54
Analysed as:Non-current assets 124Current assets 9
Total 133
LiabilitiesFair value hedges (67) (25) (42) - - - -
(1) (1) - - - - -Net investment hedges (50) (40) - - - - (10)Not designated as hedges (4) (4) - - - - -
(122) (70) (42) - - - (10)
Analysed as:Non-current liabilities (52)Current liabilities (70)
Total (122)
The equivalent disclosure for the prior year is as follows:
31st December 2006
AssetsFair value hedges 71 - - - 7 8 56
Net investment hedges 3 3 - - - - -Not designated as hedges 1 1 - - - - -
79 5 2 1 7 8 56
Analysed as:Non-current assets 74Current assets 5
Total 79
LiabilitiesFair value hedges (37) (6) (7) (10) - - (14)
Net investment hedges (40) (26) (14) - - - -Not designated as hedges (4) (4) - - - - -
(85) (38) (22) (11) - - (14)
Analysed as:Non-current liabilities (47)Current liabilities (38)
Total (85)
Fair value hedges consist of interest rate swaps and currency swaps. These instruments hedge risks arising from changes in asset/liability fair values due to interest rate and foreign exchange rate movements. In accordance with IAS 39 Financial Instruments: Recognition and Measurement, fair value hedges and the related hedged items are recorded at fair value through profit and loss.
Notes on Financial Statements

93CRH
23. Derivative Financial Instruments continued
Cash flow hedges consist of forward foreign exchange and commodity contracts and interest rate swaps. These instruments hedge risks arising to future cash flows from movements in foreign exchange rates, commodity prices and interest rates. Cash flow hedges are expected to affect profit and loss in periods closely matching the maturities shown above.
Net investment hedges consist of currency swaps and hedge changes in the value of net investments due to currency movements.
The profit/(loss) impact of fair value, cash flow and net investment hedges on the Group Income Statement is shown below:
2007 2006€m €m
- 191 (42)
(92) 42Net investment hedges - ineffectiveness 1 (2)
Capital managementThe primary objectives of CRH’s capital management strategy are to ensure that the Group maintains a strong credit rating to support the continued organic and acquisitive growth of its business and to maximise shareholder value through optimisation of the debt and equity balance.
The Board periodically reviews the capital structure of the Group, considering the cost of capital and the risks associated with each class of capital. The Group manages and if necessary adjusts its capital structure taking account of underlying economic conditions; any material adjustments to the Group’s capital structure in terms of the relative proportions of debt and equity are approved by the Board. The Group is committed to optimising the use of its balance sheet within the confines of the overall objective to maintain an investment grade credit rating. During the course of 2006, a decision was taken to implement a phased reduction in dividend cover with the objective of achieving dividend cover of 3.5 times for the 2008 financial year; dividend cover for the 2007 financial year amounted to 3.9 times (2006: 4.3 times). In addition, as part of the Board’s capital management strategy, a share buyback programme was initiated subsequent to the balance sheet date in January 2008.
The capital structure of the Group, which comprises net debt and capital and reserves attributable to the Company’s equity holders, may be summarised as follows:
2007 2006€m €m
Capital and reserves attributable to the Company’s equity holders 7,954 7,063Net debt (note 24) 5,163 4,492
Capital and net debt 13,117 11,555
Financial risk management objectives and policiesThe Group uses financial instruments throughout its businesses: interest-bearing loans and borrowings, cash and cash equivalents, short-dated liquid investments and finance leases are used to finance the Group’s operations; trade receivables and trade payables arise directly from operations; and derivatives, principally interest rate and currency swaps and forward foreign exchange contracts, are used to manage interest rate risks and currency exposures and to achieve the desired profile of borrowings. The Group does not trade in financial instruments nor does it enter into any leveraged derivative transactions.
The main risks attaching to the Group’s financial instruments are interest rate risk, foreign currency risk, credit risk and liquidity risk. Commodity price risk is of minimal relevance given that exposure is confined to a small number of contracts entered into for the purpose of hedging future movements in energy costs. The Board reviews and agrees policies for the prudent management of each of these risks as documented below.
Interest rate risk The Group’s exposure to market risk for changes in interest rates stems predominantly from its long-term debt obligations. Interest cost is managed by a centrally-controlled treasury function using a mix of fixed and floating rate debt; in recent years, the Group’s target has been to fix interest rates on approximately 50% of net debt as at the period-end. With the objective of managing this mix in a cost-efficient manner, the Group enters into interest rate swaps, under which the Group contracts to exchange, at predetermined intervals, the difference between fixed and variable interest amounts calculated by reference to a pre-agreed notional principal.
The majority of these swaps are designated under IAS 39 to hedge underlying debt obligations; undesignated financial instruments are termed “not designated as hedges” in the preceding analysis of derivative financial instruments in the Group Balance Sheet.
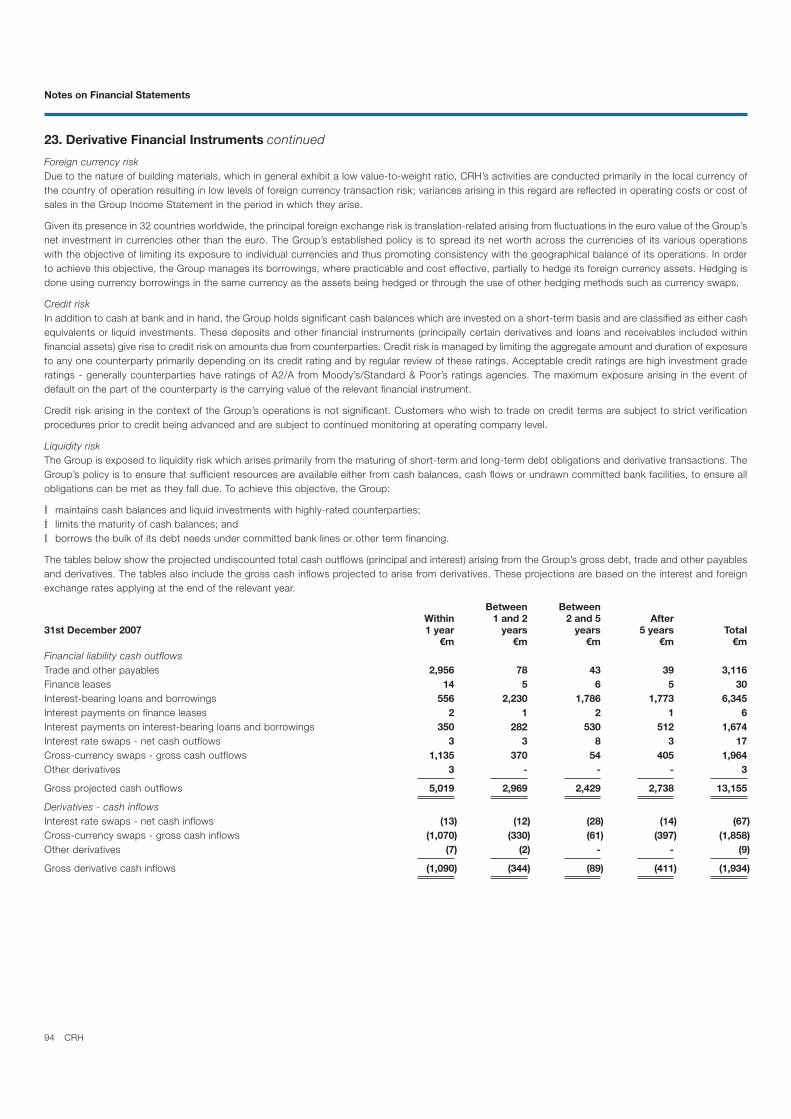
94 CRH
23. Derivative Financial Instruments continued
Foreign currency riskDue to the nature of building materials, which in general exhibit a low value-to-weight ratio, CRH’s activities are conducted primarily in the local currency of the country of operation resulting in low levels of foreign currency transaction risk; variances arising in this regard are reflected in operating costs or cost of sales in the Group Income Statement in the period in which they arise.
Given its presence in 32 countries worldwide, the principal foreign exchange risk is translation-related arising from fluctuations in the euro value of the Group’s net investment in currencies other than the euro. The Group’s established policy is to spread its net worth across the currencies of its various operations with the objective of limiting its exposure to individual currencies and thus promoting consistency with the geographical balance of its operations. In order to achieve this objective, the Group manages its borrowings, where practicable and cost effective, partially to hedge its foreign currency assets. Hedging is done using currency borrowings in the same currency as the assets being hedged or through the use of other hedging methods such as currency swaps.
Credit riskIn addition to cash at bank and in hand, the Group holds significant cash balances which are invested on a short-term basis and are classified as either cash equivalents or liquid investments. These deposits and other financial instruments (principally certain derivatives and loans and receivables included within financial assets) give rise to credit risk on amounts due from counterparties. Credit risk is managed by limiting the aggregate amount and duration of exposure to any one counterparty primarily depending on its credit rating and by regular review of these ratings. Acceptable credit ratings are high investment grade ratings - generally counterparties have ratings of A2/A from Moody’s/Standard & Poor’s ratings agencies. The maximum exposure arising in the event of default on the part of the counterparty is the carrying value of the relevant financial instrument.
Credit risk arising in the context of the Group’s operations is not significant. Customers who wish to trade on credit terms are subject to strict verification procedures prior to credit being advanced and are subject to continued monitoring at operating company level.
Liquidity riskThe Group is exposed to liquidity risk which arises primarily from the maturing of short-term and long-term debt obligations and derivative transactions. The Group’s policy is to ensure that sufficient resources are available either from cash balances, cash flows or undrawn committed bank facilities, to ensure all obligations can be met as they fall due. To achieve this objective, the Group:
maintains cash balances and liquid investments with highly-rated counterparties; limits the maturity of cash balances; andborrows the bulk of its debt needs under committed bank lines or other term financing.
The tables below show the projected undiscounted total cash outflows (principal and interest) arising from the Group’s gross debt, trade and other payables and derivatives. The tables also include the gross cash inflows projected to arise from derivatives. These projections are based on the interest and foreign exchange rates applying at the end of the relevant year.
Between BetweenWithin 1 and 2 2 and 5 After
31st December 2007 1 year years years 5 years Total€m €m €m €m €m
Financial liability cash outflowsTrade and other payables 2,956 78 43 39 3,116Finance leases 14 5 6 5 30Interest-bearing loans and borrowings 556 2,230 1,786 1,773 6,345Interest payments on finance leases 2 1 2 1 6Interest payments on interest-bearing loans and borrowings 350 282 530 512 1,674Interest rate swaps - net cash outflows 3 3 8 3 17Cross-currency swaps - gross cash outflows 1,135 370 54 405 1,964Other derivatives 3 - - - 3
Gross projected cash outflows 5,019 2,969 2,429 2,738 13,155
Derivatives - cash inflowsInterest rate swaps - net cash inflows (13) (12) (28) (14) (67)Cross-currency swaps - gross cash inflows (1,070) (330) (61) (397) (1,858)Other derivatives (7) (2) - - (9)
Gross derivative cash inflows (1,090) (344) (89) (411) (1,934)
Notes on Financial Statements

95CRH
23. Derivative Financial Instruments continued
The equivalent disclosure for the prior year is as follows:Between Between
Within 1 and 2 2 and 5 After31st December 2006 1 year years years 5 years Total
€m €m €m €m €mFinancial liability cash outflowsTrade and other payables 2,788 55 75 58 2,976Finance leases 17 17 13 7 54Interest-bearing loans and borrowings 628 223 2,178 2,875 5,904Interest payments on finance leases 3 2 4 1 10Interest payments on interest-bearing loans and borrowings 326 308 715 709 2,058Interest rate swaps - net cash outflows 5 5 15 9 34Cross-currency swaps - gross cash outflows 1,187 386 350 - 1,923Other derivatives 6 1 1 - 8
Gross projected cash outflows 4,960 997 3,351 3,659 12,967
Derivatives - cash inflowsInterest rate swaps - net cash inflows (10) (10) (27) (10) (57)Cross-currency swaps - gross cash inflows (1,179) (371) (339) - (1,889)Other derivatives (1) (1) - - (2)
Gross derivative cash inflows (1,190) (382) (366) (10) (1,948)
Commodity price riskThe Group’s exposure to price risk in this regard is minimal with the fair value of derivatives used to hedge future energy costs being €7 million favourable as at the balance sheet date (2006: €4 million unfavourable).
24. Analysis of Net Debt
Components of and reconciliation of opening to closing net debtNet debt comprises cash and cash equivalents, liquid investments, derivative financial instrument assets and liabilities and current and non-current interest-bearing loans and borrowings.
At 1st Cash Acqui- Mark-to- Translation At 31st At 31stDecember
Book value Fair value€m €m €m €m €m €m €m
31st December 2007Cash and cash equivalents (note 21) 1,102 (144) 83 - (35) 1,006 1,006Liquid investments (note 21) 370 (29) - - (23) 318 318Interest-bearing loans and borrowings (note 22) (5,958) (703) (222) (92) 477 (6,498) (6,363)
(6) 113 - 86 (182) 11 11
Group net debt (including share of non-recourse debt in joint ventures) (4,492) (763) (139) (6) 237 (5,163) (5,028)
Group net debt excluding proportionately consolidated joint ventures (4,244) (762) (221) (6) 234 (4,999) (4,864)
The equivalent disclosure for the prior year is as follows:
31st December 2006Cash and cash equivalents (note 21) 1,149 (81) 69 - (35) 1,102 1,102 Liquid investments (note 21) 342 35 - - (7) 370 370 Interest-bearing loans and borrowings (note 22) (5,107) (1,042) (239) 42 388 (5,958) (6,017) Derivative financial instruments (net) (note 23) 167 29 - (43) (159) (6) (6)
Group net debt (including share of non-recourse debt in joint ventures) (3,449) (1,059) (170) (1) 187 (4,492) (4,551)
Group net debt excluding proportionately consolidated joint ventures (3,177) (1,081) (171) (2) 187 (4,244) (4,303)
Note (i) appears on page 96.
(i)
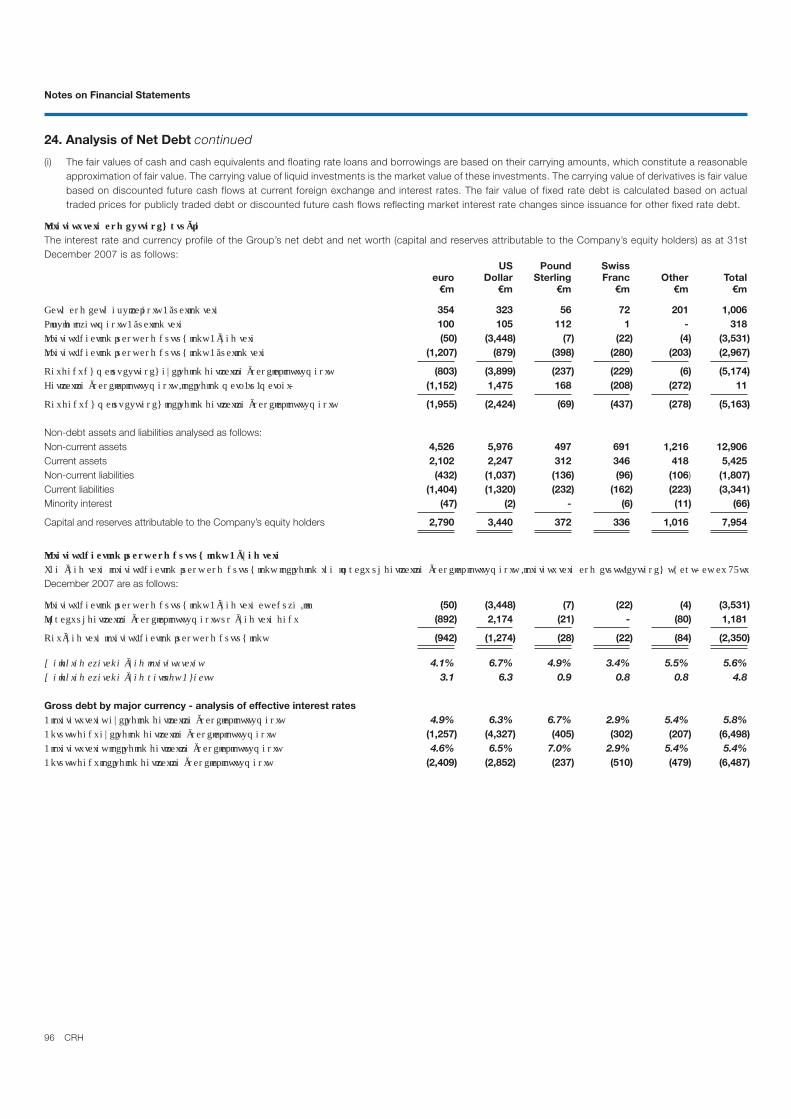
96 CRH
24. Analysis of Net Debt continued
(i) The fair values of cash and cash equivalents and floating rate loans and borrowings are based on their carrying amounts, which constitute a reasonable approximation of fair value. The carrying value of liquid investments is the market value of these investments. The carrying value of derivatives is fair value based on discounted future cash flows at current foreign exchange and interest rates. The fair value of fixed rate debt is calculated based on actual traded prices for publicly traded debt or discounted future cash flows reflecting market interest rate changes since issuance for other fixed rate debt.
The interest rate and currency profile of the Group’s net debt and net worth (capital and reserves attributable to the Company’s equity holders) as at 31st December 2007 is as follows:
US Pound Swisseuro Dollar Sterling Franc Other Total
€m €m €m €m €m €m
354 323 56 72 201 1,006100 105 112 1 - 318(50) (3,448) (7) (22) (4) (3,531)
(1,207) (879) (398) (280) (203) (2,967)
(803) (3,899) (237) (229) (6) (5,174) (1,152) 1,475 168 (208) (272) 11
(1,955) (2,424) (69) (437) (278) (5,163)
Non-debt assets and liabilities analysed as follows:Non-current assets 4,526 5,976 497 691 1,216 12,906Current assets 2,102 2,247 312 346 418 5,425Non-current liabilities (432) (1,037) (136) (96) (106) (1,807)Current liabilities (1,404) (1,320) (232) (162) (223) (3,341)Minority interest (47) (2) - (6) (11) (66)
Capital and reserves attributable to the Company’s equity holders 2,790 3,440 372 336 1,016 7,954
December 2007 are as follows:
(50) (3,448) (7) (22) (4) (3,531)(892) 2,174 (21) - (80) 1,181
(942) (1,274) (28) (22) (84) (2,350)
4.1% 6.7% 4.9% 3.4% 5.5% 5.6%3.1 6.3 0.9 0.8 0.8 4.8
Gross debt by major currency - analysis of effective interest rates 4.9% 6.3% 6.7% 2.9% 5.4% 5.8%
(1,257) (4,327) (405) (302) (207) (6,498)4.6% 6.5% 7.0% 2.9% 5.4% 5.4%
(2,409) (2,852) (237) (510) (479) (6,487)
Notes on Financial Statements
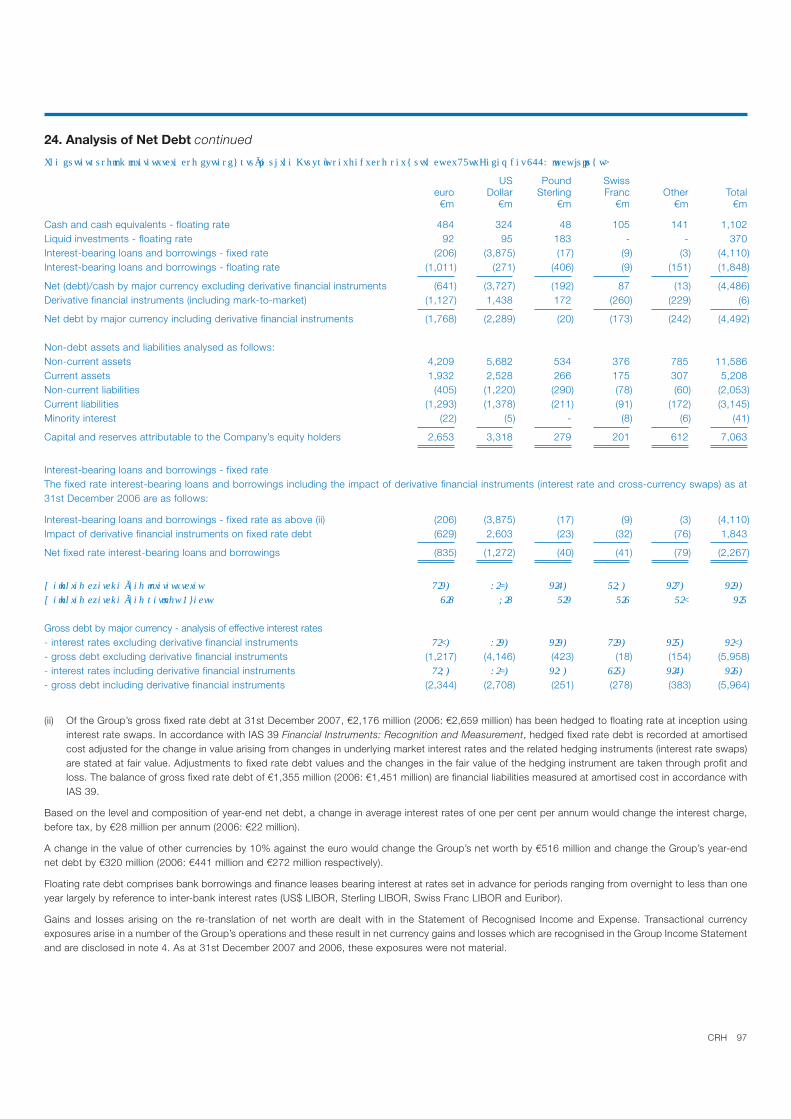
97CRH
24. Analysis of Net Debt continued
US Pound Swisseuro Dollar Sterling Franc Other Total
€m €m €m €m €m €m
Cash and cash equivalents - floating rate 484 324 48 105 141 1,102 Liquid investments - floating rate 92 95 183 - - 370 Interest-bearing loans and borrowings - fixed rate (206) (3,875) (17) (9) (3) (4,110) Interest-bearing loans and borrowings - floating rate (1,011) (271) (406) (9) (151) (1,848)
Net (debt)/cash by major currency excluding derivative financial instruments (641) (3,727) (192) 87 (13) (4,486) Derivative financial instruments (including mark-to-market) (1,127) 1,438 172 (260) (229) (6)
Net debt by major currency including derivative financial instruments (1,768) (2,289) (20) (173) (242) (4,492)
Non-debt assets and liabilities analysed as follows:Non-current assets 4,209 5,682 534 376 785 11,586 Current assets 1,932 2,528 266 175 307 5,208 Non-current liabilities (405) (1,220) (290) (78) (60) (2,053)Current liabilities (1,293) (1,378) (211) (91) (172) (3,145) Minority interest (22) (5) - (8) (6) (41)
Capital and reserves attributable to the Company’s equity holders 2,653 3,318 279 201 612 7,063
Interest-bearing loans and borrowings - fixed rateThe fixed rate interest-bearing loans and borrowings including the impact of derivative financial instruments (interest rate and cross-currency swaps) as at 31st December 2006 are as follows:
Interest-bearing loans and borrowings - fixed rate as above (ii) (206) (3,875) (17) (9) (3) (4,110) Impact of derivative financial instruments on fixed rate debt (629) 2,603 (23) (32) (76) 1,843
Net fixed rate interest-bearing loans and borrowings (835) (1,272) (40) (41) (79) (2,267)
Gross debt by major currency - analysis of effective interest rates- interest rates excluding derivative financial instruments- gross debt excluding derivative financial instruments (1,217) (4,146) (423) (18) (154) (5,958) - interest rates including derivative financial instruments- gross debt including derivative financial instruments (2,344) (2,708) (251) (278) (383) (5,964)
(ii) Of the Group’s gross fixed rate debt at 31st December 2007, €2,176 million (2006: €2,659 million) has been hedged to floating rate at inception using interest rate swaps. In accordance with IAS 39 Financial Instruments: Recognition and Measurement, hedged fixed rate debt is recorded at amortised cost adjusted for the change in value arising from changes in underlying market interest rates and the related hedging instruments (interest rate swaps) are stated at fair value. Adjustments to fixed rate debt values and the changes in the fair value of the hedging instrument are taken through profit and loss. The balance of gross fixed rate debt of €1,355 million (2006: €1,451 million) are financial liabilities measured at amortised cost in accordance with IAS 39.
Based on the level and composition of year-end net debt, a change in average interest rates of one per cent per annum would change the interest charge, before tax, by €28 million per annum (2006: €22 million).
A change in the value of other currencies by 10% against the euro would change the Group’s net worth by €516 million and change the Group’s year-end net debt by €320 million (2006: €441 million and €272 million respectively).
Floating rate debt comprises bank borrowings and finance leases bearing interest at rates set in advance for periods ranging from overnight to less than one year largely by reference to inter-bank interest rates (US$ LIBOR, Sterling LIBOR, Swiss Franc LIBOR and Euribor).
Gains and losses arising on the re-translation of net worth are dealt with in the Statement of Recognised Income and Expense. Transactional currency exposures arise in a number of the Group’s operations and these result in net currency gains and losses which are recognised in the Group Income Statement and are disclosed in note 4. As at 31st December 2007 and 2006, these exposures were not material.

98 CRH
25. Provisions for LiabilitiesProvided Utilised
At 1st Translation Arising on during during Reversed Reclass- Discount At 31st
Net present cost €m €m €m €m €m €m €m €m €m
31st December 2007
Insurance (i) 233 (20) 1 83 (99) - - 11 209Guarantees and warranties (ii) 25 (1) 1 6 (7) (2) - 1 23Rationalisation and redundancy (iii) 23 - 1 19 (29) (2) - 1 13Environment and remediation (iv) 73 (3) 1 11 (18) (2) - 2 64Other 107 (2) (18) 15 (21) (3) - 2 80
Total 461 (26) (14) 134 (174) (9) - 17 389
Analysed as:Non-current liabilities 320 248Current liabilities 141 141
Total 461 389
The equivalent disclosure for the prior year is as follows:
31st December 2006
Insurance (i) 147 (14) 75 104 (92) (1) 2 12 233 Guarantees and warranties (ii) 31 (1) 1 6 (9) (2) (2) 1 25 Rationalisation and redundancy (iii) 16 - 4 15 (12) (2) 1 1 23 Environment and remediation (iv) 79 (3) 7 6 (17) (3) 2 2 73 Other 60 (1) 25 52 (34) - 2 3 107
Total 333 (19) 112 183 (164) (8) 5 19 461
Analysed as:Non-current liabilities 223 320 Current liabilities 110 141
Total 333 461
* Reclassifications (to)/from payables.
(i) InsuranceThis provision relates to workers’ compensation (employers’ liability) and third-party liabilities or claims covered under the Group’s self-insurance schemes. Reflecting the operation of these self-insurance schemes, a substantial portion of the total provision relates to claims which are classified as incurred but not reported in respect of which the Group will bear an excess which will not be recoverable from insurers. In addition, due to the extended timeframe which is typically involved in such claims, a significant component of the total provision is subject to actuarial valuation. Where actuarial valuation is either inappropriate or impractical, other external assessments are made.
(ii) Guarantees and warrantiesSome of the products sold by Group companies (subsidiaries and joint ventures) carry formal guarantees in relation to satisfactory performance spanning varying periods subsequent to purchase. Provision is accordingly made on a net present cost basis for the anticipated cost of honouring such guarantees and warranties at each balance sheet date. Although the expected timing of any payments is uncertain, best estimates have been made in determining a likely cash profile for the purposes of discounting using past experience as a guide.
(iii) Rationalisation and redundancyThese provisions relate to irrevocable commitments under various rationalisation and redundancy programmes throughout the Group, none of which is individually material. The Group expects that these provisions will be utilised within three years of the balance sheet date.
(iv) Environment and remediationThis provision comprises obligations governing site remediation and improvement costs to be incurred in compliance with either local or national environmental regulations together with constructive obligations stemming from established best practice. Whilst a significant element of the total provision will reverse in the medium-term (two to ten years), the majority of the legal and constructive obligations applicable to long-lived assets (principally mineral-bearing land) will unwind over a 30-year timeframe. In discounting the related obligations, expected future cash outflows have been determined with due regard to extraction status and anticipated remaining life.
Notes on Financial Statements

99CRH
26. Deferred Income Tax
The deductible and taxable temporary differences at the balance sheet date in respect of which deferred tax has been recognised are analysed as follows:
2007 2006€m €m
Deferred income tax assets (deductible temporary differences)38 88
1 -Employee share options 21 56Other deductible temporary differences (i) 276 345
Total 336 489
(i) These items relate principally to deferred tax assets arising on deferred and contingent acquisition consideration and provisions for liabilities.
Deferred income tax assets have been recognised in respect of all deductible temporary differences.
Deferred income tax liabilities (taxable temporary differences)Taxable temporary differences principally attributable to accelerated tax depreciation and fair value adjustments arising on acquisition 1,280 1,268
5 3 2 1
Rolled-over capital gains 25 29
Total 1,312 1,301
Movement in net deferred income tax liabilityAt 1st January 812 718 Translation adjustment (67) (63) Net charge for the year (note 10) 40 50 Arising on acquisition (note 33) 104 92
46 42Movement in deferred tax asset on share-based payments 39 (27)
2 -
At 31st December 976 812
The Group operates either defined benefit or defined contribution pension schemes in all of its principal operating areas. Scheme assets are held in separate trustee administered funds.
At the year-end, €49 million (2006: €52 million) was included in other payables in respect of defined contribution pension liabilities.
The Group operates defined benefit pension schemes in the Republic of Ireland, Britain and Northern Ireland, the Netherlands, Belgium, Germany, Portugal, Switzerland and the United States; for the purposes of the disclosures which follow, the schemes in the Republic of Ireland, the Netherlands, Belgium, Germany and Portugal (49% joint venture) have been aggregated into a “Eurozone” category on the basis of common currency and financial assumptions. In line with the principle of proportionate consolidation, the assets, liabilities, income and expenses attaching to defined benefit pension schemes in joint ventures are reflected in the figures below on the basis of the Group’s share of these entities. The majority of the defined benefit pension schemes operated by the Group are funded as disclosed in the analysis of the defined benefit obligation presented below with unfunded schemes restricted to one scheme in each of the Netherlands, Portugal and the United States and three schemes in Germany.
In addition to the aforementioned defined benefit pension schemes, provision has been made in the financial statements for post-retirement healthcare obligations in respect of certain current and former employees principally in the United States and in Portugal and for long-term service commitments in respect of certain employees in the Eurozone and Switzerland. These obligations are unfunded in nature and the required disclosures are set out below.
In all cases, the projected unit credit method has been employed in determining the present value of the obligations arising, the related current service cost and, where applicable, past service cost.

100 CRH
continued
The cumulative actuarial gains and losses attributable to the Group’s defined benefit pension scheme obligations at 1st January 2004 (the date of transition to IFRS) were recognised in full as at that date and adjusted against retained income. Actuarial gains and losses and the associated movement in the net deferred tax asset are recognised via the Statement of Recognised Income and Expense.
Actuarial valuations - funding requirementsThe funding requirements in relation to the Group’s defined benefit schemes are assessed in accordance with the advice of independent qualified actuaries and valuations are prepared in this regard either annually, where local requirements mandate that this be done, or at triennial intervals at a maximum in all other cases. In Ireland and Britain, either the attained age or projected unit credit methods are used in the valuations. In the Netherlands and Switzerland, the actuarial valuations reflect the current unit method, while the valuations are performed in accordance with the projected unit credit methodology in Portugal and Germany. In the United States, valuations are performed using a variety of actuarial cost methodologies - current unit, projected unit and aggregate cost. The actuarial valuations range from January 2005 to December 2007.
The assumptions which have the most significant effect on the results of the actuarial valuations are those relating to the rate of return on investments and the rates of increase in remuneration and pensions. In the course of preparing the funding valuations, it was assumed that the rate of return on investments would, on average, exceed annual remuneration increases by 2% and pension increases by 3% per annum.
In general, actuarial valuations are not available for public inspection; however, the results of valuations are advised to the members of the various schemes.
Financial assumptionsThe financial assumptions employed in the valuation of the defined benefit liabilities arising on pension schemes, post-retirement healthcare obligations and long-term service commitments applying the projected unit credit methodology are as follows:
Scheme liabilitiesThe major long-term assumptions used by the Group’s actuaries in the computation of scheme liabilities as at 31st December 2007 and 31st December 2006 are as follows:
Britain andEurozone Northern Ireland Switzerland United States
2007 2006 2007 2006 2007 2006 2007 2006% % % % % % % %
Rate of increase in:- salaries 4.25 4.00 4.00 4.50 2.25 2.25 4.50 4.50- pensions in payment 2.25 2.00 3.25 3.00 1.00 1.50 - -
2.25 2.00 3.00 2.75 1.50 1.50 2.50 2.50 Discount rate 5.50 4.75 5.75 5.00 3.50 2.75 6.25 5.75Medical cost trend rate 5.25 5.25 n/a n/a n/a n/a 11.00 11.00
The mortality assumptions employed in determining the present value of scheme liabilities under IAS 19 are in accordance with the underlying funding valuations and represent actuarial best practice in the relevant jurisdictions taking account of mortality experience and industry circumstances.
Scheme assetsThe long-term rates of return expected at 31st December 2007 and 31st December 2006, determined in conjunction with the Group’s actuaries and analysed by class of investment, are as follows:
Equities 8.00 7.50 8.00 7.75 6.50 6.00 8.00 8.25 Bonds 4.50 4.00 4.50 4.25 3.25 2.75 6.00 5.75 Property 7.00 7.00 7.00 7.00 4.50 4.00 7.00 7.00 Other 4.00 3.50 5.50 5.00 2.50 2.50 4.25 5.25
Notes on Financial Statements

101CRH
continued
(a) Impact on Group Income Statement
The total expense charged to the Group Income Statement in respect of defined contribution and defined benefit pension schemes, post-retirement healthcare obligations and long-term service commitments is as follows:
2007 2006€m €m
147 117
Pension schemes (funded and unfunded) 46 23Post-retirement healthcare schemes (unfunded) - 2 Long-term service commitments (unfunded) 1 (2)
47 23
Total expense in Group Income Statement 194 140
The total defined benefit expense (comprising funded and unfunded defined benefit pension schemes and unfunded post-retirement healthcare obligations and long-term service commitments) is analysed as follows:
Britain andEurozone Northern Ireland Switzerland United States Total Group
2007 2006 2007 2006 2007 2006 2007 2006 2007 2006€m €m €m €m €m €m €m €m €m €m
Charged in arriving at Group operating profitCurrent service cost 19 33 19 18 16 11 6 8 60 70
1 3 - - 1 - - - 2 3
pension schemes (i) - (38) - - - - - - - (38)
Subtotal 20 (2) 19 18 17 11 6 8 62 35
costs respectively Expected return on scheme assets (50) (55) (31) (27) (16) (13) (10) (10) (107) (105)Interest cost on scheme liabilities 38 42 32 31 12 9 10 11 92 93
Subtotal (12) (13) 1 4 (4) (4) - 1 (15) (12)
Net charge to Group Income Statement 8 (15) 20 22 13 7 6 9 47 23
Actual return on pension scheme assets 2 79 32 33 3 22 9 16 46 150
No reimbursement rights have been recognised as assets in accordance with IAS 19 Employee Benefits.
(i) During 2006, in response to legislative changes implemented in the Netherlands, the Group reached agreement with its employees in the Netherlands on changes to certain pension arrangements which altered their basis under IFRS from defined benefit to defined contribution. This resulted in the elimination of certain defined benefit obligations from the Group Balance Sheet with a resultant gain of €38 million which was reflected in arriving at Group operating profit for the 2006 financial year.
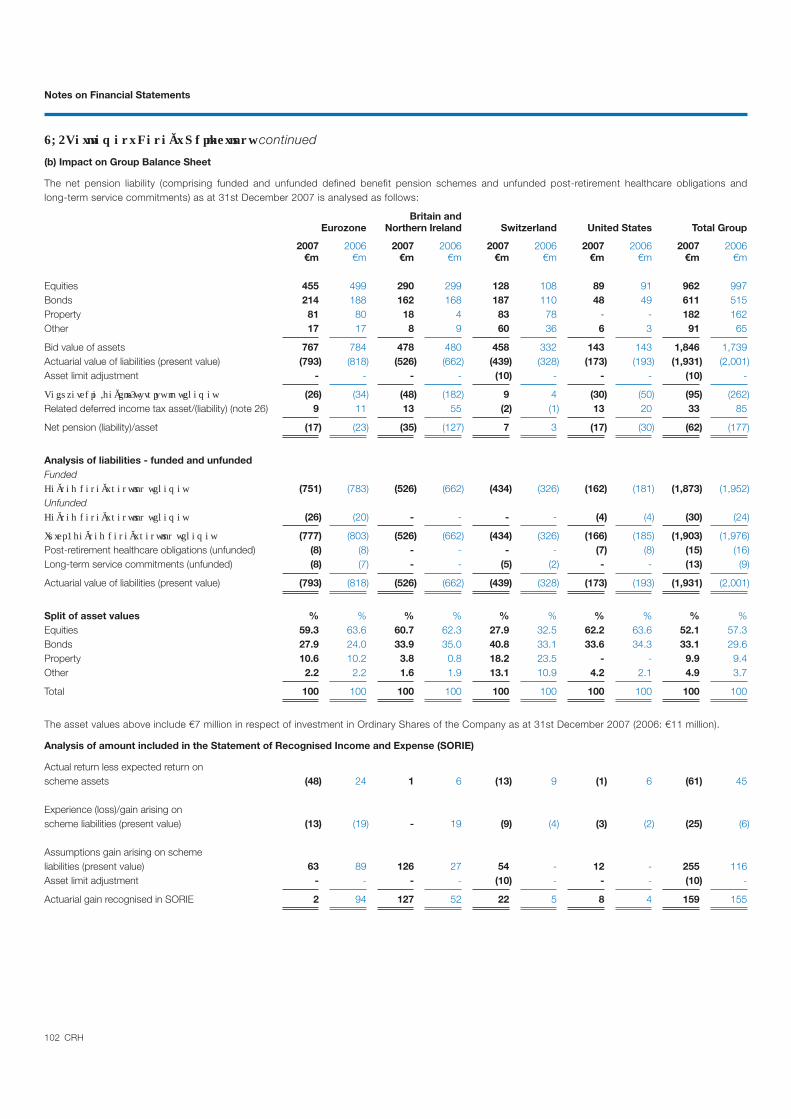
102 CRH
continued
(b) Impact on Group Balance Sheet
The net pension liability (comprising funded and unfunded defined benefit pension schemes and unfunded post-retirement healthcare obligations and long-term service commitments) as at 31st December 2007 is analysed as follows:
Britain andEurozone Northern Ireland Switzerland United States Total Group
2007 2006 2007 2006 2007 2006 2007 2006 2007 2006€m €m €m €m €m €m €m €m €m €m
Equities 455 499 290 299 128 108 89 91 962 997Bonds 214 188 162 168 187 110 48 49 611 515 Property 81 80 18 4 83 78 - - 182 162Other 17 17 8 9 60 36 6 3 91 65
Bid value of assets 767 784 478 480 458 332 143 143 1,846 1,739 Actuarial value of liabilities (present value) (793) (818) (526) (662) (439) (328) (173) (193) (1,931) (2,001)Asset limit adjustment - - - - (10) - - - (10) -
(26) (34) (48) (182) 9 4 (30) (50) (95) (262)Related deferred income tax asset/(liability) (note 26) 9 11 13 55 (2) (1) 13 20 33 85
Net pension (liability)/asset (17) (23) (35) (127) 7 3 (17) (30) (62) (177)
Analysis of liabilities - funded and unfunded Funded
(751) (783) (526) (662) (434) (326) (162) (181) (1,873) (1,952)Unfunded
(26) (20) - - - - (4) (4) (30) (24)
(777) (803) (526) (662) (434) (326) (166) (185) (1,903) (1,976)Post-retirement healthcare obligations (unfunded) (8) (8) - - - - (7) (8) (15) (16)Long-term service commitments (unfunded) (8) (7) - - (5) (2) - - (13) (9)
Actuarial value of liabilities (present value) (793) (818) (526) (662) (439) (328) (173) (193) (1,931) (2,001)
Split of asset values % % % % % % % % % %Equities 59.3 63.6 60.7 62.3 27.9 32.5 62.2 63.6 52.1 57.3 Bonds 27.9 24.0 33.9 35.0 40.8 33.1 33.6 34.3 33.1 29.6Property 10.6 10.2 3.8 0.8 18.2 23.5 - - 9.9 9.4 Other 2.2 2.2 1.6 1.9 13.1 10.9 4.2 2.1 4.9 3.7
Total 100 100 100 100 100 100 100 100 100 100
The asset values above include €7 million in respect of investment in Ordinary Shares of the Company as at 31st December 2007 (2006: €11 million).
Analysis of amount included in the Statement of Recognised Income and Expense (SORIE)
Actual return less expected return on scheme assets (48) 24 1 6 (13) 9 (1) 6 (61) 45
Experience (loss)/gain arising on scheme liabilities (present value) (13) (19) - 19 (9) (4) (3) (2) (25) (6)
Assumptions gain arising on scheme liabilities (present value) 63 89 126 27 54 - 12 - 255 116Asset limit adjustment - - - - (10) - - - (10) -
Actuarial gain recognised in SORIE 2 94 127 52 22 5 8 4 159 155
Notes on Financial Statements
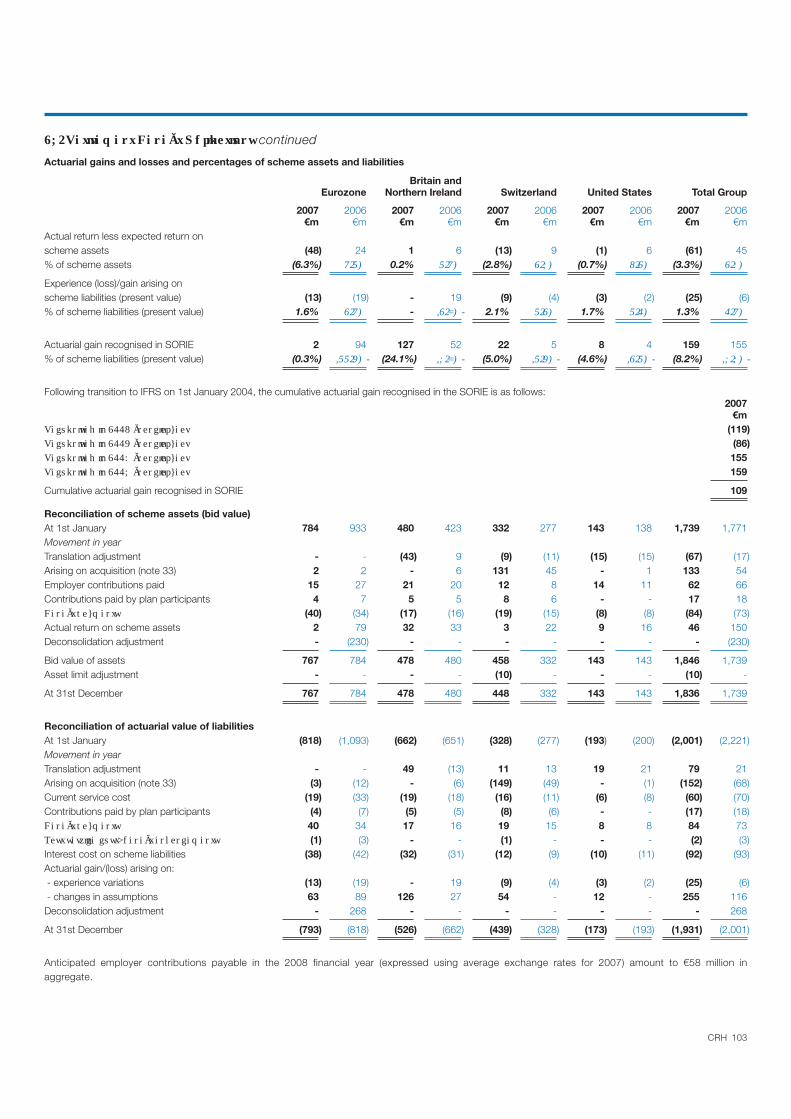
103CRH
continued
Actuarial gains and losses and percentages of scheme assets and liabilities
Britain andEurozone Northern Ireland Switzerland United States Total Group
2007 2006 2007 2006 2007 2006 2007 2006 2007 2006€m €m €m €m €m €m €m €m €m €m
Actual return less expected return on scheme assets (48) 24 1 6 (13) 9 (1) 6 (61) 45% of scheme assets (6.3%) 0.2% (2.8%) (0.7%) (3.3%)
Experience (loss)/gain arising on scheme liabilities (present value) (13) (19) - 19 (9) (4) (3) (2) (25) (6) % of scheme liabilities (present value) 1.6% - 2.1% 1.7% 1.3%
Actuarial gain recognised in SORIE 2 94 127 52 22 5 8 4 159 155% of scheme liabilities (present value) (0.3%) (24.1%) (5.0%) (4.6%) (8.2%)
Following transition to IFRS on 1st January 2004, the cumulative actuarial gain recognised in the SORIE is as follows:2007
€m(119)(86)155159
Cumulative actuarial gain recognised in SORIE 109
Reconciliation of scheme assets (bid value)At 1st January 784 933 480 423 332 277 143 138 1,739 1,771 Movement in yearTranslation adjustment - - (43) 9 (9) (11) (15) (15) (67) (17)Arising on acquisition (note 33) 2 2 - 6 131 45 - 1 133 54Employer contributions paid 15 27 21 20 12 8 14 11 62 66 Contributions paid by plan participants 4 7 5 5 8 6 - - 17 18
(40) (34) (17) (16) (19) (15) (8) (8) (84) (73)Actual return on scheme assets 2 79 32 33 3 22 9 16 46 150Deconsolidation adjustment - (230) - - - - - - - (230)
Bid value of assets 767 784 478 480 458 332 143 143 1,846 1,739Asset limit adjustment - - - - (10) - - - (10) -
At 31st December 767 784 478 480 448 332 143 143 1,836 1,739
Reconciliation of actuarial value of liabilities At 1st January (818) (1,093) (662) (651) (328) (277) (193) (200) (2,001) (2,221)Movement in yearTranslation adjustment - - 49 (13) 11 13 19 21 79 21Arising on acquisition (note 33) (3) (12) - (6) (149) (49) - (1) (152) (68)Current service cost (19) (33) (19) (18) (16) (11) (6) (8) (60) (70)Contributions paid by plan participants (4) (7) (5) (5) (8) (6) - - (17) (18)
40 34 17 16 19 15 8 8 84 73 (1) (3) - - (1) - - - (2) (3)
Interest cost on scheme liabilities (38) (42) (32) (31) (12) (9) (10) (11) (92) (93)Actuarial gain/(loss) arising on: - experience variations (13) (19) - 19 (9) (4) (3) (2) (25) (6) - changes in assumptions 63 89 126 27 54 - 12 - 255 116Deconsolidation adjustment - 268 - - - - - - - 268
At 31st December (793) (818) (526) (662) (439) (328) (173) (193) (1,931) (2,001)
Anticipated employer contributions payable in the 2008 financial year (expressed using average exchange rates for 2007) amount to €58 million in aggregate.

104 CRH
continued
History of scheme assets, liabilities and actuarial gains and losses
Given that the Group transitioned to IFRS with effect from 1st January 2004, a five-year history in respect of assets, liabilities and actuarial gains and losses is not available; the relevant data for the Group for the four years after transition to IFRS are as follows:
2007 2006 2005 2004€m €m €m €m
Bid value of assets 1,846 1,739 1,771 1,465Actuarial value of liabilities (present value) (1,931) (2,001) (2,221) (1,815)Asset limit adjustment (10) - - -
(95) (262) (450) (350)
Actual return less expected return on scheme assets (61) 45 177 17 % of scheme assets (3.3%) 2.6% 10.0% 1.2%
Experience (loss)/gain arising on scheme liabilities (present value) (25) (6) 42 (7)% of scheme liabilities (present value) 1.3% 0.3% (1.9%) 0.4%
The impact of the sensitivity analysis on the key actuarial assumptions employed in the valuation of post-retirement healthcare benefits as required under IAS 19 Employee Benefits is not material to the Group.
28. Capital Grants2007 2006
€m €m
At 1st January 10 12Translation adjustment 1 -Received 3 -
14 12Released to Group Income Statement (3) (2)
At 31st December 11 10
There are no unfulfilled conditions or other contingencies attaching to capital grants received.
Notes on Financial Statements
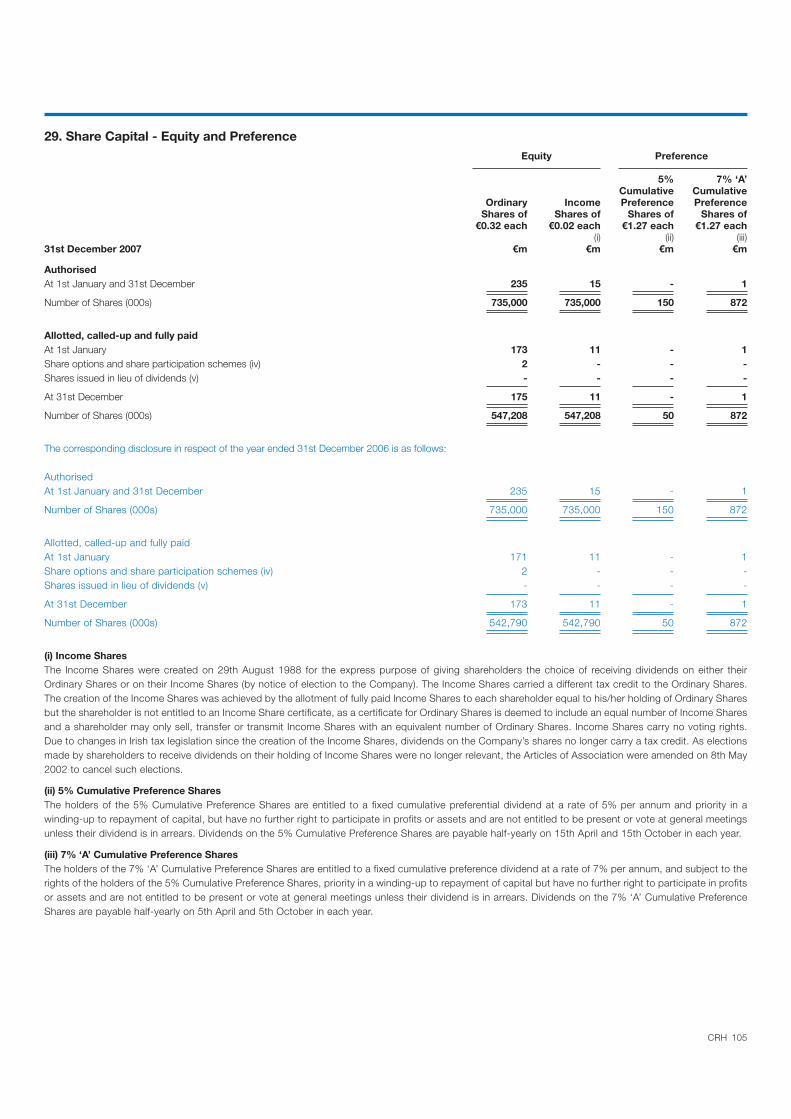
105CRH
29. Share Capital - Equity and PreferenceEquity Preference
5% 7% ‘A’Cumulative Cumulative
Ordinary Income Preference PreferenceShares of Shares of Shares of Shares of
€0.32 each €0.02 each €1.27 each €1.27 each(i) (ii) (iii)
31st December 2007 €m €m €m €m
AuthorisedAt 1st January and 31st December 235 15 - 1
Number of Shares (000s) 735,000 735,000 150 872
Allotted, called-up and fully paidAt 1st January 173 11 - 1Share options and share participation schemes (iv) 2 - - -Shares issued in lieu of dividends (v) - - - -
At 31st December 175 11 - 1
Number of Shares (000s) 547,208 547,208 50 872
The corresponding disclosure in respect of the year ended 31st December 2006 is as follows:
AuthorisedAt 1st January and 31st December 235 15 - 1
Number of Shares (000s) 735,000 735,000 150 872
Allotted, called-up and fully paid At 1st January 171 11 - 1Share options and share participation schemes (iv) 2 - - -Shares issued in lieu of dividends (v) - - - -
At 31st December 173 11 - 1
Number of Shares (000s) 542,790 542,790 50 872
(i) Income Shares The Income Shares were created on 29th August 1988 for the express purpose of giving shareholders the choice of receiving dividends on either their Ordinary Shares or on their Income Shares (by notice of election to the Company). The Income Shares carried a different tax credit to the Ordinary Shares. The creation of the Income Shares was achieved by the allotment of fully paid Income Shares to each shareholder equal to his/her holding of Ordinary Shares but the shareholder is not entitled to an Income Share certificate, as a certificate for Ordinary Shares is deemed to include an equal number of Income Shares and a shareholder may only sell, transfer or transmit Income Shares with an equivalent number of Ordinary Shares. Income Shares carry no voting rights. Due to changes in Irish tax legislation since the creation of the Income Shares, dividends on the Company’s shares no longer carry a tax credit. As elections made by shareholders to receive dividends on their holding of Income Shares were no longer relevant, the Articles of Association were amended on 8th May 2002 to cancel such elections.
(ii) 5% Cumulative Preference Shares The holders of the 5% Cumulative Preference Shares are entitled to a fixed cumulative preferential dividend at a rate of 5% per annum and priority in a winding-up to repayment of capital, but have no further right to participate in profits or assets and are not entitled to be present or vote at general meetings unless their dividend is in arrears. Dividends on the 5% Cumulative Preference Shares are payable half-yearly on 15th April and 15th October in each year.
(iii) 7% ‘A’ Cumulative Preference Shares The holders of the 7% ‘A’ Cumulative Preference Shares are entitled to a fixed cumulative preference dividend at a rate of 7% per annum, and subject to the rights of the holders of the 5% Cumulative Preference Shares, priority in a winding-up to repayment of capital but have no further right to participate in profits or assets and are not entitled to be present or vote at general meetings unless their dividend is in arrears. Dividends on the 7% ‘A’ Cumulative Preference Shares are payable half-yearly on 5th April and 5th October in each year.

106 CRH
29. Share Capital - Equity and Preference continued
(iv) Share schemes Details of share options granted under the Company’s share option schemes and savings-related share option schemes and the terms attaching thereto are provided in note 7 and in the Report on Directors’ Remuneration on pages 48 to 55. Under these schemes, options over a total of 3,022,122 Ordinary Shares were exercised during the financial year (2006: 5,337,168). Of this total, 1,795,766 (2006: 5,337,168) were satisfied by the issue of new shares for total proceeds of €27 million (2006: €80 million). The remaining options were satisfied by the purchase of 1,226,356 Ordinary Shares on the market by the Employee Benefit Trust (see footnote (i) in note 30 below). The difference of €21 million (2006: nil) between the proceeds of €20 million (2006: nil) from the exercise of these latter options and the €41 million cost (2006: nil) of the shares purchased has been debited to retained income.
Share participation schemes At 31st December 2007, 6,028,916 (2006: 5,676,369) Ordinary Shares had been appropriated to participation schemes. The Ordinary Shares appropriated pursuant to these schemes were issued at market value on the dates of appropriation. The shares issued pursuant to these schemes are excluded from the scope of IFRS 2 Share-based Payment and are hence not factored into the expense computation and the associated disclosures in note 7.
During the ten-year period commencing on 3rd May 2000, the total number of Ordinary Shares which may be issued in respect of the share option schemes, the savings-related share option schemes, the share participation schemes and any subsequent share option schemes, may not exceed 15% in aggregate of the issued Ordinary share capital from time to time.
(v) Shares issued in lieu of dividendsIn May 2007, 1,922,128 (2006: 497,960) Ordinary Shares were issued to the holders of Ordinary Shares who elected to receive additional Ordinary Shares at a price of €29.92 (2006: €28.48) per share, instead of part or all of the cash element of their 2006 and 2005 final dividends. In November 2007, 347,752 (2006: 381,691) Ordinary Shares were issued to the holders of Ordinary Shares who elected to receive additional Ordinary Shares at a price of €31.01 (2006: €27.12) per share, instead of part or all of the cash element of their 2007 and 2006 interim dividends.
30. Reserves 2007 2006
Foreign ForeignShare currency Share currency
premium Own Other translation Retained premium Own Other translation Retainedaccount shares (i) reserves reserve income account shares (i) reserves reserve income
€m €m €m €m €m €m €m €m €m €m
At 1st January 2,318 (14) 52 (137) 4,659 2,208 - 37 234 3,533
Currency translation effects - - - (410) - - - - (371) -
Premium on shares issued 102 - - - - 110 - - - -
Share option expense (note 7)
- share option schemes - - 18 - - - - 15 - -
- Performance Share Plan - 5 - - - - 1 - - -
- (10) - - (41) - (15) - - -
Share option exercises (note 29 (iv)) - - - - 20 - - - - -
Dividends (including shares issued in lieu of dividend) (note 11) - - - - (318) - - - - (222)
- - - - 159 - - - - 155
Movement in deferred tax asset on Group - - - - (46) - - - - (42)
Current tax impact of share option exercises - - - - 13 - - - - -
Movement in deferred tax asset on share-based payments - - - - (39) - - - - 27
- - - - 8 - - - - (2)
Movement in deferred tax liability on cash - - - - (2) - - - - -
to equity holders of the Company - - - - 1,430 - - - - 1,210
At 31st December 2,420 (19) 70 (547) 5,843 2,318 (14) 52 (137) 4,659
Notes on Financial Statements
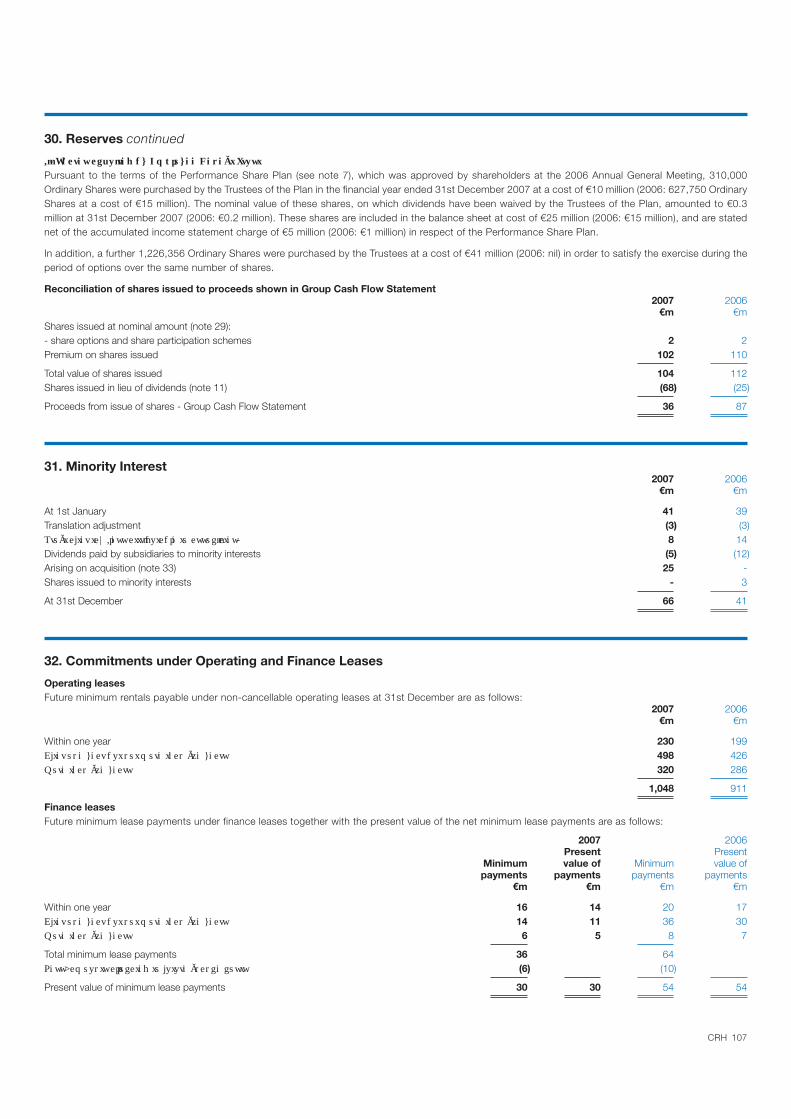
107CRH
30. Reserves continued
Pursuant to the terms of the Performance Share Plan (see note 7), which was approved by shareholders at the 2006 Annual General Meeting, 310,000 Ordinary Shares were purchased by the Trustees of the Plan in the financial year ended 31st December 2007 at a cost of €10 million (2006: 627,750 Ordinary Shares at a cost of €15 million). The nominal value of these shares, on which dividends have been waived by the Trustees of the Plan, amounted to €0.3 million at 31st December 2007 (2006: €0.2 million). These shares are included in the balance sheet at cost of €25 million (2006: €15 million), and are stated net of the accumulated income statement charge of €5 million (2006: €1 million) in respect of the Performance Share Plan.
In addition, a further 1,226,356 Ordinary Shares were purchased by the Trustees at a cost of €41 million (2006: nil) in order to satisfy the exercise during the period of options over the same number of shares.
Reconciliation of shares issued to proceeds shown in Group Cash Flow Statement2007 2006
€m €mShares issued at nominal amount (note 29):- share options and share participation schemes 2 2Premium on shares issued 102 110
Total value of shares issued 104 112Shares issued in lieu of dividends (note 11) (68) (25)
Proceeds from issue of shares - Group Cash Flow Statement 36 87
31. Minority Interest2007 2006
€m €m
At 1st January 41 39 Translation adjustment (3) (3)
8 14Dividends paid by subsidiaries to minority interests (5) (12)Arising on acquisition (note 33) 25 - Shares issued to minority interests - 3
At 31st December 66 41
32. Commitments under Operating and Finance Leases
Operating leasesFuture minimum rentals payable under non-cancellable operating leases at 31st December are as follows:
2007 2006€m €m
Within one year 230 199 498 426 320 286
1,048 911
Finance leasesFuture minimum lease payments under finance leases together with the present value of the net minimum lease payments are as follows:
2007 2006Present Present
Minimum value of Minimum value ofpayments payments payments payments
€m €m €m €m
Within one year 16 14 20 17 14 11 36 30 6 5 8 7
Total minimum lease payments 36 64(6) (10)
Present value of minimum lease payments 30 30 54 54
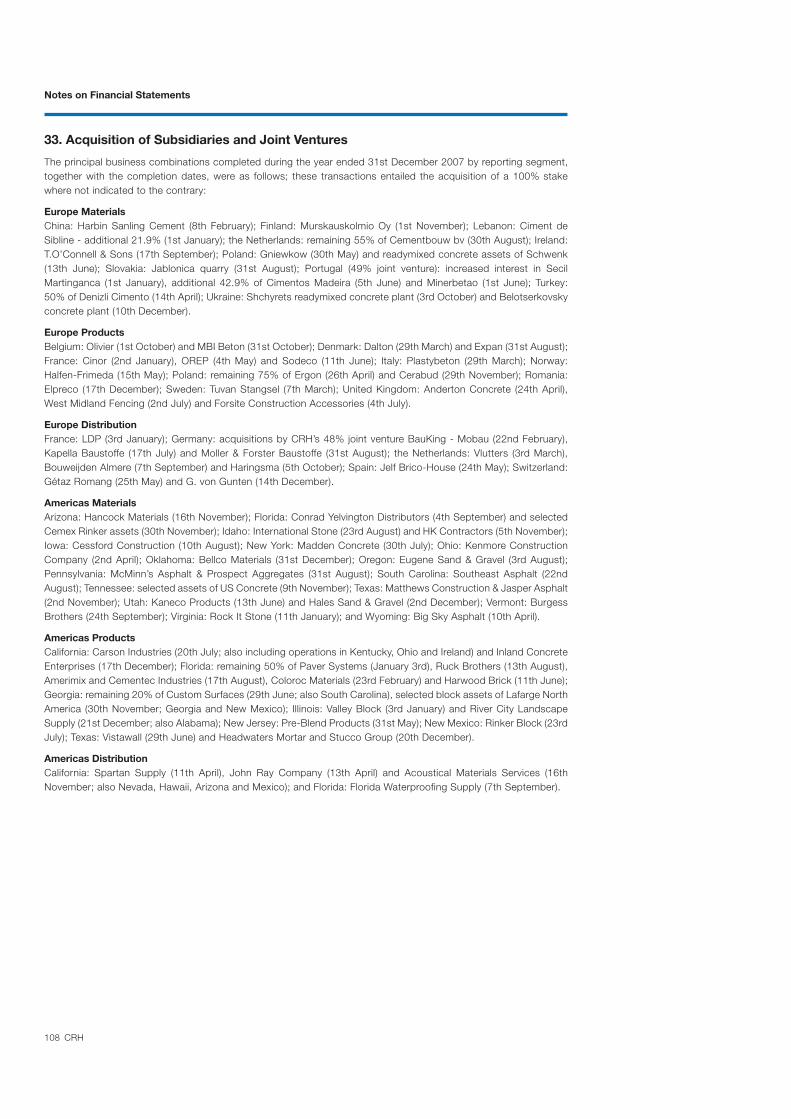
108 CRH
33. Acquisition of Subsidiaries and Joint Ventures
The principal business combinations completed during the year ended 31st December 2007 by reporting segment, together with the completion dates, were as follows; these transactions entailed the acquisition of a 100% stake where not indicated to the contrary:
Europe MaterialsChina: Harbin Sanling Cement (8th February); Finland: Murskauskolmio Oy (1st November); Lebanon: Ciment de Sibline - additional 21.9% (1st January); the Netherlands: remaining 55% of Cementbouw bv (30th August); Ireland: T.O’Connell & Sons (17th September); Poland: Gniewkow (30th May) and readymixed concrete assets of Schwenk (13th June); Slovakia: Jablonica quarry (31st August); Portugal (49% joint venture): increased interest in Secil Martinganca (1st January), additional 42.9% of Cimentos Madeira (5th June) and Minerbetao (1st June); Turkey: 50% of Denizli Cimento (14th April); Ukraine: Shchyrets readymixed concrete plant (3rd October) and Belotserkovsky concrete plant (10th December).
Europe ProductsBelgium: Olivier (1st October) and MBI Beton (31st October); Denmark: Dalton (29th March) and Expan (31st August); France: Cinor (2nd January), OREP (4th May) and Sodeco (11th June); Italy: Plastybeton (29th March); Norway: Halfen-Frimeda (15th May); Poland: remaining 75% of Ergon (26th April) and Cerabud (29th November); Romania: Elpreco (17th December); Sweden: Tuvan Stangsel (7th March); United Kingdom: Anderton Concrete (24th April), West Midland Fencing (2nd July) and Forsite Construction Accessories (4th July).
Europe DistributionFrance: LDP (3rd January); Germany: acquisitions by CRH’s 48% joint venture BauKing - Mobau (22nd February), Kapella Baustoffe (17th July) and Moller & Forster Baustoffe (31st August); the Netherlands: Vlutters (3rd March), Bouweijden Almere (7th September) and Haringsma (5th October); Spain: Jelf Brico-House (24th May); Switzerland: Gétaz Romang (25th May) and G. von Gunten (14th December).
Americas MaterialsArizona: Hancock Materials (16th November); Florida: Conrad Yelvington Distributors (4th September) and selected Cemex Rinker assets (30th November); Idaho: International Stone (23rd August) and HK Contractors (5th November); Iowa: Cessford Construction (10th August); New York: Madden Concrete (30th July); Ohio: Kenmore Construction Company (2nd April); Oklahoma: Bellco Materials (31st December); Oregon: Eugene Sand & Gravel (3rd August); Pennsylvania: McMinn’s Asphalt & Prospect Aggregates (31st August); South Carolina: Southeast Asphalt (22nd August); Tennessee: selected assets of US Concrete (9th November); Texas: Matthews Construction & Jasper Asphalt (2nd November); Utah: Kaneco Products (13th June) and Hales Sand & Gravel (2nd December); Vermont: Burgess Brothers (24th September); Virginia: Rock It Stone (11th January); and Wyoming: Big Sky Asphalt (10th April).
Americas ProductsCalifornia: Carson Industries (20th July; also including operations in Kentucky, Ohio and Ireland) and Inland Concrete Enterprises (17th December); Florida: remaining 50% of Paver Systems (January 3rd), Ruck Brothers (13th August), Amerimix and Cementec Industries (17th August), Coloroc Materials (23rd February) and Harwood Brick (11th June); Georgia: remaining 20% of Custom Surfaces (29th June; also South Carolina), selected block assets of Lafarge North America (30th November; Georgia and New Mexico); Illinois: Valley Block (3rd January) and River City Landscape Supply (21st December; also Alabama); New Jersey: Pre-Blend Products (31st May); New Mexico: Rinker Block (23rd July); Texas: Vistawall (29th June) and Headwaters Mortar and Stucco Group (20th December).
Americas DistributionCalifornia: Spartan Supply (11th April), John Ray Company (13th April) and Acoustical Materials Services (16th November; also Nevada, Hawaii, Arizona and Mexico); and Florida: Florida Waterproofing Supply (7th September).
Notes on Financial Statements
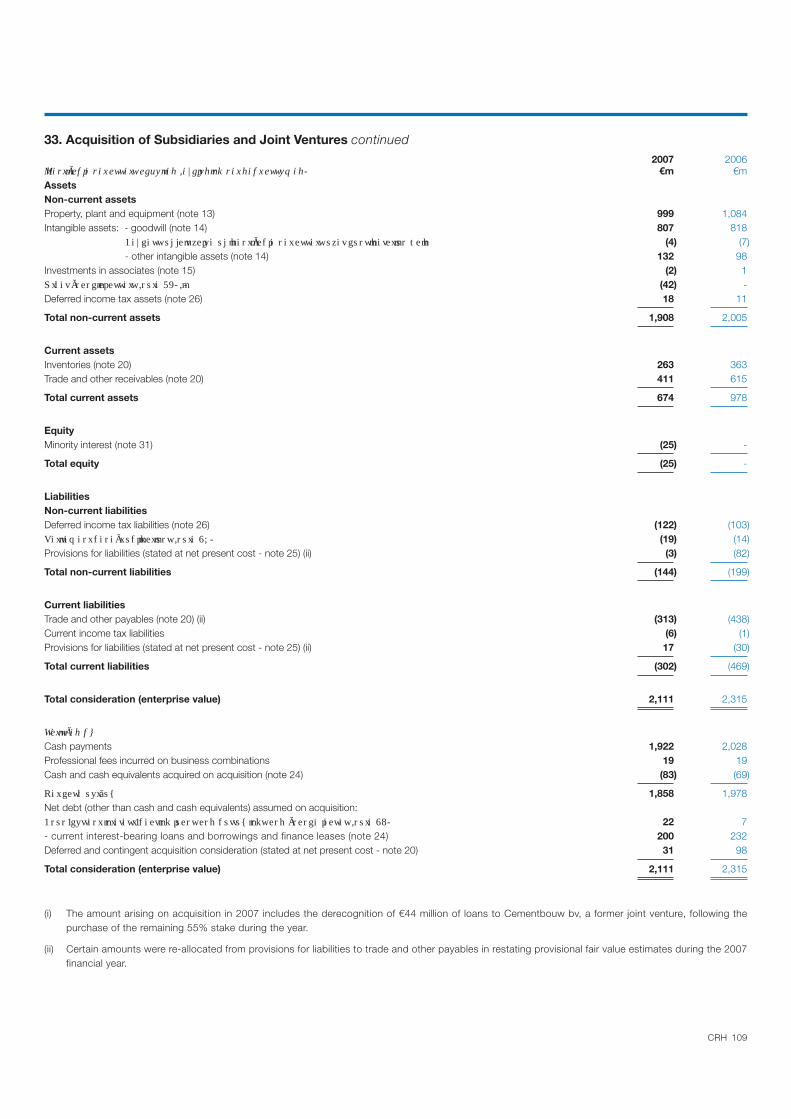
109CRH
33. Acquisition of Subsidiaries and Joint Ventures continued2007 2006
€m €mAssetsNon-current assetsProperty, plant and equipment (note 13) 999 1,084 Intangible assets: - goodwill (note 14) 807 818
(4) (7)- other intangible assets (note 14) 132 98
Investments in associates (note 15) (2) 1(42) -
Deferred income tax assets (note 26) 18 11
Total non-current assets 1,908 2,005
Current assetsInventories (note 20) 263 363Trade and other receivables (note 20) 411 615
Total current assets 674 978
EquityMinority interest (note 31) (25) -
Total equity (25) -
LiabilitiesNon-current liabilitiesDeferred income tax liabilities (note 26) (122) (103)
(19) (14)Provisions for liabilities (stated at net present cost - note 25) (ii) (3) (82)
Total non-current liabilities (144) (199)
Current liabilitiesTrade and other payables (note 20) (ii) (313) (438)Current income tax liabilities (6) (1)Provisions for liabilities (stated at net present cost - note 25) (ii) 17 (30)
Total current liabilities (302) (469)
Total consideration (enterprise value) 2,111 2,315
Cash payments 1,922 2,028 Professional fees incurred on business combinations 19 19 Cash and cash equivalents acquired on acquisition (note 24) (83) (69)
1,858 1,978Net debt (other than cash and cash equivalents) assumed on acquisition:
22 7 - current interest-bearing loans and borrowings and finance leases (note 24) 200 232Deferred and contingent acquisition consideration (stated at net present cost - note 20) 31 98
Total consideration (enterprise value) 2,111 2,315
(i) The amount arising on acquisition in 2007 includes the derecognition of €44 million of loans to Cementbouw bv, a former joint venture, following the purchase of the remaining 55% stake during the year.
(ii) Certain amounts were re-allocated from provisions for liabilities to trade and other payables in restating provisional fair value estimates during the 2007 financial year.

110 CRH
33. Acquisition of Subsidiaries and Joint Ventures continued
values.
The principal factor contributing to the recognition of goodwill on business combinations entered into by the Group is the realisation of cost savings and synergies with existing entities in the Group.
The carrying amounts of the assets and liabilities acquired determined in accordance with IFRS before completion of the combination, together with the adjustments made to those carrying values to arrive at the fair values disclosed above, were as follows:
Accounting AdjustmentsBook Fair value policy to provisional Fair
values adjustments alignments fair values value€m €m €m €m €m
Non-current assets (excluding goodwill) 766 295 - 44 1,105Current assets 661 25 (3) (9) 674Non-current liabilities (62) (48) - (34) (144)Current liabilities (294) (9) (4) 5 (302)Minority interest (21) (6) - 2 (25)
1,050 257 (7) 8 1,308Goodwill arising on acquisition 1,068 (257) 7 (15) 803
Total consideration (enterprise value) 2,118 - - (7) 2,111
The initial assignment of fair values to identifiable net assets acquired has been performed on a provisional basis in respect of a number of the business combinations disclosed above given the timing of closure of these deals; any amendments to these fair values made during the subsequent reporting window (within the twelve-month timeframe from the acquisition date imposed by IFRS 3) will be subject to subsequent disclosure. The total adjustments processed in 2007 to the fair values of business combinations completed during 2006 where those fair values were not readily or practicably determinable as at 31st December 2006 were as follows:
Initial Adjustmentsfair value to provisional Revisedassigned fair values (iii) fair value
€m €m €m
Non-current assets (excluding goodwill) 955 44 999Current assets 877 (9) 868Non-current liabilities (183) (34) (217)Current liabilities (436) 5 (431)Minority interest - 2 2
1,213 8 1,221Goodwill arising on acquisition 648 (15) 633
Total consideration (enterprise value) 1,861 (7) 1,854
(iii) The majority of the adjustments to the provisional fair values booked in 2006 and reflected above pertain to the APAC acquisition where an independent fair value assessment was pending at 31st December 2006.
Notes on Financial Statements
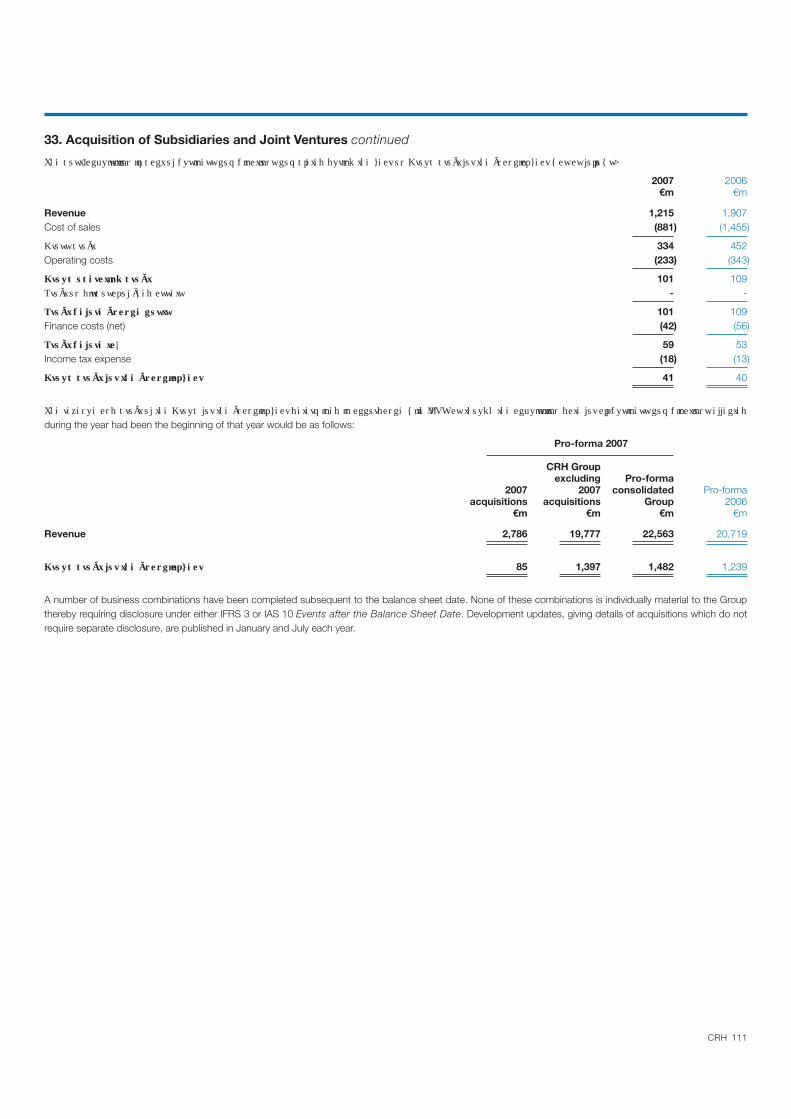
111CRH
33. Acquisition of Subsidiaries and Joint Ventures continued
2007 2006€m €m
Revenue 1,215 1,907Cost of sales (881) (1,455)
334 452 Operating costs (233) (343)
101 109 - -
101 109Finance costs (net) (42) (56)
59 53 Income tax expense (18) (13)
41 40
during the year had been the beginning of that year would be as follows:
Pro-forma 2007
CRH Groupexcluding Pro-forma
2007 2007 consolidated Pro-formaacquisitions acquisitions Group 2006
€m €m €m €m
Revenue 2,786 19,777 22,563 20,719
85 1,397 1,482 1,239
A number of business combinations have been completed subsequent to the balance sheet date. None of these combinations is individually material to the Group thereby requiring disclosure under either IFRS 3 or IAS 10 Events after the Balance Sheet Date. Development updates, giving details of acquisitions which do not require separate disclosure, are published in January and July each year.
112 CRH
34. Related Party Transactions
The principal related party relationships requiring disclosure in the consolidated financial statements of the Group under IAS 24 Related Party Disclosurespertain to: the existence of subsidiaries, joint ventures and associates; transactions with these entities entered into by the Group; and the identification and compensation of key management personnel.
Subsidiaries, joint ventures and associatesThe consolidated financial statements include the financial statements of the Company (CRH plc, the ultimate parent) and its subsidiaries, joint ventures and associates as documented in the accounting policies on pages 61 to 67. The Group’s principal subsidiaries, joint ventures and associates are disclosed on pages 120 to 125.
Sales to and purchases from, together with outstanding payables to and receivables from, subsidiaries and joint ventures are eliminated in the preparation of the consolidated financial statements in accordance with IAS 27 Consolidated and Separate Financial Statements. Loans extended by the Group to joint ventures and associates are included in financial assets (whilst the Group’s share of the corresponding loans payable by joint ventures are included in interest-bearing loans and borrowings due to the application of proportionate consolidation in accounting for the Group’s interests in these entities). Sales to and purchases from associates during the financial year ended 31st December 2007 amounted to €19 million (2006: €17 million) and €497 million (2006: €438 million) respectively. Amounts receivable from and payable to associates (arising from the aforementioned sales and purchases transactions) as at the balance sheet date are included as separate line items in notes 18 and 19 to the consolidated financial statements.
Terms and conditions of transactions with subsidiaries, joint ventures and associatesIn general, the transfer pricing policy implemented by the Group across its subsidiaries is market-based. Sales to and purchases from other related parties (being joint ventures and associates) are conducted in the ordinary course of business and on terms equivalent to those that prevail in arm’s-length transactions. The outstanding balances included in receivables and payables as at the balance sheet date in respect of transactions with associates are unsecured and settlement arises in cash. No guarantees have been either requested or provided in relation to related party receivables and payables. Loans to joint ventures and associates (the respective amounts being disclosed in note 15) are extended on normal commercial terms with interest accruing and, in general, paid to the Group at predetermined intervals.
Key management personnelFor the purposes of the disclosure requirements of IAS 24, the term “key management personnel” (i.e. those persons having authority and responsibility for planning, directing and controlling the activities of the Company) comprises the Board of Directors which manages the business and affairs of the Company. As identified in the Report on Directors’ Remuneration on pages 48 to 55, the Directors, other than the non-executive Directors, serve as executive officers of the Company. Full disclosure in relation to the compensation entitlements of the Board of Directors is provided in the Report on Directors’ Remuneration.
35. Board Approval
The Board of Directors approved and authorised for issue the financial statements on pages 58 to 112 in respect of the year ended 31st December 2007 on 3rd March 2008.
Notes on Financial Statements

113CRH
Company Balance Sheet
as at 31st December 2007
2007 2006Notes €m €m
Fixed assets2 Financial assets 311 1,074
Current assets3 Debtors 4,768 3,683
Cash at bank and in hand 98 55
4,866 3,738
Creditors (amounts falling due within one year)4 Trade and other creditors 1,669 1,386
Bank loans and overdrafts 2 1
1,671 1,387
Net current assets 3,195 2,351
Total assets less current liabilities 3,506 3,425
Creditors (amounts falling due after more than one year) Bank loans - 19
3,506 3,406
Capital and reserves6 Called-up share capital 186 1846 Preference share capital 1 1 7 Share premium 2,424 2,322 6 Own shares (19) (14)7 Revaluation reserve 42 42 7 Other reserves 60 557
812 314
Shareholders’ funds 3,506 3,406
K. McGowan, W.I. O’Mahony, Directors
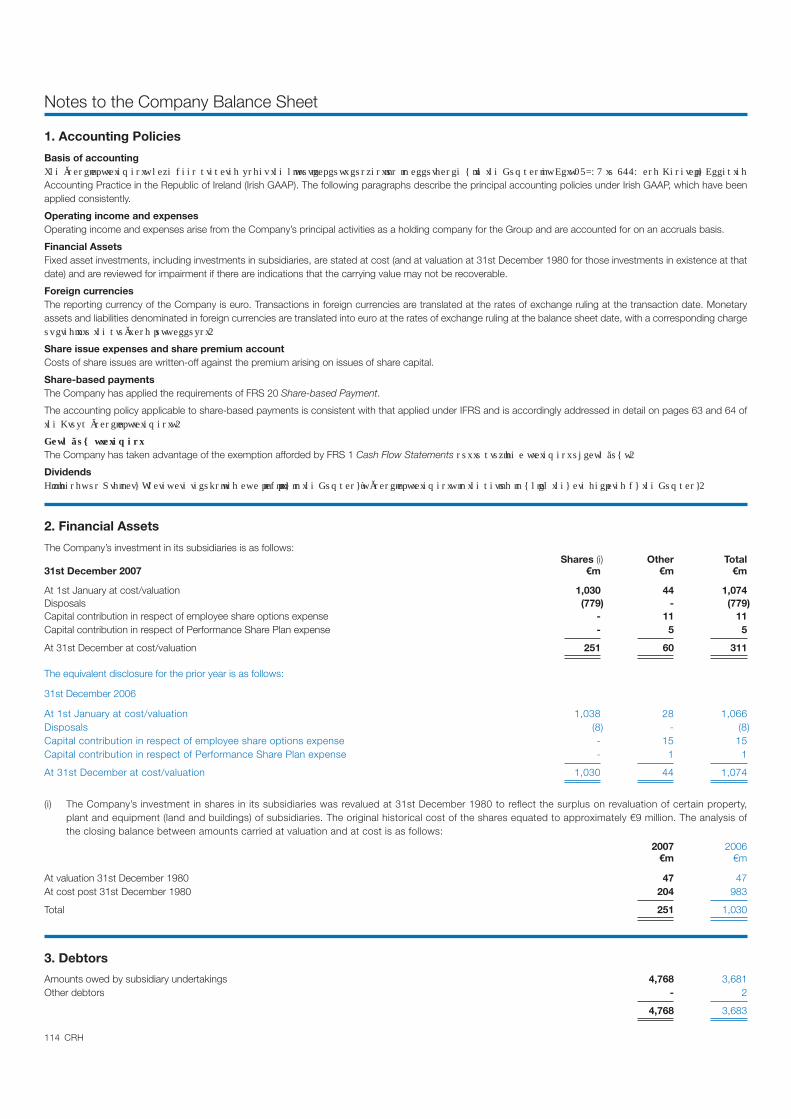
114 CRH
1. Accounting Policies
Basis of accounting
Accounting Practice in the Republic of Ireland (Irish GAAP). The following paragraphs describe the principal accounting policies under Irish GAAP, which have been applied consistently.
Operating income and expensesOperating income and expenses arise from the Company’s principal activities as a holding company for the Group and are accounted for on an accruals basis.
Financial AssetsFixed asset investments, including investments in subsidiaries, are stated at cost (and at valuation at 31st December 1980 for those investments in existence at that date) and are reviewed for impairment if there are indications that the carrying value may not be recoverable.
Foreign currenciesThe reporting currency of the Company is euro. Transactions in foreign currencies are translated at the rates of exchange ruling at the transaction date. Monetary assets and liabilities denominated in foreign currencies are translated into euro at the rates of exchange ruling at the balance sheet date, with a corresponding charge
Share issue expenses and share premium accountCosts of share issues are written-off against the premium arising on issues of share capital.
Share-based paymentsThe Company has applied the requirements of FRS 20 Share-based Payment.
The accounting policy applicable to share-based payments is consistent with that applied under IFRS and is accordingly addressed in detail on pages 63 and 64 of
The Company has taken advantage of the exemption afforded by FRS 1 Cash Flow Statements
Dividends
2. Financial Assets
The Company’s investment in its subsidiaries is as follows: Shares (i) Other Total
31st December 2007 €m €m €m
At 1st January at cost/valuation 1,030 44 1,074Disposals (779) - (779)Capital contribution in respect of employee share options expense - 11 11Capital contribution in respect of Performance Share Plan expense - 5 5
At 31st December at cost/valuation 251 60 311
The equivalent disclosure for the prior year is as follows:
31st December 2006
At 1st January at cost/valuation 1,038 28 1,066Disposals (8) - (8)Capital contribution in respect of employee share options expense - 15 15Capital contribution in respect of Performance Share Plan expense - 1 1
At 31st December at cost/valuation 1,030 44 1,074
(i) The Company’s investment in shares in its subsidiaries was revalued at 31st December 1980 to reflect the surplus on revaluation of certain property, plant and equipment (land and buildings) of subsidiaries. The original historical cost of the shares equated to approximately €9 million. The analysis of the closing balance between amounts carried at valuation and at cost is as follows:
2007 2006€m €m
At valuation 31st December 1980 47 47 At cost post 31st December 1980 204 983
Total 251 1,030
3. Debtors
Amounts owed by subsidiary undertakings 4,768 3,681Other debtors - 2
4,768 3,683
Notes to the Company Balance Sheet
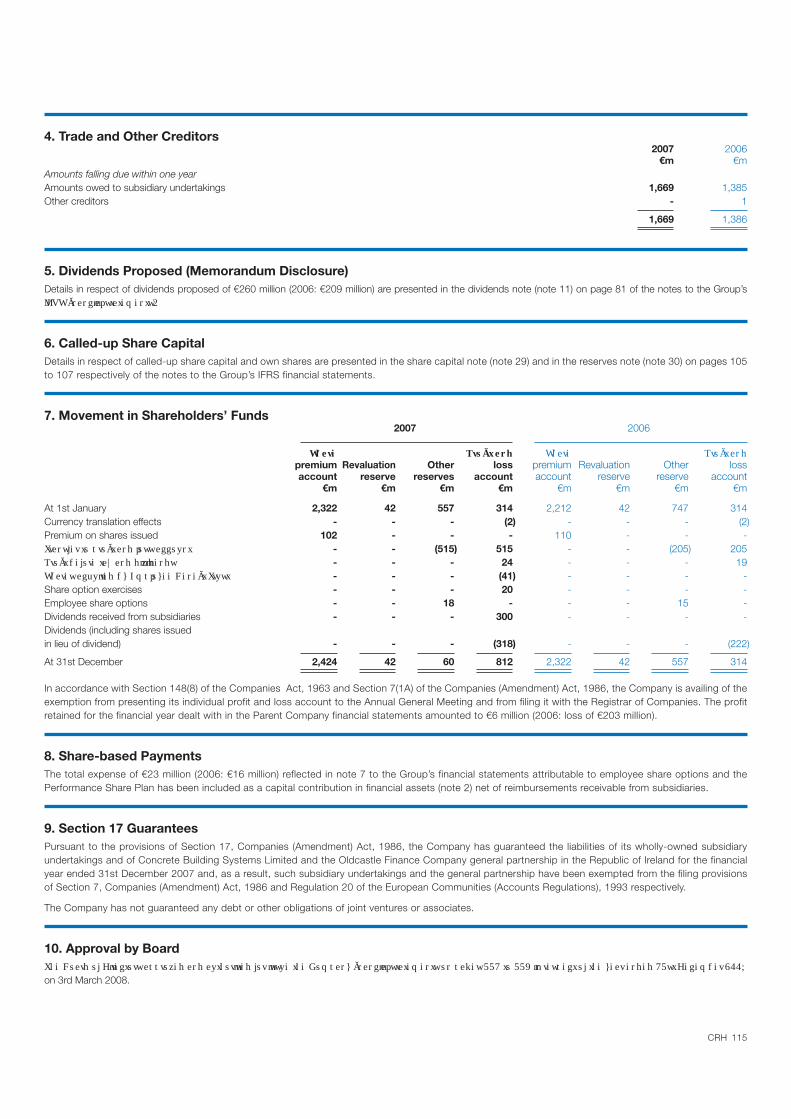
115CRH
4. Trade and Other Creditors2007 2006
€m €mAmounts falling due within one yearAmounts owed to subsidiary undertakings 1,669 1,385Other creditors - 1
1,669 1,386
5. Dividends Proposed (Memorandum Disclosure)Details in respect of dividends proposed of €260 million (2006: €209 million) are presented in the dividends note (note 11) on page 81 of the notes to the Group’s
6. Called-up Share CapitalDetails in respect of called-up share capital and own shares are presented in the share capital note (note 29) and in the reserves note (note 30) on pages 105 to 107 respectively of the notes to the Group’s IFRS financial statements.
7. Movement in Shareholders’ Funds2007 2006
premium Revaluation Other loss premium Revaluation Other lossaccount reserve reserves account account reserve reserve account
€m €m €m €m €m €m €m €m
At 1st January 2,322 42 557 314 2,212 42 747 314 Currency translation effects - - - (2) - - - (2)Premium on shares issued 102 - - - 110 - - -
- - (515) 515 - - (205) 205 - - - 24 - - - 19- - - (41) - - - -
Share option exercises - - - 20 - - - -Employee share options - - 18 - - - 15 -Dividends received from subsidiaries - - - 300 - - - -Dividends (including shares issued in lieu of dividend) - - - (318) - - - (222)
At 31st December 2,424 42 60 812 2,322 42 557 314
In accordance with Section 148(8) of the Companies Act, 1963 and Section 7(1A) of the Companies (Amendment) Act, 1986, the Company is availing of the exemption from presenting its individual profit and loss account to the Annual General Meeting and from filing it with the Registrar of Companies. The profit retained for the financial year dealt with in the Parent Company financial statements amounted to €6 million (2006: loss of €203 million).
8. Share-based PaymentsThe total expense of €23 million (2006: €16 million) reflected in note 7 to the Group’s financial statements attributable to employee share options and the Performance Share Plan has been included as a capital contribution in financial assets (note 2) net of reimbursements receivable from subsidiaries.
9. Section 17 GuaranteesPursuant to the provisions of Section 17, Companies (Amendment) Act, 1986, the Company has guaranteed the liabilities of its wholly-owned subsidiary undertakings and of Concrete Building Systems Limited and the Oldcastle Finance Company general partnership in the Republic of Ireland for the financial year ended 31st December 2007 and, as a result, such subsidiary undertakings and the general partnership have been exempted from the filing provisions of Section 7, Companies (Amendment) Act, 1986 and Regulation 20 of the European Communities (Accounts Regulations), 1993 respectively.
The Company has not guaranteed any debt or other obligations of joint ventures or associates.
10. Approval by Board
on 3rd March 2008.
116 CRH
Shareholder Information
Dividend payments
An interim dividend of 20.0c, with scrip alternative, was paid in respect of Ordinary Shares on 2nd November 2007.
A final dividend of 48.0c, if approved, will be paid in respect of Ordinary Shares on 12th May 2008. A scrip alternative will be offered to shareholders.
Dividend Withholding Tax (DWT) must be deducted from dividends paid by an Irish resident company, unless a shareholder is entitled to an exemption and has submitted a properly completed exemption form to the Company’s Registrars, Capita Registrars. DWT applies to dividends paid by way of cash or by way of shares under a scrip dividend scheme and is deducted at the standard rate of Income Tax (currently 20%). Non-resident shareholders and certain Irish companies, trusts, pension schemes, investment undertakings and charities may be entitled to claim exemption from DWT and have been sent the relevant form. Further copies of the form may be obtained from the Company’s Registrars. Shareholders should note that DWT will be deducted from dividends in cases where a properly completed form has not been received by the record date for a dividend. Individuals who are resident in Ireland for tax purposes are not entitled to an exemption.
Shareholders who wish to have their dividend paid direct to a bank account, by electronic funds transfer, should contact the Company’s Registrars to obtain a mandate form. Tax vouchers will be sent to the shareholder’s registered address under this arrangement.
Dividends are paid in euro. In order to avoid costs to shareholders, dividends are paid in Sterling and US Dollars to shareholders whose address according to the Share Register is in the UK and the United States respectively, unless they require otherwise.
Dividends in respect of 5% Cumulative Preference Shares are paid half-yearly on 15th April and 15th October.
Dividends in respect of 7% ‘A’ Cumulative Preference Shares are paid half-yearly on 5th April and 5th October.

117CRH
CREST
Transfer of the Company’s shares takes place through the CREST settlement system. Shareholders have the choice of holding their shares in electronic form or in the form of share certificates.
Share price data 2007 2006 € €Share price at 31st December 23.85 31.54Market capitalisation 13.1bn 17.1bnShare price movementduring the year: - high 38.20 31.82
- low 21.92 22.65
Shareholdings as at 31st December 2007
Ownership of Ordinary SharesNumber of % of
Geographic location* shares held total‘000
Ireland 85,191 16United Kingdom 89,516 16North America 168,593 31Europe/Other 122,014 22Retail 81,893 15
547,207 100
*This represents a best estimate of the number of shares controlled by fund managers resident in the geographic regions indicated. Private shareholders are classified as retail above.
Holdings Number of % of Number of % ofshareholders total shares held total
‘000
1 - 1,000 18,091 60.93 6,703 1.231,001 - 10,000 9,925 33.42 29,267 5.3510,001 - 100,000 1,330 4.48 35,544 6.50100,001 - 1,000,000 276 0.93 85,928 15.70Over 1,000,000 72 0.24 389,765 71.22
29,694 100 547,207 100
Stock Exchange listings
CRH has primary listings on the Irish and London Stock Exchanges. The Group’s ADRs are quoted on the New York Stock Exchange (NYSE) in the United States.
Financial calendar
Ex-dividend date 12th March 2008Record date for dividend 14th March 2008Latest date for receipt of scrip forms 25th April 2008Annual General Meeting 7th May 2008
in scrip dividend shares 12th May 2008Trading update statement 2nd July 2008Announcement of interim results for 2008 26th August 2008
Website
The Group’s website, www.crh.com, provides the full text of the Annual and Interim Reports, the Annual Report on Form 20-F, which is filed annually with the United States Securities and Exchange Commission, trading statements and copies of presentations to analysts and investors. News releases are made available, in the News & Media section of the website, immediately after release to the Stock Exchanges.
Registrars
Enquiries concerning shareholdings should be addressed to:
Capita Registrars,P.O. Box 7117, Dublin 2.Telephone: +353 (0) 1 810 2400Fax: +353 (0) 1 810 2422
Shareholders with access to the internet may check their accounts either by accessing CRH’s website and selecting “Registrars” under “Shareholder Services” in the Investor Relations section or by accessing the Registrars’ website, www.capitaregistrars.ie. This facility allows shareholders to check their shareholdings and to download standard forms required to initiate changes in details held by the Registrars.
American Depositary Receipts
The ADR programme is administered by the Bank of New York Mellon and enquiries regarding ADRs should be addressed to:
The Bank of New York MellonInvestor ServicesP.O. Box 11258Church Street StationNew York, NY 10286-1258Telephone: Toll Free Number (United States residents): 1-888-269 2377International: +1 212-815 3700Email: [email protected]: http://www.stockbny.com
Electronic proxy voting
Shareholders may lodge a proxy form for the 2008 Annual General Meeting electronically. Shareholders who wish to submit proxies via the internet may do so by accessing CRH’s, or the Registrars’, website as described above. Shareholders must register for this service on-line before the electronic proxy service can be used. Instructions on using the service are sent to shareholders with their proxy form.
CREST members wishing to appoint a proxy via the CREST system should refer to the CREST Manual and the notes to the Notice of the Annual General Meeting.

118 CRH
Management
Senior Group Staff
Liam O’MahonyChief Executive Officer
Myles LeeFinance Director
Angela MaloneCompany Secretary
Jack GoldenHuman Resources Director
Liam HughesBusiness Support Director
Paul BarryHead of Internal Audit
Maeve CartonGroup Controller
Rossa McCannGroup Treasurer
Jim O’BrienGroup Technical Advisor
Éimear O’FlynnHead of Investor Relations
Pat O’SheaGroup Taxation Director
Europe
Materials
Albert ManifoldManaging Director
Henry MorrisChief Operating Officer
Alan ConnollyFinance Director
Eamon GeraghtyTechnical Director
Tony MackenBusiness Development Manager
Ireland/Benelux
Donal DempseyRegional DirectorIreland & Benelux
Ken McKnightManaging DirectorIrish Cement
Leo GroganManaging DirectorPremier Periclase
Jim FarrellManaging DirectorRoadstone Dublin
Frank ByrneManaging DirectorRoadstone Provinces
John HoganManaging DirectorJohn A. Wood
Noel QuinnManaging DirectorNorthstone
Oliver MahonCountry ManagerBenelux
Central Eastern Europe
Declan MaguireRegional DirectorCentral Eastern Europe
David DillonCountry ManagerFinland
Eero LaatioManaging DirectorFinnsementti
Kalervo MatikainenManaging DirectorRudus
Owen RowleyCountry ManagerPoland
Andrzej PtakPresidentGrupa Oz
.arów
Aleksander SzyszkoCountry ManagerUkraine
Switzerland
Urs SandmeierCountry ManagerSwitzerland
Paul ZossoManaging DirectorJura Aggregates & Readymix
Spain
Sebastia AlegreManaging DirectorCRH Spain
Middle East/Asia
Jim NolanRegional DirectorMiddle East and Asia
Frank HeisterkampCountry ManagerTurkey and China
Products & Distribution
Máirtín ClarkeManaging Director
Peter ErkampFinance Director
Michael StirlingHuman Resources Director
Concrete Products
Rudy AertgeertsProduct Group Director
Kees VerburgFinance/Development Director
Edwin van den BergManaging DirectorArchitectural Products Benelux
Mark van LoonManaging DirectorStructural Concrete Benelux
Claus BeringManaging DirectorScandinavia and Eastern Europe
Jean-Paul GellyManaging DirectorArchitectural Products France
Hans-Josef MünchManaging DirectorEHL
Shaun GrayManaging DirectorForticrete
Richard LeeManaging DirectorSupreme
Clay Products
Wayne SheppardProduct Group Director & Managing DirectorIbstock Brick
Geoff BullProduct Group Finance Director
Jan van OmmenManaging DirectorClay Mainland-Europe
Claus ArntjenManaging DirectorAKA Ziegelwerke
Joanna StelmasiakManaging DirectorCRH Klinkier
Building Products
Marc St. NicolaasProduct Group Director
Erwin ThysFinance/Development Director
Tom BeyersDevelopment Director
Peter LieskerHuman Resources Director
Geert-Jan van SchijndelManaging DirectorBuilding Envelope Products
Dirk VaelManaging DirectorConstruction Accessories
Walter de BackerFinance DirectorConstruction Accessories
Gerben StilmaManaging DirectorInsulation Products
Frank BoekholtzFinance/Development DirectorInsulation Products
John NashDevelopment DirectorInsulation Products
Distribution
Erik BaxGroup Managing Director
Kees van der DriftFinance/Development Director
Erik de GrootHuman Resources Director
Anton HuizingDevelopment DirectorNew Regions
Harry BosshardtManaging DirectorBuilders Merchants Central Europe
Jean-Jacques MiautonManaging DirectorBuilders Merchants Switzerland
René DoorsManaging DirectorBuilders Merchants Netherlands
Jos de NijsManaging DirectorSpecialist Builders Merchants Netherlands
Philippe DenécéManaging DirectorBuilders Merchants France
Louis BruziManaging DirectorBuilders Merchants Ile-de-France
Peter WirthManaging DirectorBuilders Merchants Austria
Emiel HopmansManaging DirectorDIY Europe
119CRH
The Americas
Tom HillChief Executive Officer
Michael O’DriscollChief Financial Officer
Gary HickmanSenior Vice President Tax & Risk Management
North America
Materials
Mark ToweChief Executive Officer
Doug BlackPresident & Chief Operating Officer
Glenn CulpepperChief Financial Officer
Don EshlemanExecutive Vice President
Michael BradySenior Vice President Development
Charles BrownVice President Finance
John HayVice President Government Relations
New England
John KeatingPresidentNew England Division
Christian ZimmermanPresidentPike
Jim RegerPresidentP.J. Keating
Ciaran BrennanPresidentTilcon Connecticut
New York/New Jersey
Chris MaddenPresidentNew York/New Jersey Division
Jonas HavensPresidentCallanan Industries
John CooneyPresidentTilcon NY
John SielPresidentDolomite Group
George ThompsonPresidentTilcon NJ
Central
Dan MontgomeryPresidentCentral Division
John PowersPresidentShelly
Dan CooperriderPresidentAppalachian Mountain Group
Mid-Atlantic
Randy LakePresidentMid-Atlantic Division
Dennis RickardPresidentMichigan Paving & Materials
West
John ParsonPresidentWest Division
Jeff SchafferPresidentNorthwest Group
Shane EvansPresidentRocky Mountain Group
Scott ParsonPresidentStaker-Parson Group
Jim GaugerPresidentIowa Companies
Southwest
Kirk RandolphPresidentSouthwest Division
John WalkerRegional PresidentArkansas/Oklahoma/Texas
Chris LodgeRegional PresidentMemphis/Mississippi/Ballenger
Damien MurphyRegional PresidentKansas/Missouri
Southeast
Rick MergensPresidentSoutheast Division
Sean O’SullivanPresidentMid-South Materials
Gary YelvingtonPresidentConrad Yelvington Distributors
Robert DukePresidentPreferred Materials
Don SolliePresidentFlorida APAC Operations
Products & Distribution
Architectural Products
William SandbrookChief Executive Officer
Paul ValentineExecutive Vice President Finance & Administration
Ted KozikowskiPresident, Masonry
Keith GaussChief Financial Officer
Damian BurkeVice President Development
John KempSenior Vice President, Marketing
Bertin CastonguayDirector, Research & Development
Georges ArchambaultPresidentAPG Canada
Steve MatsickPresidentGlen-Gery
Wade FicklinPresidentAPG West
John O’NeillPresidentAPG Northeast
Tom ConroyPresidentAPG South
Marcia GibsonPresidentAPG Midwest
Keith HaasPresidentAPG Retail
David MaskePresidentBonsal American
Eoin LehanePresidentOldcastle Lawn & Garden
Precast
Mark SchackChief Executive Officer
Bob QuinnChief Administrative Officer
Eric FarinhaChief Financial Officer
George HeuselVice President Development
George HandPresidentNortheast Pipe and Precast
Jan OlsenPresidentSoutheast Division
Ray RheesPresidentCentral Division
Mike ScottPresidentWestern Division
David SheddPresidentNational Products Division
Dave SteevensPresidentEnclosures Division
Glass
Ted HathawayChief Executive Officer
Dan HamblenChief Financial Officer
Daipayan BhattacharyaVice President Development & Technology
Jim AvanziniPresident Western Group
Bob BerlethPresident Eastern Group
Tom HarrisPresident Engineered Products Group
Roy OrrPresident Central Group
MMI
John WittstockChief Executive Officer
Celeste MastinPresident & Chief Operating Officer
Bob TenczarChief Financial Officer
Lyle BumgarnerPresident Construction Accessories
David ClarkPresidentFencing
Mike McCallPresidentWire Products
Distribution
Michael LynchChief Executive Officer
Robert Feury Jr.Chief Operating Officer
Greg BloomJohn McLaughlinRuben MendozaRon PillaDonald TothVice Presidents
Brian ReillyChief Financial Officer
Kevin HawleyVice President Development
South America
Juan Carlos GirottiManaging DirectorCRH SudamericanaCanteras Cerro Negro
Alejandro Javier BertránBusiness Development Manager
Benjamin FernandezBusiness Development Manager
Bernardo AlamosManaging DirectorVidrios Dell Orto

120 CRH
Principal Subsidiary Undertakings
Europe Materials
Britain & Northern Ireland
Northstone (NI) Limited 100 Aggregates, readymixed concrete, (including Farrans, Ready Use mortar, coated macadam, rooftiles,Concrete, R.J. Maxwell & Son, Scott) building and civil engineering contracting
Premier Cement Limited 100 Marketing and distribution of cement
T.B.F. Thompson (Properties) Limited 100 Property development
China
Harbin Sanling Cement Company 100 CementLimited*
Finland
Finnsementti Oy 100 Cement
Lohja Rudus Oy Ab 100 Aggregates and readymixed concrete
Ireland
Irish Cement Limited 100 Cement
Premier Periclase Limited 100 High quality seawater magnesia
Roadstone-Wood GroupClogrennane Lime Limited 100 Burnt and hydrated lime
John A. Wood Limited 100 Aggregates, readymixed concrete,concrete blocks and pipes, asphalt,agricultural and chemical limestoneand contract surfacing
Ormonde Brick Limited 100 Clay brick
Roadstone Dublin Limited 100 Aggregates, readymixed concrete,mortar, coated macadam, asphalt,contract surfacing and concrete blocks
Roadstone Provinces Limited 100 Aggregates, readymixed concrete,mortar, coated macadam, asphalt,contract surfacing, concrete blocksand rooftiles
Netherlands
Cementbouw bv 100 Cement transport and trading,readymixed concrete and aggregates
Poland
Bosta Beton Sp. z o.o. 90.3 Readymixed concrete
Cementownia Rejowiec S.A. 100 Cement
Drogomex Sp. z o.o.* 99.94 Asphalt and contract surfacing
Faelbud S.A.* 100 Readymixed concrete, concreteproducts and concrete paving
Grupa Oz.arów S.A. 100 Cement
Grupa Prefabet S.A.* 100 Concrete products
Masfalt Sp. z o.o.* 100 Asphalt and contract surfacing
O.K.S.M. 99.92 Aggregates
Polbruk S.A.* 100 Readymixed concrete and concretepaving
ZPW Trzuskawica S.A. Production of lime and lime products
Spain
Beton Catalan Group
Beton Catalan s.a. 100 Readymixed concrete
Cabi s.a. 99.99 Cementitious materials
Cantera de Aridos Puig Broca s.a. Aggregates
Explotacion de Aridos Calizos s.a. 100 Aggregates
Formigo i Bigues s.a. Aggregates
Formigons Girona s.a. 100 Readymixed concrete and precast concrete products
Suberolita s.a. 100 Readymixed concrete and precast concrete products
Tamuz s.a. 100 Aggregates
Switzerland
JURA-Holding 100 Cement, aggregates and readymixed concrete
Ukraine
Podilsky Cement Cement
Europe Products & Distribution
Austria
Quester Baustoffhandel GmbH 100 Builders merchants
Belgium
Concrete Products
Douterloigne nv 100
blocks
Ergon nv 100 Precast concrete structural elements
Klaps nv 100 Concrete paving, sewerage and water treatment
Marlux nv 100 Decorative concrete paving
MBI Beton bv 100 Architectural products
Oeterbeton nv 100 Precast concrete
Olivier Betonfabriek nv 100 Architectural products
Omnidal nv 100 Precast concrete structural elements
Remacle sa 100 Precast concrete products
Schelfhout nv 100 Precast concrete wall elements
Clay Products
Steenhandel J. De Saegher nv 100 Clay brick factors
Building Products
Plakabeton nv 100 Construction accessories
Portal sa 100 Glass roof structures
Distribution
Van Neerbos Bouwmarkten nv 100 DIY stores
Incorporated and operating in Products and services Incorporated and operating in Products and services
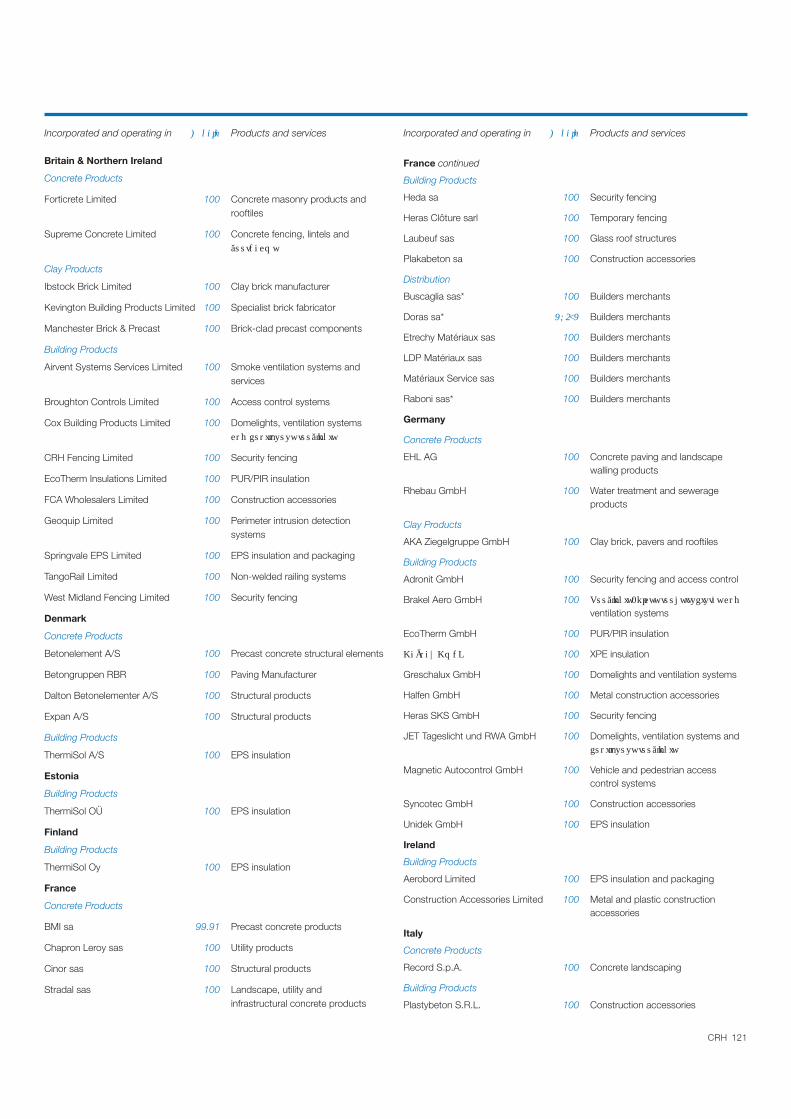
121CRH
Britain & Northern Ireland
Concrete Products
Forticrete Limited 100 Concrete masonry products and rooftiles
Supreme Concrete Limited 100 Concrete fencing, lintels and
Clay Products
Ibstock Brick Limited 100 Clay brick manufacturer
Kevington Building Products Limited 100 Specialist brick fabricator
Manchester Brick & Precast 100 Brick-clad precast components
Building Products
Airvent Systems Services Limited 100 Smoke ventilation systems and services
Broughton Controls Limited 100 Access control systems
Cox Building Products Limited 100 Domelights, ventilation systems
CRH Fencing Limited 100 Security fencing
EcoTherm Insulations Limited 100 PUR/PIR insulation
FCA Wholesalers Limited 100 Construction accessories
Geoquip Limited 100 Perimeter intrusion detection systems
Springvale EPS Limited 100 EPS insulation and packaging
TangoRail Limited 100 Non-welded railing systems
West Midland Fencing Limited 100 Security fencing
Denmark
Concrete Products
Betonelement A/S 100 Precast concrete structural elements
Betongruppen RBR 100 Paving Manufacturer
Dalton Betonelementer A/S 100 Structural products
Expan A/S 100 Structural products
Building Products
ThermiSol A/S 100 EPS insulation
Estonia
Building Products
ThermiSol OÜ 100 EPS insulation
Finland
Building Products
ThermiSol Oy 100 EPS insulation
France
Concrete Products
BMI sa 99.91 Precast concrete products
Chapron Leroy sas 100 Utility products
Cinor sas 100 Structural products
Stradal sas 100 Landscape, utility andinfrastructural concrete products
France continued
Building Products
Heda sa 100 Security fencing
Heras Clôture sarl 100 Temporary fencing
Laubeuf sas 100 Glass roof structures
Plakabeton sa 100 Construction accessories
Distribution
Buscaglia sas* 100 Builders merchants
Doras sa* Builders merchants
Etrechy Matériaux sas 100 Builders merchants
LDP Matériaux sas 100 Builders merchants
Matériaux Service sas 100 Builders merchants
Raboni sas* 100 Builders merchants
Germany
Concrete Products
EHL AG 100 Concrete paving and landscapewalling products
Rhebau GmbH 100 Water treatment and sewerage products
Clay Products
AKA Ziegelgruppe GmbH 100 Clay brick, pavers and rooftiles
Building Products
Adronit GmbH 100 Security fencing and access control
Brakel Aero GmbH 100ventilation systems
EcoTherm GmbH 100 PUR/PIR insulation
100 XPE insulation
Greschalux GmbH 100 Domelights and ventilation systems
Halfen GmbH 100 Metal construction accessories
Heras SKS GmbH 100 Security fencing
JET Tageslicht und RWA GmbH 100 Domelights, ventilation systems and
Magnetic Autocontrol GmbH 100 Vehicle and pedestrian accesscontrol systems
Syncotec GmbH 100 Construction accessories
Unidek GmbH 100 EPS insulation
Ireland
Building Products
Aerobord Limited 100 EPS insulation and packaging
Construction Accessories Limited 100 Metal and plastic construction accessories
Italy
Concrete Products
Record S.p.A. 100 Concrete landscaping
Building Products
Plastybeton S.R.L. 100 Construction accessories
Incorporated and operating in Products and services Incorporated and operating in Products and services

122 CRH
Netherlands
Concrete Products
Alvon Bouwsystemen bv 100 Precast concrete structural elements
Calduran bv 100 Sand-lime bricks and building elements
Dycore bv 100
Heembeton bv 100 Precast concrete structural elements
Kellen bv 100 Concrete paving products
Struyk Verwo bv 100 Concrete paving products
Clay Products
Kleiwarenfabriek Buggenum bv 100 Clay brick manufacturer
Kleiwarenfabriek De Bylandt bv 100 Clay paver manufacturer
Kleiwarenfabriek De Waalwaard bv 100 Clay brick manufacturer
Kleiwarenfabriek Façade Beek bv 100 Clay brick manufacturer
Kleiwarenfabriek Joosten Kessel bv 100 Clay brick manufacturer
Kleiwarenfabriek Joosten Wessem bv 100 Clay brick manufacturer
Kooy Bilthoven bv 100 Clay brick factors
Leebo bv 100 Designer, manufacturer and installer
Steenfabriek Nuth bv 100 Clay brick manufacturer
Building Products
Arfman Hekwerk bv 100 Producer and installer of fauna and railway fencing solutions
Aluminium Verkoop Zuid bv 100 Roller shutter and awning systems
BIK Bouwprodukten bv 100 Domelights and continuous
Brakel Atmos bv 100 Glass roof structures, continuous
EcoTherm bv 100 PUR/PIR insulation
Heras Nederland bv 100 Security fencing and perimeter protection
Mavotrans bv 100 Construction accessories
Unidek Group bv 100 EPS insulation
Unipol bv 100 EPS granulates
Vaculux bv 100 Domelights
Distribution
CRH Bouwmaterialenhandel bv 100 Builders merchants
100
100 Aluminium stockholding
NVB Vermeulen Bouwstoffen bv 100 Builders merchants
Stoel van Klaveren Bouwstoffen bv 100 Builders merchants
Syntec bv 100 Ironmongery merchants
Netherlands continued
Distribution
Ubbens Bouwmaterialen bv 100 Builders merchants
Van Neerbos Bouwmarkten bv 100 DIY stores
Van Neerbos Bouwmarkten 100 DIY storesExploitatie bv
Van Neerbos Bouwmaten bv 100 Cash & Carry building materials
Van Neerbos Bouwmaterialen bv 100 Builders merchants
Norway
Building Products
Halfen-Frimeda AS 100 Construction accessories
Poland
Concrete
Ergon Poland Sp. z o.o. 100 Structural products
Clay Products
CERG Sp. z o.o. 67.55 Clay brick manufacturer
Cerpol Kozlowice Sp. z o.o. 99.60 Clay brick manufacturer
CRH Klinkier Sp. z o.o. 100 Clay brick manufacturer
Gozdnickie Zaklady CeramikiBudowlanej Sp. z o.o.* 100 Clay brick manufacturer
Krotoszyñskie Przedsi biorstwoCeramiki Budowlanej “CERABUD” S.A. Clay blocks, bricks and rooftiles
Patoka Industries Limited Sp. z o.o.* 99.19 Clay brick manufacturer
Building Products
Termo Organika Sp. z o.o. 100 EPS insulation
Romania
Concrete
Elpreco SA 100 Architectural products
Slovakia
Premac Spol. s r.o. 100
Spain
Building Products
Plakabeton sa 100 Accessories for construction andprecast concrete
Distribution
JELF Brico House S.L. 60 Builders merchants
Sweden
Building Products
ThermiSol AB 100 EPS insulation
Tuvan-stängsel AB 100 Security fencing
Incorporated and operating in Products and services Incorporated and operating in Products and services
Principal subsidiary undertakings continued
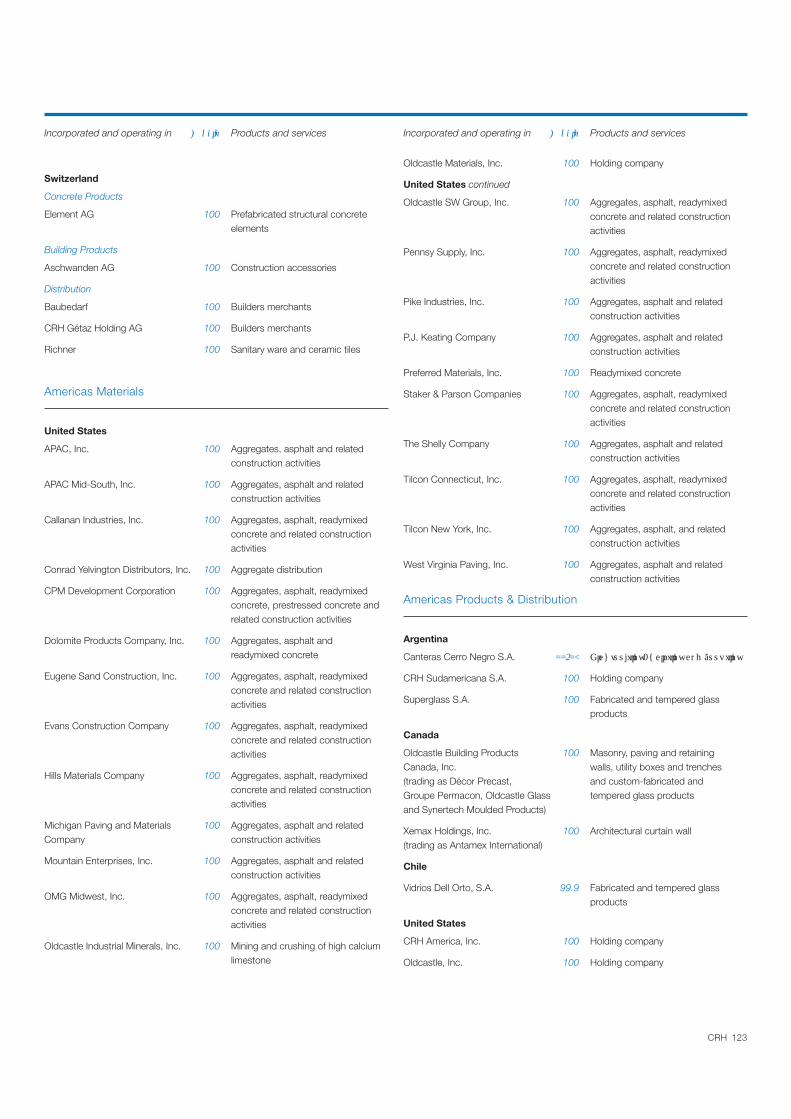
123CRH
Switzerland
Concrete Products
Element AG 100 Prefabricated structural concrete elements
Building Products
Aschwanden AG 100 Construction accessories
Distribution
Baubedarf 100 Builders merchants
CRH Gétaz Holding AG 100 Builders merchants
Richner 100 Sanitary ware and ceramic tiles
Americas Materials
United States
APAC, Inc. 100 Aggregates, asphalt and related construction activities
APAC Mid-South, Inc. 100 Aggregates, asphalt and relatedconstruction activities
Callanan Industries, Inc. 100 Aggregates, asphalt, readymixedconcrete and related constructionactivities
Conrad Yelvington Distributors, Inc. 100 Aggregate distribution
CPM Development Corporation 100 Aggregates, asphalt, readymixedconcrete, prestressed concrete andrelated construction activities
Dolomite Products Company, Inc. 100 Aggregates, asphalt and readymixed concrete
Eugene Sand Construction, Inc. 100 Aggregates, asphalt, readymixed concrete and related construction activities
Evans Construction Company 100 Aggregates, asphalt, readymixedconcrete and related constructionactivities
Hills Materials Company 100 Aggregates, asphalt, readymixedconcrete and related constructionactivities
Michigan Paving and Materials 100 Aggregates, asphalt and relatedCompany construction activities
Mountain Enterprises, Inc. 100 Aggregates, asphalt and relatedconstruction activities
OMG Midwest, Inc. 100 Aggregates, asphalt, readymixed concrete and related construction activities
Oldcastle Industrial Minerals, Inc. 100 Mining and crushing of high calcium limestone
Oldcastle Materials, Inc. 100 Holding company
United States continued
Oldcastle SW Group, Inc. 100 Aggregates, asphalt, readymixedconcrete and related constructionactivities
Pennsy Supply, Inc. 100 Aggregates, asphalt, readymixedconcrete and related constructionactivities
Pike Industries, Inc. 100 Aggregates, asphalt and relatedconstruction activities
P.J. Keating Company 100 Aggregates, asphalt and relatedconstruction activities
Preferred Materials, Inc. 100 Readymixed concrete
Staker & Parson Companies 100 Aggregates, asphalt, readymixedconcrete and related constructionactivities
The Shelly Company 100 Aggregates, asphalt and relatedconstruction activities
Tilcon Connecticut, Inc. 100 Aggregates, asphalt, readymixedconcrete and related constructionactivities
Tilcon New York, Inc. 100 Aggregates, asphalt, and relatedconstruction activities
West Virginia Paving, Inc. 100 Aggregates, asphalt and related construction activities
Americas Products & Distribution
Argentina
Canteras Cerro Negro S.A.
CRH Sudamericana S.A. 100 Holding company
Superglass S.A. 100 Fabricated and tempered glass products
Canada
Oldcastle Building Products 100 Masonry, paving and retainingCanada, Inc. walls, utility boxes and trenches(trading as Décor Precast, and custom-fabricated andGroupe Permacon, Oldcastle Glass tempered glass productsand Synertech Moulded Products)
Xemax Holdings, Inc. 100 Architectural curtain wall(trading as Antamex International)
Chile
Vidrios Dell Orto, S.A. 99.9 Fabricated and tempered glass products
United States
CRH America, Inc. 100 Holding company
Oldcastle, Inc. 100 Holding company
Incorporated and operating in Products and services Incorporated and operating in Products and services
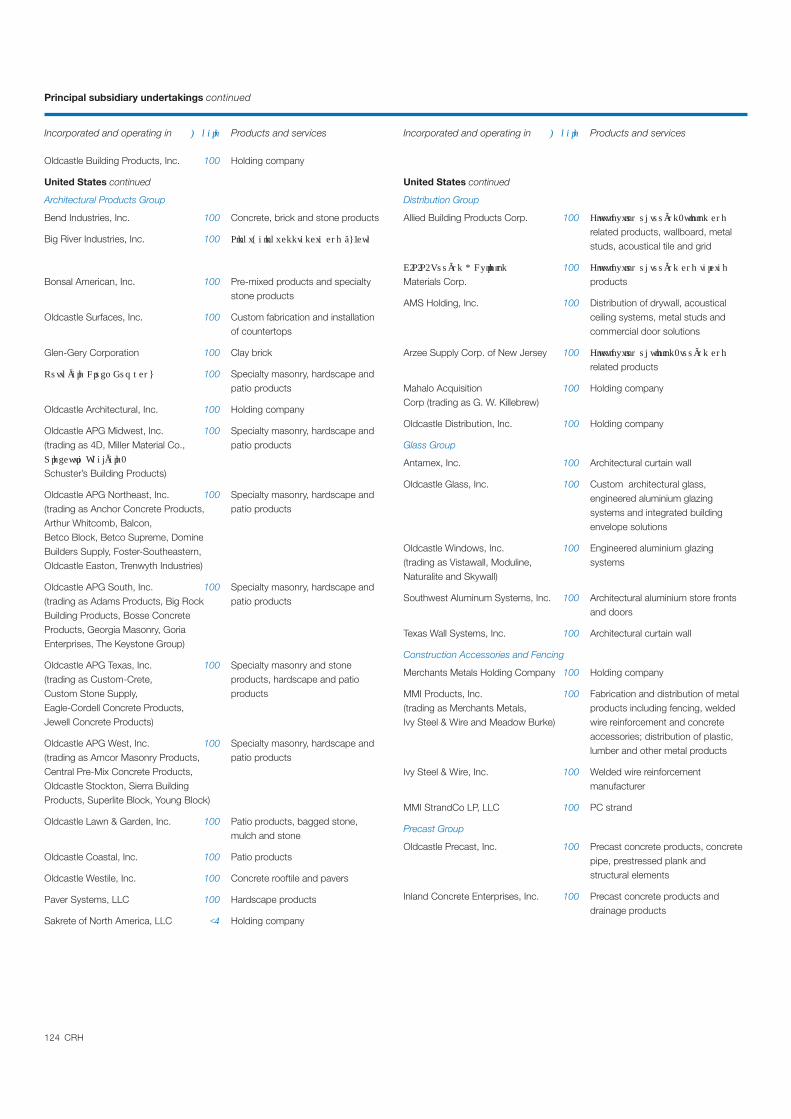
124 CRH
Oldcastle Building Products, Inc. 100 Holding company
United States continued
Architectural Products Group
Bend Industries, Inc. 100 Concrete, brick and stone products
Big River Industries, Inc. 100
Bonsal American, Inc. 100 Pre-mixed products and specialtystone products
Oldcastle Surfaces, Inc. 100 Custom fabrication and installation of countertops
Glen-Gery Corporation 100 Clay brick
100 Specialty masonry, hardscape andpatio products
Oldcastle Architectural, Inc. 100 Holding company
Oldcastle APG Midwest, Inc. 100 Specialty masonry, hardscape and(trading as 4D, Miller Material Co., patio products
Schuster’s Building Products)
Oldcastle APG Northeast, Inc. 100 Specialty masonry, hardscape and(trading as Anchor Concrete Products, patio productsArthur Whitcomb, Balcon, Betco Block, Betco Supreme, DomineBuilders Supply, Foster-Southeastern,Oldcastle Easton, Trenwyth Industries)
Oldcastle APG South, Inc. 100 Specialty masonry, hardscape and(trading as Adams Products, Big Rock patio productsBuilding Products, Bosse ConcreteProducts, Georgia Masonry, GoriaEnterprises, The Keystone Group)
Oldcastle APG Texas, Inc. 100 Specialty masonry and stone(trading as Custom-Crete, products, hardscape and patioCustom Stone Supply, productsEagle-Cordell Concrete Products,Jewell Concrete Products)
Oldcastle APG West, Inc. 100 Specialty masonry, hardscape and(trading as Amcor Masonry Products, patio productsCentral Pre-Mix Concrete Products,Oldcastle Stockton, Sierra BuildingProducts, Superlite Block, Young Block)
Oldcastle Lawn & Garden, Inc. 100 Patio products, bagged stone, mulch and stone
Oldcastle Coastal, Inc. 100 Patio products
Oldcastle Westile, Inc. 100 Concrete rooftile and pavers
Paver Systems, LLC 100 Hardscape products
Sakrete of North America, LLC Holding company
United States continued
Distribution Group
Allied Building Products Corp. 100
related products, wallboard, metalstuds, acoustical tile and grid
100
Materials Corp. products
AMS Holding, Inc. 100 Distribution of drywall, acoustical ceiling systems, metal studs andcommercial door solutions
Arzee Supply Corp. of New Jersey 100
related products
Mahalo Acquisition 100 Holding companyCorp (trading as G. W. Killebrew)
Oldcastle Distribution, Inc. 100 Holding company
Glass Group
Antamex, Inc. 100 Architectural curtain wall
Oldcastle Glass, Inc. 100 Custom architectural glass, engineered aluminium glazing systems and integrated building envelope solutions
Oldcastle Windows, Inc. 100 Engineered aluminium glazing (trading as Vistawall, Moduline, systemsNaturalite and Skywall)
Southwest Aluminum Systems, Inc. 100 Architectural aluminium store frontsand doors
Texas Wall Systems, Inc. 100 Architectural curtain wall
Construction Accessories and Fencing
Merchants Metals Holding Company 100 Holding company
MMI Products, Inc. 100 Fabrication and distribution of metal(trading as Merchants Metals, products including fencing, welded Ivy Steel & Wire and Meadow Burke) wire reinforcement and concrete
accessories; distribution of plastic, lumber and other metal products
Ivy Steel & Wire, Inc. 100 Welded wire reinforcement manufacturer
MMI StrandCo LP, LLC 100 PC strand
Precast Group
Oldcastle Precast, Inc. 100 Precast concrete products, concretepipe, prestressed plank and structural elements
Inland Concrete Enterprises, Inc. 100 Precast concrete products and drainage products
Incorporated and operating in Products and services Incorporated and operating in Products and services
Principal subsidiary undertakings continued

Europe Materials
Israel
Mashav Initiating and Development 25 CementLimited
Spain
Corporación Uniland S.A.* 26.3 Cement, aggregates, readymixedconcrete and mortar
Europe Products & Distribution
France
Groupe SAMSE* 21.66 Builders Merchants, DIY stores
Americas Materials
United States
Buckeye Ready Mix, LLC* 45 Readymixed concrete
* Audited by firms other than Ernst & Young
Pursuant to Section 16 of the Companies Act, 1986, a full list of subsidiaries, joint ventures and associate undertakings will be annexed to the Company’s Annual Return to be filed in the Companies Registration Office in Ireland.
125CRH
Incorporated and operating in Products and services Incorporated and operating in Products and services
Principal Joint Venture Undertakings Principal Associated Undertakings
Europe Materials
Ireland
Kemek Limited* 50 Commercial explosives
Portugal
Secil-Companhia Geral de Cement, aggregates, concrete Cal e Cimento, S.A.* products, mortar and readymixed
concreteTurkey
Denizli Çimento Sanayii T.A. . 50 Cement and readymixed concrete
Europe Products & Distribution
Belgium
49 XPS insulation
Germany
Bauking AG Builders merchants, DIY stores
Jackon Insulation GmbH* 49.20 XPS insulation
Ireland
Williaam Cox Ireland Limited 50 Glass constructions, continuous
Netherlands
Bouwmaterialenhandel de Schelde bv 50 DIY stores
Portugal
Modelo Distribuição de Materiais de Construção sa* 50 Cash & Carry building materials
Americas Materials
United States
American Cement Company, LLC 50 Cement
Bizzack, LLC 50 Construction
Boxley Aggregates of West Virginia, LLC 50 Aggregates
Cadillac Asphalt, LLC* 50 Asphalt
Americas Products & Distribution
United States
Architectural Products Group
Landmark Stone Products, LLC 50 Veneer stone
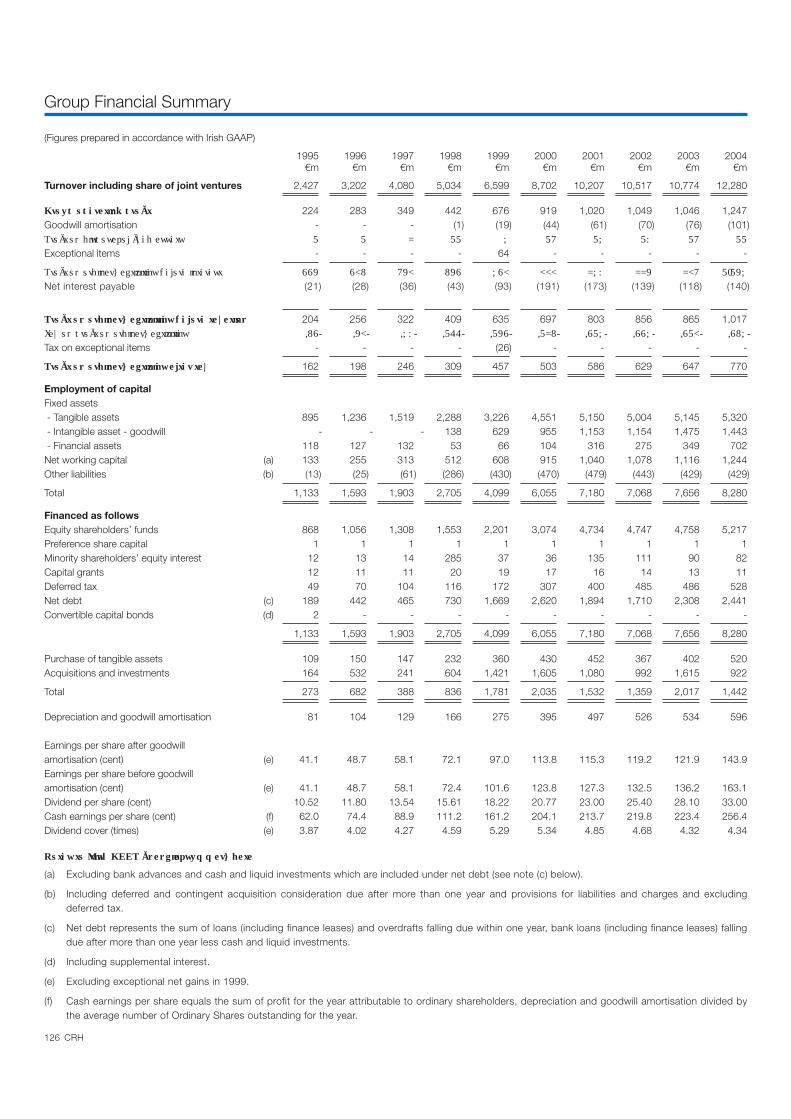
126 CRH
(Figures prepared in accordance with Irish GAAP)
1995 1996 1997 1998 1999 2000 2001 2002 2003 2004€m €m €m €m €m €m €m €m €m €m
Turnover including share of joint ventures 2,427 3,202 4,080 5,034 6,599 8,702 10,207 10,517 10,774 12,280
224 283 349 442 676 919 1,020 1,049 1,046 1,247Goodwill amortisation - - - (1) (19) (44) (61) (70) (76) (101)
Exceptional items - - - - 64 - - - - -
Net interest payable (21) (28) (36) (43) (93) (191) (173) (139) (118) (140)
204 256 322 409 635 697 803 856 865 1,017
Tax on exceptional items - - - - (26) - - - - -
162 198 246 309 457 503 586 629 647 770
Employment of capital Fixed assets - Tangible assets 895 1,236 1,519 2,288 3,226 4,551 5,150 5,004 5,145 5,320 - Intangible asset - goodwill - - - 138 629 955 1,153 1,154 1,475 1,443 - Financial assets 118 127 132 53 66 104 316 275 349 702Net working capital (a) 133 255 313 512 608 915 1,040 1,078 1,116 1,244Other liabilities (b) (13) (25) (61) (286) (430) (470) (479) (443) (429) (429)
Total 1,133 1,593 1,903 2,705 4,099 6,055 7,180 7,068 7,656 8,280
Financed as followsEquity shareholders’ funds 868 1,056 1,308 1,553 2,201 3,074 4,734 4,747 4,758 5,217Preference share capital 1 1 1 1 1 1 1 1 1 1Minority shareholders’ equity interest 12 13 14 285 37 36 135 111 90 82Capital grants 12 11 11 20 19 17 16 14 13 11Deferred tax 49 70 104 116 172 307 400 485 486 528Net debt (c) 189 442 465 730 1,669 2,620 1,894 1,710 2,308 2,441Convertible capital bonds (d) 2 - - - - - - - - -
1,133 1,593 1,903 2,705 4,099 6,055 7,180 7,068 7,656 8,280
Purchase of tangible assets 109 150 147 232 360 430 452 367 402 520Acquisitions and investments 164 532 241 604 1,421 1,605 1,080 992 1,615 922
Total 273 682 388 836 1,781 2,035 1,532 1,359 2,017 1,442
Depreciation and goodwill amortisation 81 104 129 166 275 395 497 526 534 596
Earnings per share after goodwill amortisation (cent) (e) 41.1 48.7 58.1 72.1 97.0 113.8 115.3 119.2 121.9 143.9Earnings per share before goodwill amortisation (cent) (e) 41.1 48.7 58.1 72.4 101.6 123.8 127.3 132.5 136.2 163.1Dividend per share (cent) 10.52 11.80 13.54 15.61 18.22 20.77 23.00 25.40 28.10 33.00Cash earnings per share (cent) (f) 62.0 74.4 88.9 111.2 161.2 204.1 213.7 219.8 223.4 256.4Dividend cover (times) (e) 3.87 4.02 4.27 4.59 5.29 5.34 4.85 4.68 4.32 4.34
(a) Excluding bank advances and cash and liquid investments which are included under net debt (see note (c) below).
(b) Including deferred and contingent acquisition consideration due after more than one year and provisions for liabilities and charges and excluding deferred tax.
(c) Net debt represents the sum of loans (including finance leases) and overdrafts falling due within one year, bank loans (including finance leases) falling due after more than one year less cash and liquid investments.
(d) Including supplemental interest.
(e) Excluding exceptional net gains in 1999.
(f) Cash earnings per share equals the sum of profit for the year attributable to ordinary shareholders, depreciation and goodwill amortisation divided by the average number of Ordinary Shares outstanding for the year.
Group Financial Summary
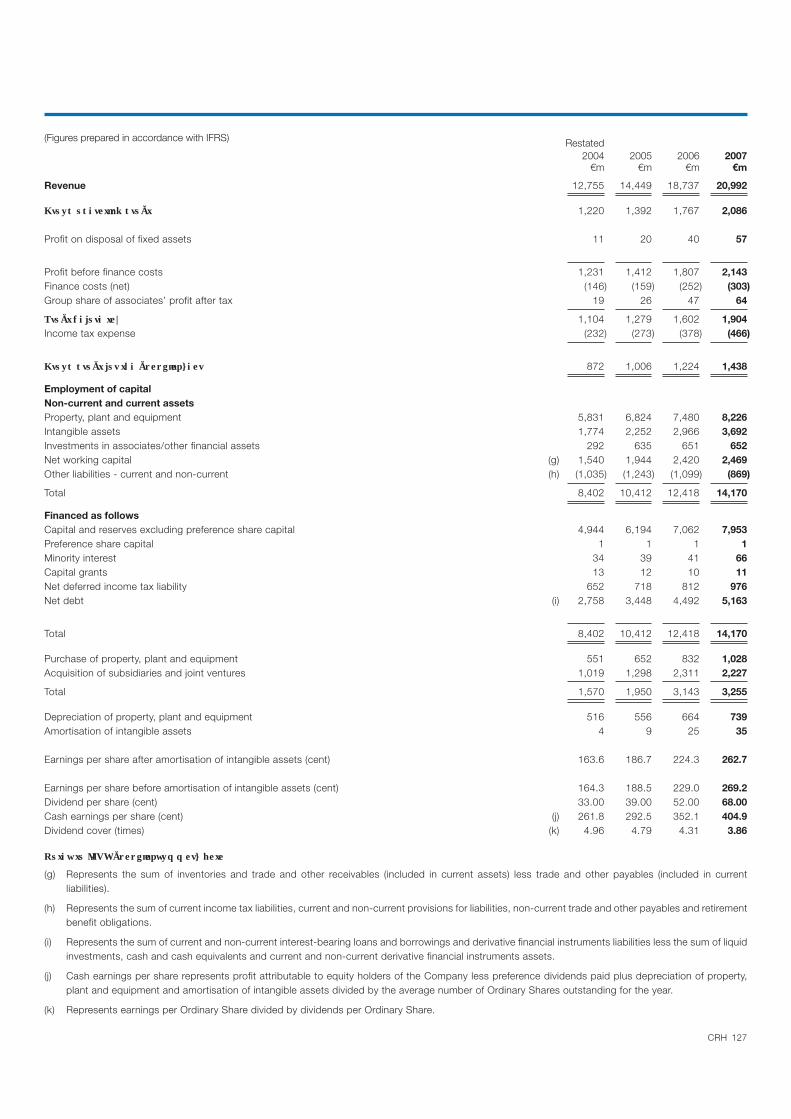
127CRH
(Figures prepared in accordance with IFRS)
2004 2005 2006 2007 €m €m €m €m
Revenue 12,755 14,449 18,737 20,992
1,220 1,392 1,767 2,086
Profit on disposal of fixed assets 11 20 40 57
Profit before finance costs 1,231 1,412 1,807 2,143Finance costs (net) (146) (159) (252) (303)Group share of associates’ profit after tax 19 26 47 64
1,104 1,279 1,602 1,904Income tax expense (232) (273) (378) (466)
872 1,006 1,224 1,438
Employment of capital Non-current and current assetsProperty, plant and equipment 5,831 6,824 7,480 8,226Intangible assets 1,774 2,252 2,966 3,692Investments in associates/other financial assets 292 635 651 652Net working capital (g) 1,540 1,944 2,420 2,469Other liabilities - current and non-current (h) (1,035) (1,243) (1,099) (869)
Total 8,402 10,412 12,418 14,170
Financed as followsCapital and reserves excluding preference share capital 4,944 6,194 7,062 7,953Preference share capital 1 1 1 1Minority interest 34 39 41 66Capital grants 13 12 10 11Net deferred income tax liability 652 718 812 976Net debt (i) 2,758 3,448 4,492 5,163
Total 8,402 10,412 12,418 14,170
Purchase of property, plant and equipment 551 652 832 1,028Acquisition of subsidiaries and joint ventures 1,019 1,298 2,311 2,227
Total 1,570 1,950 3,143 3,255
Depreciation of property, plant and equipment 516 556 664 739Amortisation of intangible assets 4 9 25 35
Earnings per share after amortisation of intangible assets (cent) 163.6 186.7 224.3 262.7
Earnings per share before amortisation of intangible assets (cent) 164.3 188.5 229.0 269.2Dividend per share (cent) 33.00 39.00 52.00 68.00Cash earnings per share (cent) (j) 261.8 292.5 352.1 404.9Dividend cover (times) (k) 4.96 4.79 4.31 3.86
(g) Represents the sum of inventories and trade and other receivables (included in current assets) less trade and other payables (included in current liabilities).
(h) Represents the sum of current income tax liabilities, current and non-current provisions for liabilities, non-current trade and other payables and retirement benefit obligations.
(i) Represents the sum of current and non-current interest-bearing loans and borrowings and derivative financial instruments liabilities less the sum of liquid investments, cash and cash equivalents and current and non-current derivative financial instruments assets.
(j) Cash earnings per share represents profit attributable to equity holders of the Company less preference dividends paid plus depreciation of property, plant and equipment and amortisation of intangible assets divided by the average number of Ordinary Shares outstanding for the year.
(k) Represents earnings per Ordinary Share divided by dividends per Ordinary Share.
Restated
128 CRH
Index
AAccounting policies 61
Acquisition of subsidiaries and joint ventures (note 33) 108
Acquisitions Committee 40, 43
American Depositary Receipts 117
Americas - 2007 Results 27
Americas Materials - Operations Review 28
Americas Products & Distribution - Operations Review 31
Amortisation of intangible assets- Geographical analysis (note 1) 70- Intangible assets (note 14) 84- Segmental analysis (note 1) 68
Annual General Meeting 47, 131
Associated undertakings, principal 120
Associates’ profit after tax, Group share of (note 9) 79
Audit Committee 40, 43
Auditors, Report of Independent 57
Auditors’ remuneration (note 4) 72
BBalance sheet- Company 113- Group 59
Balance: regional, product, sectoral 10
Board approval of financial statements (note 35) 112
Board Committees 40, 43
Board of Directors 40
CCapital grants (note 28) 104
Cash and cash equivalents (note 21) 89
Cash flow statement, Group 60
Cash flow - summary 37
Chairman’s Statement 12
Chief Executive’s Review 15
Climate change 10
Code of business conduct 44
Compound average growth rates 37
Corporate governance 8, 42
Corporate social responsibility 8, 9
CREST 117
DDebt, analysis of net (note 24) 95
Deferred acquisition consideration payable (note 19) 88
Deferred income tax- Expense (note 10) 80- Assets and liabilities (note 26) 99
Depreciation- Group operating profit (note 4) 72- Geographical (note 1) 70- Property, plant and equipment (note 13) 83- Segment (note 1) 68
Derivative financial instruments (note 23) 92
Development activity inside cover, 12
Directors’ emoluments and interests (note 5) 73
Directors’ interests in share capital 55
Directors’ interests - share options 53
Directors’ remuneration, Report on 48
Directors’ Report 46
Directors’ responsibilities, Statement of 56
Disposal of fixed assets (note 16) 87
Dividend payments (shareholder information) 116
Dividends (note 11) 81
Dow Jones Sustainability Index 9
EEarnings per Ordinary Share (note 12) 82
Economic cycles 11
Employees, average numbers (note 6) 73
Employment costs (note 6) 73
End-use- Americas Materials 30- Americas Products & Distribution 34- Europe Materials 22- Europe Products & Distribution 26- Group 10
Environment 8
Europe - 2007 Results 19
Europe Materials - Operations Review 20
Europe Products & Distribution - Operations review 23
Exchange rates 63
FFinance Committee 40, 44
Finance costs and revenue (note 8) 79
Finance leases (note 32) 107
Finance Review 35
Financial assets (note 15) 86
Financial calendar 117
Financial summary, Group (1995-2007) 126
FTSE4Good 9
Fundamental materials 2, 3
GGeographic leadership positions 6, 7
Group overview 2, 4, 6, 8, 10
Guarantees (note 25) 98
Page Page

129CRH
Index continued
HHealth & safety 9
Highlights (financial) 1
IIncome Statement, Group 58
Income tax expense (note 10) 80
Innovest 9
Intangible assets (note 14) 84
Internal control 45
Inventories (note 17) 87
JJoint venture undertakings, principal 125
Joint venture, proportionate consolidation (note 2) 71
KKey components of 2007 performance 35
Key financial performance indicators 37
LLeases, commitments under operating and finance (note 32) 107
Liquid investments (note 21) 89
Loans and borrowing, interest-bearing (note 22) 90
MManagement 118
Minority interest (note 31) 107
NNomination Committee 40, 44
Notes on financial statements 68
Notice of Meeting 131
OOperating costs (note 3) 72
Operating leases (note 32) 107
Operating profit, Group (note 4) 72
Operating profit margin 36
Operations reviews- Americas Materials 28- Americas Products & Distribution 31- Europe Materials 20- Europe Products & Distribution 23
PPayments, share-based (note 7) 73
Pensions, retirement benefit obligations (note 27) 99
Property, plant and equipment (note 13) 83
Provisions for liabilities (note 25) 98
Proxy voting, electronic
RRegistrars 117
Related party transactions (note 34) 112
Remuneration Committee 40, 44
Reserves, share premium account, own shares, foreigncurrency translation and retained income (note 30) 106
Retirement benefit obligations (note 27) 99
SSegmental information (note 1) 68
Senior Independent Director 40, 42
Share-based Payments (note 7) 73
Share capital, equity and preference (note 29) 105
Share options- Directors 53- Employees 74
Share premium (note 30) 106
Share price data 117
Shareholder information 116
Shareholdings as at 31st December 2007 117
Social & Community 9
Statement of Directors’ responsibilities 56
Statement of recognised income and expense, Group 58
Stock Exchange listings 117
Stakeholder communication 44
Strategic vision inside cover
Strategy 4, 5, 10, 11
Subsidiary undertakings, principal 120
Substantial holdings 47
Succession Committee 44
TTotal Shareholder Return inside cover
Trade and other payables (note 19) 88
Trade and other receivables (note 18) 87
Treasury information (note 24) 95
VVolumes, annualised production- Americas Materials 30- Americas Products & Distribution 34- Europe Materials 22- Europe Products & Distribution 26- Group 4, 5
WWebsite 117
Working capital, movement during year (note 20) 89
Page Page

131CRH
Notice of Meeting
The Annual General Meeting of CRH plc will be held at the Royal Marine Hotel, Marine Road, Dun Laoghaire, Co. Dublin at 11.00 a.m. on Wednesday, 7th May 2008 for the following purposes:
Directors and Auditors for the year ended 31st December 2007.
2. To declare a dividend on the Ordinary Shares.
3. To re-elect the following Directors:Mr. N. HarteryMr. T.W. HillMr. K. McGowanMs. J.M.C. O’Connorin accordance with Article 103Mr. U-H. Felchtin accordance with Article 109.
That in accordance with the powers, provisions and limitations of Article 11(e) of the Articles of Association of the Company, the Directors be and they are hereby empowered to allot equity securities for cash and in respect of sub-paragraph (iii) thereof up to an aggregate nominal value of €9,195,000. This authority shall expire at the close of business on the earlier of the date of the Annual General Meeting in 2009 or 6th August 2009.
That the Company be and is hereby authorised to purchase Ordinary
1990), in the manner provided for in Article 8A of the Articles of Association of the Company, up to a maximum of 10% of the Ordinary Shares in issue at the date of the passing of this Resolution. This authority shall expire at the close of business on the earlier of the date of the Annual General Meeting in 2009 or 6th August 2009.
That the Company be and is hereby authorised to re-issue treasury
manner provided for in Article 8B of the Articles of Association of the Company. This authority shall expire at the close of business on the earlier of the date of the Annual General Meeting in 2009 or 6th August 2009.
Special Business
That Clause 4 (21) of the Memorandum of Association of the Company be deleted and replaced by the following new Clause 4 (21):-
“(21) To lend and advance money or other property or give credit or
manner either with or without security and whether with or without the payment of interest and upon such terms and conditions as
to guarantee, indemnify, grant indemnities in respect of, enter into any suretyship or joint obligation, or otherwise support or secure, whether by personal covenant, indemnity or undertaking or by mortgaging, charging, pledging or granting a lien or other security over all or any part of the Company’s property (both present and future) or by any one or more of such methods or any other
method and whether in support of such guarantee or indemnity or suretyship or joint obligation or otherwise, on such terms and
payment of any debts or the performance or discharge of any contract, obligation or actual or contingent liability of any person or company (including, without prejudice to the generality of the foregoing, the payment of any capital, principal, dividends or interest on any stocks, shares, debentures, debenture stock, notes, bonds or other securities of any person, authority or company) including, without prejudice to the generality of the foregoing, any company which is for the time being the
155) of the Company or otherwise associated with the Company, in each case notwithstanding the fact that the Company may not
from entering into any such guarantee or indemnity or suretyship or joint obligation or other arrangement or transaction contemplated herein.”
That the Articles of Association be amended as follows:-
“ “The Acts” means the Companies Acts, 1963 to 2005 and Parts 2 and 3 of the Investment Funds, Companies and Miscellaneous Provisions Act 2006, all statutory instruments which are to be read as one with, or construed or read together as one with, the
enactment thereof for the time being in force;”
“ “Person” means where the context permits an unincorporated body of persons, a partnership, a club or other association as well as an individual and a company which shall be deemed to include a body corporate, whether a company (wherever formed, registered or incorporated), a corporation aggregate, a corporation sole and a national or local government or authority or department or other legal entity or division or constituent thereof;”
(ii) by deleting Article 12 and replacing it with the following new Article 12:
“12. The Company may pay commission to any person in consideration of a person subscribing or agreeing to subscribe, whether absolutely or conditionally, for any shares in the Company or procuring or agreeing to procure subscriptions, whether absolute or conditional, for any shares in the Company on such terms and subject to such conditions as the Directors may determine, including, without limitation, by paying cash or allotting and issuing fully or partly paid shares or any combination of the two. The Company may also, on any issue of shares, pay such brokerage as may be lawful.”
(iii) by deleting sub-paragraphs (a) and (b) from the second paragraph of Article 89 and replacing them with the following:
“(a) the amount of capital of the Company for the time being issued, paid up, or credited as paid up and the amount for the time being of the share premium account; and
132 CRH
Notice of Meeting continued
(b) the amount standing to the credit of retained income, foreign currency translation reserve and other reserves, capital grants, deferred taxation and minority shareholders’ interest, less the amount of any repayable Government grants, all as shown in the then latest audited consolidated
(c) the aggregate amount for the time being of treasury shares and own shares held by the Company (such terms as used
the Company):”
(iv) by deleting Article 127 and replacing it with the following new Article 127:
“127. Notwithstanding anything to the contrary contained in these Articles, whenever any person (including without limitation the Company, a Director, the Secretary, a member or any officer or person) is required or permitted by these Articles, the Acts or any other enactment of the State to give information in writing, such information may be given by electronic means or in electronic form, whether as electronic communication or otherwise, but only if the use of such electronic or other communication conforms with all relevant legislation and provided further that the electronic means or electronic form used has been approved of by the Directors.”
For the Board, A. Malone, Secretary,42 Fitzwilliam Square, Dublin 2.2nd April 2008
Notes
(1) The final dividend, if approved, will be paid on the Ordinary Shares on
(2) Any member entitled to attend and vote at this Meeting may appoint a proxy who need not be a member of the Company.
(3) Shareholders who wish to submit proxies via the internet may do so by accessing either CRH’s website and selecting “Registrars” under “Shareholder Services” in the Investor Relations section or by accessing the Registrars’ website, www.capitaregistrars.ie and selecting “login to Shareholder Services” under “On-line Services”. To submit a proxy on-line shareholders are initially required to register for the service.
(4) CREST members may appoint one or more proxies through the CREST electronic proxy appointment service in accordance with the procedures described in the CREST Manual. CREST Personal Members or other CREST sponsored members who have appointed a voting service provider(s) should refer to their CREST sponsor or voting service provider(s), who will be able to take the appropriate action on their behalf. Further information on CREST procedures and requirements is contained in the CREST Manual. The message appointing a proxy(ies)
taken to be the time (as determined by the timestamp generated by the CREST system) from which the Registrar is able to retrieve the message by enquiry to CREST in the manner prescribed by CREST. The Company may treat as invalid a proxy instruction in the circumstances set out in Regulation 35(5)(a) of the Companies Act 1990 (Uncertificated Securities) Regulations 1996.
(5) Pursuant to Regulation 14 of the Companies Act, 1990 (Uncertificated Securities) Regulations, 1996, the Company hereby specifies that only those shareholders registered in the Register of Members of the
attend or vote at the Annual General Meeting in respect of the number of shares registered in their name at that time.
(6) The holders of preference shares, although entitled to receive copies of the reports and financial statements, are not entitled to attend and vote at this Meeting in respect of their holdings of such shares.

This report is printed on paper manufactured to the highest environmental standards.
The wood pulp comes from forests that are being continuously replanted.
Designed and produced by Lunt McIntyre. Printed by The Printed Image.
CRH® is a registered trade mark of CRH plc
The International Building Materials Group
CRH plc
Belgard Castle ClondalkinDublin 22 Ireland
Telephone: +353 1 404 1000Fax: +353 1 404 1007 E-mail: [email protected]
Website: www.crh.com
Registered Office42 Fitzwilliam Square Dublin 2Ireland
Telephone: +353 1 634 4340 Fax: +353 1 676 5013 E-mail: [email protected]
Front cover: Element AG, the largest provider of precast concrete elements for building construction and civil engineering in Switzerland, is constructing various shops and distribution centres for the discount chain ALDI as they enter the Swiss market. Pictured here is the installation of a double T-plate for the 580,000m3 capacity ALDI Distribution Centre in Domdidier, Fribourg. This centre is being constructed to tight deadlines using 1,860 elements (facades and supportingstructures) and will open for operation in summer 2008. With three production locations, Element AG annually produces and delivers 55,000m3 of precast elements to all regions of Switzerland.