Centre for Financial Risk - Department of Economics - Macquarie

www.macquarie.com.au MACQUARIE BANK LIMITED ACN 008 583 542
MA
CQ
UA
RIE
BA
NK
2007 FINA
NC
IAL R
EPO
RT
MACQUARIE BANK 2007 FINANCIAL REPORT

eTreeMacquarie Bank is proud to be a Foundation Member of eTree. eTree is a Computershare Limited initiative with Landcare Australia which provides an environmental incentive to shareholders of Australian companies to elect to receive shareholder communications electronically. For every shareholder who registers an email address Macquarie will donate $2 to Landcare Australia to support reforestation projects in the state or territory where the registered shareholder resides.
Macquarie Bank shareholders can register to receive their shareholder communications, such as the Annual Review, electronically, by visiting www.etree.com.au/macquarie and registering their email address.
The Holey Dollar In 1813 Governor Lachlan Macquarie overcame an acute currency shortage by purchasing Spanish silver dollars (then worth five shillings), punching the centres out and creating two new coins – the ‘Holey Dollar’ (valued at five shillings) and the ‘Dump’ (valued at one shilling and three pence).
This single move not only doubled the number of coins in circulation but increased their worth by 25 per cent and prevented the coins leaving the colony. Governor Macquarie’s creation of the Holey Dollar was an inspired solution to a difficult problem and for this reason it was chosen as the symbol for the Macquarie Group.
2007 Annual General Meeting Macquarie Bank’s 2007 Annual General Meeting will be held at 10.30am on Thursday, 19 July 2007 at the Westin Sydney, in the Grand Ballroom, Lower Level, No.1 Martin Place, Sydney.
Details of the business of the meeting will be contained in the separate Notice of Annual General Meeting to be sent to shareholders.
Cover: Thames Water Thames Water is the largest water and wastewater services company in the United Kingdom, serving eight million water and 13 million wastewater customers across London and the Thames Valley. The history of Thames Water dates back to the early 1600s when the privately funded New River, a 40-mile channel, was built to create London’s water supply.
On 1 December 2006, a Macquarie-led consortium, Kemble Water, acquired Thames Water for £8 billion ($A19.88 billion). Kemble Water, named after the town near the headwaters of the Thames River, is the largest consortium Macquarie has ever brought together and includes investors from Europe, North America and Australasia.
On Kemble Water’s behalf, Macquarie has been working closely with Thames Water management to help lay the foundations for a new era for the company.
The Macquarie Bank 2007 annual report is printed on Media Print, an EMAS accredited paper stock which is totally chlorine free. EMAS is the European Union’s regulated environmental management system.
The Macquarie Bank Group’s 2007 annual report consists of two documents – the 2007 Annual Review (incorporating the Concise Report) and the 2007 Financial Report. The Annual Review provides an overview of the Group’s operations and a summary of the financial statements. This Financial Report contains the Bank’s risk management report and statutory financial statements.
If you would like a copy of the 2007 Annual Review please call us on +61 2 8232 5006 or visit www.macquarie.com.au/shareholdercentre.
Des
igne
d by
Fro
st D
esig
n, S
ydne
y
Prin
t man
agem
ent b
y O
ctop
us S
olut
ions
Macquarie Bank Head Office No.1 Martin Place Sydney NSW 2000 Australia
Tel: +61 2 8232 3333 Fax: +61 2 8232 3350
Registered Office Macquarie Bank Limited Level 3, 25 National Circuit Forrest ACT 2603 Australia
Tel: +61 2 6225 3000
Cover photograph by Steve Speller. Map image © Crown Copyright (2007). All rights reserved. Ordnance Survey Licence Number 100019345.

�
RiskManagementReport 2 Incomestatements 7 Balancesheets 8 Statementsofchangesinequity 10 Cashflowstatements 11 Notestothefinancialstatements
� Summaryofsignificantaccountingpolicies �2 2 Profitforthefinancialyear 2�
3 Revenuefromoperatingactivities 23 4 Segmentreporting 23 5 Incometax(expense)/benefit 25 6 Dividendspaidanddistributionspaidorprovided 26 7 Earningspershare 27 8 Duefrombanks 28 9 Cashcollateralonsecuritiesborrowedandreverserepurchaseagreements 28�0 Tradingportfolioassets 28�� Loanassetsheldatamortisedcost 29�2 Impairedassets 29�3 Otherfinancialassetsatfairvaluethroughprofitandloss 30�4 Otherassets 30�5 Investmentsecuritiesavailableforsale 30�6 Intangibleassets 30�7 Lifeinvestmentcontractsandotherunitholderassets 3��8 Interestinassociatesandjointventuresusingtheequitymethod 3��9 Property,plantandequipment 3420 Investmentsincontrolledentities 342� Deferredincometaxassets/(liabilities) 3622 Assetsanddisposalgroupsclassifiedasheldforsale 3623 Duetobanks 3824 Cashcollateralonsecuritieslentandrepurchaseagreements 3825 Tradingportfolioliabilities 3826 Debtissuedatamortisedcost 3827 Otherfinancialliabilitiesatfairvaluethroughprofitandloss 3828 Otherliabilities 3929 Provisions 3930 Loancapital 393� Contributedequity 4032 Reserves,retainedearningsandminorityinterests 4�33 Notestothecashflowstatements 4334 Relatedpartyinformation 4435 KeyManagementPersonneldisclosure 4636 Employeeequityparticipation 5437 Contingentliabilitiesandassets 5738 Capitalandotherexpenditurecommitments 5739 Leasecommitments 5840 Derivativefinancialinstruments 584� Averageinterest-bearingassetsandliabilitiesandrelatedinterest 6�42 Geographicalconcentrationofdepositsandborrowings 6343 Maturityanalysisofmonetaryassetsandliabilitiesandliquiditymanagement 6544 Interestraterisk 6945 Fairvalue 7746 Creditrisk 7847 AuditandotherservicesprovidedbyPricewaterhouseCoopers(“PwC”) 8648 Acquisitionanddisposalofcontrolledentities 8749 Eventsoccurringafterreportingdate 88 Directors’declaration 89 Independentauditreport 90 Tenyearhistory 92
TheFinancialReportwasauthorisedforissuebytheDirectorson14May2007.TheBankhasthepowertoamendandreissuetheFinancialReport.
MacquarieBankLimitedContents

MacquarieBankLimited2007FinancialReport2
RiskManagementReport
RiskisanintegralpartoftheMacquarieBankGroup’s(MacquarieortheBank)businesses.ManagementofthatriskisthereforecriticaltotheBank’scontinuingprofitability.StrongindependentprudentialmanagementhasbeenakeytotheGroup’ssuccessovermanyyears.Whereriskisassumed,itiswithinacalculatedandcontrolledframework.
ThemainrisksfacedbytheBankaremarketrisk,equityrisk,creditrisk,liquidityrisk,operationalrisk,legalcomplianceriskanddocumentationrisk.Responsibilityformanagementoftheseriskslieswiththeindividualbusinessesgivingrisetothem.ItistheresponsibilityoftheRiskManagementGroup(“RMG”)toensureappropriateassessmentandmanagementoftheseriskswithinMacquarie.Theserisksarequantifiedandaggregatedintheeconomiccapitalmodel.
TheriskmanagementprinciplesfollowedbyMacquarieare:
–Independence–RMGisindependentofallotherareasoftheBank,reportingdirectlytotheManagingDirectorandtheBoard.TheHeadofRMGisamemberoftheGroup’sExecutiveCommittee.RMGauthorityisrequiredforallmaterialriskacceptancedecisions.RMGidentifies,quantifiesandassessesallrisksandsetsprudentiallimits.Whereappropriate,theselimitsareapprovedbytheExecutiveCommitteeandtheBoard.
–Centralisedprudentialmanagement–RMG’sresponsibilitycoversthewholeoftheMacquarieBankGroup,meaningitcanassessrisksfromaBank-wideperspectiveandensureaconsistentapproachacrossallareas.
–Approvalofallnewbusinessactivities–OtherareasoftheBankcannotundertakenewbusinessesoractivities,offernewproductsorenternewmarketsorundertakesignificantchangetoexistingproductsorprocesseswithoutRMG’sapproval.
–Continuousassessment–RMGcontinuallyreviewschangesinrisksbroughtaboutbybothexternaldevelopmentsandinternalcircumstances.
–Frequentmonitoring–CentralisedsystemsallowRMGtomonitorcreditandmarketrisksdaily.RMGstaffliaisecloselywithotherareasoftheBanktoensurethat,shouldanylimitbreachesoccur,theyareimmediatelyaddressed,andescalatedasnecessary.
Market riskMarketriskistheriskoflossassociatedwithchangesinthelevelofvolatilityorpricesinmarketstowhichtheGroupisexposed.TheGroupisexposedtothefollowingrisksineachofthemajormarketsinwhichittrades:
–foreignexchangemarkets:changesinspotandforwardexchangeratesandthevolatilityofexchangerates;
–interestratemarkets:changesinthelevel,shapeandvolatilityofyieldcurves,thebasisbetweendifferentinterestratesecuritiesandderivativesandcreditmargins;
–equitymarkets:changesinthepriceandvolatilityofindividualequities,equitybasketsandequityindices,includingtherisksarisingfromequityunderwritingactivity;
–bullionmarkets:changesinthepriceandvolatilityofgoldandsilver;and
–commoditymarkets:changesinthepriceandvolatilityofbasemetals,agriculturalcommoditiesandenergyproducts.
Inaddition,certainproductsinvolveanexposuretothecorrelationsbetweenthepricesofdifferentinstruments.
RMGmeasuresexposuresinallmarketsforeachdealingdeskandformarketsinaggregate.Riskexposuresaremeasuredonderivativesandunderlyingassetsandliabilitiesinthesamemarket,together.
RMGsetslimitsforallexposuresinallmarkets.Limitsaresetforindividualmarketsandtradingareas,andfortheGroupasawhole.LimitsontheGroup’saggregatemarketriskareapprovedbytheGroup’sExecutiveCommittee.TheaggregateexposuretoeachmarketislimitedtoasmallpercentageoftheGroup’sshareholders’funds.Tradinglimitsarenottargetsandactualexposuresinnormalday-to-daytradingtendtobewellbelowlimits.
RMGmonitorsmarketrisksagainstlimitsdailyandprovidesareportofmarketexposurestoseniormanagementeveryday.
Marketrisklimitsaresetonthreecomplementarybases:
–awiderangeofpriceandvolatilityscenarios,includingcomprehensiveworstcase,orstress,scenarios.Thesescenariosaremeasuredeverydayandformthecornerstoneoftheriskmanagementapproach.Thescenariosaresetformovementsinindividualpricesandrates,aswellasforsimultaneousmovementsinmultiplemarkets.Theworstcasescenariosincludemarketmovementslargerthanhaveoccurredhistorically.Multiplescenariosaresetforeachmarketsoastocapturethenon-linearityandcomplexityofexposuresarisingfromderivatives.Awiderangeofassumptionsaboutthecorrelationsbetweenmarketsisapplied;
–astatisticallybasedValueAtRisk(VaR)measurewhich,tocorrespondwiththeAustralianPrudentialRegulationAuthority’s(APRA)capitaladequacystandard,isbasedona�0-dayholdingperiodanda99percentconfidencelevel.RMGperformsbacktestingontheVaRresults,whichrepresentsacomparisonofhypotheticaldailytradingprofitsandlossesagainstthedailyVaR.VaRiscalculatedusingaMonteCarlosimulationapproach;and
–volume,maturityandopenpositionlimitsaresetonalargenumberofmarketinstrumentsandpositionsinordertoconstrainconcentrationriskandtoavoidtheaccumulationofrisky,illiquidpositions.

3
Thetablebelowshowstheaverage,maximumandminimumVaRovertheyearforthemajormarketsinwhichtheBankoperates.TheVaRshowninthetableisbasedonaone-dayholdingperiod.TheaggregateVaRisonacorrelatedbasis.
ValueatRisk(VaR)figuresforyearended31March
2007 2007 2007 2006 2006 2006 Average Maximum Minimum Average Maximum Minimum $m $m $m $m $m $m
Equities 7.91 13.67 3.39 5.97 �0.69 2.�5Interestrates 2.13 3.33 1.26 3.35 5.30 �.09Foreignexchangeandbullion 2.19 4.72 1.39 �.49 3.48 0.5�Commodities 3.50 8.00 1.43 �.97 4.3� �.02Aggregate 8.44 15.22 2.18 6.90 ��.32 3.34
TheGroupalsohasexposuretonon-tradedinterestrateriskgeneratedbybankingproductssuchasloansanddeposits.Bankingbusinesseshavesmalllimitstoaccumulatemarketableparcelsofinterestraterisk.Whereverpossible,theseinterestraterisksaretransferredtoMacquarie’sTreasury&Commoditiesbusinessandmanagedwithintradedmarketrisklimits.Someresidualinterestraterisksremaininthebankingbookasanunavoidableconsequenceofdoingbusiness.ResidualriskshaveindependentlimitsthataremonitoredbyRMGMarketRisk.BankingbookinterestrateexposureisregularlyreportedtoExecutiveManagement.
Equity riskRisksariseonequity-likeexposuresthataretakenbyMacquariefromtimetotime.Theseexposuresinclude:
–HoldingsinspecialisedfundsmanagedbytheBank–DirectinvestmentsinentitiesexternaltotheBank–Property–Leaseresiduals–Holdingsofseedassetsforfunds.
AlloftheabovepositionsaresubjecttoanaggregateEquityRiskLimit(ERL).TheERLissetbytheBoard.Theexposuresarisingoneachofthepositionsarecalculatedona‘worstcase’basisdependingonthenatureoftheasset,andareaggregatedtodetermineatotalportfolioriskvalue,takingintoaccountthecorrelationsbetweenthevariousassetclasses.ThelimitismonitoredbyRMGandreportedmonthlytotheBoard.
Forsignificantacquisitionsorseedassets,RMGundertakesacomprehensiveassessmentoftheassociatedrisks.Dependingonthetypeofacquisition,thiscanincludeanoveralltransactionreview,aswellastheidentificationandassessmentofallrisksandpotentiallossesassociatedwiththeacquisitionsuchas:
–marketandcreditrisks–regulatory,capital,liquidityandcompliancerequirements–operationalandreputationrisks.
AllmaterialequityriskpositionsaresubjecttoapprovalbyRMGandbytheManagingDirector,ExecutiveCommitteeandtheBoard,dependingonthesizeandnatureoftherisk.

MacquarieBankLimited2007FinancialReport4
Allcreditexposuresaremonitoredregularlyagainstlimits.Creditexposureswhichfluctuatethroughtimearemonitoreddaily.Theseincludeoff-balancesheetexposuressuchasswaps,forwardcontractsandoptions,whichareassessedusingsophisticatedvaluationtechniques.
Tomitigatecreditrisk,Macquariemakesincreasinguseofmarginingandotherformsofcollateralorcreditenhancementtechniques(includingguarantees,lettersofcreditandthepurchaseofcreditdefaultswaps)whereappropriate.
TheBank’spoliciestocontrolcreditriskincludeavoidanceofunacceptableconcentrationsofriskeithertoanyeconomicsectorortoanindividualcounterparty.Policiesareinplacetoregulatelargeexposurestosinglecounterpartiesorgroupsofcounterparties.Suchexposuresaregenerallyrestrictedunlessthecreditisofthehigheststandardorthereisahighlevelofsecurity.
Asoffshoreexposurescontinuetogrowtheanalysisofcountryriskisofincreasingimportancetocreditrisk.WhilethemajorityofexposurescontinuetobetoOECDcountries,Macquariealsohasexposurestonon-OECDAsiaandSouthAmerica,andlimitedexposuretoAfricancountries.Macquariehasdevelopedacountryriskframeworkwhichcoverstheassessmentofcountryriskandtheapprovalofcountryrisklimits.Whereappropriatethecountryriskiscoveredbypoliticalriskinsurance.
Credit riskCreditriskarisesfrombothlendingandtradingactivities.Inthecaseoftradingactivity,creditriskreflectsthepossibilitythatthetradingcounterpartywillnotbeinapositiontocompletethecontractatanystage.TheresultantcreditexposureisafunctionofthemovementofpricesoverthetermoftheunderlyingcontractandsystemsfortheassessmentofpotentialcreditexposuresexistforeachofMacquarie’stradingactivities.
Nomaterialcreditexposuresareassumedwithoutappropriateanalysis.Afterthisanalysisisundertakenlimitsaresetforanacceptablelevelofpotentialexposure.Alllimitsarereviewedatleastonceayear,ormorefrequentlyifnecessary,toensurethatthemostcurrentinformationavailableoncounterpartiesistakenintoaccount.
Macquarie’sphilosophyoncreditriskmanagementreflectstheprincipleofseparatingprudentialcontrolfromoperationalmanagement.Theresponsibilityforapprovalofcreditexposuresisdelegatedtospecificindividuals.Allapprovalsreflecttwoprinciples:arequirementfordualsign-offandarequirementthat,aboverelativelylowlimits,allcreditexposuresmustbeapprovedoutsidethebusinesslineproposingtoundertakethem.MostcreditdecisionsarethereforetakenwithinRMG.AllcounterpartiesareratedonaMacquarieratingscalewhichissimilartothatusedbypublicratingsagencies.EachratingisassociatedwithaProbabilityofDefaultandanassessmentisalsomadeoftheLossGivenDefault.Thisclassificationenableseffectiveapplicationofresourcestothemanagement,pricingandmonitoringofcreditexposures.
RiskManagementReportcontinued
-0.2
0.0
0.2
0.4
0.6
0.8
1.0
1.2
2007
2006
2000
1999
1998
2002
2001
2003
2004
2005
Ratio of provisions and impaired assets to loans, advances and leasesPer centCollective provision to loans, advances and leases (Balance sheet)Net impaired assets to loans, advances and leases (Balance sheet)Net credit losses to loans, advances and leases (Income statement)

5
Liquidity riskResponsibilityforMacquarie’sliquiditypolicylieswithRMG.ItisreviewedregularlyandhasbeenagreedwithAPRA.
Liquidityrequirementsaremanagedonaday-to-daybasisbytheTreasuryDivision.TheyareresponsibleforensuringfundingisreadilyavailableforalltheBank’stransactions,eveninacrisisscenario,andformaintainingadiversityoffundingsources.
RMGmonitorsadherencetoliquiditypolicyonadailybasis.
AfulldescriptionofMacquarie’sliquiditypolicyiscontainedinnote43totheFinancialReport.
Operational riskMacquarieBankfacesoperationalriskswhichcouldleadtoreputationdamage,financiallossorregulatoryconsequencesasaresultofinadequateorfailedinternalprocesses,peopleorsystems,orbecauseofexternalevents.Responsibilityformanagementofoperationalriskliesinthefirstinstancewiththeareaconcerned.BusinessOperationalRiskManagershavebeenappointedtohelpensureallareasoftheBankmeetthisresponsibility.
AllareasoftheBankperformregularoperationalriskselfassessments,reportanyinternallosses(includingexpectedlossesandnearmisses)andapplyBank-wideandbusiness-specificpoliciesasappropriate.Operationalriskisakeyfactorintheconsiderationandapprovalofeachnewproductandnewbusinesspriortoitsimplementation.
RMGassessesoperationalriskacrossMacquarieasawholeandensuresthatanappropriateframeworkexiststoidentify,assessandmanageoperationalrisk.RMGensuresthatoperationalriskthroughouttheBankisidentifiedandthatappropriateresourcesareavailabletocontrolit.
Legal and compliance riskMacquarieactivelymanageslegalandcomplianceriskstoitsbusinesses.Legalandcompliancerisksincludetheriskofbreachesofapplicablelawsandregulatoryrequirements,actualorperceivedbreachesofobligationstoclientsandcounterparties,unenforceabilityofcounterpartyobligationsandtheinappropriatedocumentationofcontractualrelationships.
EachoftheBank’sbusinessesisresponsiblefordevelopingandimplementingitsownlegalriskmanagementandcomplianceprocedures.RMGassessescomplianceriskfromaBank-wideperspectiveandworkscloselywithlegal,complianceandprudentialteamsthroughoutMacquarietoensurecompliancerisksareidentifiedandappropriatestandardsareappliedconsistentlytothesecompliancerisks.Thedevelopmentofnewbusinessesandregulatorychanges,domesticallyandinternationally,arekeyareasoffocuswithinthisrole.
Other industries 5%
Wholesale & retail trade 3%
Mining 3%
Govt admin & defense 3%Health & community services 1%
Communication services 1%
Finance and insurance 34%
Private households/individuals 30%
Property and business services 14%
Transport and storage 6%
Loans, advances and leases by sector

MacquarieBankLimited2007FinancialReport6
Economic capital modelMacquarie’seconomiccapitalmodelassessesriskbasedoninternalmodelsforeachmajorrisktype:
–CreditRisk:creditportfoliomodelbasedonlossestimatesanddefaultprobabilitieslinkedtoMacquarie’sinternalratingssystem
–MarketRisk:worstcasemulti-marketscenarioanalysisandthevalue-at-riskmodel
–EquityRisk:aportfoliomodelbasedonworstcaseriskestimatesandcorrelationassumptionsacrossassetclasses
–OperationalRisk:statisticalmodelbasedonscenarioanalysisforpotentiallyseverelosses.
Therisksarethenaggregated,recognisingdiversificationbenefits,andcapitalisallocatedtobusinessareasacrosstheBank.Thisisusedtocalculatereturnoncapitalforeachoftheseareas.Economiccapitalmethodsallowassessmentofprojectedreturnsrelativetoriskonnewbusinessapprovals,newproductapprovalsandsignificantindividualtransactions.
Theaggregateriskissubjecttotheglobalrisklimit.ThislimitrepresentsthefinancialresourcesavailabletoMacquarietoabsorbrisk.
TheeconomiccapitalmodelismanagedbyRMGwithregularreportingtoseniormanagementandtheBoard.
Basel IIAPRAhavecommencedthereleaseofdraftAustralianPrudentialStandardsbasedonBaselII.Itisanticipatedthatallstandardswillbeissuedbymidyearafterfinalconsultationwithindustryparticipants.Thesestandardswillcomeintoforcefrom�January2008withtransitionalcapitalarrangementsinplaceforthefirsttwoyearsofoperation.
UndertheBaselIIcapitalframework,theBankforInternationalSettlementsseekstosecureinternationalconvergenceonregulationsgoverningthecapitaladequacyofinternationallyactivebanks.Indoingthis,itaimsformorerisk-sensitivecapitalrequirementsthatareconceptuallysoundandarebasedonabank’sownassessmentofitsrisks.Banksareabletoselectapproachesthataremostappropriatefortheiroperations.
MacquariehasappliedtoAPRAforaccreditationundertheFoundationInternalRatingsBasedApproachforcreditriskandtheAdvancedMeasurementApproachforoperationalrisk.Inpreparingitssubmission,theGrouprevieweditsriskmanagementpracticesagainsttherequirementsoftheBaselIIframework.APRAisexpectedtorespondtotheapplicationbefore3�December2007.MacquarieispreparingforthefullimplementationofBaselIIin2008.
APRAhavecommencedthereleaseofdraftAustralianPrudentialStandardsbasedonBaselII.ItisanticipatedthatallStandardswillbeissuedbymidyearafterconsultationwithindustryparticipants.Thesestandardswillcomeintoforcefrom�January2008withtransitionalcapitalarrangementsinplaceforthefirsttwoyearsofoperation.
Internal AuditInternalAuditprovidesindependentassurancetoseniormanagementandtheBoardontheadequacyandeffectivenessofMacquarie’sfinancialandriskmanagementframework.InternalAuditformsanindependentandobjectiveassessmentastowhetherriskshavebeenadequatelyidentified,adequateinternalcontrolsareinplacetomanagethoserisksandthosecontrolsareworkingeffectively.InternalAuditisindependentofbusinessmanagementandoftheactivitiesitreviews.TheHeadofInternalAuditisjointlyaccountabletotheBoardAuditandComplianceCommittee(BACC)andtheHeadofRMGandhasfreeaccessatalltimestotheBACC.
International officesMacquarie’sinternationalofficesaresubjecttothesameriskmanagementcontrolsthatapplyinAustralia.Beforeaninternationalofficecanbesetuporundertakenewactivities,RMGanalysestheproposedactivities,infrastructure,resourcingandprocedurestoensureappropriateriskmanagementcontrolsareinplace.RMGstaffmonitorandroutinelyvisitoverseasofficestoensurecompliancewithprudentialcontrols.Inaddition,RMGstaffarelocatedincertainofthelargeroffices.
Whereinternationalofficesundertaketradingactivities,dailyreportsareproducedinSydneyandallexposures,bothcreditandmarket,aremonitoredagainstestablishedlimits.
RMG resourcesMacquariecontinuestogrowrapidly,andMacquarierecognisestheimportanceofensuringthatthisgrowthismanagedeffectively.RMGresourceshavebeenincreasingslightlyfasterthanGroup-wideheadcount.RMGhasalsobeenexpandingitsinternationalpresence.
RMGheadcountat31March
2004 2005 2006 2007*
Credit 36 52 72 82Compliance 22 38 58 67InternalAudit 22 34 37 43Finance(a) �8 23 34 62OperationalRisk (b) n/a n/a 7 �3Other 3 8 �0 �6
Total �0� �55 2�8 283
BasedinAustralia 85 �23 �55 �90Basedoverseas �6 32 63 93
TotalRMGStaff �0� �55 2�8 283
* Includescontractors.
RiskManagementReportcontinued
(a)FinanceistheareaofRMGwhichoverseesmarketrisk,equityrisk,liquidityrisk,theeconomiccapitalmodelandtheBank’scomplianceobligationstoAPRA.FinancenowincludestheQuantitativeApplicationsDivision.
(b)Until3�March2005,internalauditandoperationalriskfunctionswerecombinedwithinanareaknownasOperationalRiskReview.Since�April2005,theareashavebeenoperatingseparately.

7
Consolidated Consolidated Bank Bank 2007 2006 2007 2006 Notes $m $m $m $m
Interestandsimilarincome 2 4,632 3,�36 3,368 2,0�7Interestexpenseandsimilarcharges 2 (3,904) (2,544) (2,850) (�,680)
Netinterestincome 728 592 518 337
Feeandcommissionincome 2 3,540 2,842 1,264 794Nettradingincome 2 1,047 876 921 709Shareofnetprofitsofassociatesandjointventuresusingtheequitymethod 2 242 �72 – –Otheroperatingincome 2 1,676 4�� 1,985 �,078Impairmentcharges 2 (52) (6�) (42) (46)
Totaloperatingincome 7,181 4,832 4,646 2,872
Employmentexpenses 2 (3,733) (2,407) (2,561) (�,59�)Brokerageandcommissionexpenses 2 (421) (366) (306) (267)Occupancyexpenses 2 (226) (�39) (139) (82)Non-salarytechnologyexpenses 2 (163) (�28) (101) (85)Otheroperatingexpenses 2 (710) (505) (441) (266)
Totaloperatingexpenses (5,253) (3,545) (3,548) (2,29�)
Operatingprofitbeforeincometax 1,928 �,287 1,098 58�Incometax(expense)/benefit 5 (377) (290) (13) 4
Profitfromordinaryactivitiesafterincometax 1,551 997 1,085 585Profitattributabletominorityinterests (57) (52) – –
ProfitattributabletoequityholdersofMacquarieBankLimited 1,494 945 1,085 585
Distributionspaidorprovidedon: MacquarieIncomeSecurities 6 (31) (29) – – Convertibledebentures 6 – – (54) (5�)
ProfitattributabletoordinaryequityholdersofMacquarieBankLimited 1,463 9�6 1,031 534
Centspershare
Basicearningspershare 7 591.6 400.3Dilutedearningspershare 7 569.8 382.3
The above income statements should be read in conjunction with the accompanying notes.
Incomestatementsforthefinancialyearended3�March2007

MacquarieBankLimited2007FinancialReport8
Consolidated Consolidated Bank Bank 2007 2006 2007 2006 Notes $m $m $m $m
AssetsCashandbalanceswithcentralbanks 3 5 3 5Duefrombanks 8 6,120 6,394 4,580 4,579Cashcollateralonsecuritiesborrowedandreverserepurchaseagreements 9 25,909 �3,570 25,843 �3,565Tradingportfolioassets �0 15,518 �4,246 14,931 �3,030Loanassetsheldatamortisedcost �� 45,796 34,999 18,759 �3,�8�Otherfinancialassetsatfairvaluethroughprofitandloss �3 2,779 2,�04 2,180 �,894Derivativefinancialinstruments–positivevalues 40 11,913 �0,978 11,047 �0,6�8Otherassets �4 10,444 8,452 4,699 3,2�3Investmentsecuritiesavailableforsale �5 6,060 3,746 3,211 2,3�0Intangibleassets �6 100 �50 10 ��Lifeinvestmentcontractsandotherunitholderassets �7 5,847 5,�83 – –Duefromcontrolledentities – – 13,527 �0,24�Interestinassociatesandjointventuresusingtheequitymethod �8 4,071 3,463 613 833Property,plantandequipment �9 378 292 150 90Investmentsincontrolledentities 20 – – 4,085 4,087Deferredincometaxassets 2� 457 240 431 232
Assetsanddisposalgroupsclassifiedasheldforsale 22 994 2,389 139 �8
Totalassets 136,389 �06,2�� 104,208 77,907
LiabilitiesDuetobanks 23 4,127 2,��8 2,111 �,2�7Cashcollateralonsecuritieslentandrepurchaseagreements 24 7,489 6,995 7,489 6,995Tradingportfolioliabilities 25 15,922 �0,057 15,957 �0,053Derivativefinancialinstruments–negativevalues 40 11,069 �0,057 9,800 9,286Deposits 12,403 9,267 12,055 9,094Debtissuedatamortisedcost 26 51,365 39,022 28,519 20,567Otherfinancialliabilitiesatfairvaluethroughprofitandloss 27 5,552 5,48� 5,149 5,058Otherliabilities 28 11,958 9,553 7,094 4,4�7Currenttaxliabilities 132 97 94 22Lifeinvestmentcontractsandotherunitholderliabilities 5,781 5,�30 – –Duetocontrolledentities – – 7,136 5,275Provisions 29 153 �32 124 �08Deferredincometaxliabilities 2� 78 �57 41 �29
Liabilitiesofdisposalgroupsclassifiedasheldforsale 22 170 �,427 – –
Totalliabilitiesexcludingloancapital 126,199 99,493 95,569 72,22�
LoancapitalSubordinateddebtatamortisedcost 30 1,783 �,��5 1,783 �,��4Subordinateddebtatfairvaluethroughprofitandloss 30 888 266 888 266
Totalliabilities 128,870 �00,874 98,240 73,60�
Netassets 7,519 5,337 5,968 4,306
Balancesheetsasat3�March2007

9
Consolidated Consolidated Bank Bank 2007 2006 2007 2006 Notes $m $m $m $m
EquityContributedequityOrdinarysharecapital 3� 3,103 �,9�6 3,103 �,9�6Treasuryshares 3� (7) (2) – –MacquarieIncomeSecurities 3� 391 39� 391 39�Convertibledebentures 3� – – 884 884Reserves 32 380 250 212 �66Retainedearnings 32 2,795 �,934 1,378 949
TotalcapitalandreservesattributabletoequityholdersofMacquarieBankLimited 6,662 4,489 5,968 4,306
Minorityinterest 32 857 848 – –
Totalequity 7,519 5,337 5,968 4,306
The above balance sheets should be read in conjunction with the accompanying notes.

MacquarieBankLimited2007FinancialReport�0
Consolidated Consolidated Bank Bank 2007 2006 2007 2006 $m $m $m $m
Totalequityatthebeginningoftheyear 5,337 4,425 4,306 3,826
AdjustmentsonadoptionofAASB�32andAASB�39,netoftax: Retainedprofits �6 (�4) Reserves 7� 6�Availableforsaleinvestments,netoftax 77 84 15 45Associatesandjointventures (12) (2) – –Cashflowhedges,netoftax 8 (2) (33) 20Exchangedifferencesontranslationofforeignoperations (3) – 4 (6)
Netincomerecogniseddirectlyinequity 70 �67 (14) �06
Profitfromordinaryactivitiesafterincometax 1,551 997 1,085 585
Totalrecognisedincomeandexpensefortheyear 1,621 �,�64 1,071 69�
Transactionswithequityholdersintheircapacityasequityholders: Contributionsofequity,netoftransactioncosts 1,160 308 1,160 308 Dividendsanddistributionspaidorprovided (633) (550) (602) (52�)Minorityinterest: Reductionofequitynetoftransactioncosts (21) (�2) – – Changesinretainedearningsduetoacquisitionsanddisposals 27 – – – Distributionspaidorprovided (54) (5�) – –Convertibledebentures: Distributionspaidorprovided – – (54) (5�)Otherequitymovements: Sharebasedpayments 87 53 87 53 Netpurchaseoftreasuryshares (5) – – –
Totalequityattheendoftheyear 7,519 5,337 5,968 4,306
Totalrecognisedincomeandexpensefortheyearisattributableto: OrdinaryequityholdersofMacquarieBankLimited 1,533 �,088 1,017 640 MacquarieIncomeSecuritiesholders 31 29 – – Convertibledebenturesholders – – 54 5� Minorityinterest 57 47 – –
Totalrecognisedincomeandexpensefortheyear 1,621 �,�64 1,071 69�
The above statements of changes in equity should be read in conjunction with the accompanying notes.
Statementsofchangesinequityforthefinancialyearended3�March2007

��
Cashflowstatementsforthefinancialyearended3�March2007
Consolidated Consolidated Bank Bank 2007 2006 2007 2006 Notes $m $m $m $m
CashflowsfromoperatingactivitiesInterestreceived 4,461 3,069 3,199 �,980Interestandothercostsoffinancepaid (3,828) (2,30�) (2,767) (�,530)Dividendsanddistributionsreceived 460 230 1,030 465Feesandothernon-interestincomereceived 3,572 2,644 1,653 �,403Feesandcommissionspaid (380) (443) (280) (28�)Netpaymentsfromtradingsecuritiesandotherfinancialassets/liabilities (8,281) (5,257) (8,228) (4,25�)Paymentstosuppliers (797) (827) (255) (�,�53)Employmentexpensespaid (2,377) (�,854) (1,494) (�,2�0)Incometaxpaid (626) (353) (510) (297)Lifeinvestmentcontractincome 415 �93 – –Lifeinvestmentcontractpremiumsreceivedandotherunitholdercontributions 2,594 973 – –Lifeinvestmentcontractpayments (2,469) (�,�87) – –Assetsanddisposalgroupsclassifiedasheldforsale –netreceipts/(payments)fromoperations 173 (2) – (9)Loanassetsgranted(net) (11,621) (7,777) (5,793) (6,034)Recoveryofloanspreviouslywrittenoff 3 – – –Netincreaseinmoneymarketandotherdepositaccounts 17,726 �8,5�0 11,815 �4,350
Netcashflowsfromoperatingactivities 33 (975) 5,6�8 (1,629) 3,433
Cashflowsfrominvestingactivities Paymentsforassetsavailableforsale (14,651) (7,374) (11,489) (5,63�)Proceedsfromtherealisationofassetsavailableforsale 13,762 7,�73 11,969 6,�92Paymentsforinterestsinassociates (1,525) (2,453) (193) (383)Proceedsfromthesaleofassociates 1,080 �,070 771 �43Proceedsfromthesaleofassetsanddisposalgroupsclassifiedasheldforsale 2,159 �,238 52 294Paymentsfortheacquisitionofcontrolledentities,excludingdisposalgroups,netofcashacquired (25) (�06) (1,162) (595)Paymentsfortheacquisitionofassetsanddisposalgroupsclassifiedasheldforsale,netofcashacquired (1,750) (92�) (62) (26)Paymentsforlifeinvestmentcontractsandotherunitholderinvestments (6,083) (5,327) – –Proceedsfromthesaleoflifeinvestmentcontractinvestments 5,520 5,647 – –Paymentsforfixedassets (199) (262) (109) (79)Proceedsfromthesaleoffixedassets 7 5 3 3
Netcashflowsfrominvestingactivities (1,705) (�,3�0) (220) (82)
Cashflowsfromfinancingactivities Proceedsfromtheissueofordinarysharecapital 946 223 946 223Proceedsfrom/(paymentsto)otherminorityinterest 5 (2) – –Repaymentofsubordinateddebt – (26) – (26)Issueofsubordinateddebt 1,394 – 1,394 –Dividendsanddistributionspaid (472) (520) (442) (49�)
Netcashflowsfromfinancingactivities 1,873 (325) 1,898 (294)
Net(decrease)/increaseincash (807) 3,983 49 3,057Cashandcashequivalentsatthebeginningofthefinancialyear 9,133 5,�50 7,304 4,247
Cashandcashequivalentsattheendofthefinancialyear 33 8,326 9,�33 7,353 7,304
The above cash flow statements should be read in conjunction with the accompanying notes.

MacquarieBankLimited2007FinancialReport�2
Notestothefinancialstatements3�March2007
Note1.Summaryofsignificantaccountingpolicies
i)BasisofpreparationThesignificantaccountingpoliciesadoptedinthepreparationofthisfinancialreportandthatofthepreviousfinancialyeararesetoutbelow.Thesepolicieshavebeenconsistentlyappliedtoalltheperiodspresented,unlessotherwisestated.
ThisfinancialreportisageneralpurposefinancialreportwhichhasbeenpreparedinaccordancewithAustralianAccountingStandards(whichincludesAustralianInterpretationsbyvirtueofAASB�048),theCorporationsAct200�andtheBankingAct�959.CompliancewithAustralianAccountingStandardsensuresthatthefinancialreportcomplieswithInternationalFinancialReportingStandards.
Historical cost conventionThisfinancialreporthasbeenpreparedunderthehistoricalcostconvention,asmodifiedbytherevaluationofinvestmentsecuritiesavailableforsaleandcertainotherassetsandliabilities(includingderivativeinstruments)atfairvalue.
Critical accounting estimates and significant judgementsThepreparationofthefinancialreportinconformitywithAustralianAccountingStandardsrequirestheuseofcertaincriticalaccountingestimates.Italsorequiresmanagementtoexercisejudgementintheprocessofapplyingtheaccountingpolicies.Thenotestothefinancialstatementssetoutareasinvolvingahigherdegreeofjudgementorcomplexity,orareaswhereassumptionsaresignificanttotheBankandeconomicentityfinancialreportsuchas:
–fairvalueoffinancialinstruments(note45),–impairmentlossesonloansandadvances(notes�(xi),
��and46),–acquisitionsanddisposalsofcontrolledentities,jointventures
andassociates,andheldforsaleinvestments(notes�(ii),�(x),�8,20and22),
–consolidationofspecial-purposeentities(notes�(ii),��and26),and
–abilitytorealisedeferredtax(notes�(vi),5and2�).
Estimatesandjudgementsarecontinuallyevaluatedandarebasedonhistoricalexperienceandotherfactors,includingreasonableexpectationsoffutureevents.Managementbelievestheestimatesusedinpreparingthefinancialreportarereasonable.Actualresultsinthefuturemaydifferfromthosereported.
Standards, interpretations and amendments to published standards that are not yet effectiveCertainnewstandards,amendmentsandinterpretationstoexistingstandardshavebeenpublishedthataremandatoryfortheBankandeconomicentityforaccountingperiodsbeginningonorafter�April2007orlaterperiodsbutwhichtheBankandeconomicentityhasnotyetadopted.Thesignificantonesareasfollows:
AASB 7, Financial Instruments: Disclosures(effectivefrom�April2007).AASB7introducesnewdisclosurestoimprovetheinformationaboutfinancialinstruments.Itrequiresthedisclosureofqualitativeandquantitativeinformationaboutexposuretorisksarisingfromfinancialinstruments,includingspecifiedminimumdisclosuresaboutcredit,liquidityandmarketrisk,includingsensitivityanalysistomarketrisk.TheBankandeconomicentityexpectthatthemainadditionaldisclosureswillbethesensitivityanalysisofmarketriskandthecapitaldisclosures.
AASB 101, Presentation of Financial Statements(effectivefrom�April2007).TheimpactsofrevisedAASB�0�aretoeliminatemuchoftheAustralianspecificcontent,includingtheAustralianillustrativeformatsoftheincomestatement,balancesheetandstatementofequitywhichentitieswerepreviously‘encouraged’toadoptinpreparingtheirfinancialstatements.Inadditiontothis,thestandardintroducesdisclosuresaboutthelevelofanentity’scapitalandhowitmanagescapital.
AASB 8, Operating Segments(effectivefrom�April2009).Thisstandardwillrequiretheentitytoadoptthe‘managementapproach’todisclosinginformationaboutitsreportablesegments.Generally,thefinancialinformationwillbereportedonthesamebasisasitisusedinternallybythechiefdecisionmakerforevaluatingoperatingsegmentperformanceanddecidinghowtoallocateresourcestooperatingsegments.Suchinformationmaybepreparedusingdifferentmeasurestothatusedinpreparingtheincomestatementandbalancesheet,inwhichcasereconciliationsofcertainitemswillberequired.
AASB 2007-4,Amendments to Australian Accounting Standards arising from ED 151 and Other Amendments (effectivefrom�April2007)wasmaderecentlytointroduceaccountingpolicychoicesallowedunderIFRSthatwerenotpreviouslyincorporatedbytheAASB,andtoremovemanyAustralian-specificdisclosures.TheprimaryimpactsexpectedfortheBankandeconomicentityaretoreducethedisclosuresrelatingtoinvestmentsinassociatesandjointventures.
Accountingchoicesthatwillnowbeallowedincludeusingtheindirectmethodtopreparethestatementofcashflows,andusingtheproportionateconsolidationmethodforaccountingforjointventureinterests.Australian-specificdisclosuresthatwillnolongerberequiredincludetheshareofprofitsbeforetax,shareoftaxexpense,andimpairmentlossesfrominvestmentsinassociatesandjointventures.Additionally,mostintermediarysubsidiariesoftheBankthatareAustralianreportingentitieswillnolongerberequiredtoconsolidatetheirsubsidiarieswhenpreparingfinancialstatements.Instead,theycancarrytheirinvestmentsinsubsidiariesusingthecostmethod.

�3
ii)PrinciplesofconsolidationControlled entitiesTheconsolidatedfinancialreportcomprisesthefinancialreportoftheBankanditscontrolledentities(together,“theeconomicentity”).Controlledentitiesareallthoseentities(includingspecialpurposeentities)overwhichtheBankhasthepowertogoverndirectlyorindirectlydecision-makinginrelationtofinancialandoperatingpolicies,soastorequirethatentitytoconformwiththeBank’sobjectives.Theeffectsofalltransactionsbetweenentitiesintheeconomicentityhavebeeneliminatedinfull.Minorityinterestintheresultsandequityofcontrolledentities,wheretheBankownslessthan�00%oftheissuedcapital,areshownseparatelyintheconsolidatedincomestatementandbalancesheet.
Wherecontrolofanentitywasobtainedduringthefinancialyear,itsresultshavebeenincludedintheconsolidatedincomestatementfromthedateonwhichcontrolcommenced.Wherecontrolofanentityceasedduringthefinancialyear,itsresultsareincludedforthatpartofthefinancialyearduringwhichcontrolexisted.
ControlledentitiesheldbytheBankarecarriedinitsseparatefinancialstatementsatcostinaccordancewithAASB�27:Consolidated and Separate Financial Statements.
TheBankandeconomicentitydeterminethedatesofobtainingcontrol(i.e.acquisitiondate)andlosingcontrol(i.e.disposaldate)ofanotherentitybasedonanassessmentofallpertinentfactsandcircumstancesthataffecttheabilitytogovernthefinancialandoperatingpoliciesofthatentity.Factsandcircumstancesthathavethemostimpactincludethecontractualarrangementsagreedwiththecounterparty,themannerinwhichthosearrangementsareexpectedtooperateinpractice,andwhetherregulatoryapprovalisrequired.Theacquisition/disposaldatedoesnotnecessarilyoccurwhenthetransactionisclosedorfinalisedatlaw.
SecuritisationsSecuritisedpositionsareheldthroughanumberofSpecialPurposeEntities(“SPEs”),whicharegenerallycategorisedasMortgageSPEsandOtherSPEs,whichincludecertainmanagedfundsandrepackagingvehicles.AstheeconomicentityisexposedtothemajorityoftheresidualriskassociatedwiththeseSPEs,theirunderlyingassets,liabilities,revenuesandexpensesarereportedintheeconomicentity’sconsolidatedbalancesheetandincomestatement.
Whenassessingwhethertheeconomicentitycontrols(andthereforeconsolidates)anSPE,judgementisrequiredaboutrisksandrewardsaswellastheeconomicentity’sabilitytomakeoperationaldecisionsfortheSPE.Therangeoffactorsthatareconsideredinassessingcontrolarewhether(a)amajorityofthebenefitsofanSPE’sactivitiesareobtained;(b)amajorityoftheresidualownershiprisksrelatedtotheSPE’sassetsareobtained;(c)thedecision-makingpowersoftheSPEvestwiththeeconomicentity;and(d)theSPE’sactivitiesarebeingconductedonbehalfoftheeconomicentityandaccordingtoitsspecificbusinessneeds.
Interests in associates and joint ventures using the equity methodAssociatesandjointventuresareentitiesoverwhichtheeconomicentityhassignificantinfluenceorjointcontrol,butnotcontrol,andareaccountedforundertheequitymethodexceptforthosewhichareheldforsale(seenote�(x)).Theequitymethodofaccountingisappliedintheconsolidatedfinancialreportandinvolvestherecognitionoftheeconomicentity’sshareofitsassociates’andjointventures’post-acquisitionprofitsorlossesintheincomestatement,anditsshareofpost-acquisitionmovementsinreserves.
AssociatesandjointventuresheldbytheBankarecarriedinitsseparatefinancialstatementsatcostinaccordancewithAASB�27:Consolidated and Separate Financial Statements.
TheBankandeconomicentitydeterminethedatesofobtaining/losingsignificantinfluenceorjointcontrolofanotherentitybasedonanassessmentofallpertinentfactsandcircumstancesthataffecttheabilitytosignificantlyinfluenceorjointlycontrolthefinancialandoperatingpoliciesofthatentity.Factsandcircumstancesthathavethemostimpactincludethecontractualarrangementsagreedwiththecounterparty,themannerinwhichthosearrangementsareexpectedtooperateinpractice,andwhetherregulatoryapprovalisrequiredtocomplete.Theacquisition/disposaldatedoesnotnecessarilyoccurwhenthetransactionisclosedorfinalisedatlaw.
MacquarieBankLimited2007FinancialReport�4
Notestothefinancialstatements3�March2007continued
Note1.Summaryofsignificantaccountingpoliciescontinued
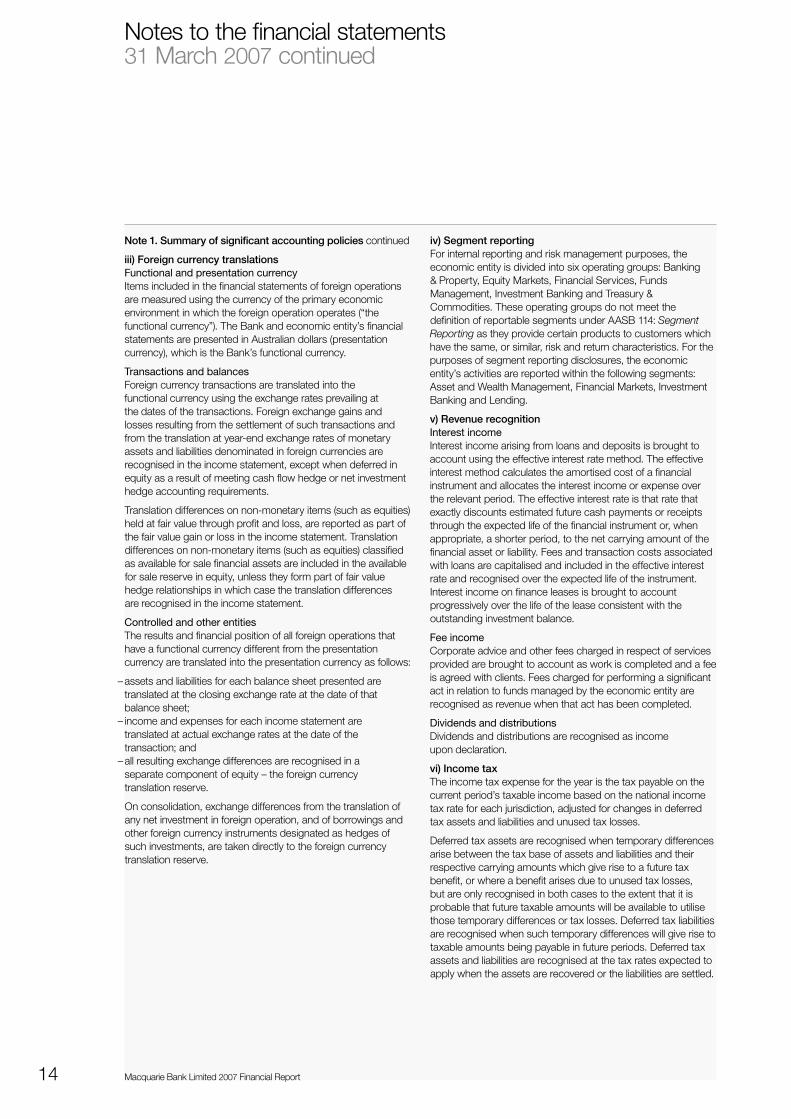
iii)ForeigncurrencytranslationsFunctional and presentation currencyItemsincludedinthefinancialstatementsofforeignoperationsaremeasuredusingthecurrencyoftheprimaryeconomicenvironmentinwhichtheforeignoperationoperates(“thefunctionalcurrency”).TheBankandeconomicentity’sfinancialstatementsarepresentedinAustraliandollars(presentationcurrency),whichistheBank’sfunctionalcurrency.
Transactions and balancesForeigncurrencytransactionsaretranslatedintothefunctionalcurrencyusingtheexchangeratesprevailingatthedatesofthetransactions.Foreignexchangegainsandlossesresultingfromthesettlementofsuchtransactionsandfromthetranslationatyear-endexchangeratesofmonetaryassetsandliabilitiesdenominatedinforeigncurrenciesarerecognisedintheincomestatement,exceptwhendeferredinequityasaresultofmeetingcashflowhedgeornetinvestmenthedgeaccountingrequirements.
Translationdifferencesonnon-monetaryitems(suchasequities)heldatfairvaluethroughprofitandloss,arereportedaspartofthefairvaluegainorlossintheincomestatement.Translationdifferencesonnon-monetaryitems(suchasequities)classifiedasavailableforsalefinancialassetsareincludedintheavailableforsalereserveinequity,unlesstheyformpartoffairvaluehedgerelationshipsinwhichcasethetranslationdifferencesarerecognisedintheincomestatement.
Controlled and other entitiesTheresultsandfinancialpositionofallforeignoperationsthathaveafunctionalcurrencydifferentfromthepresentationcurrencyaretranslatedintothepresentationcurrencyasfollows:
–assetsandliabilitiesforeachbalancesheetpresentedaretranslatedattheclosingexchangerateatthedateofthatbalancesheet;
–incomeandexpensesforeachincomestatementaretranslatedatactualexchangeratesatthedateofthetransaction;and
–allresultingexchangedifferencesarerecognisedinaseparatecomponentofequity–theforeigncurrencytranslationreserve.
Onconsolidation,exchangedifferencesfromthetranslationofanynetinvestmentinforeignoperation,andofborrowingsandotherforeigncurrencyinstrumentsdesignatedashedgesofsuchinvestments,aretakendirectlytotheforeigncurrencytranslationreserve.
iv)SegmentreportingForinternalreportingandriskmanagementpurposes,theeconomicentityisdividedintosixoperatinggroups:Banking&Property,EquityMarkets,FinancialServices,FundsManagement,InvestmentBankingandTreasury&Commodities.TheseoperatinggroupsdonotmeetthedefinitionofreportablesegmentsunderAASB��4:Segment Reportingastheyprovidecertainproductstocustomerswhichhavethesame,orsimilar,riskandreturncharacteristics.Forthepurposesofsegmentreportingdisclosures,theeconomicentity’sactivitiesarereportedwithinthefollowingsegments:AssetandWealthManagement,FinancialMarkets,InvestmentBankingandLending.
v)RevenuerecognitionInterest incomeInterestincomearisingfromloansanddepositsisbroughttoaccountusingtheeffectiveinterestratemethod.Theeffectiveinterestmethodcalculatestheamortisedcostofafinancialinstrumentandallocatestheinterestincomeorexpenseovertherelevantperiod.Theeffectiveinterestrateisthatratethatexactlydiscountsestimatedfuturecashpaymentsorreceiptsthroughtheexpectedlifeofthefinancialinstrumentor,whenappropriate,ashorterperiod,tothenetcarryingamountofthefinancialassetorliability.Feesandtransactioncostsassociatedwithloansarecapitalisedandincludedintheeffectiveinterestrateandrecognisedovertheexpectedlifeoftheinstrument.Interestincomeonfinanceleasesisbroughttoaccountprogressivelyoverthelifeoftheleaseconsistentwiththeoutstandinginvestmentbalance.
Fee incomeCorporateadviceandotherfeeschargedinrespectofservicesprovidedarebroughttoaccountasworkiscompletedandafeeisagreedwithclients.Feeschargedforperformingasignificantactinrelationtofundsmanagedbytheeconomicentityarerecognisedasrevenuewhenthatacthasbeencompleted.
Dividends and distributionsDividendsanddistributionsarerecognisedasincomeupondeclaration.
vi)IncometaxTheincometaxexpensefortheyearisthetaxpayableonthecurrentperiod’staxableincomebasedonthenationalincometaxrateforeachjurisdiction,adjustedforchangesindeferredtaxassetsandliabilitiesandunusedtaxlosses.
Deferredtaxassetsarerecognisedwhentemporarydifferencesarisebetweenthetaxbaseofassetsandliabilitiesandtheirrespectivecarryingamountswhichgiverisetoafuturetaxbenefit,orwhereabenefitarisesduetounusedtaxlosses,butareonlyrecognisedinbothcasestotheextentthatitisprobablethatfuturetaxableamountswillbeavailabletoutilisethosetemporarydifferencesortaxlosses.Deferredtaxliabilitiesarerecognisedwhensuchtemporarydifferenceswillgiverisetotaxableamountsbeingpayableinfutureperiods.Deferredtaxassetsandliabilitiesarerecognisedatthetaxratesexpectedtoapplywhentheassetsarerecoveredortheliabilitiesaresettled.

�5
TheBankanditswholly-ownedAustraliancontrolledentitiesimplementedthetaxconsolidationregimeinAustralia,effectivefrom�October2002.Underthetermsandconditionsofthetaxcontributionagreement,theBank,astheheadentityofthetaxconsolidatedgroup,willchargeorreimburseitswholly-ownedsubsidiariesforcurrenttaxliabilitiesorassetsitincursinconnectionwiththeiractivities.Asaconsequence,theBankwillrecognisethecurrenttaxbalancesofitswholly-ownedsubsidiariesasifthosewereitsowninadditiontothecurrentanddeferredtaxamountsarisinginrelationtoitsowntransactions,eventsandbalances.Amountsreceivableorpayableunderataxcontributionagreementwiththetaxconsolidatedentitiesarerecognisedseparatelyastax-relatedamountsreceivableorpayable.
Noprovisionismadeforadditionaltaxeswhichcouldbecomepayableifcertainretainedearningsorreservesofforeigncontrolledentitiesweretobedistributed.Itisnotexpectedthatanysubstantialamountwillbedistributedfromtheseretainedearningsorreservesintheforeseeablefuture.
TheBankandeconomicentityexercisejudgementindeterminingwhetherdeferredtaxassets,particularlyinrelationtotaxlosses,areprobableofrecovery.Factorsconsideredincludetheabilitytooffsettaxlosseswithinthegroupintherelevantjurisdiction,thelengthoftimethattaxlossesareeligibleforcarryforwardtooffsetagainstfutureprofitsandwhetherfutureprofitsareexpectedtobesufficienttorecouplosses.
vii)Cashcollateralonsecuritiesborrowed/lentandrepurchase/reverserepurchaseagreementsAspartofitstradingactivities,theeconomicentitylendsandborrowssecuritiesonacollateralisedbasis.Thesecuritiessubjecttotheborrowing/lendingarenotderecognisedfromthebalancesheetsoftherelevantparties,astherisksandrewardsofownershipremainwiththeinitialholder.Wherecashisprovidedascollateral,thecashpaidtothirdpartiesonsecuritiesborrowedisrecordedasareceivable,whilecashreceivedfromthirdpartiesonsecuritieslentisrecordedasaborrowing.
Repurchasetransactions,wheretheBanksellssecuritiesunderanagreementtorepurchase,andreverserepurchasetransactions,wheretheBankpurchasessecuritiesunderanagreementtoresell,arealsoconductedonacollateralisedbasis.Thesecuritiessubjecttotherepurchase/reverserepurchaseagreementsarenotderecognisedfromthebalancesheetsoftherelevantparties,astherisksandrewardsofownershipremainwiththeinitialholder.Wherecashisprovidedascollateral,thecashpaidtothirdpartiesonthereverserepurchaseagreementisrecordedasareceivable,whilecashreceivedfromthirdpartiesontherepurchaseagreementisrecordedasaborrowing.
Feesandinterestrelatingtostockborrowing/lendingandrepurchase/reverserepurchaseagreementsarerecognisedintheincomestatement,usingtheeffectiveinterestratemethod,overtheexpectedlifeoftheagreements.
TheBankcontinuallyreviewsthefairvalueofthesecuritiesonwhichtheabovetransactionsarebasedand,whereappropriate,requestsorprovidesadditionalcollateraltosupportthetransactions,inaccordancewiththeunderlyingagreements.
viii)TradingportfolioTradingportfolioassets(“longpositions”)comprisedebtandequitysecurities,bankbills,treasurynotes,bullionandcommoditiespurchasedwiththeintentofbeingactivelytraded.Tradingportfolioliabilities(“shortpositions”)compriseobligationstodeliverassetsacrossthesametradingcategories,whichtheBankhasshort-soldandareactivelytraded.
Itemsincludedinthetradingportfolioarecarriedatfairvalue.Realisedgainsandlosses,andunrealisedgainsandlossesarisingfromchangesinthefairvalueofthetradingportfolioarerecognisedastradingincomeorexpenseintheincomestatementintheperiodinwhichtheyarise.Dividendincomeorexpenseonthetradingportfolioisalsorecordedastradingincomeorexpense.Interestincomeandexpenseonthetradingportfolioisrecognisedintheincomestatementasinterestincomeorexpense.
MacquarieBankLimited2007FinancialReport�6
Notestothefinancialstatements3�March2007continued
Note1.Summaryofsignificantaccountingpoliciescontinued
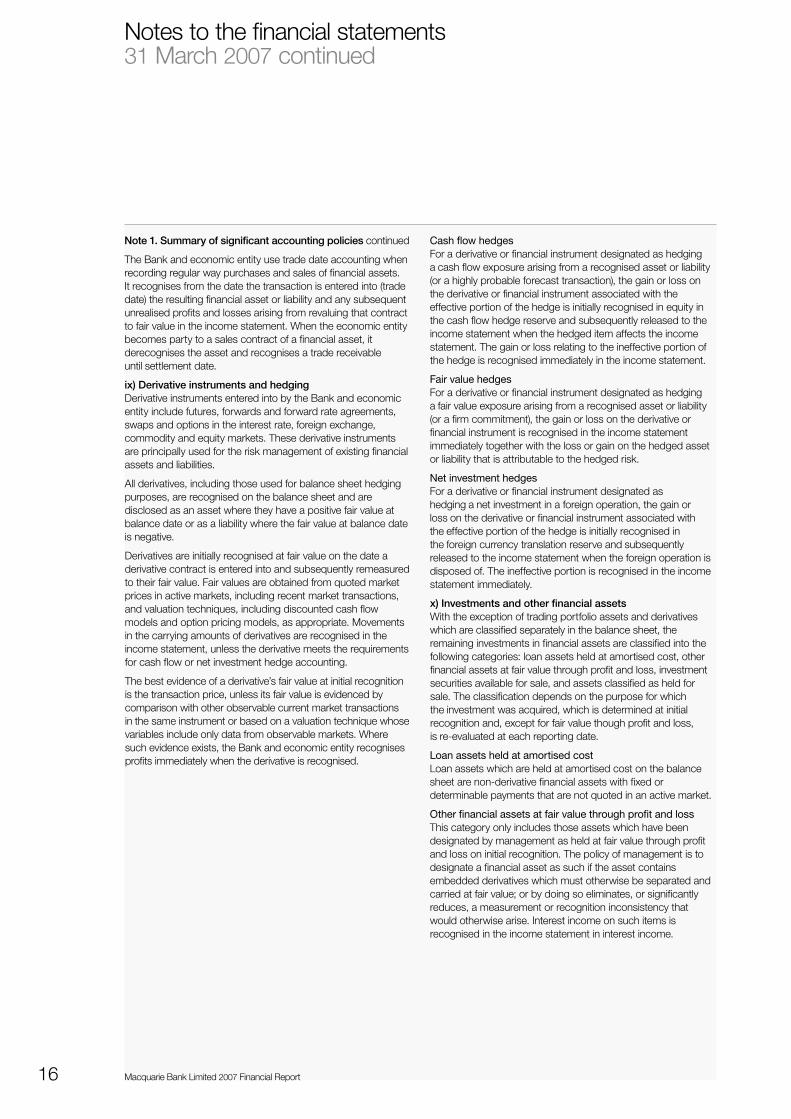
TheBankandeconomicentityusetradedateaccountingwhenrecordingregularwaypurchasesandsalesoffinancialassets.Itrecognisesfromthedatethetransactionisenteredinto(tradedate)theresultingfinancialassetorliabilityandanysubsequentunrealisedprofitsandlossesarisingfromrevaluingthatcontracttofairvalueintheincomestatement.Whentheeconomicentitybecomespartytoasalescontractofafinancialasset,itderecognisestheassetandrecognisesatradereceivableuntilsettlementdate.
ix)DerivativeinstrumentsandhedgingDerivativeinstrumentsenteredintobytheBankandeconomicentityincludefutures,forwardsandforwardrateagreements,swapsandoptionsintheinterestrate,foreignexchange,commodityandequitymarkets.Thesederivativeinstrumentsareprincipallyusedfortheriskmanagementofexistingfinancialassetsandliabilities.
Allderivatives,includingthoseusedforbalancesheethedgingpurposes,arerecognisedonthebalancesheetandaredisclosedasanassetwheretheyhaveapositivefairvalueatbalancedateorasaliabilitywherethefairvalueatbalancedateisnegative.
Derivativesareinitiallyrecognisedatfairvalueonthedateaderivativecontractisenteredintoandsubsequentlyremeasuredtotheirfairvalue.Fairvaluesareobtainedfromquotedmarketpricesinactivemarkets,includingrecentmarkettransactions,andvaluationtechniques,includingdiscountedcashflowmodelsandoptionpricingmodels,asappropriate.Movementsinthecarryingamountsofderivativesarerecognisedintheincomestatement,unlessthederivativemeetstherequirementsforcashflowornetinvestmenthedgeaccounting.
Thebestevidenceofaderivative’sfairvalueatinitialrecognitionisthetransactionprice,unlessitsfairvalueisevidencedbycomparisonwithotherobservablecurrentmarkettransactionsinthesameinstrumentorbasedonavaluationtechniquewhosevariablesincludeonlydatafromobservablemarkets.Wheresuchevidenceexists,theBankandeconomicentityrecognisesprofitsimmediatelywhenthederivativeisrecognised.
Cash flow hedgesForaderivativeorfinancialinstrumentdesignatedashedgingacashflowexposurearisingfromarecognisedassetorliability(orahighlyprobableforecasttransaction),thegainorlossonthederivativeorfinancialinstrumentassociatedwiththeeffectiveportionofthehedgeisinitiallyrecognisedinequityinthecashflowhedgereserveandsubsequentlyreleasedtotheincomestatementwhenthehedgeditemaffectstheincomestatement.Thegainorlossrelatingtotheineffectiveportionofthehedgeisrecognisedimmediatelyintheincomestatement.
Fair value hedgesForaderivativeorfinancialinstrumentdesignatedashedgingafairvalueexposurearisingfromarecognisedassetorliability(orafirmcommitment),thegainorlossonthederivativeorfinancialinstrumentisrecognisedintheincomestatementimmediatelytogetherwiththelossorgainonthehedgedassetorliabilitythatisattributabletothehedgedrisk.
Net investment hedgesForaderivativeorfinancialinstrumentdesignatedashedginganetinvestmentinaforeignoperation,thegainorlossonthederivativeorfinancialinstrumentassociatedwiththeeffectiveportionofthehedgeisinitiallyrecognisedintheforeigncurrencytranslationreserveandsubsequentlyreleasedtotheincomestatementwhentheforeignoperationisdisposedof.Theineffectiveportionisrecognisedintheincomestatementimmediately.
x)InvestmentsandotherfinancialassetsWiththeexceptionoftradingportfolioassetsandderivativeswhichareclassifiedseparatelyinthebalancesheet,theremaininginvestmentsinfinancialassetsareclassifiedintothefollowingcategories:loanassetsheldatamortisedcost,otherfinancialassetsatfairvaluethroughprofitandloss,investmentsecuritiesavailableforsale,andassetsclassifiedasheldforsale.Theclassificationdependsonthepurposeforwhichtheinvestmentwasacquired,whichisdeterminedatinitialrecognitionand,exceptforfairvaluethoughprofitandloss,isre-evaluatedateachreportingdate.
Loan assets held at amortised costLoanassetswhichareheldatamortisedcostonthebalancesheetarenon-derivativefinancialassetswithfixedordeterminablepaymentsthatarenotquotedinanactivemarket.
Other financial assets at fair value through profit and lossThiscategoryonlyincludesthoseassetswhichhavebeendesignatedbymanagementasheldatfairvaluethroughprofitandlossoninitialrecognition.Thepolicyofmanagementistodesignateafinancialassetassuchiftheassetcontainsembeddedderivativeswhichmustotherwisebeseparatedandcarriedatfairvalue;orbydoingsoeliminates,orsignificantlyreduces,ameasurementorrecognitioninconsistencythatwouldotherwisearise.Interestincomeonsuchitemsisrecognisedintheincomestatementininterestincome.

�7
Investment securities available for saleInvestmentsecuritiesavailableforsaleconsistofsecuritiesthatarenotactivelytradedandareintendedtobeheldforanindefiniteperiodoftime.Suchsecuritiesareavailableforsaleandmaybesoldshouldtheneedarise,includingliquidityneeds,orconsideringtheimpactsofchangesininterestrates,exchangeratesorequityprices.
Investmentsecuritiesavailableforsaleareinitiallycarriedatfairvalueplustransactioncosts.Gainsandlossesarisingfromsubsequentchangesinfairvaluearerecogniseddirectlyintheavailableforsalereserveinequity,untiltheassetisderecognisedorimpaired,atwhichtimethecumulativegainorlosswillberecognisedintheincomestatement.Fairvaluesofquotedinvestmentsinactivemarketsarebasedoncurrentbidprices.Iftherelevantmarketisnotconsideredactive(orthesecuritiesareunlisted),fairvalueisestablishedbyusingvaluationtechniques,includingrecentarm’slengthtransactions,discountedcashflowanalysis,optionpricingmodelsandothervaluationtechniquescommonlyusedbymarketparticipants.
TheBankandeconomicentitydeterminethatavailableforsaleequityinvestmentsareimpairedwhentherehasbeenasignificantorprolongeddeclineinthefairvaluebelowitscost.Thedeterminationofwhatissignificantorprolongedrequiresjudgement.Inmakingthisjudgement,theBankandeconomicentityevaluateamongotherfactors,thenormalvolatilityinshareprice.Inaddition,impairmentmaybeappropriatewhenthereisevidenceofadeteriorationinthefinancialconditionoftheinvestee,industryandsectorperformance,operationalandfinancingcashflowsorchangesintechnology.
Non-current assets classified as held for saleThiscategoryincludescontrolledentitiesandinterestsinassociatesorjointventureswhosecarryingamountwillberecoveredprincipallythroughasaletransactionratherthancontinuinguse.Thepolicyofmanagementistoclassifytheseassetsasheldforsalewhenitishighlyprobablethattheassetwillbesoldwithinthetwelvemonthssubsequenttobeingclassifiedassuch.
Assetsandliabilities,includingthosewithinadisposalgroup,classifiedasheldforsaleareeachpresentedseparatelyonthefaceofthebalancesheet.Therevenueandexpensesfromdisposalgroupsarepresentednetwithintheincomestatementandnotestothefinancialstatements.
Assetsclassifiedasheldforsalearecarriedatthelowerofcarryingamountandfairvaluelesscoststosell.Assetsclassifiedasheldforsale,orincludedwithinadisposalgroupthatisclassifiedasheldforsale,arenotdepreciated.
Animpairmentlossisrecognisedforanyinitialorsubsequentwritedownoftheassettofairvaluelesscoststosell.Againwouldberecognisedforanysubsequentincreaseinfairvaluelesscoststosell,limitedbythepreviouscumulativeimpairmentlossrecognised.Againorlossnotpreviouslyrecognisedbythedateofsalewouldberecognisedatthedateofsale.
xi)LoanimpairmentreviewAllloanassetsaresubjecttorecurringreviewandassessmentforpossibleimpairment.Allbaddebtsarewrittenoffintheperiodinwhichtheyareidentified.Provisionsforloanlossesarebasedonanincurredlossmodel,whichrecognisesaprovisionwherethereisobjectiveevidenceofimpairmentateachbalancedate,andiscalculatedbasedonthediscountedvaluesofexpectedfuturecashflows.
Specificprovisionsarerecognisedwherespecificimpairmentisidentified.Whereindividualloansarefoundnottobeimpaired,theyareplacedintopoolsofassetswithsimilarriskprofilesandcollectivelyassessedforlossesthathavebeenincurredbutnotyetidentified.
TheBankandeconomicentitymakejudgementsastowhetherthereisanyobservabledataindicatingthatthereisasignificantdecreaseintheestimatedfuturecashflowsfromaportfolioofloansbeforethedecreasecanbeidentifiedwithanindividualloaninthatportfolio.Thisevidencemayincludeobservabledataindicatingthattherehasbeenanadversechangeinthepaymentstatusoftheborrowersinagroup,ornationalorlocaleconomicconditionsthatcorrelatewithdefaultsonassetsinthegroup.Managementusesestimatesbasedonhistoricallossexperienceforassetswithcreditriskcharacteristicsandobjectiveevidenceofimpairmentsimilartothoseintheportfoliowhenschedulingitsfuturecashflows.Themethodologyandassumptionsusedforestimatingboththeamountandtimingoffuturecashflowsarereviewedregularlytoreduceanydifferencesbetweenlossestimatesandactuallossexperience.Changesinassumptionsusedforestimatingfuturecashflowscouldresultinachangeinprovisionsforloanlossesandhaveadirectimpactontheimpairmentcharge.

MacquarieBankLimited2007FinancialReport�8
Notestothefinancialstatements3�March2007continued
Note1.Summaryofsignificantaccountingpoliciescontinued
xii)LifebusinessThefollowingarekeyaccountingpoliciesinrelationtothelifebusiness:
DisclosureTheconsolidatedfinancialstatementsrecognisetheassets,liabilities,incomeandexpensesofthelifebusinessconductedbyasubsidiaryoftheBankinaccordancewithAASB�39:Financial Instruments: Recognition and Measurement(“AASB�39”),andAASB�038:Life Insurance Contracts(“AASB�038”)whichapplytoinvestmentcontractsandassetsbackinginsuranceliabilitiesrespectively.Theseamountsrepresentthetotallifebusinessofthesubsidiary,includingunderlyingamountsthatrelatetobothpolicyholdersandshareholdersofthelifebusiness.
Investment assetsInvestmentsassetsarecarriedatfairvaluethroughprofitandloss.Fairvaluesofquotedinvestmentsinactivemarketsarebasedoncurrentbidprices.Iftherelevantmarketisnotconsideredactive(andforunlistedsecurities),fairvalueisestablishedbyusingvaluationtechniques,includingrecentarm’slengthtransactions,discountedcashflowanalysis,optionpricingmodelsandothervaluationtechniquescommonlyusedbymarketparticipants.Changesinfairvaluesarerecognisedintheincomestatementinthefinancialperiodinwhichthechangesoccur.
Restriction on assetsInvestmentsheldintheLifeFundscanonlybeusedwithintherestrictionsimposedundertheLifeInsuranceAct�995.Themainrestrictionsarethattheassetsinafundcanonlybeusedtomeettheliabilitiesandexpensesofthefund,acquireinvestmentstofurtherthebusinessofthefundorpaydistributionswhensolvencyandcapitaladequacyrequirementsallow.ShareholderscanonlyreceiveadistributionwhenthecapitaladequacyrequirementsoftheLifeInsuranceAct�995aremet.
Policy liabilitiesLifeinsuranceliabilitiesaremeasuredastheaccumulatedbenefitstopolicyholdersinaccordancewithAASB�39andAASB�038,whichapplytoinvestmentcontractsandassetsbackinginsuranceliabilitiesrespectively.
xiii)Property,plantandequipmentProperty,plantandequipmentarestatedathistoricalcostlessaccumulateddepreciationandaccumulatedimpairmentlosses,ifany.Assetsarereviewedforimpairmentannually.Historicalcostincludesexpendituredirectlyattributabletotheacquisitionoftheasset.
Depreciationonassetsiscalculatedonastraight-linebasistoallocatethedifferencebetweentheircostandtheirresidualvaluesovertheirestimatedusefullives,atthefollowingrates:
Furnitureandfittings �0%to20%Leaseholdimprovements* 20%Computerequipment 33%to50%Plantandequipment 20%to33%Infrastructureassets 5%to20%Art �%
*Whereremainingleasetermsarelessthanfiveyears,leaseholdimprovementsaredepreciatedovertheleaseterm.
Usefullivesandresidualvaluesarereviewedannuallyandreassessedinlightofcommercialandtechnologicaldevelopments.Ifanasset’scarryingvalueisgreaterthanitsrecoverableamountduetoausefullife,residualvalueorimpairmentadjustment,thecarryingamountiswrittendownimmediatelytoitsrecoverableamount.Adjustmentsarisingfromsuchrestatementsandondisposaloffixedassetsarerecognisedintheincomestatement.
xiv)IntangibleassetsGoodwillGoodwillrepresentstheexcessofthecostofanacquisitionoverthefairvalueoftheeconomicentity’sshareofthenetidentifiableassetsoftheacquiredentityatthedateofacquisition.Goodwillonacquisitionsofcontrolledentitiesisincludedinintangibleassetsonthebalancesheet.Goodwillonacquisitionsofassociatesisincludedinthecarryingvalueofinvestmentsinassociates.Goodwillacquiredinbusinesscombinationsisnotamortisedbuttestedforimpairmentannually,ormorefrequentlyifeventsindicatethatitmightbeimpaired.Inthisevent,itiscarriedatcostlessaccumulatedimpairmentlosses.
Identifiable intangibles–Licencesandtradingrightsarecarriedatcostless
accumulatedimpairmentlosses.Theseassetsarenotbeingamortisedonthebasisthattheyhaveindefinitelives.
–Managementrightshaveafiniteusefullifeandarecarriedatcostlessaccumulatedamortisationandimpairmentlosses.Amortisationiscalculatedusingthestraight-linemethodtoallocatethecostofmanagementrightsovertheirestimatedusefullifenotexceedingtwentyyears.
Identifiableintangibleswithindefinitelivesaresubjecttoannualimpairmenttesting,ormorefrequentlyifeventsindicatethattheremaybeanimpairment.

�9
SoftwareCertaininternalandexternalcostsdirectlyincurredinacquiringanddevelopingcertainsoftwarehavebeencapitalisedandarebeingamortisedovertheirusefullife,usuallyforaperiodof3years.Costsincurredonsoftwaremaintenanceareexpensedasincurred.Thecostsofrepairsandmaintenanceareexpensedasincurred.
xv)FinancialliabilitiesTheBankandeconomicentityhasonissuedebtsecuritiesandinstrumentswhichareinitiallyrecognisedatfairvalue,netoftransactioncostsincurred.Theseinstrumentsaresubsequentlymeasuredatamortisedcost.Anydifferencebetweentheproceeds(netoftransactioncosts)andtheredemptionamountisrecognisedintheincomestatementovertheperiodoftheborrowingsusingtheeffectiveinterestratemethod.
Other financial liabilities at fair value through profit and lossThiscategoryonlyincludesthosefinancialliabilitieswhichhavebeendesignatedbymanagementasheldatfairvaluethroughprofitandlossoninitialrecognition.Thepolicyofmanagementistodesignateafinancialliabilityassuchiftheliabilitycontainsembeddedderivativeswhichmustotherwisebeseparatedandcarriedatfairvalue,orbydoingsoeliminates,orsignificantlyreduces,ameasurementorrecognitioninconsistencythatwouldotherwisearise.Interestexpenseonsuchitemsisrecognisedintheincomestatementininterestexpense.
xvi)ProvisionsEmployee benefitsLiabilitiesforunpaidsalaries,salaryrelatedcostsandprovisionsforannualleavearerecordedinthebalancesheetatthesalaryrateswhichareexpectedtobepaidwhentheliabilityissettled.Provisionsforlongserviceleaveandotherlong-termbenefitsarerecognisedatthepresentvalueofexpectedfuturepaymentstobemade.Indeterminingthisamount,considerationisgiventoexpectedfuturesalarylevelsandemployeeservicehistories.ExpectedfuturepaymentsarediscountedtotheirnetpresentvalueusingratesonCommonwealthGovernmentsecuritieswithtermsthatmatchascloselyaspossibletotheexpectedfuturecashflows.
DividendsProvisionsfordividendstobepaidbytheBankarerecognisedonthebalancesheetasaliabilityandareductioninretainedearningswhenthedividendhasbeendeclaredorpubliclyrecommendedbytheDirectors.
xvii)FundsundermanagementWithintheeconomicentitycertaincontrolledentitiesactasacustodianand/orasingleresponsibleentityforanumberofinvestmentfundsandtrusts.Asat3�March2007,theinvestmentfundsandtrusts,bothindividuallyandcollectively,haveanexcessofassetsoverliabilities.Thevalueoffundsmanagedbytheeconomicentity(measuredbasedonthegrossassetsoftheindividualfunds)is$�97.2billion(3�March2006:$�40.3billion).Thisincludes$5.9billion(3�March2006:$5.2billion)inrespectofthelifebusinessstatutoryfundsandcertainotherfundsthatareconsolidatedinthefinancialreport.Otherinvestmentfundsandtrustshavenotbeenconsolidatedinthefinancialreportbecauseindividualentitieswithintheeconomicentitydonothavecontrolofthefundsandtrusts.
Commissionsandfeesearnedinrespectoftheeconomicentity’sfundsmanagementactivitiesarebroughttoaccountasservicesareprovided,andwherethesearesubjecttoclawbackormeetingcertainperformancehurdles,atthepointwhenthoseconditionscannolongeraffecttheoutcome.

MacquarieBankLimited2007FinancialReport20
Notestothefinancialstatements3�March2007continued
Note1.Summaryofsignificantaccountingpoliciescontinued
xviii)PerformancebasedremunerationShare based paymentsTheBankoperatesshare-basedcompensationplans,whichincludeoptionsgrantedtoemployeesandsharesgrantedtoemployeesundershareacquisitionplans.TheBankandeconomicentityrecognisesanexpense(andequityreserve)forsharesandoptionsgrantedtoemployees.Thesharesandoptionsaremeasuredattheirgrantdatesbasedontheirfairvalueandinthecaseofoptions,usingthenumberexpectedtovest.Thisamountisrecognisedasanexpenseevenlyovertherespectivevestingperiods.
PerformancehurdlesattachedtotheoptionsissuedtotheExecutiveOfficersarenottakenintoaccountwhendeterminingthefairvalueoftheoptionatgrantdate.Instead,thesevestingconditionsaretakenintoaccountbyadjustingthenumberofequityinstrumentsexpectedtovest.
Thefairvalueofeachoptionisestimatedonthedateofgrantusingatrinomialoptionpricingframework.Thefollowingkeyassumptionshavebeenadoptedforgrantsmadeinthecurrentfinancialyear,riskfreeinterestrate:6.5%(weightedaverage),expectedlifeofoptions:fouryears,volatilityofshareprice:20%anddividendyield:3.2%p.a.
WhereoptionsareissuedbytheBanktoemployeesofsubsidiaries,theBankaccountsfortheequityprovidedasacapitalcontributiontothecontrolledentity.
Theeconomicentityannuallyrevisesitsestimatesofthenumberofoptionsthatareexpectedtobecomeexercisable.Whereappropriate,theimpactofrevisedestimatesarereflectedintheincomestatementovertheremainingvestingperiod,withacorrespondingadjustmenttothesharebasedpaymentsreserveinequity.
Theserulesaremandatorytooptionsgrantedafter7November2002thatvestafter�January2005.
InFebruary2007,Interpretation��AASB2:Group and Treasury Share TransactionswasapprovedbytheAASB.ThisInterpretationappliestoannualreportingperiodsbeginningonorafter�March2007.AstherequirementsofthisinterpretationareinlinewiththeBank’sexistingaccountingpolicy,theBankhasadoptedthisinterpretationearly.
Profit share remunerationTheGrouprecognisesaliabilityandexpenseforprofitsharebasedonaformulathattakesintoconsiderationtheGroup’saftertaxprofitanditsearningsoverandabovetheestimatedcostofcapital.
xix)CashandcashequivalentsCashandcashequivalentsincludeCashandbalanceswithcentralbanks,short-termamountsincludedinDuefrombanks,bankacceptedbillsandnegotiablecertificatesofdepositsissuedbyabank,withanoriginalmaturityoflessthan3months,includedinTradingportfolioassetsandInvestmentsecuritiesavailableforsale.
xx)LeasesWherefinanceleasesaregrantedtothirdparties,thepresentvalueoftheleasepaymentsisrecognisedasareceivableandincludedinLoanassetsheldatamortisedcost.Thedifferencebetweenthegrossreceivableandthepresentvalueofthereceivableisrecognisedasunearnedinterestincome.Leaseincomeisrecognisedoverthetermoftheleaseusingtheeffectiveinterestratemethod,whichreflectsaconstantrateofreturn.
LeasesenteredintobytheBankandeconomicentityaslesseeareprimarilyoperatingleases.Thetotalpaymentsmadeunderoperatingleasesarechargedtotheincomestatementonastraight-linebasisovertheperiodofthelease.
Purchasedassets,wheretheeconomicentityisthelessorunderoperatingleases,arecarriedatcostanddepreciatedovertheirusefullifewhichvariesdependingoneachclassofassetandrangesfrom3to40years.
xxi)OffsettingfinancialinstrumentsFinancialassetsandliabilitiesareoffsetandthenetamountreportedonthebalancesheetwhenthereisalegallyenforceablerighttooffsettherecognisedamountsandthereisanintentiontosettleonanetbasis,orrealisetheassetandsettletheliabilitysimultaneously.
xxii)ComparativesWherenecessary,comparativefigureshavebeenadjustedtoconformwithchangesinpresentationinthecurrentyear.
xxiii)RoundingofamountsThecompanyisofakindreferredtoinAustralianSecuritiesandInvestmentsCommissionClassOrder98/0�00(asamended),relatingtothe“roundingoff”ofamountsinthefinancialreport.AmountsinthefinancialreporthavebeenroundedoffinaccordancewiththatClassOrdertothenearestmilliondollarsunlessotherwiseindicated.

2�
Consolidated Consolidated Bank Bank 2007 2006 2007 2006 $m $m $m $m
Note2.ProfitforthefinancialyearNetinterestincomeInterestandsimilarincomereceived/receivable Otherentities 4,632 3,�36 2,670 �,66� Controlledentities – – 698 356Interestexpenseandsimilarchargespaid/payable Otherentities (3,904) (2,544) (2,525) (�,508) Controlledentities – – (325) (�72)
Netinterestincome 728 592 518 337
FeeandcommissionincomeFeeandcommissionincome 3,513 2,8�9 1,264 794Incomefromlifebusinessandotherunitholderbusinesses(note�7) 27 23 – –
Feeandcommissionincome 3,540 2,842 1,264 794
Nettradingincome*Equities 765 526 881 430Commodities 295 �97 161 84Foreignexchangeproducts 120 �52 (59) �53Interestrateproducts (133) � (62) 42
Nettradingincome 1,047 876 921 709
Shareofnetprofitsofassociatesandjointventuresusingtheequitymethod 242 �72 – –
OtheroperatingincomeNetgainsonsaleofinvestmentsecuritiesavailableforsale 160 �00 125 82Netgainsonsaleofassociatesandjointventures 650 78 353 �48Netoperatingincome/(loss)fromdisposalgroupsheldforsale** 41 (�8) – –Gainondeconsolidationofpreviouslycontrolledentitiesandbusinessesheldforsale 469 �28 – –Dividends/distributionsreceived/receivable:–equityinvestmentsandinvestmentsecuritiesavailableforsale 84 42 105 78–controlledentities – – 925 378Managementfees,groupservicechargesandcostrecoveries–controlledentities – – 456 364Otherincome*** 272 8� 21 28
Otheroperatingincome 1,676 4�� 1,985 �,078
ImpairmentchargesProvisionfordiminutionofinvestmentsecurities(includinginvestmentsecuritiesavailableforsale,associatesandjointventures) (12) (25) (3) (�8)Collectiveallowanceforcreditlossesprovidedforduringthefinancialyear(refernote��) (11) (��) (13) (�0)Specificprovisions–providedforduringthefinancialyear(refernote��) (36) (36) (31) (26)–recoveryofloanspreviouslyprovidedfor(refernote��) 13 �5 6 9–loanlosseswritten-off (9) (7) (1) (�)–recoveryofloanspreviouslywritten-off 3 3 – –
Impairmentcharges (52) (6�) (42) (46)
Totaloperatingincome 7,181 4,832 4,646 2,872
*Includedinthenettradingincomearefairvaluechangesof$68millionfortheyearending3�March2007(3�March2006:$�5million)relatingtofinancialassetsandfinancialliabilitiesdesignatedasheldatfairvaluethroughprofitandloss.Fairvaluechangesrelatingtoderivativesarealsoreportedinnettradingincomewhichpartiallyoffsetsthefairvaluechangesrelatingtothefinancialassetsandfinancialliabilitiesdesignatedatfairvalue.AlsoincludesfairvaluechangesonderivativesusedtohedgetheGroup’seconomicinterestrateriskwherehedgeaccountingrequirementsarenotmet–refertonote�(ix).
**Includedwithinnetincomefromdisposalgroupsheldforsalearethenetincomeandexpensesarisingfromtheactivitiesofthedisposalgroups.Refertonote22–Assetsanddisposalgroupsclassifiedasheldforsaleforthenameofeachgroup.
***Includedwithinotherincomeisrentalincomeof$�69million(2006:$63million)lessdepreciationof$�09million(2006:$44million)inrelationtooperatingleaseswheretheGroupisthelessor.

MacquarieBankLimited2007FinancialReport22
Notestothefinancialstatements3�March2007continued
Consolidated Consolidated Bank Bank 2007 2006 2007 2006 $m $m $m $m
Note2.ProfitforthefinancialyearcontinuedEmploymentexpensesSalary,salaryrelatedcostsincludingcommissions,superannuationandperformance-relatedprofitshare (3,469) (2,2�4) (2,371) (�,472)Sharebasedpayments (87) (53) (68) (37)Provisionforannualleave (15) (�2) (7) (6)Provisionforlongserviceleave (8) (7) (6) (5)
Totalcompensationexpense (3,579) (2,286) (2,452) (�,520)Otheremploymentexpensesincludingon-costs,staffprocurementandstafftraining (154) (�2�) (109) (7�)
Totalemploymentexpenses (3,733) (2,407) (2,561) (�,59�)
BrokerageandcommissionexpensesBrokerageexpenses (289) (264) (221) (�88)Otherfeeandcommissionexpenses (132) (�02) (85) (79)
Totalbrokerageandcommissionexpenses (421) (366) (306) (267)
OccupancyexpensesOperatingleaserentals (151) (9�) (102) (58)Depreciation:infrastructure,furniture,fittingsandleaseholdimprovements(note�9) (36) (2�) (16) (�0)Otheroccupancyexpenses (39) (27) (21) (�4)
Totaloccupancyexpenses (226) (�39) (139) (82)
Non-salarytechnologyexpensesInformationservices (64) (54) (31) (29)Depreciation:computerequipment(note�9) (38) (34) (25) (25)Othernon-salarytechnologyexpenses (61) (40) (45) (3�)
Totalnon-salarytechnologyexpenses (163) (�28) (101) (85)
OtheroperatingexpensesProfessionalfees (233) (�43) (158) (74)Auditors’remuneration(note47) (18) (�3) (7) (5)Travelandentertainmentexpenses (154) (�22) (76) (63)Advertisingandpromotionalexpenses (36) (33) (20) (24)Communicationexpenses (34) (29) (16) (�4)Depreciation:communicationequipment(note�9) (7) (5) (5) (4)Otherexpenses (228) (�60) (159) (82)
Totalotheroperatingexpenses (710) (505) (441) (266)
Totaloperatingexpenses (5,253) (3,545) (3,548) (2,29�)

23
Consolidated Consolidated Bank Bank 2007 2006 2007 2006 $m $m $m $m
Note3.RevenuefromoperatingactivitiesInterestandsimilarincome 4,632 3,�36 3,368 2,0�7Feeandcommissionincome 3,513 2,8�9 1,264 794Investmentrevenueandmanagementfeesfromlifeinvestmentcontractsandotherunitholderbusinesses(note�7) 613 509 – –Nettradingincome 1,047 876 921 709Profitonthesaleofinvestmentsecuritiesavailableforsaleandassociatesandjointventures 810 �78 478 230Otherincome(excludingprofitonthesaleofinvestmentsecuritiesavailableforsaleandassociatesandjointventures) 1,108 405 1,507 848
Totalrevenuefromoperatingactivities 11,723 7,923 7,538 4,598
Note4.SegmentreportingSegmentrevenues,expenses,assetsandliabilitiesarethosethataredirectlyattributabletoasegmentortherelevantportionthatcanbeallocatedtoasegmentonareasonablebasis.Segmentassetsincludeallassetsusedbyasegment.Thecarryingamountofcertainassetsusedjointlybysegmentsisallocatedbasedonreasonableestimatesofusage.
Anytransfersbetweensegmentshavebeendeterminedonanarms-lengthbasisandeliminatedonconsolidation.
Thesegmentinformationhasbeenpreparedinconformitywiththeeconomicentity’saccountingpoliciesasdisclosedinnote�–Summaryofsignificantaccountingpolicies.
Primarysegment–businessForinternalreportingandriskmanagementpurposes,theeconomicentityisdividedintosixoperatingGroups(“theGroups”).TheGroupsdonotmeetthedefinitionofbusiness segmentforthepurposesofreportinginaccordancewithAASB��4:Segment Reporting,becausetheGroupsprovidecertainproductstocustomerswhichhavethesame,orsimilar,riskandreturncharacteristics.
Forthepurposesofdeterminingbusinesssegments,theactivitiesoftheeconomicentityhavebeendividedintofourareas:–AssetandWealthManagement:distributionandmanufactureoffundsmanagementproducts;–FinancialMarkets:tradinginfixedincome,equities,currency,commoditiesandderivativeproducts;–InvestmentBanking:corporateandstructuredfinance,advisory,underwriting,facilitation,brokingandrealestate/property
development;and–Lending:bankingactivities,mortgages,marginlendingandleasing.
Primary segment – business Assetand Wealth Financial Investment Management Markets Banking Lending Total $m $m $m $m $m
Consolidated31March2007IncomestatementsRevenuefromexternalcustomers 2,327 2,806 3,236 3,071 11,440Netoperatingincomefromdisposalgroupsheldforsale – – 41 – 41Intersegmentalrevenue/(expense) 35 (530) (242) 737 –Shareofnetprofitsofassociatesandjointventuresusingtheequitymethod 195 38 9 – 242
Totalrevenuefromordinaryactivities 2,557 2,314 3,044 3,808 11,723
Operatingprofitfromordinaryactivitiesbeforeincometax 494 376 883 175 1,928Incometaxexpense (132) (42) (157) (46) (377)
Profitfromordinaryactivitiesafterincometax 362 334 726 129 1,551
Non-cashexpenses:depreciation (22) (15) (65) (88) (190)
Balancesheets Totalassets 12,417 69,717 13,713 40,542 136,389Totalliabilities 9,163 86,920 4,319 28,468 128,870Fixedassetsacquiredduringthefinancialyear 21 95 28 55 199Intangibleassetsacquiredduringthefinancialyear – 9 25 13 47Assetsanddisposalgroupsclassifiedasheldforsale 43 – 951 – 994Interestinassociatesandjointventuresusingtheequitymethod 921 207 2,893 50 4,071

MacquarieBankLimited2007FinancialReport24
Notestothefinancialstatements3�March2007continued
Note4.SegmentreportingcontinuedPrimary segment – business Assetand Wealth Financial Investment Management Markets Banking Lending Total $m $m $m $m $m
Consolidated3�March2006IncomestatementsRevenuefromexternalcustomers �,702 �,968 �,887 2,2�2 7,769Netoperatinglossfromdisposalgroupsheldforsale – – (�8) – (�8)Intersegmentalrevenue/(expense) 48 (280) (�38) 370 –Shareofnetprofitsofassociatesandjointventuresusingtheequitymethod �55 3 �7 (3) �72
Totalrevenuefromordinaryactivities �,905 �,69� �,748 2,579 7,923
Operatingprofitfromordinaryactivitiesbeforeincometax 345 292 480 �70 �,287Incometaxexpense (�04) (38) (�04) (44) (290)
Profitfromordinaryactivitiesafterincometax 24� 254 376 �26 997
Non-cashexpenses:depreciation (�8) (8) (25) (53) (�04)
Balancesheets Totalassets 8,780 50,732 �2,587 34,��2 �06,2��Totalliabilities 7,385 63,768 5,488 24,233 �00,874Fixedassetsacquiredduringthefinancialyear �8 54 �55 35 262Intangibleassetsacquiredduringthefinancialyear 33 24 7� 2 �30Assetsanddisposalgroupsclassifiedasheldforsale 24 – 2,365 – 2,389Interestinassociatesandjointventuresusingtheequitymethod �,070 276 2,095 22 3,463
Secondary segment – geographicalGeographicalsegmentshavebeendeterminedbasedonwherethetransactionshavebeenbooked.TheoperationsoftheeconomicentityareheadquarteredinAustralia.Alllocationsbelowthereportablesegmentthresholdhavebeencollectivelyclassifiedasother.
Australia AsiaPacific* Europe NorthAmerica Other Total $m $m $m $m $m $m
Consolidated31March2007Revenuefromexternalcustomers 7,014 1,458 1,643 1,314 11 11,440Totalassets 69,983 12,593 37,559 14,808 1,446 136,389Fixedassetsacquiredduringthefinancialyear 153 13 26 7 – 199Intangibleassetsacquiredduringthefinancialyear 11 10 9 17 – 47
Consolidated3�March2006 Revenuefromexternalcustomers 5,�07 �,056 �,0�� 568 27 7,769Totalassets 75,626 7,950 �4,284 7,723 628 �06,2��Fixedassetsacquiredduringthefinancialyear 74 3� ��9 33 5 262Intangibleassetsacquiredduringthefinancialyear 86 �2 8 24 – �30
*ExcludesAustraliaasitisdisclosedasaseparatesegment.

25
Consolidated Consolidated Bank Bank 2007 2006 2007 2006 $m $m $m $m
Note5.Incometax(expense)/benefita)Incometax(expense)/benefitCurrenttax (596) (388) (144) (37)Deferredtax 219 98 131 4�
Total (377) (290) (13) 4
Deferredincometaxrevenueincludedinincometax(expense)/benefitcomprises: Increaseindeferredtaxassets 129 35 55 23 Decreaseindeferredtaxliabilities 90 63 76 �8
Total 219 98 131 4�
b)Reconciliationofincometaxexpensetoprimafacietaxpayable Primafacieincometaxexpenseonoperatingprofit* (578) (387) (329) (�74)
Taxeffectofamountsadjustedincalculatingtaxableincome: Ratedifferentialonoffshoreincome 195 85 63 55 DistributionprovidedonMacquarieIncomePreferred Securitiesandsimilardistributions 16 �5 16 �5 Non-deductibleoptionsexpense (26) (�6) (20) (��) Intragroupdividends – – 277 ��4 Otheritems 16 �3 (20) 5
Totalincometax(expense)/benefit (377) (290) (13) 4
c)Amountsrecogniseddirectlyinequity Aggregatecurrentanddeferredtaxarisinginthereportingperiodandnotrecognisedinprofitandlossbutdirectlyrecognisedinequity:Netdeferredtax–debited/(credited)directlytoequity 11 67 (19) 54
Total 11 67 (19) 54
*Primafacieincometaxonoperatingprofitiscalculatedattherateof30%(3�March2006:30%).Theconsolidatedentityhasataxyearendingon30September.
PursuanttoaresolutionoftheBank,theconsolidatedentity’sAustraliantaxliabilitiesaredeterminedaccordingtotaxconsolidationlegislation.TheBanktogetherwithalleligibleAustralianresidentwholly-ownedcontrolledentitiesoftheBankrepresentaTaxConsolidatedGroup,withtheBankastheHeadEntity.Asaconsequence,therelevantcontrolledentitiesarenotliabletomakeincometaxpaymentsanddonotrecogniseanycurrenttaxbalances.Underthetermsandconditionsofataxfundingagreement,theBankchargeseachcontrolledentityforallcurrenttaxliabilitiesincurredinrespectoftheiractivitiesandreimburseseachcontrolledentityforcurrenttaxassetsutilised.
ShouldtheBankbeindefaultofitstaxpaymentobligations,oradefaultisprobable,thecurrenttaxbalancesofthecontrolledentitieswillbedeterminedinaccordancewiththetermsandconditionsofataxsharingagreementbetweentheBankandentitiesintheGroup.
InpreparingthisfinancialreporttheBankhasconsideredtheinformationcurrentlyavailableandwhereconsiderednecessaryhavetakenlegaladviceastotheeconomicentity’staxliabilityandinaccordancewiththisbelievethatprovisionsmadeareadequate.

MacquarieBankLimited2007FinancialReport26
Notestothefinancialstatements3�March2007continued
Consolidated Consolidated Bank Bank 2007 2006 2007 2006 $m $m $m $m
Note6.Dividendspaidanddistributionspaidorprovidedi)DividendspaidOrdinarysharecapitalInterimdividendpaid($�.25+(2006:$0.90*)pershare) 312 208 312 2082006Finaldividendpaid($�.25+(2005:$�.00*)pershare) 290 224 290 2242006Specialdividendpaid($nil(2005:$0.40*)pershare) – 89 – 89
Totaldividendspaid 602 52� 602 52�
+ Thesedividendswere�00%frankedatthe30%corporatetaxrate.*Thesedividendswere90%frankedatthe30%corporatetaxrate.
TheBank’sDividendReinvestmentPlan(“DRP”)remainsactivated.TheDRPisoptionalandoffersordinaryshareholdersinAustraliaandNewZealandtheopportunitytoacquirefullypaidordinaryshares,withouttransactioncosts,ata2.5%discounttotheprevailingmarketvaluewitheffectfromthe2006finaldividend(attheprevailingmarketvalue,priortothe2006finaldividend).AshareholdercanelecttoparticipateinorterminatetheirinvolvementintheDRPatanytime.DetailsoffullypaidordinarysharesissuedpursuanttotheDRPareincludedinnote3�–Contributedequity.
DividendperordinaryshareCashdividendsperordinaryshare(distributionofcurrentyearprofits) $3.15 $2.�5 $3.15 $2.�5
Consolidated Consolidated Bank Bank 2007 2006 2007 2006 $m $m $m $m
Frankingcreditsavailableforthesubsequentfinancialyearatacorporatetaxrateof30%(2006:30%) 176 �49 176 �49
Thefrankedportionofdividendsproposedasat3�March2007willbefrankedoutofexistingfrankingcreditsoroutoffrankingcreditsarisingfromthepaymentofincometaxpayableattheendofthefinancialyear.
Theaboveamountsrepresentthebalancesofthefrankingaccountsasattheendofthefinancialyear,adjustedfor:
a)frankingcreditsthatwillarisefromthepaymentofincometaxpayableasattheendofthefinancialyear;b)frankingcreditsthatmaybepreventedfrombeingdistributedinsubsequentfinancialyears;c)frankingdebitsthatwillarisefromthepaymentofdividendsproposedasattheendofthefinancialyearandthefinaldividend
disclosedbelowin(ii);andd)frankingdebitsthatwillarisefromthereceiptoftaxreceivablesasattheendofthefinancialyear.
ii)DividendsnotrecognisedattheendofthefinancialyearSincetheendofthefinancialyearthedirectorshaverecommendedthepaymentofthe2007finaldividendof$�.90perfullypaidordinaryshare,�00%frankedbasedontaxpaidat30%.Theaggregateamountoftheproposeddividendexpectedtobepaidon4July2007outofretainedprofitsat3�March2007,butnotrecognisedasaliabilityattheendofthefinancialyear,is$482million.Thisamounthasbeenestimatedbasedonthenumberofshareseligibletoparticipateasat3�March2007.
iii)DistributionspaidorprovidedMacquarieIncomeSecuritiesDistributionspaid(netofdistributionspreviouslyprovided) 24 23 – –Distributionsprovided 7 6 – –
Totaldistributionspaidorprovided 31 29 – –
TheMacquarieIncomeSecurity(“MIS”)isastapledarrangement,whichincludesaperpetualpreferenceshareissuedbytheBank.NodividendsarepayableunderthepreferencesharesuntiltheBankexercisesitsoptiontoreceivefuturepaymentsofinterestandprincipalundertheotherstapledsecurity.Uponexercise,dividendsarepayableatthesamerate,andsubjecttosimilarconditions,astheMIS.DividendsarealsosubjecttoDirectors’discretion.Thedistributionspaid/providedinrespectoftheMISarerecogniseddirectlyinequityinaccordancewithAASB�32:Financial Instruments: Presentation.
MacquarieIncomePreferredSecuritiesDistributionspaid(netofdistributionspreviouslyprovided) 30 27 – –Distributionsprovided 24 24 – –
Totaldistributionspaidorprovided 54 5� – –
TheMacquarieIncomePreferredSecuritiesrepresenttheminorityinterestofaconsolidatedentity.Accordingly,thedistributionspaid/providedinrespectoftheMacquarieIncomePreferredSecuritiesarerecordedasmovementsinminorityinterest,asdisclosedinnote32–Reserves,retainedearningsandminorityinterests.TheBankcanredirectthepaymentsofdistributionsundertheconvertibledebenturestobepaidtoitself.Eachdebentureconvertsfor500BankpreferencesharesattheBank’sdiscretionatanytime,incertaincircumstances(tomeetcapitalrequirements),oronmaturity.Refertonote3�forfurtherdetailsontheseinstruments.

27
Consolidated Consolidated Bank Bank 2007 2006 2007 2006 $m $m $m $m
Note6.DividendspaidanddistributionspaidorprovidedcontinuedConvertibleDebenturesDistributionspaid(netofdistributionspreviouslyprovided) – – 30 27Distributionsprovided – – 24 24
Totaldistributionspaidorprovided – – 54 5�
Consolidated Consolidated 2007 2006
Note7.Earningspershare Centspershare
Basicearningspershare 591.6 400.3
Dilutedearningspershare 569.8 382.3 $m $mReconciliationofearningsusedinthecalculationofbasicanddilutedearningspershareProfitfromordinaryactivitiesafterincometax 1,551 997(Profit)attributabletominorityinterests: MacquarieIncomePreferredSecurities (54) (5�) Otherequityholders (3) (�)Distributionspaidorprovidedon: MacquarieIncomeSecurities (31) (29)
Totalearningsusedinthecalculationofbasicanddilutedearningspershare 1,463 9�6
NumberofsharesTotalweightedaveragenumberofordinarysharesusedinthecalculationofbasicearningspershare 247,313,494 228,840,495
WeightedaveragenumberofsharesusedinthecalculationofdilutedearningspershareWeightedaveragefullypaidordinaryshares 247,313,494 228,840,495Potentialordinaryshares: Weightedaverageoptions 9,441,575 �0,790,865
Totalweightedaveragenumberofordinarysharesandpotentialordinarysharesusedinthecalculationofdilutedearningspershare 256,755,069 239,63�,360
InformationconcerningtheclassificationofsecuritiesOptionsOptionsgrantedtoemployeesundertheEmployeeOptionPlanareconsideredtobepotentialordinarysharesandhavebeenincludedinthecalculationofdilutedearningspersharetotheextenttowhichtheyaredilutive.Theissueprice,whichisequivalenttothefairvalueoftheoptionsgranted,andexercisepriceusedinthisassessmentincorporateboththeamountsrecognisedasanexpenseuptothereportingdateaswellasthefairvalueofoptionsyettoberecognisedasanexpenseinthefuture.
Includedinthebalanceofweightedaverageoptionsare�,998,45�(2006:�,424,595)optionsthatwereconverted,lapsedorcancelledduringthefinancialyear.Thereareafurther�,765,225(2006:�0,24�,098)optionsthathavenotbeenincludedinthebalanceofweightedaverageoptionsonthebasisthattheirstrikepricewasgreaterthantheaveragemarketpriceoftheBank’sfullypaidordinarysharesforthefinancialyearended3�March2007andconsequently,theyarenotconsideredtobedilutive.

MacquarieBankLimited2007FinancialReport28
Notestothefinancialstatements3�March2007continued
Consolidated Consolidated Bank Bank 2007 2006 2007 2006 $m $m $m $m
Note8.DuefrombanksCashatbank* 1,671 2,0�3 633 566Overnightcashatbank 936 �,836 923 �,823Otherloanstobanks 3,380 2,4�7 2,941 2,078Duefromclearinghouses 133 �28 83 ��2
Totalduefrombanks 6,120 6,394 4,580 4,579
*Includedwithinthisbalanceis$nil(2006:$8million)providedassecurityoverpayablestootherfinancialinstitutions.
Note9.CashcollateralonsecuritiesborrowedandreverserepurchaseagreementsCentralbank – 22 – 22Governments 48 385 48 385Otherfinancialinstitutions 13,130 5,00� 13,093 5,00�Other 12,731 8,�62 12,702 8,�57
Totalcashcollateralonsecuritiesborrowedandreverserepurchaseagreements 25,909 �3,570 25,843 �3,565
Note10.TradingportfolioassetsTradingsecuritiesEquitiesandothersecurities 12,114 9,2�� 11,675 8,��7Corporatebonds 1,496 995 1,412 97�Promissorynotes 809 �,�88 809 �,�88Certificatesofdeposit 426 �,597 426 �,597Othergovernmentsecurities 350 6�2 350 6�2Bankbills 159 330 159 330Commonwealthgovernmentbonds 71 �66 71 �66Foreigngovernmentbonds 6 42 6 42
Totaltradingsecurities 15,431 �4,�4� 14,908 �3,023
OthertradingassetsCommodities 87 �05 23 7
Totalothertradingassets 87 �05 23 7
Totaltradingportfolioassets 15,518 �4,246 14,931 �3,030
TradingassetspledgedassecurityIncludedinthebalanceofequitiesandothersecurities,certificatesofdepositandbankbillsareassetsprovidedassecurityoverissuednotesandpayablestootherexternalinvestorsandfinancialinstitutions.Thevalueofassetsprovidedis$97�million(2006:$�,249million).

29
Consolidated Consolidated Bank Bank 2007 2006 2007 2006 $m $m $m $m
Note11.LoanassetsheldatamortisedcostDuefromclearinghouses 2,827 2,033 2,751 �,906Duefromgovernments* 165 223 110 �56Duefromotherentities Otherloansandadvances** 40,269 30,845 16,009 ��,208Lessspecificprovisions (71) (52) (69) (48)
40,198 30,793 15,940 ��,�60Leasereceivables 2,697 2,030 47 35
Totalduefromotherentities 42,895 32,823 15,987 ��,�95
Totalgrossloanassets 45,887 35,079 18,848 �3,257
Lesscollectiveallowanceforcreditlosses (91) (80) (89) (76)
Totalloanassetsheldatamortisedcost 45,796 34,999 18,759 �3,�8�
*Governmentsincludefederal,stateandlocalgovernmentsandrelatedenterprisesinAustralia.**Includedwithinthisbalancearemortgageloansof$20,034million(2006:$�7,795million)heldbyconsolidatedSPEs.
Includedwithinthebalanceofloanassetsheldatamortisedcostareassetsprovidedassecurityoverissuednotesandpayablestootherexternalinvestorsandfinancialinstitutions.Thevalueofassetsprovided,excludingmortgagesecuritisedloans,is$�,63�million(2006:$nil).
SpecificprovisionsBalanceatthebeginningofthefinancialyear 52 45 48 39Providedforduringthefinancialyear 36 36 31 26Loanassetswrittenoff,previouslyprovidedfor (4) (�0) (4) (�0)Recoveryofloanspreviouslyprovidedfor (13) (�5) (6) (9)Transferfromotherprovisionsandotheritems – � – �Transfertoprovisionagainstinterestinassociatesandjointventuresusingtheequitymethod – (6) – –Attributabletoforeigncurrencytranslation – � – �
Totalspecificprovisions 71 52 69 48
Specificprovisionsasapercentageofgrossloanassets 0.15% 0.�5% 0.37% 0.36%
Thespecificprovisionsrelatetodoubtfulloanassetsthathavebeenidentifiedandprovidedfor.
CollectiveallowanceforcreditlossesBalanceatthebeginningofthefinancialyear 80 �09 76 �05AdjustmentonadoptionofAASB�39 (50) (47)Providedforduringthefinancialyear 11 �� 13 �0Transferfromtradingportfolioassets – �0 – 8
Totalcollectiveallowanceforcreditlosses 91 80 89 76
Thecollectiveallowancesforcreditlossesisintendedtocoverlossesinherentintheexistingoverallcreditportfoliowhicharenotyetspecificallyidentifiable.
Note12.ImpairedassetsImpairedassetshavebeenreportedinaccordancewithAASB�39andincludeloanassetsandimpaireditemsinrespectofderivativefinancialinstrumentsandunrecognisedcontingentcommitments.
Impairedassetswithspecificprovisionsforimpairment 166 �52 150 �32Lessspecificprovisions (78) (67) (74) (50)
Totalnetimpairedassets 88 85 76 82

MacquarieBankLimited2007FinancialReport30
Notestothefinancialstatements3�March2007continued
Consolidated Consolidated Bank Bank 2007 2006 2007 2006 $m $m $m $m
Note13.OtherfinancialassetsatfairvaluethroughprofitandlossInvestmentsecurities 789 395 190 �85Loanassets 1,990 �,709 1,990 �,709
Totalotherfinancialassetsatfairvaluethroughprofitandloss 2,779 2,�04 2,180 �,894
Note14.OtherassetsDebtorsandprepayments* 5,549 3,434 4,693 3,054Securitysettlements** 3,580 4,�46 2 �56Assetsunderoperatinglease*** 975 694 2 �Propertyheldforsaleanddevelopment* 336 �73 – 2Other 4 5 2 –
Totalotherassets 10,444 8,452 4,699 3,2�3
* Includedwithinthesebalancesis$383millionofdebtorsandprepayments(2006:$7million),and$309million(2006:$�59million)ofpropertyheldforsaleanddevelopmentwhichareprovidedassecurityoveramountspayabletootherfinancialinstitutions.
** Securitysettlementsarereceivablewithinthreeworkingdaysoftherelevanttradedate.***Assetsunderoperatingleasearestatednetofaccumulateddepreciationof$�58million(2006:$63million).
Note15.InvestmentsecuritiesavailableforsaleEquitysecurities Listed 617 347 323 �68 Unlisted* 377 �98 34 89Debtsecurities** 5,066 3,20� 2,854 2,053
Totalinvestmentsecuritiesavailableforsale 6,060 3,746 3,211 2,3�0
* Includedwithinthisbalancesis$�55million(2006:$nil)providedassecurityoverpayablestootherfinancialinstitutions.** Includedwithinthisbalancearedebtsecuritiesof$47�million(2006:$3��million)whicharerecognisedasaresultofatotalreturn
swapwithMacquarieInternationalInfrastructureFundLimited.Theeconomicentitydoesnothavelegaltitletotheseassetsbuthasfulleconomicexposuretothem.
Note16.IntangibleassetsGoodwill 39 83 – –Capitalisedsoftware 17 22 10 ��Otheridentifiableintangibles 44 45 – –
Totalintangibleassets 100 �50 10 ��

3�
Consolidated Consolidated Bank Bank 2007 2006 2007 2006 $m $m $m $m
Note17.LifeinvestmentcontractsandotherunitholderassetsLifeinvestmentcontractsandotherunitholderassetsCashandduefrombanks 63 �88 – –Debtsecurities 865 820 – –Unitsinunittrusts 4,675 3,946 – –Equitysecurities 244 229 – –
Totallifeinvestmentcontractsandotherunitholderinvestmentassets 5,847 5,�83 – –
Investmentassetsareheldprimarilytosatisfypolicyholderliabilities,whichareinvestmentlinked.
IncomefromlifeinvestmentcontractsandotherunitholderassetsPremiumincome,investmentrevenueandmanagementfees 613 509 – –Lifeinvestmentcontractclaims,reinsuranceandchangesinpolicyliabilities (578) (479) – –Directfees (8) (7) – –
Totalincomefromlifeinvestmentcontractsandotherunitholderassets 27 23 – –
SolvencySolvencyrequirementsforthelifeinvestmentcontractsbusinesshavebeenmetatalltimesduringthefinancialyear.
Asat3�March2007,thelifeinvestmentcontractsbusinesshadinvestmentassetsinexcessofpolicyholderliabilitiesof$86million(2006:$59million).
Note18.InterestinassociatesandjointventuresusingtheequitymethodInterestinassociatesandjointventuresusingtheequitymethodLoansandinvestmentswithoutprovisionsforimpairment 4,016 3,327 537 786
Loansandinvestmentswithprovisionsforimpairment 60 �76 80 65Lessprovisionforimpairment (5) (40) (4) (�8)
Loansandinvestmentsatrecoverableamount 55 �36 76 47
Totalinterestinassociatesandjointventuresusingtheequitymethod* 4,071 3,463 613 833
Investmentsinassociatesandjointventuresareaccountedforintheconsolidatedfinancialstatementsusingtheequitymethodofaccountingandarecarriedatcostbytheparententity(refertonote�(ii)).
*Includedinthisbalanceis$�84million(2006:$�53million)providedassecurityoveramountspayabletootherfinancialinstitutions.
(a)Reconciliationofmovementintheeconomicentity’sinvestmentinassociatesandjointventuresusingtheequitymethod:
Balanceatthebeginningofthefinancialyear 3,463 2,��7Associatesacquired/equitycontributed 1,542 2,728Shareofpre-taxprofitsofassociatesandincorporatedjointventures 345 246Shareoftaxexpenseofassociatesandincorporatedjointventures (103) (74)Dividendsreceived/receivablefromassociates (374) (�97)Associatesdisposedof (720) (�,070)Investmentsinassociatesprovidedfor/written-off 2 (�8)Foreignexchangeandotheradjustments (100) 93Transferredto/(from)heldforsale,availableforsaleequity 16 (362)
Balanceattheendofthefinancialyear 4,071 3,463

MacquarieBankLimited2007FinancialReport32
Notestothefinancialstatements3�March2007continued
Note18.Interestinassociatesandjointventuresusingtheequitymethodcontinued(b)Summarisedinformationofcertaininterestsinmaterialassociatesandjointventuresisasfollows:
Countryof Participating Incorporation ReportingDate interest 2007 2006Nameofentity % %
MacquarieAirports(a)**^ Australia 3�December 16% �4%DiversifiedCMBSInvestmentsInc(c)* USA 3�March 57% 57%MacquarieCountrywideTrust(b)** Australia 30June 9% 6%MacquarieMEAGPrimeREIT(b) Singapore 3�December 24% 20%MacquarieDiversified(AA)Trust(c) Australia 3�March 28% 3�%MacquarieOfficeTrust(b)** Australia 30June 6% 4%MacquarieMediaGroup(e)*** Australia 30June 22% 20%MacquarieCommunicationsInfrastructureGroup(a)**^ Australia 30June 12% ��%MacquarieCapitalAllianceGroup(c)** Australia 30June 17% �0%MacquarieAircraftLeasingLimited(a) Ireland 3�December 34% –EuropeanDirectoriesSA(d)*** Luxembourg 3�December 13% �5%EuroGamingLimited(e) UK 3�December 50% –MacquarieInfrastructureGroup(a)** Australia 30June 2% �%MacquarieEuropeanInfrastructureFund(a)** UK 3�March 5% –MacquarieGoodmanGroup(b)*** Australia 30June – 8%
* Votingrightsforthisinvestmentarenotproportionaltotheownershipinterest.Theeconomicentityhasjointcontrolbecauseneithertheeconomicentitynoritsfellowinvestorshavecontrolintheirownright.
** Theeconomicentityhassignificantinfluenceduetoitsfiduciaryrelationshipasmanageroftheseentities.*** Significantinfluencearisesduetotheeconomicentity’svotingpowerandboardrepresentation.
^Denoteslegalinterestisdifferenttoparticipatinginterest.LegalinterestinMacquarieAirportsis�8%and�7%inMacquarieCommunicationsInfrastructureGroup.
(a) Infrastructure(b)Propertydevelopment/managemententity(c)Fundsmanagementandinvestmentbanking(d)Directoriesbusiness(e)Media,television,gamingandinternetinvestments

33
Note18.Interestinassociatesandjointventuresusingtheequitymethodcontinued(c)Thefairvaluesofcertaininterestsinmaterialassociatesandjointventuresforwhichtherearepublicquotationsareasfollows:
Consolidated Consolidated Bank Bank 2007 2006 2007 2006 $m $m $m $m
MacquarieAirports 1,096 783 41 �3MacquarieCommunicationsInfrastructureGroup 324 256 14 4MacquarieCountrywideTrust 231 �49 10 4MacquarieMEAGPrimeREIT 225 �53 – –MacquarieMediaGroup 197 ��0 5 –MacquarieOfficeTrust 178 ��0 11 4MacquarieInfrastructureGroup 176 �33 54 �5MacquarieCapitalAllianceGroup 176 89 7 �MacquarieGoodmanGroup – 585 – 585
(d)Shareofassociates’andjointventures’expenditurecommitments,otherthanforthesupplyofinventories,isasfollows:
Capitalcommitments 88 70 – 25Leasecommitments 52 �45 37 86
(e)Contingentliabilitiesofassociatesandjointventuresareasfollows:
Shareincurredjointlywithotherinvestors 24 83 4 4�Forwhichtheeconomicentityisseverallyliable 146 59 6 59
(f)Aggregatedfinancialinformationofinterestsinassociatesandjointventuresareasfollows:
Economicentity’sshareof:Assets 9,472 5,676 529 773Liabilities 5,806 2,767 280 434Revenues 1,359 805 134 �03Profit 242 �72 42 37
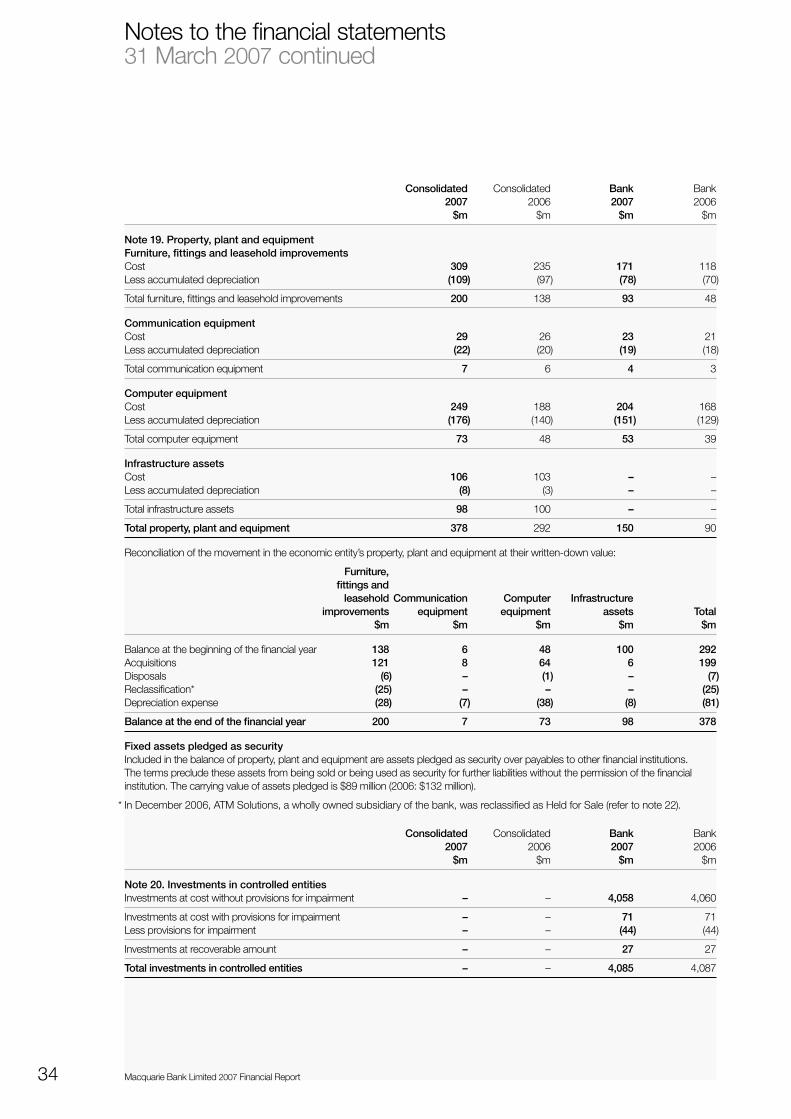
MacquarieBankLimited2007FinancialReport34
Notestothefinancialstatements3�March2007continued
Consolidated Consolidated Bank Bank 2007 2006 2007 2006 $m $m $m $m
Note19.Property,plantandequipmentFurniture,fittingsandleaseholdimprovementsCost 309 235 171 ��8Lessaccumulateddepreciation (109) (97) (78) (70)
Totalfurniture,fittingsandleaseholdimprovements 200 �38 93 48
CommunicationequipmentCost 29 26 23 2�Lessaccumulateddepreciation (22) (20) (19) (�8)
Totalcommunicationequipment 7 6 4 3
ComputerequipmentCost 249 �88 204 �68Lessaccumulateddepreciation (176) (�40) (151) (�29)
Totalcomputerequipment 73 48 53 39
InfrastructureassetsCost 106 �03 – –Lessaccumulateddepreciation (8) (3) – –
Totalinfrastructureassets 98 �00 – –
Totalproperty,plantandequipment 378 292 150 90
Reconciliationofthemovementintheeconomicentity’sproperty,plantandequipmentattheirwritten-downvalue:
Furniture, fittingsand leaseholdCommunication Computer Infrastructure improvements equipment equipment assets Total $m $m $m $m $m
Balanceatthebeginningofthefinancialyear 138 6 48 100 292Acquisitions 121 8 64 6 199Disposals (6) – (1) – (7)Reclassification* (25) – – – (25)Depreciationexpense (28) (7) (38) (8) (81)
Balanceattheendofthefinancialyear 200 7 73 98 378
FixedassetspledgedassecurityIncludedinthebalanceofproperty,plantandequipmentareassetspledgedassecurityoverpayablestootherfinancialinstitutions.Thetermsprecludetheseassetsfrombeingsoldorbeingusedassecurityforfurtherliabilitieswithoutthepermissionofthefinancialinstitution.Thecarryingvalueofassetspledgedis$89million(2006:$�32million).
*InDecember2006,ATMSolutions,awhollyownedsubsidiaryofthebank,wasreclassifiedasHeldforSale(refertonote22).
Consolidated Consolidated Bank Bank 2007 2006 2007 2006 $m $m $m $m
Note20.InvestmentsincontrolledentitiesInvestmentsatcostwithoutprovisionsforimpairment – – 4,058 4,060
Investmentsatcostwithprovisionsforimpairment – – 71 7�Lessprovisionsforimpairment – – (44) (44)
Investmentsatrecoverableamount – – 27 27
Totalinvestmentsincontrolledentities – – 4,085 4,087

35
Note20.InvestmentsincontrolledentitiescontinuedThematerialcontrolledentitiesoftheBank,basedoncontributiontotheeconomicentity’sprofitfromordinaryactivities,thesizeoftheinvestmentmadebytheBankorthenatureoftheactivitiesconductedbythecontrolledentity,are:
ConnectEastManagementLimitedDiversifiedCMBSAustraliaHoldingsPtyLimitedMacquarieAcceptancesLimitedMacquarieAfrica(Proprietary)Limited(SouthAfrica)MacquarieAirportsManagementLimitedMacquarieAlternativeAssetsManagementLimitedMacquarieAsiaRealEstateManagementLimited(formerlyMacquarieAsiaRealEstateLimited)MacquarieAustraliaSecuritiesLimitedMacquarieCapitalAllianceManagementLimitedMacquarieCapitalFundingL.P.(UnitedKingdom)MacquarieCapitalKoreaCoLimited(Korea)MacquarieCLOInvestmentsNo.�PtyLimitedMacquarieCommunicationsInfrastructureManagementLimitedMacquarieCountrywideManagementLimitedMacquarieDirectPropertyManagementLimitedMacquarieDiversifiedInvestmentsNo.2PtyLimitedMacquarieEquityCapitalMarketsLimitedMacquarieFinanceLimitedMacquarieFinancialProductsManagementLimitedMacquarieFundsManagementHoldingsPtyLimitedMacquarieGlobalDebtInvestmentNo.�PtyLimitedMacquarieGlobalFinanceServices(Mauritius)Limited(Mauritius)MacquarieHoldings(U.S.A.)Inc(UnitedStates)MacquarieInc(UnitedStates)MacquarieInfrastructureDebtManagementLimitedMacquarieInfrastructureInvestmentManagementLimitedMacquarieInfrastructureManagement(Asia)PtyLimitedMacquarieInfrastructureManagement(USA)Inc(UnitedStates)MacquarieInternationalFinanceLimitedMacquarieInvestmentManagement(UK)Limited(UnitedKingdom)MacquarieInvestmentManagementLimitedMacquarieInvestmentServicesLimitedMacquarieInvestments(UK)Limited(UnitedKingdom)MacquarieInvestmentsAustraliaPtyLimitedMacquarieLeisureManagementLimitedMacquarieOfficeManagementLimitedMacquariePropertyAdvisorsKoreaLimited(Korea)MacquariePropertyInvestmentManagement2LimitedMacquariePropertyInvestmentManagement5LimitedMacquariePropertyInvestmentManagement6LimitedMacquarieSecurities(Australia)LimitedMacquarieSecuritiesSouthAfricaLimited(SouthAfrica)MacquarieSecuritisationLimitedMacquarieSpecialisedAssetManagement2LimitedMacquarieSpecialisedAssetManagementLimitedMacquarieSpecialisedAssetManagement(Bermuda)Limited(Bermuda)M&IDebtInvestmentsPtyLimitedMQJapanMarketNeutralFund(CaymanIslands)*MQJapanMarketNeutralFund*RegionalMediaTrustRetirementVillagesGroupR.E.Limited
Note:AllentitiesareincorporatedinAustraliaunlessotherwisestated.Overseascontrolledentitiescarryonbusinesspredominantlyintheirplaceofincorporation.Beneficialinterestinallentitiesis�00%,unlessotherwisestated.Allentitieshavea3�Marchreportingdate,unlessotherwisestated.
*Theseentitieshavea30Junereportingdate.

MacquarieBankLimited2007FinancialReport36
Notestothefinancialstatements3�March2007continued
Consolidated Consolidated Bank Bank 2007 2006 2007 2006 $m $m $m $m
Note21.Deferredincometaxassets/(liabilities)Thebalancecomprisestemporarydifferencesattributableto:
Provisionsandaccruedexpenses 798 569 631 440Taxlosses 37 25 9 –Fixedassets 20 2� 20 2�Financialinstruments (386) (336) (229) (229)Investmentsinassociates (12) (39) – –
Totaldeferredincometaxassets 457 240 431 232
Availableforsalefinancialassets (78) (63) (41) (29)Investmentsinassociates – (94) – (94)Otherliabilities – – – (6)
Totaldeferredincometaxliabilities (78) (�57) (41) (�29)
Netdeferredincometaxassets 379 83 390 �03
Potentialtaxassetsofapproximately$52million(2006:$32million)attributabletotaxlossescarriedforwardbycontrolledentitieshavenotbeenbroughttoaccountinthecontrolledentitiesandintheeconomicentityastheDirectorsdonotbelievetherealisationofthetaxassetsisprobable.
Theeconomicentity’sAustraliantaxliabilitiesaredeterminedpursuanttotaxconsolidationlegislation.AlleligibleAustralianresidentwholly-ownedcontrolledentitiesoftheBankrepresentaTaxConsolidatedGroup.Underthetermsandconditionsofataxcontributionagreement,theBank,astheheadentityofthetaxconsolidatedgroup,willchargeorreimburseitswholly-ownedsubsidiariesforcurrenttaxliabilitiesorassetsitincursinconnectionwiththeiractivities.Asaconsequence,theBankhasrecognisedthecurrenttaxbalancesofitswholly-ownedsubsidiariesasifthosewereitsowninadditiontothecurrentanddeferredtaxamountsarisinginrelationtoitsowntransactions,eventsandbalances.Amountsreceivableorpayableunderataxcontributionagreementwiththetaxconsolidatedentitiesarerecognisedseparatelyastax-relatedamountsreceivableorpayable.Theprinciplesofthebalancesheetmethodoftaxeffectaccountinghavebeenadoptedwherebytheincometaxexpenseforthefinancialyearisthetaxpayableonthecurrentperiod’staxableincomeadjustedforchangesindeferredtaxassetsandliabilitiesattributabletotemporarydifferencesbetweenthetaxbasesofassetsandliabilitiesandtheircarryingamountsinthefinancialstatementsandtounusedtaxlosses.Thetaxassetsrelatingtodeductibletemporarydifferencesandtaxlossesarenotcarriedforwardasanassetunlessthebenefitisprobableofrealisation.
Thetaxassetshavebeenappliedagainstdeferredtaxliabilitiestotheextentthattheyareexpectedtoberealisedinthesameperiod,withinthesametaxpayingentity.
Consolidated Consolidated Bank Bank 2007 2006 2007 2006 $m $m $m $m
Note22.AssetsanddisposalgroupsclassifiedasheldforsaleAssociates* 750 586 139 �8
Assetsofdisposalgroupsheldforsale ATMSolutions 166 – – –LongviewOil&Gas 78 – – –SteamPacketGroup – 597 – –AHAHoldingsLimited – 469 – –MacquarieSCInvestmentsInc. – 400 – –MacquarieSmallCapRoadsHoldings,LLC – �95 – –VancouverHealthHoldingsLimited – �42 – –
Totalassetsofdisposalgroupsheldforsale** 244 �,803 – –
Totalassetsanddisposalgroupsclassifiedasheldforsale 994 2,389 139 �8
*Includedwithinthisbalanceareassetswithacarryingvalueof$409million(2006:$nil)providedassecurityoverpayablestootherfinancialinstitutions.
**Includedwithinthisbalanceareassetswithacarryingvalueof$34million(2006:$823million)providedassecurityoverpayablestootherfinancialinstitutions.
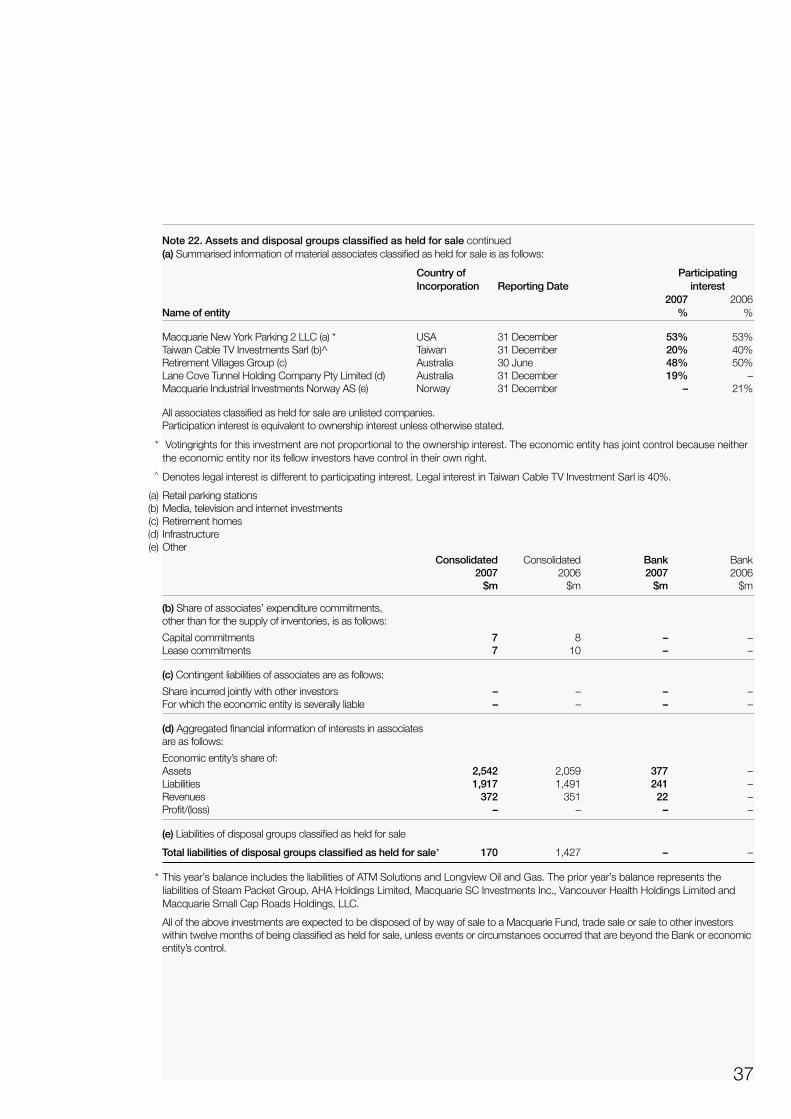
37
Note22.Assetsanddisposalgroupsclassifiedasheldforsalecontinued(a)Summarisedinformationofmaterialassociatesclassifiedasheldforsaleisasfollows:
Countryof Participating Incorporation ReportingDate interest 2007 2006Nameofentity % %
MacquarieNewYorkParking2LLC(a)* USA 3�December 53% 53%TaiwanCableTVInvestmentsSarl(b)^ Taiwan 3�December 20% 40%RetirementVillagesGroup(c) Australia 30June 48% 50%LaneCoveTunnelHoldingCompanyPtyLimited(d) Australia 3�December 19% –MacquarieIndustrialInvestmentsNorwayAS(e) Norway 3�December – 2�%
Allassociatesclassifiedasheldforsaleareunlistedcompanies.Participationinterestisequivalenttoownershipinterestunlessotherwisestated.
* Votingrightsforthisinvestmentarenotproportionaltotheownershipinterest.Theeconomicentityhasjointcontrolbecauseneithertheeconomicentitynoritsfellowinvestorshavecontrolintheirownright.
^Denoteslegalinterestisdifferenttoparticipatinginterest.LegalinterestinTaiwanCableTVInvestmentSarlis40%.
(a)Retailparkingstations (b)Media,televisionandinternetinvestments (c)Retirementhomes (d) Infrastructure (e)Other
Consolidated Consolidated Bank Bank 2007 2006 2007 2006 $m $m $m $m
(b)Shareofassociates’expenditurecommitments,otherthanforthesupplyofinventories,isasfollows:
Capitalcommitments 7 8 – –Leasecommitments 7 �0 – –
(c)Contingentliabilitiesofassociatesareasfollows:
Shareincurredjointlywithotherinvestors – – – –Forwhichtheeconomicentityisseverallyliable – – – –
(d)Aggregatedfinancialinformationofinterestsinassociatesareasfollows:
Economicentity’sshareof:Assets 2,542 2,059 377 –Liabilities 1,917 �,49� 241 –Revenues 372 35� 22 –Profit/(loss) – – – –
(e)Liabilitiesofdisposalgroupsclassifiedasheldforsale
Totalliabilitiesofdisposalgroupsclassifiedasheldforsale* 170 �,427 – –
* Thisyear’sbalanceincludestheliabilitiesofATMSolutionsandLongviewOilandGas.Theprioryear’sbalancerepresentstheliabilitiesofSteamPacketGroup,AHAHoldingsLimited,MacquarieSCInvestmentsInc.,VancouverHealthHoldingsLimitedandMacquarieSmallCapRoadsHoldings,LLC.
AlloftheaboveinvestmentsareexpectedtobedisposedofbywayofsaletoaMacquarieFund,tradesaleorsaletootherinvestorswithintwelvemonthsofbeingclassifiedasheldforsale,unlesseventsorcircumstancesoccurredthatarebeyondtheBankoreconomicentity’scontrol.

MacquarieBankLimited2007FinancialReport38
Notestothefinancialstatements3�March2007continued
Consolidated Consolidated Bank Bank 2007 2006 2007 2006 $m $m $m $m
Note23.DuetobanksOECDbanks 3,056 �,537 1,427 703OECDCentralBanks 229 373 229 373Clearinghouses 147 67 134 67Clearingbanks 27 40 27 40Other 668 �0� 294 34
Totalduetobanks 4,127 2,��8 2,111 �,2�7
Amountsduetoclearinghousesaresettledonthenextbusinessday.
Note24.CashcollateralonsecuritieslentandrepurchaseagreementsCentralbanks 985 �,039 985 �,039Otherfinancialinstitutions 3,118 2,328 3,118 2,328Other 3,386 3,628 3,386 3,628
Totalcashcollateralonsecuritieslentandrepurchaseagreements 7,489 6,995 7,489 6,995
Note25.TradingportfolioliabilitiesListedequitysecurities 14,258 4,435 14,293 4,43�Commonwealthgovernmentsecurities 1,243 4,867 1,243 4,867Othergovernmentsecurities 352 685 352 685Corporatesecurities 69 70 69 70
Totaltradingportfolioliabilities 15,922 �0,057 15,957 �0,053
Note26.DebtissuedatamortisedcostDebtissuedatamortisedcost* 51,365 39,022 28,519 20,567
Totaldebtissuedatamortisedcost 51,365 39,022 28,519 20,567
*Includedwithinthisbalanceareamountspayabletomortgagespecialpurposeentities’noteholdersof$�9,932million(2006:$�7,778million).
Note27.OtherfinancialliabilitiesatfairvaluethroughprofitandlossDebtissued 5,552 5,48� 5,149 5,058
Totalotherfinancialliabilitiesatfairvaluethroughprofitandloss 5,552 5,48� 5,149 5,058
Reconciliationofdebtissuedatamortisedcostandotherfinancialliabilitiesatfairvaluethroughprofitandlossbymajorcurrency:Australiandollars 28,596 23,784 6,124 5,065UnitedStatesdollars 15,936 8,205 15,899 8,2��Euro 5,120 5,440 5,120 5,440GreatBritishpounds 3,467 3,844 3,467 3,844HongKongdollars 1,592 �,435 1,490 �,270Japaneseyen 571 695 571 695Othercurrencies 1,635 �,�00 997 �,�00
Totalbycurrency 56,917 44,503 33,668 25,625
TheBank’sprimaryprogramfordomesticandinternationaldebtissuanceisitsmulti-currency,multi-jurisdictionalDebtInstrumentProgram.Securitiesareissuedfortermsvaryingfromonedayto30years.

39
Consolidated Consolidated Bank Bank 2007 2006 2007 2006 $m $m $m $m
Note28.OtherliabilitiesCreditors 5,166 3,247 4,021 2,359Accruedchargesandsundryprovisions 3,556 2,�55 2,902 �,8�5Duetobrokersandcustomers* 3,034 4,000 77 �74Other 202 �5� 94 69
Totalotherliabilities 11,958 9,553 7,094 4,4�7
*Amountsduetobrokersandcustomersarepayablewithinthreeworkingdaysoftherelevanttradedate.
Note29.ProvisionsProvisionforannualleave 69 57 48 39Provisionforlongserviceleave 53 45 52 45Provisionfordividends 31 30 24 24
Totalprovisions 153 �32 124 �08
Note30.LoancapitalSubordinateddebtAgreementsbetweentheBankandthelendersprovidethat,intheeventofliquidation,entitlementofsuchlenderstorepaymentoftheprincipalsumandinterestthereonisandshallatalltimesbeandremainsubordinatedtotherightsofallotherpresentandfuturecreditorsoftheBank.
ThedatesuponwhichtheBankhascommittedtorepaytheprincipalsumtothelendersareasfollows:
Subordinateddebt�8February20�3 227 227 227 2272May20�3 25 25 25 2520June20�3 332 340 332 340�5September20�4 301 300 301 300�8September20�5 432 489 432 488�9September20�6 486 – 486 –6December20�6 576 – 576 –3�May20�7 292 – 292 –
Totalsubordinateddebt 2,671 �,38� 2,671 �,380
Reconciliationofsubordinateddebtbymajorcurrency:
Australiandollars 845 552 845 552Euro 908 340 908 340GreatBritishpounds 486 – 486 –UnitedStatesdollars 432 489 432 488
Totalsubordinateddebtbycurrency 2,671 �,38� 2,671 �,380
InaccordancewithAustralianPrudentialRegulationAuthorityguidelines,theBankincludestheapplicableportionoftheprincipalsumasTier2capital.

MacquarieBankLimited2007FinancialReport40
Notestothefinancialstatements3�March2007continued
ConsolidatedandBank ConsolidatedandBank 2007 2006 2007 2006 Numberofshares $m $m
Note31.ContributedequityOrdinarysharecapitalOpeningbalanceoffullypaidordinaryshares 232,440,369 223,683,592 1,916 �,600Issueof�0,606,06�ordinaryshareson22May2006at$66.00pershare 10,606,061 – 696 –On-marketpurchaseofsharespursuanttotheMacquarieBankStaffShareAcquisitionPlan(“MBSSAP”)andNon-ExecutiveDirectorsShareAcquisitionPlan(“NEDSAP”)at$67.94(2006:$60.6�)pershare (288,009) (�60,�96) (20) (�0)AllocationofsharestoemployeespursuanttotheMBSSAPandNEDSAPat$67.94(2006:$60.6�)pershare 288,009 �60,�96 20 �0Issueofsharesonexerciseofoptions 7,536,936 7,206,943 239 222IssueofsharespursuanttotheEmployeeSharePlanat$68.30pershare – 20,��8 – �Issueofshareson23June2006pursuanttotheSharePurchasePlanat$66.00pershare 137,947 – 9 –Issueofshareson�2January2007pursuanttotheEmployeeSharePlanat$76.82pershare 21,632 – 2 –Issueofshareson�July2005pursuanttotheDividendReinvestmentPlan(“DRP”)at$5�.27pershare – �,�33,�73 – 58Issueofshareson�6December2005pursuanttotheDRPat$67.77pershare – 396,543 – 27Issueofshareson5July2006pursuanttotheDRPat$63.60pershare 1,523,326 – 97 –Issueofshareson�5December2006pursuanttotheDRPat$70.23pershare 1,674,934 – 117 –Transferfromsharebasedpaymentsreserveforexpensedoptionsthathavebeenexercised – – 27 8
Closingbalanceoffullypaidordinaryshares 253,941,205 232,440,369 3,103 �,9�6
Asat3�March2007,34,358,273(2006:3�,235,034)optionsgrantedtoemployeesoverunissuedordinaryshareshadnotbeenexercised.Forfurtherinformationregardingthetermsandconditionsoftheissueofoptionsandsharestoemployeesrefertonote36–Employeeequityparticipation.
On22May2006,theBankissued�0,606,06�additionalordinarysharesatA$66.00perordinaryshareviaaninstitutionalplacement.Theseplacementsharesrankparipassuwithexistingordinarysharesexceptthattheydidnotparticipateinthe2006finaldividendpaidon5July2006.Theequityraisedisnetofplacementfeesof$4million.
Consolidated Consolidated Bank Bank 2007 2006 2007 2006 $m $m $m $m
TotalTreasuryShares (7) (2) – –
MacquarieIncomeSecurities4,000,000MacquarieIncomeSecuritiesof$�00each 400 400 400 400Lesstransactioncostsfororiginalplacement (9) (9) (9) (9)
TotalMacquarieIncomeSecurities 391 39� 391 39�
TheMacquarieIncomeSecuritiesareclassifiedasequityinaccordancewithAASB�32:Financial Instruments: Presentation.InterestispaidquarterlyatafloatingrateofBBSWplus�.7%p.a.Paymentofinteresttoholdersissubjecttocertainconditions,includingtheprofitabilityoftheBank.Theyareaperpetualinstrumentwithnoconversionrights.TheywerelistedfortradingontheAustralianStockExchangeon�9October�999andbecameredeemable(inwholeorinpart)attheBank’sdiscretionon�9November2004.
ConvertibleDebentures7,000convertibledebenturesof£50,000each – – 884 884
Totalconvertibledebentures – – 884 884
AspartoftheissueoftheMacquarieIncomePreferredSecurities(asdetailedinnote32–Reserves,retainedearningsandminorityinterests),theLondonbranchoftheparententityissued7,000resetsubordinatedconvertibledebentures,eachwithafacevalueof£50,000,toMacquarieCapitalFundingLP,acontrolledentity.Theconvertibledebentures,whicheliminateonconsolidation,currentlypaya6.�77%semi-annualcumulativefixedratedistribution.Thedebenturesmatureon�5April2050,butmayberedeemed,attheBank’sdiscretion,on�5April2020oronanyresetdatethereafter.Ifredemptionisnotelected,thenon�5April2020andoneachfifthanniversarythereafter,thedebenturecouponwillberesetto2.35%abovethethenprevailingfiveyearbenchmarksterlinggiltrate.
Thedistributionpoliciesfortheseinstrumentsareincludedinnote6ofthisreport.

4�
Consolidated Consolidated Bank Bank 2007 2006 2007 2006 $m $m $m $m
Note32.Reserves,retainedearningsandminorityinterestsReservesForeigncurrencytranslationreserveOpeningbalance 4 (�) (44) (38)Currencytranslationdifferencesarisingduringthefinancialyear,netofhedge (3) 5 4 (6)
Totalforeigncurrencytranslationreserve 1 4 (40) (44)
AvailableforsalereserveOpeningbalance 151 – 93 –AdjustmentonadoptionofAASB�32andAASB�39,netoftax 67 48Revaluationmovementforthefinancialyear,netoftax 175 ��6 74 76Transfertoprofitonrealisation (98) (32) (59) (3�)
Totalavailableforsalereserve 228 �5� 108 93
Share-basedpaymentsreserveOpeningbalance 84 39 84 39Optionexpenseforthefinancialyear 87 53 68 37Optionsissuedtosubsidiaryemployees – – 19 �6Transfertosharecapitalonexerciseofexpensedoptions (27) (8) (27) (8)
Totalshare-basedpaymentsreserve 144 84 144 84
CashflowhedgingreserveOpeningbalance 2 – 33 –AdjustmentonadoptionofAASB�32andAASB�39,netoftax 4 �3Revaluationmovementforthefinancialyear,netoftax 8 (2) (33) 20
Totalcashflowhedgingreserve 10 2 – 33
ShareofreservesofinterestsinassociatesandjointventuresusingtheequitymethodOpeningbalance 9 �� – –Shareofreservesduringthefinancialyear (12) (�) – –Transfertoprofitonrealisation – (�) – –
Totalshareofreservesofinterestsinassociatesandjointventuresusingtheequitymethod (3) 9 – –
Totalreserves 380 250 212 �66

MacquarieBankLimited2007FinancialReport42
Notestothefinancialstatements3�March2007continued
Consolidated Consolidated Bank Bank 2007 2006 2007 2006 $m $m $m $m
Note32.Reserves,retainedearningsandminorityinterestscontinuedRetainedearningsBalanceatthebeginningofthefinancialyear 1,934 �,523 949 950AdjustmentonadoptionofAASB�32andAASB�39,netoftax �6 (�4)ProfitattributabletoequityholdersofMacquarieBankLimited 1,494 945 1,085 585DistributionspaidorprovidedonMacquarieIncomeSecurities (31) (29) – –Distributionspaidorprovidedonconvertibledebentures – – (54) (5�)Dividendspaidonordinarysharecapital (602) (52�) (602) (52�)
Totalretainedearnings 2,795 �,934 1,378 949
MinorityinterestMacquarieIncomePreferredSecurities* ProceedsonissueofMacquarieIncomePreferredSecurities 894 894 – – Issuecosts (10) (�0) – –
884 884 – – Currentyearprofit 54 5� – – DistributionprovidedonMacquarieIncomePreferredSecurities (54) (5�) – – Foreigncurrencytranslationreserve (43) (43) – –
TotalMacquarieIncomePreferredSecurities 841 84� – –
Otherminorityinterests Ordinarysharecapital 9 36 – – Preferencesharecapital 6 – – – Accumulatedgains/(losses) 1 (29) – –
Totalotherminorityinterests 16 7 – –
Totalminorityinterest 857 848 – –
*On22September2004,MacquarieCapitalFundingLP,amemberoftheeconomicentityestablishedtofacilitatecapitalraising,issued£350millionofTier�capital-eligiblesecurities(“MacquarieIncomePreferredSecurities”,“theSecurities”).TheSecurities–guaranteednon-cumulativestep-upperpetualpreferredsecurities–currentlypaya6.�77%semi-annualnon-cumulativefixedratedistribution.Theyareperpetualsecuritiesandhavenofixedmaturitybutmayberedeemedon�5April2020,attheBank’sdiscretion.Ifredemptionisnotelectedonthisdate,thedistributionratewillberesetto2.35%perannumabovethethenfive-yearbenchmarksterlinggiltrate.TheSecuritiesmayberedeemedoneachfifthanniversarythereafterattheBank’sdiscretion.Thefirstcouponwaspaidon�5April2005.
Theinstrumentsarereflectedintheeconomicentity’sfinancialstatementsasaminorityinterest,withdistributionentitlementsbeingincludedwiththeminorityinterestshareofprofitaftertax.

43
Consolidated Consolidated Bank Bank 2007 2006 2007 2006 $m $m $m $m
Note33.NotestothecashflowstatementsReconciliationofcashCashattheendofthefinancialyearasshowninthecashflowstatementsisreconciledtorelateditemsintheBalanceSheetasfollows:
Cashandbalanceswithcentralbanks 3 5 3 5Duefromotherfinancialinstitutions –duefrombanks* 5,540 6,390 4,567 4,575–tradingsecurities** 2,783 2,738 2,783 2,724
Cashattheendofthefinancialyear 8,326 9,�33 7,353 7,304
ReconciliationofprofitfromordinaryactivitiesafterincometaxtonetcashflowsfromoperatingactivitiesProfitfromordinaryactivitiesafterincometax 1,551 997 1,085 585Adjustmentstoprofitfromordinaryactivities Amountsprovidedduringthefinancialyear 55 6� 42 46 Depreciation 81 60 46 39 Shareofnetprofitsofassociatesandjointventures (242) (�72) – – Dividendsreceivedfromassociates 374 �97 – 9 Sharebasedpaymentexpense 87 53 87 53
Changesinassetsandliabilities Decreaseindividendsreceivable 376 �88 – 9 (Increase)/decreaseinfeesandcommissionsreceivable (66) (80) (67) 245 Increase/(decrease)infeesandcommissionspayable 41 (4�) 26 (��) Increase/(decrease)intaxliabilities 215 99 (298) (�93) Increaseintaxassets (385) (39) (111) (�98) (Decrease)/increaseindeferredtaxliabilities (79) (�23) (88) 90 Increaseininterestreceivable (225) (6�) (71) (37) Increaseininterestpayable 319 243 233 �50 Increaseinemploymentprovisions 20 23 16 �4 Increaseinloanassetsgranted (11,567) (7,777) (5,762) (6,034) Increase/(decrease)indebtors,prepayments,accruedcharges andcreditors 98 (4�9) 635 (7�3) Increaseinfinancialinstruments,foreignexchange andcommodities (9,603) (5,926) (9,066) (4,97�) Increaseinmoneymarketandotherdeposits 17,462 �8,382 11,664 �4,350 Decrease/(increase)inlifeinvestmentcontractreceivables 513 (47) – –
Netcashflowsfromoperatingactivities (975) 5,6�8 (1,629) 3,433
*Includescashatbank,duefromclearinghousesandovernightcashatbankaspernote�(xix).**Includescertificatesofdeposit,bankbillsandothershort-termcashsecuritiesaspernote�(xix).

MacquarieBankLimited2007FinancialReport44
Notestothefinancialstatements3�March2007continued
Consolidated Consolidated Bank Bank 2007 2006 2007 2006 $m $m $m $m
Notes33.NotestothecashflowstatementscontinuedFinancingarrangementsTotalunused 1,014 �,234 – –
Totaloverdraftfacilities 1,014 �,234 – –
CapitalMetersLimited,acontrolledentityofthebankincorporatedintheUnitedKingdom,hasacreditfacilityof£��8million(2006:£��8million).Asat3�March2007,theentityhaddrawndown£50million(2006:£29million)oftheamountavailable.
MacquarieEquities(Asia)Limited,acontrolledentityoftheBankincorporatedinHongKong,hasaHKD200millionoverdraftfacility(2006:HKD200million).Thefacilitymaybedrawndownatanytimeandissubjecttoannualreviewon3�Decemberofeachyear.Asat3�March2007,thefacilityisundrawn(2006:undrawn).
MacquarieInternationalFinanceLimited,acontrolledentityoftheBankincorporatedinAustralia,hascreditfacilitiesof$�.�billion(2006:$�.3billion).Asat3�March2007,theentityhaddrawndown$608million(2006:$387million)oftheamountavailable.
MacquarieInvestmentsAustraliaLimited,acontrolledentityoftheBankincorporatedinAustralia,hasa$500millionoverdraftfacility(2006:$nil).Asat3�March2007,$275millionwasdrawndown(2006:undrawn).
Note34.RelatedpartyinformationUltimateparentTheultimateAustralianparententityoftheGroupisMacquarieBankLimited.
ControlledentitiesTransactionsbetweentheBankanditscontrolledentitiesprincipallyarisefromtheprovisionofbankingandotherfinancialservices,thegrantingofloans,acceptanceoffundsondepositandprovisionofmanagement,administrationservices,provisionofguaranteesandprovisionoflicencestousetheMacquariebrandname.
Alltransactionswithcontrolledentitiesareinaccordancewithregulatoryrequirements,themajorityofwhichareoncommercialterms.Alltransactionsundertakenduringthefinancialyearwithcontrolledentitiesareeliminatedintheconsolidatedfinancialreport.Amountsduefromandduetocontrolledentities,atbalancesheetdate,areshowninthebalancesheetoftheBank.
BalancesarisingfromlendingandborrowingactivitiesbetweentheBankandcontrolledentitiesaretypicallyrepayableondemand,butmaybeextendedonatermbasisandwhereappropriatemaybeeithersubordinatedorcollateralised.AmountsduetoandfromcontrolledentitiesareseparatelyincludedontheBank’sbalancesheet.
TheBankhasenteredintoataxcontributionagreementwithitseligibleAustraliancontrolledsubsidiaries.Thetermsandconditionsofthisagreementaresetoutinnote�–Summaryofsignificantaccountingpolicies.TheamountreceivablebytheBankunderthetaxcontributionagreementwiththetaxconsolidatedentitiesis$�98million(2006:$5�million).Thisbalanceisincludedin“Duefromcontrolledentities”intheBank’sseparatebalancesheet.
TheBankhasenteredintoderivativetransactionswithitscontrolledentitiestohedgetheiroperations.ThefairvaluebalanceofderivativefinancialinstrumentsrelatingtotransactionsbetweentheBankanditscontrolledentitiesat3�March2007are$28�millionpositivevalue(2006:$39millionpositivevalue)and$203millionnegativevalue(2006:$�04millionnegativevalue).
Duringtheyear,thefollowingtransactionsoccurredwithcontrolledentities:
Consolidated Consolidated Bank Bank 2007 2006 2007 2006 $m $m $m $m
Interestincomereceived/receivable – – 698 356Interestexpensepaid/payable – – (325) (�72)Feeandcommissionincome – – 169 50Otheroperatingincome – – 2 –Gainsonsaleofassociatesandjointventures – – – 77Dividendsanddistributionsreceived/receivable – – 925 378Managementfees,groupservicechargesandcostrecoveries – – 456 364Brokerageandcommissionexpense – – (1) (45)

45
Consolidated Consolidated Bank Bank 2007 2006 2007 2006 $m $m $m $m
Note34.RelatedpartyinformationcontinuedThefollowingbalanceswithcontrolledentitieswereoutstandingattheyear-end:
Amountsreceivable – – 13,527 �0,24�Amountspayable – – (7,136) (5,275)
AssociatesandjointventuresTransactionsbetweentheeconomicentityanditsassociatesandjointventuresprincipallyarisefromtheprovisionofcorporateadvisoryservices,thegrantingofloans,derivativetransactionsandtheprovisionofmanagementservices.Alltransactionsundertakenwithassociatesandjointventuresareeliminatedwheretheyareunrealised,totheextentofownershipinterestsheldbythebankanditscontrolledentities,intheconsolidatedprofitandloss.
Duringtheyear,thefollowingtransactionsoccurredwithassociatesandjointventures:
Consolidated Consolidated Bank Bank 2007 2006 2007 2006 $m $m $m $m
Interestincomereceived/receivable 80 55 53 4�Interestexpensepaid/payable (13) (�7) (9) (�)Feeandcommissionincome* 967 �,0�5 275 242Otherincome 4 6 2 3Gainsonsaleofsecurities** 58 �43 42 45Dividendsanddistributions*** 374 �97 72 35Brokerageandcommissionexpense (14) (5) – –
*Feeandcommissionincomeincludesallfeeschargedtoassociates.Anyeliminationsoftheunrealisedcomponentmadewhenequityaccountingisincludedwithintheshareofprofits/lossesoftheseassociates.
**Gainsonsaleofsecuritiesareshownnetofeliminationofunrealisedprofits/lossescalculatedbyreferencetotheeconomicentity’sownershipinterestintheassociate.Thesegainsincludeprofitsarisingfromthetransferofequitysecuritiesunderthetermsofatotalreturnswap(seebelowfordetails).
***Dividendsanddistributionsareshownasgrossamounts.Undertheequityaccountingmethodtheseamountsarenottakenasprofitbutasanadjustmenttotheinterestintheassociatebalance.
Fromtimetotime,derivativetransactionsareundertakenbyassociateswiththeeconomicentityundernormalcommercialterms.ThisincludestheuseoftotalreturnswapstotransfertheeconomicbenefitsofequitysecuritiesandinterestsinassociatesfromtheBanktoitsassociates.UnderthisarrangementtheBankretainslegaltitletotheequitysecuritiesandreceivestheeconomicbenefitsofaportfolioofdebtsecuritiesinreturn.
Thetotalvalueofequitysecuritiestransferredtoassociatesunderthetermsofatotalreturnswapasdescribedaboveareasfollows:
Consolidated Consolidated Bank Bank 2007 2006 2007 2006 $m $m $m $m
Equitysecuritiesandinterestsinassociates – 439 – –
BalancesarisingfromlendingandborrowingactivitiesbetweentheBankanditscontrolledentitiesandassociatesandjointventuresaretypicallyrepayableondemand,butmaybeextendedonatermbasisandwhereappropriatemaybeeithersubordinatedorcollateralised.
Thefollowingbalanceswithassociatesandjointventureswereoutstandingattheyear-end(excludesamountsformingpartofinterestinassociatesdisclosedinnote�8):
Consolidated Consolidated Bank Bank 2007 2006 2007 2006 $m $m $m $m
Amountsreceivable 721 �,496 565 �,�32Amountspayable (68) (264) (2) (�32)

MacquarieBankLimited2007FinancialReport46
Notestothefinancialstatements3�March2007continued
Note35.KeyManagementPersonneldisclosureKeyManagementPersonnelNotethatthroughoutthisnote,MrClarkeandMrJohnsonarepresentedasExecutiveDirectorsbecausethiswastheirstatusthroughoutthefinancialyear,andthecomparativeyear.However,theybothretiredfromexecutiveresponsibilitieswitheffectfrom3�March2007sotheywillbeclassifiedinfutureReportsasNon-ExecutiveDirectors,exceptincomparativetables.
ThefollowingpersonswereVotingDirectorsofMacquarieBankLimitedduringthefinancialyearsended3�March2007and3�March2006,unlessotherwiseindicated:
ExecutiveDirectors:D.S.Clarke,AO ChairmanA.E.Moss,AO* ManagingDirectorandChiefExecutiveOfficerM.R.G.Johnson DeputyChairmanL.G.Cox,AO
IndependentNon-ExecutiveDirectors**:J.G.AllpassP.M.KirbyC.B.LivingstoneB.R.Martin(retiredon20July2006)H.K.McCann,AMJ.R.Niland,ACH.M.Nugent,AO
InadditiontotheExecutiveDirectorslistedabove,thefollowingpersonsalsohadauthorityandresponsibilityforplanning,directingandcontrollingtheactivitiesoftheBankanditscontrolledentitiesduringthepasttwofinancialyearsended3�March2007and3�March2006,unlessotherwiseindicated:
Executives:J.K.Burke* GroupHead,EquityMarketsGroup(appointed�October2005)M.Carapiet* JointHead,CorporateFinance,InvestmentBankingGroupA.J.Downe* GroupHead,TreasuryandCommoditiesGroupP.J.Maher* GroupHead,FinancialServicesGroupN.R.Minogue* GroupHead,RiskManagementGroupN.W.Moore* GroupHead,InvestmentBankingGroupW.J.Moss,AM FormerGroupHead,BankingandPropertyGroup(retiredon30March2007)W.R.Sheppard* DeputyManagingDirectorG.C.Ward* GroupHead,CorporateAffairsGroupandChiefFinancialOfficerO.Weiss FormerGroupHead,EquityMarketsGroup(retiredasGroupHeadon30September2005,retiredfromthe
ExecutiveCommitteeon4October2005andceasedemploymentwiththeBankon3�March2006)
*CurrentmembersoftheBank’sExecutiveCommittee**InaccordancewiththeBank’sdefinitionofindependence(assetoutintheCorporateGovernanceStatementcontainedinthe
2007AnnualReview).ThoseDirectorslistedasIndependentDirectorshavebeenindependentthroughoutthefinancialyearended3�March2007.
ItisimportanttonotethattheBank’sIndependentNon-ExecutiveDirectorsarespecificallyrequiredtobecategorisedasKeyManagementPersonnelforthepurposesofthedisclosuresinsection4oftheremunerationreport.However,theIndependentDirectorsdonotconsiderthattheyarepartof‘management’.
TheremunerationarrangementsforallofthepersonslistedaboveasExecutiveDirectorsorExecutivesaredescribedinsection2oftheremunerationreport.
TheremunerationarrangementsforallofthepersonslistedaboveasIndependentNon-ExecutiveDirectorsaredescribedinsection3oftheremunerationreport.

47
Note35.KeyManagementPersonneldisclosurecontinuedKeyManagementPersonnelremunerationThefollowingtabledetailstheaggregateremunerationforKeyManagementPersonnel.TheBankhastakenadvantageofthereliefprovidedbyASICClassOrder06/50andhastransferredthedetailedremunerationdisclosurestotheDirectors’Report.Therelevantinformationcanbefoundinsection4.2oftheRemunerationReport.
Short-term Long-term Share employee employee based benefits benefits payments Total Salaryand Performance short-term fees(including related Other employee Restricted Total superannuation) remuneration benefits benefits profitshare Options remuneration $ $ $ $ $ $ $
2007 7,158,710 153,640,322 89,433 160,888,465 40,449,633 7,369,553 208,707,6512006 7,236,73� �0�,�66,468 �33,450 �08,536,649 24,778,�40 5,590,630 �38,905,4�9
OptionholdingsofKeyManagementPersonnelandtheirrelatedpartiesThefollowingtablessetoutdetailsofoptionsheldduringtheyearfortheKeyManagementPersonnelincludingtheirrelatedparties.TheoptionsareoverfullypaidunissuedordinarysharesoftheBank.FurtherdetailsinrelationtotheOptionPlanaredisclosedinnote36–Employeeequityparticipation.
Fortheyearended31March2007 Number Options Options ofoptions Number granted exercised Number vested Number ofoptions duringthe duringthe ofoptions duringthe ofoptions heldat financial financial Other heldat31 financial vestedat31Nameandposition 1April2006 year year changes(a) March2007(b) year March2007(b)
ExecutiveDirectorsD.S.Clarke(c) 133,934 – – (80,200) 53,734 53,734 53,734L.G.Cox 15,720 9,245 (1,700) – 23,265 2,800 2,800M.R.G.Johnson 66,300 18,495 – – 84,795 36,366 36,366A.E.Moss 502,400 165,400 – (156,800) 511,000 107,468 55,200
Non-ExecutiveDirectors J.G.Allpass 1,700 – (1,700) – – – –P.M.Kirby – – – – – – –C.B.Livingstone – – – – – – –B.R.Martin(d) 1,700 – (1,000) – 700 – 700H.K.McCann 1,700 – (1,700) – – – –J.R.Niland – – – – – – –H.M.Nugent – – – – – – –
Executives J.K.Burke 242,000 65,000 (7,000) (118,665) 181,335 39,999 –M.Carapiet 297,144 143,360 (83,666) – 356,838 83,666 –A.J.Downe 292,168 85,000 (54,500) (104,333) 218,335 82,833 –P.J.Maher 121,668 30,000 (13,334) (13,334) 125,000 30,001 33,333N.R.Minogue 132,334 35,000 – (37,499) 129,835 36,333 21,500N.W.Moore 434,335 160,000 – – 594,335 134,334 134,334W.R.Sheppard 161,000 45,000 – (57,666) 148,334 57,666 –G.C.Ward 95,001 30,000 (15,924) (8,334) 100,743 30,000 5,742
Former W.J.Moss(e) 297,501 105,000 – (73,500) 329,001 73,500 –
(a)Vestedoptionssoldunderfacilityprovidedbyanexternalpartyunlessotherwisenoted.(b)Ordateofretirementifearlier.(c)MrClarkeretiredasExecutiveChairmanon3�March2007,whereupon80,200unvestedoptionslapsed. HewillcontinueasNon-ExecutiveChairman.(d)MrMartinretiredasaNon-ExecutiveDirectorofthebankon20July2006.(e)MrW.J.MossretiredfromtheExecutiveCommitteeon30March2007.
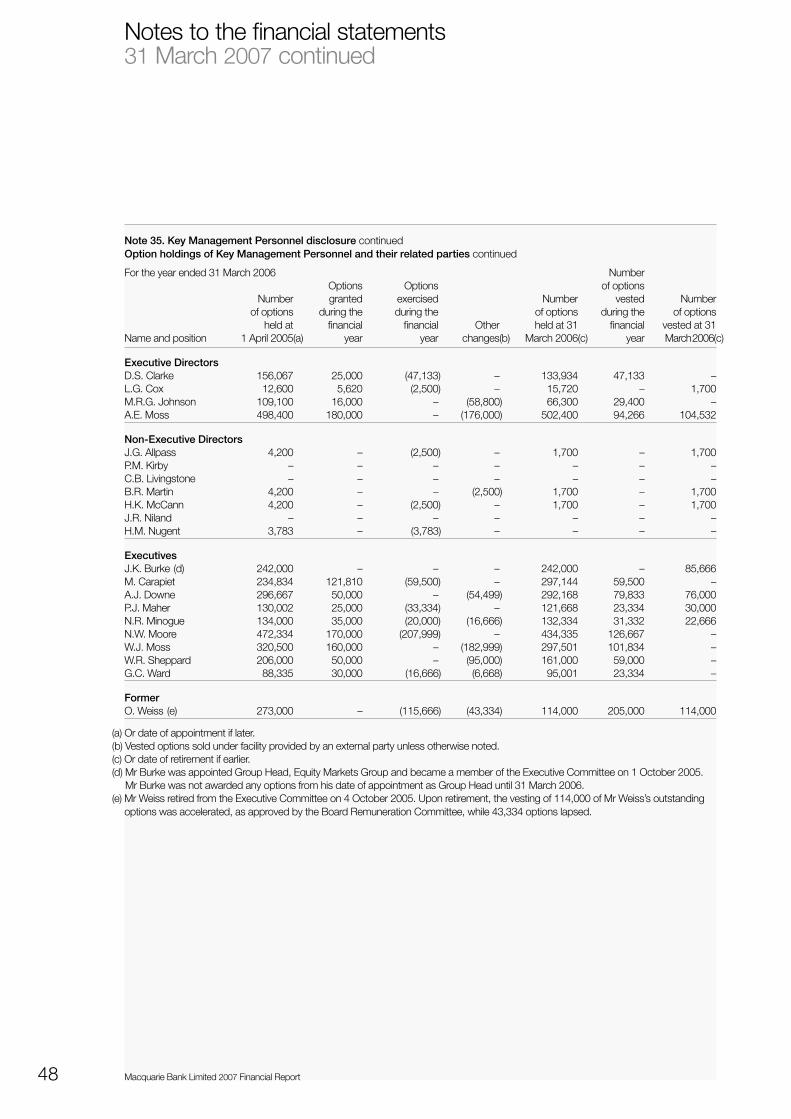
MacquarieBankLimited2007FinancialReport48
Notestothefinancialstatements3�March2007continued
Note35.KeyManagementPersonneldisclosurecontinuedOptionholdingsofKeyManagementPersonnelandtheirrelatedpartiescontinued
Fortheyearended3�March2006 Number Options Options ofoptions Number granted exercised Number vested Number ofoptions duringthe duringthe ofoptions duringthe ofoptions heldat financial financial Other heldat3� financial vestedat3�Nameandposition �April2005(a) year year changes(b) March2006(c) year March2006(c)
ExecutiveDirectorsD.S.Clarke �56,067 25,000 (47,�33) – �33,934 47,�33 –L.G.Cox �2,600 5,620 (2,500) – �5,720 – �,700M.R.G.Johnson �09,�00 �6,000 – (58,800) 66,300 29,400 –A.E.Moss 498,400 �80,000 – (�76,000) 502,400 94,266 �04,532
Non-ExecutiveDirectorsJ.G.Allpass 4,200 – (2,500) – �,700 – �,700P.M.Kirby – – – – – – –C.B.Livingstone – – – – – – –B.R.Martin 4,200 – – (2,500) �,700 – �,700H.K.McCann 4,200 – (2,500) – �,700 – �,700J.R.Niland – – – – – – –H.M.Nugent 3,783 – (3,783) – – – –
ExecutivesJ.K.Burke(d) 242,000 – – – 242,000 – 85,666M.Carapiet 234,834 �2�,8�0 (59,500) – 297,�44 59,500 –A.J.Downe 296,667 50,000 – (54,499) 292,�68 79,833 76,000P.J.Maher �30,002 25,000 (33,334) – �2�,668 23,334 30,000N.R.Minogue �34,000 35,000 (20,000) (�6,666) �32,334 3�,332 22,666N.W.Moore 472,334 �70,000 (207,999) – 434,335 �26,667 –W.J.Moss 320,500 �60,000 – (�82,999) 297,50� �0�,834 –W.R.Sheppard 206,000 50,000 – (95,000) �6�,000 59,000 –G.C.Ward 88,335 30,000 (�6,666) (6,668) 95,00� 23,334 –
FormerO.Weiss(e) 273,000 – (��5,666) (43,334) ��4,000 205,000 ��4,000
(a)Ordateofappointmentiflater.(b)Vestedoptionssoldunderfacilityprovidedbyanexternalpartyunlessotherwisenoted.(c)Ordateofretirementifearlier.(d)MrBurkewasappointedGroupHead,EquityMarketsGroupandbecameamemberoftheExecutiveCommitteeon�October2005.
MrBurkewasnotawardedanyoptionsfromhisdateofappointmentasGroupHeaduntil3�March2006.(e)MrWeissretiredfromtheExecutiveCommitteeon4October2005.Uponretirement,thevestingof��4,000ofMrWeiss’soutstanding
optionswasaccelerated,asapprovedbytheBoardRemunerationCommittee,while43,334optionslapsed.

49
Note35.KeyManagementPersonneldisclosurecontinuedShareholdingofKeyManagementPersonnelandtheirrelatedpartiesThefollowingtablessetoutdetailsoffullypaidordinarysharesoftheBankheldduringtheyearbytheKeyManagementPersonnelincludingtheirrelatedparties.
Fortheyearended31March2007
Shares Numberof issued Numberof sharesheldat onexercise Other sharesheldatNameandposition 1April2006 ofoptions changes(a) 31March2007(b)
ExecutiveDirectorsD.S.Clarke 977,248 – (326,135) 651,113L.G.Cox 268,112 1,700 – 269,812M.R.G.Johnson 353,803 – (60,000) 293,803A.E.Moss 404,336 – – 404,336
Non-ExecutiveDirectorsJ.G.Allpass 16,563 1,700 250 18,513P.M.Kirby 7,891 – 1,881 9,772C.B.Livingstone 7,336 – 214 7,550B.R.Martin(c) 8,974 1,000 146 10,120H.K.McCann 9,659 1,700 – 11,359J.R.Niland 4,109 – 1,850 5,959H.M.Nugent 19,112 – 650 19,762
ExecutivesJ.K.Burke 18,000 7,000 – 25,000M.Carapiet 345,805 83,666 96,463 525,934A.J.Downe 66,535 54,500 – 121,035P.J.Maher 46,819 13,334 – 60,153N.R.Minogue 110,811 – – 110,811N.W.Moore 835,251 – 7,862 843,113W.R.Sheppard 259,271 – – 259,271G.C.Ward 13,287 15,924 – 29,211
FormerW.J.Moss(d) 269,511 – 190 269,701
(a)Includesonmarketacquisitionsanddisposals.(b)Ordateofretirementifearlier.(c)MrMartinretiredasaNon-ExecutiveDirectoroftheBankon20July2006.(d)MrW.J.MossretiredfromtheExecutiveCommitteeon30March2007.

MacquarieBankLimited2007FinancialReport50
Notestothefinancialstatements3�March2007continued
Note35.KeyManagementPersonneldisclosurecontinuedShareholdingofKeyManagementPersonnelandtheirrelatedpartiescontinued
Fortheyearended3�March2006
Shares Numberof issued Numberof sharesheldat onexercise Other sharesheldatNameandposition �April2005(a) ofoptions changes(b) 3�March2006(c)
ExecutiveDirectorsD.S.Clarke 923,200 47,�33 6,9�5 977,248L.G.Cox 378,090 2,500 (��2,478) 268,��2M.R.G.Johnson 493,803 – (�40,000) 353,803A.E.Moss 404,436 – (�00) 404,336
Non-ExecutiveDirectorsJ.G.Allpass �3,595 2,500 468 �6,563P.M.Kirby 5,360 – 2,53� 7,89�C.B.Livingstone 6,633 – 703 7,336B.R.Martin 8,358 – 6�6 8,974H.K.McCann 6,69� 2,500 468 9,659J.R.Niland 3,64� – 468 4,�09H.M.Nugent �4,630 3,783 699 �9,��2
ExecutivesJ.K.Burke(d) �8,000 – – �8,000M.Carapiet 286,276 59,500 29 345,805A.J.Downe 66,287 – 248 66,535P.J.Maher �3,427 33,334 58 46,8�9N.R.Minogue ���,956 20,000 (2�,�45) ��0,8��N.W.Moore 627,252 207,999 – 835,25�W.J.Moss 269,35� – �60 269,5��W.R.Sheppard 259,27� – – 259,27�G.C.Ward 26,498 �6,666 (29,877) �3,287
FormerO.Weiss(e) 33,7�2 ��5,666 �0,000 �59,378
(a)Ordateofappointmentiflater.(b)Includesonmarketacquisitionsanddisposals.(c)Ordateofretirementifearlier.(d)MrBurkewasappointedGroupHead,EquityMarketsGroupandbecameamemberoftheExecutiveCommitteeon�October2005.(e)MrWeissretiredfromtheExecutiveCommitteeon4October2005.

5�
Note35.KeyManagementPersonneldisclosurecontinuedLoanstoKeyManagementPersonnelandtheirrelatedpartiesDetailsofloansprovidedbytheBanktoKeyManagementPersonnelandtheirrelatedpartiesaredisclosedinthefollowingtables:
Opening Closing balance Interest balance Numberin at1April charged(a) Write-off at31March group $’000 $’000 $’000 $’000 31March
TotalforKeyManagement 2007 76,318 5,971 – 62,101 19Personnelandtheirrelatedparties 2006 47,578 6,035 – 80,730* 22
TotalforKeyManagementPersonnel2007 57,882 4,493 – 44,891 11 2006 34,999 2,590 – 62,293* �2
*IncludesloansprovidedbytheBanktoMrWeissandhisrelatedparties.MrWeissretiredfromtheExecutiveCommitteeon4October2005.Assuch,hewasnotaKeyManagementPersonnelon�April2006andhisloanshavenotbeenincludedintheopeningbalance.
LoansandotherfinancialinstrumenttransactionsaremadebytheBankintheordinarycourseofbusinesswithrelatedparties.
CertainloansareprovidedunderzerocostcollarandshareappreciationfacilitiessecuredoverMacquarieBanksharesundernormaltermsandconditionsconsistentwithothercustomersandemployees.
PriorperiodcomparativeshavebeenrestatedtoincludeloansprovidedbymortgagesecuritisationentitiestoKeyManagementPersonnelandtheirrelatedparties.TheapplicationofAIFRShasresultedintheseentitiesbeingconsolidated.
KeyManagementPersonnelincludingtheirrelatedpartieswithloansabove$�00,000atanytimeduringthefinancialyear:
Fortheyearended31March2007 Balanceat Interest Balanceat Highestin 1April2006 charged(a) Write-off 31March2007(b) periodNameandposition $’000 $’000 $’000 $’000 $’000
ExecutiveDirectorsD.S.Clarke 48,940 3,729 – 29,937 52,658L.G.Cox 621 21 – 200 684M.R.G.Johnson 220 5 – 20 220
Executives M.Carapiet 5,183 372 – 5,286 5,298A.J.Downe 500 13 – – 500P.J.Maher 1,838 103 – 2,866 3,249N.R.Minogue 5,054 349 – 4,618 6,379N.W.Moore 6,848 908 – 12,891 12,891W.R.Sheppard 100 3 – – 100G.C.Ward 739 107 – 1,727 1,727
Former W.J.Moss(c) 6,275 361 – 4,556 7,933
(a)AllloansprovidedbytheBanktoDirectorsandExecutivesaremadeintheordinarycourseofbusinessonanarms-lengthbasisandareenteredintoundernormaltermsandconditionsconsistentwithothercustomersandemployees.Therehavebeennowrite-downsorallowancesfordoubtfuldebts.
(b)Ordateorretirementifearlier.(c)MrW.J.MossretiredfromtheExecutiveCommitteeon30March2007.

MacquarieBankLimited2007FinancialReport52
Notestothefinancialstatements3�March2007continued
Note35.KeyManagementPersonneldisclosurecontinuedLoanstoKeyManagementPersonnelandtheirrelatedpartiescontinued
Fortheyearended3�March2006 Balanceat Interest Balanceat Highestin �April2005 charged(a) Write-off 3�March2006(b) periodNameandposition $’000 $’000 $’000 $’000 $’000
ExecutiveDirectorsD.S.Clarke 3�,304 4,276 – 48,940 50,505L.G.Cox 636 52 – 62� 636M.R.G.Johnson 2,870 9� – 220 2,870
Executives M.Carapiet 7� 363 – 5,�83 8,025A.J.Downe 500 6� – 500 500P.J.Maher 530 96 – �,838 �,859N.R.Minogue 4,592 382 – 5,054 5,64�N.W.Moore – 49 – 6,848 6,848W.J.Moss 5,674 472 – 6,275 6,620W.R.Sheppard �00 �� – �00 �00G.C.Ward 80� 86 – 739 �,002
Former O.Weiss(c) 500 96 – 4,4�2 4,4�2
OthertransactionsandbalancesofKeyManagementPersonnelandtheirrelatedpartiesThefollowingKeyManagementPersonnelhaveacquiredInfrastructureBondsandsimilarproductsfromcontrolledentitieswithintheBankwhichhavebeenfinancedwithlimitedrecourseloansandaresubjecttoforwardsaleagreements.Theloanrepaymentsandproceedsarisingfromtheforwardsaleagreementsaresubjecttolegalrightofset-offandassucharenotrecognisedforfinancialreportingpurposes.TheonlyamountsrecognisedbytheeconomicentityinrespectofthesetransactionsaretheannualpaymentsfromtherelevantKeyManagementPersonnelwhicharebroughttoaccountasfeerevenue.Thesetransactionshavebeenundertakenontermsandconditionsconsistentwithothercustomersandemployees.
Consolidated Consolidated 2007 2006 $’000 $’000
TotalannualcontributionsfromKeyManagementPersonnelandtheirrelatedpartiesinrespectofInfrastructureBondsandsimilarproducts 16,817 �6,280
TheannualcontributionsinrespectofInfrastructureBondsandsimilarproductsrelatetothefollowingKeyManagementPersonnel:
ExecutiveDirectorsD.S.Clarke,L.G.Cox,M.R.G.Johnson
Non-ExecutiveDirectorsP.M.Kirby
ExecutivesJ.K.Burke,M.Carapiet,A.J.Downe,P.J.Maher,N.R.Minogue,N.W.Moore,W.R.Sheppard,G.CWard
FormerW.J.Moss,O.Weiss
(a)AllloansprovidedbytheBanktoDirectorsandExecutivesaremadeintheordinarycourseofbusinessonanarms-lengthbasisandareenteredintoundernormaltermsandconditionsconsistentwithothercustomersandemployees.Therehavebeennowrite-downsorallowancesfordoubtfuldebts.
(b)Ordateofretirementifearlier.(c)MrWeissretiredfromtheExecutiveCommitteeon4October2005.
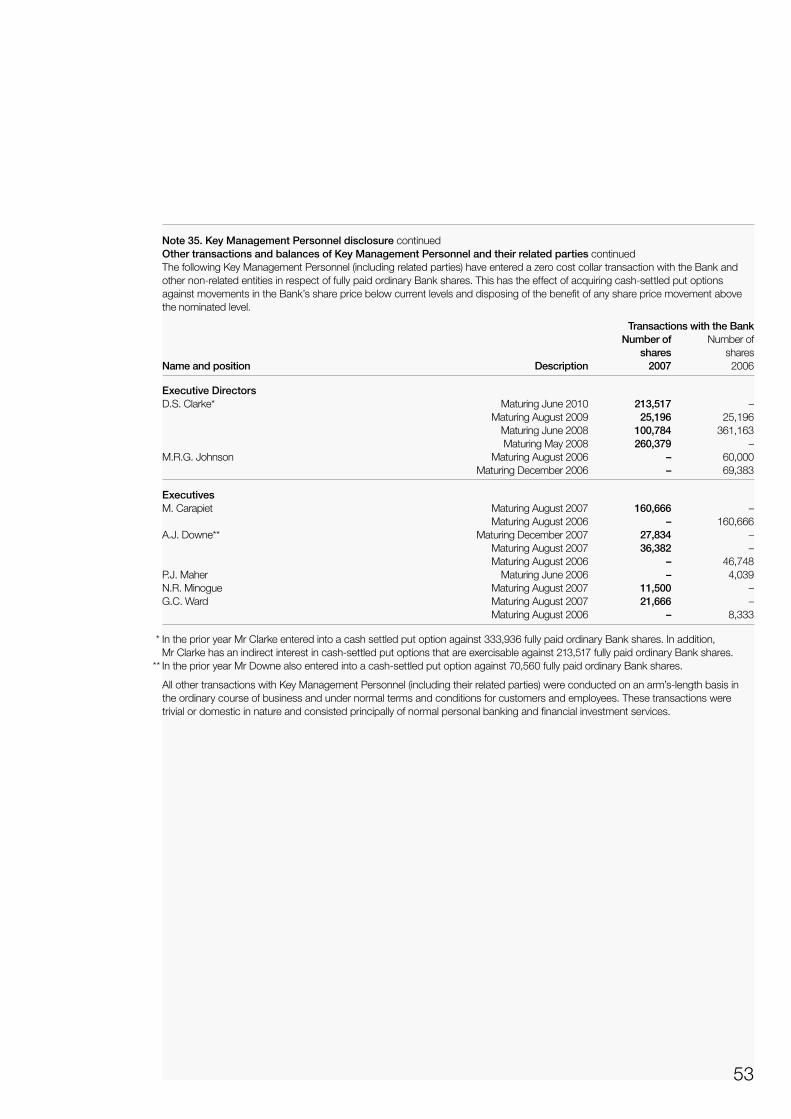
53
Note35.KeyManagementPersonneldisclosurecontinuedOthertransactionsandbalancesofKeyManagementPersonnelandtheirrelatedpartiescontinuedThefollowingKeyManagementPersonnel(includingrelatedparties)haveenteredazerocostcollartransactionwiththeBankandothernon-relatedentitiesinrespectoffullypaidordinaryBankshares.Thishastheeffectofacquiringcash-settledputoptionsagainstmovementsintheBank’ssharepricebelowcurrentlevelsanddisposingofthebenefitofanysharepricemovementabovethenominatedlevel.
TransactionswiththeBank Numberof Numberof shares sharesNameandposition Description 2007 2006
ExecutiveDirectorsD.S.Clarke* MaturingJune20�0 213,517 – MaturingAugust2009 25,196 25,�96 MaturingJune2008 100,784 36�,�63 MaturingMay2008 260,379 –M.R.G.Johnson MaturingAugust2006 – 60,000 MaturingDecember2006 – 69,383
ExecutivesM.Carapiet MaturingAugust2007 160,666 – MaturingAugust2006 – �60,666A.J.Downe** MaturingDecember2007 27,834 – MaturingAugust2007 36,382 – MaturingAugust2006 – 46,748P.J.Maher MaturingJune2006 – 4,039N.R.Minogue MaturingAugust2007 11,500 –G.C.Ward MaturingAugust2007 21,666 – MaturingAugust2006 – 8,333
*IntheprioryearMrClarkeenteredintoacashsettledputoptionagainst333,936fullypaidordinaryBankshares.Inaddition,MrClarkehasanindirectinterestincash-settledputoptionsthatareexercisableagainst2�3,5�7fullypaidordinaryBankshares.
**IntheprioryearMrDownealsoenteredintoacash-settledputoptionagainst70,560fullypaidordinaryBankshares.
AllothertransactionswithKeyManagementPersonnel(includingtheirrelatedparties)wereconductedonanarm’s-lengthbasisintheordinarycourseofbusinessandundernormaltermsandconditionsforcustomersandemployees.Thesetransactionsweretrivialordomesticinnatureandconsistedprincipallyofnormalpersonalbankingandfinancialinvestmentservices.

MacquarieBankLimited2007FinancialReport54
Notestothefinancialstatements3�March2007continued
Note36.EmployeeequityparticipationOptionPlanInNovember�995,theBankintroducedanEmployeeOptionPlan(the“Plan”),asareplacementfortheBank’snowclosedpartlypaidsharescheme.StaffeligibletoparticipatearethoseofAssociateDirectorlevelandaboveandconsultantstotheeconomicentity.At3�March2007therewere2,099(2006:�,825)participantsinthePlan.
Options,currentlyforfiveyears,overfullypaidunissuedordinarysharesintheBankaregrantedtoBondStreetCustodiansLimitedasnomineefortheindividualortheindividual’scontrolledcompanyoranentityapprovedunderthePlantoholdoptions.
Theoptionsareissuedfornoconsiderationandaregrantedatprevailingmarketprices.Priorto2�November2003,theexercisepriceofnewoptionsgrantedwasgenerallybasedontheweightedaveragemarketpriceduringthemonthpriortoacceptanceofemploymentfornewemployeesorduringthecalendarmonthofJuneinrespectofoptionsgrantedasaresultofannualpromotionsandcompensationreviews.From2�November2003until25November2004,theexercisepriceofnewoptionsgrantedwasgenerallybasedontheweightedaveragemarketpriceduringtheoneweekperiodpriortothedateofgrantoftheoptions.From26November2004,theexercisepriceofnewoptionsgrantedisgenerallybasedontheweightedaveragemarketpriceduringtheoneweekuptoandincludingthedateofgrantoftheoptions.
ThefollowingisasummaryofoptionswhichhavebeengrantedpursuanttothePlan:
Weighted Weighted average average exercise exercise Numberof price Numberof price options 2007 options 2006 2007 $ 2006 $
Outstandingatthebeginningofthefinancialyear 31,235,034 42.45 28,292,709 3�.63Grantedduringthefinancialyear 11,987,127 62.88 �0,766,858 62.93Forfeitedduringthefinancialyear (1,326,952) 50.30 (6�7,590) 39.�5Exercisedduringthefinancialyear (7,536,936) 31.72 (7,206,943) 30.85
Outstandingattheendofthefinancialyear 34,358,273 51.63 3�,235,034 42.45
Exercisableattheendofthefinancialyear 4,478,569 31.24 6,995,9�6 30.72
Foroptionsexercisedduringthefinancialyeartheweightedaveragesharepriceatthedateofexercisewas$67.09(2006:$62.�4).
Therangeofexercisepricesforoptionsoutstandingattheendoftheyearwas$20.57to$83.55(2006:$20.44to$70.60).
Theweightedaverageremainingcontractuallifefortheshareoptionsoutstandingasat3�March2007is3.�6years(2006:3.�8years).Theweightedaverageremainingcontractuallifewhenanalysedbyexercisepricerangeis:
Numberof Numberof options Years options YearsExercisepricerange($) 2007 2007 2006 2006
20–30 3,848,229 1.42 5,896,002 2.4030–40 8,243,550 2.05 �4,�44,034 2.5940–50 750,989 2.90 896,400 3.8950–60 97,500 3.21 97,500 4.2�60–70 20,534,415 3.89 9,98�,098 4.3670–80 687,590 4.36 220,000 4.6780–90 196,000 4.94 – –
34,358,273 3.16 3�,235,034 3.�8
Theweightedaveragefairvalueofoptionsgrantedduringthefinancialyearwas$�2.45(2006:$�0.45).

55
Note36.EmployeeequityparticipationcontinuedOptionPlancontinuedThemarketvalueofsharesissuedduringtheyearasaresultoftheexerciseoftheseoptionswas$506million(2006:$448million).
Themarketvalueofshareswhichwouldbeissuedfromtheexerciseoftheoutstandingoptionsat3�March2007was$2,843million(2006:$2,020million).Nounissuedshares,otherthanthosereferredtoabove,areunderoptionasatthedateofthisreport.
Optionsgrantedsincethe�997annualpromotionandcompensationreviewsvestastoonethirdofeachtrancheafterthesecond,thirdandfourthanniversariesofthedateofcommencementofemploymentfornewstartersand,forexistingemployees,on�Julytwo,threeandfouryearsaftertheallocationoftheoptions.Subjecttostafftradingrules,optionscanbeexercisedafterthevestingperiodatanytimeuptoexpiry.Inindividualcases,suchaswhereanemployeeleaveswiththeBank’sagreementtowardstheendofavestingperiod,theBank’sExecutiveCommitteehasthepowertowaivetheremainderofanyvestingperiodandallowexerciseofsomeoralloftherelevantoptions.
InrespectofeachtrancheofvestedoptionsgrantedtoExecutiveDirectorsoftheBankafterthe�997AnnualGeneralMeetinguntilthe2002promotionandcompensationreviewgrants:
–onethirdofthevestedoptionsmayonlybeexercisediftheBank’saverageannualReturnonEquityforthethreepreviousfinancialyearsisatorabovethe55thpercentileofthecorrespondingfiguresforallcompaniesinthethenASXAllIndustrialsIndex;
–anotherthirdofthevestedoptionsmayonlybeexercisediftheBank’saverageannualReturnonEquityforthethreepreviousfinancialyearsisatorabovethe65thpercentileofthecorrespondingfiguresforallcompaniesinthethenASXAllIndustrialsIndex;and
–thefinalthirdofthevestedoptionsmayonlybeexercisediftheBank’saverageannualReturnonEquityforthethreepreviousfinancialyearsisatorabovethe75thpercentileofthecorrespondingfiguresforallcompaniesinthethenASXAllIndustrialsIndex,withtheconditionstobeexaminedquarterlyfromvestinguntilexpiryoftheoptions.Optionswhichhavevestedbutarenotabletobeexercisedataparticularexaminationdate,willbeexercisable(untilexpiry)atorafterfuturequarterlyexaminationdateswhenandiftheexerciseconditionspertainingtoanyofthosedateshavebeenmet.
FollowingcessationofpublicationoftheASXAllIndustrialsIndexinmid-2002,theBoardexerciseditsauthoritytoresolvethatwhethertheexerciseconditionsaremetfromthatpointonistobedeterminedbyhavingregardtotheactualperformanceoftheBankbyusingtheformulasetoutintheexerciseconditionsbutwiththewords“AllOrdinariesIndexexcludingcompaniesintheGICSLevel2‘Energy’andGICSLevel3
‘MetalsandMining’classifications”replacing“ASXAllIndustrialsIndex”andusing“ReturnonOrdinaryEquity”insteadof“ReturnonEquity”.
Inrespectofoptionsgrantedfrommid-2002to25November2004,inrespectofeachtrancheofvestedoptionsgrantedtomembersoftheBank’sExecutiveCommittee,ExecutiveVotingDirectorsandotherExecutiveDirectorsoftheBank,optionsareonlyexercisableiftheBank’saverageannualreturnonordinaryequityforthethreepreviousfinancialyearsisatorabovethe65th(ExecutiveCommitteeandExecutiveVotingDirectors)and50th(otherExecutiveDirectors)percentiles,ofthecorrespondingfiguresforallcompaniesinthethenS&P/ASX300IndustrialsIndex,withtheconditionsexaminedquarterlyfromvestinguntilexpiry.
Foroptionsgrantedfrom26November2004onwards,wheretheinvitationtoapplyfortheoptionswassenttotheExecutivebefore30June2006,inrespectofeachtrancheofvestedoptionsgrantedtomembersoftheBank’sExecutiveCommittee,ExecutiveVotingDirectorsandotherExecutiveDirectorsoftheBank,optionsareonlyexercisableiftheBank’saverageannualreturnonordinaryequityforthethreepreviousfinancialyearsisabovethe65th(ExecutiveCommitteeandExecutiveVotingDirectors)and50th(otherExecutiveDirectors)percentiles,ofthecorrespondingfiguresforallcompaniesinthethenS&P/ASX300IndustrialsIndex,withtheconditionsexaminedquarterlyfromvestinguntilexpiry.
ForoptionsgrantedtothemembersoftheBank’sExecutiveCommittee,ExecutiveVotingDirectorsandotherExecutiveDirectorsoftheBankwheretheinvitationtoapplyfortheoptionswassenttotheExecutiveonorafter30June2006,inrespectofeachtrancheofvestedoptions,optionswillonlybeexercisableiftheBank’saverageannualreturnonordinaryequityforthethreepreviousfinancialyearsisabovethe65th(ExecutiveCommitteeandExecutiveVotingDirectors)and50th(otherExecutiveDirectors)percentiles,ofthecorrespondingfiguresforallcompaniesinthethenS&P/ASX�00Index,withtheconditionstobeexaminedonlyuponvesting.
ThePlanRulesprovidethatthetotalnumberofoptionswhichcanbeonissueatanyonetimeislimitedsuchthatthenumberofsharesresultingfromexerciseofallunexercisedoptionsdoesnotexceed20%ofthenumberoftheBank’sthenissuedordinarysharesplusthenumberofshareswhichtheBankwouldhavetoissueifallrightstorequiretheBanktoissueshares,whichtheBankhasthengranted(includingoptions)werethenenforcedorexercisedtothegreatestextentpermitted.TheBoardhasasecondlimitationonthenumberofoptionsbeingeffectivelythesamecalculationasinthePlanRulesexceptthatanyexercisedoptionsgrantedlessthanfiveyearsago,wheretheExecutiveisstillwiththeBank,willbetreatedasstillbeingunexercised.
Fullypaidordinarysharesissuedontheexerciseofoptionsrankparipassuwithallotherfullypaidordinarysharesthenonissue.
On25May2000,theBoardapprovedamendmentstothePlanRulesreferredtoastheDeferredExerciseShareOptionPlan(“DESOP”).SharesresultingfromtheexerciseofoptionssincethenhavebeenplacedundertheDESOP,unlessoptionholdersrequestotherwise.UnlesstheBankisawareofcircumstanceswhich,inthereasonableopinionoftheBank,indicatethattherelevantExecutivemayhaveactedfraudulently,dishonestlyorinamannerwhichisinbreachofhis/herobligationstotheBankoranyassociatedentity,thensucharequestwillbegranted.

MacquarieBankLimited2007FinancialReport56
Notestothefinancialstatements3�March2007continued
SharesacquiredunderDESOPcannotbesold,transferredordisposedofforaperiodofsixmonthsfromthedatethatthesharesaretransferredintoaparticipatingemployee’snameandarealsosubjecttoforfeiturebyanemployeeinanumberofcircumstancesincludingtheft,fraud,dishonesty,ordefalcationinrelationtoaffairsoftheBankorarelatedentityoriftheycarryoutorfailtocarryoutanactwhichbringstheBankoranassociatedentityintodisrepute.
SharesheldintheDESOPwillbewithdrawnontheearlierof:
–anemployee’sresignationfromtheBankorarelatedcompany;
–uponrequestfromtheemployee(aftertheexpirationofthenon-disposalperiod);and
–tenyearsfromthedatethattheoptionswereoriginallygranted.
Optionscarrynodividendorvotingrightsbuthavestandardadjustmentclausesforbonusandrightsissuesandreconstructions.
EmployeeSharePlanFollowingshareholderapprovalatthe�997AnnualGeneralMeeting,theBankintroducedtheMacquarieBankEmployeeSharePlan(“ESP”)wherebyeachfinancialyear,eligibleemployeesareofferedupto$�,000worthoffullypaidordinaryBanksharesfornocashpayment.TheBank’sstaffprofitsharingpoolsandforcertainstaff,futurecommissions,areadjusteddownwardsbytheaggregatemarketvalueofthesharesissuedundertheESP.
SharesissuedundertheESPcannotbesolduntiltheearlierofthreeyearsafterissueorthetimewhentheparticipantisnolongeremployedbytheBankorasubsidiaryoftheBank.Inallotherrespects,sharesissuedrankequallywithallotherfullypaidordinarysharesthenonissue.
Thenumberofshareseachparticipantreceivesis$�,000dividedbytheweightedaveragepriceatwhichtheBank’ssharesaretradedonAustralianStockExchangeLimitedonthesevendaysuptoandincludingthedateofallotment,roundeddowntothenearestwholeshare.
TheemployeeswhoareeligibleforanofferarethosepermanentemployeeswhohavebeencontinuouslyemployedbytheBankorasubsidiaryoftheBanksince�Apriloftherelevantyear,arestillemployedbytheBankorasubsidiaryoftheBankontherelevantallotmentdateandareAustralianresidentsonboththeclosingdateofanofferandontherelevantallotmentdate.Personswhoareineligibleincludeallnon-permanentstaff,staffsecondedtotheBankfromexternalcompanies,staffleavingAustraliaforanoverseaspostingpriortotheallotmentdate,staffwhohavebeengivennoticeofdismissalfromemploymentbytheBankorsubsidiaryoftheBankorwhohavetenderedtheirresignationtoavoidsuchadismissal(eveniftheywould,butforthisrequirement,beeligibletoacquireshares)andanystaffmemberthataGroupHeadbelievesshouldbeineligiblebasedonpoorperformance.
ThelatestofferundertheESPwasmadeduringDecember2006.Atotalof�,664(2006:�,437)staffparticipatedinthisoffer.On�2January2007,theparticipantswereeachissuedwith�3(2006:�4)fullypaidordinarysharesbasedontheofferamountof$�,000andthethencalculatedaveragemarketsharepriceof$76.82(2006:$68.30),atotalof2�,632(2006:20,��8)shareswereissued.Theshareswereissuedfornocashconsideration.
StaffShareAcquisitionPlanFollowingshareholderapprovalatthe�999AnnualGeneralMeeting,theBankintroducedtheMacquarieBankStaffShareAcquisitionPlan(“MBSSAP”)wherebyeachfinancialyear,Australianbasedeligibleemployeesaregiventheopportunitytonominateanamountoftheirpre-taxavailableprofitshareorfuturecommissiontopurchasefullypaidordinaryBankshares(“Shares”).ThetotalnumberofSharespurchasedundertheMBSSAPislimitedinanyfinancialyeartothreepercentoftheBank’sSharesasatthebeginningofthatfinancialyear.
Sharesareacquiredatprevailingmarketprices.Anyapplicablebrokerageexpenses,workers’compensationpremiumsandpayrolltaxareappliedtotheemployee’saccount.
SharesacquiredundertheMBSSAPcannotbesold,transferredordisposedofforaperiodofsixmonthsfromthedatethattheSharesaretransferredintoaparticipatingemployee’snameexceptinspecialcircumstancesiftheemployeeresigns.TheSharesheldintheMBSSAParealsosubjecttoforfeiturebyanemployeeinanumberofcircumstancesincludingtheft,fraud,dishonesty,ordefalcationinrelationtotheaffairsoftheBankorarelatedcompanyoriftheycarryoutanactorfailtodoanactwhichbringstheBankorarelatedcompanyintodisrepute.
SharesheldintheMBSSAPwillbewithdrawnontheearlierof:
–anemployee’sresignationfromtheBankorarelatedentity;–uponrequestbytheemployee(aftertheexpirationofthenon-
disposalperiod);and–tenyearsfromthedatethattheSharesareregisteredinan
employee’sname.
Inallotherrespects,sharesrankequallywithallotherfullypaidordinarysharesthenonissue.
EligibleemployeesareAustralian-basedpermanentfull-timeorpart-timeemployeesoftheBankorarelatedcompanywhoeitherreceiveavailableprofitshareintherelevantyearofatleast$�,000intotalorallocateatleast$�,000inavailablecommissiontowardstheMBSSAP.
TheMacquarieBankExecutiveDirectorShareAcquisitionPlan(“MBEDSAP”)isasubplanoftheMBSSAPwhichwascreatedin2003andwasopentoeligibleExecutiveDirectors.ThedisposalandforfeiturerestrictionsintheMBEDSAPdiffertothoseintheMBSSAP.NofurtheroffersundertheMBEDSAParecurrentlyproposed.
OffersundertheMBSSAPweremadeduringMay2006.Atotalof553(2006:368)staffparticipatedintheMBSSAP.InJulyandDecember2006,atotalof285,268(2006:�54,243)shareswereacquiredon-market.NostaffparticipatedintheMBEDSAP.
Note36.EmployeeequityparticipationcontinuedOptionPlancontinued

57
Non-ExecutiveDirectorShareAcquisitionPlanFollowingshareholderapprovalatthe�999AnnualGeneralMeeting,theBankalsointroducedtheMacquarieBankNon-ExecutiveDirectorShareAcquisitionPlan(“NEDSAP”)wherebyeachfinancialyearAustralianbasedNon-ExecutiveDirectors(“NEDs”)oftheMacquarieBankGroupofcompaniesaregiventheopportunitytocontributesomeoralloftheirfuturepre-taxremunerationfromtheMacquarieBankGrouptoacquireMacquarieBankLimitedshares(“shares”).NEDsmaysubsequentlyapplytoreducetheirpreviousallocationsprovidedthattherelevantbuyingperiodhasnotcommenced.IfNEDswishtoparticipatethereisaminimumcontributionof$�,000ofNEDremunerationperbuyingperiodtogotowardstheNEDSAP.
Sharesareacquiredatprevailingmarketprices.BrokeragefeesareappliedtotheNED’saccount.
SharesacquiredundertheNEDSAPcannotbesold,transferredordisposedofforaperiodofsixmonthsfromthedatethattheSharesaretransferredintoaNED’snameexceptinspecialcircumstancesiftheNEDresigns.ThesharesheldintheNEDSAParealsosubjecttoforfeiturebyaNEDinanumberofcircumstancesincludingtheft,fraud,dishonesty,ordefalcationinrelationtotheaffairsoftheBankorarelatedcompanyoriftheycarryoutanactorfailtodoanactwhichbringstheBankorarelatedcompanyintodisrepute.
SharesheldintheNEDSAPwillbewithdrawnontheearlierof:
–theparticipantceasestobeaNEDofMBL;–uponrequestbytheNED(aftertheexpirationofthenon-disposalperiod);and–tenyearsfromthedatethatthesharesareregisteredinaNED’sname.
Inallotherrespects,sharesrankequallywithallotherfullypaidordinarysharesthenonissue.
SharesresultingfromparticipationintheNEDSAPmaycounttowardsmeetingtheminimumshareholdingrequirementsofNEDs.
OffersundertheNEDSAPweremadeduringMay2006.Atotalof4(2006:7)NEDsparticipatedintheNEDSAP.InJulyandDecember2006,atotalof2,74�(2006:5,953)shareswereacquiredon-market.
Consolidated Consolidated Bank Bank 2007 2006 2007 2006 $m $m $m $m
Note37.ContingentliabilitiesandassetsThefollowingdetailsofcontingentliabilitiesandassetsexcludederivatives.
Contingentliabilitiesexistinrespectof:Guarantees 321 364 2,316 �,226Indemnities 25 64 28 237Undrawncreditfacilities 6,576 3,926 5,546 3,8�7Undrawncreditfacilities–revocableatanytime 3,938 2,979 3,938 2,979Othercontingentliabilities(a) 1,139 �,509 1,189 827
Totalcontingentliabilities 11,999 8,842 13,017 9,086
Contingentliabilitiesexistinrespectofclaimsandpotentialclaimsagainstentitiesintheeconomicentity.Wherenecessary,appropriateprovisionshavebeenmadeinthefinancialstatements.TheBankandeconomicentitydoesnotconsiderthattheoutcomeofanysuchclaimsknowntoexistatthedateofthisreport,eitherindividuallyorinaggregate,arelikelytohaveamaterialeffectonitsoperationsorfinancialposition.
Ofthetotalcontingentliabilitiesabove,$�0.5billion(2006:$6.9billion)alsorepresentcontingentassets.Suchcommitmentstoprovidecreditmayinthenormalcourseconverttoloansandotherassets.
Note38.CapitalandotherexpenditurecommitmentsNotlaterthanoneyear 30 88 30 28Laterthanoneyearandnotlaterthanfiveyears 23 23 23 23Laterthanfiveyears – – – –
Totalcapitalandotherexpenditurecommitments 53 ��� 53 5�
(a)Othercontingentliabilitiesincludelettersofcredit,commitmentscertainofdrawdownandperformancerelatedcontingents.Alsoincludedareforwardassetpurchaseswherebytheeconomicentityhasenteredintoconditionalagreementstoacquireassetsandoperatingbusinesseswiththeintentionofsubsequentdisposal.Theseassetsandbusinesseswillberecognisedwhencontrolpassestotheeconomicentity.Thetotalcommitmentat3�March2007was$�,��5million(2006:$�,466million).

MacquarieBankLimited2007FinancialReport58
Notestothefinancialstatements3�March2007continued
Consolidated Consolidated Bank Bank 2007 2006 2007 2006 $m $m $m $m
Note39.LeasecommitmentsNon-cancellableoperatingleasesexpiring:Notlaterthanoneyear 145 �27 109 �27Laterthanoneyearandnotlaterthanfiveyears 474 43� 387 43�Laterthanfiveyears 216 29� 172 29�
Totaloperatingleasecommitments 835 849 668 849
OperatingleasesrelatetocommercialbuildingsandmotorvehiclesleasedbytheBank’sstaff.Thefutureleasecommitmentsdisclosedarenetofanyrentalincentivesreceivedandsub-leaseincomeearned.
Note40.DerivativefinancialinstrumentsObjectivesofholdingandissuingderivativefinancialinstrumentsTheeconomicentityisanactivepricemakerinderivativesoninterestrates,foreignexchange,commoditiesandequities.Itsobjectiveistoearnprofitsfromthepricemakingspreadandfrommanagingtheresidualexposuresonhedgedpositions.ProprietarypositiontakingisasmallpartoftheBank’stradingactivities.Risksonderivativesaremanagedtogetherwithallothertradingpositionsinthesamemarket.Alltradingpositions,includingderivatives,aremarkedtofairvaluedaily.
Theeconomicentityalsousesderivativestohedgebankingoperationsandforasset/liabilitymanagement.Certainderivativetransactionsmayqualifyascashflow,fairvalueornetinvestmentinforeignoperationshedges,iftheymeettheappropriatestricthedgecriteriaoutlinedinnote�(ix):
Cashflowhedges Theeconomicentityisexposedtovolatilityinfutureinterestcashflowsarisingfromtheconsolidatedmortgagesecuritisationvehiclesandotherstructuredproductswhicharesubjecttovariableinterestrates.Theaggregateprincipalbalancesandinterestcashflowsacrossalltheseportfoliosformthebasisforidentifyingthenon-tradinginterestrateriskoftheeconomicentity,whichishedgedwithinterestrateswaps.
Inadditiontothis,theinterestrateswapsusedtohedgetheMIPSsecuritieshavebeendesignatedascashflowhedgesofanintercompanyloanbytheBankinitsseparatefinancialstatements.Changesinthefairvalueoftheseinterestswapsaredeferredinequityandsubsequentlyreleasedtoearningsastheinterestontheintercompanyloanisaccrued.At3�March2007,thefairvalueofoutstandingderivativesheldbytheBankanddesignatedascashflowhedgeswas$95millionpositivevalue(2006:$37millionpositivevalue).
In2007,theeconomicentityrecognisedalossof$3million(2006:$3millionloss)intheincomestatementduetohedgeineffectiveness.At3�March2007,thefairvalueofoutstandingderivativesheldbytheeconomicentityanddesignatedascashflowhedgeswas$�8�millionnegativevalue(2006:$84millionnegativevalue).
Fairvaluehedges Theeconomicentity’sfairvaluehedgesprincipallyconsistofforeignexchangeforwardcontractsusedtoprotectagainstchangesinthefairvalueofforeigndenominatedequityinstrumentsduetomovementsinmarketforeignexchangerates.
Asat3�March2007,thefairvalueofoutstandingderivativesheldbytheeconomicentityanddesignatedasfairvaluehedgeswas$�0millionpositivevalue(2006:$8millionnegativevalue).
Netinvestmentinforeignoperationshedges Theeconomicentityhasappliednetinvestmenthedgingforforeignexchangeriskarisingfromforeignoperations.
At3�March2007,thefairvalueofoutstandingderivativesheldbytheeconomicentityanddesignatedasnetinvestmentinforeignoperationshedgeswas$�08millionpositivevalue(2006:$54millionpositivevalue).
Thetypesofcontractswhichtheeconomicentitytradesandusesforhedgingpurposesaredetailedbelow:
Futures:Futurescontractsprovidetheholderwiththeobligationtobuyaspecifiedfinancialinstrumentorcommodityatafixedpriceandfixeddateinthefuture.Contractsmaybeclosedearlyviacashsettlement.Futurescontractsareexchangetraded.
Forwards and forward rate agreements:Forwardcontracts,whichresemblefuturescontracts,areanagreementbetweentwopartiesthatafinancialinstrumentorcommoditywillbetradedatafixedpriceandfixeddateinthefuture.Aforwardrateagreementprovidesfortwopartiestoexchangeinterestratedifferentialsbasedonanunderlyingprincipalamountatafixeddateinthefuture.
Swaps:Swaptransactionsprovidefortwopartiestoswapaseriesofcashflowsinrelationtoanunderlyingprincipalamount,usuallytoexchangeafixedinterestrateforafloatinginterestrate.Cross-currencyswapsprovideatoolfortwopartiestomanageriskarisingfrommovementsinexchangerates.
Options:Optioncontractsprovidetheholdertherighttobuyorsellfinancialinstrumentsorcommoditiesatafixedpriceoveranagreedperiodoronafixeddate.Thecontractdoesnotobligetheholdertobuyorsell,howeverthewritermustperformiftheholderexercisestherightspertainingtotheoption.
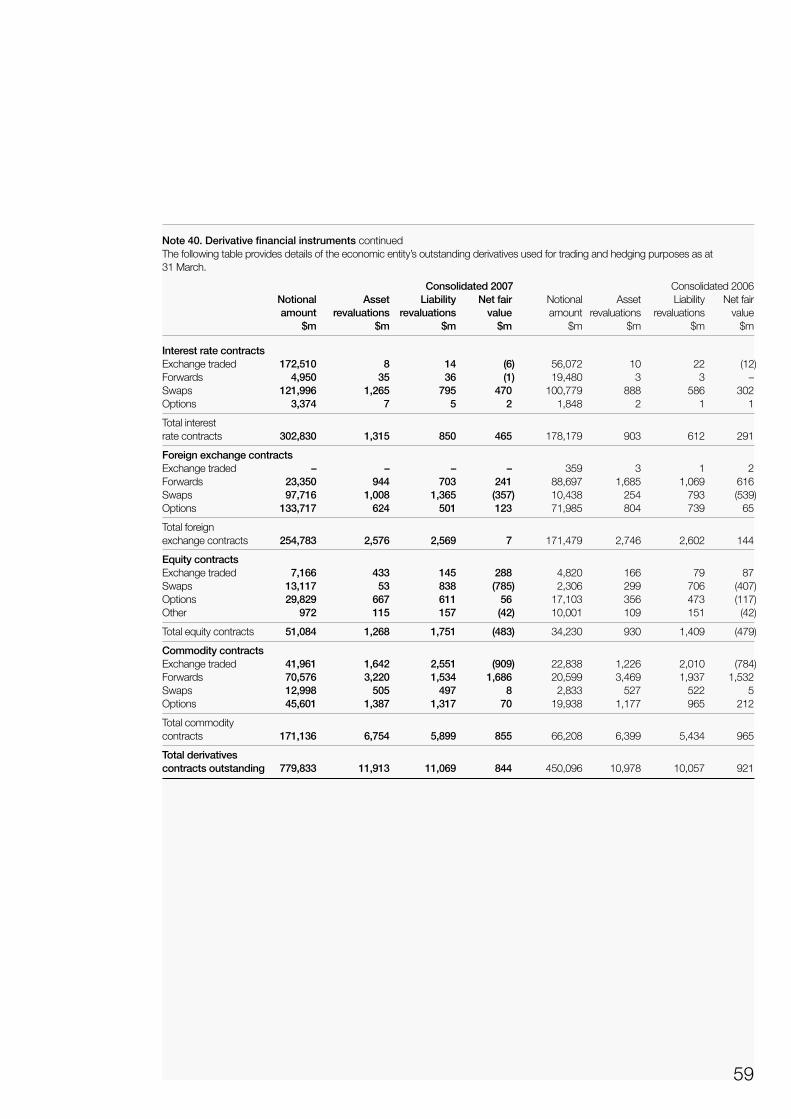
59
Note40.DerivativefinancialinstrumentscontinuedThefollowingtableprovidesdetailsoftheeconomicentity’soutstandingderivativesusedfortradingandhedgingpurposesasat3�March.
Consolidated2007 Consolidated2006 Notional Asset Liability Netfair Notional Asset Liability Netfair amount revaluations revaluations value amount revaluations revaluations value $m $m $m $m $m $m $m $m
InterestratecontractsExchangetraded 172,510 8 14 (6) 56,072 �0 22 (�2)Forwards 4,950 35 36 (1) �9,480 3 3 –Swaps 121,996 1,265 795 470 �00,779 888 586 302Options 3,374 7 5 2 �,848 2 � �
Totalinterestratecontracts 302,830 1,315 850 465 �78,�79 903 6�2 29�
ForeignexchangecontractsExchangetraded – – – – 359 3 � 2Forwards 23,350 944 703 241 88,697 �,685 �,069 6�6Swaps 97,716 1,008 1,365 (357) �0,438 254 793 (539)Options 133,717 624 501 123 7�,985 804 739 65
Totalforeignexchangecontracts 254,783 2,576 2,569 7 �7�,479 2,746 2,602 �44
EquitycontractsExchangetraded 7,166 433 145 288 4,820 �66 79 87Swaps 13,117 53 838 (785) 2,306 299 706 (407)Options 29,829 667 611 56 �7,�03 356 473 (��7)Other 972 115 157 (42) �0,00� �09 �5� (42)
Totalequitycontracts 51,084 1,268 1,751 (483) 34,230 930 �,409 (479)
CommoditycontractsExchangetraded 41,961 1,642 2,551 (909) 22,838 �,226 2,0�0 (784)Forwards 70,576 3,220 1,534 1,686 20,599 3,469 �,937 �,532Swaps 12,998 505 497 8 2,833 527 522 5Options 45,601 1,387 1,317 70 �9,938 �,�77 965 2�2
Totalcommoditycontracts 171,136 6,754 5,899 855 66,208 6,399 5,434 965
Totalderivativescontractsoutstanding 779,833 11,913 11,069 844 450,096 �0,978 �0,057 92�

MacquarieBankLimited2007FinancialReport60
Notestothefinancialstatements3�March2007continued
Note40.DerivativefinancialinstrumentscontinuedThefollowingtableprovidesdetailsoftheBank’soutstandingderivativesusedfortradingandhedgingpurposesasat3�March.
Bank2007 Bank2006 Notional Asset Liability Netfair Notional Asset Liability Netfair amount revaluations revaluations value amount revaluations revaluations value $m $m $m $m $m $m $m $m
InterestratecontractsExchangetraded 170,133 9 16 (7) 56,072 �0 22 (�2)Forwards 2,829 32 33 (1) �9,449 3 3 –Swaps 107,433 1,179 741 438 83,803 872 570 302Options 1,953 7 5 2 �,848 2 � �
Totalinterestratecontracts 282,348 1,227 795 432 �6�,�72 887 596 29�
ForeignexchangecontractsExchangetraded – – – – 359 – – –Forwards 23,350 944 703 241 88,697 �,685 �,069 6�6Swaps 97,260 1,007 687 320 7,586 24� 328 (87)Options 133,717 624 501 123 7�,985 804 740 64
Totalforeignexchangecontracts 254,327 2,575 1,891 684 �68,627 2,730 2,�37 593
EquitycontractsExchangetraded 7,166 433 145 288 4,820 �66 79 87Swaps 13,097 39 838 (799) 2,306 283 698 (4�5)Options 27,888 634 559 75 �7,�03 346 469 (�23)Other 972 115 157 (42) �0,00� �09 �50 (4�)
Totalequitycontracts 49,123 1,221 1,699 (478) 34,230 904 �,396 (492)
CommoditycontractsExchangetraded 24,127 1,072 2,133 (1,061) 24,654 965 �,755 (790)Forwards 69,302 3,139 1,542 1,597 20,483 3,443 �,9�6 �,527Swaps 12,178 426 423 3 2,428 523 52� 2Options 45,601 1,387 1,317 70 �9,68� �,�66 965 20�
Totalcommoditycontracts 151,208 6,024 5,415 609 67,246 6,097 5,�57 940
Totalderivativescontractsoutstanding 737,006 11,047 9,800 1,247 43�,275 �0,6�8 9,286 �,332

6�
Consolidated2007 Consolidated2006
Average Income/ Average Average Income/ Average balance (expense) rate balance (expense) rate $m $m % $m $m %
Note41.Averageinterest-bearingassetsandliabilitiesandrelatedinterestAssetsInterestbearingassetsDuefrombanks 3,753 200 5.3 2,702 �23 4.6Cashcollateralonsecuritiesborrowedandreverserepurchaseagreements 16,889 865 5.1 �0,34� 505 4.9Tradingportfolioassets 4,379 260 5.9 2,829 �5� 5.3Loanassetsheldatamortisedcost 41,218 2,986 7.3 29,8�2 2,��5 7.�Otherfinancialassetsatfairvaluethroughprofitandloss 820 55 6.7 739 57 7.7Otherassets 19 1 6.0 �0� 6 5.9Investmentsecuritiesavailableforsale 4,224 255 6.0 3,�05 �75 5.6Netinterestinassociatesandjointventuresusingtheequitymethod 197 10 5.2 �05 4 3.8
Totalinterestbearingassets 71,499 4,632 49,734 3,�36Totalnon-interestbearingassets 48,105 4�,378
Totalassets 119,604 9�,��2
LiabilitiesInterestbearingliabilitiesDuetobanks 3,570 (176) 4.9 �,489 (65) 4.4Cashcollateralonsecuritieslentandrepurchaseagreements 8,333 (432) 5.2 3,38� (�58) 4.7Tradingportfolioliabilities 3,190 (179) 5.6 5,528 (284) 5.�Deposits 10,720 (498) 4.6 8,643 (376) 4.4Debtissuedatamortisedcost 45,407 (2,444) 5.4 30,379 (�,566) 5.2Otherfinancialliabilitiesatfairvaluethroughprofitandloss 1,227 (46) 3.7 889 (27) 3.0Otherliabilities 118 (9) 7.5 �07 (4) 3.7LoancapitalSubordinateddebt 2,013 (120) 6.0 �,328 (64) 4.8
Totalinterestbearingliabilities 74,578 (3,904) 5�,744 (2,544)Totalnon-interestbearingliabilities 38,359 34,420
Totalliabilities 112,937 86,�64
Netassets 6,667 4,948
EquityContributedequity Ordinarysharecapital 2,763 �,780 Treasuryshares (3) (�) MacquarieIncomeSecurities 391 39�Reserves 325 �40Retainedearnings 2,325 �,682
TotalcapitalandreservesattributabletoequityholdersofMacquarieBankLimited 5,801 3,992
Minorityinterestfromdisposalgroupsclassifiedasheldforsale (3) �02
Minorityinterest 869 854
Totalequity 6,667 4,948

MacquarieBankLimited2007FinancialReport62
Notestothefinancialstatements3�March2007continued
Bank2007 Bank2006
Average Income/ Average Average Income/ Average balance (expense) rate balance (expense) rate $m $m % $m $m %
Note41.Averageinterest-bearingassetsandliabilitiesandrelatedinterestcontinuedAssetsInterestbearingassetsDuefrombanks 2,848 153 5.4 �,880 84 4.5Cashcollateralonsecuritiesborrowedandreverserepurchaseagreements 17,029 861 5.1 �0,34� 505 4.9Tradingportfolioassets 4,841 270 5.6 2,825 �5� 5.3Loanassetsheldatamortisedcost 15,917 1,183 7.4 9,903 764 7.7Otherfinancialassetsatfairvaluethroughprofitandloss 670 41 6.1 556 46 8.3Otherassets 16 1 6.0 92 6 6.�Investmentsecuritiesavailableforsale 2,488 153 6.2 �,965 �04 5.3Duefromcontrolledentities 13,619 699 5.1 6,420 356 5.5Netinterestinassociatesandjointventuresusingtheequitymethod 166 7 4.1 30 � 4.�
Totalinterestbearingassets 57,594 3,368 34,0�2 2,0�7Totalnon-interestbearingassets 25,874 28,��5
Totalassets 83,468 62,�27
LiabilitiesInterestbearingliabilitiesDuetobanks 1,956 (89) 4.5 �,222 (45) 3.7Cashcollateralonsecuritieslentandrepurchaseagreements 8,129 (432) 5.3 3,38� (�58) 4.7Tradingportfolioliabilities 3,214 (179) 5.6 5,528 (284) 5.�Deposits 10,442 (486) 4.7 8,373 (36�) 4.3Debtissuedatamortisedcost 25,240 (1,170) 4.6 �3,774 (565) 4.�Otherfinancialliabilitiesatfairvaluethroughprofitandloss 1,227 (45) 3.7 889 (27) 3.�Otherliabilities 36 (2) 5.9 �05 (4) 3.5Duetocontrolledentities 6,369 (327) 5.1 3,�59 (�72) 5.5LoancapitalSubordinateddebt 2,013 (120) 6.0 �,328 (64) 4.8
Totalinterestbearingliabilities 58,626 (2,850) 37,759 (�,680)Totalnon-interestbearingliabilities 19,883 20,783
Totalliabilities 78,509 58,542
Netassets 4,959 3,585
EquityContributedequity Ordinarysharecapital 2,752 �,780 Treasuryshares – – MacquarieIncomeSecurities 391 39� Convertibledebentures 884 884Reserves 187 ��2Retainedearnings 745 4�8
TotalcapitalandreservesattributabletoequityholdersofMacquarieBankLimited 4,959 3,585
Minorityinterestfromdisposalgroupsclassifiedasheldforsale – –
Minorityinterest – –
Totalequity 4,959 3,585

63
Note42.GeographicalconcentrationofdepositsandborrowingsThefollowingtabledetailsthesourceofdepositsandborrowings,baseduponthelocationoftherelevantcounterparty.Referto“LiquidityManagement”withinnote43–Maturityanalysisofmonetaryassetsandliabilitiesandliquiditymanagement,fordiscussiononthesourceoftheBank’sfunding. North Asia Australia Europe America Pacific* Other Total $m $m $m $m $m $m
Consolidated2007
Duetobanks 1,551 1,172 709 588 107 4,127Cashcollateralonsecuritieslentandrepurchaseagreements 4,276 2,654 459 57 43 7,489Tradingportfolioliabilities 2,632 10,096 2,510 638 46 15,922Deposits 11,319 108 575 268 133 12,403Debtissuedatamortisedcost 27,484 16,328 6,850 703 – 51,365Otherfinancialliabilitiesatfairvaluethroughprofitandloss 905 1,393 557 2,697 – 5,552Subordinateddebtatamortisedcost 442 1,341 – – – 1,783Subordinateddebtatfairvaluethroughprofitandloss 403 485 – – – 888
Totaldepositsandborrowingsbygeographicallocation 49,012 33,577 11,660 4,951 329 99,529
Bank2007
Duetobanks 577 793 455 179 107 2,111Cashcollateralonsecuritieslentandrepurchaseagreements 4,276 2,654 459 57 43 7,489Tradingportfolioliabilities 2,649 10,096 2,510 665 37 15,957Deposits 11,237 107 404 268 39 12,055Debtissuedatamortisedcost 5,251 15,715 6,850 703 – 28,519Otherfinancialliabilitiesatfairvaluethroughprofitandloss 623 1,377 557 2,592 – 5,149Subordinateddebtatamortisedcost 442 1,341 – – – 1,783Subordinateddebtatfairvaluethroughprofitandloss 403 485 – – – 888
Totaldepositsandborrowingsbygeographicallocation 25,458 32,568 11,235 4,464 226 73,951
*ExcludesAustralia.

MacquarieBankLimited2007FinancialReport64
Notestothefinancialstatements3�March2007continued
North Asia Australia Europe America Pacific* Other Total $m $m $m $m $m $m
Note42.GeographicalconcentrationofdepositsandborrowingscontinuedConsolidated2006
Duetobanks 727 73� 267 360 33 2,��8Cashcollateralonsecuritieslentandrepurchaseagreements 4,782 �,58� 6�0 �� �� 6,995Tradingportfolioliabilities 6,049 280 – 3,728 – �0,057Deposits 7,806 �07 423 7�0 22� 9,267Debtissuedatamortisedcost 22,706 �3,3�4 �,436 �,566 – 39,022Otherfinancialliabilitiesatfairvaluethroughprofitandloss 776 �,22� – 3,484 – 5,48�Subordinateddebtatamortisedcost 288 827 – – – �,��5Subordinateddebtatfairvaluethroughprofitandloss 266 – – – – 266
Totaldepositsandborrowingsbygeographicallocation 43,400 �8,06� 2,736 9,859 265 74,32�
Bank2006
Duetobanks 488 427 �96 73 33 �,2�7Cashcollateralonsecuritieslentandrepurchaseagreements 4,782 �,58� 6�0 �� �� 6,995Tradingportfolioliabilities 6,049 280 – 3,724 – �0,053Deposits 7,74� 96 438 7�0 �09 9,094Debtissuedatamortisedcost 4,250 �3,3�5 �,436 �,566 – 20,567Otherfinancialliabilitiesatfairvaluethroughprofitandloss 529 �,2�� – 3,3�8 – 5,058Subordinateddebtatamortisedcost 288 826 – – – �,��4Subordinateddebtatfairvaluethroughprofitandloss 266 – – – – 266
Totaldepositsandborrowingsbygeographicallocation 24,393 �7,736 2,680 9,402 �53 54,364
*ExcludesAustralia.

65
Consolidated2007 No 3months 3monthsto 1yearto Over maturity Atcall orless 12months 5years 5years specified Total $m $m $m $m $m $m $m
Note43.MaturityanalysisofmonetaryassetsandliabilitiesandliquiditymanagementAssetsCashandbalanceswithcentralbanks 3 – – – – – 3Duefrombanks 3,119 2,988 – 13 – – 6,120Cashcollateralonsecuritiesborrowedandreverserepurchaseagreements 21,831 4,078 – – – – 25,909Tradingportfolioassets – 15,518 – – – – 15,518Loanassetsheldatamortisedcost 5,278 7,468 3,359 5,048 24,643 – 45,796Otherfinancialassetsatfairvaluethroughprofitandloss 781 924 74 286 714 – 2,779Investmentsecuritiesavailableforsale 12 3,296 – 1,149 631 972 6,060Lifeinvestmentcontractsandotherunitholderassets* 146 550 198 121 – 4,832 5,847Interestinassociatesandjointventuresusingtheequitymethod – –- – – – 4,071 4,071
Totalmonetaryassets 31,170 34,822 3,631 6,617 25,988 9,875 112,103
LiabilitiesDuetobanks 1,074 2,229 272 138 414 – 4,127Cashcollateralonsecuritieslentandrepurchaseagreements 4,086 3,403 – – – – 7,489Tradingportfolioliabilities – 15,922 – – – – 15,922Deposits 6,808 4,719 761 101 14 – 12,403Debtissuedatamortisedcost 1,236 17,009 13,262 5,153 14,705 – 51,365Otherfinancialliabilitiesatfairvaluethroughprofitandloss 43 993 1,181 2,958 377 – 5,552Lifeinvestmentcontractsandotherunitholderliabilities – – – – – 5,781 5,781Subordinateddebtissuedatamortisedcost – – – – 1,783 – 1,783Subordinateddebtissuedatfairvaluethroughprofitandloss – – – – 888 – 888
Totalmonetaryliabilities 13,247 44,275 15,476 8,350 18,181 5,781 105,310
*Thelifeinvestmentcontractbusinessoffersaninvestmentlinkedproduct.Policyholdersareprimarilyexposedtotheliquidityriskonlifeinvestmentcontractassets.Themembersaresubjecttoliquidityriskonthesurplusinthelifeinvestmentcontractstatutoryfunds.
Thetabledetailsthematuritydistributionofselectedmonetaryassetsandliabilities.
Maturitiesrepresenttheremainingperiodasat3�March2007totherepaymentdate.Certaindepositshoweverarerecordedattheirexpectedmaturitydateratherthanthecontractualrepaymentdate.Thesedeposits,althoughwithdrawableondemand,displaythenecessarycharacteristicsoflongertermdeposits.

MacquarieBankLimited2007FinancialReport66
Notestothefinancialstatements3�March2007continued
Bank2007 No 3months 3monthsto 1yearto Over maturity Atcall orless 12months 5years 5years specified Total $m $m $m $m $m $m $m
Note43.MaturityanalysisofmonetaryassetsandliabilitiesandliquiditymanagementcontinuedAssetsCashandbalanceswithcentralbanks 3 – – – – – 3Duefrombanks 1,657 2,910 – 13 – – 4,580Cashcollateralonsecuritiesborrowedandreverserepurchaseagreements 21,765 4,078 – – – – 25,843Tradingportfolioassets – 14,931 – – – – 14,931Loanassetsheldatamortisedcost 5,046 6,666 1,405 3,371 2,271 – 18,759Otherfinancialassetsatfairvaluethroughprofitandloss 519 735 72 286 568 – 2,180Investmentsecuritiesavailableforsale 4 2,578 – 200 75 354 3,211Duefromcontrolledentities 11,092 – – 292 834 1,309 13,527Interestinassociatesandjointventuresusingtheequitymethod – – – – – 613 613
Totalmonetaryassets 40,086 31,898 1,477 4,162 3,748 2,276 83,647
LiabilitiesDuetobanks 349 1,491 133 138 – – 2,111Cashcollateralonsecuritieslentandrepurchaseagreements 4,086 3,403 – – – – 7,489Tradingportfolioliabilities – 15,957 – – – – 15,957Deposits 6,802 4,592 626 35 – – 12,055Debtissuedatamortisedcost 1,236 16,942 6,302 3,985 54 – 28,519Otherfinancialliabilitiesatfairvaluethroughprofitandloss 28 898 1,172 2,674 377 – 5,149Duetocontrolledentities 6,261 – – – – 875 7,136Subordinateddebtissuedatamortisedcost – – – – 1,783 – 1,783Subordinateddebtissuedatfairvaluethroughprofitandloss – – – – 888 – 888
Totalmonetaryliabilities 18,762 43,283 8,233 6,832 3,102 875 81,087
Thetabledetailsthematuritydistributionofselectedmonetaryassetsandliabilities.
Maturitiesrepresenttheremainingperiodasat3�March2007totherepaymentdate.Certaindepositshoweverarerecordedattheirexpectedmaturitydateratherthanthecontractualrepaymentdate.Thesedeposits,althoughwithdrawableondemand,displaythenecessarycharacteristicsoflongertermdeposits.

67
Consolidated2006 No 3months 3monthsto �yearto Over maturity Atcall orless �2months 5years 5years specified Total $m $m $m $m $m $m $m
Note43.MaturityanalysisofmonetaryassetsandliabilitiesandliquiditymanagementcontinuedAssetsCashandbalanceswithcentralbanks 5 – – – – – 5Duefrombanks 4,025 2,369 – – – – 6,394Cashcollateralonsecuritiesborrowedandreverserepurchaseagreements 6,2�8 7,352 – – – – �3,570Tradingportfolioassets �4,246 – – – – – �4,246Loanassetsheldatamortisedcost 4,4�8 7,073 2,�73 4,209 �7,�26 – 34,999Otherfinancialassetsatfairvaluethroughprofitandloss 609 686 � 208 600 – 2,�04Investmentsecuritiesavailableforsale 358 �,892 299 242 406 549 3,746Lifeinvestmentcontractsandotherunitholderassets* �8� 653 5� ��6 – 4,�82 5,�83Interestinassociatesandjointventuresusingtheequitymethod – – – – – 3,463 3,463
Totalmonetaryassets 30,060 20,025 2,524 4,775 �8,�32 8,�94 83,7�0
LiabilitiesDuetobanks 875 893 �22 64 �64 – 2,��8Cashcollateralonsecuritieslentandrepurchaseagreements 3,047 3,948 – – – – 6,995Tradingportfolioliabilities �0,057 – – – – – �0,057Deposits 5,955 2,699 346 247 20 – 9,267Debtissuedatamortisedcost 966 �0,2�9 �2,29� 5,305 �0,24� – 39,022Otherfinancialliabilitiesatfairvaluethroughprofitandloss – �4 496 662 – 4,309 5,48�Lifeinvestmentcontractsandotherunitholderliabilities – – – – – 5,�30 5,�30Subordinateddebtissuedatamortisedcost – – – – �,��5 – �,��5Subordinateddebtissuedatfairvaluethroughprofitandloss – – – – 266 – 266
Totalmonetaryliabilities 20,900 �7,773 �3,255 6,278 ��,806 9,439 79,45�
*Thelifeinvestmentcontractbusinessoffersaninvestmentlinkedproduct.Policyholdersareprimarilyexposedtotheliquidityriskonlifeinvestmentcontractassets.Themembersaresubjecttoliquidityriskonthesurplusinthelifeinvestmentcontractstatutoryfunds.

MacquarieBankLimited2007FinancialReport68
Notestothefinancialstatements3�March2007continued
Bank2006 No 3months 3monthsto �yearto Over maturity Atcall orless �2months 5years 5years specified Total $m $m $m $m $m $m $m
Note43.MaturityanalysisofmonetaryassetsandliabilitiesandliquiditymanagementcontinuedAssetsCashandbalanceswithcentralbanks 5 – – – – – 5Duefrombanks 2,5�7 2,062 – – – – 4,579Cashcollateralonsecuritiesborrowedandreverserepurchaseagreements 6,2�3 7,352 – – – – �3,565Tradingportfolioassets �3,030 – – – – – �3,030Loanassetsheldatamortisedcost 4,275 4,236 �,528 2,553 589 – �3,�8�Otherfinancialassetsatfairvaluethroughprofitandloss 608 477 � 208 600 – �,894Investmentsecuritiesavailableforsale 62 �,500 292 200 – 256 2,3�0Duefromcontrolledentities 9,�36 �,�05 �0,24�Interestinassociatesandjointventuresusingtheequitymethod – – – – – 833 833
Totalmonetaryassets 35,846 �5,627 �,82� 2,96� �,�89 2,�94 59,638
LiabilitiesDuetobanks 769 329 ��9 – – – �,2�7Cashcollateralonsecuritieslentandrepurchaseagreements 3,047 3,948 – – – – 6,995Tradingportfolioliabilities �0,053 – – – – – �0,053Deposits 5,674 2,709 346 362 3 – 9,094Debtissuedatamortisedcost 966 �0,044 4,688 4,808 6� – 20,567Otherfinancialliabilitiesatfairvaluethroughprofitandloss – �4 50� 684 – 3,859 5,058Duetocontrolledentities 3,�87 – – – – 2,088 5,275Subordinateddebtissuedatamortisedcost – – – – �,��4 – �,��4Subordinateddebtissuedatfairvaluethroughprofitandloss – – – – 266 – 266
Totalmonetaryliabilities 23,696 �7,044 5,654 5,854 �,444 5,947 59,639
LiquiditymanagementTheliquiditymanagementpolicyoftheeconomicentityisapprovedbytheBoardandagreedwiththeAustralianPrudentialRegulationAuthority.ThispolicyisreviewedregularlybytheRiskManagementGroup(“RMG”)toensureitcontinuestomeettheneedsoftheeconomicentityunderarangeofdifferentmarketcircumstances.Theeconomicentity’sliquiditypolicyrequiresthat:
�.Coreassets(thatis,onbalancesheetassetsthatcannotbeliquifiedquickly)plusliquiditybuffersarefundedwithdeposits/borrowingswithaminimummaturitygreaterthan�week(5workingdays);
2.Specifiedpercentagesofborrowingshavematuritiesbeyond6and�2months.Alimitisalsosetonthemaximumpercentageofdepositsmaturingwithinthenext3monthsandinanyonemonth;and
3.Theeconomicentitymustkeepatleastacertainpercentageofitstotalassetsinhighlyliquidform(forexample,CommonwealthandStateGovernmentdebt,bankbills,overnightloansandrepurchaseagreements).
WithintheseparametersliquiditymanagementistheresponsibilityoftheTreasuryDivisionwithintheTreasuryandCommoditiesGroupsubjecttoriskmanagementoversightbyRMG.
Anobjectiveoftheeconomicentity’sliquiditypolicyistoachieveadiversifiedsourceofcoreliabilities,byinvestortype,location,currency,maturityandproduct.Inrespectoftheretailmarket,theBankfocusesitsattentiononsmallandmediumsizeddepositorswhodonotgenerallyaccesstheprofessionalmarket.
TheBank’skeytoolsforaccessingwholesalefundingmarketsaretheUSD$25billionDebtInstrumentProgrammeandtheUSD$�0billionCommercialPaperProgram,bothofwhichallowtheBanktoachieveitsobjectiveofdiversifiedsourcesoffundingintheoffshoremarkets.NegotiableCertificatesofDepositalsoprovideareliablesourceoffundinginthedomesticmarkets.

69
Note44.InterestrateriskTheinterestrateshownistheeffectiveinterestrateorweightedaverageeffectiveinterestrateinrespectofaclassofassetsorliabilities.Forfloatingrateinstrumentstherateisthecurrentmarketrate;forfixedrateinstrumentstherateisahistoricalrate.Thebandingsreflecttheearlierofthenextcontractualrepricingdateorthematuritydateoftheassetorliability.
Consolidated2007 Weighted Fixedinterestraterepricing average effective Floating 1month 3months Non- interest interest 1month to3 to12 1yearto Over interest rate rate orless months months 5years 5years bearing Total % $m $m $m $m $m $m $m $m
AssetsCashandbalanceswithcentralbanks 5.3 3 – – – – – – 3Duefrombanks 5.6 3,314 2,806 – – – – – 6,120Cashcollateralonsecuritiesborrowedandreverserepurchaseagreements 5.3 21,831 2,837 1,241 – – – – 25,909Tradingportfolioassets 5.0 – 904 365 378 800 1,053 12,018 15,518Loanassetsheldatamortisedcost 6.8 34,267 1,610 2,423 3,658 3,331 507 – 45,796Otherfinancialassetsatfairvaluethroughprofitandloss 7.0 772 852 100 413 177 209 256 2,779Derivativefinancialinstruments–positivevalues – – – – – – – 11,913 11,913Otherassets – – – – – – – 10,444 10,444Investmentsecuritiesavailableforsale 6.3 83 511 2,505 270 1,126 578 987 6,060Intangibleassets – – – – – – – 100 100Lifeinvestmentcontractsandotherunitholderassets* 2.4 145 313 238 198 121 – 4,832 5,847Interestinassociatesandjointventuresusingtheequitymethod 6.3 304 – – – – – 3,767 4,071Property,plantandequipment – – – – – – – 378 378Deferredincometaxassets – – – – – – – 457 457Assetsanddisposalgroupsclassifiedasheldforsale – – – – – – – 994 994
Totalassets 60,719 9,833 6,872 4,917 5,555 2,347 46,146 136,389
*Thelifebusinessoffersaninvestmentlinkedproduct.Policyholdersareprimarilyexposedtotheinterestrateriskonlifeinvestmentcontractassets.Themembersaresubjecttointerestrateriskonthesurplusinthelifebusinessstatutoryfunds.

MacquarieBankLimited2007FinancialReport70
Notestothefinancialstatements3�March2007continued
Consolidated2007 Weighted Fixedinterestraterepricing average effective Floating 1month 3months Non- interest interest 1month to3 to12 1yearto Over interest rate rate orless months months 5years 5years bearing Total % $m $m $m $m $m $m $m $m
Note44.InterestrateriskcontinuedLiabilitiesDuetobanks 5.4 2,179 648 431 286 264 319 – 4,127Cashcollateralonsecuritieslentandrepurchaseagreements 5.1 4,086 3,403 – – – – – 7,489Tradingportfolioliabilities 5.0 – – 90 391 477 722 14,242 15,922Derivativefinancialinstruments–negativevalues – – – – – – – 11,069 11,069Deposits 7.7 9,718 1,537 802 346 – – – 12,403Debtissuedatamortisedcost 7.0 1,779 7,324 9,425 13,262 4,963 14,612 – 51,365Otherfinancialliabilitiesatfairvaluethroughprofitandloss 5.6 – 9 250 707 263 1 4,322 5,552Otherliabilities – – – – – – – 11,958 11,958Currenttaxliabilities – – – – – – – 132 132Lifeinvestmentcontractsandotherunitholderliabilities – – – – – – – 5,781 5,781Provisions – – – – – – – 153 153Deferredincometaxliabilities – – – – – – – 78 78Liabilitiesofdisposalgroupsclassifiedasheldforsale – – – – – – – 170 170Subordinateddebtatamortisedcost 6.1 – – 1,783 – – – – 1,783Subordinateddebtatfairvaluethroughprofitandloss 6.8 – – 153 735 – – – 888
Totalliabilities 17,762 12,921 12,934 15,727 5,967 15,654 47,905 128,870
Totalequity 7,519 7,519
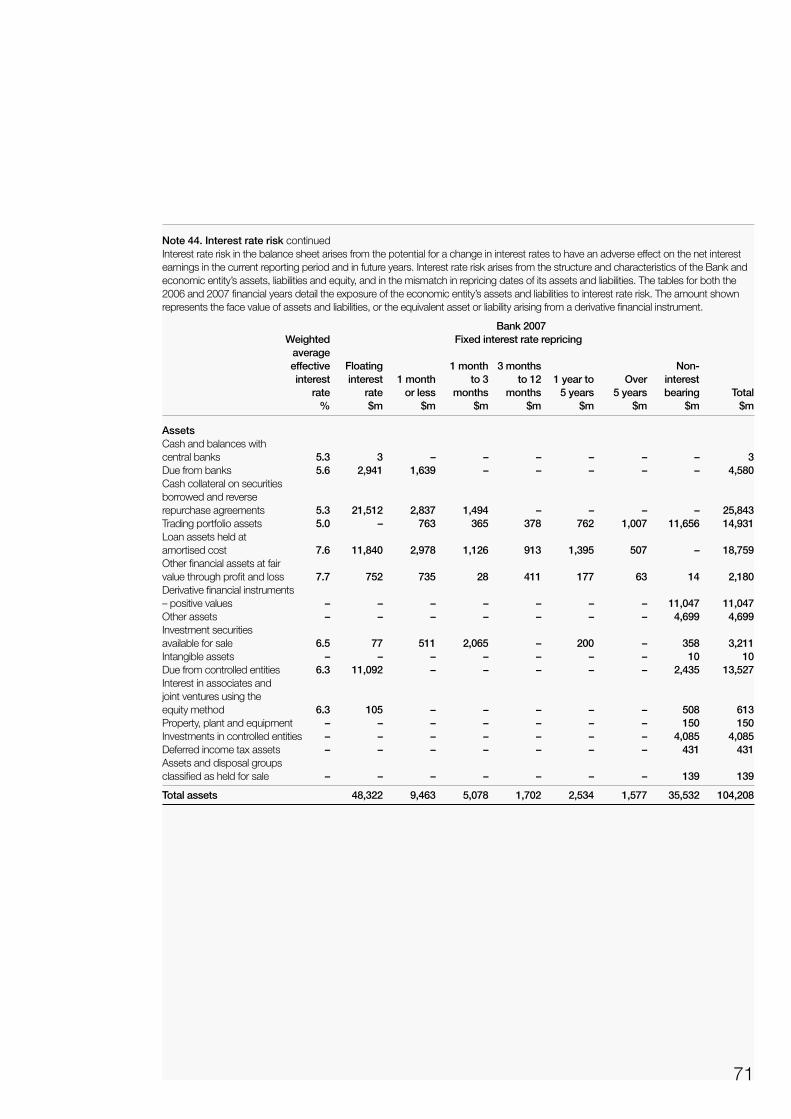
7�
Note44.InterestrateriskcontinuedInterestrateriskinthebalancesheetarisesfromthepotentialforachangeininterestratestohaveanadverseeffectonthenetinterestearningsinthecurrentreportingperiodandinfutureyears.InterestrateriskarisesfromthestructureandcharacteristicsoftheBankandeconomicentity’sassets,liabilitiesandequity,andinthemismatchinrepricingdatesofitsassetsandliabilities.Thetablesforboththe2006and2007financialyearsdetailtheexposureoftheeconomicentity’sassetsandliabilitiestointerestraterisk.Theamountshownrepresentsthefacevalueofassetsandliabilities,ortheequivalentassetorliabilityarisingfromaderivativefinancialinstrument.
Bank2007 Weighted Fixedinterestraterepricing average effective Floating 1month 3months Non- interest interest 1month to3 to12 1yearto Over interest rate rate orless months months 5years 5years bearing Total % $m $m $m $m $m $m $m $m
AssetsCashandbalanceswithcentralbanks 5.3 3 – – – – – – 3Duefrombanks 5.6 2,941 1,639 – – – – – 4,580Cashcollateralonsecuritiesborrowedandreverserepurchaseagreements 5.3 21,512 2,837 1,494 – – – – 25,843Tradingportfolioassets 5.0 – 763 365 378 762 1,007 11,656 14,931Loanassetsheldatamortisedcost 7.6 11,840 2,978 1,126 913 1,395 507 – 18,759Otherfinancialassetsatfairvaluethroughprofitandloss 7.7 752 735 28 411 177 63 14 2,180Derivativefinancialinstruments–positivevalues – – – – – – – 11,047 11,047Otherassets – – – – – – – 4,699 4,699Investmentsecuritiesavailableforsale 6.5 77 511 2,065 – 200 – 358 3,211Intangibleassets – – – – – – – 10 10Duefromcontrolledentities 6.3 11,092 – – – – – 2,435 13,527Interestinassociatesandjointventuresusingtheequitymethod 6.3 105 – – – – – 508 613Property,plantandequipment – – – – – – – 150 150Investmentsincontrolledentities – – – – – – – 4,085 4,085Deferredincometaxassets – – – – – – – 431 431Assetsanddisposalgroupsclassifiedasheldforsale – – – – – – – 139 139
Totalassets 48,322 9,463 5,078 1,702 2,534 1,577 35,532 104,208

MacquarieBankLimited2007FinancialReport72
Notestothefinancialstatements3�March2007continued
Bank2007 Weighted Fixedinterestraterepricing average effective Floating 1month 3months Non- interest interest 1month to3 to12 1yearto Over interest rate rate orless months months 5years 5years bearing Total % $m $m $m $m $m $m $m $m
Note44.InterestrateriskcontinuedLiabilitiesDuetobanks 5.9 1,538 175 1 133 264 – – 2,111Cashcollateralonsecuritieslentandrepurchaseagreements 5.1 4,086 3,403 – – – – – 7,489Tradingportfolioliabilities 5.0 – – 90 391 477 722 14,277 15,957Derivativefinancialinstruments–negativevalues – – – – – – – 9,800 9,800Deposits 7.1 9,626 1,542 541 346 – – – 12,055Debtissuedatamortisedcost 5.3 1,614 7,174 9,390 6,302 3,985 54 – 28,519Otherfinancialliabilitiesatfairvaluethroughprofitandloss 5.9 – 8 241 700 262 – 3,938 5,149Otherliabilities – – – – – – – 7,094 7,094Currenttaxliabilities – – – – – – – 94 94Duetocontrolledentities 6.3 6,261 – – – – – 875 7,136Provisions – – – – – – – 124 124Deferredincometaxliabilities – – – – – – – 41 41Subordinateddebtatamortisedcost – – – 1,783 – – – – 1,783Subordinateddebtatfairvaluethroughprofitandloss 6.1 – – 153 735 – – – 888
Totalliabilities 23,125 12,302 12,199 8,607 4,988 776 36,243 98,240
Totalequity 5,968 5,968

73
Consolidated2006 Weighted Fixedinterestraterepricing average effective Floating �month 3months Non- interest interest �month to3 to�2 �yearto Over interest rate rate orless months months 5years 5years bearing Total % $m $m $m $m $m $m $m $m
Note44.InterestrateriskcontinuedAssetsCashandbalanceswithcentralbanks 5.3 5 – – – – – – 5Duefrombanks 5.0 4,025 2,320 49 – – – – 6,394Cashcollateralonsecuritiesborrowedandreverserepurchaseagreements 5.3 6,2�8 6,032 �,320 – – – – �3,570Tradingportfolioassets 5.� 50 876 �,560 778 765 �,048 9,�69 �4,246Loanassetsheldatamortisedcost 7.� 22,072 4,358 3,888 �,222 3,�70 289 – 34,999Otherfinancialassetsatfairvaluethroughprofitandloss 6.� 609 45� 235 � 208 600 – 2,�04Derivativefinancialinstruments–positivevalues – – – – – – – �0,978 �0,978Otherassets – – – – – – – 8,452 8,452Investmentsecuritiesavailableforsale 5.6 358 7�4 �,�78 299 242 406 549 3,746Intangibleassets – – – – – – – �50 �50Lifeinvestmentcontractsandotherunitholderassets* 2.6 �8� 304 349 5� ��6 – 4,�82 5,�83Interestinassociatesandjointventuresusingtheequitymethod 5.5 �35 – – – – – 3,328 3,463Property,plantandequipment – – – – – – – 292 292Deferredincometaxassets – – – – – – – 240 240Assetsanddisposalgroupsclassifiedasheldforsale – – – – – – – 2,389 2,389
Totalassets 33,653 �5,055 8,579 2,35� 4,50� 2,343 39,729 �06,2��
*Thelifebusinessoffersaninvestmentlinkedproduct.Policyholdersareprimarilyexposedtotheinterestrateriskonlifeinvestmentcontractassets.Themembersaresubjecttointerestrateriskonthesurplusinthelifebusinessstatutoryfunds.

MacquarieBankLimited2007FinancialReport74
Notestothefinancialstatements3�March2007continued
Consolidated2006 Weighted Fixedinterestraterepricing average effective Floating �month 3months Non- interest interest �month to3 to�2 �yearto Over interest rate rate orless months months 5years 5years bearing Total % $m $m $m $m $m $m $m $m
Note44.InterestrateriskcontinuedLiabilitiesDuetobanks 4.6 875 258 635 �22 64 �64 – 2,��8Cashcollateralonsecuritieslentandrepurchaseagreements 5.3 3,047 3,948 – – – – – 6,995Tradingportfolioliabilities 4.5 – – �05 877 2,36� 2,445 4,269 �0,057Derivativefinancialinstruments–negativevalues – – – – – – – �0,057 �0,057Deposits 4.5 5,955 �,756 943 346 247 20 – 9,267Debtissuedatamortisedcost 5.� �,�45 3,305 6,846 �2,380 5,�67 �0,�79 – 39,022Otherfinancialliabilitiesatfairvaluethroughprofitandloss 3.8 – – �4 496 662 – 4,309 5,48�Otherliabilities – – – – – – – 9,553 9,553Currenttaxliabilities – – – – – – – 97 97Lifeinvestmentcontractsandotherunitholderliabilities – – – – – – – 5,�30 5,�30Provisions – – – – – – – �32 �32Deferredincometaxliabilities – – – – – – – �57 �57Liabilitiesofdisposalgroupsclassifiedasheldforsale – – – – – – – �,427 �,427Subordinateddebtatamortisedcost 5.0 – – �,��5 – – – – �,��5Subordinateddebtatfairvaluethroughprofitandloss 6.� – – – 266 – – – 266
Totalliabilities ��,022 9,267 9,658 �4,487 8,50� �2,808 35,�3� �00,874
Totalequity 5,337 5,337

75
Bank2006 Weighted Fixedinterestraterepricing average effective Floating �month 3months Non- interest interest �month to3 to�2 �yearto Over interest rate rate orless months months 5years 5years bearing Total % $m $m $m $m $m $m $m $m
Note44.InterestrateriskcontinuedAssetsCashandbalanceswithcentralbanks 5.3 5 – – – – – – 5Duefrombanks 5.2 2,5�7 2,06� � – – – – 4,579Cashcollateralonsecuritiesborrowedandreverserepurchaseagreements 5.3 6,2�3 6,032 �,320 – – – – �3,565Tradingportfolioassets 5.2 50 876 �,559 778 744 900 8,�23 �3,030Loanassetsheldatamortisedcost 7.3 4,572 3,063 3,822 426 645 653 – �3,�8�Otherfinancialassetsatfairvaluethroughprofitandloss 6.2 608 423 54 � 208 600 – �,894Derivativefinancialinstruments–positivevalues – – – – – – – �0,6�8 �0,6�8Otherassets – – – – – – – 3,2�3 3,2�3Investmentsecuritiesavailableforsale 5.6 62 378 �,�22 292 200 – 256 2,3�0Intangibleassets – – – – – – – �� ��Duefromcontrolledentities 5.5 9,�36 – – – – – �,�05 �0,24�Interestinassociatesandjointventuresusingtheequitymethod 5.5 58 – – – – – 775 833Property,plantandequipment – – – – – – – 90 90Investmentsincontrolledentities – – – – – – – 4,087 4,087Deferredincometaxassets – – – – – – – 232 232Assetsanddisposalgroupsclassifiedasheldforsale – – – – – – – �8 �8
Totalassets 23,22� �2,833 7,878 �,497 �,797 2,�53 28,528 77,907

MacquarieBankLimited2007FinancialReport76
Notestothefinancialstatements3�March2007continued
Bank2006 Weighted Fixedinterestraterepricing average effective Floating �month 3months Non- interest interest �month to3 to�2 �yearto Over interest rate rate orless months months 5years 5years bearing Total % $m $m $m $m $m $m $m $m
Note44.InterestrateriskcontinuedLiabilitiesDuetobanks 4.� 769 67 262 ��9 – – – �,2�7Cashcollateralonsecuritieslentandrepurchaseagreements 5.3 3,047 3,948 – – – – – 6,995Tradingportfolioliabilities 3.9 – – �05 877 2,36� 2,445 4,265 �0,053Derivativefinancialinstruments–negativevalues – – – – – – – 9,286 9,286Deposits 4.5 5,674 �,755 954 346 362 3 – 9,094Debtissuedatamortisedcost 4.4 97� 3,270 6,695 4,777 4,793 6� – 20,567Otherfinancialliabilitiesatfairvaluethroughprofitandloss 3.8 – – �4 50� 684 – 3,859 5,058Otherliabilities – – – – – – – 4,4�7 4,4�7Currenttaxliabilities – – – – – – – 22 22Duetocontrolledentities 4.5 3,887 – – – – – �,388 5,275Provisions – – – – – – – �08 �08Deferredincometaxliabilities – – – – – – – �29 �29Subordinateddebtatamortisedcost 5.0 – – �,��4 – – – – �,��4Subordinateddebtatfairvaluethroughprofitandloss 6.� – – – 266 – – – 266
Totalliabilities �4,348 9,040 9,�44 6,886 8,200 2,509 23,474 73,60�
Totalequity 4,306 4,306
Forinternalriskmanagement,theeconomicentitydoesnotusetherepricinginformationinthewaypresentedinthistable.Interestraterisk,likeallmarketrisk,ismeasuredandcontrolledonthebasisofawiderangeofratemovementscenarios,includingworstcasescenarios.Itiscalculateddailyandcoversallinterestratesensitiveinstruments.TheeconomicentityalsocalculatesdailyValueAtRiskmeasuresforallmarketrisks,includinginterestraterisk.
77
Note45.FairvalueFairvaluereflectsthepresentvalueoffuturecashflowsassociatedwithafinancialassetorliability.Marketpricesorratesareusedtodeterminefairvaluewhereanactivemarketexists.Wherenoactivemarketpriceorrateisavailable,fairvaluesareestimatedusingpresentvalueorothervaluationtechniques,usinginputsbasedonmarketconditionsprevailingatbalancesheetdates.
Thevaluesderivedfromapplyingthesetechniquesaresignificantlyaffectedbythechoiceofvaluationmodelusedandtheunderlyingassumptionsmaderegardingfactorssuchastimingandamountsoffuturecashflows,discountrates,creditriskandvolatility.
Thefollowingmethodsandsignificantassumptionshavebeenappliedindeterminingthefairvaluesoffinancialassetsandliabilitiescarriedatfairvalue,andfordisclosurepurposes,indeterminingwhetheramaterialdifferencebetweenthefairvalueandcarryingamountexists.
Financialinstrumentscarriedatfairvalue:–Tradingportfolioassetsandliabilities,financialassetsand
liabilitiesatfairvaluethroughprofitandloss,derivativefinancialinstruments,andothertransactionsundertakenfortradingpurposesaremeasuredatfairvaluebyreferencetoquotedmarketpriceswhenavailable(e.g.listedsecurities).Ifquotedmarketpricesarenotavailable,thenfairvaluesareestimatedonthebasisofpricingmodels,orotherrecognisedvaluationtechniques;
–Investmentsecuritiesclassifiedasavailableforsalearemeasuredatfairvaluebyreferencetoquotedmarketpriceswhenavailable(e.g.listedsecurities).Ifquotedmarketpricesarenotavailable,thenfairvaluesareestimatedonthebasisofpricingmodelsorotherrecognisedvaluationtechniques.Unrealisedgainsandlosses,excludingimpairmentwrite-downs,arerecordedintheAvailableForSaleReserveinequityuntilanassetissold,collectedorotherwisedisposedof;
–Fairvaluesoffixedrateloansandissueddebtclassifiedasfairvaluethroughprofitandlossisestimatedbycomparingmarketinterestrateswhentheloansweregranted/debtissuedwithcurrentmarketratesofferedonsimilarloans.
Financialinstrumentscarriedatcost:–Thecarryingamountofliquidassetsandotherassets
maturingwithin�2monthsapproximatestheirfairvalue.Thisassumptionisappliedtoliquidassetsandtheshort-termelementsofallotherfinancialassetsandfinancialliabilities;
–Thefairvalueofdemanddepositswithnospecificmaturityisapproximatelytheircarryingamountastheyareshortterminnatureorarepayableondemand;
–Thefairvalueofvariableratefinancialinstruments,includingcashcollateralonsecuritiesborrowedandreverserepurchaseagreements,isapproximatedbytheircarryingamountsandinthecaseofloans,doesnot,therefore,reflectchangesintheircreditquality,astheimpactofcreditriskislargelyrecognisedseparatelybydeductingtheamountoftheallowanceforcreditlosses;
–Thefairvalueoffixedrateloansandmortgagescarriedatamortisedcostisestimatedbycomparingmarketinterestrateswhentheloansweregrantedwithcurrentmarketratesofferedonsimilarloans.Changesinthecreditqualityofloanswithintheportfolioarerecognisedseparatelybydeductingtheamountoftheallowanceforcreditlosses.Thecarryingamountsarenotmateriallydifferenttotheirfacevalue;
–Substantiallyalloftheeconomicentity’scommitmentstoextendcreditareatvariablerates.Assuch,thereisnosignificantexposuretofairvaluefluctuationsresultingfrominterestratemovementsrelatingtothesecommitments;
–Thefairvalueofvariableratenotespayableanddebtissuedatamortisedcostisapproximatedbytheircarryingamount.
Wherevaluationtechniquesareusedtodeterminefairvalues,theyarevalidatedandperiodicallyreviewedbyqualifiedpersonnelindependentoftheareathatcreatedthem.Allmodelsarecertifiedbeforetheyareused,andmodelsarecalibratedtoensuretheoutputsreflectactualdataandcomparativemarketprices.Totheextentpossible,modelsuseonlyobservabledata(e.g.forOTCderivatives),howeverareassuchascreditrisk,volatilitiesandcorrelationsrequiremanagementtomakeestimates.Theeffectofchangingtheseestimates,forthosefinancialinstrumentsforwhichthefairvaluesweremeasuredusingvaluationtechniquesthataredetermined,infullorinpart,basedonunobservabledata(e.g.forcertainexoticorstructuredfinancialinstruments),toarangeofreasonablypossiblealternativeassumptions,wouldnothaveamaterialimpactascomparedtotheamountsrecognisedinthefinancialstatements.

MacquarieBankLimited2007FinancialReport78
Notestothefinancialstatements3�March2007continued
Note46.CreditriskCreditriskisthepotentiallossarisingthroughthedefaultofcounterpartiestofinancialassets.Thetablebelowdetailstheconcentrationofcreditexposureoftheeconomicentity’sassetstosignificantgeographicallocationsandcounterpartytypes.Theamountsshownrepresentthemaximumcreditriskoftheeconomicentity’sassets.Inallcasesthisisequaltothecarryingvalueoftheassetswiththeexceptionofcreditcommitmentsandcontingentliabilitiesandderivativeswhicharerecordedatthemaximumcreditexposure.
Consolidated2007Creditriskconcentration Derivative Debt Life Interestin Cashcollateral Loanassets Otherfinancial financial investment investment Credit associatesand onsecurities Trading heldat assetsatfair instruments securities contractsand commitments jointventures Duefrom borrowedandreverse portfolio amortised valuethrough –positive available otherunit andcontingent usingthe Banks repurchaseagreements assets cost profitandloss values Otherassets forsale holderassets liabilities equitymethod Total $m $m $m $m $m $m $m $m $m $m $m $m
AustraliaCentralbankGovernments – 48 895 40 125 218 – – – 92 – 1,418Otherfinancialinstitutions 1,570 1,123 724 66 29 1,202 – 1,266 – – 14 5,994Other – 3,659 2,929 36,754 1,999 1,504 4,977 678 5,847 1,086 2,665 62,098
TotalAustralia 1,570 4,830 4,548 36,860 2,153 2,924 4,977 1,944 5,847 1,178 2,679 69,510
NewZealandGovernments – – – – – 1 – – – – – 1Otherfinancialinstitutions 52 1 4 – – 5 – – – – – 62Other – – – 306 – 35 54 – – – 4 399
TotalNewZealand 52 1 4 306 – 41 54 – – – 4 462
EuropeGovernments – – 6 – – – – – – – – 6Otherfinancialinstitutions 1,094 11,997 62 501 50 3,720 – 769 – – – 18,193Other – 7,779 2,866 2,845 74 838 2,601 1,406 – 791 472 19,672
TotalEurope 1,094 19,776 2,934 3,346 124 4,558 2,601 2,175 – 791 472 37,871
NorthAmericaGovernments – 595 – 1 – 3 – – – – – 599Otherfinancialinstitutions 720 10 22 23 – 1,552 – 99 – – – 2,426Other – 674 2,923 4,877 492 1,213 35 809 – 229 428 11,680
TotalNorthAmerica 720 1,279 2,945 4,901 492 2,768 35 908 – 229 428 14,705
AsiaGovernments – – – – – – – – – – – –Otherfinancialinstitutions 2,532 – – 1 – 246 – – – – – 2,779Other – 11 5,050 224 9 583 2,675 39 – 179 482 9,252
TotalAsia 2,532 11 5,050 225 9 829 2,675 39 – 179 482 12,031
OtherGovernments – – 6 – – – – – – – – 6Otherfinancialinstitutions 152 – – – – 41 – – – – – 193Other – 12 31 158 1 752 102 – – 48 6 1,110
Totalother 152 12 37 158 1 793 102 – – 48 6 1,309
Total 6,120 25,909 15,518 45,796 2,779 11,913 10,444 5,066 5,847 2,425 4,071 135,888
Totalgrosscreditrisk 135,888

79
Note46.CreditriskCreditriskisthepotentiallossarisingthroughthedefaultofcounterpartiestofinancialassets.Thetablebelowdetailstheconcentrationofcreditexposureoftheeconomicentity’sassetstosignificantgeographicallocationsandcounterpartytypes.Theamountsshownrepresentthemaximumcreditriskoftheeconomicentity’sassets.Inallcasesthisisequaltothecarryingvalueoftheassetswiththeexceptionofcreditcommitmentsandcontingentliabilitiesandderivativeswhicharerecordedatthemaximumcreditexposure.
Consolidated2007Creditriskconcentration Derivative Debt Life Interestin Cashcollateral Loanassets Otherfinancial financial investment investment Credit associatesand onsecurities Trading heldat assetsatfair instruments securities contractsand commitments jointventures Duefrom borrowedandreverse portfolio amortised valuethrough –positive available otherunit andcontingent usingthe Banks repurchaseagreements assets cost profitandloss values Otherassets forsale holderassets liabilities equitymethod Total $m $m $m $m $m $m $m $m $m $m $m $m
AustraliaCentralbankGovernments – 48 895 40 125 218 – – – 92 – 1,418Otherfinancialinstitutions 1,570 1,123 724 66 29 1,202 – 1,266 – – 14 5,994Other – 3,659 2,929 36,754 1,999 1,504 4,977 678 5,847 1,086 2,665 62,098
TotalAustralia 1,570 4,830 4,548 36,860 2,153 2,924 4,977 1,944 5,847 1,178 2,679 69,510
NewZealandGovernments – – – – – 1 – – – – – 1Otherfinancialinstitutions 52 1 4 – – 5 – – – – – 62Other – – – 306 – 35 54 – – – 4 399
TotalNewZealand 52 1 4 306 – 41 54 – – – 4 462
EuropeGovernments – – 6 – – – – – – – – 6Otherfinancialinstitutions 1,094 11,997 62 501 50 3,720 – 769 – – – 18,193Other – 7,779 2,866 2,845 74 838 2,601 1,406 – 791 472 19,672
TotalEurope 1,094 19,776 2,934 3,346 124 4,558 2,601 2,175 – 791 472 37,871
NorthAmericaGovernments – 595 – 1 – 3 – – – – – 599Otherfinancialinstitutions 720 10 22 23 – 1,552 – 99 – – – 2,426Other – 674 2,923 4,877 492 1,213 35 809 – 229 428 11,680
TotalNorthAmerica 720 1,279 2,945 4,901 492 2,768 35 908 – 229 428 14,705
AsiaGovernments – – – – – – – – – – – –Otherfinancialinstitutions 2,532 – – 1 – 246 – – – – – 2,779Other – 11 5,050 224 9 583 2,675 39 – 179 482 9,252
TotalAsia 2,532 11 5,050 225 9 829 2,675 39 – 179 482 12,031
OtherGovernments – – 6 – – – – – – – – 6Otherfinancialinstitutions 152 – – – – 41 – – – – – 193Other – 12 31 158 1 752 102 – – 48 6 1,110
Totalother 152 12 37 158 1 793 102 – – 48 6 1,309
Total 6,120 25,909 15,518 45,796 2,779 11,913 10,444 5,066 5,847 2,425 4,071 135,888
Totalgrosscreditrisk 135,888

MacquarieBankLimited2007FinancialReport80
Notestothefinancialstatements3�March2007continued
Note46.CreditriskcontinuedThefollowingprovidesdetailaroundtheactivemanagementofCreditRiskbytheeconomicentity:
TheeconomicentityentersintomasternettingagreementswithitscounterpartiestomanagethecreditriskwhereithastradingderivativesintheEquityMarketsandTreasuryandCommoditiesdivisions.Creditderivativeshavebeenusedbytheeconomicentitytomitigateriskbybuyingandsellingprotectionoverbalancesheetassets.Asat3�March2007thefairvalueofthecreditderivativeswas$2millionnegativevalue(2006:$�millionpositivevalue).Stockborrowingandreverserepurchasearrangementsenteredintobytheeconomicentitywithexternalcounterpartiesrequirescollateralof�05%(whichisconsistentwithindustrypractice).Mortgageinsurancecontractsareenteredintoinordertomanagethecreditriskaroundthemortgageportfolios.Asat3�March2007,loansof$22.�billion(2006:$�8.�billion)werecoveredbythesecontracts.Otherriskmitigationmeasuresincludeblockeddeposits,bankguaranteesandlettersofcredit.Asat3�March2007,thisamountedto$2,305million(2006:$426million).
Bank2007 Creditriskconcentration Cashcollateral Derivative Debt Interestin onsecurities Loanassets Otherfinancial financial investment Credit associatesand borrowedand Trading heldat assetsatfair instruments securities commitments jointventures Duefrom reverserepurchase portfolio amortised valuethrough –positive available andcontingent usingthe Controlled DuefromBanks agreements assets cost profitandloss values Otherassets forsale liabilities equitymethod entities Total $m $m $m $m $m $m $m $m $m $m $m $m
AustraliaGovernments – 48 895 18 125 218 – – 92 – – 1,396Otherfinancialinstitutions 1,288 1,086 706 65 – 1,104 – 1,264 – 4 – 5,517Other – 3,658 2,902 12,753 1,931 1,504 3,592 111 1,697 479 8,170 36,797
TotalAustralia 1,288 4,792 4,503 12,836 2,056 2,826 3,592 1,375 1,789 483 8,170 43,710
NewZealandCentralbank – – – – – 1 – – – – – 1Otherfinancialinstitutions 16 1 – – – 4 – – – – – 21Other – – – 49 – 35 – – – – 345 429
TotalNewZealand 16 1 – 49 – 40 – – – – 345 451
EuropeGovernments – – 6 – – – – – – – – 6Otherfinancialinstitutions 987 11,997 62 – 50 3,506 – 769 – – – 17,371Other – 7,779 2,866 2,811 – 837 1,106 593 39 – 2,791 18,822
TotalEurope 987 19,776 2,934 2,811 50 4,343 1,106 1,362 39 – 2,791 36,199
NorthAmericaGovernments – 595 – – – – – – – – – 595Otherfinancialinstitutions 391 10 22 20 – 1,337 – 99 – – – 1,879Other – 657 2,556 2,808 74 912 1 18 60 53 1,683 8,822
TotalNorthAmerica 391 1,262 2,578 2,828 74 2,249 1 117 60 53 1,683 11,296
AsiaOtherfinancialinstitutions 1,897 – – – – 245 – – – – – 2,142Other – – 4,909 83 – 561 – – 11 77 441 6,082
TotalAsia 1,897 – 4,909 83 – 806 – – 11 77 441 8,224
OtherGovernments – – 6 – – – – – – – – 6Otherfinancialinstitutions 1 – – – – 41 – – – – – 42Other – 12 1 152 – 742 – – 48 – 97 1,052
Totalother 1 12 7 152 – 783 – – 48 – 97 1,100
Total 4,580 25,843 14,931 18,759 2,180 11,047 4,699 2,854 1,947 613 13,527 100,980
Totalgrosscreditrisk 100,980

8�
Note46.CreditriskcontinuedThefollowingprovidesdetailaroundtheactivemanagementofCreditRiskbytheeconomicentity:
TheeconomicentityentersintomasternettingagreementswithitscounterpartiestomanagethecreditriskwhereithastradingderivativesintheEquityMarketsandTreasuryandCommoditiesdivisions.Creditderivativeshavebeenusedbytheeconomicentitytomitigateriskbybuyingandsellingprotectionoverbalancesheetassets.Asat3�March2007thefairvalueofthecreditderivativeswas$2millionnegativevalue(2006:$�millionpositivevalue).Stockborrowingandreverserepurchasearrangementsenteredintobytheeconomicentitywithexternalcounterpartiesrequirescollateralof�05%(whichisconsistentwithindustrypractice).Mortgageinsurancecontractsareenteredintoinordertomanagethecreditriskaroundthemortgageportfolios.Asat3�March2007,loansof$22.�billion(2006:$�8.�billion)werecoveredbythesecontracts.Otherriskmitigationmeasuresincludeblockeddeposits,bankguaranteesandlettersofcredit.Asat3�March2007,thisamountedto$2,305million(2006:$426million).
Bank2007 Creditriskconcentration Cashcollateral Derivative Debt Interestin onsecurities Loanassets Otherfinancial financial investment Credit associatesand borrowedand Trading heldat assetsatfair instruments securities commitments jointventures Duefrom reverserepurchase portfolio amortised valuethrough –positive available andcontingent usingthe Controlled DuefromBanks agreements assets cost profitandloss values Otherassets forsale liabilities equitymethod entities Total $m $m $m $m $m $m $m $m $m $m $m $m
AustraliaGovernments – 48 895 18 125 218 – – 92 – – 1,396Otherfinancialinstitutions 1,288 1,086 706 65 – 1,104 – 1,264 – 4 – 5,517Other – 3,658 2,902 12,753 1,931 1,504 3,592 111 1,697 479 8,170 36,797
TotalAustralia 1,288 4,792 4,503 12,836 2,056 2,826 3,592 1,375 1,789 483 8,170 43,710
NewZealandCentralbank – – – – – 1 – – – – – 1Otherfinancialinstitutions 16 1 – – – 4 – – – – – 21Other – – – 49 – 35 – – – – 345 429
TotalNewZealand 16 1 – 49 – 40 – – – – 345 451
EuropeGovernments – – 6 – – – – – – – – 6Otherfinancialinstitutions 987 11,997 62 – 50 3,506 – 769 – – – 17,371Other – 7,779 2,866 2,811 – 837 1,106 593 39 – 2,791 18,822
TotalEurope 987 19,776 2,934 2,811 50 4,343 1,106 1,362 39 – 2,791 36,199
NorthAmericaGovernments – 595 – – – – – – – – – 595Otherfinancialinstitutions 391 10 22 20 – 1,337 – 99 – – – 1,879Other – 657 2,556 2,808 74 912 1 18 60 53 1,683 8,822
TotalNorthAmerica 391 1,262 2,578 2,828 74 2,249 1 117 60 53 1,683 11,296
AsiaOtherfinancialinstitutions 1,897 – – – – 245 – – – – – 2,142Other – – 4,909 83 – 561 – – 11 77 441 6,082
TotalAsia 1,897 – 4,909 83 – 806 – – 11 77 441 8,224
OtherGovernments – – 6 – – – – – – – – 6Otherfinancialinstitutions 1 – – – – 41 – – – – – 42Other – 12 1 152 – 742 – – 48 – 97 1,052
Totalother 1 12 7 152 – 783 – – 48 – 97 1,100
Total 4,580 25,843 14,931 18,759 2,180 11,047 4,699 2,854 1,947 613 13,527 100,980
Totalgrosscreditrisk 100,980
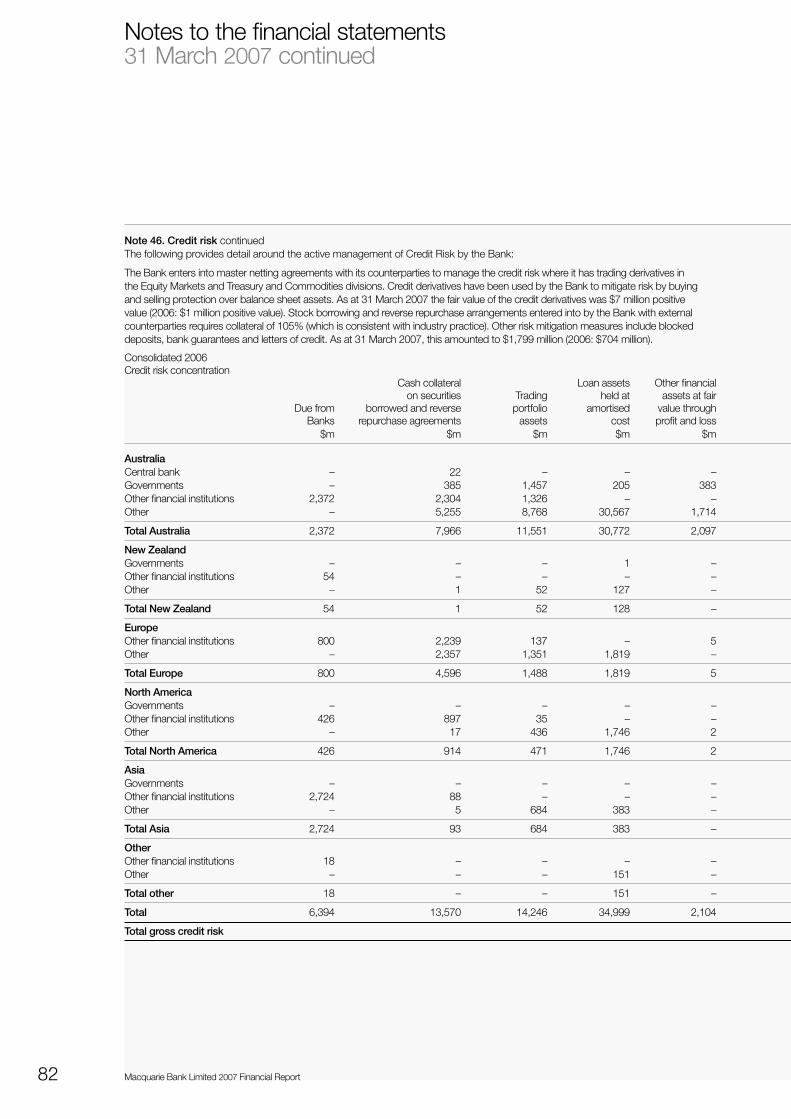
MacquarieBankLimited2007FinancialReport82
Note46.CreditriskcontinuedThefollowingprovidesdetailaroundtheactivemanagementofCreditRiskbytheBank:
TheBankentersintomasternettingagreementswithitscounterpartiestomanagethecreditriskwhereithastradingderivativesintheEquityMarketsandTreasuryandCommoditiesdivisions.CreditderivativeshavebeenusedbytheBanktomitigateriskbybuyingandsellingprotectionoverbalancesheetassets.Asat3�March2007thefairvalueofthecreditderivativeswas$7millionpositivevalue(2006:$�millionpositivevalue).StockborrowingandreverserepurchasearrangementsenteredintobytheBankwithexternalcounterpartiesrequirescollateralof�05%(whichisconsistentwithindustrypractice).Otherriskmitigationmeasuresincludeblockeddeposits,bankguaranteesandlettersofcredit.Asat3�March2007,thisamountedto$�,799million(2006:$704million).
Consolidated2006Creditriskconcentration Derivative Debt Life Interestin Cashcollateral Loanassets Otherfinancial financial investment investment Credit associatesand onsecurities Trading heldat assetsatfair instruments securities contractsand commitments jointventures Duefrom borrowedandreverse portfolio amortised valuethrough –positive available otherunit andcontingent usingthe Banks repurchaseagreements assets cost profitandloss values Otherassets forsale holderassets liabilities equitymethod Total $m $m $m $m $m $m $m $m $m $m $m $m
AustraliaCentralbank – 22 – – – 78 – – – – – �00Governments – 385 �,457 205 383 29 – – – 2 – 2,46�Otherfinancialinstitutions 2,372 2,304 �,326 – – 267 – �,879 – – – 8,�48Other – 5,255 8,768 30,567 �,7�4 4,57� 4,94� 390 5,�83 535 2,5�5 64,439
TotalAustralia 2,372 7,966 ��,55� 30,772 2,097 4,945 4,94� 2,269 5,�83 537 2,5�5 75,�48
NewZealandGovernments – – – � – – – – – – – �Otherfinancialinstitutions 54 – – – – 8 – – – – – 62Other – � 52 �27 – 67 26 – – � 3 277
TotalNewZealand 54 � 52 �28 – 75 26 – – � 3 340
EuropeOtherfinancialinstitutions 800 2,239 �37 – 5 2,332 – 373 – – – 5,886Other – 2,357 �,35� �,8�9 – 655 822 �35 – 77 233 7,449
TotalEurope 800 4,596 �,488 �,8�9 5 2,987 822 508 – 77 233 �3,335
NorthAmericaGovernments – – – – – � – – – – – �Otherfinancialinstitutions 426 897 35 – – 5�0 – �8 – – – �,886Other – �7 436 �,746 2 �,2�0 280 399 – 246 33� 4,667
TotalNorthAmerica 426 9�4 47� �,746 2 �,72� 280 4�7 – 246 33� 6,554
AsiaGovernments – – – – – 9 – – – – – 9Otherfinancialinstitutions 2,724 88 – – – 387 – – – – �� 3,2�0Other – 5 684 383 – 429 2,358 – – 42 368 4,269
TotalAsia 2,724 93 684 383 – 825 2,358 – – 42 379 7,488
OtherOtherfinancialinstitutions �8 – – – – 66 – – – – – 84Other – – – �5� – 359 25 7 – �3 2 557
Totalother �8 – – �5� – 425 25 7 – �3 2 64�
Total 6,394 �3,570 �4,246 34,999 2,�04 �0,978 8,452 3,20� 5,�83 9�6 3,463 �03,506
Totalgrosscreditrisk �03,506
Notestothefinancialstatements3�March2007continued

83
Note46.CreditriskcontinuedThefollowingprovidesdetailaroundtheactivemanagementofCreditRiskbytheBank:
TheBankentersintomasternettingagreementswithitscounterpartiestomanagethecreditriskwhereithastradingderivativesintheEquityMarketsandTreasuryandCommoditiesdivisions.CreditderivativeshavebeenusedbytheBanktomitigateriskbybuyingandsellingprotectionoverbalancesheetassets.Asat3�March2007thefairvalueofthecreditderivativeswas$7millionpositivevalue(2006:$�millionpositivevalue).StockborrowingandreverserepurchasearrangementsenteredintobytheBankwithexternalcounterpartiesrequirescollateralof�05%(whichisconsistentwithindustrypractice).Otherriskmitigationmeasuresincludeblockeddeposits,bankguaranteesandlettersofcredit.Asat3�March2007,thisamountedto$�,799million(2006:$704million).
Consolidated2006Creditriskconcentration Derivative Debt Life Interestin Cashcollateral Loanassets Otherfinancial financial investment investment Credit associatesand onsecurities Trading heldat assetsatfair instruments securities contractsand commitments jointventures Duefrom borrowedandreverse portfolio amortised valuethrough –positive available otherunit andcontingent usingthe Banks repurchaseagreements assets cost profitandloss values Otherassets forsale holderassets liabilities equitymethod Total $m $m $m $m $m $m $m $m $m $m $m $m
AustraliaCentralbank – 22 – – – 78 – – – – – �00Governments – 385 �,457 205 383 29 – – – 2 – 2,46�Otherfinancialinstitutions 2,372 2,304 �,326 – – 267 – �,879 – – – 8,�48Other – 5,255 8,768 30,567 �,7�4 4,57� 4,94� 390 5,�83 535 2,5�5 64,439
TotalAustralia 2,372 7,966 ��,55� 30,772 2,097 4,945 4,94� 2,269 5,�83 537 2,5�5 75,�48
NewZealandGovernments – – – � – – – – – – – �Otherfinancialinstitutions 54 – – – – 8 – – – – – 62Other – � 52 �27 – 67 26 – – � 3 277
TotalNewZealand 54 � 52 �28 – 75 26 – – � 3 340
EuropeOtherfinancialinstitutions 800 2,239 �37 – 5 2,332 – 373 – – – 5,886Other – 2,357 �,35� �,8�9 – 655 822 �35 – 77 233 7,449
TotalEurope 800 4,596 �,488 �,8�9 5 2,987 822 508 – 77 233 �3,335
NorthAmericaGovernments – – – – – � – – – – – �Otherfinancialinstitutions 426 897 35 – – 5�0 – �8 – – – �,886Other – �7 436 �,746 2 �,2�0 280 399 – 246 33� 4,667
TotalNorthAmerica 426 9�4 47� �,746 2 �,72� 280 4�7 – 246 33� 6,554
AsiaGovernments – – – – – 9 – – – – – 9Otherfinancialinstitutions 2,724 88 – – – 387 – – – – �� 3,2�0Other – 5 684 383 – 429 2,358 – – 42 368 4,269
TotalAsia 2,724 93 684 383 – 825 2,358 – – 42 379 7,488
OtherOtherfinancialinstitutions �8 – – – – 66 – – – – – 84Other – – – �5� – 359 25 7 – �3 2 557
Totalother �8 – – �5� – 425 25 7 – �3 2 64�
Total 6,394 �3,570 �4,246 34,999 2,�04 �0,978 8,452 3,20� 5,�83 9�6 3,463 �03,506
Totalgrosscreditrisk �03,506

MacquarieBankLimited2007FinancialReport84
Notestothefinancialstatements3�March2007continued
Note46.Creditriskcontinued
Bank2006 Creditriskconcentration Cashcollateral Derivative Debt Interestin onsecurities Loanassets Otherfinancial financial investment Credit associatesand borrowedand Trading heldat assetsatfair instruments securities commitments jointventures Duefrom reverserepurchase portfolio amortised valuethrough –positive available andcontingent usingthe Controlled DuefromBanks agreements assets cost profitandloss values Otherassets forsale liabilities equitymethod entities Total $m $m $m $m $m $m $m $m $m $m $m $m
AustraliaCentralbank – 22 – – – 78 – – – – – �00Governments – 385 �,457 �6� �78 29 – – 2 – – 2,2�2Otherfinancialinstitutions 2,092 2,304 �,305 – – 266 – �,386 – – – 7,353Other – 5,255 8,7�6 9,484 �,7�4 4,308 3,043 �32 550 765 5,972 39,939
TotalAustralia 2,092 7,966 ��,478 9,645 �,892 4,68� 3,043 �,5�8 552 765 5,972 49,604
NewZealandOtherfinancialinstitutions �� – – – – 8 – – – – – �9Other – � – (7) – 67 – – � – �63 225
TotalNewZealand �� � – (7) – 75 – – � – �63 244
EuropeOtherfinancialinstitutions 738 2,239 �37 – – 2,270 – 359 – – – 5,743Other – 2,357 �,283 �,8�8 – 650 �70 �3� 24 3 �,672 8,�08
TotalEurope 738 4,596 �,420 �,8�8 – 2,920 �70 490 24 3 �,672 �3,85�
NorthAmericaOtherfinancialinstitutions �09 898 35 – – 5�0 – – – – – �,552Other – �6 97 �,228 2 �,209 – 45 �93 2� �,04� 3,852
TotalNorthAmerica �09 9�4 �32 �,228 2 �,7�9 – 45 �93 2� �,04� 5,404
AsiaCentralBanks – – – – – 9 – – – – – 9Otherfinancialinstitutions �,628 88 – – – 385 – – – – – 2,�0�Other – – – 346 – 406 – – 8 42 �,006 �,808
TotalAsia �,628 88 – 346 – 800 – – 8 42 �,006 3,9�8
OtherOtherfinancialinstitutions � – – – – 66 – – – – – 67Other – – – �5� – 357 – – �3 2 387 9�0
Totalother � – – �5� – 423 – – �3 2 387 977
Total 4,579 �3,565 �3,030 �3,�8� �,894 �0,6�8 3,2�3 2,053 79� 833 �0,24� 73,998
Totalgrosscreditrisk 73,998

85
Note46.Creditriskcontinued
Bank2006 Creditriskconcentration Cashcollateral Derivative Debt Interestin onsecurities Loanassets Otherfinancial financial investment Credit associatesand borrowedand Trading heldat assetsatfair instruments securities commitments jointventures Duefrom reverserepurchase portfolio amortised valuethrough –positive available andcontingent usingthe Controlled DuefromBanks agreements assets cost profitandloss values Otherassets forsale liabilities equitymethod entities Total $m $m $m $m $m $m $m $m $m $m $m $m
AustraliaCentralbank – 22 – – – 78 – – – – – �00Governments – 385 �,457 �6� �78 29 – – 2 – – 2,2�2Otherfinancialinstitutions 2,092 2,304 �,305 – – 266 – �,386 – – – 7,353Other – 5,255 8,7�6 9,484 �,7�4 4,308 3,043 �32 550 765 5,972 39,939
TotalAustralia 2,092 7,966 ��,478 9,645 �,892 4,68� 3,043 �,5�8 552 765 5,972 49,604
NewZealandOtherfinancialinstitutions �� – – – – 8 – – – – – �9Other – � – (7) – 67 – – � – �63 225
TotalNewZealand �� � – (7) – 75 – – � – �63 244
EuropeOtherfinancialinstitutions 738 2,239 �37 – – 2,270 – 359 – – – 5,743Other – 2,357 �,283 �,8�8 – 650 �70 �3� 24 3 �,672 8,�08
TotalEurope 738 4,596 �,420 �,8�8 – 2,920 �70 490 24 3 �,672 �3,85�
NorthAmericaOtherfinancialinstitutions �09 898 35 – – 5�0 – – – – – �,552Other – �6 97 �,228 2 �,209 – 45 �93 2� �,04� 3,852
TotalNorthAmerica �09 9�4 �32 �,228 2 �,7�9 – 45 �93 2� �,04� 5,404
AsiaCentralBanks – – – – – 9 – – – – – 9Otherfinancialinstitutions �,628 88 – – – 385 – – – – – 2,�0�Other – – – 346 – 406 – – 8 42 �,006 �,808
TotalAsia �,628 88 – 346 – 800 – – 8 42 �,006 3,9�8
OtherOtherfinancialinstitutions � – – – – 66 – – – – – 67Other – – – �5� – 357 – – �3 2 387 9�0
Totalother � – – �5� – 423 – – �3 2 387 977
Total 4,579 �3,565 �3,030 �3,�8� �,894 �0,6�8 3,2�3 2,053 79� 833 �0,24� 73,998
Totalgrosscreditrisk 73,998

Macquarie Bank Limited 2007 Financial Report86
Notes to the financial statements 31 March 2007 continued
Consolidated Consolidated Bank Bank 2007 2006 2007 2006 $’000 $’000 $’000 $’000
Note 47. Audit and other services provided by PricewaterhouseCoopers (“PwC”)During the financial year, the auditor of the Bank and economic entity, PwC, and its related practices earned the following remuneration:
PwC – Australian firmAudit and review of financial reports of the Bank or any entity in the economic entity 3,420 3,324 2,404 2,709Other audit-related work 1,579 1,090 1,448 966Other assurance services 454 451 454 407
Total audit and other assurance services 5,453 4,865 4,306 4,082Advisory services 1,432 552 1,432 552Taxation 361 249 361 249
Total remuneration paid to PwC – Australian firm 7,246 5,666 6,099 4,883
Related practices of PwC – Australian firm (including PwC – overseas firms)Audit and review of financial reports of the Bank or any entity in theeconomic entity 3,460 2,775 126 70Other audit-related work 425 199 356 12Other assurance services 25 148 – –
Total audit and other assurance services 3,910 3,122 482 82Advisory services 5,681 2,754 – –Taxation 1,113 1,426 – –
Total remuneration paid to related practices of PwC – Australian firm 10,704 7,302 482 82
Total remuneration paid to PwC 17,950 12,968 6,581 4,965
Use of PwC’s services on other than audit and assurance engagements is restricted in accordance with the Bank’s Auditor Independence policy. These assignments are principally tax compliance and agreed upon assurance procedures in relation to acquisitions.
Certain fees for advisory services are in relation to Initial Public Offerings and due diligence services for new funds. These fees may be recovered by the economic entity upon the successful establishment of the funds.
It is the Bank’s policy to seek competitive tenders for all major advisory projects.

87
Note48.AcquisitionanddisposalofcontrolledentitiesEntitiesacquiredorconsolidatedduetochangeincontrol:
a)MacquarieSmallCapsRoads(anadditionalfourtollroads:CentralAlabamaAssets;plustheDetroitWindsorTunnel)On�2May2006,asubsidiaryoftheBankacquired�00%oftheassetsinfourtollroad-relatedcompaniesinAlabama,USA.Acquiredonthesamedaywas�00%oftheequityofMacquarieNorthAmericanInfrastructure,Inc,whosewhollyownedsubsidiary,TheDetroit&CanadaTunnelCorporationisthecontrollerunderlong-termconcessionoftheUSoperationsandoperatorundersubcontractoftheCanadianoperationsoftheDetroitWindsorTunnel.
b)EastLondonBusGroupHoldingsLimitedOn22June2006,asubsidiaryoftheBanksignedasaleandpurchaseagreementtoacquire�00%ofEastLondonBusGroupHoldingsLimited.ThecompanyownsandoperatesabusandcoachbusinessintheUnitedKingdom.
c)CervusFinancialCorpOn6July2006,asubsidiaryoftheBankpurchaseda�00%interestinCervusFinancialCorp,alistedCanadiancorporationwithestablishedmortgageservicingcontractsandmortgagebrokernetwork.
d)CoronaEnergyHoldingsLimitedOn3�July2006,asubsidiaryoftheBank,MacquarieInternationaleInvestmentsLimited,acquired�00%ofthesharecapitalofCoronaEnergyHoldingsLimited,aUnitedKingdomnon-domesticgassupplycompany.
e)LongviewOilandGasOn26October2006,asubsidiaryoftheBankacquired�00%ofthebusinessassetsofLongviewOilandGas.Thebusinesshasaseriesofoperationaloilandgasproperties,gasprocessingplantandgasgatheringinfrastructure,locatedinArkansas,USA.
Aggregatedetailsoftheacquisitions(includingdisposalgroups)areasfollows:
2007 2006 $m $m
FairvalueofnetassetsacquiredCashandotherfinancialassets 103 �82Derivativesandfinancialinstruments–positivevalues 39 269Fixedassets 8 28Intangibleassets 14 ��2Assetsofdisposalgroupsclassifiedasheldforsale 1,189 2,27�Derivativefinancialinstruments–negativevalues – (254)Payables,provisionsandborrowings (135) (�97)Liabilitiesofdisposalgroupsclassifiedasheldforsale (674) (�,660)Minorityinterestindisposalgroupsclassifiedasheldforsale – (�5�)
Totalfairvalueofnetassetsacquired 544 600
PurchaseconsiderationCashconsideration 544 589Deferredconsideration – 76
Totalpurchaseconsideration 544 665
ReconciliationofcashmovementCashconsideration (544) (589)Lesscashacquired 10 279
Totalcashoutflow (534) (3�0)
Theoperatingresultsoftheseentitieshavenothadamaterialimpactontheresultsoftheeconomicentity.
Therearenosignificantdifferencesbetweenthefairvalueofnetassetsacquiredandtheacquiree’scarryingvalueofnetassetsotherthanthegoodwillandotherintangibleassetsnotedabove.
The3�March2006comparativesrelatetotheacquisitionsofDaeguEastCirculationRoadCompany,S2NetLimited(formerlyOpenTelecommunicationsLimited),KoreanPowerInvestmentCo.Limited,ATMSolutionsAustralasia,TheSteamPacketGroupLimited,SmarteCarteCorporation,AHAAccessHealthAbbotsfordLimitedandAHAAccessHealthVancouverLimited,BaldwinCountyBridgeCompanyLLCandMacquarieCookEnergyLLC(formerlyCookInletEnergySupplyLLC).

MacquarieBankLimited2007FinancialReport88
Notestothefinancialstatements3�March2007continued
Note48.AcquisitionanddisposalofcontrolledentitiescontinuedEntitiesdisposedofordeconsolidatedduetochangeincontrol:
a)MacquarieSmallCapsRoadsOn2October2006,asubsidiaryoftheBanksold�00%ofitsinterestinMacquarieSmallCapsRoads.
b)SmarteCarteCorporationOn20November2006,asubsidiaryoftheBanksoldpartofitsinvestmentinSmarteCarteCorporation.AsubsidiaryoftheBankhasretaineda�0%interest.
c)EastLondonBusGroupHoldingsLimitedOn24November2006,asubsidiaryoftheBanksolditsinterestinEastLondonBusGroupHoldingsLimited.AsubsidiaryoftheBankhasretaineda�0%interest.
d)TheSteamPacketGroupLimitedOn�9December2006,asubsidiaryoftheBanksolditsinterestinTheSteamPacketGroupLimited.AsubsidiaryoftheBankhasretaineda�0%interest.
e)AccessHealthAbbotsfordLimitedandAccessHealthVancouverLimitedOn30January2007,asubsidiaryoftheBanksolditsinterestinAHAHoldingsLimitedandVancouverHealthHoldingsLimited.
f)ForwardStepsHoldingsLimitedOn�3December2006,asubsidiaryoftheBank,MacquarieLeisureServicesPtyLimited,enteredintoaShareSaleAgreementtosellitsinterestinForwardStepsHoldingsLimited(“FSHL”).Thetransactionsettledon2February2007.
Aggregatedetailsofthedisposalsareasfollows: 2007 2006 $m $m
CarryingvalueofassetsandliabilitiesdisposedofCashandotherfinancialassets 2 –Assetsofdisposalgroupsclassifiedasheldforsale 3,015 �,099Fixedassets 1 –Intangibleassets 21 –Liabilitiesofdisposalgroupsclassifiedasheldforsale (2,361) (687)Payablesandprovisions (1) –Minorityinterestindisposalgroupsclassifiedasheldforsale – (�39)
Totalcarryingvalueofassetsandliabilitiesdisposedof 677 273
ReconciliationofcashmovementCashreceived* 1,125 460Less:Investmentretained (61) (��0)Cashdeconsolidated (163) (�02)
Totalcashinflow 901 248
*Cashreceivedincludestherepaymentofintercompanydebtinthe3�March2006financialyear.
The3�March2006comparativesrelatetothedeconsolidationofRGCapitalandDMGRegionalRadio,DaeguEastCirculationRoadCompanyandKoreanPowerInvestmentCo.Limited.
Note49.EventsoccurringafterreportingdateTherewerenomaterialpostbalancesheeteventsoccurringafterthereportingdaterequiringdisclosureinthesefinancialstatements.

89
IntheDirectors’opinion
(a)thefinancialstatementsandnotessetoutonpages7to88,andauditedremunerationdisclosuresonpages47to90intheDirectors’Report,areinaccordancewiththeCorporations Act 2001,including:
(i) complyingwithAustralianAccountingStandards,theCorporations Regulations 2001andothermandatoryprofessionalreportingrequirements;and
(ii) givingatrueandfairviewoftheBankandconsolidatedentity’sfinancialpositionasat3�March2007andofitsperformance,asrepresentedbytheresultsofitsoperationsanditscashflows,forthefinancialyearendedonthatdate;and
(b)therearereasonablegroundstobelievethatMacquarieBankLimitedwillbeabletopayitsdebtsasandwhentheybecomedueandpayable.
TheDirectorshavebeengiventhedeclarationsbythechiefexecutiveofficerandchieffinancialofficerrequiredbysection295AoftheCorporations Act 2001.
ThisdeclarationismadeinaccordancewitharesolutionoftheDirectors.
DavidClarkeExecutiveChairman
AllanMossManagingDirectorandChiefExecutiveOfficer
Sydney�4May2007
MacquarieBankLimitedanditscontrolledentitiesDirectors’Declaration

MacquarieBankLimited2007FinancialReport90
IndependentAuditReporttotheMembersofMacquarieBankLimited
AuditopinionInouropinion:
�.thefinancialreportofMacquarieBankLimited:
–givesatrueandfairview,asrequiredbytheCorporations Act 2001inAustralia,ofthefinancialpositionofMacquarieBankLimitedandtheMacquarieBankGroup(definedbelow)asat3�March2007,andoftheirperformancefortheyearendedonthatdate,and
–ispresentedinaccordancewiththeCorporations Act 2001,AccountingStandardsandothermandatoryfinancialreportingrequirementsinAustralia,andtheCorporations Regulations 2001;and
2.theremunerationdisclosuresthatarecontainedonpages47to90oftheDirectors’ReportcomplywithAccountingStandardAASB�24Related Party Disclosures(AASB�24)andtheCorporations Regulations 2001.
Thisopinionmustbereadinconjunctionwiththerestofourauditreport.
ScopeThe financial report, remunerations disclosures and Directors’ responsibilityThefinancialreportcomprisesthebalancesheet,incomestatement,cashflowstatements,statementofchangesinequity,accompanyingnotestothefinancialstatements,andtheDirectors’declarationforbothMacquarieBankLimited(thecompany)andtheMacquarieBankGroup(theconsolidatedentity),fortheyearended3�March2007.Theconsolidatedentitycomprisesboththecompanyandtheentitiesitcontrolledduringthatyear.
ThecompanyhasdisclosedinformationabouttheremunerationofDirectorsandExecutives(remunerationdisclosures)asrequiredbyAASB�24,undertheheading“remunerationreport”onpages47to90ofthedirectors’report,aspermittedbytheCorporations Regulations 2001.
TheDirectorsofthecompanyareresponsibleforthepreparationandtrueandfairpresentationofthefinancialreportinaccordancewiththeCorporations Act 2001.Thisincludesresponsibilityforthemaintenanceofadequateaccountingrecordsandinternalcontrolsthataredesignedtopreventanddetectfraudanderror,andfortheaccountingpoliciesandaccountingestimatesinherentinthefinancialreport.TheDirectorsarealsoresponsiblefortheremunerationdisclosurescontainedintheDirectors’Report.

9�
Weformedourauditopiniononthebasisoftheseprocedures,whichincluded:
–examining,onatestbasis,informationtoprovideevidencesupportingtheamountsanddisclosuresinthefinancialreportandremunerationdisclosures,and
–assessingtheappropriatenessoftheaccountingpoliciesanddisclosuresusedandthereasonablenessofsignificantaccountingestimatesmadebytheDirectors.
OurproceduresincludereadingtheotherinformationintheAnnualReviewtodeterminewhetheritcontainsanymaterialinconsistencieswiththeFinancialReport.
Whileweconsideredtheeffectivenessofmanagement’sinternalcontrolsoverfinancialreportingwhendeterminingthenatureandextentofourprocedures,ourauditwasnotdesignedtoprovideassuranceoninternalcontrols.
Ourauditdidnotinvolveananalysisoftheprudenceofbusinessdecisionsmadebydirectorsormanagement.
IndependenceInconductingouraudit,wefollowedapplicableindependencerequirementsofAustralianprofessionalethicalpronouncementsandtheCorporations Act 2001.
PricewaterhouseCoopers
IanHammondPartner
Sydney�4May2007
LiabilitylimitedbyaschemeapprovedunderProfessionalStandardsLegislation.
Audit approachWeconductedanindependentauditinordertoexpressanopiniontothemembersofthecompany.OurauditwasconductedinaccordancewithAustralianAuditingStandards,inordertoprovidereasonableassuranceastowhetherthefinancialreportisfreeofmaterialmisstatementandtheremunerationdisclosurescomplywithAASB�24andClassOrder06/50.Thenatureofanauditisinfluencedbyfactorssuchastheuseofprofessionaljudgement,selectivetesting,theinherentlimitationsofinternalcontrol,andtheavailabilityofpersuasiveratherthanconclusiveevidence.Therefore,anauditcannotguaranteethatallmaterialmisstatementshavebeendetected.Forfurtherexplanationofanaudit,visitourwebsitehttp://www.pwc.com/au/financialstatementaudit.
Weperformedprocedurestoassesswhetherinallmaterialrespectsthefinancialreportpresentsfairly,inaccordancewiththeCorporations Act 2001,AccountingStandardsandothermandatoryfinancialreportingrequirementsinAustralia,aviewwhichisconsistentwithourunderstandingofthecompany’sandtheconsolidatedentity’sfinancialposition,andoftheirperformanceasrepresentedbytheresultsoftheiroperations,changesinequityandcashflows.WealsoperformedprocedurestoassesswhethertheremunerationdisclosurescomplywithAASB�24andtheCorporations Regulations 2001.

MacquarieBankLimited2007FinancialReport92
Withtheexceptionof3�March2005,thefinancialinformationpresentedbelowhasbeenbasedontheaccountingstandardsadoptedateachreportingdate.Thefinancialinformationfortheperiodsended3�March2005andlaterarebasedonresultsreportedunderAustralianAccountingStandardsthatincorporateInternationalFinancialReportingStandards.
Yearsended31March �998 �999 2000 200� 2002 2003 2004 2005 2006 2007
Incomestatement($million)Totalincomefromordinaryactivities 757 904 �,337 �,649 �,822 2,�55 2,823 4,�97 4,832 7,181Totalexpensesfromordinaryactivities (590) (686) (�,036) (�,324) (�,467) (�,695) (2,�38) (3,039) (3,545) (5,253)Operatingprofitbeforeincometax �67 2�8 30� 325 355 460 685 �,�58 �,287 1,928Incometaxexpense (26) (53) (79) (53) (76) (96) (�6�) (288) (290) (377)Profitfortheyear �4� �65 222 272 279 364 524 870 997 1,551MacquarieIncomePreferredSecuritiesdistributions – – – – – – – (28) (5�) (54)Otherminorityinterests – – – � – (3) (3) (�) (�) (3)MacquarieIncomeSecuritiesdistributions – – (�2) (3�) (29) (28) (27) (29) (29) (31)Profitattributabletoordinaryequityholders �4� �65 2�0 242 250 333 494 8�2 9�6 1,463
Balancesheet($million)Totalassets 7,929 9,456 23,389 27,848 30,234 32,462 43,77� 67,980 �06,2��136,389Totalliabilities 7,348 8,805 22,�54 26,5�0 27,8�7 29,877 40,938 63,555 �00,874128,870Netassets 58� 65� �,235 �,338 2,4�7 2,585 2,833 4,425 5,337 7,519Risk-weightedassets 4,967 4,987 8,5�� 9,860 �0,65� �0,030 �3,36� �9,77� 28,75� 39,386Totalloanassets 3,�58 4,002 6,5�8 7,785 9,209 9,839 �0,777 28,425 34,999 45,796Impairedassets(netofprovisions) �2 44 23 3� 49 �6 6� 42 85 88
ShareinformationCashdividendspershare(centspershare) Interim 2� 30 34 4� 4� 4� 52 6� 90 125 Final 30 38 52 52 52 52 70 �00 �25 190 Special – – – – – 50 – 40 – – Total 5� 68 86 93 93 �43 �22 20� 2�5 315Basicearningspershare(centspershare) 88.� �0�.3 �24.3 �38.9 �32.8 �64.8 233.0 369.6 400.3 591.6Sharepriceat3�March($)(a) �4.35 �9.�0 26.40 27.63 33.26 24.70 35.80 48.03 64.68 82.75Ordinarysharecapital(millionshares)(b) �57.6 �6�.� �7�.2 �75.9 �98.5 204.5 2�5.9 223.7 232.4 253.9Marketcapitalisationat3�March(fullypaidordinaryshares)($million) 2,262 3,077 4,520 4,860 6,602 5,05� 7,729 �0,744 �5,032 21,010
RatiosReturnonaverageordinaryshareholders’funds 26.�% 26.8% 28.�% 27.�% �8.7% �8.0% 22.3% 29.8% 26.0% 28.1%Payoutratio 57.9% 67.2% 70.0% 67.5% 73.6% 87.4%(c)53.2% 53.2% 54.4% 54.3%Tier�ratio ��.7% �3.0% �4.5% �2.9% �7.8% �9.0% �6.2% �4.4% �2.4% 15.0%Capitaladequacyratio �6.4% �7.3% �8.4% �6.0% �9.4% 2�.4% �9.9% 2�.2% �4.�% 15.5%Expense/incomeratio 77.9% 75.9% 77.5% 80.3% 80.5% 78.7% 75.7% 72.4% 73.4% 73.2%Impairedassetsas%ofloanassets(excludingsecuritisationSPVsandsegregatedfuturesfunds) 0.4% �.�% 0.3% 0.4% 0.5% 0.2% 0.6% 0.3% 0.5% 0.4%Netloanlossesas%ofloanassets(excludingsecuritisationSPVsandsegregatedfuturesfunds) 0.0% 0.�% 0.�% 0.�% 0.2% 0.0% 0.3% 0.2% 0.2% 0.1%
Assetsundermanagement($billion)(d) 2�.4 22.8 26.3 30.9 4�.3 52.3 62.6 96.7 �40.3 197.2
Staffnumbers(e) 2,474 3,��9 4,070 4,467 4,726 4,839 5,7�6 6,556 8,�83 10,023
(a) TheBank’sordinaryshareswerequotedontheAustralianStockExchangeon29July�996(b) Numberoffullypaidordinarysharesat3�March,excludingoptionsandpartlypaidshares.(c) Thespecialdividendfor2003waspaidtoreleaseone-offfrankingcreditstoshareholdersonentryintotaxconsolidation.
Excludingthespecialdividendof50centspershare,thepayoutratiowouldhavebeen56.8%.(d) ThemethodologyusedtocalculateassetsundermanagementwasrevisedinSeptember2005.Comparativesat3�March2005
havebeenrestatedinaccordancewiththerevisedmethodology.(e) Includesbothpermanentstaff(fulltime,parttimeandfixedterm)andcontractors(includingconsultantsandsecondees).
MacquarieBankLimitedanditscontrolledentitiesTenyearhistory

eTreeMacquarie Bank is proud to be a Foundation Member of eTree. eTree is a Computershare Limited initiative with Landcare Australia which provides an environmental incentive to shareholders of Australian companies to elect to receive shareholder communications electronically. For every shareholder who registers an email address Macquarie will donate $2 to Landcare Australia to support reforestation projects in the state or territory where the registered shareholder resides.
Macquarie Bank shareholders can register to receive their shareholder communications, such as the Annual Review, electronically, by visiting www.etree.com.au/macquarie and registering their email address.
The Holey Dollar In 1813 Governor Lachlan Macquarie overcame an acute currency shortage by purchasing Spanish silver dollars (then worth five shillings), punching the centres out and creating two new coins – the ‘Holey Dollar’ (valued at five shillings) and the ‘Dump’ (valued at one shilling and three pence).
This single move not only doubled the number of coins in circulation but increased their worth by 25 per cent and prevented the coins leaving the colony. Governor Macquarie’s creation of the Holey Dollar was an inspired solution to a difficult problem and for this reason it was chosen as the symbol for the Macquarie Group.
2007 Annual General Meeting Macquarie Bank’s 2007 Annual General Meeting will be held at 10.30am on Thursday, 19 July 2007 at the Westin Sydney, in the Grand Ballroom, Lower Level, No.1 Martin Place, Sydney.
Details of the business of the meeting will be contained in the separate Notice of Annual General Meeting to be sent to shareholders.
Cover: Thames Water Thames Water is the largest water and wastewater services company in the United Kingdom, serving eight million water and 13 million wastewater customers across London and the Thames Valley. The history of Thames Water dates back to the early 1600s when the privately funded New River, a 40-mile channel, was built to create London’s water supply.
On 1 December 2006, a Macquarie-led consortium, Kemble Water, acquired Thames Water for £8 billion ($A19.88 billion). Kemble Water, named after the town near the headwaters of the Thames River, is the largest consortium Macquarie has ever brought together and includes investors from Europe, North America and Australasia.
On Kemble Water’s behalf, Macquarie has been working closely with Thames Water management to help lay the foundations for a new era for the company.
The Macquarie Bank 2007 annual report is printed on Media Print, an EMAS accredited paper stock which is totally chlorine free. EMAS is the European Union’s regulated environmental management system.
The Macquarie Bank Group’s 2007 annual report consists of two documents – the 2007 Annual Review (incorporating the Concise Report) and the 2007 Financial Report. The Annual Review provides an overview of the Group’s operations and a summary of the financial statements. This Financial Report contains the Bank’s risk management report and statutory financial statements.
If you would like a copy of the 2007 Annual Review please call us on +61 2 8232 5006 or visit www.macquarie.com.au/shareholdercentre.
Des
igne
d by
Fro
st D
esig
n, S
ydne
y
Prin
t man
agem
ent b
y O
ctop
us S
olut
ions
Macquarie Bank Head Office No.1 Martin Place Sydney NSW 2000 Australia
Tel: +61 2 8232 3333 Fax: +61 2 8232 3350
Registered Office Macquarie Bank Limited Level 3, 25 National Circuit Forrest ACT 2603 Australia
Tel: +61 2 6225 3000
Cover photograph by Steve Speller. Map image © Crown Copyright (2007). All rights reserved. Ordnance Survey Licence Number 100019345.

www.macquarie.com.au MACQUARIE BANK LIMITED ACN 008 583 542
MA
CQ
UA
RIE
BA
NK
2007 FINA
NC
IAL R
EPO
RT
MACQUARIE BANK 2007 FINANCIAL REPORT