2007-04-27 Acer 1Q 2007 Investor Conference (Print) · Q1, 2007 Investor Conference April 27, 2007...
22
Acer Inc. Q1, 2007 Investor Conference April 27, 2007 www.acer.com
Transcript of 2007-04-27 Acer 1Q 2007 Investor Conference (Print) · Q1, 2007 Investor Conference April 27, 2007...

Acer Inc.Q1, 2007
Investor Conference
April 27, 2007
www.acer.com

1
� The information is provided for informational purposes only, and is not an offer to buy or sell or a solicitation of an offer to buy or sell any security issued by Acer or other parties
� Acer’s statements that are not historical facts are forward-looking statements that indicate actions or results of actions that may occur in the future, based on current available information and underlying assumptions.
� Acer does not warranty their accuracy, reliability and completeness. There are a number of factors such as economic conditions, firms abilities, industry environment that could cause actual results and developments to differ materially from those expressed or implied by forward looking statements. Investors should not place undue reliance on them.
Legal Disclaimer

Consolidated Financial Results
Howard Chan
CFO & V.P.
3
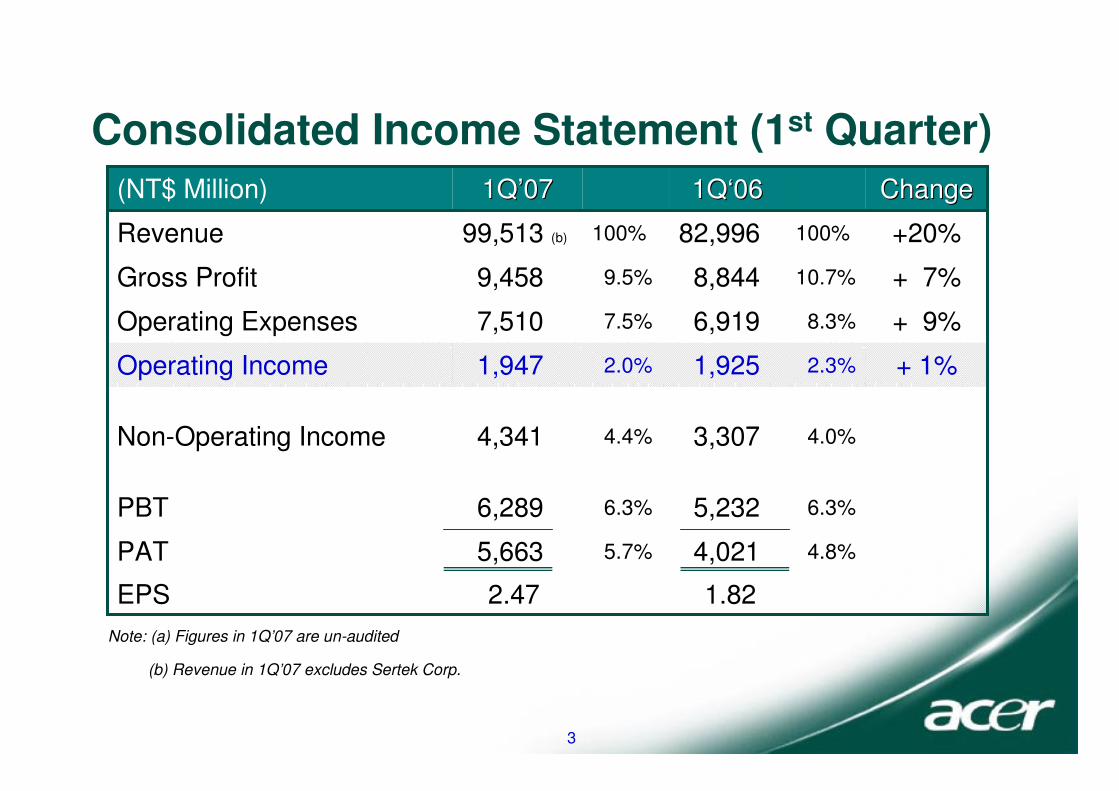
Consolidated Income Statement (1st Quarter)
4.8%4,0215.7%5,663PAT
1.822.47EPS
6.3%5,2326.3%6,289PBT
4.0%3,3074.4%4,341Non-Operating Income
+ 1%2.3%1,9252.0%1,947Operating Income
+ 9%8.3%6,9197.5%7,510Operating Expenses
+ 7%10.7%8,8449.5%9,458Gross Profit
+20%100%82,996100%99,513 (b)Revenue
ChangeChange1Q1Q‘‘06061Q1Q’’0707(NT$ Million)
Note: (a) Figures in 1Q’07 are un-audited
(b) Revenue in 1Q’07 excludes Sertek Corp.

4
Consolidated Revenue and Gross Margin
0
30,000
60,000
90,000
120,000
(NT
$ M
illio
n)
0.0%
5.0%
10.0%
15.0%
Revenue 49,432 48,625 56,057 70,901 65,710 65,676 82,518 104,184 82,996 72,855 94,726 118,516 99,513
Gross Margin 12.8% 12.2% 11.1% 12.3% 12.1% 11.0% 9.9% 10.3% 10.7% 10.7% 10.0% 10.8% 9.5%
Revenue Growth 63% 47% 39% 32% 33% 35% 47% 47% 26% 11% 15% 14% 20%
1Q'04 2Q'04 3Q'04 4Q'04 1Q'05 2Q'05 3Q'05 4Q'05 1Q'06 2Q'06 3Q'06 4Q'06 1Q'07
Q1, 2007 Revenue Growth: +20% Y/YQ1, 2007 Revenue Growth: +20% Y/Y

5
Consolidated Operating Income
����
� ��� ��� ��� ��
� � ���� � ���� � ���� � ���
� � � ��� � � ��� � � ��� � � ��
� � ���� � ���� � ���� � ���
� � � ��� � � ��� � � ��� � � ��(N
T$
mill
ion
)
�� � �� � � �� � � �� � � �
� � � �� � � �� � � �� � � �
� � � �� � � �� � � �� � � �
Op. Income 893 672 720 1,521 1,940 1,659 1,778 2,272 1,925 1,516 1,976 2,396 1,947
Op. Margin - % 1.8% 1.4% 1.3% 2.1% 3.0% 2.5% 2.2% 2.2% 2.3% 2.1% 2.1% 2.0% 2.0%
1Q'04 2Q'04 3Q'04 4Q'04 1Q'05 2Q'05 3Q'05 4Q'05 1Q'06 2Q'06 3Q'06 4Q'06 1Q'07
Note: (a) Operating Income in 1Q’05 includes one-time special gains

6
Consolidated Balance Sheet
35%68,685Notes & Account receivable
34%66,166Account payable
40%79,034Total Shareholders' Equity60%116,921Total Liabilities58%113,836Current Liabilities24%47,670Other current liabilities
100%195,955Total Asset1%2,283Others5%10,091Property, plant and equipment5%9,356Long-term Investment
89%174,224Total Current Assets10%19,121Others13%25,361Inventory
6%12,314Financial Assets-Current
25%48,743Cash and cash equivalence
Current Assets
Mar. 31, 2007Mar. 31, 2007(NT$ Million)
Healthy Financial RatioHealthy Financial Ratio
� Current Ratio : 153%
� Quick Ratio : 123%
� Liability Ratio : 60%
� Liability / E Ratio : 148%

7
Holding & Investment Business
1366237590.51%CDFH
17,541
7,868
508
797
6,057
1,552
Market ValueMarket Value(NT$ M)(NT$ M)
10,297
5,290
65
217
2,718
1,384
Book ValueBook Value(NT$ M)(NT$ M)
7,244
2,578
443
580
3,339
168
Potential GainPotential Gain(Apr. 24,2007)(Apr. 24,2007)
0.04% Hon Hai
9.35%Wistron
Major Shareholdings
0.04% TSMC
Others*
4.71%
Percentage of Percentage of OwnershipOwnership
Total
BenQ
Note: The above numbers are valued on April 24, 2007*Others include Venture Capital Business

�Dividend Policy (NT$ per share )
�Employee Bonus (Percentage of 90% PAT plus or minus Special Reserve)
Dividend & Employee Bonus
3.00.23.832005
2.30.63.382004
2.5250.5053.612003
0.15
1.033
Stock
4.45
4.46
EPS
3.852006
2.0662002
CashYear
4.0%4.0%2005
1.6%6.4%2004
4.48%3.52%2006
6.4%
7%
Stock
1.6%2003
1% 2002
CashYear
* 10% for Legal Reserve

Business Review
Gianfranco Lanci
President

10
IT Product Revenue Breakdown by Geography
4%56%
2%
23%
15%
EMEA Pan AmericaAsia Pacific TaiwanChina
6%
15%
18%
5%56%
EMEA Pan AmericaAsia Pacific Taiwan & HKChina
Note: (a) Asia Pacific excludes Greater China (Taiwan, HK, and Mainland China)
(b) EMEA stands for Europe, Middle East and Africa
(c) China includes HK from Q3 ’06
Q1, 2007 US$2,791M
(NT$91,856 M)
Q1, 2006 US$2,222M
(NT$71,782 M)

11
IT Product Revenue Breakdown
59%
7%
15%
19%
Notebook Desktop PC
Display Others
Note: Others include servers, projector and IA products
16%
17%
5%
62%
Notebook Desktop PC
Display Others
Q1, 2007 US$2,791M
(NT$91,856 M)
Q1, 2006 US$2,222M
(NT$71,782 M)

12
26
15
1214
18 19
22
3230
1917
232222
17
14
1919
1213
15
10
20
30
40
1Q'0
2
2Q'0
2
3Q'0
2
4Q'0
2
1Q'0
3
2Q'0
3
3Q'0
3
4Q'0
3
1Q'0
4
2Q'0
4
3Q'0
4
4Q'0
4
1Q'0
5
2Q'0
5
3Q'0
5
4Q'0
5
1Q'0
6
2Q'0
6
3Q'0
6
4Q'0
6
1Q
'07
Inventory Turnover Days (ADS)
IT Products Business IT Products Business
Note: Q2' 03 and Q3' 03 inventory rose due to increased sourcing of key components in order to avoid antici pated shortages
13
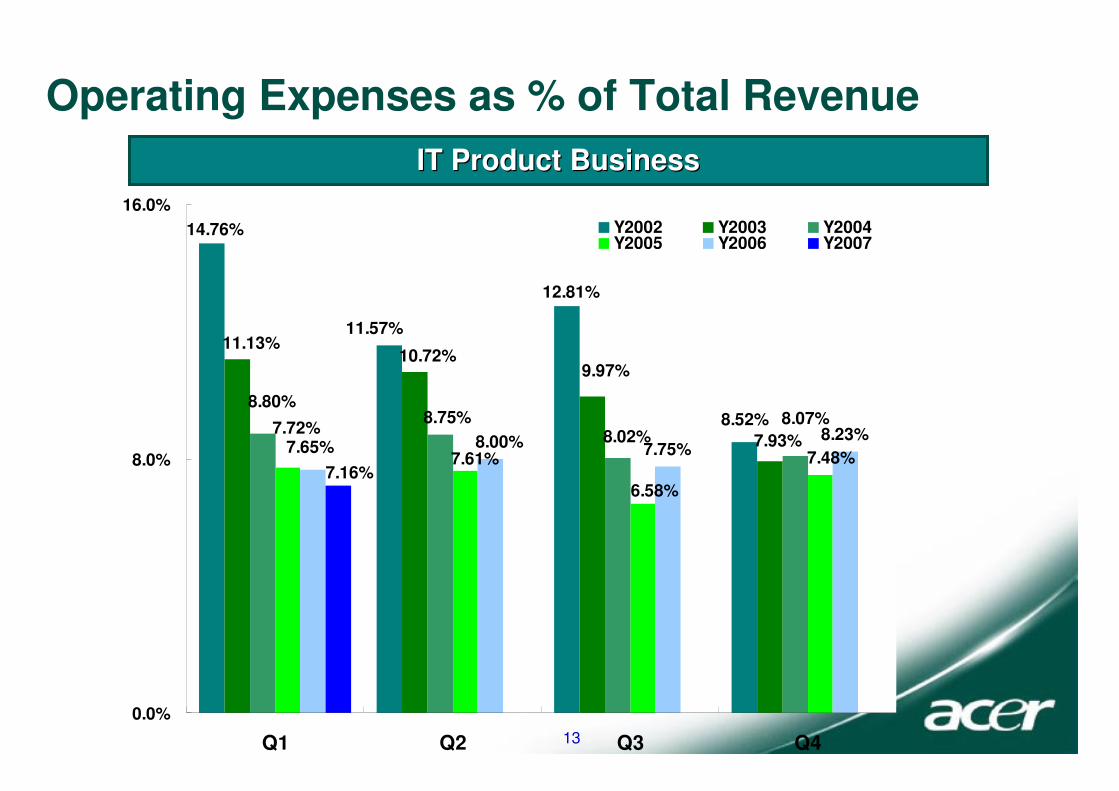
Operating Expenses as % of Total RevenueIT Product Business IT Product Business
8.23%
14.76%
11.57%
12.81%
8.52%
11.13%10.72%
9.97%
7.93%
8.80%8.75%
8.02%8.07%
7.48%
7.72%
7.61%
6.58%
7.75%8.00%7.65%7.16%
0.0%
8.0%
16.0%
Q1 Q2 Q3 Q4
Y2002 Y2003 Y2004Y2005 Y2006 Y2007

Acer Business Status & Strategy
J.T. Wang
Chairman & CEO

Top 5 PC Brands Worldwide (1Q’07)
16.1%5.9%7.1%6.3%Lenovo4
Unit GrowthMarket Share
15.3%3.8%3.9%4.1%Toshiba5
8.9%Overall Market
46.1%5.1%7.1%6.8%3
- 7.8%16.4%14.0%13.9%Dell2
28.7%14.9%17.4%17.6%HP1
YoY1Q’064Q’061Q’07Rank
Source: Gartner Source

Top 5 PC Brands Worldwide (1Q’07) Unit GrowthMarket Share
12.8%4.3%3.9%4.3%Toshiba5
10.9%Overall Market
41.4%5.3%7.1%6.7%4
17.4%6.4%7.4%6.7%Lenovo3
- 6.9%18.2%14.9%15.2%Dell2
28.2%16.5%18.4%19.1%HP1
YoY1Q’064Q’061Q’07Rank
Source: IDC Source

17
Acer Strategy after Top 3 Achieved
1. Continued growth through organic growth, M&A and strategic alliances.
2. Emphasize growth in the desktop PC market more aggressively by investing more resources while sustaining strong growth in the notebook PC market.
3. No set target date to achieve strategic point No. 2. Our priority is to enhance operation efficiency, profitability and sustainability.
4. High priority of balance sheet optimization.

18
HP Patent Law SuitsFacts
1. Acer emphasizes the development of its own intellectual property and respects the intellectual property rights of others. Acer owns approximately one thousand worldwide PC related patents.
2. Acer products are designed following open industrial standards. Acer buys fully assembled products from the same group of ODM manufacturers & key component
suppliers as the other major PC brand companies.

19
3. Acer’s ODM manufacturers are obligated to indemnify Acer from claims of patent infringement.
4. Notwithstanding our opinion discussed above, Acer will be subject to legal proceedings carried out in the US.

20
Present Assessment
Acer Products should continue to be available through its
established sales channels in the U.S.A. to serve US
consumers.
HP Patent Law Suits

21
Q & A
April 27, 2007
www.acer.com