2006, Volume 7, Number 2 - Latvijas Universitāte · 2006, Volume 7, Number 2 Editors Solveiga...
62
Transcript of 2006, Volume 7, Number 2 - Latvijas Universitāte · 2006, Volume 7, Number 2 Editors Solveiga...

2
2006, Volume 7, Number 2
EditorsSolveiga Miezītis, Ph.D, University of Latvia, University of TorontoMalgožata Raščevska, Dr. Psych., University of Latvia
Members of International Editorial BoardImants Barušs, Ph. D, University of Western Ontario, CanadaLinas A. Bieliauskas, Ph. D, University of Michigan Medical Center, USARobert L. Burden, Ph. D, University of Exeter, United KingdomArthur Cropley, Ph. D, University of Hamburg, Germany, AustraliaJuris G. Draguns, Ph. D, Pennsylvania State University, University Park, USAIlze Kalniņš, Ph. D, University of Toronto, CanadaĀrija Karpova, Dr. habil. psych., University of LatviaRimas Kočiunas, Ph. D, Vilnius University, LithuaniaThomas Oakland, Ph. D, University of Florida, USAAldis Putniņš, Ph. D, University of South AustraliaViesturs Reņģe, Dr. Psych., University of LatviaSandra Sebre, Ph. D, University of LatviaBernie Stein, Ph. D, Ministry of Education, IsraelAntanas Valantinas, Ph.D, Ministry of Education and Science, Lithuania
Authors should submit manuscripts to:Prof. Malgožata RaščevskaDepartment of Psychology,Faculty of Education and Psychology,University of Latvia,Jurmalas gatve 74/76Riga, Latvia, LV 1083Phone, fax: 371-7034018E-mail: [email protected] secretary of the Journal: Vizma ZaķeCover design: Svetlana NarkevicaLayout: Latvijas Universitātes Akadēmiskais apgāds
ISSN 1407 - 768X © Department of Psychology, University of Latvia, 2006
3
Contents
Introduction: Special Edition of VII International Baltic Psychology Conference Addresses and Presentations ..................................................................... 4
KEYNOTE’S PRESENTATION ..................................................................................... 6
The Betula study: Reliabilities and Long-Term Stabilitiesof Memory Test Performances Over the Adult LifespanMichael Rönnlund, Lars-Göran Nilsson ......................................................................... 6
PRESENTATIONS OF EMPIRICAL STUDIES ......................................................... 15
Humor Effect on Stress Responses: The experimental study using stress inducing movieIeva Stokenberga ............................................................................................................... 15
Gender and Age Differences in Emotional Intelligence, Stoicism and Aggression Anda Gaitniece-Putāne, Malgožata Raščevska .............................................................. 26
Subjective Well-being and Satisfaction with Partnership of Pregnant Women, Women without Pregnancy and their PartnersIlze Mizāne, Ieva Bite ....................................................................................................... 43
PROFESSIONAL EXPERIENCE IN BALTIC STATES .............................................. 50
Guidance and Counselling in Higher Education: Where do we stand in the Baltics?Solveiga Miezītis ................................................................................................................ 50
Notes on Authors ............................................................................................................. 60
Notes for authors .............................................................................................................. 62

4
Introduction: Special Edition of VII International Baltic Psychology Conference Addresses and Presentations
The 2006 issues of the Baltic Journal of Psychology feature the keynote addresses and paper presentations of the VII International Baltic Psychology Conference, held on June 15 – 17, 2006 at the University of Latvia in Riga, Latvia The conference theme was “Baltic Psychology in Global Context: Where Do We Stand?”.
The first 2006 issue of the Baltic Journal of Psychology included keynote address-es by Juris Draguns (USA), Imants Barušs (Canada), and Arthur Cropley (Australia/Germany), as well as papers by René Mõttus (Estonia), Julija Gaiduk (Lithuania), and Sarmīte Voitkāne, Solveiga Miezīte, Malgožata Raščevska, Mārtiņš Vanags, (Latvia).
The lead article of this issue is the joint paper by Lars-Göran Nilsson (Stockholm Brain Institute, Karolinska Institute) and Michael Rönnlund’s (Umeå University) “The Betula study: Reliabilities and Long-Term Stabilities of Memory Test Performances Over the Adult Lifespan” which informs the readers with the main results of the Bet-ula study on memory, health, and aging.
Ieva Stokenberga (University of Latvia) discusses the effect of humour on the stress responses based on her empirical study: “Humor Effect on Stress Responses: The Experimental Study Using Stress Inducing Movie”.
Anda Gaitniece-Putāne (University of Latvia) explores differences in emotional intelligence, stoicism and aggression among 20-25 and 30-35 year old men and women in her article “Differences in Emotional Intelligence, Stoicism and Aggression among 20-25 and 30-35 Year Old Men and Women”.
Ilze Mizāne and Ieva Bite (University of Latvia) present the results of a study that examines differences on subjective well- being, satisfaction with the partnership and intimacy between women and their partners over the period of pregnancy and in non-pregnant women.
Finally in the section on “Professional Experience in the Baltic states” Solveiga Miezītis (University of Latvia and University of Toronto) informs the readers about an important theme for university staff and counselling practitioners “Guidance and Counselling in Higher Education: Where do We Stand in the Baltics?” She presents the issues raised in the newly released FEDORA Report on Guidance and Counsel-ling in Higher Education in European Union Member States edited by Michael Katzen-steiner, Paula Ferrer-Sama, and Gerhart Rott as well as a summary of the proposed Vilnius Charter discussed at the FEDORA conference in Vilnius in October, 2006. She invites responses to these two documents in order to initiate a dialogue about the challenges and the progress in introducing guidance and counselling services in the Baltic countries.
Baltic Journal of Psychology, 2006, 7 (2), 4–5

5
We would also welcome suggestions for discussion among colleagues on other topics related to policy issues and professional practice in the Baltic countries.
Solveiga MiezītisMalgožata Raščevska
Introduction: Special Edition of VII International Baltic Psychology Conference Addresses and ..
6
KEYNOTE’S PRESENTATION
The Betula study: Reliabilities and Long-Term Stabilitiesof Memory Test Performances Over the Adult Lifespan
Michael Rönnlund Umeå University
Lars-Göran NilssonStockholm University
Stockholm Brain Institute, Karolinska Institute
Major characteristics of the Betula study on memory, health, and aging (Nilsson et al., 1997, 2004) were presented. In addition, reliability and stability coefficients (5 and 10 years) were computed for individual measures of episodic memory and semantic memory (and for Block Design and MMSE) and for unit-weighted composites (min. n = 1000, 830, and 643 for T1, T2, and T3, respectively). Reliability estimates ranged from .42 to .88 overall. Stability coefficients were substantial at the composite level (r = 77-.83) and did not differ for younger (35-55 years) and older adults (60-80 years). Finally, the stability coefficients decreased minimally over retest intervals, regardless of age. Together, the results indicate considerable stability of inter-indi-vidual differences of declarative memory across age and time, suggesting that heterogeneity of the aging processes, at least as reflected at the behavioral level, may be less prominent than is often asserted. This indication of relative lack of diversity needs to be supplemented with care-ful analyses of differences/changes in variance across age and time. 1 Keywords: Episodic memory, semantic memory, aging, reliability, stability coefficients.
In this paper we present some major characteristics of the Betula Study (Nilsson et al., 1997; 2004), an ongoing longitudinal study of memory, health and aging and report measurement properties and temporal stabilities of several of the cognitive measures included in the test battery.
The Betula study is being conducted in the city of Umeå in the northern part of Sweden. Colloquially, Umeå is known as the city of birch trees. Because the Latin word for birch tree is betula (alba), the project is referred to as the Betula Study. An overall purpose of the Betula Study is to examine the development of memory and health in adulthood and old age. More specific purposes are to explore early, preclinical signs and potential risk factors of dementia, and to obtain premorbid measures of memory and health in people who will be in accidents or will acquire various diseases affecting the central nervous system during the course of the study.
Baltic Journal of Psychology, 2006, 7 (2), 6–14
1 Author’s note. Correspondence concerning this article should be addressed to Michael Rönnlund, e-mail: [email protected]
7
The general design of the study includes four samples of subjects with 10 differ-ent age cohorts in each. All participants were randomly sampled from the population registry in Umeå. Subjects in the first sample (S1) were tested the first time in 1988-1990 (T1), in 1993-1995 (T2), in 1998-2000 (T3), and in 2003-2005 (T4). Subjects in the next two samples (S2 and S3) were tested the first time at T2 and then at T3. S3 participants were also called back to T4. At T3 a new sample (S4) was tested and at T4 still another sample (S5) was tested. The reason for introducing new samples at these latter occasions was to estimate the size of practice effects from one test occasion to the next.
Subjects in S1 were 35, 40, 45, 50, 55, 60, 65, 70, 75, and 80 years of age when first tested at T1. Subjects in S2 were also 35, 40, 45, 50, 55, 60, 70, 75, and, 80 years of age when they were tested the first time, five years later, at T2. Subjects in S3 were 40, 45, 50 …, 85 years of age when they were tested the first time at T2. Subjects in S4 were 35, 40, 45, 50, 55, 60, 65, 70, 75, 80, 85, and, 90 years of age when they were tested for the first time at T3. A total of 100 subjects participated in each cohort of S1, S2, and S3 when the sample was first tested. In S4 and S5 the corresponding number of par-ticipants was 50.
At each wave of data collection, subjects took part in extensive cognitive test-ing and health examination. They also completed questionnaires about various social variables. The measures of cognition were selected to cover various aspects: episodic memory, semantic memory, primary memory, implicit memory, procedural memory, cognitive speed, and spatial cognition. In addition to these tests, memory functioning was also assessed by means of subjective ratings. An extensive description of all these variables can be found in Nilsson et al. (1997).
Social variables included marital status, profession, type of dwelling, living condi-tions, education, life style, current daily activities, profession, profession and activities of spouse, children, parents, friends, as well as activities during childhood and ado-lescence.
The health variables included self ratings of health and various blood parameters (see Nilsson et al., 1997). Measures of diastolic and systolic blood pressure, and pulse rate were also taken. Hearing and vision status, height, weight, body mass index, bi-ceps, and triceps skin-fold were also measured. Other health related factors include: dental status, health care consumption, previous diseases, diseases of relatives, medi-cation, substance use, subjective ratings of stress, activities of daily living (hygiene etc), personality, mood and seasonal variation.
Several articles have been published including cognitive data from the Betula Study. In recent years, we have examined cognitive functions in relation to genetic markers and brain imaging (e.g., Lind et al., 2006a, 2006b, in press; Nilsson, 2006a, 2006b; Persson et al., 2006).
Since the majority of the cognitive measures in the Betula battery were designed specifically for the purpose of the study, rather than drawn from pre-existing batter-ies, it is important to consider the psychometric properties of the individual measures including their reliabilities. With regard to reliability, previous studies (e.g., Nyberg et al., 1996; Rönnlund et al., 2003) reported ranges for the spilt-half coefficients for some
The Betula study: Reliabilities and Long-Term Stabilities of Memory Test Performances Over the ..
8
of the individual measures. In the present paper we provide information concerning reliability, as estimated by the Spearman-Brown coefficient or by Cronbach´s alpha, across a wider range of cognitive measures that include measures of episodic memory and semantic memory and measures assumed to reflect global intellectual function-ing (MMSE; Folstein, Folstein, & McHugh, 1975) and aspects of fluid intelligence/visuospatial functioning (WAIS-R Block Design, Wechsler, 1981).
In addition, five- and ten-year stability coefficients are reported for the individual cognitive measures and for composite (episodic/semantic) scores. As concerns the stability coefficients it is important to note that departure from unity not only signals lack of perfect reliability but also reflects inter-individual differences in time-related changes across the retest interval. Thus, although high values should be indicative of good test-retest reliability, a finding of relatively modest values could either come as the result of inefficient test-retest reliability, as a result of large inter-individual vari-ability over time, or a mixture of these factors.
Both with regard to estimates of within-occasion reliability/consistency and tem-poral stability of cognitive performance, attention was paid to potential age differenc-es, such that estimates were computed for the whole group and for the five youngest and oldest age cohorts, respectively. Apart from being useful for sake of future refer-ence, these estimates bear on important theoretical issues. It has often been argued that older as compared with younger adults exhibit more dispersion and inconsist-ency (i.e., within and between-occasion variability) with regard to sensory-motor and cognitive performance (for supportive evidence see Anstey, 1999, Christensen et al., but see Robertson, Myerson, & Hale, 2006), and are more diverse (i.e., at the inter-in-dividual level; see Morse, 1993 for partial support of this notion).
If increased age is indeed coupled with substantial increases in heterogeneity at the intra- and inter-individual levels, one might predict that estimates obtained from groups of older as compared with younger adults show lower values of internal con-sistency. In a related vein, if the cognitive aging processes (as reflected at the level of behavior) are accompanied by a large extent of heterogeneity with regard to rate and direction of time-related change, stability coefficients might be expected to be lower in older adults, and to decrease substantially with longer retest-intervals, for older participants in particular.
Method
Participants The results are mainly based on data from Sample 1, which was first tested in
1988-1990), and originally included 1000 participants (35, 40, 45, 50, 55, 60, 65, 70, 75, and, 80 years) that were screened for dementia, sensory impairments, mental re-tardation and a native tongue other than Swedish (see Nilsson et al., 1997 for fur-ther details concerning recruitment, inclusion criteria and representativeness). At T2 (1993-1995), 863, non-demented participants were able to return (for at least partial measurements). On the cognitive measures considered at present the returnee rate ranged from 815-853 (this difference mostly reflect the fact that testing was undertak-
Michael Rönnlund, Lars-Göran Nilsson
9
en during to separate sessions with some individuals only willing to take part of the first session). At Time 3 (1998-2000), finally, a total of 651 non-demented individuals were able to be re-assessed on at least some of cognitive measure considered (n = 602-651 across the measures). Within occasion reliabilities were mainly established for S1 at Time 1, comparison with the other samples tested for the first time (S2 at T2, and S3 at T3) yielding similar values.
Materials and ProcedureThe memory tasks described below were administered during two test sessions,
both of which lasted between 1.5 and 2 hours for each subject. For detailed descrip-tions of the structure of the test sessions and complete lists of the tests included from T1 to T3, the reader may consult Nilsson et al. (1997) and Nilsson (1999). The present inclusion of tests was based on the availability of data coded at the item-level (for some tests, e.g., face/noun recognition, these data were not available) and on their status with respect to current use (e.g., a measure of general knowledge included at T1 and T2 only was excluded). Episodic Memory Measures
Recall of sentences and actions. Participants were presented with two lists of 16 verb-noun sentences, each denoting a simple action (e.g., lift the book) that were read aloud by the experimenter (8 seconds/per item). For one list, participants were re-quested to remember the sentences without further instructions of how to encode the material. Immediately following presentation the sentences were to be recalled orally in any order. Responses containing the correct verb and noun were counted (FR sentences). For the other list each sentence was enacted by the participant, using the specified object (8 seconds/item). A free recall test of the sentences followed. Number of sentences (including the correct verb and noun) recalled in the enacted condition was entered in the analyses (FR actions).
Cued recall of nouns. The nouns of the sentences and actions within each of the two study lists belonged to four semantic categories (e.g., fruits, musical instruments, body parts, kitchen utensils). Following the free recall test, participants were provided with a sheet listing the eight semantic categories into which the nouns of the 32 sentences (described above) could be divided. They were told that these might serve as cues to remember the nouns. Number of nouns recalled from the verbal (CR sentences) and the enacted encoding condition (CR actions) served as a measure in the analyses.
Recall/divided attention. Participants were presented with four lists, each includ-ing 12 nouns. The items in each list were read aloud by the experimenter at a pace of 2 seconds/item. Following presentation of the last item of each list, participants re-called as many of the nouns as possible in any order at a given pace (2 seconds/item), indicated by a metronome. For one list, the task was performed under conditions of full attention at study and retrieval. Study/retrieval of words in the other lists was paired with performing a secondary task. This task consisted of sorting red and black cards into two piles on basis of colour (2 seconds/item). In one condition, division of attention occurred at study of the nouns, but not at retrieval. In another condition, participants were requested to sort the cards at retrieval of the nouns, but not at study. In a fourth condition, division of attention occurred both at study and retrieval of the
The Betula study: Reliabilities and Long-Term Stabilities of Memory Test Performances Over the ..

10
words. Preliminary analyses revealed low split-half (.20-.30; T1 -T3) and retest coef-ficients (in the .40-range over the first retest interval). At present we performed the analyses on the basis of the four conditions combined.
Activity recall. At the end of the second test session, the participants were asked to recall (describe) the tests they had performed during the second test session, in any order. The total number of activities identified as performed previously (Activity Recall) served as the measure entered in the analyses of temporal stability1. Semantic Memory Measures
Vocabulary. Vocabulary was measured by means of a 30 item multiple-choice syn-onym test (SRB; Dureman, 1960). In this test the participant was requested to select the synonym of each target word from among five alternatives. Seven minutes were allotted for completing the test.
General knowledge. This test of general knowledge introduced at Time 4, con-sists of 26 general-knowledge questions (e.g., “What is the capital city of Ethiopia?”, “How many players are there in a soccer team?”). For each question the participants were provided with four alternatives out of which the correct should be picked out. Number of correct answers served as the dependent measure. Semantic Tests: Fluency Measures
Word fluency. Three word fluency tests were considered at present. In each test, the participants generated as many words as possible in one minute with restrictions on what type of words should be generated varying across tests. In the first test, the participants said aloud as many words as possible with an initial letter A (Fluency A). The second test was to produce as many words as possible beginning with M and con-taining five letters (Fluency M5). The third test was to generate as many professions as possible with the initial letter B (Fluency PB).
Results and DiscussionEstimates of reliability of the cognitive measures, five- and ten-year stability coef-
ficients were computed for each of the cognitive measures. The resulting values are provided in Table 1. The results pertaining to individual cognitive measures are organized in accord
with the targeted cognitive constructs (episodic memory, semantic memory, visu-ospatial ability, and global intellectual functioning with WAIS-R Block Design and MMSE as single markers of the latter). For the episodic and semantic measures simple composite scores (based on six and four individual measures, respectively) were in addition computed (unit-weighted z-scores) for the sake of examining the effect of ag-gregation on the stability coefficients. For each measure values are given for the whole sample and separately for the five youngest (35-55 years) and the five oldest cohorts (60-80 years). The stability coefficients are given for five- (T1-T2) and ten-year (T1-T2) retest intervals.
A common criterion of acceptable within-occasion estimates of reliability is .70 or above. As can be seen from table 1, two of the episodic memory measures (word recall, activity memory) meet this criterion, whereas the others attained lower values
Michael Rönnlund, Lars-Göran Nilsson

11
(.52-.63, overall data). Presumably due to restriction in range imposed by the age-split (all of the episodic measures were negatively correlated with age; see Nilsson et al., 1997), values for 35-55 year and 60 to 85-year olds, respectively, were lower in general as compared with the overall coefficients. Of main interest, the values appear highly similar for the younger and older group, suggesting that internal consistency of test performances are invariant across the age span.
As concerns the two semantic memory measures for which split-half estimates were applicable (general knowledge and vocabulary), values are acceptable, both as judged from the overall estimates and from estimates for the younger and older half of the sample. Block design similarly yielded high values overall and for separate age groups, whereas MMSE was associated with a low value (.40) even as judged from the full sample data. As such, this is not surprising given that it is a screening test, yielding near ceiling-level performance in particular across the younger groups.
Table 1. Reliability and Stability Coefficients of Individual Cognitive Measures and for Unit-Weighted Composite Scores (Episodic and Semantic Memory). Values are Given for the Whole Sample and Separately for the Five Youngest (35-55 years) and the Five Oldest
(60-80 years) Groups
Reliability coefficientsa Stability coefficients (5/10 years)
Construct Measure Overall 35-55 yrs 60-80 yrs Overall 35-55 yrs 60-80 yrsEpisodic Memory FR Actions .63 .42 .47 .63/.64 .44/.55 .54/.53
CR Actions .52 .36 .42 .50/.52 .36/.44 .45/.50FR Sentences .62 .54 .48 .51/.63 .42/.64 .43/.51CR Sentences .64 .52 .63 .42/.68 .29/.66 .39/.65Word Recall .79 .73 .75 .72/.71 .64/.67 .66/.66Activity Recall .88 .89 .84 .60/.59 .55/.56 .54/.53Composite score - - - .83/.82 .78/.80 .76/.78
Semantic Memory Vocabulary .86 .81 .88 .86/.82 .85/.84 .85/.80General knowledge .71 .74 .68 - - -Fluency A - - - .68/.62 .63/.59 .67/.62Fluency M5 - - - .64/.62 .65/.59 .61/.65Fluency PB - - - .43/.42 .38/.35 .37/.43Composite score - - - .83/.78 .79/.76 .81/.78
Visuospatial Ability (Gv) Block Design .82 .75 .78 .81/.80 .78/.77 .70/.73Global Cogn Functioning MMSE .40 .22 .42 .46/.38 .31/.32 .46/.39
Note. a Values were computed in accord with the Spearman-Brown formula (on odd-even arranged items), except for MMSE and Block Design (Cronbach´s alpha). 1 Due to addition/exclusion of a few cognitive tasks given at the second test session during which the to-be-remembered activities were performed (i.e., from T1 to T3), the maximum number of activities that could be recalled differed marginally over times of measurement. However, as the present study concerned degree of stability of inter-individual differences rather than absolute levels of performance, this difference was ignored. 2 Fleichman et al. (2005), for example, used the following criteria to describe short-term (48- day) stabili-ties on memory measures: excellent (r = > .80), very good (r = .70-.79), good (r = .60-.69), fair (r = .50-.59) and poor (r < .50).
The Betula study: Reliabilities and Long-Term Stabilities of Memory Test Performances Over the ..

12
Turning to stability coefficients, their relative magnitude generally correspond with within-occasion estimates of reliability at the level of individual measures. For the episodic measures the five-year coefficients ranged from r = .42 to r = .63, overall. The corresponding values for the semantic measures are r = .43 to r = .86. As judged from values in the right-most columns of Table 1, there is no or little tendency of an age-related difference across measures with regard to the magnitude of the coefficients (all ps >. 01 using a test of differences in r based on Fisher’s r to z-transformation; Howell, 2004, the conservative α-level being motivated by multiple comparisons).
The relative lack of age differences with regard to stability over individual tests is most clearly manifest at the level of composite scores which reveal a minimal age-related difference on episodic memory (r = .78 and r = .76 for the youngest and oldest, respectively; semantic memory: r = .79 for the youngest and r = .81 for the oldest) over the five-year interval. The finding of small and non-significant age-related difference with regard to stability holds also for Block Design, with somewhat lower value for the oldest (r = .70 vs. r =.78). MMSE, finally, showed a significantly higher stability for the older part of the sample (p < .01, one-tailed test). The latter seems reasonable, given that non-demented elderly make at least four errors on average leaving some room for individual differences to operate at baseline, which may not hold equally true for the younger groups (see Nilsson et al., 1997 for descriptive data).
Finally, a comparison between the five- and ten-year coefficients provides little or no support for the hypothesis that inter-individual differences diminish substantially with time since coefficients based on the five- and the ten-year intervals was small (for episodic memory: r = .83 vs. .82; for semantic memory: r = .83 and .78, for Block Design: r = .81 and .80 for T1-T2 and T1-T3, respectively). At this point it is worth noting that coefficients obtained (composite level) are high in general and that even the ten-year coefficients would qualify as indicators of high reliability (i.e., across a brief time-interval).
It could be argued that our analyses confound retest-status for the T1-T2 ver-sus T1-T3 comparisons. For example, cases of dementia at T3 were preclinical at T2 and may, thus, may have served to distort the T1-T2 estimates (presumably lowering these). In order to control for this possibility stability coefficients for T1-T2 were re-computed based only on the non-demented participants available also at T3. The results, however, revealed almost exactly the same values as those reported previously (r = .83, r = .82, n = 797, for the episodic and semantic composites, and r = .82, r = .47 for Block Design and MMSE scores, respectively, with n = 783 and 798 for latter two measures). Hence, dropout including impending dementia on part of the individu-als had little effect on the overall estimates of temporal stability presented in Table 1.
In conclusion, reliabilities for several of the individual cognitive measures (e.g., episodic memory measures) were less than optimal. However, as demonstrated, sim-ple (unit-weighted) composite score yielded values high enough to qualify for high reliability in the test-retest sense even over a ten-year period (see Lövdén et al., 2004 for even higher estimates over five years in a sub-sample using structural equation modelling to estimate coefficients). Thus, in most situations it is recommended to work with aggregate memory scores. Of further interest, the stability coefficients did
Michael Rönnlund, Lars-Göran Nilsson
13
not appear to differ in any substantial fashion in groups of younger and older adults. In a related vein, no or little time-related reductions in the stability coefficients were observed.
The latter observations may suggest that age-related deficits in memory perform-ance (see Rönnlund, Nyberg, Bäckman, & Nilsson for cross-sectional and longitudinal aging trends on memory measures; see Rönnlund & Nilsson, 2006 for corresponding data on Block Design) may be characterized by less heterogeneity than often asserted by researchers when appropriate screening for dementia and sensory impairments is undertaken. Admittedly, stability coefficients only pertain to rank-order. It is, thus, in principle, possible that people become less alike with advancing age in spite of stable rank-orders. Hence, indications that age-related diversity is relatively minor, if not absent, needs to be substantiated by careful analyses of differences/changes in the variance from viewpoint of cross-sectional and longitudinal data.
References
Christensen, H., Mackinnon, A. E., Korten, A. F., Jorm, A. S., & Jacomb, P. (1999). Dispersion in cognitive ability as a function of age: A longitudinal study of an elderly community sample. Aging, Neuropsychology, and Cognition, 6, 214-228.
Dureman, I. (1960). SRB:1. Stockholm: Psykologiförlaget. Fleichman, D. A., Gabrieli, J. D. E., Wilson, R. S., Moro, T. T., & Bennett, D. A. (2005). Repetition
priming and recognition memory in younger and older persons: Temporal stability and performance. Neuropsychology, 19, 750-759.
Folstein, M.F., Folstein, S. E., & McHugh, P. R. (1975). “Mini Mental State”: A practical method for grading the mental status of patients for the clinician. Journal of Psychiatry Research, 12, 189-198.
Howell, D. C. (1997). Statistical methods for psychology (4th ed.). Duxbury Press. Lind, J., Ingvar, M., Persson, J., Cruts, M., Van Broeckhoven, C., Adolfsson, R., & Nilsson, L.-G.
(in press). Parietal cortex activation predicts longitudinal memory decline in APOE e4 car-riers. NeuroReport.
Lind, J., Larsson, A., Persson, J., Ingvar, M., Nilsson, L.-G., Bäckman, L., Adolfsson, R., Cruts, M., Sleegers, K., Van Broeckhoven, C., & Nyberg, L. (2006a). Reduced hippocampal volume in non-demented carriers of the Apolipoprotein E e4:Relation to chronological age and recog-nition memory. Neuroscience Letters, 396, 23-27.
Lind, J., Persson, J., Ingvar, M., Larsson, A., Cruts, M., Van Broeckhoven, C., Adolfsson, R., Bäck-man, L., Nilsson, L.-G., Petersson, K.M., & Nyberg, L. (2006b). Reduced functional brain activity response in cognitively intact Apolipoprotein e4 carriers. Brain, 129, 1240-1248.
Lövdén, M., Rönnlund, M., Wahlin, Å., Bäckman, L., Nyberg, L., & Nilsson, l.-G. (2004). The extent of stability and change in episodic and semantic memory in old age: Demographic predictors of level and change. Journal of Gerontology: Psychological Sciences and Social Sci-ences, 59B, P130-P134.
Morse, C. K. (1993). Does variability increase with age? An archival study of cognitive mea-sures. Psychology and Aging, 8, 156-164.
Nilsson, L.-G. (1999). Aging, dementia, and memory. In L.-G. Nilsson and H. J. Markowitsch (Eds.), Cognitive Neuroscience of Memory. Göttingen: Hogrefe & Huber Publishers.
The Betula study: Reliabilities and Long-Term Stabilities of Memory Test Performances Over the ..

14
Nilsson, L.-G. (2006a). Memory processes, aging, cognitive decline and neurodegenerative dis-eases. European Psychologist, 11, 304-311.
Nilsson, L.-G., Adolfsson, R., Bäckman, L., Cruts, M., Nyberg, L., Small, B.J., & Van Broeck-hoven, C. (2006b). The influence of APOE status on episodic and semantic memory: Data from a population-based study. Neuropsychology, 20, 645-657.
Nilsson, L.-G., Bäckman, L., Erngrund, K., Nyberg, L., Adolfsson, R., Bucht, G., Karlsson, S., Widing, M., & Winblad, B. (1997). The Betula prospective cohort study: Memory, health, and aging. Aging, Neuropsychology, and Cognition, 4, 1-32.
Nilsson, L-.G., Adolfsson, R., de Frias, C. M., Molander, B., & Nyberg, L. (2004). Betula: A pro-spective study on memory, health and aging. Aging, Neuropsychology, and Cognition, 11, 134-148.
Nyberg, L. (1994). A structural equation modeling approach to the multiple memory systems question. Journal of Experimental Psychology: Learning, memory, and cognition, 20, 485-491.
Nyberg, L., Bäckman, L., Erngrund, K., Olofsson, U., & Nilsson, L.-G. (1996). Age differences in episodic memory, semantic memory, and priming: Relationships to demographic, intellec-tual, and biological factors. Journal of Gerontology: Psychological Sciences, 51, 234-240.
Persson, J., Lind, J., Larsson, A., Crutz, M., Van Broeckhoven, C., Adolfsson, R., Nilsson, L.-G., & Nyberg, L. (2006). Altered brain white-matter integrity in non-demented carriers of the APOE ε4 allele: A risk for Alzheimer’s disease. Neurology, 66, 1029-1033.
Robertson, S., Myerson, J., & Hale, S. (2006). Are there age differences in intraindividual vari-ability in working memory performance. Journal of Gerontology: Psychological Sciences, 61B, P18-P24.
Rönnlund, M., & Nilsson, L.-G. (2006). Adult life-span patterns in WAIS-R Block Design per-formance: Cross-sectional versus longitudinal age gradients and relations to demographic factors. Intelligence, 34, 63-78.
Rönnlund, M., Nyberg, L., Bäckman, L., & Nilsson, L.-G. (2003). Recall of subject-performed tasks, verbal tasks, and cognitive activities across the adult life span: Parallel age-related deficits. Aging, Neuropsychology, and Cognition, 10, 182-201.
Rönnlund, M., Nyberg, L., Bäckman, L., & Nilsson, L.-G. (2005). Stability, growth, and decline in adult life span development of declarative memory: Cross-sectional and longitudinal data from a population-based study. Psychology and Aging, 20, 3-18.
Wechsler, D. (1981). Wechsler Adult Intelligence Scale - Revised: Manual. New York: Psychologi-cal Corporation.
Acknowledgements
The Betula Study is funded by the Bank of Sweden Tercentenary Foundation (1988-0082:17; J2001-0682), Swedish Council for Planning and Coordination of Re-search (D1988-0092, D1989-0115, D1990-0074, D1991-0258, D1992-0143, D1997-0756, D1997-1841, D1999-0739, B1999-474), Swedish Council for Research in the Humanities and Social Sciences (F377/1988-2000), the Swedish Council for Social Research (1988-1990: 88-0082, and 311/1991-2000), and the Swedish Research Coun-cil (345-2003-3883, 315-2004-6977).
Michael Rönnlund, Lars-Göran Nilsson
15
PRESENTATIONS OF EMPIRICAL STUDIES
Humor Effect on Stress Responses: The Experimental Study Using Stress Inducing Movie
Ieva StokenbergaUniversity of Latvia
The aim of the study was to determine whether humor affects stress responses in an experi-mental stress situation. Sixty-nine students of psychology and education and fifty students of building engineering took part in the study. Participants were randomly assigned to one of three groups and watched the stress inducing movie. One of the groups was instructed to watch the film in preparation for the task of commenting upon it in a humorous manner; the second group was instructed to prepare a scientific comment, while the third received no specific instructions regarding comments. Self-reported measures of emotion were collected before and after the film. Results did not support the hypothesis, a two-way interaction among group and sample showed that engineering students showed lower stress reactions in the sci-entific perspective group, rather than in the humor group.2
Key words: Humor, stress, experiment.
IntroductionHumor was recognized as an important resource for fighting against the difficul-
ties and adverse effects of life stress both in academic and popular literature through-out the 20th century. Since the early 1980s the effects of humor and individual differ-ences in sense of humor have been studied widely in a context of stress, coping and adaptation outcomes such as mood, anxiety, depression, and physical health (Lefcourt & Thomas, 1998; Martin, 2001).
According to transactional stress theory (Lazarus, 1966; Lazarus & Folkman, 1984) the amount of stress experienced depends on the appraisal of the potential stressor. During primary appraisal, potential stress stimuli can be perceived as ir-relevant, benign or harmful, i.e. threatening (Lazarus & Folkman, 1984). Secondary appraisal includes assessment of available coping resources for dealing with the threat. Problem-focused and emotion focused coping strategies are used to deal with threat, depending on beliefs about the self (e.g., control over the situation), the environment (e.g., the possibility of changing the situation) and available resources (e.g., social sup-port) (Lazarus & Folkman, 1984).
Baltic Journal of Psychology, 2006, 7 (2), 15–25
2 Author’s note. Correspondence concerning this article should be addressed to Ieva Stoken-berga, e-mail [email protected]

16
Humor in a stress situation is considered to be a positive, adaptive emotion-fo-cused coping strategy called “positive reappraisal” or “reframing” (Martin, Kuiper, Olinger, & Dance, 1993; Abel, 2002). According to incongruity theory, humor is the playful perception of incongruities, different perspectives, and several meanings which provides the flexibility to take another perspective in a stressful situation, dis-tance oneself from it, and as a result experience less threat and more mastery over the situation (Kuiper, Martin, & Olinger, 1993). According to activation theory, humor in stress situations evokes positive mood and reduces negative tension, thus maintaining an optimal level of activation (Svebak & Martin, 1997; Svebak & Apter, 1987).
In situations where a stimulus is appraised as threatening, humor can help to change perspective and re-appraise the situation from a different perspective, finding something funny in it. For example, if somebody misses the bus and risks being late for a meeting, it is less stressful to re-appraise the situation and conclude that now he or she will have enough time to drink a coffee and not have to experience the boring opening speeches. In a social context, humor can build a positive atmosphere and provide social support. For example, in a large auditorium a speaker can feel tense and nervous, but a joke about that can raise understanding and elicit supportive feedback from the audience.
It is assumed that individuals with higher trait sense of humor perceive potential stress events as less threatening and experience fewer adverse outcomes from stressful life situations. Several studies have provided support for this hypothesis – students with higher sense of humor evaluated an exam as a challenge rather than a threat, and predicted their ability to pass exams in the future in a more optimistic manner than students whose sense of humor scores were low (Kuiper, Martin, & Olinger, 1993). Martin and Lefcourt report that students with high sense of humor experience less mood disturbance, than students with low sense of humor when confronted with the same level of daily hassles (Martin & Lefcourt, 1983). Similar effects were found with respect to depression (Nezu, Nezu, & Blissett, 1988) and everyday positive and nega-tive mood (Kuiper & Martin, 1998). However, there are studies which do not replicate these findings (Porterfield, 1987; Overholser, 1992). There is little evidence supporting the widely-held view that sense of humor moderates stress effect on physical health (Svebak, Gotestam, & Jensen, 2004; Martin, 2001).
Results from experimental studies of humor on stress appraisal show effects of external humor stimuli (enjoyment of video and audio-taped humorous performanc-es, humor expression via amusing comments) on stress responses. Some studies have demonstrated that listening to humorous audio tapes increases pain tolerance (Hudak, Dale, Hudak, & DeGood, 1991), reduces anxiety (Yovetic, Dale, & Hudak, 1990) and mood disturbance (Martin & Lefcourt, 1986; Cann, Holt, & Calhoun, 1999).
It was hypothesized that humor creation (producing a humor narrative) would have a stronger stress moderating effect compared with the effect of external humor-ous stimuli (humor perception and enjoyment), although previous research provided inconsistent support for this assumption (Lefcourt & Martin, 1986; Lehman et al., 2001; Newman & Stone, 1996). For instance humor creation in a stress situation can be seen as an additional stressor, since people vary a lot in their ability and willingness to
Ieva Stokenberga
17
produce jokes (Lefcourt & Martin, 1986). The expression of mirth is also socially and personally sensitive. Some theorist assumes that expression of mirth is more related to extraversion and sociability than to a tendency to use humor to cope with stress (Sve-bak, 1996). An individual can find a situation funny but not express this for individual reasons, culture, social norms, etc, despite the fact that this humor perspective leads to the experience of mirth and has the potential to help deal with the threat.
The present study investigated whether a humor perspective (looking for some-thing funny in a situation) can lower stress responses while watching a stress inducing movie. First, the subjective humor perspective seems to be relevant to the individual, since it is possible to choose appropriate content and style of humor appraisal oneself. Second, the humor perspective is the most precise representation of humor as a posi-tive, healthy defence mechanism (Freud, 1928), described as a cheerful view of the world and its problems (also called “perspective-taking humor”, Lefcourt et al., 1995).
In previous studies using stress inducing movies, either negative emotions (New-man & Stone, 1996) or a total mood disturbance created by summing positive and negative emotions were observed (Lefcourt & Martin, 1986; Cann, Holt, & Calhoun, 1999). The present study aims at establishing whether a humor perspective affects both positive and negative emotions. Both positive and negative emotions were measured before and after the stress manipulation, which made it possible to calculate changes in these emotions. It is hypothesized that positive and negative emotion will change less in the group primed to adopt a humor perspective.
Method
ParticipantsSixty-nine students of psychology and education (61 female and 8 male, age range
18-24, M=19.7, SD=1.3) and fifty students of building engineering (9 female and 41 male, age range 19-24, M=20.7, SD=.78) participated in the study on a voluntary basis.
ProcedureThe experiment was organized in two stages – in April 2004 the first stage of the
experiment was run in the sample of social sciences students. In October 2006 the sec-ond stage of the experiment was run in the engineering student sample. The experi-ment took place in a class well known to participants. The procedure was identical in the both samples - one to two weeks before the experiment participants filled in three different sense of humor questionnaires and were randomly assigned to one of the three groups – humor, scientific or control group. The experiment started with verbal instructions to follow the written instructions in a PowerPoint presentation displayed via multimedia projector on the screen.
Humor Effect on Stress Responses: The experimental study using stress inducing movie
3 It was found by Lazarus and his colleagues (Lazarus, Speisman, Morgkoff, & Davison, 1962; Speisman, Lazarus, Mordkoff & Davison, 1964) that this movie (‘Subincision’) induces both physiological and affective stress reactions.
18
First, 17 colored pictures of natural landscapes were displayed after an instruction to watch them and try to relax. After that, respondents filled out self-report measures of emotion. Second, participants were informed that a stress inducing movie about the initiation ritual in an aboriginal tribe would be shown.3 For technical reasons the film was shown on TV to the first sample and via multimedia projector on a screen to the second sample. The experimental group was instructed to watch the film and make comments on it to themselves that were as funny as possible, and to prepare to write a humorous comment on it. The second group was instructed to prepare a scien-tific comment, while the third did not get any specific instructions regarding com-ments. After watching the film (12 min.) participants filled out self-report measure of emotions and wrote a brief story about the film according to the instructions for their group. After that, participants were informed about the purpose of the experiment and debriefed about their feelings and thoughts.
MeasuresIn order to assess immediate affective responses to the experimental condition
two scales were used – the Positive and Negative Affects Scale (PANAS; Watson, Clark, & Tellegen, 1988) and the Mood Adjective Checklist (Nowlis & Nowlis, 1956).
The Positive and Negative Affects Scale (PANAS; Watson, Clark, & Tellegen, 1988) assesses the degree to which each of 20 emotions is being experienced right at the moment, by rating on a 5-point scale ranging from “very slightly or not at all” to “ex-tremely.” It consists of 10 positive and 10 negative mood adjectives, resulting in two subscales, one for positive affect and one for negative affect. In previous research, internal consistency analyses have yielded Cronbach’s alphas in the range of .87 to .90 for both subscales (Watson, Clark, & Tellegen, 1988; DePaoli & Sweeney, 2000). In the present study, Cronbach’s alpha was .86 for positive affect and .73 for negative affect.
The Mood Adjective Checklist (Nowlis & Nowlis, 1956) consists of 53 mood adjectives, resulting in 9 subscales – aggression, depression, anxiety, concentration, activation, deactivation, pleasantness, social affection and egotism. Participants were asked to evaluate the degree to which they were feeling each mood right at the mo-ment, rating on a 5-point scale ranging from “very slightly or not at all” to “extremely.” Internal consistency analyses yielded Cronbach’s alphas in the range of .51 to .85 for several subscales; however, no alphas were lower than .66 for the subscales used in further analyses.
In order to reduce the complexity of statistical analyses caused by the number of variables, data from subscales which were sensitive to the film were summed to devel-op a general positive and negative emotion index variable. Positive affect, Pleasantness and Social Affect (inter-correlations range from r=.66 to r=.70, p<.01) were summed in a single variable “Positive emotions” (Cronbach’s alfa α=.88). Negative affect, Aggres-sions, Depression and Anxiety (inter-correlations range from r=.66 to r=.88, p<.01) were summed in the variable “Negative emotions” (Cronbach’s alfa α=.92). For further analyses two dependent variables were used - change in positive emotions during the film (measure after minus measure before the film) and change in negative emotions during the film (measure after minus measure before manipulation).
Ieva Stokenberga

19
Previous studies show a moderating effect of individual differences in sense of humor (Martin et al., 2003; Cann, Holt, & Calhoun, 1999); consequently, two different questionnaires were included to assess individual differences in coping humor and humor style.
The Humor Style Questionnaire (HSQ, Martin at al., 2003) is a 32 item question-naire including two dimensions – adaptive vs. maladaptive and interpersonal vs. in-trapersonal humor style. Four scales measuring four different humor styles according to these dimensions are: Affiliative humor (“I enjoy making people laugh”); Self-en-hancing humor (“My humorous outlook on life keeps me from getting overly upset or depressed about things”); Aggressive humor (“If someone makes a mistake I will often tease them about it”) and Self-defeating humor (“I let people laugh at me or make fun at my expense more than I should”). Participants were asked to rate the degree to which each item characterizes them on a 7-point Likert-type scale ranging from “to-tally disagree” to “totally agree.” In the present study, internal consistencies (Cronbach alpha) for the Affiliative, Self-enhancing, Aggressive, and Self-defeating humor scales, respectively, were .73, .78, 64, and .74.
The Coping Humor Scale (CHS, Martin & Lefcourt, 1983) is a seven item scale measuring the degree to which participants report using humor to cope with stress-ful situations. Sample items include “I often lose my sense of humor when I’m having problems” (reversed) and “I can usually find something to laugh or joke about even in trying situations.” Participants were asked to rate the extent to which they agree or disagree on a 4-point Likert-type scale. Reliability analyses of the CHS have yielded Cronbach alphas in the .60 to .70. (Martin, 1996).The Cronbach alpha in the present study was .62.
Results
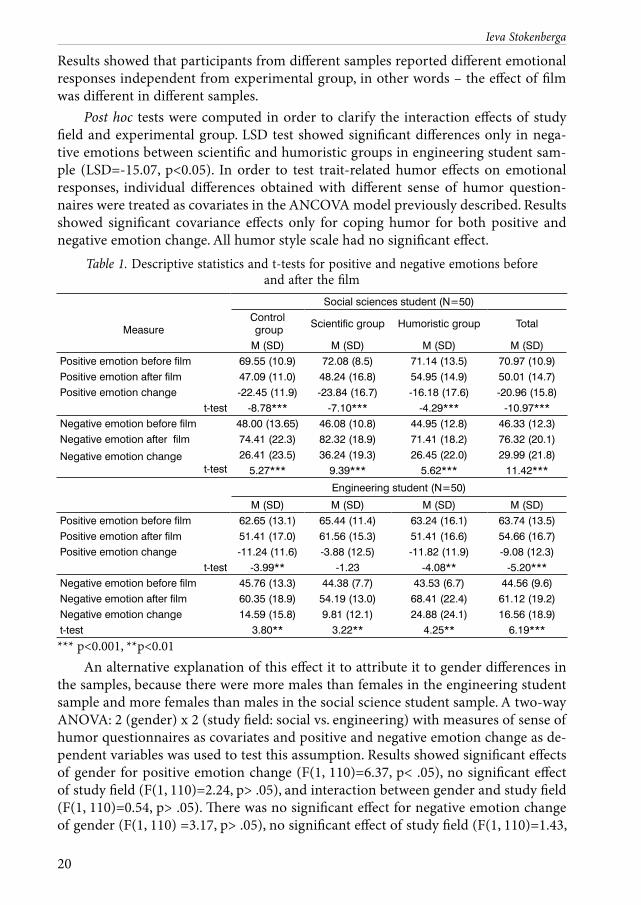
First, a check was carried out to determine whether the film had raised the partic-ipants’ level of emotional stress. A descriptive statistical analysis and a series of t tests were used to compare emotional responses before and after the film. As shown in Ta-ble 1, positive emotions were higher before watching the film and lower after the film, although negative emotions were lower before and were higher after the film. Positive emotions decreased during the film (the change measure had a negative value) and negative emotion increased during the film (the change measure had a positive value) in all groups. Emotion change was significant in both samples and in all experimental groups, except the scientific group in the engineering student sample, where positive emotion change during the film was non-significant.
A two-way ANCOVA: 2 (study field: social vs. engineering) x 3 (experimental group: control vs. scientific vs. humoristic) with dependent variables positive and neg-ative emotion change and measures of sense of humor questionnaires as covariates was used to test the hypothesis. As shown in Table 2, experimental group showed no significant effects neither to positive, nor negative emotion change, there was signifi-cant effect of study field to both positive and negative emotion change and significant interaction effect of study field and experimental group to negative emotion change.
Humor Effect on Stress Responses: The experimental study using stress inducing movie
20
Results showed that participants from different samples reported different emotional responses independent from experimental group, in other words – the effect of film was different in different samples.
Post hoc tests were computed in order to clarify the interaction effects of study field and experimental group. LSD test showed significant differences only in nega-tive emotions between scientific and humoristic groups in engineering student sam-ple (LSD=-15.07, p<0.05). In order to test trait-related humor effects on emotional responses, individual differences obtained with different sense of humor question-naires were treated as covariates in the ANCOVA model previously described. Results showed significant covariance effects only for coping humor for both positive and negative emotion change. All humor style scale had no significant effect.
Table 1. Descriptive statistics and t-tests for positive and negative emotions before and after the film
Measure
Social sciences student (N=50)Control group Scientific group Humoristic group Total
M (SD) M (SD) M (SD) M (SD)Positive emotion before film 69.55 (10.9) 72.08 (8.5) 71.14 (13.5) 70.97 (10.9)Positive emotion after film 47.09 (11.0) 48.24 (16.8) 54.95 (14.9) 50.01 (14.7)Positive emotion change -22.45 (11.9) -23.84 (16.7) -16.18 (17.6) -20.96 (15.8)
t-test -8.78*** -7.10*** -4.29*** -10.97***Negative emotion before film 48.00 (13.65) 46.08 (10.8) 44.95 (12.8) 46.33 (12.3)Negative emotion after film 74.41 (22.3) 82.32 (18.9) 71.41 (18.2) 76.32 (20.1)
Negative emotion changet-test
26.41 (23.5) 36.24 (19.3) 26.45 (22.0) 29.99 (21.8)5.27*** 9.39*** 5.62*** 11.42***
Engineering student (N=50)
M (SD) M (SD) M (SD) M (SD)Positive emotion before film 62.65 (13.1) 65.44 (11.4) 63.24 (16.1) 63.74 (13.5)Positive emotion after film 51.41 (17.0) 61.56 (15.3) 51.41 (16.6) 54.66 (16.7)Positive emotion change -11.24 (11.6) -3.88 (12.5) -11.82 (11.9) -9.08 (12.3)
t-test -3.99** -1.23 -4.08** -5.20***Negative emotion before film 45.76 (13.3) 44.38 (7.7) 43.53 (6.7) 44.56 (9.6)Negative emotion after film 60.35 (18.9) 54.19 (13.0) 68.41 (22.4) 61.12 (19.2)Negative emotion change 14.59 (15.8) 9.81 (12.1) 24.88 (24.1) 16.56 (18.9)t-test 3.80** 3.22** 4.25** 6.19***
*** p<0.001, **p<0.01
An alternative explanation of this effect it to attribute it to gender differences in the samples, because there were more males than females in the engineering student sample and more females than males in the social science student sample. A two-way ANOVA: 2 (gender) x 2 (study field: social vs. engineering) with measures of sense of humor questionnaires as covariates and positive and negative emotion change as de-pendent variables was used to test this assumption. Results showed significant effects of gender for positive emotion change (F(1, 110)=6.37, p< .05), no significant effect of study field (F(1, 110)=2.24, p> .05), and interaction between gender and study field (F(1, 110)=0.54, p> .05). There was no significant effect for negative emotion change of gender (F(1, 110) =3.17, p> .05), no significant effect of study field (F(1, 110)=1.43,
Ieva Stokenberga
21
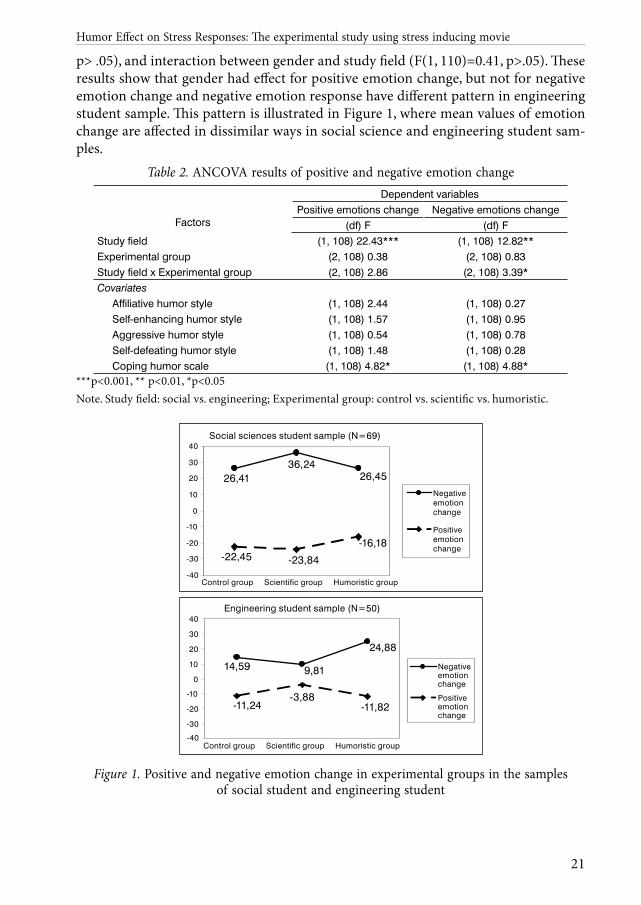
p> .05), and interaction between gender and study field (F(1, 110)=0.41, p>.05). These results show that gender had effect for positive emotion change, but not for negative emotion change and negative emotion response have different pattern in engineering student sample. This pattern is illustrated in Figure 1, where mean values of emotion change are affected in dissimilar ways in social science and engineering student sam-ples.
Table 2. ANCOVA results of positive and negative emotion change
Factors
Dependent variablesPositive emotions change Negative emotions change
(df) F (df) FStudy field (1, 108) 22.43*** (1, 108) 12.82**Experimental group (2, 108) 0.38 (2, 108) 0.83Study field x Experimental group (2, 108) 2.86 (2, 108) 3.39*Covariates
Affiliative humor style (1, 108) 2.44 (1, 108) 0.27Self-enhancing humor style (1, 108) 1.57 (1, 108) 0.95Aggressive humor style (1, 108) 0.54 (1, 108) 0.78Self-defeating humor style (1, 108) 1.48 (1, 108) 0.28Coping humor scale (1, 108) 4.82* (1, 108) 4.88*
***p<0.001, ** p<0.01, *p<0.05Note. Study field: social vs. engineering; Experimental group: control vs. scientific vs. humoristic.
Figure 1. Positive and negative emotion change in experimental groups in the samples of social student and engineering student
Humor Effect on Stress Responses: The experimental study using stress inducing movie
22
Discussion
These results do not support the hypothesis that a humor perspective can affect emotional stress responses. However the stimulus material did evoke different reac-tion among students in different study fields. Social science students reported higher stress if compared with engineering students, and for engineering student negative emotions were lower in the scientific perspective situation but higher in the humor condition. These contradictious in the data raise a variety of questions.
They can be explained by unequal gender balance in both samples; therefore the interaction effect of gender, group and study field was not possible to calculate. Other studies show contradictious results on gender differences in stress induced by ‘Subin-cision’ film (Lazarus, Speisman, Morgkoff, & Davison, 1962; Speisman, Lazarus, Mor-dkoff, & Davison, 1964; Lefcourt & Martin, 1986).
The lack of difference between both experimental groups and the control group in both samples suggests that the manipulation effect (both scientific and humorous) was not as strong as expected. In previous studies demonstrating humor effects on stress reactions external humor manipulation was used (e.g. audio-taped humorous comments, Martin & Lefcourt, 1986; a humorous video, Cann, Holt, & Calhoun, 1999) or included humor expression externally (e.g., telling a humorous narrative, Newman & Stone, 1996). It may well be that a humor perspective without expression of mirth is not strong enough to affect emotional responses, although there is evidence that a humor perspective can influence success on stressful tasks in stereotyped threat situ-ation (Cigankova, 2006).
An alternative explanation is that in the control group (where no specific coping perspective was provided) participants still used some coping strategy according to their personal needs and habits, but this was not controlled and therefore it is not pos-sible to include it in analyses.
Coping humor was found to have a significant interaction effect with both posi-tive and negative emotion change, providing support for previous findings that in-dividual differences in self-reported coping humor scales show its moderating effect on stress responses (Newman & Stone, 1996; Cann, Holt, & Calhoun, 1999, Martin & Lefcourt, 1986). This finding supports the assumption that the coping aspect of humor is sufficient to explain its role in the process of stress. Individual differences in sense of humor should be included in future studies of stress-moderating effects of humor.
In previous research, either negative emotion were treated as dependent vari-able (Newman & Stone, 1996) or else total mood disturbance, calculated by summing positive and negative emotions (Lefcourt & Martin, 1986; Cann, Holt & Calhoun, 1999). Self-reported emotion and mood surveys are widely used in stress moderating cross- sectional and also experimental studies, although there are doubts about the assessment of stress outcomes in this way (Lazarus, DeLongis, Folkman, Gruen, & 1985). Lazarus and colleagues argue that the widely used approach to measuring such stress outcomes as mood, depression, anxiety and somatic complaints is not accurate because of the strong covariance of those variables. Alternative measures of stress outcomes can be obtained by evaluating task performance and daily success.
Ieva Stokenberga

23
One more question arises with respect to the stress stimulus used in this experi-ment. The film ‘Subincision’ was found to be stressful in the 1960s (Lazarus, Speisman, Morgkoff, & Davison, 1962; Speisman, Lazarus, Mordkoff & Davison, 1964), only weak emotional responses were found among men in the 1980s, although women still ex-pressed moderate to high stress (Lefcourt & Martin, 1986). The present study shows that emotional responses occurred during the film, but there was great variability from individual to individual. Thus, the question arises whether this stress stimulus was perceived as threatening, even if it raised negative emotional response.
An explanation can be found in the theoretical approach to understanding stress. According to transactional stress theory, the definition of stress is a “particular rela-tionship between the person and the environment that is appraised by the person as taxing or exceeding his or her well-being” (Lazarus, 1966; Lazarus & Folkman, 1984). That means that stress can be caused by any stimulus which is appraised as threaten-ing. Social identity approach to stress specified that perception of threat and coping with it is strongly linked with shared social identity (Haslam & Reicher, 2006; Haslam, 2004). According to this view, stress stimuli are appraised differently, depending on salient personal or social identity. Because the film shows aboriginal tribal initiation rituals which are unfamiliar and very different from the participants’ culture, there is weak identification with actors and it is easy to use distancing and rationalization to cope with unpleasant feelings raised by the film. From this perspective it can be speculated that the stress stimulus used in this study was not perceived as threaten-ing to participants’ identity and therefore did not actualize coping needs – the film was unpleasant, but not threatening. This assumption can be illustrated by the results of studies where a direct threat to the individual was used to test humor effects (e.g. discomfort threshold, Hudak, Dale, Hudak., & DeGood, 1991; anxiety during waiting for electro-stimulation, Yovetic, Dale., & Hudak, 1990; success in a mathematic task in a situation of stereotype threat, Cigankova, 2006).
Further research is necessary to test the hypothesis of the humor effect on stress responses, following several lines of reasoning. First, it is necessary to investigate whether humor priming effects differ according to whether the humorous material is provided for enjoyment or if it involves the task of taking a humor perspective and creating a humorous narrative. Second, the stress stimulus has to be relevant to the participants’ personal or social identity, assuring that the situation is perceived as a threat. Third, it is necessary to investigate the role of humor in shared social iden-tity. There is strong evidence that shared social identity is a very important issue for providing, receiving and perceiving social support as the key mechanism that helps people to cope with stress (Haslam, 2006). Fourth, it is necessary to include alternative measurement of stress outcomes, instead of relying only on self-reports of emotions. From the practical perspective, considering that stress is an unavoidable characteristic of life and that everybody has to live with it, it is important to assess not only affective reactions to stress but also its effects on task performance and success.
Humor Effect on Stress Responses: The experimental study using stress inducing movie
24
References
Abel, M. H. (2002). Humor, stress, and coping strategies. Humor: International Journal of Humor Research, 15 (4), 365-381.
Cann, A., Holt, K., & Calhoun, L. G. (1999). The roles of humor and sense of humor in respons-es to stressors. Humor: International Journal of Humor Research, 12 (2), 177-193.
Cigankova, O. (2006). Humoristiskās perspektīvas ietekme uz stereotipu draudiem sievietēm [Ef-fect of humoristic perspective to stereotype threat for women]. Unpublished term paper, Uni-versity of Latvia, Riga, Latvia.
DePaoli, L. C., Sweeney, D. C. (2000). Further validation of the positive and negative affect schedule. Journal of Social Behavior & Personality, 15 (4), 561-569
Freud, S. (1928). Humour. International Journal of Psychoanalysis, 9, 1-6.Haslam, S. A. (2004). Psychology in organizations. The social identity approach (2nd edition).
London, SAGE. Haslam, A., & Reicher, S. (2006). Stressing the group: Social identity and the unfolding dynam-
ics of responses to stress. Journal of Applied Psychology, 91 (5), 1037-1052.Hudak, D. D., Dale, A., Hudak, M. A., & DeGood, D. E. (1991). Effects of humorous stimuli and
sense of humor on discomfort. Psychological Reports, 69, 779-786.Kuiper, N. A., & Martin, R. A. (1998). Laughter and Stress in Daily Life: Relation to Positive
and Negative Affect. Motivation & Emotion (Special Issue on Affect & Self-Regulation), 22 (2), 133-153.
Kuiper, N. A., Martin, R. A., & Olinger, J. L. (1993). Coping humor, stress, and cognitive apprais-als. Canadian Journal of Behavioural Science 25 (1), 81-96.
Lazarus, R. S. (1966). Psychological stress and the coping process. New York: McGraw-Hill.Lazarus, R. S., & Folkamn, S. (1984). Stress, appraisal, and coping. NewYork: Springer.Lazarus, R. S., DeLongis, A., Folkman, S., & Gruen, R. (1985). Stress and adaptational outcomes
: The Problem of Confounded Measures. American Psychologist, 40 (7), 770-779.Lazarus, R. S., Speisman, J. C., Morgkoff, A. M., & Davison, L. A. (1962). A laboratory study of
psychological stress produced by a motion picture film. Psychological Monographs, 76 (34), 1-35.
Lefcourt, H. M., Davidson, K., Shepard, R., Philips, M., Prkachin, K., & Mills, D. E. (1995). Perspective-taking humor: Accounting for stress moderation. Journal of Social and Clinical Psychology, 14 (4), 373-391.
Lefcourt, H. M., & Martin, R. A. (1986). Humor and life stress: Antidote to adversity. New York, Springer.
Lefcourt, H.M., & Thomas, S. (1998). Humor and Stress Revisited. In W. Ruch (Ed.), The Sense of Humor. Exploration of a Personality Characteristic (pp. 179-202). Berlin, Mouton de Gruyter.
Lehman, K.M., Burke, K.L., Martin, R., Sultan, J., & Czech, D. R. (2001). A reformulation of the moderating effects of productive humor. Humor: International Journal of Humor Research, 14 (2), 131-161.
Martin, R. A. (1996). The Situational Humor Response Questionnaire (SHRQ) and Coping Humor Scale (CHS): A decade of research findings. Humor: International Journal of Humor Research, 9 (3/4), 251-272.
Ieva Stokenberga

25
Martin, R. A. (2001). Humor, laughter, and physical health: Methodological issues and research findings. Psychological Bulletin, 127 (4), 504-519.
Martin, R. A., Kuiper, N. A., Olinger, L. J., & Dance, K. A. (1993). Humor, coping with stress, self-concept, and psychological well-being. Humor: International Journal of Humor Research 6 (3/4), 89-104.
Martin, R. A., & Lefcourt, H. M. (1983). Sense of humor as a moderator of the relation between stressors and moods. Journal of Personality and Social Psychology, 45 (6), 1313-1324.
Martin, R. A., Puhlik-Doris, P., Larsen, G., Gray, J., & Weir, K. (2003). Individual differences in uses of humor and their relation to psychological well-being: Development of the Humor Styles Questionnaire. Journal of Research in Personality, 37, 48-75.
Newman, M. G., & Stone, A. A. (1996). Does humor moderate the effects of experimentally-induced stress? Annuals of Behavioural Medicine, 18 (2), 101-109.
Nezu, A. M., Nezu, C. M., & Blissett, S. E. (1988). Sense of humor as a moderator of the rela-tion between stressful events and psychological distress: A prospective analysis. Journal of Personality and Social Psychology, 54 (3), 520-525.
Nowlis, V., & Nowlis, H. H. (1956). The description and analysis of mood. Annals of the New York Academy of Sciences, 65, 345-355.
Overholser, J. C. (1992). Sense of humor when coping with life stress. Personality and Individual Differences, 13 (7), 799-804.
Porterfield, A. L. (1987). Does sense of humor moderate the impact of life stress on psychologi-cal and physical well-being? Journal of Research in Personality, 21 (3), 306-317.
Speisman, J. C., Lazarus, R. S., Mordkoff, A., & Davison, L. (1964). Experimental reduction of stress based on ego-defense theory. Journal of Abnormal and Social Psychology, 68 (4), 367-380.
Svebak, S. (1996). The Development of the Sense of Humor Questionnaire: From SHQ to SHQ-6. Humor: International Journal of Humor Research 9 (3/4), 341-361.
Svebak, S., & Apter, M. J. (1987). Laughter: An empirical test of some reversal theory hypoth-eses. Scandinavian Journal of Psychology, 28, 189-198.
Svebak, S. K., Gotestam, G., & Jensen, E. N. (2004). The significance of sense of humor, life re-gard, and stressors for bodily complaints among high school students. Humor: International Journal of Humor Research, 17 (1/2), 121-134.
Svebak, S., & Martin, R. A. (1997). Humor as a form of coping. In S. Svebak and M. J. Apter (Eds.) Stress and Health: A Reversal Theory Perspective (pp. 173-184), Taylor & Francis.
Watson, D., Clark, L.A. & Tellegen, A. (1988). Development and validation of brief measures of positive and negative affect: The PANAS scales. Journal of Personality and Social Psychology, 54 (6), 1063-1070.
Yovetich, N. A., Dale, J. A., & Hudak, M. A. (1990). Benefits of humor in reduction of the threat-induced anxiety. Psychological Reports, 66, 51-58.
Humor Effect on Stress Responses: The experimental study using stress inducing movie
26
Gender and Age Differences in Emotional Intelligence, Stoicism and Aggression
Anda Gaitniece-Putāne4
University of Latvia
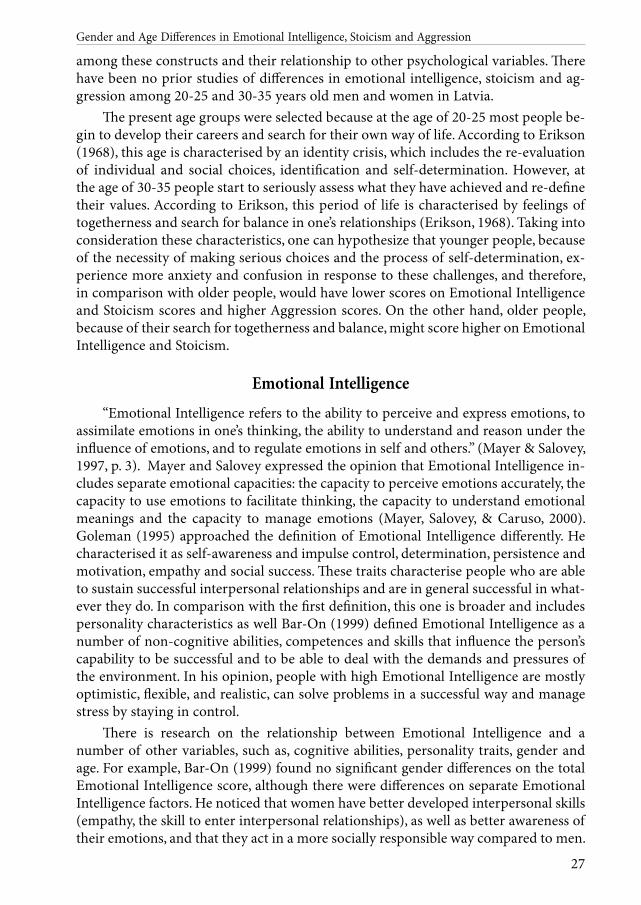
The aim of this study was to explore gender and age differences in emotional intelligence, sto-icism and aggression for 20-25 and 30-35 year old adult. A total of 414 respondents (50% men and 50% women) took part in the study. The respondents came from different socio-econom-ic groups. The following instruments were used: the Bar-On Emotional Quotient Inventory, the Aggression Questionnaire, and the Liverpool Stoicism Scale. The results of the MANOVA analysis show that age and gender significant influence Emotional Intelligence and Aggression as multifactor constructs. The results of ANOVA showed that there were no significant differ-ence between the gender and age groups on the total Emotional Quotient, there were only significant differences on several Emotional Intelligence factors and subscales, and on the Stoicism scale.5 Keywords: Emotional intelligence, stoicism, aggression, gender, age.
IntroductionAggression, emotional intelligence and stoicism are significant characteristics of
human behaviour, that are connected with emotion regulation Prior understanding of these relationships can help both to define the nature of these related constructs more clearly and to establish the mechanism of their interaction. Many aspects that characterize personality are related to socio-demographic indices. This has been es-tablished in several studies of emotional intelligence and aggression and a number of studies of stoicism (Bar-On, 1999; Van Rooy, Alonso & Viswesaran, 2005; Feldman, 2004; Sutarso, 1999; Geary, 1998; Buss & Perry, 1992; Archer, Kilpatrick & Bramwell, 1995; Ramirez, Andreu & Fujihara, 2001; Archer & Haigh, 1997; Harris, 1996; Wagstaff & Rowledge, 1995; Seale, 2002; Fergus, Gray, Fitch, Labrecque & Phillips, 2002 etc), in which the researchers showed that both gender and age differences exist, although they vary in different cultural milieus and in different age groups. This is why informa-tion about the relationship of these variables to socio-demographic indices in one cul-tural milieu cannot necessarily be applied in others. Therefore the aim of the present study was to establish whether there are gender and age differences in these three variables - Emotional Intelligence, Aggression and Stoicism - in the cultural milieu of Latvia. This information is also important for further studies about interrelations
Baltic Journal of Psychology, 2006, 7 (2), 26–42
4 This is part of Anda Gaitnieces-Putanes’s study from Ph. D thesis, supervisor prof. Malgožata Raščevska
5 Author’s note. Correspondence concerning this article should be addressed to Anda Gaitneice-Putāne, e-mail: [email protected]
27
among these constructs and their relationship to other psychological variables. There have been no prior studies of differences in emotional intelligence, stoicism and ag-gression among 20-25 and 30-35 years old men and women in Latvia.
The present age groups were selected because at the age of 20-25 most people be-gin to develop their careers and search for their own way of life. According to Erikson (1968), this age is characterised by an identity crisis, which includes the re-evaluation of individual and social choices, identification and self-determination. However, at the age of 30-35 people start to seriously assess what they have achieved and re-define their values. According to Erikson, this period of life is characterised by feelings of togetherness and search for balance in one’s relationships (Erikson, 1968). Taking into consideration these characteristics, one can hypothesize that younger people, because of the necessity of making serious choices and the process of self-determination, ex-perience more anxiety and confusion in response to these challenges, and therefore, in comparison with older people, would have lower scores on Emotional Intelligence and Stoicism scores and higher Aggression scores. On the other hand, older people, because of their search for togetherness and balance, might score higher on Emotional Intelligence and Stoicism.
Emotional Intelligence
“Emotional Intelligence refers to the ability to perceive and express emotions, to assimilate emotions in one’s thinking, the ability to understand and reason under the influence of emotions, and to regulate emotions in self and others.” (Mayer & Salovey, 1997, p. 3). Mayer and Salovey expressed the opinion that Emotional Intelligence in-cludes separate emotional capacities: the capacity to perceive emotions accurately, the capacity to use emotions to facilitate thinking, the capacity to understand emotional meanings and the capacity to manage emotions (Mayer, Salovey, & Caruso, 2000). Goleman (1995) approached the definition of Emotional Intelligence differently. He characterised it as self-awareness and impulse control, determination, persistence and motivation, empathy and social success. These traits characterise people who are able to sustain successful interpersonal relationships and are in general successful in what-ever they do. In comparison with the first definition, this one is broader and includes personality characteristics as well Bar-On (1999) defined Emotional Intelligence as a number of non-cognitive abilities, competences and skills that influence the person’s capability to be successful and to be able to deal with the demands and pressures of the environment. In his opinion, people with high Emotional Intelligence are mostly optimistic, flexible, and realistic, can solve problems in a successful way and manage stress by staying in control.
There is research on the relationship between Emotional Intelligence and a number of other variables, such as, cognitive abilities, personality traits, gender and age. For example, Bar-On (1999) found no significant gender differences on the total Emotional Intelligence score, although there were differences on separate Emotional Intelligence factors. He noticed that women have better developed interpersonal skills (empathy, the skill to enter interpersonal relationships), as well as better awareness of their emotions, and that they act in a more socially responsible way compared to men.
Gender and Age Differences in Emotional Intelligence, Stoicism and Aggression

28
At the same time, men have better intrapersonal skills (self-respect, independence), adaptation abilities (problem solving, flexibility, better ability to manage stress and a higher level of optimism) (Bar–On, 1999).
Other researchers found that women have a higher general level of Emotional Intelligence, as indicated by higher total Emotional Intelligence scores (Van Rooy, Alonso & Viswesaran, 2005; Feldman, 2004; Sutarso, 1999). In addition, they have higher scores on the interpersonal factor (Reiff, 2001; Smith, 2001; Palmer, Manocha, Gignac & Stough, 2003). Another study shows that men have higher average levels of the total EI score (Fatt & Howe, 2003). Other researchers have found that there are no gender differences on the total Emotional Intelligence score or its factors (Maree & Eiselen, 2004; Roothman, Kirsten, & Wissing, 2003; Nikolaou & Tsaousis, 2002; Rooth-man, Kirsten, & Wissing, 2003; Harrigan, 2002).
In the case of age differences in Emotional Intelligence, there are studies conclud-ing that 40-49 year old respondents have the highest Emotional Intelligence scores (Bar-On, 1999; Van Rooy, Alonso, & Viswewsaran, 2005). Sutarso found that the high-est means on the subscales of the Emotional Intelligence questionnaire were in the age group from 20 to 40 (Sutarso, 1999). Derksen, Kramer and Katzko reported the high-est means on the Emotional Intelligence questionnaire in the age group from 35 to 44, and found that the means tended to decrease among older respondents (Derksen, Kramer, & Katzko, 2002). There are other studies that show no correlation between Emotional Intelligence and age (Hemmati, Mills, & Kroner, 2004; Maree & Eiselen, 2004; Smith, 2001). Thus, the results of different studies involving Emotional Intel-ligence vary considerably.
AggressionIn the psychological literature the notion of aggression is defined in different
ways. For example, Berkowitz expressed the opinion that, in order for an action to be classified as aggression, it must include a voluntary, conscious act with the aim of hurting or offending another person (Berkowitz, 1990). Bass (1961) argued that ag-gression is any behaviour that includes threats or harm to others. Taking into consid-eration other authors’ views on aggression (Shaver & Tarpy, 1993; Korman, 1974 and others), aggression is usually defined as conscious offensive action as a result of which its victim suffers.
Research on gender differences in aggression, shows that men demonstrate high-er physical aggression (Geary, 1998). Self-assessment forms also yield similar results (Buss & Perry, 1992; Archer, Kilpatrick, & Bramwell, 1995; Ramirez, Andreu, & Fuji-hara, 2001; Andreu, Fujihara, & Ramirez, 2001 and others.). Men’s tendency to dem-onstrate higher levels of aggression is more openly expressed in highly provocative situations (Beron & Richardson, 1997). However, the research results are not unequiv-ocal: Researchers such as Eagly, Steffen and Frodi (cited in Geary, 1998) concluded that men are also more aggressive than women in neutral and non-provocative situa-tions. When women are provoked or are made to justify themselves, they become as aggressive as men (Geary, 1998). Both at home and at work men and women express anger and aggression in rather similar ways. They can become sour, hold grudges,
Anda Gaitniece-Putāne, Malgožata Raščevska

29
have a frank dispute or shout. The results of studies show that men have a higher ten-dency towards direct forms of aggression, but women more often use indirect actions, finding implicit ways to hurt others (Lagerspetz, Bjorkqvist, & Peltonen, 1998). Thus research in different cultural milieus shows gender differences in aggression.
There is comparatively little research on the relationship between aggression and age. Part of this research focuses on teenagers, but research among adults shows that aggression has significant negative correlations with age (Archer & Haigh, 1997; Har-ris, 1996). Thus, as the individual becomes older, physical aggression and the overall aggression levels tend to decrease.
StoicismThe modern notion of stoicism was introduced by Wagstaff and Rowledge (1995).
They defined it as emotional control, emotional non-involvement and lack of emo-tional expressivity. Furnham (1972) holds a similar view of stoicism, defining it as rejection or denial of emotions. The construct of stoicism has been minimally studied as yet (Almberg, Grafstrom, & Winblad, 1997.; Becker, 2003; Colby, 2003; Furnham, Petrides, Sisterson, & Baluch, 2003; Wagstaff & Rowledge, 1995). This notion is more often used in philosophy and in mass media for referring to the ability of people to remain calm in critical situations, and the ability to endure pain without complaint. Research has demonstrated the existence of gender differences in stoicism (Wagstaff & Rowledge, 1995; Seale, 2002; Fergus, Gray, Fitch, Labrecque, & Phillips, 2002). Men have a tendency to demonstrate stoicism more often and more intensively. Age differ-ences in stoicism have not been investigated to date.
Taking into account that there were gender differences on the three constructs re-viewed: Emotional Intelligence, aggression and Stoicism, and age differences in Emo-tional Intelligence and Aggression, we hypothesized that there would be differences in Emotional Intelligence, Aggression and Stoicism across gender and age in a Latvian sample. Investigating these variables would be of interest because none of them have as yet been studied in the Latvian cultural setting.
Hence the specific aim of this study was to investigate gender differences in Emo-tional Intelligence, Stoicism and Aggression among 20-25 and 30-35 years old indi-viduals.
Method
RespondentsThe research group included 414 respondents: 100 men in the age group from
20 to 25 (M=22.21; SD=1.65); 101 men in the age group from 30 to 35 (M=32.65; SD=1.73); 100 women in the age group from 20 to 25 (M=21.8; SD=1.63) and 113 women in the age group from 30 to 35 (M=32.44; SD=1.89). There was no significant differences between the average age of the male and female samples in the age group of 20-25 (t=1.67, p> .05) and in the age group of 30-35 (t=0.93, p> 0.05).
Respondents represent different socio-economic groups (social workers, lawyers and people working in legal agencies, in the technical field, in economics, business,
Gender and Age Differences in Emotional Intelligence, Stoicism and Aggression

30
service industries, education, administration, office workers, as well as students, artists, and unemployed people), including people of different educational levels (elementary education, secondary education, college and higher education) and different average monthly income (ranging from less than 100 Ls to more than 300 Ls a month).
The respondents were asked to take part in a study about „typical behavioural styles in Latvia”, and were not directly informed about the purpose of this research. The sample was selected to represent respondents from as many different socio-eco-nomic groups as possible for each of the specific age and gender groups included in the study.
InstrumentsBar-On Emotional Quotient Inventory (EQ-i): This inventory was originally pub-
lished in Canada (Bar-On, 1999), and has been adapted in Latvian by A. Gaitniece-Putāne, M. Raščevska and G. Malzubris (pilot study, Malzubris, 2003). The Bar-On EQ- inventory includes five factors, measured by a total of 15 subscales. The inven-tory includes 133 items. The items are scored on a 5-point Likert scale, ranging from “Never or very seldom refers to me,” to “Very often or always refers to me.” The scores are summed after re-coding the items with reverse meaning. Thus, the higher the score, the higher the Emotional Intelligence quotient. Double translation of the scale was performed: from English into Latvian and then from Latvian back into Eng-lish, in order to assure the precision of the translation. The translations were done by two independent bilingual experts. The results in the Latvian sample showed a high consistency of the inventory (Cronbach’s alpha = .94). Most of Bar-On EQ scales have sufficiently high internal reliability, except for the Assertiveness, Independence, Empathy and Reality Testing subscales. The Cronbach’s alphas of these scales are very close to .70.
Aggression Questionnaire (Buss & Perry, 1992): The Latvian version was adapted by Gaitniece-Putane (2005). The scale includes 29 items, scored on 5-point Likert scales ranging from “Never,” to “Very often.” Two items are scored in the reverse direc-tion. Each respondent obtains scores on four scales: Physical Aggression, Verbal Ag-gression, Anger and Hostility. The number of items differs for each scale.
The total scale of the Aggression Questionnaire in the Latvian sample displayed high consistency (Cronbach’s alpha = .88). The results showed no necessity to modify the items in Latvian.
The Liverpool Stoicism Scale (Wagstaff & Rowledge,1995): This scale was adapted in Latvian by Gaitniece-Putāne (2005). It consists of 20 items scored on 5-point Likert scales ranging from “Absolutely agree,” to ”Absolutely disagree”. Half of the items are formulated and scored in reverse. The minimum score is 20 points, the maximum 100 points. The Stoicism scales have sufficiently high reliability.
Socio-Demographic Questionnaire: The respondents were asked to fill out a ques-tionnaire about demographic and socio-economic indices: age, gender, education, oc-cupation and average monthly income.
Anda Gaitniece-Putāne, Malgožata Raščevska
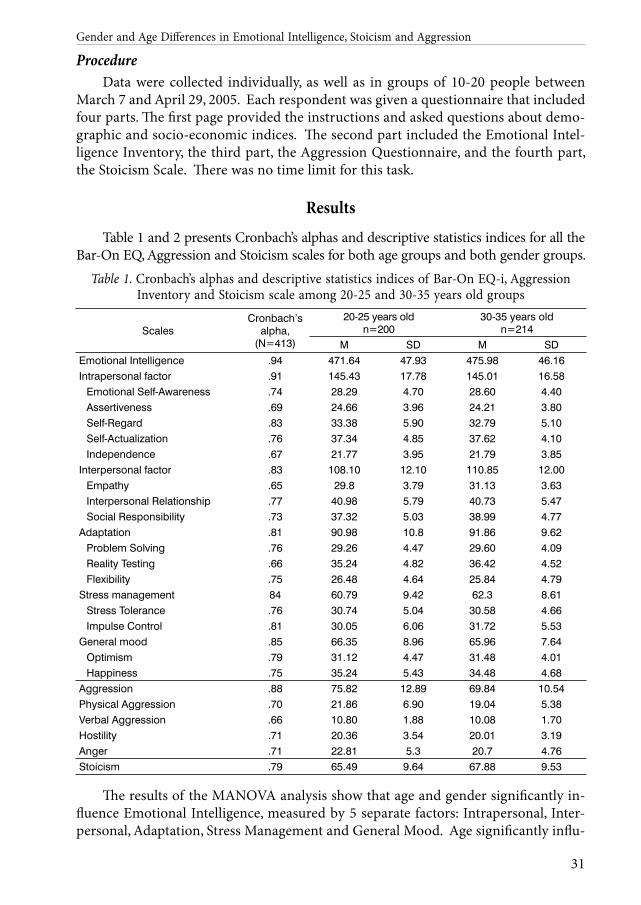
31
ProcedureData were collected individually, as well as in groups of 10-20 people between
March 7 and April 29, 2005. Each respondent was given a questionnaire that included four parts. The first page provided the instructions and asked questions about demo-graphic and socio-economic indices. The second part included the Emotional Intel-ligence Inventory, the third part, the Aggression Questionnaire, and the fourth part, the Stoicism Scale. There was no time limit for this task.
Results
Table 1 and 2 presents Cronbach’s alphas and descriptive statistics indices for all the Bar-On EQ, Aggression and Stoicism scales for both age groups and both gender groups.
Table 1. Cronbach’s alphas and descriptive statistics indices of Bar-On EQ-i, Aggression Inventory and Stoicism scale among 20-25 and 30-35 years old groups
ScalesCronbach’s
alpha, (N=413)
20-25 years oldn=200
30-35 years oldn=214
M SD M SDEmotional Intelligence .94 471.64 47.93 475.98 46.16Intrapersonal factor .91 145.43 17.78 145.01 16.58
Emotional Self-Awareness .74 28.29 4.70 28.60 4.40Assertiveness .69 24.66 3.96 24.21 3.80Self-Regard .83 33.38 5.90 32.79 5.10Self-Actualization .76 37.34 4.85 37.62 4.10Independence .67 21.77 3.95 21.79 3.85
Interpersonal factor .83 108.10 12.10 110.85 12.00Empathy .65 29.8 3.79 31.13 3.63Interpersonal Relationship .77 40.98 5.79 40.73 5.47Social Responsibility .73 37.32 5.03 38.99 4.77
Adaptation .81 90.98 10.8 91.86 9.62Problem Solving .76 29.26 4.47 29.60 4.09Reality Testing .66 35.24 4.82 36.42 4.52Flexibility .75 26.48 4.64 25.84 4.79
Stress management 84 60.79 9.42 62.3 8.61Stress Tolerance .76 30.74 5.04 30.58 4.66Impulse Control .81 30.05 6.06 31.72 5.53
General mood .85 66.35 8.96 65.96 7.64Optimism .79 31.12 4.47 31.48 4.01Happiness .75 35.24 5.43 34.48 4.68
Aggression .88 75.82 12.89 69.84 10.54Physical Aggression .70 21.86 6.90 19.04 5.38Verbal Aggression .66 10.80 1.88 10.08 1.70Hostility .71 20.36 3.54 20.01 3.19Anger .71 22.81 5.3 20.7 4.76Stoicism .79 65.49 9.64 67.88 9.53
The results of the MANOVA analysis show that age and gender significantly in-fluence Emotional Intelligence, measured by 5 separate factors: Intrapersonal, Inter-personal, Adaptation, Stress Management and General Mood. Age significantly influ-
Gender and Age Differences in Emotional Intelligence, Stoicism and Aggression

32
ences Emotional Intelligence, MANOVA Pillai’s Trace=0.05, F (5, 406) =3.86, p< .002. Gender also significantly influences Emotional Intelligence, Pillai’s Trace=0.18 and F (5, 406) =17.64, p< .001. The interaction of age and gender does not have a signifi-cant influence upon Emotional Intelligence, measured by the 5 separate factors, Pillai’s Trace= 0.01 and F (5,406) =0.94, p< .45.
Similar conclusions can be drawn from MANOVA (gender x age) related to Emo-tional Intelligence calculated, using the 15 subscales: for age Pillai’s Trace = 0.11, F (15, 396) =3.27, p< .001; for gender Pillai’s Trace = 0.26, F (15, 396)=9.12, p< .001. The interaction of age and gender does not have a significant influence upon Emotional Intelligence, measured by 15 subscales, Pillai’s Trace=0.04, F(15, 396)=1.05, p< .41.
Table 2. Descriptive statistics indices of Bar-On EQ-i, Aggression Inventory and Stoicism scale among 20-25 and 30-35 years old men and women
Scales
Total sample: 20-35 years old 20-25 years old 30-35 years oldMen
n=201Womenn=213
Men n=100
Women n=100
Menn=101
Womenn=113
M SD M SD M SD M SD M SD M SDEmotional Intel-ligence (total) 471.47 49.86 476.15 44.16 472.74 49.75 470.53 46.26 470.22 50.19 481.13 41.79
Intrapersonal factor 145.35 17.42 145.08 16.94 146.71 18.16 144.14 17.40 144.00 16.63 145.92 16.56Emotional Self- Awareness 27.75 4.51 29.11 4.48 28.01 4.51 28.56 4.88 27.49 4.52 29.59 4.05
Assertiveness 24.59 3.74 24.27 4.01 24.80 3.91 24.51 4.02 24.39 3.58 24.05 4.00Self-Regard 33.4 5.21 32.77 5.76 34.14 5.52 32.61 6.20 32.67 4.81 32.9 5.36Self-Actualization 37.26 4.71 37.69 4.19 37.46 4.92 37.22 4.80 37.07 4.51 38.12 3.53Independence 22.34 3.6 21.25 4.09 22.30 3.91 21.24 3.92 22.39 3.29 21.26 4.24
Interpersonal factor 105.61 11.86 113.21 11.18 104.68 11.5 111.51 11.77 106.52 12.19 114.71 10.45Empathy 29.25 3.65 31.66 3.49 28.62 3.58 30.98 3.65 29.87 3.64 32.26 3.25Interpersonal Relationship 39.94 5.7 41.71 5.43 40.49 5.72 41.46 5.85 39.39 5.65 41.93 5.04
Social Respon-sibility 36.42 4.75 39.84 4.59 35.57 4.59 39.07 4.87 37.27 4.77 40.52 4.24
Adaptation 91.56 10.61 91.31 9.83 91.62 11.08 90.34 10.53 91.50 10.18 92.17 9.12Problem Solving 29.66 4.35 29.22 4.21 29.44 4.42 29.07 4.54 29.88 4.29 29.35 3.91Reality Testing 35.42 4.71 36.25 4.67 34.91 4.84 35.58 4.81 35.93 4.54 36.85 4.48Flexibility 26.48 4.53 25.84 4.89 27.27 4.22 25.69 4.91 25.69 4.71 25.96 4.88
Stress manage-ment 63.19 8.98 60.04 8.83 62.94 9.17 58.63 9.22 63.44 8.83 61.29 8.31
Stress Tolerance 31.75 4.7 29.62 4.76 31.94 4.57 29.53 5.22 31.55 4.84 29.71 4.33Impulse Control 31.44 5.6 30.42 6.04 31.00 6.03 29.1 5.96 31.88 5.12 31.58 5.88
General mood 65.77 8.52 66.51 8.1 66.79 8.56 65.91 9.37 64.75 8.4 67.04 6.74Optimism 30.86 4.67 31.73 3.76 30.92 4.73 31.31 4.22 30.79 4.63 32.1 3.27Happiness 34.91 4.88 34.78 5.25 35.87 4.87 34.60 5.90 33.96 4.71 34.95 4.63
Aggression 75.38 12.17 70.22 11.5 77.86 12.79 73.78 12.73 72.93 11.05 67.07 9.27Physical Aggres-sion 23.33 6.19 17.63 5.06 24.81 6.58 18.9 5.89 21.87 5.42 16.51 3.89
Verbal Aggression 10.67 1.75 10.2 1.85 10.91 1.85 10.68 1.87 10.43 1.61 9.77 1.73Hostility 20.44 3.41 19.94 3.31 20.57 3.47 20.16 3.62 20.31 3.37 19.75 3.01Anger 20.95 4.86 22.45 5.28 21.57 4.72 24.04 5.58 20.33 4.94 21.04 4.59Stoicism 62.08 7.73 71.11 9.23 61.27 8.00 69.71 9.32 62.89 7.41 72.35 9.01
Anda Gaitniece-Putāne, Malgožata Raščevska

33
Thus, age and gender together significantly influence Emotional Intelligence, measured by 5 separate factors, and by 15 subscales. However, the results of ANOVA in Table 2, with only the total EQ as a dependent variable, are quite different. Neither the independent variables age and gender, nor the interaction of age and gender sig-nificantly influence the total Emotional Intelligence score.
According to MANOVA results, both age and gender significantly influence total Aggression, measured by 4 subscales: Physical aggression, Verbal aggression, Hostility and Anger (see Table 2). For age Pillai’s Trace = 0.09 and F (4, 407) =9.72, p< .001, and for gender Pillai’s Trace = 0.35 and F (4, 407) =53.86, p< .001 (see Table 2). Interac-tion of age and gender significantly influences total Aggression, Pillai’s Trace=0.02 and F (4, 407) =2.06, p= .86. The same results were also obtained by the ANOVA model, using only total Aggression as the dependent variable.
Table 3. Bar-On EQ-i, Aggression Inventory and Stoicism Inventory descriptive statistics indices with independent variables of age and gender
MANOVA Gender(men-women)
Age(20-25) – (30-35)
age gender age x gender 20-25 30-35 men womenF F F t t t t
Intrapersonal factor 0.08 0.04 1.76 1.02 -0.85 1.1 -0.77 Emotional Self-Awareness 0.33 9.06** 3.11 -0.83 -3.6** 0.82 -1.69 Assertiveness 1.30 0.66 0 0.52 0.64 0.78 0.83 Self-Regard 1.18 1.45 2.65 1.84 -0.33 2.01* -0.37 Self-Actualization 0.33 0.85 2.16 0.35 -1.87 0.59 -1.54 Independence 0.02 8.27** 0.008 1.91 2.19* -0.17 -0.03Interpersonal factor 4.99* 44.25** 0.36 -4.15* -5.29** -1.1 -2.1* Empathy 13.29** 46.82** 0.001 -4.62** -5.07** -2.46* -2.7** Interpersonal Relationship 0.34 10.31** 2.07 -1.19 -3.48** 1.38 -0.63 Social Responsibility 12.05** 55.41** 0.07 -5.24** -5.29** -2.57* -2.33*Adaptation 0.73 0.09 0.93 0.84 -0.5 0.8 -1.36 Problem Solving 0.74 1.13 0.04 0.58 0.94 -0.72 -0.49 Reality Testing 6.23* 3.00 0.07 -0.98 -1.49 -1.54 -1.99* Flexibility 1.99 2.00 4.01* 2.44** -0.41 2.5* -0.41Stress management 3.27 13.66** 1.54 3.32* 1.83 -0.39 -2.22* Stress Tolerance 0.05 20.83** 0.37 3.48** 2.95** 0.58 -0.27 Impulse Control 8.8** 3.75 2.00 2.24* 0.39 -1.12 -3.06**General mood 0.31 0.75 3.79 0.69 -2.21* 1.7 -1.02 Optimism 0.63 4.16* 1.21 -0.62 -2.36* 0.19 -1.51 Happiness 2.48 0.08 5.17* 1.66 -1.54 2.82** -0.47Emotional Intelligence (ANOVA) 0.76 0.89 2.02 -0.33 -1.74 0.36 -1.76Aggression (ANOVA) 26.52** 19.34** 0.62 2.26* 4.22** 2.93** 4.43**Physical Aggression 24.31** 108.85** 0.26 6.7** 8.38** 3.46** 3.53**Verbal Aggression 16.04** 6.47* 1.50 0.87 2.86** 1.98* 3.68**Hostility 1.03 24.02 0.05 0.82 1.27 0.55 0.90Anger 18.93** 10.6** 3.25 -3.38** -1.09 1.82 4.31**Stoicism (ANOVA) 5.93* 118.61** 0.54 -6.87** -8.33** -1.49 -2.1*
**p< .01*p< .05
Gender and Age Differences in Emotional Intelligence, Stoicism and Aggression
34
Table 3 presents the MANOVA (age x gender) for Emotional Intelligence scales and subscales, as well as t-tests that were calculated in order to show gender differ-ences within age groups, and age differences within gender groups.
Age significantly influences the Interpersonal factor, as well as the following sub-scales (see Table 3): Empathy, Social Responsibility, Reality Testing and Impulse Con-trol. In all these scales 30-35 year old adults have higher means than 20-25 year old adults (see Table 2). Analysis of age group differences within gender samples shows that not all the above-mentioned means of variables increase with age in both gender groups. They increase for both genders (F+M) on the Empathy and Social Respon-sibility and only for females on Reality Testing, Impulse Control and Stress Manage-ment. In turn, males show the opposite tendency on separate Emotional Intelligence subscales: as scores on Self-Regard, Flexibility and Happiness decrease significantly with age.
In the total adult sample gender significantly influences the Interpersonal factor (F>M) (including all the subscales) and the Stress management factor (M>F) (includ-ing the Stress Tolerance subscale), as well as subscales of some other factors: Emo-tional Self-Awareness (F>M), Independence (M>F) and Optimism (F>M). However, gender differences within the two age groups are not the same. Females in compari-son with males in both age groups score significantly higher only on the Interpersonal factor (including the subscales of Empathy and Social Responsibility) and lower on Stress Tolerance. Only in the 30-35 age group females show higher scores than males on Emotional Self-Awareness, Interpersonal Relationship, General Mood, and Opti-mism, but significantly lower scores on Independence. Only in the 20-25 age group females compared to males show lower scores on Stress Management (including Im-pulse Control) and Flexibility.
MANOVA subscale results for the Aggression Inventory show that both age and gender significantly influence Physical Aggression, Verbal Aggression and Anger, but do not influence Hostility (see Table 3). On almost all scales younger adults have higher scores than older adults, and men score higher compared to women. An excep-tion is the Anger scale, where 20-25 year old women have higher scores than men, but there are no gender differences in the 30-35 age group. There are no age differences on Anger in the male sample, but there are differences in the female sample. There is no significant influence of the age and gender interaction on all the Aggression scales.
ANOVA results of the Stoicism scale for the total adult sample show (see Table 3) that both age and gender significantly influence stoicism, but not age and gender interaction. Women aged 30-35 obtained significantly higher stoicism scores than the 20-25 year-old group. There are no significant age differences in the male sample. Gender differences are manifested in both age groups: women are more stoical than men.
The summary of significant differences on the Bar-On EQ-i, Aggression Inventory and Stoicism Inventory indices between gender and age groups (see Table 4).
Anda Gaitniece-Putāne, Malgožata Raščevska
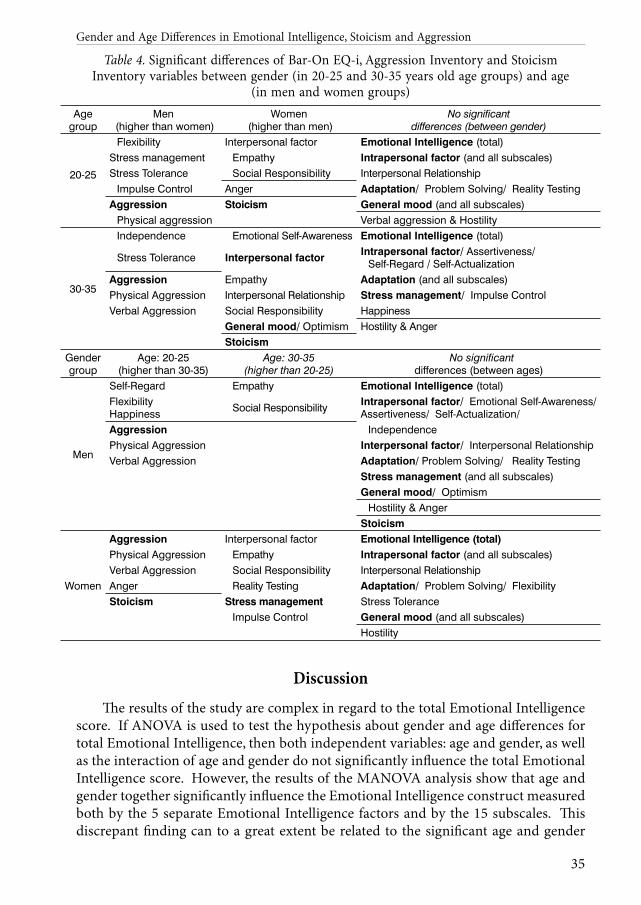
35
Table 4. Significant differences of Bar-On EQ-i, Aggression Inventory and Stoicism Inventory variables between gender (in 20-25 and 30-35 years old age groups) and age
(in men and women groups)Age
groupMen
(higher than women)Women
(higher than men)No significant
differences (between gender)
20-25
Flexibility Interpersonal factor Emotional Intelligence (total)Stress management Empathy Intrapersonal factor (and all subscales)Stress Tolerance Social Responsibility Interpersonal Relationship
Impulse Control Anger Adaptation/ Problem Solving/ Reality TestingAggression Stoicism General mood (and all subscales)
Physical aggression Verbal aggression & Hostility
30-35
Independence Emotional Self-Awareness Emotional Intelligence (total)
Stress Tolerance Interpersonal factor Intrapersonal factor/ Assertiveness/ Self-Regard / Self-Actualization
Aggression Empathy Adaptation (and all subscales)Physical Aggression Interpersonal Relationship Stress management/ Impulse ControlVerbal Aggression Social Responsibility Happiness
General mood/ Optimism Hostility & AngerStoicism
Gender group
Age: 20-25(higher than 30-35)
Age: 30-35(higher than 20-25)
No significantdifferences (between ages)
Men
Self-Regard Empathy Emotional Intelligence (total)FlexibilityHappiness Social Responsibility Intrapersonal factor/ Emotional Self-Awareness/
Assertiveness/ Self-Actualization/ Aggression IndependencePhysical Aggression Interpersonal factor/ Interpersonal RelationshipVerbal Aggression Adaptation/ Problem Solving/ Reality Testing
Stress management (and all subscales)General mood/ Optimism
Hostility & AngerStoicism
Women
Aggression Interpersonal factor Emotional Intelligence (total)Physical Aggression Empathy Intrapersonal factor (and all subscales)Verbal Aggression Social Responsibility Interpersonal RelationshipAnger Reality Testing Adaptation/ Problem Solving/ FlexibilityStoicism Stress management Stress Tolerance
Impulse Control General mood (and all subscales)Hostility
Discussion
The results of the study are complex in regard to the total Emotional Intelligence score. If ANOVA is used to test the hypothesis about gender and age differences for total Emotional Intelligence, then both independent variables: age and gender, as well as the interaction of age and gender do not significantly influence the total Emotional Intelligence score. However, the results of the MANOVA analysis show that age and gender together significantly influence the Emotional Intelligence construct measured both by the 5 separate Emotional Intelligence factors and by the 15 subscales. This discrepant finding can to a great extent be related to the significant age and gender
Gender and Age Differences in Emotional Intelligence, Stoicism and Aggression

36
interaction on the subscales of Flexibility and Happiness. Different age dynamics of Emotional Intelligence subscale scores within gender groups resulted in the total Emotional intelligence scores not showing actual differences on the Emotional Intel-ligence construct measurements. It can be concluded that the scales of Emotional Intelligence are more significant variables that influence the total measurement of Emotional Intelligence in the opposite direction if the sample consists of respondents of both genders and a large age range.
Although MANOVA results shows that age and gender, as well as age and gen-der interaction generally influence the Emotional intelligence construct, this influence is basically determined by the Interpersonal and Stress Management factors. The results of the analysis for the 20-25 age group and the 30-35 age group for each gender, show that there are no differences on total Emotional Intelligence. However, there are differ-ences between age groups on the Emotional Intelligence Interpersonal factor, as well as on Empathy and Social Responsibility scales of this factor (see in Table 4). Thus, age significantly influences both of the subscales. The Interpersonal factor taps the ability to communicate well, to reach understanding with other people, and to co-operate with other people. Empathy assesses the ability to understand, accept, feel other people’s emotions; and Social Responsibility involves the ability to be an industrious, creative, and cooperative member of a social group. In general the Interpersonal factor refers to the ability to understand each other and to cooperate, and these abilities may be enhanced by accumulated life experience, among the people in the 30-35 age group.
Comparing results in the gender groups within each age group on the Interpersonal factor and its subscales, differences are again found on the Interpersonal scale, which are similar to the results of other studies (Reiff, 2001; Smith, 2001; Palmer, Manocha, Gignac, & Stough, 2003). There are also differences on the Social Responsibility and Em-pathy subscales on this factor with gender significantly influencing both of the subscales. On most Emotional intelligence scales (excepted Stress Tolerance) Latvian women at both 20-25 and 30-35 years of age score higher than men. These results are a little differ-ent from Bar-On (1999) results. These findings may be traced to the female gender role, which prescribes an orientation towards other people and their emotions, as well as the desire to communicate and cooperate with others. On the Interpersonal Relationship subscale within the Interpersonal factor, which includes the ability to form and maintain mutually satisfying, emotionally close, intimate and attracting relationships, 30-35 year old women score higher than men in the same age group. This result again may be re-lated to the female gender role which emphasizes the orientation towards relationship and may possibly promote greater interpersonal skills. It is, however, worth noting that in the 20-25 age group there are no significant gender differences. Young men nowadays may be more flexible in their relationships and may no longer so strictly abide by the traditional male gender role, characteristic for Latvia, which prescribes being emotionally reserved. This could influence the quality of a relationship, since emotionally close, intimate relationships demand greater emotional openness. Con-ceivably related is the finding that on the Emotional Intelligence Flexibility subscale, which evaluates the ability to adjust feelings, thoughts and actions to changing situ-ations and conditions, 20-25 year old men score higher than their 30-35 years old counterparts.
Anda Gaitniece-Putāne, Malgožata Raščevska
37
On the Emotional intelligence Stress Management factor, which entails the ability to cope with stress without panic and losing control, as well as to be calm and bal-anced and to work well in tense situations, 30-35 year-old women, compared to 20-25 year-old women, score higher. An analogous result is obtained on the Impulse control subscale, which encompasses the ability to resist or deny the impulse or the urge to act and to control emotions. Thus, 30-35 year-old women compared to 20-25 year-old women can better control themselves and cope with tense situations. This can again be explained on the basis of life experience which has enabled them to practise these skills and probably also to establish their priorities and values which, in turn, help to avoid worrying about nonessentials and facilitate coping with impulses that in the long-term perspective are not deemed to be constructive.
The analysis of gender differences in both age groups shows that 20-25 year-old men score higher than women on both the Stress management factor and Impulse control. The male gender role may foster such traits as self-control and balance. With age and experience women may also have improved these skills, and this may be a possible reason why in the 30-35 age-group there are no such differences. However, there are gender differences in both age groups, with men scoring higher on the Stress Tolerance subscale, which indicates tolerance of stressful situations and emotional arousal and the ability to cope with stress without panic. Since these results are similar to those reported by Bar-On (1999), it can be concluded that men in general tend to cope more effectively with stressful situations.
Upon analysis of age differences within both gender groups, we can see that 30-35 year-old women score higher than 20-25 year-old women on the Reality Testing subscale. This subscale taps the ability to differentiate subjective experience from objective reality, which can plausibly be explained by 30-35 year-old women’s greater life experience. In turn, 20-25 year-old men score higher than 30-35 year-old men on the Self-Regard subscale, tapping the ability to understand, accept and respect oneself; the Flexibility subscale, concerned with the ability to adjust feelings, thoughts and ac-tion to changing situations and conditions, and the Happiness subscale, referring to the ability to be content with life, be happy about self and others, and express positive emotions. A possible explanation is that
20-25 year-old men are less self-critical and are more positively oriented and have a stronger belief in their ability to adapt to new situations.
With regard to gender differences in both age groups on the General Mood factor, which includes the ability to enjoy life, maintain a positive outlook and feel satisfied, as well as on the Optimism subscale of this factor, which includes the ability to see the good in life and to maintain a positive attitude in the case of failure, women in the 30-35 age-group score higher than men. These results are discrepant from the findings by Bar-On (Bar-On, 1999). Differences between the gender roles may account for the present results. Men are expected to excel and succeed, and they tend to experience a sense of frustration and failure whenever this high standard is not met (Pleck, 1981; Kilmartin, 1994). In turn, women do not feel this social pressure to the same extent and are therefore better able to maintain a positive attitude even in the face of fail-ure. This phenomenon was also observed after Latvia regained independence in the
Gender and Age Differences in Emotional Intelligence, Stoicism and Aggression
38
beginning of the 1990-ies, when the economy was disrupted and many people were unemployed. In this situation, men tended to experience more painfully their inabil-ity to fulfil their role demands as breadwinners and to conform to the social image of competence and success; and as a result some of them turned to alcohol On the other hand, there were many women who did not give up, were ready to adapt to changing circumstances, and tried to solve family problems while maintaining a hopeful out-look. Lack of significant differences at the age of 20-25 can probably be explained by the fact that most men at this age have not yet assumed the financial responsibility of providing for a family, which, demands care and success in the professional field.
Women in the 30-35 age bracket score higher on the Emotional Self-Awareness subscale, which has to do with the recognition and understanding of one’s emotions. These results are in keeping with the Interpersonal Relationship subscale, where 30-35 year-old women score higher than men. This scale also refers to the ability to recog-nize emotions and the ability to initiate and maintain emotionally close and intimate relationships. This can be explained by the women’s gender role which prescribes paying more attention to and analyzing one’s own emotions. It is interesting that there are no gender differences in the 20-25 age-group. Men of this generation may have extended their gender role boundaries and have found a place for emotionality. They may no longer hold on to the stereotype of an emotionally reserved and constricted male image. It is worth noting that in the 20-25 age group men score higher than women on the Flexibility subscale, which includes the ability to adjust one’s feelings, thoughts and behaviour to changing situations and conditions. Thus, we may con-clude that if a man recognizes and understands his emotions well, he may adjust to different situations better in terms of his feelings, thoughts and behaviour.
Men in the 30-35 age-group score higher compared to women on the Independ-ence subscale, which includes the ability to control and manage one’s thoughts, ac-tions, and to be emotionally independent. This finding appears to be directly related to the gender role, which requires men to be self-reliant and independent in their beliefs and actions (Thompson & Pleck, 1986; Pleck, 1987).
The results of the analysis of age differences within both gender groups shows dif-ferences on total Aggression, which is consistent with the results of other studies (e.g., Archer & Haigh, 1997; Harris, 1996), as well on the Physical and verbal Aggression subscales and on the Anger subscale (see Table 3). However, there are no age differ-ences in men on these scales. Age, however, significantly influences total Aggression and Physical Aggression. Thus 30-35 year-old women, but not men, scored higher than 20-25 year-old women on the Emotional Intelligence Impulse control subscale, which refers to the ability to resist or deny impulse, the urge to act and the ability to control emotions. Thus, 20-25 year-old respondents tended to give way to their ag-gressive impulses and to be less controlled in their physical and verbal expressions of aggression, as well as in their expressions of anger.
These findings relate to the results on the Emotional Intelligence Interpersonal factor already discussed above, showing that 30-35 year old women score higher in comparison to 20-25 year old women, and to the results on the Emotional Intelligence Empathy subscale, showing that both 30-35 year-old women and men scored higher
Anda Gaitniece-Putāne, Malgožata Raščevska
39
than 20-25 year-old women and men. All of these findings definitely refer to the con-trol aggressive and angry impulses.
However, analysis of gender differences within both age groups shows that men score higher on the total Aggression and Physical Aggression subscale. The above results are not surprising and are similar to those of other studies (Buss & Perry, 1992; Archer, Kilpatrick, & Bramwell, 1995; Ramirez, Andreu, & Fujihara, 2001 etc.). The only exception occurs on the Verbal Aggression subscale in the 20-25 year age-group. Lack of gender differences on the Verbal Aggression subscale was reported by Geary (1998), who found that when women are provoked or have to justify themselves, they become as aggressive as men. However, a woman, taking into account her physical weakness, tends to choose verbal rather than physical aggression. Gender differences at age 30-35, with women scoring lower in Verbal Aggression compared to men, may be explained on the basis of the assumption that as women grow older, they begin to adjust to other people more and therefore choose open conflicts less frequently. This result is indirectly related to the fact that on the Emotional Intelligence Interpersonal Relationship subscale, which includes the ability to start and maintain mutually satisfy-ing, emotionally close, intimate and attractive relationships, 30-35 year-old women score higher, however, in the 20-25 age group gender differences are not significant. These results concur with those found on the Verbal Aggression subscale.
In turn, 20-25 year-old women score higher than men on the Anger subscale. A possible explanation is that women are more reserved in the external expression of aggression, as the results of this study have shown. Therefore, not expressing their an-ger and holding it inside results in a higher level of self-reported experience of anger. By the age of 30-35, women may have learned to transform their experience of anger or to view unpleasant situations in a more resigned way.
ANOVA results show that both age and gender influence Stoicism significantly, with. 30-35 year-old women scoring higher than their 20-25 year-old counterparts, perhaps because older women often tend to be more sceptical, resigned and calmer in comparison to younger women, who may be more naive, romantic and enthusiastic. Lack of such differences between the age groups in the male sample may be linked to the fact that women scored higher then men in both age groups. Thus, in Latvian women stoicism as a psychological variable is more pronounced and changes more dynamically than in men.
These results are contrary to those found in other studies, in which men in some situations manifest higher stoicism in comparison to women (Seale, 2002; Fergus, Gray, Fitch, Labrecque, & Phillips, 2002; Kunkel & Burleson, 1999; Lois, 2001). The authors of the Liverpool Stoicism scale, Wagstaff and Rowledge found higher stoicism indices in men (Wagstaff & Rowledge, 1995). This discrepancy can have different ex-planations. First, the above-mentioned studies used other research methods, includ-ing observations, to determine Stoicism, but not the Liverpool Stoicism scale. As an assessment method, this scale was used only in two studies, by Wagstaff and Rowledge (Wagstaff & Rowledge, 1995) and by Furnham et al. (Furnham, Petrides, Sisterson, & Baluch, 2003), in which gender differences were not studied. It is possible that in most studies Stoicism is defined differently from Wagstaff and Rowledge’s definition, either
Gender and Age Differences in Emotional Intelligence, Stoicism and Aggression
40
as the ability to cope with difficulties or by adding the aspect of emotional control, but that the definition lacks such aspects posited by Wagstaff and Rowledge as emotional non-involvement and lack of emotional expressivity. These differences in definition could contribute to the discrepancies in the results.
Secondly, we must take into account that in studies with men higher Stoicism was demonstrated in different situations, for example, when suffering from cancer or hav-ing one’s partner become ill with cancer (Seale, 2002; Fergus, Gray, Fitch, Labrecque, & Phillips, 2002) or in extreme situations (Lois, 2001). In these studies, stoicism was not measured as a stable personality trait. The Liverpool Stoicism scale is designed to measure Stoicism as a characteristic cognitive personality reaction that tends to be constant across situations. These differences in conception and measurement may well account for the differences in the results obtained in the different studies.
Third, in the study by Wagstaff and Rowledge men’s higher Stoicism scores, in contrast to women’s higher scores in the present study, might be explained on the basis of cultural differences. In Latvia, social historical circumstances required women to be equally active in the labour market and at the same time assume more responsibil-ity for the family in everyday life situations, which might foster the development of emotional constriction and self-control. Such a psychological defence style may be transmitted across generations.
When the independence of Latvia was restored in 1991, the unimpeded flow of information, blocked during the decades of Soviet rule, was reinstituted. Mass media began discussing changes in traditional gender roles, in particular within the emo-tional sphere. It has been increasingly recognized that men, like women, harbour powerful emotional experiences and that they may and should express their feelings and not suppress them in a stoical manner, as used to be expected. Many men have accepted this view and have allowed themselves to become more emotionally expres-sive. At the same time, women because of everyday problems and the responsibility for their families, continue to demonstrate greater emotional control.
In general, it can be concluded that in the Latvian sample gender and age dif-ferences were found on several Emotional Intelligence factors and subscales, on Ag-gression and its subscales and on Stoicism. A pattern of findings emerged that was somewhat different from the results obtained in other cultural milieus. These find-ings need to be explored further through cross-cultural replications and comparisons.
ReferencesAlmberg, B., Grafstrom, M., & Winblad, B. (1997). Major strain and coping strategies as re-
ported by family members who care for aged demented relatives. Journal of Advanced Nurs-ing, 26, 683–691.
Andreu, J. M., Fujihara, T., & Ramirez, J. M. (2001). Cultural and sex differences in aggression: A comparison between japanese and spanish students. Aggressive Behavior, 27, (4), 313-322.
Archer, J., & Haigh, A. M. (1997). Do beliefs about aggressive feelings and actions predict re-ported levels of aggression? British Journal of Social Psychology, 36, 83-105.
Archer, J., Kilpatrick, G., & Bramwell, R. (1995). Comparison of two aggression inventories. Aggressive Behavior, 21, 371-380.
Anda Gaitniece-Putāne, Malgožata Raščevska
41
Bar-On, R. (1999). The Emotional Inventory (EQ –I): Technical Manual. Toronto: Multi-Health Systems.
Becker, L. C. (2003). Human health and Stoic moral norms. Journal of Medicine and Philosophy, 28,(2), 221- 238.
Berkowitz, L. (1990). On the information and regulation of anger and aggression: a cognitive- neoassociationistic analysis. American Psychologist, 45-69.
Beron, R., & Richardson, D. (1997). Aggression. SPb.: Piter (in Russian).Buss,A. H. (1961). The Psychology of Aggression. New York, London: John Wiley and Sons, Inc.Buss, A. H., & Perry, M. (1992). The Aggression Questionnaire. Journal of Personality and Social
Psychology, 63, (3), 452-459.Colby, C. (2003). The return of stoicism. Citizens Centre Report, 3, 3- 4.Derksen, J., Kramer, I., & Katzko, M. (2002). Does a self-report measure for emotional intel-
ligence assess something different than general Intelligence? Personality and Individual Dif-ferences, 32, 37-48.
Erikson, E. (1968). Identity. Youth and Crisis. New York: Norton.Fatt, J. P., & Howe, I. C. (2003). Emotional Intelligence of foreign and local university students
in Singapore: Implications for managers. Journal of Business & Psychology, 17, (3), 345-367.Feldman, J. (2004). The relationship among college freshmen’s cognitive risk tolerance, aca-
demic hardiness, and emotional intelligence and their usefulness in predicting academic outcomes. Dissertation Abstracts International Section A: Humanities & Social Sciences, 64, (7-a), 2381.
Fergus, K., Gray, R., Fitch, M., Labrecque, M., & Phillips, C. (2002). Active consideration: Con-ceptualizing patient- provided support for spouse caregivers in the context of prostate can-cer. Qualitative Health Research, 12,( 4), 492-514.
Furnham, A. (1992). Fortitude. In D. Anderson (Ed.), The loss of virtue (pp.135-153). London: Social Affairs Unit.
Furnham, A., Petrides, K. V., Sisterson, G., & Baluch, B. (2003). Repressive coping style and positive self- presentation. British Journal of Health Psychology, 8, 223-249.
Gaitniece-Putāne, A. (2005). Liverpool Stoicism Scale adaptation. Baltic Journal of Psychology. 6 (1), 57–64.
Geary, D. C. (1998). Male, female. Washington.Goleman, D. (1995). Emotional Intelligence. New York: Bantam Books.Harrigan, D. (2002). The relationship between Emotional Intelligence scores and self- ratings
of physical health: A regressional approach. Dissertation Abstracts International: The Sciences & Engineering, 63, 3059.
Harris, M. B. (1996). Aggressive experience and aggressiveness: relationship to ethnicity, gen-der, and age. Journal Applied Social Psychology, 26, 843-870.
Hemmati, T., Mills, J. F., & Kroner, D.G. (2004). The validity of the Bar-On Emotional Intelligence quotient in an offender population. Personality and Individual Differences, 37, 695-706.
Kilmartin, C. T. (1994). The masculine self. New York: Macmillan.Korman, A. K. (1974). The Psychology of Motivation. Prentice- Hall Inc.Lagerspetz, K. M., Bjorkqvist, K., & Peltonen, T. (1998). Is indirect aggression typical of fe-
males? Aggressive Behavior, 14, 403–414.
Gender and Age Differences in Emotional Intelligence, Stoicism and Aggression

42
Lois, J. (2001). Peaks and valleys. The gendered emotional culture of edgework. Gender & So-ciety, 15 (3), 381-406.
Malzubris, G. (2003). The relationship between moral reason and emotional intelligence. Univer-sity of Latvia. (Master thesis in Psychology, unpublished material).
Maree, J. G., & Eiselen, R. J. (2004). The Emotional Intelligence profile of academics in a merger setting. Education and Urban Society, 36, (4), 482-504.
Mayer, J. D., & Salovey, P. (1997). What is Emotional Intelligence? In P. Salovey & D. Sluyter (Eds.), Emotional development and Emotional Intelligence: Implications for educators (pp. 3-31). New York: Basic Books.
Mayer, J. D., Salovey, P., & Caruso, D. R. (2000). Models of Emotional Intelligence. In R. Stern-berg (Ed.), Handbook of Intelligence (pp. 396-420). Cambridge, UK: Cambridge University Press.
Nikolaou, I., & Tsaousis, I. (2002). Emotional Intelligence in the workplace: Exploring its effects on occupational stress and organizational commitment. The International Journal of Organi-zational Analysis, 10 (4), 327-342.
Palmer, B. R., Manocha, R., Gignac, G., & Stough, C. (2003). Examining the factor structure of the Bar-On Emotional Quotient Inventory with an Australian general population sample. Personality and Individual Differences, 35, 1191-1210.
Pleck, J. H. (1981). Prisoners of manliness. Psychology Today, pp. 69-80.Pleck, J. H. (1987). The theory of male sex-role identity: Its rise and fall, 1936 to the present. In
Brod, H. (Ed.), The making of masculinities (pp.21-38). Boston: Allen & Unwin.Ramirez , J. M., Andreu, J. M., & Fujihara, T. (2001). Cultural and sex differences in aggression:
A comparison between Japanese and Spanish students using two different inventories. Ag-gressive Behavior, 27, 313-322.
Reiff, H. B. (2001). The relation of LD and gender with Emotional Intelligence in college stu-dents. Journal of Learning Disabilities. 34 (pp.66-86)
Roothman, B., Kirsten, D. K., & Wissing, M. P. (2003). Gender differences in aspects of Psycho-logical well-being. South African Journal of Psychology, 33 (4), 212-218.
Seale, C. (2002). Cancer heroics: A study of News Reports with particular reference to gender. Sociology, 36 (1), 107-126.
Shaver, K. G., & Tarpy, R. M.(1993). Psychology. McMillan Publishing Company.Smith, J. E. (2001). Emotional Intelligence and behavior: An exploratory study of people on
parole. Dissertation Abstracts International: The Sciences & Engineering, 61, (11-b), 6168.Sutarso, P. (1999). Gender differences on the Emotional Intelligence Inventory (EQI) (marital
status). Dissertation Abstracts International: The Sciences & Engineering, 60, 3011.Thompson, E. H., & Pleck, J. H. (1986). The structure of male role norms. American Behavioral
Scientist, 29, 531-543.Van Rooy, D. L., Alonso, A., & Viswesaran, C. (2005). Group differences in Emotional Intel-
ligence scores: Theoretical and practical implications. Personality and Individual Differences, 38 (3), 689-700.
Wagstaff, G., & Rowledge, A. (1995). Stoicism: Its relation to gender, attitude toward poverty, and reactions to emotive material. Journal of Social Psychology, 135, 181-184.
Anda Gaitniece-Putāne, Malgožata Raščevska
43
Subjective Well-being and Satisfaction with Partnership of Pregnant Women, Women without Pregnancy
and their PartnersIlze Mizāne, Ieva Bite
University of Latvia
The aim of the research was to clarify the differences for subjective well- being, satisfaction with the partnership and intimacy between women during the period of pregnancy and wom-en without pregnancy, and among their partners. Two groups were included in the research, 22-35 year-old expectant mothers and their partners aged 22-43 (n=60) and 22-35 year-old women without pregnancy and their partners aged 22-45 (n=60). The study took place in Lat-via. The results of the research show that there are no significant differences between satisfac-tion with life, positive affect, negative affect, satisfaction with partnership and intimacy among women without pregnancy and expectant mothers. However, the results show significant dif-ferences between partners of expectant mothers and partners of women’s without pregnancy on intimacy and satisfaction with partnership measures. Pregnant women’s partners show higher scores on satisfaction with partnership and intimacy than men whose partners are not pregnant.6
Key words: Subjective well-being, satisfaction with partnership, intimacy, and the period of pregnancy.
Introduction
Psychological investigations of relationships and connection between mother, father and prospective baby, can be traced back only to the 1970’s. Psychological re-search on the significance of the role of mother and father is related to reduced birth-rate, increase in divorced families and growing number of neglected children (Brut-mans, Filipova, & Hamitova, 2002).
It is important to realize that partner well-being during the period of pregnancy has an effect on the baby. By the 4th month of pregnancy the unborn infant can al-ready hear. Hence the partner relationship and attitude is very important to the ex-pected baby (Turners & Donald, 1995).
Interest in the effect of the quality of partnerships emerged in the 1970’s. At this time research in the quality of marriage was initiated since partnership problems are among the most common reasons, why people seek the help of psychologists (Fin-cham & Bradbury, 1987; Sacco & Phares, 2001) and these problems have a tendency to negatively affect the individuals’ physical and psychological well-being (Fincham & Bradbury, 1987).
Baltic Journal of Psychology, 2006, 7 (2), 43–49
6 Author’s note. Correspondence concerning this article should be addressed to Ilze Mizāne, e-mail: [email protected]
44
Psychologists have suggested that satisfaction with the partnership correlates with subjective well-being (Mills, Grasmick, Morgan, & Wenk, 1992). Subjective well-being refers to how people evaluate their lives and includes at least three components: Posi-tive affect assessment, negative affect assessment, and satisfaction with life (Diener, Suh, & Oishi, 1997). Based on theory and research findings researchers have conclud-ed that subjective well-being is dependent on several factors: education level, partner-ships and communication with family members, economic independence, physical well-being, social well-being, security and freedom of choice and action. Whether a woman experiences a sense of well-being depends on a range of factors, including her educational level, the sex and number of children, and the relationship with her part-ner (Thapan, 2003). Partnership can fulfill basic and universal human needs; it pro-vides companionship and freedom from loneliness. Williams (1988) also concluded that the interpersonal intimacy and emotional support provided by a spouse leads to subjective well-being (Diener, Gohm, Suh, & Oishi, 2000).
Intimacy is significant because of its relationship to both psychological and psysi-ological well-being. Several studies have concluded that difficulties with intimacy are closely associated with many mental health disorders. People, who lack intimate re-lationships experience more stress-related symptoms, are more likely to develop ill-nesses, and have slower recoveries from illness. Intimate relationships enhance per-sonal need satisfaction, including the need for achievement, mastery, recognition, and self-esteem. Researchers have related satisfaction with intimacy with happiness, satis-faction and well-being (Hook, Gerstein, Detterich, & Gridley, 2003). Current findings show that there is a connection between intimacy of the partnership and satisfaction with the partnership (Greeff & Malherbe, 2001).
Over the past decade, the transition to parenthood has been the focus if several studies in social and clinical psychology. This transition represents a period of life change and stress for parents. The birth of a baby implies a certain disorganization that involves many individual and relationship adjustments (Dulude, Wright, & Be-langer, 2000).
The period of pregnancy can be divided in three trimesters, where each trimester is 3 months long. The second trimester is the natural stage at which to conduct research, because at this time the psychological and physiological adaptation period of the first trimester and its related stress decreases and the period of anticipation related to the third trimester when partners prepare for childbirth has not yet begun (Craig, 2000).
Becoming a new parent poses challenges for nearly every couple. During the transition to parenthood, changes occur in partnership satisfaction, communication, affection and adjustment (Curran, Hazen, Jacobvitz, & Feldman, 2005). Researchers have focused their attention on identifying and predicting which couples are more likely than others to experience difficulties in the transition to parenthood and why. For example, Cowan and Cowan (1992) report that the general problem for first-time parents is the fact that the parental role competes with the roles of the partnership. Other studies have found that following the birth of their first child, the parents` in-timate relationship changes for the worse and partners` emotional support for each other also decreases (Guttmann & Lazar, 2004).
Ilze Mizāne, Ieva Bite

45
Not all couples report a decline in satisfaction with the partnership across the transi-tion to parenthood, and some even show improvement. Changes in satisfaction with the partnership are associated with both partners` satisfaction with the division of house-hold tasks, personality and demographic variables, the “plannedness” of pregnancy and parental mental heath (Perren, Von Wyl, Burgin, Simoni, & Von Klitzing, 2005).
Most studies about satisfaction with partnership, intimacy and subjective well-be-ing are related to the period of partnership overall, rarely they are divided in different periods of the relationship, for example, the period of pregnancy when woman and man have to adapt to new social rules, and have to manage tension in the relationship (Mekosh-Rosenbaum & Lasker, 1995).
Therefore the goal of this research is to clarify how differ subjective well- being, satisfaction with the partnership and intimacy between women during the period of pregnancy and women without pregnancy, and between their partners.
MethodParticipants
Two groups were included in the study:1) 22-35 year-old Latvian expectant mothers and their partners aged 22–43,
who have lived together for at least one year, had a first planned pregnancy, were in the second trimester of the pregnancy, had not had a prior spontane-ous or planned abortion (n=60);
2) 22-35 year-old Latvian women without pregnancy and their partners aged 22–45 without children, who had lived together for at least one year (n=60).
The mean duration of the respondents living together was 2.5 years. The majority of respondents had higher education. The mean monthly income of one family mem-ber ranged from 200- 300 LVL (140-210 EURO).
InstrumentsAll the scales were translated from English to Latvian and back to English by a
team of psychologists. The Cronbach alphas included in the text were obtained from these samples.
Two measures were completed for subjective well-being:The Satisfaction with Life Scale (Pavot & Diener, 1993) consists of five statements
that can be assessed on a 7-point Likert scale from 1 (strongly disagree) to 7 (strongly agree), which characterize satisfaction with life (for instance “In most ways my life is close to my ideal”). (Cronbach’s alpha = .70).
The Positive and Negative Affect Scale (PANAS) (Watson, Clark, & Tellegen, 1988) consists of two scales: A positive affect scale and a negative affect scale. Each scale consists of 7 emotions that are assessed on a 5-point Likert scale rang-ing from 1(very slightly or not at all) to 5 (extremely), to characterize emo-tions that have been felt during the past week (for instance, “ interested”, “distressed”). (Cronbach’s alpha for positive affect scale = .79, for negative affect scale = .84).
Subjective Well-being and Satisfaction with Partnership of Pregnant Women, Women without ..

46
The Intimate Safety Questionnaire (ISQ) (Cordova, Warren, Gee, & McDonald, 2002) consists of 19 statements that can be assessed on a 4-point Likert scale ranging from 0 (never) to 4 (always), which characterize intimate relationships between partners (for instance, “When I am with my partner I feel anxious, like I’m walking on eggshells”, “I feel comfortable when my partner initiates sex with me”). (Cronbach’s alpha = .68).
The New Marital Satisfaction Scale (Blum & Mehrabian, 1999). Over 500 items from existing measures of marital satisfaction were classified into major content cat-egories. Many repetitions were identified and eliminated. This process of item classification and deletion yielded three major groups of items dealing with: homogamy, general satisfaction, interpersonal interaction. Thirty-five new items were written to assess the content and diversity within each of these tree categories. The scale consists of 18 positively worded and 17 negatively worded items. These statements that can be assessed using a 9-point agree-ment-disagreement scale that ranges from +4 (very strong agreement) to –4 (very strongly disagreement). Satisfaction with partnership includes the fol-lowing statements: “My spouse is very loving and affectionate”,
Demographic questionnaire. Variables assessed included age, gender, duration of liv-ing together with partner, number of children, education level, occupation, annual household income, planning of pregnancy, number of pregnancies and pregnancy trimester.
ProcedureParticipants were invited to participate in the research study at a health centre
where a course was organized for pregnant women and also on some Internet sites. The data was collected from 30 couple who were expecting a baby and from 30 cou-ples without pregnancy. The data was obtained in the period from March 25 to April 25, 2006. There was no time limit for filling out the Scales.
Data AnalysisData were analysed using statistical methods, both descriptive and inferential,
specifically Pearson correlations and t-tests.
ResultsTable 1 shows that there are no statistically significant differences between Satis-
faction with life scale, Positive affect, Negative affect, Satisfaction with partnership, and Intimacy assessment between women without pregnancy and expectant mothers.
Table 2 shows statistically significant differences between partners of expectant mothers and partners of women without pregnancy on Intimacy and Satisfaction with partnership measures. Partners of expectant mothers have higher scores for Inti-macy and Satisfaction with partnership than partners of women without pregnancy.
Ilze Mizāne, Ieva Bite
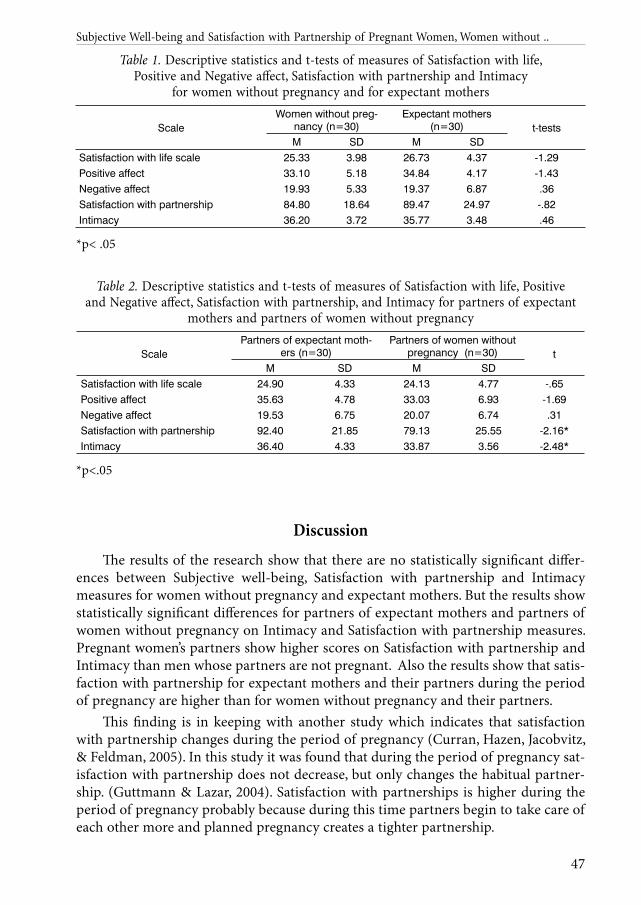
47
Table 1. Descriptive statistics and t-tests of measures of Satisfaction with life, Positive and Negative affect, Satisfaction with partnership and Intimacy
for women without pregnancy and for expectant mothers
ScaleWomen without preg-
nancy (n=30)Expectant mothers
(n=30) t-testsM SD M SD
Satisfaction with life scale 25.33 3.98 26.73 4.37 -1.29Positive affect 33.10 5.18 34.84 4.17 -1.43Negative affect 19.93 5.33 19.37 6.87 .36Satisfaction with partnership 84.80 18.64 89.47 24.97 -.82Intimacy 36.20 3.72 35.77 3.48 .46
*p< .05
Table 2. Descriptive statistics and t-tests of measures of Satisfaction with life, Positive and Negative affect, Satisfaction with partnership, and Intimacy for partners of expectant
mothers and partners of women without pregnancy
ScalePartners of expectant moth-
ers (n=30)Partners of women without
pregnancy (n=30) tM SD M SD
Satisfaction with life scale 24.90 4.33 24.13 4.77 -.65Positive affect 35.63 4.78 33.03 6.93 -1.69Negative affect 19.53 6.75 20.07 6.74 .31Satisfaction with partnership 92.40 21.85 79.13 25.55 -2.16*Intimacy 36.40 4.33 33.87 3.56 -2.48*
*p<.05
Discussion
The results of the research show that there are no statistically significant differ-ences between Subjective well-being, Satisfaction with partnership and Intimacy measures for women without pregnancy and expectant mothers. But the results show statistically significant differences for partners of expectant mothers and partners of women without pregnancy on Intimacy and Satisfaction with partnership measures. Pregnant women’s partners show higher scores on Satisfaction with partnership and Intimacy than men whose partners are not pregnant. Also the results show that satis-faction with partnership for expectant mothers and their partners during the period of pregnancy are higher than for women without pregnancy and their partners.
This finding is in keeping with another study which indicates that satisfaction with partnership changes during the period of pregnancy (Curran, Hazen, Jacobvitz, & Feldman, 2005). In this study it was found that during the period of pregnancy sat-isfaction with partnership does not decrease, but only changes the habitual partner-ship. (Guttmann & Lazar, 2004). Satisfaction with partnerships is higher during the period of pregnancy probably because during this time partners begin to take care of each other more and planned pregnancy creates a tighter partnership.
Subjective Well-being and Satisfaction with Partnership of Pregnant Women, Women without ..
48
Although the survey of prior research indicates that for men during the period of their partners’ pregnancy satisfaction with the partnership decreases (Delmore-Ko, Pancer, & Hunsberger, 2000), the results of this study show the opposite, that men during the period of their partners’ pregnancy show higher satisfaction with the partnership than men whose partners are without pregnancy. This result is in keeping with another study which explains that the period of pregnancy is a “honeymoon” for the partners (Perren, Von Wyl, Burgin, Simoni, & Von Klitzing, 2005). The results also show that partners of expectant mothers are more satisfied with intimacy than are partners of women without pregnancy. It probably means that during the period of the first planned pregnancy partners feel more devoted and pay more attention to each other than before pregnancy and during this period men feel much more togeth-erness with theirs partners, because partners have planned this pregnancy, together and go to doctor’s appointments and to new parents courses.
These results show that during the period of pregnancy it is very important that each partner feels comfortable with his or her own life and with the partnership be-cause these two life spheres - satisfaction with life and satisfaction with partnership – can influence each other.
The limitations of the study are that the each group consists of only 30 respond-ents, and that only voluntary respondents took part in the study. Therefore it is not possible to generalize from the results of this study to all populations.
It would be interesting for the next study to include a group with partners who have not planned the pregnancy and then compare the results with those of a group where partners have planned the pregnancy. One could also survey in this groups how partners negotiate stress and assess the partners’ adaptation skills, because research indicates that partner stress affects the satisfaction with partnerships. As well in a wider survey about partners’ subjective well-being and satisfaction with partnership during the period of pregnancy it would be useful to conduct the study before the period of pregnancy, during the period of pregnancy and also after the birth.
References
Blum, J., & Mehrabian, A. (1999). Personality and temperament correlates of marital satisfac-tion. Journal of Personality, 67, 93-125.
Brutmans V. I., Filipova G. G., & Hamitova I. J. (2002). Psychological situation dynamic for women’s over a period of pregnancy and after birth. Psychological Questions, 7, 59-68.
Craig, G. (2000). Development psychology. [in Russian] Moscow, 153-177.Cordova, J. V., Warren, L. Z., Gee, C. B., & McDonald, R. P. (2002). Intimate safety: Measuring the
private experience of intimacy in men and women. Manuscript submitted for publication.Cowan, C.P., & Cowan, P. (1992). When partners become parents: The Big life change for couple.
New York: Basic Books.Curran, M., Hazel, N., Jacobvitz, D., & Feldman, A. (2005). Representations of early family
relationships predict marital maintenance during the transition to parenthood. Journal of Family Psychology, 19(2), 189-197.
Ilze Mizāne, Ieva Bite
49
Delmore- Ko, P., Pancer, S.M., & Hunsberger, B. (2000). Becoming a parent: the relation be-tween prenatal expectations and postnatal experience. Journal of Family Psychology, 14 (4), 625-640.
Diener, Ed., Suh, E., & Oishi, S. (1997). Recent findings on subjective well-being. Indian Journal of Clinical Psychology, March, 215-238.
Diener, Ed., Gohm, C.L., Suh, E., & Oishi, S. (2000). Similarity of the relations between marital status and subjective well being across cultures. Journal of Cross-cultural Psychology, 31 (4), 419-436.
Diener, & Biswas-Diener, R. (Ed.) (2000). New directions in subjective well-being research: the cutting edge. University of Illinois Pacific University, Draft: February 28, 2000, 221-229.
Dulude, D., Wright, J., & Belanger, C. (2000). The effects of pregnancy complications on the parental adaptation process. Journal of reproductive and infant psychology,18 (1), 5-19.
Fincham, F. D., & Bradbury, T. N. (1987). The assessment of marital quality: A reevaluation. Journal of Marriage and the Family, 49, 797-809.
Greef, A. P., & Malherbe, H. L. (2001). Intimacy and marital satisfaction in spouses. Journal of Sex and Marital Therapy, 27 (3), 247-257.
Guttmann. J., & Lazar, A. (2004). Criteria for marital satisfaction: does having a child make a difference? Journal of reproductive and infant psychology, 22 (3), 147-155.
Hook, M., Gerstein, L., Detterich, L., & Gridley, B. (2003). How close are we? Measuring inti-macy and examing gender differences. Journal of Counselling and Development, 81, 462-473.
Mekosh-Rosenbaum, V., & Lasker, J. N. (1995). Effects of pregnancy outcomes on marital sat-isfaction: A longitudinal study of birth and loss. Infant Mental Health Journal, 16 (2), 127-143.
Mills, R. J., Grasmick, H. G., Morgan, C. S., & Wenk, D. (1992). The effect of gender, family satisfaction and economic strain on psychological well-being. Family Relations, 1992, 41, 440-445.
Pavot, W., & Diener, Ed. (1993). Review of the satisfaction with life scale. Psychological Assess-ment, 1993, 5 (2), 164-171.
Perren, S., Von Wyl, A., Burgin, D., Simoni, H., & Von Klitzing, K. (2005). Intergenerational transmission of marital quality across the transition to parenthood. Family Process, 44 (5), 441-459.
Sacco, W. P., & Phares, V. (2001). Partner appraisal and marital satisfaction: The role of self-es-teem and depression. Journal of Marriage and Family, 63, May, 504-513.
Thapan, M. (2003). Marriage, well-being, and agency among women. Gender and Development, 11 (1), 77-84.
Turners, S. J., & Donald B. H. (1995). Lifespan development. Fifth edition. Mitchell College. Har-court Brace College Publisher, 130, 134.
Watson, D., Clark, L. A., & Tallegen, A. (1988). Development and Validation of brief measures of positive and negative affect: The PANAS Scale. Journal of Personality and social psychology, 54 (6), 1063-1070.
Williams, D. G. (1988). Gender, marriage, and psychosocial well-being. Journal of Family Issues, 9(4), 452-468.
Subjective Well-being and Satisfaction with Partnership of Pregnant Women, Women without ..

50
PROFESSIONAL EXPERIENCE IN BALTIC STATES
Guidance and Counselling in Higher Education: Where do We Stand in the Baltics?
Solveiga MiezītisUniversity of Latvia and University of Toronto
This paper includes information obtained from the European Forum for Student Guidance (FEDORA) documents prepared to stimulate dialogue among professionals which could even-tually lead to a common policy regarding standards of practice in guidance and counseling in higher education in the European Union member states. The paper presents a brief summary of the analyses by Paula Ferrer-Sama and Michael Katzensteiner of the data from the National reports presented in the FEDORA report on Guidance and Counseling in Higher Education in European Union Member States. The text of the proposed FEDORA Vilnius Charter is also included to stimulate discussion regarding the implementation of the recommendations for the development of guidance and counseling services in the higher education institutions in the Baltic states. The paper ends with a set of questions regarding the demand for and the pres-ent provision of services in universities in the three Baltic states as a basis for future exchange of ideas and experience in this area.7
Key words: Guidance, counseling, higher education, counseling service, Baltic countries.
The problem of Guidance and Counselling Service provision in the Baltic countries
After six years of research on first-year student adjustment at the University of Latvia, that demonstrates that between a third and half of the students across all facul-ties indicate needs for support in academic, social and emotional areas (Voitkane & Miezite, 2001) a half-time staff position has been allocated for an experienced psycho-logical counsellor. This hopefully will be the beginning of a much greater commit-ment by the university administration to provide student support services that might help to decrease the 20% drop out rate during the first year of studies.
This commentary on guidance and counselling in higher education was stimu-lated by the discussions at the FEDORA conference in Vilnius in October, 2006 that provided insight into the student needs and challenges faced by the guidance coun-sellors in different European countries. It became clear that the range of available resources and services vastly differs from one country to another and that there is a wide gap between the availability of resources and services in the universities of the
Baltic Journal of Psychology, 2006, 7 (2), 50–59
7 Author’s note. Correspondence concerning this article should be addressed to Solveiga Miezītis, e-mail: [email protected]

51
new member states of the European Union and the well established guidance and counselling centers in several of the Western European countries The analysis of the National reports in the newly released FEDORA Report on Guidance and Counselling in Higher Education in European Union Member States provides detailed information about the diversity of practices in the field of guidance and counselling across Europe. The purpose of this commentary is to provide a brief summary of the issues raised in the report and to stimulate further discussion about the guidance and counselling provisions at various universities in the Baltic countries.
FEDORA, The European Forum for Student Guidance
FEDORA is a Non Governmental Organization founded nearly 20 years ago to provide advice and work for high standards and ethics in guidance and counselling in the European higher Education Area. In July 2005 members of FEDORA gathered at the FEDORA summer university held at the University of Cyprus decided to work towards formulating a FEDORA charter for guidance and counselling. The reason for this initiative came from the members’ awareness of the rapidly changing conditions for provision of counselling services in higher education in the wake of the Bologna process with its emphasis on closer European cooperation in Higher Education. A common course structure and the trend towards dual and European degrees is open-ing a more flexible market for Higher Education across Europe. Along with this in-creased flexibility and student movement, new challenges and demands for counselling is needed by students working and studying in new environments. It was also deemed important to provide access to information and advice to new member states to help develop guidance and counselling services based on the same standards of service delivery and ethics that are practiced in the established guidance centers in European universities. Based on these observations the members of FEDORA at the VIII Con-gress in Vilnius in October 2006 decided to work towards the formulation of a charter based on the National reports on the standards and ethics currently in practice in the European Union member states. The 2006 Report on Guidance and Counselling in Higher Education in European Union Member States edited by Michael Katzensteiner, Paula Ferrer-Sama, and Gerhart Rott was compiled on the basis of the National re-ports prepared and submitted in response to the request for the representatives of the member states of the European Union to submit information on the higher education framework, and the main features of guidance and counselling services in their coun-tries. The National reports included data on the four main areas of FEDORA: Educa-tional Guidance and Counselling, Disability and Special Needs, Psychological Student Counselling, and Career Guidance and Employment in order to provide an overview of the current policies and practices in these areas in the different European countries. The data compiled from the National reports were analyzed and commented upon by the editors of the final Report as well as by several other authors.
This commentary will begin with a brief summary of the main findings reported by Paula Ferrer-Sama on the basis of her analysis of the National reports in which she provides an overview of the four areas of service delivery that are included under the umbrella of Guidance and Counselling in Higher Education. The next section will
Guidance and Counselling in Higher Education: Where do we stand in the Baltics?

52
include some of the issues presented by Michael Katzensteiner in his discussion of the challenges in the development of a common identity of Guidance and Counsel-ling in Higher Education. The third section will cite the recommendations from the proposed Vilnius Charter for consideration in assessing the process of implementa-tion of Guidance and Counselling services in the major universities in the three Baltic countries.
It is our hope that this introductory commentary will evoke the interest of our Lithuanian and Estonian colleagues and that we shall be able to prepare a joint state-ment concerning the development of guidance and counselling services in higher education in the three Baltic countries for a subsequent issue of the Baltic Journal of Psychology.
A brief summary of the analysis of the National reports by Paula Ferrer-Sama
First, a brief summary of the analysis of the data of the National reports by Paula-Ferrer Sama for the four areas of FEDORA regarding the provision of guidance and counselling services.
Area 1 – Educational Guidance and Counselling In most countries educational guidance is provided either by special guidance
services or through teacher mentoring and counselling. These services involve in-dividual or group information sessions, psychological counselling, and support for students with disabilities. In most countries funding is supplied by the Ministry of Education at the national or regional level. Services are usually located on the univer-sity campus and are provided by counsellors or advisors. The service providers may be educational or occupational psychologists, or educators, and in some cases other specialists such as tutors, social workers or teachers who act as student advisors in their own departments.
These professionals offer information as well as advice regarding career choice, entrance requirements and enrolment procedures for specific institutions, guidance for career planning, adaptation to academic life, and study skill training. Seminars, educational fairs, Web-based information, brochures and assessment instruments are used in education guidance. The extent and availability of services varies across coun-tries depending on the priorities and resources allocated for such services.
Area 2 – Disability and Special NeedsAlthough equal treatment for all students is regulated by law in all the countries,
the resources and provisions for special services for disabled students tend to be very limited. In many countries universities have a person designated to provide support to disabled students. The roles of these professionals vary and there are no specific quali-fications requirements. Some professionals have training in psychology or counselling and may have specialized experience in dealing with disabled student. These profes-sionals perform various functions ranging from advocacy, policy development, aware-ness raising, to staff training, and direct interventions. For example they may promote
Solveiga Miezīte

53
integration, guarantee inclusive curriculum design and implementation through ad-aptation of texts and examinations, and development of study materials e.g. Braille or sign language transcriptions, or audiotaped materials to accommodate students with particular types of disability. They may also encourage rehabilitation through tutoring, speech therapy, social skill training, as well as providing provide assessment, diagnosis and individual counselling. However, there are vast differences in resource and service availability in this area in various institutions of Higher Education.
Area 3 – Psychological Student CounsellingAccording to research as well as counsellor reports there is an increase in psy-
chosocial and psychosomatic disorders among students. Stress related disorders such as anxiety and symptoms of depression can be experienced by students as they move away from home and try to adapt to university life. In some of countries psychological counselling services are provided by the university Psychology departments. Group counselling and various support programs are offered to improve social skills, clarify academic goals, improve learning and time management skills, and provide health and sexual education but in many other countries psychological support comes un-der the medical jurisdiction and services are provided by health clinics outside of the university. Referrals to outside clinics are made by the university psychological counsellors in the case of severe disturbances, or at the students’ request. In some countries Psychological guidance services are staffed by highly qualified personnel with a bachelor or master degree in psychology, post graduate training in clinical psy-chology, counselling, psychotherapy, or nursing. Additional examinations and profes-sional certification may also be required. In other countries counsellors or guidance teachers provide the services, assisted by other professionals such as social workers or reception staff. In some universities services are provided by volunteers with any kind of professional background and an additional training course in psychology.
One of the major concerns in this area relates to the misperceptions of psycho-logical services by prospective clients as well as staff member of the university com-munity. Hence public education regarding student needs for services is one of the priorities to be addressed in this area.
Area 4 - Career Guidance and EmploymentCareer guidance is considered to be a well established area in European Higher
Education institutions. Career guidance services within the institution are offered separately or as part of the general guidance services that may cooperate with voca-tional and placement services provided outside the universities. The professionals who serve as career counsellors or advisors take on different roles, such as employer liaison, information officer, administrative support staff. The qualifications for career guidance staff are not regulated by law and depend on the requirements set by the particular institution. In most countries career counsellors hold a degree in educa-tion, psychology, sociology or social sciences and in some countries they may be re-quired to have additional training for example, in counselling or psychometric testing. Career counsellors provide information on labour market trends, career guidance, career planning, job seeking skills, placement liaison with employees, make internship
Guidance and Counselling in Higher Education: Where do we stand in the Baltics?
54
arrangements, and offer group seminars and workshops, as well as individual mentor-ing and coaching.
The above summary provides a glimpse of the vast differences in counsellor qual-ifications and the range of service provisions in different countries.
At present the term guidance counsellor and the services these practitioners provide have different meanings in various European Union member states. Hence at this time a dialogue based on a common understanding of these terms is difficult to establish.
Thus one of the goals of the proposed Vilnius Charter is to recommend some common goals for establishing qualification criteria and standards of practice for guidance counsellors for the member states of the European Union.
Towards an Identity of Guidance and Counselling in Higher Education
Michael Katzensteiner in his paper on professional identity development in guid-ance and counselling in higher education raises some important issues that need to be addressed by guidance and counselling professionals across Europe.. In view of the diversity of the practitioner roles and service models in the four areas included under the umbrella of guidance and counselling Michael Katzensteiner invites the reader to look for commonalities that would allow us to define the field and recognize the identity of the specialization and of the professionals who provide guidance and counselling services in higher education. Katzensteiner points out that, proceeding from the analysis of the National reports of the four areas related to the diversity in the qualifications of the counsellors and the professional training required in different countries, standards based on academic disciplines and scientific methods cannot al-ways be taken for granted. Hence one of the goals of FEDORA is to establish common academic requirements as a goal for counsellors in order to ensure a common basis for constructive dialogue about standards of ethics and practice, as well as to reach a commonly agreed upon definition of the field among the professionals involved in guidance and counselling service delivery.
Katzensteiner points out that the four areas are the building blocks of a common identity in the field of guidance and counselling. Since similar services are involved across these areas there is room for misunderstandings regarding the role require-ments and practices involved in each of the four areas. The author proposes that communication within networks like FEDORA as well as between the networks and research should lead to the development of a clear profile in every area. While keeping in mind that the suggested FEDORA classification does not cover all the activities in the field”.
Katzensteiner goes on to suggest that in the area of Educational Guidance a clear basic sense of identity does not seem to exist either in terms of self-perception of the counsellors themselves or the „public perception” due to the heterogeneous nature of the area and the diversity of tasks required of the practitioners. Counsellors provide study advice and initial tutorials on study management and study skill development. Furthermore the counsellor’s job is also to help students to manage transitions, a com-plex process that defies exact definition. The variety of roles and the range of profes-
Solveiga Miezīte

55
sions involved in providing the services is confusing. In some cases these tasks are carried out by academic staff in secondary education, or by members of the student union. Katzensteiner wisely suggests that „the educational counsellors are the part-ners of (adolescent) people, who have to find out their deepest wishes and to establish their own identity while being faced with the demands by the society, of parents, of the economy and.... with the demands of their study.” Hence one of the missions of educational guidance counsellors is to help students develop their identity instead of merely learning “student-role playing” in different situations.
In the area of Disability and Special Needs Katzensteiner suggests that counsellors have a much clearer sense of identity. These usually are highly qualified experts in their particular field of specialization with a pioneering spirit and a sense of mission that is clearly needed to educate the public in this newly evolving service area that is not always viewed as a priority in the society at large. Experts help students to gain their identity and balance their needs with the demands of the external situation. This task is difficult due to the complexity of issues involved in defining terms like „disability” and „special needs” which also entail the concept of „equal opportunities.” According to the World Health Organization Classification of Functioning, Disability and Health, „disability is not only related to a special group, but also to the environ-ment of that group”, which in this case refers to the student’s academic environment, and their physical and social surroundings. Katzensteiner concludes that to achieve successful integration of special needs students cooperation between the experts, the students and the academic institution is essential.
Although the area of Psychological Counselling in Higher Education appears to be well covered in publications, and discussions at the FEDORA PSYCHE group confer-ences, and the identity of psychological counselling is well established and grounded in the discipline of psychology, Katzensteiner points to three issues which complicate the situation in this area. These issues relate to prejudices about psychology and psy-chologists, the highly diversified nature of the field of psychology and the differences in the definition of the term „psychological counselling”.
Psychologists are perceived by the public in ambiguous ways. There are various perceptions and misperceptions about psychologists and the ways in which they work to help solve people’s problems. Furthermore there are fears and prejudices associated with mental illness which may prevent people from seeking help for fear of being la-belled mentally ill. Thus psychologists are contantly challenged to clarify and explain their professional role and their methods to potential clients and the public.
To confuse the issue there are many sub-areas of specialization in psychology which are related to the needs of students who seek psychological counselling. Ac-cording to Rott et al. (2005), Psychological Counselling in Higher Education is related in practice to clinical psychology, health psychology, organizational and occupational psychology, educational psychology, psychological diagnostics, psychology of cogni-tion, learning and memory, psychological psychotherapy and special treatments such as for addiction.
In many countries law regulates the practice of clinical psychology, psychothera-py, health psychology and in some cases even psychological counselling, but presently
Guidance and Counselling in Higher Education: Where do we stand in the Baltics?

56
there is no European law in this area. Hence it is important to clarify what is meant by the term „psychological counselling” for the student target group, and the various members of the academic institutions which can help to facilitate or impede referral for psychological counselling when needed.
According to Katzensteiner the area of Career Guidance and Employment, has a clear profile as well as networks outside of FEDORA for sharing ideas and experience through conferences and summer universities. This type of service is also recognized in the new member states. The need for career advisors was apparent already in the 1980’s and was a significant factor contributing to the establishment of FEDORA.
Career advising involves the definition and assessment of „career” for the target group in relation to their interests and aspirations as well as the demands of the labour market. Therefore as in the case of educational guidance, career counselling involves the stimulation of the process of identity development through interaction with the students and the facilitation of systematic reflexion.
Katzensteiner concludes his excellent discussion of professional identity clarifi-cation by emphasizing the need to reach agreement regarding some basic skills and qualifications for professionals in the field of guidance and counselling in higher edu-cation. Although one cannot guarantee that a future advisor will have a mature and mentally healthy personality, certain personal competencies can be acquired through training, such as communication skills, as well as greater self-awareness and empathy. Among important professional skills, and training requirements Katzensteiner lists the following:
- Academic degree;- Counselling skills adapted to specific tasks in the field, such as case studies
about counselling;- Psychological knowledge about learning, adolescence, personality;- Group work techniques, teaching and presentation skills;- Basic skills in project management;- Standardized on-the-job training;- Dealing with new media like the web;- Evaluation;- Organization dynamics;- Training of specific skills.
In addition Katzensteiner also recommends „Field competence” in higher educa-tion as a requirement for common identity acquisition which is best achieved through cooperation between countries. Field competence involves:
- Knowledge of the law regulating studies and institutions of higher education in their home country as well as a European and International overview;
- Organization of programs of study and institutions of higher education;- Study abroad;- European and international developments in the field;
Solveiga Miezīte
57
- Policy of European Union in this field;- Trends in European job market;- Networks in this field;- Research results about higher education and career.
In conclusion, Katzensteiner suggests the following processes to help guidance counsellors in higher education to move towards the development of a common iden-tity:
- Enforced discussion based on the Vilnius Charter; - Standardized professional training for the four specific areas and shared
training concerning the „field competencies”;- Intensification of advanced training; - Quality assurance regarding curriculum and practice of counsellors and ad-
visors.
The Vilnius Charter for Guidance and Counselling in Higher Education
In order to stimulate the discussion and planning for the development of guid-ance and counselling in higher education in the Baltic countries we need to famil-iarize ourselves with the objectives and recommendations of the proposed Vilnius Charter that is currently being circulated to the FEDORA membership. The executive board of Fedora adopted the decision to formulate a charter in the hope that it will be an important contribution to the successful development of a set of standards and guidelines for guidance and counselling in the European Higher Education Area.
The stated objectives of FEDORA are to promote the development of guidance and counselling services in European Higher Education for the good of:
- Our students – helping all students, including disabled students, to make in-formed educational and occupational choices. We also want to contribute in creating better psycho-social opportunities for equality and increase the number of graduates, leaving our institutions with diplomas of high value.
- Our institutions – as we find that professional guidance and counselling services are and must continue to be integrated in our institutions strategies, contributing to the successful fulfilment of institutional aims and goals.
- Our members and those working in the field of European guidance and counselling, creating conditions for offering the best services possible and to ensure room for continually developing their skills and knowledge.
And to:Make guidance available for all: - Create an European database of information on education and job market - Improve staff qualifications by: a. Creating European standards for guidance practitioners in Higher
Education institutions;
Guidance and Counselling in Higher Education: Where do we stand in the Baltics?
58
b. Intensifying training; c. Sharing expertise by facilitating Exchange programs for staff; d. Fostering staff certification for qualified guidance practices. a. Support networking of practitioners and researchers and developing a
resource list of experts on different topics.
FEDORA also proposes to work and seek close cooperation with national and European institutions and organizations sharing the same goals and ambitions and will work to influence and qualify the work of institutions such as the European Com-mission and UNESCO in the field of guidance and counselling in the Higher Educa-tion Area.
The FEDORA Vilnius Charter states that all institutions must ensure, that suf-ficient resources are allocated for offering access to services for all students, and for offering professional guidance and counselling resources to:
- Help students and graduates to self manage transitional stages and make information-based decisions for studies and employment, thus preventing school drop out and facilitating job satisfaction.
- Support students and graduates with disabilities, learning difficulties and special needs.
- Offer psychological counseling.- Train transferable competencies, to prepare students for the job market and
society.- Take care of diversity by facilitating access to education and employment to
different target groups.- Connect Higher Education institutions with the outside (schools, employers,
foreign students).
The code of ethics requires counsellors to follow the basic principles of impartial-ity, confidentiality, and responsibility to students.
To meet standards all services must be willing to undergo internal and external audits and evaluations to ensure the quality and integrity of the services offered to students, institutions, employers and other stockholders. Guidance and counselling services are essential for the success of students in higher education and a high quality of service must be ensured and measured as part of the quality assurance programs.
Guidance and counselling in the Baltics: Where do we stand?
In order to initiate a dialogue about the development of guidance and counsel-ling services in Higher Education in the Baltic countries we invite professionals from different universities to share information about the provision of services in their set-tings. The topics of interest include:
- The specific kinds of services provided (individual assessment, counselling, group work and training in social skills, study skills, time management etc.);
- The number and qualifications of different types of service providers;
Solveiga Miezīte
59
- The type of advertising used to inform students about the services offered;- Information about the recipients of services: demographic data, the types of
problems that students request support for, follow-up evaluation;- Administration and financing of the services;- Other kinds of information relevant to the experience in the particular set-
ting.
Please send the above information as well as your reactions to the ideas presented in the Vilnius charter to [email protected] and we will compile the data and report back to the readership in a future issue of the Baltic Journal of Psychology.
Psychological counsellors who feel a resonance with the stated objectives of FE-DORA and would like to participate in the deliberations of this policy shaping asso-ciation are invited to meet at the FEDORA PSYCHE conference at the University of Crete from September 5-8, 2007.
References
Katzensteiner, M., Ferrer-Sama, P., & Rott, G. (2006). Guidance and Counselling in Higher Education in European Union Member States. FEDORA.
Rott, G., Figgueiredo Dias, G., & Broonen, J. P. (Eds.) (2005). Cognition, Motivation, and Emo-tion: Dynamics in the Academic Environment. Louvain-la-Neuve: FEDORA.
Vilnius Charter (2006). FEDORA Charter on Guidance and Counselling within the European Higher Education Area (FEDORA draft manuscript).
Voitkane, S., & Miezite, S. (2001). First-Year University Students Adjustment Problems. Baltic Journal of Psychology, 2(1), 43-58.
Guidance and Counselling in Higher Education: Where do we stand in the Baltics?
60
Notes on Authors
Lars-Göran Nilssonis the Olof Eneroth Professor of Psychology at Stockholm University. He is also Head of Department and the Principal Investigator of the Betula Study on Memory, Health, and Aging. In addition to cognitive aging, his research interests include behavioral genetics and cognitive neuroscience with a focus on brain imaging.
Michael Rönnlundis Senior Lecturer in Psychology at Umeå University. The main focus of his research interest is on various aspects of cognitive aging.
Ieva Stokenberga, Mg. psych., doctoral students of Department of Psychology at the University of Latvia. Her fields of interests are positive psychology and social psychology. Her current re-search deals with relationship between humor and stress.
Anda Gaitniece- Putāne, Mg. psych., is assistant of Department of Psychology at the University of Latvia. Her fields of interests are gender psychology, social psychology and personality psychol-ogy. Her current research deals with relationship between Emotional Intelligence, Ag-gressiveness and Stoicism in male and female.
Malgožata RaščevskaPh.D., professor at the Department of Psychology, University of Latvia. More than for 15 years she has been teaching at the University of Latvia giving courses in cognitive psychology, theory of intelligence, research methodology and has published several books and articles in this area. Her current research deals with intelligence, test con-struction and adaptation.
Ilze MizāneReceived her master’s degree in 2006 from Department of Psychology, University of Latvia, specializing in clinical psychology. She continues her studies on systemic fam-ily psychotherapy. Work as psychologist in Crisis centre “Skalbes”. Her fields of interest are psychology of family in period of pregnancy
Ieva BiteDr.psych., is associated professor and head of Professional Master degree program in psychology in the University of Latvia, and psychotherapist.
61
Solveiga Miezītisis professor emeritus in the Department of Adult Education and Counseling Psy-chology at the University of Toronto and in the Department of Psychology at the University of Latvia. Her main areas of research are on first-year student adjustment to university; and on teacher and parent-mediated prevention and intervention of de-pression in children and adolescents. She teaches courses on Depression, Consultation and Effecting Change, Creativity and Wellness, and Narrative as a Vehicle of personal change.

62
Notes for authors
The “Baltic Journal of Psychology” is published by the Department of Psychol-ogy, Faculty of Education and Psychology, University of Latvia. The journal publishes original papers on current issues in psychology as well as empirical, theoretical, and practical articles on broad aspects of psychology. It will appear two times a year.
Information for authors on submitting manuscripts:Contributions, written in English, should follow the general style described in
the Publication Manual of the American Psychological Association (5th ed. 2002).
Manuscripts should not exceed 8000 words, should be typed on (21 x 29.7cm) white bond paper, double-spaced, with font size 12, and with margins of at least 2.54 cm on all four sides. Acceptable typefaces are Times Roman or Courier. Three copies of each manuscript including electronic version on disk should be submitted. Disks can be of any standard size, IBM compatible, written in Word for Windows. Manu-scripts will not be returned to authors.
Title page for the manuscript should show the title of the article, the name (s) and affiliation (s) of the authors, running head and, at the bottom of the page, the name and address of the person (including postal code and electronic mail address) to whom proofs and reprint requests should be sent.
An abstract of up to 150 words should follow the title page on a separate page. A list of 3 – 10 key words should be provided directly below the abstract.
Each table should be numbered and referred to by number in the text. Each table should be typed on a separate page and have a descriptive title.
Each illustration (diagram, chart, photograph, and drawing) should be num-bered and referred to by number in the text. Each table should be typed on a separate page and have a descriptive title.
References are given at the end of the text. All references cited in the text must appear in the reference list in APA format.
Authors should submit a brief biographical statement (8 - 10 lines) for inclusion in the section “Notes on Authors”.
There is no payment for published papers. The authors will receive 3 reprints, free of charge.