2006 UI Financial Reportauditor.illinois.gov/Audit-Reports/Compliance-Agency... · 2007-12-12 ·...
55
ANNUAL FINANCIAL REPORT 2006 Fiscal Year
Transcript of 2006 UI Financial Reportauditor.illinois.gov/Audit-Reports/Compliance-Agency... · 2007-12-12 ·...

ANNUALFINANCIAL
REPORT
2006
Fiscal Year

Administrative OfficersB. Joseph White
President
Douglas E. Beckmann
Senior Associate Vice President for Business and
Finance
Sally A. Pelg
Executive Director of University Accounting and
Financial Reporting
Julie A. Zemaitis
Executive Director of University Audits
Sylvia Manning
Chancellor, University of Illinois
at Chicago
Heather J. Haberaecker
Executive Assistant Vice President for Business and
Finance at Chicago
Richard D. Ringeisen
Chancellor, University of Illinois
at Springfield
Michael D. Bohl
Assistant Vice President for Business and Finance
at Springfield
Richard H. Herman
Chancellor, University of Illinois
at Urbana-Champaign
Michael B. Bass
Executive Assistant Vice President for Business and
Finance at Urbana-Champaign
Board of Trustees 2
The University 3
Message from President B. Joseph White 4
Impact Illinois 5
On-Campus Headcount 8
Staff and Student Data 10
Message from Stephen K. Rugg, Comptroller 11
Independent Auditor’s Report 12
Management’s Discussion and Analysis 13
Audited Financial Statements
Statement of Net Assets 26
Statement of Revenues, Expenses and Changes in Net Assets 27
Statement of Cash Flows 28
Notes to Financial Statements 30
Board Officers
Lawrence C. Eppley, Chair
Lester H. McKeever, Jr., Treasurer
Stephen K. Rugg, Comptroller
Thomas R. Bearrows, University Counsel
Michele M. Thompson, Secretary
Table of Contents
ANNUAL FINANCIAL REPORT

Lawrence C. Eppley, Chair
Marjorie E. Sodemann
Robert F. Vickrey
2001-2007
STUDENT TRUSTEES
Umair Mamsa, UIC
Sarah M. Doyle, UIS
Christopher M. Kantas, UIUC
July 1, 2006 - June 30, 2007
Frances G. Carrol, Ed.D.
Kenneth D. Schmidt, M.D.
David V. Dorris
2005-2011
Member Ex-OfficioHonorable Rod R. Blagojevich, Governor
UNIVERSITY OF ILLINOIS BOARD OF TRUSTEES
Devon C. Bruce
Niranjan S. Shah
Robert Y. Sperling
2003-2009
2 • 2006 Annual Financial Report

The University of Illinois at Chicago is a major research univer-sity located in the heart of one of the world’s great cities. Thelargest university in Chicago, UIC has 25,000 students, 15 col-leges, and the state’s major public medical center. UIC is com-mitted to providing a first-rate education for its students, to serv-ing its diverse community and to creating and disseminating newknowledge as a university of growing national and internationalstature.
http://www.uic.edu
The University of Illinois at Springfield is a four-year, public,liberal arts university enrolling approximately 4,500 students.UIS is known for its small classes and personal approach toteaching and students point to their close relationships withprofessors as the most important feature of their education.Located in the state capital, UIS has a special mission in publicaffairs.
http://www.uis.edu
Since its founding in 1867, the University of Illinois at Urbana-Champaign hasearned a reputation of international stature. Its distinguished faculty, outstand-ing resources, breadth of academic programs and research disciplines and large,diverse student body constitute an educational community ideally suited forscholarship and research. Scholars and educators consistently rank it among aselect group of the world’s great universities.
http://www.uiuc.edu
UNIVERSITY OF ILLINOIS
2006 Annual Financial Report • 3

4 • 2006 Annual Financial Report
MESSAGE FROM THE PRESIDENT
I am pleased to present the University of Illinois Financial Report for fiscal year 2006 on behalf ofour Board of Trustees and our faculty, students and staff.
Here you will find detailed information about the University’s financial position and performancefor the year ended June 30, 2006. The graphs, table, charts and financial statements reflect thatthe U. of I. financial house is in order and that our resources have been prudently managed.
Besides the financial information, which begins on page 13, there are data points that tell thestory behind the numbers. Impact Illinois: 10 Ways You Benefit translates dollars into achievementsthat have a positive economic and societal impact on the state of Illinois and beyond.
The University of Illinois’ biggest single patron is the state of Illinois, through its elected legisla-ture and officials. The state’s direct annual investment in this University exceeds $700 million; anadditional $328 million in state funds helps pay for medical and pension benefits for our 23,000employees. Impact Illinois amply demonstrates that this investment pays excellent dividends. Infact, I believe that the University of Illinois is the state’s most valuable asset in creating a pros-perous future for the people of Illinois.
As always, I welcome your attention and comments.
Sincerely yours,
B. Joseph WhitePresident

2006 Annual Financial Report • 5Courtesy of Office for University Relations; Photography, Thompson-McClellan Photography, mattferguson.com, Chris Brown,Bill Wiegand, UIC Photographic Services, Office of Publications and Marketing at Urbana-Champaign, UIS Office of CampusRelations, the University of Illinois at Chicago Medical Center and John Dixon, The News Gazette.

6 • 2006 Annual Financial Report

2006 Annual Financial Report • 7

56,5068 • 2006 Annual Financial Report
A State University With A Global ReachTotal University enrollment for the fall semester of 2005 was approximately 68,325. Illinois residents account for80% of the total enrollment. The remaining 20% of the University’s enrollment is divided between students fromother states and U.S. territories, 10%, and international students, 10%.
The primary focus of the University’s educational program is to provide the highest quality educational experienceto Illinois residents. Illinois taxpayers provide a direct subsidy to the University that represents about one-third ofthe University’s operating budget. The enrollment of students from other states, U.S. territories and foreign coun-tries help broaden the educational and life experience of all our students.
Adams 157
Alexander 5
Bond 24
Boone 121
Brown 10
Bureau 93
Calhoun 5
Carroll 26
Cass 40
Champaign 5,123
Christian 152
Clark 29
Clay 20
Clinton 48
Coles 130
Cook 25,475
Crawford 49
Cumberland 18
Dekalb 222
Dewitt 43
Douglas 85
Du Page 6,198
Edgar 55
Edwards 7
Effingham 115
Fayette 24
Ford 74
Franklin 31
Fulton 62
Gallatin 3
Greene 36
Grundy 145
Hamilton 2
Hancock 31
Hardin 0
Enrollment by County, Fall 2005
Henderson 11
Henry 138
Iroquois 120
Jackson 79
Jasper 39
Jefferson 40
Jersey 39
JoDaviess 27
Johnson 10
Kane 1,237
Kankakee 238
Kendall 209
Knox 115
Lake 3,396
La Salle 305
Lawrence 23
Lee 76
Livingston 103
Logan 140
McDonough 56
McHenry 1,060
McClean 633
Macon 397
Macoupin 114
Madison 453
Marion 56
Marshall 32
Mason 46
Massac 12
Menard 108
Mercer 32
Monroe 96
Montgomery 116
Morgan 154
Moultrie 53
Illinois Students2,001 to 27,000501 to 2,000201 to 500101 to 2000 to 100
ON-CAMPUS HEADCOUNT
Ogle 113
Peoria 583
Perry 23
Piatt 130
Pike 43
Pope 6
Pulaski 3
Putnam 25
Randolph 31
Richland 34
Rock Island 274
St. Clair 381
Saline 18
Sangamon 2,270
Schuyler 14
Scott 21
Shelby 40
Stark 21
Stephenson 81
Tazewell 363
Union 16
Vermilion 208
Wabash 19
Warren 35
Washington 26
Wayne 17
White 17
Whiteside 111
Will 2,316
Williamson 58
Winnebago 646
Woodford 130
Unknown 12

61,4
39
2006 Annual Financial Report • 9
Alabama 29
Alaska 8
Arizona 62
Arkansas 27
California 530
Colorado 72
Connecticut 51
Delaware 11
District of Columbia 13
Florida 159
Georgia 82
Hawaii 21
Idaho 20
Illinois 56,506
Indiana 243
Iowa 113
Kansas 83
Kentucky 85
Louisiana 30
Maine 8
Maryland 166
Massachusetts 114
Michigan 239
Minnesota 132
Mississippi 18
Missouri 337
Montana 10
Nebraska 46
Nevada 16
New Hampshire 20
New Jersey 219
New Mexico 33
New York 246
Enrollment by State, Fall 2005
North Carolina 80
North Dakota 9
Ohio 271
Oklahoma 37
Oregon 39
Pennsylvania 150
Rhode Island 7
South Carolina 27
South Dakota 8
Tennessee 71
Texas 208
Utah 55
Vermont 12
Virginia 138
Washington 80
West Virginia 14
Wisconsin 181
Wyoming 3
Unknown 239
Other* 61
United States(AK & HI inset)
401 to 54,000301 to 400201 to 300101 to 2000 to 100
68,3
25North/Central America & W. Indies 254
U.S. and U.S. Territories 61,476
Subtotal North/Central America 61,730
Asia 5,292
Europe 710
South America 270
Africa 132
Oceania 50
Unknown - Foreign 141
Enrollment by Continent, Fall 2005
*U.S. residents with foreign addresses

Student Full-Time Equivalent Enrollment
Fall 2005 On-Campus Enrollment
Chicago* Springfield Urbana-Champaign Total University
Undergraduate 15,148 2,005 30,453 47,606
Graduate 6,766 1,373 9,112 17,251
Professional 2,439 0 1,029 3,468
TOTAL 24,353 3,378 40,594 68,325
*Includes 982 residents.Note: Fte calculated based on IBHE definition
Degrees Awarded FY 2005Chicago Springfield Urbana-Champaign Total University
Certificates — — 12 12
Bachelors 3,149 672 6,752 10,573
Postbaccalaureate Certificates — 3 — 3
Masters 1,785 470 2,622 4,877
Post-Masters Certificates — 11 15 26
Doctorate 286 1 636 923
First-Professional 503 — 335 838
First-Professional-Certificates 25 — — 25
TOTAL 5,748 1,157 10,372 17,277
Staff Full-Time Equivalent (all funds)
OtherUrbana- University Total
Chicago Springfield Champaign Administration University
Faculty 2,422 226 2,940 5 5,593
Academic Professional 3,475 158 3,190 751 7,574
Support Staff 5,239 266 4,467 539 10,511
Graduate Assistant 2,135 130 2,618 17 4,900
TOTAL 13,271 780 13,215 1,312 28,578
Note: Chicago campus includes University of Illinois Hospital; Urbana-Champaign campus includes CooperativeExtension Service.
10 • 2006 Annual Financial Report
STAFF AND STUDENT DATA AS OF OCTOBER 2005

2006 Annual Financial Report • 11
I am pleased to present the Annual Financial Report of the University of Illinois for thefiscal year ended June 30, 2006. The University has built a firm foundation of fiscalstrength that underpins a broad array of highly successful, top-quality academic pro-grams. The current report documents continued positive growth in revenue and netassets, utilizing diverse sources of funding.
We are one University with three campuses sharing a common name, mission, gov-erning body and unwavering commitment to academic excellence. We are an organi-zation that is academically decentralized and financially centralized. Each of the morethan 1,100 staff within the central administrative organization is committed to provid-ing leadership for the operating units of the University and to follow best businesspractices to ensure the integrity of all University initiatives.
At the close of FY 2006, the University completed a strategic planning process encom-passing all academic and support organizations. The goal for our support organiza-tions is to align our roles, structure, and operating approach to financial and businessfunctions in order to provide maximum flexibility while ensuring proper stewardshipof the University resources. The University’s President has created and the Board ofTrustees has endorsed a compact to secure resources available from the State, fromfaculty scholarship and research, from private and corporate friends of the University,and from students and families, including the redirection of existing resources fromlower to higher priorities. We must now focus our efforts on execution of the strategicplans and the compact’s successful implementation.
The University community is working to create a brilliant future. With high aspirationstrategic plans and a solid financial foundation, we are committed to building uponthe University’s tradition of excellence in teaching, research, public service, and eco-nomic development.
Stephen K. RuggVice President for Administration, Comptroller
October 4, 2006
MESSAGE FROM THE VICE PRESIDENTfor Administration, Comptroller

The Honorable William G. HollandAuditor GeneralState of IllinoisandThe Board of TrusteesUniversity of Illinois
As Special Assistant Auditors for the Auditor General, we have audited the accompanying basic financial statementsof the University of Illinois (University) and its aggregate discretely presented component units, collectively a compo-nent unit of the State of Illinois, as of and for the year ended June 30, 2006, as listed in the table of contents. Thesefinancial statements are the responsibility of the University’s management. Our responsibility is to express opinionson these financial statements based on our audit. The prior year partial comparative information has been derivedfrom the University’s 2005 financial statements and, in our report dated September 28, 2005 we expressed unquali-fied opinions on those financial statements.
We conducted our audit in accordance with auditing standards generally accepted in the United States of Americaand the standards applicable to financial audits contained in Government Auditing Standards, issued by the ComptrollerGeneral of the United States. Those standards require that we plan and perform the audit to obtain reasonableassurance about whether the financial statements are free of material misstatement. An audit includes examining,on a test basis, evidence supporting the amounts and disclosures in the financial statements. An audit also includesassessing the accounting principles used and significant estimates made by management, as well as evaluating theoverall financial statement presentation. We believe that our audit provides a reasonable basis for our opinions.
In our opinion, the financial statements referred to above present fairly, in all material respects, the respective finan-cial position of the University and of its aggregate discretely presented component units as of June 30, 2006, and therespective changes in financial position and cash flows thereof for the year then ended in conformity with accountingprinciples generally accepted in the United States of America.
In accordance with Government Auditing Standards, a report on our consideration of the University’s internal control overfinancial reporting and on our tests of its compliance with certain provisions of laws, regulations, contracts, and grantagreements and other matters will be issued under separate cover. The purpose of that report is to describe thescope of our testing of internal control over financial reporting and compliance and the results of that testing, and notto provide an opinion on the internal control over financial reporting or on compliance. That report, upon issuance,is an integral part of an audit performed in accordance with Government Auditing Standards and should be considered inassessing the results of our audit.
The accompanying management’s discussion and analysis as listed in the table of contents is not a required part ofthe basic financial statements but is supplementary information required by accounting principles generally ac-cepted in the United States of America. We have applied certain limited procedures, which consisted principally ofinquiries of management regarding the methods of measurement and presentation of the required supplementaryinformation. However, we did not audit the information and express no opinion on it.
Peoria, Illinois
October 4, 2006
12 • 2006 Annual Financial Report
INDEPENDENT AUDITOR’S REPORT

The following Management’s Discussion and Analysis, or MD&A, provides an overview of thefinancial position and activities of The University of Illinois for the year ended June 30, 2006.
We encourage you to read this MD&A section in conjunctionwith the audited financial statements and footnotes appearing in this report.
2006 Annual Financial Report • 13
MANAGEMENT’S DISCUSSION AND ANALYSIS
INTRODUCTION AND BACKGROUNDThe following Management’s Discussion and Analysis or MD&A provides an overview of the financial position and activities ofthe University of Illinois for the year ended June 30, 2006 with comparative information for the year ended June 30, 2005. TheMD&A should be read in conjunction with the audited financial statements and footnotes appearing in this report.
The University of Illinois was founded in 1867 in response to the federal Land Grant Act of 1862. The University’s evolution overnearly 140 years as a land-grant institution has produced a set of core values that underlie all aspects of its present and futureprograms. The University is a comprehensive public university, a family of three distinct campuses — Chicago, Springfield andUrbana-Champaign serving the people of Illinois through a shared commitment to our missions of excellence in teaching,research, public service and economic development.
Our campuses attract some of the most talented students in the world and currently enrolls greater than 68,000 on-campusstudents and thousands more take courses off campus and online. The University of Illinois is a world leader in research withinternationally renowned faculty and currently employs approximately 5,600 faculty members on its three campuses. TheUniversity offers a diverse range of degree programs from baccalaureate to post-doctoral levels. Approximately 17,000 degreesare awarded annually. The operating budget for fiscal year 2006, from all fund sources, was approximately $3.5 billion. We area university that belongs to the people of Illinois. Our faculty, staff and students share their knowledge and expertise and theresources of the University with citizens in every corner of the state through more than 700 public service and outreach pro-grams.
The University has a mission to transform lives and serve society by educating, creating knowledge, and putting knowledge towork on a large scale and with excellence. Our vision is to create a brillant future for the University in which students, faculty, andstaff thrive and citizens of Illinois, the nation, and the world benefit.
An integral part of the University’s mission is a commitment to research. A knowledge-based economy requires ongoing invest-ments in research, invention, and the discovery and application of new knowledge. The University’s world-class faculty are thedrivers of cutting-edge research, yielding inventions and the discovery of new knowledge, which can be commercialized into newprocesses, products, and services. The faculty members at the University generate external grants that bring employment,graduate students, and resources to Illinois. Students benefit greatly from this research enterprise through their participation inemerging research areas.
The University of Illinois serves as an essential partner with the state in sustaining growth in the economy and thriving, healthycommunities. The University also has an impressive impact on the state’s economy. Our very operation means billions in directspending in Illinois and employment for more than 33,000. In addition, the increased earning power of hundreds of thousandsof alumni living in Illinois results in additional tax revenue for our state.
The University is dedicated to using the resources at all three campuses in an integrated fashion to strengthen the services tothe state through the education of a modern labor work force, research and development, technology commercialization, andpartnership with business, government and community groups. Each campus makes specific and different contributions to theUniversity’s overarching mission and vision. The campuses are strengthened by intercampus cooperation and by university-wide services, yet carry out their academic functions with a high degree of delegated authority and autonomy. In addition to thethree main campuses, the University also has health professions sites in the Illinois towns of Rockford, Peoria, and the QuadCities, continuing education centers and offices across the State of Illinois and offers a variety of classes online.

14 • 2006 Annual Financial Report
University of Illinois at ChicagoThe University of Illinois at Chicago (UIC) is a major research university located in the heart of one of the world’s great cities. Thelargest university in Chicago, UIC ranks among the nation’s top 50 universities in federally funded research. UIC plays a criticalrole in Illinois healthcare, operating the state’s major public medical center and serving as the principal educator of Illinois’physicians, dentists, pharmacists, nurses and other health professionals. UIC’s student body is one of the nation’s most diverse,reflecting the global character of Chicago. The hallmark of the campus is its Great Cities Commitment, through which UICfaculty, staff and students engage in hundreds of programs with civic, community, corporate and government partners to im-prove the quality of life in Chicago and other metropolitan areas around the world.
University of Illinois at SpringfieldThe University of Illinois at Springfield (UIS) is located on 746 picturesque acres in the state capital of Illinois. UIS is a small,public liberal arts university where faculty place the top priority on teaching. The resulting close relationships they build withstudents are consistently cited by graduates as the University’s greatest strength. Classes are small so students benefit fromhands on learning; they do not just observe in the classrooms and labs. Through extraordinary internships in the communityand in government, UIS offers 42 undergraduate and graduate degree programs, and is known for an emphasis on public affairsand service, its wireless campus, and its extensive online offerings.
University of Illinois at Urbana-ChampaignThe University of Illinois at Urbana-Champaign is a place of excellence, innovation, and tradition. At our state’s classic land-grant university, more than 2,000 faculty members lead 40,000 undergraduate, graduate and professional students from aroundthe world in a process of discovery and learning in 16 colleges and schools, and more than 80 research centers and labs. Illinoisfaculty and students are engaged with top scholars from around the world and across disciplines to address humanity’s criticalissues. Their work has earned the world’s top prizes and recognitions, including Nobel and Pulitzer Prizes, Tony Awards, MacArthur“genius” awards, and National Medals of Science and Technology. Many faculty members have been inducted into the nation’selite academies of arts and sciences. Unique campus resources include one of the world’s largest university libraries, outstand-ing centers for the arts, and many world-class research facilities, including the National Center for Supercomputing Applica-tions, Beckman Institute for Advanced Science and Technology, and Siebel Center for Computer Science.
USING THE FINANCIAL STATEMENTSThe University’s financial report includes three financial statements: the Statement of Net Assets; the Statement of Revenues,Expenses, and Changes in Net Assets; and the Statement of Cash Flows. The financial statements are prepared in accordancewith Governmental Accounting Standards Board (GASB) principles, which establish standards for external financial reportingfor public colleges and universities and require that financial statements be presented on a consolidated basis to focus on theUniversity as a whole. The financial statements encompass the University and its discretely presented component units, theUniversity of Illinois Foundation, the University of Illinois Alumni Association, and Wolcott, Wood and Taylor, Inc. Additionalinformation regarding these component units is summarized in Note 1 to the financial statements. This MD&A focuses on theUniversity excluding the discretely presented component units. MD&A for these component units is included in their sepa-rately issued financial statements.
FINANCIAL HIGHLIGHTS AND KEY TRENDSThe fiscal year 2006 budget for direct state appropriations, as approved by the Governor, was approximately $700 million,virtually the same as the approved fiscal year 2005 budget. Despite the lack of growth in our state appropriated funds, theoverall budget utilized by the University increased by about 3%. This trend demonstrates the University’s ability to rely on otherdiverse sources of funding to provide services to our students and support our mission.
Net assets, which represent the residual interest in the University’s assets after liabilities, increased during the current year by$61 million attributed largely to an increase of $54 million in invested in capital assets and an increase of $37 million inrestricted expendable funds offset by decreases in unrestricted funds. As of June 30, 2006, the University’s total assets were $4.5billion compared to total assets of $4.3 billion as of June 30, 2005. This growth is largely due to an increase in capital assets andcash and investment balances from the proceeds of borrowings for capital projects during the fiscal year 2006. The Universityissued Auxiliary Facilities System Revenue Series 2005B Bonds in the amount of $67.3 million to fund various improvementsand additions to the System and Certificates of Participation Academic Facilities Projects, Series 2006A in the amount of $81.9million to fund various maintenance and improvement projects.

(in thousands)2006 2005
Current assets:
Cash and investments $ 479,317 $ 380,705
Accounts and notes receivable 340,310 331,215
Other current assets 54,039 52,736
Noncurrent assets:
Investments 616,118 618,605
Notes receivable 42,086 35,421
Capital assets, net of accumulated depreciation 2,969,989 2,867,380
Other assets 35,228 30,119
Total assets $ 4,537,087 $ 4,316,181
Current liabilities:
Accounts payable, accrued liabilities and deferred revenue $ 401,355 $ 371,410
Bonds payable 29,133 23,813
Leaseholds payable and other obligations 32,691 27,244
Accrued self insurance 34,105 29,912
Other current liabilities 73,162 71,655
Noncurrent liabilities:
Bonds payable 805,579 756,459
Leaseholds payable and other obligations 492,332 435,843
Accrued self insurance 108,109 101,064
Other noncurrent liabilities 190,636 189,697
Total liabilities $ 2,167,102 $ 2,007,097
Net assets $ 2,369,985 $ 2,309,084
STATEMENT OF NET ASSETSThe Statement of Net Assets presents the financial position of the University at the end of the fiscal year and includes all assetsand liabilities of the University using the accrual basis of accounting. The difference between total assets and total liabilities,net assets, is one indicator of the current financial condition of the University. The changes in net assets that occur over timeindicate improvement or deterioration in the University’s financial condition. Generally assets and liabilities are reported atcost with the exception of investments which are reported at fair value and capital assets which are stated at historical cost lessaccumulated depreciation. A summarized comparison of the University’s assets, liabilities and net assets at June 30, 2006 and2005 is as follows:
2006 Annual Financial Report • 15
Total assets increased by $221 million or 5% to $4.5 billion during fiscal year 2006. The change is attributed to an increase incash and investments of $96 million, an increase in accounts and notes receivable of $16 million, an increase in capital assets of$103 million, and an increase in other assets of $6 million. The increase in total University cash and investments is largely dueto the issuance of certificates of participation at the end of the fourth quarter for deferred maintenance projects. The increasein accounts and notes receivable was attributable to increases in receivables from sponsoring agencies, hospital and othermedical activities, and the medical service plans during the fiscal year.
Total liabilities increased by approximately $160 million or 8% during fiscal year 2006. Bonds payable increased by $54 millionprimarily due to the sale of bonds for Auxiliary Facilities System capital projects. Leaseholds and other obligations payableincreased by $62 million because certificates of participation were issued during FY06 for deferred maintenance projects onacademic facilities. Accrued self insurance increased by $11 million as the result of actuarial studies which analyze future claimsoutstanding and estimate the possible outcome. The residual increase is due to a slight increase in accrued compensatedabsence balances and an increase in the accrued payroll and accounts payable at the end of fiscal year 2006.

16 • 2006 Annual Financial Report
The following graphs illustrate the University’s assets and liabilities with the current and non current categories combined:
100,000
200,000
300,000
400,000
500,000
600,000
700,000
800,000
900,000
Bonds payable Payables, accruedliabilities, and
deferred revenue
Otherliabilities
Accrued selfinsurance
Leaseholds payableand
other obligations
LIABILITIES (in thousands)
Accounts and notesreceivable
500,000
1,000,000
1,500,000
2,000,000
2,500,000
3,000,000
Other assets Capital assets, netCash andinvestments
ASSETS (in thousands)
2005 2006

Capital AssetsCapital assets, net, which includes the University’s land, buildings, improvements, and equipment including capitalized soft-ware and library books, increased by $103 million to approximately $2.97 billion at June 30, 2006. The University’s policyrequires the capitalization of all land and collection purchases regardless of cost, equipment at $5,000, buildings and improve-ments at $100,000, and infrastructure at $1,000,000. The University depreciates its capital assets on a straight-line basis, usingestimated useful lives ranging from three to fifty years. Facilities under construction include projects funded from State capitalappropriations, private gifts, revenue bonds, certificates of participation, and internal funds. No new State capital appropria-tion funding was received for fiscal year 2006 but funds reappropriated from prior years were utilized for costs related to thecompletion of the Classroom and Office Building at the Springfield campus, the College of Medicine Research Facility on theChicago campus and survey facilities at the Urbana-Champaign campus. Revenue bonds were used to fund recreation facilityupgrades and new construction at each of the campuses and a portion of the South Campus Project at the Chicago campus. Thefollowing chart illustrates the composition of the University’s capital assets, net of accumulated depreciation, by category.
2006 Annual Financial Report • 17
NET CAPITAL ASSETS
(in thousand/s)
2006 2005
Buildings $ 1,778,318 59.8% $ 1,684,972 58.8%
Improvements and infrastructure 336,615 11.3% 341,747 11.9%
Construction in progress 262,974 8.9% 230,729 8.0%
Land 121,851 4.1% 119,631 4.2%
Equipment and software 352,360 11.9% 378,051 13.2%
Collections 117,871 4.0% 112,250 3.9%
TOTAL $ 2,969,989 $ 2,867,380
BONDS PAYABLE(in thousands)
2006 2005
Auxiliary Facilities System $ 694,867 $ 635,880
Health Services Facilities System 62,636 64,277
UIC South Campus 76,466 79,148
Other Issues 743 967
$ 834,712 $ 780,272
Long - Term DebtThe University has historically utilized revenue bonds to finance auxiliary and health service facility needs, and more recently,the UIC South Campus Project. These activities generally have the ability to generate resources from student fees, users, andthird parties sufficient to service the debt. During fiscal year 2006 the University issued Auxiliary Facilities System RevenueBonds Series 2005B in the amount of $67.3 million to fund various additions and improvements to the System. In addition, theUniversity issued South Campus Development Bonds Series 2006A in the amount of $53.7 million to provide for the advancerefunding of the outstanding South Campus Development Bonds Series 1999. The following chart details the various bondeddebt outstanding at June 30, 2006 and 2005:
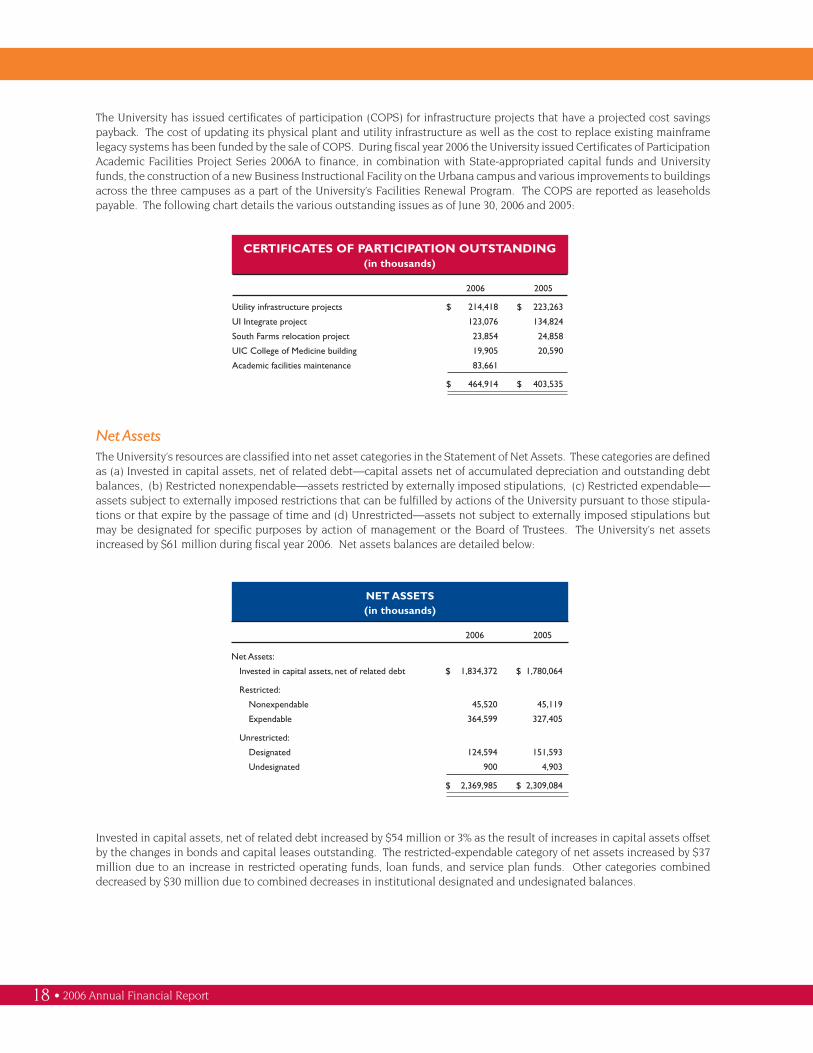
CERTIFICATES OF PARTICIPATION OUTSTANDING(in thousands)
2006 2005
Utility infrastructure projects $ 214,418 $ 223,263
UI Integrate project 123,076 134,824
South Farms relocation project 23,854 24,858
UIC College of Medicine building 19,905 20,590
Academic facilities maintenance 83,661
$ 464,914 $ 403,535
NET ASSETS(in thousands)
2006 2005
Net Assets:
Invested in capital assets, net of related debt $ 1,834,372 $ 1,780,064
Restricted:
Nonexpendable 45,520 45,119
Expendable 364,599 327,405
Unrestricted:
Designated 124,594 151,593
Undesignated 900 4,903
$ 2,369,985 $ 2,309,084
Invested in capital assets, net of related debt increased by $54 million or 3% as the result of increases in capital assets offsetby the changes in bonds and capital leases outstanding. The restricted-expendable category of net assets increased by $37million due to an increase in restricted operating funds, loan funds, and service plan funds. Other categories combineddecreased by $30 million due to combined decreases in institutional designated and undesignated balances.
18 • 2006 Annual Financial Report
The University has issued certificates of participation (COPS) for infrastructure projects that have a projected cost savingspayback. The cost of updating its physical plant and utility infrastructure as well as the cost to replace existing mainframelegacy systems has been funded by the sale of COPS. During fiscal year 2006 the University issued Certificates of ParticipationAcademic Facilities Project Series 2006A to finance, in combination with State-appropriated capital funds and Universityfunds, the construction of a new Business Instructional Facility on the Urbana campus and various improvements to buildingsacross the three campuses as a part of the University’s Facilities Renewal Program. The COPS are reported as leaseholdspayable. The following chart details the various outstanding issues as of June 30, 2006 and 2005:
Net AssetsThe University’s resources are classified into net asset categories in the Statement of Net Assets. These categories are definedas (a) Invested in capital assets, net of related debt—capital assets net of accumulated depreciation and outstanding debtbalances, (b) Restricted nonexpendable—assets restricted by externally imposed stipulations, (c) Restricted expendable—assets subject to externally imposed restrictions that can be fulfilled by actions of the University pursuant to those stipula-tions or that expire by the passage of time and (d) Unrestricted—assets not subject to externally imposed stipulations butmay be designated for specific purposes by action of management or the Board of Trustees. The University’s net assetsincreased by $61 million during fiscal year 2006. Net assets balances are detailed below:

(in thousands)2006 2005
Operating revenues:
Student tuition and fees $ 554,856 $ 507,137
Sponsored programs 769,949 760,728
Hospital and other medical activities 453,032 425,932
Auxiliary enterprises and independent operations 294,107 273,404
Medical service plan 141,336 138,624
Other 277,028 259,331
Total operating revenues 2,490,308 2,365,156
Operating expenses 3,548,600 3,471,498
Operating loss (1,058,292) (1,106,342)
Nonoperating revenues (expenses)
State appropriations and on behalf payments 922,227 940,510
Private gifts 116,111 120,844
Investment income 38,992 35,077
Other net operating revenues (expenses) (23,945) (41,241)
Net nonoperating revenues 1,053,385 1,055,190
Capital state appropriations and capital gifts and grants 65,600 92,439
Endowment gifts 208 1,256
Increase in net assets 60,901 42,543
Net assets, beginning of year 2,309,084 2,266,541
Net assets, end of year $ 2,369,985 $ 2,309,084
STATEMENT OF REVENUES, EXPENSES AND CHANGESIN NET ASSETSThe Statement of Revenues, Expenses, and Changes in Net Assets presents the University’s results of operations. In accor-dance with GASB reporting standards, revenues and expenses are classified as either operating or nonoperating. A summa-rized comparison of the University’s Statement of Revenues, Expenses and Changes in Net assets for the years ended June 30,2006 and 2005 is as follows:
RevenuesThe University’s revenues are generated from various sources to help supplement student tuition and fees. Multiple sourcesof revenue allow the University to maintain its funding base in the face of recent level funding or declining funding from stateappropriations. GASB reporting standards require revenues to be categorized as operating or nonoperating. Operating rev-enues are derived from activities associated with providing goods and services by the University and generally result fromexchange transactions where each of the parties to the transaction either give up or receive something of equal or similarvalue. The University also relies on such revenue as State appropriations, gifts, and investment income to support operationswhich GASB reporting standards define as nonoperating.
2006 Annual Financial Report • 19

Student tuition and state appropriations are primary sources of funding for the University’s academic programs. State appro-priation revenue remained relatively consistent between fiscal year 2005 and fiscal year 2006. Tuition revenue increased by$48 million during fiscal year 2006. The increase in tuition is due to a 9% tuition increase approved by the Board of Trusteesfor fiscal year 2006 and additional tuition as the result of special tuition differentials in various graduate and undergraduateprograms. Payments made by the State on behalf of the University to Central Management Services (CMS) and the StateUniversities Retirement System (SURS) for FY06 were $328 million compared to $347 million in FY05. This decrease is causedby reduced state funding for employer required contributions to the State Universities Retirement System. GASB reportingrequires disclosure of all estimated allocations to the University be included in the current year statement of revenues, ex-penses and changes in net assets.
20 • 2006 Annual Financial Report
The following graphically illustrates the revenues by source (both operating and certain nonoperating) which were used tofund the University’s operating activities for the year ended June 30, 2006:
30% Nonoperating revenues$ 1,077.3 million
22% Grants and contracts$ 769.9 million
13% Hospital and othermedical services$ 453.0 million
8% Auxiliary enterprisesand independentoperations$ 294.1 million
6% Departmental activities$ 197.1 million
16% Student tuition and fees$ 554.9 million
5% Other operating revenues$ 221.3 million
26% State appropriations andon behalf payments
3% Gifts
1% Investment incomeTOTAL $ 3,567.6 million
REVENUES(in millions)

Operating expenses per the Statement of Revenues, Expenses and Changes in Net Assets increased by $77 million duringfiscal year 2006. Expenses related to the University’s mission of instruction, research and public service increased by 1%, or$11.6 million in 2006. Hospital and medical activities expenses increased by $12.3 million or 3% which correlates to normalinflationary increases during fiscal year 2006. Depreciation expense increased $9.1 million due to new buildings and improve-ments being completed and placed in service in FY06. Other increases are attributable to self supporting operations andscholarship and fellowship expenses which correlate with inflation and corresponding revenue increases.
The University chooses to report their expenses by functional classifications in the Statement of Revenues, Expenses andChanges in Net Assets. For the reader’s information, the expenses are displayed in their natural classification in Note 15. Thefollowing graph illustrates the expenses by natural classification:
ExpensesThe majority of the University’s expenses are exchange transactions which GASB standards define as operating expenses.Nonoperating expenses include capital financing costs and costs related to capital assets.
2006 Annual Financial Report • 21
65% Compensation and benefits$ 2,289.9 million
29% Supplies and services$ 1,035.9 million
1% Student aid$ 37.7 million
5% Depreciation$ 185.1 millionTOTAL $ 3,548.6 million
OPERATING EXPENSES(in millions)
OPERATING EXPENSES(in thousands)
2006 2005
Instruction $ 666,200 18.8% $ 677,813 19.5%
Research 556,874 15.8% 557,058 16.0%
Public service 300,990 8.5% 277,626 8.0%
Support services 451,271 12.7% 450,280 13.0%
Hospital and medical activities 406,466 11.4% 394,122 11.4%
Auxiliary enterprises and independent operations 239,574 6.7% 217,040 6.3%
Scholarships and fellowships 185,155 5.2% 175,166 5.0%
Operation and maintenance of plant 229,038 6.5% 199,183 5.7%
Depreciation 185,105 5.2% 175,978 5.1%
On behalf payments for fringe benefits 327,927 9.2% 347,232 10.0%
$ 3,548,600 $ 3,471,498

The University’s cash and cash equivalents increased by $120 million during fiscal year 2006. This increase is largely due to theissuance of certificates of participation during the fourth quater of FY06 and increases in proceeds from sales and maturities ofinvestments.
(in thousands)
2006 2005
Cash flows from operating activities:
Total sources $ 2,436,210 $ 2,294,791
Total uses (3,026,089) (2,879,173)
Net cash flows used by operating activities (589,879) (584,382)
Cash flows from noncapital financing activities:
State appropriations 655,838 658,325
Gifts transferred from the Foundation 116,111 107,278
Other sources, net 24,187 (2,467)
Net cash flows provided by noncapital financing activities 796,136 763,136
Cash flows from capital and related financing activities:
Proceeds from debt issues 198,746 172,624
State capital appropriations 9,004 20,322
Payments of principal and interest on bonds and capital leases (150,576) (176,286)
Payment of bond issuance costs (1,330) (1,113)
Purchase of capital assets (226,475) (219,299)
Other sources, net 19,479 37,594
Net cash flows used by capital and related financing activities (151,152) (166,158)
Cash flows from investing activities:
Interest and dividends received 37,820 30,586
Proceeds from sales and maturities of investments
net of cash paid for investment purchases 27,369 (52,657)
Net cash flows provided (used) by investing activities 65,189 (22,071)
Net increase (decrease) in cash and cash equivalents 120,294 (9,475)
Cash and cash equivalents, beginning of year 266,771 276,246
Cash and cash equivalents, end of year $ 387,065 $ 266,771
STATEMENT OF CASH FLOWSThe Statement of Cash Flows provides information about the University’s financial results, by reporting the major sources anduses of cash. A comparative summary of the statement of cash flows for the years ended June 30, 2006 and 2005 is as follows:
22 • 2006 Annual Financial Report

2006 Annual Financial Report • 23
THE UNIVERSITY’S ECONOMIC OUTLOOKThe University is well positioned to continue its strong financial condition and level of excellence in service to students,patients, the research community, the state and the nation. A critical element to the University’s future continues to be a strongrelationship with the State of Illinois. State appropriations from the Governor and General Assembly provide essential operat-ing support for University programs. The direct appropriation for fiscal year 2007, signed into law by the Governor, reflects anincrease of approximately $12.8 million (1.8%) from the fiscal year 2006 approved budget. The State of Illinois also appropriatesfunds for payments on behalf of University employees to CMS and SURS to pay benefits for our employees. The fiscal year 2007budget is $388.6 million, an increase of $61.8 million from the prior year’s budget.
The University projects an increase in tuition and miscellaneous departmental revenue. The recommended $539.8 million fiscalyear 2007 tuition and miscellaneous departmental revenue budget represents a $53.5 million (11.0%) increase from fiscal year2006. The estimated increase in tuition revenue is due to a general tuition increase for each full time student of $586 at UIC, $750at UIS and $666 at UIUC. In addition to these, there are several special programs which have differential rate increases alongwith adjustments for enrollment levels and investment income on tuition revenue. New undergraduate students will have a fouryear tuition guarantee, this is the third year of the tuition guarantee program.
Private gifts are an important supplement to the University’s sources of funding for operating costs, a significant factor in thegrowth of academic units, and essential for capital acquisition and construction. The University is working with the Foundationto strengthen the future of private giving to the University. Private gifts are budgeted to increase by 8.5% during fiscal year 2007.
Research is a major component of the University’s mission. Research leading to the development of new products and servicesis also the engine driving economic development, another component of the University’s mission. The growth in externallysponsored research is testimony to the public and private sector confidence in the University’s research faculty. The fiscal year2007 sponsored project budget is an estimate of grant and contract awards for direct costs and represents a 2.7 % increase fromfiscal year 2006.
Under State statute the University of Illinois generates its own power, steam and chilled water to heat, cool and power theUniversity’s physical plant. In recent years, the costs of fuel prices have been volatile and at the same time the University hasadded a significant amount of new building space. These conditions coupled with serious deferred maintenance issues acrossthe campuses, particularly in the power plants, has resulted in substantial utility cost increases. Utility budget increases havebeen insufficient to keep pace with these large cost increases. As a result, the expenditures have exceeded the budgetedamount for this purpose during the last four years. The University is redoubling its efforts on conservation, deferred mainte-nance and appropriate funding of the utility production and distribution system to correct this situation.
The University experienced growth from a variety of funding sources during fiscal year 2006 despite essentially unchanged Statesupport. To achieve a continued strong financial position, the University constantly pursues multiple and diverse sources ofrevenue to support our mission of instruction, research, public service and economic development. The University’s Board ofTrustees and management are committed to upholding the University’s outstanding academic reputation and believe theUniversity’s financial condition will remain strong.


AUDITEDFINANCIAL
STATEMENTS
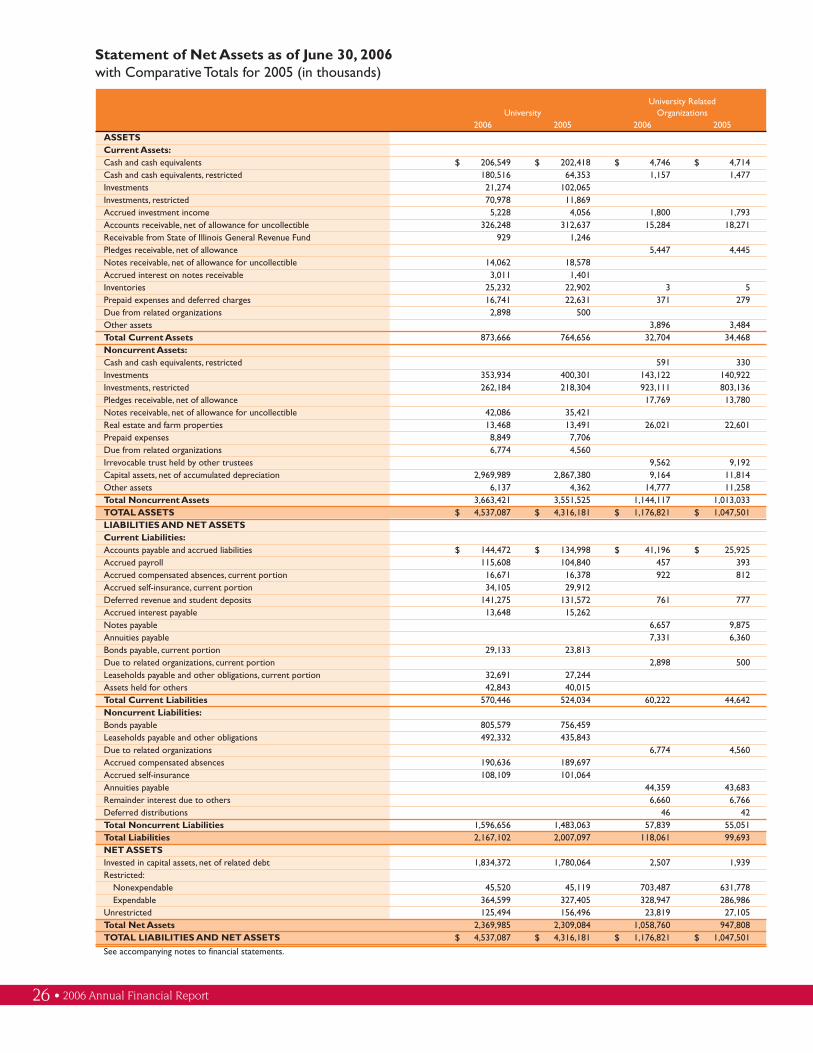
Statement of Net Assets as of June 30, 2006with Comparative Totals for 2005 (in thousands)
University RelatedUniversity Organizations
2006 2005 2006 2005ASSETSCurrent Assets:Cash and cash equivalents $ 206,549 $ 202,418 $ 4,746 $ 4,714Cash and cash equivalents, restricted 180,516 64,353 1,157 1,477Investments 21,274 102,065Investments, restricted 70,978 11,869Accrued investment income 5,228 4,056 1,800 1,793Accounts receivable, net of allowance for uncollectible 326,248 312,637 15,284 18,271Receivable from State of Illinois General Revenue Fund 929 1,246Pledges receivable, net of allowance 5,447 4,445Notes receivable, net of allowance for uncollectible 14,062 18,578Accrued interest on notes receivable 3,011 1,401Inventories 25,232 22,902 3 5Prepaid expenses and deferred charges 16,741 22,631 371 279Due from related organizations 2,898 500Other assets 3,896 3,484Total Current Assets 873,666 764,656 32,704 34,468Noncurrent Assets:Cash and cash equivalents, restricted 591 330Investments 353,934 400,301 143,122 140,922Investments, restricted 262,184 218,304 923,111 803,136Pledges receivable, net of allowance 17,769 13,780Notes receivable, net of allowance for uncollectible 42,086 35,421Real estate and farm properties 13,468 13,491 26,021 22,601Prepaid expenses 8,849 7,706Due from related organizations 6,774 4,560Irrevocable trust held by other trustees 9,562 9,192Capital assets, net of accumulated depreciation 2,969,989 2,867,380 9,164 11,814Other assets 6,137 4,362 14,777 11,258Total Noncurrent Assets 3,663,421 3,551,525 1,144,117 1,013,033TOTAL ASSETS $ 4,537,087 $ 4,316,181 $ 1,176,821 $ 1,047,501LIABILITIES AND NET ASSETSCurrent Liabilities:Accounts payable and accrued liabilities $ 144,472 $ 134,998 $ 41,196 $ 25,925Accrued payroll 115,608 104,840 457 393Accrued compensated absences, current portion 16,671 16,378 922 812Accrued self-insurance, current portion 34,105 29,912Deferred revenue and student deposits 141,275 131,572 761 777Accrued interest payable 13,648 15,262Notes payable 6,657 9,875Annuities payable 7,331 6,360Bonds payable, current portion 29,133 23,813Due to related organizations, current portion 2,898 500Leaseholds payable and other obligations, current portion 32,691 27,244Assets held for others 42,843 40,015Total Current Liabilities 570,446 524,034 60,222 44,642Noncurrent Liabilities:Bonds payable 805,579 756,459Leaseholds payable and other obligations 492,332 435,843Due to related organizations 6,774 4,560Accrued compensated absences 190,636 189,697Accrued self-insurance 108,109 101,064Annuities payable 44,359 43,683Remainder interest due to others 6,660 6,766Deferred distributions 46 42Total Noncurrent Liabilities 1,596,656 1,483,063 57,839 55,051Total Liabilities 2,167,102 2,007,097 118,061 99,693NET ASSETSInvested in capital assets, net of related debt 1,834,372 1,780,064 2,507 1,939Restricted:
Nonexpendable 45,520 45,119 703,487 631,778Expendable 364,599 327,405 328,947 286,986
Unrestricted 125,494 156,496 23,819 27,105Total Net Assets 2,369,985 2,309,084 1,058,760 947,808TOTAL LIABILITIES AND NET ASSETS $ 4,537,087 $ 4,316,181 $ 1,176,821 $ 1,047,501
See accompanying notes to financial statements.
26 • 2006 Annual Financial Report

Statement of Revenues, Expenses and Changes in Net AssetsYear Ended June 30, 2006 with Comparative Totals for 2005 (in thousands)
University Related
University Organizations
2006 2005 2006 2005
OPERATING REVENUES:
Student tuition and fees, net $ 554,856 $ 507,137 $ $
Fee for services - state appropriation 44,626 46,117
Federal appropriations 15,805 16,819
Federal grants and contracts 601,846 608,403
State of Illinois grants and contracts 59,944 62,710
Private gifts, grants, and contracts 108,159 89,615 114,954 98,579
Educational activities 197,089 181,118
Auxiliary enterprises, net 282,321 264,660
Hospital and other medical activities, net 408,406 379,815
Medical service plan 141,336 138,624
Independent operations 11,786 8,744
Interest and service charges on student loans 2,913 759
On behalf - hospital and other medical activities 61,221 60,635
Allocation from the University 8,642 7,325
Other sources 30,968 27,511
TOTAL OPERATING REVENUES 2,490,308 2,365,156 154,564 133,415
OPERATING EXPENSES:
Instruction 666,200 677,813
Research 556,874 557,058
Public service 300,990 277,626
Academic support 218,043 206,894
Student services 82,656 79,616
Institutional support 150,572 163,770 35,213 30,831
Operation and maintenance of plant 229,038 199,183
Scholarships and fellowships 185,155 175,166
Auxiliary enterprises 229,935 207,825
Hospital and medical activites 406,466 394,122
Independent operations 9,639 9,215
Depreciation 185,105 175,978 328 314
On behalf payments for fringe benefits 327,927 347,232
Distributions on behalf of the University 127,279 122,521
TOTAL OPERATING EXPENSES 3,548,600 3,471,498 162,820 153,666
Operating loss (1,058,292) (1,106,342) (8,256) (20,251)
NONOPERATING REVENUES (EXPENSES):
State appropriations 655,521 653,913
Private gifts 116,111 120,844
On behalf payments for fringe benefits 266,706 286,597 1,770 1,517
Net investment income (net of interest expense of $2,110 in 2006) 38,992 35,077 7,499 3,288
Net increase in the fair value of investments 3,200 11,593 85,957 66,724
Interest on capital asset related debt (61,657) (59,068) (465) (228)
Loss on sale/disposal of capital assets (1,063) (3,933)
Other nonoperating revenues 35,575 10,167
Other nonoperating expenses (6,950) (1,363)
NET NONOPERATING REVENUES (EXPENSES) 1,053,385 1,055,190 87,811 69,938
Income (loss) before other revenues, expenses, gains, or losses (4,907) (51,152) 79,555 49,687
Capital state appropriations 53,961 65,994
Capital gifts and grants 11,639 26,445
Private gifts for endowment purposes 208 1,256 31,397 24,445
INCREASE IN NET ASSETS 60,901 42,543 110,952 74,132
NET ASSETS, BEGINNING OF YEAR, AS RESTATED 2,309,084 2,266,541 947,808 873,676
NET ASSETS, END OF YEAR $ 2,369,985 $ 2,309,084 $ 1,058,760 $ 947,808
See accompanying notes to financial statements.
2006 Annual Financial Report • 27

Statement of Cash FlowsYear Ended June 30, 2006 with Comparative Totals for 2005 (in thousands)
University RelatedUniversity Organizations
2006 2005 2006 2005
CASH FLOWS FROM OPERATING ACTIVITIES:
Student tuition and fees $ 559,611 $ 506,419 $ $
Medical fees for service - state appropriations 44,626 46,117
Federal, state, and local grants and contracts 680,459 685,111
Nongovernmental sponsored programs 101,775 92,612 3,336 3,783
Sales and services of educational and other departmental activities 202,755 172,445
Contributions and gifts 97,889 76,841
Service fee revenue 16,233 8,937
Auxiliary activities and independent operations 293,345 275,793 652
Hospital and other medical activities 407,355 370,042
Medical service plan 131,910 125,842
Distributions on behalf of the University (116,802) (105,538)
Allocation from the University 8,226 6,555
Payments to employees and benefits (1,947,205) (1,806,820) (16,800) (14,628)
Payments to suppliers (1,025,991) (994,966) (11,039) (8,799)
Payments to annuitants (39,086) (62,749) (7,491)
Student loans issued (13,807) (14,638)
Student loans collected 13,071 19,717 (8,088)
Student loan interest and fees collected 1,303 693
Other operating revenue 8,193 11,972
NET CASH USED BY OPERATING ACTIVITIES (589,879) (584,382) (18,852) (27,716)
CASH FLOWS FROM NONCAPITAL FINANCING ACTIVITIES:
State appropriations 655,838 658,325
Gifts transferred from University of Illinois Foundation 116,111 107,278
Private gifts for endowment purposes 663 104 31,397 24,445
Advance and repayments to related organizations, net (4,611) 300 (400) (300)
Other, net 28,135 (2,871) (78) (1,621)
NET CASH PROVIDED BY NONCAPITAL FINANCING ACTIVITIES 796,136 763,136 30,919 22,524
CASH FLOWS FROM CAPITAL AND RELATED FINANCING ACTIVITIES:
Proceeds from issuance of capital debt 198,746 172,624 2,582
Capital state appropriations 9,004 20,322
Capital gifts and grants 9,634 37,594
Proceeds from the sale of capital assets 9,845 3,084
Purchase of capital assets (226,475) (219,299) (713) (3,319)
Principal payments on bonds and capital leases (100,707) (129,486)
Interest payments on bonds and capital leases (49,869) (46,800) (396) (228)
Payment on notes payable (4,803) (220)
Payment of bond issuance costs (1,330) (1,113)
Other net (323)
NET CASH USED BY CAPITAL AND RELATED FINANCING ACTIVITIES: (151,152) (166,158) (3,151) (1,185)
CASH FLOWS FROM INVESTING ACTIVITIES:
Interest and dividends on investments, net 37,820 30,586 9,789 4,887
Proceeds from sales and maturities of investments 10,966,314 8,139,616 1,004,680 882,368
Purchase of investments (10,938,945) (8,192,273) (1,023,412) (880,942)
NET CASH PROVIDED (USED) BY INVESTING ACTIVITIES 65,189 (22,071) (8,943) 6,313
Net increase (decrease) in cash and cash equivalents 120,294 (9,475) (27) (64)
Cash and Cash Equivalents, Beginning of Year 266,771 276,246 6,521 6,585
CASH AND CASH EQUIVALENTS, END OF YEAR $ 387,065 $ 266,771 $ 6,494 $ 6,521
28 • 2006 Annual Financial Report

Statement of Cash FlowsYear Ended June 30, 2006 with Comparative Totals for 2005 (in thousands) - (continued)
University RelatedUniversity Organizations
2006 2005 2006 2005
Reconciliation of operating loss to net cash used by operating activities:
Operating loss $ (1,058,292) $ (1,106,342) $ (8,256) $ (20,251)
Adjustments to reconcile operating loss to net cash used
by operating activites:
On behalf payments for reimbursement of hospital and medical activities (61,221) (60,635)
On behalf payments for fringe benefits expense 327,927 347,232 1,770 1,517
Depreciation expense 185,105 175,978 328 314
Change in value of split interest agreements (1,352)
Changes in assets and liabilities:
Accounts receivable, net (14,042) (31,170) 633 (30)
Notes receivable, net (2,149) 7,360
Accrued interest on notes receivable (1,610) (65)
Inventories (2,330) 1,440 2 (1)
Prepaid expenses and deferred charges 1,671 3,315 (90) (61)
Pledges receivable (5,000) (4,000)
Noncurrent assets other (8,289) (4,605)
Accounts payable (707) 12,517 (79) 244
Accrued payroll 10,768 8,026 4 30
Deferred revenue and student deposits 9,703 1,789 15 707
Accrued compensated absences 1,232 22,705 110 45
Accrued self-insurance 11,238 32,938
Assets held for others 2,828 530 (273)
Net cash used by operating activities $ (589,879) $ (584,382) $ (18,852) $ (27,716)
Noncash investing, capital, and financing activities:
On behalf payments for fringe benefits $ 266,706 $ 286,597 $ 1,770 $ 1,517
Gifts in kind 2,005 2,418 19,406 26,049
Capital assets in accounts payable 48,961 37,463 49
Capital asset acquisitions by CDB 44,957 45,672
Capital asset acquisitions via leaseholds payable 11,096 27,557
Capital appreciation on bonds payable 10,662 10,217
Net interest capitalized 1,263 4,028
Other capital asset adjustments 1,329 9,606
Loss on sale/disposal of capital assets 1,063 3,934
See accompanying notes to financial statements.
2006 Annual Financial Report • 29

30 • 2006 Annual Financial Report
NOTES TO FINANCIAL STATEMENTS
NOTE 1 - ORGANIZATION AND SUMMARY OF SIGNIFICANTACCOUNTING POLICIES
Organization and Basis of PresentationThe University of Illinois (University), a federal land grant institution and a component unit of the State of Illinois, con-ducts education, research and public service and related activities principally at its three campuses in Urbana-Champaign,Springfield and Chicago which include the University of Illinois Hospital (Hospital) and other health care facilities. Thegoverning body of the University is The Board of Trustees of the University of Illinois (Board).
As required by accounting principles generally accepted in the United States of America, as prescribed by the Governmen-tal Accounting Standards Board (GASB), these financial statements present the financial position and financial activitiesof the University (the primary government) and its component units as well as certain activities and expenses funded byother State agencies on behalf of the University or its employees. The component units discussed below are included inthe University’s financial reporting entity (Entity) because of the significance of their financial relationship with the Uni-versity.
The University Related Organizations’ (UROs) column in the financial statements includes the financial data of theUniversity’s discretely presented component units. The University of Illinois Foundation (Foundation), the University ofIllinois Alumni Association (Alumni Association), and Wolcott, Wood and Taylor, Inc. (WWT) are included in the University’sreporting entity because of the significance of their operational or financial relationship with the University. These com-ponent units are discretely presented in a separate column to emphasize that they are Illinois non-profit organizationslegally separate from the University.
The Foundation was formed for the purpose of providing fund raising and other assistance to the University in order toattract private gifts to support the University’s instructional, research and public service activities. In this capacity, theFoundation solicits, receives, holds and administers gifts for the benefit of the University. Complete financial statementsfor the Foundation may be obtained by writing the Director of Business and Administration, 414C Harker Hall, 1305 W.Green Street, Urbana, IL 61801.
The Alumni Association was formed to promote the general welfare of the University and to encourage and stimulateinterest among students, former students and others in the University’s programs. In this capacity, the Alumni Associa-tion offers memberships in the Alumni Association to former students, conducts various activities for students and alumni,and publishes periodicals for the benefit of alumni. Complete financial statements for the Alumni Association may beobtained by writing the Director of Administration and Business Affairs, Alice Campbell Alumni Center, 601 S. LincolnAvenue, Urbana, IL 61801.
WWT was formed to provide practice management support services and operate as a billing/collection entity for healthcare activities under the laws of the State of Illinois. Complete financial information may be obtained by writing thePresident and CEO, 200 W. Adams, Suite 225, Chicago, IL 60606.
Prairieland Energy, Inc. (Prairieland), a for profit, wholly-owned subsidiary, was formed for the purpose of providing sup-port for the University through delivery of comprehensive economical utility services to all campuses of the University.
Illinois Ventures, LLC, (Illinois Ventures), a for profit, wholly-owned subsidiary, exists to facilitate the development of newcompanies commercializing technology originated or developed by faculty, staff and/or students of the University. TheUniversity desires Illinois Ventures to foster technology commercialization and economic development in accordancewith the teaching, research, and public service missions of the University.
The University of Illinois Research Park, LLC, (Research Park), a for profit, wholly-owned subsidiary, was formed to aid andassist the University by establishing and operating a research park on the University’s Urbana campus. The Research Parkwas designed to promote the development of new companies which commercialize University technologies.
Activities of Prairieland, Illinois Ventures, and the Research Park for the current fiscal year, which were minimal, have beenincorporated in the University’s financial statements using the blended method.
The Foundation, Alumni Association, WWT, Prairieland, Illinois Ventures and the Research Park are related organizationsas defined under University Guidelines adopted by the State of Illinois Legislative Audit Commission.

2006 Annual Financial Report • 31
The University is a component unit of the State of Illinois for financial reporting purposes. The financial balances and activitiesincluded in these financial statements are, therefore, also included in the State’s comprehensive annual financial report.
The basic financial statements include prior year comparative information, which has been derived from the University’s 2005financial statements. Such information does not include all of the information required to constitute a presentation in confor-mity with accounting principles generally accepted in the United States of America. Accordingly, such information should beread in conjunction with the University’s financial statements for the year ended June 30, 2005.
Certain items in the June 30, 2005 financial statements have been reclassified to correspond to the June 30, 2006 presentation.
The Entity’s resources are classified into net asset categories and reported in the Statement of Net Assets. These categories aredefined as (a) Invested in capital assets, net of related debt—capital assets net of accumulated depreciation and outstandingdebt balances (b) Restricted nonexpendable—assets restricted by externally imposed stipulations (c) Restricted expendable—assets subject to externally imposed restrictions that can be fulfilled by actions of the Entity pursuant to those stipulations orthat expire by the passage of time and (d) Unrestricted—assets not subject to externally imposed stipulations but may bedesignated for specific purposes by action of management or the Board of Trustees.
Significant Accounting PoliciesThe Entity prepared its financial statements as a Business Type Activity, as defined by GASB Statement No. 35, using theeconomic resources measurement focus and the accrual basis of accounting. Business Type Activities are those financed inwhole or in part by fees charged to external parties for goods and services.
The Statement of Revenues, Expenses, and Changes in Net Assets classifies the Entity’s fiscal year activity as operating andnonoperating. Operating revenues generally result from exchange transactions such as payments received for providing goodsand services, including tuition and fees, net of scholarships and fellowships, certain grants and contracts, sales and services ofeducational activities, hospital, and auxiliary enterprise revenues.
Scholarships and fellowships of $123,697,000 and $2,186,000 are netted against student tuition and fees and auxiliary enter-prises revenues, respectively. Stipends and other payments made directly to students are reported as scholarship and fellow-ship expense. Net tuition and fees, except for Summer Session, are recognized as revenues as they are assessed. The portionof Summer Session tuition and fees applicable to the following fiscal year is deferred.
Grant and contract revenues which are received or receivable from external sources are recognized as revenues to the extent ofrelated expenses or satisfaction of eligibility requirements on the accrual basis. Advances are classified as deferred revenue.
Certain revenue sources that the Entity relies on to provide funding for operations including State appropriations, gifts, andinvestment income are defined by GASB Statement No. 35 as nonoperating. In addition, transactions related to capital andfinancing activities are components of nonoperating revenues.
Appropriations made from the State of Illinois General Revenue Fund for the benefit of the University are recognized as nonop-erating revenues when eligibility requirements are satisfied.
In accordance with GASB Statement No. 24, Accounting and Financial Reporting for Certain Grants and Other Financial Assistance, theUniversity reported payments made to the State Universities Retirement System on behalf of the Entity for contributions toretirement programs for Entity employees of approximately $70,463,000 for the year ended June 30, 2006. Substantially allemployees participate in group health insurance plans administered by the State of Illinois. The employer contributions tothese plans for University employees paid by State appropriations and auxiliary enterprises are paid to Central ManagementServices on behalf of the University. The employer contributions to these plans on behalf of employees paid from otherUniversity-held funds are paid by the University. The on behalf payments are approximately $257,464,000 for 2006. The cost ofthese benefits paid on behalf of the Hospital are reflected as operating revenues as the result of certain contractual agreements.All other on behalf payments are reflected as nonoperating revenues. In all cases, the corresponding on behalf expense isreflected as operating and reported in on behalf payments for fringe benefits.
With respect to the Hospital, net patient service revenue is reported at the estimated net realizable amounts due from patients,third-party payors, and others for services rendered, including estimated retroactive adjustments under reimbursement agree-ments with third-party payors. Retroactive adjustments are accrued on an estimated basis in the period the related services arerendered and adjusted in future periods as final settlements are determined. The Hospital has agreements with third-partypayors that provide for payments to the Hospital at amounts different from its established rates. Approximately 92% of theHospital’s net patient service revenues were derived from Medicare, Medicaid, Blue Cross and managed care programs for the

32 • 2006 Annual Financial Report
year ended June 30, 2006. Payments under these programs are based on established program rates or costs, as defined, ofrendering services to program beneficiaries. The Hospital provides contractual allowances on a current basis for the differencesbetween charges for services rendered and the expected payments under these programs. For the year ended June 30, 2006, thecontractual allowances totalled $706,612,000.
The Entity first applies restricted net assets when an expense or outlay is incurred for purposes for which both restricted andunrestricted net assets are available.
The majority of the Entity’s expenses are exchange transactions which GASB defines as operating expenses for financial state-ment presentation. Nonoperating expenses include capital financing costs and costs related to investment activity.
Employment contracts for certain academic personnel provide for twelve monthly salary payments, although the contractedservices are rendered during a nine month period. The liability for those employees who have completed their contractedservices, but have not yet received final payment, was approximately $46,428,000 at June 30, 2006 and is recorded in the accom-panying financial statements. This amount will be paid from amounts specifically included in State of Illinois General RevenueFund appropriations to the University for fiscal year 2007 rather than from the unrestricted net assets available at June 30, 2006.
Accrued compensated absences for Entity personnel are charged as an operating expense, using the vesting method, based onearned but unused vacation and sick leave days including the Entity’s share of social security and medicare taxes. At June 30,2006, the University estimates that $134,689,000 of the accrued compensated absences liability will be paid out of State ofIllinois General Revenue Fund appropriations to the University in subsequent years, rather than from unrestricted net assetsavailable at June 30, 2006.
The Statement of Cash Flows details the change in the cash and cash equivalents balance for the fiscal year. Cash and cashequivalents include bank accounts and investments with original maturities of ninety days or less at the time of purchase. Suchinvestments consist primarily of U.S. Treasury bills, commercial paper, and money market funds.
Inventories are stated at the lower of cost or market. Cost is determined principally by the average cost method.
For donor restricted endowments, the Uniform Management of Institutional Funds Act, as adopted in Illinois, permits theBoard of Trustees of the University of Illinois to appropriate an amount of realized and unrealized endowment appreciation asthey determine to be prudent. The University’s policy is to retain the endowment realized and unrealized appreciation with theendowment after spending rule distributions.
Capital assets are recorded at cost or fair value at the date of a gift. Depreciation of the capital assets is calculated on a straight-line basis over the estimated useful lives (three to fifty years) of the respective assets. The University’s policy requires thecapitalization of all land and collection purchases regardless of cost, equipment at $5,000, buildings and improvements at$100,000, and infrastructure at $1,000,000. The Entity does not capitalize collections of works of art or historical treasures heldfor public exhibition, education, or research in furtherance of public service rather than capital gain, unless they were capital-ized as of June 30, 1999. Proceeds from the sale, exchange, or other disposal of any item belonging to a collection of works of artor historical treasures must be applied to the acquisition of additional items for the same collection.
The preparation of financial statements in conformity with accounting principles generally accepted in the United States ofAmerica requires management to make estimates and assumptions that affect the reported amounts of assets and liabilitiesand disclosure of contingent assets and liabilities at the date of the financial statements and the reported amounts of revenuesand expenses during the reporting period. Actual results could differ from those estimates. A material estimate that is particu-larly susceptible to significant change in the near term relates to the determination of the allowance for doubtful accounts andcontractual allowances.
In accordance with GASB Statement No. 20, Accounting and Financial Reporting for Proprietary Funds and Other Governmental Entities ThatUse Proprietary Fund Accounting, the Entity follows all applicable GASB pronouncements. In addition, the Entity applies all appli-cable Financial Accounting Standards Board (FASB) Statements and Interpretations, Accounting Principles Board (APB) Opin-ions and Accounting Research Bulletins of the Committee on Accounting Procedures issued on or before November 30, 1989unless those pronouncements conflict with or contradict GASB pronouncements. The Entity has elected not to apply FASBpronouncements issued after November 30, 1989.

2006 Annual Financial Report • 33
NOTE 2 - CASH, CASH EQUIVALENTS AND DEPOSITSThe carrying amount of the University’s and the UROs’ cash totalled $(16,870,000) and $4,831,000 at June 30, 2006, respectively.
The total bank account balances at June 30, 2006, of the University and the UROs, aggregated $6,903,000, and $4,131,000,respectively, of which $6,903,000, and $4,067,000, respectively, was covered by federal depository insurance or by collateral heldby an agent in the Entity’s name.
Certificates of Deposit, which are reported as investments per GASB Statement No. 9, for the University and the UROs totaled$846,000 and $33,000, respectively, at June 30, 2006 and were covered by federal depository insurance or collateral held by anagent in the Entity’s name.
NOTE 3 - INVESTMENTSInvestments in real estate and farm properties are carried at cost, or when donated, at the fair value at the date of donation. Allother investments are carried at their fair value, as determined by quoted market prices. Investment income and the change infair value of investments is recognized in the fund which owned such investments, except for income derived from investmentsof the University Endowment Fund which is recognized in the fund to which the income is restricted.
Illinois Statutes and Board policy authorize the University to invest in obligations of the U.S. Treasury, agencies, and instrumen-talities (U.S. Government securities); bank and savings and loan time deposits; corporate bonds, stock and commercial paper;repurchase agreements; and mutual funds. Illinois Statutes require a third party custodian to perfect the University’s securityinterest under repurchase agreements. The University follows industry standards and requires that securities underlying repur-chase agreements must have a fair value of at least 102% of the cost of the repurchase agreement. At June 30, 2006, theUniversity and the UROs had repurchase agreements of $37,600,000 and $1,663,000, respectively and the market value of secu-rities underlying these repurchase agreements was $39,185,000 and $1,663,000, respectively, at June 30, 2006.
Nearly all of the Entity’s investments are managed by external professional investment managers. Many of these investmentsare made through commingled investment vehicles such as common trust funds and mutual funds. A number of the invest-ment managers utilize derivatives in the execution of their investment strategies. In general, managers utilize derivatives toreduce or eliminate undesirable risks, to increase portfolio liquidity and flexibility or to increase investment return within thelevel of risk defined in the manager’s investment guidelines. Examples of authorized derivative transactions would be thehedging of foreign currency exposure through the use of currency forwards, owning mortgage securities with embedded prepay-ment options or utilizing treasury futures to change the duration of a fixed income portfolio. The Foundation invests in “To BeAnnounced” (TBA) GNMA and FNMA mortgage rolls. The Foundation does not intend to finance all of its TBA mortgage rolls.The Foundation reports its pending trades as accounts receivable and accounts payable on the gross basis. The Entity did notengage in any other significant derivative transactions during the year ended June 30, 2006.
The University, by the authorization of the Board of Trustees, increases its investment income by lending the University’s secu-rities, through its custodian, to independent third parties. Such loans are secured by collateral consisting of cash, cash equiva-lents or U.S. Government securities and irrevocable bank letters of credit in an amount not less than 102% of the fair value of thesecurities loaned. Any collateral securities cannot be pledged or sold by the University unless the borrower defaults. TheUniversity receives interest and dividends during the loan period as well as a fee from the custodian. At June 30, 2006, theUniversity has no credit risk exposure to borrowers because the amounts the University owes the borrowers exceed the amountsthe borrowers owe the University. As of June 30, 2006, approximately $212,997,000 of the investments reported on the University’sStatement of Net Assets were on loan, secured by collateral with a fair value of approximately $216,478,000.
Distributions are made from the University Endowment Fund to the University entities that benefit from the endowment funds.The endowment spending rule provides for an annual distribution of 4.75% of the two-quarter lagged, seven-year moving aver-age market value of fund units. At June 30, 2006 net appreciation of $11,712,000 is available to be spent, of which $11,022,000is restricted to specific purposes.
The Board develops University policy on investments and delegates the execution of those policies to its administrative agents.The University follows the State of Illinois Uniform Management of Institutional Funds Act when investing its endowment andoperating funds. The State of Illinois Public Funds Investment Act provides the context and framework for plant fund invest-ments. The following details the carrying value of the Entity’s investment portfolio as of June 30, 2006:

Interest Rate Risk: Interest rate risk is the risk that changes in interest rates will adversely affect the fair value of an investment. TheUniversity employs multiple investment managers, of which each has specific maturity assignments related to the operatingfunds. The funds are structured with different layers of liquidity. Funds expected to be used within one year are invested inmoney market instruments. Core operating funds are invested in longer maturity investments. Core operating funds invest-ment manager’s performance benchmarks are Lehman Brothers 1-3 year Government Credit Bond Index and the LehmanBrothers Intermediate Aggregate Bond Index. The University’s manager guidelines provide that the average weighted durationof the portfolio, including option positions, not vary from that of their respective performance benchmarks by more than +/-20percent. The Entity’s investments and maturities at June 30, 2006 are illustrated below:
At June 30, 2006, the University’s operating funds pool portfolio had an effective duration of 1.8 years.
34 • 2006 Annual Financial Report
UNIVERSITY CASH EQUIVALENTSAND INVESTMENTS
(in thousands)
Certificates of Deposit $ 846
U.S. Treasury Put 4,345
U.S.Treasury Bonds and Bills 192,003
U.S. Government Agencies 115,352
Commercial Paper 71,490
Corporate Bonds 126,641
Bond Mutual Funds 62,196
Non Government Mortgage Backed Securities 74,897
Non U.S. Government Bonds 3,971
Repurchase Agreements 37,600
Subtotal 689,341
US Equities 20,175
International Equities 39,241
U.S. Equity Mutual Funds 111,715
Limited Partnerships 3,744
Real Estate 138
Money Market Funds 246,753
Illinois Public Treasurer’s Investment Pool 1,198
TOTAL $ 1,112,305
URO CASH EQUIVALENTSAND INVESTMENTS
(in thousands)
Certificates of Deposit $ 33
U.S. and Other Government Securities 65,022
Municipal Bonds 331
Corporate Bonds and Notes 61,026
Mutual Funds - Bonds 125,579
Mutual Funds - Municipal Bonds 2,244
Mutual Funds - Blended Bonds 4,562
Repurchase Agreements 1,663
Subtotal 260,460
U.S. Equities 286,381
International Equities 174,385
Preferred Stock 6
Mutual Funds - Stocks 202,794
Mutual Funds - Bonds 10,582
Money Market Funds 27,967
Real Estate Trust and Partnerships 101,623
Other 3,698
TOTAL $ 1,067,896
UNIVERSITY INVESTMENT MATURITIES(in thousands)
GreaterTotal Less than 1 1 - 5 6 - 10 than 10
Certificates of Deposit $ 846 $ 846 $ $ $U.S. Treasury Put 4,345 4,345U.S.Treasury Bonds and Bills 192,003 112,050 59,434 18,380 2,139U.S. Government Agencies 115,352 27,284 27,822 4,872 55,374Commercial Paper 71,490 71,490Corporate Bonds 126,641 3,954 85,775 19,642 17,270Bond Mutual Funds 62,196 5,193 8,073 37,733 11.197Non Government Mortgage Backed Securities 74,897 566 1,259 73,072Non U.S. Government Bonds 3,971 3,512 459Repurchase Agreements 37,600 37,600
TOTAL $ 689,341 $ 262,762 $ 185,182 $ 82,345 $ 159,052

Credit Risk: Credit risk is the risk that an issuer or other counterparty to an investment will not fulfill its obligations. The University’spolicy requires that operating funds be invested in fixed income securities and money market instruments. Fixed income securitiesshall be rated investment grade or better by one or more nationally recognized statistical rating organizations. Securities notcovered by the investment grade standard are allowed if, in the manager’s judgment, those instruments are of comparable creditquality. Securities which fall below the stated minimum credit requirements subsequent to initial purchase may be held at themanager’s discretion. It is expected that the average credit quality of the operating funds will not fall below Standard & Poor’s AA-or equivalent. At June 30, 2006 the University and the UROs had debt securities and quality ratings as shown in the charts below:
2006 Annual Financial Report • 35
URO INVESTMENT MATURITIES(in thousands)
GreaterTotal Less than 1 1 - 5 6 - 10 than 10
Certificates of Deposit $ 33 $ 33 $ $ $U.S. and Other Government Securities 65,022 1,479 22,446 41,097Municipal Bonds 331 331Corporate Bonds and Notes 61,026 119 2,769 2,019 56,119Mutual Funds - Bonds 125,579 41,923 26,532 53,051 4,073Mutual Funds - Municipal Bonds 2,244 248 711 926 359Mutual Funds - Blended Bonds 4,562 3,586 976Repurchase Agreements 1,663 1,663
TOTAL $ 260,460 $ 43,986 $ 35,077 $ 79,749 $ 101,648
UNIVERSITY INVESTMENTS QUALITY RATINGS(in thousands)
Less than BBTotal AAA/Aaa AA/Aa A/BA BBB/Baa BB/Ba or Not Rated
Certificates of Deposit $ 846 $ $ $ $ $ $ 846U.S. Treasury Put 4,345 4,345U.S.Treasury Bonds and Bills 192,003 192,003U.S. Government Agencies 115,352 115,352Commercial Paper 71,490 71,490Corporate Bonds 126,641 27,272 6,205 39,583 35,434 9,704 8,443Bond Mutual Funds 62,196 46,655 1,651 1,905 4,032 6,525 1,428Non Government Mortgage
Backed Securities 74,897 70,823 856 555 2,663Non U.S. Government Bonds 3,971 767 1,455 290 1,459Repurchase Agreements 37,600 37,600
TOTAL $ 689,341 $ 524,362 $ 10,167 $ 42,333 $ 40,925 $ 16,229 $ 55,325
URO INVESTMENTS QUALITY RATINGS(in thousands)
Less than BBTotal AAA/Aaa AA/Aa A/BA BBB/Baa BB/Ba or Not Rated
Certificates of Deposit $ 33 $ $ $ $ $ $ 33U.S. Government Agencies 65,022 63,871 49 1,102Municipal Bonds 331 331Corporate Bonds and Notes 61,026 25,996 11,111 5,398 6,139 8,202 4,180Mutual Funds - Bonds 125,579 101,494 8,583 10,126 2,063 3,292 21Mutual Funds - Municipal Bonds 2,244 1,481 441 113 75 2 132Mutual Funds - Blended Bonds 4,562 263 3,863 412 24Repurchase Agreements 1,663 1,663
TOTAL $ 260,460 $ 193,436 $ 23,998 $ 16,098 $ 9,379 $ 11,496 $ 6,053
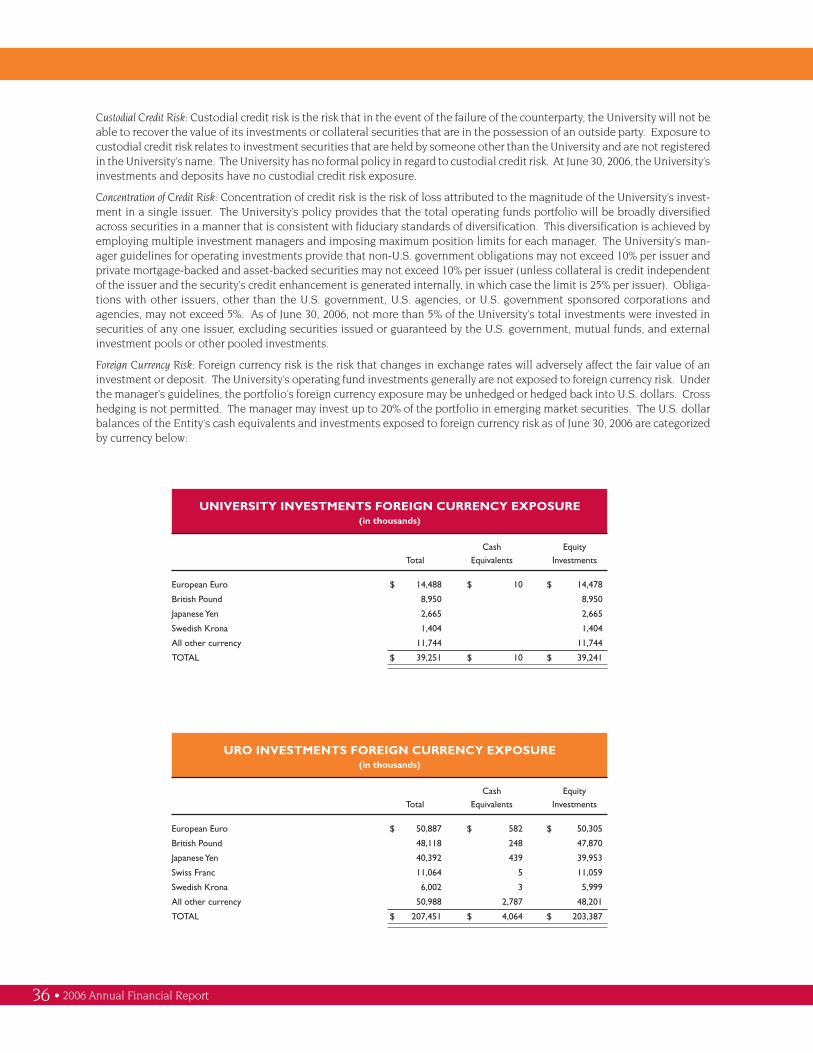
36 • 2006 Annual Financial Report
Custodial Credit Risk: Custodial credit risk is the risk that in the event of the failure of the counterparty, the University will not beable to recover the value of its investments or collateral securities that are in the possession of an outside party. Exposure tocustodial credit risk relates to investment securities that are held by someone other than the University and are not registeredin the University’s name. The University has no formal policy in regard to custodial credit risk. At June 30, 2006, the University’sinvestments and deposits have no custodial credit risk exposure.
Concentration of Credit Risk: Concentration of credit risk is the risk of loss attributed to the magnitude of the University’s invest-ment in a single issuer. The University’s policy provides that the total operating funds portfolio will be broadly diversifiedacross securities in a manner that is consistent with fiduciary standards of diversification. This diversification is achieved byemploying multiple investment managers and imposing maximum position limits for each manager. The University’s man-ager guidelines for operating investments provide that non-U.S. government obligations may not exceed 10% per issuer andprivate mortgage-backed and asset-backed securities may not exceed 10% per issuer (unless collateral is credit independentof the issuer and the security’s credit enhancement is generated internally, in which case the limit is 25% per issuer). Obliga-tions with other issuers, other than the U.S. government, U.S. agencies, or U.S. government sponsored corporations andagencies, may not exceed 5%. As of June 30, 2006, not more than 5% of the University’s total investments were invested insecurities of any one issuer, excluding securities issued or guaranteed by the U.S. government, mutual funds, and externalinvestment pools or other pooled investments.
Foreign Currency Risk: Foreign currency risk is the risk that changes in exchange rates will adversely affect the fair value of aninvestment or deposit. The University’s operating fund investments generally are not exposed to foreign currency risk. Underthe manager’s guidelines, the portfolio’s foreign currency exposure may be unhedged or hedged back into U.S. dollars. Crosshedging is not permitted. The manager may invest up to 20% of the portfolio in emerging market securities. The U.S. dollarbalances of the Entity’s cash equivalents and investments exposed to foreign currency risk as of June 30, 2006 are categorizedby currency below:
UNIVERSITY INVESTMENTS FOREIGN CURRENCY EXPOSURE(in thousands)
Cash EquityTotal Equivalents Investments
European Euro $ 14,488 $ 10 $ 14,478
British Pound 8,950 8,950
Japanese Yen 2,665 2,665
Swedish Krona 1,404 1,404
All other currency 11,744 11,744
TOTAL $ 39,251 $ 10 $ 39,241
URO INVESTMENTS FOREIGN CURRENCY EXPOSURE(in thousands)
Cash EquityTotal Equivalents Investments
European Euro $ 50,887 $ 582 $ 50,305
British Pound 48,118 248 47,870
Japanese Yen 40,392 439 39,953
Swiss Franc 11,064 5 11,059
Swedish Krona 6,002 3 5,999
All other currency 50,988 2,787 48,201
TOTAL $ 207,451 $ 4,064 $ 203,387

2006 Annual Financial Report • 37
NOTE 4 - ACCOUNTS, NOTES, AND PLEDGES RECEIVABLEThe Entity provides allowances for uncollectible accounts and notes receivable based upon management’s best estimate ofuncollectible accounts and notes at the Statement of Net Assets date, considering type, age, collection history of receivables,and any other factors as considered appropriate. Accounts receivable are reported net of allowances of $266,698,000 at June30, 2006. Notes receivable are reported net of allowances of $2,267,000 at June 30, 2006.
The composition of accounts receivable and notes and pledges receivable at June 30, 2006 is summarized as follows:
NOTE 5 - CAPITAL ASSETSNet interest cost incurred on borrowed funds during the period of construction of capital assets is capitalized as a componentof the cost of acquiring those assets. Net interest of $1,263,000 was capitalized during the year ended June 30, 2006.
Capital assets activity for the University and the UROs for the year ended June 30, 2006 is summarized as follows:
ACCOUNTS RECEIVABLE(in thousands)
Receivables from sponsoring agencies $ 163,655
Hospital and other medical activities 80,842
Student tuition and fees, net of allowances 22,342
Auxiliaries, net of discounts and allowances 9,251
Medical service plan 37,572
Educational activities 11,328
Other 1,258
TOTAL $ 326,248
NOTES AND PLEDGES RECEIVABLE(in thousands)
Student notes - University:
Student notes outstanding $ 58,415
Allowance for uncollectible loans (2,267)
Total student notes, net $ 56,148
Gift pledges outstanding - UROs:
Operations $ 22,850
Capital 12,699
Total gift pledges outstanding 35,549
Less:
Allowance and unamortized discount to present value (12,333)
Total pledges receivable, net $ 23,216
UNIVERSITY CAPITAL ASSETS(in thousands)
Beginning EndingBalance Additions Retirements Transfers Balance
Nondepreciable Capital Assets:
Land $ 119,631 $ 9,008 $ (6,788) $ $ 121,851
Construction in progress 230,729 197,758 (165,513) 262,974
Inexhaustible collections 13,681 338 14,019
Total nondepreciable capital assets 364,041 207,104 (6,788) (165,513) 398,844
Depreciable Capital Assets:
Buildings 2,486,514 (637) 152,531 2,638,408
Improvements and infrastructure 539,078 12,982 552,060
Equipment and software 1,054,881 68,971 (40,694) 1,083,158
Library materials 382,740 22,547 405,287
Subtotal 4,463,213 91,518 (41,331) 165,513 4,678,913
Less accumulated depreciation 1,959,874 185,105 (37,211) 2,107,768
Total net depreciable capital assets 2,503,339 (93,587) (4,120) 165,513 2,571,145
TOTAL $ 2,867,380 $ 113,517 $ (10,908) $ $ 2,969,989

38 • 2006 Annual Financial Report
NOTE 6 - ACCRUED SELF-INSURANCE, LOSS CONTINGENCY,AND COMPENSATED ABSENCESThe University’s accrued self-insurance liability of $142,214,000 at June 30, 2006 covers hospital patient liability; hospital andmedical professional liability; estimated general and contract liability; and workers’ compensation liability related to employ-ees paid from local funds. The accrued self-insurance liability was discounted at a rate of 6% at June 30, 2006. Amountsincreasing the accrued self-insurance liability are charged as expenses based upon estimates made by actuaries and the University’srisk management division. The workers’ compensation self-insurance liability of $10,059,000 at June 30, 2006 related to employ-ees who are paid from State appropriations is included in the University’s accounts payable. These claims will be paid fromState appropriations in the year in which the claims are finalized, rather than from unrestricted net assets as of June 30, 2006.
Accrued self-insurance includes $99,806,000 at June 30, 2006 for the currently estimated ultimate cost of uninsured medicalmalpractice liabilities. Ultimate cost consists of amounts estimated by the University’s risk management division and indepen-dent actuaries for asserted claims, unasserted claims arising from reported incidents, expected litigation expenses, and amountsdetermined by actuaries using relevant industry data and Hospital specific data to cover projected losses for claims incurred butnot reported. Because the amounts accrued are estimates, the aggregate claims actually incurred could differ significantly fromthe accrued self-insurance liability at June 30, 2006. Changes in these estimates will be reflected in the Statement of Revenues,Expenses and Changes in Net Assets in the period when additional information is available.
The University has contracted with several commercial carriers to provide varying levels and upper limits of excess indemnitycoverage. These coverages have been considered in determining the required accrued self-insurance liability. There were nosettlements which exceeded insurance coverage during the last three years.
URO CAPITAL ASSETS(in thousands)
Beginning EndingBalance Additions Retirements Transfers Balance
Nondepreciable Capital Assets:
Land $ 934 $ $ $ $ 934
Farmland 647 647
Buildings held for the University’s further use 8,964 (3,084) 5,880
Total nondepreciable capital assets 10,545 (3,084) 7,461
Depreciable Capital Assets:
Buildings 492 492
Leasehold improvements 92 92
Equipment and software 2,897 762 3,659
Subtotal 3,481 762 4,243
Less accumulated depreciation 2,212 328 2,540
Total net depreciable capital assets 1,269 434 1,703
TOTAL $ 11,814 $ 434 $ (3,084) $ $ 9,164
CHANGES IN ACCRUED SELF-INSURANCE(in thousands)
2006 2005
Balance, beginning of year $ 130,976 $ 98,038
Claims incurred and changes in estimates 45,563 79,137
Claim payments (34,325) (46,199)
Balance, end of year 142,214 130,976
Less current portion (34,105) (29,912)
Balance, end of year - noncurrent portion $ 108,109 $ 101,064

Accrued compensated absences includes personnel earned but unused vacation and sick leave days, including the University’sshare of social security and medicare taxes, valued at the current rate of pay.
NOTE 7 - BONDS AND NOTES PAYABLEOn February 2, 2006 the University issued UIC South Campus Development Project Revenue Bonds Series 2006A in the amountof $53,700,000 to refund in advance of maturity and defease all of the $49,365,000 outstanding principal amount of the UICSouth Campus Development Project Revenue Bonds Series 1999 and to pay costs incidental to the issuance of the Series 2006Abonds. The refunding resulted in savings of $5,500,000 over the life of the issue at a present value of approximately $4,950,000.The difference between the reacquisition price and the net carrying amount of the old debt, loss on refunding, was $4,189,000.This loss is deferred and amortized as a component of interest expense over the remaining life of the old debt or the life of thenew debt, whichever is shorter.
On August 10, 2005 the University issued Auxiliary Facilities System Revenue Bonds Series 2005B in the amount of $67,305,000.Series 2005B Bonds were issued to fund various additions and improvements to the System, to pay debt service during con-struction, and to pay all costs incidental to the issuance of the bonds.
Capital appreciation bonds of $280,055,000 outstanding at June 30, 2006 do not require current interest payments and have anet unappreciated value of $159,326,000. The University records the annual increase in the principal amount of these bonds asinterest expense and accretion on bonds payable.
The UIC South Campus Series 2006A Bonds, the Auxiliary Facilities System Series 2005B Bonds, and the Health Services Facili-ties System Series 1997B Bonds are variable rate bonds which bear interest at a defined weekly rate and are paid monthly. Therequired future interest payments for the Series 2006A, Series 2005B, and Series 1997B Bonds have been calculated using thecurrent interest rate, based upon short term tax exempt rates, of 3.98%, 3.95%, and 4%, respectively, over the life of the bonds.Other outstanding bond issues bear interest at fixed rates ranging from 2.25% to 7.96%.
2006 Annual Financial Report • 39
CHANGES INCOMPENSATED ABSENCES BALANCE
(in thousands)
Balance, beginning of year $ 206,075
Additions/(Deductions) 1,232
Balance, end of year 207,307
Less current portion (16,671)
Balance, end of year - noncurrent portion $ 190,636
BONDS PAYABLE(in thousands)
Principal
Maturity Beginning Paid/Debt Ending Current
Dates Balance New Debt Refunded Balance Portion
AUXILIARY FACILITIES SYSTEM -
Current Interest Bonds 2007-2035 $ 474,035 $ 67,305 $ 15,120 $ 526,220 $ 9,515
Capital Appreciation Bonds 2007-2030 283,945 3,890 280,055 15,015
WILLARD AIRPORT 2007-2009 970 225 745 235
HEALTH SERVICES FACILITIES SYSTEM 2007-2026 64,900 1,670 63,230 1,755
UIC SOUTH CAMPUS 2007-2023 79,330 53,700 52,540 80,490 3,190
$ 903,180 $ 121,005 $ 73,445 950,740 29,710
Unaccreted appreciation (120,729) (453)
830,011 29,257
Unamortized debt premium 21,266 790
Unamortized loss on refunding (16,565) (914)
TOTAL $ 834,712 $ 29,133

40 • 2006 Annual Financial Report
To facilitate the advance refunding of the UIC South Campus Development Project Series 1999 Bonds and, as a means to lowerits borrowing costs, when compared against fixed-rate bonds at the time of issuance in February 2006, the University enteredinto two interest rate swaps in connection with its $53,700,000 variable-rate Bonds (UIC South Campus Development Project)Series 2006A. The intention of the swaps was to effectively change the University’s variable interest rate on the Bonds to asynthetic fixed rate of 1.030% through August 1, 2007 and 4.292% thereafter, which includes the Bonds’ current liquidity facilityfee. In addition, there is a 0.070% current remarketing fee.
The Bonds and related swap agreements mature on January 15, 2022, and the swaps’ initial notional amount of $53,700,000matches the $53,700,000 variable-rate Bonds. The swaps were entered at the same time as the Bonds were issued (February2006). Starting in fiscal year 2011, the notional value of the swaps and the principal amount of the associated bonds decline.Under the swaps, the University pays the counterparties a fixed payment of 0.830% through August 1, 2007 and 4.092% there-after and receives a variable payment equal to its cost-of-funds through February 3, 2010 and thereafter receives a variablepayment equal to 68% of LIBOR. The counterparty credit rating by Standard & Poor’s was AA- and by Moody’s InvestorsService was Aa2 for the first Counterparty. The counterparty credit rating by Standard & Poor’s was A+ and by Moody’sInvestors Service was Aa3 for the second Counterparty.
The University engaged a third-party consultant to calculate the “mark to market” or “market value” of the swap transaction.On June 30, 2006, the combined mark to market value of the two swaps was $1,129,000. Since this is a positive number itrepresents an approximation of the amount of money that a swap provider may have been willing to pay the University toterminate the swap. In accordance with governmental accounting standards, this amount is not required to be included in theaccompanying financial statements.
The University has the option to terminate the swap early. The University or the counterparties may terminate the swaps if theother party fails to perform under the terms of the contract. The University may terminate the swap if both credit ratings of thecounterparties fall below BBB+ as issued by Standard & Poor’s and Baa1 as issued by Moody’s Investors Service. If the swaps areterminated, the variable-rate Bonds would no longer carry a synthetic fixed interest rate. Also, if at the time of termination, theswaps have a negative fair value, the University would be liable to the counterparties for a payment equal to the swaps’ fair value.
Using the actual rate of 3.980% in effect as of June 30, 2006, debt service requirements of the variable-rate debt and net swappayments, assuming current interest rates remain the same for their term, were as follows. As rates vary, variable-rate bondinterest payments and net swap payments will also vary.
None of the University’s bonds described above constitute obligations of the State of Illinois. Series 1979, Series 1991, Series1993, Series 1996, Series 1999A, Series 1999B, Series 2000, Series 2001A, Series 2001B, Series 2001C, Series 2003A, Series 2005A,and Series 2005B Auxiliary Facilities System Bonds are payable solely from net revenues of the Auxiliary Facilities System,student tuition and fees and certain restricted plant funds. Series 1997 Bonds are payable solely from the net revenues of theAirport and related restricted plant funds. Series 1997A and 1997B Bonds are payable solely from net revenues of the HealthSystem, Medical Service Plan revenue net of bad debt expense, and College of Medicine net tuition revenue. Series 2000, Series2003, and 2006A Bonds are payable from revenue derived from the defined tax increment financing (TIF) district, student tuitionand fees, and funds on deposit in the Bond and Interest Sinking Fund. In addition, the Series 2000 Bonds are payable from thesales proceeds derived from the sale of certain land in the University of Illinois UIC South Campus Development Project.
VARIABLE-RATE DEBT SERVICE REQUIREMENTS(in thousands)
Variable-Rate Bonds
Principal Interest Swaps, Net Total
2007 $ $ 2,138 $ (1,692) $ 446
2008 2,143 (238) 1,905
2009 2,137 60 2,197
2010 2,137 60 2,197
2011 215 2,133 61 2,409
2012-2016 16,490 9,475 309 26,274
2017-2021 29,950 4,585 222 34,757
2022-2025 7,045 153 27 7,225
TOTAL $ 53,700 $ 24,901 $ (1,191) $ 77,410
Interest Rate

DEBT SERVICE REQUIREMENTS(in thousands)
Principal Interest
2007 $ 29,710 $ 32,078
2008 30,305 32,804
2009 31,640 32,098
2010 32,540 31,183
2010 33,710 30,247
2012-2016 191,810 135,185
2017-2021 231,535 104,360
2022-2026 164,695 65,088
2027-2031 141,445 30,809
2032-2036 63,350 5,521
TOTAL $ 950,740 $ 499,373
2006 Annual Financial Report • 41
CHANGE IN NOTES PAYABLE(in thousands)
Balance, beginning of year $ 9,875
Payments (3,218)
Balance, end of year $ 6,657
During fiscal year 2006, the debt service payments related to the Series 1999, Series 2000, Series 2003, and Series 2006A Bondswere $8,194,000. Proceeds from the sale of land of $1,787,000 and revenue from other legally available sources of $6,407,000funded these payments.
Costs associated with the issuance of the Series 1991, Series 1993, Series 1996, Series 1999A, Series 1999B, Series 2000, Series2001A, Series 2001B, Series 2001C, Series 2003A, Series 2005A and Series 2005B Auxiliary Facilities System Bonds; Series 1997Willard Airport Bonds; Series 1997A and Series 1997B Health Services Facilities Bonds; and Series 2000, Series 2003 andSeries 2006A UIC South Campus Bonds have been recorded as deferred charges and are being amortized over the life of therelated bond issue.
The Foundation has a demand note outstanding with interest at 5.27% and principal outstanding of $6,657,000. The changein the balance for fiscal year 2006 is as follows:
ADVANCE REFUNDED BONDS(in thousands)
Outstanding atSeries June 30, 2006
1978-M $ 40,735
1996 43,110
1999 49,365
1999A 85,300
2000 10,785
2001B 3,625
TOTAL $ 232,920
The University has defeased bonds through advanced funding in prior years and, accordingly, they are not reflected in theaccompanying statements. The amount of bonds which have been defeased as of June 30, 2006 consists of the following:
Future debt service requirements for all bonds outstanding at June 30, 2006 are as follows:
Certain bonds of the University have debt service requirements. The Maximum Annual Net Debt Service for those bonds, asdefined, is $15,490,000.

42 • 2006 Annual Financial Report
NOTE 8 - LEASEHOLDS AND OTHER OBLIGATIONSLeaseholds payable and other obligations activity for the year ended June 30, 2006 consist of the following:
The University leases various plant facilities and equipment under capital leases. This includes assets obtained with certificatesof participation proceeds and recorded as capital leases as well as other capital lease agreements funded through operations.
On June 6, 2006 the University issued Certificates of Participation (Academic Facilities Projects) Series 2006A in the amount of$81,930,000. The Series 2006A Certificates were issued to acquire, construct and install, and equip a business instructionalfacility on the Urbana Campus and to finance various improvements to buildings on the University’s three campuses.
To facilitate the advance refunding of the Certificates of Participation (Utility Infrastructure Projects) Series 2001 A & B; and, asa means to lower its borrowing costs, when compared against fixed-rate bonds at the time of issuance in March 2004, theUniversity entered into an interest rate swap in connection with its $143,665,000 variable-rate Certificates of Participation(Utility Infrastructure Projects) Series 2004. The intention of the swap was to effectively change the University’s variable interestrate on the Certificates to a synthetic fixed rate of 4.059%, which includes the Certificates’ current liquidity facility fee. Inaddition, there is a 0.05% current remarketing fee.
The Certificates and related swap agreement mature on August 15, 2021, and the swap’s initial notional amount of $143,665,000matches the $143,665,000 variable-rate Certificates. The swap was entered at the same time as the Certificates were issued(March 2004). Starting in fiscal year 2006, the notional value of the swap and the principal amount of the associated Certificatesdecline. Under the swap, the University pays the counterparty a fixed payment of 3.765% and receives a variable paymentcomputed as 100% of the Bond Market Association Municipal Swap Index TM (BMA). Conversely, the Certificates’ variableinterest rates are expected to approximate BMA. Since issuance, the Certificates’ average variable interest rate has been 0.01%below BMA. The counterparty credit rating by Standard & Poor’s was A+ and by Moody’s Investors Service was Aa3.
The University engaged a third-party consultant to calculate the “mark to market” or “market value” of the swap transaction. OnJune 30, 2006, the mark to market value of the swap was $4,747,000. Since this is a positive number, it represents an approxima-tion of the amount of money that a swap provider may have been willing to pay the University to terminate the swap. Inaccordance with governmental accounting standards, this amount is not required to be included in the accompanying financialstatements.
LEASEHOLDS AND OTHER OBLIGATIONS(in thousands)
Beginning Ending CurrentBalance Additions Deductions Balance Portion
University:
Certificates of Participation $ 407,475 $ 81,930 $ (22,105) $ 467,300 $ 26,530
Unamortized debt premium 12,868 1,735 (1,403) 13,200 1,487
Unamortized deferred loss on refunding (16,808) 1,222 (15,586) (1,222)
403,535 83,665 (22,286) 464,914 26,795
Other capital leases 52,411 8,131 (5,157) 55,385 5,587
Environmental remediation liability 7,141 (2,417) 4,724 309
Total University $ 463,087 $ 91,796 $ (29,860) $ 525,023 $ 32,691
UROs:
Annuities payable $ 50,043 $ 1,647 $ $ 51,690 $ 7,331
Other liabilities 6,766 (106) 6,660
Total UROs $ 56,809 $ 1,647 $ (106) $ 58,350 $ 7,331
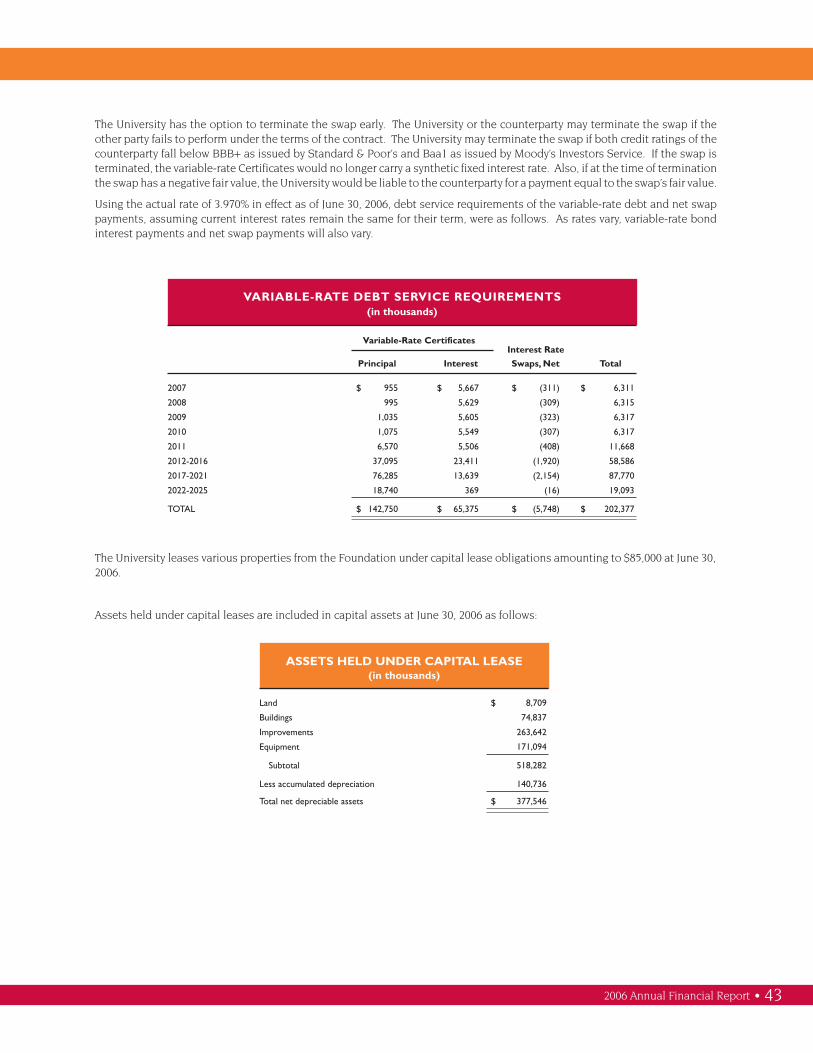
2006 Annual Financial Report • 43
The University has the option to terminate the swap early. The University or the counterparty may terminate the swap if theother party fails to perform under the terms of the contract. The University may terminate the swap if both credit ratings of thecounterparty fall below BBB+ as issued by Standard & Poor’s and Baa1 as issued by Moody’s Investors Service. If the swap isterminated, the variable-rate Certificates would no longer carry a synthetic fixed interest rate. Also, if at the time of terminationthe swap has a negative fair value, the University would be liable to the counterparty for a payment equal to the swap’s fair value.
Using the actual rate of 3.970% in effect as of June 30, 2006, debt service requirements of the variable-rate debt and net swappayments, assuming current interest rates remain the same for their term, were as follows. As rates vary, variable-rate bondinterest payments and net swap payments will also vary.
The University leases various properties from the Foundation under capital lease obligations amounting to $85,000 at June 30,2006.
Assets held under capital leases are included in capital assets at June 30, 2006 as follows:
VARIABLE-RATE DEBT SERVICE REQUIREMENTS(in thousands)
Variable-Rate Certificates
Principal Interest Swaps, Net Total
2007 $ 955 $ 5,667 $ (311) $ 6,311
2008 995 5,629 (309) 6,315
2009 1,035 5,605 (323) 6,317
2010 1,075 5,549 (307) 6,317
2011 6,570 5,506 (408) 11,668
2012-2016 37,095 23,411 (1,920) 58,586
2017-2021 76,285 13,639 (2,154) 87,770
2022-2025 18,740 369 (16) 19,093
TOTAL $ 142,750 $ 65,375 $ (5,748) $ 202,377
Interest Rate
ASSETS HELD UNDER CAPITAL LEASE(in thousands)
Land $ 8,709
Buildings 74,837
Improvements 263,642
Equipment 171,094
Subtotal 518,282
Less accumulated depreciation 140,736
Total net depreciable assets $ 377,546

The University monitors environmental matters and records an estimated liability for identified environmental remediationcosts. The estimated liability at June 30, 2006 is $4,724,000.
The University also leases various buildings and equipment under operating lease agreements. Total rental expense underthese agreements was $9,769,000 for the year ended June 30, 2006. The future mininum lease payments (excluding those leasesrenewed on an annual basis) are as follows:
As of June 30, 2006, future minimum lease payments under capital leases is as follows:
At June 30, 2006, the Foundation had annuities payable outstanding of $51,690,000. Annuities payable represent an actuarialcomputation of the present value of future payments to annuitants.
44 • 2006 Annual Financial Report
The net present value of outstanding capital leases at June 30, 2006 is:
OUTSTANDING CAPITAL LEASES(in thousands)
Certificates of Participation
Series 1997 Utility Infrastructure $ 19,900
Series 2001 UI Integrate 86,285
Series 2003 South Farms 23,280
Series 2003 UI Integrate 31,700
Series 2003 Utility Infrastructure 61,550
Series 2004 Utility Infrastructure 142,750
Series 2005 College of Medicine 19,905
Series 2006A Academic Facilities 81,930
Other capital leases 55,385
NET PRESENT VALUE $ 522,685
FUTURE MINIMUMOPERATING LEASE PAYMENTS
(in thousands)
2007 $ 7,844
2008 5,894
2009 4,275
2010 2,925
2011 1,382
2012-2016 2,344
TOTAL $ 24,664
FUTURE MINIMUM LEASE PAYMENTSUNDER CAPITAL LEASES
(in thousands)
2007 $ 54,611
2008 53,321
2009 52,439
2010 51,660
2011 51,058
2012-2016 214,506
2017-2021 154,798
2022-2026 86,000
Total minimum lease payments 718,393
Amount representing interest (195,708)
NET PRESENT VALUE $ 522,685

2006 Annual Financial Report • 45
NOTE 9 - NET ASSETS As discussed in Note 1 to the financial statements, the Entity’s net assets are classified for accounting and reporting purposesinto one of four net asset categories according to externally imposed restrictions. The following tables include detail of the netasset balances for the University and the UROs including major categories of restrictions and internal designations of unre-stricted funds.
URO NET ASSETS(in thousands)
Invested in capital assets, net of related debt $ 2,507
Restricted - nonexpendable
Invested in perpetuity to produce income expendable for -
scholarships, fellowships and research 703,487
Restricted - expendable for -
Scholarships, fellowships and research 328,947
Unrestricted 23,819
TOTAL $ 1,058,760
UNIVERSITY NET ASSETS(in thousands)
Invested in capital assets, net of related debt $ 1,834,372
Restricted - nonexpendable
Invested in perpetuity to produce income expendable for -
scholarships, fellowships and research 45,520
Restricted - expendable for -
Scholarships, fellowships and research 217,487
Loans 77,938
Service plans 45,488
Retirement of indebtedness 23,686
Unrestricted
Designated for:
Auxiliary 26,457
Hospital 54,181
Capital projects 56,795
Self supporting activities 9,687
Institutional Support 77,273
Quasi endowments 91,124
Amount expected to be financed in future years (190,923)
Undesignated 900
TOTAL $ 2,369,985

46 • 2006 Annual Financial Report
NOTE 10 - FUNDS HELD IN TRUST BY OTHERSThe University and Foundation are income beneficiaries of several irrevocable trusts which are held and administered byoutside trustees. The University and Foundation have no control over these funds as to either investment decisions or incomedistributions, thus the principal is not recorded in the accompanying financial statements. The fair value of these funds atJune 30, 2006 and the amount of income received from these trusts during the year then ended were as follows:
NOTE 11 - STATE UNIVERSITIES RETIREMENT SYSTEMThe Entity contributes to the State Universities Retirement System of Illinois (SURS), a cost-sharing multiple-employer de-fined-benefit pension plan with a special funding situation whereby the State of Illinois makes substantially all actuariallydetermined required contributions on behalf of the participating employers. SURS was established July 21, 1941, to provideretirement annuities and other benefits for staff members and employees of the State universities, certain affiliated organiza-tions, and certain other State educational and scientific agencies and for survivors, dependents, and other beneficiaries ofsuch employees. SURS is considered a component unit of the State of Illinois’ financial reporting entity and is included in theState’s financial reports as a pension trust fund. SURS is governed by Section 5/15, Chapter 40, of the Illinois Compiled Statutes.SURS issues a publicly available financial report that includes financial statements and required supplementary information.That report may be obtained by writing to SURS, 1901 Fox Drive, Champaign, IL 61820 or by calling 1-800-275-7877.
Eligible employees must participate upon initial employment. Employees are ineligible to participate if (a) employed afterhaving attained age 68; (b) employed less than 50% of full-time; or (c) employed less than full-time and attending classes withan employer. Of those Entity employees ineligible to participate, the majority are students at the University.
SURS provides retirement, disability and death benefits. Members are eligible for normal retirement at any age after 35 years ofservice, at age 60 after 8 years of service or at age 62 after 5 years of service. There are also provisions for early retirement.Retirement benefits are based on certain formulas that generally are a function of years of service and the average salary based onthe highest earnings of any four consecutive years. Disability benefits are paid to disabled members with two years of coveredservice, generally at 50% of basic compensation until the total benefits paid equal 50% of the total earnings in covered service.Death benefits are payable to survivors of an active member with one and one half years of covered service or of a former memberwith ten years of covered service. These benefits are payable until children attain the age of 18, to a spouse after age 50 and to adependent parent after age 55. Benefits are equal to the retirement contributions and interest, a lump sum payment of $1,000,and a monthly annuity equal to a portion of the accrued normal retirement benefit based on specified formulas.
Plan members are required to contribute 8.0% of their annual covered salary and substantially all employer contributions aremade by the State of Illinois on behalf of the individual employers at an actuarially determined rate. The current rate is 10.18%of annual covered payroll. The contribution requirements of plan members and employers are established and may be amendedby the Illinois General Assembly. The University’s contributions to SURS for the years ended June 30, 2006, 2005, and 2004were $101,570,000, $145,752,000 and $755,398,000 respectively, equal to the required contributions for each year. The 2004contribution includes an annual calculated contribution of $158,153,000 and additional funding from the State of Illinois of$597,245,000. The Foundation’s contributions to SURS for the years ended June 30, 2006, 2005, and 2004 were $521,000,$475,000 and $418,000 respectively.
Entity employees hired prior to April 1, 1986 are exempt from contributions required under the Federal Insurance ContributionAct. Employees hired after March 31, 1986 are required to contribute 1.45% of their gross salary for Medicare. The Entity isrequired to match this contribution.
Employees may also elect to participate in certain tax-sheltered retirement plans. These voluntary plans permit employees todesignate a part of their earnings into tax-sheltered investments and thus defer federal and state income taxes on theircontributions and the accumulated earnings under the plans. Participation and the level of employee contributions arevoluntary. The employer is not required to make contributions to these plans.
FUNDS HELD IN TRUST BY OTHERS(in thousands)
University Foundation
Fair value of funds held in trust by others $ 40,408 $ 26,709
Income received from funds held in trust by others $ 1,087 $ 907

2006 Annual Financial Report • 47
NOTE 12 - POSTEMPLOYMENT BENEFITSIn addition to providing pension benefits, the State provides certain health, dental and life insurance benefits to annuitants who areformer State employees. This includes annuitants of the Entity. Substantially all State employees, including the employees of the Entity,may become eligible for postemployment benefits if they eventually become annuitants. Health and dental benefits include basicbenefits for annuitants under the State’s self-insurance plan and insurance contracts currently in force. Life insurance benefits forannuitants under age 60 are equal to their annual salary at the time of retirement; life insurance benefits for annuitants age 60 and olderare limited to $5,000 per annuitant.
Currently, the State does not segregate payments made to annuitants from those made to current employees for health, dental and lifeinsurance benefits. The cost of health, dental and life insurance benefits is recognized by the State as incurred. These costs are fundedby the State except for certain non-appropriated funds funded by the University.
NOTE 13 - COMMITMENTS AND CONTINGENCIESAt June 30, 2006 the University had commitments on various construction projects and contracts for repairs and renovation of facilitiesof approximately $152,112,000.
The University receives monies from federal and state government agencies under grants and contracts for research and other activities.The costs, both direct and indirect, charged to these grants and contracts are subject to audit and disallowance by the granting agency.The University believes that any disallowances or adjustments would not have a material effect on the University’s financial position.
The University also receives monies under third-party payor arrangements for payment of medical services rendered at its hospital andclinics. Some of these arrangements allow for settlement adjustments based on costs and other factors. The University believes that anyadjustments would not have a material effect on the University’s financial position.
The University is a defendant in a number of legal actions primarily related to medical malpractice. These legal actions have beenconsidered in estimating the University’s accrued self-insurance liability. The total of amounts claimed under these legal actions, includ-ing potential settlements and amounts relating to losses incurred but not reported, could exceed the amount of the self-insuranceliability. In the opinion of the University’s administrative officers, the University’s self-insurance liability and limited excess indemnityinsurance coverage from commercial carriers are adequate to cover the ultimate liability of these legal actions, in all material respects.
NOTE 14 - PRIOR PERIOD ADJUSTMENTDuring fiscal year 2006, the University reviewed and corrected its calculation of accrued compensated absences. The accompanyingfinancial statements for 2005 have been restated to correct the calculation errors. The effect of this restatement was to decrease operat-ing expenses and increase net assets by $199,000 for the fiscal year ended June 30, 2005. The net assets at the beginning of 2005decreased by $11,837,000, which was restated to reflect an increase in the accrued compensated absences as of June 30, 2004.
UNIVERSITY PRIOR PERIOD ADJUSTMENT(in thousands)
2006 2005
Net assets beginning of year $ 2,309,084 $ 2,278,378
Prior period adjustment (11,837)
Net assets beginning of year, as restated $ 2,309,084 $ 2,266,541

NOTE 15 - OPERATING EXPENSES BY NATURAL CLASSIFICATIONOperating expenses by natural classification for the year ended June 30, 2006 for the University and the UROs are summarizedas follows:
48 • 2006 Annual Financial Report
UNIVERSITY OPERATING EXPENSES BY NATURAL CLASSIFICATION(in thousands)
Compensation Supplies andand benefits services Student aid Depreciation Total
Instruction $ 567,006 $ 95,903 $ 3,291 $ $ 666,200
Research 368,371 185,901 2,602 556,874
Public service 179,154 120,152 1,684 300,990
Academic support 140,795 72,725 4,523 218,043
Student services 52,271 28,269 2,116 82,656
Institutional support 116,801 33,637 134 150,572
Operations and maintenance of plant 66,877 162,158 3 229,038
Scholarships and fellowships 167,252 797 17,106 185,155
Payments on behalf of the University 327,927 327,927
Auxiliary enterprises 77,539 146,186 6,210 229,935
Hospital and medical activities 224,280 182,182 4 406,466
Independent operations 1,687 7,952 9,639
Depreciation 185,105 185,105
TOTAL $ 2,289,960 $ 1,035,862 $ 37,673 $ 185,105 $ 3,548,600
URO OPERATING EXPENSES BY NATURAL CLASSIFICATION(in thousands)
Distribution onbehalf of the InstitutionalUniversity support Depreciation Total
Salaries and benefits $ $ 16,894 $ $ 16,894
Distributions on behalf of the University 127,279 127,279
Marketing and communications 5,285 5,285
Travel 964 964
Equipment 378 378
Meeting, conferences and special events 964 964
Supplies and other 10,728 10,728
Depreciation 328 328
TOTAL $ 127,279 $ 35,213 $ 328 $ 162,820

NOTE 16 - SEGMENT INFORMATIONThe following financial information represents identifiable activities for which one or more revenue bonds is outstanding. TheAuxiliary Facilities System is comprised of University owned housing units, student unions, recreation and athletic facilities,and similar auxiliary service units including parking. The Health Services Facilities System is comprised of the University ofIllinois Hospital and associated clinical facilities providing patient care. The Willard Airport Facility is comprised of land,hangars, a terminal building, parking lots, runways, and related apron areas.
(in thousands)
HEALTHAUXILIARY SERVICES WILLARDFACILITIES FACILITIES AIRPORT
SYSTEM SYSTEM FACILITY TOTAL
Condensed Statement of Net Assets
ASSETS:
Current assets $ 236,869 $ 135,592 $ 1,695 $ 374,156
Noncurrent assets
Capital assets, net of accumulated depreciation 575,683 181,513 31,269 788,465
Other noncurrent assets 30,761 3,068 279 34,108
TOTAL ASSETS $ 843,313 $ 320,173 $ 33,243 $ 1,196,729
LIABILITIES
Current liabilities $ 72,552 $ 63,285 $ 1,187 $ 137,103
Noncurrent liabilities
Long term debt 673,921 77,742 509 752,093
Other liabilities 5,291 19,536 24,827
TOTAL LIABILITIES 751,764 160,563 1,696 914,023
NET ASSETS:
,Invested in capital assets, net of related debt (1,536) 101,997 30,524 130,675
Restricted
Expendable 16,304 2,436 408 19,148
Unrestricted 76,781 55,177 615 132,883
TOTAL NET ASSETS 91,549 159,610 31,547 282,706
TOTAL LIABILITIES AND NET ASSETS $ 843,313 $ 320,173 $ 33,243 $ 1,196,729
Condensed Statement of Revenues, Expenses and Changes
in Net Assets
Operating revenues $ 227,035 $ 532,464 $ 2,539 $ 762,127
Operating expenses 203,227 504,404 2,770 710,490
Depreciation expense 16,601 19,073 1,727 37,401
Operating income (loss) 7,207 8,987 (1,958) 14,236
Nonoperating revenues (expenses) (13,018) (5,143) 526 (17,635)
Capital and endowment additions 664 664
Increase (decrease) in net assets (5,811) 3,844 (768) (2,735)
Net assets, beginning of year 97,360 155,766 32,315 285,441
NET ASSETS, END OF YEAR $ 91,549 $ 159,610 $ 31,547 $ 282,706
Condensed Statement of Cash Flows
Net cash flows provided (used) by operating activities $ 35,949 $ 37,059 $ (113) $ 72,895
Net cash flows provided by noncapital financing activities 1,509 142 424 2,075
Net cash flows used by capital and related financing activities (40,581) (31,616) (549) (72,746)
Net cash flows provided by investing activities 8,475 1,138 21 9,634
Net increase (decrease) in cash and cash equivalents 5,352 6,723 (217) 11,858
Cash and cash equivalents, beginning of year 78,303 40,081 1,007 119,391
Cash and cash equivalents, end of year $ 83,655 $ 46,804 $ 790 $ 131,249
2006 Annual Financial Report • 49

NOTE 17 - UNIVERSITY RELATED ORGANIZATIONSThe Entity’s financial statements include the activity of the University Related Organizations which represent the discretelypresented component units. Below are condensed financial statements by organization:
(in thousands)
ALUMNI
FOUNDATION ASSOCIATION WWT TOTAL
Condensed Statement of Net Assets
Assets:
Current assets $ 28,630 $ 2,168 $ 1,906 $ 32,704
Noncurrent assets
Capital assets, net of accumulated depreciation 8,183 641 340 9,164
Other noncurrent assets 1,120,517 14,436 1,134,953
Total assets $ 1,157,330 $ 17,245 $ 2,246 $ 1,176,821
Liabilities:
Current liabilities $ 55,743 $ 2,355 $ 2,124 $ 60,222
Noncurrent liabilities
Long term debt 3,986 2,788 6,774
Other noncurrent liabilities 51,056 9 51,065
Total liabilities 106,799 6,350 4,912 118,061
Net assets:
Invested in capital assets, net of related debt 1,526 641 340 2,507
Restricted
Nonexpendable 703,487 703,487
Expendable 328,947 328,947
Unrestricted 16,571 10,254 (3,006) 23,819
Total net assets 1,050,531 10,895 (2,666) 1,058,760
Total liabilities and net assets $ 1,157,330 $ 17,245 $ 2,246 $ 1,176,821
Condensed Statement of Revenues, Expenses and Changes
in Net Assets
Operating revenues $ 140,053 $ 8,220 $ 6,291 $ 154,564
Operating expenses 148,277 8,706 5,509 162,492
Depreciation expense 106 21 201 328
Operating income (loss) (8,330) (507) 581 (8,256)
Nonoperating revenues (expenses) 92,591 (4,668) (112) 87,811
Contributions to endowments 31,397 31,397
Increase in net assets 115,658 (5,175) 469 110,952
Net assets, beginning of year 934,873 16,070 (3,135) 947,808
Net assets, end of year $ 1,050,531 $ 10,895 $ (2,666) $ 1,058,760
Condensed Statement of Cash Flows
Net cash flows provided (used) by operating activities $ (20,439) $ 753 $ 834 $ (18,852)
Net cash flows provided (used) by noncapital financing activities 31,397 (478) 30,919
Net cash flows used by capital and related financing activities (991) (2,043) (117) (3,151)
Net cash flows provided (used) by investing activities (10,369) 1,560 (134) (8,943)
Net increase (decrease) in cash and cash equivalents (402) 270 105 (27)
Cash and cash equivalents, beginning of year 3,306 1,597 1,618 6,521
Cash and cash equivalents, end of year $ 2,904 $ 1,867 $ 1,723 $ 6,494
NOTE 18 - SUBSEQUENT EVENTSOn September 13, 2006, the University sold Auxiliary Facilities System Revenue Bonds Series 2006 in the amount of $318,155,000.The anticipated closing date is October 5, 2006. The proceeds of the Series 2006 Bonds will be used to fund various improve-ments and additions to the System, fund the cost of refunding portions of the outstanding Auxiliary Facilities System RevenueBonds, pay a portion of the interest during construction, and to pay all costs incidental to the issuance of the bonds.
This information is an integral part of the accompanying financial statements.
50 • 2006 Annual Financial Report


Printed by the authority of the State of Illinois
October 2006
Copies Printed .......................................... 1,750
Total Cost ................................................ $7,799
Cost per Copy ........................................... $4.46
Printed by Illinois Graphics
Graphic Design by Jody Boles