2006 TIDEWATER -...
93
Celebrating 50 Years 2006 TIDEWATER
Transcript of 2006 TIDEWATER -...

Celebrating 50 Years
2006 TIDEWATER


1956-2006
Celebrating 50 Years
rom humble beginnings in a one-room, rentedoffice with one boat and a few employees, to aglobal mega-corporation with operations in over
60 countries, over 500 vessels of all shapes and sizes, and morethan 7,000 employees from over 70 countries, Tidewaterhas been through a lot in the past fifty years.
And it all started with an idea.Alden J. Laborde, known as “Doc” to virtually everyone,
was a seagoing man from his youngest days. As a graduate ofthe United States Naval Academy, Doc had just finished hisfirst tour of duty on the battleship USS Tennessee and hadjust begun a business career when Pearl Harbor was attacked,sending America full-force into World War II. During the war,Doc served his country well on a sub-chaser, a destroyerescort, and finally, as commander of a destroyer escort. After
the war, he retired from the Navy with the rank ofCommander, and set out to see what the business world wasall about.
After a stint with famous Texas oilman Sid Richardsonsupervising the building of what are now called “swampbarges”, basically a submersible barge for marshy operations,Doc landed a job as Marine Superintendent for Kerr-McGeeOil Company, which served as his entrée into the oil and gasbusiness, and where he would begin to effect changes thatwould alter the process of drilling for oil and gas forever. Afterassisting Kerr-McGee in developing barges that could drill foroil in shallow waters offshore, Laborde, along with a fewfriends, including Charlie Murphy, founder of Murphy OilCo., founded a drilling company called ODECO (OceanDrilling and Exploration Co.). Using financing provided by
F
1

1955Ten investors build theEbb Tide, the first oiland gas service vessel.
1956Tidewater Marine Service,Inc. a public company,opens for business inthe U.S. Gulf of Mexico.
1958Internationaloperationsbegin in LakeMaracaibo,Venezuela.
1966Fleet expandsto more than200 vessels atwork in theUnited States,South America,Central Americaand West Africa.
1968Tidewateracquires Twenty GrandMarine increasing itsfleet to 350 vessels.
1970The New York andPacific Stock Exchangeslist Tidewater as tickersymbol “TDW”; Tidewateralso acquires interest inoil production in watersoff of Indonesia.
1974Tidewater engages in afleet expansion programunprecedented in theindustry through newconstruction and vesselcompany acquisitions.
1977May 13, 1977 shareholdersvote to approve theBoard’s recommendationto change the name ofthe corporation toTidewater Inc. Duringthe year, the vesselconstruction programadds 13 new U.S.flag vessels to theTidewater fleet at acost of $40.2 million.
History Of Tidewater

Charles Murphy, and experience gained in theNavy, Doc invented, in 1951, the first ever freestanding offshore drilling rig named the Mr.Charlie in honor of its chief backer. ODECOwent on to become the operator of an entire fleetof offshore drilling rigs, and remained under thecontrol of Doc Laborde, its’ CEO; and MurphyOil (which retained a 51% interest in ODECO).A new industry had been forged — one which,in just a little more than half a century, wouldgrow to become the most important means ofextracting hydrocarbons from offshore drillingbasins around the world.
It was during the early days of ODECO thatDoc noticed a real need for a custom-designedvessel to serve the burgeoning numbers of offshorerigs being utilized off the Louisiana and Texascoasts.
Laborde figured that oil companies would wantthese rigs to be supplied on a regular basis, andthere were no real vessels to do that, other thanfishing boats and World War II surplus vessels,which were not really well-suited for the job.
“It occurred to me at the time that we neededto design a boat specifically for the offshore servicebusiness,” said Laborde recently. “The biggest changefrom what I would call a conventional design wasto move the living quarters, pilot house, andcontrols of the vessel from the back of the boat tothe front, leaving the stern area completely clearfor cargo. This was a pretty radical idea at the time,and I’m sure people thought I was crazy inventingthis strange-looking craft. But to almost every-one’s surprise, it very quickly became acceptedbecause its advantages were so obvious.”
When he saw that the new vessel design wascatching on, he decided that a new companyneeded to be formed to handle this end of thebusiness. That’s when he got ten of his friendsto invest $10,000 each and form what wouldeventually become Tidewater Inc.
Doc worked out a deal with Alexander Ship-yard in New Orleans to provide the pilot houseand some used engines, and within months, usingschematics that were literally drawn by Doc on theback of lunch sacks and perfected by the shipyard,Tidewater’s first vessel, the Ebb Tide, was born.
The Ebb Tide was put into service for Shell OilCompany almost immediately after its launch, andwithin a matter of weeks, Shell requested that
Tidewater build another vessel just like it. Thesecond boat, the Rip Tide, was put into service asquickly as the first, and once again, Laborde wasasked to produce two more vessels.
“We had two boats working and two more onorder when it became apparent that I needed toturn the operations of Tidewater over to some-body else, since I was still heavily involved withODECO which was building rigs,” Laborde said.To avoid a potential conflict of interest, DocLaborde asked his older brother, C. E. Laborde, Jr.,and Eddie Kyle, Jr. (who were two of the originalten investors) for some recommendations on whocould take over the business. His older brothersuggested that they give his younger brother, John,the opportunity, and the other investors agreed. Atthe time, John P. Laborde was a lawyer working forRichardson and Bass. John was a graduate ofLouisiana State University and had spent four yearsin Army military service during World War II, threein the Southwest Pacific and Japan in GeneralDouglas MacArthur’s general headquarters. Whenhe was asked about taking a new position with thefledgling company, he immediately resigned fromRichardson and Bass and became the first officialPresident of Tidewater Marine Service, Inc.
The company was well underway, but with anever-increasing demand for vessels, the original teninvestors were almost tapped out. It becameimmediately obvious that the group would needmore structured financing to allow it to grow toits potential.
Burch Williams, one of the original investors, had
3
The Ebb Tide,built in 1955, wasthe first purposebuilt supply boatto the offshoreoil industry.
Celebrating 50 Years

just become a partner in the investment firm ofRheinholdt & Gardner, coincidentally, the firm thatprovided the original financing for Doc Laborde’sODECO venture. Williams was convinced that thebest way to raise the necessary capital to growTidewater was to go public. He presented his case tohis partners at Rheinholdt, and with the help andsupport of The Whitney Bank of New Orleans, aplan was developed for initial financing.
Shortly thereafter, the papers were signed, thefinancing came through, and on March 1, 1956,Tidewater Marine Service, Inc. became a publiccompany, trading on the NASDAQ.
Under the leadership of John Laborde, whowould remain Chairman and President for thenext 38 years, Tidewater would weather manystorms, but continue to grow into the successfulgiant that it is today. But there were a lot of stepsto be taken along the way.
Perhaps the boldest step was the decision toexpand operations outside the Gulf of Mexicointo foreign waters. A short two years after forma-tion, John Laborde saw that in addition to the GulfCoast of the U.S., the next area where offshoredrilling was in its formative years was in LakeMaracaibo in Venezuela. And so, he moved todevelop Tidewater’s business on the lake.
“At that time, Lake Maracaibo was probably theonly other ‘over-water’ operation in the oil and gasindustry in the world,” said John Laborde. “I wentdown there and found a small company calledSemarca, which owned a few small crewboatsworking on the lake. I made them an offer and inMarch of 1958, Semarca became a full subsidiaryof Tidewater, marking the beginning of our world-wide expansion.”
By the end of the 1950s, Tidewater, at justthree years old, was generating revenues of over$2 million. The domestic oil industry was sluggishat the time, so Laborde made the decision toexpand the Venezuelan fleet by another 14 vessels,a decision which would prove wise indeed, sincethat initial international expansion became a bench-mark for future international operations in Trinidad,West Africa and the Middle East.
The 1960s were a time of unprecedentedgrowth for Tidewater. Even though 1962 sawTidewater’s first decline in revenue, the companywas still able to reward its shareholders with adividend of five cents per share. By the mid-60s,Tidewater’s fleet had expanded to over 180 vessels.The Venezuelan operations were growing signifi-cantly, other operations expanded to the U.S.WestCoast and the Middle East, the Morgan City, La.,
facilities were built and almostimmediately expanded, and annualrevenues were fast approaching $20million. Not bad for just a mere tenyears. But the roller coaster ride wasjust beginning.
Shortly after the first decadeended, John Laborde and Tidewaterbegan a program of expansion, form-ing a joint venture in Australiaand beginning operations in WestAfrica, Central America and Alaska.Tidewater was truly becoming aninternational force with which tobe reckoned.
Founding President,John P. Laborde(far left) and thepioneering first crew of the EbbTide.
4
History Of Tidewater
1979Tidewater adds 26 newvessels to its marinefleet at a cost of$37.1 million.
1983Tidewater completes a$200 million, 59 vesselnew constructionprogram.
1986Tidewater completes atwo-year building programthat adds 40 vessels tothe fleet at a cost of$104 million.
1978Hilliard Oil & Gas, inc., inan exchange of stock,becomes a wholly-ownedsubsidiary of TidewaterInc. on June 30, 1977.

Much of Tidewater’s growth overthe years came through acquisitionsas well. In 1968, the acquisition ofTwenty Grand Marine helped Tidewaterexpand its fleet from 200 vessels toover 350 in just one year.
Acquisitions didn’t just occurwithin Tidewater’s Marine Division.In the late 1960s,Tidewater acquiredcompanies outside of its core business.This diversification process includedthe acquisition of companies such asHamer Hammer Service, Inc., SouthCoast Gas Compression Company,and Sandair Corporation, which gaveTidewater a presence in Holland andthe Middle East.
By 1970, Tidewater far exceededthe requirements for listing on the New York StockExchange, a goal that had been set a decade and ahalf earlier. On May 19,1970,Tidewater officially hitthe “big board”with John Laborde and other officerson the floor of the NYSE to watch it happen.
If the 1960s were boom times for Tidewater,the 1970s boomed even louder. From revenues ofaround $50 million in 1970, Tidewater explodedby 1981 to revenues of $354 million and net earningsof over $40 million.
During this time, not only did the fleet expand,the workforce did too, prompting Tidewater topurchase a 24-story building on Canal Streetin New Orleans that came to be known as“Tidewater Place.” However, as the companycontinued to grow and expand, its fleet of vesselswas aging. The company began an aggressive $200million, 59-vessel new construction program in1981, which would take more than two years tocomplete. When it was done,Tidewater had oneof the largest and youngest fleet of vessels inthe world.
While the fleet had grown, and Tidewater haddiversified itself into the compression and other
businesses, including the acquisition of Hilliard Oil& Gas, an oil drilling and production company, noone could predict how turbulent the 1980s wouldbe, not only for Tidewater, but for the oil and gasindustry in general.
In the mid-80s, the oil industry was in themidst of a severe downcycle, which causedTidewater to record its first loss in the history ofthe company. At the same time, a hostile takeoverbid was launched by the Irwin Jacobs Group,which had begun acquiring large amounts ofTidewater stock in 1984. In an effort to protectitself from the hostile takeover,Tidewater divesteditself of its Indonesian oil and gas interests, soldoff Hilliard Oil & Gas, and restructured its debt after recording almost a $60 millionloss in 1987. Two years later, when theJacobs Group made a buyout offer to theTidewater Board, the company was ina solid enough position to refuse theoffer and successfully place 5.5 millionshares of common stock on themarket. The company had weath-ered the storm, and was able to
Celebrating 50 Years
The Miss Jane Tide,a 260’ state of theart platform supplyvessel hard at work in the Gulfof Mexico.
5
1992Tidewater consumatesmerger with Zapata GulfMarine which doubles thesize of the fleet.
1994John P. Laborde, Chairman, President andCEO retires after 38 years with the company.William C. O’Malley takes over the helm.Tidewater Compression expands by acquringtwo companies – Brazos Gas Compression Corp.and a subsidiary of energy giant, Halliburton.
1996Tidewater Inc. acquiresHornbeck OffshoreServices, pushing thecompany’s vessel countto more than 600.

effect a return to profitability in the early 1990s.Much of that profitability came with the
1991 merger with Zapata Gulf Marine, one ofTidewater’s largest competitors. The merging ofthe companies literally doubled the size ofTidewater. Once again, the fleet was growing,older vessels were being replaced with newer ones,and the focus of the company returned fully to themarine and compression businesses.
1994 also saw the end of 38 years of service tothe company by Chairman, President, and CEOJohn Laborde, who retired from the company.William C. O’Malley, former Chairman and CEOof Sonat Offshore Drilling Inc., was named to beLaborde’s successor. Among one of the first thingsO’Malley set out to achieve was the initiation of amajor safety initiative within the company toreduce lost time accidents. This program, still ineffect today, has had amazing results, with lost timeaccidents dropping from over 75 in the early 1990sto just one in each of fiscal years 2005 and 2006.
O’Malley was at the helm of the company whentwo significant acquisitions were consummated —domestic operator Hornbeck Offshore Services, Inc.in 1996; international operator O.I.L. Ltd. in 1997, aswell as in 1998 when the company’s compression
division was sold and Tidewater revenues topped $1billion for the first time. Before retiring from thecompany in 2001, O’Malley helped initiate whatbecame a $700 million new construction and vesselacquisition program designed to upgrade Tidewater’sfleet in order to meet the new challenges ofsupplying and moving huge rigs working in deeperand deeper waters offshore.
Upon O’Malley’s retirement, Dean E. Taylor,Tidewater’s current Chairman, President, andCEO took over the reins, and has led the companynot only through another period of growth,expansion and success, but also through one of themost harrowing of times for Tidewater employees,Hurricanes Katrina and Rita in 2005. While dealingwith the challenges of the two hurricanes, thecompany responded with its second highest netearnings performance in its 50 year history
The hurricanes not only threatened the lives ofTidewater’s devoted workers along the Gulf Coast,but also threatened other assets of the company aswell: vessels stationed in the paths of the storms,and of course, the offices of the company. Whilethere was a slight disruption primarily from themass exodus out of New Orleans, the businessdidn’t miss a beat. Emergency plans which hadbeen in place worked almost flawlessly, allemployees were accounted for, and while spreadout at many different venues, the people ofTidewater proved what everyone has known aboutthe company since the 1950s: Tidewater is strong,focused, dedicated, and ready for the next 50 years.
The Robert H. Boh, named after along-standing member of the Company’sBoard of Directors, working off thecoast of West Africa.
6
History Of Tidewater
1997Tidewater acquiresO.I.L. Ltd., increasingits fleet to more than700 vessels.
1998Tidewater sells itsTidewater Compressiondivision and reportsrecord profits incompany history.
2000Tidewater embarks ona $300 million newconstruction programthat will position thecompany to fill anew market niche indeepwater exploration.
2001Tidewater’s new buildprogram is upgraded toa $700 million plan,placing the fleet amongthe top competitorsin the deepwatermarkets worldwide.
2002Dean E. Taylor takesover from William C.O’Malley as Chairman,President and CEO.
2003Tidewater announcesits acquisition of 27vessels from Ensco,part of an ongoingeffort toward its fleetexpansion and improve-ment programs.
2004Tidewater receives theprestigious safety inseas award granted bythe National OceanIndustries Association(NOIA).
2006Tidewater celebratesits 50th Anniversaryand reports secondhighest profits incompany’s history.
On May 22, 2003, Tidewater employeeMatt Comotto salutes Tidewater byflying the company flag on top ofMt. Everest.

t is fitting that Tidewater marked its fiftieth anniversary in ayear that tested the mettle of every company in the domes-tic oilfield. Each of Tidewater’s employees, in their own ways,showed in this past year the same determination and spirit
that our company’s founders showed when they pioneered theformation of the offshore service vessel industry in the Gulf ofMexico in 1956, pushed their ideas into the uncharted waters ofinternational drilling activity in 1958, and persevered throughthe many economic cycles that followed.
During my 28 years at Tidewater I’ve been privileged to workwith a very special group of people,who in countless ways have donetheir best to improve our company, in good times and bad. Yet I’venot experienced a time when the Tidewater spirit burned as brightlyas it did last summer after two of the most devastating storms inhistory hit the oil producing areas of the U.S. Gulf of Mexico. In theimmediate aftermath of Hurricane Katrina, though many of ouremployees lost touch with their families, lost their homes and posses-sions—few missed a day of work (none as the result of an accident),and all worked longer and harder than ever to secure whatever theycould for each other, for our customers, and for the operation of ourcompany. Due to their foresight and spirit, we lost no employees tothe storm, and sustained no damage to any of our equipment oroperating bases. Without missing a beat, our team set up temporaryheadquarters in Houston, moved personnel to our base in Amelia tokeep the company’s worldwide operations going, missing not apaycheck, an invoice, or having a vendor paid on time. Thanks totheir resolve and to the efforts of our other 6,000 internationalemployees, I am able to report to you in this letter that, not only didwe weather the two devastating storms, we grew our net earningsfor our shareholders in excess of 133% compared to last year!
The foresight and determination that we inherited from ourfounders to be the best in our industry is also evident in lessdramatic ways as we examine our past performance, and plans andgoals for our future. When the decision was made, many yearsago, to establish Tidewater as the first OSV company to operateinternationally, it could not have been known how importantoverseas markets would become in today’s global marketplace.Looking back just eight years, which was the last time that weposted earnings in one quarter in excess of $1.00 a share, 65% ofour operating profits came from our domestic operations, and35% came from our international business. This year, 75% of ourprofitability comes from our international operations, while 25%came from our domestic business. Those of you who are longerterm holders of our shares will remember a period two years agowhen all of our earnings came from our international operations.Thus the step out to international operations in 1958 was a mostimportant move for the sustainability of our business.
Equally important were the decisions initiated in 2000 by mypredecessor, Bill O’Malley, to commit in excess of a billion dollars
toward renewing and enhancing our fleet in order to maintain ourposition as the largest and best fleet of offshore supply vessels in theworld. I can’t help but reflect, as we celebrate our fiftieth year, thatour reconfigured operating fleet, consisting of over 350 vessels, hasproduced this year earnings comparable to those that about 600vessels produced the last time we had the level of earnings of our justcompleted fiscal year.Though we still have mature tonnage that willin time require replacement, we also have the largest fleet of newvessels of our industry in the world—some 120 new boats are part ofour current fleet. Much has been done, there is still much to do.
We are continuing to use our capital to enhance our fleet—todaywe have some 19 vessels under construction, and more will follow.We also are continuing to evaluate, other than by reinvesting in thebusiness, additional ways to enhance Tidewater’s value to shareholders,whether it is through buying back stock, increasing dividends, or byother means. We are committed to the creation of economic value.All of our managers, and eventually many of our employees, will berewarded upon how we handle the capital that has been entrusted tous by our shareholders.And finally, all of us continue do those thingswhile maintaining a safety culture that ensures that what we do forour owners is done in an environment that is safe for our employees,an environment that otherwise can be unforgiving.
I congratulate all of our employees for, once again, a nearperfect performance in terms of safe operations. In our fiscal yearending 2006, we had once again just one Lost Time Accident, atruly amazing performance considering the conditions in whichour employees worked these past 12 months, in over 30 millionman-hours of service, in over 70 countries, in a plethora oflanguages, cultures, and locales, and at least two historic storms.
Finally, we thank our customers for providing us our livelihoods,and pledge to continue to focus on exceeding their needs andexpectations as they are recognized, and we thank our vendors andother stakeholders for their support in so doing. We thank ourBoard of Directors for their counsel, and you, our shareholders foryour confidence and support.
At 50, the future looks bright forTidewater. Last year, I ended my letter to you with the phrase “andwe look forward to the comingyear.” This year, I’ll modify thatjust a tad.
We look forward to the next50 years!
To Our Shareholders
7
I
Dean E. TaylorChairman, President, andChief Executive Officer

his was a year in which Tidewater facednot only the challenges of serving its cus-tomers safely and profitably in its geo-
graphically diverse markets around the globe,but alsoone in which it faced the additional challenges pro-duced by two major storms that severely damagedthe energy industry’s infrastructure in the Gulf ofMexico, one of the company’s major operating areas.Tidewater’s personnel rose to the occasion, and theydid so in such a way that they not only increased netearnings by 133%, but did so equaling fiscal 2005’sexceptional safety record, recording just one LostTime Accident all year—that is, one incident in over30 million man hours worked in every conceivableoffshore and near-shore environment.
The dedicated work ethic of Tidewater’s employ-ees allowed the company to take full advantage of theopportunities created in the wake of the Gulf ofMexico storms and had a positive impact on our ves-sels’ utilization and dayrates in the region, as our cus-tomers called on us to assist in repairing the immensedamage done to the region’s infrastructure. Demandfor our domestic-based vessels and crews increasedsignificantly, increasing vessel utilization that hadalready been on the rise prior to the Hurricanes.
Our appreciably noteworthy financial resultsreflected increased demand, not only in the Gulf ofMexico, but in practically all of our internationalmarkets. Our earnings showed positive comparisonsboth year to year and sequentially each quarter dur-ing fiscal 2006. Our international fleet, which is
comprised of some 350 vessels, produced an annualoperating profit of $186 million, an increase of 95%compared to fiscal 2005’s $95 million profit. Averagevessel dayrates rose each quarter throughout the year,buoyed by oil companies’ burgeoning explorationand development activities in virtually every area ofinternational offshore drilling . Because Tidewater’sfleet is not only large but diverse,Tidewater is able tooffer vessels of different sizes and classes to handle theneeds of nearly all of the complex projects as theymove through their various stages of completion.
Demand for our domestic vessels began toimprove well before last year’s hurricanes. Althoughthere has been a departure of a number of offshoredrilling rigs from the Gulf of Mexico, projects in theregion have grown in scope, and together withrepairs necessitated by the hurricanes, operators havebegun to contract both rigs and offshore supply ves-sels for longer contract durations to ensure the sup-ply of this equipment when needed. The relativelytight supply of workable vessels coupled with theincreased demand for them for post storm repairwork improved our utilization significantly, pushingdayrates for suitable equipment higher as we movedthrough the year to levels not before seen in the Gulfof Mexico. As a result, our domestic operatingprofit rose to $61.2 million in fiscal 2006, comparedto $2.0 million in the prior year.
Year-over-year our total company revenuesincreased by $185 million,which improved our fiscal2006 earnings to $4.07 per share—more than double
8
T
Operations

our fiscal 2005 $1.78 per share earnings. This wouldnot have been possible without the commitment wemade over the last several years to regenerate ouroperating assets. During fiscal 2006 we delivered 18newly constructed vessels into our fleet: 10 anchorhandling towing supply vessels, one platform supplyvessel and seven crewboats. Since the beginning of2000, we have added 113 new vessels to our fleetfrom our newbuild or vessel purchase programs andat March 31,2006 we had 13 additional vessels underconstruction with future plans for building more. Todate, we have funded the cost of all of these vesselsfrom current cash,operating cash flow and funds pro-vided by our unsecured notes and revolving creditline. From fiscal 2000 through fiscal 2006, we alsosold or disposed of 302 mature or non-productivevessels that were no longer needed in our worldwidefleet. During this last fiscal year alone,we sold or dis-posed of 51 vessels, including the July 2005 sale of sixKMAR 404 Class AHTS vessels to a Norwegianoperator for $188 million (that in itself resulted in a$65.9 million pre-tax gain).The proceeds from thatsale were utilized to pay down debt under ourrevolving credit facility, to begin our new sharerepurchase program, and to invest in additional newvessels. While the overall size of our worldwidefleet is smaller today than when we began ourregeneration program, the earnings power of ourcurrent fleet is potentially substantially greaterbecause of the increased efficiency and expandedcapabilities of the new vessels, and the dayrates and
utilization that they are capable of attaining.Fiscal 2006 was a year characterized by much
drama in the oil patch. We saw historically highcommodity prices, extraordinary weather events,and demand for offshore equipment unmatchedover the last several years. Looking ahead,Tidewaterintends to continue to pursue growth through itschosen strategies—to grow market share whereverpossible, to continue to renew the fleet, to keep itspowder dry to stay prepared for sensible acquisitions,and to grow its profits and cash flow. The goal ofcreating additional value for our shareholders in asafe environment for world-class employees is ours.It is our pledge to achieve it.
Lost Time Accidents
18
16
14
12
10
8
6
4
2
0 2000
2001
2002
2003
2004
2005
10
89
5 5 5
1
20061
1999
1998
18
1998-2006 (Fiscal Year)
9

Financial Highlights
(000’s omitted, except Per Share data and Vessel Count)
Fiscal Years 2006 2005 2004 2003 2002
Revenues $ 877,617 692,150 652,630 635,823 729,029
Net Earnings $ 235,756 101,339 41,662 88,630 136,159
Net Cash from Operations $ 283,578 160,062 129,049 202,000 194,390
Capital Expenditures $ 172,408 207,391 297,515 269,620 317,907
Long-term Debt $ 300,000 380,000 325,000 139,000 54,000
Stockholders’ Equity $ 1,659,121 1,442,702 1,366,110 1,351,395 1,285,818
Per Share Data
Net Earnings $ 4.07 1.78 .73 1.57 2.41
Cash Dividends $ .60 .60 .60 .60 .60
Market Price at Year-end $ 55.23 38.86 28.13 28.72 42.35
Weighted Average CommonShares Outstanding 57,372,815 56,854,282 56,563,328 56,413,856 56,054,797
Total Vessel Countat Year End 523 563 575 545 555
10

stockholder assistanceInformation about stockholder accounts may be obtained by contacting the Transfer Agent andRegistrar for Tidewater’s common stock, Computershare Trust Company, N.A., P.O. Box 43010,Providence, RI 02940-3010, phone: 781-575-3170. General stockholder information is availableon the EquiServe web site, www.computershare.com.
duplicate mailingsIf you receive duplicate mailings of shareholder materials, you can help eliminate the added expenseby requesting that only one copy be sent. To eliminate duplicate mailings, contact the Company’s StockTransfer Agent and Registrar listed above.
stock exchangeTidewater’s common stock is traded on the New York and Pacific Stock Exchanges under thesymbol TDW.
form 10-K reportTidewater’s 2006 Annual Report on Form 10-K may be obtained without charge by contacting theCompany’s Investor Relations Department at corporate headquarters. Tidewater’s SEC filings can alsobe viewed online at the Company’s website, www.tdw.com.
website and e-mail alertsInformation concerning the Company, including quarterly financial results and news releases, isavailable on the Company’s website at www.tdw.com. E-mail alerts about the Company’s newsreleases, SEC filings and presentations are available by registering at the company’s website.
investor relationsRequests for information concerning the company should be directed to the Investor RelationsDepartment using the address or phone numbers listed below. Requests for information can alsobe submitted at the Company’s website, www.tdw.com.
tidewater601 Poydras Street, Suite 1900New Orleans, Louisiana 70130Tel: 1-800-678-84331-504-568-1010Email: [email protected]: www.tdw.com
11

Standing, left to right:
Jon C. MadonnaFormer Chairman and ChiefExecutive Officer, KPMG LLC
Arthur R. CarlsonChairman,TCW Energyand Infrastructure Group
Richard T. du MoulinPresident, IntrepidShipping LLC
Paul W. MurrillProfessional Engineerand Investor
Jack ThompsonConsultant
Sitting, left to right:
Richard A. PattarozziFormer Vice President,Shell Oil Co.
Dean E.TaylorChairman, President andChief Executive Officer
William C. O'MalleyFormer Chairman, Presidentand Chief Executive Officer,Tidewater Inc.
Not Pictured:
Wayne LeonardChief Executive Officer,Entergy Corporation
Standing, left to right:
J. Keith LousteauChief Financial Officer,Executive Vice Presidentand Treasurer
Craig DemarestController
William R. Brown, IVVice President
Cliffe F. LabordeExecutive Vice President,General Counsel
Jeffrey M. PlattSenior Vice President
Joseph M. BennettSenior Vice President,Principal Accounting Officerand Chief InvestorRelations Officer
Sitting, left to right:
Gerard P. KehoeVice President
Reginald A. McNeeSenior Vice President
Dean E.TaylorChairman, President andChief Executive Officer
James H. DonnellyVice President
Stephen W. DickExecutive Vice President
Management CertificationsOn July 25, 2005, in accordance with Section 3.03A.12(a) of the New York Stock Exchange Listed Company Manual,
the Company's management submitted its certification to the New York Stock Exchange stating that it was not aware of any violationsby the Company of the Exchange's Corporate Governance listing standards as of that date.
The certifications with respect to the Company's Annual Report on Form 10-K for the fiscal year ended March 31, 2006, requiredby Section 302 of the Sarbanes-Oxley Act, have been filed as Exhibits 31.1 and 31.2 to the Company's Annual Report on Form 10-K.
Board of Directors
Corporate Officers

UNITED STATES SECURITIES AND EXCHANGE COMMISSION
Washington, D.C. 20549 __________
FORM 10-K
ANNUAL REPORT PURSUANT TO SECTION 13 OR 15(d) OF THE SECURITIES EXCHANGE ACT OF 1934
For the Fiscal Year Ended March 31, 2006
For the transition period from to .
Commission file number: 1-6311
Tidewater Inc. (Exact name of registrant as specified in its charter)
Delaware 72-0487776(State of incorporation) (I.R.S. employer identification no.)
601 Poydras St., Suite 1900 New Orleans, Louisiana 70130
(Address of principal executive offices, including zip code)
(504) 568-1010 (Registrant’s telephone number, including area code)
Securities registered pursuant to Section 12(b) of the Act:
Title of each class Name of each exchange on which registered
Common Stock, par value $0.10 New York Stock Exchange, Pacific Stock Exchange Preferred Stock Purchase Rights New York Stock Exchange, Pacific Stock Exchange
Securities registered pursuant to Section 12(g) of the Act: None
Indicate by check mark if the registrant is a well-known seasoned issuer, as defined in Rule 405 of the Securities Act. Yes No
Indicate by check mark if the registrant is not required to file reports pursuant to Section 13 or Section 15(d) of the Act. Yes No
Indicate by check mark whether the registrant (1) has filed all reports required to be filed by Section 13 or 15(d) of the Securities Exchange Act of 1934 during the preceding 12 months (or for such shorter period that the registrant was required to file such reports), and (2) has been subject to the filing requirements for the past 90 days. Yes No
Indicate by check mark if disclosure of delinquent filers pursuant to Item 405 of Regulation S-K is not contained herein, and will not be contained, to the best of registrant's knowledge, in definitive proxy or information statements incorporated by reference in Part III of this Form 10-K or any amendment to this Form 10-K.
Indicate by check mark whether the registrant is a large accelerated filer, an accelerated filer, or a non-accelerated filer (as defined in Rule 12b-2 of the Exchange Act).
Large accelerated filer Accelerated filer Non-accelerated filer
Indicate by check mark whether the registrant is a shell company (as defined in Rule 12b-2 of the
Exchange Act).

-2-
The aggregate market value of the voting common stock held by non-affiliates of the registrant as of September 30, 2005, was approximately $2,774,962,198 based upon the last sales price reported for such date. Excluded from the calculation of market value are 3,031,240 shares held by the Registrant's grantor stock ownership trust.
58,161,207 shares of Tidewater Inc. common stock $0.10 par value per share were outstanding on April 7, 2006. Excluded from the calculation of shares outstanding at April 7, 2006 are 2,148,957 shares held by the Registrant's grantor stock ownership trust. Registrant has no other class of common stock outstanding.
DOCUMENTS INCORPORATED BY REFERENCE
Portions of the Proxy Statement for Registrant's 2006 Annual Meeting of Stockholders are incorporated into Part III of this report.
TABLE OF CONTENTS
Part I
Item Number Page
1. Business........................................................................................................................................ 3 1A. Risk Factors ................................................................................................................................ 10 1B. Unresolved Staff Comments ...................................................................................................... 11 2. Properties.................................................................................................................................... 12 3. Legal Proceedings ...................................................................................................................... 12 4. Submission of Matters to a Vote of Security Holders................................................................ 12
Part II
5. Market for the Registrant's Common Stock and Related Stockholder Matters............................................................................................................... 13 6. Selected Financial Data.............................................................................................................. 14 7. Management's Discussion and Analysis of Financial Condition and Results of Operations .................................................................................... 15 7A. Quantitative and Qualitative Disclosures About Market Risk.................................................... 36 8. Financial Statements and Supplementary Data ........................................................................ 37 9. Changes in and Disagreements with Accountants on Accounting and Financial Disclosure.................................................................................... 37 9A. Controls and Procedures............................................................................................................ 38 9B. Other Information........................................................................................................................ 38
Part III
10. Directors and Executive Officers of the Registrant.................................................................... 39 11. Executive Compensation............................................................................................................ 39 12. Security Ownership of Certain Beneficial Owners and Management....................................... 40 13. Certain Relationships and Related Transactions ...................................................................... 40 14. Principal Accounting Fees and Services ................................................................................... 40
Part IV
15. Exhibits, Financial Statement Schedules and Reports on Form 8-K........................................ 41
SIGNATURES ............................................................................................................................................ 45
-3-
Forward-looking Information and Cautionary Statement
In accordance with the safe harbor provisions of the Private Securities Litigation Reform Act of 1995, the company notes that this Annual Report on Form 10-K and the information incorporated herein by reference contain certain forward-looking statements which reflect the company’s current view with respect to future events and financial performance. Any such forward-looking statements are subject to risks and uncertainties and the company’s future results of operations could differ materially from historical results or current expectations. Some of these risks are discussed in this report, and include, without limitation, fluctuations in oil and gas prices; level of fleet additions by competitors and industry overcapacity; changes in capital spending by customers in the energy industry for exploration, development and production; changing customer demands for different vessel specifications which may make some of our vessels technologically obsolete for certain customer projects or in certain markets; acts of terrorism; significant weather conditions; unsettled political conditions, war, civil unrest and governmental actions, especially in higher risk countries of operations; foreign currency fluctuations; and environmental and labor laws.
Forward-looking statements, which can generally be identified by the use of such terminology as “may,” “expect,” “anticipate,” “estimate,” “forecast,” “believe,” “think,” “could,” “will,” “continue,” “intend,” “seek,” “plan,” “should,” “would” and similar expressions contained in this report, are predictions and not guarantees of future performance or events. Any forward-looking statements are based on current industry, financial or economic information, which the company has assessed but which by its nature is dynamic and subject to rapid and possibly abrupt changes. The company’s actual results could differ materially from those stated or implied by such forward-looking statements due to risks and uncertainties associated with our business. The forward-looking statements should be considered in the context of the risk factors listed above and discussed elsewhere in this Form 10-K. Investors and prospective investors are cautioned not to place undue reliance on such forward-looking statements. Management disclaims any obligation to update or revise the forward-looking statements contained herein to reflect new information, future events or developments.
PART I
ITEM 1. BUSINESS
General
Tidewater Inc. (the "company"), a Delaware corporation, provides offshore supply vessels and marine support services to the offshore energy industry through the operation of the world’s largest fleet of offshore marine service vessels. The company's worldwide headquarters and principal executive offices are located at 601 Poydras Street, New Orleans, Louisiana 70130, and its telephone number is (504) 568-1010. The company was incorporated in 1956. Unless otherwise required by the context, the term "company" as used herein refers to Tidewater Inc. and its consolidated subsidiaries.
With a fleet of over 520 vessels at March 31, 2006, including 67 stacked vessels, 66 vessels withdrawn from service and 22 vessels operated pursuant to joint venture or other agreements, the company operates and has a strong presence in most of the world's significant oil and gas exploration and production markets and provides services supporting all phases of offshore exploration, development and production, including: towing of and anchor handling of mobile drilling rigs and equipment; transporting supplies and personnel necessary to sustain drilling, workover and production activities; assisting in offshore construction activities; and a variety of specialized services including pipe laying, cable laying and 3-D seismic work.
Website Access to Company Reports
The company’s Internet website address is http://www.tdw.com. The company makes available free of charge, on or through its website, its annual reports on Form 10-K, quarterly reports on Form 10-Q and current reports on Form 8-K and any amendments to those reports, as soon as reasonably practicable after they are electronically filed with the Securities and Exchange Commission. The public may read and copy any materials the company has filed with the SEC at the SEC's Public Reference Room at 450 Fifth Street,

-4-
NW, Washington, DC 20549. Information on the operation of the Public Reference Room may be obtained by calling the SEC at 1-800-SEC-0330. The SEC maintains an internet site that contains the company’s reports, proxy and information statements, and the company’s other SEC filings. The address of that site is www.sec.gov. Information appearing on the company’s website is not part of any report filed with the Securities and Exchange Commission.
The company has posted on its internet website address the company’s Code of Business Conduct and Ethics. The company has adopted a Code of Business Conduct and Ethics (Code) for its directors, principal executive officer, principal financial officer, principal accounting officer, and other officers and employees on matters of business conduct and ethics, including compliance standards and procedures. The company intends to satisfy the disclosure requirements of the Securities and Exchange Commission regarding amendments to, or waivers from, the Code by posting such information on the same web site. Changes in and waivers to the Code will be posted on the company's website within five business days and maintained for at least 12 months. A copy of the Code is also available in print to any stockholder upon written request addressed to Tidewater Inc., 601 Poydras Street, Suite 1900, New Orleans, Louisiana 70130.
Business Highlights
During the second quarter of fiscal 2006, the company completed the sale of six of its KMAR 404 class of Anchor Handling Towing Supply vessels to Deep Sea Supply ASA for a total cash price of $188.0 million. The transaction resulted in a $65.9 million pre-tax financial gain, or approximately $42.8 million after tax, or $0.74 per diluted common share. The transaction resulted in an approximate $112.0 million taxable gain, but no cash taxes are due because of the availability of net operating loss carryforwards. The company used a portion of the proceeds of the sale to repay $95.0 million of outstanding borrowings under the company’s revolving credit agreement.
The company’s properties and equipment were unaffected by Hurricanes Katrina and Rita, which affected the Gulf Coast region of the United States. The company’s fleet of vessels operating in the Gulf of Mexico did not sustain any damage and the company's main operational base in Amelia, Louisiana suffered only power and telephone outages. The company's corporate headquarters located in New Orleans, Louisiana did not sustain damage but was inaccessible for business for approximately three months. During this period, the company’s New Orleans based staff personnel were assigned to the company’s main operational base in Amelia, Louisiana while the company’s senior management group operated from the company’s Houston, Texas office. The company’s shipyard, Quality Shipyards, LLC located in Houma, Louisiana also did not sustain any damage. All international operations of the company were unaffected by the two storms. The company's corporate headquarters are accessible for business and its New Orleans based staff personnel have resumed operations in New Orleans while the company’s senior management group operates in both the New Orleans and Houston offices.
In July 2005, the company’s Board of Directors authorized the company to spend up to $120.0 million to repurchase shares of its common stock. Repurchases are made through open market or privately-negotiated transactions. The company intends to use its available cash and, when considered advantageous, borrowings under its revolving credit facility to fund the share repurchases. The Board of Directors’ authorization for this repurchase program will expire when all authorized funds have been expended or on June 30, 2006, unless extended by the Board of Directors. As of March 31, 2006, the company spent $20.8 million for the repurchase and cancellation of 455,000 common shares, or an average price paid per common share of $45.64. At March 31, 2006, approximately $99.2 million was available to repurchase shares of the company’s common stock pursuant to the stock repurchase program.
The provisions of the American Jobs Creation Act of 2004 (the Act), were effective for the company as of April 1, 2005, and allowed the company to omit recording deferred tax assets or liabilities on future undistributed earnings of most non-U.S. subsidiaries and business ventures that it considers indefinitely reinvested abroad. At March 31, 2005, the company reversed all previously recorded deferred tax assets and liabilities related to timing differences, foreign tax credits, or prior undistributed earnings of these entities whose future and prior earnings are now anticipated to be indefinitely reinvested abroad. This resulted in an approximate $31.8 million reduction of income tax expense in the fourth quarter of fiscal 2005.

-5-
In late March 2004, the company concluded based on mounting extrinsic evidence that low drilling activity levels in the Gulf of Mexico due to a prolonged weakness in the domestic market could possibly persist for a period of time. In March 2004, the company’s management performed a review of the recoverability of the values of its Gulf of Mexico operating assets and recorded a non-cash asset impairment charge of $26.5 million ($17.2 million after tax, or $0.30 per share) relating to 83 older Gulf of Mexico supply vessels that had been stacked for as long as several years and were viewed as unlikely to return to active service. The impairment charge was taken to adjust the carrying value of these assets to fair value at March 31, 2004. A full discussion of the impairment of long-lived assets is disclosed in “Impairment of Long-lived Assets” section of Item 7 and Note 3 of Notes to Consolidated Financial Statements. In the fourth quarter of fiscal 2005, the company reviewed, for impairment purposes, all stacked vessels and vessels withdrawn from service and recorded a non-cash impairment charge of $1.7 million ($1.1 million after tax, or $0.02 per share) to reduce the carrying amount of 10 stacked vessels as to which an impairment charge had not been taken in fiscal 2004 but which were subsequently identified as being unlikely to return to active service. An impairment review during fiscal 2006 resulted in a non-cash impairment charge of approximately $3.1 million ($2.0 million after tax, or $0.03 per share) on eight additional vessels that are withdrawn from service as to which an impairment charge had not been taken previously.
Six years have passed since the company embarked on its aggressive new-build vessel construction and acquisition program which facilitated the company’s entrance into the deepwater markets of the world and allowed the company to begin to replace its core fleet with fewer, larger, more efficient vessels. During this time the company purchased and/or constructed 28 anchor handling towing supply vessels for approximately $539.9 million, of which 11 are deepwater vessels. The company also added 38 platform supply vessels during this time for approximately $607.6 million, of which 23 are deepwater platform supply vessels, 14 are U.S. built replacement vessels (vessels intended to replace the company’s core fleet) and one is an international built replacement vessel. The company also expanded its crewboat fleet by 43 vessels and increased its “other” type of vessels by four vessels in the past six years for an approximate cost of $154.1 million. Twenty-five of the crewboats and “other” type of vessels were built in the U.S. while 22 were built by international shipyards.
The vessel construction and acquisition program and the expansion program were initiated with the intent of strengthening the company’s stong presence in all major oil and gas producing regions of the world through the replacement of the company’s core fleet. In order to avoid potential overcapacity in our markets that could be created through the addition of the vessels discussed above, the company sold, primarily to buyers who operate outside of our industry, and/or scrapped 219 vessels between April 2000 and March 2006.
To date, the company has funded all of its vessel commitment programs from current cash balances, operating cash flow, and funds provided by its $300 million senior unsecured notes and its revolving credit facility. At March 31, 2006, the company had 13 vessels under construction for a total capital commitment of $175.3 million, of which the company has already expended $61.0 million. A full discussion of each event including capital commitments and scheduled delivery dates is disclosed in the “Vessel Construction Programs and Acquisitions” and “Vessel Dispositions” section of Item 7 and Note 10 of Notes to Consolidated Financial Statements.
Areas of Operation
The company's fleet is deployed in the major offshore oil and gas areas of the world. The principal areas of the company's operations include the U.S. Gulf of Mexico, the Persian Gulf, the Caspian Sea, and areas offshore Australia, Brazil, Egypt, India, Indonesia, Malaysia, Mexico, Trinidad, Venezuela and West Africa. The company conducts its operations through wholly-owned subsidiaries and joint ventures. Information

-6-
concerning revenues and operating profit derived from domestic and international marine operations and domestic and international total marine assets for each of the fiscal years ended March 31 are summarized below:
(In thousands) 2006 2005 2004 Revenues: Vessel operations: United States $ 180,374 118,288 125,344 International 666,608 537,238 500,604 Other marine operations 30,635 36,624 26,682
$ 877,617 692,150 652,630 Operating profit (loss): Vessel operations: United States $ 61,227 2,022 (17,715) International 186,044 95,383 96,316 Impairment of long-lived assets (3,050) (1,733) (26,456) Gain on sales of assets 86,337 11,977 7,075 Other marine operations 6,511 6,623 4,623
$ 337,069 114,272 63,843 Total marine assets: United States $ 566,707 532,097 569,841 International 1,490,083 1,542,996 1,389,541 Total marine assets $ 2,056,790 2,075,093 1,959,382
Please refer to Item 7 of this report and Note 13 of Notes to Consolidated Financial Statements for further discussion of revenues, operating profit and identifiable assets.
Marine Vessel Fleet
The company's vessels regularly and routinely move from one operating area to another, often to and from offshore operating areas of different continents. Tables comparing the average size of the company's marine fleet by class and geographic distribution for the last three fiscal years are included in Item 7 of this report. The company discloses its vessel statistical information, such as utilization and average day rates, by vessel class. Listed below are the company’s five major vessel classes along with a description of the type of vessels categorized in each class and the services the respective vessels perform.
Deepwater Vessels. This is the company’s newest class of vessels, which is often referred to as North Sea-type vessels. Included in this class are large, platform supply vessels and large, high-horsepower (generally greater than 10,000 horsepower) anchor handling towing supply vessels. This vessel class is chartered to customers for use in transporting supplies and equipment from shore bases to deepwater and intermediate water depth offshore drilling rigs, platforms and other installations. Platform supply vessels, which have large cargo handling capabilities, serve drilling and production facilities and support offshore construction and maintenance work. The anchor handling towing supply vessels are equipped for and are capable of towing drilling rigs and other marine equipment, as well as setting anchors for positioning and mooring drilling rigs.
Towing Supply and Supply Vessels. This is the company’s largest fleet class by number of vessels. Included in this class are anchor handling towing supply vessels and supply vessels with average horsepower below 10,000 BHP, and platform supply vessels that are generally less than 220 feet. The respective vessels in this class perform the same functions and services as their deepwater vessel class counterparts except they are chartered to customers for use generally in intermediate and shallow waters.
Crewboats and Utility Vessels. Crewboats and utility vessels are chartered to customers for use in transporting personnel and small quantities of supplies from shore bases to offshore drilling rigs, platforms and other installations.
Offshore Tugs. Offshore tugs tow floating drilling rigs; dock tankers; tow barges; assist pipe laying, cable laying and construction barges; and are used in a variety of other commercial towing operations, including towing barges carrying a variety of bulk cargoes and containerized cargo.

-7-
Other Vessels. The company's vessels also include inshore tugs; offshore barges; and production, line-handling and various other special purpose vessels. Inshore tugs, which are operated principally within inland waters, tow drilling rigs to and from their locations, and tow barges carrying equipment and materials for use principally in inland waters for drilling and production operations. Barges are either used in conjunction with company tugs or are chartered to others.
Revenue Contribution of Main Classes of Vessels
Revenues from vessel operations were derived from the main classes of vessels in the following percentages:
Year Ended March 31, 2006 2005 2004
Deepwater vessels......................................................................................................................22.4% 22.3% 20.5% Towing-supply/supply..................................................................................................................58.5% 57.7% 57.6% Crew/utility ..................................................................................................................................10.9% 10.7% 9.8% Offshore tugs.................................................................................................................................7.8% 8.8% 11.3% Other. .............................................................................................................................................0.4% 0.5% 0.8%
Shipyard Operations
Quality Shipyards, LLC, a wholly-owned subsidiary of the company, operates two shipyards in Houma, Louisiana, which construct, modify and repair vessels. The shipyard performs work for outside customers, as well as the construction, repair and modification of the company’s own vessels. During the last three fiscal years, Quality Shipyards, LLC constructed and delivered four 220-foot platform supply vessels and is currently constructing two additional 220-foot platform supply vessels for the company. Three of the supply vessels were delivered during fiscal 2004 while the fourth vessel was delivered during fourth quarter of fiscal 2006. The two remaining 220-foot platform supply vessels currently under construction are expected to be delivered in fiscal 2007.
International Operations
A significant portion of the company's operations are conducted internationally. Revenues from international operations as a percentage of the company's total revenues were 77%, 80% and 78% during fiscal 2006, 2005 and 2004, respectively. The company's international marine vessel operations are vulnerable to the usual risks inherent in doing business in countries other than the United States. Such risks include political and economic instability, possible vessel seizures or nationalization of assets and other governmental actions, the ability to recruit and retain management for overseas operations, currency fluctuations and revaluations, and import/export restrictions; all of which are beyond the control of the company.
Safety and Risk Management
The company is committed to ensuring the safety of its operations. Management regularly communicates with its personnel to promote safety and instill safe work habits through company media and safety review sessions. The company also regularly conducts safety training meetings for its seaman and staff personnel. The company dedicates personnel and resources to ensure safe operations and regulatory compliance. The company employs safety personnel at every operating location who are responsible for administering the company’s safety programs. The company’s Director of Health and Safety is involved in the review of all incidents.
The operation of any marine vessel involves an inherent risk of catastrophic marine disaster, adverse weather conditions, mechanical failure, collisions, and property losses to the vessel and business interruption due to political action in countries other than the United States. Any such event may result in a reduction in revenues or increased costs. The company's vessels are insured for their estimated market value against damage or loss, including war, terrorism acts, and pollution risks. The company also carries workers' compensation, maritime employer's liability, directors and officers liability, general liability (including third party pollution) and other insurance customary in the industry.

-8-
The company secures appropriate insurance coverage at competitive rates by maintaining a self-retention layer up to certain limits on its marine package policies. The company carefully monitors claims and participates actively in claims estimates and adjustments. The estimated costs of our self-insured claims, which include estimates for incurred but unreported claims, are accrued as liabilities on the balance sheet based on the analysis of third-party actuaries.
The continued threat of terrorist activity and other acts of war, or hostility, have significantly increased the risk of political, economic and social instability in some of the geographic areas in which the company operates. It is possible that further acts of terrorism may be directed against the United States domestically or abroad and such acts of terrorism could be directed against properties and personnel of U.S.-owned companies such as ours. The resulting economic, political and social uncertainties, including the potential for future terrorist acts and war, could cause the premiums charged for our insurance coverage to increase. The company currently maintains war risk coverage on its entire fleet. To date, the company has not experienced any property losses as a result of terrorism, political instability or war.
Management believes that the company’s insurance coverage is adequate. The company has not experienced a loss in excess of insurance policy limits; however, there is no assurance that the company’s liability coverage will be adequate to cover all potential claims that may arise. While the company believes that it should be able to maintain adequate insurance in the future at rates considered commercially acceptable, it cannot guarantee such with the current level of uncertainty in the insurance market.
Industry Conditions, Competition and Customers
The company’s operations are materially dependent upon the levels of activity in offshore crude oil and natural gas exploration, development and production throughout the world. Such activity levels are affected by the trends in worldwide crude oil and natural gas prices that are ultimately influenced by the supply and demand relationship for the natural resources. A discussion of current market conditions appears under “General Market Conditions and Results of Operations” in Item 7 of this report.
The principal competitive factors for the offshore vessel service industry are suitability and availability of equipment, price and quality of service. The company has numerous competitors in virtually all areas in which it operates, and competition is intense. During the prolonged downturn in the Gulf of Mexico market, which began during calendar year 2001, the company made a strategic decision to attempt to maintain high day rates at the expense of lower utilization. During that time, the majority of the company’s competitors in the Gulf of Mexico elected to charge lower day rates and maintain higher utilization for their vessels. Lower utilization of the company’s Gulf of Mexico supply vessel fleet resulted in the company stacking 89, or 70%, of its 127 supply vessels in the Gulf of Mexico. Of these 89 stacked domestic supply vessels, 72 vessels along with 11 additional vessels that had not been stacked were included in a non-cash asset impairment charge of $26.5 million ($17.2 million after tax, or $0.30 per share) recorded in March 2004. The 17 vessels that were not considered impaired, with an aggregate carrying amount at March 31, 2004 of approximately $10.4 million, had physical and operational characteristics different from the group of impaired vessels which would allow them to be more readily returned to service as market conditions warranted. In the fourth quarter of fiscal 2005, the company reviewed, for impairment purposes, all stacked vessels and vessels withdrawn from service and recorded a non-cash impairment charge of $1.7 million ($1.1 million after tax, or $0.02 per share) to reduce the carrying amount of 10 stacked vessels as to which an impairment charge had not been taken in fiscal 2004 but which were subsequently identified as being unlikely to return to active service. An impairment review during fiscal 2006 resulted in a non-cash asset impairment charge of approximately $3.1 million ($2.0 million after tax, or $0.03 per share) on eight additional vessels that are withdrawn from service as to which an impairment charge had not been taken previously. A full discussion of the impairment of long-lived assets is disclosed in “Impairment of Long-lived Assets” section of Item 7 and Note 3 of Notes to Consolidated Financial Statements.
The company’s diverse, mobile asset base and the geographic distribution of its assets enable the company to respond to changes in market conditions and provide a broad range of vessel services to its customers throughout the world. Management believes the company has a significant competitive advantage because of the size, the diversity and geographic distribution of its vessel fleet and the company's financial condition and economies of scale.

-9-
The company’s principal customers are major oil and natural gas exploration, development and production companies, foreign government-owned or controlled organizations and companies that explore and produce oil and natural gas, and companies that provide other services to the offshore energy industry. Over the last several years, consolidation of exploration, development and production companies has occurred which has, and will continue to have, an impact on the company’s global operations. Although Chevron Corporation (including its worldwide subsidiaries and affiliates) accounted for 15% of revenues during the year ended March 31, 2006, the five largest customers accounted for approximately 41% of the company’s revenues. The company does not consider its operations dependent on any single customer.
Regulatory Matters
The company is subject to various statutes and regulations governing the operation and maintenance of its vessels. Under the citizenship provisions of the Merchant Marine Act of 1920 and the Shipping Act, 1916, the company would not be permitted to engage in U.S. coastwise trade if more than 25% of the company's outstanding stock were owned by non-U.S. citizens. The company has a dual stock certificate system to protect against non-U.S. citizens owning more than 25% of its common stock. In addition, the company's charter provides the company with certain remedies with respect to any transfer or purported transfer of shares of the company's common stock that would result in the ownership by non-U.S. citizens of more than 24% of its common stock. Based on information supplied to the company by its transfer agent, approximately 6.68% of the company's outstanding common stock was owned by non-U.S. citizens as of March 31, 2006.
The company's vessels are subject to various statutes and regulations governing their operation. The laws of the United States require that vessels engaged in U.S. coastwise trade must be built in the U.S. In addition, once a U.S.-built vessel is registered under a non-U.S. flag, it cannot thereafter engage in U.S. coastwise trade. Therefore, the company's non-U.S. flag vessels must be operated abroad; and if the company is not able to secure adequate numbers of charters abroad for such vessels, even if work would otherwise have been available for such vessels in the United States, the company’s financial performance could be adversely affected. Of the total 523 vessels owned or operated by the company at March 31, 2006, 331 were registered under flags other than the United States and 192 were registered under the U.S. flag.
All of the company's offshore vessels are subject to international safety and classification standards. U.S. flag towing supply, supply vessels and crewboats are required to undergo periodic inspections twice every five years. Vessels registered under flags other than the United States are subject to similar regulations as governed by the laws of the applicable jurisdictions, and the regulations of classifications societies.
Seasonality
The company’s vessel fleet generally has its highest utilization rates in the warmer temperature months when the weather is more favorable for offshore exploration, development and construction work. However, business volume for the company is more dependent on oil and natural gas prices and the global supply and demand conditions for the company's services than any seasonal variation.
Environmental Compliance
During the ordinary course of business the company's operations are subject to a wide variety of environmental laws and regulations. The company attempts to comply in all material respects with these laws and regulations in order to avoid costly accidents and related environmental damage. Compliance with existing governmental regulations that have been enacted or adopted regulating the discharge of materials into the environment, or otherwise relating to the protection of the environment, has not had, nor is expected to have, a material effect on the company. The company is proactive in establishing policies and operating procedures for safeguarding the environment against any environmentally hazardous material aboard its vessels and at shore base locations. Whenever possible, hazardous materials are maintained or transferred in confined areas to ensure containment if accidents occur. In addition, the company has established operating policies that are intended to increase awareness of actions that may harm the environment.

-10-
Employees
As of March 31, 2006, the company had approximately 7,500 employees worldwide. The company considers relations with its employees to be satisfactory. The company is not a party to any union contract in the United States but through several subsidiaries is a party to union agreements covering local nationals in several countries other than the United States. For the past few years, the company has been a target of a union organizing campaign for the U.S. Gulf of Mexico employees by maritime labor unions. These union organizing efforts have recently abated, although the threat has not been completely eliminated. If the Gulf employees were to unionize, the company’s flexibility in managing industry changes in the domestic market could be adversely affected.
ITEM 1A. RISK FACTORS
The company operates in a business environment that has many risks. Listed below are some of the more critical risk factors that affect the company and the offshore marine service industry and should be considered when evaluating any forward-looking statement. The effect of any one risk factor or a combination of several risk factors could materially affect the company’s results of operations, financial condition and cash flows and the accuracy of any forward-looking statement made in this Form 10-K.
Oil and Gas Prices Are Highly Volatile
Commodity prices for crude oil and natural gas are highly volatile. Prices are extremely sensitive to the supply/demand relationship for the respective natural resources. High demand for crude oil and natural gas and/or low inventory levels for the resources as well as any perceptions about future supply interruptions can cause commodity prices for crude oil and natural gas to rise, while generally, low demand for natural resources and/or increases in crude oil and natural gas supplies cause commodity prices for the respective natural resources to decrease.
Factors that affect the supply of crude oil and natural gas include but are not limited to the following: the Organization of Petroleum Exporting Countries’ (OPEC) ability to control crude oil production levels and pricing, as well as, the level of production by non-OPEC countries; political and economic uncertainties; advances in exploration and development technology; worldwide demand for natural resources; significant weather conditions; and governmental restrictions placed on exploration and production of natural resources.
Changes in the Level of Capital Spending by Our Customers
The company’s principal customers are major oil and natural gas exploration, development and production companies. The company’s results of operations are highly dependent on the level of capital spending by the energy industry. The energy industry’s level of capital spending is substantially related to the demand for the resource and the prevailing commodity price of natural gas and crude oil. During periods of low commodity prices, the company’s customers generally reduce their capital spending budgets for offshore drilling, exploration and development.
Historically, strong fundamentals such as high commodity prices for natural gas and crude oil, tight inventory levels for the resources along with strong consumer demand have been positive indicators for increases in capital spending by the company’s customers. Other factors that influence the level of capital spending by our customers which are beyond the control of the company include: worldwide demand for crude oil and natural gas and the cost of exploring and producing oil and natural gas which can be affected by environmental regulations, significant weather conditions and technological advances that affect energy and its usage.
The Offshore Marine Service Industry is Highly Competitive
The company operates in a highly competitive environment. Competitive factors include price and quality of service by vessel operators and the quality and availability of vessels. Decreases in the level of offshore drilling and development activity by the energy industry generally negatively affect the demand for the

-11-
company’s vessels thereby exerting downward pressure on day rates. Extended periods of low vessel demand and/or low day rates will reduce the company’s revenues.
Excess marine service capacity exerts downward pressure on charter rates. Excess capacity can occur when newly constructed vessels enter the market and when vessels are mobilized between market areas. While the company has committed to the construction of several vessels, it has also sold and/or scrapped a significant number of vessels over the last several years. A discussion about the aging of the company’s fleet that has necessitated the company’s new vessel construction programs appears in the “Vessel Construction Programs and Acquisitions” section of Item 7.
Failure to Attract and Retain Key Management and Technical Personnel
The company’s success depends upon the continued service of its executive officers and other key management and technical personnel, particularly the company’s area managers and fleet personnel, and the company’s ability to attract, retain, and motivate highly qualified personnel. The loss of the services of a number of the company’s executive officers, area managers, fleet personnel or other key employees, or our ability to recruit replacements for such personnel or to otherwise attract, retain and motivate highly qualified personnel could harm the company. The company currently does not carry key employee life insurance payable to the company with respect to any of its management employees.
Risks Associated with Operating Internationally
For the fiscal years ended March 31, 2006, 2005 and 2004, 77%, 80%, and 78%, respectively, of the company’s total revenues were generated by international operations. The company's international marine vessel operations are vulnerable to the usual risks inherent in doing business in countries other than the United States. Such risks include political and economic instability, possible vessel seizures or nationalization of assets and other governmental actions, the ability to recruit and retain management of overseas operations, currency fluctuations and revaluations, and import/export restrictions; all of which are beyond the control of the company.
The continued threat of terrorist activity and other acts of war, or hostility, have significantly increased the risk of political, economic and social instability in some of the geographic areas in which the company operates. It is possible that further acts of terrorism may be directed against the United States domestically or abroad and such acts of terrorism could be directed against properties and personnel of U.S.-owned companies such as ours. To date, the company has not experienced any property losses or material adverse effects on its results of operations and financial condition as a result of terrorism, political instability or war.
At present, the company believes the risks of operating internationally to be within acceptable limits and, in view of the mobile nature of the company's principal revenue producing assets, does not consider them to constitute a factor materially adverse to the conduct of its international marine vessel operations as a whole.
Operational Risks Inherent to the Offshore Marine Industry
The operation of any marine vessel involves an inherent risk of catastrophic marine disaster, adverse weather and sea conditions, mechanical failure, collisions, and property losses to vessels, and business interruption due to political action in countries other than the United States. Any such event may result in a reduction in revenues or increased costs. The company's vessels are insured for their estimated market value against damage or loss, including war, terrorism acts, and pollution risks. The company also carries workers' compensation, maritime employer's liability, directors and officers’ liability, general liability (including third party pollution) and other insurance customary in the industry.
ITEM 1B. UNRESOLVED STAFF COMMENTS
The company has previously disclosed that it is the subject of an informal inquiry by the Securities and Exchange Commission (SEC) related to the $26.5 million impairment charge that it recorded in its fiscal year ended March 31, 2004 that was related to 83 vessels that had been used in the Gulf of Mexico. The

-12-
company is in discussions with the SEC in an effort to resolve the matters raised by the inquiry. At this time, the company is unable to predict the timing or ultimate outcome of these discussions.
ITEM 2. PROPERTIES
Information on Properties is contained in Item 1 of this Form 10-K.
ITEM 3. LEGAL PROCEEDINGS
The company is not a party to any litigation that, in the opinion of management, is likely to have a material adverse effect on the company's financial position or results of operations.
ITEM 4. SUBMISSION OF MATTERS TO A VOTE OF SECURITY HOLDERS
There were no matters submitted to a vote of security holders during the fourth quarter of fiscal 2006.

-13-
PART II
ITEM 5. MARKET FOR THE REGISTRANT'S COMMON STOCK AND RELATED STOCKHOLDER MATTERS
Common Stock Market Prices and Dividends
The company's common stock is traded on the New York Stock Exchange and the Pacific Stock Exchange under the symbol TDW. At March 31, 2006, there were approximately 1,369 record holders of the company's common stock, based upon the record holder list maintained by the company's stock transfer agent. The following table sets forth the high and low closing sale prices of the company's common stock as reported on the New York Stock Exchange Composite Tape and the amount of cash dividends per share declared on Tidewater common stock for the periods indicated.
Fiscal Year Quarter High Low Dividend
2006 First $ 40.23 $ 31.85 $ .15 Second 49.77 37.09 .15 Third 49.24 41.00 .15 Fourth 59.17 44.90 .15
2005 First $ 30.05 $ 25.74 $ .15 Second 33.50 26.90 .15 Third 36.45 29.61 .15 Fourth 42.84 33.39 .15
Issuer Repurchases of Equity Securities
In July 2005, the company’s Board of Directors authorized the company to spend up to $120.0 million to repurchase shares of its common stock. Repurchases are made through open market or privately-negotiated transactions. The company intends to use its available cash and, when considered advantageous, borrowings under its revolving credit facility to fund the share repurchases. The Board of Directors’ authorization for this repurchase program will expire when all authorized funds have been expended or on June 30, 2006, unless extended by the Board of Directors. As of March 31, 2006, the company spent $20.8 million for the repurchase and cancellation of 455,000 common shares, or an average price paid per common share of $45.64. At March 31, 2006, approximately $99.2 million was available to repurchase shares of the company’s common stock pursuant to the stock repurchase program. The following table summarizes the stock repurchase activity for the three months ending March 31, 2006 and the approximate dollar value of shares that may yet be purchased pursuant to the stock repurchase program:
Total Number of Shares
Purchased
Average Price Paid Per Share
Total Number of Shares Purchased as
Part of Publicly Announced Program
Approximate Dollar Value of Shares that
May Yet Be PurchasedUnder the Program
January 1, 2006 – January 31, 2006 --- $ --- --- $ 111,308,581
February 1, 2006 – February 28, 2006 90,000 52.55 90,000 106,578,738
March 1, 2006 - March 31, 2006 145,000 50.64 145,000 99,235,700
Total 235,000 $ 51.37 235,000

-14-
Securities Authorized for Issuance under Equity Compensation Plans
Please refer to Item 12 of this Annual Report on Form 10-K for information concerning common stock authorized for issuance under the company’s equity compensation plan.
ITEM 6. SELECTED FINANCIAL DATA
The following table sets forth a summary of selected financial data for each of the last five fiscal years. This information should be read in conjunction with "Management's Discussion and Analysis of Financial Condition and Results of Operations" and the Consolidated Financial Statements of the company included in this report.
Years Ended March 31 (In thousands, except ratio and per share amounts)
2006(B) 2005 (C) 2004 (D) 2003 2002 Statement of Earnings Data : Revenues: Vessel revenues $ 846,982 655,526 625,948 624,555 715,361 Other marine revenues 30,635 36,624 26,682 11,268 13,668
$ 877,617 692,150 652,630 635,823 729,029 Net earnings $ 235,756 101,339 41,662 88,630 136,159 Earnings per common share (A) $ 4.07 1.78 .73 1.57 2.41 Cash dividends declared per
common share $ .60 .60 .60 .60 .60
Balance Sheet Data (at end of period): Cash and cash equivalents $ 246,109 15,376 17,636 17,767 11,882 Total assets $ 2,364,540 2,213,173 2,081,790 1,849,578 1,669,370 Long-term debt $ 300,000 380,000 325,000 139,000 54,000 Stockholders’ equity $ 1,659,121 1,442,702 1,366,110 1,351,395 1,285,818 Working capital $ 413,289 133,643 152,585 141,225 152,891 Current ratio 4.57 2.42 3.12 2.95 3.07
Cash Flow Data: Net cash provided by operating activities $ 283,578 160,062 129,049 202,000 194,390 Net cash provided by (used in) investing activities $ 53,208 (189,125) (285,429) (255,931) (300,216) Net cash (used in) provided by financing activities $ (106,053) 26,803 156,249 59,816 22,555
(A) All per share amounts were computed on a diluted basis. (B) In July 2005, the company sold six KMAR 404 class of anchor handling towing supply vessels for a cash price of $188.0 million
resulting in a $65.9 million pre-tax financial gain or approximately $42.8 million after tax, or $0.74 per diluted common share. (C) In March 2005, the company recorded a tax benefit of $31.8 million ($0.56 per share) to reverse previously recorded deferred tax
assets and liabilities no longer required as a result of the American Jobs Creation Act of 2004 (for a full discussion see note 4 of Notes to Consolidated Financial Statements).
(D) In March 2004, the company recorded a non-cash asset impairment charge of $26.5 million ($17.2 million after tax, or $0.30 per share) on 83 older Gulf of Mexico supply vessels. A full discussion of the impairment of long-lived assets is disclosed in “Impairment of Long-lived Assets” section of Item 7 and Note 3 of Notes to Consolidated Financial Statements.

-15-
ITEM 7. MANAGEMENT'S DISCUSSION AND ANALYSIS OF FINANCIAL CONDITION AND RESULTS OF OPERATIONS
Forward-looking Information and Cautionary Statement
In accordance with the safe harbor provisions of the Private Securities Litigation Reform Act of 1995, the company notes that this Annual Report on Form 10-K and the information incorporated herein by reference contain certain forward-looking statements which reflect the company’s current view with respect to future events and financial performance. Any such forward-looking statements are subject to risks and uncertainties and the company’s future results of operations could differ materially from historical results or current expectations. Some of these risks are discussed in this report, and include, without limitation, fluctuations in oil and gas prices; level of fleet additions by competitors and industry overcapacity; changes in capital spending by customers in the energy industry for exploration, development and production; changing customer demands for different vessel specifications which may make some of our vessels technologically obsolete for certain customer projects or in certain markets; acts of terrorism; significant weather conditions; unsettled political conditions, war, civil unrest and governmental actions, especially in higher risk countries of operations; foreign currency fluctuations; and environmental and labor laws.
Forward-looking statements, which can generally be identified by the use of such terminology as “may,” “expect,” “anticipate,” “estimate,” “forecast,” “believe,” “think,” “could,” “will,” “continue,” “intend,” “seek,” “plan,” “should,” “would” and similar expressions contained in this report, are predictions and not guarantees of future performance or events. Any forward-looking statements are based on current industry, financial or economic information, which the company has assessed but which by its nature is dynamic and subject to rapid and possibly abrupt changes. The company’s actual results could differ materially from those stated or implied by such forward-looking statements due to risks and uncertainties associated with our business. The forward-looking statements should be considered in the context of the risk factors listed above and discussed elsewhere in this Form 10-K. Investors and prospective investors are cautioned not to place undue reliance on such forward-looking statements. Management disclaims any obligation to update or revise the forward-looking statements contained herein to reflect new information, future events or developments.
Executive Summary and Overview
The company provides services and equipment to the global offshore energy industry through the operation of a diversified fleet of marine service vessels. Revenues, net earnings and cash flows from operations are dependent upon the activity level of the vessel fleet that is ultimately dependent upon oil and natural gas prices that, in turn, are determined by the supply/demand relationship for oil and natural gas. The following discussion should be read in conjunction with the Selected Financial Data and the Consolidated Financial Statements and related disclosures.
Fiscal 2006 domestic results of operations improved significantly as compared to fiscal 2005. The company’s domestic-based revenues and operating profit increased approximately $62.1 million and $59.2 million, respectively, during the current fiscal year due to favorable commodity prices and an improved operating environment which resulted in increased demand for the company’s vessels which in turn resulted in an escalation of vessel dayrates. A significant portion of the company’s increase in domestic-based revenues went directly to operating profit because operating costs and depreciation did not change proportionally when revenue changed. Hurricanes Katrina and Rita caused extensive damage to the energy industry infrastructure in the Gulf of Mexico and along the U.S. Gulf Coast resulting in an interruption in oil and gas production in the Gulf of Mexico. Given the damage sustained to the offshore oil and gas infrastructure, management anticipates its vessels to be in high demand in the Gulf of Mexico for the near term while repairs are made to offshore pipelines and platforms. Fiscal 2006’s domestic-based operating costs increased a modest 4% as compared to fiscal 2005. The number of available drilling rigs in the U.S. market will be the primary driver of the company’s future profitability in the domestic market. The strength of the international drilling market has attracted offshore rigs from the U.S. market over the past few years. Over the longer term, the company’s domestic-based fleet utilization will be influenced more by the active offshore rig count than by any other single outside influence, although the number of available units of competitor companies will also have a significant effect.
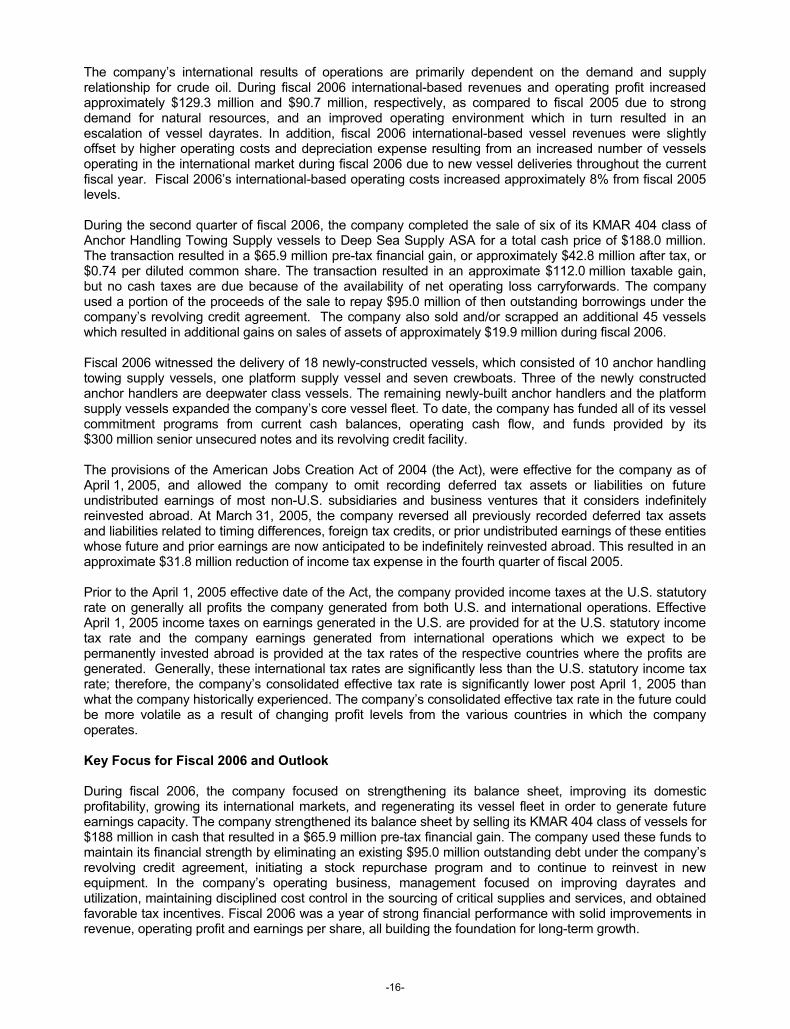
-16-
The company’s international results of operations are primarily dependent on the demand and supply relationship for crude oil. During fiscal 2006 international-based revenues and operating profit increased approximately $129.3 million and $90.7 million, respectively, as compared to fiscal 2005 due to strong demand for natural resources, and an improved operating environment which in turn resulted in an escalation of vessel dayrates. In addition, fiscal 2006 international-based vessel revenues were slightly offset by higher operating costs and depreciation expense resulting from an increased number of vessels operating in the international market during fiscal 2006 due to new vessel deliveries throughout the current fiscal year. Fiscal 2006’s international-based operating costs increased approximately 8% from fiscal 2005 levels.
During the second quarter of fiscal 2006, the company completed the sale of six of its KMAR 404 class of Anchor Handling Towing Supply vessels to Deep Sea Supply ASA for a total cash price of $188.0 million. The transaction resulted in a $65.9 million pre-tax financial gain, or approximately $42.8 million after tax, or $0.74 per diluted common share. The transaction resulted in an approximate $112.0 million taxable gain, but no cash taxes are due because of the availability of net operating loss carryforwards. The company used a portion of the proceeds of the sale to repay $95.0 million of then outstanding borrowings under the company’s revolving credit agreement. The company also sold and/or scrapped an additional 45 vessels which resulted in additional gains on sales of assets of approximately $19.9 million during fiscal 2006.
Fiscal 2006 witnessed the delivery of 18 newly-constructed vessels, which consisted of 10 anchor handling towing supply vessels, one platform supply vessel and seven crewboats. Three of the newly constructed anchor handlers are deepwater class vessels. The remaining newly-built anchor handlers and the platform supply vessels expanded the company’s core vessel fleet. To date, the company has funded all of its vessel commitment programs from current cash balances, operating cash flow, and funds provided by its $300 million senior unsecured notes and its revolving credit facility.
The provisions of the American Jobs Creation Act of 2004 (the Act), were effective for the company as of April 1, 2005, and allowed the company to omit recording deferred tax assets or liabilities on future undistributed earnings of most non-U.S. subsidiaries and business ventures that it considers indefinitely reinvested abroad. At March 31, 2005, the company reversed all previously recorded deferred tax assets and liabilities related to timing differences, foreign tax credits, or prior undistributed earnings of these entities whose future and prior earnings are now anticipated to be indefinitely reinvested abroad. This resulted in an approximate $31.8 million reduction of income tax expense in the fourth quarter of fiscal 2005.
Prior to the April 1, 2005 effective date of the Act, the company provided income taxes at the U.S. statutory rate on generally all profits the company generated from both U.S. and international operations. Effective April 1, 2005 income taxes on earnings generated in the U.S. are provided for at the U.S. statutory income tax rate and the company earnings generated from international operations which we expect to be permanently invested abroad is provided at the tax rates of the respective countries where the profits are generated. Generally, these international tax rates are significantly less than the U.S. statutory income tax rate; therefore, the company’s consolidated effective tax rate is significantly lower post April 1, 2005 than what the company historically experienced. The company’s consolidated effective tax rate in the future could be more volatile as a result of changing profit levels from the various countries in which the company operates.
Key Focus for Fiscal 2006 and Outlook
During fiscal 2006, the company focused on strengthening its balance sheet, improving its domestic profitability, growing its international markets, and regenerating its vessel fleet in order to generate future earnings capacity. The company strengthened its balance sheet by selling its KMAR 404 class of vessels for $188 million in cash that resulted in a $65.9 million pre-tax financial gain. The company used these funds to maintain its financial strength by eliminating an existing $95.0 million outstanding debt under the company’s revolving credit agreement, initiating a stock repurchase program and to continue to reinvest in new equipment. In the company’s operating business, management focused on improving dayrates and utilization, maintaining disciplined cost control in the sourcing of critical supplies and services, and obtained favorable tax incentives. Fiscal 2006 was a year of strong financial performance with solid improvements in revenue, operating profit and earnings per share, all building the foundation for long-term growth.

-17-
Given the progress the company has made in executing its strategies, the company is poised to continue to grow organically and, given the right opportunity, to grow through targeted and disciplined acquisitions. The company will continue to pursue its long-term growth strategies on a disciplined basis. The company has targeted two additional dimensions within its growth initiatives to include (1) assessing opportunities for its older fleet; and (2) targeted acquisitions. In each case, the company will carefully consider whether proposed transactions have the appropriate risk/reward profile. These areas of opportunity have a common theme which is to leverage the company’s existing strengths and capitalize on favorable market conditions to improve operating profit, earnings per share and cash flows.
Vessel Construction Programs and Acquisitions
Current Commitments
The company is constructing five anchor handling towing supply vessels varying in size from 5,000 brake horsepower (BHP) to 10,000 BHP. One international shipyard is constructing two vessels while a different international shipyard is constructing three vessels. Scheduled delivery for the five vessels will begin in July 2006, with the last vessel scheduled for delivery in December 2007. As of March 31, 2006, $32.9 million has been expended on the vessels of the total $80.8 million commitment cost.
The company is also committed to the construction of two 220-foot and three 250-foot supply vessels for approximately $78.7 million. The company’s shipyard, Quality Shipyard, LLC, is constructing the two 220-foot vessels while a different U.S. shipyard is constructing the 250-foot vessels. Scheduled delivery of the two 220-foot vessels is expected in August 2006 and July of 2007 while the three 250-foot vessels are expected to be delivered in March 2007, June 2007 and September 2007. As of March 31, 2006, $23.5 million has been expended on these five vessels.
The company is also committed to the construction of one 175-foot, state-of-the-art, fast, crew/supply boat, one water jet crewboat and one tugboat for an approximate total cost of $15.7 million. A U.S. shipyard is constructing the 175-foot crewboat, while one international shipyard is constructing the water jet crewboat and a different international shipyard is constructing the tugboat. Scheduled delivery of the 175-foot crewboat is expected in July 2006. The water jet crewboat was delivered in April 2006 while the tugboat is expected to be delivered in February of 2007. As of March 31, 2006, $4.6 million has been expended on these three vessels.
The company has also contracted for the construction of a new corporate aircraft for a total approximate cost of $27.0 million. As of March 31, 2006, $3.7 million has been spent. The airplane is expected to be available for use in May of 2007.
Current Vessel Commitments Summary
The table below summarizes the various vessel commitments by vessel class and type as of March 31, 2006:
U. S. Built International Built Number Total Expended Number Total Expended
of Cost Through of Cost Through Vessel class and type Vessels Commitment 3/31/06 Vessels Commitment 3/31/06
(In thousands) (In thousands) Deepwater vessels: Platform supply vessels 3 $51,923 $15,094 --- --- --- Replacement fleet: Anchor handling towing supply --- --- --- 5 $80,841 $32,900 Platform supply vessels 2 $26,832 $8,421 --- --- --- Crewboats and offshore tugs: Crewboats – 175-foot 1 $7,229 $474 --- --- --- Crewboats – water jet --- --- --- 1 $1,086 $895 Offshore tugs --- --- --- 1 $7,401 $3,187 Totals 6 $85,984 $23,989 7 $89,328 $36,982

-18-
While the company does not have any other commitments for new-build vessel contracts other than what is discussed above, the company anticipates that over the next several years, it will continue to build, acquire or lease newer vessels in order to replace its aging vessels. The majority of the company’s supply and towing supply vessels were constructed between 1976 and 1983. As such, most of this vessel class exceeds 22 years of age and will need to be replaced within the next several years. In addition to age, market conditions also help determine when a vessel is no longer economically viable. The company anticipates using future operating cash flows, existing borrowing capacities or new borrowings or lease arrangements to fund over the next few years the continuing replacement of the company’s mature fleet of vessels. These vessels would replace the company’s core international fleet with fewer, larger and more efficient vessels. The company believes that adequate capital resources will be available to continue its fleet replacement.
Fiscal 2006 Vessel Deliveries and Acquisitions
During fiscal 2006, the company delivered two large anchor handling towing supply vessels, with BHP in excess of 25,000, that are capable of working in most deepwater markets of the world. A Chinese shipyard constructed the vessels for an approximate cost of $70.4 million which includes shipyard commitments and other incidental costs such as spare parts, management and supervision, and outfitting costs. The Chinese shipyard also constructed and delivered in December 2005, for approximately $37.3 million, a third large anchor handling towing supply vessel to a second shipyard that modified and outfitted the vessel. This vessel was delivered to the company in April 2006.
The company delivered to the market seven anchor handling towing supply vessels varying in size from 6,500 to 8,000 BHP. The vessels were delivered by four international shipyards during fiscal 2006 for an approximate cost of $81.8 million.
The company also delivered to the market during fiscal 2006 one 220-foot, platform supply vessel for approximately $12.0 million. The company’s shipyard, Quality Shipyard, LLC, constructed the vessel which is capable of working in domestic and international markets and was built to replace older supply vessels.
During fiscal 2006, the company delivered to the market one 175-foot, state-of-the-art, fast, crew/supplyboat from a U.S. shipyard and six water jet crewboats from a shipyard in Holland for an approximate total cost of $13.4 million.
Fiscal 2005 Vessel Deliveries and Acquisitions
During fiscal 2005, the company took delivery of two deepwater anchor handling towing supply vessels and five anchor handling towing supply vessels varying in size from 6,500 to 8,000 BHP. A shipyard in China constructed the two deepwater anchor handling towing supply vessels, with a BHP in excess of 25,000, for an approximate cost of $68.6 million. The first China built deepwater vessel was delivered during the second quarter of fiscal 2005. The second deepwater anchor handler was delivered in March 2005 to a second shipyard that modified and outfitted the vessel before being delivered to the company in August 2005. All five of the anchor handling towing supply vessels were built by international shipyards for an approximate total cost of $74.8 million.
The company also took delivery of one U.S.-built platform supply vessel, three U.S.-built 175-foot crewboats and one water jet crewboat built in Holland during fiscal 2005 for an approximate total cost of $32.4 million. The platform supply vessel was built in order to replace older supply vessels and is intermediate in size and technically capable of working in certain domestic and international deepwater markets. Also during fiscal 2005, the company purchased three 5,500 to 6,500 BHP anchor handling towing supply vessels for approximately $39.6 million and one platform supply vessel for approximately $16.3 million.
Fiscal 2004 Vessel Deliveries and Acquisitions
On April 1, 2003, the company paid $79.0 million in cash to ENSCO International Incorporated to purchase its 27-vessel Gulf of Mexico-based marine fleet. The mix of vessels the company acquired consisted of five anchor handling towing supply vessels, six stretched 220-foot platform supply vessels and 16 supply

-19-
vessels. In conjunction with the acquisition of the vessels, it was agreed that, for a two year period and subject to satisfactory performance, the company would provide to ENSCO all of its discretionary vessel requirements in the Gulf of Mexico. The day rates charged under the arrangement were based upon predetermined pricing criteria. The original agreement expired on March 31, 2005 and a one year extension under similar terms was agreed to which expired on March 31, 2006. A second one year extension has been agreed to which will expire on March 31, 2007.
During fiscal 2004, the company took delivery of two large, platform supply vessels (one constructed by a Brazilian shipyard and the other by a shipyard in the Far East). The company also took delivery of nine next generation supply vessels, ranging in size from 205-foot to 220-foot, for approximately $133.2 million. The company’s shipyard, Quality Shipyard, LLC, constructed three of the next generation supply vessels and two other U.S. shipyards constructed the remaining six vessels. Although the nine vessels are intermediate in size and are technically capable of working in certain deepwater markets, they were constructed to replace older supply vessels. Also during fiscal 2004, the company purchased two 5,500 BHP anchor handling towing supply vessel for approximately $24.4 million, purchased one offshore tug for approximately $4.3 million and took delivery of three water jet crewboats that were constructed in Holland for approximately $2.7 million.
During fiscal 2004, the company constructed and delivered to the market, for an approximate total cost of $10.6 million, two crewboats whose construction contracts the company assumed from Crewboats, Inc., a privately held, independent provider of crewboat services in the Gulf of Mexico during fiscal 2002.
The company also delivered to the market during fiscal 2004, for an approximate total cost of $19.7 million, three 175-foot, state-of-the-art, fast, crew/supply boats that blend the speed of a crewboat with the capabilities of a supply vessel. All three vessels were constructed at a U.S. shipyard that is currently constructing one additional 175-foot, fast, crew/supply boats as discussed above.
Vessel Deliveries and Acquisitions Summary
The table below summarizes the number of vessels that have been added to the company’s fleet, excluding 27 vessels purchased from ENSCO on April 1, 2003, during fiscal 2006, 2005 and 2004 by vessel class and vessel type:
Number of vessels added Vessel class and type 2006 2005 2004 Deepwater vessels: Anchor handling towing supply 3 2 --- Platform supply vessels --- 2 Replacement fleet: Anchor handling towing supply 7 8 2 Platform supply vessels 1 2 9 Crew/utility: Crewboats 7 4 8 Offshore tugs --- --- 1 Total number of vessels added to the fleet 18 16 22
Impairment of Long-lived Assets
During fiscal 2004, numerous marine drilling rigs exited the U.S. Gulf of Mexico despite attractive domestic oil and gas commodity pricing for an extended period of time. These departures, combined with the low activity levels of traditional Gulf of Mexico operators, left the active offshore rig count at its lowest level in ten years. By late fiscal 2004, the company concluded, based on mounting extrinsic evidence that low activity levels in the Gulf of Mexico could possibly persist for an extended period of time. Management reviewed the recoverability of the values of its Gulf of Mexico operating assets and recorded in March 2004 a non-cash asset impairment charge of $26.5 million ($17.2 million after tax, or $0.30 per share) relating to 83 older Gulf of Mexico supply vessels. As a result of the prolonged weakness in the Gulf of Mexico drilling market, a majority of the vessels were stacked for as long as several years and were viewed as unlikely to return to service. Due to the average age of the vessels (23.5 years), outdated specifications (low horsepower and cargo capacities) relative to competing equipment, significant costs to repair and return the vessels to service (average approximately $500,000 per vessel) and an anticipation of low customer demand for the vessels in the future, the company concluded it was unlikely that these vessels would return to active
-20-
service. Based on such factors, and in accordance with Statement of Financial Accounting Standards (SFAS) No. 144, “Accounting for the Impairment or Disposal of Long-Lived Assets,” the asset impairment charge noted above was taken to adjust the carrying value of the assets to fair value at March 31, 2004. The fair value of the vessels was determined based upon management’s estimate of liquidation values that could be realized in sales to unrelated purchasers and included an assumption that a significant number of the vessels (as much as 50%) may have to be scrapped. Disposal of the assets may take an extended period of time due to the vessels’ outdated specifications. Two vessels from this group of impaired vessels were sold during fiscal 2005 and an additional 22 impaired vessels were sold and/or scrapped during fiscal 2006.
The company has previously disclosed that it is the subject of an informal inquiry by the Securities and Exchange Commission (SEC) related to the $26.5 million impairment charge that it recorded in its fiscal year ended March 31, 2004 that was related to 83 stacked vessels that had been used in the Gulf of Mexico. The company is in discussions with the SEC in an effort to resolve the matters raised by the inquiry. At this time, the company is unable to predict the timing or ultimate outcome of these discussions.
In the fourth quarter of fiscal 2005, the company reviewed, for impairment purposes, all stacked vessels and vessels withdrawn from service and recorded a non-cash impairment charge of $1.7 million ($1.1 million after tax, or $0.02 per share) to reduce the carrying amount of 10 stacked vessels as to which an impairment charge had not been taken in fiscal 2004 but which were subsequently identified as being unlikely to return to active service. An impairment review during fiscal 2006 resulted in a non-cash impairment charge of approximately $3.1 million ($2.0 million after tax, or $0.03 per share) on eight additional vessels that are withdrawn from service as to which an impairment charge had not been taken previously.
General Market Conditions and Results of Operations
Offshore service vessels provide a diverse range of services and equipment to the energy industry. Fleet size, utilization and vessel day rates primarily determine the amount of revenues and operating profit because operating costs and depreciation do not change proportionally when revenue changes. Operating costs primarily consist of crew costs; repair and maintenance; insurance; fuel, lube oil and supplies. Fleet size and utilization are the major factors that affect crew costs. The timing and amount of repair and maintenance costs are influenced by customer demands, vessel age and scheduled drydockings to satisfy safety and inspection requirements mandated by regulatory agencies. Whenever possible, vessel drydockings are scheduled in order to minimize any impact on vessel operations and are only done if economically justified, given the vessel's age and physical condition. The following table compares revenues and operating expenses (excluding general and administrative expenses and depreciation expense) for the company’s vessel fleet for the years ended March 31. Vessel revenues and operating costs relate to vessels owned and operated by the company, while other marine services relate to third-

-21-
party activities of the company's shipyards, brokered vessels and other miscellaneous marine-related activities. (In thousands) 2006 2005 2004 Revenues (A): Vessel revenues: United States $ 180,374 118,288 125,344 International 666,608 537,238 500,604 846,982 655,526 625,948 Other marine revenues 30,635 36,624 26,682 Total revenues $ 877,617 692,150 652,630 Operating costs: Vessel operating costs: Crew costs $ 243,584 226,653 213,687 Repair and maintenance 76,058 70,519 76,975 Insurance 15,820 18,568 20,638 Fuel, lube and supplies 39,617 40,329 38,309 Other 56,402 45,802 45,090 431,481 401,871 394,699 Costs of other marine revenues 23,836 29,453 21,502 Total operating costs $ 455,317 431,324 416,201
(A) For fiscal 2006, 2005 and 2004, Chevron Corporation (including its worldwide subsidiaries and affiliates) accounted for 15%,13.2% and 12.0%, respectively, of revenues while Petroleo Brasileiro SA accounted for 10.2% of revenue during fiscal 2005.
Marine operating profit (loss) and other components of earnings before income taxes for the years ended March 31 consists of the following:
(In thousands) 2006 2005 2004 Vessel activity: United States $ 61,227 2,022 (17,715) International 186,044 95,383 96,316
247,271 97,405 78,601 Impairment of long-lived assets (3,050) (1,733) (26,456) Gain on sales of assets 86,337 11,977 7,075 Other marine services 6,511 6,623 4,623 Operating profit 337,069 114,272 63,843 Other income 16,797 7,589 7,634 Corporate expenses (21,280) (15,179) (13,291) Interest and other debt costs (9,074) (6,887) (3,683) Earnings before income taxes $ 323,512 99,795 54,503
As a result of the uncertainty of a certain customer to make payment of vessel charter hire, the company has deferred the recognition of approximately $6.1 million of billings as of March 31, 2006, $1.6 million of billings as of March 31, 2005 and $3.1 million of billings as of March 31, 2004 which would otherwise have been recognized as revenue. The company will recognize the amounts as revenue as cash is collected or at such time as the uncertainty has been resolved.
Comparison of Fiscal 2006 to Fiscal 2005
Fiscal 2006 domestic results of operations benefited from strong industry fundamentals which translated into higher utilization and average day rates for the company’s domestic-based vessel fleet. Prospects for growth in the offshore market in the Gulf of Mexico have shown significant improvement during the past year. However, Hurricanes Katrina and Rita have caused extensive damage to the energy industry infrastructure in the Gulf of Mexico and along the U.S. Gulf Coast resulting in an interruption in oil and gas production in the Gulf of Mexico. The U.S. Minerals Management Service (MMS) statistical report on production shut-ins due to Hurricanes Katrina and Rita dated March 22, 2006 reported that total shut-in oil production, for the period of September 26, 2005 to March 22, 2006, totaled approximately 25% of the yearly U.S. Gulf oil production. During this same period of time, natural gas shut-in totaled approximately 19% of the yearly U.S. Gulf gas production as reported by MMS. Pre-storm offshore rig demand improved greatly and drilling activity was forecast to remain at improved levels well into 2006. The exploration and production (E&P) companies have contracted offshore drilling rigs for longer durations than in past periods due to concerns over rig availability in the domestic market. The market for offshore support vessels

-22-
tightened as drilling operators discovered that offshore vessels currently in service are in short supply. The Gulf of Mexico supply boat market still has a significant number of vessels stacked that could resume active status, but only after expenditures to drydock to re-certify the vessels. The company did not experience any injuries to its personnel or damage or interruption of service to its fleet of vessels serving the offshore oil and gas industry in the Gulf of Mexico due to Hurricanes Katrina and Rita. The aftermath of the storms did not have any material impact on the company’s ability to respond to customer needs or its ability to fulfill contract commitments. Demand for the company’s available domestic-based vessels prior to the two storms was strong and business has been brisk since the storms, with charter rates exceeding levels that were achieved in prior industry upturns in 1997 and 2001.
Domestic results of operations are primarily driven by natural gas exploration and production and, given the damage sustained to the offshore oil and gas infrastructure, management anticipates its vessels to be in high demand in the Gulf of Mexico for the near term while repairs are made to offshore pipelines and platforms. While the repair work in the Gulf of Mexico is expected to keep domestic-based vessel demand high for the near term, the offshore rig count in the Gulf of Mexico remains relatively depressed as compared to past up cycles. The uptick in domestic-based business during the second half of fiscal 2006 is related to the repair work resulting from damage caused by Hurricanes Katrina and Rita. Upon completion of the needed repair work in the U.S. Gulf of Mexico, and assuming no significant damage from any hurricanes during 2006, the number of available drilling rigs in the U.S. market will be the primary driver of the company’s future profitability in the domestic market. The strength of the international drilling market has attracted offshore rigs from the U.S. market over the past few years. This capacity constraint is forcing some E&P companies to delay drilling programs. Over the longer term, the company’s domestic-based fleet will be influenced more by the active offshore rig count than by any other single outside influence. Recent analysts’ reports indicate that over the next 4 years offshore drilling rig count will increase as the newbuild order books for jackup rigs currently stand at approximately 62 rigs. Nine of these rigs are scheduled to be delivered in calendar 2006 while calendar years 2007, 2008 and 2009 expect to have 21, 26 and 6 rig deliveries, respectively.
Historically, the company’s international results of operations have been primarily dependent on the supply and demand relationship for crude oil and crude oil prices are presently at historically high levels. The company’s fiscal 2006 international results of operations benefited from higher average day rates, utilization and an increase in the number of vessels operating internationally. Improvements in the company’s average day rates and utilization are due to increases in international E&P spending and an increase in rig utilization in the international arena. Industry analysts are forecasting that demand for crude oil will likely remain strong throughout calendar year 2006 and expect future crude oil prices to remain at high levels due to strong domestic and international demand, tight crude oil inventory supplies and continued concerns over possible supply interruptions caused by geopolitical risk in certain countries that are members of the Organization of Petroleum Exporting Countries (OPEC). Analysts also forecast that calendar year 2006 E&P spending in the international markets will increase approximately 15% from amounts spent in calendar 2005. Management anticipates international vessel demand will continue to improve along with these market conditions, although the demand will be limited by the availability of drilling and production units to serve the industry. There are also a number of vessels under construction in the industry that will enter into service in the coming year that will increase the available supply of vessels to satisfy customer demands.
The company’s properties and equipment were unaffected by Hurricanes Katrina and Rita, which affected the Gulf Coast region of the United States. The company’s fleet of vessels operating in the Gulf of Mexico did not sustain any damage and the company's main operational base in Amelia, Louisiana suffered only power and telephone outages. The company's corporate headquarters located in New Orleans, Louisiana did not sustain damage but was inaccessible for business for approximately three months. During this period, the company’s New Orleans based staff personnel were assigned to the company’s main operational base in Amelia, Louisiana while the company’s senior management group operated from the company’s Houston, Texas office. The company’s shipyard, Quality Shipyards, LLC located in Houma, Louisiana also did not sustain any damage. All international operations of the company were unaffected by the two storms. The company's corporate headquarters are accessible for business and its New Orleans based staff personnel have resumed operations in New Orleans while the company’s senior management group operates in both the New Orleans and Houston offices. The company maintains insurance against property damage, including extra-expense coverage which covers costs incurred to continue as nearly as practicable the normal operations of the business.
-23-
Domestic-based vessel revenues increased approximately 53%, or $62.1 million, during fiscal 2006 as compared to fiscal 2005 due to an increase in utilization rates and average day rates on all classes of vessels operating in the domestic market. The company’s deepwater class of vessels contributed approximately 24% of revenue growth during fiscal 2006 as compared to fiscal 2005. Active towing supply/supply vessels, the company’s most significant income producing vessel class in the domestic market, generated approximately 55% of the revenue growth during the same comparative period, while the crew/utility class contributed 15% of the revenue growth during the same comparative period. The company’s offshore tugs also had a positive contribution to the revenue increase generating 5% of the revenue growth during fiscal 2006 as compared to fiscal 2005.
Utilization rates on the company’s domestic-based deepwater class of vessels increased approximately 14% during fiscal 2006 as compared to fiscal 2005 while average day rates for the deepwater vessels increased 41% during the comparative period. Utilization rates and average day rates for the domestic-based towing supply/supply vessels increased approximately 12% and 43%, respectively, during fiscal 2006 as compared to fiscal 2005. Utilization rates on the company’s domestic-based crew/utility class of vessels increased approximately 13% during fiscal 2006 as compared to fiscal 2005 while average day rates for the crew/utility class of vessels increased approximately 38% during the same comparative period. Lastly, utilization rates and average day rates on the domestic-based offshore tugs increased approximately 7% and 28%, respectively, during fiscal 2006 as compared to fiscal 2005.
U.S.-based operating profit increased approximately $59.2 million during fiscal 2006 as compared to fiscal 2005 due to higher revenues. Revenues generated during fiscal 2006 were slightly offset by higher vessel operating costs, specifically crew costs which increased due to competitive pressure on wages rates.
International-based vessel revenues increased approximately 24%, or $129.4 million, during fiscal 2006 as compared to fiscal 2005 due to an increase in average day rates on all vessel classes. The company’s international deepwater class, towing supply/supply class and crew/utility class of vessels generated approximately 22%, 64% and 10%, respectively, of the revenue growth during fiscal 2006 as compared to fiscal 2005. The company’s offshore tugs and other class of vessel also made positive contributions to fiscal 2006’s revenue growth, each contributing approximately 4% and 1%, respectively, to the increase in revenues earned. Revenues also improved due to an increase in total utilization of the international-based fleet which increased 3% during fiscal 2006 as compared to fiscal 2005.
International-based vessel operating profit increased 95%, or $90.7 million, during fiscal 2006 as compared to fiscal 2005 primarily due to higher revenues. Higher revenues were partially offset by increases in crew costs (resulting from an increase of vessels operating in the international market and due to additional United Kingdom multi-employer retirement fund expense) and depreciation expense resulting from an increase in the number of vessels operating in the international market. Increases in depreciation expense is a result of adding newly built vessels to the company’s fleet of vessels.
During the first quarter of fiscal 2006, the company performed a thorough review of all vessels withdrawn from service and stacked vessels in the company’s fleet and during the third quarter of fiscal 2006, the company performed a thorough review of all vessels in its fleet for asset impairment. The reviews resulted in a December 2005 impairment charge of $3.1 million on eight vessels withdrawn from service. The eight vessels were written down to each vessel’s respective estimated fair value. An impairment charge of $1.7 million was recorded in fiscal 2005 to reduce the carrying amount of 10 stacked vessels that were unlikely to return to active service.
Due to an improved safety record and lower claim costs and loss reserves, the company’s insurance and loss reserve costs decreased approximately 15% during fiscal 2006 as compared to fiscal 2005.
Other marine services operating profit which consist of operating profit on the company’s shipyard operations, brokered vessel and other marine services lines of business were comparable to fiscal 2005 levels.
Fiscal 2006 gain on sales of assets increased significantly as compared to fiscal 2005 due primarily to the July 26, 2005 sale of six KMAR 404 class of Anchor Handling Towing Supply vessels to Deep Sea Supply ASA for a total cash price of $188.0 million. The transaction resulted in a $65.9 million pre-tax financial gain,

-24-
or approximately $42.8 million after tax, or $0.74 per diluted common share. The company also sold and/or scrapped an additional 45 vessels which resulted in additional gains on sales of assets of approximately $19.9 million during fiscal 2006.
Comparison of Fiscal 2005 to Fiscal 2004
Persistent weakness in the natural gas drilling market in the U.S. Gulf of Mexico continued to negatively impact the company’s domestic results of operations during fiscal 2005; however, prospects for growth in the offshore drilling market in the Gulf of Mexico did show promise because of several positive developments that occurred during fiscal 2005. In August 2004, the Western Gulf of Mexico lease sale received solid bids. Bids for shallow water tracts were up and high bids for deepwater tracts increased from the previous year’s sale. The Texas State Lease Sale, which was held in January 2005, reported to have had its best showing in six years and the independent exploration and production (E&P) companies were dominant bidders at the Central Gulf of Mexico lease sales held in March 2005. Analysts forecast that worldwide E&P expenditures would increase in calendar year 2005 due to continuing strong demand for natural resources despite historically high crude oil prices and lofty natural gas prices. Sizeable portions of the increase in capital spending was expected to be spent in North America. Industry analysts reported that many companies planned on increasing their calendar year 2005 E&P budgets on deepwater activities in the Gulf of Mexico. Offshore rig demand was showing signs of strengthening and drilling activity was likely to improve. The E&P companies began to contract offshore drilling rigs for longer durations than in past periods due to concerns over rig availability in the domestic market. The market for offshore support vessels tightened during fiscal 2005 as drilling operators discovered that offshore vessels then in service were in short supply. During fiscal 2005, the Gulf of Mexico supply boat market still had a significant number of vessels stacked that could have resumed active status, but only after significant expenditures to drydock and re-certify the vessels.
Natural gas pricing is a critical factor in E&P companies’ development of capital spending budgets. Weather was a major driver of natural gas pricing during calendar year 2004. The latter half of calendar 2004 witnessed natural gas inventories exceed five-year inventory averages due to mild summer and winter weather. Disappointing storage withdrawals due to the mild weather applied downward pressure on natural gas commodity prices. The downward pricing trend appeared to reverse during the first quarter of calendar year 2005 as inventories for natural gas began decreasing. Management was pleased by the strength that developed in the offshore drilling market during fiscal 2005 despite the challenge presented in predicting how domestic-based vessel demand would be affected in the upcoming quarters.
The company’s international results of operations for fiscal 2005 benefited from higher utilization and average day rates and an increase in the number of vessels operating internationally. Industry analysts forecast that demand for crude oil would remain strong throughout calendar year 2005 and beyond and expected future crude oil prices to remain at attractive levels due to high consumer demand, a tightening of crude inventory supplies and concerns over possible supply interruptions caused by geopolitical risk in certain members of the Organization of Petroleum Exporting Countries (OPEC) countries. During fiscal 2005, analysts estimated that profitable international offshore markets would receive notable increases in exploration and production spending in 2005 due to strong demand for crude oil and higher commodity prices for the resource. Management anticipated international vessel demand to improve along with the market conditions.
Domestic-based vessel revenues decreased approximately 6%, or $7.1 million, as compared to fiscal 2004 due to a decrease in the number of vessels operating in the domestic market resulting from the redeployment of vessels to international growth areas, an increase in vessel sales (specifically crewboats and offshore tugs) and lower utilization and average day rates on the company’s offshore tugs. Revenues generated by the towing supply/supply vessel class, the company’s major income producing vessel class in the domestic market, increased approximately 5% compared to fiscal 2004 due to a 26.6% increase in utilization and a 5% increase in average day rates.
International-based vessel revenues for fiscal 2005 increased approximately 7%, or $36.6 million, as compared to fiscal 2004 due to an increase in the number of vessels operating in international markets and due to higher utilization and average day rates on the company’s deepwater class of vessels, which contributed 56% of the increase in revenue growth for fiscal 2005 as compared to fiscal 2004. The

-25-
company’s towing supply/supply vessels operating in the international markets contributed 42% to fiscal 2005’s international revenue growth as compared to the previous fiscal year.
Other marine service revenues which consist of revenues earned on the company’s shipyard operations, brokered vessel and other marine services lines of business increased approximately 37%, or $9.9 million as compared to fiscal 2004. The company’s shipyard, Quality Shipyards, LLC generated 86% of the increase, or approximately $8.5 million as they performed more third party vessel construction, repair and refurbishments during fiscal 2005 than in fiscal 2004.
Fiscal 2005’s U.S.-based operating profit increased approximately $19.7 million as compared to fiscal 2004 due to a decrease in vessel operating costs, specifically crew costs and fuel, lube and supplies, and a reduction in depreciation expense primarily related to 83 older domestic-based towing supply/supply vessels that were determined impaired at March 31, 2004. Depreciation expense ceased on these 83 vessels when the carrying values of the vessels were written down to estimated current fair market value. The 83 vessels were determined impaired as a result of the prolonged weakness in the Gulf of Mexico drilling market and due to the vessels’ average age (23.5 years), their outdated specifications (low horsepower and cargo capacities) relative to competing equipment, the significant costs to repair and return these vessels to service (average approximately $500,000 per vessel), the anticipation of lower customer demand for the vessels in the future, and management’s conclusion that it was unlikely that the vessels would return to active service. Based on this determination, and in accordance with SFAS No. 144, “Accounting for the Impairment or Disposal of Long-Lived Assets,” an asset impairment charge of $26.5 million was recorded to write down the carrying value of these assets to fair value at March 31, 2004. An impairment charge of $1.7 million was recorded in fiscal 2005 to reduce the carrying amount of 10 stacked vessels that are unlikely to return to active service.
International-based vessel operating profit was comparable to fiscal 2004 despite higher revenues due to increases in international vessel operating costs, specifically crew costs, fuel, lube and supplies, and depreciation expense resulting from an increase in the number of vessels (including vessels moved by the company from the Gulf of Mexico) operating in the international market.
Due to the level of vessel activity experienced and to a positive safety performance on a year to date basis, marine results of operations for fiscal 2005 includes $6.7 million of net insurance premium rebates as provided for in our insurance program. The company has an opportunity to obtain additional insurance premium rebates in the future should the positive safety performance continue. The company recorded $10.5 million of premium rebates during fiscal 2004.
Fiscal 2005’s gain on sales of assets increased approximately 69% compared to fiscal 2004 due to an increase in the number of vessels sold.
Vessel Class Statistics
Vessel utilization is determined primarily by market conditions and to a lesser extent by drydocking requirements. Vessel day rates are determined by the demand created through the level of offshore exploration, development and production spending by energy companies relative to the supply of offshore service vessels. Suitability of equipment and the degree of service provided also influence vessel day rates. Vessel utilization rates are calculated by dividing the number of days a vessel works during a reporting period by the number of days the vessel is available to work in the reporting period. Average day rates are calculated by dividing the revenue a vessel earns during a reporting period by the number of days the vessel worked in the reporting period. Vessel utilization and average day rates are calculated on active vessels only and, as such, do not include vessel withdrawn from active service or joint venture vessels.
Effective April 1, 2004, the company excluded from its utilization statistics the domestic-based towing supply/supply vessels determined impaired in March 2004 as disclosed in the “Impairment of Long-lived Assets” section of Item 7 and Note 3 of Notes to Consolidated Financial Statements. Had the impaired vessels been removed from the company’s utilization statistics for the quarter periods ended June 30, 2003, September 30, 2003, December 31, 2003, and March 31, 2004, domestic-based towing supply/supply utilization would have been 52.6%, 48.2%, 52.2% and 46.2%, respectively. The company’s towing supply/supply vessels utilization for the year ended March 31, 2004 would have been 49.8%. The following

-26-
tables compare day-based utilization percentages and average day rates by vessel class and in total for each of the quarters in the years ended March 31:
UTILIZATION:Fiscal Year 2006 First Second Third Fourth Year Domestic-based fleet: Deepwater vessels 100.0% 97.9 99.3 99.7 99.2 Towing-supply/supply 62.4 60.6 62.2 62.0 61.8 Crew/utility 80.6 86.6 88.0 86.6 85.5 Offshore tugs 26.2 26.4 32.7 30.8 28.9 Total 61.5% 61.9 65.0 64.5 63.2 International-based fleet: Deepwater vessels 85.5% 82.7 89.4 89.9 86.8 Towing-supply/supply 71.5 72.1 75.8 76.8 74.1 Crew/utility 75.2 74.1 79.9 76.2 76.4 Offshore tugs 57.5 46.4 63.0 63.3 57.5 Other 34.6 35.7 44.3 28.8 35.9 Total 70.9% 69.6 75.5 75.2 72.8 Worldwide fleet: Deepwater vessels 87.4% 85.2 91.1 91.7 88.8 Towing-supply/supply 69.7 69.9 73.2 74.0 71.7 Crew/utility 76.5 76.9 81.7 78.5 78.5 Offshore tugs 48.4 40.3 54.2 53.7 49.0 Other 34.6 35.7 44.3 28.8 35.9 Total 69.0% 68.0 73.3 72.9 70.8 Fiscal Year 2005 First Second Third Fourth Year Domestic-based fleet: Deepwater vessels 74.9% 94.1 91.7 91.6 87.2 Towing-supply/supply 50.7 54.6 57.6 57.1 55.0 Crew/utility 68.1 80.3 77.1 80.0 76.0 Offshore tugs 28.6 29.3 24.6 25.1 27.1 Total 51.2% 57.4 57.2 58.0 55.8 International-based fleet: Deepwater vessels 72.6% 87.9 91.8 84.8 84.5 Towing-supply/supply 68.7 68.5 72.2 70.9 70.1 Crew/utility 75.1 74.0 77.0 75.7 75.5 Offshore tugs 64.1 68.3 62.2 61.6 64.0 Other 55.5 49.4 45.4 47.3 49.4 Total 69.2% 70.6 72.8 71.2 71.0 Worldwide fleet: Deepwater vessels 73.1% 89.0 91.8 85.7 84.9 Towing-supply/supply 65.0 65.7 69.3 68.3 67.1 Crew/utility 73.2 75.6 77.0 76.7 75.6 Offshore tugs 50.2 55.6 50.8 51.3 52.0 Other 55.5 49.4 45.4 47.3 49.4 Total 64.9% 67.7 69.5 68.5 67.7 Fiscal Year 2004 First Second Third Fourth Year Domestic-based fleet: Deepwater vessels 68.0% 84.3 89.1 81.6 80.8 Towing-supply/supply 24.1 20.6 21.9 19.2 21.5 Crew/utility 71.5 76.2 71.8 57.8 69.6 Offshore tugs 31.2 39.7 43.7 34.8 37.4 Total 34.2% 34.0 34.9 29.1 33.1 International-based fleet: Deepwater vessels 80.8% 78.2 82.3 72.5 78.4 Towing-supply/supply 73.2 69.3 69.3 64.8 69.1 Crew/utility 78.1 69.9 74.3 73.4 73.9 Offshore tugs 66.6 63.7 69.8 59.6 64.9 Other 48.6 40.1 42.3 42.7 43.5 Total 72.5% 67.8 70.0 65.5 68.9 Worldwide fleet: Deepwater vessels 78.3% 79.3 83.6 74.2 78.9 Towing-supply/supply 53.4 49.6 50.6 46.7 50.1 Crew/utility 75.9 71.9 73.5 68.9 72.5 Offshore tugs 53.3 54.7 59.9 50.3 54.6 Other 48.6 40.1 42.3 42.7 43.5 Total 58.7% 55.8 57.8 52.8 56.3

-27-
AVERAGE DAY RATES:Fiscal Year 2006 First Second Third Fourth Year Domestic-based fleet: Deepwater vessels $ 15,041 17,456 20,306 20,006 18,401 Towing-supply/supply 7,169 7,569 9,474 10,545 8,706 Crew/utility 3,843 4,238 5,080 5,455 4,673 Offshore tugs 9,191 11,110 10,146 9,707 10,060 Total $ 7,104 7,814 9,318 10,049 8,606 International-based fleet: Deepwater vessels $ 13,850 15,592 17,014 17,823 16,012 Towing-supply/supply 6,728 7,121 7,318 7,682 7,224 Crew/utility 3,292 3,306 3,444 3,541 3,399 Offshore tugs 4,960 5,847 6,129 5,735 5,669 Other 2,939 3,536 3,064 4,597 3,442 Total $ 6,648 7,046 7,284 7,635 7,162 Worldwide fleet: Deepwater vessels $ 14,029 15,933 17,640 18,272 16,448 Towing-supply/supply 6,803 7,194 7,667 8,140 7,467 Crew/utility 3,426 3,547 3,845 4,018 3,716 Offshore tugs 5,632 6,914 6,841 6,407 6,440 Other 2,939 3,536 3,064 4,597 3,442 Total $ 6,730 7,191 7,655 8,078 7,428 Fiscal Year 2005 First Second Third Fourth Year Domestic-based fleet: Deepwater vessels $ 12,678 12,577 13,289 14,009 13,087 Towing-supply/supply 5,569 5,794 6,194 6,741 6,080 Crew/utility 3,035 3,357 3,477 3,689 3,382 Offshore tugs 7,385 7,566 7,388 9,648 7,874 Total $ 5,736 5,909 6,136 6,735 6,117 International-based fleet: Deepwater vessels $ 12,680 11,847 12,553 13,165 12,552 Towing-supply/supply 6,050 6,202 6,288 6,561 6,279 Crew/utility 2,838 2,742 2,950 3,184 2,930 Offshore tugs 4,371 4,559 4,347 5,057 4,585 Other 1,579 1,262 1,201 1,418 1,375 Total $ 5,723 5,874 6,064 6,372 6,013 Worldwide fleet: Deepwater vessels $ 12,680 11,959 12,648 13,279 12,636 Towing-supply/supply 5,972 6,134 6,273 6,591 6,246 Crew/utility 2,889 2,904 3,073 3,303 3,042 Offshore tugs 5,045 5,074 4,793 5,691 5,145 Other 1,579 1,262 1,201 1,418 1,375 Total $ 5,726 5,881 6,076 6,433 6,032 Fiscal Year 2004 First Second Third Fourth Year Domestic-based fleet: Deepwater vessels $ 13,303 12,652 12,328 13,505 12,918 Towing-supply/supply 5,469 6,124 5,763 5,901 5,800 Crew/utility 2,827 2,879 2,897 3,108 2,914 Offshore tugs 7,015 7,306 6,089 5,791 6,539 Total $ 5,354 5,786 5,553 5,913 5,640 International-based fleet: Deepwater vessels $ 11,578 11,825 12,481 12,434 12,082 Towing-supply/supply 6,544 6,448 6,286 6,134 6,358 Crew/utility 2,945 3,135 3,040 2,927 3,010 Offshore tugs 4,318 4,737 4,590 4,326 4,496 Other 1,361 1,746 1,820 1,416 1,578 Total $ 5,904 6,011 5,937 5,750 5,902 Worldwide fleet: Deepwater vessels $ 11,871 12,001 12,454 12,662 12,247 Towing-supply/supply 6,349 6,394 6,196 6,096 6,262 Crew/utility 2,907 3,048 2,999 2,971 2,981 Offshore tugs 4,911 5,432 5,003 4,707 5,022 Other 1,361 1,746 1,820 1,416 1,578 Total $ 5,790 5,962 5,856 5,782 5,848
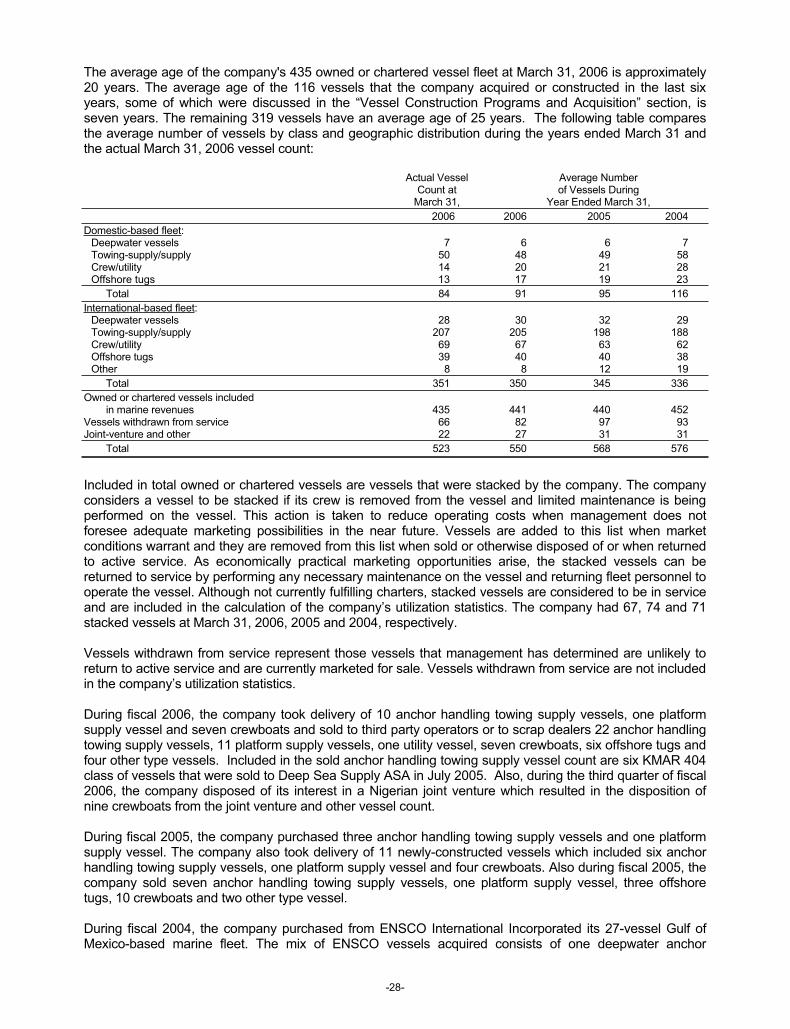
-28-
The average age of the company's 435 owned or chartered vessel fleet at March 31, 2006 is approximately 20 years. The average age of the 116 vessels that the company acquired or constructed in the last six years, some of which were discussed in the “Vessel Construction Programs and Acquisition” section, is seven years. The remaining 319 vessels have an average age of 25 years. The following table compares the average number of vessels by class and geographic distribution during the years ended March 31 and the actual March 31, 2006 vessel count:
Actual Vessel Average Number Count at of Vessels During March 31, Year Ended March 31, 2006 2006 2005 2004 Domestic-based fleet: Deepwater vessels 7 6 6 7 Towing-supply/supply 50 48 49 58 Crew/utility 14 20 21 28 Offshore tugs 13 17 19 23 Total 84 91 95 116 International-based fleet: Deepwater vessels 28 30 32 29 Towing-supply/supply 207 205 198 188 Crew/utility 69 67 63 62 Offshore tugs 39 40 40 38 Other 8 8 12 19 Total 351 350 345 336 Owned or chartered vessels included in marine revenues 435 441 440 452Vessels withdrawn from service 66 82 97 93Joint-venture and other 22 27 31 31 Total 523 550 568 576
Included in total owned or chartered vessels are vessels that were stacked by the company. The company considers a vessel to be stacked if its crew is removed from the vessel and limited maintenance is being performed on the vessel. This action is taken to reduce operating costs when management does not foresee adequate marketing possibilities in the near future. Vessels are added to this list when market conditions warrant and they are removed from this list when sold or otherwise disposed of or when returned to active service. As economically practical marketing opportunities arise, the stacked vessels can be returned to service by performing any necessary maintenance on the vessel and returning fleet personnel to operate the vessel. Although not currently fulfilling charters, stacked vessels are considered to be in service and are included in the calculation of the company’s utilization statistics. The company had 67, 74 and 71 stacked vessels at March 31, 2006, 2005 and 2004, respectively.
Vessels withdrawn from service represent those vessels that management has determined are unlikely to return to active service and are currently marketed for sale. Vessels withdrawn from service are not included in the company’s utilization statistics.
During fiscal 2006, the company took delivery of 10 anchor handling towing supply vessels, one platform supply vessel and seven crewboats and sold to third party operators or to scrap dealers 22 anchor handling towing supply vessels, 11 platform supply vessels, one utility vessel, seven crewboats, six offshore tugs and four other type vessels. Included in the sold anchor handling towing supply vessel count are six KMAR 404 class of vessels that were sold to Deep Sea Supply ASA in July 2005. Also, during the third quarter of fiscal 2006, the company disposed of its interest in a Nigerian joint venture which resulted in the disposition of nine crewboats from the joint venture and other vessel count.
During fiscal 2005, the company purchased three anchor handling towing supply vessels and one platform supply vessel. The company also took delivery of 11 newly-constructed vessels which included six anchor handling towing supply vessels, one platform supply vessel and four crewboats. Also during fiscal 2005, the company sold seven anchor handling towing supply vessels, one platform supply vessel, three offshore tugs, 10 crewboats and two other type vessel.
During fiscal 2004, the company purchased from ENSCO International Incorporated its 27-vessel Gulf of Mexico-based marine fleet. The mix of ENSCO vessels acquired consists of one deepwater anchor

-29-
handling/towing supply vessel and 26 towing-supply/supply vessels. Also during fiscal 2004, the company took delivery of two large deepwater platform supply vessels, nine platform supply vessels, two anchor handling towing supply vessels, eight crewboats and one offshore tug. The company sold and/or scrapped seven towing-supply/supply vessels, two crewboats, three offshore tugs and seven other type vessels during fiscal 2004. Also during fiscal 2004, the company sold three crewboats to one of its 49%-owned unconsolidated international joint ventures.
General and Administrative Expenses
Consolidated general and administrative expenses for the years ended March 31 consists of the following components:
(In thousands) 2006 2005 2004 Personnel $ 52,165 42,392 39,126 Office and property 12,636 12,840 12,562 Sales and marketing 5,662 4,731 4,374 Professional service 9,295 7,378 5,545 Other 6,731 6,083 5,907
$ 86,490 73,424 67,514
General and administrative expenses for fiscal 2006 were higher compared to fiscal 2005 and 2004 due primarily to the amortization of restricted stock granted in March 2005 and 2004; costs associated with the Sarbanes-Oxley Act of 2002; an improved business environment; and increased employee bonus plan costs resulting from increased earnings of the company. Fiscal 2006 general and administrative expenses were also higher as compared to fiscal 2005 and 2004 due to costs associated with Hurricanes Katrina and Rita (approximately $1.8 million), including a Board of Director-approved employee assistance program for personal uninsured losses related to the hurricanes.
Liquidity, Capital Resources and Other Matters
The company’s current ratio, level of working capital and amount of cash flows from operations for any year are directly related to fleet activity and vessel day rates. Fleet activity and vessel day rates are ultimately determined by the supply/demand relationship for crude oil and natural gas. Variations from year-to-year in these items are primarily the result of market conditions. Cash from operations, in combination with the company’s senior unsecured debt and available line of credit, provide the company, in management’s opinion, with adequate resources to satisfy its current financing requirements. At March 31, 2006, the entire amount of the company’s $300 million revolving line of credit was available for future financing needs. Continued payment of dividends, currently at $0.15 per quarter per common share, is subject to declaration by the Board of Directors.
On May 18, 2005, the company amended its $295 million revolving line of credit agreement, which expires on May 18, 2010, increasing the face amount of the facility from $295 million to $300 million and providing a mechanism for increasing the amount of the facility up to $400 million. Borrowings bear interest at the company’s option, at the greater of prime or Federal Funds rates plus .5% or LIBOR rates plus margins from .50 to 1.125% based on the company’s funded debt to total capitalization ratio. The amended agreement reduced the annual fee on the unused portion of the facility to a range between .10 to .25% and modified certain financial covenants, which would allow more flexibility in utilizing the facility.
In July 2005, the company’s Board of Directors authorized the company to spend up to $120.0 million to repurchase shares of its common stock. Repurchases are made through open market or privately-negotiated transactions. The company intends to use its available cash and, when considered advantageous, borrowings under its revolving credit facility to fund the share repurchases. The Board of Directors’ authorization for this repurchase program will expire when all authorized funds have been expended or on June 30, 2006, unless extended by the Board of Directors. As of March 31, 2006, the company spent $20.8 million for the repurchase and cancellation of 455,000 common shares, or an average price paid per common share of $45.64. At March 31, 2006, approximately $99.2 million was available to repurchase shares of the company’s common stock pursuant to the stock repurchase program.
-30-
On July 8, 2003, the company issued $300 million of senior unsecured notes. The multiple series of notes with maturities ranging from 7 years to 12 years have an average outstanding life to maturity of 9.5 years and can be retired before maturity without penalty. The weighted average interest rate on the notes sold to private institutional investors is 4.35%. The note proceeds were used to refinance a then-existing $245.0 million debt outstanding, with the balance of the proceeds used to fund capital expenditures.
Operating Activities
Net cash provided by operating activities for any fiscal year will fluctuate according to the level of business activity for the applicable year. Fiscal 2006 net cash from operating activities increased to $283.6 million from $160.1 million in fiscal 2005 due to higher net earnings, partially offset by increases in accounts receivables.
Fiscal year 2005 net cash provided by operating activities increased to $160.1 million from $129.0 million in fiscal 2004 as a result of higher earnings due to a better business environment than the previous fiscal year.
Investing Activities
Investing activities for fiscal 2006 provided $53.2 million of cash, which is primarily attributed to the $225.6 million of proceeds from the sale of assets offset by approximately $172.4 million of additions to properties and equipment. Additions to properties and equipment were comprised of approximately $26.8 million in capitalized major repair costs, $0.8 million for vessel enhancements, $138.2 million for the construction of offshore marine vessels, $3.7 million for the construction of an aircraft and $2.9 million of other properties and equipment purchases.
Investing activities for fiscal 2005 used $189.1 million of cash, which is net of $18.3 million of proceeds from the sale of assets. Additions to properties and equipment was comprised of approximately $29.6 million in capitalized major repair costs, $2.4 million for vessel enhancements, $120.8 million for the construction of offshore marine vessels and $54.6 million for the acquisition of four vessels. Additions to properties and equipment were lower in fiscal 2005 as compared to fiscal 2004 due to fewer vessels purchased.
Investing activities for fiscal 2004 used $285.4 million of cash, which is net of $11.5 million from proceeds from the sale of assets. Additions to properties and equipment was comprised of approximately $24.6 million in capitalized major repair costs, $0.3 million in vessel enhancements, $2.0 million in other properties and equipment purchases, $192.2 million for the construction and purchase of offshore marine vessels and $77.8 million for the purchase of 27 ENSCO vessels on April 1, 2003. Additions to properties and equipment in fiscal 2004 includes the purchase of 27 vessels from ENSCO and higher capital spending on vessels under construction during fiscal 2004 as disclosed in the “Vessel Construction Programs and Acquisitions” section of Item 7.
Financing Activities
Fiscal 2006 financing activities used $106.1 million of cash, which included debt repayments of $110.0 million, repurchase of common stock of $20.8 million and $34.6 million of cash used for quarterly payment of common stock dividends of $0.15 per share. This was offset primarily by $30.0 million of credit facility borrowings and $29.6 million from the issuance of common stock as a result of stock option exercises.
Fiscal 2005 financing activities provided $26.8 million of cash, which included $113.0 million of credit facility borrowings and $7.5 million from the issuance of common stock. This was offset primarily by repayments of debt of $58.0 million. The company also used $34.3 million of cash for the payment of common stock dividends of $.60 per share. Net borrowings were used to help finance the company’s various vessel construction programs and vessel acquisitions.
Fiscal 2004 financing activities provided $156.2 million of cash, which included $300 million of privately placed senior unsecured borrowings, a $100 million term loan placed with a group of banks primarily to finance the purchase of the ENSCO vessels, $36.0 million of borrowings from the company’s original revolving and term loan agreement and $35.0 million of borrowings from the company’s new $295 million

-31-
revolving credit agreement. Borrowings were offset primarily by repayments of debt of $285.0 million, which consists of the July 2003 payoff of the $100 million term loan used to purchase the ENSCO vessels, the July 2003 payoff of $175.0 million of outstanding debt under the company’s original revolving and term loan agreement, and a $10.0 million repayment on the company’s new $295 million revolving credit agreement. The company also used $34.0 million of cash for the payment of common stock dividends of $.60 per share. Net borrowings were used to help finance the company’s various vessel construction programs and vessel acquisitions.
Interest and Debt Costs
Interest and debt costs incurred, net of interest capitalized, for fiscal 2006, 2005 and 2004 was approximately $9.1 million, $6.9 million, and $3.7 million, respectively. Interest costs capitalized during fiscal 2006, 2005 and 2004 was approximately $6.3 million, $10.0 million, and $8.5 million, respectively. Total interest and debt costs incurred in fiscal 2006 were considerably higher than the previous two fiscal years because the relative-portion of interest cost capitalized during fiscal 2006 was less than in fiscal years 2005 and 2004 due to the reduced level of investments in the company’s new construction program during the current fiscal year.
Other Liquidity Matters
While the company does not have any other commitments for new-build vessel contracts other than what is discussed in the “Vessel Construction and Acquisitions” section of Item 7, the company anticipates that over the next several years, it will continue to build, acquire or lease newer vessels in order to replace its aging vessels. The majority of the company’s supply and towing supply vessels were constructed between 1976 and 1983. As such, most of this vessel class exceeds 22 years of age and will need to be replaced within the next several years. In addition to age, market conditions also help determine when a vessel is no longer economically viable. The company anticipates using future operating cash flows, existing borrowing capacities or new borrowings or lease arrangements to fund over the next few years the continuing replacement of the company’s mature fleet of vessels, with emphasis on the international anchor handling towing supply vessels. These vessels would replace the company’s core international fleet with fewer, larger and more efficient vessels. The company believes that adequate capital resources will be available to continue its fleet replacement.
At the conclusion of its examination of the company’s income tax returns covering fiscal years 2001 and 2002, the Internal Revenue Service (IRS) proposed changes to taxable income which, if sustained, would result in additional income tax of $12.8 million. The proposed increase in taxable income results primarily from the IRS disallowance of all claimed deductions from taxable income related to the company’s foreign sales corporation (FSC) as well as all deductions claimed under the Extraterritorial Income Exclusion (ETI). The company has filed a formal protest with the IRS seeking a reconsideration of their position taken. The company has also received a final assessment of additional income tax of $1.75 million resulting from the IRS’s earlier examination of the company’s income tax returns for fiscal years 1999 and 2000. Such assessment is also due to the IRS disallowance of essentially all deductions related to FSC activity during that period. The company has paid the 1999 and 2000 assessment and has begun the process of seeking a refund of the taxes paid through the initiation of legal proceedings. The IRS has begun an examination of the company’s 2003 and 2004 federal income tax returns. The company also has additional ongoing examinations by various state and foreign tax authorities. The company does not believe that the results of these examinations will have a material adverse effect on the company’s financial position or results of operations.
Certain current and former subsidiaries of the company are, or have been, participating employers in an industry-wide multi-employer retirement fund in the United Kingdom, the Merchant Navy Officers Pension Fund (MNOPF.) The company has been informed of an estimated 234 million sterling, or approximately $433 million, total fund deficit as estimated by the MNOPF actuary, that will require contributions from the participating employers. Substantially all of the fund's deficit allocable to the company relates to current operating subsidiaries as the company does not believe, on the advice of counsel, that it is liable for any additional portion of the fund's deficit that relates to subsidiaries that have either been sold or dissolved in prior years. The amount of the company's share of the fund's deficit will depend ultimately on a number of

-32-
factors including an updated calculation of the total fund deficit, the number of participating employers, and the final method used in allocating the required contribution among participating employers.
In August 2005, the company received an invoice from the fund in the amount of $3.8 million for what the trustees calculated to be the company's current share of the fund deficit. Accordingly, the company recorded this amount in full as crew cost expense during the second quarter of fiscal 2006. As allowed by the terms of the assessment, approximately $0.7 million of the invoiced amount was paid during fiscal 2006 with the remainder, including interest charges, to be paid in annual installments over nine years. The first installment totaling approximately $0.4 million was paid in March 2006.
It is possible that the fund's trustee may issue additional invoices to the company for additional amounts in the future for various reasons, including the results of future fund valuation reports and whether other assessed parties have the financial capability to contribute their respective allocations.
Contractual Obligations
The following table summarizes the company’s consolidated contractual obligations as of March 31, 2006 and the effect such obligations, inclusive of interest costs, are expected to have on the company’s liquidity and cash flows in future periods.
(In thousands) Payments Due by Period Less than 2-3 4-5 More Than
Contractual Obligation Total One Year Years Years 5 Years
Long-Term Debt $ 390,132 13,057 26,114 50,462 300,499
Operating Leases $ 61,110 4,277 15,299 15,476 26,058
Purchase Obligations $ 4 4 --- --- ---
Vessel Construction Obligations $ 72,960 38,485 34,475 --- ---
Total $ 524,206 55,823 75,888 65,938 326,557
Off-Balance Sheet Arrangements
On March 24, 2006, the company sold one of its newly-built vessels, delivered to the market in March 2006, to Banc of America Leasing & Capital LLC (BOAL&C), an unrelated third party, for $12.0 million and simultaneously entered into a bareboat charter arrangement with BOAL&C. The company is accounting for the transaction as a sale/leaseback transaction with operating lease treatment. Accordingly, the company will not record the asset on its books and the company will expense periodic lease payments. The agreement to acquire and charter with BOAL&C also calls for the company to sell and simultaneously bareboat charter four additional vessels, which are currently under construction, upon the vessels’ delivery to the market. BOAL&C agreed to pay actual invoice cost of the respective vessels being acquired, or $63.5 million. The vessels currently under construction are expected to be delivered to the market beginning July 2006 with final delivery of the last vessel in September 2007. The initial charter hire operating lease term expires in 2014. The company has the option to extend the charter hire operating lease three times, each for a period of 12 months, which would provide the company the opportunity to extend the operating lease through 2017. See Note 9 to Notes to Consolidated Financial Statements included in Item 8 of this Form 10-K for a more complete discussion of this transaction.
Critical Accounting Policies and Estimates
The preparation of financial statements in accordance with accounting principles generally accepted in the United States requires management to make estimates and assumptions that affect both the recorded values of assets and liabilities at the date of the financial statements and the revenues recognized and expenses incurred during the reporting period. The company’s estimates and assumptions affect its recognition of deferred expenses, bad debts, income taxes, the carrying value of its long-lived assets and goodwill, and its provision for certain contingencies. The company evaluates the reasonableness of these estimates and assumptions continually based on a combination of historical information and other
-33-
information that comes to its attention that may vary its outlook for the future. Actual results may differ from these estimates under different assumptions.
Management suggests that the company’s Summary of Significant Accounting Policies, as described in Note 1 of Notes to Consolidated Financial Statements, be read in conjunction with this Management’s Discussion and Analysis of Financial Condition and Results of Operations. The company believes the critical accounting policies that most impact the company’s consolidated financial statements are described below.
Revenue Recognition. The company’s primary source of revenue is derived from time charter contracts of its vessels on a rate per day of service basis. These time charter contracts are generally either on a term basis (average three months to two years) or on a “spot” basis. The base rate of hire for a term contract is generally a fixed rate, provided, however, that term contracts at times include escalation clauses to recover increases in specific costs. A spot contract is a short-term agreement to provide offshore marine services to a customer for a specific short-term job. Spot contract terms generally range from one day to one week. Marine vessel revenues are recognized on a daily basis throughout the contract period.
Receivables. In the normal course of business, the company extends credit to its customers on a short-term basis. The company’s principal customers are major oil and natural gas exploration, development and production companies. Although credit risks associated with our customers are considered minimal, the company routinely reviews its accounts receivable balances and makes adequate provisions for doubtful accounts.
Goodwill. The company tests goodwill impairment annually at a reporting unit level, as required, using carrying amounts as of December 31. The company considers its reporting units to be its domestic and international operations. The estimated fair value of the reporting unit is determined by discounting the projected future operating cash flows for the remaining average useful life of the assets within the reporting units by the company’s related weighted average cost of capital. Impairment is deemed to exist if the implied fair value of the reporting unit goodwill is less than the respective book value of the reporting unit goodwill, and in such case, an impairment loss would be recognized equal to the difference. There are many assumptions and estimates underlying the determination of the fair value of each reporting unit, such as, future expected utilization and average day rates for the vessels, vessel additions and attrition, operating expenses and tax rates. Although the company believes its assumptions and estimates are reasonable, deviations from the assumptions and estimates could produce a materially different result.
The company performed its annual impairment test as of December 31, 2005, and the test determined there was no goodwill impairment. At March 31, 2006, the company’s goodwill balance represented 14% of total assets and 20% of stockholders’ equity. Interim testing will be performed if events occur or circumstances indicate that the carrying amount of goodwill may be impaired. Examples of events or circumstances that might give rise to interim goodwill impairment testing include significant adverse industry or economic changes, significant business interruption due to political unrest or terrorism, unanticipated competition that has the potential to dramatically reduce the company’s earning potential, legal issues, or the loss of key personnel.
Impairment of Long-Lived Assets. The company reviews long-lived assets for impairment whenever events occur or changes in circumstances indicate that the carrying amount of an asset group may not be recoverable. In such evaluation, the estimated future undiscounted cash flows generated by an asset group are compared with the carrying amount of the asset group to determine if a write-down may be required. The company estimates cash flows based upon historical data adjusted for the company’s best estimate of future market performance that is based on industry trends. If impairment exists, the carrying value of the asset group is reduced to its estimated fair value. Vessels with similar operating and marketing characteristics are grouped for asset impairment testing.

-34-
Although the company believes its assumptions and estimates are reasonable, deviations from the assumptions and estimates could produce a materially different result. Management estimates may vary considerably from actual outcomes due to future adverse market conditions or poor operating results that could result in the inability to recover the current carrying value of an asset group, thereby possibly requiring an impairment charge in the future. As the company’s fleet continues to age, management closely monitors the estimates and assumptions used in the impairment analysis to properly identify evolving trends and changes in market conditions that could impact the results of the impairment evaluation. During fiscal 2005, the company refined its asset groupings to increase the number of asset groups and better reflect the composition of its fleet and the markets within which it currently operates.
In addition to the periodic review of long-lived assets for impairment when circumstances warrant, the company also performs a review of its stacked vessels and vessels withdrawn from service every six months. This review considers items such as the vessel’s age, length of time stacked and likelihood of a return to active service, among others. The company records an impairment charge when the carrying value of a vessel withdrawn from service or stacked vessel that is unlikely to return to service exceeds its estimated fair value.
Income Taxes. The company determines its effective tax rate by estimating its permanent differences resulting from differing treatment of items for tax and accounting purposes. The company is periodically audited by taxing authorities in the United States and by the respective tax agencies in the countries in which we operate internationally. The tax audits generally include questions regarding the calculation of taxable income. Audit adjustments affecting permanent differences could have an impact on the company’s effective tax rate.
The carrying value of the company’s net deferred tax assets is based on the company’s present belief that it is more likely than not that it will be able to generate sufficient future taxable income in certain tax jurisdictions to utilize such deferred tax assets, based on estimates and assumptions. If these estimates and related assumptions change in the future, the company may be required to record or adjust valuation allowances against its deferred tax assets resulting in additional income tax expense in the company’s consolidated statement of operations. Management evaluates the realizability of the deferred tax assets quarterly and assesses the need for changes to valuation allowances quarterly. While the company has considered future taxable income and ongoing prudent and feasible tax planning strategies in assessing the present need for a valuation allowance, in the event the company were to determine that it would be able to realize its deferred tax assets in the future in excess of its net recorded amount, an adjustment to the valuation allowance would increase income in the period such determination was made. Should the company determine that it would not be able to realize all or part of its net deferred tax asset in the future, an adjustment to the deferred tax asset would be charged to income in the period such determination was made.
Drydocking Costs. The company expenses maintenance and repair costs as incurred during the asset’s original estimated useful life (its original depreciable life). Major repair costs incurred after the original depreciable life that also has the effect of extending the useful life of the asset are capitalized and amortized over 30 months. Major vessel modifications are capitalized and amortized over the remaining life of the equipment. Vessel modifications that are performed for a specific customer contract are capitalized and amortized over the firm contract term. The majority of the company’s vessels require a drydocking inspection twice in each five year period and the company schedules these drydockings when it is anticipated that the work can be performed. The company’s net earnings can fluctuate quarter to quarter due to the timing of scheduled drydockings.
Accrued Property and Liability Losses. The company self-insures potential hull damage and personal injury claims that may arise in the normal course of business. The company is exposed to insurance risks related to the company’s reinsurance contracts with various insurance entities. The reinsurance recoverable amount can vary depending on the size of a loss. The exact amount of the reinsurance recoverable is not known until all losses are settled. The company estimates the reinsurance recoverable amount it expects to receive and also estimates losses for claims that have occurred but have not been reported or not fully developed. The company also monitors its reinsurance recoverable balances regularly for possible reinsurance exposure and makes adequate provisions for doubtful reinsurance receivables. It is the

-35-
company’s opinion that its accounts and reinsurance receivables have no impairment other than that for which provisions have been made.
Pension and Other Postretirement Benefits. The company sponsors a defined benefit pension plan and a supplemental executive retirement plan covering eligible employees of Tidewater Inc. and participating subsidiaries. The company also sponsors a defined contribution retirement plan that covers eligible U.S. fleet personnel and eligible employees of the company hired after December 31, 1995 and a post retirement plan for qualified retired employees. Net periodic pension costs and accumulated benefit obligations are determined in accordance with SFAS Accounting Standard No. 87, "Employers' Accounting for Pensions," using a number of assumptions including the discount rate, the rate of compensation increases, retirement ages, mortality rates and expected long-term return on plan assets. These assumptions have a significant impact on the amounts reported. The company’s pension cost consists of service costs, interest costs, amortization of prior service costs or benefits, expected returns on plan assets and, in part, on a market-related valuation of assets. The Company considers a number of factors in developing its pension assumptions, including an evaluation of relevant discount rates, expected long-term returns on plan assets, plan asset allocations, expected changes in wages and retirement benefits, analyses of current market conditions and input from actuaries and other consultants.
The company also provides postretirement benefits to qualified retired employees. The postretirement program provides limited health care and life insurance benefits. Costs of the program are based on actuarially determined amounts and are accrued over the period from the date of hire to the full eligibility date of employees who are expected to qualify for these benefits. This plan is not funded.
New Accounting Pronouncements
In December 2004, the Financial Accounting Standards Board (FASB) issued Statement of Financial Accounting Standards (SFAS) No. 123 (Revised 2004), “Share-Based Payment” (SFAS 123R). This standard requires expensing of stock options and other share-based payments and supersedes SFAS No. 123, Accounting for Stock-Based Compensation and Accounting Principles Board (APB) Opinion No. 25, Accounting for Stock Issued to Employees, and its related implementation guidance that had allowed companies to choose between expensing stock options or showing proforma disclosure only. This standard, together with a new rule adopted by the Securities and Exchange Commission in April 2005, is effective for the company as of April 1, 2006 and will apply to all awards granted, modified, cancelled or repurchased after that date. The ultimate amount of increased compensation expense will be dependent on the number of option shares granted, their timing and vesting period and the method used to calculate the fair value of the awards, among other factors. Based on stock options outstanding as of March 31, 2006, the adoption of SFAS No. 123R is expected to result in the recognition of $6.0 million of future compensation expense, of which $3.2 million is expected to be recorded during fiscal 2007.
From time to time, new accounting pronouncements are issued by the FASB that are adopted by the company as of the specified effective date. Unless otherwise discussed, management believes that the impact of recently issued standards, which are not yet effective, will not have a material impact on the company’s consolidated financial statements upon adoption.
Effects of Inflation
Day-to-day operating costs are generally affected by inflation. However, because the energy services industry requires specialized goods and services, general economic inflationary trends may not affect the company’s operating costs. The major impact on operating costs is the level of offshore exploration, development and production spending by energy exploration and production companies. As the spending increases, prices of goods and services used by the energy industry and the energy services industry will increase. Future increases in vessel day rates may shield the company from the inflationary effects on operating costs.
Due to the increase in business activity resulting from strong global oil and gas fundamentals, the competitive market for experienced crew personnel has exerted upward pressure on wages in the labor markets which increased the company’s operating expenses.

-36-
Also, the commodity price of steel has increased dramatically due to increased worldwide demand for the metal. Although prices have moderated some in calendar year 2005, the price of steel remains high by historical standards. If the price of steel continues to rise, the cost of new vessels will result in higher capital expenditures and depreciation expenses which will reduce the company’s future operating profits.
Environmental Matters
During the ordinary course of business the company's operations are subject to a wide variety of environmental laws and regulations. The company attempts to comply with these laws and regulations in order to avoid costly accidents and related environmental damage. Compliance with existing governmental regulations that have been enacted or adopted regulating the discharge of materials into the environment, or otherwise relating to the protection of the environment, has not had, nor is expected to have, a material effect on the company. The company is proactive in establishing policies and operating procedures for safeguarding the environment against any environmentally hazardous material aboard its vessels and at shore base locations. Whenever possible, hazardous materials are maintained or transferred in confined areas to ensure containment if accidents occur. In addition the company has established operating policies that are intended to increase awareness of actions that may harm the environment.
ITEM 7A. QUANTITATIVE AND QUALITATIVE DISCLOSURES ABOUT MARKET RISK
Market risk refers to the potential losses arising from changes in interest rates, foreign currency fluctuations and exchange rates, equity prices and commodity prices including the correlation among these factors and their volatility. The company is primarily exposed to interest rate risk and foreign currency fluctuations and exchange risk.
Interest Rate Risk. Changes in interest rates may result in changes in the fair market value of the company’s financial instruments, interest income and interest expense. The company’s financial instruments that are exposed to interest rate risk are its cash equivalents and long-term borrowings. Due to the short duration and conservative nature of the cash equivalent investment portfolio, the company does not expect any material loss with respect to its investments. The book value for cash equivalents is considered to be representative of its fair value.
At March 31, 2006, the company had $300 million of debt outstanding which represents senior unsecured notes that were issued on July 8, 2003. The multiple series of notes with maturities ranging from 7 years to 12 years have an average outstanding life to maturity of 9.5 years and can be retired prior to maturity without penalty. The weighted average interest rate on the notes is 4.35%. The fair value of this debt at March 31, 2006 is estimated to be $279.8 million.
On May 18, 2005, the company amended its $295 million revolving line of credit agreement, which expires on May 18, 2010, increasing the face amount of the facility from $295 million to $300 million and providing a mechanism for increasing the amount of the facility up to $400 million. Borrowings bear interest at the company’s option, at the greater of prime or Federal Funds rates plus .5% or LIBOR rates plus margins from .50 to 1.125% based on the company’s funded debt to total capitalization ratio. The amended agreement reduced the annual fee on the unused portion of the facility to a range between .10 to .25% and modified certain financial covenants, which would allow for more flexibility in utilizing the facility.
The company is exposed to possible interest rate fluctuations related to its commitment to the sale/leaseback of four of its vessels to BOAL&C. On March 24, 2006, the company entered into four interest rate swap transactions to effectively fix the amount of the lease payments on four vessels currently under construction that the company agreed to sell and leaseback from BOAL&C. The lease payments for each respective vessel will be based on the five year swap rate at the time of the lease which will coincide with the delivery of each vessel. Any amounts received from the bank or paid to the bank will be recorded on the company's balance sheet as either an other asset or other liability and amortized over the term of the respective leases. The company is accounting for the interest rate swap as a cash flow hedge under SFAS No. 133, as amended. The derivative instrument is carried at fair value on the consolidated balance sheet in other assets or other liabilities depending on the fair value at the balance sheet date. Changes in the fair value of the derivative instrument, to the extent the hedge is effective, are recognized in other comprehensive income (a component of stockholders’ equity). Amounts representing hedge ineffectiveness,

-37-
if any, are recorded in earnings. At March 31, 2006, the four interest rate swaps had a combined fair value of $0.3 million which is included in other assets in the consolidated balance sheet.
Foreign Exchange Risk. The company’s financial instruments that can be affected by foreign currency fluctuations and exchange risks consist primarily of cash and cash equivalents, trade receivables and trade payables denominated in currencies other than the U.S. dollar. The company periodically enters into spot and forward derivative financial instruments as a hedge against foreign currency denominated assets and liabilities and currency commitments.
Spot derivative financial instruments are short-term in nature and settle within two business days. The fair value approximates the carrying value due to the short-term nature of this instrument, and as a result, no gains or losses are recognized. Forward derivative financial instruments are generally longer-term in nature but generally do not exceed one year. The accounting for gains or losses on forward contracts is dependent on the nature of the risk being hedged and the effectiveness of the hedge. The company enters into derivative instruments only to the extent considered necessary to meet its risk management objectives and does not use derivative contracts for speculative purposes.
The company had one currency spot contract outstanding at March 31, 2006 totaling approximately $1.5 million that settled on April 3, 2006. The company had three currency spot contracts outstanding at March 31, 2005 totaling approximately $1.0 million that settled on April 1, 2005. The company had no spot contracts outstanding at March 31, 2004.
The company is exposed to possible currency fluctuations related to its commitment to construct two of its anchor handling towing supply vessels at an Indonesian shipyard. The company is required, per the construction agreements, to make all payments in Singapore dollars and is currently exposed to possible currency fluctuations on the remaining commitment which totals a current U.S. dollar equivalent of approximately $22.6 million. At March 31, 2006 the company had seven forward contracts outstanding totaling $13.8 million that hedged the company’s foreign exchange exposure relating to the Indonesian shipyard commitments. The company is accounting for the forward contract as a cash flow hedge under SFAS No. 133, as amended. The derivative instrument is carried at fair value on the consolidated balance sheet in other assets or other liabilities depending on the fair value at the balance sheet date. Changes in the fair value of the derivative instrument, to the extent the hedge is effective, are recognized in other comprehensive income (a component of stockholders’ equity). Amounts representing hedge ineffectiveness, if any, are recorded in earnings. At March 31, 2006, the forward contracts combined fair value of $0.6 million is included in other assets in the consolidated balance sheet. A portion of the forward contract was ineffective and accordantly the ineffective portion of the hedge totaling approximately $88,500 was recorded as an increase to earnings during the fourth quarter of fiscal 2006.
The company had no derivative financial instruments outstanding at March 31, 2005 and 2004 that qualified as a hedge instrument. For full disclosure on the company’s derivative financial instruments see Note 11 of Notes to Consolidated Financial Statements.
Because of its significant international operations, the company is exposed to currency fluctuations and exchange risk on all charter hire contracts denominated in foreign currencies. The company does not hedge against any foreign currency rate fluctuations associated with foreign currency contracts that arise in the normal course of business. To minimize the financial impact of these items the company attempts to contract a significant majority of its services in United States dollars. The company continually monitors the currency exchange risks associated with all contracts not denominated in U.S. dollars.
ITEM 8. FINANCIAL STATEMENTS AND SUPPLEMENTARY DATA
The information required by this Item is included in Part IV of this report.
ITEM 9. CHANGES IN AND DISAGREEMENTS WITH ACCOUNTANTS ON ACCOUNTING AND FINANCIAL DISCLOSURE
None.

-38-
ITEM 9A. CONTROLS AND PROCEDURES
CEO and CFO Certificates
Included as exhibits to this Annual Report on Form 10-K are “Certifications” of the Chief Executive Officer and the Chief Financial Officer. The first form of certification is required in accordance with Section 302 of the Sarbanes-Oxley Act of 2002. This section of the Form 10-K contains the information concerning the controls evaluation referred to in the Section 302 Certifications and this information should be read in conjunction with the Section 302 Certifications for a more complete understanding of the topics presented.
Evaluation of Disclosure Controls and Procedures
Disclosure controls and procedures are designed with the objective of ensuring that information required to be disclosed in our reports filed under the Securities Exchange Act of 1934 ("Exchange Act"), such as this report, is recorded, processed, summarized and reported within the time periods specified in the Securities and Exchange Commission rules. However, any control system, no matter how well conceived and followed, can provide only reasonable, and not absolute, assurance that the objectives of the control system are met.
The company evaluated, under the supervision and with the participation of the company’s management, including the company’s Chairman of the Board, President and Chief Executive Officer and Chief Financial Officer, the effectiveness of the design and operation of the company’s disclosure controls and procedures (as defined in Rule 13a-15(e) and 15d-15(e) under the Securities Exchange Act of 1934, as amended (the ‘Exchange Act’)) as of the end of the period covered by this report. Based on that evaluation, the company’s Chairman of the Board, President and Chief Executive Officer along with the company’s Chief Financial Officer concluded that the company’s disclosure controls and procedures are effective in timely alerting them to material information relating to the company (including its consolidated subsidiaries) required to be disclosed in the reports the company files and submits under the Exchange Act.
Management’s Annual Report on Internal Control Over Financial Reporting
Management’s assessment of the effectiveness of the company’s internal control over financial reporting is discussed in “Management’s Report on Internal Control Over Financial Reporting” which is included in “Item 15. Exhibits and Financial Statement Schedules” to this Annual Report on Form 10-K and appears on page F-2.
Audit Report of Deloitte & Touche LLP
Our independent registered public accounting firm has issued an audit report on management’s assessment of the effectiveness of the company’s internal control over financial reporting and on the effectiveness of the company’s internal control over financial reporting. This report is also included in “Item 15. Exhibits and Financial Statement Schedules” to this Annual Report on Form 10-K and appears on page F-3.
Changes in Internal Control Over Financial Reporting
There have been no other changes in the company’s internal controls over financial reporting during the fourth quarter of fiscal 2006 that have materially affected or are reasonably likely to materially affect, the company’s internal control over financial reporting.
ITEM 9B. OTHER INFORMATION
All matters required to be disclosed on Form 8-K during the company’s fiscal 2006 fourth quarter have been previously disclosed on Form 8-K filed with the Securities and Exchange Commission.

-39-
PART III
ITEM 10. DIRECTORS AND EXECUTIVE OFFICERS OF THE REGISTRANT
Information concerning directors of the company is incorporated by reference to the section entitled “Election of Directors” of the company's definitive proxy statement that will be filed no later than 120 days after March 31, 2006.
Information regarding Section 16(a) compliance is incorporated by reference to the section entitled “Section 16(a) Beneficial Ownership Reporting Compliance” from the proxy statement.
Executive Officers of the Registrant
Name Age Position
Dean E. Taylor................................57 Chairman of the Board of Directors since 2003. Chief Executive Officer since March 2002. President since October 2001. Executive Vice President from 2000 to 2001. Senior Vice President from 1998 to 2000.
Cliffe F. Laborde.............................54 Executive Vice President since 2000. Senior Vice President from 1992 to 2000. General Counsel since 1992.
Stephen W. Dick.............................56 Executive Vice President since December 2001. Senior Vice President from 1999 to 2001. Vice President from 1990 to 1999.
J. Keith Lousteau............................59 Chief Financial Officer since 2000. Executive Vice President since 2003. Senior Vice President from 2000 to 2003. Vice President from 1987 to 2000. Treasurer since 1987.
There are no family relationships between the directors or executive officers of the company. The company's officers are elected annually by the Board of Directors and serve for one-year terms or until their successors are elected.
Audit Committee Financial Expert
Information regarding the company’s Audit Committee and identification of the Audit Committee Financial Expert is incorporated by reference to the section entitled “Corporate Governance” from the proxy statement.
Code of Ethics
Information regarding the company’s Code of Business Conduct for its directors and executive officers of the company is set forth in Item 1 of this report.
ITEM 11. EXECUTIVE COMPENSATION
Information concerning executive compensation is incorporated by reference to the section entitled “Executive Compensation” from the proxy statement described in Item 10 of this report.

-40-
ITEM 12. SECURITY OWNERSHIP OF CERTAIN BENEFICIAL OWNERS AND MANAGEMENT
Information concerning security ownership of certain beneficial owners and management is incorporated by reference from the proxy statement described in Item 10 of this report.
Equity Compensation Plan Information
The following table provides information as of March 31, 2006 about equity compensation plans of the company under which shares of common stock of the company are authorized for issuance:
Number of securities remaining available for future issuance under
Number of securities to Weighted-average equity compensation be issued upon exercise exercise price of plans (excluding of outstanding options, outstanding options, securities reflected in
warrants and rights warrants and rights column (A) Plan category (A) (B) (C)Equity compensation plans approved by shareholders 3,662,875 $38.57 494,219 (1) Equity compensation plans not approved by shareholders --- --- 67 (2) Balance at March 31, 2006 3,662,875 (3) $38.57 494,286
(1) Includes 39 shares available for grant under the company’s 1997 Stock Incentive Plan that could be issued as restricted stock and up to 115,650 shares that could be issued as restricted stock or other non-option award under the company’s 2001 Stock Incentive Plan.
(2) All of such shares are issuable as restricted stock under the company’s Employee Restricted Stock Plan. See the description of the employee Restricted Stock Plan included in Note 8 of Notes to Consolidated Financial Statements.
(3) If the exercise of these outstanding options and issuance of additional common shares had occurred as of March 31, 2006, these shares would represent 5.9% of the then total outstanding common shares of the company.
ITEM 13. CERTAIN RELATIONSHIPS AND RELATED TRANSACTIONS
Information concerning certain relationships and related transactions is incorporated by reference from the proxy statement described in Item 10 of this report.
ITEM 14. PRINCIPAL ACCOUNTING FEES AND SERVICES
The information required by this Item is incorporated by reference to the section entitled “Audit Committee Report” in the proxy statement described in Item 10 of this report.

-41-
PART IV
ITEM 15. EXHIBITS, FINANCIAL STATEMENT SCHEDULES, AND REPORTS ON FORM 8-K
A. Financial Statements and Schedules
The Consolidated Financial Statements and Schedule of the company listed on the accompanying Index to Financial Statements and Schedule (see page F-1) are filed as part of this report.
B. Reports on Form 8-K
1. The company’s report on Form 8-K dated January 10, 2006 reported that the company issued a press release reporting that the company expected its fiscal 2006 third quarter financial results to exceed earnings expectations and also reported the date, time and telephone number to the company’s earnings conference call.
2. The company’s report on Form 8-K dated January 24, 2006 reported that the company issued an earnings release reporting the company’s results of operations for the quarter and nine-month period ended December 31, 2005.
3. The company’s report on Form 8-K dated January 24, 2006 reported that the company provided a transcript from the company’s January 24, 2006 analyst conference call discussing its financial results for the quarter and nine-month period ended December 31, 2005.
4. The company’s report on Form 8-K dated February 2, 2006 reported that the company filed a slide presentation which was provided to investors at the Credit Suisse First Boston 2005 Energy Summit in Vail, Colorado. The Form 8-K also includes a transcript to the presentation at the Credit Suisse First Boston 2005 Energy Summit in Vail, Colorado.
5. The company’s report on Form 8-K dated March 15, 2006 reported that the company filed a slide presentation which was provided to investors at the Citigroup Small and Mid-Cap Conference in Las Vegas, Nevada. The Form 8-K also includes a transcript to the presentation at the Citigroup Small and Mid-Cap Conference in Las Vegas, Nevada.
6. The company’s report on Form 8-K dated March 29, 2006 reported that the company’s Compensation Committee of the Board of Directors approved the fiscal 2007 year annual base salaries and long term compensation awards of the executive officers of the company. The Form 8-K dated March 29, 2005 also reported outside director compensation fees and fiscal 2006 annual bonuses.
C. Exhibits
The index below describes each exhibit filed as a part of this report. Exhibits not incorporated by reference to a prior filing are designated by an asterisk; all exhibits not so designated are incorporated herein by reference to a prior filing as indicated.
Articles of Incorporation and Bylaws
3.1 Restated Certificate of Incorporation of Tidewater Inc. (filed with the Commission as Exhibit 3(a) to the company's quarterly report on Form 10-Q for the quarter ended September 30, 1993, File No. 1-6311).
3.2 Tidewater Inc. Bylaws (filed with the Commission as Exhibit 3.2 on Form 8-K dated June 1, 2005, File No. 1-6311).

-42-
Instruments Defining Rights of Security Holders
4.1 Restated Rights Agreement dated as of September 19, 1996 between Tidewater Inc. and The First National Bank of Boston (filed with the Commission as Exhibit 1 to Form 8-A on September 30, 1996).
Financing Agreements
10.1A First Amendment dated May 18, 2005 to Amended and Restated Revolving Credit Agreement (filed with the Commission on Form 8-K on May 20, 2005, File No. 1-6311).
10.2 $295,000,000 Amended and Restated Revolving Credit Agreement dated as of August 15, 2003 (filed with the Commission as Exhibit 4 to the company’s quarterly report on Form 10-Q for the quarter ended September 30, 2003, File No. 1-6311).
Stock Plans
10.3+ Tidewater Inc. Amended and Restated Tidewater Inc. 1992 Stock Option and Restricted Stock Plan (Effective November 29, 2001) (filed with the Commission as Exhibit 10.3 to the company’s annual report on Form 10-K for the fiscal year ended March 31, 2005, File No. 1-6311).
10.4+ Amended and Restated Tidewater Inc. 1997 Stock Incentive Plan dated November 21, 2002 (filed with the Commission as Exhibit 10(a) to the company's quarterly report on Form 10-Q for the quarter ended December 31, 2002, File No. 1-6311).
10.5+ Tidewater Inc. 2001 Stock Incentive Plan dated November 21, 2002 (filed with the Commission as Exhibit 10.5 to the company’s annual report on Form 10-K for the fiscal year ended March 31, 2005, File No. 1-6311).
10.6+ Tidewater Inc. Employee Restricted Stock Plan (filed with the Commission as Exhibit 10.2 to the company's quarterly report on Form 10-Q for the quarter ended December 31, 2004, File No. 1-6311).
10.7+ Form of Stock Option and Restricted Stock Agreement Under the Amended and Restated 1992 Stock Option and Restricted Stock Plan (filed with the Commission as Exhibit 10.7 to the company’s annual report on Form 10-K for the fiscal year ended March 31, 2005, File No. 1-6311).
10.8+ Form of Restricted Stock Agreement Under the Tidewater Inc. Employee Restricted Stock Plan (filed with the Commission as Exhibit 10.3 to the company's quarterly report on Form 10-Q for the quarter ended December 31, 2004, File No. 1-6311).
10.9+ Form of Stock Option and Restricted Stock Agreement for the Grant of Incentive Stock Options and Non-Qualified Stock Options Under the Tidewater Inc. 2001 Stock Incentive Plan, and the Grant of Restricted Stock Under the Tidewater Inc. 1997 Stock Incentive Plan (filed with the Commission as Exhibit 10.4 to the company’s quarterly report on Form 10-Q for the quarter ended December 31, 2004, File no. 1-6311).
10.10+ Form of Stock Option and Restricted Stock Agreement for the Grant of Incentive Stock Options and Non-Qualified Stock Options Under the Tidewater Inc. 2001 Stock Incentive Plan and the Grant of Restricted Stock Under the Tidewater Inc. 1997 Stock Incentive Plan (filed with the Commission as Exhibit 10.10 to the company’s annual report on Form 10-K for the fiscal year ended March 31, 2005, File No. 1-6311).
10.11+ Form of Stock Option and Restricted Stock Agreement for the Grant of Incentive Stock Options, Non-Qualified Stock Options and Restricted Stock Under the Tidewater Inc. 2001 Stock

-43-
Incentive Plan (filed with the Commission as Exhibit 10.11 to the company’s annual report on Form 10-K for the fiscal year ended March 31, 2005, File No. 1-6311).
10.12+ Form of Stock Option and Restricted Stock Agreement for the Grant of Incentive Stock Options and Non-Qualified Stock Options Under the Tidewater Inc. 2001 Stock Incentive Plan and the Grant of Restricted Stock Under the Tidewater Inc. Employee Restricted Stock Plan (filed with the Commission as Exhibit 10.12 to the company’s annual report on Form 10-K for the fiscal year ended March 31, 2005, File No. 1-6311).
10.13+ Form of Restricted Stock Agreement for the Grant of Restricted Stock Under the Tidewater Inc. Employee Restricted Stock Plan (filed with the Commission as Exhibit 10.13 to the company’s annual report on Form 10-K for the fiscal year ended March 31, 2005, File No. 1-6311).
10.14*+ Form of Stock Option and Restricted Stock Agreement for the Grant of Incentive Stock Options, Non-Qualified Stock Options and Restricted Stock Under the Tidewater Inc. 2001 Stock Incentive Plan.
10.15*+ Form of Stock Option and Restricted Stock Agreement for the Grant of Incentive Stock Options and Non-Qualified Stock Options Under the Tidewater Inc. 2001 Stock Incentive Plan and the Grant of Restricted Stock Under the Tidewater Inc. 1997 Stock Incentive Plan.
10.16*+ Form of Restricted Stock Agreement for the Grant of Restricted Stock Under the Tidewater Inc. Employee Restricted Stock Plan (performance vesting).
10.17*+ Form of Restricted Stock Agreement for the Grant of Restricted Stock Under the Tidewater Inc. Employee Restricted Stock Plan (time vesting).
Other Incentive Plans
10.18+ Tidewater Inc. Second Amended and Restated Supplemental Executive Retirement Plan dated March 1, 2003 (filed with the Commission as Exhibit 10.14 to the company’s annual report on Form 10-K for the fiscal year ended March 31, 2005, File No. 1-6311).
10.19+ Tidewater International Supplemental Executive Retirement Plan effective November 1, 2003 (filed with the Commission as Exhibit 10.14A to the company’s annual report on Form 10-K for the fiscal year ended March 31, 2005, File No. 1-6311).
10.20+ Second Amended and Restated Employees' Supplemental Savings Plan of Tidewater Inc. dated October 1, 1999 (filed with the Commission as Exhibit 10(d) to the company's quarterly report on Form 10-Q for the quarter ended December 31, 1999, File No. 1-6311).
10.21+ Tidewater Inc. Executive Medical Benefit Plan dated January 1, 2000 (filed with the Commission as Exhibit 10.16 to the company’s annual report on Form 10-K for the fiscal year ended March 31, 2005, File No. 1-6311).
10.22*+ Amended and Restated Deferred Compensation Plan for Outside Directors of Tidewater Inc., effective November 17, 2005.
10.23*+ Amended and Restated Non-Qualified Pension Plan for Outside Directors of Tidewater Inc. effective March 31, 2005.
10.24 Tidewater Inc. Management Annual Incentive Plan for Fiscal 2006 (filed with the Commission as Exhibit 10.2 on Form 8-K dated June 1, 2005, File No. 1-6311).
10.25+ Tidewater Inc. Executive Officer Annual Incentive Plan for Fiscal 2006 (filed with the Commission as Exhibit 10.1 on Form 8-K dated June 1, 2005, File No. 1-6311).

-44-
10.26+ Restated Non-Qualified Deferred Compensation Plan and Trust Agreement as Restated October 1, 1999 between Tidewater Inc. and Merrill Lynch Trust Company of America (filed with the Commission as Exhibit 10(e) to the company's quarterly report on Form 10-Q for the quarter ended December 31, 1999, File No. 1-6311).
10.27+ Second Restated Executives Supplemental Retirement Trust as Restated October 1, 1999 between Tidewater Inc. and Hibernia National Bank (filed with the Commission as Exhibit 10(j) to the company's quarterly report on Form 10-Q for the quarter ended December 31, 1999, File No. 1-6311).
Other Compensation Arrangements
10.28+ Summary of Compensation Arrangements with Directors (filed with the Commission as Exhibit 10.23 to the company’s annual report on Form 10-K for the fiscal year ended March 31, 2005, File No. 1-6311). .
10.29+ Summary of 2006 Executive Officers Base Salaries (filed with the Commission on Form 8-K on March 29, 2006, File No. 1-6311).
10.30+ Summary of Bonuses paid to three Executive Officers of the Company under the Tidewater Inc. 2006 Management Annual Incentive Plan, and of Bonus paid to the Company's Chief Executive Officer under the Tidewater Inc. Executive Officer Annual Incentive Plan for fiscal year 2006 (filed with the Commission on Form 8- K on March 29, 2006, File No. 1-6311).
Change of Control Agreements
10.31+ Form of Amended and Restated Change of Control Agreement dated October 1, 1999 with four executive officers of Tidewater Inc. (filed with the Commission as Exhibit 10(c) to the company's quarterly report on Form 10-Q for the quarter ended December 31, 1999, File No. 1-6311).
Other Exhibits
21* Subsidiaries of the company.
23.1* Consent of Independent Registered Accounting Firm – Deloitte & Touche LLP.
23.2* Consent of Independent Registered Accounting Firm – Ernst & Young LLP.
Certifications
31.1* Certification of Chief Executive Officer Pursuant to Section 302 of the Sarbanes-Oxley Act of 2002.
31.2* Certification of Chief Financial Officer Pursuant to Section 302 of the Sarbanes-Oxley Act of 2002.
32.1* Certification of Chief Executive Officer Pursuant to Section 906 of the Sarbanes-Oxley Act of 2002.
32.2* Certification of Chief Financial Officer Pursuant to Section 906 of the Sarbanes-Oxley Act of 2002.
* Filed herewith. + Indicates a management contract or compensatory plan or arrangement.

-45-
SIGNATURES OF REGISTRANT
Pursuant to the requirements of Section 13 of the Securities Exchange Act of 1933, the Registrant has duly caused this report to be signed on its behalf by the undersigned, thereunto duly authorized on May 26, 2006.
TIDEWATER INC. (Registrant)
By: /s/ Dean E. Taylor Dean E. Taylor Chairman of the Board of Directors, President and
Chief Executive Officer
By: /s/ J. Keith Lousteau J. Keith Lousteau Executive Vice President and Chief Financial Officer
By: /s/ Joseph M. Bennett Joseph M. Bennett Senior Vice President, Principal Accounting Officer and Chief Investor Relations Officer
SIGNATURES OF DIRECTORS
Pursuant to the requirements of the Securities Exchange Act of 1934, this report has been signed below by the following persons on behalf of the Registrant and in the capacities indicated on May 26, 2006.
/s/ Dean E. Taylor /s/ William C. O’Malley Dean E. Taylor William C. O’Malley
/s/ Arthur R. Carlson /s/ Paul W. Murrill Arthur R. Carlson Paul W. Murrill
/s/ Richard T. du Moulin /s/ Richard A. Pattarozzi Richard T. du Moulin Richard A. Pattarozzi
/s/ J. Wayne Leonard /s/ Jack E. Thompson J. Wayne Leonard Jack E. Thompson
/s/ Jon C. Madonna Jon C. Madonna

F-1
TIDEWATER INC.
Annual Report on Form 10-K Items 8, 15(a), and 15(c)
Index to Financial Statements and Schedule
Financial Statements Page
Management’s Report on Internal Control Over Financial Reporting F-2Report of Independent Registered Public Accounting Firm – Deloitte & Touche LLP F-3Report of Independent Registered Public Accounting Firm – Deloitte & Touche LLP F-5Report of Independent Registered Public Accounting Firm – Ernst & Young LLP F-6Consolidated Balance Sheets, March 31, 2006 and 2005 F-7Consolidated Statements of Earnings, three years ended March 31, 2006 F-8Consolidated Statements of Stockholders' Equity and Comprehensive Income, three years ended March 31, 2006 F-9Consolidated Statements of Cash Flows, three years ended March 31, 2006 F-10Notes to Consolidated Financial Statements F-11
Financial Statement Schedule
II. Tidewater Inc. and Subsidiaries Valuation and Qualifying Accounts F-32
All other schedules are omitted as the required information is inapplicable or the information is presented in the financial statements or the related notes.

F-2
MANAGEMENT’S REPORT ON INTERNAL CONTROL OVER FINANCIAL REPORTING
The company’s management is responsible for establishing and maintaining adequate internal control over financial reporting (as defined in Exchange Act Rules 13a-15(f)). The company’s internal control system was designed to provide reasonable assurance to the company’s management and Board of Directors regarding the preparation and fair presentation of published financial statements. All internal control systems, no matter how well designed, have inherent limitations. Therefore, even those systems determined to be effective can provide only reasonable assurance with respect to financial statement preparation and presentation.
The company’s management assessed the effectiveness of the company’s internal control over financial reporting as of March 31, 2006. In making this assessment, management used the criteria set forth by the Committee of Sponsoring Organizations of the Treadway Commission (COSO) in Internal Control—Integrated Framework. Based on our assessment we believe that, as of March 31, 2006, the company’s internal control over financial reporting is effective based on those criteria.
Deloitte & Touche LLP, the company’s registered public accounting firm that audited the company’s financial statements included in this Annual Report on Form 10-K, has issued an attestation report on management’s assessment and on the effectiveness of the company’s internal control over financial reporting. The attestation report of Deloitte & Touche LLP appears on page F-3.

F-3
REPORT OF INDEPENDENT REGISTERED PUBLIC ACCOUNTING FIRM
To the Board of Directors and Stockholders of Tidewater Inc.New Orleans, Louisiana
We have audited management’s assessment, included in the accompanying Management’s Report on Internal Control Over Financial Reporting, that Tidewater Inc. (the “Company”) maintained effective internal control over financial reporting as of March 31, 2006, based on criteria established in InternalControl—Integrated Framework issued by the Committee of Sponsoring Organizations of the Treadway Commission. The Company’s management is responsible for maintaining effective internal control over financial reporting and for its assessment of the effectiveness of internal control over financial reporting. Our responsibility is to express an opinion on management’s assessment and an opinion on the effectiveness of the Company’s internal control over financial reporting based on our audit.
We conducted our audit in accordance with the standards of the Public Company Accounting Oversight Board (United States). Those standards require that we plan and perform the audit to obtain reasonable assurance about whether effective internal control over financial reporting was maintained in all material respects. Our audit included obtaining an understanding of internal control over financial reporting, evaluating management’s assessment, testing and evaluating the design and operating effectiveness of internal control, and performing such other procedures as we considered necessary in the circumstances. We believe that our audit provides a reasonable basis for our opinions.
A company’s internal control over financial reporting is a process designed by, or under the supervision of, the company’s principal executive and principal financial officers, or persons performing similar functions, and effected by the company’s board of directors, management, and other personnel to provide reasonable assurance regarding the reliability of financial reporting and the preparation of financial statements for external purposes in accordance with generally accepted accounting principles. A company’s internal control over financial reporting includes those policies and procedures that (1) pertain to the maintenance of records that, in reasonable detail, accurately and fairly reflect the transactions and dispositions of the assets of the company; (2) provide reasonable assurance that transactions are recorded as necessary to permit preparation of financial statements in accordance with generally accepted accounting principles, and that receipts and expenditures of the company are being made only in accordance with authorizations of management and directors of the company; and (3) provide reasonable assurance regarding prevention or timely detection of unauthorized acquisition, use, or disposition of the company’s assets that could have a material effect on the financial statements.
Because of the inherent limitations of internal control over financial reporting, including the possibility of collusion or improper management override of controls, material misstatements due to error or fraud may not be prevented or detected on a timely basis. Also, projections of any evaluation of the effectiveness of the internal control over financial reporting to future periods are subject to the risk that the controls may become inadequate because of changes in conditions, or that the degree of compliance with the policies or procedures may deteriorate.
In our opinion, management’s assessment that the Company maintained effective internal control over financial reporting as of March 31, 2006, is fairly stated, in all material respects, based on the criteria established in Internal Control—Integrated Framework issued by the Committee of Sponsoring Organizations of the Treadway Commission. Also in our opinion, the Company maintained, in all material respects, effective internal control over financial reporting as of March 31, 2006, based on the criteria established in Internal Control—Integrated Framework issued by the Committee of Sponsoring Organizations of the Treadway Commission.
We have also audited, in accordance with the standards of the Public Company Accounting Oversight Board (United States), the consolidated financial statements and financial statement schedule as of and

F-4
for the year ended March 31, 2006 of the Company and our report dated May 25, 2006 expressed an unqualified opinion on those financial statements and financial statement schedule.
/s/ DELOITTE & TOUCHE LLP
New Orleans, Louisiana May 25, 2006

F-5
REPORT OF INDEPENDENT REGISTERED PUBLIC ACCOUNTING FIRM
To the Board of Directors and Stockholders of Tidewater Inc. New Orleans, Louisiana
We have audited the accompanying consolidated balance sheets of Tidewater Inc. and subsidiaries (the “Company”) as of March 31, 2006 and 2005 and the related consolidated statements of earnings, stockholders’ equity and other comprehensive income, and cash flows for the years then ended. Our audits also included the financial statement schedule listed in the Index at Item 15. These financial statements and financial statement schedule are the responsibility of the Company’s management. Our responsibility is to express an opinion on these financial statements and financial statement schedule based on our audits. The financial statements of the Company for the year ended March 31, 2004 were audited by other auditors whose report, dated April 19, 2004, expressed an unqualified opinion on those statements.
We conducted our audits in accordance with the standards of the Public Company Accounting Oversight Board (United States). Those standards require that we plan and perform the audit to obtain reasonable assurance about whether the financial statements are free of material misstatement. An audit includes examining, on a test basis, evidence supporting the amounts and disclosures in the financial statements. An audit also includes assessing the accounting principles used and significant estimates made by management, as well as evaluating the overall financial statement presentation. We believe that our audits provide a reasonable basis for our opinion.
In our opinion, such consolidated financial statements present fairly, in all material respects, the financial position of the Company as of March 31, 2006 and 2005, and the results of their operations and their cash flows for the years then ended in conformity with accounting principles generally accepted in the United States of America. Also, in our opinion, such financial statement schedule, when considered in relation to the basic consolidated financial statements taken as a whole, presents fairly, in all material respects, the information set forth therein.
We have also audited, in accordance with the standards of the Public Company Accounting Oversight Board (United States), the effectiveness of the Company’s internal control over financial reporting as of March 31, 2006, based on the criteria established in Internal Control—Integrated Framework issued by the Committee of Sponsoring Organizations of the Treadway Commission and our report dated May 25, 2006 expressed an unqualified opinion on management’s assessment of the effectiveness of the Company’s internal control over financial reporting and an unqualified opinion on the effectiveness of the Company’s internal control over financial reporting.
/s/ DELOITTE & TOUCHE LLP
New Orleans, Louisiana May 25, 2006

F-6
REPORT OF INDEPENDENT REGISTERED PUBLIC ACCOUNTING FIRM
The Board of Directors and Shareholders Tidewater Inc.
We have audited the accompanying consolidated statements of earnings, stockholders’ equity and comprehensive income, and cash flows of Tidewater Inc. for the year ended March 31, 2004. Our audit also included the financial statement schedule listed in the accompanying Index to Financial Statements and Schedule. These financial statements and schedule are the responsibility of the Company’s management. Our responsibility is to express an opinion on these financial statements and schedule based on our audit.
We conducted our audit in accordance with auditing standards generally accepted in the United States. Those standards require that we plan and perform the audit to obtain reasonable assurance about whether the financial statements are free of material misstatement. An audit includes examining, on a test basis, evidence supporting the amounts and disclosures in the financial statements. An audit also includes assessing the accounting principles used and significant estimates made by management, as well as evaluating the overall financial statement presentation. We believe that our audit provides a reasonable basis for our opinion.
In our opinion, the consolidated financial statements referred to above present fairly, in all material respects, the consolidated results of operations and cash flows of Tidewater Inc. for the year ended March 31, 2004, in conformity with accounting principles generally accepted in the United States. Also, in our opinion, the related financial statement schedule, when considered in relation to the basic financial statements taken as a whole, presents fairly, in all material respects, the information set forth therein.
/s/ Ernst & Young LLP
New Orleans, Louisiana April 19, 2004

F-7
TIDEWATER INC.CONSOLIDATED BALANCE SHEETSMarch 31, 2006 and 2005 (In thousands) ASSETS 2006 2005 Current assets: Cash and cash equivalents $ 246,109 15,376 Trade and other receivables, less allowance for doubtful accounts of $6,265 in 2006 and $7,138 in 2005 237,428 169,784 Marine operating supplies 41,181 38,959 Other current assets 4,325 3,837 Total current assets 529,043 227,956 Investments in, at equity, and advances to unconsolidated companies 34,308 32,074 Properties and equipment: Vessels and related equipment 2,457,947 2,483,970 Other properties and equipment 50,205 48,512 2,508,152 2,532,482 Less accumulated depreciation and amortization 1,134,425 1,080,296 Net properties and equipment 1,373,727 1,452,186 Goodwill 328,754 328,754Other assets 98,708 172,203 Total assets $ 2,364,540 2,213,173
LIABILITIES AND STOCKHOLDERS' EQUITY Current liabilities: Accounts payable and accrued expenses 97,265 82,261 Accrued property and liability losses 7,223 9,286 Other current liabilities 11,266 2,766 Total current liabilities 115,754 94,313 Long-term debt 300,000 380,000 Deferred income taxes 175,267 184,410 Accrued property and liability losses 21,732 34,778 Other liabilities and deferred credits 92,666 76,970 Stockholders’ equity: Common stock of $0.10 par value, 125,000,000 shares authorized, issued 60,310,164 shares at March 31, 2006 and 60,718,231 shares at March 31, 2005 6,031 6,072 Other stockholders' equity 1,653,090 1,436,630 Total stockholders’ equity 1,659,121 1,442,702 Total liabilities and stockholders' equity $ 2,364,540 2,213,173
See accompanying Notes to Consolidated Financial Statements.

F-8
TIDEWATER INC.CONSOLIDATED STATEMENTS OF EARNINGS Years Ended March 31, 2006, 2005, and 2004 (In thousands, except share and per share data) 2006 2005 2004 Revenues: Vessel revenues $ 846,982 655,526 625,948 Other marine revenues 30,635 36,624 26,682 877,617 692,150 652,630 Costs and expenses: Vessel operating costs 431,481 401,871 394,699 Costs of other marine revenues 23,836 29,453 21,502 Depreciation and amortization 107,526 99,613 98,510 General and administrative 86,490 73,424 67,514 Impairment of long-lived assets 3,050 1,733 26,456 Gain on sales of assets (86,337) (11,979) (7,075)
566,046 594,115 601,606 311,571 98,035 51,024
Other income (expenses): Foreign exchange gain (loss) 1,035 (327) (1,782) Equity in net earnings of unconsolidated companies 10,035 6,299 6,252 Minority interests (16) (59) (204) Interest and miscellaneous income 9,961 2,734 2,896 Interest and other debt costs (9,074) (6,887) (3,683) 11,941 1,760 3,479 Earnings before income taxes 323,512 99,795 54,503 Income tax expense (benefit) 87,756 (1,544) 12,841 Net earnings $ 235,756 101,339 41,662 Basic earnings per common share $ 4.11 1.78 .74 Diluted earnings per common share $ 4.07 1.78 .73
Weighted average common shares outstanding 57,372,815 56,854,282 56,563,328Incremental common shares from stock options 593,856 213,992 125,062 Adjusted weighted average common shares 57,966,671 57,068,274 56,688,390
Cash dividends declared per common share $ .60 .60 .60
See accompanying Notes to Consolidated Financial Statements.

F-9
TIDEWATER INC.CONSOLIDATED STATEMENTS OF STOCKHOLDERS' EQUITY AND COMPREHENSIVE INCOME Years Ended March 31, 2006, 2005 and 2004
Grantor Deferred Accumulated Trust Stock Additional compensation- other Ownership Common paid-in Retained restricted comprehensive Program (In thousands) stock capital earnings stock loss (GSOP) Total Balance at March 31, 2003 $ 6,058 301,540 1,141,923 (1,147) (12,482) (84,497) 1,351,395 Net earnings --- --- 41,662 --- --- --- 41,662 Other Comprehensive Income: Unrealized gains/(losses) on available-for-sale securities --- --- --- --- 911 --- 911 Changes in Supplemental Executive Retirement Plan minimum liability --- --- --- --- (871) --- (871) Changes in Pension Plan minimum liability --- --- --- --- (273) --- (273) Total Comprehensive income 41,429 Issuance of restricted stock 13 3,472 --- (3,675) --- 25 (165) Exercise of stock options (1) 724 --- --- --- 4,730 5,453 Cash dividends declared --- --- (34,008) --- --- --- (34,008) Issuance of common shares --- 407 --- --- --- 1,134 1,541 Other --- --- --- 465 --- --- 465 Balance at March 31, 2004 $ 6,070 306,143 1,149,577 (4,357) (12,715) (78,608) 1,366,110 Net earnings --- --- 101,339 --- --- --- 101,339Other Comprehensive Income: Unrealized gain/(losses) on available-for-sale securities --- --- --- --- 11 --- 11 Changes in Supplemental Executive Retirement Plan minimum liability --- --- --- --- (975) --- (975) Changes in Pension Plan minimum liability --- --- --- --- (1,016) --- (1,016) Total Comprehensive income 99,359 Issuance of restricted stock 2 2,911 --- (5,987) --- 2,972 (102) Exercise of stock options --- 2,334 --- --- --- 6,107 8,441 Cash dividends declared --- --- (34,286) --- --- --- (34,286) Issuance of common shares --- 435 --- --- --- 900 1,335 Other --- --- --- 1,845 --- --- 1,845 Balance at March 31, 2005 $ 6,072 311,823 1,216,630 (8,499) (14,695) (68,629) 1,442,702 Net earnings --- --- 235,756 --- --- --- 235,756 Other Comprehensive Income: Unrealized gains/(losses) on available-for- sale securities --- --- --- --- 105 --- 105 Changes in Supplemental Executive Retirement Plan minimum liability --- --- --- --- (518) --- (518) Changes in Pension Plan minimum liability --- --- --- --- (2,038) --- (2,038) Changes in fair value of derivative instruments --- --- --- --- 505 --- 505 Total Comprehensive income 233,810 Issuance of restricted stock 7 8,855 --- (13,037) --- 3,084 (1,091) Exercise of stock options (2) 16,242 --- --- --- 18,620 34,860 Cash dividends declared --- --- (34,575) --- --- --- (34,575) Issuance of common shares --- 462 --- --- --- 470 932 Retirement of common stock (46) (20,719) --- --- --- --- (20,765) Other --- --- --- 3,248 --- --- 3,248 Balance at March 31, 2006 $ 6,031 316,663 1,417,811 (18,288) (16,641) (46,455) 1,659,121
See accompanying Notes to Consolidated Financial Statements.
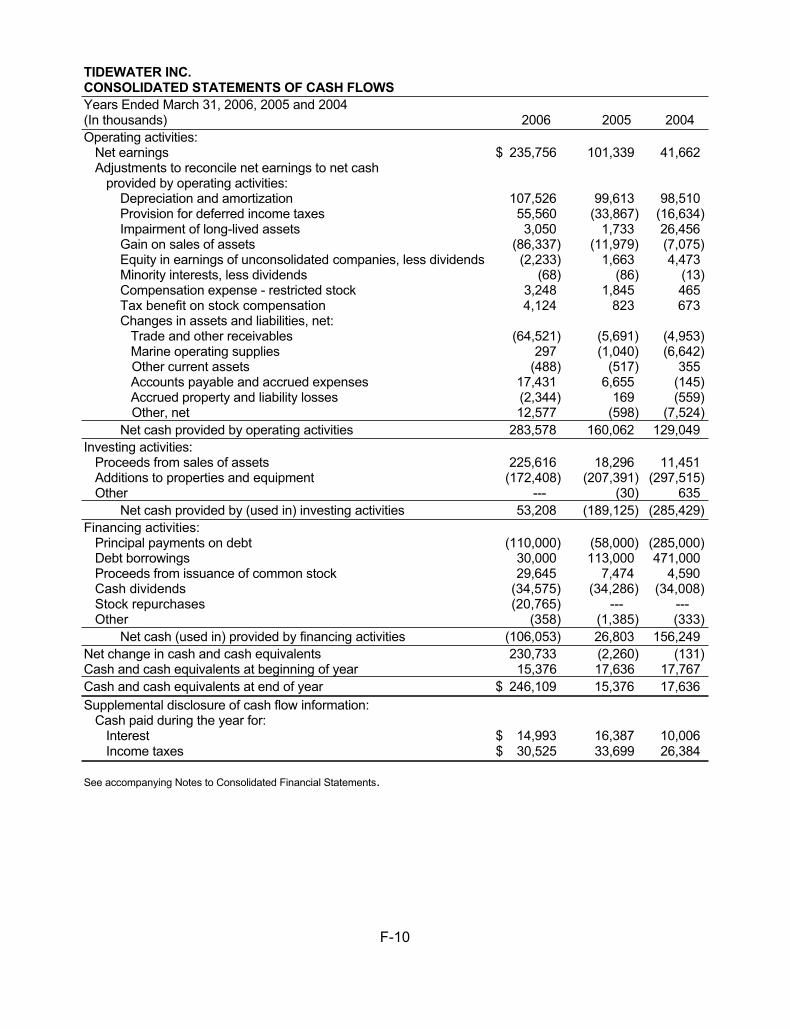
F-10
TIDEWATER INC.CONSOLIDATED STATEMENTS OF CASH FLOWSYears Ended March 31, 2006, 2005 and 2004 (In thousands) 2006 2005 2004 Operating activities: Net earnings $ 235,756 101,339 41,662 Adjustments to reconcile net earnings to net cash provided by operating activities: Depreciation and amortization 107,526 99,613 98,510 Provision for deferred income taxes 55,560 (33,867) (16,634) Impairment of long-lived assets 3,050 1,733 26,456 Gain on sales of assets (86,337) (11,979) (7,075) Equity in earnings of unconsolidated companies, less dividends (2,233) 1,663 4,473 Minority interests, less dividends (68) (86) (13) Compensation expense - restricted stock 3,248 1,845 465 Tax benefit on stock compensation 4,124 823 673 Changes in assets and liabilities, net: Trade and other receivables (64,521) (5,691) (4,953) Marine operating supplies 297 (1,040) (6,642) Other current assets (488) (517) 355 Accounts payable and accrued expenses 17,431 6,655 (145) Accrued property and liability losses (2,344) 169 (559) Other, net 12,577 (598) (7,524) Net cash provided by operating activities 283,578 160,062 129,049 Investing activities: Proceeds from sales of assets 225,616 18,296 11,451 Additions to properties and equipment (172,408) (207,391) (297,515) Other --- (30) 635 Net cash provided by (used in) investing activities 53,208 (189,125) (285,429) Financing activities: Principal payments on debt (110,000) (58,000) (285,000) Debt borrowings 30,000 113,000 471,000 Proceeds from issuance of common stock 29,645 7,474 4,590 Cash dividends (34,575) (34,286) (34,008) Stock repurchases (20,765) --- --- Other (358) (1,385) (333) Net cash (used in) provided by financing activities (106,053) 26,803 156,249 Net change in cash and cash equivalents 230,733 (2,260) (131) Cash and cash equivalents at beginning of year 15,376 17,636 17,767 Cash and cash equivalents at end of year $ 246,109 15,376 17,636 Supplemental disclosure of cash flow information: Cash paid during the year for: Interest $ 14,993 16,387 10,006 Income taxes $ 30,525 33,699 26,384
See accompanying Notes to Consolidated Financial Statements.

F-11
TIDEWATER INC.NOTES TO CONSOLIDATED FINANCIAL STATEMENTSMarch 31, 2006, 2005, and 2004
(1) Summary of Significant Accounting Policies
Nature of Operations
The company provides services and equipment to the offshore energy industry through the operation of the world's largest fleet of offshore service vessels. Revenues, net earnings and cash flows from operations are dependent upon the activity level for the vessel fleet, which is ultimately dependent upon crude oil and natural gas prices that, in turn, are determined by the supply/demand relationship for crude oil and natural gas.
Use of Estimates
The preparation of financial statements in accordance with accounting standards generally accepted in the United States requires management to make estimates and assumptions that affect the reported amounts of assets and liabilities at the date of the financial statements and the reported amounts of revenues and expenses during the reporting period. The company evaluates its estimates and assumptions on an ongoing basis based on a combination of historical information and various other assumptions that are considered reasonable under the particular circumstances. Actual results may differ from these estimates under different assumptions.
Principles of Consolidation
The Consolidated Financial Statements include the accounts of Tidewater Inc. and its subsidiaries. Significant intercompany balances and transactions are eliminated in consolidation.
Cash Equivalents
The company considers all highly liquid investments with maturities of three months or less when purchased to be cash equivalents.
Inventories
Inventories, which consist primarily of operating parts and supplies for the company’s vessels, are stated at the lower of weighted-average cost or market.
Properties and Equipment
Properties and equipment are stated at cost. Depreciation for financial reporting purposes is computed primarily on the straight-line basis beginning with the date of construction, with salvage values of 5%-10% for marine equipment, using estimated useful lives of 15 - 25 years for marine equipment (from date of construction) and 3 - 30 years for other properties and equipment. Depreciation is provided for all vessels unless a vessel meets the criteria to be classified as held for sale in accordance with Statement of Financial Accounting Standard (SFAS) No. 144, “Accounting for the Impairment or Disposal of Long-Lived Assets.” Estimated remaining useful lives are reviewed when there has been a change in circumstances that indicate the original estimated useful life may no longer be appropriate.
Used equipment is depreciated in accordance with the above policy; however, no life less than six years is used for marine equipment regardless of the date constructed.
Maintenance and repairs are charged to operations as incurred during the asset's original estimated useful life (its original depreciable life). Major repair costs incurred after the original estimated depreciable

F-12
life that also have the effect of extending the useful life of the asset are capitalized and amortized over 30 months. Vessel modifications that are performed for a specific customer contract are capitalized and amortized over the firm contract term. Major modifications to equipment are capitalized and amortized over the remaining life of the equipment. The majority of the company’s vessels require drydocking inspection twice in each five year period and the company schedules vessel drydockings when it is anticipated that the work can be performed.
The following is a summary of net properties and equipment at March 31, 2006 and 2005:
2006 2005
Number Carrying Number Carrying Of Vessels Value Of Vessels Value
(In thousands) (In thousands)
Vessels in active service 368 $ 1,214,195 364 $ 1,195,721 Stacked vessels 67 20,170 74 27,623 Vessels withdrawn from service 66 10,163 94 17,076 Marine equipment under construction 112,261 194,714 Other property and equipment 16,938 17,052 Totals 501 $ 1,373,727 532 $ 1,452,186
The company considers a vessel to be stacked if its crew is removed from the vessel and limited maintenance is being performed on the vessel. This action is taken to reduce operating costs when management does not foresee adequate marketing possibilities in the near future. Vessels are added to this list when market conditions warrant and they are removed from this list when sold or otherwise disposed of or when returned to active service. As economically practical marketing opportunities arise, the stacked vessels can be returned to service by performing any necessary maintenance on the vessel and returning fleet personnel to operate the vessel. Although not currently fulfilling charters, stacked vessels are considered to be in service and are included in the calculation of the company’s utilization statistics. Stacked vessels at March 31, 2006 and 2005 have an average age of 25.2 and 24.8 years, respectively.
Vessels withdrawn from service represent those vessels that management has determined are unlikely to return to active service and are currently marketed for sale. Vessels withdrawn from service are not included in the company’s utilization statistics. Vessels withdrawn from service at March 31, 2006, with an average age of 26.2 years, include 20 vessels carried at an aggregate estimated liquidation value of $4.2 million and 33 vessels carried at an aggregate estimated scrap value of $1.3 million. Vessels withdrawn from service at March 31, 2005, with an average age of 24.9 years, include 38 vessels carried at an aggregate estimated liquidation value of $7.4 million and 42 vessels are carried at an aggregate estimated scrap value of $1.2 million.
All vessels are classified in the company’s consolidated balance sheets in Properties and Equipment. No vessels are classified as held for sale because no vessel meets the criteria of SFAS No. 144, “Accounting for the Impairment or Disposal of Long-Lived Assets.” Stacked vessels and vessels withdrawn from service are reviewed for impairment semiannually.
Goodwill
The company follows SFAS No. 142, “Goodwill and Other Intangible Assets,” which requires goodwill to be tested annually for impairment using a fair value-based approach and does not permit amortization of goodwill as previously required by Accounting Principles Board (APB) Opinion No. 17, “Intangible Assets.” An impairment loss would be recorded if the recorded goodwill exceeds its implied fair value. Goodwill primarily relates to the fiscal 1998 acquisition of O.I.L. Ltd., a British company. At March 31, 2006, the company’s goodwill represented 14% of total assets and 20% of stockholders’ equity.
F-13
Impairment of Long-Lived Assets
The company accounts for long-lived assets in accordance with SFAS No. 144, “Accounting for the Impairment or Disposal of Long-Lived Assets” and reviews long-lived assets for impairment whenever events occur or changes in circumstances indicate that the carrying amount of assets may not be recoverable. In such evaluation, the estimated future undiscounted cash flows generated by an asset group are compared with the carrying amount of the asset group to determine if a write-down may be required. The company estimates cash flows based upon historical data adjusted for the company’s best estimate of future market performance that is based on industry trends. If impairment exists, the carrying value of the asset group is reduced to its estimated fair value. Vessels with similar operating and marketing characteristics are grouped for asset impairment testing.
Although the company believes its assumptions and estimates are reasonable, deviations from the assumptions and estimates could produce a materially different result. Management estimates may vary considerably from actual outcomes due to future adverse market conditions or poor operating results thatcould result in the inability to recover the current carrying value of an asset group, thereby possibly requiring an impairment charge in the future. As the company’s fleet continues to age, management closely monitors the estimates and assumptions used in the impairment analysis to properly identify evolving trends and changes in market conditions that could impact the results of the impairment evaluation.
The company refined its asset groupings for impairment testing under SFAS No. 144, “Accounting for the Impairment or Disposal of Long-Lived Assets,” during fiscal 2005, and increased the number of asset groupings to better reflect the composition and varying capabilities of the company’s vessels and the markets within which such vessels operate. Also during the fourth quarter of fiscal 2005, the company formalized procedures for a periodic impairment review of its stacked vessels and vessels withdrawn from service. This review is undertaken every six months, or more often if considered necessary, and considers items such as the vessel’s age, length of time stacked and likelihood of a return to service, among others. The company records an impairment charge when the carrying value of a vessel withdrawn from service or a stacked vessel that is unlikely to return to service exceeds its estimated fair value.
Accrued Property and Liability Losses
The company's insurance subsidiary establishes case based reserves for estimates of reported losses on direct business written, estimates received from ceding reinsurers, and reserves based on past experience of unreported losses. Such losses principally relate to the company's marine operations and are included as a component of costs of marine operations in the consolidated statements of earnings. The liability for such losses and the related reimbursement receivable from reinsurance companies are classified in the consolidated balance sheets into current and noncurrent amounts based upon estimates of when the liabilities will be settled and when the receivables will be collected.
Pension and Other Postretirement Benefits
Pension costs are accounted for in accordance with the provisions of SFAS No. 87, “Employers' Accounting for Pensions” and are funded to at least meet the minimum funding requirements as required by law. Prior service costs are amortized on the straight-line basis over the average remaining service period of employees expected to receive pension benefits. Postretirement benefits other than pensions are accounted for in accordance with SFAS No. 106, “Employers' Accounting for Postretirement Benefits Other Than Pensions.” The estimated cost of postretirement benefits other than pensions are accrued during the employees' active service period.
The company follows the disclosure provisions of SFAS No. 132R, "Employers' Disclosures about Pensions and Other Postretirement Benefits—an amendment of FASB Statements No. 87, 88, and 106," as revised, which standardizes the disclosures for pensions and other postretirement benefit plans.

F-14
Income Taxes
Income taxes are accounted for in accordance with the provisions of SFAS No. 109, “Accounting for Income Taxes.” Deferred tax assets and liabilities are recognized for the future tax consequences attributable to differences between the financial statement carrying amounts of existing assets and liabilities and their respective tax bases. Deferred tax assets and liabilities are measured using enacted tax rates expected to apply to taxable income in the years in which those temporary differences are expected to be recovered or settled. The effect on deferred tax assets and liabilities of a change in tax rates is recognized in income in the period that includes the enactment date. Deferred taxes are not provided on undistributed earnings of certain non-U.S. subsidiaries and business ventures because the company considers those earnings to be permanently invested abroad.
Revenue Recognition
The company’s primary source of revenue is derived from time charter contracts of its vessels on a rate per day of service basis; therefore, marine vessel revenues are recognized on a daily basis throughout the contract period. These time charter contracts are generally either on a term basis (average three months to two years) or on a “spot” basis. The base rate of hire for a term contract is generally a fixed rate, provided, however, that term contracts at times include escalation clauses to recover specific additional costs. A spot contract is a short-term agreement to provide offshore marine services to a customer for a specific short-term job. Spot contract terms generally range from one day to one week. Marine vessel revenues are recognized on a daily basis throughout the contract period.
Operating Costs
Vessel operating costs are incurred on a daily basis and consist primarily of costs such as crew wages, repair and maintenance, insurance, fuel, lube oil and supplies, and other vessel expenses such as brokers commissions and crew personnel training costs. Repair and maintenance costs include both routine costs and major drydocking repair costs. Vessel operating costs are recognized as incurred on a daily basis.
Foreign Currency Translation
The U.S. dollar is the functional currency for all of the company’s existing international operations, as transactions in these operations are predominately denominated in U.S. dollars. Foreign currency exchange gains and losses are included in the consolidated statements of earnings.
Earnings Per Share
Earnings per share are computed in accordance with SFAS No. 128, "Earnings Per Share," which requires the reporting of both earnings per share and diluted earnings per share. The calculation of earnings per share is based on the weighted average number of shares outstanding and therefore excludes any dilutive effect of stock options, while diluted earnings per share includes the dilutive effect of stock options. Per share amounts disclosed in these Notes to Consolidated Financial Statements, unless otherwise indicated, are on a diluted basis.
Concentrations of Credit Risk
Financial instruments that potentially subject the company to concentrations of credit risk consist principally of trade and other receivables. These receivables are with a variety of domestic, international and national energy companies and also include reinsurance companies for recoverable insurance losses. The company manages its exposure to risk through ongoing credit evaluations of its customers and generally does not require collateral. The company maintains an allowance for doubtful accounts for potential losses and does not believe it is generally exposed to concentrations of credit risk that are likely

F-15
to have a material adverse impact on the company’s financial position, results of operations, or cash flows.
Stock-Based Compensation
The company measures compensation expense for its stock-based compensation plan using the intrinsic value recognition and measurement principles prescribed by APB Opinion No. 25, "Accounting for Stock Issued to Employees" and related interpretations. The plan is described in Note 8 of Notes to Consolidated Financial Statements. The company uses the disclosure provision of SFAS No. 148, "Accounting for Stock-Based Compensation – Transition and Disclosure," which amended the disclosure provision of SFAS No. 123. The following table illustrates the effect on net earnings and earnings per share had the company determined compensation cost based on the fair value at the grant date for its stock options under SFAS No. 123, "Accounting for Stock-Based Compensation."
(In thousands) 2006 2005 2004 Net earnings as reported $ 235,756 101,339 41,662 Add stock-based employee compensation expense included in reported net earnings, net of related tax effect 2,324 1,185 252Less total stock-based employee compensation expense, under fair value method for all awards, net of tax (6,085) (6,760) (6,418) Pro forma net earnings $ 231,995 95,764 35,496 Basic earnings per common share: As reported $ 4.11 1.78 .74 Pro forma $ 4.04 1.68 .63 Diluted earnings per common share: As reported $ 4.07 1.78 .73 Pro forma $ 4.00 1.68 .63
Comprehensive Income
The Company uses SFAS No. 130, "Reporting Comprehensive Income," which requires the reporting and display of total comprehensive income and its components in the financial statements. Total comprehensive income represents the net change in stockholders’ equity during a period from sources other than transactions with stockholders and, as such, includes net earnings. For the company, accumulated other comprehensive income is comprised of the net after-tax effect of accumulated foreign currency translation adjustments, unrealized gains and losses on available-for-sale securities and derivative financial instruments, and any minimum pension liability for the company’s U.S. Defined Benefits Pension Plan and Supplemental Executive Retirement Plan.
Derivative Instruments and Hedging Activities
The company uses SFAS No. 133, “Accounting for Derivative Instruments and Hedging Activities,” (SFAS No. 133) as amended. The company periodically utilizes derivative financial instruments to hedge against foreign currency denominated assets and liabilities and currency commitments. These transactions are forward currency contracts or interest rate swaps that are entered into with major financial institutions. Derivative financial instruments are intended to reduce the company’s exposure to foreign currency exchange risk and interest rate risk related to the company’s commitment to sell and simultaneously leaseback four of its vessels to Bank of America Leasing & Capital LLC. The company accounts for changes in the fair value of a derivative instrument depending on the intended use of the derivative and the resulting designation, which is established at the inception of a derivative. SFAS No. 133 requires that a company formally document, at the inception of a hedge, the hedging relationship and the entity’s risk management objective and strategy for undertaking the hedge, including identification of the hedging instrument, the hedged item or transaction, the nature of the risk being hedged, the method used to assess effectiveness and the method that will be used to measure hedge ineffectiveness of derivative instruments that receive hedge accounting treatment. For derivative instruments designated as foreign currency or interest rate hedges, changes in fair value, to the extent the hedge is effective, are recognized in other comprehensive income until the hedged item is recognized in earnings. Amounts

F-16
representing hedge ineffectiveness are recorded in earnings. Hedge effectiveness is assessed quarterly based on the total change in the derivative’s fair value.
Reclassifications
Certain previously reported amounts have been reclassified to conform to the 2006 presentation.
New Accounting Pronouncements
In December 2004, the Financial Accounting Standards Board (FASB) issued Statement of Financial Accounting Standards (SFAS) No. 123 (Revised 2004), “Share-Based Payment” (SFAS 123R). This standard requires expensing of stock options and other share-based payments and supersedes SFAS No. 123, Accounting for Stock-Based Compensation and Accounting Principles Board (APB) Opinion No. 25, Accounting for Stock Issued to Employees, and its related implementation guidance that had allowed companies to choose between expensing stock options or showing proforma disclosure only. This standard, together with a new rule adopted by the Securities and Exchange Commission in April 2005, is effective for the company as of April 1, 2006 and will apply to all awards granted, modified, cancelled or repurchased after that date. The ultimate amount of increased compensation expense will be dependent on the number of option shares granted, their timing and vesting period and the method used to calculate the fair value of the awards, among other factors. Based on stock options outstanding as of March 31, 2006, the adoption of SFAS No. 123R is expected to result in the recognition of $6.0 million of future compensation expense, of which $3.2 million is expected to be recorded during fiscal 2007.
From time to time, new accounting pronouncements are issued by the FASB that are adopted by the company as of the specified effective date. Unless otherwise discussed, management believes that the impact of recently issued standards, which are not yet effective, will not have a material impact on the company’s consolidated financial statements upon adoption.
(2) Investment in Unconsolidated Companies
Investments in unconsolidated affiliates, generally 50% or less owned partnerships and corporations, are accounted for by the equity method. Under the equity method, the assets and liabilities of the unconsolidated joint venture companies are not consolidated in the company’s consolidated balance sheet.
Investments in, at equity, and advances to unconsolidated marine joint-venture companies at March 31 were as follows:
Percentage (In thousands) ownership 2006 2005
Sonatide Marine Ltd. (Luanda, Angola) 49% $ 32,912 30,475 Others 20%-50% 1,396 1,599
$ 34,308 32,074
During fiscal 2004, the company sold three crewboats to Sonatide Marine Ltd. for $11.8 million. The company financed the sale of all three crewboats. Under the terms of the repayment agreement, the loan is payable in 36 equal installments plus interest at 90 day LIBOR plus 1.5% adjusted quarterly.
The company restructured its financing agreements with Sonatide Marine Ltd. during the first quarter of fiscal 2005. Under the terms of the new financing arrangement, the loan is payable in 60 equal installments (beginning in June 2004 and ending in May 2009), plus interest at 90 day LIBOR plus 1.5% adjusted quarterly.
As of March 31, 2006, 2005 and 2004, $10.3 million, $13.5 million, and $17.5 million, respectively, was owed the company related to these financings.

F-17
(3) Impairment of Long-lived Assets
During fiscal 2004, numerous marine drilling rigs exited the U.S. Gulf of Mexico despite attractive domestic oil and gas commodity pricing for an extended period of time. These departures, combined with the low activity levels of traditional Gulf of Mexico operators, left the active offshore rig count at its lowest level in ten years. By late fiscal 2004, the company concluded based on mounting extrinsic evidence that low activity levels in the Gulf of Mexico could possibly persist for an extended period of time. Management reviewed the recoverability of the values of its Gulf of Mexico operating assets and recorded in March 2004 a non-cash asset impairment charge of $26.5 million ($17.2 million after tax, or $0.30 per share) relating to 83 older Gulf of Mexico supply vessels. As a result of the prolonged weakness in the Gulf of Mexico drilling market, the vessels were stacked for as long as several years and were viewed as unlikely to return to service. Due to the average age of the vessels (23.5 years), outdated specifications (low horsepower and cargo capacities) relative to competing equipment, significant costs to repair and return the vessels to service (average approximately $500,000 per vessel) and an anticipation of low customer demand for the vessels in the future, the company concluded it was unlikely that these vessels would return to active service. Based on such factors, and in accordance with Statement of Financial Accounting Standards No. 144, “Accounting for the Impairment or Disposal of Long-Lived Assets,” the asset impairment charge noted above was taken to adjust the carrying value of the assets to fair value at March 31, 2004. The fair value of the vessels was determined based upon management’s estimate of liquidation values that could be realized in sales to unrelated purchasers and included an assumption that a significant number of the vessels (as much as 50%) may have to be scrapped. Disposal of the assets may take an extended period of time due to the vessels’ outdated specifications. Two vessels from this group of impaired vessels were sold during fiscal 2005 and an additional 22 vessels were sold and/or scrapped during fiscal 2006.
In the fourth quarter of fiscal 2005, the company reviewed, for impairment purposes, all stacked vessels and vessels withdrawn from service and recorded a non-cash impairment charge of $1.7 million ($1.1 million after tax, or $0.02 per share) to reduce the carrying amount of 10 stacked vessels as to which an impairment charge had not been taken in fiscal 2004 but which were subsequently identical as being unlikely to return to active service. An impairment review during fiscal 2006 resulted in a non-cash impairment charge of approximately $3.1 million ($2.0 million after tax, or $.03 per share) on eight additional vessels that are withdrawn from service as to which an impairment charge had not been taken previously.
(4) Income Taxes
Earnings before income taxes derived from United States and international operations for the years ended March 31 are as follows:
(In thousands) 2006 2005 2004 United States $ 126,533 (4,505) (52,590) International 196,979 104,301 107,093
$ 323,512 99,795 54,503
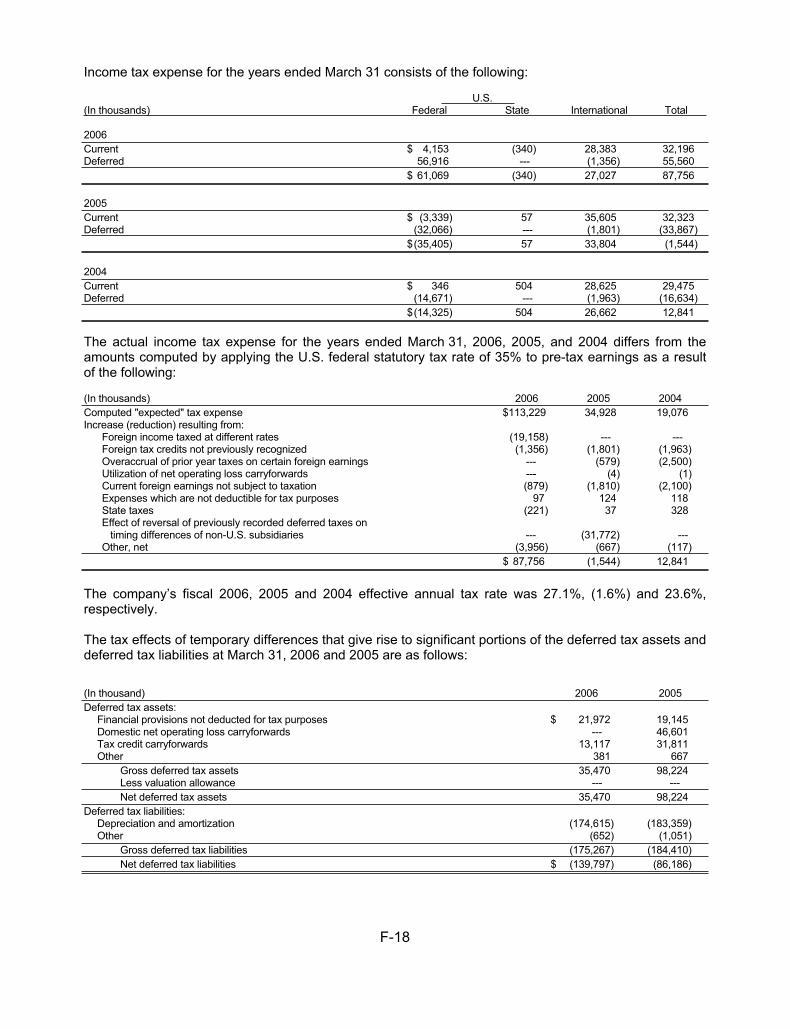
F-18
Income tax expense for the years ended March 31 consists of the following:
U.S. (In thousands) Federal State International Total
2006 Current $ 4,153 (340) 28,383 32,196 Deferred 56,916 --- (1,356) 55,560 $ 61,069 (340) 27,027 87,756
2005 Current $ (3,339) 57 35,605 32,323 Deferred (32,066) --- (1,801) (33,867) $ (35,405) 57 33,804 (1,544)
2004 Current $ 346 504 28,625 29,475 Deferred (14,671) --- (1,963) (16,634) $ (14,325) 504 26,662 12,841
The actual income tax expense for the years ended March 31, 2006, 2005, and 2004 differs from the amounts computed by applying the U.S. federal statutory tax rate of 35% to pre-tax earnings as a result of the following:
(In thousands) 2006 2005 2004 Computed "expected" tax expense $113,229 34,928 19,076 Increase (reduction) resulting from: Foreign income taxed at different rates (19,158) --- --- Foreign tax credits not previously recognized (1,356) (1,801) (1,963) Overaccrual of prior year taxes on certain foreign earnings --- (579) (2,500) Utilization of net operating loss carryforwards --- (4) (1) Current foreign earnings not subject to taxation (879) (1,810) (2,100) Expenses which are not deductible for tax purposes 97 124 118 State taxes (221) 37 328 Effect of reversal of previously recorded deferred taxes on timing differences of non-U.S. subsidiaries --- (31,772) --- Other, net (3,956) (667) (117) $ 87,756 (1,544) 12,841
The company’s fiscal 2006, 2005 and 2004 effective annual tax rate was 27.1%, (1.6%) and 23.6%, respectively.
The tax effects of temporary differences that give rise to significant portions of the deferred tax assets and deferred tax liabilities at March 31, 2006 and 2005 are as follows:
(In thousand) 2006 2005 Deferred tax assets: Financial provisions not deducted for tax purposes $ 21,972 19,145 Domestic net operating loss carryforwards --- 46,601 Tax credit carryforwards 13,117 31,811 Other 381 667 Gross deferred tax assets 35,470 98,224 Less valuation allowance --- --- Net deferred tax assets 35,470 98,224 Deferred tax liabilities: Depreciation and amortization (174,615) (183,359) Other (652) (1,051) Gross deferred tax liabilities (175,267) (184,410) Net deferred tax liabilities $ (139,797) (86,186)

F-19
The provisions of the American Jobs Creation Act of 2004 (the Act), were effective for the company as of April 1, 2005, and allowed the company to omit recording deferred tax assets or liabilities on future undistributed earnings of most non-U.S. subsidiaries and business ventures that it considers indefinitely reinvested abroad. At March 31, 2005, the company reversed all previously recorded deferred tax assets and liabilities related to timing differences, foreign tax credits, or prior undistributed earnings of these entities whose future and prior earnings are now anticipated to be indefinitely reinvested abroad. This resulted in an approximate $31.8 million reduction of income tax expense in the fourth quarter of fiscal 2005.
The company has not recognized a U.S. deferred tax liability associated with temporary differences related to investments in foreign subsidiaries that are essentially permanent in duration. The differences relate primarily to undistributed earnings and stock basis differences. Though the company does not anticipate repatriation of funds, a current U.S. tax liability would be recognized when the company receives those foreign funds in a taxable manner such as through receipt of dividends or sale of investments. As of March 31, 2006, the total amount for which U.S. deferred taxes have not been recognized is approximately $265.3 million. A determination of the unrecognized deferred tax liability for temporary differences related to investments in foreign subsidiaries is not practicable due to uncertainty regarding the use of foreign tax credits which would become available as a result of a transaction. The American Jobs Creation Act of 2004 provides for a special one-time tax deduction of 85% of certain foreign earnings that are repatriated in either fiscal 2005 or 2006. The company has evaluated the repatriation provision, and consistent with its decision to reinvest all future earnings of its foreign subsidiaries, has concluded that the repatriation of unremitted foreign earnings provides no benefit to the company, and has no effect on income tax expense as reported.
As of March 31, 2006, the company has foreign tax credit carry-forwards approximating $12.0 million that expire in 2014 through 2015.
The company receives a tax benefit that is generated by certain employee stock benefit plan transactions. This benefit is recorded directly to additional paid-in-capital and does not reduce the company’s effective income tax rate. The tax benefit for the years ended March 31, 2006, 2005 and 2004 totaled approximately $4.1 million, $0.8 million and $0.7 million, respectively.
(5) Long-term Debt and Revolving Credit Agreement
On May 18, 2005, the company amended its $295 million revolving line of credit agreement, which expires on May 18, 2010, increasing the face amount of the facility from $295 million to $300 million and providing a mechanism for increasing the amount of the facility up to $400 million. Borrowings bear interest at the company’s option, at the greater of prime or Federal Funds rates plus .5% or LIBOR rates plus margins from .50 to 1.125% based on the company’s funded debt to total capitalization ratio. The amended agreement reduced the annual fee on the unused portion of the facility to a range between .10 to .25% and modified certain financial covenants, which would allow more flexibility in utilizing the facility. There were no borrowings outstanding under the revolving credit agreement at March 31, 2006.
At March 31, 2005, the company had $80.0 million outstanding borrowings from the revolving credit facility. The weighted average interest rate applicable to amounts outstanding under the revolving credit agreement at March 31, 2005 was 1.97%.
Prior to the amendment on May 18, 2005, borrowings under the company’s $295 million revolving credit agreement bore interest at the company’s option, at prime or Federal Funds rates plus .5% or LIBOR rates plus margins from .75% to 1.25% based on the company’s funded debt to total capitalization ratio. Any borrowings under the agreement were unsecured and the company paid an annual fee of .20 to .30% on the unused portion of the facility as determined by the company’s funded debt to total capitalization ratio.

F-20
At March 31, 2006, the company had $300 million of debt outstanding which represents senior unsecured notes that were issued on July 8, 2003. The multiple series of notes with original maturities ranging from 7 years to 12 years have an average outstanding life to maturity of 9.5 years and can be retired prior to maturity without penalty. The average interest rate on the notes is 4.35%. The terms of the notes limit the amount of company debt, and the company’s debt to total capitalization ratio cannot exceed 55%. The fair value of this debt at March 31, 2006 is estimated to be $279.8 million.
Under the terms of the revolving credit agreement, the company has agreed to limitations on future levels of investments and aggregate indebtedness, maintenance of certain debt to capitalization ratios and debt to earnings ratios. The revolving credit agreement also limits the company’s ability to encumber its assets for the benefit of others.
Interest and debt costs incurred, net of interest capitalized, for fiscal 2006, 2005 and 2004 was approximately $9.1 million, $6.9 million, and $3.7 million, respectively. Interest costs capitalized during fiscal 2006, 2005 and 2004 was approximately $6.3 million, $10.0 million, and $8.5 million, respectively.
(6) Employee Benefit Plans
Upon meeting various citizenship, age and service requirements, employees are eligible to participate in a defined contribution savings plan and can contribute from 2% to 75% of their base salary to an employee benefit trust. The company matches with company common stock 50% of the employee’s contribution to the plan up to a maximum of 6% of the employee’s base salary. The plan held 453,337 shares and 482,387 shares of the company's common stock at March 31, 2006 and 2005, respectively. Amounts charged to expense for the plan for 2006, 2005 and 2004 were $1.1 million, $1.4 million, and $1.2 million, respectively.
A defined benefit pension plan covers certain U.S. citizen employees and employees who are permanent residents of the United States. Benefits are based on years of service and employee compensation. Approximately 75% of the pension plan assets are invested in fixed income securities with the balance invested in equity securities and cash and cash equivalents. The plan does not invest in Tidewater stock. The company’s policy is to fund the plan based upon minimum funding requirements of the Employee Retirement Income Security Act of 1974. Certain benefits programs are maintained in several other countries that provide retirement income for covered employees.
The company also has a supplemental retirement plan (supplemental plan) that provides pension benefits to certain employees in excess of those allowed under the company's tax-qualified pension plan. Assets of this non-contributory defined benefit plan are held in a Rabbi Trust, which consists of a variety of marketable securities, none of which is Tidewater stock. The Trust assets, which are included in “other assets” in the company’s consolidated balance sheet, are recorded at fair value with unrealized gains or losses included in other comprehensive income. Trust assets at March 31, 2006 and 2005 were $10.6 million and $10.6 million, respectively, and the company’s obligation under the supplemental plan, which is included in “other liabilities and deferred credits” on the consolidated balance sheet, amounted to $16.2 million and $14.5 million, respectively, at March 31, 2006 and 2005.
Qualified retired employees currently are covered by a program which provides limited health care and life insurance benefits. Costs of the program are based on actuarially determined amounts and are accrued over the period from the date of hire to the full eligibility date of employees who are expected to qualify for these benefits. This plan was amended during the year ended March 31, 2006 to eliminate prescription drug coverage for Medicare eligible participants and to provide an alternative high deductible plan design. This plan is not funded.
Changes in plan assets and obligations during the years ended March 31, 2006 and 2005 and the funded status of the U.S. defined benefit pension plan and the supplemental plan (referred to collectively

F-21
as "Pension Benefits") and the postretirement health care and life insurance plan (referred to as "Other Benefits") at March 31, 2006 and 2005 were as follows:
Pension Benefits Other Benefits (In thousands) 2006 2005 2006 2005 Change in benefit obligation Benefit obligation at beginning of year $ 61,970 56,645 41,902 42,785 Service cost 760 696 2,011 1,758 Interest cost 3,527 3,354 2,365 2,347 Participant contributions --- --- 378 375 Plan amendments --- --- (27,870) --- Benefits paid (2,714) (2,575) (1,687) (1,320) Actuarial (gain) loss 4,458 3,850 16,537 (4,043) Benefit obligation at end of year $ 68,001 61,970 33,636 41,902
Change in plan assets Fair value of plan assets at beginning of year $ 40,204 38,423 --- --- Actual return 1,577 3,486 --- --- Employer contributions 1,662 870 1,309 945 Participant contributions --- --- 378 375 Benefits paid (2,714) (2,575) (1,687) (1,320) Fair value of plan assets at end of year $ 40,729 40,204 --- ---
Reconciliation of funded status Fair value of plan assets $ 40,729 40,204 --- --- Benefit obligation 68,001 61,970 33,636 41,902 Funded (unfunded) status (27,272) (21,766) (33,636) (41,902) Unrecognized actuarial loss 15,905 11,521 25,537 9,505 Unrecognized prior service cost (benefit) 165 254 (27,439) 417 Net accrued benefit cost $ (11,202) (9,991) (35,538) (31,980)
Net accrued benefit cost consists of: Accrued benefit liability $ (23,213) (18,531) (35,538) (31,980) Intangible asset 593 1,055 --- --- Accumulated other comprehensive loss 11,418 7,485 --- --- Net accrued benefit cost $ (11,202) (9,991) (35,538) (31,980)
The following table provides the projected benefit obligation and accumulated benefit obligation for the pension plans:
(In thousands) 2006 2005 Projected benefit obligation $ 68,001 61,970 Accumulated benefit obligation 63,941 58,735
The following table provides information for pension plans with an accumulated benefit obligation in excess of plan assets (includes both the U.S. defined benefit pension plan and supplemental plan):
(In thousands) 2006 2005 Projected benefit obligation $ 68,001 61,970 Accumulated benefit obligation 63,941 58,735 Fair value of plan assets 40,729 40,204

F-22
Net periodic pension cost for the U.S. defined benefit pension plan and the supplemental plan for 2006, 2005 and 2004 include the following components:
(In thousands) 2006 2005 2004 Service cost $ 760 696 650 Interest cost 3,527 3,354 3,346 Expected return on plan assets (2,450) (2,559) (2,585) Amortization of prior service cost 89 98 99Recognized actuarial loss 948 842 639 Net periodic pension cost $ 2,874 2,431 2,149
Net periodic postretirement health care and life insurance costs for 2006, 2005 and 2004 include the following components:
(In thousands) 2006 2005 2004 Service cost $ 2,011 1,758 1,844 Interest cost 2,365 2,347 2,435 Other amortization and deferral 492 536 766 Net periodic postretirement benefit cost $ 4,868 4,641 5,045
The company is required to recognize a minimum liability if the U.S. defined benefits pension plan or supplemental plan has an accumulated benefit obligation in excess of plan assets. Adjustments to the minimum liability are included in other comprehensive income.
(In thousands) 2006 2005 Increase in minimum liability included in other comprehensive income $ 3,933 3,063
Assumptions used to determine net benefit obligations for the fiscal years ended March 31 were as follows:
Pension Benefits Other Benefits2006 2005 2006 2005
Discount rate 5.5% 5.75% 5.5% 5.75% Rates of annual increase in compensation levels 3.00% 3.00% N/A N/A
Assumptions used to determine net periodic benefit costs for the fiscal years ended March 31 were as follows:
Pension Benefits Other Benefits2006 2005 2004 2006 2005 2004
Discount rate 5.75% 6.25% 6.75% 5.75% 6.25% 6.75% Expected long-term rate of return on assets 6.25% 6.75% 7.25% N/A N/A N/A Rates of annual increase in compensation levels 3.00% 3.00% 4.00% N/A N/A N/A
To develop the expected long-term rate of return on assets assumption, the company considered the current level of expected returns on various asset classes. The expected return for each asset class was then weighted based on the target asset allocation to develop the expected return on plan assets assumption for the portfolio.
The following table provides the target and actual asset allocations for the U.S. defined benefits pension plan: Actual as of Actual as of Target 2006 2005Equity securities 15% 12% 9%Debt securities 80% 73% 79%Other, primarily cash 5% 15% 12%Total 100% 100% 100%

F-23
Based upon the assumptions used to measure the company’s qualified pension and postretirement benefit obligation at March 31, 2006, including pension and postretirement benefits attributable to estimated future employee service, the company expects that benefits to paid over the next ten years will be as follows:
(In thousands) Pension Other
Year ending March 31, Benefits Benefits 2007 $ 3,318 1,277 2008 3,536 1,465 2009 3,801 1,618 2010 4,115 1,855 2011 4,424 2,047 2012 - 2016 26,139 12,904 Total estimated future benefit payments $ 45,332 21,166
The assumed health care cost trend rate used in measuring the accumulated postretirement benefit obligation will be 10% in 2006, gradually declining to 5% in the year 2011 and thereafter. A 1% increase in the assumed health care cost trend rates for each year would increase the accumulated postretirement benefit obligation by approximately $5.3 million at March 31, 2006 and increase the total of service and interest cost for the year ended March 31, 2006 by $0.8 million. A 1% decrease in the assumed health care cost trend rates for each year would decrease the accumulated postretirement benefit obligation by approximately $4.3 million at March 31, 2006 and decrease the total of service and interest cost for the year ended March 31, 2006 by $0.6 million.
A defined contribution retirement plan covers all eligible U.S. fleet personnel, along with all new eligible employees of the company hired after December 31, 1995. This plan is noncontributory by the employee, but the company has contributed in cash 3% of an eligible employee’s compensation to an employee benefit trust. The cost of the plan for fiscal 2006, 2005 and 2004 was $1.9 million, $1.6 million and $1.7 million, respectively. Forfeitures totaling approximately $0.1 million, $0.2 million and $0.3 million reduced the costs of the plan for fiscal 2006, 2005 and 2004, respectively.
(7) Other Assets, Other Liabilities and Deferred Credits and Accumulated Other Comprehensive Income
A summary of other assets at March 31 follows:
(In thousands) 2006 2005 Recoverable insurance losses $ 21,732 34,778 Deferred income tax assets 35,470 98,224 Other 41,506 39,201
$ 98,708 172,203
A summary of other liabilities and deferred credits at March 31 follows:
(In thousands) 2006 2005 Postretirement benefits liability $ 35,136 31,577 Pension liability 11,202 9,991 Minority interests in net assets of subsidiaries 1,128 1,196 Deferred vessel revenues 2,033 --- Income taxes 15,605 13,657 Other 27,562 20,549
$ 92,666 76,970

F-24
A summary of accumulated other comprehensive income at March 31 follows:
(In thousands) 2006 2005 Currency translation adjustments $ 10,578 10,578 Derivatives – marked-to-market, net of tax of $272 in 2006 and $0 in 2005 (505) --- Unrealized gains on available-for-sale securities, net of tax of $57 in 2006 and $6 in 2005 (853) (748) Benefit plans minimum liabilities, net of tax of $1,376 in 2006 and $1,072 in 2005 7,421 4,865
$ 16,641 14,695
(8) Capital Stock
The company has 125 million shares of $.10 par value common stock authorized. At March 31, 2006 and 2005, 60,310,164 shares and 60,718,231 shares, respectively, were issued. At March 31, 2006 and 2005, 2,167,021 and 3,201,352 shares, respectively, were held by the Grantor Trust Stock Ownership Program, which are not included in common shares outstanding for earnings per share calculations. At March 31, 2006 and 2005, 3,000,000 shares of no par value preferred stock were authorized and unissued.
In July 2005, the company’s Board of Directors authorized the company to spend up to $120.0 million to repurchase shares of its common stock. Repurchases are made through open market or privately-negotiated transactions. The company intends to use its available cash and, when considered advantageous, borrowings under its revolving credit facility to fund the share repurchases. The Board of Directors’ authorization for this repurchase program will expire when all authorized funds have been expended or on June 30, 2006, unless extended by the Board of Directors. As of March 31, 2006, the company spent $20.8 million for the repurchase and cancellation of 455,000 common shares, or an average price paid per common share of $45.64. At March 31, 2006, approximately $99.2 million was available to repurchase shares of the company’s common stock pursuant to the stock repurchase program.
Under the company's stock option and restricted stock plans, the Compensation Committee of the Board of Directors has authority to grant stock options and restricted shares of the company's stock to officers and other key employees. At March 31, 2006, 4,157,161 shares of common stock are reserved for issuance under the plans of which 494,286 shares are available for future grants. Stock options are granted with an exercise price equal to the stock's fair market value at the date of grant. All outstanding stock options have ten-year terms and most of the outstanding options vest and become exercisable in equal installments over a three-year period from the grant date.
The per share weighted-average fair values of stock options granted during fiscal years 2006, 2005 and 2004 were $20.40, $12.61, and $9.40, respectively, on the dates of grant using the Black Scholes option-pricing model with the following weighted-average assumptions:
2006 2005 2004 Risk-free interest rate 4.79% 4.15% 3.25% Expected dividend yield 1.07% 1.50% 2.00% Expected stock price volatility 35.00% 36.46% 40.68% Expected stock option life 5.5 years 5 years 5 years
The company applies the intrinsic value recognition and measurement principles prescribed by APB Opinion No. 25 in accounting for its plans and, accordingly, no compensation cost has been recognized for its stock options in the consolidated financial statements. The effect on the company’s net earnings had the company determined compensation cost based on the fair value at the grant date for its stock options under SFAS No. 123 is disclosed in Note 1 of Notes to Consolidated Financial Statements.

F-25
Stock option activity during 2006, 2005 and 2004 was as follows:
Weighted-average Number Exercise Price of Shares
Balance at March 31, 2003 $ 35.93 4,330,482 Granted 28.01 377,500 Exercised 22.45 (220,641) Expired or cancelled 38.57 (139,668) Balance at March 31, 2004 35.85 4,347,673 Granted 37.55 169,722 Exercised 26.74 (284,853) Expired or cancelled 35.07 (93,001) Balance at March 31, 2005 36.48 4,139,541 Granted 55.76 399,250 Exercised 37.00 (868,582) Expired or cancelled 33.46 (7,334) Balance at March 31, 2006 $ 38.57 3,662,875
The 3,662,875 options outstanding at March 31, 2006 fall into three general exercise-price ranges as follows:
Exercise Price Range $22.75 - $29.44 $32.25 - $40.28 $42.19-$59.00 Options outstanding at March 31, 2006 1,199,644 970,314 1,492,917 Weighted average exercise price $27.01 $36.47 $49.23 Weighted average remaining contractual life 6.2 years 5.7 years 4.8 years Options exercisable at March 31, 2006 1,097,460 970,314 1,213,406 Weighted average exercise price of options exercisable at March 31, 2006 $26.92 $36.47 $47.73
At March 31, 2006, 2005, and 2004, the number of options exercisable under the stock option plans was 3,281,180, 3,698,184, and 3,385,975, respectively; and the weighted average exercise price of those options was $37.44, $37.36, and $37.41, respectively.
A total of 563,793 shares of restricted common stock of the company were granted to certain key employees during fiscal years 2002 through 2006 from the company’s Employee Restricted Stock Plan and the 1997 and 2001 Stock Incentive Plans. These restricted shares vest and become freely transferable over a four-year period provided the employee remains employed by the company during the vesting period. During the restricted period, the restricted shares may not be transferred or encumbered, but the recipient has the right to vote and receive dividends on the restricted shares. The fair market value of the stock at the time of the grants totaled approximately $24.3 million and was classified in stockholders’ equity as deferred compensation – restricted stock. The deferred amount is being amortized by equal monthly charges to earnings over the respective four-year vesting periods. The Employee Restricted Stock Plan is the only equity compensation plan that has not been approved by shareholders.
The company established a Grantor Trust Stock Ownership Program on January 29, 1999 in connection with which the company entered into a trust agreement with a bank providing for the establishment of the related trust (the "trust"). The trust is designed to acquire, hold and distribute shares of the common stock of the company to provide for the payment of benefits and compensation under the company's employee benefit plans, including its stock option plans and 401(k) plan. The trust will not increase or alter the amount of benefits or compensation that will be paid under these plans.
On January 29, 1999, the company sold at market value 5,000,000 shares (the "acquired shares") of common stock to the trust for $107,187,500, or $21.4375 per share. In payment for the acquired shares, the trust paid $500,000 in cash and issued a promissory note payable to the company for the remaining balance. Acquired shares will be released to satisfy the company's obligations to pay benefits under company benefit plans as the promissory note is paid down or forgiven.

F-26
For financial reporting purposes the trust is consolidated with the company. Any dividend transactions between the company and the trust are eliminated. Acquired shares held by the trust remain valued at the market price at the date of purchase and are shown as a reduction to stockholders' equity in the company's consolidated financial statements. The difference between the trust share value and the fair market value on the date shares are released from the trust is included in additional paid-in capital. Common stock held in the trust is not considered outstanding in the computation of earnings per share. The trust held 2,167,021 and 3,201,352 shares of common stock at March 31, 2006 and 2005, respectively. The trustee will vote or tender shares held by the trust in accordance with the confidential instructions of participants in the company's stock option plans and 401(k) plan.
Under a Shareholder Rights Plan, one preferred stock purchase right has been distributed as a dividend for each outstanding common share. Each right entitles the holder to purchase, under certain conditions, one one-hundredth of a share of Series A Participating Preferred Stock at an exercise price of $160, subject to adjustment. The rights will not be exercisable unless a person (as defined in the plan) acquires beneficial ownership of 15% or more of the outstanding common shares, or a person commences a tender offer or exchange offer, which upon its consummation such person would beneficially own 15% or more of the outstanding common shares. The Board of Directors are authorized in certain circumstances to lower the beneficial ownership percentage to not less than 10%.
If after the rights become exercisable a person becomes the beneficial owner of 15% or more of the outstanding common shares (except pursuant to an offer for all shares approved by the Board of Directors), each holder (other than the acquirer) will be entitled to receive, upon exercise, common shares having a market value of twice the exercise price. In addition, if the company is involved in a merger (other than a merger which follows an offer for all shares approved by the Board of Directors), major sale of assets or other business combination after a person becomes the beneficial owner of 15% or more of the outstanding common shares, each holder of a right (other than the acquirer) will be entitled to receive, upon exercise, common stock of the acquiring company having a market value of twice the exercise price.
The rights may be redeemed for $.01 per right at any time prior to ten days following the acquisition by a person of 15% or more of the outstanding common shares. The rights expire on November 1, 2006.
(9) Sale/Leaseback Arrangements
On March 24, 2006, the company sold one of its newly-built vessels, delivered to the market in March 2006, to Banc of America Leasing & Capital LLC (BOAL&C), an unrelated third party, for $12.0 million and simultaneously entered into a bareboat charter arrangement with BOAL&C. The company is accounting for the transaction as a sale/leaseback transaction with operating lease treatment. Accordingly, the company will not record the asset on its books and the company will expense periodic lease payments. The agreement to acquire and charter with BOAL&C also calls for the company to sell and simultaneously bareboat charter four additional vessels, which are currently under construction, upon the vessels’ delivery to the market. BOAL&C agreed to pay actual invoice cost of the respective vessels being acquired, or $63.5 million. The vessels currently under construction are expected to begin delivery to the market beginning July 2006 with final delivery of the last vessel in September 2007.
The initial charter hire operating lease term expires in 2014. The company has the option to extend the charter hire operating lease three times, each for a period of 12 months, which would provide the

F-27
company the opportunity to extend the operating lease through 2017. Future minimum lease payments as of March 31, 2006 under the operating lease are as follows:
AmountYear ending March 31, (In Thousands) 2007 $ 1,765 2008 5,581 2009 6,688 2010 6,688 2011 6,688 Thereafter 25,958 Total future lease payments $ 53,368
The company is exposed to possible interest rate fluctuation related to its commitment to the sale and simultaneous leaseback of four additional vessels it agreed to sell to Banc of America Leasing & Capital LLC. See Note 11 to the Consolidated Financial Statements for a more complete discussion of this transaction.
(10) Commitments and Contingencies
Compensation continuation agreements exist with all of the company’s officers whereby each receives compensation and benefits in the event that their employment is terminated following certain events relating to a change in control of the company. The maximum amount of cash compensation that could be paid under the agreements, based on present salary levels, is approximately $31.4 million.
As of March 31, 2006 the company has committed to the construction of 13 vessels at a total cost of approximately $175.3 million, which includes shipyard commitments and other incidental costs. The company is committed to the construction of five anchor handling towing supply vessels averaging between 6,500 to 8,000 brake horsepower (BHP), five platform supply vessels, one 175-foot crewboat, one offshore tug and one water jet vessel. Scheduled delivery of the vessels is expected to began in April 2006 with final delivery in December 2007. As of March 31, 2006, $61.0 million has been expended on these vessels.
While the company does not have any other commitments for new-build vessel contracts other than what is discussed above, the company anticipates that over the next several years, it will continue to build, acquire or lease newer vessels in order to replace its aging vessels. The majority of the company’s supply and towing supply vessels were constructed between 1976 and 1983. As such, most of this vessel class exceeds 22 years of age and will need to be replaced within the next several years. In addition to age, market conditions also help determine when a vessel is no longer economically viable. The company anticipates using future operating cash flows, existing borrowing capacities or new borrowings or lease arrangements to fund over the next few years the continuing replacement of the company’s mature fleet of vessels. These vessels would replace the company’s core international fleet with fewer, larger and more efficient vessels. The company believes that adequate capital resources will be available to continue its fleet replacement.
At the conclusion of its examination of the company’s income tax returns covering fiscal years 2001 and 2002, the Internal Revenue Service (IRS) proposed changes to taxable income which, if sustained, would result in additional income tax of $12.8 million. The proposed increase in taxable income results primarily from the IRS disallowance of all claimed deductions from taxable income related to the company’s foreign sales corporation (FSC) as well as all deductions claimed under the Extraterritorial Income Exclusion (ETI). The company has filed a formal protest with the IRS seeking a reconsideration of their position taken. The company has also received a final assessment of additional income tax of $1.75 million resulting from the IRS’s earlier examination of the company’s income tax returns for fiscal years 1999 and 2000. Such assessment is also due to the IRS disallowance of essentially all deductions related to FSC activity during that period. The company has paid the 1999 and 2000 assessment and has begun the process of seeking a refund of the taxes paid through the initiation of legal proceedings. The IRS has

F-28
begun an examination of the company’s 2003 and 2004 federal income tax returns. The company also has additional ongoing examinations by various state and foreign tax authorities. The company does not believe that the results of these examinations will have a material adverse effect on the company’s financial position or results of operations.
Certain current and former subsidiaries of the company are, or have been, participating employers in an industry-wide multi-employer retirement fund in the United Kingdom, the Merchant Navy Officers Pension Fund (MNOPF.) The company has been informed of an estimated 234 million sterling, or approximately $433 million, total fund deficit as estimated by the MNOPF actuary, that will require contributions from the participating employers. Substantially all of the fund's deficit allocable to the company relates to current operating subsidiaries as the company does not believe, on the advice of counsel, that it is liable for any additional portion of the fund's deficit that relates to subsidiaries that have either been sold or dissolved in prior years. The amount of the company's share of the fund's deficit will depend ultimately on a number of factors including an updated calculation of the total fund deficit, the number of participating employers, and the final method used in allocating the required contribution among participating employers.
In August 2005, the company received an invoice from the fund in the amount of $3.8 million for what the trustees calculated to be the company's current share of the fund deficit. Accordingly, the company recorded this amount in full as crew cost expense during the second quarter of fiscal 2006. As allowed by the terms of the assessment, approximately $0.7 million of the invoiced amount was paid during fiscal 2006 with the remainder, including interest charges, to be paid in annual installments over nine years. The first installment totaling approximately $0.4 million was paid in March 2006.
It is possible that the fund's trustee may issue additional invoices to the company for additional amounts in the future for various reasons, including the results of future fund valuation reports and whether other assessed parties have the financial capability to contribute their respective allocations.
The company has previously disclosed that it is the subject of an informal inquiry by the Securities and Exchange Commission (SEC) related to the $26.5 million impairment charge that it recorded in its fiscal year ended March 31, 2004 that was related to 83 stacked vessels that had been used in the Gulf of Mexico. The company is in discussions with the SEC in an effort to resolve the matters raised by the inquiry. At this time, the company is unable to predict the timing or ultimate outcome of these discussions.
Various legal proceedings and claims are outstanding which arose in the ordinary course of business. In the opinion of management, the amount of ultimate liability, if any, with respect to these actions will not have a material adverse effect on the company's financial position, results of operations, or cash flows.
(11) Financial Instruments
The company’s financial instruments consist primarily of cash and cash equivalents, trade receivables, trade payables and long-term debt whose book values are considered to be representative of their respective fair values. The company also periodically enters into spot and forward currency derivative financial instruments as a hedge against foreign currency denominated assets and liabilities and currency commitments.
Spot contracts are short-term in nature and settle within two business days. The fair value approximates the carrying value due to the short-term nature of this instrument, and as a result, no gains or losses are recognized. Forward derivative financial instruments are generally longer-term in nature. The accounting for gains or losses on forward contracts is dependent on the nature of the risk being hedged and the effectiveness of the hedge. The company enters into derivative instruments only to the extent considered necessary to meet its risk management objectives and does not use derivative contracts for speculative purposes.
The company had one currency spot contract outstanding at March 31, 2006 totaling approximately $1.5 million that settled on April 3, 2006. The company had three currency spot contracts outstanding at
F-29
March 31, 2005 totaling approximately $1.0 million that settled on April 1, 2005. The company had no spot contracts outstanding at March 31, 2004.
The company is exposed to possible currency fluctuations related to its commitment to construct two of its anchor handling towing supply vessels at an Indonesian shipyard. The company is required, per the construction agreements, to make all payments in Singapore dollars and is currently exposed to possible currency fluctuations on the remaining commitment which totals a current U.S. dollar equivalent of approximately $22.6 million. At March 31, 2006 the company had seven forward contracts outstanding totaling $13.8 million that hedged the company’s foreign exchange exposure relating to the Indonesian shipyard commitments. The company is accounting for the forward contract as a cash flow hedge under SFAS No. 133, as amended. The derivative instrument is carried at fair value on the consolidated balance sheet in other assets or other liabilities depending on the fair value at the balance sheet date. Changes in the fair value of the derivative instrument, to the extent the hedge is effective, are recognized in other comprehensive income (a component of stockholders’ equity). Amounts representing hedge ineffectiveness, if any, are recorded in earnings. At March 31, 2006, the forward contracts combined fair value of $0.6 million is included in other assets in the consolidated balance sheet. A portion of the forward contract was ineffective and accordantly the ineffective portion of the hedge totaling approximately $88,500 was recorded as an increase to earnings during the fourth quarter of fiscal 2006.
The company is exposed to possible interest rate fluctuations related to its commitment to the sale/leaseback of four of its vessels to BOAL&C. On March 24, 2006, the company entered into four interest rate swap transactions to effectively fix the amount of the lease payments on four vessels currently under construction that the company agreed to sell and leaseback from BOAL&C. The lease payments for each respective vessel will be based on the five year swap rate at the time of the lease which will coincide with the delivery of each vessel. Any amounts received from the bank or paid to the bank will be recorded on the company's balance sheet as either an other asset or other liability and amortized over the term of the respective leases. The company is accounting for the interest rate swap as a cash flow hedge under SFAS No. 133, as amended. The derivative instrument is carried at fair value on the consolidated balance sheet in other assets or other liabilities depending on the fair value at the balance sheet date. Changes in the fair value of the derivative instrument, to the extent the hedge is effective, are recognized in other comprehensive income (a component of stockholders’ equity). Amounts representing hedge ineffectiveness, if any, are recorded in earnings. At March 31, 2006, the four interest rate swaps had a combined fair value of $0.3 million which is included in other assets in the consolidated balance sheet.
The company had no derivative financial instruments outstanding at March 31, 2005 that qualified as hedges.
(12) Sale of KMAR 404 Class of Vessels
During the second quarter of fiscal 2006, the company completed the sale of six of its KMAR 404 class of Anchor Handling Towing Supply vessels to Deep Sea Supply ASA for a total cash price of $188.0 million. The transaction resulted in a $65.9 million pre-tax financial gain, or approximately $42.8 million after tax, or $0.74 per diluted common share. The transaction resulted in an approximate $112.0 million taxable gain, but no cash taxes are due because of the availability of net operating loss carryforwards. The company used a portion of the proceeds of the sale to repay $95.0 million of outstanding borrowings under the company’s revolving credit agreement.

F-30
(13) Segment and Geographic Distribution of Operations
The company follows SFAS No. 131, "Disclosures about Segments of an Enterprise and Related Information" and operates in two business segments: United States and International. The following table provides a comparison of revenues, operating profit, total assets, and depreciation and amortization and additions to properties and equipment for the years ended March 31. Vessel revenues and operating costs relate to vessels owned and operated by the company while other marine services relate to the activities of the company's shipyards, brokered vessels and other miscellaneous marine-related businesses.
(In thousands) 2006 2005 2004 Marine revenues (A): Vessel revenues: United States $ 180,374 118,288 125,344 International (B) 666,608 537,238 500,604 846,982 655,526 625,948 Other marine services 30,635 36,624 26,682 $ 877,617 692,150 652,630 Marine operating profit: Vessel activity: United States $ 61,227 2,022 (17,715) International 186,044 95,383 96,316 247,271 97,405 78,601 Impairment of long-lived assets (3,050) (1,733) (26,456) Gains on sales of assets 86,337 11,977 7,075 Other marine services 6,511 6,623 4,623 337,069 114,272 63,843 Other income 16,797 7,589 7,634 Corporate expenses (21,280) (15,179) (13,291) Interest and other debt costs (9,074) (6,887) (3,683) Earnings before income taxes $ 323,512 99,795 54,503 Total assets: Marine: United States $ 566,706 532,096 569,840 International (B) 1,455,776 1,510,923 1,355,820 2,022,482 2,043,019 1,925,660 Investments in and advances to unconsolidated Marine companies 34,308 32,074 33,722 2,056,790 2,075,093 1,959,382 General corporate 307,750 138,080 122,408 $ 2,364,540 2,213,173 2,081,790 Depreciation and amortization: Marine equipment operations United States $ 22,070 21,825 32,447 International 84,824 77,149 65,408 General corporate depreciation 632 639 655 $ 107,526 99,613 98,510 Additions to properties and equipment: Marine equipment operations United States $ 46,543 14,752 139,910 International 121,437 192,588 157,545 General corporate 4,428 51 60 $ 172,408 207,391 297,515
(A) For fiscal 2006, 2005 and 2004, Chevron Corporation (including its worldwide subsidiaries and affiliates) accounted for 15%, 13.2% and 12.0%, respectively, of revenues while Petroleo Brasileiro SA accounted for 10.2% of revenue during fiscal 2005.
(B) Marine support services are conducted worldwide with assets that are highly mobile. Revenues are principally derived from offshore service vessels, which regularly and routinely move from one operating area to another, often to and from offshore operating areas in different continents. Because of this asset mobility, revenues and long-lived assets attributable to the company's international marine operations in any one country are not "material" as that term is defined by SFAS No. 131. Equity in net assets of non-U.S. subsidiaries is $1.3 billion, $1.3 billion and $930.1 million at March 31, 2006, 2005 and 2004, respectively. Other international identifiable assets include accounts receivable and other balances denominated in currencies other than the U.S. dollar, which aggregate approximately $5.1 million, $8.8 million and $9.1 million at March 31, 2006, 2005, and 2004, respectively. These amounts are subject to the usual risks of fluctuating exchange rates and government-imposed exchange controls.

F-31
(14) Supplementary Information--Quarterly Financial Data (Unaudited)
Years Ended March 31, 2006 and 2005 (In thousands, except per share data)
2006 First Second Third Fourth
Marine revenues $ 192,167 204,351 234,559 246,540
Marine operating profit $ 43,330 120,963 85,379 87,397
Net earnings $ 28,860 82,192 60,022 64,682
Basic earnings per share $ .50 1.44 1.05 1.12
Diluted earnings per share $ .50 1.42 1.04 1.11
2005 First Second Third Fourth
Marine revenues $ 158,117 166,827 187,593 179,613
Marine operating profit $ 21,820 27,189 33,166 32,097
Net earnings $ 12,881 16,309 19,753 52,396
Basic earnings per share $ .23 .29 .35 .92
Diluted earnings per share $ .23 .29 .34 .91
Operating profit consists of revenues less operating costs and expenses, depreciation, general and administrative expenses and other income and expenses of the Marine division.
See Notes 1, 2, 3, 4 and 10 for detailed information regarding transactions that affect fiscal 2006 and 2005 quarterly amounts. A discussion of current market conditions appears in Item 7 Management's Discussion and Analysis of Financial Condition and Results of Operations.
(15) Subsequent Events
In April and May of 2006, the company committed to the construction of 14 additional vessels. The company is constructing eleven anchor handling towing supply vessels varying in size from 5,000 to 10,000 BHP at three different international shipyards for an approximate total cost of $165.2 million. Scheduled delivery for these vessels is expected to begin in November 2006, with the last vessel scheduled for delivery in November 2008.
The company also committed to the construction of two additional 175-foot, state-of-the-art, fast, crew/supply boats for an approximate total cost of $15.0 million and one internationally built tug for a total expected cost of $3.5 million. Scheduled delivery of the two U.S. built crewboats is expected in October 2007 and the tug in April 2007.
During the period May 15, 2006 through May 25, 2006, pursuant to the company’s stock repurchase plan discussed in Note 8, the company repurchased 385,000 shares of common stock for an aggregate purchase price of $19.5 million, or an average price of $50.60 per share.

F-32
SCHEDULE II
TIDEWATER INC. AND SUBSIDIARIESValuation and Qualifying Accounts
Years Ended March 31, 2006, 2005 and 2004 (In thousands)
Column A Column B Column C Column D Column E Balance
Balance at at Beginning Additions End of
Description of period at Cost Deductions Period
2006 Deducted in balance sheet from trade accounts receivables: Allowance for doubtful accounts $ 7,138 31 904 6,265
2005 Deducted in balance sheet from trade accounts receivables: Allowance for doubtful accounts $ 7,304 28 194 (A) 7,138
2004 Deducted in balance sheet from trade accounts receivable: Allowance for doubtful accounts $ 7,304 --- --- 7,304
(A) Accounts receivable amounts considered uncollectible and removed from accounts receivable by reducing allowance for doubtful accounts.


TIDEWATER601 Poydras Street, Suite 1900New Orleans, Louisiana 70130
Tel: 1-800-678-84331-504-568-1010
Email: [email protected]: www.tdw.com
Celebrating 50 Years!
2730-AR-06