2006 - Portal Rasmi Kementerian Kesihatan Malaysia -...
234
Transcript of 2006 - Portal Rasmi Kementerian Kesihatan Malaysia -...


Ministry of Health Malaysia
malaysia’s health2006


As we move further into the 21st century, the agenda
for health care will be influenced and dominated by the
globalisation of the economy, the democratisation of
societies and the computerisation of technologies. There is
little doubt that escalating healthcare costs and increasing
expectations of high quality care are one of the few strong
trends that have emerged as a result of the above. As we
grapple with the mounting pressures on the health care
industry, we need to strengthen, evaluate and reflect on
the benefits and relevance of existing programmes and if
necessary, propose the introduction of new ones.
Technical report series provide an important platform
for reporting the progress of the country’s health sector
development and generating new ideas for fur ther
improvement and enhancement.
The 2006 report covers a wide spectrum of issues relevant
to the healthcare industry including the evaluation of
existing health programmes, measures to strengthen
supportive services and the utilization of innovation to
optimise healthcare service delivery. There is also a special
contribution from the Malaysian Medical Council on its
achievements and future directions to ensure the provision
of high quality services by registered medical practitioners
TAN SRI DATUK DR HJ MOHD ISMAIL MERICAN
DIRECTOR-GENERAL OF HEALTH, MALAYSIA
foreword

VISION
MISSIONOF THE MINISTRY OF HEALTHThe mission of the Ministry of Health is to build
partnership for health to facilitate and support the
people to :
• Attain fully their potential in health.
• Motivate them to appreciate health as valuable
asset.
• Take positive action to improve further and
sustain their health status to enjoy a better
quality of life.
FOR HEALTHMalaysia is to be a nation of healthy individuals,
families and communities, through a health system
that is equitable, affordable, efficient, technologically
appropriate, environmentally-adaptable and consumer-
friendly, with emphasis on quality, innovation, health
promotion and respect of human dignity and which
promotes individual responsibility and community
participation towards an enhanced quality of life.

Contents
Foreward
PART 1
CHAPTER 1 - HEALTHCARE SERVICE
Optimising Dermatology Services Through Innovative Approches Haemopetic Stem Cell Transplantation Blood Transfusion Services : Enhancing Safety Nuclear Medicine in the 21st Century : Contributing to Better Healthcare
CHAPTER 2 - POPULATION HEALTH
Population Based Cervical Cancer Screening Programme : The Way Forward Evaluating Primary Oral Healthcare Programmes Epidemiology Of Foodborne Diseases In Malaysia Control Of Psychotropic Substances In Malaysia : - Balancing The Demand And Supply Elimination Of Malaria As A Public Health Problem In Malaysia: Prospect, Opportunities And Challenges.
11
23
31
42
55
64
82
98
106
CHAPTER 3 - HEALTH SYSTEM MANAGEMENT
Implementation Of HIMS E-Reporting In The Ministry Of Health
Teleprimary Care: Enabling Single Electronic Health Record For Continuous, Seamless Quality Healthcare
Cosmetics - Paradigm Shift Towards Self Regulation
CHAPTER 4 - RESEARCH AND DEVELOPMENT
Food Consumption Pattrens Of Malaysian Adults
Private Healtcare Facilities And Service Act 1998 - A Year After Implementation
New Approch On Dengue And Chikungunya Control
The National Pharmaceutical Control Bureau And Its Role In Quality Assurance Of Pharmaceutical Products
Dioxin In Food
CHAPTER 5 - SPECIAL CONTRIBUTION Achievement And Future Directions Of Malaysian Medical Council
127
137
153
165
175
184
191
205
213

part1
CHAPTER 1 HEALTHCARE SERVICE
CHAPTER 2 POPULATION HEALTH
CHAPTER 3 HEALTH SYSTEM MANAGEMENT
CHAPTER 4 RESEARCH AND DEVELOPMENT
CHAPTER 5 SPECIAL CONTRIBUTION


1chapter


11Director General Technical Report ( DGTR )
OPTIMISING DERMATOLOGY SERVICESTHROUGH INNOVATIVE APPROACHES
SUMMARY
Dermatology is a specialty of Internal Medicine. As the period of training to become a dermatologist is very long, it will take some time for Malaysia to reach the ideal dermatologist to population ration of 1:100,000. Using innovative ways to optimise the available specialist resources allow specialist services to reach more people while we continue to develop subspecialisation within Dermatology and our serious efforts to train more dermatologists for the country.
Networking of consultants among and between the new Klang Valley Hospitals and the tertiary centre in Hospital Kuala Lumpur enable coverage and at the same time maintain sub specialty interest and development. Decentralisation of specified dermatology sub specialty services to regional centres throughout the country retain expertise in the other centres as well. The widespread implementation and use of teledermatology bring consultant opinions to remote areas without specialist services. Innovative approaches to inpatient dermatology care include a flexi nurse to inpatient ratio based on nursing needs of each patient. “Good-Night, Sleep Well” nursing ward round detect patients who may develop problems overnight. “Good- Bye, Keep Well” discharge process which is planned, personalised and private reduce re-admissions into the ward and achieve better outcomes.
All these measures and many more will raise the quality of care for skin patients while we continue to train more dermatologists through the Advanced Masters in Dermatology Programme, a smart partnership between the Ministry of Health (MOH) and University Kebangsaan Malaysia (UKM) and the Fellowship Training Programme of the MOH. The future is bright for Dermatology in Malaysia.
Introduction
Since 1969 Dermatology is an independent specialty of Internal Medicine. It is concerned with the total care of skin patients and healthy individuals, sexually transmitted diseases (better known as Genito-Urinary Medicine) and
Hansen’s Disease or Leprosy. The scope has developed steadily and the emphasis has expanded from epidemiological to molecular basis and understanding of the skin and its treatment and care.

12 Director General Technical Report ( DGTR )
Sub specialisation within Dermatology has become a necessity to keep abreast of the latest developments in the various rapidly developing fields of Dermatology and be able to offer state-of-the-art care to skin patients and the community.
It is therefore crucial that we create and sustain a large and active pool of well trained dermatologists not only to serve the whole population but also to help develop sub-specialty interests and conduct research relevant to the needs of the discipline and the country.
Vision for Dermatology
Malaysia will be a nation of healthy individuals, families and communities where skin diseases is not a major health problem because of an informed and involved public and through dermatological services that are of high quality, accessible and affordable to all.
Mission for Dermatology
To work in partnership with the people to improve and sustain health in general and healthy skin in particular through promotive, preventive, therapeutic and rehabilitative measures.
Who Provides Dermatology Services
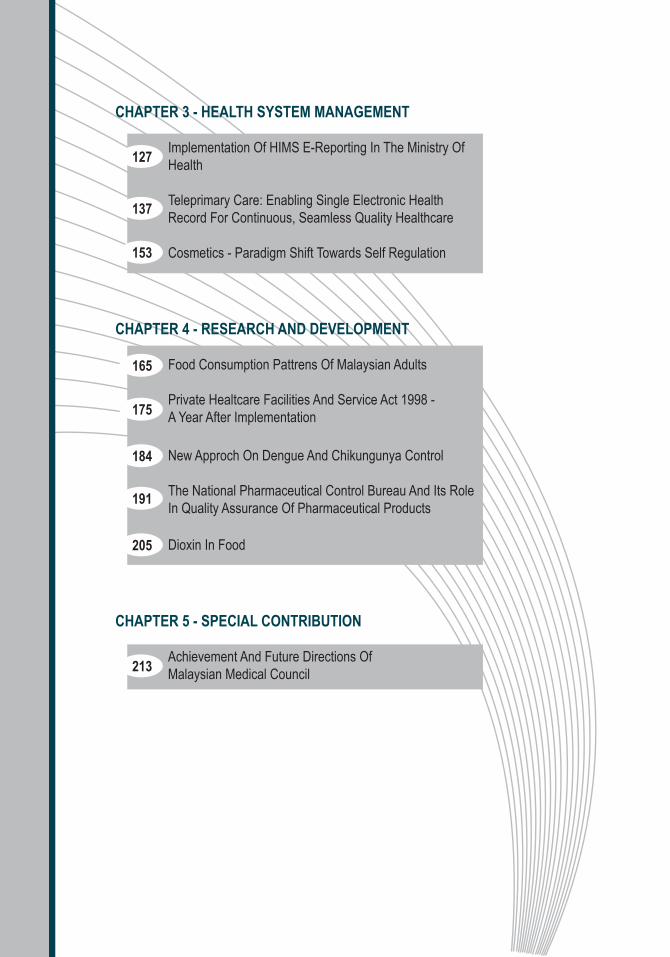
Dermatology services in Malaysia are provided by dermatologists in the public and private sectors. Table l shows the number of dermatologists in the country in 2006 and total projected number required for 2020, for an ideal ratio of one dermatologist to 100,000 population.
13Director General Technical Report ( DGTR )
Institution
1. MOH Hospitals
2. Private Sector
3. Universities
Total
Total Number 2006
25
43
4
72
Total Required 2020
150
100
35
285
Comments
21 Malaysians 4 Contract
Mostly in Klang Valley
USM, UM, UiTM
To achieve ideal ratio1:100,000 pop. (2020)
Table 1 : Distribution of Dermatologists in the Country (2006)
Source: Information and Documentation System Unit, Ministry of Health Malaysia
Source: Department of Dermatology, Hospital Kuala Lumpur.* Contract Doctors from India
Year
Table 2: Number of Public Sector Doctors in Service According to Categories, 2006
Kuala Lumpur
Selangor
Negeri Sembilan
Melaka
Pulau Pinang
Perlis
Perak
Johor
Pahang
Terengganu
Kelantan
Sabah
Sarawak
Kedah
4
2
1
1
1
1
3
1
1
1
2
1
1
2
5
0
0
0
1
0
1
0
0
0
0
0
1
0
0
2
1
1
1
1
1
0
0
1
0
1
1
0
2
0
0
0
0
0
0
0
0
0
2
0
0
0
9
2
1
1
1
1*
2
2
1
0
1*
1*
1
1*
No.
of
Der
mat
olog
ists
No.
of
Der
mat
olog
ists
in
Un
iver
siti
es
Med
ical
Offi
cer
exp
erie
nce
d in
Der
mat
olog
y
Tra
inee
s in
Der
mat
olog
y
Rot
atio
n
Med
ical
Offi
cer

14 Director General Technical Report ( DGTR )
Development and Decentralization of Subspecialties within Dermatology
Sub-specialisation within Dermatology began in 1989 with the setting up of the photodermatology service in Hospital Kuala Lumpur (HKL). Subsequently, training of specialists in various sub-specialties in Dermatology progressed steadily, leading to the establishment of various sub specialty services (table 2, 3 and table 4).
These services were initially pioneered at the tertiary centre in HKL. Subsequently, facilities and expertise were introduced to many state hospitals with dermatologists. Decentralisation of certain subspecialties to regional centres was considered desirable to create interest and retain consultants in their own state. This saw the establishment of immunobullous diseases service in Ipoh Hospital, pigmentary disorders service in Malacca Hospital and infectious dermatology and dermato pathology services in Johor Bharu Hospital. Other sub specialty services remain at the tertiary centre at HKL and these include photodermatology, dermato & laser surgery, auto immune disorders, infectious dermatology, allergy and immunology and paediatric dermatology. Future sub specialty focus will be dermato oncology, hair and nail disorders, genodermatology, cosmetic or aesthetic dermatology and many more.

15Director General Technical Report ( DGTR )
Table 3 : Dermatologists trained in Specialised Fields. MOH 2006
Source: Information and Documentation System Unit, Ministry of Health Malaysia
Levels of Care
1. Institute of Dermatology
2. Regional Centres (Johor Bharu, Ipoh, Malacca, Penang)
3. State Dermatology Departments
4. District Hospitals with specialists
Description
Tertiary Centre at Hospital Kuala Lumpur
Mainly 2° Care dermatology with one or two 3° level sub specialty
9 hospitals with Specialists/Consultants
Currently only Muar Hospital. Future target is to have a dermatologist in all district hospitals with specialists.
Table 4 : Amounts and Types of Samples Received (2003-2006)
No Present Status
UnderTraining
Trainingto Start
Subspecialisation
Allergy and contact & Occupational dermatoses
Infectious Dermatology
Pigmentary Disorders
Phototherapy
Paediatric Dermatology
Bullous Disorders
Dermatologic Surgery& Laser Surgery
Dermatopathology
Autoimmune Disorders
Hair & Nail Disorders
Dermato Oncology
Genito Urinary Med
Genodermatology
2
2
1
1
2
1
2
2
1
-
-
2
-
-
-
-
-
2
-
-
1
-
-
-
-
-
-
-
-
2007
-
-
2007
-
-
2008/9
2008/9
2008
2008/9
Hospitals
HKL & Selayang
HKL & J Bharu
Malacca
HKL
HKL, Kuching
Ipoh
HKL & Johor Bharu
HKL, J Bharu
HKL
Ipoh
HKL
HKL, Penang
HKL
1
2
3
4
5
6
7
8
9
10
11
12
13
16 Director General Technical Report ( DGTR )
Workload Indicators
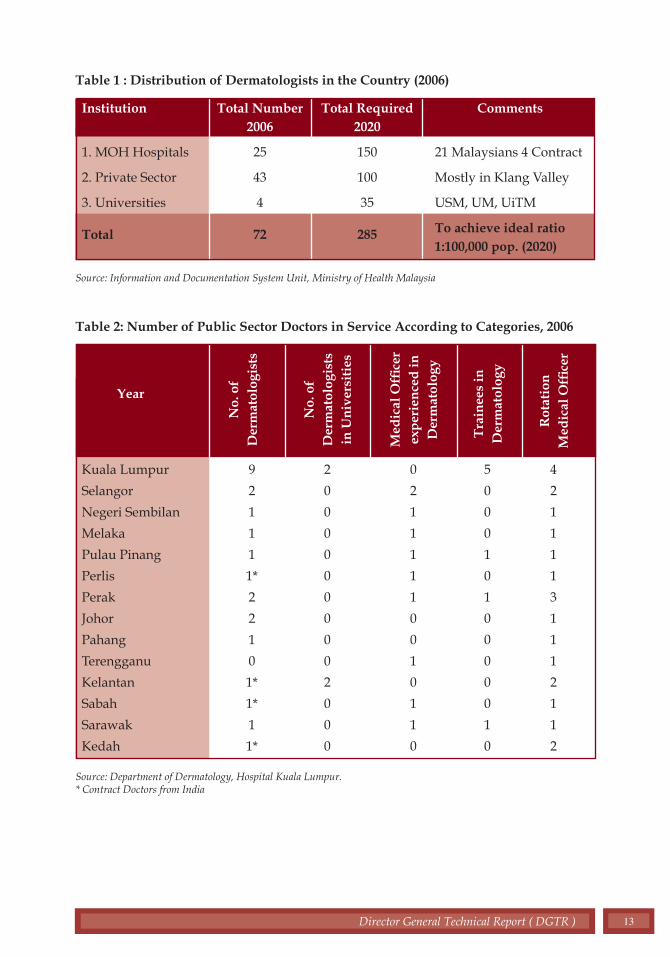
The work load carried out at the various centres reflects the activities of these centres throughout the country (Figures 1, 2 and 3). Besides the clinic new and follow-up case consultations, a large volume of work involves day care procedures done at the clinic such as cryotherapy, phototherapy, biopsies, patch testing, ulcer care and many more.
0 100 200 300 400 500 600
No. of ward admissions for Dermatology patients
HKL
H.Selayang
H.Klang
H.Ipoh
H.Alor Star
H.Kangar
H.P.Pinang
Kota Bharu
H.KT
H.Kuantan
H.Seremban
H.Melaka
H.Muar
H.JB
H.KK
H.Kuching
Figure 1 : Dermatology Clinic Workload - New and Follow-up Cases Year 2006
Figure 2 : Dermatology Inpatient Workload Year 2006
0 5,000 10,000 15,000 20,000 25,000 30,000 35,000
No. of consultations
HKL
H.Selayang
H.Klang
H.Ipoh
H.Alor Star
H.Kangar
H.P.Pinang
Kota Bharu
H.KT
H.Kuantan
H.Seremban
H.Melaka
H.Muar
H.JB
H.KK
H.Kuching
New cases Follow-up cases

17Director General Technical Report ( DGTR )
Networking between and among Consultants in the Klang Valley Hospitals
With the establishment of five new hospitals in the Klang Valley namely, Selayang Hospital, Putrajaya Hospital, Sungai Buloh Hospital, Ampang Hospital and Serdang Hospital, due consideration had to be made with regards to the provision of dermatology services in these hospitals without depleting the manpower in the tertiary centre in HKL which has many sub-specialty services, active research activities and postgraduate and undergraduate training activities on an ongoing basis. To optimise limited manpower resources available, it is decided that each consultant dermatologist provide services in at least 2 centres, the tertiary centre at HKL and one other Klang Valley hospital where he or she provides specialist services together with a dedicated and trained dermatology medical officer from the secondary level hospital. This allows equipments available in these new hospitals to be utilized appropriately. Patients with skin problems in the catchment areas of these hospitals need not travel to the centre of town for specialist dermatology consultations -a smart partnership in a win-win situation.
Training of Dermatologists
There is an urgent need to train more dermatologists, and quickly, to meet the current shortage and required expansion of services. Towards this end, a structured and formal training programme is put
0 100 200 300 400 500 600
No. of cases
HKL
H.Selayang
H.Klang
H.Ipoh
H.Alor Star
H.Kangar
H.P.Pinang
Kota Bharu
H.KT
H.Kuantan
H.Seremban
H.Melaka
H.Muar
H.JB
H.KK
H.Kuching
Figure 3 : Skin Biopsy Workload Year 2006

18 Director General Technical Report ( DGTR )
in place i.e. the Advanced Master in Dermatology Programme (UKM & MOH) and the Fellowship Training Programme (MOH). It is a 3 year full time training, mainly at the tertiary centre at Hospital Kuala Lumpur. However, the first 18 months of the course can be done at another dermatology center which fulfils the criteria and has been accredited as a training center. The entry criteria is either the Master of Internal Medicine (M.Med) or the MRCP (UK). Candidates must satisfactorily complete the course, submit a well written research project and pass an exit examination which consists of written paper (MCQs), clinical examination and viva and histopathology slide interpretation. Overseas external examiners are invited to participate in the examination to maintain standard.
The pioneer group was 2 candidates who completed training in 2005. Two more graduated in November 2006. Since then, the course has matured and interest in the course increased. Currently 6 candidates in the 2nd year of training and 8 more candidates are awaiting to join in November 2007 (Table 5). There are many more eligible potential candidates who have expressed their interest to pursue a career in Dermatology and are completing their pre-entry requirements before they apply for the course.
Table 5 : Training in Dermatology (Advanced Master in Dermatology - UKM/ MOH Fellowship in Dermatology (MOH)
Source: Department of Dermatology, Hospital Kuala Lumpur.
Year of Training
Completed Fellowship Training
Adv. M. Derm - 1st BatchDec 2002 - Nov. 2005
Adv. M. Derm - 2nd BatchDec. 2003 - Nov. 2006
Adv. M. Derm - 3rd BatchJune 2006 - May 2009
Adv. M. Derm - 4th BatchDec. 2007 - Nov. 2010
Awaiting for Adv. M. Derm Programme
No. of Trainees
3 Dermatologists
2 Dermatologists1 Paediatric Dermatologist(Fellowship programme)
2 Dermatologists
6 Dermatologists
8 Dermatologists
9 other potential candidates
Year of graduation as Dermatologist
2004
2005
2006
2009
2010

19Director General Technical Report ( DGTR )
Training of Paramedics
For good patient outcomes, it is equally important to have well trained paramedics in dermatology services because skin treatment is very specialized indeed. Towards this end, a post basic course in skin nursing is being planned so that all skin clinic and skin ward nurses have special training to meet the demands of taking care of patients with skin diseases.
A week’s course in Leprosy Management for paramedics has been conducted twice a year regularly for several years. This has helped to maintain nationally a critical mass of staff able to perform the slit skin smears (SSS) and are knowledgeable in the management the leprosy patients. Update courses in General Dermatology and Sexually Transmitted Diseases are conducted annually by, not only the tertiary centre at HKL, but also other regional and state hospitals. This is in the hope of updating knowledge on skin diseases to medical officers at hospital and district level.
Teledermatology
Dermatology is an excellent area for the application of telemedicine because of the visual nature of the presenting signs and symptoms. Through teledermatology consultant opinions can be brought to remote areas without specialists. Generally, referrals are made from district hospitals or primary care centres to dermatology departments of state hospitals with consultant dermatologists. The referrals can be made to any centre and need not be bound by geographical location or distance. But to facilitate the process a network of referring and receiving centres have been identified (table 6).
Currently many sites are being equipped and training being done throughout the country to encourage this form of opinion seeking. The availability of appropriate hardware, software and opinion seeking culture of doctors are the determinants of success of this enabling technology.
Teledermatology in Primary Care has been in place for several years and is making steady progress with good outcomes.

20 Director General Technical Report ( DGTR )
Table 6 : Network of Refering and Receiving Centres
Source: Department of Dermatology, Hospital Kuala Lumpur.
REGION
NORTH
CENTRAL
SOUTH
EAST COAST
Total
EXPERT CENTRES
HOSPITAL IPOH
HOSPITAL KUALA LUMPUR
HOSPITAL SEREMBAN
HOSPITAL MELAKA
HOSPITAL JOHOR BHARU
HOSPITAL KUANTAN
6
REFERRING HOSPITALS
1. Kuala Krai2. Cameron Highlands3. Jeli4. Seri Manjung5. Gerik6. Taiping
1. Kuala Kubu bahru2. Beluran3. Ranau4. Semporna5. Slim river6. Kudat
1. Tampin2. Jempol
1. Muar2. Tangkak 3. Alor Gajah
1. Kempas 4. Tenglu2. Endau 5. Tg. Sedili3. TUTA 6. Tebrau
1. Gua Musang2. Hulu Berang3. Bentong
26
Other Innovations for Dermatology In-Patient Care
1. Flexi Nurse to In-Patient Ratio
A flexible nurse-patient ratio based on skin nursing needs of the patients was introduced to ensure optimum care despite limitations in number of nurses in the skin ward. Skin beds in the ward are designated as follows:-

21Director General Technical Report ( DGTR )
• High Dependency Beds (HDB): One nurse looks after one or at most two patients only and this is practiced for severe, complicated conditions such as Toxic Epidermal Necrolysis (TEN), Stevens Johnsons Syndrome (SJS), Pemphigus Vulgaris with extensive bullae and erosions, erythroderma etc. These patients need an ICU type total care and monitoring. The nurse in charge will know all about the patients’ current status.
• Medium Dependency Beds (MDB): Has a ratio of one nurse to 3 to 5 patients. Here the nursing needs are moderate, patients are not too dependant and can carry out their own personal hygiene. They need help in skin care especially for inaccessible areas of the body.
• Low Dependency Beds (LDB): The nurse to patient ratio is one nurse to 5 to 8 patients. Generally these patients are relatively well, can perform most of their skin treatments by themselves, but need only supervision and monitoring by the nurses.
• Applying these concepts in skin nursing, allows appropriate utilisation of nurses, where each nurse is expected to know everything about the patients under her care, holistically, from admission to discharge.
2. “Good Night, Sleep Well” Nurse Ward Round
A good night ward round by the night nurse is introduced at bed time when all nursing duties have been done and patients are ready to sleep. Here the night nurse goes around bed by bed, not only to say good night, but to detect any patients who may have problem settling down, such as coughing, discomfort or general restlessness. General measures are instituted and these patients are looked into on a more frequent basis e.g. half-hourly until the problem settles. Such a monitoring can detect impending problems early and doctors on call can be alerted for quicker response.

22 Director General Technical Report ( DGTR )
3. “Good Bye, Keep Well” Discharge Process This is a discharge process which is planned, individualised,
personalised and with complete privacy by the nurse and the doctor in charge. The ward doctor and nurse sit down in a quiet and private area with the patient and his immediate relatives to reinforce the diagnosis, skin treatments, dos and don’ts and the next clinic appointment date. Specific instructions such as allergy cards are also explained and given to patients. It is hoped that with proper informed discharge, patients will keep well for long periods and will reduce the need for readmissions.
Conclusion
Dermatology is a vibrant and growing discipline. The challenges to the providers of care are enormous to meet the ever increasing knowledge, technology and the rising expectations of the public. Nevertheless, the opportunities to continuously improve the quality of care are limitless. A dedicated, proactive and innovative approach to meeting these challenges will ensure that appropriate care is given to the community. Quality is a moving target, and we can and should always do better tomorrow what we do today.

23Director General Technical Report ( DGTR )
HAEMOPOIETIC STEM CELL TRANSPLANTATION
SUMMARY
Haemopoietic stem cell transplant is a cure for many haemopoietic malignancies and genetic diseases involving the lymphohaemopoitic system. It is a cost-effective measure as many patients require immunosuppressive treatment for 6 months to one year only and many return to full employment or education one year later. Majority of patients in MOH do not undergo transplant because of the lack of centres available or the lack of a potential donor source in 70% of patients who lack a HLA matched sibling. Stem cell transplantation today is also safer with less toxicity from reduced conditioning, better supportive treatments and facilities and the availability of more stem cell sources. These have made stem cell transplant accessible even to the older patient and to those with underlying pre-morbid illness
Introduction
Haemopoietic stem cell transplantation was originally conceived as a treatment for radiation-induced injury. It was subsequently extended for the treatment of haemopoietic cancers, bone marrow failure syndromes
and genetic diseases pertaining to the lymphohaemopoietic system.
Stem cells are defined as a population of undifferentiated cells which have the capacity to self renew and terminally differentiate. The fertilized egg has true totipotent capacity with unrestricted differentiation potential. Embryonic stem cells are pluripotent and are able to give rise to a variety of specialised cell types. It cannot however support the development of a foetus. The use of embryonic stem cells is currently prohibited.
Adult somatic stem cells are multipotent and have differentiation that is restricted in lineage. Haemopoietic stem cells are somatic stem cells that are easily accessible and a renewable source.
The chemotherapy used to treat cancers acts primarily on proliferating cells. Normal and malignant stem cells however are quiescent and therefore insensitive to therapy. Both normal and malignant stem cells have the capacity to repair DNA efficiently, resist apoptosis and excrete toxic chemotherapy by means of ATP-

24 Director General Technical Report ( DGTR )
binding transporters. Therefore although chemotherapy can kill dividing cancer cells efficiently, the leukaemic stem cell remains and the cancer thereby recurs. In the adult acute myeloid leukaemia, chemotherapy cures 15-20% patients whereas stem cell transplant effects 55-60% long term remission. In adult acute lymphoblastic leukaemia, chemotherapy cures 30-40% patients whereas stem cell transplant offers 40-60% cure rate. Stem cell transplant is the only known cure for chronic myeloid leukaemia with 55-70% long term cure. However the use of imatinib mesylate or Glivec can currently give superior results in the intermediate term with a better quality of life and lower morbidity and mortality.
Genetic diseases that involve the lymphohaemopoietic system eg. thalassaemias, haemoglobinopathies and severe combine immunodeficiency disease can only be cured with a stem cell transplant. Bone marrow failure syndromes like aplastic anaemia also require the use of new stem cells as a form of replacement therapy.
Aggressive lymphomas and solid organ tumours that relapse can sometimes only be cured with extremely high doses of chemotherapy. This can be done safely only with the use of autologous stem cells that are infused after the delivery of high dose chemotherapy to rescue the haemopoietic system. Autoimmune disease e.g. scleroderma and SLE can also be treated with stem cell transplant which can effect a long period of remission. The bases for the use of transplant is basically to cytoreduce the self-reactive lymphocytes with high dose chemotherapy and re-infuse new stem cells with re-education of the thymic lymphocytes.
Types of transplants
There are two main types of transplants - allogeneic which requires the use of stem cells from another person and autologous which uses stem cells from the patient. Allogeneic stem cells are used when the disease involves the patient’s stem cells or marrow eg. leukaemia, thalassaemia or aplastic anaemia. Autologous transplant is indicated in conditions which do not involve the patient’s marrow e.g. lymphoma, solid organ tumours etc.
Allogeneic transplants only became feasible in the 1960s with the discovery of the HLA system that is located on the chromosome 6. The HLA system contains the major histocompatibility complex that

25Director General Technical Report ( DGTR )
allows cells to initiate immune reactions related to histocompatibility. Recipient T cells can recognize foreign donor HLA antigens and cause rejection whereas donor T-cells can recognize recipient HLA antigens and cause graft-versus- host disease. These genes are inherited as haplotypes with one haplotype from each parent. Therefore two siblings have one in four chance of inheriting the same haplotypes from their parents which will make them HLA-compatible. However even in families with many siblings, only 30% of our patients have a HLA matched sibling. The others will have to search for a non-related donor source.
Stem cell sources
Bone marrow has been the traditional source of haemopoietic stem cells. It is obtained by repeated aspiration of the posterior iliac crest under general anaesthesia. Discomfort and pain may arise which usually disappears two weeks after the procedure and serious effects such as deaths are very rare.
It is also known that there are small amounts of stem cells circulating in the peripheral blood. This amount can be increased many-fold with the use of cytokines like G-CSF. The stem cells can be detected by a surrogate marker CD34 which can be used to measure the amount of stem cells and these can be collected with a leucopheresis procedure in the outpatient. The advantage is that the donor need not undergo general anaesthesia and large amounts of stem cells can be collected in this manner. However the amount of circulating lymphocytes is also increased and this may give rise to graft-vs.-host reactions.
It is also known since the 70s that there are circulating stem cells in the cord blood that is often discarded with the placenta. These stem cells are limited in quantity and volume. They however have the potential of being immunologically naive and hence can be transplanted across HLA barriers and may be safer in terms of viral exposure. The cord blood can be easily and safely extracted and stored and can be readily made available when required. Currently there are cord blood banks in 21 countries storing 170,000 units worldwide. Up to 50% of paediatric unrelated transplants and more than 10% of adult unrelated transplants utilise cord blood as a source. It is especially advantageous for ethnically under-represented populations e.g. Malays who are under-represented in marrow registries which comprise of mainly Caucasian donors.

26 Director General Technical Report ( DGTR )
Further, identifying unrelated donors and procuring their stem cells takes more than 3 months and almost half of these donors “drop-out” resulting in frustration and potential delays.
Preparative regimens
Before stem cells can be infused, the patient has to undergo conditioning. The conditioning has traditionally been a combination of total body irradiation with immunosuppressive chemotherapy. The use of irradiation has been superseded with chemotherapy regimens which are less toxic. The goals of conditioning are to :
1. Eradicate the tumour clone
2. Create space in the marrow to receive the new stem cells
3. Immunosuppress the recipient so as not to reject the graft
These regimens are still potentially toxic resulting in morbidity and mortality. Many patients are also elderly; they have underlying fungal infections or hepatitis or have pre-morbid illness e.g. cardiac failure and kidney impairment. It has been known for some time that high dose chemotherapy to myeloablate the recipient may not be necessary. The more important feature is to immunosuppress the recipient so as not to reject the graft. Once the stem cells have been infused and engrafted, the donor immune system will be able to eradicate the tumour clone. This forms the basis of designing reduced-intensity conditioning transplants. Therefore transplants are effectively made less toxic and are available even for the older patient with underlying pre-morbid illness.
Transplantation in Malaysia
Haemopoietic stem cell transplantation began at the Department of Paediatrics, University Hospital, Kuala Lumpur in 1987. Since then a total of 9 centres - 2 in the HKL and Hospital Ampang, 3 in the universities and 4 in the private centres have been set up. The Malaysian BMT (Bone marrow transplant) Recipient Registry was founded in 1999 by mutual agreement between UMMC, HKL, HUKM and SJMC to collaborate on merging data. This registry was maintained until 2004 when it was officially taken over by the National Transplant Registry.

27Director General Technical Report ( DGTR )
A total of 1048 haemopoietic stem cell transplants have been performed as of 2005. This has been steadily rising from 8 cases in 1987 to 62 cases in 1999 to 145 cases annually in 2005. There is a slight female preponderance of 52%. The largest ethnic group is Chinese (48%), Malays (37%) and Indians (7%). The median age of recipients is 14 years ranging from 1 month to 70 years.
The majority of the cases transplanted were leukaemias (52%) followed by lymphomas (16%), thalassaemias (10%) and bone marrow failure syndromes (9%). Most of the transplants were allogeneic (71%) with the rest autologous.
The stem cell sources were mainly from the peripheral blood stem cells (53%) followed by marrow (43%) and cord blood (4%). 96% of these were from HLA matched siblings. Only 4% were from unrelated sources.
Indications and timing
Haemopoietic stem cell transplantation can cure many blood disorders. Outcomes vary according to the type and stage of the disease, the age and functional level of the patient, the source of stem cells and the degree of HLA mismatch.
The 5 year event free survival for AML transplanted in 1st CR was 55-65% and 2nd CR was 30-40%. The 5 year event free survival for CML transplanted within 1 year of diagnosis was 70-80% and 50-60% if transplanted after 1 year.
Autologous transplant can cure 45-50% of NHL in 1st chemosensitive relapse and 30-35% in 2nd chemosensitive relapse.
Haemopoietic stem cell transplant cure many genetic diseases including thalassaemias, sickle cell anaemias and Wiskott-Aldrich syndromes. Patients with thalassaemia should be transplanted early before developing liver damage from chronic iron overload.
Early transplantation is critical in determining the outcome. However the proper time is sometimes difficult to ascertain and is the subject of controversy. Recognised prognostic markers particularly cytogenetics and molecular cytogenetics are extremely important in determining timing. Acute myeloid leukaemia with favorable cytogenetics eg. t(8;21), t(15;17) and inv 16 are offered

28 Director General Technical Report ( DGTR )
only chemotherapy. Those with standard cytogenetics or poor cytogenetics are offered early transplant. Chronic myeloid leukaemia who receive Glivec should be transplanted if they do not attain an optimal cytogenetic response. Hence a good cytogenetic and molecular laboratory is crucial in determining which patients require early transplant.
A new concept that has challenged the traditional view has been whether somatic stem cells can trans differentiate across tissue barriers and whether differentiated cells have the capacity to “de-differentiate” and revert back to the stem cell pool. This unexpected plasticity of somatic stem cells has a vast clinical impact with the potential for regenerative medicine. Whether haemopoietic stem cells have the capacity to repair heart muscle, liver or induce vascularisation remains a topic of interest and intensive research.
Problems
1. There are currently only two centres in the MOH catering for transplants. One is in the Paediatrics Institute which performs 21 transplants/year and the other at Hospital Ampang which performs 45 transplants/year. This is grossly inadequate as majority of the leukaemics and thalassaemics are treated at the MOH. Most of these patients will not receive a transplant although it is a curative therapy.
2. It is recognized that chemotherapy will only cure 30% of leukaemics. The remaining patients will benefit from a stem cell transplant. Many centres continue to give salvage chemotherapy because patients cannot be accommodated into the transplant list. These salvage chemotherapies often involve more expensive chemotherapies and may yield complications like fungal infections which require even more expensive supportive care. Therefore transplant is a more effective and cost-effective measure to salvage patients. Many of these patients after transplantation only require immunosuppressive treatment for 6 months to a year and are able to return to work after one year. A minority (15-20%) may have long term chronic morbidity from chronic graft-versus-host disease.
3. Transplants performed in the universities cost RM 30,000 for an autologous type and RM50-70,000 for an allogeneic type. A transplant in the private sector would cost twice the
29Director General Technical Report ( DGTR )
above amount. This estimated cost does not take into account complications that may require ICU care or more intense immunosupression in the event of graft-vs.-host disease
4. Only 30% of our patients have a matched donor. The remainder will not be able to undergo a transplant unless a donor is located. With the ethnic under-representation of Malays and Chinese in most major international registries, the chance of getting a match is less than 10%. The cost of procurement, even if a match is found is RM100-150,000 which would be beyond the budget of most patients and this cost does not include the transplant itself!
5. With the ease of collecting peripheral blood stem cells using a leukapheresis machine, many private hospitals are collecting stem cells for indications that are not acceptable including strokes, cardiac infarcts, mental retardation, Parkinson’s disease and the list seems endless.
Recommendations
1. The MOH needs to perform more stem cell transplants as many patients are treated in the MOH facilities. Many cannot afford to be transplanted in the private setting and it is also not cost-effective. It is suggested that a 2nd centre be set up outside the Klang Valley with good supportive and laboratory services. One such centre can be planned in Penang GH. A third centre can be considered in the next 5 years in East Malaysia like Kota Kinabalu. This should be able to take care of the nation’s transplant needs for the next 20 years. These centres can also serve as back up services.
2. Centres performing stem cell services should be accredited. These include setting standards for clinical and nursing services, laboratory personnel as well as facilities. The storage of stem cells should fulfill stringent requirements akin to blood banks and adhere to safety codes, monitoring of procedures as well as monitoring of storage conditions and performance of viability measures.
3. It is important for Malaysia to have its own registry because of the ethnic under-representation of our ethnic groups in registries worldwide. It is also cost effective to set up a big cord

30 Director General Technical Report ( DGTR )
registry as this will be the most cost-effective method to serve the population with readily accessible units. It is important that the HLA laboratory be set up with international accreditation so that mutual exchange of stem cell sources can be performed with international and neighbouring registries.
1. Haemopoietic Stem Cell Transplantation. The EBMT Handbbok 2004.
2. Hematopoietic Stem-cell Transplantation. NEJM 2006;354:1813-26
3. 2nd Report of the Nation
Bibliography

31Director General Technical Report ( DGTR )
BLOOD TRANSFUSION SERVICES : ENHANCING SAFETY
Introduction
A sustainable safe blood supply is an essential part of the healthcare service in the country and as such Malaysia has developed its Blood Transfusion Service (BTS) based on safety, quality and efficiency. With the development
of other medical services, the supply of blood needs to improve to meet the ever increasing demand. Blood is provided through 127 government hospitals and numerous other private hospitals. The total number of blood donations in government hospitals has been steadily increasing to a total number of 477, 365 in 2006.
The objective of the Blood Transfusion Services is to ensure a continuous supply of blood and blood products which is safe and of quality and accessible for all who need them.
Background
Originally the BTS was made up of hospital-based blood banks, each doing its own collection, testing and issue. In 1997 the MOH adopted a policy of consolidation and regionalization of the service to ensure that safe and quality blood was available anywhere in the country.
SUMMARY
The blood transfusion service is an essential part of healthcare delivery. It needs to be developed in tandem with the other disciplines in order to meet the demand of healthcare services. Safety of blood supply is important. In order to achieve this objective, the Ministry of Health has developed numerous strategies. Amongst them are procurement of blood from safe donors, development of national criteria, standards and guidelines for all process procedures, setting up quality systems and the provision of training. This is further enhanced with the national fractionation programme and employing of various technologies like nucleic acid testing (NAT), leucofiltration and pathogen inactivation.
Policy of consolidation and regulation

32 Director General Technical Report ( DGTR )
The National Blood Centre (NBC) was established and operationalised in the year 2000. The centre was based in Kuala Lumpur. Besides providing blood transfusion services for the Klang Valley and its surrounding, it also functions as the National Blood Services Reference Centre and Laboratory. It also coordinates all activities relating to blood transfusion carried out in government hospitals. In addition, the NBC carries out performance appraisal, provision of technical support and advice as well as training for all categories of personnel involved in blood banking activities. It also functions as a regional centre for the central region.
Other regional centres are in the pipeline and will be built under the 9th and 10th Malaysia Plans. Meanwhile the 53 screening centres performing testing for transfusion transmitted infections (TTI) are to be consolidated to only 18 screening centres.
Strategies in ensuring safe blood supply
A number of strategies have been employed over the years to ensure safe blood supply.
Blood procurement in Malaysia is based on voluntary non-remunerated donations. This is the safest source of blood for transfusion. This is achieved by awareness programme. In addition the BTS is also increasing the number of regular blood donors and phasing out replacement donors.
Since the last millennium, the total number of blood donations at government hospitals had increased by 2-5% annually (Fig. 1). In 1999, the number of donations was 334,459. By 2006 a total of 477,365 donations were received. Of this 99.3% were voluntary donations while the remaining 0.7% was replacement donations. This is blood given in order to replace those that were used by their friends or relatives. This figure for replacement donors was an improvement from 5.3% in 1999. However in Peninsular Malaysia voluntary donation is 100%. The majority of replacement donors came from Sabah where replacement donors made up of 6.3% of their total collection. Efforts are being made to phase this out by providing resources and re-organinising the service.
National Blood Centre was establish
Regional centres
Safe blood donor

33Director General Technical Report ( DGTR )
Donor criteria and selection
National standard guidelines on process and procedures
Criteria for blood donors have been established and reviewed regularly. Only donors who meet the criteria and passed the BTS questionnaire and pre-donation interviews are allowed to donate blood. This is to ensure only those that do not have risk behaviours that expose them to Transfusion Transmitted Disease donate their blood.
In order to ensure safe blood & blood products, the MOH established a national guideline and published it as the “Transfusion Practice Guidelines For Clinicians and Laboratory Personnel - 2nd Edition 2005. This covers the entire process and procedures from donation to clinical transfusion practice at the bedside. It is currently being updated and the third edition is expected to be published in 2007.
0
50000
100000
150000
200000
250000
300000
350000
400000
450000
500000
Total No.of Donors Voluntary Donors
Replacement Donors Total No.of Recipients
Total No.of Donors 334459 361898 384711 418118 423046 447690 472234 477365
Voluntary Donors 316412 345557 372555 411462 418385 443699 468156 473866
Replacement Donors 18047 16341 12156 6656 4661 3991 4078 3499
Total No.of Recipients 148115 151504 164638 196434 208930 222807 220605 253968
1999 2000 2001 2002 2003 2004 2005 2006
Figure 1 : Total Number of Blood Donors, Voluntary Donors, Replacement Donors and Number of Recipients for 1999 - 2006

34 Director General Technical Report ( DGTR )
External Quality Assessment Programe
National indicators
External Quality Audits
TTI screen centres
Quality Programme All hospital blood banks are required to participate in External Quality Assessment programme for immunohaematology, Hepatitis B and C by NBC and HIV by Institute of Medical Research (IMR).This evaluates the proficiency of the laboratories in performing these tests. To ensure that international standards are met, the service provider, NBC and IMR participate in External Quality Assessment organised by international bodies.
National indicators have been established and all blood banks are required to submit these indicators to the National QAP Programme. This allows the performance of blood banks to be monitored and evaluated.
Audits are carried out by NBC on blood banks throughout the country. This activity has greatly contributed to the improvement seen in some blood banks that have been audited. However this effort is limited by resources. These audits are very through, time consuming and put a strain on both the auditors and auditees.
Establishment of Quality Management Systems Quality Management Systems have been established in many blood banks through training using the World Health Organisation module. Since 2004 four blood banks have been accredited by the National Australian Testing Authority (NATA).
These are:-
a. NBC in 2004a. Blood bank Hospital Kota Baru in 2006b. Blood bank Hospital Penang in 2006 c. Blood bank Hospital Kuantan in 2006
The other blood banks are being audited and will eventually be accredited.
Consolidation of Screening Laboratories
A national standard for establishing a TTI screening laboratory has been established. To ensure that staff perform a critical number of tests to maintain their skills and proficiency, the number of screening

35Director General Technical Report ( DGTR )
Contract fractionation
centres were reduced from 53 to 18. This also allowed an efficient use of resources and ensured cost effectiveness, but most of all enhanced the safety of blood supply.
Fractionation Programme
Blood component therapy has led to excess plasma being produced. The excess plasma is sent for contract fractionation. Over the last 15 years, the amount of plasma fractionated has increased steadily (Table 2) Through the programme Factor VIII concentrate, factor IX concentrate, intravenous immunoglobulin (IVIG) and albumin are produced (Table 1). These products are safer as they are virally inactivated. Currently the amount of IVIG produced is sufficient for MOH use. Commercially they are also expensive. This programme has provided a cost-saving of RM 12 to 15 million a year to the MOH. In addition, it provides a buffer during world shortage of these plasma-derived products.
30000
27500
25000
22500
20000
17500
15000
12500
10000
7500
5000
2500
0
Vo
lum
e (L
itre
s)
Year
1991 1992 1993 1994 1995 1996 1997 1998 1999 2000 2001 2002 2003 2004 2005 2006
Volume 84 25 0 45 51 64 70 87 11 12 15 17 19 22 35 39
Figure 2 : Plasma Volume For Fractionation (1991 - 2006)

36 Director General Technical Report ( DGTR )
Appropriate use of blood
Human capacity through training
Guidelines On The Use of Blood In order to minimize morbidity and mortality due to adverse events related to blood transfusion, guidelines were formulated to reduce unnecessary and inappropriate use of blood and blood products. The National Blood Centre had issued the 2nd edition of Guidelines on the use of Blood and Blood Products in 2007. This outlines appropriate use of blood in various clinical conditions.
Training
Human capacity is important in ensuring safe blood transfusion. Regular training programmes are carried out for doctors, nurses, medical laboratory technologists, scientists and blood donor organisers to update their knowledge and responsibilities. This includes seminars, workshops and attachments to good centres.
Post graduate training has been offered to both doctors and scientists to support the development of the BTS. This is to ensure that trained personnel provide the leadership and managerial support the BTS needs in ensuring safe blood for the nation. The medical laboratory technologists are given a six month post basic course in transfusion science. The quality of the BTS has shown marked improvement in places where these personnel have been posted
Table 1 : Fractionated Products From Malaysian Plasma
Year
2005
2006
Plasma (kg)
25,771.87
29,294.83
Product
20% NSA (Albumin) Prothrombinex (Factor IX) Intragram (IVIG) Factor
VIII Concentrate
20% NSA (Albumin) Prothrombinex (Factor IX) Intragram (IVIG) Factor
VIII Concentrate
Year
14,012 6,574 38,499 8,764
31,341 6,488 40,027 4,375

37Director General Technical Report ( DGTR )
Transfusion committee to ensure effective and efficient BTS
Surveillance programme where data on adverse event are collected
State and Hospital. Every state and hospital under the MOH are required to establish Transfusion Committees to ensure safer, more effective and efficient blood transfusion services. Where these committees are functioning and active, the quality of the service is seen to have improved, more so when the hospital directors and state health directors have provided the leadership they required.
Haemovigilance Programme The National Haemovigilance programme was started in 2003. This is a surveillance programme where data on adverse events sare collected with the objective of collecting evidence, analysing them and implementing corrective actions. In 2006 there was 100% participation from hospitals under the MOH as compared to 66.4% and 85.5% in 2004 and 2005 respectively. The number of reported events have also increased (Fig. 3). Serious events have shown reduction from 0.9% in 2004 to 0.46% in 2006. Based on this report, training programmes have been tailor-made to rectify deficiencies.
0
500
1000
1500
2000
2500
1 2 3
2005
Year
2004 2006
No of cases
Series1
Figure 3 : Total No Of Adverse Event 2004 - 2006
38 Director General Technical Report ( DGTR )
Apheresis Programme The apheresis procedure allows blood donors to donate only one component such as plasma or platelets only. Over the years apheresis platelets have been collected to reduce donor exposure in recipients. This programme also allows plasma collection for fractionation. The components collected from this programme are superior in terms of safety and quality. However the cost effectiveness of this programme needs to be further explored.
Future Directions
Achievements over the years have placed Malaysia as one of the developing countries with a well established blood programme that can serve as an example to other countries. This could not have been achieved without the vision and support of the MOH. There still remain areas of improvement that require commitment from the government that will bring the BTS to the next level. These are the establishment of regional centres, comprehensive network of information technology system, strengthening the HTC and STC, clinical research in transfusion as well as public awareness programmes. Nucleic Acid Testing for transfusion transmitted infections has proven to be beneficial in enhancing the safety of donated blood. Pathogen inactivation is another area that needs to be explored. In order to strengthen the clinical aspect of transfusion, a team of doctors and nurses can be established in the hospital.
• Establishment of Regional Centres It is hoped that the Regional Centres will be established in RM9 and RM10 as planned. This is the only way to achieve 100% self sufficiency and provide Malaysia with a world class BTS which is efficient, safe and of quality. Such an organization would also be cost effective.
• Information Technology Establishment of a network of Information Technology Systems that connect all blood banks as well as hospitals would improve the blood delivery system to all hospitals and enhance the safety of blood transfusion.
Apheresis platelets and plasma
Achievement through vision and support of MOH

39Director General Technical Report ( DGTR )
• Strengthening the HTC and STC Both these transfusion committees need to be strengthened countrywide as most of the problems and issues need to be dealt with at the local level. Active participation of clinicians, administrators and the blood bank personnel is crucial.
• Clinical Research in Transfusion Clinical research in transfusion shall be encouraged. This will allow better transfusion practice which is evidence based. Currently hardly any research in this area is being done in Malaysia especially in areas that do not affect developed countries such as transfusion in Dengue Fever and Dengue Haemorrhagic Shock Syndrome.
• Public Awareness Programme Public awareness programme needs to be enhanced to educate the public of their role in ensuring safe blood supply. Skilled personnel are required to ensure that this is done effectively so that only donors without risk behaviour donate blood.
• Nucleic Acid Testing (NAT)
Nucleic acid testing is expected to start in 2007. This is to reduce the window period of transmission of TTI. It would also eliminate the hassle of lookback process. A pilot study conducted in 2005 and 2006 indicate that this strategy is needed to enhance the safety of donated blood.
• Pathogen inactivated fresh blood components In order to reduce the risk of TTI, pathogen inactivated fresh blood components need to be introduced. Perhaps this product can be provided to targeted patient groups such as in the paediatric age groups or in particular the neonates as this technology is costly.
40 Director General Technical Report ( DGTR )
• Transfusion Teams The establishment of transfusion teams comprising of doctors and nurses in each hospital would ensure better clinical transfusion practice in the ward as well as strengthen the clinical interface. Currently a pilot project is being carried out in Hospital Kuala Lumpur.
Conclusion
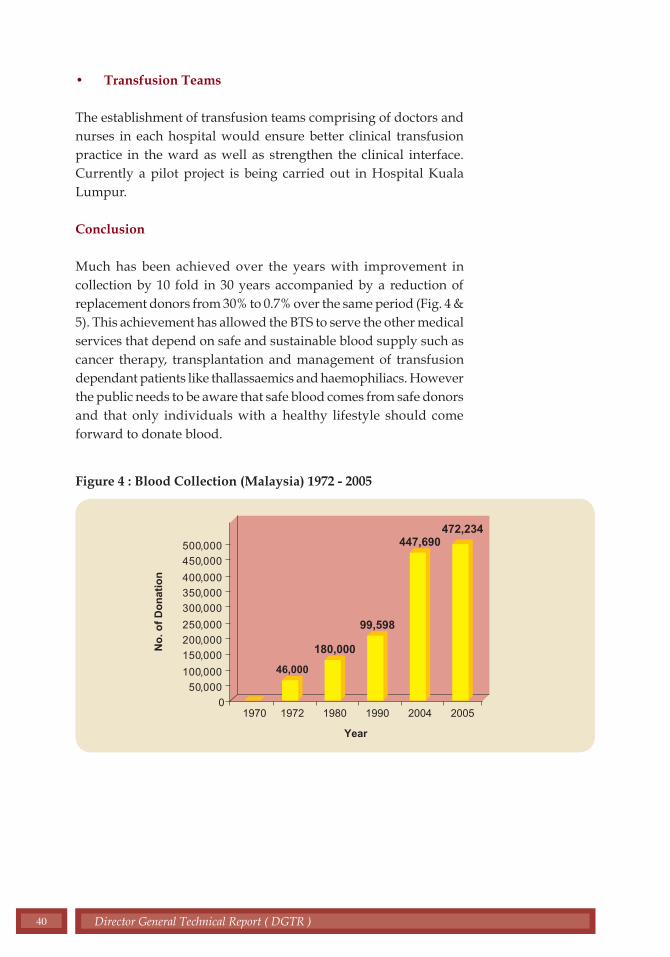
Much has been achieved over the years with improvement in collection by 10 fold in 30 years accompanied by a reduction of replacement donors from 30% to 0.7% over the same period (Fig. 4 & 5). This achievement has allowed the BTS to serve the other medical services that depend on safe and sustainable blood supply such as cancer therapy, transplantation and management of transfusion dependant patients like thallassaemics and haemophiliacs. However the public needs to be aware that safe blood comes from safe donors and that only individuals with a healthy lifestyle should come forward to donate blood.
Figure 4 : Blood Collection (Malaysia) 1972 - 2005
0
0
0
0
0
0
0
0
0
0
0
50, 00
100, 00
150, 00
200, 00
250, 00
300, 00
350, 00
400, 00
450, 00
500, 00
Year
No
. of
Do
nat
ion
20051970 1972 1980 1990 2004
46,000
99,598
447,690472,234
180,000

41Director General Technical Report ( DGTR )
Figure 5 : Percentage Of Replacement Donors In Total Blood Collection
There must also be awareness amongst all care givers to ensure that blood transfusion is safe. Proper training should be emphasised so that all health personnel involved in the transfusion chain are aware of their roles and responsibilities to ensure better quality care to all patients.
30%30%
1.%4.50%
18%
35%
30%
25%
25%
15%
10%
5%
0%
1970 1980 1990 2000 2004
% o
f re
pla
cem
ent
do
no
r

42 Director General Technical Report ( DGTR )
NUCLEAR MEDICINE IN THE 21ST CENTURY :CONTRIBUTING TO BETTER HEALTH CARE
SUMMARY
The scope of nuclear medicine has expanded tremendously since it was first introduced in Malaysia in the early 1960’s. It has moved from merely providing diagnostic service to the therapeutic and interventional nuclear medicine today. The introduction of Positron Emission Tomography (PET), the setting up of cyclotron facility and the use of targeted delivery agents for imaging and therapy has enabled an earlier and more accurate, as well as more specific diagnosis. This latest technology allows for the visualization of pathological changes at cellular and biochemical level, before their anatomical changes occur. This advancement will definitely contribute towards better clinical outcome and it will no doubt, transform the manner of disease management in the future.
Early Beginning until 2006
Worldwide scenario
Introduction
Nuclear medicine service was introduced in Malaysia in 1964 and had its humble beginning as a Nuclear Medicine Unit under the Department of Radiotherapy of Kuala Lumpur Hospital (HKL). Currently there are a
total of 14 nuclear medicine centers nationwide, five of which are in the Ministry of Health, three in the Universities and the remainder are in the private sector.
Worldwide, the field of nuclear medicine has developed tremendously and most have become an established medical specialty. Some have expanded to various fields of sub-specialisation while others have been integrated into other medical specialities to provide more comprehensive patient management.
This report focuses on the development of nuclear medicine as a specialty in the Ministry of Health Malaysia; the challenges faced and future direction of nuclear medicine services in the Ministry.

43Director General Technical Report ( DGTR )
Role of Nuclear Medicine in Healthcare
Nuclear Medicine involves the use of radioactive isotopes (radioisotopes) to prevent, diagnose, and treat disease. Radioisotopes have been utilised in diagnostic imaging for over 60 years now, while therapeutic uses are a later development. Its use in disease management is growing with new developments and discoveries in medical science and technology.
Scope of Nuclear Medicine Nuclear Medicine Service cover 3 major areas as follows (figure 1) : a) Clinical Nuclear Medicine b) Nuclear Pharmacy c) Nuclear Medicine Physics
Clinical Nuclear Medicine
Clinical Nuclear Medicine is the core activity providing diagnostic and therapeutic aspects of nuclear medicine. Services are being provided by a multi-disciplinary team, comprising of nuclear medicine physicians, medical officers, nurses and technologists.
Defining Nuclear Medicine
Sections of Nuclear Medicine
Diagnostic Nuclear Medicine
Figure 1 : Scope of Nuclear Medicine
Source: Abdul Khader MA. Nuclear Medicine in Malaysia, Presentation

44 Director General Technical Report ( DGTR )
Therapeutic Nuclear Medicine
Positron Emission Tomography (PET)
Nuclear Pharmacy
In nuclear medicine diagnostic techniques, very small amounts of radioactive materials are introduced into the body. Due to their affinity to specific organs, bones or tissues, the emissions they produce can provide crucial information about a particular type of cancer or disease. Nuclear medicine technique provides a more comprehensive information compare to other imaging procedures as it is capable of providing both functional and structural imaging. This enables many diseases and cancers to be diagnosed much earlier.
Over the last decade, major progress has been made in the treatment of disease with radioisotopes. Treatments involving the use of medical isotopes are gaining momentum. Some cancer types are already being treated with radioisotopes.
Positron emission tomography (PET) is one of the latest nuclear medical technology available today. It provides functional imaging modality by mapping glucose metabolism in the whole body. A glucose analogue, fluorodeoxyglocose, is labeled with positron emitting radioisotope fluorine-18 produced by the cyclotron. The resulting radiopharmaceutical 2-18F-fluoro-2-deoxy-D-glucose (FDG) is a substrate for glucose transport proteins (Glut) in cell membranes and accumulates intra-cellularly. It undergoes the same uptake as glucose but is metabolically trapped and accumulated in the cancer cell after phosphorylation by hexokinase.
Increased metabolic activity in malignant tissue is accompanied by increased glucose uptake relative to that of surrounding normal tissue. This focal increase in glucose uptake can be identified with FDG PET scanning. PET scanning is now an important cancer imaging tool and in some cases, it has become an indispensable tool in clinical nuclear medicine. It is used in diagnosis and staging of cancers; detection of locoregional and distant metastasis; diagnosis for recurrence and in monitoring the response to treatment in cancer. It is also being used in neurology and cardiology specialties now.
The nuclear pharmacy section is managed by a pharmacist trained in nuclear medicine. The practice of a nuclear pharmacist include the procurement, compounding, dispensing and distribution radiopharmaceuticals for nuclear medicine procedures. A nuclear pharmacist is also expected to be involve in the quality control, research and development of radiopharmaceuticals.

45Director General Technical Report ( DGTR )
Nuclear Medicine Physics Section
Vision
Objectives
Historical Perspectives
The Nuclear Medicine Physics section is managed by a nuclear medicine physicist who is also a key member of the nuclear medicine team. The responsibilities revolve around safety issues in relation to patients, staff and the public; quality assurance relating to both performance of key equipment as well as procedural factors contributing to the quality of service.
Nuclear Medicine in Ministry of Health Hospitals Nuclear medicine service in the Ministry of Health is to be set up as nuclear medicine department on a regional basis. These centres will play a bigger role as training centres where each would have its chosen sub specialty area to be developed at a tertiary level in the future.
To provide safe and quality diagnostic, therapeutic and interventional nuclear medicine services in Malaysia
Development and expansion of nuclear medicine services in Malaysia has been rather slow. After the setting up of the first Nuclear Medicine Unit in Kuala Lumpur Hospital in 1964, only 3 additional centres were set up over the next 30 years. It was only in the 1990s that more centres were set up as new advancements in nuclear medicine technology enable it to play a bigger role in patient management and fuel demand for such services.
In 2006, a total of 14 nuclear medicine centers have been established in the country, both in the public and private sectors. These centres provide various levels of services, ranging from diagnostic to therapeutic services. The introduction of Positron Emission Tomography (PET) technology has enabled more sophisticated diagnostic and clinical services to be offered.
Organisationally, nuclear medicine has been put under various departments in the Ministry of Health as shown below. It was only in 2005 that the first nuclear medicine unit attained Department status in Penang Hospital and this was followed by Kuala Lumpur Hospital in 2006. ( Table 1 ).

46 Director General Technical Report ( DGTR )
Source: Abdul Khader MA. Nuclear Medicine in Malaysia Presentation
Table 1 : Nuclear Medicine Set Up in the Ministry of Health Hospitals 1964 - 2006
Hospital Kuala Lumpur
Hospital Umum Sarawak
Hospital Pulau Pinang
Hospital Sultanah Aminah, Johor Bahru
1964 : Dept of Radiotherapy1993 : Dept of Medicine2006 : Department of Nuclear Medicine
1986 : Dept of Medicine1997 : Dept of Radiotherapy2002 : Dept of Diagnostic and Imaging2005 : Dept of Nuclear Medicine
1995 : Dept of Diagnostic and Imaging
1997 : Dept of Diagnostic and Imaging
The development of nuclear medicine received its boost under the 8th Malaysia Plan where nuclear medicine service was identified as one of the services for expansion on a regional basis. This was carried into the 9th Malaysia Plan with further consolidation of nuclear medicine services in the Ministry of Health.
Present Nuclear Medicine Centres
Penang Hospital serving the Northern RegionKuala Lumpur Hospital serving the Central RegionHospital Sultanah Aminah Hospital serving the Southern RegionHospital Umum Sarawak serving East Malaysia
These centres will be equipped in phases with:
• Hot lab providing dispensing of radioisotopes • Diagnostic nuclear medicine services• Therapeutic nuclear medicine services• Therapeutic nuclear medicine wards• Positron Emission Tomography (PET) services
Services in the 8th & 9th Malaysia Plans
Regional Centers

47Director General Technical Report ( DGTR )
Types of activities
Way forward Planning Meeting
Nuclear Medicine Activities
The bulk of clinical services is in diagnostic nuclear medicine with the majority of scans being radionuclide bone scan. The number of scans performed is limited by the number of gamma camera system and the amount of radioactive isotopes available on a particular day. The types of services at the 4 hospitals with nuclear medicine services and their workload are shown in Appendix 1.
Between 2005 and 2006, workload for all the centres showed an increase except HSA Johor. This is due to introduction of few new services in each of these centres (Appendix 2).
Other Activities
• Training of nuclear medicine clinicians, medical officers, pharmacists and technologists.
• Industrial training for undergraduate and masters students from local universities.
• Training sites for nurses undergoing post-basic nursing course.
• Research in all main components of nuclear medicine
• Collaborations with regional and international nuclear medicine bodies
Way Forward Planning for Nuclear Medicine
To facilitate planned expansion of nuclear medicine services in the Ministry of Health, a national nuclear medicine meeting was held on 2nd to 5th May 2002 in Johor Baru. The meeting was given due recognition by the presence of the Director-General of Health who officiated the occasion. During this meeting, major stakeholders had the opportunity to discuss and brainstorm on wide ranging issues related to the development of nuclear medicine in the Ministry of Health. Recommendations and targets to be achieved were set and prioritised.

48 Director General Technical Report ( DGTR )
Resolutions and Recommendations
Masters in Nuclear Medicine Program
Subspecialisation
Networking
Some of the recommendations and resolutions made at the meeting were :
• Upgrading of all existing nuclear medicine units to departmental status.
• Upgrading of infrastructure to provide diagnostic, therapeutic and PET facilities in all nuclear medicine centres.
• Increasing the number of equipment and replacing old obsolete equipment.
• Expanding the scope of services and introducing new services.
• Training and continuing professional development for clinical and technical personnel, including nuclear pharmacists and nuclear medicine physicists personnel.
• Organisational restructuring based on functional and core function.
Challenges and Future Directions
Although there are issues related to the development of nuclear medicine services in the country, in particular trained personnel for the sustenance and expansion of services, positive steps have been taken and services will be expanded and improved in the years to come.
To meet the shortage of nuclear medicine specialists, a 4 year Masters in Medicine (Nuclear Medicine) programme is being planned together with the universities.
The development of nuclear medicine specialty shall continue to be consolidated with the upgrading regional centres, where each would have an area of sub-specialisation as well as state of the art technology to support continuing professional development.
Networking between Ministry of Health, the universities, related agencies and private centres would further enhance the range of services as well as accessibility to these services for the population. International collaboration, in particular with the International

49Director General Technical Report ( DGTR )
Atomic Energy Agency (IAEA) since the late 1990s, has helped greatly in the development of nuclear medicine service in the country. Collaborative projects are being carried out together with the Forum for Nuclear Cooperation in Asia (FNCA) which started in 2005 shall continue until 2008.
Conclusion
The future for nuclear medicine in Malaysia is bright and promising. From a humble beginning as a Nuclear Medicine Unit in 1964, nuclear medicine service has expanded and all nuclear medicine centers in the Ministry of Health will be upgraded to department status. Challenges and issues faced shall be a catalyst to achieve greater heights.
The introduction of modern technology of Positron Emission Tomography (PET), cyclotron facility and the use of targeted delivery agents have provided greater insight into the molecular origins of disease as well as visualisation of pathological changes at the cellular and biochemical level before anatomical changes occur. These advancements shall without doubt, provide better quality patient care for the population in the future.

50 Director General Technical Report ( DGTR )
Source: Nuclear Medicine Annual Report 2006, Ministry of Health, Malaysia
Note : HKL = Hospital Kuala Lumpur; HUS = Hospital Umum Sarawak, Kuching; HPP = Hospital Pulau Pinang, HSA = Hospital Sultanah Aminah, Johor Baru
Appendix 1 : Types of Activities and Workload by Hospital, 2005-2006
ACTIVITIES 2005 2006
Scan Type HKL HUS HPP HSA TOTAL HKL HUS HPP HSA TOTAL
Bone scan 890 671 631 214 2406 1091 772 702 185 2750
Bone Densitometry 0 0 308 0 308 0 0 393 0 393
Cardiac (stress+Rest) 487 0 248 813 1548 637 0 186 601 1424
Brain (Ceretec) 0 1 0 0 1 0 0 0 0 0
Dacryo 0 0 6 0 6 0 0 10 0 10
DMSA 234 11 191 64 500 236 18 0 65 319
DMSA V 3 0 0 0 3 0 0 175 0 175
DTPA 494 119 394 107 1114 591 162 389 70 1212
Gallium Scan 15 0 0 2 17 17 0 0 0 17
GFR 494 1 0 0 495 591 0 0 0 591
GFR (Cr-51 EDTA) 3 0 0 0 3 1 0 0 0 1
GIT Bleed 8 0 0 0 8 6 0 0 0 6
HIDA 27 35 32 16 110 18 35 32 8 93
Indium Octreotide 0 0 0 1 1 0 0 0 0 0 Iodine 131 Ablation for Thyroid canser 348 0 0 0 348 575 0 0 0 575 Iodine131: Thyrotoxicosis 559 0 94 0 653 1127 0 116 0 1243
Iodine 131 WBS 764 0 0 0 764 1139 0 0 0 1139 Kidney Reject (Colloid) 0 0 0 0 0 0 0 0 0 0
Liver Scan 0 0 0 0 0 0 0 0 0 0
Lung V/Q Scan 47 0 0 0 47 36 0 0 0 36 ACTIVITIES 2005 2006
Meckel's 9 4 19 6 38 15 7 12 5 39
MIBG 10 0 0 0 10 18 0 0 0 18
MUGA 1 0 0 0 1 0 0 0 0 0
NPC 1 0 0 0 1 0 0 0 0 0
Parathyroid 6 0 6 0 12 9 0 7 3 19
PET CT Scan 0 0 101 0 101 0 0 345 0 345
Red Cell Mass 38 0 0 0 38 32 0 0 0 32
Red Cell Survival 0 0 0 0 0 0 0 0 0 0
Reflux Study 0 0 0 0 0 0 0 0 0 0
Spleen colloid 0 0 0 3 3 0 0 0 1 1 Spleen RBC Denatured 0 0 0 1 1 0 0 0 0 0
Spleen Scan 1 0 0 0 1 2 0 0 0 2 Splenic Sequestration Study 0 0 0 0 0 0 0 0 0 0
Testicular Scan 0 0 0 0 0 0 0 0 0 0
Thyroid 53 7 52 14 126 78 1 55 13 147
Venogram 0 0 0 0 0 0 0 0 0 0
VP Shunt Study 0 0 0 0 0 0 0 0 0 0
WBS (Myoview) 1 0 0 0 1 2 0 0 0 2 R-L Shunt Quantification 0 0 0 0 0 1 0 0 0 1
TOTAL: 4493 849 2082 1241 8665 6222 995 2422 951 10590

51Director General Technical Report ( DGTR )
Appendix 2 : Activities of Four Nuclear Medicine Centers in Year 2005-2006.
0
1000
2000
3000
4000
5000
6000
7000
HKL HUS HPP HSA
TO
TA
L N
O O
F S
CA
NS
HOSPITAL
2005 2006


2chapter


55Director General Technical Report ( DGTR )
POPULATION BASED CERVICAL CANCER SCREENING PROGRAMME : THE WAY FORWARD
Introduction
Cervical cancer is an important focus for cancer control programmes because of the burden of the disease, and the potential for effective prevention via screening. It is the second most common cancer in women worldwide.
Annual global estimates for the year 2000 were 470,600 new cases and 233,400 deaths from cervical cancer. Eighty percent of these cases occured in developing countries. In most countries in North America and Western Europe, the incidence of cervical cancer has been falling although recently at a much slower rate.
The aim of screening for cervical cancer is to detect and treat pre-invasive lesions and consequently reduce the incidence and
SUMMARY
Cervical cancer, the second most common cancer in women worldwide is an important public health issue. It is potentially preventable and treatable, since it takes many years to develop from detectable precursor lesions. The aim of screening is to detect and allow early treatment of pre-invasive lesions thus reducing the incidence and mortality from the disease. This knowledge had been used in many developed countries via organized screening programmes over the past 50 years, and has resulted in remarkable reduction in mortality and morbidity from cervical cancer. An organized screening programme should be population-based, with regular participation of women and monitoring of women throughout the screening pathway. It should also have centralized laboratory facilities with quality control programmes, allowing prompt diagnosis, treatment and follow-up of women with detected abnormalities. In Malaysia, despite the widespread availability of Pap smear screening programmes started 30 years ago, there is relatively low capture rates. Major efforts have been made to evaluate and review the programme, notably the Consensus Meeting in 1997, the workshop to review cytology services in Malaysia in 2004 and the National Workshop on Population-based Cervical Cancer Screening in 2005. These initiatives paved the way forward, moving away from the current opportunistic approach and decentralized cytological services. A pilot project, inviting women for screening through a population database and monitored utilizing a computerized call-recall system, has been initiated in 2 districts beginning in 2006.
56 Director General Technical Report ( DGTR )
mortality from the disease. Cervical cancer meets the criteria that determine the suitability of a disease for a broad-scale screening programme (ACCP 2004): it is potentially fatal, thus is an important public health problem; there is a recognized precursor stage that can be treated in a safe, effective and acceptable way; there is a long latent period from precancerous lesions to the occurrence of cancer, thus allowing time for detection and treatment; treatment of early lesions is cost effective and is less taxing on resources compared to the management of invasive cancer. A study in Nordic countries reported that cervical cancer screening is estimated to save $17m yearly in the period of 2008-2012.
The primary method of screening for cervical intraepithelial neoplasia (CIN) is the Papanicolaou (Pap) smear. Even though the efficacy of the test was never proven through randomized trials, it is generally agreed that it is effective in reducing the incidence of the disease in developed countries, therefore resulting in fewer mortalities.
Organised Screening Programme
In a national cancer control programme, screening should be organised to enable adequate coverage of the target group, and individuals with abnormalities receive appropriate therapy. Screening intervals and target age groups must be addressed. A population based and well organised screening programme with the appropriate target age range at the right frequency is more successful than opportunistic screening. Such programmes should consist of :-
• Identification of the target population
• Measures to monitor women through the screening pathway
• Measures to encourage regular participation
• Choice of Pap smear taking facilities
• Laboratory facilities for interpreting smears
• Quality control programmes for taking and interpreting Pap smears
• Information to women of Pap smear results
• Mechanism for referring women for diagnosis and treatment
• Adequate facilities for diagnosis, treatment and follow-up of women with detected abnormalities
• Evaluation and monitoring of the programme
Justification for Screening of Cervical Cancer
Characteristics of organised screening programme

57Director General Technical Report ( DGTR )
Cervical cancer incidence and mortality have steadily declined within countries that have introduced organised Pap smear screening programs. Data from the WHO cancer mortality data bank confirm major reductions in cervical cancer mortality in Nordic countries that initiated organized programmes in the 1960s. Their programmes define the ages and the frequencies of screening, use personal invitations and give personal information about the results of screening. They found that personal letters of invitation improves compliance and allowed regulation of the target group. In the United Kingdom a major effort started in 1988 to initiate such organised programmes had significantly reduced cervical cancer mortality.(figure 1).
Experiences by other countries
Magnitude of Cervical Cancer
Adapted from Quinn M, Babb P, Jones J, Allen E. BMJ. 1999;318:904-908.
Year
0
10
12
14
16
18 100
90
80
70
60
50
40
30
20 10
0
Invasive Cervical Cancer
Coverage
National call-recall introduced
Incidencerate per100,000
populations
Percentage
1971 1975 1980 1985 1987 1990 1995
Figure 1 : Age-Standardized Incidence of Invasive Cervical Cancer and Coverage of Screening, England, 1971-1995
The Malaysian Scenario
The National Cancer Registry (2003) reported that cervical cancer is the second most common cancer among Malaysian women. In 2003, there were 1,557 cervical cancer cases reported accounting for 12.9% of the total female cancers. The overall age-standardized incidence rate of cervical cancer in Malaysia was 19.7 per 100,000 population.
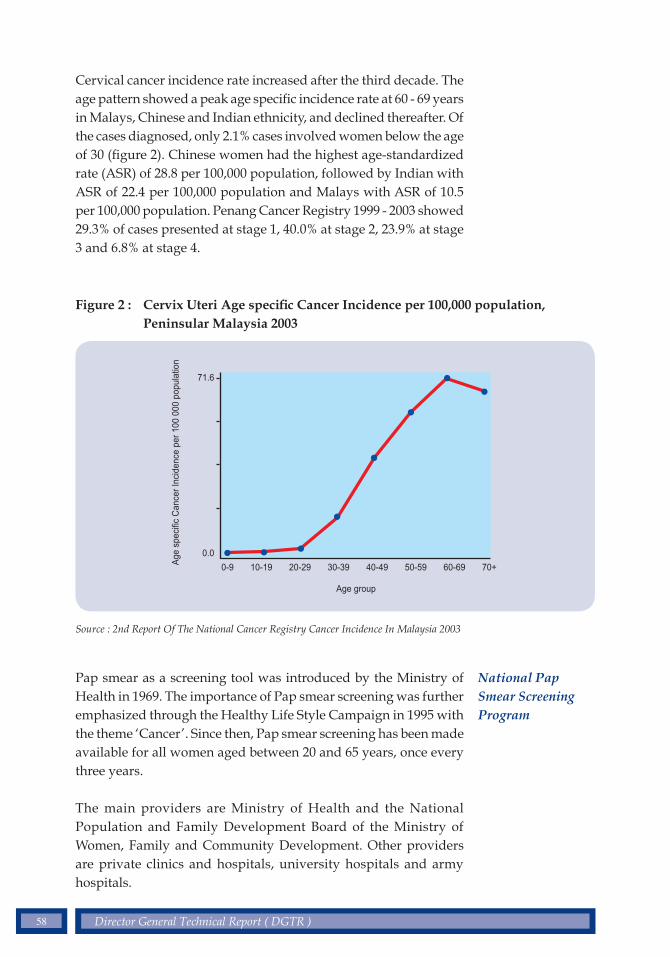
58 Director General Technical Report ( DGTR )
Cervical cancer incidence rate increased after the third decade. The age pattern showed a peak age specific incidence rate at 60 - 69 years in Malays, Chinese and Indian ethnicity, and declined thereafter. Of the cases diagnosed, only 2.1% cases involved women below the age of 30 (figure 2). Chinese women had the highest age-standardized rate (ASR) of 28.8 per 100,000 population, followed by Indian with ASR of 22.4 per 100,000 population and Malays with ASR of 10.5 per 100,000 population. Penang Cancer Registry 1999 - 2003 showed 29.3% of cases presented at stage 1, 40.0% at stage 2, 23.9% at stage 3 and 6.8% at stage 4.
Figure 2 : Cervix Uteri Age specific Cancer Incidence per 100,000 population, Peninsular Malaysia 2003
Source : 2nd Report Of The National Cancer Registry Cancer Incidence In Malaysia 2003
Age
spe
cific
Can
cer
Inci
denc
e pe
r 10
0 00
0 po
pula
tion
Age group
0-9 10-19 20-29 30-39 40-49 50-59 60-69 70+
71.6
0.0
National Pap Smear Screening Program
Pap smear as a screening tool was introduced by the Ministry of Health in 1969. The importance of Pap smear screening was further emphasized through the Healthy Life Style Campaign in 1995 with the theme ‘Cancer’. Since then, Pap smear screening has been made available for all women aged between 20 and 65 years, once every three years.
The main providers are Ministry of Health and the National Population and Family Development Board of the Ministry of Women, Family and Community Development. Other providers are private clinics and hospitals, university hospitals and army hospitals.

59Director General Technical Report ( DGTR )
Despite the above efforts, the prevalence of women in such screening programmes is still low, amounting to only 26% in the 2nd National Health & Morbidity Survey (NHMS II) 1996. One of the recognised contributing factors is the inadequate opportunistic approach. Being an ‘opt in’ programme, its efficacy is therefore low. This has less impact on cervical cancer incidence and mortality and reduces cost-effectiveness (Hakama 1997), since most of the screening is limited to women attending primary health care, antenatal and family planning clinics. Data from year 2003-2005 shows the overuse of services by younger women who are at lower risk (figure 3)
1.7 22.3 34 23.6 10.1 2.8 1.1 4.5
<20 20-29 30-39 40-49 50-59 60-65 >65 unknown
1.5 20.3 31 22.1 9.5 2.5 1 11.8
1.4
2003
2004
2005 20.7 30.3 21.7 9.7 2.5 1.1 12.5
Per
cen
tag
e (%
)
age (year)
35
30
25
20
15
10
5
0
Figure 3 : Percentage of Pap Smear by Age Group : 2003-2005
Source : Information and Documentation System Unit, Ministry of Health Malaysia.
The Way Forward
The Consensus Meeting in 1997 agreed to screen women age 20 - 65 years old every 3 years. Strategies to improve the programme included health promotion programmes, adequate laboratory facilities, quality control, good referral systems, and appropriate and acceptable treatment. In 2004, centralised cytology services with sufficient number of full-time cytotechnicians was agreed

60 Director General Technical Report ( DGTR )
upon, with a plan to phase out the existing decentralised, part-time cytoscreening activities in the one- or two-manned laboratories in the health clinics nationwide. In 2005, a plan was made to change the current approach of opportunistic screening to population-based screening in order to increase coverage and move towards an organised form of screening programme.
A pilot project was designed to study the feasibility of a population strategy in terms of its organisation, assessing the acceptability of the public and to study the effectiveness in terms of coverage, attendance and the cytologic findings in the study areas. The study areas identified are districts of Mersing, Johor and Klang, Selangor - 2 districts with varying demographic profile, available health care services and support systems. The project was initiated in 2006 with the development of application software for the call-recall system and updating of database of the eligible women population in the study areas.
The strategies and activities involved :-
1. Establishment of a central unit for monitoring, evaluation and coordination of activities. This also includes infrastructure.
2. Provision of health information through direct mailing and other communication initiatives e.g. media campaign and community action through network with key community representatives
3. Creation of a call-recall system which utilises population register, sourced from the National Registration Department, which will be updated at regular intervals, to show whether a woman is a current resident, has emigrated or is dead. Names and addresses of the women who are eligible are sent from the central unit through direct mailing, with the help of a computerised database system. Through the call-recall system :
• Eligible women in the population who have not had a Pap smear for the last 3 years will be called
• Women with abnormal Pap smears will be recalled
• Women with normal Pap smears to present for re-screening will be reminded
Objectives, strategies and activities

61Director General Technical Report ( DGTR )
4. Establishment of a registry through a Pap smear database. This central unit will receive information regarding cytologic findings of the smears taken. The Pap smear registry will be linked to the National Cancer Registry for women with gynaecological cancer, to exclude them from the screening programme.
5. Identification of relevant laboratories and upgrading of facilities. The Public Health Laboratories in Sungai Buloh and Johor Bahru with support of Hospital Serdang and Hospital Sultanah Aminah.
6. Strengthening of related downstream and upstream activities. Structured training and credentialing of involved healthcare staff are being implemented. Upstream activities such as colposcopic and oncology services are reviewed in view of expected large number of referrals.
7. Development of guidelines and standardisation of forms and reports to be used in monitoring and evaluation.
8. Intersectoral cooperation between health service providers such as the private practitioners, the local army health centres, National Population and Family Development Board, the Family Planning Associations and other NGOs and partners.
9. Evaluation will be based on population coverage, attendance rate, follow-up time, acceptability and effectiveness of direct mail services. The impact of the pilot project can be assessed after 3 years, in accordance with the screening cycle.
Conclusion
For Malaysia to have a successful cervical cancer screening programme, there must be re-organisation of the present set-up, in a backdrop of existing infrastructure and mechanisms. The pilot project will pave the way forward for better healthcare services but will be met with many challenges such as alternatives to communication and recruitment strategies, management of the voluminous database, possible incentives for programme partners, potential legal issues and most of all, the change of mindset of the public and healthcare providers.

62 Director General Technical Report ( DGTR )
1. ACCP, 2004. Planning and Implementing Cervical Cancer Prevention and Control Programs; A Manual for Managers. Alliance for Cervical Cancer Prevention
2. Beral V, Hermon C, Munoz N, et. al. Cervical cancer. Cancer Surveys. 1994; 19 - 20: 265 - 285
3. Ferlay J, Bray F, Psani P, et. al. GLOBOCAN 2000. Cancer incidence, mortality and prevalence worldwide. Version 1.0. IARC Cancer Base no. 5. IARC Press, Lyon, 2001
4. Hakama M. Screening for cervical cancer: experience of the Nordic countries. In: Franco E, Monsonego J, (eds). New Developments in Cervical Cancer Screening and Prevention. London: Blackwell Science Ltd; 1997: 190-199
5. Hakama M, Chamberlain J, Day NE, et al. Evaluation of screening programmes for gynaecological cancer. British Journal of Cancer .1985 Oct ;52 (4) : 669-673.
6. Hristova L, Hakama M. Effect of Screening for cancer in the Nordic countries on deaths, cost and quality of life up to the year 2017. Acta Oncology. 1997; 36 Suppl 9:1-60
7. Laara E, Day NE, Hakama M. Trends in mortality from cervical cancer in the Nordic countries: association with organised screening programmes. Lancet 1987;i:1247-9
8. Institute of Public Health, 1997. National Health and Morbidity Survey 1996. Volume 19 Pap’s Smear Examination.
9. J.Cuzick. The Organisation of Cervical Screening in England and Wales. In: Miller A.B, Chamberlain J, Day NE, Hakama M, Prorok PC (eds). Cancer Screening.International Union Against Cancer 1991; 163-171
10. M.Hakama, K.Magnus, F.Petterson, et al. Effect of Organised Screening on the Risk of Cervical Cancer in the Nordic Countries. In: Miller A.B, Chamberlain J, Day NE, Hakama M, Prorok PC (eds). Cancer Screening. International Union Against Cancer 1991; 153-162
11. IDS (Information and Documentation System Unit) MOH 2005. 2005 Family Planning, Sub System-Health Management Information System, Ministry of Health Malaysia
Bibliography

63Director General Technical Report ( DGTR )
12. National Cancer Registry. Second Report of the National Cancer Registry Cancer Incidence in Malaysia 2003. Ministry of Health, Malaysia; 2004
13. Penang Cancer Registry Report 1999 - 2003. Ministry of Health, Malaysia; 2004
14. T.Bjorge, A.Gunbjorud, O.Haugen, et al. Mass screening for cervical cancer in Norway: evaluation of the pilot project. Cancer Causes and Control 1995, 6, 477-484
15. Quinn M, Babb P, Jones J, et al. Effect of screening on incidence of and mortality from cancer in England: evaluation based on the routinely collected statistics. BMJ. 1999;318:904-908.
16. WHO 2002. Cervical cancer screening in developing countries : report of a WHO consultation. World Health Organization 2002
17. WHO 2002. National Cancer Control Programmes, Policies and Managerial Guidelines. 2nd edition
18. WHO 2006. Comprehensive cervical cancer control : a guide to essential practice. World Health Organization 2006

64 Director General Technical Report ( DGTR )
EVALUATING PRIMARY ORAL HEALTHCARE PROGRAMMES
SUMMARY
The oral healthcare programme of the Ministry of Health is one of the most comprehensive oral healthcare delivery system in the world. The Oral Health Division, as lead agency in oral healthcare, provides primary and secondary care for the population. The emphasis is on the younger age groups and activities are targeted at preschool children, school children, ante-natal mothers, the elderly, the ‘special’ groups and others deemed socially- or economically-disadvantaged. Community programmes include the water fluoridation programme while the fissure sealant programme and the programme for primary prevention and early detection of oral cancer and precancer adopt high-risk strategies. Performance of personal care activities and community programmes are measured by indicators (some proxy) that assess equity, accessibility, appropriateness, adequacy and effectiveness.
Introduction
The primary oral healthcare programme relates to activities carried out for target groups stipulated by the Oral Health Division, Ministry of Health Malaysia (MOH). These groups comprise pre-school children, school children,
antenatal mothers, children with special needs, and the elderly, and activities are undertaken with reference to formulated guidelines.
Evaluation of the activities at primary care level assesses the level and/or trends of achievement of the services. It is also pertinent to measure the impact these activities have in terms of equity of coverage, manpower distribution and facilities, acceptability (whether accepted by the target groups), adequacy, appropriateness and effectiveness.
Data from the Health Management Information System (HIMS) are extrapolated into indicators depicting workload or impact achievements from the Quality Assurance Programme (National Indicators Approach), Key Performance Indicators (KPI), Customer Satisfaction Surveys or from the evaluation of the Modified Budgeting System (MBS) conducted every five years.
Target Groups

65Director General Technical Report ( DGTR )
Background
The total population of Malaysia in year 2006 was 26,640,200 comprising about 17 million adults, 5 million school children, 3 million preschool children (aged 5-6) and half a million ante-natal mothers. The Federal Territory Kuala Lumpur (FTKL) had the highest number of public sector dental officers followed by Johor and Selangor. There were 1,368 dental professionals in the public sector and 1,572 in the private, giving a ratio of 1 dentist to 9,061 population in 2006, a small improvement from 1 to 10,694 in the year 2000. The number of dental nurses increased from 1,813 (2000) to 2,413 (2006).
The bigger states like Perak, Sarawak, Johor, Sabah and Pahang had more facilities compared to the most populous state of Selangor. There were a total number of 3,571 (2,117 clinics) dental units for Malaysia in 2006 compared to 2,802 (1,729 clinics) in 2000.
The proportion of Malaysians utilizing primary oral healthcare in MOH facilities has remained about the same over the years. In year 2006, 23.4% of Malaysians utilized MOH facilities compared to 24.9% in year 2000 (Table 1).
Table 1 : Proportions Target Group Utilising Dental Facilities of the Ministry of Health Malaysia Year 2000 and 2006
Source: Information and Documentation System Unit, Ministry of Health Malaysia.Proportions, shown are of the target group population
Target Group
Preschool children
Primary school children
Secondary school children
Antenatal mothers
Adults
Total
Year 2000 N (%)
359,584 (6.5%)
2,868,062 (51.9%)
1,436,822 (26%)
95,547 (1.7%)
764,616 (13.8%)
5,524,631 (24.9%)
Year 2006 N (%)
543,988 (8.6%)
3,059,528 (48.4%)
1,559,627 (24.7%)
85,050 (1.3%)
1,047,486 (16.6%)
6,316,701 (23.4%)

66 Director General Technical Report ( DGTR )
Criteria for evaluation
Proportions however, may be misleading. There was a real increase in quantum from 2000 to 2006. Patient numbers increased by 43% and attendance by about 40% from year 2000 to 2006 (Table 2).
Evaluation at primary care level covered both primary oral healthcare activities as well as community programmes. The scope encompassed :
• Equity - denotes the availability and distribution of manpower resources in conducting an activity; it is used to compare available resources in terms of ratio of manpower / facilities to target population
• Accessibility - measures access of patients to services using percentage coverage of patients
• Appropriateness - assesses appropriateness of the school programme based on proportion of those deemed as ‘No Treatment Required’ on examination at the start of each year
• Adequacy - measures how far the programme has contributed to improvement in oral health status; assesses the performance rates for appropriate intervention and the number of patients rendered orally-fit on completion of care
• Effectiveness - measures objective met and in this case, the caries-free status of each group (Table 3).
Not all the evaluation criteria were utilized by each activity. For example, the fissure sealant programme adopts a high-risk strategy in schools rather than a population strategy and therefore can only be assessed on adequacy and quality of care. Data for each criteria are tabulated in Table 1A in the Appendix.
Table 2 : Population Rendered Oral Healthcare in the Ministry of Health Malaysia in Year 2000 and 2006
Source: Information and Documentation System Unit, Ministry of Health Malaysia
Variable
PatientsAttendance
Year 2000
5,524,5716,236,509
Year 2006
7,906,7618,679,764

67Director General Technical Report ( DGTR )
Equity
Accessibility
The national ratio of dental nurses (DN) to pre-school population is 1 DN to 616 preschool children for the year 2006. This seems a good ratio but equity needs to be viewed from the perspective of concurrent demands on dental nurses from other groups of children.
Accessibility was measured in terms of new cases of pre-school children seen under the activity. There is high coverage of children at both public and private kindergartens at 93.1% (2006). However, this translates as a national average of 46% based on total pre-school population, indicating that many young children do not attend pre-school institutions. Based on the total pre-school population, most states showed an increasing trend, the highest being Perlis (79%), Terengganu (75%) and Pahang (74%). Those that achieved below the national average were Sabah (42%) and Sarawak (36%) but smaller states like Malacca (25%), Negeri Sembilan (31%) and FTKL (20%) also fared below average.
Table 3 : Evaluation Criteria Utilised for Assessing Performance of Primary Oral Healthcare Programme (2006)
Source: Oral Health Division, Ministry of Health Malaysia
Oral HealthCare Programme
Preschool
Primary School
Secondary School
Ante-Natal
Elderly
Water Fluoridation
Fissure Sealant
Oral Cancer Screening
Equity
√
√
√
√
√
√
-
√
Accessibility
√
√
√
√
√
√
-
√
Appropriateness
-
√
√
√
√
√
-
√
Effectiveness
√
√
√
√
-
√
-
√
Adequacy
-
√
√
√
-
√
√
√
Evaluation Criteria

68 Director General Technical Report ( DGTR )
Effectiveness
Equity
The effectiveness of the pre-school programme is viewed from the proportion of 6-year-olds found caries-free (Figure 1). The proportion at 35.9% in 2006 surpassed the 30% target set for year 2010. States like FTKL, Selangor and Negeri Sembilan have achieved more than 40% caries-free with Johor trailing at 39.3%. Caries-free status was poorest in Kelantan (4.5%), Terengganu (13.4%) and Perlis (16.2%).
Although there was high coverage of young children in kindergartens, the outcome was less than satisfactory when viewed from the perspective of the World Health Organisation (WHO) figure of 50% caries-free at age 5-6 years.
Oral health personnel continue to encourage teachers and minders to initiate early tooth-brushing activities to inculcate positive health habits in young children. In spite of these activities, the rate of oral health improvement among pre-school children continues to be slow. Data indicate association between caries and water fluoridation, with states without the benefit of water fluoridation showing higher caries treatment needs in this group. Fluoride mouth-rinsing among 6-year-olds may be a possibility, but young children have poor gag reflex and the possibility of swallowing such substances should be avoided. There is increasing emphasis on treatment rather than just prevention, with use of the Atraumatic Restorative Treatment (ART) technique.
Hence, there is a need to target health promotion activities at even younger children of toddler age (4-5 years). In the public sector, activities for pre-school children must adhere to formulated guidelines with active involvement of kindergarten teachers and parents. Additionally, kindergarten authorities need to assist in the provision of infrastructure for such activities such as providing sinks and troughs for oral hygiene activities.
Oral Healthcare for Pre-School Children
Equity in the form of ratio of dental nurses (DN) to primary school children is good for most states with an overall national ratio of 1 DN to 1,580 children. Again, ‘good’ is relative due to concurrent demands from the pre-school group. The ratio was better in the smaller states of Perlis (1 : 666) and FT Labuan (1 : 777) compared to the bigger and more populated states of Selangor (1 : 3,379) and Johor (1 : 2,905). The ratio in Sarawak was also good (1:937) as the state has the highest number of dental nurses in Malaysia (1 : 1,580).

69Director General Technical Report ( DGTR )
120
100
80
60
40
20
0
No Treatment RequiredPercent Caries free 6-year-olds
Percent Rendered Orally fitPercent Caries free 6-year-olds
2000 2001 2002 2003 2004 2005 2006
56.7
96.3
24.5
52.458.2
97.3
52.958.6
97.2
26.2 26.2
55.560.1
96.6
28.5
57.3
97.2
61.8
28.8
57.161.8
93.8
38.6
57.563.9
95.3
58.2
35.9
Accessibility
Appropriateness
Effectiveness
Adequacy
The coverage for primary school children is proxy for accessibility. Proportions covered were almost the same in 2006 (95.3%) as in 2000 (95.4%). Almost all states covered 95% of this target group except for Kelantan, Sabah and Sarawak. However, even these states showed improvement in coverage from 85% (2000) to 90% (2006).
The proportion of primary school children with ‘No Treatment Need’ is proxy for ‘appropriateness’ of care. This is the percentage taken at initial screening at the start of the new year. The figure has risen from 56.7% in 2000 to 63.9% in 2006 (Figure 1). This percentage increase is especially marked for Johor, Selangor and Pahang where proportions are more than 70%. Again Kelantan, Sarawak and Sabah fared less well than the other states and need to put in extra efforts to rise above the 55% mark.
‘Effectiveness’ is gauged from the proportion of 12-year-olds caries-free. The national caries-free status for this age group is 58.2% (2006) from 52.4% in 2000 (Figure 1). Selangor, FTKL and Johor achieved more than 70%, while Sabah and Kelantan recorded the lowest, ranging from 27.4% - 45.4%.
The ‘adequacy’ of the activity is assessed from the percentage of primary school children who have completed treatment and have been rendered orally fit. For this group, the rate has remained about the same in 2000 (96.3%) and 2006 (95.3%) (Figure 1). In spite of having the highest number of dental nurses, Sarawak showed the lowest achievement (75.4%) while Sabah and Kelantan achieved just below the 95% mark.
Figure 1 : Oral Health Status of Primary School Children (2000-2006)
Source: Information and Documentation System Unit, Ministry of Health Malaysia

70 Director General Technical Report ( DGTR )
Equity
Accessibility
Appropriateness
Effectiveness
Adequacy
Oral Healthcare for Secondary School Children
The distribution of dental officers (DO) to secondary school children has remained status quo over a number of years with a national average of 1 DO to 2,934 school children. As this is a problem of manpower shortage, the 2006 ratio was not good in both the populous states of Selangor (1 : 6,067) and Johor (1:3,491) and in Kelantan (1: 3,583), Sarawak ( 1 : 4,701) and Sabah (1 : 4,655) as well.
‘Accessibility’ in terms of coverage of secondary school children has seen a very small improvement from 66.7% in 2000 to 67.1% in 2006. This indicator has been unstable in the interim years. Kedah showed an increase from 44.2% (2004) to 64.9% (2006) while there needs to be improvement in Sarawak (23.2%), Sabah (33.7%) and Kelantan (38.1%). Not surprisingly, Selangor, with such a poor DO to secondary school children ratio, managed to cover only 60.3% in 2006.
Secondary school children seen with ‘No Treatment Required’ stabilized from 70.5% (2000) to 74.2% (2006) demonstrating ‘appropriateness’ of the activity as defined (Figure 2). Sabah and Kelantan showed the lowest trends.
Proportion of caries-free 16-year-olds examined rose from 35.4% (2000) to 47.7% (2006) (Figure 2). The incremental dental care programme in schools is deemed effective especially for FTKL and Johor (62.4%). Sabah, Sarawak, Kelantan and Terengganu remained the lowest below the 30% mark.
Proportion of secondary school children rendered orally fit has remained consistently high. In year 2006, 91% were rendered orally fit compared to 90.2% in 2000 (Figure 2). Most states had high achievements, hence, demonstrating adequacy of the care rendered for this target group, except for Kelantan (57.7%).

71Director General Technical Report ( DGTR )
Oral Healthcare for Antenatal Mothers
The national ratio of DO to antenatal mothers has shown a positive trend from 1: 1,325 (2000) to 1:692 (2006). For the larger states like Sabah (1:1,521), Sarawak (1:1,033), and Selangor (1:1,793), DO numbers are still insufficient to meet the requirements of providing oral healthcare for antenatal mothers.
Coverage is mainly an issue of accessibility for antenatal mothers. In spite of better ratio of DO to antenatal mothers, data for new attendance has not increased appreciably in 2006 (16.4%) from that of year 2000 (18.4%). However, accessibility is good in states like Perlis (70.1%), FT Labuan (43.8%) and Pahang (32.6%) which had superceded the 30% mark in 2006.
Community Oral Healthcare Programme
Fluoridation of public water supplies remains the cornerstone for prevention and control of dental caries. The objective of the programme is to provide at least 70% of the population with fluoridated water. The level of fluoride in water supplies has been reduced from 0.6ppm to 0.4 ppm in 2005.
Equity of the programme is gauged from the coverage of population receiving fluoridated water. The programme has supplied about 65% of Malaysians with fluoridated water since year 2000 (Figure 3). In 2006, population coverage was more than 70% in some states except for Kelantan, Terengganu, Sarawak and Sabah. Population
Equity
Accessibility
Equity
Source: Information and Documentation System Unit, Ministry of Health Malaysia
Figure 2 : Oral Health Status of Secondary School Children (2000-2006)
100
90
80
70
60
50
40
30
20
10
0
No Treatment Required Percent Caries free 16-year-oldsPercent Rendered Orally fit
2000 2001 2002 2003 2004 2005 2006
70.5
90.2
35.4
70.4
90.5
72
90.7
39.2 40.2
71.2
90.5
41.9
90
70.8
43.3
76.3
93.2
38.6
74.2
90.8
47.7

72 Director General Technical Report ( DGTR )
coverage has varied over the years in some states. This has been due to factors such as privatization of water supply, as in Kelantan and Terengganu when the programme was halted, poor maintenance and repair of fluoride feeders at water treatment plants, and erratic supply of fluoride chemicals.
Figure 3 : Percentage Population receiving Fluoridated Water Supplies (2000-2006)
Source: Information and Documentation System Unit, Ministry of Health Malaysia
100
90
80
70
60
50
40
30
20
10
0
2000 2001 2002 2003 2004 2005 2006
72.768.4
59.0 62.4 64.869.1
73.9
The adequacy of the fluoridation programme is assessed by the number of water treatment plants equipped with fluoride feeders. In 2006, about 65.5% water treatment plants were installed with fluoride feeders compared to 56.9% in 2004. About 12.8% of those that were not active were due to lack of resources for replacement.
Effectiveness of the programme is based on caries-free status of 12 year-old children. Data indicate an association between the percentage of caries-free 12 year olds and the population receiving water fluoridation (Figure 4).

73Director General Technical Report ( DGTR )
Figure 5 : Provision of Fissure Sealants (2000-2006)
Source: Information and Documentation System Unit, Ministry of Health Malaysia
250,000
200,000
150,000
100,000
50,000
0
2000 2001 2002 2003 2004 2005 2006
No. of teeth rendered fissured sealantsNo.. of Patients
Adequacy
School-based Fissure Sealant Programme
The fissure sealant programme is a clinical preventive programme aimed at individuals with risk of caries.
The oral health services evaluate the adequacy of the programme based on the number of Year 1 to 6 primary students rendered treatment and the number of teeth rendered fissure sealant. It is a retrospective study based mainly on HIMS data. There was an increase overall from the years 2000 to 2006 (Figure 5).
Figure 4 : Population receiving Fluoridated Water and Percentage Caries-Free 12-year-olds and (2006)
Source: Information and Documentation System Unit, Ministry of Health Malaysia
100.0
90.0
80.0
70.0
60.0
50.0
40.0
30.0
20.0
10.0
0.0
Percent Caries free 12-year-oldsPercent Population Receving Fluoridated Water
FT Lab
uan
Selang
or &
FTKL
Penan
g
Mala
cca
N Sem
bilan
Saraw
ak
Perlis
Pahan
g
Kelant
an
Sabah
Teren
ggan
u
Mala
ysia
Kedah
Joho
r
Perak

74 Director General Technical Report ( DGTR )
As the programme is aimed at newly erupted molar teeth, more than half of children involved were in Year 1 and Year 2. Criteria of child and tooth selection are contained in guidelines formulated for the programme.
Primary Prevention and Early Detection of Oral Pre-Cancer and Cancer Lesions
Although prevalence of oral cancer in Malaysia is low at 0.04%, certain unique characteristics are associated with oral pre-cancer and cancer in this country. Oral cancer lesions are found predominantly among the Indian ethnic group who comprise about 8% of the population yet account for 60% of oral lesions detected. There is also a higher prevalence of associated ‘pre-cursor’ lesions among the Indigenous groups. As such groups tend to be in captive communities, members of such communities are found to exhibit habits that put them at risk to oral lesions, namely quid chewing, tobacco use and alcohol consumption.
The Primary Prevention and Early Detection of Oral Pre-cancer and Cancer Programme was launched on the basis that early intervention together with efforts at modifying, reducing, or stopping risk habits, would lead to a reduction of the more invasive forms of the disease.
A high-risk strategy is adopted aimed at such captive communities. Together with opportunistic screening of patients, the oral health services aim to reduce the incidence and prevalence of oral pre-cancer and cancer in the country.
The preliminary results of the second phase of the screening programme at the end of 2006 reported 13,242 subjects aged 20 years and more screened of the captive groups (Table 4). More than 90% of those screened received dental health talks. Of those screened, 452 (3.4%) individuals with lesions were identified and 236 were referred to Oral Surgeons for management. Compliance rate for referrals was 44.9% (105 cases).
Groups at risk to oral cancer

75Director General Technical Report ( DGTR )
Of those referred, 43.8% were found to have pre-malignant lesions. Eight cases were malignant lesions, the majority (61.3%) at Stages 3 and 4, while the rest were found in TMN Stage 1.
Under a government-funded research project, diagnostic findings and management strategies are stored in a central database and monitored. The targeted high-risk population will also undergo re-screening at specified intervals under the national screening programme to follow-through cases with high-risk habits.
Discussion
Without doubt, resources (manpower, facilities, allocation) distributed accordingly to areas of need would lead to improvements in output and outcome. There is a need to further strengthen primary oral healthcare for pre-school children, school children and ante-natal mothers and to expand oral healthcare to toddlers in states that have not commenced with the programme.
However, constraints have necessitated innovation. The success of the incremental school programme through the ‘outreach’ concept is apparent in the positive trends in oral health status of primary school children. The current strategies should be sustained and consolidated further to improve coverage of this group.
For secondary school children, the change in strategy in 1995 to treat not only children in Forms 2 and 4 but to encompass the whole school has reaped benefits. However, it has been a long-standing issue of DO shortage in some states. The need to increase coverage
Merits of the Incremental Dental Care Programme in Schools
Table 4 : Oral Pre-Cancer & Cancer Screening (2003 - 2006)
Source: Oral Health Division, MOH
2003 26,908 3,409 219 3,628 13.5 135 4.0 77 26 33.8
2004 10,084 1,416 3 1,416 14.0 80 5.7 35 19 54.3
2005 36,446 3,958 11 3,958 10.9 159 4.0 70 25 35.7
2006 31,112 4,240 0 4,240 13.6 78 1.8 54 35 64.8
Total 104,550 13,009 233 13,242 12.7 452 3.4 236 105 44.9
Examined With lesions
Seen by Oral Surgeons
Year 20yrs
New Repeat
Attendance
Percent Examined
n %
Referred
n %
76 Director General Technical Report ( DGTR )
The woes of the fluoridation programme
The effectiveness of water fluoridation
of secondary school children to that of the primary has called for the new strategy of putting DN together with DO in secondary schools. This has been made possible with expanded training of dental nurses in the use of new and modern equipment and increased use of mobile dental clinics.
The programme for antenatal mothers continues to be a challenge. The recent change in antenatal programme at health facilities (Integrated Programme) where the antenatal programme is held daily has contributed to even lower achievement in 2006 as opposed to pre-scheduled ‘ante-natal days’ in the past.. This is because dental officers have conflicting schedules in schools which do not allow them to be in their dental clinics daily to render care to the antenatal group. A change in strategy needs to be discussed to look into some kind of rotation system for dental officers to render care to this group on a daily basis.
The MOH is dependent on third parties to implement the water fluoridation programme. Poor maintenance and repair schedule of fluoride feeders by state water authorities have also led to disruption in fluoridated water supply. Privatization of water supplies in the states of Kelantan (1995) and Terengganu (1999) took its toll with cessation of water fluoridation. Persistence by our oral health counterparts in Kelantan, however, has paid off with gradual reinstatement of fluoride feeders in the last two years. The programme, however, has ceased totally in Terengganu due to lack of fluoride supplies, which has not been approved by the state government. The Oral Health Division must persist in efforts to reinstate/expand the water fluoridation programme, especially in states that have ceased the programme. Guidelines for the water fluoridation programme are called for and have been drafted.
Effectiveness of water fluoridation is proven worldwide and states with a stable water fluoridation programme have exhibited higher percentages of caries-free 12-year-olds. The impact of caries control from water fluoridation is now difficult to isolate with the advent of other fluoride medium such as fluoridated toothpaste. Nevertheless, different sources of fluoride have a cumulative impact on caries prevention and control. However, caries decline cannot be attributed to fluoride use alone as diet, lifestyle, socio-economic status and the environment have all been shown to impact on oral health status. In Sarawak, for example, although the coverage of population receiving fluoridated water is high, percentage of caries-free 12 year-olds is low.

77Director General Technical Report ( DGTR )
There is equity in water fluoridation as fluoridated water is delivered regardless of socio-demography. There are no compliance issues. Concerted efforts by relevant agencies have seen a rise in proportion population on fluoridated water from year 2000 (64.8%) to 2006 (73.9%). This has also seen the fluoridation programme expanded to smaller water treatment plants of less than 0.5 million gallons per day (mgd). In 2006, 14% of water treatment plants were of capacities of less than 0.5 mgd.
Since more than 93% of the Malaysian population received piped water supplies, it is essential that the fluoridation programme be sustained as an effective preventive public health measure against dental caries for the population regardless of race and creeds and their associated economic status. However, the services have yet to institute steps to study the cost-effectiveness of the fluoridation programme. With so many agencies involved in public water supply, links must be strengthened between agencies.
Early screening for fissure sealant needs as stipulated in the guideline and placing emphasis on high-risk groups is the direction for the future. The programme calls for repeat training cycles of dental officers and nurses in clinical preventive techniques with the advent of newer materials and treatment modalities.
Conclusion
Comparison of oral healthcare with other countries highlights the fact that Malaysia has one of the most comprehensive oral healthcare programme in place under the MOH. Political will is without doubt the thrust that ensures the continuation of oral healthcare activities, especially for the younger age groups. Such support has eased the establishment of collaboration between several Ministries, in particular the Ministry of Education. The success of the School Dental Service has gained recognition by the World Health Organization (WHO). Prioritizing target groups, with emphasis on younger age groups gives focus to such activities. Continuous scrutiny and evaluation of the programme need to be sustained.
The Fissure Sealant Programme
78 Director General Technical Report ( DGTR )
1. Oral Health Division, MOH, Modified Budgeting System Report on Oral health (2000 - 20004)
2. Engineering Division MOH. No. (32)KKM-153(5/191)Bhg.5 dated 22 December 2004
3. York Report. A Systemic Review of Public Water Fluoridation September 2000
4. U.S. Department of Health and Human Services, Centers or Disease Control, Dental Disease Prevention Activity. Water fluoridation: Manual for Engineers and Technicians.Atlanta; September 1986.
5. The Malaysian Water Association. Malaysia Water Industry Guide 2005. KDN:PP1167/10/2005 ISSN: 1675-2384
6. Loh KH. Cost-Identification Study of Fluoridation in Johor. Johore Dental Service, 2003
7. Peterson PE. The World Oral Health Report 2003: Continuous improvement of oral health in the 21st Century - the approach of the WHO Oral Health Programme. Community Dent Oral Epidermiol 2003 31(Suppl 1): 3-24
8. Oral Health Division, Ministry of Health. Guidelines : A school-based Fissure Sealant Programme 2nd ed. Oral Health Division, Ministry of Health 2003
9. Oral Health Division, Ministry of Health Malaysia. National Oral Health Survey of School Children 1997 (NOHSS’97)
Bibliography

79Director General Technical Report ( DGTR )
Pre-school children
Primary school children
Secondary school children
Equity
Accessibility
Effectiveness
Equity
Accessibility
Appropriateness
Effectiveness
Adequacy
Equity
Ratio of dental nurses to pre schoolers
Percentage of new pre schoolers
Percentage of caries-free status of 6 year old
Dental nurse to primary school students ratio
Percentage of new primary school students seen
Percentage of primary school children requiring no treatment
Percentage of caries-free status of 12 year old
Percentage of primary school children rendered orally-fit
Dental officers to secondary school children ratio
1:616
93.1%
33.8%
1:1,580
100%
63.9%
58.2%
95.1%
1:2,934
90.2% in 2000
25.4% in 2000
Perlis 1:666Selangor 1:3379
95.4% in 2000
56.7% in 2000
52.4% in 2000
96.3% in 2000
A) Primary oral healthcare Activities
Programme Evaluation criteria
Indicator Achievement 2006
Comments
Figure 4 : Performance of Primary Oral Healthcare Activities and Community Program

80 Director General Technical Report ( DGTR )
Ante-natal mothers
Elderly
Water fluori-dation
Accessibility
Appropriateness
Effectiveness
Adequacy
Equity
Accessibility
Accessibility
Equity
Adequacy
Percentage of new secondary school children seen
Percentage of secondary school children requiring no treatment
Percentage of caries-free status of 16 year old
Percentage of secondary school children rendered orally-fit
Ratio of dental officers to ante-natal mothers
Percentage of new ante-natal mothers attending clinic
Percentage of new elderly patients
Population coverage
Percentage of water plants with fluoride feeders
70.3%
74.2%
47.7%
91%
1:692
16.4%
4.64%
73.9%
65.5%
55.7% in 2000
70.5% in 2000
35.4% in 2000
90.2% in 2000
1: 1,325 in 2000
18.4% in 2000
5% in 2000
56.9% in 2004
Programme Evaluation criteria
Indicator Achievement 2006
Comments
B) Community oral healthcare programmes

81Director General Technical Report ( DGTR )
Fissure sealant programme
Early detection of oral pre-cancer and cancer lesions programme
Effectiveness
Adequacy
Adequacy
Percentage of caries free amongst 12 year old
Percentage of students with FS teeth
Percentage of teeth sealed out of teeth needing FS
Number of high-risk screened
73.9%
64.8%
82.0%
4,240 screened
58.2% in 2004
of 138,996 children needing FS
of 196,335 needing FS
1,416 patientsin 2004
Programme Evaluation criteria
Indicator Achievement 2006
Comments

82 Director General Technical Report ( DGTR )
EPIDEMIOLOGY OF FOODBORNE DISEASES IN MALAYSIA
SUMMARY
Surveillance data on foodborne diseases for the period 1996-2006 generally indicates a declining trend of such diseases in the country. However, there are still pockets of areas with poor basic sanitation and environmental facilities reporting a significant number of cases. Sabah contributed most of the cholera cases reported in the country, the majority of whom were immigrants. Typhoid is a problem in Kelantan with school going age-group being the most affected. Food poisoning affects every state, especially in schools. Preventing and controlling foodborne disease require inter-agency involvement, in particular agencies responsible for the provision of basic environmental facilities while local authorities play an important role in enforcing laws related to establishment and operations of food outlets. Data from the national disease and pathogen surveillance system, with linkages to systems from various related agencies will provide useful information that are important for a better understanding of foodborne disease problem in Malaysia.
Introduction
Foodborne (FB) diseases are defined as diseases caused by agents, usually infectious or toxic in nature, that enter the body through the ingestion of food.
Every year, it causes millions of illnesses and thousands of deaths throughout the world, especially in countries with poor socio-economic status that gave low priority on food safety. In many developed countries, the incidence of infections caused by classical enteropathogens like Salmonella typhi and Vibrio cholera has decreased, but new enteropathogens have emerged which needs due attention. These include E. coli, Vibrio vulnificus, Listeria monocytogenes, multiresistant Salmonella serotype Typhimurium definitive type 104 and the parasite Cyclospora cayetanensis.
In Malaysia, notification of communicable diseases is compulsory as required under the Prevention and Control of Infectious Diseases Act 1988 (Act 342).

83Director General Technical Report ( DGTR )
Before the introduction of CDCIS (Communicable Diseases Control Information System), an electronic system for notification of communicable diseases in 2002, foodborne disease surveillance data was collected and registered manually. Since 2004, all data have been collected using the electronic system.
Over the last 10 year period (1995 - 2005), foodborne diseases have been on the decreasing trend. For instance, the incidence of cholera decreased from 10.9 to 1.5 per 100,000 populations3. Until recently, there has been no publication on the epidemiology of foodborne diseases in Malaysia as a whole.
As a result, some foodborne diseases data quoted in some overseas publications are misleading. For example, the CIA - The World Fact Book website classified Malaysia as being high risk for food and waterborne diseases, while Crump et al 2002, classified Malaysia as part of a region with high incidence of typhoid fever (more than 100,000 populations)
This report provides a comprehensive over-view on the epidemiology of foodborne disease in Malaysia.
Sources and Materials
Foodborne disease is defined as diseases transmitted as a result of ingestion of contaminated food or water. For the purpose of this report, it covers only cholera, typhoid and paratyphoid fevers, viral hepatitis A, food poisoning and dysentery.
The number of cases and incidence rates are based on data available in the surveillance system, Ministry of Health, Malaysia from the year 1996 to 2006. Thus it covers only cholera, typhoid and paratyphoid fevers, viral hepatitis A, food poisoning and dysentery.
Epidemiological description on the cases by time, place and person for 2005 and 2006 were obtained from the CDCIS and analyzed by SPSS 11.
Incidence rates were derived by dividing the number of cases with mid-year population of a particular year. Specific rates for particular population groups were calculated by dividing number of cases in such groups with their respective mid-year populations for the year. Population data was based on the Monthly Statistic Bulletin,

84 Director General Technical Report ( DGTR )
June 2005 and June 2006 published by Department of Statistic Malaysia.
Results of Analysis
Overall for the past 10 years, the incidence of cholera, typhoid, hepatitis A and dysentery had steadily decreased (Figure 1). However the incidence of food poisoning showed a fluctuating trend with improvements in the first half of 2000, but appeared to be on the increase in 2006 (Table 1).
Figure 1 : Trends of Major Foodborne Diseases in Malaysia, 1996 to 2006
0
1
2
3
4
5
6
7
8
1996 1997 1998 1999 2000 2001 2002 2003 2004 2005 2006Inci
denc
e R
ate
(per
100
,000
pop
ulat
ion)
Cholera DysentryHep ATyphoid/paratyphoid
Source: Information and Documentation System Unit, Ministry of Health Malaysia

85Director General Technical Report ( DGTR )
Cholera
Despite a significant decline in number of cholera cases in most parts of Malaysia, outbreaks still persist in several areas where water supply, sanitation, food handling and personal hygiene practices are inadequate.
The annual incidence of cholera in Sabah had always been higher compared to the other states (Table 2). Over the past 5 years, 69% of all cholera cases reported in the country were from Sabah. The problem of cholera in Sabah is complex and multi-factorial. Water and sanitation however, are major contributing factors. Analysis on the cases reported from 2001 through 2005 revealed that 66% of the cases did not have safe water supply at their residence and 79% did not have sanitary toilet facilities. It was also found that 47% of all cases reported were foreign nationals.
In other states, the incidence of cholera was rather sporadic and occured in areas where food hygiene practices were given little emphasis by the community.
Table 1 : Incidence Rate (per 100,000 population) of Major Foodborne Diseases in Malaysia, 1996 t0 2006
Foodpoisoning
Cholera Yeartyphoid/
paratyphoid Hep A Dysentry
1996 15.3 7.0 4.5 4.0 0.6
1997 31.0 1.8 3.2 1.6 0.6
1998 31.0 5.9 3.5 1.1 0.1
1999 38.0 2.4 3.6 1.4 1.9
2000 37.0 0.6 3.5 2.2 2.0
2001 30.0 2.3 2.9 1.9 1.2
2002 29.0 1.5 3.5 1.2 1.2
2003 26.0 0.5 3.1 0.9 1.2
2004 23.0 0.4 1.9 0.4 1.4
2005 18.0 1.5 4.1 0.2 0.5
2006 26.0 0.9 0.8 0.2 0.4
Source: Information and Documentation System Unit, Ministry of Health Malaysia

86 Director General Technical Report ( DGTR )
In 2002, an outbreak of cholera was reported in one primary school in Kelantan, with 46 cases and 1 death. The primary source of the outbreak was traced to a contaminated open well. In 2004, 72 cases of cholera were reported from 2 outbreaks in Kedah. Contaminated food was identified as a source.
The incidence rate of cholera was greater among non-Malaysian. In 2005 the incidence rate among non- Malaysian was 12.46/100,000 compared to 1.27/100,000 for Malaysian while in 2006, the incidence was 3.21/100,000 and 1.27/100,000 respectively. Among the non-Malaysians, 92% of the cases were Philippinos followed by Bangladeshis (7%), Indian 6.5%) and other nationalities (8%).
Table 2 : Incidence of Cholera (per 100,000 population), Malaysia by States, 2002 - 2006
YearStates 2002 2003 2004 2005 2006
Sabah 13.66 4.59 3.62 0.48 12.27
Sarawak 0.05 0.00 0.86 0.00 0.00
Perlis 0.00 0.00 0.00 0.00 0.00
Kedah 0.06 1.03 0.06 3.81 0.00
P.Pinang 0.07 1.01 0.00 0.00 0.00
Perak 0.09 0.37 0.32 0.00 0.00
Selangor 3.14 2.55 0.00 0.02 0.34
W.P 0.93 0.20 0.13 0.07 0.00
N.S 0.00 0.00 0.00 0.00 0.00
Melaka 3.24 0.00 0.00 0.00 0.00
Johor 0.00 0.00 0.00 0.00 0.00
Pahang 0.91 0.15 0.07 0.07 0.00
T'ganu 0.00 0.53 0.00 0.00 0.00
Kelantan 0.07 4.98 0.07 0.20 0.00
Source: Information and Documentation System Unit, Ministry of Health Malaysia
Typhoid
The incidence of typhoid has steadily declined in most states except Kelantan which had a major outbreak lasting for 3 months in 2005 (Figure 1).
As in the case of cholera, typhoid infection occurs in areas where safe water supply and sanitation, food handling and personal hygiene practices are inadequate.

87Director General Technical Report ( DGTR )
The incidence of typhoid in Kelantan had always been higher compared to other states (Table 3). Inadequate safe water supply was a major contributing factor. In March 2003, 128 typhoid cases were reported in Bachok district, Kelantan. This was found to be associated with contaminated well water. In the 2005 outbreak (April - June 2005), 735 cases were reported with 2 deaths. The majority of cases were detected in Kota Bharu, Tumpat and Bachok districts. The source of infection could not be ascertained. However, contaminated ice and ready-to-eat (RTE) food distributed to street hawkers and night markets were very much suspected. At that time, the safe water supply coverage in the state was only 81.8% compared to other states with coverage of between 94.1% to 100%.
Table 3 : Incidence of Typhoid/Paratyphoid (per 100,000 population) in Malaysia By States, 2002 - 2006
Sabah 8.80 6.29 5.54 2.06 1.30 Sarawak 1.66 1.08 1.50 0.69 0.47
Perlis 0.00 0.46 1.36 0.00 0.44 Kedah 1.78 1.80 1.16 1.00 1.00
P.Pinang 0.65 0.21 0.35 0.61 0.20 Perak 1.80 1.32 1.08 0.80 0.57
Selangor 0.82 0.62 1.08 1.00 1.00 W.P 1.29 0.67 0.78 0.13 0.13 N.S 1.34 0.44 0.43 0.74 0.00
Melaka 0.45 0.29 0.29 0.14 0.28 Johor 1.07 0.68 0.46 0.39 0.28
Pahang 0.59 1.46 0.64 0.84 0.14 T'ganu 2.44 7.25 3.23 0.79 0.86 Kelantan 24.78 24.78 7.50 58.91 4.90
YearStates 2002 2003 2004 2005 2006
Source: Information and Documentation System Unit, Ministry of Health Malaysia
Further description of cases by ethnicity showed that in 2005, Malays had the highest rate of infection at 6.52/100,000 population, compared to Chinese (0.34/100,000) and Indian (0.55/100,000). This was expected as the major outbreak in 2005 happened in Kelantan which has a predominantly malay population (85%). Non-Malaysians recorded a rate of 2.21/100,000 population and other Malaysian peribumis at 2.13/100,000 population.

88 Director General Technical Report ( DGTR )
In 2006, the year without any major outbreak, the incidence rate among Malays was 1.07/100,000, Chinese (0.24) and Indian (0.27) while non-Malaysians recorded a rate of 1.42/100,000 and other Malaysian peribumis (1.54/100,000).
Among Non-Malaysians, the majority of cases were Nepalese (37.7%), followed by Indonesian (19.1%), Philipinos (18.0%), and Bangladeshi (13.1%).
Cases by Age group and Occupation For the 2005-2006 cases, most of the typhoid cases reported were among the younger school-going age group of 5-19 years.
Figure 3 : Proportion of Typhoid Cases By Age Groups in Malaysia, 2005 and 2006.
0.0
0.1
0.2
0.3
0.4
0 - 4
5 - 9
10 -
14
15 -
19
20 -
24
25 -
29
30 -
34
35 -
39
40 -
44
45 -
49
50 -
54
55 -
59
60 -
64
65 -
69
70 -
74
75 -
79 80
Age groups (years)
Pro
port
ion
of C
ases
2005
2006
Source: Information and Documentation System Unit, Ministry of Health Malaysia
Food Poisoning
The incidence of food poisoning has been on the decline from 1999 but there was a sudden increase in 2006, following an administrative directive for district health offices to register all cases of food poisoning detected in every episode of outbreak investigation (Figure 4).

89Director General Technical Report ( DGTR )
In 2005, the majority of food poisoning cases occurred in schools (53.4%) followed by institutions (15.9%) and private residences (11.5%). Similar pattern was observed in 2006, where 62.7% occurred in school, followed by (12.8%) and private residences (8.5%) (Table 4).
As expected, the school going age group posed greater risk compared to the other age groups (Figure 5).
In 2005 and 2006, Malays posed the greatest risk for food poisoning compared to other ethnic groups. The incidence rate among the Malays in 2005 was 27.1 per 100,000 population, followed by Indian (8.67) and others (4.49 per 100,000 populations). In 2006, the incidence rate among Malays was 46.9 per 100,000, followed by Indian (8.9 per 100,000) and Chinese (4.73 per 100,000).
An analysis of 149 episodes of food poisoning in 2006 showed that unsanitary food premises and poor hygienic practices among food handlers during food preparation contributed about 40% of episodes reported in that year. Another important factor was prolonged holding time of food at room temperature or foods being served more than 4 hours after they had been cooked. This contributed to 28% of all episodes reported.
Figure 4 : Incidence of Food Poisoning in Malaysia, 1996 to 2006
Source: Information and Documentation System Unit, Ministry of Health Malaysia
Sabah 8.80 6.29 5.54 2.06 1.30 Sarawak 1.66 1.08 1.50 0.69 0.47
Perlis 0.00 0.46 1.36 0.00 0.44 Kedah 1.78 1.80 1.16 1.00 1.00
P.Pinang 0.65 0.21 0.35 0.61 0.20 Perak 1.80 1.32 1.08 0.80 0.57
Selangor 0.82 0.62 1.08 1.00 1.00 W.P 1.29 0.67 0.78 0.13 0.13 N.S 1.34 0.44 0.43 0.74 0.00
Melaka 0.45 0.29 0.29 0.14 0.28 Johor 1.07 0.68 0.46 0.39 0.28
Pahang 0.59 1.46 0.64 0.84 0.14 T'ganu 2.44 7.25 3.23 0.79 0.86 Kelantan 24.78 24.78 7.50 58.91 4.90
YearStates 2002 2003 2004 2005 2006

90 Director General Technical Report ( DGTR )
Hepatitis A
The incidence rate for hepatitis A decreased dramatically over the past 10 years, with no marked difference between states or ethnic groups.
As shown in Figure 6, most of the hepatitis A cases were among the adult population with a mean age of 34.8 in 2005 and 33.5 in 2006. Cases were mainly detected in sporadic common source outbreaks.
Table 4 : Food Poisoning Cases By Place of Occurrence, 2005 - 2006
Year of Episode
2005 2006 Total
436 499 935 Isolated cases 9.70% 7.00% 8.00%
2390 4496 6886 School
53.40% 62.70% 59.10%
713 916 1629 Institution
15.90% 12.80% 14.00%
514 613 1127 Private Residency 11.50% 8.50% 9.70%
38 19 57 Factory/ Company 0.80% 0.30% 0.50%
Hotel/ Resort
58 38 96
1.30% 0.50% 0.80%
280 500 780 Camp
6.30% 7.00% 6.70%
19 7 26 Quarters
0.40% 0.10% 0.20%
27 86 113
Location Type
Others 0.60% 1.20% 1.00%
Total 4475 7174 11649
Source: Information and Documentation System Unit, Ministry of Health Malaysia

91Director General Technical Report ( DGTR )
Figure 5 : Age specific rate of Food Poisoning in Malaysia, 2005 and 2006
Dysentery
The incidence of dysentery has been low with no marked changes in the incidence over the past 10 years. The highest incidence rate was 2 per 100,000 population recorded in 2000.
In 2005 and 2006, children less than 5 year of age and elderly more than 65 years old had greater risk of dysentery (Figure 7). There is no risk difference between ethnic groups.
Figure 6 : Box Plot Age Distribution of Hepatitis A, Malaysia, 2005 and 2006
0 -
4
5 -
9
10 -
14
15 -
19
20 -
24
25 -
29
30 -
34
35 -
39
40 -
44
45 -
49
50 -
54
55 -
59
60 -
64
65 -
69
70 -
74
75 -
79
Age Groups
Atack Rate (per 100,000)
140.00
120.00
100.00
80.00
60.00
40.00
20.00
0.0
20062005
542005
Year
124
30
17
N =
100
80
60
40
20
0
-20
Age
862006
Source: Information and Documentation System Unit, Ministry of Health Malaysia

92 Director General Technical Report ( DGTR )
Discussion
The incidence of foodborne diseases in Malaysia has shown great improvements over the years. This is attributed to improvements in living standards where socio-economic development has bought about improvements in basic infrastructures, in particular, safe water supply. Improvements in educational status of its population also play an important role.
The trend for cholera however, is rather unpredictable with outbreaks and sporadic cases reported each year. For instance, the incidence of cholera had steadily declined from 1998 to 2000 but this trend was broken in 2001, with outbreaks occurring in Selangor and Melaka5. Outbreaks in a few non-traditional areas in 1995 and 1996 also resulted in dramatic increase in incidence of cholera in these years as reported by T Meftahudin in 20026.
Typhoid incidence in this country is relatively low and confined to a few areas. Crump et al (2004) classified overall regional typhoid fever rates into high (>100,000 case/year), medium (10 - 100/100,000 case/year), and low (<10 - 100/100,000 case/year)4. In his research, incidence was calculated for the overall population by extrapolation using appropriate age-incidence curve as shown in figure 10, using either data from published studies, national surveillance data or neighbouring countries. Surprisingly, although the annual
Figure 7: Age Specific Rate of Dysentery in Malaysia, 2005 and 2006.
0.00
2.00
4.00
6.00
8.00
10.00
12.00
0 -
4
5 -
9
10
- 1
4
15
- 1
9
20
- 2
4
25
- 2
9
30
- 3
4
35
- 3
9
40
- 4
4
45
- 4
9
50
- 5
4
55
- 5
9
60
- 6
4
65
- 6
9
70
- 7
4
75
- 7
9
Atta
ck R
ate
(per
100
,000
)
Age groups (years)
2005
2006

93Director General Technical Report ( DGTR )
incidence of typhoid fever in Malaysia for the past 10 years has been consistently lower than 5/100,000 case/year, Malaysia is grouped under the region with high incidence. Rightly, the distribution of typhoid fever by age group in Malaysia (Figure 3) ought to be in the medium to low endemic region (Figure 8).
Figure 8 : Distribution of typhoid fever by age group, at various incidence
0.0
0.1
0.2
0.3
0.4
0 - 4
5 - 9
10 -
14
15 -
19
20 -
24
25 -
29
30 -
34
35 -
39
40 -
44
45 -
49
50 -
54
55 -
59
60 -
64
65 -
69
70 -
74
75 -
79 80Age groups (years)
Pro
po
rtio
n o
f C
ases
High (>100 per 100 000 per year)
Medium (10 per 100 000 per year)
Low (<10 per 100 000 per year)
The overall ratio of typhoid fever caused by S. typhi to that caused by S. paratyphi is about 10 to 1. The proportion of S. paratyphi infection is increasing in some parts of the world1. In 2006, 96.8% infections were due to S. typhi, followed by S. paratyphi B (2.5 %) and S. paratyphi A (1.3%). Prior to 2006, data on S. typhi and S. paratyphi had been aggregated into S. typhi/paratyphi.
The separation of S. typhi from S. paratyphi is important as the public health consequence of both infections are different. Some 1 to 5% of patients infected by S typhi become chronic carriers. Although the percentage is relatively low, it can be potentially dangerous if these carriers are food handlers. To overcome this, every typhoid case in this country has to be followed up for at least 12 months after the infection. During the follow up, stool samples are taken to test for S. typhi7.
Source: Crump et al 2004

94 Director General Technical Report ( DGTR )
The overall incidence of hepatitis A is relatively low. Geographic areas are characterized by high, intermediate or low levels of endemicity patterns of Hepatitis A infection8. The level of endemicity is associated with hygienic and sanitary conditions of each geographic area. In areas of high endemicity like parts of Africa, Asia, Central and South America, where sanitary and hygienic conditions are still poor, infection is usually acquired during early childhood as an asymptomatic or mild infection. Adults are usually immune and endemics of Hepatitis A are uncommon. The incidence may reach 150 per 100,000 per year.
In areas of moderate endemicity, mostly developing countries like Southern and Eastern Europe, and some regions in the Middle East, better living standards may lead to a higher incidence with infections occurring among older age groups.
In developed countries like Northern and Western Europe, Japan, Australia, New Zealand, USA, Canada where there is good sanitary and hygienic conditions, infection rates are generally low. In countries with very low HAV infection rates, the disease may occur among specific risk groups such as travellers. Malaysia can be considered as low to moderate endemicity for hepatitis A due to good hygiene and sanitary conditions in most parts of the country, and also the epidemiology of the disease.
This report is based on cases reported in the national surveillance system. Although foodborne diseases are common in the country, it is suspected that only a fraction of them are being reported. Notification is a process which must be initiated by the attending doctor. Failure on the part of the doctor and any break on the chain of events in the process would result in a case being not notified.
Preventing foodborne diseases is a multifactorial process, with no simple or universal solutions. It is essential to understand the underlying mechanisms by which contamination and disease transmission occur in order to interrupt the chain of events9. Public health challenges of foodborne diseases are changing as a result of newly identified pathogens and vehicles of transmission; changes in food production and distribution; and an apparent decline in food safety awareness. Meeting these complex challenges requires collaboration and coordinated effort of multiple regulatory agencies, service providers and food producers. The lack of reliable data on

95Director General Technical Report ( DGTR )
the burden of foodborne diseases impedes understanding on its public health importance10. New surveillance strategies need to be developed to monitor the incidence of human illness within the food chain, and developing effective prevention strategies.
The proposed national active surveillance of foodborne diseases called MyFoodNet would address some of the challenges posed11. It is aimed at strengthening and enhancing existing foodborne disease surveillance and food contaminants data collection system. Data and information are collected from all sectors dealing with foodborne disease surveilance and food safety. This would assist in determining the true dimension of the burden of foodborne diseases in the country and support the development of evidence-based disease prevention and control activities. It would also improve the ability to link pathogen in the food to disease in humans.
Coordinated enforcement activities need to be strengthened to lower the risk of foodborne diseases. Training and capacity building are essential for the development of technical expertise while infrastructure improvements for high risk areas have to be looked into.
Measures to strengthen national capacity and infrastructure for laboratory based surveillance need to be addressed as well. Ultimately, this networking system could link with regional and international networking systems and help to facilitate timely recognition of emerging foodborne diseases and their early interventions.
96 Director General Technical Report ( DGTR )
1. WHO. 2002. Method for Foodborne Disease Surveillance in Selected Sites. Report of a WHO Consultation, 18-21 March 2002, Leipzig, Germany. WHO/CDS/CSR/EPH/2002.22
2. FoodNet Working Group, CDC. News and Notes. 1997. Emerg Inf Dis. Vol. 3, No. 4, Oct-Dec 1997. Pg. 581-583.
3. MOH. Annual Report 2005, The Ministry of Health Malaysia. MOH; 2006.
4. John A Crump, Stephen P. Luby & Eric D Mintz. 2004. The Global Burden of Typhoid Fever. Bulletin of WHO. 82 (5).
5. W Mansor Hamzah, Hanif Zailani (Editor). 2006. Garispanduan Pengurusan Wabak Penyakit Kolera Edisi 2 (FWBD/CHO/GP/001 (pindaan 2006). MOH; 2006: (November 2006).
6. T Meftahudin. 2002. Review of the trend and causes of food borne outbreak in Malaysia from 1988 to 1997. Med J Malaysia; 2002: 57 (1): (March 2002).
7. W Mansor Hamzah, Hanif Zailani (Editor). Garispanduan Pengurusan Wabak Penyakit Typhoid Edisi 2 (FWBD/TYP/GP/001 (pindaan 2006). MOH; 2006: (November 2006)
8. WHO. 2000. Department of Communicable Disease Surveillance and Response. 2000. Hepatitis A. WHO/CDS/CSR/ EDC/2000.7.
9. Lim VKE. 2004. Foodborne Diseases in Malaysia: Editorial. Med J Malaysia. 57 (1), Mar 2002
10. WHO. 2007. WHO Fact sheet No237, Revised March 2007. Available at: http://www.who.int/mediacentre/factsheets/fs237/. (Accessed on 20 April 2007)
11. MOH (Nirmala Amplavanar, Hanif Zailani). 2004. Foodborne disease surveillance at national level: Malaysia perspective, preceding for FAO/WHO Second Global Forum of Food Safety Regulators, Bangkok Thailand, 12 - 14 October 2004.
12. MOH (Nirmala Amplavanar, Hanif Zailani). 2004. Foodborne disease surveillance at national level: Malaysia perspective, preceding for FAO/WHO Second Global Forum of Food Safety Regulators, Bangkok Thailand, 12 - 14 October 2004.
Bibliography

97Director General Technical Report ( DGTR )
13. Bhuttta Zulfiqar A Husein. 2006. Current Concept in The Diagnosis and Treatment of Typhoid Fever. British Medical Journal. 333:7558. July 2007.
14. WHO. 2003. Background document: The diagnosis, treatment and prevention of typhoid fever. WHO/V&/03.07

98 Director General Technical Report ( DGTR )
CONTROL OF PSYCHOTROPIC SUBSTANCES IN MALAYSIA : BALANCING THE DEMAND AND SUPPLY
SUMMARY
The scenario of psychotropic substances abuse and diversion in Malaysia is on the rise and alarming. Even though legislations and control programmes are in existence, the problems still persist. Enforcement of the laws which governs the psychotropic substances by the relevant authorities were still inadequate to curb the problems. Furthermore harm reduction programme which includes using substitution drugs to treat addiction had lead to increase demand and oversupply of psychotropic substances especially involving medical practitioners. Licensing to the handler of the psychotropic substances is the only solution which later can lead to other important measures in order to balance demand and supply of the psychotropic substances.
Psychotropic substances abuse in Malaysia
Introduction
Drug-related problems are still the number one menace and posed a serious threat to the health and well-being. Problems associated with substance abused and diversion were found to cause harm to individuals,
families, and communities. Factors that influence drug use are very complex and not easy to understand. It is believed it involves a combination of both individual and social factors. Increased availability and substances used not for medical purposes is a contributing factors for substance abuse.
The patterns and problems of abuse and diversion of psychotropic substances among abusers and by practitioners is difficult to explain because it is not well documented. Practitioners usually found involved in supplying to generally three types of people. The first type are genuine patients who are in need to alleviate their medical problems. The second type is drug abusers who are addicted to psychotropic substances. The last type is a ‘criminal’ who obtain psychotropic substances for their monetary gain.
Drugs abusers always obtain excessive quantities of psychotropic substances by inducing the practitioners. They are also found to go from one clinic to another to get the supply. Their target clinics

99Director General Technical Report ( DGTR )
Legislation
Control programmes
were practitioners who are known for supplying the substances on demand or without adhering to the existing laws.
Control of psychotropic substances
Controlling the use of psychotropic substances for legitimate purposes has become an important subject to international and national regulations. Since 1971, Malaysia had the awareness of controlling of psychotropic substances for legitimate purposes. Subsequently in 1989 a specific regulation by the name Poisons (Psychotropic Substances) Regulations 1989 was gazetted to meet the international obligations under the Convention on Psychotropic Substances 1971.
The effectiveness of controlling of psychotropic substance depends on having the necessary legislations and the administrative systems. This includes a control programme to monitor, inspect and investigate the importation, manufacturing and distribution of the substances. The control programme not only meant to prevent abuse and diversion, but it shall not diminish the medical usefulness of the psychotropic substances.
The control programme corrolates with the supply of psychotropic substances. For the past three years, (2004 to 2006) there were three groups of psychotropic substances which were on the rise. The groups were Benzodiapines (minor tranquillizer), followed by Barbiturates (hypnotic) and Phentermine (weight loss) [Figure 1]. Among the benzodiazepines group it was found Midazolam as the substance that has been most supplied and followed by Diazepam [Figure 2]. Focus of the control programmes were on these three groups. The outcome of the focus resulted on enhancement of monitoring on activities of importation, manufacturing and distribution of the substances.
In order to prevent abuse and diversion of psychotropic substances, diversion investigations on practitioners were conducted by the Pharmaceutical Services Division (PSD), Ministry of Health Malaysia. In 2006, 132 clinics were investigated and it was found that State of Johore and Pahang had the most problems [Figure 3]. These two states were found to have the most supply of psychotropic substances due to the increase demand not for medical treatment.

100 Director General Technical Report ( DGTR )
Enforcement
PSD has also implemented the Quota System which is able to estimate the quantity of importation of psychotropic substances into the country. Since 2005 it has enforced to limit the number of wholesalers that dealt with psychotropic substances.
Three law enforcement agencies; The Royal Malaysian Police (RMP), Royal Malaysian Customs (RMC) and Pharmaceutical Services Division (PSD) were the authorities responsible for enforcing the Poisons (Psychotropic Substances) 1989 in Malaysia.
Figure 1 : Supply of Psychotropic Substances in kilogram
Source : Pharmaceutical Services Division
2006
2005
2004
500
450
400
350
300
250
200
150
100
50
0
Bupre
norp
hine
Zolpide
m
Zolpicl
one
Benzo
diaze
pines
Barbit
urat
es
Phent
erm
ine

101Director General Technical Report ( DGTR )
Figure 2 : Supply of Benzodiazepines in kilogram
Source : Pharmaceutical Services Division
2004 2005 2006
300
250
200
150
100
50
0
Clonaz
epam
Diazep
am
Fluraz
epam
Alpraz
olam
Brom
azep
am
Clobaz
am
Triazo
lam
Lora
zepa
m
Mida
zolam
Nitraz
epam
In 2004, 682,936 psychotropic substances pills had been seized throughout the nation; the seizures increased to 763,526 pills in 2005. However the figure dropped was drastically to 198,689 pills in 2006. This drastic dropped was due to the increased trend of abuse for Amphetamine Type Stimulants (ATS) [Table 1].
Figure 3 : Diversion Investigations on Private Clinic Conducted By States in 2006
Source : Pharmaceutical Services Division
20
18
16
14
12
10
8
6
4
2
0
2
Perlis
Kedah
Penan
g
Perak
WPKL
Selang
or
N Sem
bilan
Mela
kaJo
hor
Pahan
g
Teren
ggan
u
Kelant
an
Sabah
Saraw
ak
12
78
17
13
8
6
1919
7
4
6
4

102 Director General Technical Report ( DGTR )
Table 1 : Comparison of Drugs Seized 2004 to 2006
Source: Anti Drugs Agency, Prime Minister Department
20
18
16
14
12
10
8
6
4
2
0
2
Perlis
Kedah
Penan
g
Perak
WPKL
Selang
or
N Sem
bilan
Mela
kaJo
hor
Pahan
g
Teren
ggan
u
Kelant
an
Sabah
Saraw
ak
12
78
17
13
8
6
1919
7
4
6
4
Beside controlling precursor chemicals for producing dangerous drugs, PSD also is also the national competent authority in controlling the legimate use of dangerous drugs and psychotropic substances. Practitioners are allowed to supply psychotropic substances for medical purposes provided they follow strictly to the Poisons (Psychotropic Substances) Regulations 1989. Although most were are law abiding, they were a few found supplying over the counter (contravention to Regulation 11), not maintaining records (contravention to Regulation 22), and not keeping psychotropic substances under lock and key (contravention to Regulation 24). In 2004, most were caught having these three offences but in 2006, offences for not maintaining records were on the rise [Figure 4].

103Director General Technical Report ( DGTR )
Total abstinence versus harm reduction
Factors associated with high demand
Factors associated with pharmaceutical industries
Figure 4 : Psychotropic Substances Type of Offences According to Poisons (Psychotropic Substances) Regulations 1989, 2004 to 2006
Source: Pharmaceutical Services Division
Balancing the Demand and Supply
Since 1987, Malaysia started a total abstinence approach to combat the drug problems. Rehabilitation centers were constructed with the aim of treating drug addicts. In addition to further strengthen drug control programme, harm reduction components were being introduced. The aim of harm reduction is to overcome the HIV/AIDS problems as well as gradually reduce the abuse towards opiates.
The high demand for psychotropic substances has created a highly profitable business. The psychotropic substances from legitimate source were heavily sought for reasons that they were guaranteed of their safety, quality and efficacy. Furthermore the cost of obtaining the substances from clinics was far less compared to their cost from the illegal sources. From PSD experiences the factors above were the main contributors for the high demand of psychotropic substances especially involving practitioners.
The existence of continuous aggressive sales methods by pharmaceutical industries may be a sign of inadequate control programme by the authorities. Activities like importation, manufacturing and distribution of psychotropic substances are supposed to be highly regulated. However, small quantities with frequent purchases are being practiced in order to boost up the sale
18
16
14
12
10
8
6
4
2
0
2006
2005
2004
Section 11 Section 22 Section 24

104 Director General Technical Report ( DGTR )
Strategies to balance demand and supply
of psychotropic substances. To worsen the problems, psychotropic substances are now easily available through Internet sales by a wide range of companies outside Malaysia.
In the existing laws, the medical practitioners enjoy a great degree of professional freedom and discretion to determine the choice of psychotropic substances to be prescribed to their patients. Through the PSD finding some were involved in unlawful practices which includes supply not for medical treatments, failure to maintain records and not having proper storage.
The oversupply of psychotropic substances was also attributed by the use of multiple drugs in irrational combinations. Some practitioners where found to mix combination of buprenorphine with benzodiazepines to boost the drug effect as well as to increase profit.
Licensing the person handling psychotropic substances is an effective measure. A collaborative effort is needed to promote the appropriate handling of psychotropic substances while at the same time curbing their abuse and diversion among all parties.
A database system can be developed which allows the practitioners and the authorities to check for multiple-doctoring, polypharmacy and over prescribing. Having adequate information will help authorities to enhance their capacity to investigate and take necessary action.
Conclusion
Psychotropic substances abuse and diversion involving medical practitioners will continue to be a problem if it is not being addressed properly. The need for a control programme is important to balance the demand and supply of psychotropic substances. Effective strategies will have to be introduced and implemented to achieve the objectives.

105Director General Technical Report ( DGTR )
1. Agensi Anti Dadah Kebangsaan, Buletin Dadah 2006, http://www.adk.gov.my
2. Balance is the central principle, http://www.medsch.wisc.edu
3. Ghogse H, Franquet J, Schaepe H, A question of balance: the overconsumption and unavailability of internationally controlled drugs,
http://www.onlineopinion.com.au
4. Model reference guide for health professionals: Prevention and detection of abuse of nacotics and controlled substances and their diversion to illicit channels,
http://www.cicad.ooas.org
Bibliography

106 Director General Technical Report ( DGTR )
ELIMINATION OF MALARIA AS A PUBLIC HEALTH PROBLEM IN MALAYSIA : PROSPECT, OPPORTUNITIES AND CHALLENGES.
SUMMARY
The history of Malaria control in the country started with the establishment of the Malaria Advisory Board in 1911 and since then Malaysia has been quite successful in controlling Malaria as a public health problem. Malaria cases has dropped from about 300,000 cases annually before the implementation of the Malaria Eradication Programme in 1967 to about 5,000 cases over the last 3 years. The epidemiology of Malaria has also changed indicating success of control and Malaysia is moving away from endemic status. With a good and efficient health care delivery system and continuing improvement in socio-economic status, there is a great opportunity to eliminate Malaria as a public health problem in the country. Nevertheless, programme managers must be alerted to challenges and constraints in achieving this goal. The greatest challenge is complacency. Others include the problem of drug resistance, increasing case fatality, declining experience and expertise, outbreaks of Malaria due to influx of foreign workers from malarious countries and increasing incidence of infection by Simian Malaria. To achieve elimination of local transmission and thus eliminating Malaria as a public health problem, programme managers must continue to sustain control activities and be able to carry out assessment of the potential problems. Innovative, cost-efficient and sustainable measures must then be put in place to mitigate the identified problems. We will be approaching 100 years of Malaria control in 2011 but will Malaria remain? The choice is ours.
Infecting species
Introduction
Malaria is both an acute and chronic disease caused by protozoa of the genus Plasmodium. Four species cause human Malaria: P. falciparum , P. vivax, P. Malariae and P. ovale. The first 3 species are endemic
in Malaysia. P.ovale although generally not endemic in this country, has been reported twice before among the aborigines. Malaria in Malaysia is largely a problem in the rural areas. True urban Malaria transmission in Malaysia is non existence although pockets of peri-urban Malaria outbreaks have been reported recently.

107Director General Technical Report ( DGTR )
The Pinang fever
Malaria Advisory Board
Malaria Eradication Program
Vector-borne Diseases Control Programme
Development of Malaria Control Programme
We do not know when Malaria first came to Peninsular Malaysia. However, it entered into the Malayan history when the first British settlement was founded on the Island of Penang in 1786. Described as the “Pinang Fever” then, the story was one which we now know about Malaria epidemic. Felling of trees in the foothills and valleys followed by influx of non-immune settlers, epidemic of “fever” (Malaria) came as a disastrous and almost inevitable sequel. It was not known until 1900 when Hamilton Wright did the first systematic studies of Malaria in Peninsular Malaysia and Malcom Watson (Sir) 2 years later leaves no doubt that the species which caused Malaria in Europe, occurred also in Malaya and behaved essentially the same way.
The problem of “tree felling” and Malaria epidemics continues in the modern era of British occupation. With the rapid growth of rubber industry in the preceding 10 years, the number of cases increases alarmingly in 1910, not only in the rural villages but also in the hilly residential area of Kuala Lumpur where the colonial masters resided. The situation was so alarming that an advisory body with powers to co-ordinate and direct Malaria control was recommended. This resulted in the setting up of the Malaria Advisory Board in November, 1911 and marked the first coordinated and concerted effort on Malaria control in the country.
Malaysia in general has achieved significant success in the control of Malaria as a public health problem. Before 1960, there was no proper record of the number of Malaria cases detected in the country. The number of cases was estimated to be about 300,000 annually before the implementation of the eradication programme. At the start of the Malaria Eradication Programme (MEP) in Peninsular Malaysia in 1967, there were more than 150,000 cases being reported from static and mobile clinics throughout Peninsular Malaysia. Although the MEP has failed to achieve it’s objective of complete eradication of the disease by 1982, the programme has no doubt contributed significantly in bringing down the number of cases to about 50,000 cases in 1970. More importantly, MEP has laid down the solid foundation in terms of infrastructure and control strategies for the subsequent Anti-Malaria Programme (AMP) and the very much-integrated existing Vector-borne Diseases Control Programme (VBDCP) in 1985.

108 Director General Technical Report ( DGTR )
Malaria in Malaysia is Malaria in Sabah
Changing Malaria epidemiology
Continued vigilant effort on the part of the Ministry of Health and improved access to sustainable effective control measures especially in the state of Sabah, brought down further the number of cases to around 10,000 cases a year beginning 2000. The achievement in Sabah is particularly remarkable. In 1980’s when the incidence of Malaria in Peninsular Malaysia and Sarawak have remained constant at about 10 per 10,000 population, it was between 100 to 400 per 10,000 population in Sabah. The significant reduction in cases was brought about by the concerted and more focused effort in controlling this infection. The Federal Government provided about RM4.5 million through a New Policy budget in 1995 to enhance Malaria control programme in the state. Overall, the incidence rate of Malaria has decline from as high as 25 per 10,0000 population in 1991 to about 2.16 per 10,000 population in 2006 (Figure 1).
Figure 1 : Number of Malaria Cases in Malaysia and Sabah, 1990 - 2006
Source: Vector-borne Diseases Control Programme, MOH, Malaysia
0
10000
20000
30000
40000
50000
60000
70000
90 91 92 93 94 95 96 97 98 99 20002001
20022003
20042005
2006
Malaysia Sabah
Num
ber
of c
ases
Elimination of Transmission: Prospect and Opportunities
The prospect of eliminating Malaria as a public health problem in Malaysia looks bright. Through effective, coordinated and concerted strategies, many endemic areas have been freed of Malaria, including the logistically difficult interior Orang Asli (aboriginal) settlements in Peninsular Malaysia. The number of cases over the last three years has averaged at around 5,000 cases annually. By simple logic, if we were able to bring down ten of thousands of cases to the current level in just a decade, it will not be impossible to eliminate Malaria as a public health problem in another decade. The epidemiology of Malaria in Malaysia is also changing, which indicates the success of the Malaria control program and provide the evidence of declining Malaria transmission.

109Director General Technical Report ( DGTR )
P.vivax is dominant over P. falciparum
Lost of age-group endemic profile
Changing Dominant Parasite Species
There has been a change in the proportion of the infecting species. P. falciparum which is associated with the more severe form of the infection and the principle cause of death due to Malaria, used to be the dominant species in the country until the year 2000. However, P. vivax has outnumbered P. falciparum for the first time in the history of Malaria in Malaysia in 2001 (Figure 2) and continues to be the dominant species there after. This trend is significant as the changing pattern of dominant species reflects the effectiveness and sustainability of the control strategies in interrupting the transmission of Malaria, where absence of hypnozoites prevent the occurrence of relapse in P. falciparum. P. vivax on the other hand, may relapse because of the presence of hypnozoites in the liver, which requires long course (14 days) of primaquine treatment.
Figure 2: Changes in the Dominant Infecting Malaria Species in Malaysia
Source: Vector-borne Diseases Control Programme, MOH
0
10
20
30
40
50
60
70
80
90 91 92 93 94 95 96 97 98 9920
0120
0220
0320
0420
0520
06
%
P. falciparum P.vivax
Population at Risk
There is a significant change in the population at risk of acquiring Malaria infection over the last 3 decades. In 1980’s and 1990’s, the distribution of cases showed the typical age distribution of endemic Malaria with large proportion (>50%) of children (<10 years old) getting the infection (Figure 3). In endemic traditional villages, the infection increases with age in children, then declining in young adult due to acquired immunity. Over representation of older adult during those years were due to occupational exposure from agricultural plantation and lumbering activities in a rapidly

110 Director General Technical Report ( DGTR )
developing Malaysia. However in 2006, the typical endemic pattern is totally lost and more than 80% of the cases were adult, largely associated with occupational (plantation and lumbering) and recreational exposure. Transmission in traditional villages has largely been interrupted.
Figure 3 : Age Distribution Of Malaria Cases over 3 Decades in Malaysia.
Source: Vector-borne Diseases Control Programme, MOH, Malaysia
0
10000
20000
30000
40000
50000
60000
70000
90 91 92 93 94 95 96 97 98 99 20002001
20022003
20042005
2006
Malaysia Sabah
Num
ber
of c
ases
Opportunities
Evidence-based integrated programme
Accessible comprehensive health care system
Ample resources
With the number of Malaria cases at it lowest level, there is now the opportunity to completely interrupt the transmission of Malaria in the country. The control program adopted by the MOH adopted the best strategy which is evidence-based, coordinated and integrated in terms of organisation (intra- and inter-sectoral approach) and strategies (multi-prong approach targeting at the parasite and the vector while protecting the host). We have among the best health care system and infrastructures which are readily accessible to the general population. This has facilitated the fundamental control strategies of early case detection and treatment. We have an excellent secondary and tertiary referral system of district and state/national hospitals to manage complicated cases so as to prevent Malaria mortality. We have the resources to ensure that population at risk, particularly in rural areas, are protected from mosquito bites through the provision of insecticide-treated bed-net and residual spraying, where in some countries, they are still struggling with the best practices and delivery systems. As the country continues to prosper socio-economically, the control program is more sustainable and thus, our potential to achieve complete interruption of Malaria transmission also increases.

111Director General Technical Report ( DGTR )
Complacency is enemy No. 1
Anopheles without Malaria
Drug resistant not new
Evidence of resistant P. vivax
Resistance SurveillanceProgramme
Challenges
In our thrust towards complete interruption of local Malaria transmission, we must be alert on the challenges that may hinder or delay the achievement of the goal. The greatest challenge is complacency. Experience showed that when control measures take a complacent approach and Malaria take a back seat in national setting priority because of declining Malaria cases, Malaria resurges very quickly. This is because in most Malaria endemic areas, the mosquito vector will remain although transmission has been interrupted through parasite source reduction (treatment of cases). It is practically difficult, and in some areas, almost impossible to eradicate Malaria vector, such as in remote forested areas. Thus the concept of Anopheles without Malaria in most Malaria control programme. Therefore, program managers must continue to keep vigilance of the potential of Malaria re-appearing again after successful control of the problem.
Drug resistance
One of the important strategies in interrupting the Malaria transmission is through parasite source reduction in infected individuals through the use of effective anti-Malarial drugs. It has been acknowledged that the development and spread of drug resistant parasite poses the greatest challenge in Malaria control. Drug resistant falciparum Malaria is not new in Malaysia. First reported by Motgomery and Elyes in 1963, the problem of resistant falciparum Malaria has risen steadily over the years. Hakim et al. (1996) reported a resistance rate of 63% and 47% to chloroquine (CQ) and sulfadoxine-pyrimethamine (SP), respectively. More significantly, although the total resistance rose marginally compared to that reported by McKelvy et al (1971), the proportion of severe resistance (grade RII/RIII) increased markedly from 4.2% to 54.2% in 1997 (Table 3).
At University Hospital, 80% of falciparum cases developed resistance to CQ and there was evidence of resistance of P. vivax in 10% of the cases, mainly among migrant workers. The National Anti-Malaria Response Surveillance Programme launched in 2003 and coordinated by the Institute for Medical Research, provided more evidence of this in-vivo resistance. Seventeen sentinel sites in Peninsular Malaysia, Sabah and Sarawak monitored all confirmed falciparum cases treated with first-line Malaria drugs (CQ alone, SP

112 Director General Technical Report ( DGTR )
Evidence of gene mutation
alone or CQ+SP) weekly for 4 weeks. On average, resistance to CQ, SP or combination of the two drugs, used as in Sarawak, Sabah and Peninsular Malaysia respectively, ranged between 20 to 60%. This is further supported by the declining in-vitro sensitivity pattern where 98.1% of P. falciparum isolates were resistant to CQ. Furthermore, there is increasing molecular evidence of mutation in resistant-associated parasite genes to CQ and SP (Table 2). We should also take note that failure to quinine, the second line drug, in treating paediatric patient has been reported in this country.
Table 1 : In-vivo Resistance of P. falciparum Against First Line Anti-Malaria Drugs.
Source: Vector-borne Diseases Control Programme, MOH, Malaysia
Drug
Chloroquine
Chloroquine
Chloroquine
Chloroquine
Sulfadoxine-pyremethamine
RI
-
49.3
12.3
9.1
10.5
Source
Montgmery & Elyes, 1963
McKelvey et al, 1971
Dondero et al, 1976
Hakim et al, 1996
Hakim et al, 1996
Overall resistance rate
28.5
50.7
49.0
63.3
47.4
RII/RIII
-
4.2
37.7
54.2
36.7
Table 2 : Evidence of Mutation of the Dihydrofolate Reductase (DHFR) and Dihydropteroate Synthetase (DHPS) Genes Among P. falciparum Isolates by Restriction Enzyme Fragment Length Polymorphism Analysis (REFLP)
Source: Hakim SL, personal communication
Location of the isolate
Lahad Datu
Tawau
Gerik
Number of isolate tested
11
3
33
DHFR only (%)
3 (27.3)
0
12 (33.4)
Both(%)
0
0
2 (6.1)
DHPS only (%)
0
2 (66.7)
17 (51.5)
Number with mutation (%)

113Director General Technical Report ( DGTR )
Malaria is now a “rare” disease
Sense of ownership
Declining Expertise
Malaria is now very much a rural health problem with all urban areas free of the infection. It is now considered very rare in urban areas in Malaysia, so uncommon that many doctors in major hospitals and private practices in cities and major towns particularly in Peninsular Malaysia, rarely see Malaria cases. This poses a problem in the diagnosis and management of Malaria. Similarly with laboratory diagnosis, as the experienced microscopists are being replaced with young Medical Laboratory Technologists (MLT) who hardly see any Malaria slides, the quality in microscopic diagnosis is in suspect. IMR has been supporting the Perak State Vector Control Programme refresher course on Malaria microscopy annually since 2003. It is very obvious that knowledge and skill of the MLTs in Malaria were very poor (Table 3). This problem of laboratory diagnosis has been observed as one of the contributory factors in Malaria mortality during such reviews.
Control programme managers are also facing problem with loss of experienced vector control staff such as the Entomologists, Health Inspectors and Public Health Assistants, some of whom were deeply involved in the formulation of the current Malaria control programmes, due to retirement. The philosophy, rationale and fundamental basis of specific actions, strategies and programs may not be well understood by new staff without appropriate re-training and re-orientation programme. That sense of “ownership” may have thinned out or disappeared altogether over the years.
Table 3 : Pre-test Performance of the Three Batches of Participants of the Perak (Vector-borne Disease Health Department Control Section) Malaria Microscopy Refresher Course.
Source: Hakim SL. Personal Communication
Badge
2003
2004
2005
Average score
34.7
31.9
30.1
Maximum score
61.7
53.3
61.5
Number of participants
31
31
33

114 Director General Technical Report ( DGTR )
Case fatality rate
Rising Case Fatality
The number of Malaria death in the country is considered to be low with case fatality rate of below 0.5 per 1,000 cases. This is probably contributed by early case detection, early supervised treatment with effective drug which is readily available and the existence of good referral system for severe and complicated infection. However, the rising trend in case fatality rate over the last decades is of concern (Figure 4). Although the death is attributed mainly to delayed detection and instituting effective treatment, especially among migrant workers, the problem of rising drug resistance to anti-Malarial drugs and declining expertise at all levels of care, could not be entirely ruled out.
Figure 4 : Malaria Case Fatality Rate 1990-2006
Source: Vector-borne Diseases Control Programme, MOH Malaysia
0
10000
20000
30000
40000
50000
60000
70000
90
91
92
93
94
95
96
97
98
99
2000
2001
2002
2003
2004
2005
2006
year
No.
of c
ases
0
0.1
0.2
0.3
0.4
0.5
0.6
0.7
CF
R (
%)
No. of cases CFR
Imported cases
The proportion of imported cases has also increased significantly from 9.6% in 2001 to 40% in 2006. The implication of these imported cases is important not only on the potential of re-introducing the infection in Malaria-free but prone areas, leading to the risk of outbreaks, and the introduction of resistant strain of the Malaria parasite which may further complicate the situation.

115Director General Technical Report ( DGTR )
Illegal migrant worker
Malaria transmission dynamic
Stable equilibrium between parasite-vector-host-environment in endemic state
Ecosystem change & mosquito density
Confounding drug resistance
The problem is compounded with the entry of illegal migrant workers especially in the agricultural and lumbering sections. Compulsory screening for Malaria is for the migrant workers who enter legally. Unless this issue is being addressed seriously at the national level, importation of cases will remain the principle source of re-introducing the infection in Malaria free area.
Outbreak of Malaria
One of our biggest challenges now is basically in preventing re-introduction of Malaria in Malaria free but Malaria prone areas as well as early detection and effective management of Malaria outbreaks, including those in Malaria endemic areas.
The transmission of Malaria is a dynamic interaction between the parasite, the human host and the mosquito vector, which is supported by the enabling ecological environment and socio-economic factors. When Malaria first strike in a non-immune community, the disease spread aggressively, affecting all ages who are exposed. They present with overt and sometime severe manifestations which may lead to death. As the human population acquired certain level of immunity over time after repeated exposures, equilibrium in transmission dynamics is established and a stable transmission pattern developed in the form of endemic Malaria. Changes in any of the factors in the transmission dynamics may affect the equilibrium. This may lead to an explosive epidemic with high fatality rate. In an endemic area, changes in the environment, very often as a result of socio-economic development, may lead to proliferation of mosquito vector leading to enhanced disease transmission and epidemic, as depicted by the epidemic in an aboriginal settlement in Air Bah, Perak in 1999-2000 (Figure 5). Felling down of old rubber trees for re-planting in an adjacent plantation resulted in the proliferation of the mosquito vector that triggered the outbreak, which later spread to neighbouring village of Lubuk Cupak. Added to the eco-system change that triggered the outbreak, the problem of drug resistance compounded the situation and prolonged the outbreak. About 29.2% showed treatment failure by D14 to a combination of CQ and SP in the field and another 33.3% by D21, although re-infection could not be ruled out in the latter. Despite the aborigines being partially immune, the epidemic was nevertheless explosive though fortunately, non-fatal.

116 Director General Technical Report ( DGTR )
2000 2001
05
1015
2025
3035
4045
50
may jul sep
nov jan mar
may jul sep
nov jan mar
Air Bah L. Cupak
No.
of c
ases
Plantationclearing forreplantingcompleted
Fatal outbreakRe-introduction of Malaria parasite in Malaria free areas continues to challenge the concept of “anophelism without Malaria”. In this situation, despite absent of remarkable changes in mosquito density, the epidemic is often explosive and may be fatal because of the lower human host immunity. Such was experienced in Felda Neram, Trengganu (Figure 6) which last reported a case about 10 years before the outbreak in 2000.
Ageing settlers resorted to using migrant workers to manage their plantation and being illegal, they were not screen medically upon entry. The parasite was introduced and spread rapidly among the workers. Though the workers stayed in the Kongsi in the plantation, social activities at night carried out by the workers among the settler areas spread the disease to the local.
Figure 5 : Epidemic of Malaria in Air Bah and Lubok cupak, Gerik, Perak
Source: Lenggong Malaria Sub-Sector Office, Gerik, Perak

117Director General Technical Report ( DGTR )
Reduction of anti-Malaria antibody
The severity of the outbreak was not only confounded by the problem of drug resistance, but also lack of population immunity due to lack of exposure after several years. It has been shown that after some period of interrupted transmission in a particular endemic community, the level of antibody against the parasite is significantly reduced. Out of the 19 treated cases with post-treatment follow-up slides, 15 (78.9%) showed recrudescence on Day 7 after the first course of the first line CQ-SP. Among the 15, five responded to a repeated course of CQ-SP combination and the remaining 10 were referred for quinine treatment.
Nu
mb
er o
f ca
ses
Epidemiology Week
01
234
567
89
33 34 35 36 37 38 39 40 41 42 43 44 45 46 47 48 49 50
Indon Local Death
Figure 6 : Fatal Epidemic in Felda Sungai Neram, Kemaman, Terengganu in 2000
Source: Kemaman Health Office, Trengganu
Figure 7 : Geometric Mean of Anti-Schizont Antibody Titre by Age Group in 1994 and 2002.
0
1
2
3
4
5
6
0 to 4 5 to 9 10 to 14 >=15
Geo
met
ric m
ean
antib
ody
titre
Age in year
1994 2002
118 Director General Technical Report ( DGTR )
Multi-drug resistant outbreak, Gerik, 2007.
Cross-species transmission a public health threat.
Sporadic peri-urban outbreaks in Penang and Selangor in recent years were also attributed to this introduction of parasite by migrant workers.
The dynamic equilibrium may also be offset by the increasing virulence and introduction of the drug resistant strain of the parasite. The recent outbreak of 127 cases of multi-drug resistant falciparum Malaria in Gerik, Perak in April 2007, which was introduced by migrant workers and later spread to the local community, was an example of that scenario. All the cases have to be treated with Quinine with or without tetracycline resulting in prolonged hospital stay. It was an anxious moment as the last line drug mefloquine, in the case of quinine failure, may not be effective at all as cross-resistance with quinine is well known and Malaysia has no other alternatives. Nevertheless, the severe outbreak was very well managed without lost of any patient despite all the difficulties. It reflects the capacity and capability of the public health care system in dealing with such a difficult situation.
Simian Malaria
Cross-species transmission of infectious agents is among the most important public-health threats facing humanity. Man’s increased use of forested areas for hunting, road construction, mining, logging and other so-called economic activities, brings them into close proximity with non-human primates and other animals, heightening the potential for transmission of exotic zoonotic infections. On the other hand, clearance of large forested areas for development can also force the animals closer to man in search for food. When ample food supplies are within reach, the animals may colonise areas closer to human habitat, thus creating a potential risk of zoonotic transmission. This risk has in actual fact, happened in Sarawak, Malaysia. A large focus of naturally acquired monkey Malaria (Plasmodium knowlesi) among human in Kapit, Sarawak has been reported. Out of 208 people with Malaria in the Kapit Division whose blood samples were examined by molecular method, 120 (58%) of them were found to be positive for P. knowlesi. Evidence so far suggested only monkey-to-human transmission existed. Cases in Sarawak were apparently associated with farming activities whereas in Peninsular, a few cases confirmed by polemerase chain reaction (PCR) were associated with recreational activities. The transmission dynamics of the infection has yet to be established. Naturally acquired P. knowlesi has also been reported in Thailand. There

119Director General Technical Report ( DGTR )
Sustaining effort
Knowledge of transmission dynamics
SAM model
are several other simian Malaria species that are closely associated with human species, and some of these such as P. cyanomolgi, P. inui and P. simium have been implicated in symptomatic Malaria in human.
The Way Forward
There is an excellent opportunity for Malaysia to finally put to an end, the chapter of Malaria as a public health problem. Many previously endemic areas are now free from Malaria, including those logistically difficult interior aboriginal settlements of Peninsular Malaysia and the natives of Sabah and Sarawak. This is made possible through the un-tiring effort and undivided dedication of the health staff at all levels. This has been facilitated by the continued improvement in socio-economic status, physical infrastructures and human resource development, providing easy access to quality health care services.
In order to achieve the goal of complete elimination of local transmission of Malaria, we need to address the challenges and continue to sustain our effort, commitment and enthusiasm in carrying out our task. We must also continue to improve and innovate in the way we do things. As discussed earlier, if we are complacent because the number of cases is low now, Malaria cases may re-bond. Therefore, we must sustain our effort in combating Malaria. We must be able to identify and anticipate factors that favour re-introduction of Malaria, sustain its transmission and/or trigger outbreak, which may challenge us in achieving our goal.
Thus, program managers must have in-depth knowledge and understanding of the Malaria transmission dynamics and must be able to conduct risk assessment, quantitatively or qualitatively, to identify these challenges and problems. Once identified, effective, innovative and sustainable mitigation and adaptive measures must be implemented and properly supervised to prevent resurgence of Malaria. Sensitive and effective surveillance system becomes more critical in the current low level of endemicity.
This sustain-assessment-mitigate model (Figure 9) is proposed to be the guiding principle to our programme managers in charting their program and strategies.

120 Director General Technical Report ( DGTR )
New anti-Malaria regime: Artemisinin-combined therapy
The model is based on the principle that Malaria may re-bounce (R) if control measures are relaxed because of complacency. The model also proposed that if we continue with our commitment and enthusiasm but ignoring the challenges, we may have to wait a longer time (T3) to achieve our objective and therefore the potential of incurring more cost. For example, to mitigate the problem of drug resistance, we may need to change our first-line regimen policy. New effective anti-Malaria drugs such the artesiminin-combined therapy (ACT) as proposed by WHO, is effective in addressing the drug resistance problem. Per unit cost of the new drugs may be more expensive than the existing CQ and SP but the number of cases are so low that the cost may be comparable to that of CQ and SP 10 years ago. Delay in changing the regimen may put us at risk of delaying the interruption of the transmission (and therefore more cost) and the risk of Malaria re-bouncing, but this time around with more difficult resistant strain. The challenge is not only with resistant falciparum Malaria but also increasing evidence of resistant P. vivax. Recent outbreak of vivax Malaria among migrant workers in Puchong, Selangor this year (2007), indicates declining responsiveness of P. vivax Malaria where some of the cases require second-line quinine treatment.
We may also need to innovate in the way we do things to mitigate the challenges to achieve the same goal. Currently epidemiological pattern showed significant proportion of the cases were imported
Figure 9 : The Sustain-Assessment-Mitigate (SAM) Model
R
T0 T1 T2 T3
Assessment
Sustain control measures
Mitigate potential problems
No.
of
cases

121Director General Technical Report ( DGTR )
by migrant workers. Although we have put in place compulsory screening of migrant workers by examination of blood smears, we believe the method is both inefficient and not cost-effective. This is based on the simple logic that a microscopist can only examine 60 slides per-working day. Taking a lower estimate of 1.5 million slides collected annually for this purpose, it would require 83 full-time microsocopists working a full 25 days a month. New technology to detect Malaria antigen, which can be automated is available that may significantly improve screening efficiency and cost-effectiveness.
Similarly, routine collection of blood smears from 10% clinic attendance may need to be reviewed. In Malaria free areas, asymptomatic Malaria infection is almost non-existence and thus, such strategy may not be able to pick-up new cases effectively. Diagnostic laboratory may need to invest on new technology such as PCR for confirmation of infecting species, particularly simian Malarias which may be morphologically difficult to differentiate from similar human Malaria parasites. In this context, regional Public Health Laboratories may consider upgrading their role as service reference laboratory in this area.
Mapping the Malaria vector is very critical in assessing the risk of re-introducing the parasite. Malaysian landscapes have changed significantly since independent and thus, the vector map generated during the MEP period is largely outdated. However, the traditional way of doing entomological survey is labourious, time consuming and expensive. New approaches using geographical information system and remote sensing, may need to be explored for more efficient and effective way of carrying out the vector mapping. Nevertheless, we must be cautioned that having these technologies are not synonymous with having an effective surveillance system. The value of any surveillance system for any infectious disease is measured by its ability to provide timely, accurate “data for action” to people responsible for prevention and control activities and its ability to provide on going feedback to the primary gatherers of information.
The number of Malaria cases has plateaued for far too long (Figure 1) and seem to be stabilising at around 5,000 cases for the past 3 years (Figure 9: T0-T1) without further significant improvement. The choice now is ours. It would be interesting to see by 2011, marking 100 years of the establishment of the Malaria Advisory Board, whether Malaria remains a public health problem in Malaysia.
Innovative methods
Passive case screening
Vector mapping
GIS and remote sensing in vector mapping

122 Director General Technical Report ( DGTR )
Abegunde AT (2005). Monkey Malaria in man. Lancet, 364: 1217
Beck LR, Rodriguez MH, Dister SW, et al (1994). Remote sensing as a landscape epidemiologic tool to identify villages at high risk for Malaria transmission. American Journal of Tropical Medicine and Hygiene, 51: 271-280.
Booman M, Durrheim DN, Grange KL, Martin C, Mabuza AM, Zitha A, Mbokazi FM, Fraser C & Sharp BL (2002). Using a geographical information system to plan a Malaria control programme in South America. Bulletin of the World Health Organisation, 78:1438-1444.
Deane LM, Deane MP and Ferrera Neto J. (1966). Studies on transmission of simian Malaria and on a natural infection of man with Plasmodium simian in Brazil. Bulletin of the World Health Organisation, 35: 805-808.
Dondero TJ, Parson RE and O’Holohan DR. (1975). Increased frequency of chloroquine resistant P falciparum on a rubber estate in Peninsular Malaysia during two years of systematic chloroquine treatment. Southeast Asian Journal of Tropical Medicine and Public Health, 6: 488-496.
Hakim SL, Furuta T, Noor Rain A, Normaznah Y, Mohd Zamri MR, Kojima S and Mak JW. (1995). Diagnosis of Malaria using plate hybridisation method for the detection of polymerase chain reaction products. Transaction of the Royal Society of Tropical Medicine and Hygiene, 89: 271- 272.
Hakim SL, Lachmanan SR & Merican I (1997). Clinical, haematological and chemotherapeutic profiles of Malaria cases in Hospital Kuala Lumpur: a retrospective review. International Medical Research Journal, 1 : 103-106.
Hakim SL, Roohi SSA, Zulkarnai Y, Navaratnam V, Mansor SM Palmer K and Mak JW (1996).Plasmodium falciparum: Increased proportion of severe resistance (RII and RIII) to chloroquine and high rate of resistance to sulfadoxime-
pyrimethamine in West Malaysia after two decades. Transaction of the Royal Society of Tropical Medicine and Hygiene; 90: 294 - 297
Halim A (2002). Seroepidemiology of Malaria in Sungai Gapoi Village, Bentong, Pahang. Dissertation submitted in partial fulfilment for the Postgraduate Diploma in Applied Parasitology & Entomology, Institute for Medical Research, Kuala Lumpur.
Bibliography

123Director General Technical Report ( DGTR )
Ho KB, Mak JW and Ramadas M. (1987). A study of the sensitivity of Plasmodium falciparum to chloroquine and mefloquine using the in-vitro microtechnique in Peninsular Malaysia. Transaction of the Royal Society of Tropical Medicine and Hygiene, 81: 257-259.
Institute for Medical Research (1950). Fifty years of Research in Malaya, 1900-1950.
Jamaiah I, Anuar AK, Najib NA and Zurainee MN. (1998). Imported Malaria: a retrospective study in University Hospital, Kuala Lumpur, a ten-year experience. Medical Journal of Malaysia, 53: 6-9.
Jongwutiwes S, Putaporntip C, Iwasaki T, Sata T and Kanbarat H. (2004). Naturally acquired Plasmodium knowlesi Malaria in uman, Thailand. Emerging Infectious Diseases, 10, 2211-2213.
Lim CB, Hakim SL and Mohd Sham K. (1994). Mefloquine in the treatment of multi-drug resistant falciparum Malaria. Malaysian Journal of Child Health, 6: 129-131.
Mak JW, Jegathesan M, Lim PKC, Hakim SL, Noor Rain A, Ambu S and Chong HK (1992). Epidemiology and control of Malaria in Malaysia: Special Report. Southeast Asian Journal of Tropical Medicine & Public Health, 23: 572-577.
McKelvy TPH, Lundie ART, Vanreenen RM, Williams EDH, More HS, Thomas MJG, Worsley DE and Crawford IP (1971). Chloroquine-resistant falciparum Malaria among British Service Personnel in West Malaysia and Singapore. Transaction of the Royal Society of Tropical Medicine and Hygiene, 65: 286-304.
Mohamed DA (1965). Annual Report of the Malaria Advisory Board, Malaysia.
Montgomery R and Elyes DE. (1963). Chloroquine resistant falciparum Malaria in Malaya. Transaction of the Royal Society of Tropical Medicine and Hygiene, 57: 409-416.
Moore CS & Cheong I (1995). Audit of imported and domestic Malaria cases at Kuala Lumpur Hospital. British Journal of Clinical Practice, 9: 304-307.
Storey J, Taylor AC, Yap LF, Kandaya E, Delorme DR, Harrison BA & Lewis Jr. GE (1989). Plasmodium ovale in Peninsular Malaysia: what is the true situation in the Oriental and Pacifics regions? Tropical Biomedicine, 6: 1-6.
Bibliography

124 Director General Technical Report ( DGTR )
Singh JC, Singh B, Alias A and Abdullah MS. (1995). Assessment of association between three pfmdr1 point mutations and chloroquine resistance in vitro of Malaysian Plasmodium falciparum isolates. Transaction of the Royal Society of Tropical Medicine and Hygiene, 89: 436-437.
Singh B, Sung LK, Matusop A, Radhakrishnan A, Shamsul SSG. Singh JC, Thomas A and Conway DJ (2004). A large focus of naturally acquired Plasmodium knowlesi infections in human beings. Lancet, 363: 1017-1023
Thacker SB, Choi K & Brachman PS (1983). The surveillance of infectious diseases. Journal of the American Medical Association, 249: 1181-1185.
Bibliography

3chapter

3

127Director General Technical Report ( DGTR )
IMPLEMENTATION OF HIMS E-REPORTING IN THE MINSTRY OF HEALTH
1. Background
Health Management Information System (HIMS) is responsible for the effective planning, development, coordination and evaluation of the health programme and activities. It is a decision support system for health
management and a system that links information to managerial concern.
An information system is necessary because managers at different levels of management require information to assess achievement, monitor existing programmes as well as plan for future development, including evaluation of resource allocation. The information system will also provide feedback on accomplishments of norms and targets set, and whether resources have been fruitfully utilised. This feedback will appear in the form of information which can be stored in a computer file, recorded in a register or reported in a monthly, quarterly or annual report.
SUMMARY
HIMS is responsible for providing health information for the effective planning, development, coordination and evaluation of the health programme and activities. In MOH, in 9MP, one of the supplementary goals is strengthening of Health Information system, in order to provide strategic directions towards Health Information Management in the country. HIMS Blueprint was approved in 9MP. Amongst the deliverables included the mechanism of timely report and access to accurate and quality information. HIMS e-reporting is an electronic reporting system for the collection, collation and analysis of Health information. HIMS e-reporting was approved for implementation in 9 MP to ensure access to timely quality HIMS data and information for decision making. HIMS e-reporting is one of the deliverables of HIMS Blueprint. The scope include design and development of e-forms, standardized data interface format, central data storage and generation HIMS subsystem reports and reports distribution in the IDS portal. Operational policies were developed and training were given before actual implementation in July 2007. The expected outcome of this project is to enable capture of quality data from public and private sector and towards the establishment of the National Health Data Warehouse (NHDW).
HIMS as a decision support system

128 Director General Technical Report ( DGTR )
HIMS Blueprint.
The information Documentation System (IDS) unit in MOH was established in 1980, and the core business function at that time is for the planning and operations of a Health Management Information System (HIMS) for MOH.
The HIMS established in 1980 collects data from all Ministry of Health (MOH) hospitals and health clinics, (inclusive of Klinik Desa (KD’s) and several mobile clinics) hospitals and clinics from other agencies such as university hospitals, Armed Forces hospitals & clinics, Orang Asli hospital and private hospitals
HIMS sub-system currently include Medical Care, Family Health, Family Planning, Communicable Disease, Blood Transfusion Services Information System, Rural Environment Sanitation Programme (BAKAS), Food Safety and Quality Information System and Health Facilities.
HIMS electronic reporting (e-reporting) is an system for the collection, collation and analysis of health information. It is proposed a web-based reporting system be developed through which all health and health related data from MOH facilities, non MOH facilities and the private sector can be transacted for timely and quality health information.
HIMS e-reporting was approved for implementation in 9 MP to ensure access to timely quality HIMS data and information for decision making. The e-reporting is one of the deliverables of the Blueprint.
Amongst the objectives of the Blueprint were as follows:-
a. To provide the policy and strategic framework for better health information management in the country
b. To provide directions on the legislative and regulatory changes necessary to support the action plan
c. To determine the organization and action plan to enable the translation of policy to practice
d. To clarify the responsibilities of the stakeholders and coordination activities required to support the action plan

129Director General Technical Report ( DGTR )
Timeliness, quality and integrity of data will be part of HIMS e
Private Hospitals data will be part of HIMS e
e. To identify building blocks necessary to support the change
f. To determine the skill match and training required to support the change
g. To be used as the policy and strategic document for other related plans and blueprint such as ITSP etc
2. Issues
The current system of reporting is predominantly manual except for the hospital inpatient in MOH hospitals which uses a software called “Sistem Maklumat Rawatan Perubatan” (SMRP) which allows electronic file transfer and Communicable Diseases Information System (CDCIS) at the Health Office, which is online data transaction.
In term of timeliness of data, the current system of data collection is less efficient in terms of time taken to get the feedback of HIMS data from state and produce MOH annual report yearly. In the conventional method, the districts submits return by the 30th January of the following year and the data is compiled at the state level and sent to IDS.
The IDS unit takes time to enter data, compile and do basic analysis for the programs to do their write up their report. The data from the private sector is provided as raw data by individual as required by the Act and the data entry has to be done at IDS level.
As for quality and integrity of data, the states check randomly and changing the figures at the last minute will affect the analysis. There is no standard data definition for the data elements used thus affecting the credibility of the information.

130 Director General Technical Report ( DGTR )
3. The scope of HIMS e-reporting
The scope of HIMS e-reporting include the following:-
3.1 Data Collection
Design and development of e-forms application for use at all hospitals, health office and clinics that will contain in electronic format, all returns that are sent to IDS. This will also include the design and development of a standardized data interface format for collection of relevant data for the returns from the existing electronic systems e.g. Total Hospital Information System (THIS), “Sistem Pengurusan Pesakit Dalam, (SPPD), “Sistem Maklumat Rawatan Perubatan”(SMRP), Communicable Disease Control Information System (CDCIS), Tele Primary Care (TPC), etc
3.2 Central Data Storage
As for Central Data Storage, the design and development of central storage for aggregated data in IDS portal and the source files, are from the sites.
3.3 Reports Generation and Report Distribution
The scope also include the production of aggregated returns from the data transmission to IDS from all stakeholders. The reports will be generated from the aggregated data in IDS portal. As for reports distribution, the design and development should be of web based portal as that all HIMS subsystem reports can be access through IDS portal, distribute updated versions of e-forms application and interface with other relevant agencies like Statistics Department and others.
4. HIMS e-reporting Framework
Two central data bases will be created, one for storage of the submitted e-form files and another will be used for storing the aggregated data. (Figure 1)
HIMS e design
Aggregated data will be auto generated in IDS portal
HIMS e solution framework.

131Director General Technical Report ( DGTR )
All standard HIMS reports in the form of aggregated returns at national, state and district level will be generated by the system. Data quality can be verified at the source and at IDS level. Data can also be exported to other third party products such as Excel, SPSS for subsequent analysis
5. Operational policies HIMS e
Operational policies on HIMS e was developed first to ensure that the user will understand before HIMS e implemented. The operational policies as listed in the following:-
5.1 HIMS e portal
• HIMS e will be a web based portal with access provided to users on a need to know basis
• All forms shall be submitted through the HIMS e portal to IDS by the district or hospitals at frequency as determined in the guidelines
Verification of data can be at IDS level
HIMS e operational policies
Figure 1 : HIMS-e : Solution framework
Source: Information & Documentation System Unit (IDS), MOH

132 Director General Technical Report ( DGTR )
• Users from the, state and the programs shall be allowed access to the portal for read only purposes and on the need to know basis. However the state will verify the data and this verification audit will be captured in the portal .As for the private hospitals the report will be aggregated at the state level and submitted to IDS portal
• Aggregated data for the national level shall be amended or appended at IDS only and such entries shall have audit trail
• All HIMS data reports and annual reports shall be accessed through the portal
5.2 HIMS e Forms
• All e forms shall be entered by qualified and trained personnel
• The HIMS sub system program owners shall be responsible for updating the forms
• IDS will coordinate the training of Assistant Medical record Officer(AMRO) and other health personnel in the adoption of e system
• ICT Division shall be responsible for the system operations and maintenance
5.3 HIMS Data Repository
• There will be one central data base at the IDS
• IDS will be the custodian of the data
• ICT Division will be responsible for system operations and maintenance
5.4 Data Access
• Access to data shall be given to individuals identified by the users and shall be approved by the state director

133Director General Technical Report ( DGTR )
• State AMRO will coordinate the requisition and approval of access rights
5.5 Data Security and Confidentiality
• All prospective users of data for secondary use shall obtain the approval of IDS following which access will be given on a case to case basis
5.6 Data Quality
• All data entries and amendment shall have audit trail
6. Benefits
The benefits of HIMS e will cut across at all level in terms of time saving. At the District Health Office or (Pusat Kesihatan Daerah) PKD , the staff can save time in preparing the monthly reports because the totaling and analysis of forms(B forms ) will be done by the system.
At the Pejabat Keihatan Negeri(PKN) level there is no need to aggregate for the state as this will be done also by the system. On the contrary the state officers can use the data to make further analysis relevant to their state. At national level, especially at the IDS level, all the aggregated forms will be done by the system and therefore the staff will be able to analyse the data and produce adhoc reports for further use as required by the ministry.
Effective monitoring of submission deadlines can be generated by the system and supervision were easily monitored. Availability of uniform data at IDS unit will be made easier for data mining and analysis for utilization, performance, workload, disease pattern and other studies. Uniformed management of patient data can be easily expanded for other studies such as case mix, outcomes measurement and others.
Timeliness, quality and integrity of data can be achieved.

134 Director General Technical Report ( DGTR )
7. Work Process for HIMS e-Reporting for Various sub-system
7.1 Family Health
In Phase 1, the data entry for all public health sub-systems will be at the District Health Office or (Pusat Kesihatan Daerah) level. The Klinik Desa(KD) and Klinik Kesihatan (KK) will continue to submit the paper forms to the PKD. The PKD will key in the data into the e-form. The system will validate the data entered and perform calculations and aggregations at the district level. Upon completion the e- forms will be submitted on line to IDS portal. Currently the PKD sends the aggregated form to Pejabat Kesihatan Negeri(PKN) to be further aggregated at the State level. However with e-reporting system, the PKD will send the electronic forms directly to IDS, saving time for the PKN staff. PKN will be able to view the state data online (via the Portal), verify data and do quality check.
As for Family Planning data, the information will be entered at PKD level to the e system and LPPKN will be given access to the family planning data for data compilation at the national level.
7.2 Medical Care Program
All formats have been reviewed by AMRO at state level, hospital level, Medical Development Division and IDS unit. The implementation of the new formats will be done in phases.
The current SMRP will be upgraded to fulfill the e-reporting format requirements for inpatient data capture. As for outpatient and day care e-reporting forms, it had been reviewed and will be implemented in phases. In phase I, where there are no local area network and computer hardware to support online submission the existing work flow of the system will be maintained. All data will be entered by AMRO at record office and will be sent to the e-reporting portal validated.
There will be no data compilation at the state level. However the state will be allowed access to the state data to ensure data quality and submission status.
Work process varies for individual subsystem

135Director General Technical Report ( DGTR )
As for hospital with IT, integration profile will be given to all HIS vendors whereby the HIMS forms can be generated through the e- reporting system.
7.3 Blood Transfusion Services Information System (BTIS)
As for BTIS, the completed laboratory e-forms will be sent to Medical Record Office (MRO) at State level which will enter the data into the IDS portal. The validation and integrity of data will be validated by Sate pathologist. Data aggregation and generation of the reports will be done by the system.
7.4 Oral Health Information System
All Oral health returns from the clinics and hospitals will be sent to the District Dental Office (DDO) where the forms will be keyed in and submitted to IDS. Reports will be generated by the system.
7.5 Private Hospital
The private hospital will enter the data for using the e form application that will be made available in the IDS portal. The forms will be sent through e mail to the State Health Office. The state AMRO will merge the data and will submit to the IDS portal from where the report will be generated
7.6 BAKAS and Food Safety and Quality (FSQ)
As for BAKAS, the HIMS e-reporting format will be entered by Public Health Inspectors (PHI) at district level, keyed in the data and send to e-reporting IDS portal. HIMS e for FSQ will be integrated later with FOSIM software developed by Food Safety and Quality Division.
8. Roles and Responsibilities
The roles and responsibilities for staff will be from national to district level and are as the follwings :
• Coordination of training of various users for all HIMS sub-system.
Roles and Responsibilities

136 Director General Technical Report ( DGTR )
HIMS e ready to be implemented in July 2007
• AMRO state will be the liaison officer to coordinate all activities related to e reporting
• Report verification and quality check • Data entry for Blood Bank and Private hospitals • Duplication of copies of all training materials • Training of trainers
As at national level, IDS unit and the vendor will :-
• Produce manuals and guidelines including soft copies to state
• Training of all champions and key users • Technical support • Data verification ,quality check , report generation
ICT Division will be responsible for all technical aspects of implementation, operations and maintenance of the system. IDS will be responsible for domain, including e-forms and the reports.
9. Current Status
The e-forms had been developed and tested by the user and HIMS sub-system will be ready for its implementation by July 2007. Training for all subsystem users have also been completed.
10. Conclusion
In conclusion, the e-reporting HIMS project will establish a set of solutions that can help solve many of the current problem without major disruption to operations. The expected outcome of this project is to enable capture of quality data from public and private sector and towards the establishment of the National Health Data Warehouse (NHDW).
1. Ministry of Health, Malaysia. Draft of HIMS Blueprint “Towards Excellence in Health Information Management”, 2005.
2. Health Management Information System (HIMS), Director-General Technical report 2004.
3. Government of Malaysia. Book II for 9MP, Planning and Development Division.
Bibliography

137Director General Technical Report ( DGTR )
TELEPRIMARY CARE: ENABLING SINGLE ELECTRONIC HEALTH RECORD FOR CONTINUOUS, SEAMLESS QUALITY HEALTHCARE
SUMMARY
The Ministry of Health of Malaysia has developed and implemented an enterprise-wide Electronic Health Record (EHR) system called Teleprimary Care (TPC) to improve the flow and sharing of information across the health sector. The primary aim is to deliver efficient, seamless and continuous healthcare for Malaysians. The TPC network currently links 2 hospitals, 50 primary care centres, 7 health offices in Johor, Sibu and Perlis with its headquarters at the Ministry of Health, Putrajaya. The application, Teleprimary Care Information System (TPCis), is designed to provide clinicians, paramedics and medical administrators with a powerful, function-rich and easy-to-use clinical information system. The system assures safe and secure point-of-care documentation of patient encounters regardless of location within the network. Since its roll-out in November 2004, 636,497 patients have been registered, 1,554,791 visit records documented and 295,203 Care Plans created by end of 2006. The benefits of TPC are currently enjoyed by 2,500 active users. The next year will see activities and attempts to measure these benefits.
Introduction
Safe, comprehensive, and cost-effective patient care depends on the provider’s ability to obtain an accurate and timely record of the patient’s previous healthcare that includes pertinent history, investigations and treatments. Without
this information, tests may be repeated or previous results ignored, allergies may not be known, and information about drug regimens may be wrongly communicated or not communicated at all.
Inadequate information is a common cause of medical errors. Smith et al. (2005) studied the problem of missing clinical information during primary care visits to show how these breakdowns in professional communication may adversely affect patient care. Important pieces of information were unavailable at the time the patient was seen in 1 out of 7 visits, for example, a laboratory result, a letter from a consultant, a radiology report, a hospital history or physical examination report.
Quality healthcare is dependent on timely access to patients’ entire medical record

138 Director General Technical Report ( DGTR )
The Current Scenario in Malaysia
ICT to Enhance Quality of Healthcare
The TPC network and integrated EHR system in Malaysia
In Malaysia, no formal study has been conducted to determine the extent and nature of missing relevant information during a clinic encounter. However, healthcare providers often lament poor or fragmented documentation or loss of documentation, even within the same facility.
Additionally, healthcare facilities lack the ability to share critical information quickly, and administrators encounter difficulties when attempting to pool existing data for analysis due to incomplete or poor documentation and non-use of standard terminology.
Information technology, specifically an electronic health record (EHR) system, has the potential to improve quality, safety and efficiency of healthcare. Health information technology has been shown to increase adherence to guidelines, enhance disease surveillance, and decrease medication errors. This report highlights some key applications of a comprehensive, consistent and clinically-sound electronic health record for Malaysians, which is always available and current to ensure quality care for patients.
The Electronic Health Record (EHR) and Teleprimary Care (TPC)
The Electronic Health Record (EHR) is a longitudinal electronic record of patients’ health information generated by one or more encounters in any care setting. In Malaysia, there are several government hospitals with EHR systems but these commercial proprietary EHRs reside entirely within each hospital. Many private hospitals and clinics also use EHRs but all these are stand-alone systems.
Teleprimary Care (TPC) is the only enterprise-wide virtual private network with a comprehensive integrated EHR system which links, through satellites or lease lines, 50 primary care centres, two secondary care hospitals and 7 health offices across a distance of 1,500 km (Figure 1). This clinical information system (TPCis) is designed to allow point-of-care documentation of encounters by multiple healthcare providers in varied healthcare settings. All documentations of care episodes are then stored in a central repository which is available and accessible to all authorized users. It incorporates some clinical decision support that prompts drug-drug interactions and drug allergies and has about 200 clinical practice guidelines/protocols.

139Director General Technical Report ( DGTR )
Encrypting Data and Limiting Access Rights
3 States 1500km apart• Clinic : 50• Hospitals : 2 (Hospital Sultanah Aminah Johor Bahru &
Hospital Sibu)• Health Offices : 7• Division : 4
Modules and Functionalities
The application functionalities and user interfaces are designed through direct negotiation with more than 3,000 potential users. Direct negotiation with system users and owners ensures that the user interface is easy to learn and to use. It also gives users a sense of ownership and the consequent desire to see the success of this project. Since its initial roll-out in November 2004, which was and is still being implemented in phases, 636,497 patients have been registered, 1,554,791 visit records documented and 295,203 Care Plans created by end of year 2006.
Security and Confidentiality of Patient Records
One major concern of users, clients and stakeholders of any clinical information system is the security of data. In TPC, access to medical notes is protected by the latest encryption technology together with a context-based model of access. Administrators assign access rights to the application based on users’ roles for example, a clerk will only be able to access demographic data but not the medical notes. Besides access safeguards and barriers, TPC incorporates fire walls and audit trails to ensure patient confidentiality. The ability
Figure 1 : Teleprimary Care Sites

140 Director General Technical Report ( DGTR )
Using MyKad for Registration
to classify a disease, that is, to selectively restrict all documentation of a particular diagnosis of a patient to a few named providers or groups of providers offers the patient ultimate privacy. For instance, a very, very important patient (VIP) may only want a few providers to manage him/her disease, or a patient with multiple diseases may choose to restrict access to information on his more socially-sensitive disease.
Each and every user, after training, is given a log-in identity with a password and is assigned access to TPCis based on his/her role. All users have to sign a security and confidentiality form and are constantly reminded on their responsibility to keep their passwords to themselves. Ability to assign role and rights to individual users not only protects a patient’s confidentiality but also enables administrators/ consultants to control ordering of expensive investigations/ procedures and also prescription of expensive List A drugs.
Patient Management System (PMS)
Registration of patients need only be done once by a card reader that captures the demographic information embedded in the national identification card, MyKad. This one-time registration is subsequently accessible to all authorized users within the network, hence cutting down repetitive documentation of demographic data. Daily documentation of visit records and queue management are more efficient, cutting down registration time to see a healthcare provider. Automation of this task allows the generation of reports on daily, weekly or yearly workload, again, cutting down daily menial task of manual data entry and calculation (Figure 2).

141Director General Technical Report ( DGTR )
Figure 2 : Automated Report on Demographic Characteristics of Patients Seen in April 2006 In Sultanah Aminah Hospital
A well-designed electronic health record is dependent on correct identification of patients. A unique patient identifier is important to ensure that all information of a patient is stored in a single record within the system, regardless of when or where the record was created or who the creator was. In Malaysia, the data in MyKad allows every patient to be uniquely identified. However, all patients are also given a unique TPC number. Plans are also in place to create a patient master index to identify all patients, including non-citizens and those without MyKad.
A PMS allows creation of rosters/appointment schedules for the various services for up to a year. This allows electronic appointments which enable control over workload, since the system will not allow any more appointments once the allotted time slots are filled up. However, it has a role-based flexibility of allowing one to slot in emergency or unscheduled cases. This right is usually given to clinical specialists.
Electronic schedules allow remote appointment by staff in other clinics. It can generate reports on defaulter rates and can be configured to remind patients of their appointments. The ability to give remote appointment is currently enjoyed both by staff and patients. Previously, much time was wasted in calling another
Creating Patient Identifiers
Versatility of Electronic Appointment Scheduling

142 Director General Technical Report ( DGTR )
clinic for appointments and it was not uncommon for patients to travel substantial distances to get appointments. Patients are also impressed by the efficiency of tele-referrals when they find their records in place in remote clinics without having to submit their system-generated referral forms given as back-ups.
Electronic Orders
Electronic laboratory, imaging and procedure orders reduce dependence on handwritten order forms and saves time. Specimen labels generated also eliminate repetitive writing of patient’s biodata and test details on tiny specimen labels. Ready access to electronic results cuts down turnaround time for laboratory and imaging results. There are fewer repeat tests because fewer test results are lost. Sharing of results within network also cuts down unnecessary repeat tests.
Patients greatly appreciate ready access to their results, and are able to obtain printed copies of their results performed at remote clinics. Healthcare providers find that electronic results with flagging of abnormal findings are easier to assimilate than printouts from laboratory analysers. This ensures that patients get prompt treatment, reducing morbidity and mortality. Electronic results also allow trending of any chosen test results over time (Figure 3).
Automated Procedures for Diagnostics
Figure 3 : Automated Trending of Serum Urea over Time
A summary list of results of different orders done is also possible (Figure 4).

143Director General Technical Report ( DGTR )
Figure 4 : Example of a Summary List of Imaging and Laboratory Orders
The Electronic Health Record (EHR) and Teleprimary Care (TPC)
Electronic prescription orders cut down prescription mistakes by generating excellent legible prescriptions. Alert on drug allergies and drug-drug interactions also improve safety (Figure 5). Features enjoyed by clinicians are the availability of templates listing recommended treatments for common diseases, the default standard dosage with duration of treatment for common medications and auto-population of previous prescriptions making drug refill a breeze during follow-up visits. Pharmacists and dispensers appreciate the legible prescriptions and legible names of prescribing clinicians whom they can contact for any prescription queries.
Figure 5 : Automated Prompt on Drug Interactions Prevent Medication Errors

144 Director General Technical Report ( DGTR )
Electronic Diagnosis
Electronic diagnosis results in automated notification of infectious diseases (Figure 6) which addresses problem of under-reporting and prompt early appropriate investigation and intervention. TPCis allows configuration to alert outbreak based on symptoms or drug prescribed making it possible to track emerging infectious diseases.
Electronic diagnosis allows real-time monitoring of notifiable diseases (Figure 7) and syndromic surveillance of diseases.
Figure 6 : Electronic Diagnosis Results in Automated Notification of Infectious Diseases

145Director General Technical Report ( DGTR )
Figure 7 : Real-time Report of Infectious Diseases
Figure 8 : Psoriasis Care Plan

146 Director General Technical Report ( DGTR )
The development and implementation of a clinical information system that provides meaningful and understandable patient information or medical notes in a format that is usable by clinician is a big challenge world-wide. The Care Plan allows excellent documentation of all medical encounters/visits of a particular patient in a format that is easily understood and readily accessible to all those with access rights to the TPC network (Figure 9). The date and place of data entry and the creator of this document (provenance) is clearly documented. The single location of a patient’s EHR enables care coordination and improves quality and efficiency of care.
Figure 9 : Demonstration of Access to Single Integrated Patient Record
The Care Plan templates are created based on existing Clinical Practice Guidelines (CPGs) /Protocols/Consensus statements. The modules allow for updating of templates to ensure that care recommendations are based on best available evidence. Such Care Plans also allow for tracking of compliance to existing CPGs.
The Care Plan module is widely used and there is much appreciation of the decision support provided. The excellent documentation cuts down frustrating search for medical information of a patient regardless of location. They can be copied and polished to create a medical report cutting down the waiting time for requests for any medical report.

147Director General Technical Report ( DGTR )
Teleconsultation (TC)
This module supports both real-time and ‘store and forward’ teleconsultation allowing for remote management of patients, including remote orders of laboratory/imaging tests and prescription (Figure 10). Real-time TC is supported by a ‘Click-to-Meet’ software with desktop video conferencing set. ‘Store and Forward’ TC is more practical since it does (not?) require the referring staff and consultant to be available at the same time. One advantage of this system is that EHR is shared. Hence, both referring healthcare provider and consultant have access to same patient’s record and there is provision of prompt feedback to the referring healthcare provider to augment patient care. Furthermore, all transactions on TC are captured into patients’ records ensuring a single EHR.
Real-time and ‘Store and Forward’ TC
Figure 10 : Status of Some Teleconsultations Conducted
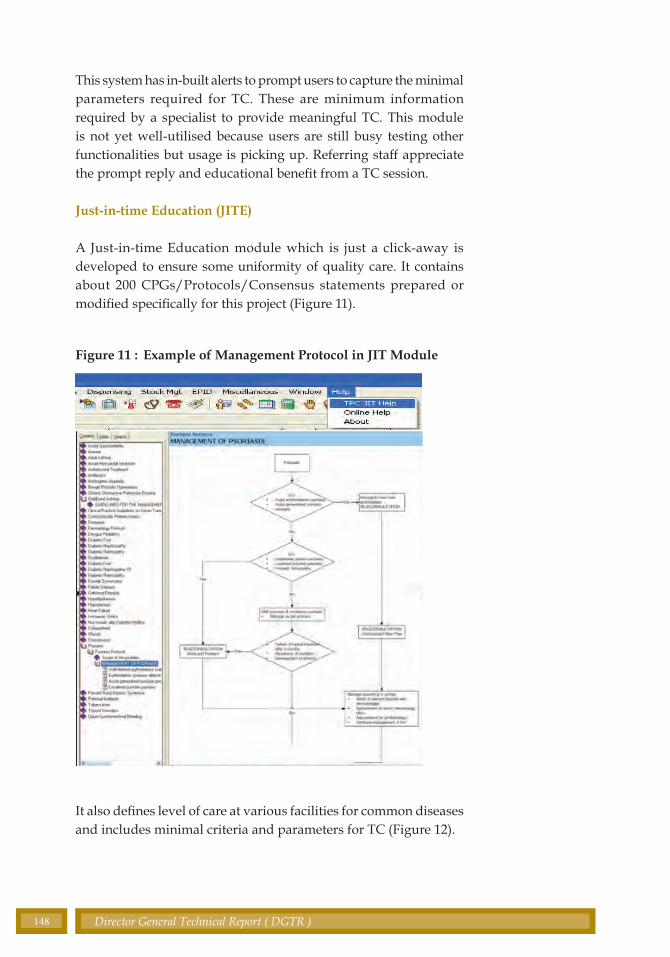
148 Director General Technical Report ( DGTR )
This system has in-built alerts to prompt users to capture the minimal parameters required for TC. These are minimum information required by a specialist to provide meaningful TC. This module is not yet well-utilised because users are still busy testing other functionalities but usage is picking up. Referring staff appreciate the prompt reply and educational benefit from a TC session.
Just-in-time Education (JITE)
A Just-in-time Education module which is just a click-away is developed to ensure some uniformity of quality care. It contains about 200 CPGs/Protocols/Consensus statements prepared or modified specifically for this project (Figure 11).
Figure 11 : Example of Management Protocol in JIT Module
It also defines level of care at various facilities for common diseases and includes minimal criteria and parameters for TC (Figure 12).

149Director General Technical Report ( DGTR )
Figure 12 : JIT Protocol Define Criteria for Teleconsultation and Level of Care
Epidemiology
This module allows automation of the surveillance functions of the Health Office such as real-time notification and alert of any notifiable disease, disease tracking and all activities related to the management of both the index patient and contacts besides allowing monitoring of site(s) of outbreak or impending epidemic.
Pharmacy
This module allows tracking of the movement of drugs and other pharmacy supplies from receipt of goods to stock management at various sites with in-built alerts on low drug supply or impending drug expiry.
Automation of Surveillance Functions
Tracing Movement of Pharmacy Supplies

150 Director General Technical Report ( DGTR )
Master Screen Series for Future Expansion of Scope
Encoding Data for Data Mining
Security and Administrative
A series of master screens allow the configuration and customization of the application to meet future needs and expansion of scope after project roll-out. These include :
• Security Master to allow assigning of access rights, List A drugs and certain tests/procedures,
• The Pharmacy Master to allow inclusion of new drugs, to configure standard dosage regimen or drug-drug interactions and to delete drugs that have been withdrawn from the market,
• Master definition screen to define a new site, discipline, new data element such as list of occupation, new services and others,
• Laboratory Master to define new laboratory parameters/tests, to configure results and also to configure certain tests as indicative of a notifiable disease,
• Diagnosis Master to allow addition of new diagnoses, creating diagnosis groups and configuration of a notifiable/ communicable disease,
• General Consultation (GC) Master to allow creation of individual symptoms, physical examination, laboratory, procedures and Care Plan templates, and the
• Teleconsultation (TC) Master to allow configuration of minimal parameters required for TC.
Data Management and Mining
Common data standards are vital for the development of an integrated EHR and to enable integration of clinical information entered by different care providers from multiple sites. Common medical terms used in gathering patient history, capturing physical findings and all laboratory/ imaging tests are drawn up and coded to enable data-mining and to ensure use of a common language throughout the network. Consensus has been reached to use modified ICD10 CM coding for capturing diagnosis, MAMPU

151Director General Technical Report ( DGTR )
Synthesising data
standard for documenting demographic data and our existing facilities name and coding to identify our healthcare facilities.
TPCis updates and synchronises data daily to ensure that information is current to eliminate risk liability of using outdated information. Data gathered by TPCis can be aggregated for population analysis and to create disease registry which will assist healthcare planning to improve population health.
Conclusion
TPC implementation from November 2004 to end of 2006 was a pioneering effort which underlines the commitment of the Ministry of Health to quality care, technological leadership, customer service and patient safety. The challenge was in developing a usable electronic health system that can be readily adopted by users. Current usage is encouraging and feedback from users regarding TPCis has been positive. TPC safeguards patients’ confidentiality and has the potential to increase efficiency by reducing errors and providing immediate and complete patient information and decision support whenever and wherever needed. The system also ensures care coordination as all caregivers view common unified records of each patient’s entire healthcare encounters.
Additionally, TPC improves disease notification and surveillance and supports data retrieval for quality assessment of activities and research. All these benefits are currently being enjoyed by TPC sites although returns on investments are not seen yet. The full benefit of TPCis can only be demonstrated if the whole healthcare system is wired to send and receive patient information in a common digital format. There is a need to roll out TPC to all government facilities and to start integrating TPCis with existing EHRs in other healthcare facilities, including private sector facilities.

152 Director General Technical Report ( DGTR )
1. Leape LL, Bates DW, Cullen DJ, et al. Systems analysis of adverse drug events. J Am Med Assoc 1995;274:35-43
2. Smith PC, Araya-Guerra R, Bublitz C, et al. Missing clinical information during primary care visits. J Am Med Assoc 2005;293:565-71
3. Bates DW, Leape LL, Cullen DJ, et al. Effect of computerized physician order entry and a team intervention on prevention of serious medication errors. J Am Med Assoc 1998;280:1311-6
4. Bates (DW), David W, Gawande (A), Atul A. Patient safety: improving safety with information technology. New England J Med 2003;348(25):2526-34
5. National Committee on Vital and Health Statistics, USA Information for health: A strategy for building the National Health Information Infrastructure. Report and recommendations from the National Committee on Vital and Health Statistics. Washington DC, November 15, 2002
6. Hersh WR. Medical informatics: Improving healthcare through information. J Am Med Assoc 2002;288(16):1955-8
7. Hunt DL, Haynes RB, Hanna SE, Smith K. Effects of computer-based clinical decision support systems on physician performance and patient outcomes: A Systematic Review. J Am Med Assoc 1998;280(15): 1339-46
8. Institute of Medicine, USA. Key capabilities of an Electronic Health Record system. Washington DC, National Acad Pr; 2003
9. Chaudhry B, Wang J, Wu S, et al. Systematic Review: Impact of health information technology on quality, efficiency and costs of medical care. Annals Intern Med 2006;144:742-52
10. HIMSS definition of Electronic Health Record available at http://www.himss.org/ASP/topics_ehr.asp. Accessed on 19 July 2007
11. World Health Organisation. Electronic Health Records: Manual for developing countries, 2006
Bibliography

153Director General Technical Report ( DGTR )
COSMETICS - PARADIGM SHIFT TOWARDS SELF REGULATION
SUMMARY
The most significant aspect of the implementation of the ASEAN Cosmetic Directives which will become effective from 1 Jan 2008 is the move from the traditional approach of “pre-market approval” to the new approach of “post-marketing surveillance”, or in other words, a shift towards self-regulation by the industry. Legitimate and fair self-regulation will become more important as the industry grows faster than government regulation. In order to ensure that self-regulation provides faster and more sustainable results, training by the authorities and on-going consultation between the regulators and authorities and industry are necessary. The use of clear and fair procedures and close monitoring of the self-regulation programmes by the regulators can help prevent abuses of self-regulation. At the same time, the regulators and authorities will have to realize that there is a need for paradigm shift as self-regulation places great reliance on industry to be responsible for safety assessment of their products and ingredients with very little government intervention prior to the placement of the products in the market. The role of the authorities will be to ensure that companies and products comply with the self-regulation programmes through post-marketing surveillance activities. For companies, there are real financial incentives to ensure the success of the self-regulation programmes as actions taken by the authorities for non-compliance could result in negative publicity that will adversely impact on the business. In short, meaningful self-regulation provides an important complement to the authorities’ law enforcement actions against non compliance and deceptive marketing. Together, the authorities and the industry can lower the amount of non compliance and deception in the marketplace, promote greater consumer confidence, and save scarce enforcement resources.
Introduction
For decades prior to 2003, the cosmetic industry in Malaysia has been producing, selling and marketing cosmetic products with very little government involvement in terms of regulation. Whilst the basis for the regulatory control of
cosmetic products comes from the Control of Drugs and Cosmetic Regulations 1984, it was only in 2003 that the implementation of the cosmetics regulations became effective.
Under the Regulations, the Drug Control Authority (DCA) has the mandate to protect the health of Malaysians by minimizing the risk associated with the use of cosmetics marketed in Malaysia.

154 Director General Technical Report ( DGTR )
Cosmetic products are diversified and not restricted only to color cosmetics such as lipsticks, mascara, eye shadows and blushers as some people may assume. In short, products that meet the definition of cosmetics as stated below are regulated as cosmetics in Malaysia for as long as these products comply with the requirements of the cosmetics regulatory control.
The regulations define a cosmetic product as follows:
“any substance or preparation intended to be placed in contact with various external parts of the human body (epidermis, hair system, nails, lips and external genital organs) or with teeth and the mucous membranes of the oral cavity, with a view exclusively or mainly to cleaning them, perfuming them, changing their appearance and/or correcting body odours and/or protecting them or keeping them in good condition”.
Cosmetics Industry in Malaysia
In this urbanisation era, beauty plays a significant role in portraying a self image and in developing self confidence. With the increasing number of women and even men working towards this, the development of cosmetic and toiletries market in Malaysia is growing tremendously. The market in Malaysia is valued at an estimate of RM3 billion or about USD800 million annually. Malaysia’s cosmetics and toiletries industry are predicted to grow continuously with the rate of 13% annually with saturated establishment both from local and international brands.
Besides urbanisation, sales are sustained by a rise in the number of women working, and aggressive marketing and promotional activities of the retailers. The numerous new product launches also signify that the market still has room for growth. Approximately six million, out of an estimated population of 24.53 million as of 2006 , fuel demand for cosmetics and dermatological products. When this segment of the population matures, demand should grow stronger because age-related cosmetic problems such as fine lines, wrinkles, dull skin and brown spots start to surface.
It is estimated that there are more than 60,000 types of cosmetic products in the local market. Imported products from Thailand, the United States, France, Singapore and Japan dominate the market in Malaysia whilst the local cosmetics and toiletries industry generally involves mixing and formulation processes, using imported
What are cosmetic products?
Definition of “Cosmetics”
The size of cosmetics market in Malaysia
Countries of export & local companies activities

155Director General Technical Report ( DGTR )
ingredients. Many of these companies are contract manufacturers, mainly for products such as shampoo and conditioners, other hair care products, perfumes, and cosmetics.
The market can be divided into:
(i) Mass market
Low to medium price range cosmetics and toiletries are sold at mass market in supermarkets, pharmacies and through direct selling agents.
(ii) Prestige brands
Exclusive, high priced brands usually sold at major departmental stores.
(iii) Others
Outlets (especially franchise chains) which operate individually in shopping complexes. These individual outlets usually specialise in natural based products while there are also beauty centers offering niche and specialised products to the middle and higher income groups.
Safety of Cosmetics
As cosmetic products are used by consumers of all ages including babies, the safety of cosmetic products is very crucial. In the EU and the US for example, cosmetic manufacturers are required to ensure the safety of their products before they go on sale. The industry in these regions has a long record of safety, with about six billion products manufactured annually worldwide, and only rare reports of problems like allergic reactions associated with these myriad of products. Nonetheless, momentum has been building for greater overseeing of the chemicals in these products, with the European Union taking the lead in imposing new rules for monitoring the contents in cosmetic products sold.
“On any given day, a consumer may use as many as 25 different cosmetic products. If each of these products contains 10 different ingredients, this consumer could easily be exposed to more than 200 different chemical compounds.”
Rare safety issues associated with the use of cosmetics
156 Director General Technical Report ( DGTR )
Cosmetics Regulations in Malaysia
In Malaysia, cosmetics are regulated by the Drug Control Authority (DCA). The Control of Drugs and Cosmetic Regulations 1984 provides specifications for manufacturing, labeling, distribution and sale of cosmetics. All manufacturers, importers and wholesalers of cosmetics in Malaysia must be licensed by the DCA. The Regulations also require for all cosmetic products to be registered (i.e. pre-market approval) with the DCA prior to manufacture and importation. The controls are introduced for the following reasons:-
• To ensure that cosmetic products are safe and do not contain substances which are prohibited.
• To allow consumers to make an informed choice and to identify ingredients which they may be sensitive or allergic to.
• To allow for an efficient control and withdrawal from the market of products that may have an undesirable effect.
Cosmetic products are regulated based on the following principles:-
• The industry must be responsible for the safety, quality, performance and overall value of their products.
• The consumer must be provided with adequate information to help them make an informed choice of the products that best suit them.
• The government is given the mandate and authority to actively monitor products at the point of manufacture and in the market place.
Cosmetic manufacturers in Malaysia should meet Good Manufacturing Practice (GMP) guidelines and are required to list all ingredients on the product label. The ingredients should be listed according to their International Nomenclature Cosmetic Ingredient (INCI) names.
Reasons for cosmetics control / regulations
Principles of cosmetics regulations
Compliance with GMP guidelines

157Director General Technical Report ( DGTR )
The DCA has also established an enforcement programme to ensure that cosmetic product manufacturers comply with cosmetic regulations. As part of the programme, the DCA can send out representatives to randomly gather cosmetic products available in the market in Malaysia. These products may be tested to ensure product safety and quality.
Cosmetics Regulations in Developed Markets
In Europe, cosmetics are regulated mainly through the European Cosmetics Directive, 76/768/EC and its many and various amendments. This legislation is in force in all European Union markets and is considered the gold standard for cosmetic regulation across many other countries while not formally adopted there. This legislation addresses a number of key areas and is intended to ensure the safety of cosmetic products and free movement for products within the European Union.
The US Food and Drugs Administration (FDA) authority over cosmetics is different from other products regulated by the agency, such as drugs, biologics, and medical devices. Cosmetic products and ingredients are not subject to FDA pre-market approval authority, with the exception of colour additives. However, FDA may pursue enforcement action against products and firms that or individuals who violate the law.
ASEAN Cosmetic Directives (ACD)
The vision of regional economic integration was conceptualized by the ASEAN in recognition of the importance and potential of trade liberalisation and facilitation and in desiring to increase regional competitiveness. However, market integration is not just about cutting or removing tariffs on trade. ASEAN countries have to make sure that non-tariff barriers including technical barriers created by standards, technical regulations and conformity assessments are removed. ASEAN has recognised the need to conclude Mutual Recognition Arrangements and harmonize standards and technical regulations in order to facilitate the movement of goods in the region.
Enforcement program
Cosmetics regulations in EU
Cosmetics regulations in the US
Background towards the introduction of the ACD

158 Director General Technical Report ( DGTR )
In December 1998, the ASEAN signed the Framework Agreement on Mutual Recognition Arrangements. Since then, the ASEAN cosmetic regulators and the cosmetic industry in the ASEAN region have been working together to address the issues associated with barriers. Therefore, the rules and guidelines developed under the ASEAN Cosmetic Directives (ACD) represent a broad cross-section of industry views and the regulators input. As a result of this collaboration, the Agreement on the ASEAN Harmonised Cosmetic Regulatory Scheme (AHCRS) was signed on 2 September 2003.
Under the AHCRS Agreement, the ASEAN Member Countries are required to make all efforts for the implementation of the ACD effective from 1 January 2008. The most significant aspect of this harmonised scheme is that all ASEAN Member Countries will move from the traditional approach of “pre-market approval” to the new approach of “post-marketing surveillance” for cosmetic products, which is considered to be more effective. Hence, the general objective of the ACD is towards replacing rigorous pre-market approval control for cosmetics with post-marketing controls.
In the development of the ACD, the ASEAN has agreed to use the EU Cosmetic Directives as the model for the ACD with several amendments and additions to suit the local situation in ASEAN. Since the ACD documents are mostly originated from the EU Cosmetic Directives, any changes in the EU Directives will most likely impact the ACD and the same changes may need to be effected into the ASEAN documents as well.
The ASEAN Cosmetic Committee (ACC), which is established under the ASEAN Harmonisation Agreement, is responsible for effective functioning of the Agreement. Part of its responsibilities is coordinating, reviewing and monitoring the implementation of the ASEAN Cosmetic Directives. The ACC has also established an ASEAN Cosmetic Scientific Body (ACSB) which is to give advice to ACC on any matter of a scientific and technical nature in the field of cosmetic products.
Regulatory Control of Cosmetics after 2007
With the implementation of the ASEAN Cosmetic Directives, there will no longer be requirement for cosmetic registration. Companies will only be required to notify the authority of their intention to place any cosmetic product in the market place. Upon receipt
Post-marketing vs pre-market approval control process
ACD, an adaptation of the EU Cosmetic Directives
Establishment of the ACC and ACSB

159Director General Technical Report ( DGTR )
of the acknowledgement of the notification fee by the authority, companies can start placing the products in the market. Licensing such as import and wholesale license will no longer be required for companies that deal with cosmetic products. In short, the ACD put great reliance on industry for self regulations as companies will be responsible for safety assessment of their products and ingredients. Companies are also to ensure that they comply with all aspects of the ACD requirements including:
• Ingredients• Labeling• Cosmetics GMP• Claims guidelines• Product information file (PIF)
Self Regulation
Legitimate and fair self-regulation will become more important as the industry grows faster than government regulation. The use of clear and fair procedures which provide the requirements and expectations of the industry and the regulators can help prevent abuses of the self-regulation process.
The general principle of self-regulation involves the on-going consultation between the regulators and authorities and industry. With the knowledge that self-regulation is a new concept in Malaysia, it is also realised that regular training of the industry as well as regulators on the requirements and the expectation of the ACD is necessary to ensure that the self-regulation provides faster and more sustainable results than government regulation.
Benefit of Self Regulation
It is believed that well constructed industry self-regulatory programmes offer several advantages to consumers, regulators and the industry as shown below:
(i) Self-regulation can be more prompt, flexible and responsive than traditional statutes and regulations.
(ii) The self-regulatory process and outcomes will likely be flexibly adapted to the realities of the market. Since the ACD are developed with a broad cross-section of industry views,
General principle of self-regulation
Benefits of self-regulation

160 Director General Technical Report ( DGTR )
the programmes can be implemented with the accumulated judgment and hands-on experiences of the industry members involved, resulting in workable rules that are at once more effective and less burdensome to companies.
(iii) Compliance under the self-regulatory system can be as high or higher as compared to under the government regulations because the industry participates in the construction of the ACD.
(iv) There are real financial incentives to ensure the success of the self-regulation. A reputation for ‘non-compliance’ will not serve the interest of the companies and actions taken by the government for non-compliance to the ACD requirements may result in high level of publicity that will adversely impact on the business.
Paradigm Shift Towards Self-Regulation
Government resources are limited and unlikely to grow in the future, thus, it will serve the government better in leveraging the limited resources by promoting and encouraging self-regulation. By abolishing the rigorous, time and resource consuming pre-market approval control process, the government can effectively utilize the existing resources towards close monitoring of the compliance of companies and products with the ACD through the post marketing surveillance activities. The post-marketing surveillance activities will be more effective in ensuring that only safe and quality products that can truly provide the claimed benefits are placed on the market.
The kind of self-regulation that will be conceived through the implementation of the ASEAN Cosmetic Directives is not without some level of enforcement. Purely voluntary scheme may not be effective in protecting consumers or fulfilling the other goals of self-regulation. There is no question that self-regulatory programmes work most effectively when the stakeholders have strong incentive to comply, and one of the incentives is law enforcement which will still exist in our legislation upon the implementation of the ACD.
Authorities role in self-regulation

161Director General Technical Report ( DGTR )
Conclusion
Meaningful self-regulation provides an important complement to the authorities’ law enforcement actions against non compliance and deceptive marketing. In our consumer protection role we work with industry groups to develop sound self-regulatory initiatives, thereby avoiding unnecessary government regulations. But we are also there to prevent abuse of the self-regulation by the industry through our post-marketing surveillance activities. Together, the authorities and the industry can lower the amount of non compliance and deception in the marketplace, promote greater consumer confidence, and save scarce enforcement resources.


4chapter


165Director General Technical Report ( DGTR )
FOOD CONSUMPTION PATTRENS OF MALAYSIAN ADULTS
SUMMARY
The findings from the National Nutrition Survey (2002-2003) provide the first national estimates on the intake of energy and nutrients for the Malaysian population. Findings show that the traditional practice of consuming three main meals per day is still in place in Malaysia and home-prepared meals are still part of the Malaysian diet. The daily median energy intake of Malaysian adult was 1,540 kcal/day or 70% of the Recommended Nutrient Intake (RNI) and decreased with age. The median daily intake of carbohydrate, protein and fat were about 222 g/day, 55 g/day and 46 g/day respectively. The median percentage of total energy contributed by macronutrients was 59% for carbohydrate, 14% protein and 27% fat. Cooked rice (nasi) was eaten by 97% of population twice daily. The study found that intakes of macronutrients were well within the recommendations for a healthy diet but energy intake and intakes of micronutrients fell short of recommended levels. Calcium and iron were found to be the most inadequate, particularly among women across socio-demographic groups and BMI status. In terms of food groups, overall, majority of Malaysians meet the Malaysian Dietary Guideline for most food groups except for milk.
A need to develop food and nutrition policies
Introduction
SNutrition is a complex process and a nutrition survey involves the study of multiple exposures which are usually interrelated. For example, every individual will have fat, fibre and vitamin A in his or her diet, but the quantity and
quality of foods eaten will vary between individuals. Moreover, a person’s food intake can change from time to time.
Nutrition is closely associated with chronic diseases such as cardiovascular disease, cancer, osteoporosis and diabetes. Cardiovascular disease has been the number one cause of hospital deaths in Malaysia for the last 20 years. The Malaysian government is concerned with the trend of increasing prevalence in cardiovascular diseases. Information about the nutrition of the Malaysian population is therefore urgently needed to develop food and nutrition policies, intervention and educational programmes as well as monitoring the country’s nutrition situation.

166 Director General Technical Report ( DGTR )
A national nutrition survey was conducted by the Ministry of Health in 2002 - 2003. The main objective was to determine the nutritional status, food consumption and physical activity pattern among Malaysian adults.
A stratified random sampling was used. The survey covered six zones in Malaysia - Southern, Central, East and Northern zones of Peninsular Malaysia, and Sabah and Sarawak. The eligible respondents were Malaysian adults aged 18 - 59 years. One adult was chosen to represent the pattern of nutrition for the whole household.
A total of 7,349 adults were interviewed between October 2002 and December 2003. A structured questionnaire was used to elicit information on socio-demography, 24-hour dietary intake, eating pattern, habitual physical activity, 24-hour physical activity, selected anthropometric measurements, habitual food intake, and intake of dietary supplements. Body weight and height were measured. Data cleaning, including checking, validating and editing were done prior to data analysis. The data analysis was done using SPSS version 13.0 for complex sampling design.
Information on dietary intake was collected using the 24-hour diet recall, a widely used method to obtain quantitative dietary information on individuals in large epidemiological studies. A semi-quantitative food frequency questionnaire which consisted of 126 food items was used to evaluate the habitual intake of the respondents during the previous one year period. The list included all the common food items found in Malaysia. For each food item, respondents gave only one response that is eaten ‘daily, weekly, monthly, yearly, seasonally or not all’. This questionnaire was validated for Peninsular Malaysia.
Only the findings on dietary patterns are described in this paper.
Meal Pattern
Meal pattern describes the type and pattern of food intake, which ultimately will determine the dietary behaviour of individuals.
More rural people consumed breakfast (91.8%) compared to urban (87.4%). The same was seen for lunch with 90.2% of rural population consuming lunch compared to 87.5% urban (Figure 1).
Objective of the National Nutrition Survey (2002-2003)
Methodology
Meal Patterns by Strata

167Director General Technical Report ( DGTR )
0.00
84.00
86.00
88.00
90.00
92.00
94.00
Pro
port
ion
(%)
Urban Rural Urban Rural Urban Rural
Breakfast Lunch Dinner
Figure 1 : Proportion of Adults Who Take Breakfast/ Lunch/ Dinner by Strata
Figure 2 : Meal Types by Location
Pro
po
rtio
n (
%)
Meals
100.00
80.00
60.00
40.00
20.00
0Breakfast Lunch Dinner
68.96
31.04
69.00
31.00
82.78
17.22
At Home
Outside
Meal Pattern by Location
Majority of adults (74.2%) ate three meals per day. More meals were eaten at home than outside the home (office, canteen/cafeteria, restaurant, hawkers/coffee shop and others) (Figure 2). Having breakfast outside of home, especially at coffee shops or hawkers stalls, was more prevalent in Peninsular Malaysia than in Sabah or Sarawak.
Most adults preferred to spend meal times with family members (Figure 3). More men preferred to eat alone compared to women.

168 Director General Technical Report ( DGTR )
The daily median energy intake of Malaysian adults was 1,540 kcal/day or 70% of the Recommended Nutrient Intake (RNI). Adults in Sabah (1,679 kcal/day), Sarawak (1,652 kcal/day) and the East Coast zones (1,654 kcal/day) achieved more than 70% of RNI for energy, while those in the Central zone had the lowest RNI achievement of 65% (1,484 kcal/day) (Figure 4).
Energy Intake
Pro
po
rtio
n (
%)
Meals
80.00
70.00
60.00
50.00
40.00
30.00
20.00
10.00
00.00Breakfast Lunch Dinner
Alone
Family
Friends34.88
49.11
16.00
23.93
56.06
20.0118.66
70.23
11.11
Figure 3 : Meal Companion
Figure 4 : Median Energy Intake by Zone
Med
ian
en
erg
y (k
cal/d
ay)
Zone
1,700
1,650
1,600
1,550
1,500
1,450
1,400
1,350Southern Central East Coast Northern Sabah Sarawak
1,488 1,484
1,654
1,504
1,6791,652

169Director General Technical Report ( DGTR )
Intake of Macronutrients
Intake of Micronutrients
Adults in rural areas had a slightly higher energy intake and RNI achievement (71%) than their urban counterparts (65%). In most of the economic and socio-demographic groups, women had lower median energy intake and percent achievement of RNI than men. The energy intake and percent RNI achievement was lower among the older age group (50 to 59 years) compared to the younger (20 to 29 years).
Median percentage of energy intake from breakfast, lunch and dinner were 29%, 29% and 32%, respectively. Among those who took afternoon tea, this contributed to about 17% of the total daily energy intake. Median energy intakes during weekdays were similar to that at weekends among populations in Sabah, Sarawak, Central and Southern zones. However, for East Coast and Northern zones, median energy intake was higher during the weekend compared to weekdays.
The median daily intake of carbohydrate, protein and fat were about 221g/day, 55g/day, and 46 g/day, respectively. The median percentage total energy contributed by macronutrients was 59% for carbohydrate, 14% protein and 27% fat (Figure 5). Contribution of energy by macronutrients was similar in both men and women
Figure 5 : Median Percentage of Energy from Macronutrients
CHO = carbohydrate
Pro
po
rtio
n (
%)
Meals
100.00
80.00
60.00
40.00
20.00
0Breakfast Lunch Dinner
68.96
31.04
69.00
31.00
82.78
17.22
At Home
Outside
Intakes of selected micronutrients were also analysed. The median sodium intake among Malaysian adults was about 2,300 mg/day. Sodium intake did not differ much by strata (rural 2,283 mg/day; urban 2,321 mg/day).

170 Director General Technical Report ( DGTR )
Daily Consumed Foods
The median intake for calcium was 353 mg/day or 43% of the RNI. Comparison by gender showed that women took less calcium (334 mg/day) than men (374 mg/day). For all demographic, socio-economic and Body Mass Index (BMI) groups, the achievement of recommended level for calcium did not exceed 50%.
The median intake of iron was about 8.7 mg/day, with men having a higher intake (9.5 mg/day) than women (8.2 mg/day). While men achieved more than 60% of RNI for iron, women satisfied only 30% of the recommended level.
The median intake of vitamin C was about 39 mg/day or 55% of the recommended level. The percent of RNI for vitamin C intake was higher with age, although achievement was less than 60%. The median intake of vitamin A was around 380 μg/day or 68% of recommended intake for vitamin A.
Cooked rice (nasi) was eaten by 97% of the population twice daily and the average amount eaten was 2½ plates per day. Other food items eaten daily were marine fish, (one medium fish per day), green leafy vegetables (one cup per day) and sweetened condensed milk (three teaspoons per day) (Table 1).
There were differences in the prevalence of daily consumption of foods between the urban and rural population, and also between men and women. The mean frequencies for daily intake of rice, leafy vegetables, marine fish, local kuih, ikan bilis (anchovy) and biscuits were significantly higher among the rural adults compared to the urban. The prevalence of daily consumption of marine fish among rural adults was 51.2% but only 33.6% among urban adults. In contrast, urban dwellers were more frequent eaters of chicken and eggs. Men also ate chicken and eggs more frequently than women. Comparing the age groups, 20.8% of adults below 20 years of age consumed chicken at least once a day, while this pattern of intake was not seen in the older age groups.

171Director General Technical Report ( DGTR )
Type of food
Cooked rice
Marine fish
Green leafy vegetables
Sweetened condensed milk
Powdered milk
Bread
Biscuit
Local “kuih”
Chicken egg
“Ikan bilis”
Prevalence who
answered daily
consumption (%)
97.15
40.78
39.89
35.55
17.13
17.11
16.30
16.30
12.06
11.94
Mean frequency
per day
2.00
1.61
1.47
1.57
1.41
1.24
1.25
1.25
1.15
1.24
Total amount
consumed daily
2 ½ plates
294.06 gram
1 ½ medium
100.27 gram
1 cup
93.26 gram
3 teaspoons
50.93 gram
3 teaspoons
20.61 gram
3 slices
96.48 gram
5 pieces
55.66 gram
2 pieces
62.27 gram
1 whole medium
71.84 gram
2 tablespoons
15.45 gram
Table 1 : Prevalence and Mean Frequency of the Top 10 Daily Consumed Foods
Our findings showed that intake of full cream milk differs with age. Adults aged 50 - 59 years had the highest prevalence of daily consumption of full cream milk (23.5%) while those aged 18 - 19 years had the lowest at 14.7%. Overall, the amounts consumed by all age groups were below the recommended levels.
Adult Malaysians were also found to consume about 30 grams of sweetened condensed milk (equivalent to three teaspoons) per day and 21 gram of sugar (equivalent to four teaspoons) per day, amounting to approximately seven teaspoons of sugar per day. About 43% of men consumed sweetened condensed milk compared to 28.3% of women.
Milk Consumption

172 Director General Technical Report ( DGTR )
Weekly Consumed Foods
Bean vegetables were consumed by 73% of the population about twice weekly. The average amount eaten was one cup per week. Other food items consumed weekly were chicken eggs (72%, three eggs per week), chicken meat (69 %, three pieces per week) and cabbage (66%, one cup per week) (Table 2).
Table 2 : Prevalence and Mean Frequency of the Top 10 Weekly Consumed Foods
Type of food
Bean vegetables
Chicken egg
Chicken meat
Cabbage
Local kuih
Wheat noodles
Rice-based noodles
Bread
Green leafy vegetables
Tubers
Prevalence who
answered weekly
consumption (%)
72.7
72.1
69.1
66.3
63.5
59.3
58.0
56.9
54.4
54.0
Mean frequency
per week
1.99
2.50
2.38
1.79
2.19
2.13
2.01
2.47
2.73
1.82
Total amount
consumed
weekly
1 cup
97.55 gram
3 whole medium
149.05 gram
3 pieces
196.80 gram
1 cup
122.60 gram
4 pieces
120.54 gram
1 bowl
(371.77 gram
1 bowl
(403.49 gram
6 slices
(205.28 gram
2 cups
(152.22 gram
1 cup
(109.69 gram
Our results also demonstrated that Malaysian adults had a satisfactory habit of drinking plain water, with 98.5% drinking at least six glasses of plain water daily. Other beverages with a high prevalence for daily consumption were tea (47.5%), coffee (27.7%), chocolate-based drinks (22.8%) and cordial syrup (11.0%).
Liquid Consumption

173Director General Technical Report ( DGTR )
Baseline Data
Comparing Consumption Pattern to the Malaysian Food Pyramid
Discussion
The present study provides the first national estimates on intake of energy and nutrients of Malaysians. The study found that energy intake of Malaysian adults fall short of the recommended intake, while intakes of macronutrients seem to be well within the recommendations for a healthy diet. The intakes of major micronutrients were less than two thirds of the RNI. Calcium and iron were found to be the most inadequate, particularly among women across socio-demographic groups and BMI status. As nearly half of the studied population had under-reported their energy intake, cautious interpretation of the current findings is advised.
The intake for each food item was averaged over the one-year period. Based on their daily, weekly, monthly, yearly and seasonal consumption pattern, the average intake per day in grams and number of servings per day for each food item was calculated. The mean intakes per day for various foods were put into groups as in the Malaysian Food Pyramid. The average consumption was then compared to the recommendations in the Malaysian Food Pyramid (Table 3).
Table 3 : Comparison of Daily Food Intake among Survey Population with the Malaysian Food Pyramid Recommendations
Food group
Cereal, cereal products
and tuber
Fruits and Vegetables
Meat, poultry, fish,
legumes and products
Milk and dairy
products
Malaysian
Food Pyramid
recommendations
(No. of servings
per day)
8-12
5
2-3
1-2
Intake by survey
population
(No. of servings
per day)
9.9
6.34
8.72
0.14
Meet Malaysian
Food Pyramid
recommendations?
Yes
Yes
Excess
No

174 Director General Technical Report ( DGTR )
Overall, the survey population’s average daily intake met the recommendations for intake of foods in the cereal group, fruits and vegetable group and the meat group. The consumption of meat group more than fulfilled the suggested recommendation of 2 - 3 servings per day, with the survey population consuming almost nine servings of foods in the meat group per day. However, milk consumption was much below the recommended intake. Malaysians tended to consume milk in the form of sweetened condensed milk which was habitually added to beverages such as tea, coffee and chocolate-flavoured beverages.
Conclusion
This National Nutrition Survey (2002-2003) has found that energy intake and intakes of major micronutrients among Malaysians fall short of recommended levels, while macronutrients were well within the recommendations for a healthy diet.
The traditional practice of consuming three main meals per day is still in place in Malaysia and home-prepared meals are still the major contribution to the Malaysian diet or food intake. In terms of food groups, overall, majority of the Malaysian population meet the Malaysian Dietary Guideline for most food groups except for milk.

175Director General Technical Report ( DGTR )
PRIVATE HEALTHCARE FACILITIES AND SERVICE ACT 1998 - A YEAR AFTER IMPLEMENTATION
SUMMARY
The Private Healthcare Facilities and Services Act 1998 [Act 586] and its regulations went into force on 1st May 2006. In its initial stage of implementation, several meetings were held between Ministry of Health and respective stakeholders. The Medical Practice Division together with the State Health Departments, held road-shows throughout the nation to explain the Act and to reassure facilities in the registration and licensing of the private healthcare facilities. As of 1st September 2007, 68.6% applications by the private medical clinics and 22.6% applications by the private dental clinics had already been approved. Among facilities that had been licensed were 199 private hospitals, 21 private maternity homes, 10 private nursing homes, 2 private hospices, 2 private ambulatory care centres and 6 haemodyalisis centres. The first enforcement activity was carried out on 11th October 2006 involving a traditional treatment centre in Shah Alam. To date, a total of 22 premises had been sealed. In materialising this Act and its regulations, the medical inspectors were exposed to many issues and challenges. Several meetings were conducted with professional bodies and Non-Governmental Organisations in view of the issues and shortcomings arising from the implementation of the Private Healthcare Facilities and Services Act 1998 and Regulations. In conclusion, a year after the implementation of Act 585, the Ministry felt that the nation had benefited from it. Currently the public are aware of their rights while seeking treatment from the private healthcare sector.
Introduction
The Private Healthcare Facilities and Services Act 1998 [Act 586] and its regulations were gazetted on 1st April 2006 and went into force on 1st May 2006. This Act replaces the Private Hospital Act 1971 [Act 43] and its regulations
which only loosely regulated the private hospitals, private nursing homes and private maternity homes in Malaysia. The long awaited implementation of this Act was positively welcomed, much to the delight of the consumers of healthcare services and also the Ministry of Health (MOH). With the coming of this Act the healthcare sector of this country can be comprehensively controlled and regulated. However the Act did receive mixed reactions from various
Implementation of Act 586 and its regulations
176 Director General Technical Report ( DGTR )
Commitment of the Ministry of Health
Initial response by the stakeholders
Steps taken by MOH
Negotiations to facilitate registration of clinics
stakeholders which include the private medical practitioners and other private healthcare providers.
Early Stages of Implementation
Several meetings and discussions between the Ministry of Health (Ministry) and the stakeholders were held to discuss legal and implementation issues related to the Act. The parties involved included the Malaysian Medical Association (MMA), Malaysian Dental Association (MDA), Federation of Private Medical Practitioners Association of Malaysia (FPMPAM), and the Association of the Private Hospitals Malaysia (APHM). The aim was also to clarify the stand of the Ministry of Health and to reassure the stakeholders that the Ministry would be fair in all its undertakings. The commitment on the part of the Ministry was shown by the involvement of the Honourable Minister of Health and the Director General of Health in all these meetings.
Despite all these efforts by the Ministry, there was a lukewarm response received from stakeholders for registration of clinics in the initial phase. Instead doctors and professional associations continuously criticised the Act in the press calling it a “draconian law”, “criminalising doctors”, “micro-managing practice of medicine” etc. The Ministry was not spared either and was accused of not consulting with the professional bodies as well as “rushing” into enforcing the law.
The Ministry appeared to be holding the ground alone except for a few individuals that supported the implementation while all consumer associations kept mum. The Ministry realised that the main reason for the outcry by the doctors and the silence by the consumer associations was due to the lack of understanding of what the Act was all about and what it was intended to deliver. The Medical Practice Division together with the respective State Health Departments then held road-shows throughout the nation to meet individual doctors to explain the Act and to facilitate the registration of their clinics.
Registration of clinics
As the time granted for the grace period of six (6) months to the private medical and dental clinics to submit their applications approached an end, tension built up within the Medical Practice

177Director General Technical Report ( DGTR )
Outcome of registration exercise by the end of 2006
Regulating private healthcare facilities other than clinics under Act 586
Division over the poor response to the registration of clinics. Describing it as a failure of implementation, the professional associations called upon the Ministry to put the implementation of the Act on hold. The Ministry reacted by giving some concessions to the registration procedures but held the ground by not allowing an extension of the grace period as demanded.
As the time ticked towards 1st November 2006, at the end of the statutory grace period, there was a sharp surge of applications for registrations which accounted for almost 90% of the estimated clinics in the country. That concluded the initial step of implementation of the registration exercise of clinics that ended with a sweet victory to the Ministry.
By the end of 2006, there were almost 7000 applications received by the Medical Practice Division of the Ministry of Health. These applications had to be checked and facts verified. Completed applications were then presented to the Evaluation Committee chaired by the Deputy Director General of Health (Medical). Those applications passed by this committee were submitted to the Director General for his consent and approval. As of 1st September 2007, 68.6% (4,234 out of 6,176) applications by private medical clinics and 22.6% (314 out of 1,389) applications by private dental clinics had already been approved (See Appendix 1).
Approval and Licensing of Private Hospitals and Other Facilities All existing private healthcare facilities which had been licensed under the Private Hospitals Act 1971 were deemed to be licensed under the Private Healthcare Facilities and Services Act 1998. For new applications of private hospitals and other private healthcare facilities, a two-tier process of application was introduced, first for approval “to establish or maintain” and the second for license “to provide and operate” a private healthcare facility or service. The application amongst others required submission of architectural plans, justification of the need for a new facility or service at the proposed location, the human resource plan and description of any hi-tech equipment intended to be used. Pre-licensing inspection was conducted and a report on compliance to the prescribed standards prepared. Other aspects of criteria for licensing included minimum professional requirements, nursing norms, documents such as the Certificate of Fitness of the building, Certificate of Fitness of the

178 Director General Technical Report ( DGTR )
Response by stakeholders on approval and licensing
Enforcement activities
Offences and Penalties under Act 586
elevators and autoclaves, Fire Certificate and/or support letter from the Fire Department and blood supply agreement with blood banks, to name a few.
Although the procedure for approval and licensing process of private hospitals and other private healthcare facilities was more tedious than that of private clinics, the process has been rather smooth. This could be attributed to the type of ownership which was mainly company-owned as compared to sole proprietorship in the clinics. Being better organized, the companies could fulfil all the requirements for approval and licensing. To date, a total of 199 private hospitals, 21 private maternity homes, 10 private nursing homes, 2 private hospices and 2 private ambulatory care centres have been licensed under the Ministry of Health. In the case of private haemodialysis centres, out of a total of 174 private haemodialysis centres which had been granted approval to establish or maintain services, only 6 have been granted a license to operate or provide the service (See Appendix 2).
Enforcement
The first enforcement activity was carried out on 11th October 2006 involving a traditional treatment centre in Shah Alam following a complaint by the public. Prior to that, a verification inspection had been carried out by a team of medical inspectors from the Selangor State Health Department and the Medical Practice Division to substantiate the complaint. Following this, a series of raids were carried out in various states throughout the country. These raided premises were either unregistered or unlicensed or employing unregistered medical practitioners or unqualified practitioners to run the premises. To date, a total of 20 clinics had been raided and these raids were namely in Selangor (6), Johor (7), WP Kuala Lumpur (2) and one each in Negeri Sembilan, Perak, Sarawak, Penang and Kedah.
Fifteen (15) of these clinics will be charged under section 4(1) of Act 586 which states “that no person shall establish, maintain, operate or provide a medical clinic or private dental clinic unless it is registered under section 7”. The other clinics will be charged under section 31(1)(c) of Act 586 which delineates that “a licensee or a holder of a certificate of registration in respect of a licensed or registered private healthcare facility or service shall ensure that persons employed or

179Director General Technical Report ( DGTR )
“Policy on Enforcement - Act 586”
Separation of powers
Lacuna in law for approval and licensing of private haemodialysis centres
engaged by the licensed or registered private healthcare facility or service are registered under any law regulating their registration, or in absence of any such qualification, hold such qualification and experience as are recognised by the Director General”.
After a year of enforcement, the Medical Practice Division has published a booklet entitled “Policy on Enforcement - Act 586”. This policy lays down the general stance of the Ministry in enforcing the Act, the basic requirements of an enforcement team and broad principles of the procedures during enforcement.
Issues and Challenges
Enforcement and the licensing process should be separated to promote transparency and integrity in decision making. For the licensing process an evaluation committee was formed in July 2005. The Evaluation Committee’s role is to examine and endorse all completed applications and to make recommendations to the Director-General of Health. The chairman of the Committee is the Deputy Director-General of Health (Medical) with members comprising representatives from the Planning and Development Division, Pharmaceutical Services Division, Engineering Services Division and Medical Practice Division. To facilitate the examination of floor plans, a subcommittee was formed to review all floor plans submitted for registration or approval or licensing. The subcommittee was made up of representatives from the Medical Practice Division, Planning and Development Division and Engineering Services Division.
In the past one (1) year, it was found that more than 50% of applications received were incomplete. Experience showed that steps taken to communicate or correspond to applicants regarding these deficiencies resulted in a period of many months before the problems could be solved. Sometimes it was necessary for the Ministry to give deadlines and reminders. Otherwise the applicants faced the consequence of applications being returned.
The existing private haemodialysis centres in the country are mainly run by societies or companies on a charity or volunteer basis. The Act provides approval or license to be awarded only to a sole proprietor, partnership or body corporate. “Body corporate” is further defined as those incorporated under the Companies Act 1965. Problems arise

180 Director General Technical Report ( DGTR )
Interpretation of the law
in cases of statutory body corporate other than those incorporated under the Companies Act 1965 for example the St. John’s Ambulance Malaysia and the Malaysian Red Crescent Society. To overcome this problem, these bodies were urged to form private arms so that these haemodialysis centres can be legalised. In addition, these bodies are faced with problems of getting willing registered medical practitioners to become the “person-in-charge”. Their reason was that being a voluntary or a charitable body, no private medical practitioners would want to put themselves in a position of responsibility and run the risk of being personally prosecuted should there be a breach of law. This is despite the willingness on the part of these bodies to buy indemnity insurance for the private medical practitioners. To overcome this problem, the Director-General of Health has allowed Government medical officers to be involved in any volunteer or charitable body as the person-in-charge. A circular to that effect was issued to all states.
The Ministry also found variations in the provision of services in the private sector which include performance of day care procedures on an outpatient basis. Although there were attempts by some private clinics to mislead the Ministry into believing that the specialists involved were only practising outpatient care but information from the respective medical specialty bodies showed otherwise. It was revealed that these specialists will inevitably be involved in some form of procedures. The question would be what procedures would be considered safe to be conducted in clinic settings and what would not. This has led to several discussions with these bodies and the promulgation of guidelines to govern this practice. To date, there is a guideline for ophthalmologists where certain eye surgeries have been allowed to be performed on an outpatient basis. In the pipeline are guidelines regulating the practice of gastroenterology and aesthetic medicine in the outpatient setting.
Ongoing meetings have also been conducted with professional bodies and Non-Governmental Organisations in view of issues and shortcomings arising from the implementation of the Private Healthcare Facilities and Services Act 1998 and Regulations. Among the issues raised were “unfair” fee schedules, kickbacks by managed care organisations and general provisions with regard to basic amenities and clinic cleanliness. The Ministry has been urged to make amendments to the relevant provisions of the 2006 Regulations.

181Director General Technical Report ( DGTR )
Applying the enforcement clauses of the Act
Experience gained during raids showed that much more “experimentation” with the enforcement clauses should be carried out. So far, various categories of private healthcare facilities and services such as private medical or dental clinics, hospitals and ambulatory care centres have been tested during these raids. The option to seal a private clinic or ‘render it inoperable” by seizing all medical equipments and documentation has brought about results and this option was supported by the Deputy Public Prosecutor. The Act has also enabled the Ministry to weed out unqualified practitioners such as medical assistants, nurses, or foreigners from practising in these facilities. However, amendments to the enforcement clauses of the Act need to be looked at in the future to facilitate a more efficient and effective enforcement.
Conclusion A year after the implementation of the Private Healthcare Facilities and Services Act 1998, the Ministry has seen the benefits to the citizenry. There is now more public awareness of their rights while seeking treatment from the private healthcare sector. The long arm of the law made it very clear that there was no place for bogus doctors as private healthcare facilities and services which employed such persons would be sealed. The medical and dental professionals should now realise that their trade is not just being regulated through professional guidelines and Codes but also in the facilities where they practice and in services they render. Experience gained from implementation should be the guiding principle for any amendments to Act 586 and its Regulations by the Ministry in the future.

182 Director General Technical Report ( DGTR )
Appendix 1 : Number of Private Medical Clinics and Private Dental Clinics by State (as of 31st August 2007)
Source: Medical Practice Control Section 31 August 2007
PRIVATE MEDICAL CLINIC PRIVATE DENTAL CLINIC
STATE No. of Applications
No. of Approved Applications
No. of Applications
No. of Approved Applications
Johore 755 301 159 38
Kedah 323 308 47 22
Kelantan 173 138 46 5
Malacca 263 163 32 4
Negri Sembilan 255 229 47 18
Pahang 212 199 43 25
Penang 451 402 104 39
Perak 586 400 96 37
Perlis 31 29 4 2
Selangor 1447 862 363 42
Terengganu 137 129 36 5
Sabah 291 200 75 18
Sarawak 291 203 78 6
Federal Territory (KL) 952 665 256 53
Federal Territory (Labuan) 9 6 3 0
TOTAL 6176 4234 1389 314

183Director General Technical Report ( DGTR )
STATE PRIVATE
HAEMODIALYSIS CENTRE
PRIVATE HOSPITAL
PRIVATE MATERNITY
HOME
PRIVATE NURSING HOME
PRIVATE AMBULATORY CARE CENTRE
PRIVATEHOSPICE
Johore 0 28 3 6 0 0
Kedah 0 11 0 1 0 0
Kelantan 0 3 0 0 0 0
Malacca 1 4 1 0 0 0
Negri Sembilan
2 5 0 0 0 0
Pahang 0 9 1 0 0 0
Penang 2 21 2 0 0 2
Perak 0 14 2 0 0 0
Perlis 0 0 1 0 0 0
Selangor 0 45 5 0 0 0
Terengganu 0 1 2 0 0 0
Sabah 0 8 1 0 0 0
Sarawak 0 10 0 1 0 0
Federal Territory (KL)
1 40 3 2 2 0
Federal Territory (Labuan)
0 0 0 0 0 0
TOTAL 6 199 21 10 2 2
Appendix 2 : Number of Licensed Private Healthcare Facilities and Services by State and Category (as of 31st August 2007)
Source: Medical Practice Control Section 31 August 2007

184 Director General Technical Report ( DGTR )
NEW APPROCH ON DENGUE AND CHIKUNGUNYA CONTROL
SUMMARY
Dengue, a viral fever transmitted by Aedes mosquito species, is the most rapidly spreading vector borne disease in the world with over 100 million cases per year in over 100 countries. Malaysia has had an average of 36,000 clinical cases per year in the last 4 years, and the situation is expected to worsen in 2007 with the resurfacing of DEN-2 and DEN-3 virus serotypes. There is no specific treatment, and a safe and effective tetravalent dengue vaccine is at least a decade away. Conventional Aedes control methods like fogging and breeding site reduction cannot prevent dengue outbreaks by themselves as seen from numerous examples around the world, especially Singapore. An important reason for this is the low entomological threshold for dengue transmission, which can be as low as 3 adult female mosquitoes emerging every day in a locality of 100 people. Recent advances in molecular biology and genetics at the University of Oxford and its part-owned company Oxitec has led to a biotechnology solution to dengue known as RIDL®, which can be applied as part of the integrated vector control programme. Following proofs-of-concept and regulatory approvals, this technology is to be evaluated by the Institute for Medical Research, Ministry of Health under contained and open field conditions, and if successfully proven, could be a long-term biotechnology solution to dengue as well as other Aedes-borne diseases like chikungunya and yellow fever.
Dengue is a problem of national importance
Introduction
Dengue is the most rapidly spreading vector borne disease in the world (WHO 2006). Two-fifths of the world’s population (2.5 billion people) are at risk, with over 100 million cases annually in over 100 countries. Malaysia is
one of the worst affected countries, with an average of 36,000 clinical cases per year in the last 4 years (Figure 1). At the time of writing this report, dengue cases and deaths in 2007 are more severe than the comparable period in 2006.
The virus that causes dengue and dengue hemorrhagic fever is an arbovirus with four antigenically distinct serotypes (DEN-1, 2, 3 and 4) that offer no permanent cross-protective immunity against each other. DEN-1 is endemic to Malaysia while DEN-2 and DEN-3 have resurfaced, resulting increased cases of DHF and deaths.

185Director General Technical Report ( DGTR )
Conventional control strategies cannot solve the problem by themselves
Dengue Challenges
Unfortunately, there is no specific treatment for dengue, and a safe tetravalent vaccine is still in development and at least a decade away from being available for widespread use. As Aedes is a day-biting mosquito, bed nets are also not very effective against Aedes-borne diseases like dengue or chikungunya. The current strategy is to control the mosquito vectors, Aedes aegypti (primary vector) and Aedes albopictus (secondary vector), using conventional methods such as fogging with insecticides and breeding site reduction. However, these methods cannot prevent dengue outbreaks by themselves as seen from examples around the world, especially Singapore. An important reason for this is the low entomo-logical threshold for transmission of dengue, as low as 3 adult female mosquitoes emerging every day in a locality of 100 people.
This does not call for discontinuation of conventional vector control methods; in fact it would be necessary to continue public education and ‘COMmunication for Behavioural Impact’ (COMBI) for sustained breeding site reduction involving the public. Legally-enforced larval control is neither practical for a large and diverse country like Malaysia, nor has it stopped the resurgence of dengue in Singapore. Although fogging has been shown to have a limited impact and may have other implications (such as resistance and residues in the environment), it is unlikely that an integrated
Figure 1 : Dengue Cases (clinical) in Malaysia
Source: Vector Borne Disease Control Section, Ministry of Health Malaysia, 2006
0 50 100 150
Deaths
Cases (000)
2005
2004
2003
2002
2001
2000

186 Director General Technical Report ( DGTR )
The Sterile Insect Technique has been successfully used to locally eradicate pests such as the new world screw worm and Mediterranean fruit fly
vector control programme in the future could totally do away with fogging. It would be necessary to continue fogging in some measure to bring down the vector population. In fact, the Institute for Medical Research (IMR) in Kuala Lumpur routinely conducts field evaluations of new pyrethroid formulations and new surfactant monomolecular films against Aedes aegypti but all these have been found to be effective only under certain conditions. The IMR has also formulated and tested microbial control agents such as Bacillus thuringiensis H-14 (Bti) against container-breeding Aedes larvae. However, none of the aforesaid methods, by themselves or together, have been able to stop the spread of dengue, mainly due to the low transmission threshold as mentioned above.
RIDL® - a promising biotechnology solution
The IMR has therefore refocused its research efforts on the evaluation of new technologies that seem promising to reduce the vector population below the low dengue transmission threshold. One such technology that is currently under evaluation by the IMR is called RIDL®. This new biotechnology solution for dengue, based on advances in molecular biology and genetics made at the University of Oxford and its part-owned company Oxitec, has won recognition and funding from the Grand Challenges in Global Health competition. Using its proprietary RIDL® technology, Oxitec has developed genetically sterile male Aedes aegypti mosquitoes which are destined to produce offspring that will all die as larvae or pupae. By releasing large numbers of these sterile male mosquitoes (which cannot bite) in a sustained manner, Aedes aegypti population can be crashed below the disease transmission threshold, and possibly even eradicated within a year in communities of up to a million people according to research led by Stanford University.
The idea of releasing sterile insects in large numbers to control pests is itself not new, but a well-known concept that was developed by American entomologists Raymond Bushland and Edward Knipling in the 1950s for which they received the 1992 World Food Prize. The Sterile Insect Technique (SIT) has set very successful precedents around the world, most notably by controlling the Mediterranean fruit fly (Ceratitis capitata), and by eradicating the new world screw worm (Cochliomyia hominivorax) from the United States and Central America all the way up to Panama. The largest sterile

187Director General Technical Report ( DGTR )
The Government of Malaysia has signed an agreement with Oxitec to field evaluate its promising RIDL® technology
insect plant in the world is in Guatemala, and produces over 2 billion sterile medflies per week.
However, the SIT has hitherto not been successful with mosquitoes such as Aedes in spite of decades of efforts by the IAEA because radiation (used in classical SIT to sterilise the insects) renders the mosquitoes very weak and unfit to compete with the male mosquitoes in the wild. However, this problem now seems to be over because RIDL® uses genetic methods instead of radiation to achieve sterility, therefore the genetically sterile RIDL® insects have been reported to be fitter and competitive.
The University of Oxford has established proof-of-concept of its RIDL® technology in collaboration with Imperial College, London School of Hygiene & Tropical Medicine, Oxitec and Stanford University. In addition, the fitness of genetically sterile Aedes aegypti has also been independently verified in laboratory studies conducted by the Institut Pasteur in Paris.
Following these proofs-of-concept, and upon the invitation of Malaysia’s Ministry of Health, Oxitec signed a MoU with the IMR and a legal agreement with the Government of Malaysia whereby the IMR will conduct field evaluation of the RIDL® technology, initially under total containment. This project has been cleared by the Director-General of Health and the Economic Planning Unit of the Prime Minister’s Department, and has obtained the support of the Vector Borne Disease Control Section of the Ministry of Health. The Malaysian Industry-Government Group for High Technology (MiGHT) has recognised this work to be ‘of national importance’.
Following site inspections and presentations to three different committees including the national Genetic Modification Advisory Committee (GMAC), the IMR will conduct fully contained trials in 2007, in a purpose-built facility located within its Jalan Pahang campus in Kuala Lumpur. This facility comprises of a state-of-the-art field house which is perhaps one of its kind in the world (Figure 2), and an Arthropod Containment Level 2 laboratory to rear and analyse the genetically sterile mosquitoes.
If the fully contained evaluation in the field house is successful, the IMR will seek further regulatory and ethical clearances (from the Genetic Modification Advisory Committee and the Medical Research Ethics Committee) to conduct open trials in a remote island with

188 Director General Technical Report ( DGTR )
Chikungunya is a major threat to Malaysia
the consent and involvement of local health authorities. Based on larval survey, the IMR and the Vector Borne Disease Control Section of the Ministry of Health have selected an island P. Ketam for this purpose, and initiated baseline studies to understand the native mosquito population dynamics in this island.
Figure 2 : Interior (top) and Exterior (bottom) view of the state-of-the-art field house
Source: Institute for Medical Research (IMR), Ministry of Health Malaysia, 2006
Chikungunya
Chikungunya, another Aedes-borne viral infection, poses a significant threat to Malaysia. Although the outbreaks in 2006 and 1999 were contained (Table 1), the threat of chikungunya can be easily seen from the experience of countries like India and the French Réunion. In 2006, India had 1.4 million suspected cases of chikungunya, while the 2005-06 outbreak in the French Réunion affected a third of the island’s population. With Visit Malaysia Year coming up in 2007, the emerging threat from chikungunya to the nation and its tourism revenues cannot be underestimated.
Table 1 : Chikungunya in Malaysia
Source : Vector Borne Disease Control Section, Ministry of Health Malaysia, 2006
*this is a conservative estimate because the MOH is yet to assign a specific officer to monitor chikungunya and compile the cases
Affected Locations
Port Klang, Selangor
Perak
Cases*
27
227
1999
2006

189Director General Technical Report ( DGTR )
If the RIDL® technology is proven to work, it may not only solve dengue but also chikungunya and yellow
Virologically, chikungunya is different from dengue because the former is caused by an alphavirus. However, from an entomological point of view and from the disease management point of view, the two diseases are quite similar. Like dengue, chikungunya also has no specific medication, vaccine still in development, and little protection from bed nets because Aedes bites during the day. The limitations of conventional Aedes control methods discussed earlier in the context of dengue are equally applicable to chikungunya, therefore RIDL®, if proven to work in trials conducted by the Ministry of Health, could be a long-term biotechnology solution to dengue as well as other Aedes-borne diseases such as chikungunya and yellow fever.
Conclusions
Dengue control is a project of national importance, as the number of cases have averaged nearly 36,000 annual cases in the last four years, and two serotypes (DEN-2 and DEN-3) have resurfaced in the country. Chikungunya is an emerging threat to Malaysia even though the 1999 and 2006 outbreaks were contained. Both these diseases have no specific medications, no safe vaccines in sight, and solutions like bed nets are not applicable because Aedes mosquitoes which carry these diseases bite during the day. Conventional vector control methods have been unable to prevent outbreaks or arrest the spread of these diseases, both globally and in Malaysia. An important reason for this is the low entomological threshold for dengue transmission, which can be as low as 3 adult female mosquitoes emerging every day in a locality of 100 people. Recent advances in molecular biology and genetics at the University of Oxford and its part-owned company Oxitec has led to a biotechnology solution for dengue known as RIDL®, which seems to be a promising method that could reduce the population of Aedes aegypti below the transmission threshold if applied in a sustained manner as part of an integrated vector control programme. Following proofs-of-concept and regulatory approvals, this technology is to be evaluated by the Ministry of Health under contained and open field conditions. If proven to work, RIDL® could be a long-term biotechnology solution to dengue as well as other Aedes-borne diseases like chikungunya and yellow fever.

190 Director General Technical Report ( DGTR )
1. Atkinson MP, et al., Analyzing the Control of Mosquito-borne Diseases by a Dominant Lethal Genetic System, Proceedings of the National Academy of Sciences of the United States of America, 104 (22): 9540, 2007.
2. Centers for Disease Control and Prevention (Dengue Branch), Dengue Fact Sheet, San Juan, Puerto Rico, 7 January 2005.
3. Cruez AF, 2 deadlier dengue viruses reappear, The New Straits Times, 11 January 2007.
4. Curtis C, Review of previous applications of genetics to vector control, In: Bridging Laboratory and Field Research for Genetic Control of Disease Vectors, Eds. Knols BGJ and Louis C, Springer ISBN: 1-4020-3800-3, 2006.
5. Focks DA, et al., Transmission thresholds for dengue in terms of Aedes aegypti pupae per person with discussion of their utility in source reduction efforts, Am. J. Trop. Med. Hyg., 62 (1): 11, 2000.
6. Jain S, A resident of 100 nations, but few know how to get this killer, The Indian Express (Front Page), 6 October 2006.
7. Olson KE, et al., Genetic approaches in Aedes aegypti for control of dengue: an overview, In: Bridging Laboratory and Field Research for Genetic Control of Disease Vectors, Eds. Knols BGJ and Louis C, Springer ISBN: 1-4020-3800-3, 2006.
8. Phuc HK, et al., Late-acting dominant lethal genetic systems and mosquito control, BMC Biology, 5: 11, 2007.
9. Reiter P, Institut Pasteur Paris, personal communication, 2006.
10. Vasan SS, The promise of SIT (Sterile Insect Pest Technique) in dengue control, CME/CPD Programme Guest Lecture, Institute for Medical Research, Kuala Lumpur, Malaysia, 13 March 2006.
11. Word Health Organization, Fact Sheet N°117: Dengue and dengue hemorrhagic fever, Geneva, Switzerland, April 2002.
12. World Health Organization, Report of the Scientific Working Group meeting on Dengue, Geneva, Switzerland, 1-5 October 2006.
Bibliography

191Director General Technical Report ( DGTR )
THE NATIONAL PHARMACEUTICAL CONTROL BUREAU AND ITS ROLE IN QUALITY ASSURANCE OF PHARMACEUTICAL
PRODUCTS
SUMMARY
The National Pharmaceutical Control Bureau (NPCB) plays a major role in ensuring the quality, safety and efficacy of pharmaceutical, traditional medicines, health supplements and cosmetic products available in the Malaysian market. Controlling the quality of a product before and after marketing authorization is critical to ensure the quality and safety of drugs. Laboratory assessments of samples of marketed drugs enable NPCB to evaluate the quality of products used in Malaysia and to identify problems pertaining to drug quality. In doing so, it helps minimize the amount of sub-standard medicinal products in circulation. As a WHO Collaborating Centre for Regulatory Control of Pharmaceuticals and member of the Pharmaceutical Inspection Co-operation Scheme (PIC/S), NPCB has played an exemplary role in the international regulatory arena. Technical collaboration with the WHO and other regulatory agencies has been enhanced in various aspects such as GMP inspections, networking in surveillance and pharmaco-vigilance, evaluation of dossiers for pre-qualification program, quality control of herbal medicines, analytical validation and proficiency testing.
Introduction
Malaysia has developed and enforced a series of drug legislations that regulate the registration, import, export, manufacture, distribution, prescribing, dispensing, sale, use, advertising and licensing of
drugs in this country.
The promulgation of the Control of Drugs and Cosmetics Regulations in June 1984 marked the dawn of systematic regulatory control of pharmaceutical products in Malaysia. In Malaysia, all pharmaceutical products, innovator and generic, undergo quality control inspection by the National Pharmaceutical Control Bureau (NPCB), the country’s drug regulatory body. NPCB ensures the quality, efficacy and safety of pharmaceuticals through registration of products and licensing of premises. NPCB also monitors the quality of registered products in the market and any adverse drug reactions.
Drug legislation and regulation

192 Director General Technical Report ( DGTR )
Ensuring the Quality of Pharmaceutical Products
Quality is of great importance in the Ministry of Health (MOH). The quality assurance of pharmaceutical products is a wide-ranging concept covering all matters that, individually or collectively, influence the quality of a product such as setting of specifications, sampling, testing and analytical clearance. This ensures that the raw materials, intermediates, packaging materials and finished pharmaceutical products conform to established specifications for identity, strength, purity and other characteristics. It is the totality of the arrangements made to ensure that pharmaceutical products are of the quality required for their intended use.
The quality of pharmaceutical products can be affected by a lack of adequate control over numerous activities which occur throughout its life cycle. In order to maintain the original quality every activity in the manufacture, storage and distribution of pharmaceutical products must be carried out according to the principles of good manufacturing practice (GMP), good storage practice (GSP) and good distribution practice (GDP).
Drug Registration
The drug registration exercise was implemented in phases, commencing with Phase 1 for prescription drugs in 1985, Phase 2 for over-the-counter (OTC) products in 1988, Phase 3 for traditional medicines in 1992 and Phase 4 for cosmetics in 2004.
With a mission of ensuring safety, efficacy and quality of pharmaceutical products, the Malaysian Drug Control Authority (DCA) was established in 1985. These regulations which are established under the Sale of Drugs Act 1952 (Revised 1989) empower the DCA to implement the registration of products and licensing of premises. Therefore, it is the responsibility of the DCA to ensure that only registered products can be sold in Malaysian market and only licensed premises are allowed to be operated within the country.
The DCA has to-date registered a total of 145,139 pharmaceutical and healthcare products comprising 11,356 ( 7.8%) prescription drugs, 8,686 (6.0%) over-the-counter (OTC) medicines, 16,857 (11.6%) traditional medicines and 108,240 (74.6%) cosmetic products.
The Phases of Drug Registration
Role of the Drug Control Authority
Registration Statistics

193Director General Technical Report ( DGTR )
For the same period, a total of 17,801 applications were rejected. Of these, 4,290 were applications for registration of prescription drugs, 3,357 for OTC medicines, 9,529 for traditional medicines and 625 for cosmetics. This clearly demonstrates the commitment of NPCB in ensuring that only drugs that conform to acceptable standards and quality are allowed to be marketed. The annual registration statistics over the last two decades are shown in Tables 1 to 3 in the Appendix.
A total of 172,340 applications were received from 1985 to 2006, of which 17,019 (9.9%) were prescription drugs, 13,159 (7.64%) OTC products, 30,072 (17.5%) natural products and 112,090 (65.0%) cosmetic products. The number of applications received had shown increasing trends.
A total of 145,139 products had been registered by 2006, of which 11,356 (7.8%) were prescription drugs, 8,685 (6.0%) OTC products, 16,858 (11.6%) traditional medicines, and 108,240 (74.6%) cosmetics. The number of products registered display increasing trends for all categories.
In the last two decades, a total of 17,801 applications were rejected, of which 4,290 (24.1%) were prescription drugs, 3,357 (18.9%) OTCs, 9,529 (53.5%) traditional medicines and 625 (3.5%) cosmetics. There was high percentage of rejections of natural products and most were due to failure of samples tested.
Licensing
With effect from 1 January 2002, Malaysia has been a member of the Pharmaceutical Inspection Co-operation Scheme (PIC/S). Hence the PIC/S GMP Guidelines have been used by all pharmaceutical manufacturers in the country.
These consist of basic requirements documented in nine chapters and specific requirements that are stipulated in 18 annexes. Pharmaceutical manufacturers are required to comply with all nine chapters together with one or more annexes depending on the type of product or activities that are being carried out on the premises. The GMP code ensures that the manufacturer employs procedures, systems and equipment that are consistent and that will produce repeated outcomes, that is, the same standards of quality.
Adherence to Good Practices
The Role of Various Centres in NPCB

194 Director General Technical Report ( DGTR )
The Centre for Compliance and Licensing in NPCB plays an important role in ensuring that manufacturing premises for pharmaceutical products, traditional medicines and cosmetics adhere to the requirements of GMP. The Centre also co-operates with the State Pharmacy Enforcement Branches to ensure that licensed importers and wholesalers adhere to Good Storage Practice (GSP). The GMP inspection includes Good Laboratory Practice (GLP) aspects which are carried out by the Centre for Quality Control (CQC).
The number of licensed manufacturer, importer and wholesaler premises has shown an increasing trend (Figure 1). In 2006, 336 (16.0%) of these are manufacturers, 775 (37.0%) importers and 985 (47.0%) wholesalers. In the same year, there were 85 licensed pharmaceutical product manufacturers, 161 licensed traditional product manufacturers and 90 licensed cosmetic product manufacturers.
Increasing Licensed Premises
GMP Inspections and Advisory Services
Figure 1: Number of Licensed Premises (1999 - 2006)
Source: Information and Documentation System Unit, Ministry of Health Malaysia
1200
1000
800
600
400
200
01999 2000 2001 2002 2003 2004 2005 2006
Importer WholesalerManufacture
237305
985
205
322
686
227
315
722
214
326
890
217
316
875
227
456
867
309
686
984
336
776
985
No
. of
licen
sed
pre
mis
es
Year
Audits, inspections and surveillance activities enable drug regulatory authorities to monitor whether pharmaceutical operations are carried out in accordance to approved standards and guidelines. Activities include physical inspection and quality-testing of product samples.

195Director General Technical Report ( DGTR )
A total of 291 GMP inspections were conducted in 2006 compared to 226 inspections in 2005 (Figure 2). The number of advisory services given in 2006 was 172 compared to 184 in 2005. These activities help ensure that manufacturing premises of pharmaceutical products, traditional medicines and cosmetics licensed manufacturers adhere to the requirements of Good Manufacturing Practice (GMP).
Figure 2 : GMP Inspections and Advisory Inspections
250,000
200,000
150,000
100,000
50,000
0
2000 2001 2002 2003 2004 2005 2006
No. of teeth rendered fissured sealantsNo.. of Patients
Quality Control
Quality is an important part of the registration requirements for pharmaceuticals and traditional medicines. This include evaluation of documents such as protocols for analysis and testing of samples for pharmaceuticals. For traditional medicines, only documents for testing of samples are required. This quality aspect is under the purview of the Centre for Quality Control (CQC) which determines the methods and specifications for all tests based on Official Pharmacopeias, the relevant international standards, applicant’s documents as well as in-house methods. The same standards are applied during post-market surveillance of these products. Controlling the quality of a product, both before and after marketing authorization, is critical to ensure the quality and safety of drugs. The results of laboratory assessment of samples of marketed products enable NPCB to evaluate the actual quality of the product and to identify problems of drug quality. In doing so, it helps minimise the amount of sub-standard medicinal products in circulation.
The Processes of Quality Control
Analysis of samples
Source: Information and Documentation System Unit, Ministry of Health Malaysia

196 Director General Technical Report ( DGTR )
Personnel from the laboratories inspect the Quality Control laboratories of the pharmaceutical industry. Inspection helps improve the industry’s ability to perform quality control, eventually leading to better-quality drug on the market.
The majority of products analysis are undertaken for registration purposes, for surveillance of registered products in the market, for complaint cases on registered products and for enforcement samples. The total number of tests has increased from year to year (Table 1). Application begins with protocol of analysis evaluation before sample testing. For parenteral products, the applicant has to submit the protocol of analysis as well as validation data, while traditional medicine begins with sample testing.
Type of Tests
Registration samples
Surveillance samples
Complaint
Enforcement
Others
Total
2003
2,483
1,891
88
347
58
4,867
2004
1,807
2,158
122
179
7
4,273
2005
2,314
2,113
114
262
84
4,887
2006
2,196
2,690
110
156
35
5,187
Table 1: Amounts and Types of Samples Received (2003-2006)
The common analyses carried out are microbial limit tests (MLT), chemical tests, heavy metals (As, Hg, Pb), disintegration, dissolution, sterility, bacterial endotoxin and others such as toxicity, biochemical, biological, particle count, antibiotic assay.
There were a number of cases where the analyses did not comply with stated specifications (Table 2). For the year 2006, 8.8% samples failed to comply with the specifications. However, there had been a decrease in the test failures compared to previous years (9.8% in 2005, 11.6% in 2004 and 9.5% in 2003)
Non-compliance of Analyses

197Director General Technical Report ( DGTR )
Year
No. of tests done
No. of samples tested
No. of samples failed testing
2003
51,251
4180
397(9.5%)
2004
51,424
4847
561(11.6%)
2005
61,406
4605
449(9.8%)
2006
63,410
5185
458(8.8%)
Table 2 : Number of Samples Failed Testing (2003-2006)
Participating in proficiency testing schemes (PTS) provides a laboratory with an objective means of assessing and demonstrating the reliability of its data and also to assess its ability to perform tests competently.
The Centre of Quality Control, NPCB has carried out Laboratory Proficiency Testing to determine laboratory testing performance by means of inter-laboratory comparisons.
Post- marketing surveillance
A post-marketing surveillance programme implemented in 1990 ensures the continued quality, safety and efficacy of registered products in the Malaysian market. The NPCB conducts continuous surveillance on quality of pharmaceutical products. Activities include physical inspection and quality-testing of product samples. The Pharmaceutical Services Division, NPCB and the pharmacy enforcement unit in all states form an extensive and effective surveillance network throughout the country.
In year 2006, 2,748 samples from the total of 37,735 registered pharmaceutical and traditional products were taken for tests. Samples were sent to CQC for analysis. Testing on pharmaceutical products are carried out in accordance to the current protocols of analysis supplied by the manufacturer(s), while testing of traditional medicines are carried out according to standard laboratory methods such as microbial test, heavy metal test and others.
In 2006, 149 (6.2%) out of 2,405 batches of products sampled failed laboratory testing (Table 3), and 108 batches were recalled from the market due to shortfalls in either quality or efficacy of the products.
Laboratory Proficiency Testing
Analysis of surveillance samples

198 Director General Technical Report ( DGTR )
Labels and Package Inserts
Failure rate of surveillance samples was found to decrease for the period of 2003-2006. Where tests failed but are deemed not to significantly affect the quality of the product, a letter of warning is issued to the product holder. Products that fail laboratory testing for two different batches will be recalled and a proposal would be sent to the DCA to terminate the registration of the said product.
Labels and package inserts of registered products are checked to ensure that they comply with registration requirements. The numbers checked increased from 588 (1998) to 2,631 (2006). Percentage non-conformance has markedly decreased from previous years to 2.6% in 2006 (Figure 3).
Year
No. of samples tested
No. of samples failed
No. of recall
No. of warning
1998
610
111
50
61
1999
1,083
204
113
91
2000
1,726
233
120
113
2001
1,536
222
100
122
2002
1,495
313
154
159
2003
1,276
571
499
72
2004
2,147
260
179
81
2005
1,769
116
74
42
2006
2,405
149
108
41
Table 3 : Results of Testing of Surveillance Samples, Product Recall (Directive + Voluntary) and Warning (1998-2006)
Figure 3 : Percentage Non-conformance of Labels and Package Inserts (1998-2006)
35%
30%
25%
20%
15%
10%
5%
0%1998 1999 2000 2001 2002 2003 2004 2005 2006
13.6%14.4%
19.3%
14.7%
30.8%
17.3%
7.8%
11.2%
2.6%
Per
cen
t
Year
Source: Information and Documentation System Unit, Ministry of Health Malaysia

199Director General Technical Report ( DGTR )
Exercising Pharmaco-vigilance
Progress of ADR Reporting
Adverse Drug Reaction (ADR) Monitoring
In 1987, the adverse drug reaction (ADR) monitoring programme was launched and in 1990, Malaysia was accepted by the WHO Collaborating Centre as the 34th member of its Drug Safety Programme.
The safety of drugs marketed is monitored through the ADR monitoring programme which is under the purview of the Malaysian Adverse Drug Reactions Advisory Committee (MADRAC). Pharmaco-vigilance or drug safety monitoring is part of the regulatory system for drug registration. Pharmaco-vigilance involves making risk benefit assessments and the principal output is the provision of better information on how to use drugs safely.
The DCA has the responsibility of ensuring that all drugs marketed for use in this country are efficacious, of acceptable quality and safe for use. The first two criteria can be established through post-market surveillance and laboratory testing. ADR remains an important issue in clinical practice. Clinical trial data, obtained under strictly controlled conditions, cannot predict adverse events which may occur when a drug is used in the general population.
When the programme was first launched in 1987, only 10 ADR reports were received. There has been a gradual increase in the number of reports (Figure 4). In 2006, a total of 2,543 reports were received.
Figure 4 : Number of ADR Reports Received (1987 - 2006)
3000
2500
2000
1500
1000
500
0
Per
cen
t
Year
1987 1988 1989 1990 1991 1992 1993 1994 1995 1996 1997 1998 1999 2000 2001 2002 2003 2004 2005 2006
No. of ADR received
Source: Information and Documentation System Unit, Ministry of Health Malaysia

200 Director General Technical Report ( DGTR )
Strategies to increase awareness of ADR
ADR Reporting Forms
ADR Monitoring through Multidisplinary Approach
Undertaking Risk Benefit Assessments
Regulatory Measures for ADR
Strategies that have been used to create awareness about the programme and to improve the reporting rate include talks and presentations by members of MADRAC, lectures to medical and pharmacy students and publication of articles pertaining to ADR in local newsletters and bulletins.
To further facilitate reporting, ADR reporting forms with pre-paid postage have been supplied to health professionals since October 1998. On-line reporting of ADR has been made available to health professionals and the pharmaceutical industry through the NPCB website.
A multidisciplinary approach towards ADR monitoring is encouraged. Pharmacists in both the public and private sectors are beginning to realize their role in this system as they are in an ideal position to provide detailed information on drugs which may have caused adverse reactions in patients. The pharmaceutical industry which has been passive in the past has also started to monitor ADR on marketed products.
Based on the implications and seriousness of the ADR reports received and from literature reviews and information from other regulatory agencies, risk benefit assessments have been made in an effort to ensure safety to consumers without depriving the community of useful drugs.
Regulatory measures implemented by the DCA include:
• Restrictions on the usage in high risk groups• Limiting the prescription of certain drugs to specific
prescribers• Incorporating warning/precautionary statements in the
product literature and packaging material• Instituting product recalls• Suspension/cancellation of product registration.
Decisions of DCA are made public through the NPCB website and are also published in the national drug bulletin. To create awareness of important safety issues, the drug registration holders are also instructed to send “Dear Doctor” letters to the relevant health professionals.

201Director General Technical Report ( DGTR )
Future Challenges
The national ADR monitoring centre is linked to the World Health Organisation (WHO) and to other regulatory agencies through an information networking system called “vigimed” which was established by the Uppsala Monitoring Centre in Sweden. This allows the national centre to receive information on current issues and provides for good collaboration with other international ADR monitoring agencies.
To date, 145,139 products have been registered for use in Malaysia by the DCA. More new chemical entities are being introduced into the market with limited information on post-market surveillance. Existing drugs need to be continually monitored as they may interact with the newer products. Generic and “me-too” drugs do not necessarily have safety profile similar to patented products. Little is known about the long term effects of traditional medicines and their interactions with other drugs.
An effective and efficient monitoring system which requires the cooperation of health professionals, the pharmaceutical industry and consumers is required to meet these challenges.
Although many regulatory actions are taken based on information from other regulatory agencies, it is imperative that the national centre be self-reliant as decisions must be made in the context of Malaysia to ensure the safety and well-being of Malaysians are never jeopardized.
Future Plans
To ensure the quality of pharmaceutical products, NPCB plans to embark on the following activities in the near future:• Inspection on Good Clinical Practice (GCP) of facilities carrying
out clinical trials and Bioavailability / Bioequivalence (BA/BE) Studies
• Technical cooperation with other agencies in the field of Biotechnology
• Dialogue sessions with associations of pharmaceutical, traditional and cosmetics companies as well as other relevant agencies/institutions
• Enhancing and strengthening post-marketing surveillance programme and
• Creating greater awareness about the ADR reporting programme

202 Director General Technical Report ( DGTR )
Conclusion
The successful implementation of the various NPCB activities has contributed towards quality and safe use of drugs in the Ministry of Health in particular and the country in general. Statistics show that the quality of pharmaceutical products has increased over the past two decades.
The impact of pharmaceutical regulatory control has spurred the development of the local pharmaceutical and traditional industries. Many new manufacturing premises complying with GMP have emerged, capable of producing a diversified range of quality products.
Increasing ADR awareness, reinforcing compliance to GMP and GSP and enhancing post-marketing surveillance are efforts taken to further strengthen the present regulatory system and the mission of ensuring product quality, safety and efficacy in our pursuit towards improving healthcare of our nation.
1. National Pharmaceutical Control Bureau, Ministry of Health Malaysia. Annual Report 2005
2. National Pharmaceutical Control Bureau, Ministry of Health Malaysia. Guidelines on Good Storage Practice (GSP). 2nd Edition 2004
3. National Pharmaceutical Control Bureau, Ministry of Health Malaysia. Garispanduan Amalan Perkilangan Baik (APB) Bagi Ubat-ubatan Tradisional. Edisi Kedua, 2003
4. National Pharmaceutical Control Bureau, Ministry of Health Malaysia. PIC/S GMP Guide
Bibliography

203Director General Technical Report ( DGTR )
REGISTRATION STATISTICS FOR PHARMACEUTICAL PRODUCTS
Year Perscription Product
NonPerscription
Product
Natural Product
TotalCosmetic Cumulative
Table 1 : Number of Applications Received (1985-2006)
1985
1986
1987
1988
1989
1990
1991
1992
1993
1994
1995
1996
1997
1998
1999
2000
2001
2002
2003
2004
2005
2006
Total
9
6,439
824
702
664
528
481
150
376
400
440
617
532
587
796
427
578
509
263
529
703
465
17,019
0
0
56
2,532
2,750
597
305
60
111
168
239
671
635
606
789
444
487
448
266
720
645
630
13,159
0
0
0
0
0
0
0
3,973
7,059
4080
288
415
668
938
1,347
1,523
1,154
1,603
1,471
2,220
1,807
1,526
30,072
9
6,439
880
3,234
3,414
1,125
828
4,328
7,597
4,679
1,025
1,833
1,958
2,408
3,542
2,656
2,369
2,774
28,177
34,099
31,787
27,179
172,340
0
0
0
0
0
0
42
145
51
31
58
130
123
277
610
262
150
214
26,177
30,630
28,632
24,558
112,090
9
6,448
7,328
10,562
13,976
15,101
15,929
20,257
27,854
32,533
33,558
35,391
37,349
39,757
43,299
45,955
48,324
51,098
79,275
113,374
145,161
172,340
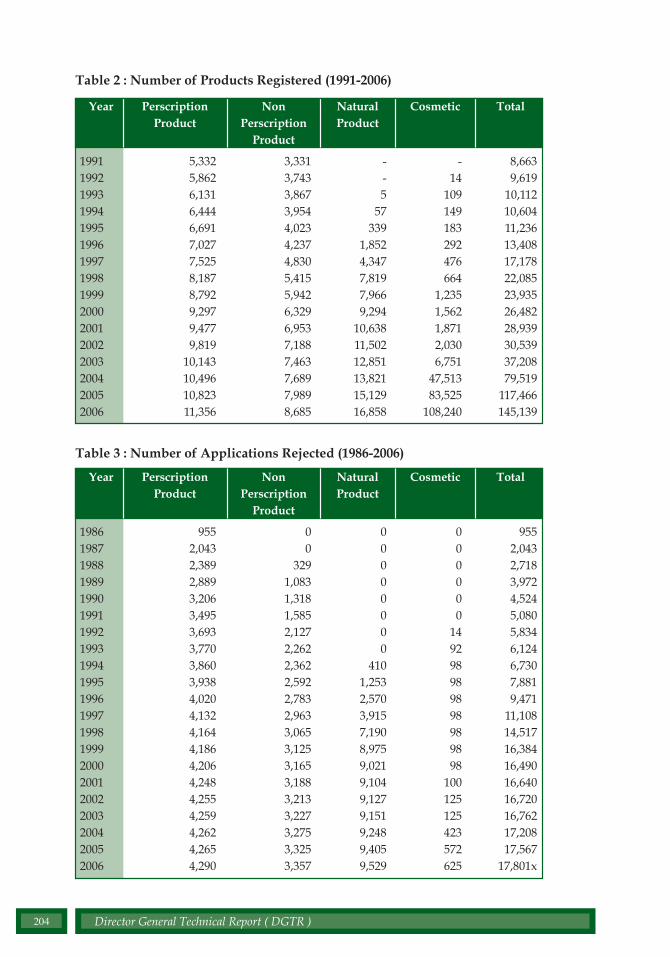
204 Director General Technical Report ( DGTR )
Table 2 : Number of Products Registered (1991-2006)
Year Perscription Product
NonPerscription
Product
Natural Product
TotalCosmetic
1991199219931994199519961997199819992000200120022003200420052006
5,3325,8626,1316,4446,6917,0277,5258,1878,7929,2979,4779,819
10,14310,49610,82311,356
3,3313,7433,8673,9544,0234,2374,8305,4155,9426,3296,9537,1887,4637,6897,9898,685
--5
57339
1,8524,3477,8197,9669,294
10,63811,50212,85113,82115,12916,858
8,6639,619
10,11210,60411,23613,40817,17822,08523,93526,48228,93930,53937,20879,519
117,466145,139
-14
109149183292476664
1,2351,5621,8712,0306,751
47,51383,525
108,240
Table 3 : Number of Applications Rejected (1986-2006)
198619871988198919901991199219931994199519961997199819992000200120022003200420052006
9552,0432,3892,8893,2063,4953,6933,7703,8603,9384,0204,1324,1644,1864,2064,2484,2554,2594,2624,2654,290
00
3291,0831,3181,5852,1272,2622,3622,5922,7832,9633,0653,1253,1653,1883,2133,2273,2753,3253,357
00000000
4101,2532,5703,9157,1908,9759,0219,1049,1279,1519,2489,4059,529
9552,0432,7183,9724,5245,0805,8346,1246,7307,8819,471
11,10814,51716,38416,49016,64016,72016,76217,20817,567
17,801x
000000
149298989898989898
100125125423572625
Year Perscription Product
NonPerscription
Product
Natural Product
TotalCosmetic

205Director General Technical Report ( DGTR )
DIOXINS IN FOOD
SUMMARY
Dioxin has the potential to cause cancers in human and is classified as a Class I carcinogenic substance. Dioxin can enter the food supply through a number of different routes. Food of animal origin contributes to about 80% of the overall human exposure and the contamination of food can vary widely depending on the origin of the foodstuff. Various categories of food were sampled and analysed by the Food Safety & Quality Division, Ministry of Health after the dioxin crisis. Analysis was conducted by the Doping Centre, University of Science Malaysia. This article discusses the monitoring of dioxin in food which include fish, cockles, leafy vegetables and fresh milk, since 2003. The preliminary exposure assessment of these food indicate that dietary intake of dioxin among Malaysians is below the safe level of 1-4 pg I-TEQ/kg body weight /day recommended by the World Health Organization.
Source of dioxins
Introduction
Dioxins” refers to a group of chemical compounds that share certain chemical structures and biological characteristics. Several hundred of these compounds exist and are members of three closely related
families: the chlorinated dibenzo-p-dioxins (CDDs), chlorinated dibenzofurans (CDFs) and certain polychlorinated biphenyls (PCBs). Sometimes the term dioxin is also used to refer to the most studied and one of the most toxic dioxins, 2,3,7,8-tetrachlorodibenzo-p-dioxin (TCDD).
These compounds can accumulate in the body fat of animals and humans and have a tendency to remain unchanged for prolonged intervals. Long term high levels of exposure to dioxins have the potential to cause a range of toxic effects in animals and humans, including skin lesions, reproductive disorders and cancer.
Dioxins are formed as a result of combustion processes such as commercial or municipal waste incineration and from burning fuels like wood, coal or oil. Dioxins can also be formed when household trash is burned and as a result of natural processes such as forest

206 Director General Technical Report ( DGTR )
Health effects
Dioxin in food chain
Occurrence in food
fires. Chlorine bleaching of pulp and paper, certain types of chemical manufacturing and processing, and other industrial processes all can create small quantities of dioxins. Cigarette smoke also contains small amounts of dioxins.
Studies have shown that exposure to dioxins at high enough doses may cause a number of adverse health effects. The health effects associated with dioxins depend on a variety of factors including the level of exposure, when someone was exposed, and for how long and how often. The most common health effect in people exposed to large amounts of dioxin is chloracne. Chloracne is a severe skin disease with acne-like lesions that occur mainly on the face and upper body. Other effects of exposure to large amounts of dioxin include skin rashes, skin discoloration, excessive body hair, and possibly mild liver damage.
One of the main concerns over health effects for dioxins is the risk of cancer in adults. Several studies suggest that workers exposed to high levels of dioxins at their workplace over many years have an increased risk of cancer. Animal studies have also shown an increased risk of cancer from long-term exposure to dioxins.
Dioxin can enter the food supply through a number of different routes. The contamination of the environment by dioxins is primarily caused by the aerial transportation and deposition of emissions from various sources like waste incineration, production of chemicals, traffic, etc. Soils may be polluted by sewage sludge or composts, spills and erosion from nearby contaminated areas. Soil is absorbed, directly or indirectly via dust deposits on vegetables, by free-range grazing cattle, goats, sheep and chicken and burrowing/grazing pig and wild boar. Aerial transport and deposition of dioxins and dioxin-like PCBs are also the main sources of contamination of leafy vegetables, pastures and roughages. (please ask writer to review this paragraph; many words used here are not words we normally use like pastures, roughages)
In general, food of animal origin contributes to about 80% of the overall human exposure. The contamination can vary widely depending on the origin of the foodstuff. Meat, eggs, milk, farmed fish and other food products may be contaminated above background levels by dioxins from feeding stuffs. Such contamination may be due to a high level of local environmental contamination, for example from a local waste incinerator

207Director General Technical Report ( DGTR )
Measurement of dioxin concentration
Tolerable monthly intake
Monitoring of dioxin in food
Each congener of compound of dioxins or dioxin-like PCBs presents a different level of toxicity. To sum up the toxicity of these different congeners, the concept of toxic equivalency factors (TEFs) has been introduced to facilitate risk assessment and regulatory control. This means that the analytical results of all congeners or compounds of toxicological relevance are converted into one result which summarizes all and is expressed as TCDD toxic equivalent concentration” or “TEQ”.
A Tolerable Monthly Intake (TMI) of 70pg/kgbody weight/month was established by the Joint FAO/WHO Expert Committee on Food Additives (JECFA) in 2001 and concurs with the lower end of the range Tolerable Daily Intake (TDI) of 1-4 pg WHO-TEQ/kg body weight, established by the WHO Consultation in1998.
Methodology
Monitoring data on dioxins conducted by the Food Safety and Quality Division (FSQD) of the Ministry of Health since 2003 were compiled and analysed. Monitoring involved one hundred and fifteen samples from distribution centers across the country. Types of food include fresh milk (cow’s milk), fish and seafood, vegetables and fruits. All samples were analysed by the Doping Centre, University of Science Malaysia, which is the only laboratory that has the capability to analyse dioxin in South East Asia.
Results
Out of the total of 115 samples analyzed, fish, fresh milk, prawns and cockles contribute to high number of samples taken as shown in Table 1. All samples had a level of dioxin of less than 1 pg-I-TEQ/gram except for one sample of spinach (0.87%) which exceeded 1 pg-I-TEQ/gram

208 Director General Technical Report ( DGTR )
The average intake of dioxins was estimated by multiplication and summation of the average consumption of the various foods with the concentrations in the foods. The exposure is calculated for both lower bound (Table 2) and upper bound (Table 3). The amount of food consumption and body weight for Malaysians is based on the Malaysian Adult Nutritional Survey 2002/2003.
Table 1 : Dioxin Concentration in Food
Source : Food Safety & Quality Division, MOH
Result(Range of minimum & maximum concentration)
I-TEQ pg/g
Type of food
Min Max
Total samples
Goat milk 0.02 0.52 9 Fresh milk (cow’s milk)
0.01 0.18 19
Prawns 0.00 0.16 17 Cockles 0.01 0.18 10 Mussels 0.03 0.51 6 Fish 0.01 0.43 30 Kangkung 0.08 0.44 6 Spinach 0.06 1.97 6 Ciku 0.01 0.17 6 Oranges 0.00 0.14 6 Total samples 115
Table 2 : Dietary Exposure Assessment in Food (upper bound)
Types of food
Average concentration (pg/g)
Amount of food consumption (g/day)
Dietary exposure (pg/kg bw day)
Fish 0.103333 12.11 0.0199 Cockles 0.115 4.70 0.0086
Prawns 0.024118 3.00 0.0012
Fresh milk 0.093929 35.52 0.0531 Leafy vegetables 0.481667
50.66 0.3886
Oranges 0.011667 14.09 0.0026
Source : Food Safety & Quality Division, MOH

209Director General Technical Report ( DGTR )
Dioxin in food chain
Safe level
Dioxin contamination
Discussion
Dioxins and dioxin-like PCBs are poorly soluble in water, but are adsorbed onto mineral or organic particles in suspension in water. Dioxin concentrates in the fatty tissues of beef and dairy cattle, poultry or seafood. Theoretically, the longer the life span of an animal, the higher potential accumulation of dioxin in its adipose tissue.
The European Union (EU) introduced different maximum levels for dioxins in different types of food. The lowest level set was 1 pg-I-TEQ/gram. Food Drug Administration United States (USFDA) also considered foods that contain less than 1 pg-I-TEQ/gram as safe.
The results of the monitoring showed that the level of dioxin contamination in goat’s milk, cow’s milk, prawns, cockles, fish and selected leafy vegetables and fruits were low.
Recent data of dioxins in fish and milk are available from Australia, New Zealand and United Kingdom Fish from these countries show levels from 0.77 to 9.5 pg I-TEQ/g, which is much higher than the level found in Malaysia which ranges from 0.01 to 0.43 pg I-TEQ/g . Level found in milk, 0.027 to 0.43 pg I- TEQ/g, is comparable to level found in Malaysia, 0.01 to 0.52 pg I- TEQ/g.
Table 2 : Dietary exposure assessment in food (lower bound)
Source : Food Safety & Quality Division, MOH
Types of food
Average concentration (pg/g)
Amount of food consumption (g/day)
Dietary exposure (pg/kg bw day)
Fish 0.179333333 12.11 0.0346 Cockles 0.1575 4.70 0.0118
Prawns 0.14058824 3.00 0.0067 Fresh milk 0.11
35.52 0.0622
Leafy vegetables 0.5525
50.66 0.4458
Oranges 0.131667 14.09 0.0295
210 Director General Technical Report ( DGTR )
It appears that the total intake of dioxin in Malaysia varies from 0.474 (lower bound) to 0.590 ( upper bound) pg I-TEQ/kg bw/day. This is below the Tolerable Daily Intake (TDI) of 1-4 pg WHO-TEQ/kg body weight, established by the WHO in1998.
Compared to other countries, estimates of total dietary exposure to dioxins for average consumers have been found to vary from 69 pg I-TEQ/day in the Netherlands to 210 pg I-TEQ/day in Spain, equal to 0.93-3.0 pg I-TEQ/kg bw/day respectively, assuming an average body weight of 70 kg.
Conclusion
Based on the review of the monitoring data available on the contamination of dioxin in food, it can be concluded that the level of dioxin in various foods in Malaysia is low. Further monitoring programme on dioxin contamination in food should be continued with expansion of the sample size and type of food. With more data, refinement of exposure assessment will help in better understanding and better estimate of dioxin exposure through dietary intake among Malaysian population.
Exposure assessment
Bibliography
1. The European Commission : Community Strategy for Dioxins, Furans and Polychlorinated Biphenyls, 2001
2. Dioxins in Food , Technical Report Series No 27. Food Standards Australia New Zealand, May 2004
3. R Hoogerbrugge et al. Dioxin in Dutch vegetabless RIVM report 310305003/2004.
4. http://ec.europa.eu/environment/dioxin
5. Compilation of EU Dioxin Exposure and Health Data - Human Exposure, October 1999

5chapter


Director General Technical Report ( DGTR ) 213
ACHIEVEMENT AND FUTURE DIRECTIONS OFMALAYSIAN MEDICAL COUNCIL
SUMMARY
The Malaysian Medical Council (MMC) was established under the provision of section 3 of the Medical Act 1971. The principal aim of the Council is to ensure the highest standard of medical ethics, education and practice, in the interest of patients, public and the profession through the fair and effective administration of the said Act.Since its inception, the Council has experienced many challenges. Being a statutory body carrying out its noble regulatory duties and functions, undeniably, the Council faces numerous problems amidst manpower, financial and legal constraints. However, with strong support from the President, the Council was able to discharge its duties well whilst meeting clients’ expectation.The Council looks forward in continuing to provide excellent services for both its registered practitioners and public. It is the Council’s sincere hope that the noble profession strive to excel and each and every one of its registered practitioners continues to practise medicine not only professionally and also ethically both locally and globally.
Introduction
Patients trust practitioners with their lives and wellbeing. They need to have confidence that professing individuals are not only competent but more importantly adhere to certain ethical standards. To that effect, medical
practitioners, from earlier days, were registered under various statutes, namely; the Medical Registration Ordinance 1952 of the States of Malaya, the Medical Registration Ordinance of Sabah, the Medical Registration Ordinance of Sarawak and the Emergency (Essential Powers) Ordinance No. 65, 1971. To streamline and strengthen regulation of medical practitioners, a common statute, known as the Medical Act 1971, was enacted by the Parliament and henceforth gazetted on 30th September 1971.
Pursuant to the statute in force, the Council was established to execute such duties and functions as enumerated. Being the governing body and custodian to the medical profession in Malaysia, the Council makes all policy decisions.

214 Director General Technical Report ( DGTR )
The core functions of the Council are as follows:
a. To register qualified medical graduates;
b. To prescribe and promulgate good medical practice;
c. To promote and maintain high standard of medical education;
d. To ensure practitioners abide by their Code of Professional Conduct and censure those who have strayed and;
e. To deal firmly and fairly with doctors whose fitness to practice is in doubt.
The Council protects, promotes and maintains the health and safety of the public in the practice of medicine, inter alia through :
a. Registration of qualified medical practitioners;
b. Maintenance of a Medical Register of all registered medical practitioners in Malaysia;
c. Issuance of practicing certificates to registered medical practitioners;
d. Promoting, recognising and accrediting medical education and training programmes;
e. Determining and promulgating the conduct and ethics of registered medical practitioners;
f. Assessing and reviewing medical practitioners with mental or physical condition, to ensure they are fit or competent to practise medicine;
g. Advising and making recommendations to the Minister of Health on matters relating to the practice of medicine in Malaysia; and
h. Performing other functions so as to give effect to the Medical Act 1971 as may be prescribed in the Act or assigned by the Minister.

Director General Technical Report ( DGTR ) 215
The Council also acts through various Committees and its functions are coordinated by a Secretariat.
Section 3 of the Act explicitly prescribes the composition of the Council. The Director -General of Health of Malaysia is the ex-officio President and Registrar of the Council. Other members are either elected directly by all registered practitioners or nominated and appointed by the Minister of Health for a period not exceeding three years. The Council membership, however, is limited to Malaysian practitioners registered with the Council. There is no provision for lay members in the current Act.
Currently, the membership of the Council comprises 33 members as follows:
a. The President;b. 9 elected members from the Peninsular Malaysia;c. 1 elected member from Sabah;d. 1 elected member from Sarawak;e. 3 appointed members from public universities established
under Universities and University Colleges Act 1971 (a total of 18 members from 6 such universities); and
f. 3 appointed members from Public Services.
Following the inception of the Medical Regulations in 1974, the Council held its first election in October 1974. (Please refer to the Council’s official website at http://mmc.gov.my with regards to current composition.)
Committees of the Council
Provisions under the First Schedule of the Medical Act 1971 permit the Council to form one or more committees, and to delegate some of the Council’s functions as the Council thinks fit. The committees currently established under the Act are:
a. The Evaluation Committee;b. The Ethics Committee;c. The Committee to Review the Code of Professional Conduct;d. The Medical Act and Regulations Amendments Committee;e. The Preliminary Investigation Committees; f. The Editorial Committee;g. The Charge Committee;

216 Director General Technical Report ( DGTR )
h. The Medical Review Panel;i. The Medical Review (Appeal) Panel;j. The Medical Qualifying Board; and k. The Joint Technical Accreditation Board.
Except for the appointment of the five Preliminary Investigation Committees by the President, other committees are appointed by the Council. (For further details with regards to current composition and the terms of reference of each committee, please refer to the Council’s official website.)
Management
The Secretariat is headed by a Secretary who is responsible for the day-to-day administration and operations of the Council. The Secretary is appointed by the President under the provision of para 4 of the First Schedule under the Medical Act 1971. Currently, all expenditure of the Council is paid out of the annual budget of the Ministry of Health.
Facilities and Services
The Main Office of the Council is located at Level 2, Block E-1 in Precinct 1, Federal Government Administrative Complex, Putrajaya whilst the branch office, which deals with disciplinary matters, is located at 3rd Floor, Block D, Ministry of Health Complex, Jalan Chenderasari, Kuala Lumpur.
Amongst the services provided by the Council are:
a. Processing applications for registration and annual practising certificate;
b. Issuing certificates of good standing;
c. Processing applications for compulsory services waiver;
d. Disseminating information about the standards expected of medical professionals in Malaysia;
e. Advising public and practitioners on what to do if they have any concerns about treatment;

Director General Technical Report ( DGTR ) 217
f. Providing information on the list of recognized medical schools;
g. Assisting in continuous professional development (CPD) for practitioners;
h. Handling of public complaints against practitioners and meeting out punishment against those found guilty.
Productivity and Workload
All persons are required to register with the Council in order to practice medicine legally in this country pursuant to the Act in force. The Council maintains a Medical Register for this purpose. There are four categories of registration undertaken by the Council:
a. Provisional Registration (sections 12 and 13);b. Full Registration (without conditions) (section 14(1)); andc. Conditional Registration (with conditions) (Section 14(3));d. Temporary Registration
Sections 12 and 13 of the Act state that a person shall be provisionally registered as a medical practitioner solely for the purpose of obtaining experience as a house officer if he holds a qualification recognized by the Council. Provisional registration allows newly qualified practitioners to undertake the general clinical training needed for full registration. A medical practitioner who is provisionally registered is entitled to work only in house officer posts in hospitals that are approved for the purpose of internship training by the Medical Qualifying Board. Under the Act, ‘housemanship’ or ‘internship’ is the period of resident medical practice before full registration. The noble aim of internship training is to provide newly qualified undergraduates practitioners with an educationally sound experience that professionalises them not only with appropriate knowledge, skills and experience but above all attitude.

218 Director General Technical Report ( DGTR )
Provisional registration, however, is available only to practitioners with the following nationality, rights and qualifications:
• Medical graduates of recognised institutions as listed in the Second Schedule of the Act. Medical graduates who hold medical qualifications which are not recognised by the Council, have to sit and pass the Medical Qualifying Examination in accordance to Section 12(1)(aa) of the said Act;
• Malaysian citizens; and
• For non-citizens, exemption is given only to local graduates or those related or married to Malaysians.
Exemption from internship may be allowed, if a practitioner can provide proof of such postings from a limited number of foreign countries to the satisfaction of the Council provided they are registered with that foreign medical council. Nevertheless, as the ‘Compulsory Rotating Internship’ is part of a medical programme in certain foreign countries, new graduates from training institutions in these countries including India do not qualify to apply for exemption from internship or for full registration, even though they are fully registered with the respective Medical Council.
Upon finishing the internship training and certification by their supervisors, practitioners are entitled to full registration. In general, after finishing the three-year compulsory service, Malaysian practitioners are allowed to set up their own practice. Non-Malaysians, however, are only allowed to practise medicine subject to restrictions and conditions as may be stipulated by the Minister of Health. Temporary registration is a special form of registration to enable foreign registered practitioners to practise medicine for a period of not more than three months. Section 16 of the Act provides for the issuance of Temporary Practising Certificates to such practitioners who intend to practise medicine in Malaysia either for the purpose of undergoing post-graduate courses at local institutions, training of local practitioners during workshops/conferences or for research/attachment. Extensions may be considered on application.
The applicant need not possess a recognised basic medical degree. Application must be submitted by a local registered medical practitioner with valid and current annual practising certificate who will stand as a guarantor, six weeks prior to practice.
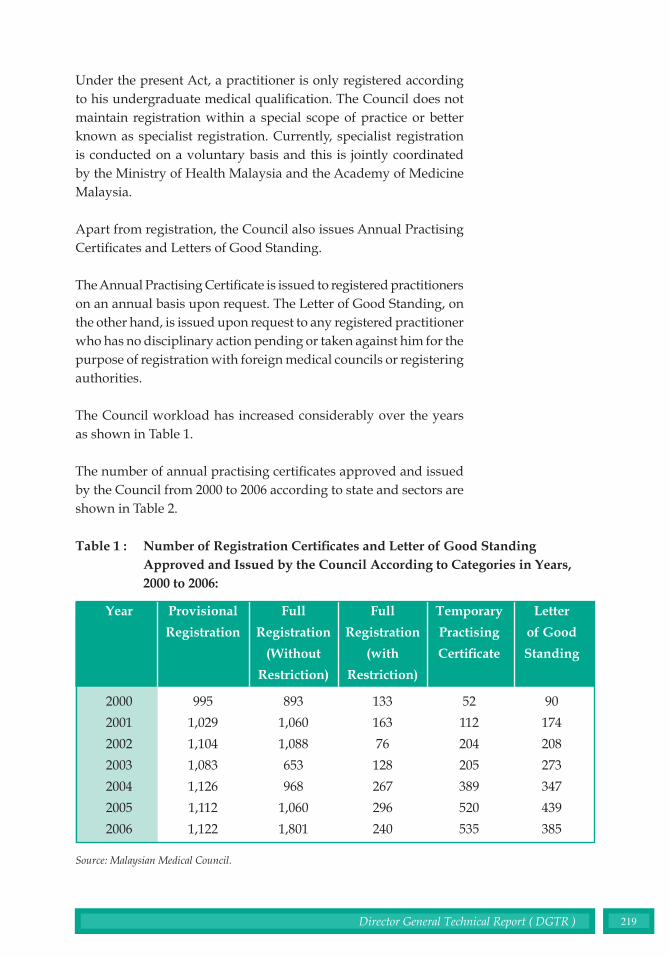
Director General Technical Report ( DGTR ) 219
Under the present Act, a practitioner is only registered according to his undergraduate medical qualification. The Council does not maintain registration within a special scope of practice or better known as specialist registration. Currently, specialist registration is conducted on a voluntary basis and this is jointly coordinated by the Ministry of Health Malaysia and the Academy of Medicine Malaysia.
Apart from registration, the Council also issues Annual Practising Certificates and Letters of Good Standing.
The Annual Practising Certificate is issued to registered practitioners on an annual basis upon request. The Letter of Good Standing, on the other hand, is issued upon request to any registered practitioner who has no disciplinary action pending or taken against him for the purpose of registration with foreign medical councils or registering authorities.
The Council workload has increased considerably over the years as shown in Table 1.
The number of annual practising certificates approved and issued by the Council from 2000 to 2006 according to state and sectors are shown in Table 2.
Table 1 : Number of Registration Certificates and Letter of Good Standing Approved and Issued by the Council According to Categories in Years, 2000 to 2006:
Year
2000
2001
2002
2003
2004
2005
2006
Provisional
Registration
995
1,029
1,104
1,083
1,126
1,112
1,122
Full
Registration
(with
Restriction)
133
163
76
128
267
296
240
Temporary
Practising
Certificate
52
112
204
205
389
520
535
Letter
of Good
Standing
90
174
208
273
347
439
385
Full
Registration
(Without
Restriction)
893
1,060
1,088
653
968
1,060
1,801
Source: Malaysian Medical Council.

220 Director General Technical Report ( DGTR )
Tab
le 2
:
Nu
mb
er o
f A
nn
ual
Pra
ctis
ing
Cer
tifi
cate
Iss
ued
Acc
ord
ing
to S
tate
s fr
om
2000
till
200
6 fo
r P
ub
lic
and
Pri
vate
Sec
tors
.
Key
: P
b =
Pub
lic: P
r =
Pri
vate
.So
urce
: Mal
aysi
an M
edic
al C
ounc
il.
2000
20
01
2002
20
03
2004
20
05
2006
A
ccor
ding
T
o st
ates
P
b P
r P
b P
r P
b P
r P
b P
r P
b P
r P
b P
r P
b P
r W
ilaya
h Pe
rsek
utua
n 15
46
1374
15
60
1434
16
91
1558
18
67
1639
17
94
1801
18
13
1843
18
90
1563
Joho
r 35
2 77
7 36
7 80
7 40
7 84
6 45
6 86
2 46
1 87
4 47
7 89
1 45
6 92
4 K
edah
25
5 38
2 28
2 39
8 32
6 41
1 31
6 41
0 33
8 44
7 34
9 45
7 35
5 44
4 K
elan
tan
531
170
582
172
623
176
574
186
584
186
595
194
595
192
Mel
aka
173
252
186
268
185
283
173
293
239
333
247
344
231
326
N.S
embi
lan
194
265
219
271
227
280
259
290
290
320
306
334
212
319
Paha
ng
201
235
243
252
272
274
286
289
305
311
316
319
223
311
P.P
inan
g 28
2 72
8 29
4 77
3 31
1 79
6 32
0 78
1 34
6 84
1 25
7 85
3 37
0 82
2 Pe
rak
411
711
427
741
418
777
507
764
514
892
527
919
483
773
Perl
is
49
33
44
31
56
32
50
37
78
36
83
44
60
33
Sela
ngor
67
7 16
06
651
1685
61
5 18
30
685
1891
72
1 20
50
735
2097
75
7 21
03
Ter
engg
anu
141
123
156
127
174
135
210
140
201
144
219
153
227
141
Saba
h 20
2 27
7 23
9 29
2 28
4 30
9 20
0 28
8 26
8 32
9 27
9 33
7 22
5 31
2 Sa
raw
ak
205
276
220
286
262
311
308
343
327
362
332
377
300
339
Tot
al
5219
52
09
5470
55
37
5851
80
18
6211
82
13
5466
89
20
6635
91
62
6384
86
02
Gra
nd t
otal
12
,428
13
,007
13
,869
14
,424
15
,386
15
,797
14
,986

Director General Technical Report ( DGTR ) 221
Tab
le 3
:
Sta
tus
of E
nq
uir
ies
into
Com
pla
ints
by
the
Pre
lim
inar
y In
vest
igat
ion
C
omm
itte
es a
nd
the
Cou
nci
l, 20
03 -
2006
:
Key
: P
IC -
Pre
limin
ary
Inve
stig
atio
n C
omm
itte
eSo
urce
: Mal
aysi
an M
edic
al C
ounc
il.
2003
20
04
2005
20
06
Inq
uiry
L
evel
C
ompl
eted
Ong
oing
C
ompl
eted
Ong
oing
C
ompl
eted
O
ngoi
ng
Com
plet
ed
Ong
oing
PI
C I
21
54
30
59
18
67
18
55
PI
C I
I 12
66
17
70
35
37
27
21
PI
C I
II
36
39
10
43
19
35
21
30
PIC
IV
69
65
16
68
28
50
27
35
PI
C V
N
ot A
ppoi
nted
Yet
4
22
TO
TA
L
108
224
73
240
100
189
97
16
3 M
MC
6
5 10
19
20
17
27
13

222 Director General Technical Report ( DGTR )
Over the past 5 years, the number of complains received by the Council has steadily increased. However, the rate, on the average, is less than 0.4 complain per 1,000 registered medical practitioners. As illustrated in Table 3 below, the number of cases resolved is increasing. Most of the cases of more than three years standing are settled. (The increasing cases are due to new cases)
Issues and Challenges & The Way Forward
The Council always upholds that excellent service delivery is not only a mere obligation, but more importantly a vital and noble task to promote Malaysia into an internationally competitive healthcare hub. To achieve that, among the various major measures undertaken over the years to strengthen our services are:
1. Management :
Since the inception of the Medical Act in 1971, and the establishment of the Council in 1974, the Council was wholly funded by the Ministry of Health and all its generated income was credited into the Government’s consolidated account. For that matter, the Council had to abide by all the rules and regulations governing the government agencies. Being a corporate body, at times, it was quite challenging and daunting for the Council to execute its functions efficiently and effectively with such restrictions.
Table 4 : Outcome of Inquiries for Years 2003-2006:
Source: Malaysian Medical Council.
Types of Punishment
a. Charge dismissed and practitioner found
not guilty
b. Name of Practitioner Struck off from the
Medical Register
c. Name suspended from the Medical
Register
d. Reprimanded
TOTAL
2006
12
2
8
5
27
2005
6
0
9
5
20
2004
5
0
2
3
10
2003
1
0
1
3
5

Director General Technical Report ( DGTR ) 223
However, in response to a paper put up by the President in May 2007, the Cabinet has allowed the Council to utilise and generate its own income whilst approving a substantial amount of kick-off grant to enable the Council to operate as a corporate body in accordance to the Act. With such financial independence, it is our fervent hope that our services will improve further.
2. Office Automation:
In 2006, the Council was granted a substantial budget to improve its office automation. A new application system or database was developed in line with all the legal requirements under the Medical Act 1971. After the data from the 50,000-odd files of registered medical practitioners were ‘migrated’ into the new database, the website was officially launched using the http://mmc.gov.my address on 6 August 2007.
Through the official website, MMC aims to assist its clients in the following ways:
• Informing public about the legislation that guides our work, the members of our governing Council and their duties, our duties and services for both registered practitioners and members of the public;
• Providing information about the standards expected of medical professionals in Malaysia;
• Assisting the public to express their concerns about treatment by medical practitioners;
• Providing advise on the list of recognised medical schools; and
• Applying for registration and paying online;• Enabling clients to download various forms.
With the advent of office automation, clients are now able to apply annual practising certificates and pay online as well as download relevant forms at the click of a button in the comfort of their clinics.
3. Review of the Medical Act 1971 and its Regulations:
Under the present Act and Regulations which was enacted more than three decades ago, many shortcomings were noted. Amongst the major ones are lack of provision for enforcement, the archaic

224 Director General Technical Report ( DGTR )
procedures which dictate the inquiry process into complaints against registered practitioners, lack of rehabilitation as a form of punishment for errant practitioners, lack of control over medical education and the ever increasing number of university representatives.
As far as legal matter is concerned, the procedure for inquiry, for instance, has to be followed strictly. Undeniably, certain procedures that were formulated more than three decades ago hinder rather than facilitate. In 2001, out of ignorance of certain legal requirements, the public dubbed the Council as a ‘toothless tiger’ for being slow. The most common causes for the delay are that the Council has to give priority for inquiries based on the seriousness of the complaints at the expense of older complaints and last minute postponements on the requests of the involved parties. Once postponed, a new date will be fixed at the expense of other cases. By the rules of natural justice, a new date can only be fixed after a certain time frame, usually not less than a month, for the parties to prepare their case.
Little did the public realise and is aware that, in spite of being dubbed as a ‘toothless tiger’, whilst still utilising the 1974 inquiry procedures, for the years 2003 and 2006, the Council has managed, on the average, to steadily settle almost 50 percent of the complaints received within a year. In addition to streamlining its disciplinary enquiry procedures, on 11 January 2005, the Council has also approved a set of Standing Orders.
To ensure justice and fairness to all parties and also to overcome delay, the present Act and Regulations were comprehensively revised by the Council. After much deliberation, a consensus was reached on the final draft which was presented to the Honourable Minister of Health in early 2007. It is the fervent hope of the Council to see it being enacted and come into force in the near future.
4. Revising the Code of Professional Conduct and Promulgating Nine Additional Ethical Guidelines:
The members of the medical profession are expected to abide by a code of conduct established by the profession itself. The purpose of this code is to safeguard the public, ensure propriety in professional practice and to prevent abuse of professional privileges.
The Council has formulated and adopted its Code of Conduct on December 1986, and published it in April 1987. In addition,

Director General Technical Report ( DGTR ) 225
the Council adopted two other booklets namely ‘Good Medical Practice’ and ‘Confidentiality’ in January 2001 to supplement and complement its Code of Professional Conduct.
The Code of Professional Conduct gives details of misconduct for which practitioners can be disciplined. They are grouped under four headings:
a. Neglect or disregard of professional responsibilities;b. Abuse of professional privileges and skills;c. Conduct derogatory to the reputation of the medical profession;
andd. Advertising, canvassing and related professional offences.
Medicine is a dynamic profession. What was a norm and practised a decade ago, for instance, may not be acceptable anymore. Similarly, the same goes to the ethics of the medical practice. Besides revising the Act, the Code of Professional Conduct has also been subject to revision so as to meet the current local and global challenges. Amongst the landmark decision was to allow practitioners to disseminate information with regards to their services and specialities whilst still maintaining their distance from advertising. Furthermore, the Council initiated measures to ensure the ethical issues within the profession are contemporary. Two papers namely Dissemination of Information by Medical Practitioners and Medical Reports and Medical Records were recently formulated.
To date, the Council has prescribed and promulgated a total of nine Ethical Guidelines, namely;
a. Brain Death;b. Clinical Trials & Biomedical Research;c. Ethical Implications Of Doctors In Conflict Situations;d. Medical Genetics & Genetic Services;e. Organ Transplantation;f. Relationship Between Doctors & The Pharmaceutical
Industry;g. Assisted Reproduction;h. Dissemination Of Information By The Medical Profession;
andi. Medical Records & Medical Reports.
These Ethical Guidelines are available for download at the
http://mmc.gov.my website.

226 Director General Technical Report ( DGTR )
5. Specialist Register:
Under the present Act, the law only requires practitioners to be registered according to their basic qualifications. Hence, there is no demarcation between a non-specialist and a specialist in terms of practice as far registration is concerned. A practitioner in an institution may need to be credentialed by a committee before he is allowed to profess certain procedures. A practitioner in a small institution or in solo practice may profess based on skills gathered from his experience or training without even being credentialed. Under the present Act, any practitioner may claim to be a consultant and stick various credentials to his name without having committed an offence.
Hence, in parallel with major advances in medical specialities, there is a real need to register practitioners not only according to their specialities but also their sub-specialities. Currently, the Council is amending the Act to enable a Specialist Register to be legalised as well as the mammoth task of preparing a list of postgraduate qualifications eligible for registration.
6. Continuing Professional Development:
Continuing Professional Development (CPD) is a continuous process of personal growth, to improve the capability and realise the full potential of professionals. This can be achieved by obtaining and developing a wide range of knowledge, skills and experience, which are not normally acquired during initial training or routine work, and which together develop and maintain competence to practise. Globally, there is a growing imperative placed upon practitioners to maintain professional competence through a systematic process of CPD.
In medicine, where there is no room for mistake and negligence, there is a real need for constant updating of knowledge and skills in order to maintain professional competence. Hence, practitioners should undertake CPD to affirm their professional competence. Under the amended Act, the Council hopes to achieve this through ensuring practitioners attain a certain number of credit points before their annual practising certificates are renewed.

Director General Technical Report ( DGTR ) 227
7. Medical Education:
It is the responsibility of the Council as the custodian of the medical profession in Malaysia to ensure that only qualified persons are allowed to practice this noble profession. To that effect, only graduates from medical training institutions that meet certain standards and criteria would be allowed to practice. Hence, recognition, the process of according a status to a programme or institution to enable its graduates to be eligible for registration with the Council, is an important prerequisite. During the process, an external evaluation based on a set of criteria and standards judged to be good practices for the discipline is carried out by a group of peers. Usually, recognition is a one-off exercise.
To ensure the quality of provision and standards of medical education and training are being safeguarded and enhanced, a regular appraisal of recognition or better known as accreditation has been introduced as a quality assurance mechanism. Under the initiative, recognized institutions are evaluated on a regular basis between 1-5 years depending on the conformance to the standards set by the Council. The accreditation process assists medical institutions in the attainment of structures and functions as well as the performance of graduates in compliance with national norms of preparation for practice and training. The standards are contained in the ‘Guidelines on Standards and Criteria in the Accreditation of Basic Medical Education Programme in Malaysia’.
As medical education is vital in ensuring competent and safe doctors, the Council has conducted a series of meetings to revise it’s ‘Guidelines on Standards and Criteria in the Accreditation of Basic Medical Education Programme in Malaysia’. Amongst the criteria revised were student : staff ratio and student : bed ratio. Furthermore in September 2007, the Council has also adopted a rating system which will enable a fair and objective assessment to be carried out on medical training institutions and to evaluate the performance of their undergraduates during their internship.
8. Qualifying Medical Examination:
Pursuant to the Medical Act 1971, only individuals possessing recognized basic medical degrees listed in the Second Schedule are accepted to register and practise medicine in Malaysia whilst

228 Director General Technical Report ( DGTR )
graduates from unrecognized colleges have to sit and pass the Medical Qualifying Examination in three local universities or examining bodies before their registrations are accepted.
Section 12(1)(aa) of the Act grants provisions to the Minister to conduct examination for medical undergraduates from institutions not listed in the Second Schedule of the Act. Successful candidates are then eligible for provisional registration with the Council. The principal aim of the Medical Qualifying Examination is to determine whether an individual has the necessary basic knowledge and skills to practise safe medicine. Hence, graduates from unrecognised colleges will be assessed at par with final year medical undergraduates of the relevant local examining bodies.
The examinations are held at Universiti Kebangsaan Malaysia, University of Malaya and Universiti Sains Malaysia twice a year in March and October. The candidates are subjected to the rules and the regulations of those examining bodies with regards to the examination, the re-sitting of any examination and the imposition of any fee as determined by the Regulations. As the qualifying examinations are held at three different examination centres, there have been various allegations of non-uniformity. To reduce such allegations, measures are undertaken by the Council to conduct its own qualifying examination in the near future.
Conclusion
MMC has gained invaluable experience since its inception. The challenges were tremendous but not insurmountable. The Council and its secretariat look forward in continuing to provide and enhance excellent services for both its registered practitioners and public. It is the Council’s sincere hope that this noble profession will strive to excel and each and every one of its registered practitioners continues to practise medicine not only professionally, but also ethically and legally.

Director General Technical Report ( DGTR ) 229
EDITORIAL COMMITTEE
Principle Advisor : Tan Sri Datuk Dr. Mohamad Ismail Merican Director General of Health, Malaysia
Chief Editor : Dr. Azman Abu Bakar Director, Hospital Serdang Ministry of Health. Editors : Dr. Ang Kim Teng Director, Selangor Health Department Ministry of Health
Dr. Khairiyah Abdul Muttalib Oral Health Division, Ministry of Health
Dr. Mohammad Amir Kamaluddin Division of Epidemiology and Statistics Institute for Medical research, Ministry of Health.
Dato’ Dr. Ravindran Jegasothy Consultant and Head of O&G Department, Hospital Kuala Lumpur
Dr. Wong Swee Lan Consultant, Paediatric Department Hospital Tuanku Jaafar
Dr Shukiman Ismail O&G Specialist Hospital Tuanku Jaafar
230 Director General Technical Report ( DGTR )
LIST OF CONTRIBUTORS
1. Y. Bhg Puan Sri Datuk Dr. Suraiya Hani binti Tun Hussein
2. Dr. Chang Kian Meng
3. Dato’ Dr. Yasmin Ayob
4. Dato Dr. Mohamed Ali Abdul Khadir
5. Dr. Majdah Hj Mohamed
6. Dr. Mymoon Alias
7. Dr. Hjh. Mahrusah Bt. Hj Jamaluddin
8. Dr. Mohd Hanif Zailani
9. Dr. Wan Mansor Hamzah
10. En Adnan Salimin
11. En Dzafarullah Daud
12. Dr. Lokman Hakim Sulaiman
13. Dr. Hj. Lailanor Hj. Ibrahim
14. Dr. Choon Siew Eng
15. Pn. Anis Talib
16. Datin Dr. Safiah Mohd Yusof
17. Dr. Mohd Khairi bin Yakub
18. Dr. Nik Shamsidah Nik Ibrahim
19. Dr. Muhammad Anis bin Abd. Wahab
20. Dr. Lee Han Lim
21. Pn Tan Lie Sie
22. Dr. Thahiratul Asma Zakaria
23. Dr. Hj. Wan Mazlan bin Hj. Mohamed Woojdy
24. En. C. Perumal

Director General Technical Report ( DGTR ) 231
ACKNOWLEDGEMENT
The Editorial Committee wishes to thank the Director-General of Health Malaysia for his invaluable guidance and direction in the preparation of this Report. The Committee also wishes to acknowledge various Divisions in the Ministry of Health for their support and for the provision of relevant information towards the production of this Report :
• Planning and Development Division
• Family Health Development Division
• Disease Control Division
• Food Quality Control Division
• Oral Health Division
• Health Education Division
• Medical Development Division
• Medical Practice Division
• Engineering Services Division
• Pharmaceutical Services Division
• Manpower Planning and Training Division
• Institute for Medical Research
• Institute of Public Health
• Institute of Health Management
• Clinical Research Centre
Special thanks are also accorded to all those who have assisted in one way or another in the compilation and production of this report, in particular, the Information and Documentation System Unit, Ministry of Health Malaysia.