2006 Environmental Scan Dr. Laura R. Crane...
95
2006 Environmental Scan Dr. Laura R. Crane Director August 2006 William Rainey Harper College Office of Research 1200 West Algonquin Road Palatine, IL 60067-7398 Phone: 847.925.6955
Transcript of 2006 Environmental Scan Dr. Laura R. Crane...

2006 Environmental Scan
Dr. Laura R. Crane Director August 2006
William Rainey Harper College Office of Research
1200 West Algonquin Road Palatine, IL 60067-7398
Phone: 847.925.6955

Harper College
Environmental Scan
Final Report
PREPARED FOR OFFICE OF RESEARCH HARPER COLLEGE
BY REGIONAL DEVELOPMENT INSTITUTE
NORTHERN ILLINOIS UNIVERSITY
JUNE 30, 2006


TABLE OF CONTENTS
EXECUTIVE SUMMARY ................................................................................................... I INTRODUCTION...............................................................................................................1 I. CONVERGENCE OF DEMOGRAPHIC, ECONOMIC, TECHNOLOGICAL, AND
POLITICAL-SOCIAL TRENDS.......................................................................................2 Demographic Trends .....................................................................................................3
Ethnographic and Age Shifts 3 Baby Boomers, Generation X, and the Millennial Generation 3 Flight of the Exurbanites 4
Economic Trends...........................................................................................................5
Recovery from the Recession 5 Median Incomes and Poverty 6 The Decline of the Middle Class 8 Global Economy, Off-Shoring, and Outsourcing 9
Technological Trends ..................................................................................................12
New Communication Technologies 12 Critical Emerging Technologies 12
Political/Social Trends .................................................................................................13
Increasing Involvement of Parents 13 Higher Education under the Microscope 13 Legislative Issues Affecting Education 14 Local Political Issues 15 Increasing Social Globalization 15 The Price of Oil and the Green Movement 15
Implications of Convergent Trends ..............................................................................17
Possible Decreases in Educational Attainment by 2020 17 A Projected Shortage of Skilled Workers for the Future 17 Trends in the Harper College District 18 Critical Issues for the Region 19
II. TRENDS IN EDUCATION - STUDENT FACTORS ...................................................21 Student Demographics ................................................................................................21
Increasing Numbers of Students Attending College 21 Trends in High School Enrollments 22 Source: Harper College Office of Research, 2006 22 International Students 22 Pathway versus Pipeline 22 Lifelong Learning 23 Increasing Minority Enrollments 23

Student Academic Preparation and College Readiness..............................................24 Achievement Gaps 24 National Spotlight on High School Education 26 College-Level Remediation 26 College Completion Gaps 27
III. TRENDS IN EDUCATION - CURRICULA, ASSESSMENT, AND INSTRUCTION...29 21st Century Knowledge and Skills .............................................................................29 Higher Education Assessment and Accountability ......................................................30
Increasing Accountability 30 Appropriate Measures for Community Colleges 30 Assessment of Outcomes 31 Access to Programs and Services 31
Trends in Instructional Approaches and Pedagogy .....................................................32
Use of Technology in Higher Education 32 Instructional Approaches 34 Instructional Competition 34
IV. TRENDS IN EDUCATION - MEETING THE NEEDS OF BUSINESS AND ................
INDUSTRY................................................................................................................36 Commuting Patterns ....................................................................................................36 Labor Market Projections.............................................................................................36 Critical and Emerging Occupations .............................................................................40 Infrastructure for Economic Growth .............................................................................40
V. TRENDS IN EDUCATION - FINANCIAL SUPPORT..................................................41 Trends in Higher Education Funding ...........................................................................41 Student Financial Assistance.......................................................................................43
VI. MAJOR ISSUES AFFECTING COMMUNITY COLLEGES .......................................44
REFERENCES................................................................................................................47 APPENDIX A: RECOMMENDATIONS FOR EDUCATION ...........................................52 APPENDIX B: EMERGING CRITICAL TECHNOLOGIES .............................................53 APPENDIX C: ILLINOIS LEGISLATIVE ISSUES ..........................................................56 APPENDIX D: PROGRAMS WITHIN 10 MILES OF 60067...........................................58 APPENDIX E: LABOR MARKET DATA.........................................................................67

TABLE OF EXHIBITS Exhibit 1 Illinois Labor Force 1996-2006 6 Exhibit 2 Percentages of Population in Poverty 7 Exhibit 3 Percentages of Low-Income Students in High Schools 8 Exhibit 4 Percentages of Low-Income Students in Pre-High Schools 8 Exhibit 5 Differences in Wage Distribution in Selected Municipalities 9 Exhibit 6 Illinois Population at Work Entry-Age and Exit Ages (In Thousands) 18 Exhibit 7 Population, Household, and Employment Trends from 2000-2030 19 Exhibit 8 Comparison of Municipalities with Largest Projected Growth in Population and
in Employment from 2000-2030 20 Exhibit 9 Grades 9-12 Enrollment Illinois versus Harper College District 22 Exhibit 10 Percentages of High School Students Meeting/Exceeding State Standards 24 Exhibit 11 Percentages of Students Meeting or Exceeding Reading State Standards in 11th Grade 25 Exhibit 12 Percentages of Students Meeting or Exceeding Mathematics State Standards in 11th Grade 25 Exhibit 13 Retention and Completion Rates of College Students 27 Exhibit 14 Distribution of Employment by Industry in Northern Cook County 37 Exhibit 15 Predicted Growth and Annual Wage by Industry from 2002 to 2012 38 Exhibit 16 High-Paying Occupations with Many Illinois Job Openings 2004-2014 39 Exhibit 17 Top 20 Job Titles by Number of Total Annual Openings 67 Exhibit 18 Top 20 Job Titles by Number of Annual Openings Due to Growth 68 Exhibit 19 Top 20 Job Titles by Percent of Growth within the Occupation 69 Exhibit 20 Job Titles Predicted to Lose the Most Jobs 2002-2012 71


EXECUTIVE SUMMARY An environmental scan is a useful tool for college administrators, faculty, and staff to identify the national, state, regional, and local trends and events that may affect the college. By understanding these forces, college planners are better positioned to increase the lead-time to respond to the more predictable trends that pose opportunities or threats to the institution. The escalating national interest in education is evidenced in the media daily. In June 2006, the Commission on the Future of Higher Education released a draft report of its findings. The over-riding theme was increased accountability, with specific expectations on how the higher education system is to improve access, affordability, and quality and innovation (Chapter VI). Community colleges are called upon to take an even more active role in the economic development of their districts at a time of escalating demand for programs and services, decreased public and private funding, and increased mandates for accountability. Within this context, an environmental scan can help a college focus its efforts and resources and identify the ways to best achieve its mission. This report is divided into six sections. A review of the demographic, economic, technological, and political/social trends gives the context in which the college is operating. The next four sections look at specific trends in education, including student factors; curricula, assessment, and instruction; meeting the needs of business and industry; and financial support. The last section lists the most critical issues for community college as identified in national reports. Converging Demographic, Economic, Technological, and Political/Social Trends Community colleges operate in complex environments in which demographic, economic, technological, and political/social trends converge in dynamic ways. This section of the paper summarizes the most critical individual trends and their interactions. Demographic Trends The Harper College district has clusters of very different demographic characteristics. Two of the factors that could directly affect the college in the next ten years are the Baby Boomer retirements and the increasing immigrant population. The first wave of Baby Boomers reaches retirement in 2011-2012. Just as this generation altered lifestyles and traditions, there are strong indications they also will redefine retirement—in fact, nearly 80% of the Boomers plan to work in some capacity in retirement or delay retirement (Roper ASW, 2004). This talented, experienced pool of workers is looking for flexibility in employment, mostly part-time, and in jobs that make significant social impacts. They are carefully watching, and voting, to preserve their pensions and to harness healthcare costs. Needless to say, traditional “dependency ratios” may not be sufficient in predicting the impact of the Boomers on the economy, and the allocation of public funds will be altered by this large voting block. Because Harper College receives significant funding through local property taxes and public funds, maintaining support from the Boomers is important. This generation will be seeking additional educational programs and services in retirement.
Harper College Environmental Scan Page i

The immigrant population will most likely continue to increase because of the higher birth rates of the current immigrant population and through an influx of new immigrants. Mount Prospect, Arlington Heights, and Palatine are considered “port-of-entry” locations (Paral & Norkewicz, 2003). These two factors work together to create a potential situation of rapid change in the demographics of the district. As the Boomers retire, they may seek to move to exurbia, or rural areas such as Huntley or Woodstock, thus placing housing on the market. The median cost of housing in the college district is rather high; however, there are pockets of more modestly priced homes. As “ports of entry,” the demographic characteristics of some communities within the college district could change quickly. Economic Trends Due to rapid changes in technology and political relationships, traditional boundaries are of far less importance than historically. Real-time communication, instant messaging, and virtual labs allow scientists from around the world to collaborate on research and development. The barriers once associated with time, location, language, and culture have been reduced (NIU, 2006. p. 6). The U.S. is one of many economies competing in the global market. Countries such as South Korea, China, India, and Singapore as well as counties in Latin America have entered the global market. “Five qualified chemists can be hired in India for the cost of just one in America…For the cost of one engineer in the United States, a company can hire eleven in India…Given such enormous disadvantages in labor cost, we cannot be satisfied merely to match other economies in those area where we do enjoy strength; rather we must excel … markedly” (Augustine, 2005, p. 3). Locally, the northern Cook County region is recovering from the recession faster than the rest of the State of Illinois. Unemployment is lower than the current state rate; however, it is not as low as in 1990. The median household incomes are high compared to the State of Illinois, but nearly one-third of those renting housing are “rent burdened,” or expending over 30% of their income on rent. There are signs of increasing levels of poverty. The percentages of low-income students in district high schools have increased since 2001. Percentages of Low-Income Students in District High Schools
0.0
2.0
4.0
6.0
8.0
10.0
12.0
14.0
YR99 YR00 YR01 YR02 YR03 YR04 YR05
HS District 211 HS District 214 Barrington HS
Source: Interactive Illinois Report Card (Northern Illinois University, 2006)
Harper College Environmental Scan Page ii

In addition, nearly 30% of the students in District 21 and nearly 25% of the students in District 15 were classified as low-income in 2005. As increasing numbers of low-income students complete high school, Harper College could face more students with limited financial resources for college. Percentages of Low-Income Students in Pre-High School
0.0
5.0
10.0
15.0
20.0
25.0
30.0
35.0
YR99 YR00 YR01 YR02 YR03 YR04 YR05
District 15 District 21 District 25 Barrington Middle
Source: Interactive Illinois Report Card (Northern Illinois University, 2006) Nationally and within the State of Illinois, the middle class appears to be declining as the gap between the “haves” and “have nots” widens. In northern Cook County, average wages increased 4% from 2001 to 2004, and the average wage of a new hire decreased 1% from 2001 to 2004 (U.S. Census, 2006). Within the college district, the highest and lowest median household incomes differ by nearly $30K. Barrington, with the highest percentage of households with incomes over $100K (42%), also has a significant proportion of households with incomes less than $25K (15%). Within the district, the increase in global competition combined with the recession and increasing oil prices has resulted in businesses and organizations finding ways to do more with less. In such a situation, one of the first areas to be cut or eliminated is funding for employee training. As businesses find it harder to recruit and retain workers with the specific skill levels needed, funding for training is slowly being returned; however, the training is more often being done within the company than through external providers (Eduventures, 2005). Technology Trends Technology has revolutionized how we work, live, and communicate. The digital age emerged in the last 25 years and has great implications for how instruction is organized and delivered. The leading edge of the Millennial Generation, just now entering the workforce, grew up with the world-wide-web and cell phones; the Boomers, now reaching retirement age, remember rotary phones and calculus on slide rules. With wireless technology, critical masses of consumers can be reached 24/7 and at their convenience.
Harper College Environmental Scan Page iii

Harper College Environmental Scan Page iv
The Illinois Survey of Critical Technologies (ISBE & NIU, 2006) identified 26 emerging technologies in five growth areas in Illinois’ economy. The implementation of these critical technologies requires a citizenry and workforce with strong mathematics and science skills: bioscience, environmental and energy technologies, human health and development, information technology and communication, and materials science and advanced manufacturing (Appendix B). Political/Social Trends Higher education is in the spotlight, and the relationship between public education institutions and the state and their districts are becoming more complex and visible (SCUP, 2006). During the next two years, major political races will be decided, including a change in leadership in the White House and a contested race for governor of Illinois. Education is a key campaign topic; however, the focus is on reforming education. In Illinois, several legislative bills and resolution directly affect community colleges. The most pervasive action involves the review of the role of the community college in Illinois. The Task Force on Community Colleges will make recommendations by December 31, 2006 as to whether changes are needed to meet the expanded role and demands on the Illinois community colleges. The difference between partisan and non-partisan elections is blurring as more candidates for public boards align with political parties or declare to be an advocate for a focused issue, such as censorship of reading materials or tax relief. The fluctuating price of oil may affect commuting patterns of workers and students. It has resulted in a renewed interest in “green technology,” and colleges are investigating alternative energy solutions for current and proposed buildings. The Convergence of Trends Taken together, the demographic, economic, technological, and political/social trends have several implications for the community college:
• If current trends and policies do not change, by 2020 the Illinois workforce could be less educated than today’s workforce, which will result in a drop in the state’s per capita income.
• If the disparity in degree attainment does not change, the educational level of the Illinois worker may decrease as the population shifts to fewer white workers and more workers from populations with lower levels of educational attainment. As the Harper College district becomes increasingly Hispanic, it will be important for the college to continue its recruitment and retention efforts with this segment of the population.
• By 2030, the population of the Harper College district should be close to maximum capacity. Employment, however, is outpacing the increases in population. If these predictions hold, and if the population becomes increasingly low-income, the district will have even more difficult challenges in recruiting and retaining a skilled workforce. In addition, these trends could result in a lowering of the median household income.
• As employers, community colleges may face continuing shortages in areas such as nursing faculty and administration
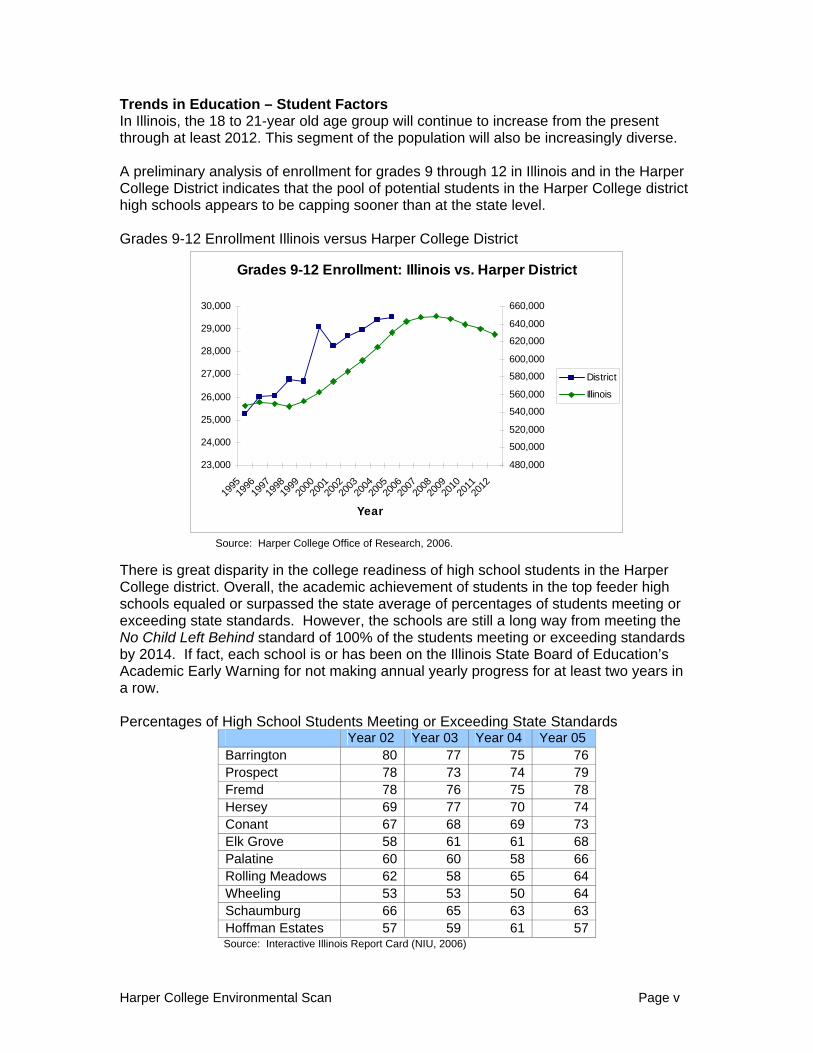
Trends in Education – Student Factors In Illinois, the 18 to 21-year old age group will continue to increase from the present through at least 2012. This segment of the population will also be increasingly diverse. A preliminary analysis of enrollment for grades 9 through 12 in Illinois and in the Harper College District indicates that the pool of potential students in the Harper College district high schools appears to be capping sooner than at the state level. Grades 9-12 Enrollment Illinois versus Harper College District
Grades 9-12 Enrollment: Illinois vs. Harper District
23,000
24,000
25,000
26,000
27,000
28,000
29,000
30,000
1995
1996
1997
1998
1999
2000
2001
2002
2003
2004
2005
2006
2007
2008
2009
2010
2011
2012
Year
480,000
500,000
520,000
540,000
560,000
580,000
600,000
620,000
640,000
660,000
District
Illinois
Source: Harper College Office of Research, 2006. There is great disparity in the college readiness of high school students in the Harper College district. Overall, the academic achievement of students in the top feeder high schools equaled or surpassed the state average of percentages of students meeting or exceeding state standards. However, the schools are still a long way from meeting the No Child Left Behind standard of 100% of the students meeting or exceeding standards by 2014. If fact, each school is or has been on the Illinois State Board of Education’s Academic Early Warning for not making annual yearly progress for at least two years in a row. Percentages of High School Students Meeting or Exceeding State Standards
Year 02 Year 03 Year 04 Year 05 Barrington 80 77 75 76 Prospect 78 73 74 79 Fremd 78 76 75 78 Hersey 69 77 70 74 Conant 67 68 69 73 Elk Grove 58 61 61 68 Palatine 60 60 58 66 Rolling Meadows 62 58 65 64 Wheeling 53 53 50 64 Schaumburg 66 65 63 63 Hoffman Estates 57 59 61 57
Source: Interactive Illinois Report Card (NIU, 2006)
Harper College Environmental Scan Page v

In addition to the disparity among schools, there are significant gaps in the achievement levels of low-income students as compared to their not low-income peers. Approximately, 25-30% fewer low-income students meet or exceed the 11th grade reading or mathematics standards than their peers in the college’s feeder high schools. There is national concern over the low performance of high school students. On June 19-20, 2006, the Illinois State Board of Education hosted the high school reform conference to address ways to increase high school completion rates, increase the academic achievement of students, and better align high school expectations with those of colleges and the workplace. The concern over low performance extends into college. The growing consensus is that too few students who intended to complete college actually obtain a degree. At the community college level, two characteristics which appear to increase the chances of completing a two-year degree are 1) earning credits in college-level math and 2) completing summer coursework (Adelman, 2005). Tracking college students to determine graduation rates is difficult. Most models use a “pipeline” methodology. Judith Ramaley of the National Science Foundation (2001) recommends that the “pipeline” model for education be replaced with a “pathways” model. The pipeline model implies a straightforward, linear progression in which one moves through school and to work. In reality, students follow various pathways as they enroll in multiple institutions, simultaneously combine work and education, and re-train for multiple careers. In fact, research by Adelman (2005) found that nearly 60% of traditional-age students completing a bachelor’s degree attended more than one institution, 35% attended more than two, 20% who started at one 4-year college completed at another, and 15% moved back and forth between community colleges and 4-year institutions. The expectations placed on community colleges are expanding. At one time, “education” referenced the time in schools and colleges and “training” was for the workplace or special trainers. As workers need on-going, lifelong learning to keep current in their occupations, there should be “more efforts to integrate higher education, training, and work” (Yankelovich, 2005). Lifelong learning will apply to the general citizenry as well as the worker; e.g., as health care options become more technical, the average person needs a knowledge base on which to make the best personal healthcare decisions. Trends in Education – Curriculum, Assessment, and Instruction Harper College is well established within the district and highly regarded by its constituents. It is best known for quality education, associate’s/two-year degrees, preparation for four-year colleges, low cost/affordability, and a variety of programs/flexible hours (Greystone Group, 2005). The 21st Century brings new challenges to community colleges, including Harper College. The changing skill set for the 21st Century, increasing demands for accountability, changes in pedagogy, and increasing competition are a few examples. Changing Skills for the 21st Century The Partnership for 21st Century Skills (March 2006) involved educators, employers, parents, community members, and students in identifying the 21st Century skills.
Harper College Environmental Scan Page vi

Harper College Environmental Scan Page vii
The proposed curriculum included skills to be taught in an integrated, balanced approach and learning evaluated through authentic assessments:
• Core Subjects - English, reading or language arts, mathematics, science, foreign languages, civics, government, economics, arts, history, and geography
• 21st Century Content - global awareness; financial, economic, business, and entrepreneurial literacy; civic literacy; health and wellness awareness
• Learning and Thinking Skills - know how to keep learning throughout life, critical-thinking and problem-solving skills, communication skills, creativity and innovation skills, collaboration skills, contextual learning skills, and information and media literacy skills
• Information and Communications Technology - ability to use technology to develop knowledge and skills
• Life Skills - leadership, ethics, accountability, adaptability, personal productivity, personal responsibility, people skills, self-direction, and social responsibility.
The 21st Century workplace needs “workers who can negotiate, coordinate, and facilitate rather than manage, direct, and control” (GDA, 2003, p. 17). Greater Expectations (Association of American Colleges and Universities, 2002) advocated for more emphasis on skills which can be used to evaluate information, greater understanding of ethnical consequences of actions, and skills to thrive in a global, diverse cultural environment. Increasing Demands for Accountability Community colleges are vital, innovative, and effective in providing high quality and affordable education in the face of rising tuition and lower per-student funding; in meeting the needs of the increasingly ethnically diverse population; and in leading the way in e-learning (Rockbridge, 2006). This message, however, is not clearly articulated nor understood by the public. The call for increased accountability for colleges and universities is coming from diverse sectors. The U.S. Department of Education formed the Miller Commission; however, other groups are clamoring as well for outcomes measures.
• The Higher Learning Commission routinely requires follow-up visits and reports for colleges not completely implementing and using student learning outcomes assessments.
• The National Center for Postsecondary Improvement (2002) outlined three areas of improvement needed in higher education: improve educational quality and institutional performance; be more responsive in balancing market forces with higher education’s public purpose; and use better data to document what is known about institutional structures and practices.
• A report from the National Center for Public Policy and Higher Education, The Governance Divide, advocated for more alignment between all of the P-16 educational system, including the alignment of courses, policies to connect the funding for P-16 education, coordinated data systems to track students, and an accountability system to assess the pre-college and college interface.
• Jobs for the Future, a Boston advocacy group, chastised states which do not have specific, measurable goals and established strategies for increasing college participation, retention, and graduation rates (Collins, 2006).

Harper College Environmental Scan Page viii
On the other hand, the Community College Student Engagement survey is used by many institutions across the U.S. to benchmark student learning and retention (www.ccsse.org). This instrument was recommended to the Commission on the Future of Higher Education as a possible way to establish national accountability data. The National Community College Benchmark Project began as a pilot project at Johnson County Community College in Kansas. It was found to be a successful way for community colleges to share comparable data and benchmark themselves against other similar community colleges while reserving the anonymity of the data (www.hccbp.org). Changes in Pedagogy Derek Bok, former president of Harvard (2005), maintains that “lecturing remains the most common method of instruction even though much research suggests that more active forms of teaching help students learn more and remember better what they learn. Although more than 90% of professors claim that improving critical thinking is the most important goal of undergraduate education, the great majority of exam questions merely test recall or comprehension of course materials” (Lipka, December 16, 2005). Changing technology and pedagogy are reflected in the “movement in higher education to more closely examine the design of learning space—virtual and physical, formal and informal—and the effects of that design on learning. That exploration is being done collaboratively by faculty, technologists, and designers of the built environment” (SCUP, 2006). Technology is changing the way education is delivered and perceived. Megatrends for education (GDA, 2003) include
• Increased use of technology for interacting with students for instruction and student services
• Wireless telecommunication networks around campus • Rapid growth of wireless networks and device capabilities, increasing the need
for expanded bandwidth and concerns about security • Student support services delivered via technology • More virtual instruction • Increased fiscal strain on institutions to keep state-of-the-art technology.
Some see the real challenge not in the hardware but in managing the continuously expanding, ubiquitous amounts of information. Ways to organize, understand, and use these vast amounts of information are needed. More students will arrive at college with computer skills. Almost one-quarter of school districts nationwide and nine states have invested millions of dollars in “one-to-one” laptop programs, hoping the availability of a computer for every student will improve achievement and other skills. Printed textbooks are being replaced with electronic textbooks with modules which can be easily updated and customized for different learners. Rather than face-to-face or online instruction, podcasting is being used more frequently. With the “University of iPod,” we are in the initial stages of revolutionizing the delivery of instruction and exploring new paradigms for learning. E-mobile learning was unleashed last year when

Apple Computer Inc. piloted the use of iTunes U with six universities to enable students to access course lectures via the iTunes software. Transitioning from printed page to podcasting requires more than changing the delivery of the curriculum. “Perhaps is it time to consider a blank sheet approach to learning, by setting aside existing educational systems, policies, and practices, and instead first focusing on what knowledge, skills, and abilities a person will need to lead a productive and satisfying life in the century ahead. Then, by considering the diversity of ways in which people learn, and the rich array of knowledge resources emerging in our society, design a new ecology of learning for the 21st Century” (Duderstandt, 2003, p. 20). E-Learning is prevalent in U.S. community colleges. Nearly all (98%) offer online courses, and half offer the same version of the online course as they do in a traditional delivery method. The vast majority (94%) plan on expanding online courses; however, funding (45%) was the most often noted challenge. About one-fourth (27%) noted faculty resistance as a challenge. The Open Content Initiative funded through the Hewlett Foundation provides a new perspective on education. It provides the infrastructure needed to make course materials accessible to anyone with web access. The University of California at Irvine, the University of California at Berkley, MIT, Utah State, Johns Hopkins School of Public Health, Rice, and Carnegie Mellon have free materials online—no tuition, no fees, just use the material how you wish. Traditional instructional approaches are under fire from those within and outside of education. New cross-discipline programs are becoming more common, such as biotechnology and business with engineering or healthcare. Physics First advocates for changing the traditional sequence of science to include a problem-based, less math-intensive physics course as the first step. Instructional Competition Instructional competition is increasing both within the U.S. and globally. Students go between institutions finding the courses and programs that meet their scheduling and financial needs. With increasing costs of tuition, fees, and books, students are more sensitive to the quality of the instruction and the net benefit provided to the student. Delivering instruction was once the purview of accredited or state-recognized educational institutions. The alternative credentialing being offered online through sites such as Brainbench are challenging that concept. Non-credit certifications are granted through passing on-line tests, and remedial instruction is readily available through the site to help those not quite ready pass the test. China, India, and South Korea are ramping up their colleges to prepare engineers and science graduates. The for-profits postsecondary institutions are increasing market share by focusing on niche markets and providing convenient, responsive, customer-oriented programs that are based on an applied pedagogical approach and that culminate in student graduation and employment. Even thought tuition is higher, students like the convenient scheduling of courses; accelerated degree completion through year around study; and coordinated, intensive student services (Bailey & Badway, 2001).
Harper College Environmental Scan Page ix
Local competition around Harper College is increasing. Appendix D lists some of the programs offered by competitors within 10 miles of the 60067 zip code. Trends in Education – Meeting the Needs of Business and Industry A goal of higher education is to prepare a skilled workforce to meet the economic development needs of the region served. A survey conducted by Northern Illinois University in 2005 found nearly two-thirds of employers believe Illinois colleges and universities do an “excellent” or “good” job of preparing graduates for the workforce. Over half (52%) of the employers indicated that continuing education was very important--significantly fewer than the 65% reported in 1998. On the other hand, in 1965, in addition to credit students, an additional 22% of the adults in the U.S. participated in some type of education; by 2001, this percentage had increased to 46% (SCUP, 2005). In the NIU survey, employers offered the following recommendations on ways to improve the higher education-business relationship: keep employers better aware of what programs and services the college can offer; focus academic courses on more authentic, real-world content; improve recruiting practices so employers know the skills students possess; and provide more internship opportunities. Nearly 98,000 workers commute into the northwest suburbs daily, indicating an “exporting” of the management workforce and an importing of the construction and production workforce. Gordon (2005) summarized the problem with workforce preparation: “in contemporary America there are just too many people training for the wrong jobs and not enough people preparing for the jobs we are creating…The career aspirations of much of the population in the U.S. are at serious odds with the increasingly high-tech needs of the economy.” Strong academic advising and career counseling is needed to provide a balanced mix of student majors and regional need. From 2002 to 2012, employment in the U.S. is predicted to increase 14.8% but only 6.7% in Illinois. The future looks brighter for the Chicago region, which has a predicted increase of 10.5%. Critical skills shortages are predicted for nursing, transportation, and specialized areas of manufacturing (IDES, 2006). The projected critical shortage of nurses is nationwide. The State of Illinois is proposing to spend a yearly additional $3-$5 million on the nursing crisis through 2020. The challenge often faced by colleges includes the availability of qualified nursing faculty as well as the need for additional funding to hire them. The number of jobs in the Chicago-Naperville-Joliet MSA will continue to grow. The following exhibit shows three factors – the average wage of a worker, the percentage of predicted growth from 2002-2012, and the portion of the total workforce for that industry as reflected in the size of the bubble. Manufacturing, a higher wage occupation with significant number of jobs, will have minimal growth, mostly due to increased productivity through the use of advanced technology. Professional, scientific, and technical services and construction are predicted as both high income and relatively high growth. Health care is to continue to be a growth industry with an average wage around $38,000.
Harper College Environmental Scan Page x

Predicted Growth and Annual Wage by Industry from 2002 to 2012
Source: IDES, 2006. The top ten occupations in Cook County by size, growth, and wage that do not require a 4-year degree as reported in the State of the Workforce Report (Workforce Board of Northern Cook County, 2003, p. 2) were: 1. Police Patrol Officers 2. Brick Masons 3. Electricians 4. Registered Nurses 5. Computer Support Specialists
6. Personal and Home Care Aids 7. Business Services Sales Agents 8. Dental Hygienists 9. Engineering Technicians 10. Truck Drivers, Heavy
Job Titles Predicted to Lose the Most Jobs 2002-2012 Chicago-Naperville-Joliet MSA
Bottom 20 Occupations # Jobs Eliminated 1 Secretaries, except Legal, Medical and Executive -492 2 Stock Clerks and Order Fillers -354 3 Data Entry Keyers -242 4 Secretaries, Adm. Assts. & Off. Supp. Wkrs, AO -209 5 Word Processors and Typists -173 6 Team Assemblers -144 7 Telephone Operators -131 8 Postal Service Mail Sorters & Machine Operators -129 9 Computer Operators -120 10 Order Clerks -117
Source: IDES, 2006
-5.00
0.00
5.00
10.00
15.00
20.00
25.00
30.00
$0 $20,000 $40,000 $60,000 $80,000 $100,000 $120,000 $140,000
Annual Wage
Manufacturing
ManagementFire & Insurance Information
Professional, Scientific, Technical ServicesConstruction
Health Care
Administrative Services
Arts, Entertainment
Hotel/Food
Retail Trade
Wholesale TradePersonal Services
Education
Transportation
Harper College Environmental Scan Page xi

Harper College Environmental Scan Page xii
The following high-paying occupations have many projected job openings for 2004-2014 for the State of Illinois. The median annual earnings in 2004 are listed next to each occupation. Registered nurse leads the list. High-Paying Occupations with Many Job Openings Projected 2004-2014 in Illinois
Source: U.S. Bureau of Labor Statistics: http://www.bls.gov/opub/ooq/oochart.htm Emerging, new jobs are being created for
• Alternative energy and the environmental greening sector • Translating information into usable forms, data warehousing and mining • Consumer financial services as boomers and the younger generation grapple
with retirement and soaring healthcare costs • Biotechnology, pharmaceutical studies, and stem cell research to address the
need for drugs and advanced research • Bioscience including astrobiology, biomaterials, and biomechanics • Homeland security and the industries around defense and safety, such as
biodefense and bioinformatics • Advanced manufacturing including biopolymers, celestial mining,
nanotechnology, and smart materials.
212122
262728
3436
41444446494951
5759
6589
120
0 20 40 60 80 100 120 140
First-line Supervisors/Mgrs Construction $50,450
Physcians and Surgeons $145,600
Middle School Teachers, except Sp Ed/Voc Ed $43,670
Police and Sheriff's Patrol Officers $45,210
Computer Software Engineers/Applications $74,980
Licensed Practical Nurses $33,970
Automotive Service Technicians/Mechanics $32,450
First-line Supervisors/Managers Retail Sale $32,720
Carpenters $34,900
First-line Supervisors/Mgrs Office/Admin $41,080
Secondary School Teachers, except Spec Ed and Vocational $45,650
Maintenance and Repair Workers, General 30,710
Executive Secretaries and Administrative Assistants $34,970
Accountants and Auditors $50,770
Truck Drivers, Heavy and Tractor-Trailer $33,520
Sales Representatives, Wholesale and Manufacturing $45,400
Elementary School Teachers, except Spec Ed $43,160
General and Operations Managers $77,420
Postsecondary Teachers $51,800
Registered Nurses $52,330

Harper College Environmental Scan Page xiii
Trends in Education – Financial Support Approximately 40% of community college executives feel it is unlikely that their school can maintain the affordability of education over the next few years and consider tuition and/or decreasing financial aid funding as the major challenges (Rockbridge, 2006).
Public community colleges in Illinois are predominantly funded through local property taxes, state and federal funds, and tuition and fees. There is a movement to reduce, or eliminate, the local property tax contribution. State and federal funding has decreased. Raising tuition and fees can limit access to education for the low- and middle-income families.
Harper College is facing fiscal challenges. According to the Harper College 2005-2006 College Plan and Budget, the college has lost $500,000 in the last five years due to federal and state cuts in support services for the disabled, tutoring, women’s services, advising, writing center, minority transfer services, ESL, and AED. The under-funded Illinois Veterans Grant cost the college $195,000 in Fiscal Year 2005. State appropriations were down $85,576 in Fiscal Year 2006 with a total decrease of $2,836,681 or 29.1% over four years.
Research from the National Center for Public Policy and Higher Education and the Ed Trust confirm the growing number of students graduating from college with increasing levels of debt and the hundreds of thousands of students dropping out of college, but needing to repay educational loans without the benefit of degree.
Major Issues Affecting Community College Three reports provide similar focal points for community college planners. First, a 2006 survey of 245 community college executives identified the following major daily challenges for community colleges (Rockbridge, 2006):
• Student retention (87%) • Lack of state/local funding (86%) • Under-prepared students (84%) • Rising personnel costs (81%) • Rising technology costs (79%).
Second, Keeping America’s Promise: a Report on the Future of the Community College (2002) was a joint project of the Education Commission of States and the League for Innovation in the Community College. It identified trends, promises, and actions for community colleges. The proposed actions were:
• Create stronger connections with K-12 education • Build a new culture of evidence in community colleges • Provide effective remediation • Strengthen student engagement in the community college learning experience • Rethink and redesign • Exercise leadership
Lastly, the recommendations in the draft report of the Commission on the Future of Higher Education directly impact community colleges. Four areas were covered in the report: access, affordability, quality and innovation, and accountability. The following are selected highlights of the draft as reported in The Chronicle of Higher Education (Field, 2006, pp. 3-5) and in Chapter VI:

Harper College Environmental Scan Page xiv
Access
• Review and revise standards for transfer of credit among higher-education institutions to improve quality and reduce the amount of time it takes students to reach their educational goal.
• Overhaul K-12 teacher preparation with particular emphasis on reforming colleges of education.
• Address nonacademic barriers to college access by developing partnerships among schools, colleges, and the private sector to provide early and ongoing-college awareness activities, academic support, and college-planning, and financial-aid-application assistance.
Affordability
• Overhaul the entire student-financial-aid system in favor of substantial increases in need-based aid. Consolidate programs and restructure the system to increase access and retention and decrease debt burden.
• Significantly increase federal funding of need-based financial aid, subject to simplification and restructuring of the system. Give priority to need-based financial aid.
• Replace the Free Application for Federal Student Aid, known as FAFSA, with a postcard-size application form, and analyze student need through the federal tax system.
• Create a “bottom line” for college performance that measures institutional costs and performance, and enables parents and policy makers to see institutional results in terms of academic quality, productivity, and efficiency.
• Reduce barriers to transfer of credit and unnecessary accrediting constraints on new institutions.
Quality and Innovation
• Establish a federal fund to provide incentives for effective teaching and use the latest research in rapidly growing areas such as neuroscience, cognitive science, and organizational science.
• Do more to support and harness the power of distance learning. • Develop a national plan to keep the United States at the forefront of the
knowledge revolution. • Establish a nationwide pilot program for Lifelong Learning Accounts
(individual asset accounts to finance education and training), to allow workers to continuously upgrade their skills while increasing their earnings. The accounts would be financed through tax incentives to individuals and employees.
• Establish a National Innovation Partnership that provides federal matching funds to states to encourage innovations in program formatting, delivery, and transfer of credit.
• Develop a comprehensive plan for better integration of policy, planning, and accountability among postsecondary education, adult education, and vocational education.

Harper College Environmental Scan Page xv
Accountability • Require institutions to measure student learning using measures such as the
National Survey of Student Engagement and the Community College Survey of Student Engagement, as well as the Collegiate Learning Assessment and the Measure of Academic Proficiency and Progress. Provide incentives for states, higher-education associations, systems, and institutions to develop outcomes-focused accountability systems.
• Make results of such measures available to students and report them publicly in the aggregate. They should also be included on transcripts and in national databases of accountability data. Institutions should make aggregate results publicly available in a consumer-friendly form.
• Administer the National Assessment of Adult Literacy every five years, instead of ten.
• Require the National Center for Education Statistics to prepare timely annual public reports on college revenues and expenditure, including analysis of the major changes from year to year, at the sector and state levels.
• Develop a national unit-record tracking system to follow the progress of each student in the country, with appropriate privacy safeguards.
• Create a consumer-friendly information database on higher education including a search engine that allows parents, policy makers, and others to weigh and rank institutions based on variables of their choosing.
• Establish a national accreditation framework that contains a set of comparable performance measures on learning outcomes appropriate to degree levels and institutional missions, and that is suitable for accreditation, public reporting, and consumer profiles; that does not prescribe specific input and process standards; and that requires institutions to report progress relative to their national and international peers.
• Make accountability more transparent as a condition of accreditation. Make the findings of reviews easily accessible to the public, and increase the proportion of public representatives in the governance of accrediting organizations and members of review teams from outside higher education.
It is obvious that many of the recommendations are aimed at national and state-level agencies; however, the impact will follow through to individual institutions. Community colleges should keep abreast of the Commission’s final report and determine the impact these recommendations will have on the individual institution. The next few years will be critical to Illinois community colleges. The increasing national clamor for the reform of higher education, the upcoming final recommendations from the Commission on the Future of Higher Education, and the findings of the Illinois Task Force on Community Colleges could precipitate systemic change. Some believe the change will come from global and local educational competitors; others believe that higher education will once again be responsive to the needs of those they serve and adjust accordingly. Given this context, college planners can help shape the future of their institution in the 21st Century.

Harper College Environmental Scan Page xvi

INTRODUCTION
During the last decade, colleges found it necessary to adjust their practices to accommodate external changes occurring around them--the college website with an on-line catalog became a primary recruiting tool, instructional delivery expanded to include on-line and hybrid approaches, and some colleges began iPod-based courses. Such technological advances, as well as demographic, political, and economic trends, can greatly influence who attends college, what content is offered, how instruction is delivered, and the resources available to the institution. College administrators, faculty, and staff who identify critical internal and external changes are best prepared to strategically plan the future of the institution. This report presents national, state, regional, and local data that may directly, or indirectly, affect Harper College. These trends, events, and observations can be used to initiate discussions on what are the critical factors that may impact the college in the next 5,10, to 20 years and what actions the college could consider. Of course, no environmental scan is a complete forecast of the future. Convergent trends, highly predictable trends, highly improbable situations, and unpredictable chance events can abruptly change the course of history. The scan, however, can help planners better understand the forces that are, or may, impact the college and increase the lead-time to respond to the more predictable trends. In order to help plan for the future, this report includes six sections on the major trends impacting Harper College:
I. Convergence of Demographic, Economic, Technological, and Political/Social Trends
A summary of significant trends in each of these areas, followed by a concluding section
II. Trends in Education - Student Factors Trends in student demographics and academic preparation/readiness
III. Trends in Education - Curricula, Assessment, and Instruction Recommendations on the 21st Century knowledge and skills needed by
students, trends in higher education assessment and accountability, and trends in instructional approaches and newer pedagogy
IV. Trends in Education - Meeting the Needs of Business and Industry Illinois Department of Employment Security data and projections of future job
growth, new, emerging occupations, and the infrastructure needed for economic growth
V. Trends in Education - Financial Support Trends in funding of education and financial assistance for students
VI. Major Issues Affecting Community Colleges The most critical issues community colleges face
Harper College Environmental Scan Page 1

Harper College Environmental Scan Page 2
I. CONVERGENCE OF DEMOGRAPHIC, ECONOMIC,
TECHNOLOGICAL, AND POLITICAL-SOCIAL TRENDS This chapter examines the convergence of demographic, economic, technological, and political/social trends that will most likely impact the education system in the U.S. and Harper College. Combined, these trends present some challenges and opportunities for community colleges. Before examining the trends, it is useful to look at the context of higher education in the 21st Century. Over twenty national reports in the past 10 years have concluded that the United States is slipping in its global competitiveness. For example, A Roadmap for American Innovation (Council on Competitiveness, 2005) summarized the challenges facing the U.S.:
• Talent, technology, and capital are available globally. • Global competitors are gaining on the U.S. through investment in research
and education. • U.S. investment in engineering, math, and related sciences has been flat for
more than a decade. • High school students in the U.S. perform well below those in other
industrialized nations in the fields of mathematics and science. According to Innovate America (Council on Competitiveness, 2004, p. 5), “Innovation will be the single most important factor in determining America’s success through the 21st Century”, and innovation depends upon investing in resources and creating the infrastructure needed to prepare a quality workforce with appropriate knowledge and skills needed for economic growth. In other words, the competitiveness of the U.S. is directly linked to its ability to educate its workers and citizens (Carnevale & Desrochers, 2003). Multiple national initiatives are in place currently, with others proposed, to transform education to meet the new challenges of the 21st Century. The U.S. Department of Education and Congress are discussing the challenges and proposing solutions. Numerous state coalitions have formed to improve education. Even major business and industry groups have offered wide-ranging recommendations. Some of the recommendations focus on better recruitment and retention of teachers, increasing the mathematics and science requirements, addressing remediation problems, and providing more scholarships and funding for education. On the other hand, a growing discontent with education is reflected in the recommendations to completely re-engineer the education system from the primary grades through higher education. A summary of the major recommendations and issues facing education are in Section VI and in Appendix A. In light of the developing national momentum and interest in education, community colleges are being called upon to take an even more active role in the economic development of their districts at a time of escalating demand for programs and services, decreased public and private funding, and increased mandates for accountability. Within this context of increasing globalization and increasing focus on education, the following chapters provide information aimed to help Harper College best achieve its mission.

DEMOGRAPHIC TRENDS Harper College’s district consists of clusters with very different demographic characteristics. In general, it has mature municipalities with less than 5% of their area available for development and within 10% of the projected population cap. Whereas some of the municipalities are rather static demographically, others are undergoing dynamic population shifts (Northeastern Illinois Planning Commission, 2003). Ethnographic and Age Shifts The Metro Chicago Immigration Fact Book (Paral & Norkewicz, 2003) identified 8 locations of the 25 top Chicago-area immigration population centers within the Harper College district: Mount Prospect, Schaumburg, Palatine, Des Plaines, Hoffman Estates, Wheeling, Arlington Heights, and Buffalo Grove. The regional immigrant population is mostly from Mexico (41% of foreign-born population, 7% of total Chicago Metro population), Poland (10% of foreign-born population, 2% of metro region), and India (5% of foreign-born, 1% metro region). “Among the leading ‘port-of-entry’ are locations in Mount Prospect, Arlington Heights, and Palatine (Paral & Norkewicz, 2003, p. 3). The Latino population within the Harper College district is located mostly in the northeastern portion of the district and along Interstate 90 and tends to have lower levels of education than the native population. The median age of the population varies across the district with the oldest population in the northwestern area of the district. Areas with the greatest levels of Latino immigration have the lowest median ages. If the Baby Boomers retire and remain within the district, the 55-and-over population will continue to increase. In general, this segment of the population is educated and will be seeking ways to remain active. Baby Boomers, Generation X, and the Millennial Generation In 2011-12, the leading edge of the Baby Boomer generation will reach age 65. Just as this generation altered lifestyles and traditions, there are strong indications they also will redefine retirement—in fact, nearly 80% of the Boomers plan to work in some capacity in retirement or delay retirement (Roper ASW, 2004). This talented, experienced pool of workers is looking for flexibility in employment, mostly part-time, and in jobs that make significant social impacts. They are carefully watching, and voting, to preserve their pensions and to harness healthcare costs. Needless to say, traditional “dependency ratios” may not be sufficient in predicting the impact of the Boomers on the economy, and the allocation of public funds will be altered by this large voting block. During the next few decades, the college workplace and classrooms may include at least three generations—each with a different ideological orientation. Generation X, or those born in the 1961 to 1981 era, is the latchkey generation. In general, they shun the all-absorbing work-orientation of their parents—don’t give your life away to be downsized. They work hard and play hard, leaving work at work. They are described as self-confident, self-reliant, and multi-taskers. They grew up during change and accept it; they fiercely guard their personal and leisure time. On the other hand, Gen Y, which is also called the Millennial Generation (born after 1977 or 1982, depending on the source), have been described as confident, conventional, team-oriented, pressured, and high achievers (Boyd, Sept. 24, 2005). The Gen Ys seek out meaningful work, open-minded
Harper College Environmental Scan Page 3

workplaces, and jobs which can accommodate their personal lives (Tulgan & Martin, 2001). The differences among these three generations are so great that a new position for the future could be Corporate Age Advisor, a person to mediate disagreements between age groups (Challenger, 2005). Businesses, such as Xerox, are changing recruitment tactics for Gen Y by using campaigns as “Express Yourself” and emphasizing flexible work schedules, telecommuting, full tuition reimbursement, and online mentoring (Tulgan & Martin, 2001). Flight of the Exurbanites A recent trend noted in U.S. Census data is the expanding population growth beyond Chicago and the collar counties. A growing exurbia movement is evident in the five-year growth rates of various counties: Kendall (46%), Will (28%), and Boone (21%). Often the new population in these rural areas came from the suburbs. The Harper College district may begin to see evidence of the “flight” of the exurbanites. As the Baby Boomers reach retirement age, they may move away from the high-priced suburbs into smaller homes or condos in rural areas. There is growing speculation that as Boomers leave the suburbs, the housing values may decrease, opening the region to lower-income families with adults with lower levels of education. Other suburbs, such as Berwyn, have watched their populations change quickly from a skilled population to an increasingly under-skilled immigrant population within 10 years. Areas once thought to be within a maximum population limit increased, mostly due to the higher number of births among the immigrant population.
Harper College Environmental Scan Page 4

Harper College Environmental Scan Page 5
ECONOMIC TRENDS The Workforce Board of Northern Cook County (2003) summarized the positive features and the challenges of the Northern Cook region:
• A diverse industrial mix, with strengths in manufacturing, professional/scientific/technical services, construction, and information. Northern Cook’s industrial diversity mirrors the region, which mirrors the nation. Recovery from the current recession should be relatively faster than other regions as a result. Manufacturing employment will continue to decline; however, the need for advanced skilled labor and replacement positions will keep it a strong sector in the region.
• High-wage, high-skill occupations, with 29% of available jobs in management,
professional, and related occupations; however, the greatest opportunities are in jobs that require less than a four-year degree. The aspirations of youth may not match the jobs available, leading to unemployment or underemployment.
• Attraction to workers from outside the area, with over 165,000 people
entering the area to work everyday. The area exports managers and professionals and imports jobs in services, construction, and production.
• High median household incomes; however, growing number of “have nots” in
terms of income, educational attainment, and skill levels.
• Vitality from increasing diversity, including the highest percentages of Asian immigrants in the region. At the same time, there are large numbers of people without English communication skills.
The following sections further explore these and other related topics. Recovery from the Recession According to the Illinois Department of Employment Security (IDES, 2004, p. 1), “it is clear that the recession has had a much larger impact on the employment of Illinois and its surrounding border states than it has on national employment.” Between 1990 and 2005, Illinois lost nearly one-fourth of its manufacturing industry jobs, representing a loss of 222,500 jobs. Schaumburg-based Motorola, Inc. is a prime example. In terms of the proportion of employment, in 1999, the manufacturing share of employment in Illinois was 14.8% and in the U.S. 13.4%. By 2004, the Illinois manufacturing share had decreased further to 12.1%, and the U.S. share declined to 11.0% (National Science Board, 2006). In addition to manufacturing, the proportion of employees in high-technology establishments decreased from 1998 to 2002 in the U.S. from 8.93% to 8.35%. Illinois experienced a similar decrease from 9.12% to 8.24%. These decreases reflect the nearly 7% of jobs in high-technology industries in the U.S. which were lost between 2000 and 2002 (National Science Board, 2006).

In recent months, economic indicators show a recovery; business activity in the Midwest is expanding at rates faster than anticipated (Chicago Business, March 31, 2006). The latest unemployment statistic for the Chicago-Naperville-Joliet Metropolitan Statistical Area was April 2006 at 4.9%, lower than the 2005 annual rate of 5.9%, and considerably lower than the April 2005 rate of 6.1% (U.S. Bureau of Labor Statistics, 2006); however, much higher than the unemployment rates in 1990, around 3%. Exhibit 1 Illinois Labor Force 1996-2006
Source: Illinois Department of Employment Security, (IDES, 2006) Median Incomes and Poverty The northwest suburbs include a mix of the highest and lowest income families (Lewis, June 2003). Hoffman Estates and Schaumburg ($142,098) and the Barrington communities ($125,656) are ranked 7th and 10th respectively among Chicago area’s most affluent communities as measured by average family income (Chicago Business, November 29, 2004). The median household income in Illinois has decreased 12% from 1999 to 2005--a much larger decrease than the national rate of 4%. According to Ralph Matire, executive director for the Center for Tax and Budget Accountability, “Absolutely all net new jobs in this state have been in lower-paying service jobs. Generally speaking that means no health insurance benefits, no retirement, and working full-time for wages that pretty much cannot support a family of four” (Chicago Tribune, November 17, 2005). If the job projections for 2002 through 2012 hold, the problem will increase within the state. There are only two areas in Illinois for which projections indicate more new high-wage jobs than new low-wage jobs. The two areas are the northeastern sector including Chicago and a region near St. Louis (Center for Tax and Budget Accountability and NIU, 2005). Even though the Chicago region is fairing better wage-wise than other areas in the state, poverty does exist and is increasing in Harper College’s district. Palatine, Mount
Harper College Environmental Scan Page 6

Prospect, Schaumburg, and Hoffman Estates each have at least 2,000 people living in poverty. About three-fourths of the housing in the northwest suburban area is owner occupied; however, Wheeling, Palatine, and Schaumburg have over 30% of the housing in rentals. “Rent burdened” is defined as over 30% of the income is expended on rent. Nearly one-third of those renting in the Harper College district are “rent burdened.” In the Chicago region, 10.7% of the families are considered the working poor, an increase of 2.6% in ten years (Chicago Business, November 22, 2004). The poverty rates in the Harper College district are lower than the regional rates; however, the most vulnerable of the population are the elderly and the young. Exhibit 2 Percentages of Population in Poverty
Age 65+ All Children Wheeling 7.9 5.3 6.6 Elk Grove Village 6.2 2.0 1.6 Palatine 5.1 4.8 5.6 Schaumburg 4.5 3.0 3.3 Barrington 3.8 3.1 3.9 Mount Prospect 3.7 4.6 6.3 Arlington Heights 3.0 2.5 2.1 Rolling Meadows 2.9 5.1 7.4 Hoffman Estates 2.8 4.4 5.7 Inverness 1.8 1.5 0.4 Prospect Heights 1.4 4.3 5.2 South Barrington 0.5 2.6 4.5
Highlight indicates greater than 5%. Source: Poverty and Housing in the Northwest Suburbs (Lewis, June 2003) The increase in poverty is observed, also, in the increasing numbers of low-income students in the public schools in the Harper College district. At the high school level, both District 211 and District 214 have had steady increases from 2001 through 2005 in the percentages of students qualifying for free and reduced-price lunches. In 2005, these percentages in both districts exceeded 10%. Barrington High School, also, has experienced increases in the percentage of low-income students since 2001.
Harper College Environmental Scan Page 7

Exhibit 3 Percentages of Low-Income Students in High Schools
0.0
2.0
4.0
6.0
8.0
10.0
12.0
14.0
YR99 YR00 YR01 YR02 YR03 YR04 YR05
HS District 211 HS District 214 Barrington HS
Source: Interactive Illinois Report Card (Northern Illinois University, 2006) In the pre-high school districts, the poverty rates for District 15 and District 21 are considerably higher than the rates for the high schools. Nearly 30% of the students in District 21 and nearly 25% of the students in District 15 were classified as low income in 2005. Exhibit 4 Percentages of Low-Income Students in Pre-High Schools
0.0
5.0
10.0
15.0
20.0
25.0
30.0
35.0
YR99 YR00 YR01 YR02 YR03 YR04 YR05
District 15 District 21 District 25 Barrington Middle
Source: Interactive Illinois Report Card (Northern Illinois University, 2006) The Decline of the Middle Class The increasing percentages of low income coupled with the recession is resulting in a widening gap between the “haves” and “have nots.” The middle class in Illinois is declining as evidenced by widening gaps in income and job opportunities for middle-tier workers (Center for Tax and Budget Accountability & NIU, 2005). This gap is not unique
Harper College Environmental Scan Page 8

to Illinois; it is an international and national trend as well. The top 20% of U.S. workers control 85% of the U.S. wealth, and the middle tier is shrinking as the top and bottom tiers increase (Reich, December 8, 2005). In the northern Cook County area, average wages increased only 4% from 2001 to 2004, not keeping up with inflation. The average wage of a new hire decreased 1% from 2001 to 2004 (U.S. Census, 2006). Within the Harper College district, disparity is apparent when the median household incomes are compared. Exhibit 5 shows the median household incomes for some of the larger municipalities in the college’s district. The highest and lowest median household incomes differ by nearly $30,000. Barrington, with the highest percentage of households with incomes over $100K, also has one of the highest percentages of household with incomes less than $25K. Exhibit 5 Differences in Wage Distribution in Selected Municipalities Municipality
Median Household Income (1999)
% of HouseholdsIncome > $100K
% of HouseholdsIncome < $25K
Barrington $83,085 41.8% 14.7%Buffalo Grove 80,525 37.1 7.7Arlington Heights 67,807 28.6 12.2Hoffman Estates 65,937 24.7 10.4Roselle 65,254 22.5 9.5Palatine 63,321 23.9 12.7Elk Grove Village 62,132 20.5 12.8Hanover Park 61,358 15.6 11.3Schaumburg 60,941 20.0 12.8Rolling Meadows 59,535 20.6 12.7Mount Prospect 57,165 19.3 17.0Carpentersville 54,526 11.6 15.5Des Plaines 53,638 14.3 18.6Source: U.S. Census, 2006 Global Economy, Off-Shoring, and Outsourcing Keeping Illinois Competitive (Northern Illinois University, 2006, p .6 summarized some of the challenges of the global economy:
Due to rapid changes in technology and political relationships, traditional boundaries are of far less importance than historically. Real-time communication, instant messaging, and virtual labs allow scientists from around the world to collaborate on research and development. The barriers once associated with time, location, language, and culture have been reduced. As the global market and workplaces expand, innovation--once the hallmark of the U.S.--can occur anywhere. Not only can it occur, but also the rapid emergence of the economies of South Korea, India, China, Singapore, Malaysia, and Thailand shows that innovation is occurring and that the U.S. faces increasing competition. The Asian countries have been particularly aggressive in recruiting top American experts in critical
Harper College Environmental Scan Page 9
technologies to work at elaborate new facilities in their countries. At the same time, other nations are joining the global market, but at a much slower pace; e.g., Eastern Europe, central Asia, the Middle East, Latin America, and Africa (National Science Board, 2006). China--perceived by many as a likely pre-eminent 21st Century power--provides a good example of rapid economic globalization. The power of the country lies in the enormous number of its people--one out of five people in the world resides in China. Even though it has moved 300 million people out of poverty and quadrupled the average person’s annual income, significant poverty still exists. Given the current rate of growth, China can pass the U.S. economy in 30 years; however, the U.S. will maintain a higher per capita income (Lindsay & Daalder, 2005). India is another global competitor. Norman R. Augustine, retired Chairman and Chief Executive Officer of Lockheed Martin Corporation summarized the situation as, “Five qualified chemists can be hired in India for the cost of just one in America…For the cost of one engineer in the United States, a company can hire eleven in India…Given such enormous disadvantages in labor cost, we cannot be satisfied merely to match other economies in those area where we do enjoy strength; rather we must excel … markedly” (Augustine, October 20, 2005).
The global competition has extended to education. The U.S. holds 25 of the top university rankings worldwide; however, other countries are gaining (SCUP, 2006). Expect more inter- and intra-national collaborations and consortia. As the standard of living improves in their native countries, highly skilled, foreign-national students and workers in the U.S. may opt to go home. Duke University researchers found that in 2004, China graduated approximately 351,500 engineers, India graduated 112,000 engineers, and the U.S. graduated 137,400 engineers (Gereffi & Wadhwa, 2006). Because their populations are so large, even a small proportion of their population will create a large number of graduates. On the other hand, South Korea graduates as many engineers as the U.S. even though it has only one-sixth of the U.S. population (Lindsay & Daalder, 2005). To be globally competitive, manufacturers are looking for ways to use technology to increase productivity, thus increasing efficiency and automation. Manufacturing workers need higher levels of training to use the advanced technology. Many of the new employees are engineers and programmers, and the more labor intensive work is shipped overseas (Chicago Business, February 21, 2006). The robotics developed as part of the advanced manufacturing technology has increased productivity, which led to the elimination of significant numbers of manufacturing jobs. In 2004, manufacturers reached the same productivity levels of 2000 with 17% fewer workers (Chicago Business, 2004). Within the U.S., outsourcing, especially information technology, custodial, and human resources functions, has been one way businesses have tried to cut operating costs and/or obtain services in hard-to-fill jobs. In fact, the majority of outsourced jobs goes to companies within the U.S. (Chicago Business, June 10, 2004).
Harper College Environmental Scan Page 10

For some, outsourcing has worked, but not for all. Large companies such as J.P. Morgan Chase & Co. are rethinking outsourcing of information technology staff and rehiring their own staff (Chicago Business, September 15, 2004). The increase in global competition combined with the recession and increasing oil prices has resulted in businesses and organizations finding ways to do more with less. In such a situation, one of the first areas to be cut or eliminated is funding for employee training. As businesses find it harder to recruit and retain workers with the specific skill levels needed, funding for training is slowly being returned; however, the training is more often being done within the company than through external providers (Eduventures, 2005).
Harper College Environmental Scan Page 11

TECHNOLOGICAL TRENDS Technology has revolutionized how we work, live, and communicate. The digital age emerged in the last 25 years. In 1981, around the same time of the birth of the oldest in the Millennial Generation, the IBM PC hit the market. It was a mere 15 years ago that the public learned that webs could be much more than something associated with spiders. The leading edge of the Millennial Generation, just now entering the workforce, grew up with the world-wide-web and cell phones; the Boomers, now reaching retirement age, remember rotary phones and calculus on slide rules. What can possibly be next? We already have e-mail, e-commerce, e-banking, e-government, and e-learning. With cell phones, communication can occur almost anywhere. Find the nearest hotspot to use your wireless connection to the web. Technology has drastically changed the way people communicate, the amount of communication, and the ways in which we gather and learn information. Some predict that the challenge of the future is to harness the overload of data and facts and transform it into meaningful, useful information. The problem is not a lack of information, rather the lack of useful, usable, reliable information. New Communication Technologies In the past few years, Internet access has increased but not evenly across the segments of the population. In 2004, 7% of those online were over 65 years old, 40% did not go to college, and 15% had incomes less than $25,000 (Harris Interactive Reports, 2004). As broadband becomes available, increasing segments of the population will have access to the Internet, voice-over IP, wi-fi, and other integrations of previously stand-alone services, such as telephone, cable, and satellite TV. With wireless technology, critical masses of consumers can be reached 24/7 and at their convenience. Critical Emerging Technologies Technology, also, is changing the content of academic disciplines and occupations. The Illinois Survey of Critical Technologies (ISBE & NIU, 2006) identified 26 emerging technologies as growth areas in Illinois’ economy. The implementation of these critical technologies requires a citizenry and workforce with strong mathematics and science skills. Appendix B defines each of the 26 critical technologies
Bioscience astrobiology, biomaterials, biomechanics, biotechnology, natural
products, and recombinant DNA Environmental and Energy Technologies alternative fuels, bioremediation, fuel cell, green technology Human Health and Development biodefense, bioinformatics, gene therapy, genomics, proteomics, stem
cells Information Technology and Communication artificial intelligence, algorithms, data warehousing and mining, graph
theory, modeling complex nonlinear systems, quantum computing Materials Science and Advanced Manufacturing Biopolymers, celestial mining, nanotechnology, and smart materials
Harper College Environmental Scan Page 12

Harper College Environmental Scan Page 13
POLITICAL/SOCIAL TRENDS As the “War on Terror” and conflicts around the world continue, political tensions are increasing as approval ratings of many leaders are decreasing. The conviction of former Governor George Ryan, the scandals involving leaks and inappropriate activity at the federal level, and the conviction of several high-ranking CEOs have resulted in a public growing more intolerant and skeptical. Even the steroid use of baseball players has resulted in the public questioning the honesty and integrity of those once admired. During the next two years, major political races will be decided, including a change in leadership in the White House and a hotly contested race for Governor of Illinois. The good news is that education is a key campaign topic; however, the focus is on reforming education with too few dollars and with limited involvement of a broad base of professional educators. With Representative Hastert as Speaker of the House, Illinois has an avenue for input into major decisions and appropriations. The uncertainty of political leadership, the increasing indecision of legislative bodies, the mounting competition for public funds to support a war and address issues such as health care, and possibly new procedures concerning immigration--all lead to an unpredictable situation for education. There are, however, some trends that can provide direction for institutions for higher education. Increasing Involvement of Parents “Helicopter parents” or parents who are extremely involved with their students’ college education are on the increase. Colleges are more and more unpleasantly surprised by calls from legislators when parents bypass deans and normal protocol to demand action. In Maine, when credits from one university were not transferable to another, a bill was introduced to ensure transferability. In Wisconsin, a state bill was introduced to suspend parking tickets during “move-in” periods into dorms (Lipka, 2005). Some colleges are looking to create offices of parental relations (Howe & Strauss, 2000). “Some institution are strengthening the old concept of ‘in loco parentis’ and accepting a greater responsibility for more parts of the students’ lives. This trend is driven as much by parents as by the needs of the campus to influence student behavior” (SCUP, 2006, p. 2). Some campuses are re-instating rules and regulations that limit the activities of students; e.g., curfews for dorms and stricter suspension criteria concerning the use of alcohol. According to the Institute on Educational Sciences, more parents are selecting to home school their children. From 1999 to 2003, the number of students who are home-schooled increased 28.9% in the United States (IES, 2003). Colleges are re-evaluating policies and procedures to ensure their programs are accessible to this population. Higher Education under the Microscope The Commission on the Future of Higher Education, also known as the Miller Commission, was charged by U.S. Secretary of Education Margaret Spellings to prepare a comprehensive national strategy for higher education focusing on two questions:
• How can we ensure that college is affordable and accessible? • How well are institutions of higher education preparing our students to
compete in the new global economy?

Early on, the chair of the commission voiced his concern over the gap between what American citizens want from higher education what they are getting. In the early meetings, a strong argument was made for student outcome testing at the completion of a degree. Not all of the 12 members of the commission side with the chair. The vast and broad input into the commission and the internal conflicts among the members led to a draft commission report on June 22, 2006, which immediately created dissention among the member of the commission. Some regard the tone of the paper as too critical and combative and believe the outside writer who compiled the commission’s thoughts did not do so accurately. A revised, toned-down version was released in July. The commission is to come to some consensus in September with a final set of recommendation. More details on the draft recommendations are in Chapter VI - Major Issues Affecting Community Colleges. Legislative Issues Affecting Education Several key legislative issues at the national and state level have ramifications for community colleges. At the federal level, the reauthorization of the Higher Education Act was hotly debated. “The Higher Education Reauthorization Act is dead. No, it’s alive. No, it’s dead. This dance has gone on for a long, long time. And, while it goes on, it remains vulnerable to piecemeal changes such as the reduction in student loan funds, which happened at the turn of the year” (SCUP, 2006). Funding recommendations for some higher education programs are debated routinely, and educators scramble to strategize what will happen if key programs are unfunded. Pell Grants, Stafford loans, support programs such as TRIO and GEAR UP, and Perkins funding have been especially vulnerable in the past. The current status of key federal legislation in 2006 is: April 1: President Bush signed into law H.R. 4911, the Higher Education
Extension Act of 2006. The Act extends the authority for HEA programs to operate until June 30, 2006.
March 30: The House of Representatives passed H.R. 609, the College Access and Opportunity Act, by a vote of 221 to 199. The bill will amend and reauthorize various provisions throughout the Higher Education Act of 1965 through 2012.
Relationships between public educational institutions and the state and their districts are becoming more complex and visible (SCUP, 2006). Several bills and resolutions affected Harper College and higher education. The most pervasive action involves the review of the role of the community college in Illinois, which may have significant effects in the future. House Joint Resolution 122 created a Joint Task Force on Community Colleges to “review the community college system and recommend to the General Assembly whether changes are needed to meet the expanded role and demands on the system in the future.” The report is due December 31, 2006.
Harper College Environmental Scan Page 14

Harper College Environmental Scan Page 15
Other relevant legislation is summarized in Appendix C, including • House Bill 2225 and 4406 to provide additional student financial aid • House Bill 4209 to grant Harper College authority for a pilot baccalaureate
program • House Resolution 1101 and Senate Resolution 701 to expand student
information systems • Senate Bill 49 to establish procedures in public school and college districts in
covering annuities due to salary increases in excess of 6% • Senate Bill 931 to provide incentives to students and institutions to increase the
number of nursing graduates • Senate Joint Resolution to inventory baccalaureate partnerships in Illinois
between community colleges and universities. Local Political Issues Changes in local politics can greatly impact a public community college. For example, non-partisan elections are used to select board members; however, it is not uncommon for candidates to finance campaigns, use more media than in the past, and align with issues and political parties before the election. Some candidates will test the political waters by running for a public board with the ultimate goal of a political candidacy for a municipal or county office. Public boards aim to speak with one voice and present a consensus view. It is becoming more common for individual board members to rally a cause as an individual. For example, in District 214, a board member used the media to advance her request to remove specific literature from the curriculum. Illinois public community colleges are funded primarily through state/federal funds, tuition and fees, and local property taxes. According to the Harper College 2005-2006 College Plan and Budget, in the past four years, state appropriations to the college decreased $2,836,681 or 29.1% and are expected to drop further in 2007. Harper College has adjusted by integrating planning and budgeting, doing more with less, and focusing on strategic new program development and planned enrollment growth, all while maintaining quality in programs and services. In the past four years, Property Tax Appeal Board refunds have totaled $5.335 million (Harper College, 2005). Increasing Social Globalization In tandem with economic globalization, there is an increasing need for citizenry to better understand global cultures, language, and customs. The entry of China and India into the higher education and economic arenas, the religious and political issues surrounding issues the War on Terror, the expansion of U.S. companies abroad, and the increase in foreign-owned companies in the U.S. are only a few of the issues which require citizens with a broad-based understanding of other cultures. Some educators advocate that this type of understanding be built into education programs at all levels (Yankelovitch, 2005). Other colleges, such as Harper College, include a diversity course as part of the degree program. The Price of Oil and the Green Movement The fluctuating price of oil may affect commuting patterns of workers and students. Those unable to afford the rising costs may look for more flexible modes of public transportation to meet their transportation needs. Commuter colleges may need to assess the options students have in accessing instruction with an understanding that

fuel costs may discourage some students from enrolling in courses. The price of oil has two additional impacts: increasing cost of doing business and renewed interest in alternative/green technology. Businesses and organizations, including community colleges, can expect increased costs in materials and supplies, especially those involved in transportation or the use of oil in their production. “The combination punch of Hurricane Katrina’s effect on building materials and supplies, plus increases in both the cost of oil and natural gas, have created unexpected deficiencies in operating budgets for the current fiscal year and in capital budgets” (SCUP, 2006. p. 3). Colleges are seeking ways to cut utility costs and to anticipate changes in the cost of building materials. Some are exploring alternative energy sources. “Green” and “sustainability” are key business operating principles (SCUP, 2006), and energy efficiency is a strategy used to decrease operational costs. The Kyoto Accord went into effect on February 16, 2005, with some countries pushing to increase taxes to ensure the greening of their countries (SCUP, 2005). Even though the U.S. has not adopted the accord, the “green movement” is gaining momentum. The number of LEED-certified projects (Leadership in Energy and Environmental Design) is increasing. There is renewed interest in wind energy, alternative fuel energy, sustainable design, and commercial research on green practices. The request for green products for public buildings is becoming more accepted (SCUP, 2005). As colleges plan for capital projects, the inclusion of green technology is often included in the cost projections. Recent college graduates tend to look for jobs that align with their social and environmental propensities (Gallup Briefing, 2002). The need for programs related to green technology may increase.
Harper College Environmental Scan Page 16
IMPLICATIONS OF CONVERGENT TRENDS Possible Decreases in Educational Attainment by 2020 According to the National Center for Public Policy and Higher Education (www.highereducation.org), if current trends and policies do not change, by 2020 the Illinois workforce could be less educated than today’s workforce, which will result in a drop in the state’s per capita income. These predictions are based on the anticipated continuation of demographic shifts. According to Keeping Illinois Competitive (NIU, 2006, p. 19): In 2000, there was a significant disparity in the educational attainment of
the working-age population (25 to 64-year olds) in Illinois. About 22% of the black population had less than a high school credential and a comparable (23%) proportion had some college. Over half of the Hispanic working population had less than a high school credential and only 13% held a college degree. Among the white working age population, only 8% had less than a high school degree and over 40% had a college degree (National Center for Public Policy and Higher Education, 2005).
By 2020, one-third of the workforce in Illinois will be from non-white groups, with the majority of growth within the Hispanic group. As workers from minority groups become an increasingly dominant part of the Illinois workforce, their education will be increasingly critical to the success or failure of the economy.
If the disparity in degree attainment does not change, the educational level of the Illinois
worker may decrease as the population shifts to fewer white workers and more workers from populations with lower levels of educational attainment. As the Harper College district becomes increasingly Hispanic, it will be important for the college to continue its recruitment and retention efforts with this segment of the population. In the 2000 U.S. Census, about 20% of the 25 to 34-year olds had “some college, no degree.” A survey of Harper College residents (Greystone, 2004) found 15% of the respondents age 24 to 54 had less than an associate’s degree. This population is vulnerable as more jobs in manufacturing and information technology require more advanced training (Carey, 2004). A Projected Shortage of Skilled Workers for the Future Keeping Illinois Competitive (NIU, 2006, p. 18) discussed the predicted shortage of skilled workers in the future due to Baby Boomer retirements, shifting demographics, and rapidly increasing technological changes: According to the Jobs Revolution (Gunderson, et al. 2004), by 2010,
when the first wave of Baby Boomers reach retirement, “there will be too few workers, especially workers with the necessary skills, to fill the new positions that are anticipated for the future…The projections indicate a U.S. shortfall of 1.8 million workers with two-year degrees, 3.3 million workers with four-year degrees, and 1.9 million workers with advanced degrees. There will be 30 million skilled-worker slots and 23 million Americans to fill them. By 2030, 41 million new workers will enter the workforce as 76 million will retire.
Harper College Environmental Scan Page 17
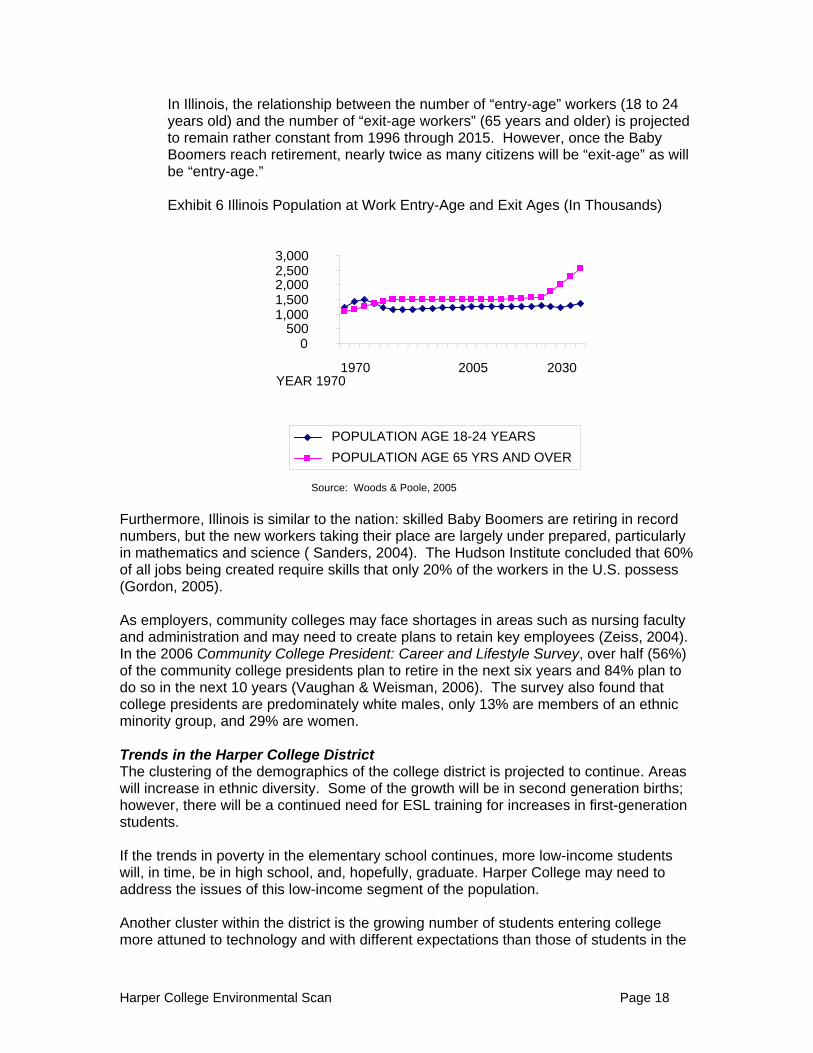
In Illinois, the relationship between the number of “entry-age” workers (18 to 24 years old) and the number of “exit-age workers” (65 years and older) is projected to remain rather constant from 1996 through 2015. However, once the Baby Boomers reach retirement, nearly twice as many citizens will be “exit-age” as will be “entry-age.”
Exhibit 6 Illinois Population at Work Entry-Age and Exit Ages (In Thousands)
Source: Woods & Poole, 2005
Furthermore, Illinois is similar to the nation: skilled Baby Boomers are retiring in record numbers, but the new workers taking their place are largely under prepared, particularly in mathematics and science ( Sanders, 2004). The Hudson Institute concluded that 60% of all jobs being created require skills that only 20% of the workers in the U.S. possess (Gordon, 2005). As employers, community colleges may face shortages in areas such as nursing faculty and administration and may need to create plans to retain key employees (Zeiss, 2004). In the 2006 Community College President: Career and Lifestyle Survey, over half (56%) of the community college presidents plan to retire in the next six years and 84% plan to do so in the next 10 years (Vaughan & Weisman, 2006). The survey also found that college presidents are predominately white males, only 13% are members of an ethnic minority group, and 29% are women. Trends in the Harper College District The clustering of the demographics of the college district is projected to continue. Areas will increase in ethnic diversity. Some of the growth will be in second generation births; however, there will be a continued need for ESL training for increases in first-generation students. If the trends in poverty in the elementary school continues, more low-income students will, in time, be in high school, and, hopefully, graduate. Harper College may need to address the issues of this low-income segment of the population. Another cluster within the district is the growing number of students entering college more attuned to technology and with different expectations than those of students in the
0 500
1,000 1,500 2,000 2,500 3,000
YEAR 19701970 2005 2030
POPULATION AGE 18-24 YEARS POPULATION AGE 65 YRS AND OVER
Harper College Environmental Scan Page 18

Harper College Environmental Scan Page 19
past. The growing involvement in parents and the need for high-tech, high-touch approaches will put increased demands on student support services. Critical Issues for the Region A survey by the Northwest Suburban Economic Development Council (NIU, 2003) identified the five most critical issues for the region:
• Transportation ( 77%) • Workforce development, training, and retention (71%) • Business development (59%) • Utilities and technology infrastructure (59%) • Affordable housing and cost of living (53%)
Transportation concerns included congestion, roadway access routes, availability and use of public transportation, and airport expansion. Workforce issues included bringing industry/business and education together to meet regional needs and the recruitment and retention of workers. These issues are supported by the projected trends in population, households, and employment. Considerable commuting occurs within the district as some areas are more residential and others are becoming more commercial and employment centers. Exhibit 7 Population, Household, and Employment Trends from 2000-2030
Population Households Employment
Area 2000 2030 Change 2000 2030 Change 2000 2030 Change Arlington Heights 76,031 82,441 8.4% 30,763 33,415 8.6% 58,259 61,594 5.7% Barrington 10,168 10,429 2.6% 3,767 4,001 6.2% 8,935 11,085 24.1% Barrington Hills 3,915 5,060 29.2% 1,381 1,777 28.7% 682 903 32.4% Buffalo Grove 42,909 45,258 5.5% 15,708 16,903 7.6% 18,790 23,090 22.9% Carpentersville 30,586 39,091 27.8% 8,872 12,825 44.6% 7,363 10,284 39.7% Deer Park 3,102 3,846 24.0% 989 1,311 32.6% 172 2,780 1516.3% Des Plaines 58,720 60,343 2.8% 22,362 23,576 5.4% 60,359 62,167 3.0% Elk Grove Village 34,727 36,948 6.4% 13,278 14,030 5.7% 61,121 97,974 60.3% Fox River Grove 4,862 5,542 14.0% 1,677 2,045 21.9% 991 1,286 29.8% Hanover Park 38,278 37,705 -1.5% 11,105 11,618 4.6% 7,921 10,866 37.2% Hoffman Estates 49,495 54,590 10.3% 17,034 20,021 17.5% 21,012 33,716 60.5% Inverness 6,749 7,069 4.7% 2,312 2,424 4.8% 1,601 1,607 0.4% Lake Barrington 4,757 5,695 19.7% 2,039 2,220 8.9% 1,136 1,590 40.0% Mount Prospect 56,265 58,049 3.2% 21,585 22,835 5.8% 18,397 21,005 14.2% North Barrington 2,918 3,542 21.4% 1,003 1,291 28.7% 641 936 46.0% Palatine 65,479 72,365 10.5% 25,518 28,782 12.8% 23,773 24,741 4.1% Rolling Meadows 24,604 26,351 7.1% 8,923 10,286 15.3% 23,206 28,214 21.6% Roselle 23,115 26,784 15.9% 8,443 9,830 16.4% 8,862 11,876 34.0%
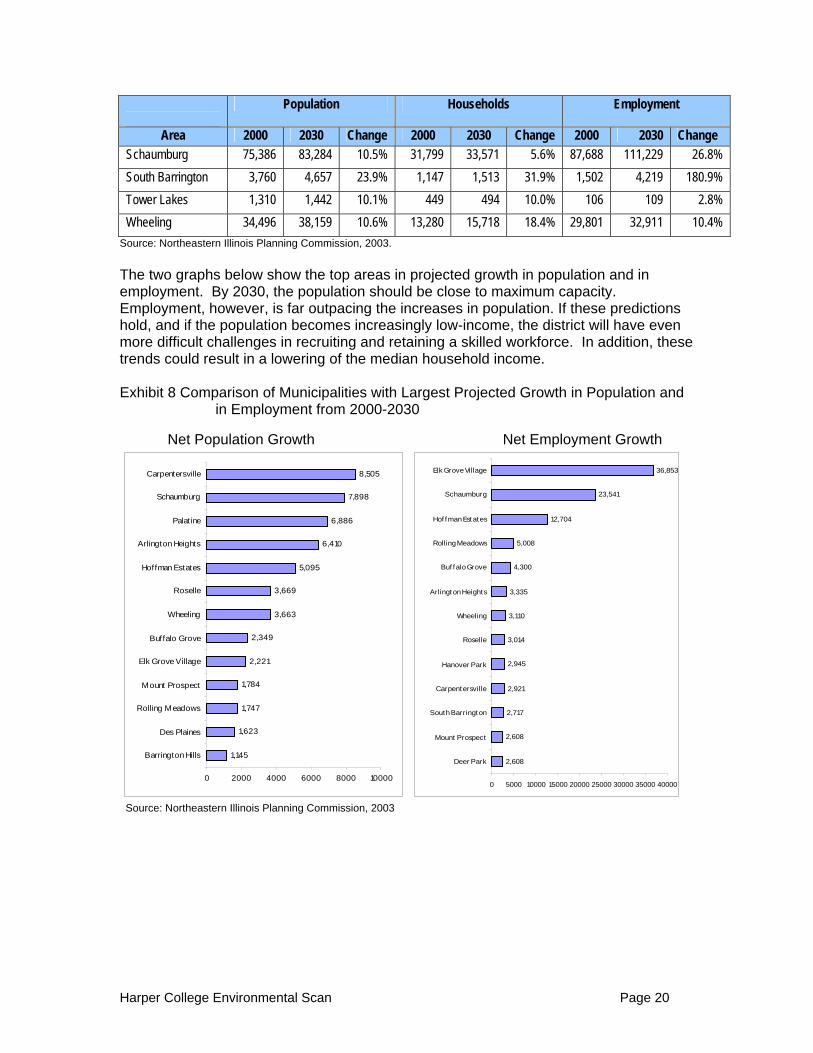
Population Households Employment
Area 2000 2030 Change 2000 2030 Change 2000 2030 Change Schaumburg 75,386 83,284 10.5% 31,799 33,571 5.6% 87,688 111,229 26.8% South Barrington 3,760 4,657 23.9% 1,147 1,513 31.9% 1,502 4,219 180.9% Tower Lakes 1,310 1,442 10.1% 449 494 10.0% 106 109 2.8% Wheeling 34,496 38,159 10.6% 13,280 15,718 18.4% 29,801 32,911 10.4%
Source: Northeastern Illinois Planning Commission, 2003. The two graphs below show the top areas in projected growth in population and in employment. By 2030, the population should be close to maximum capacity. Employment, however, is far outpacing the increases in population. If these predictions hold, and if the population becomes increasingly low-income, the district will have even more difficult challenges in recruiting and retaining a skilled workforce. In addition, these trends could result in a lowering of the median household income. Exhibit 8 Comparison of Municipalities with Largest Projected Growth in Population and
in Employment from 2000-2030 Net Population Growth Net Employment Growth
2,608
2,608
2,717
2,921
2,945
3,014
3,110
3,335
4,300
5,008
12,704
23,541
36,853
0 5000 10000 15000 20000 25000 30000 35000 40000
Deer Park
Mount Prospect
South Barrington
Carpentersville
Hanover Park
Roselle
Wheeling
Arlington Heights
Buf falo Grove
Rolling Meadows
Hof fman Estates
Schaumburg
Elk Grove Village
1,145
1,623
1,747
1,784
2,221
2,349
3,663
3,669
5,095
6,410
6,886
7,898
8,505
0 2000 4000 6000 8000 10000
Barrington Hills
Des Plaines
Rolling Meadows
Mount Prospect
Elk Grove Village
Buffalo Grove
Wheeling
Roselle
Hoffman Estates
Arlington Heights
Palatine
Schaumburg
Carpentersville
Source: Northeastern Illinois Planning Commission, 2003
Harper College Environmental Scan Page 20

Harper College Environmental Scan Page 21
II. TRENDS IN EDUCATION - STUDENT FACTORS
This chapter looks at students in terms of demographic characteristics, their pathways through the educational system, and their preparedness for college.
STUDENT DEMOGRAPHICS Harper College, similar to the nation, will have increasing numbers of students needing educational programming to meet their unique life situation. The Harper College Fact Book, which is updated each year, provides the following analyses and trends on credit and non-credit students:
• Chapter III Credit Students o Applicants o Fall Semester (10th Day) o Annual Credit Enrollments o Retention Analysis o Degrees and Certificates Awarded o Profile of Students Awarded Degrees and Certificates
• Chapter IV Noncredit Students
o Continuing Education Students o Harper College for Businesses
Increasing Numbers of Students Attending College In 1975, less than half of the U.S. high school students entered a two- or four-year college, and in 2001 the number increased to almost two-thirds (Carey, 2006). With limited resources, enrollment management is becoming more critical. So as to not over extend resources, various strategies have been used by colleges to limit enrollment, such as admission fees, priority application deadlines, increased admission requirements for high-demand programs, and elimination of late registration. While community colleges do not have many limited-enrollment programs, there are selected programs, such as in nursing, to which this applies. During the 1990s, enrollments in community colleges increased, especially among dependent students of all income levels (American Council on Education, 2004).
• More middle- and high-income students have attended community colleges in the last few years, probably due to the recession.
• Nationally, community colleges are seeing a larger percentage of younger, independent adults. In 2005, over 40% of community college students nationwide were under the age of 22, a significant increase from 32% in 1995. In 2005-2006, 45.6% of the Harper College students were under the age of 22.
• Community colleges are seeing increases in the numbers of “reverse transfers,” students who either attend or complete a 4-year degree and then attend a community college (Marcus, January 2006).
• Increasing numbers of women students are attending college. According to the Greystone study (2004), 37% of the Harper College district will “probably” or “definitely” enroll in a certificate or college degree program or in college courses in the next five years. Approximately, one in four residents who are not currently enrolled would like to enroll. For those interested in pursuing higher education,

10% aim for a certificate, 10% an associate’s degree, 21% a bachelor’s degree, and 28% a master’s degree. Education/teaching, business, or healthcare were the most often noted areas of study for a certificate, and business and healthcare were most often noted for those interested in an associate’s degree. Computers/electronics/technology and arts/fine arts were of most interest to those wanting to enroll in courses. More than half of those with an intention of enrolling in courses were interested in distance learning via the Internet. Time and cost are the two most often noted barriers to enrollment. Trends in High School Enrollments In Illinois, the 18 to 21-year old age group, the traditional college-age group, will continue to increase from the present through at least 2012. This segment of the population will also be increasingly diverse. The figure below presents a preliminary analysis of enrollment for grades 9 through 12 in Illinois and in the Harper College district. The pool of potential students in district high schools appears to be capping sooner than at the state level. Exhibit 9 Grades 9-12 Enrollment Illinois versus Harper College District
Grades 9-12 Enrollment: Illinois vs. Harper District
23,000
24,000
25,000
26,000
27,000
28,000
29,000
30,000
1995
1996
1997
1998
1999
2000
2001
2002
2003
2004
2005
2006
2007
2008
2009
2010
2011
2012
Year
480,000
500,000
520,000
540,000
560,000
580,000
600,000
620,000
640,000
660,000
District
Illinois
Source: Harper College Office of Research, 2006 International Students The number of student visa requests decreased sharply after 9/11 but began to increase in 2005. Enrollments of international students are at the lowest level since 1971 with the largest decreases in students from India, China, and Japan (SCUP, 2005). Pathway versus Pipeline The community college serves students with differing goals and attendance patterns. Judith Ramaley of the National Science Foundation (2001) recommends that the “pipeline” model for education be replaced with a “pathways” model. The pipeline model implies a straightforward, linear progression in which one moves through school and to work. In reality, students follow various pathways as they enroll in multiple institutions,
Harper College Environmental Scan Page 22

Harper College Environmental Scan Page 23
simultaneously combine work and education, and re-train for multiple careers. Ramaley identified about 72 models by which students are acquiring the credits they need for an undergraduate degree. The pipeline model no longer holds for many young adults who are extending the period between adolescence and settling down into their 30s. The “education” followed by “work” model forces them to make choices in occupations for which they have no “real world” experience or to delaying the decision until it is too late (Yankelovich, 2005). Research by Adelman (2005) found that nearly 60% of traditional-age students completing a bachelor’s degree attended more than one institution, 35% attended more than two, 20% who started at one 4-year college completed at another, and 15% moved back and forth between community colleges and 4-year institutions. Several patterns of enrollment were common to traditional-age community college students:
• persistent group that transfers to a four-year institution • persistent group that complete a two-year degree • high school graduates with weaker levels of preparedness who give up during
the first two years • a group that withdraws from the community college with few credits • four-year drop ins who start elsewhere but also attend a community college • students who go in and out of two- and four-year institutions or “swirl” • reverse transfers who often have low grade point averages at a four-year
institution and transfer to the community college (Adelman, 2005). Lifelong Learning At one time, “education” referenced the time in schools and colleges and “training” was for the workplace or special trainers. As workers need on-going, lifelong learning to keep current in their occupations, we should see “more efforts to integrate higher education, training, and work” (Yankelovich, 2005). Details on Harper College students’ age and ethnicity can be found in Chapter III and Chapter IV of the Harper College Fact Book. The demands for education for professional and other skilled groups will likely increase, both for work-related and for personal interest topics (SCUP, 2005). The need for lifelong learning applies, also, to the general citizenry as more technological and complex issues enter the public forum and appear in referendum or items on the voting ballot. As health care options become more technical, citizens need increasing knowledge in order to make the best decisions. In addition to work-related reasons for lifelong learning, the Baby Boomers in retirement may want expanded programming to meet their needs and interests. Increasing Minority Enrollments The increasing Hispanic demographic in the Harper College district could lead to higher enrollments from this population segment, which is much more likely to attend two-year colleges (Glenn, 2005). According to a 2006 survey of community college executives, 16% of the community colleges are highly prepared, 57% are somewhat prepared, and 10% are not at all prepared for an increase in their minority student body. About 16% reported this was not an issue at their college (Rockbridge, 2006).

Colleges with a perceived under representation of minority students have addressed the situation in various ways: offer assessment/placement and developmental classes (99%), engage in outreach activities to the minority community (85%), offer college transition outreach activities (84%), offer ESL instruction (88%), provide cultural sensitivity awareness for faculty (72%), and implement teaching techniques to accommodate cultural distinctiveness (46%). Hispanic enrollments in postsecondary education have increased in the last five years, and in some regions the Hispanic enrollment rates match that of their peers. Colleges with high graduation rates for the Hispanic population have noted the need to accommodate work schedules and to provide role models for the students (Pew Hispanic Trust, 2004).
STUDENT ACADEMIC PREPARATION AND COLLEGE READINESS There is great disparity in the college readiness of high school graduates in the Harper College district. Overall, the academic achievement of students in the top 10 feeder high schools equaled or surpassed the state average of percentages of students meeting or exceeding state standards. However, as shown below, the schools are still a long way from meeting the No Child Left Behind standard of 100% of the students meeting or exceeding standards by 2014. If fact, each school is or has been on the Illinois State Board of Education’s Academic Early Warning list meaning the school has not reached annual yearly progress for two years in a row. Exhibit 10 Percentages of High School Students Meeting/Exceeding State Standards
Year 2002 Year 2003 Year 2004 Year 2005 Barrington 80 77 75 76 Prospect 78 73 74 79 Fremd 78 76 75 78 Hersey 69 77 70 74 Conant 67 68 69 73 Elk Grove 58 61 61 68 Palatine 60 60 58 66 Rolling Meadows 62 58 65 64 Wheeling 53 53 50 64 Schaumburg 66 65 63 63 Hoffman Estates 57 59 61 57
Source: Interactive Illinois Report Card (NIU, 2006) Achievement Gaps In addition to the disparity among schools, there are significant gaps in the achievement levels of low-income students as compared to their not low-income peers. As shown in the following exhibits, 25-30% fewer low-income students meet or exceed the 11th grade reading or mathematics standards than their peers.
Harper College Environmental Scan Page 24

Exhibit 11 Percentages of Students Meeting or Exceeding Reading State Standards in 11th Grade
0
10
20
30
40
50
60
70
80
90
211 Low Income 55 44 40 35 42
211 Not LI 68 67 69 69 72
214 Low Income 34 42 34 38 48
214 Not LI 71 71 71 72 74
Barrington LI 28 29 28 36
Barrington Not LI 81 84 79 80 81
Reading YR 01
YR 02 YR 03 YR 04 YR 05
Source: Interactive Illinois Report Card (NIU, 2006) Exhibit 12 Percentages of Students Meeting or Exceeding Mathematics State Standards
in 11th Grade
0
20
40
60
80
100
211 Low Income 47 40 38 39 40
211 Not LI 69 70 72 74 74
214 Low Income 37 42 38 43 41
214 Not LI 74 73 74 75 75
Barrington LI 28 18 21 34
Barrington Not LI 79 80 77 79 79
Math YR 01 YR 02 YR 03 YR 04 YR 05
Source: Interactive Illinois Report Card (NIU, 2006)
Harper College Environmental Scan Page 25

National Spotlight on High School Education The quality of high school education is in the national spotlight. Criticisms and solutions are coming from all sectors, even from Bill Gates (2005):
When we looked at the millions of students our high schools are not preparing for higher education--we look at the damaging impact that has on their lives--we came to a painful conclusion: America’s high schools are obsolete…By obsolete, I don’t just mean that our high schools are broken, flawed, and under-funded--though a case could be made for every one of those points. By obsolete, I mean that our high schools--even when they’re working exactly as designed--cannot teach our kids what they need to know today. Training the workforce of tomorrow with the high schools of today is like trying to teach kids about tomorrow’s computers on a 50-year-old mainframe. It’s the wrong tool for the times.
On June 19-20, 2006, the Illinois State Board of Education hosted the high school reform conference to address ways to increase high school completion rates, increase the academic achievement of students, and better align high school expectations with those of colleges and the workplace. The growing national momentum can be observed through projects such as The American Diploma Project, adopted by 22 states, to ensure high school graduates are prepared for postsecondary education and the skills needed to obtain a good paying job. In each of the 22 states, governors, state superintendents of education, business executives, and college and university leaders are re-thinking the high school diploma and looking to raise the rigor of the high school standards, assessments and curriculum and better align these expectations with the demands of postsecondary education and work (American Diploma Project, 2004). Illinois is not a participating state at this time but some leaders across the state are discussing the option of joining the project. If these reforms are successful, community college should see fewer students in need of remediation. College-Level Remediation Nationally, “between 28% and 40% of first-time freshmen in four-year public institutions, and between 42% and 63% of first-time freshmen in two-year public institutions, enroll in at least one remedial course” (Olson, 2006). According to college faculty across the nation, 20% of the entering freshmen are “not well-prepared” and 32% are “somewhat well-prepared” in science. For mathematics, nearly one-third of the students were rated by college faculty as “not very well-prepared” and another third were described as “somewhat well-prepared” (Olson, 2006). The bottom line is that large numbers of students are entering college in need of remediation. In fact, in 2005, a total of 83,585 Illinois public community college students enrolled in remedial courses in mathematics (Parke, 2006). The need for remediation decreases the chances the student will graduate. A national study found that 75% of students not needing remediation will graduate; however, only 46% of students needing one or two remedial mathematics courses will graduate (Adelman, 2004). If this holds true, over 45,000 Illinois community college students enrolled in remedial mathematics courses will not persist to graduation.
Harper College Environmental Scan Page 26

In addition, the true number of students needing remediation is not known. Some students decide not to enroll in college after taking the placement tests, and others downgrade their ambitions to certificates not requiring college-level preparation. College Completion Gaps Several major reports issued in the last five years reported low college completion rates. The methodologies differ; however, the conclusions are the same: too few students who enter college, either a two-year or four-year institution, with an intent on completing a bachelor’s degree actually complete the degree. In the last decade, every country surveyed except the U.S. has increased the college attainment rates of the 25 to 34-year olds (Carey, 2004). As shown in the table below, the percentage of students entering Illinois colleges from high school is comparable to the national average. The freshman-to-sophomore retention rate for Illinois community colleges is less than the U.S. rate, whereas the 4-year college freshman-to-sophomore retention rate is higher than the corresponding national average. A greater percentage of Illinois students complete 4-year degrees within 6 years than the percentages indicated nationally. Compared to the top five U.S. states, however, Illinois has room for improvement for its enrollment, retention, and graduation rates (Northern Illinois University, 2006). Exhibit 13 Retention and Completion Rates of College Students
United States
Illinois
Average of Top Five States
High school seniors enter college 57% 57% 65% Community college students return for second year
55% 53% 61%
Community college students graduated within 3 years
31% 25% 52%
4-year college students return for second year
74% 79% 84%
4-year degree within 6 years 55% 58% 64% Source: Keeping Illinois Completive (NIU, 2006, p. 65); IPEDS Graduation Rate Survey, 2003 The averages in the table mask large variations among Illinois subgroups in the percentages of freshmen completing a 4-year degree within 6 years. Nearly two-thirds of Asian students (65%) and white students (64%) complete degrees in six years, but graduation rates of Hispanic students (46%) and black students (33%) are much lower. The differences may be in part due to the number of black and Hispanic students who are also low income. These students are more apt to reduce their course loads to part-time in order to accommodate a job or they may drop out and work but later return to college. Students are talking longer to complete degrees, and the costs of the degree are often higher to the student and taxpayer. Some states are looking at ways to decrease the time to the degree through strategies such as guaranteeing courses will be available, withholding a portion of aid until graduation, and computerized tracking systems to enable students to know which courses are yet needed to complete the degree and to flag students falling behind (Arenson, 2003).
Harper College Environmental Scan Page 27

It is difficult to complete a trend analysis on degree completion in Illinois community colleges. According to Scott Parke of the Illinois Community College Board (quoted in Boston Globe, January 29, 2006), the numbers of Illinois community college students completing a degree or certificate has increased due to computer software that allow some institutions to monitor courses students take and help them identify ways to finish a degree or certificate. Harper College specific data on student retention is in Chapter III of the college Fact Book. Factors which increase the likelihood that a student will complete a degree are under study. Adelman (2005) found that the academic intensity, or rigor, of a student’s high school courses is a better predictor of whether or not the student will graduate from college than are high school grades or standardized test scores. At the community college level, two characteristics that appear to increase the chances of completing a two-year degree are 1) earning credits in college-level mathematics and 2) completing summer coursework (Adelman, 2005).
Harper College Environmental Scan Page 28
Harper College Environmental Scan Page 29
III. TRENDS IN EDUCATION - CURRICULA, ASSESSMENT, AND
INSTRUCTION
We are attempting to educate and prepare students today so that they
are ready to solve future problems not yet identified using technologies not yet invented based on scientific knowledge not yet discovered.
Joseph Lagowski, University of Texas at Austin Harper College is well established within the district and highly regarded by its constituents. It is best known for quality education, associate’s/two-year degrees, preparation for four-year colleges, low cost/affordability, and a variety of programs/flexible hours (Greystone Group, 2005). The 21st Century brings new challenges to community colleges, including Harper College. The changing skill set for the 21st Century, increasing demands for accountability, changes in pedagogy, and increasing competition are a few.
21ST CENTURY KNOWLEDGE AND SKILLS
The Partnership for 21st Century Skills (March 2006) involved educators, employers, parents, community members, and students in identifying the 21st Century skills. The conclusion was a curriculum that included
• Core Subjects - English, reading or language arts, mathematics, science, foreign languages, civics, government, economics, arts, history, and geography
• 21st Century Content - global awareness; financial, economic, business, and entrepreneurial literacy; civic literacy; health and wellness awareness
• Learning and Thinking Skills - know how to keep learning throughout life, critical-thinking and problem-solving skills, communication skills, creativity and innovation skills, collaboration skills, contextual learning skills, and information and media literacy skills
• Information and Communications Technology - ability to use technology to develop knowledge and skills
• Life Skills - leadership, ethics, accountability, adaptability, personal productivity, personal responsibility, people skills, self-direction, and social responsibility.
In addition, the partnership specified that the skills should be taught in an integrated, balanced approach and that authentic assessments should be used to evaluate student learning. Employers and the workforce sector stress the need for lifelong learning; workers will need to be adaptable to new technologies and know how to learn. “Workers will need a whole new set of skills: negotiating, coordinating, and facilitating rather than managing, directing, and controlling” (GDA, 2003, p. 17). Greater Expectations (Association of American Colleges and Universities, 2002) advocated for more emphasis on skills which can be used to evaluate information, greater understanding of ethnical consequences of actions, and skills to thrive in a global cultural environment.

Harper College Environmental Scan Page 30
HIGHER EDUCATION ASSESSMENT AND ACCOUNTABILITY “As the perceived and real price of a degree increases, as well as the percentage of costs borne by students and their families, criticism of traditional higher education institutions is increasing” (SCUP, 2006, p. 8). First came No Child Left Behind; followed by a call for high school reform; and in late 2006, higher education will hear the final recommendations from the Commission on the Future of Higher Education, or the Miller Commission, charged by U.S. Secretary of Education Margaret Spellings to prepare a comprehensive national strategy for higher education. Increasing Accountability Community colleges are vital, innovative, and effective in providing high-quality and affordable education in the face of rising tuition and lower per-student funding; in meeting the needs of the increasingly ethnically diverse population; and in leading the way in e-learning (Rockbridge, 2006). This message, however, is not clearly articulated nor understood by the public. The call for increased accountability for colleges and universities is coming from diverse sectors. The U.S. Department of Education formed the Miller Commission; however, other groups are clamoring as well for outcomes measures.
• The Higher Learning Commission routinely requires follow-up visits and reports for colleges not completely implementing and using student learning outcomes assessments.
• The National Center for Postsecondary Improvement (2002) outlined three areas of improvement needed in higher education: improve educational quality and institutional performance; be more responsive in balancing market forces with higher education’s public purpose; and use better data to document what is known about institutional structures and practices.
• A report from the National Center for Public Policy and Higher Education, The Governance Divide, advocated for more alignment between all of the P-16 educational system, including the alignment of courses, policies to connect the funding for P-16 education, coordinated data systems to track students, and an accountability system that assesses the interface between the pre-college and college sectors.
• Jobs for the Future, a Boston advocacy group, chastised states which do not have specific, measurable goals and established strategies for increasing college participation, retention, and graduation rates (Collins, 2006).
Appropriate Measures for Community Colleges Accountability involves assessing measurable outcomes against some established criteria. Traditional measures and approaches often do not take into account the complexity of community colleges, and, often the public and legislators do not understand the limitation of the data being reported at the national, state, and local levels. Even the Carnegie Classification system is under revision to provide better information on community colleges (Inside Higher Education, November 18, 2005). At a time when colleges are to show access to minorities and document the achievement gaps between ethnic/racial groups, “there is growing dissatisfaction with

the usefulness and accuracy of national statistics on the race/ethnicity of students” (SCUP, 2006, p. 1). Researchers have difficulty in interpreting data with large numbers of students indicating “unknown” or “other.” A study by the Irvine Foundation found that the group of “unknowns” often thought to be black or Hispanic students was in fact 42% white, 12% Asian American, and 11% under-represented minority, and 3% other (Inside Higher Ed, January 5, 2006). National data collection may soon include the U.S. census framework with multiple race and ethnicity categories. On the other hand, two approaches have been discussed as models. The Community College Student Engagement survey is used by many institutions across the U.S. to benchmark student learning and retention (www.ccsse.org). This instrument was recommended to the Commission on the Future of Higher Education as a possible way to establish national accountability data. The National Community College Benchmark Project began as a pilot project at Johnson County Community College in Kansas. It was found to be a successful way for community colleges to share comparable data and benchmark themselves against other similar community colleges while reserving the anonymity of the data (www.hccbp.org). Assessment of Outcomes So far, higher education has not received the mandates handed to elementary and high schools in No Child Left Behind and other federal programs. Teachers in the elementary and high schools found it necessary to become proficient in using data to prescribe individualized interventions for children falling behind and had to become aware of the best practices documented in research. At the instructional level, the Higher Learning Commission’s emphasis on student learning outcomes has impacted higher education. The Council for Higher Education Accreditation is encouraging colleges to use new, effective, and innovative systems to evaluate and document student outcomes in ways the general public can understand. The Community College of Baltimore County received a CHEA award for their accountability approach used in Learning and Student Development. The use of digital or e-portfolios as a way for students to document their skill sets (aahe.org/teaching/pfoliosearch3.cfm) has increased with exemplary implementations at the University of Iowa in their ePortfolio project in the College of Education, (GDA, 2003; Hill & Irvine, 2003). Access to Programs and Services Colleges are faced with the challenge of providing access while maintaining academic standards and with decreasing fiscal resources. Access is a main theme of the Commission on Higher Education. One approach to expanding access to education is the community college baccalaureate degree. Miami-Dade Community College, one of four of Florida’s 28 public community colleges offering four-year degrees in selected fields, graduated its first bachelor’s degree students. It has 358 students in six different bachelor’s degree teaching programs. Arkansas, New Mexico, and Nevada also allow selected two-year colleges to transition to selected four-year degrees. A similar proposal failed to pass in Arizona (New York Times, December 14, 2005).
Harper College Environmental Scan Page 31

Harper College Environmental Scan Page 32
Providing instruction that is geographically convenient to the student is a growing challenge. Some schools are holding classes in YMCAs, ice cream parlors, shopping centers, public libraries, museums, office buildings, and remodeled motels. In some cases the alternative sites help with financing the courses as a trade-off of gaining traffic through their facility (CNN.com, March 1, 2006). Increasing access does not mean lowering standards. The University of Phoenix was fined $9.8 million by federal regulators for pressuring recruiters to accept unqualified students (Chicago Tribune, September 14, 2004).
TRENDS IN INSTRUCTIONAL APPROACHES AND PEDAGOGY Derek Bok, former president of Harvard (2005), maintains that “lecturing remains the most common method of instruction even though much research suggests that more active forms of teaching help students learn more and remember better what they learn. Although more than 90% of professors claim that improving critical thinking is the most important goal of undergraduate education, the great majority of exam questions merely test recall or comprehension of course materials” (Lipka, December 16, 2005). Along with new instructional technology tools, research in neuroscience provides a basis for new pedagogical strategies: the connection between the affective and cognitive functions and the need to integrate cognitive and conceptual thinking skills (SCUP, 2005). Higher education faculty are faced with new challenges: the new generation of students learn in multiple ways and using new modes of communication. Students expect instruction to be delivered in convenient, flexible, just-in-time modes which use the latest technology that they are accustomed to using every day. Use of Technology in Higher Education Technology is changing the way education is delivered and perceived. Megatrends for education (GDA, 2003) include
• Increased use of technology for interacting with students for instruction and student services
• Wireless telecommunication networks around campus • Rapid growth of wireless networks and device capabilities, increasing the need
for expanded bandwidth and concerns about security • Student support services delivered via technology • More virtual instruction • Increased fiscal strain on institutions to keep state-of-the-art technology.
Some see the real challenge not in the hardware but in managing the continuously expanding, ubiquitous amounts of information. Ways to organize, understand, and use these vast amounts of information are needed. The Futurist (Challenger, 2005, p. 2) predicted that “digital Telectronic assistant programs T will surf the Net on our behalf and enable us to amass entire digital libraries on a given subject by doing nothing more than setting a few key search guidelines.”

Changing technology and pedagogy are reflected in the “movement in higher education to more closely examine the design of learning space—virtual and physical, formal and informal—and the effects of that design on learning. That exploration is being done collaboratively by faculty, technologists, and designers of the built environment” (SCUP, 2006). Other researchers envision the future of technology to be in the info-structure provided by the Internet, broadband, distributed computing, the wireless Web, open source software, and groupware. More students will arrive at college with computer skills. Almost one-quarter of school districts nationwide and nine states have invested millions of dollars in “one-to-one” laptop programs, hoping the availability of a computer for every student will improve achievement and other skills. Printed textbooks are being replaced with electronic textbooks with modules which can be easily updated and customized for different learners. Rather than face-to-face or online instruction, podcasting is being used more frequently. With the “University of iPod,” we are in the initial stages of revolutionizing the delivery of instruction and exploring new paradigms for learning. E-mobile learning was unleashed last year when Apple Computer Inc. piloted the use of iTunes U with six universities to enable students to access course lectures via the iTunes software. Transitioning from printed page to podcasting requires more than changing the delivery of the curriculum. “Perhaps is it time to consider a blank sheet approach to learning, by setting aside existing educational systems, policies, and practices, and instead first focusing on what knowledge, skills, and abilities a person will need to lead a productive and satisfying life in the century ahead. Then, by considering the diversity of ways in which people learn, and the rich array of knowledge resources emerging in our society, design a new ecology of learning for the 21st Century” (Duderstandt, 2003, p. 20). Online learning is growing the fastest in professional development; 80% of professional development in Canada includes e-learning (SCUP, 2006). Distance learning is most appealing to the 25 to 45-year old market (The Chronicle of Higher Education, November 15, 2004). E-Learning is prevalent in U.S. community colleges. Nearly all (98%) offer online courses, and half offer the same version of the online course as they do in a traditional delivery method. The vast majority (94%) plan on expanding online courses; however, funding (45%) was the most often noted challenge. About one-fourth (27%) noted faculty resistance as a challenge. As job markets get tight, students with internship experiences have an advantage (National Association of Colleges and Employers, 2003). For some students, their internship experience is online. International Truck and Engine of Warrenville, Illinois used this approach in 2002 (GDA, 2003). The Open Content Initiative funded through the Hewlett Foundation provides a new perspective on education. It provides the infrastructure needed to make course materials accessible to anyone with web access. The University of California at Irvine, the University of California at Berkley, MIT, Utah State, Johns Hopkins School of Public
Harper College Environmental Scan Page 33
Harper College Environmental Scan Page 34
Health, Rice, and Carnegie Mellon have free materials online—no tuition, no fees, just use the material how you wish. Instructional Approaches Traditional instructional approaches are under fire from those within and outside of education.
• The Quiet Crisis by Peter Smith contends that the current models of education cannot accommodate the increasing numbers of low-income students.
• The Business-Education Roundtable, the Illinois Business Roundtable, the U.S. Department of Education, as well as many other groups, have called for the improvement of mathematics and science education in the U.S. In international competitions, the U.S. scores at the average or lower level, far behind countries such as Hong Kong-China, Finland, South Korea, and the Netherlands. Some states have looked to Finland for a model of mathematics and science education.
• Proponents and critics of Physics First are debating how to teach science in more authentic, problem-based ways. The traditional sequence of science courses is biology, chemistry, and physics. Physics First, as the name infers, would put physics in the high school curriculum first, because, according to its advocates, biology requires an understanding of chemistry which requires knowledge of physics.
• New cross-discipline programs are becoming more common, such as biotechnology and business with engineering or healthcare, education administration and MBA, and criminal justice and computer science (GDA, 2003).
Instructional Competition Instructional competition is increasing both within the U.S. and globally. Students go between institutions finding the courses and programs that meet their scheduling and financial needs. With increasing costs of tuition, fees, and books, students are more sensitive to the quality of the instruction and the net benefit provided to the student. Delivering instruction was once the purview of accredited or state-recognized educational institutions. The alternative credentialing being offered online through sites such as Brainbench are challenging that concept. Non-credit certifications are granted through passing on-line tests, and remedial instruction is readily available through the site to help those not quite ready pass the test. “The greatest explosion ever seen in higher education is happening right now in Asia, especially India and China” (SCUP, 2006, p. 6). According to one report, in 2004, China graduated approximately 500,000 engineers; India graduated 200,000 engineers; and the U.S. graduated 70,000 engineers (Colvin, 2005). More recently, Duke University researchers reported a comparison of degrees, excluding certificates. Their report found that in 2004, China graduated approximately 351,500 engineers; India graduated 112,000 engineers; and the U.S. graduated 137,400 engineers (Gerrefi and Wadhwa, 2005). Regardless of the exact numbers, because their populations are so large, even a small proportion of their population will create a large number of graduates. On the other hand, South Korea graduates as many engineers as the U.S. even though it has only one-sixth of the U.S. population. The impact of for-profit higher education institutions on community colleges was studied by Bailey and Badway (2001). The for-profits were increasing in the market share by

focusing their efforts. Whereas community colleges have a broad mission, for-profit institutions have a narrow, focused mission on a niche market. The for-profit institution’s goal is convenient, responsive, customer-oriented programs that are based on an applied pedagogical approach and that culminate in student graduation and employment. Even thought tuition is higher at the non-profit institution, students attend the programs because of the convenient scheduling of courses; accelerated degree completion through year around study; and coordinated, intensive student services. Local competition around Harper College is increasing. Appendix D lists some of the programs offered by competitors within 10 miles of Harper College. For example, DeVry University has an online division for business administration, computer information, accounting and financial management, and administration and human resources management. Career Education Corporation of Hoffman Estates ranked second to American Pharmaceutical Partners, Inc. as the fastest-growing public companies from 1997 to 2002. (Chicago Business, August 8, 2003).
Harper College Environmental Scan Page 35

IV. TRENDS IN EDUCATION - MEETING THE NEEDS OF
BUSINESS AND INDUSTRY A common goal of higher education is to prepare a skilled workforce to meet the economic development needs of the region served. Increasing pressure is being placed on community colleges and universities to work with federal, state, and regional agencies to create the industry clusters and workforce needed for the economic infrastructure of a region. A survey conducted by Northern Illinois University in 2005 found nearly two-thirds of employers believe Illinois colleges and universities do an “excellent” or “good” job of preparing graduates for the workforce. Over half (52%) of the employers indicated that continuing education was very important--significantly fewer than the 65% reported in 1998. On the other hand, in 1965 only 22% of the adults in the U.S. participated in some type of education, excluding full-time attendance at a postsecondary institution, and by 2001, this percentage had increased to 46% (SCUP, 2005). In the NIU survey, employers offered the following recommendations on ways to improve the higher education-business relationship: keep employers better aware of what programs and services the college can offer; focus academic courses on more authentic, real-world content; improve recruiting practices so employers know the skills students possess; and provide more internship opportunities.
COMMUTING PATTERNS The northern Cook County region is part of the larger Chicago-Naperville-Joliet MSA. Because of the high commuting rates, it is difficult to isolate regional economic development needs just to the Harper College district. The longest commute times in the country are in the Chicago area (Singh, March 30, 2005). According to the U.S. 2000 Census, 60% of the Harper College district residents commute at least 30 minutes to work. Nearly 98,000 workers commute into the northwest suburbs daily. Over 40% of the population is employed in management and professional jobs; however, only 29% of the jobs in the northwest suburbs are in that grouping, indicating an “exporting” of the management workforce. The “import” is the production workforce in which 26% of jobs are in construction and production but 17% of the population is employed in those types of jobs (Pepperl, November 18, 2004).
LABOR MARKET PROJECTIONS From 2002 to 2012, employment in the U.S. is predicted to increase 14.8% but only 6.7% in Illinois. The future looks brighter for the Chicago region, which has a predicted increase of 10.5% (See Appendix E). This labor market data is based on trend analyses of the past; however, the global economy, technological changes, demographic changes, and the unpredictable “tipping points” that may occur could negate the predictions.
Harper College Environmental Scan Page 36

The distribution of jobs across the major industry categories shifted from 1991 to 2001. Services increased in the share of jobs, and manufacturing and wholesale trades decreased. Exhibit 14 Distribution of Employment by Industry in Northern Cook County
0%5%
10%15%20%25%30%35%40%
Services
Manufactur
ing
Retail Trade
Wholesale
Trade
Finance
, Insur
ance, Real E
state
Constructi
on
Transport,
Communication,E
lectric
Agricultu
re
YR 91 YR 96 YR 01
Source: The Workforce Board of Northern Cook County, 2003
Harper College Environmental Scan Page 37
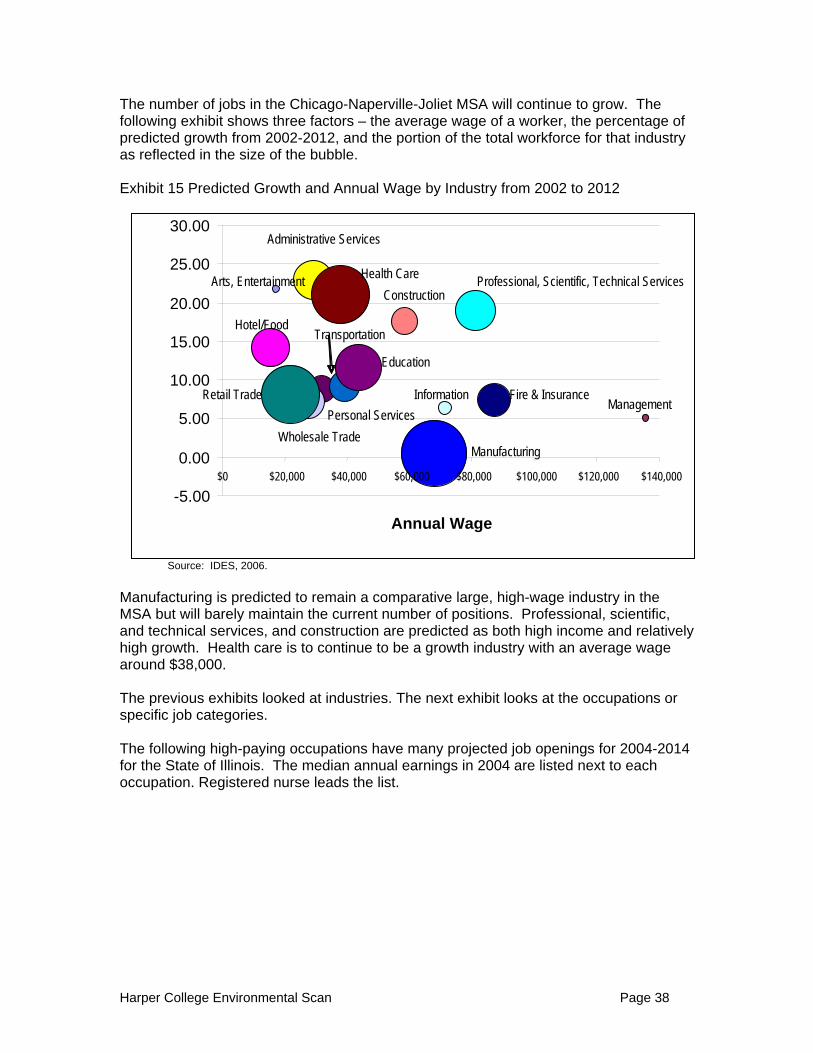
The number of jobs in the Chicago-Naperville-Joliet MSA will continue to grow. The following exhibit shows three factors – the average wage of a worker, the percentage of predicted growth from 2002-2012, and the portion of the total workforce for that industry as reflected in the size of the bubble. Exhibit 15 Predicted Growth and Annual Wage by Industry from 2002 to 2012
30.00
Source: IDES, 2006. Manufacturing is predicted to remain a comparative large, high-wage industry in the MSA but will barely maintain the current number of positions. Professional, scientific, and technical services, and construction are predicted as both high income and relatively high growth. Health care is to continue to be a growth industry with an average wage around $38,000. The previous exhibits looked at industries. The next exhibit looks at the occupations or specific job categories. The following high-paying occupations have many projected job openings for 2004-2014 for the State of Illinois. The median annual earnings in 2004 are listed next to each occupation. Registered nurse leads the list.
-5.00
0.00
5.00
10.00
15.00
20.00
25.00
$0 $20,000 $40,000 $60,000 $80,000 $100,000 $120,000 $140,000
Annual Wage
Administrative Services
Health CareArts, Entertainment Professional, Scientific, Technical ServicesConstruction
Hotel/Food
Education
Transportation
Retail Trade Information Fire & Insurance Management
Personal ServicesWholesale Trade
Manufacturing
Harper College Environmental Scan Page 38

Exhibit 16 High-Paying Occupations with Many Illinois Job Openings 2004-2014
21
21
22
26
27
28
34
36
41
44
44
46
49
49
51
57
59
65
89
120
0 20 40 60 80 100 120 140
First-line Superv isors/Mgrs Construction $50,450
Phy scians and Surgeons $145,600
Middle School Teachers, ex cept Sp Ed/Voc Ed $43,670
Police and Sheriff's Patrol Officers $45,210
Computer Softw are Engineers/Applications $74,980
Licensed Practical Nurses $33,970
Automotiv e Serv ice Technicians/Mechanics $32,450
First-line Superv isors/Managers Retail Sale $32,720
Carpenters $34,900
First-line Superv isors/Mgrs Office/Admin $41,080
Secondary School Teachers, ex cept Spec Ed and Vocational $45,650
Maintenance and Repair Workers, General 30,710
Ex ecutiv e Secretaries and Administrativ e Assistants $34,970
Accountants and Auditors $50,770
Truck Driv ers, Heav y and Tractor-Trailer $33,520
Sales Representativ es, Wholesale and Manufacturing $45,400
Elementary School Teachers, ex cept Spec Ed $43,160
General and Operations Managers $77,420
Postsecondary Teachers $51,800
Registered Nurses $52,330
Source: U.S. Bureau of Labor Statistics: http://www.bls.gov/opub/ooq/oochart.htm The top ten occupations in Cook County by size, growth, and wage that do not require a 4-year degree as reported in the State of the Workforce Report (Workforce Board of Northern Cook County, 2003, p. 2) were: 1. Police Patrol Officers 2. Brick Masons 3. Electricians 4. Registered Nurses 5. Computer Support Specialists
6. Personal and Home Care Aids 7. Business Services Sales Agents 8. Dental Hygienists 9. Engineering Technicians 10. Truck Drivers, Heavy
Appendix E has charts showing data for the Chicago-Naperville-Joliet Metropolitan Statistical Area predicted for 2002-2012 (IDES, 2005) in terms of the number of annual openings due to growth and replacements combined, number of annual jobs due to growth only, the percentage of growth for that occupation, and the job titles predicted to lose the most jobs in 2002-2012.
Harper College Environmental Scan Page 39

Harper College Environmental Scan Page 40
CRITICAL AND EMERGING OCCUPATIONS Critical skills shortages are predicted for nursing, specific areas in manufacturing, and transportation. Finding the workers with the appropriate skills is the challenge. Many manufacturing workers lost jobs in the recent recession but do not have the skills needed for the current job openings in manufacturing. Fewer students are going into highly-skilled technical and engineering fields. (Chicago Business, Nov. 22, 2005). Retaining skilled employees is more difficult than in the past. The loyalty between employer-employee is no longer as strong, and “just-in-time” employment and hiring-firing to meet the business cycle needs is more prevalent. The projected critical shortage of nurses is nationwide. The State of Illinois is proposing to spend a yearly additional $3-$5 million on the nursing crisis through 2020 . The challenge often faced by colleges includes the availability of qualified nursing faculty as well as the need for additional funding to hire them. Emerging, new jobs are being created for
• Alternative energy and the environmental greening sector • Translating information into usable forms, data warehousing, and data mining • Consumer financial services as boomers and the younger generation grapple
with retirement and soaring healthcare costs • Biotechnology, pharmaceutical studies, and stem cell research to address the
need for drugs and advanced research • Bioscience including astrobiology, biomaterials, and biomechanics • Homeland security and the industries around defense and safety, such as
biodefense and bioinformatics • Advanced manufacturing including biopolymers, celestial mining,
nanotechnology, and smart materials.
INFRASTRUCTURE FOR ECONOMIC GROWTH
Gordon (2005) summarized the problem with workforce preparation: “in contemporary America there are just too many people training for the wrong jobs and not enough people preparing for the jobs we are creating…The career aspirations of much of the population in the U.S. are at serious odds with the increasingly high-tech needs of the economy.” Some communities have non-governmental organizations to help bridge business and their labor market needs with education and career preparation, such as Santa Ana, California’s Bridge to Careers. Chicago’s Renaissance 2010 program aims to create 100 special academies with the same orientation and goal of preparing all students for postsecondary education (Gordon, 2005).

V. TRENDS IN EDUCATION - FINANCIAL SUPPORT
The funding of postsecondary education and the financial support provided to students are two nationally debated topics. Colleges are finding it difficult to keep student tuition and fees low enough to increase access to education for the low-income student and to generate sufficient funding for quality programs and services.
TRENDS IN HIGHER EDUCATION FUNDING The competition for public funds is intensifying, especially as healthcare becomes a focal point of aging Americans, as more concern is placed on Homeland Security and local criminal justice systems, and increasing numbers of low-income and special needs students enter the K-12 system. The Miller Commission is focusing national attention on access and accountability for higher education institutions. Approximately 40% of community college executives feel it is unlikely that their schools can maintain the affordability of education over the next few years and consider tuition and/or decreasing financial aid funding as the major challenges (Rockbridge, 2006). The Pew Charitable Trusts and the National Center for Higher Education Management Systems (Kelly & Jones, December 2005) went even further by developing a model to assess an institution’s performance relative to funding. The ratio was computed as the total of state and local funding and tuition and fees divided by the number of full-time equivalent students, adjusted for cost of living and faculty salaries. Among the performance measures were participation, degree productivity, and graduation rates. In general, Illinois performed near the average on most of the measures. Illinois was noted as one the top producers of bachelor’s degrees relative to their student populations given the resources. For two-year colleges, South Dakota, Mississippi, and California were the most productive given their resources. Even though these measures are quite limited and need to be improved, the fact that national, influential organizations are even using these productivity ratios to compare states points to a new era of accountability for higher education. State and public funding of community colleges decreased significantly from 1981 to 2001. In his dissertation study, Roessler (2006) concluded that the percentage of community college budgets from state funding decreased from 27.1% to 15.9% and local funding decreased from 32.1% to 29.8%. In general, suburban community colleges were able to maintain the local funding level. Harper College is facing fiscal challenges. According to the Harper College 2005-2006 College Plan and Budget, the college has lost $500,000 in the last five years due to federal and state cuts in support services for the disabled, tutoring, women’s services, advising, writing center, minority transfer services, ESL, and AED. The under-funded Illinois Veterans Grant cost the college $195,000 in Fiscal Year 2005. State appropriations were down $85,576 in Fiscal Year 2006 with a total decrease of $2,836,681 or 29.1% over four years.
Harper College Environmental Scan Page 41
Harper College Environmental Scan Page 42
Colleges are struggling to balance budgets and find new revenue streams. Various approaches are being explored:
• Public colleges in Colorado and Virginia are looking for ways to decrease the state money received in return for more flexibility and the ability to set tuition rates (The Chronicle of Higher Education, March 26, 2004).
• A proposal in South Carolina would have allowed the public colleges to become private institutions.
• “Large companies outside of higher education are outsourcing, off-shoring, eliminating pensions, increasing employee contributions for medical insurance, and in some cases drastically slashing jobs and pay” (SCUP, 2006, p. 3). Predictions by the Society for College and University Planning indicate “more of these same changes may be inevitable for higher education institutions, as they face the same set of economic realities” (p. 3).
• Some community colleges are competing for bids, such as those to run the displaced worker one-stops or to provide instruction to the armed forces.
• Over $1.3 billion in patent revenues went to U.S. institutions of higher education in 2002 (SCUP, 2005). Some colleges are providing incentives to faculty members to create courses and other intellectual property.
• Community college foundations are becoming more aggressive in raising funds (Evelyn, 2004).
The challenges are not limited to decreasing support from federal, state, and local sources. Technology costs continue to grow—more bandwidth, more functionality, and even a new Windows due out this year. Hackers, viruses, and worms increase the resources needed to ensure security of information. The millennial students expect high tech and high touch, both requiring high-expense resources. As non-profits receive decreased funding from public and private sources, it will be more difficult for colleges to partner with them. Groups, such as A+ Illinois, advocate using more state revenues and less local property tax revenue to finance education. In Illinois, concern mounts over the funding of the state’s pension system. Performance-based funding has been discussed as part of the solution to the funding issues. Community college presidents are split in their support of performance-based funding in which funding is tied to the completion of goals such as student transfer and employment (For 58%, Oppose 43%; Rockbridge, 2006). Furthermore, 71% believe their local community feels the funding of the community college is the state’s responsibility. If performance-based funding is implemented, community colleges can be at a disadvantage with their open-door policies. Other institutions increase performance by limiting enrollment to those who will most probably be successful.

STUDENT FINANCIAL ASSISTANCE
Research from the National Center for Public Policy and Higher Education and the Ed Trust confirm the growing number of students graduating from college with increasing levels of debt and the hundreds of thousands of students dropping out of college, but needing to repay educational loans without the benefit of a degree.
States are looking for ways to finance the student financial assistance programs. Sallie Mae has made overtures to acquire the state-based loan agencies. There is concern that such actions will result in a few companies with a monopoly in student loans, thus decreasing competition (Chronicle of Higher Education, March 31, 2006). The Illinois Veteran tuition program was under funded by $13.6 million in 2006. Community colleges, which enroll about 68% of the veterans, had to cover the lost revenue (Chicago Tribune, March 26, 2006). House Resolutions 1039, adopted, states community colleges are entitled to reimbursement of administrative costs of the Illinois Veterans Grant Program, Illinois National Guard Grant Program, and the MIA-POW Scholarship program. In addition, IBHE and ICCB are to determine the resources waived to cover the under funding of the programs during the past four years (IBHE Board Packet, June 6, 2006). The Illinois Merit Scholarship program was not funded in 2006. In 2002, Illinois students of poverty received financial aid to cover tuition and fees at a state university; in 2005, the aid was decreased to about two-thirds of the cost. There is increasing concern that decreased funding will result in increasing tuition and compromising the accessibility of education to the low-income and to the newest populations, which often are low-income.
Harper College Environmental Scan Page 43

Harper College Environmental Scan Page 44
VI. MAJOR ISSUES AFFECTING COMMUNITY COLLEGES
Various national organizations, commissions, and research reports have proposed lists of the major issues affecting community colleges. This section presents the recommendation of three separate sources asking similar questions. Appendix A has additional recommendations. A: Survey of Community College Executives A 2006 survey of 245 community college executives identified the following major daily challenges for community colleges (Rockbridge, 2006):
• Student retention (87%) • Lack of state/local funding (86%) • Under-prepared students (84%) • Rising personnel costs (81%) • Rising technology costs (79%).
About half (46%) of the community college executives reported that the challenge of retaining students will increase in the future. The most common strategies used to increase retention included tutoring (99%), academic counseling (99%), orientation (94%), personal counseling (86%), financial aid (71%), and on-campus facilities for children (58%). As more jobs require postsecondary education, colleges will see increasing numbers of students needing education, often from segments of the population that traditionally have not faired well in higher education; e.g., low-income students who often need college remedial courses or lack the funding necessary to continue in a degree program. B: Education Commission of States and League for Innovation Keeping America’s Promise: a Report on the Future of the Community College (2002) was a joint project of the Education Commission of States and the League for Innovation in the Community College. It identified the following specific trends, promises, and actions for community colleges.
Trends That Matter Trend 1. Escalating demand for postsecondary education Trend 2. Continuously changing student “mix” Trend 3. Going to college: not what it used to be Trend 4. Funding squeeze
Community College Promises Promise 1. Provide and promote access to college Promise 2. Improve student attainment Promise 3. Focus on learning Promise 4. Embrace accountability Promise 5. We must--and we will--close the gap (There remains in American higher
education a significant gap in educational attainment between students from high socioeconomic levels and students who are poor, between White students and their African-American and Hispanic peers.)

Harper College Environmental Scan Page 45
Actions - Making Good on the Promises 1. Create stronger connections with K-12 education 2. Build a new culture of evidence in community colleges 3. Provide effective remediation 4. Strengthen student engagement in the community college learning experience 5. Rethink and redesign 6. Exercise leadership C: Commission on the Future of Higher Education The recommendations in the draft report of the Commission on the Future of Higher Education directly impact community colleges. Four areas were covered in the report: access, affordability, quality and innovation, and accountability. The following were the highlights of the draft as reported in The Chronicle of Higher Education (Field, 2006, pp. 3-5): Access
• Review and revise standards for transfer of credit among higher-education institutions to improve quality and reduce the amount of time it takes students to reach their educational goal.
• Overhaul K-12 teacher preparation with particular emphasis on reforming colleges of education.
• Address nonacademic barriers to college access by developing partnerships among schools, colleges, and the private sector to provide early and ongoing-college awareness activities, academic support, and college-planning and financial-aid-application assistance.
Affordability
• Overhaul the entire student-financial-aid system in favor of substantial increases in need-based aid. Consolidate programs and restructure the system to increase access and retention and decrease debt burden.
• Significantly increase federal funding of need-based financial aid, subject to simplification and restructuring of the system. Give priority to need-based financial aid.
• Replace the Free Application for Federal Student Aid, known as FAFSA, with a postcard-size application form, and analyze student need through the federal tax system.
• Create a “bottom line” for college performance that measures institutional costs and performance, and enables parents and policy makers to see institutional results in terms of academic quality, productivity, and efficiency.
• Reduce barriers to transfer of credit and unnecessary accrediting constraints on new institutions.
Quality and Innovation
• Establish a federal fund to provide incentives for effective teaching and use the latest research in rapidly growing areas such as neuroscience, cognitive science, and organizational science.
• Do more to support and harness the power of distance learning. • Develop a national plan to keep the United States at the forefront of the
knowledge revolution. • Establish a nationwide pilot program for Lifelong Learning Accounts
(individual asset accounts to finance education and training), to allow workers

Harper College Environmental Scan Page 46
to continuously upgrade their skills while increasing their earnings. The accounts would be financed through tax incentives to individuals and employees.
• Establish a National Innovation Partnership that provides federal matching funds to states to encourage innovations in program formatting, delivery, and transfer of credit.
• Develop a comprehensive plan for better integration of policy, planning, and accountability among postsecondary education, adult education, and vocational education.
Accountability
• Require institutions to measure student learning using measures such as the National Survey of Student Engagement and the Community College Survey of Student Engagement, as well as the Collegiate Learning Assessment and the Measure of Academic Proficiency and Progress. Provide incentives for states, higher-education associations, systems, and institutions to develop outcomes-focused accountability systems.
• Make results of such measures available to students and report them publicly in the aggregate. They should also be included on transcripts and in national databases of accountability data. Institutions should make aggregate results publicly available in a consumer-friendly form.
• Administer the National Assessment of Adult Literacy every five years, instead of ten.
• Require the National Center for Education Statistics to prepare timely annual public reports on college revenues and expenditure, including analysis of the major changes from year to year, at the sector and state levels.
• Develop a national unit-record tracking system to follow the progress of each student in the country, with appropriate privacy safeguards.
• Create a consumer-friendly information database on higher education including a search engine that allows parents, policy makers, and others to weigh and rank institutions based on variables of their choosing.
• Establish a national accreditation framework that contains a set of comparable performance measures on learning outcomes appropriate to degree levels and institutional missions, and that is suitable for accreditation, public reporting, and consumer profiles; that does not prescribe specific input and process standards; and that requires institutions to report progress relative to their national and international peers.
• Make accountability more transparent as a condition of accreditation. Make the findings of reviews easily accessible to the public, and increase the proportion of public representatives in the governance of accrediting organizations and members of review teams from outside higher education.
It is obvious that many of the recommendations are aimed at national and state-level agencies; however, the impact will follow through to individual institutions. Community colleges should keep abreast of the Commission’s final report and determine the impact these recommendations will have on the individual institution.

REFERENCES Adelman, C. (2004). National Education Longitudinal Study (NES: 88). Washington,
D.C.: U.S. Department of Education. Adelman, C. (2005). Moving Into Town-and Moving On: The Community College in the
Lives of Traditional-age Students. Washington, D.C.: U.S. Department of Education.
American Council on Education. (2004). Choice of Institution: Changing Student
Attendance Patterns in the 1990s. www.acenet.edu/programs/policy. American Diploma Project (The): Ready of Not: Creating a High School Diploma that
Counts (2004). http://www.achieve.org/achieve.nsf/ADPNetwork?OpenForm. Arenson, K.W. (April 13, 2003) “The Longtime Student,” The New York Times. Association of American Colleges and Universities. (2002). Greater Expectations.
Washington, D.C.: Author. Augustine, N.R. (October 20, 2005). Statement as Chair, Committee on Prospering in
the Global Economy of the 21st Century; and Committee on Science, Engineering, and Public Policy, Division on Policy and Global Affairs, The National Academies, before the Committee on Science, U.S. House of Representatives.
Bailey, T. & Badway, N. (2001). For-Profit Higher Education and Community Colleges.
Stanford, CA: National Center for Postsecondary Improvement. Bok, D. (2005). Our Underachieving Colleges: A Candid Look at How Much Students
Learn and Why They Should Be Learning More. New York: Princeton University Press.
Boyd, R. (September 24, 2005). Keynote Comments. Chicago, IL: UCEA Mid-
America/Great Plains Joint Regional Conference. Carey, K. (2004). A Matter of Degrees: Improving Graduation Rates in Four-Year
Colleges and Universities. Washington, D.C.: Education Trust. Carnevale, A.P. and Desrochers, D.M. (2003). Standards for What? The Economic
Roots of K-16 Reform. Princeton, NJ: ETS. Center for Tax and Budget Accountability and Northern Illinois University. (2005). The
State of Working Illinois 2005. Chicago, IL: Authors. www.stateofworkingillinois.niu.edu.
Challenger, J.A. (2005). “Working in the Future: How Today’s Trends are Shaping
Tomorrow’s Jobs,” The Futurist (39:6), 47-50.
Harper College Environmental Scan Page 47

Collins, M. (2006). By the Numbers: State Goals for Increasing Postsecondary Attainment. Boston, MA: Jobs for the Future.
Colvin, G. (July 25, 2006). “America Isn’t Ready,” Fortune Magazine. Council on Competitiveness. (2005). A Roadmap for American Innovation.
www.compete.org. Council on Competitiveness. (2004). Innovate America. www.compete.org. Duderstadt, J.J. (July 22, 2003). Navigating the American University through the Stormy
Seas of a Changing World. Miami, FL: Society for College and University Planning.
Eduventures, Inc. (2005). Developing Effective Channels to Corporate and Government
Markets. Boston, MA: author. Evelyn, J. (October 29, 2004). “The Search for New Means of Support,” The Chronicle of
Higher Education. Gallup Briefing. June 18, 2002. Social Responsibility: Will Grads Raise the Bar? Gates, B. (2005). Speech to National Governors Association, February 26, 2005.
www.gatesfoundation.org/Media Center/Speeches/BillgSpeechNGA-050226.htm. GDA Integrated Services. (2003). Westminster College National Environmental Scan.
Mt. Pleasant, SC: Author. Gereffi, G. and Wadhwa, V. (December 2006). Framing the Engineering Outsourcing
Debate: Placing the United States on a Level Playing Field with China and India. <http://memp.pratt.duke.edu/downloads/duke_outsourcing_2005.pdf>.
Glenn, D. (April 12, 2005). “Education Researchers Use Survey Data to Discern Trends
and Differences Among Community-college Students,” The Chronicle of Higher Education.
Gordon, E.E. (2005). The 2010 Meltdown: Solving the Impending Jobs Crisis. Westport,
CT: Praeger Publishing. Gunderson, S., Jones, R., and Scanland, K. (2004). The Jobs Revolution: Changing
How America Works. Chicago, IL: Copywriters, Inc. Harper College (2005). 2005-2006 College Plan and Budget. Palatine, IL: Author. Hill, D.M. and Irvine, G. (2003). “Accreditation, Competence and Digital Portfolio
Assessment.” On the Horizon 11(4), 6-9. Howe, H. and Strauss, W. (2000). Millennials Rising. New York: Vintage Books. Illinois Department of Employment Security (IDES). (2004). The Illinois Labor Market
Review (9:2), http://lmi.ides.state.il.us/lmr/winter_2004/ILMR.pdf.
Harper College Environmental Scan Page 48

Illinois Department of Employment Security (IDES). (2006). www.ilworkforce.org. Illinois State Board of Education (ISBE) and Northern Illinois University (NIU). (2006).
Illinois Survey of Critical Technologies: Summary Report, DeKalb, IL: NIU. Institute of Educational Sciences. (2003). Homeschooling in the United States 2003.
Washington, D.C.: U.S. Department of Education, NCES. Kelly, P.J. and Jones, D.P. (December 2005). A New Look at the Institutional
Component of Higher Education Finance: A Guide for Evaluating Performance Relative to Financial Resources. Bolder, CO: NCHEM and The Pew Charitable Trusts.
Lewis, J.H. (June 2003). Poverty and Housing in the Northwest Suburbs. Chicago, IL:
Institute for Metropolitan Affairs, Roosevelt University. Lewis, J.H. (November 2002). Informing Social Service Provision: Evidence from the
Illinois Families Study. Chicago, IL: University Consortium on Welfare Reform, Roosevelt University, funded by Polk Bros. Foundation.
Lindsay, J.M. and Daalder, I.H. (August 2005). America’s Role in the World: Challenges
to American Businesses and Higher Education. Washington, DC: Business-Higher Education Forum.
Lipka, S. (December 16, 2005). “State Legislators as Co-Pilots,” The Chronicle of
Higher Education. Marcus, D. (January 18, 2006). “Many Transfer from a 4-Year Campus to a 2-Year
One,” New York Times (January 18, 2006). National Association of Colleges and Employers. (2003). Job Outlook Survey 2003.
Washington, D.C.: Author. National Center for Postsecondary Improvement. (2002). Beyond Dead Reckoning:
Research Priorities for Redirecting Higher Education. Stanford, CA: Author. National Science Board. (2006). Science and Engineering Indicators 2006. Washington,
D.C.: Author. Northeastern Illinois Planning Commission. (2003). 2030 Forecasts of Population,
Households, and Employment. Chicago, IL: Author. www.nipc.org. Northern Illinois University (NIU). (2003). Feasibility Study: Northwest Suburban
Economic Development Council. Prepared for Northwest and Schaumburg Association of Commerce and Industry. DeKalb, IL: Author.
Northern Illinois University (NIU). (2006). Interactive Illinois Report Card. DeKalb, IL:
Regional Development Institute. www.iirc.niu.edu
Harper College Environmental Scan Page 49
Northern Illinois University (NIU). (2006). Keeping Illinois Competitive. DeKalb, IL: Author.
Olson, L. (April 26, 2006). “Vies Differ on Defining College Prep,” Education Week. Paral, R. and Norkewicz, M. (2003). The Metro Chicago Immigration Fact Book.
Chicago, IL: Institute for Metropolitan Affairs, Roosevelt University. Parke, S. (December 2006). Special analysis of ICCB Data. Springfield, IL: Illinois
Community College Board. Partnership for 21st Century Skills. (March 2006). Results that Matter: 21st Century
Skills and High School Reform. Washington, D.C.: Author. Pepperl, M. (November 18, 2004). Changes, Challenges, and Choices. Presentation at
the Research Consortium Meeting of the Workforce Board of Northern Cook County.
Ramaley, J. (2001). “Policy Options Development,” Broadening Participation in Science
and Engineering Research and Education: Workshop Proceedings. Washington, D.C.: NSF Alliance for Graduate Education and Professoriate.
Reich, R. (December 8, 2005). “The New Rich-Rich Gap,” Newsweek,
www.msnbc.msn.com/id/10206251/site/newsweek. Rockbridge Associates, Inc. (April 23, 2006). Community Colleges Today: The
Presidents Speak Study. Washington, D.C.: AACC, SallieMae, Rockbridge Associations, Inc.
Roessler, B. (2006). Unpublished dissertation study for University of North Texas.
Reported in Inside Higher Ed, January 16, 2006. Roper ASW. (2004). Baby Boomers Envision Retirement II-Key Findings: Survey of
Baby Boomers’ Expectations for Retirement. Washington, DC. AARP. Singh, S.D. (March 30, 2005). “Local Commute Times Among Longest,” Chicago
Business. Society for College and University Planning (SCUP). (2005). Trends in Higher
Education. Ann Arbor, MI: Author. Society for College and University Planning (SCUP). (2006). Trends in Higher
Education. Ann Arbor, MI: Author. Tulgan, B. and Martin, C.A. (2001). Managing Generation Y: Global Citizens Born in the
Late Seventies and Early Eighties. Amherst, MA: HRD Press. Vaughan, G.B. and Weisman, I.M. (2006). 2006 Community College President: Career
and Lifestyle Survey. Washington, D.C.: AACC. Woods and Poole Economics, Inc. (2005). State of Illinois Data.
Harper College Environmental Scan Page 50

Workforce Board of Northern Cook County. (2003). State of the Workforce Report: Executive Summary. Park Ridge, IL: Author.
Workforce Board of Northern Cook County. (2003). State of the Workforce Report:
Addendum. Park Ridge, IL: Author. Yankelovich, D. (2005). “Ferment and Change: Higher Education in 2015”. The
Chronicle of Higher Education, November 25, 2005. Zeiss, T. (2004). A New Wake-up Call for Community Colleges.
http://www.leauge.org/publication/abstracts/leadership/labs0409.htm.
Harper College Environmental Scan Page 51

APPENDIX A: RECOMMENDATIONS FOR EDUCATION
Keeping Illinois Competitive (NIU, 2006) assessed the status of mathematics and science education in Illinois. Five challenges were identified: Challenge One: Student Academic Achievement Slightly more than half of Illinois high school students have the requisite
mathematics and science skills for postsecondary education or jobs in the emerging new economy.
Challenge Two: Alignment to 21st Century Knowledge and Skills State curricula, assessments, and pedagogy are not consistently aligned
with the 21st Century knowledge and skills needed for the state’s economic vitality.
Challenge Three: Teacher Preparation Many mathematics and science teachers do not have the proper
qualifications or access to ongoing professional development to improve their teaching.
Challenge Four: Investment in Science, Technology, Engineering, and Mathematics Education (STEM)
Strategies may not be adequate to recruit and retain the most qualified individuals for STEM professions and for research and development for innovation.
Challenge Five: Lifelong Learning In the 21st Century, all citizens and workers will need increasing
mathematics and science skills and opportunities for lifelong learning.
Keeping Illinois Competitive (NIU, 2006) provided abstracts of fifteen papers with recommendations on improving education in the U.S. Each of the papers recommended at least one of the following:
1. Lower barriers for immigration of high-skilled individuals. 2. Increase government investment in science/technology research and
development, physical sciences and engineering. 3. Improve K-12 math and science curriculum. 4. Improve teacher education/content knowledge. 5. Improve working environments for teachers. 6. Establish teacher mentoring/collaboration programs. 7. Increase science, technology, education, and math (STEM) teacher salaries in K-
12. 8. Provide opportunities/incentives for professional development of STEM teachers. 9. Alter attitudes of young people towards STEM education. 10. Provide loans/scholarships to pursue STEM degrees. 11. Provide fellowships to teach STEM subjects. 12. Provide students with STEM career incentives. 13. Create more flexible certification for STEM teachers. 14. Attract woman and ethnic minorities to STEM education. 15. Increase businesses’ role in STEM education. 16. Expand professional science masters programs. 17. Engage the public.
Harper College Environmental Scan Page 52

APPENDIX B: EMERGING CRITICAL TECHNOLOGIES
Concept Definitions from Illinois Survey of Critical Technologies: Summary Report (ISBE & NIU, 2006, directly quoted from Appendix).
BIOSCIENCES ASTROBIOLOGY The scientific study of life in the universe – its origin, evolution, distribution, comparability to Earth and human habitation, and future prospects. BIOMATERIALS Synthetic or natural materials that can replace or augment tissues, organs or body functions. BIOMECHANICS The use of the principles of mechanics to explore and engineer solutions to biological problems. BIOTECHNOLOGY The use of microorganisms, live plant or animal cells or their parts to create new products or to carry out biological processes aimed at genetic improvement for the benefit of people. NATURAL PRODUCTS Chemical compounds, naturally produced in plants or by microbial species that are harvested for use in health care and drug development. RECOMBINANT DNA DNA that has been altered by joining genetic material from two different sources to study the expression of a gene. ENVIRONMENTAL AND EMERGING TECHNOLOGIES ALTERNATIVE FUELS Study of alternative ways to produce energy for both stationary (e.g. power plant) and non-stationary (e.g. automobiles and aircraft) applications. Alternative fuel sources include wind and solar power, hydrogenated biofuels, and fuel cell, among others. BIOREMEDIATION The processes by which naturally occurring or modified organisms act to degrade or transform hazardous organic contaminants. FUEL CELL Devices for generating electrical energy directly from chemical energy. It differs from a battery in that the chemicals are not stored in the cell. Rather, they are fed into it as power is needed. GREEN TECHNOLOGY Industrial technologies and applications modified to reduce, prevent, or eliminate environmental damage.
Harper College Environmental Scan Page 53

HUMAN HEALTH AND DEVELOPMENT BIODEFENSE Use of various biotechnologies to respond to the intentional use of pathogens (bioterrorism) by detecting, identifying, assessing, and neutralizing pathogens. BIOINFORMATICS Use of computers in biology-related sciences to organize, interpret, and predict biological structure and function. Bioinformatics is usually applied in the context of analyzing DNA sequence data. GENE THERAPY Introducing a normal, functional copy of a gene into a cell for the purpose of correcting defective, disease-causing genes. GENOMICS The study of an organism’s full complement of genes to enable understanding of their expression and sequencing. PROTEOMICS The study of the totality of proteins in an organism. Studying the form and functions of proteins with the aid of supercomputers complements the scientific advances being made by the mapping of the genomes. STEM CELLS The study and application of undifferentiated (stem) cells that can be grown and maintained to differentiate into a variety of different cell types with select biological functions. INFORMATION TECHNOLOGIES AND COMMUNICATION ARTIFICIAL INTELLIGENCE Computers and hardware that can make intelligent decisions based on sensory feedback. ALGORITHMS A finite set of step-by-step instructions for problem solving or computational procedures, especially ones that can be implemented by a computer. DATA WAREHOUSING AND MINING The process of collecting, processing, filtering, extracting and refining useful knowledge from large databases. GRAPH THEORY The study of graphs either for their own sake or as models of such diverse things as groups (in pure mathematics) or computer networks. MODELING COMPLEX NONLINEAR SYSTEMS Systems which are not characterizable by linear or first-order equations, but are governed by any variety of complex, reciprocal relationships or feedback loops.
Harper College Environmental Scan Page 54

QUANTUM COMPUTING Information processing that can be performed only by harnessing physical phenomena unique to quantum physics, with performance expected to exceed a billion times faster than today’s most powerful supercomputer. MATERIALS SCIENCE AND ADVANCED MANUFACTURING BIOPOLYMERS Polymeric material produced from or by biological sources, for example, biodegradable plastics that are synthesized by living organisms. CELESTIAL MINING The search for, excavation and processing, or essential elements and materials on extra-terrestrial bodies (planets, asteroids, etc). NANOTECHNOLOGY Development and use of materials, structures, or devices that have a size of less than 2000 nanometers. Production of devices on this small scale saves space and resources, resulting in improved efficiency and processing speed. SMART MATERIALS Materials that have imbedded sensors and actuators so that they can sense and react to their environments.
Harper College Environmental Scan Page 55

APPENDIX C: ILLINOIS LEGISLATIVE ISSUES The following bills/resolutions were considered in 2005 and 2006 by Illinois legislators. Reference
Topic
House Bill 2225 Passed both chambers but pending funding; offers grants of $250 per semester to students with family incomes less than $200,000 and who do not qualify for MAP need-based awards
House Bill 4209 Not enacted; proposed to grant Harper College authority for a pilot baccalaureate program
House Bill 4406 Sent to the governor and is subject to appropriation; provides $1,000 in a renewable grant to students who meet several criteria, including at least a 2.7 high school graduation grade point, receipt of public aid funds, and in legal custody of a grandparent
House Bill 5429 Sent to the governor; requires “ICCB to establish a three-year pilot program at three community colleges for mobile response workforce training … and is targeted at businesses struggling to recruit a qualified workforce skilled in new technologies”
House Resolution 1101 and Senate Resolution 701
Passed; directed the IBHE to expand student information systems to include more comprehensive information on student participation, mobility, and performance; to encourage all institutions to participate in the shared enrollment data consortium and teacher data warehouse; to develop an integrated system in conjunction with the Joint Education Committee and workforce data to provide data for policy and resource-allocation decisions
House Resolution 913 Adopted; urges the U.S. government to approve the Development, Relief, and Education for Alien Minors Act of 2005
House Resolution 94 Adopted; encourages each public and private college or university in Illinois to participate in the Midwest Student Exchange program
Illinois Senate Bill Passed both chambers; allows community colleges and public universities to extend the payback period for large-scale energy conservation projects to 20 years
Senate Bill 1682 Passed both chambers; amends the Property Tax Extension Limitation Law of the Property Tax Code by setting procedures taxing bodies follow to receive referendum approval
Senate Bill 2487 Not enacted; proposed to make IBHE the chief procurement officer for higher education
Senate Bill 49 In 2005 legislation, public school and college districts in Illinois were required to cover the cost of annuities due to salary increases in excess of 6%. Senate Bill 49 passed both chambers and established procedures to exclude various salary increases and payments. It also gave subpoena power to the SURS board to compel witnesses and production of documents.
Harper College Environmental Scan Page 56

Reference
Topic
Senate Bill 882 Not enacted; proposed to add psychology to the fields of study eligible for reimbursement through the Health Services Education Grant
Senate Bill 931 Passed both chambers; creates the Nurse Educator Assistance Act, including several incentives to students and institutions to increase the number of nursing graduates
Senate Joint Resolution 88
Passed both houses; directed IBHE to inventory the baccalaureate partnerships between community colleges and in- and out-of-state colleges and universities; it directs ICCB to create guidelines to encourage community colleges to look first to Illinois-based institutions for baccalaureate partnerships
Senate Resolution 692 Adopted; establishes a study of textbook costs and the feasibility of rental programs at community colleges and public universities
Source: IBHE, Board Packet June 6, 2006
Harper College Environmental Scan Page 57

APPENDIX D: PROGRAMS WITHIN 10 MILES OF 60067 The following table is a list of organizations within 10 miles of zip code 60067 that provide educational services through the Illinois Workforce Development Program. Data was taken directly from the Illinois Workforce Board website. Provider Name Course of Study Address ABC School of Home Inspection Home Inspector Pre-Licensing (1001159 ) 10 N. Martingale
Schaumburg IL, 60173 Academy Of Dog Grooming Arts Ltd Professional Pet Grooming (1532 ) 1742 West Algonquin Rd.
Arlington Heights IL, 60005 Advanced Technical Support, Inc. MCSE (Microsoft Certified Systems Engineer) (2730 ) 1530 East Dundee Road
Suite 360 Palatine IL, 60074
Algor, Inc. 906/916 Professional Combination (5805 ) Algor Professional (5804 ) Heat Transfer, Linear Dynamics/CAD (5803 )
Learning Tree Inernational,1501 Woodfield Road Schaumburg IL, 60173
American Academy of Computer Training & Technology, Inc.
Desktop Publishing/Graphics Track (1327 ) 434 1/2 E. Northwest Hwy. Suite 2 Palatine IL, 60074
American Academy of Computer Training & Technology, Inc.
Desktop Publishing/Graphics/Internet Track (1329 ) Internet Track (1326 ) Desktop Publishing/Graphics Track (1327 ) Desktop Publishing/Graphics/Internet Track (1329 ) Internet Track (1326 )
5005 Newport Drive, Suite 303 Suite 303 Rolling Meadows IL, 60008
American Flyers Commercial Pilot Certification Course (1002134 ) Flight Instructor - Multi Engine Airplane (5818 ) Flight Instructor Academy (3479 ) Initial Fly Instructor Course (5899 ) Instrument Flight Instructor Course (1897 ) Instrument Rating Course (639 ) Multi Engine Flight Instructor Course (1896 ) Multi-Engine Airline Transport Pilot Certification Course (5819 ) Private Pilot Certificate (3480 )
1108 S Milwaukee Ave Wheeling IL, 60090
Automotive Educational College, Inc. ARSA Sales Boot Camp Program (5261 ) 2401 West Hassell Rd., Suite 1530 Hoffman Estates IL, 60195
Centres, Int MOUS Computer Training (4855 ) 1340 Remington Road Suite X Schaumburg IL, 60173
Chicago Professional Center Residential Commercial HVAC Technician (3374 ) Residential HVAC Technician (1001705 )
310 N. Wolf Wheeling IL, 60090
Comp USA, Inc. Database Application Developer (2375 ) Microsoft Certified Database Administrator (904 ) Microsoft Certified Systems Engineer (979 ) Oracle Database Administrator (2370 ) Oracle Database Developer (899 ) PC Technician Plus (2372 ) Web Designer (902 )
1045 E. Golf Road Schaumburg IL, 60173
Harper College Environmental Scan Page 58

Provider Name Course of Study Address Computer Aided Technology, Inc. CAD Productitivity Tools (6592 )
CATalyst Complete (1001377 ) COSMOS Motion (1000082 ) Industrial Design Modeling (1000925 ) SmarTEam Editor Advanced Administration (1001381 ) SmarTeam Editor Basic Administration (1001380 ) SMARTEAM Editor User (1001378 ) SmarTeam Workflow User (1001379 ) SolidWorks - File Management-CATI (6481 ) SolidWorks - PDMWorks Traing (6440 ) SolidWorks - Translation Techniques (6530 ) SolidWorks Administrator (6389 ) SolidWorks Advanced Assembly Modeling (6624 ) SolidWorks Advanced Part Modeling (6532 ) SolidWorks Animator (6359 ) SolidWorks Certified Professional Program/CATalyst SolidWorks Essentials: Drawings (6366 ) SolidWorks Essentials: Parts and Assemblies-CATI SolidWorks PhotoWorks (6482 )
165 Arlington Heights Road Suite 101 Buffalo Grove IL, 60089
Computer Training Source, Inc. Accounting Specialist Program (35 ) Computer Basics Program (3838 ) Desktop Publishing Specialist Program (1000185 ) Graphic Design Specialist Program (1000186 ) Microsoft Access Specialist Program (2727 ) Microsoft Excel Specialist Program (2729 ) Microsoft Office Master Instructor (1000188 ) Microsoft Office Specialist (MOS) / Computerized Accounting Microsoft Office Specialist (MOS)/Computer Repair (A+) Microsoft Office Specialist (MOS)/Desktop Publishing Microsoft Office Specialist Program (MOUS) (MOS) (4123 ) Microsoft Office Specialist Program (MOUS) (MOS) -Basic Microsoft Project Specialist (1000184 ) Microsoft Word Specialist Program (MOS) (2728 ) QuickBooks Specialist Program (4122 ) Video Specialist Program (1002401 ) Web Designer Program - Intermediate (37 ) Web Designer Program (34 )
1320 Tower Rd Suite 109 Schaumburg IL, 60173
Creative Market Solutions, Inc. Biz Idea Generator Learning Program (1121 ) 415 East Golf Road, Suite 110 Arlington Heights IL, 60005
Creative Market Solutions, Inc. Biz Starters Business Planning Program - Business Services Biz Starters Business Planning Program - Consulting Version Biz Starters Business Planning Program - Internet Business Biz Starters Business Planning Program - Retail Version Biz Starters Business Planning Program Getting to Go Self-Employment Assessment Program
415 East Golf Road, Suite 110 Arlington Heights IL, 60005
DeVry University- Lincolnshire Center Bachelor of Science in Business Administration (5600 ) Bachelor of Science in Computer Information Systems (712 ) Bachelor of Science in Technical Management (3726 ) Graduate Certificate in Information Systems Management (1001601 ) Master of Accounting and Financial Management (1001263 ) Master of Business Adminsitration (1000594 ) Master of Human Resource Management (1001264 ) Master of Information Systems Management (1001265 ) Master of Network and Communications Management (1001266 ) Master of Project Management (1001268 ) Master of Public Administration (1001267 )
25 Tri-State International Center Suite 130 Lincolnshire IL, 60069
Harper College Environmental Scan Page 59
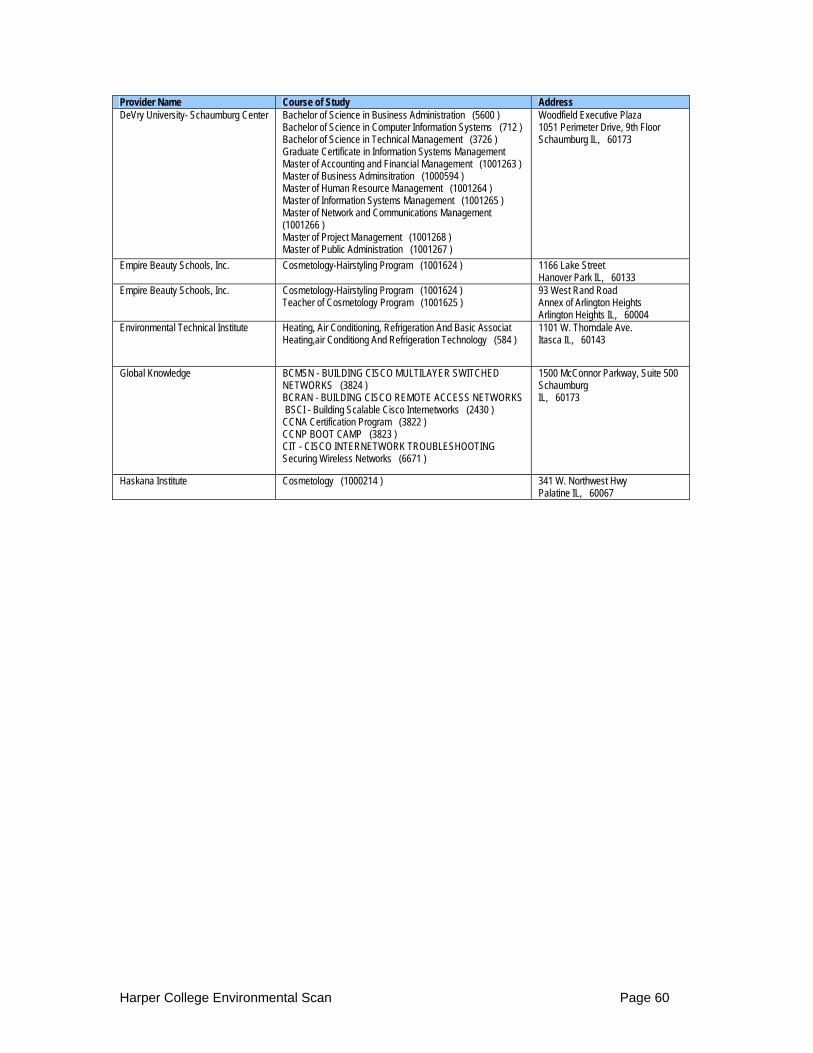
Provider Name Course of Study Address DeVry University- Schaumburg Center Bachelor of Science in Business Administration (5600 )
Bachelor of Science in Computer Information Systems (712 ) Bachelor of Science in Technical Management (3726 ) Graduate Certificate in Information Systems Management Master of Accounting and Financial Management (1001263 ) Master of Business Adminsitration (1000594 ) Master of Human Resource Management (1001264 ) Master of Information Systems Management (1001265 ) Master of Network and Communications Management (1001266 ) Master of Project Management (1001268 ) Master of Public Administration (1001267 )
Woodfield Executive Plaza 1051 Perimeter Drive, 9th Floor Schaumburg IL, 60173
Empire Beauty Schools, Inc. Cosmetology-Hairstyling Program (1001624 ) 1166 Lake Street Hanover Park IL, 60133
Empire Beauty Schools, Inc. Cosmetology-Hairstyling Program (1001624 ) Teacher of Cosmetology Program (1001625 )
93 West Rand Road Annex of Arlington Heights Arlington Heights IL, 60004
Environmental Technical Institute Heating, Air Conditioning, Refrigeration And Basic Associat Heating,air Conditiong And Refrigeration Technology (584 )
1101 W. Thorndale Ave. Itasca IL, 60143
Global Knowledge BCMSN - BUILDING CISCO MULTILAYER SWITCHED NETWORKS (3824 ) BCRAN - BUILDING CISCO REMOTE ACCESS NETWORKS BSCI - Building Scalable Cisco Internetworks (2430 ) CCNA Certification Program (3822 ) CCNP BOOT CAMP (3823 ) CIT - CISCO INTERNETWORK TROUBLESHOOTING Securing Wireless Networks (6671 )
1500 McConnor Parkway, Suite 500 Schaumburg IL, 60173
Haskana Institute Cosmetology (1000214 ) 341 W. Northwest Hwy Palatine IL, 60067
Harper College Environmental Scan Page 60

Provider Name Course of Study Address I.T. Quality Group, Inc. Advanced Coding/Certification readiness course (1303 )
Advanced Web Applications Development Course (3026 ) Basic concepts of E- Commerce and Relational Database Basic Java Language Applications Development course Certified Medical Assistant Program (1000763 ) Certified Nurse Assistant program (1000913 ) Certified Phlebotomy/EKG Technician Program (1001815 ) CNC OPERATOR course (2526 ) CNC OPERATOR/PROGRAMMER PROGRAM (2525 ) CNC Programmer course (2524 ) Computer Drafting I - III program (3430 ) Computer Drafting I (3427 ) Computer Drafting II (3025 ) Computer Drafting III (3024 ) Computerized Accounting/Administrative Assistance program Computerized Accounting/Medical Billing Program (3022 ) Computerized Accounting/Medical Coder Progarm (703 ) E - Commerce Java Program (3431 ) E - Commerce Solutions Program (3032 ) Echocardiography and Vascular Ultrasound course ESL (beginners level) (5822 ) ESL (Beginning/Intermediate/Advanced) program (4011 ) ESL (intermediate level) (5836 ) ESL(advanced) (5829 ) Extensible Markup Language (XML) course (3429 ) General Parts/Abdomen Ultrasound Course (1000766 ) Java Technologies and Multi-tier Applications Development Medical Coder Professional program (1302 ) Medical Insurance Billing/Coding Program (3020 ) Microsoft.Net Platform Program (3426 ) Oracle Development Administration Program (3023 ) Performance Testing course (5835 ) Product Design Program (704 ) Quality Assurance Program (541 ) Quality Assurance/Advanced Automation (5823 ) ToolDie Maker/Designer Program (3425 ) Ultrasound Technician Program (1000765 ) Unified Modeling Language with Rational Rose Course Unix and C++ (C++/Unix/Advanced C++) program (4005 ) Web Applications Development Course (3428 ) Web development and Oracle (1001454 ) WebSphere and Visual Age course (4007 )
1400 E. Lake Cook Rd., Ste 130 Buffalo Grove IL, 60089
Image Designer School of Nail Technology
Nail Technician Teacher course (1002109 ) Nail Technology course 101 (1002108 )
1045 W. Golf Rd. Hoffman Estates IL, 60195
International Institute For Learning Microsoft Project 2000 Certification Series (3821 ) The Project Management Certificate Program (3820 ) English as a Second Language (1002139 ) Professional Massage Therapy Program (1002138 )
NIU Hoffman Estates Center, 5555 Trillium Blvd. Hoffman Estates IL, 60192
JCM III Corporation Basic Nurse Assistant Certification Program (1000221 ) EKG TECHNICIAN BASIC AND ADVANCE (1001967 ) PATIENT CARE TECHNICIAN (1002421 ) PHARMACY TECHNICIAN (1001968 ) PHLEBOTOMY TECHNICIAN (1001969 )
1355 Remington Rd Suite Q Schaumburg IL, 60173
Jennings Computer Systems, Inc. (JCSI)
Microsoft Certified Systems Engineer (5196 ) 1340 Remington Road, Suite W Schaumburg IL, 60173
Harper College Environmental Scan Page 61

Provider Name Course of Study Address Manpower Call Center Training (2038 )
Excel - Advanced (2044 ) Excel - Intermediate (1307 ) Excel - Introduction (1306 ) Excel - Macros (2041 ) Internet Basics (2043 ) Keyboarding Skills (2040 ) Lotus Notes - Electronic Mail Calendaring (2042 ) Manpower Skillware Computer Training And Techtrack Training (1311 ) MS Access - Intermediate (1304 ) MS Access - Introduction (1317 ) MS Outlook (1309 ) MS Powerpoint - Intermediate (1315 ) MS Powerpoint - Introduction (1305 ) MS Project (1308 ) MS Windows (1314 ) MS Word - Advanced (1318 ) MS Word - Intermediate (2039 ) MS Word - Introduction (1310 )
830 West End Court Suite 800 Vernon Hills, IL 60061-1379
Microhard Technical Institute Certified Netware Administrator (2719 ) Certified Novell Engineer 6.5 (2722 ) Cisco Certified Network Administrator (2743 ) Cisco Certified Network Professional (2726 ) Computerized Accounting for Beginners (3227 ) Database Administration CertGuru (720 ) Helpdesk Specialist Certguru (1857 ) Hotel Front Office Operations Management (1001899 ) IBM DB2 (1852 ) IT Support Specialist CertGuru (5695 ) LAN/WAN Specialist (5693 ) MCSE for beginners (1858 ) Microsoft Certified Database Administrator (2740 ) Microsoft Certified Professional (2721 ) Microsoft Certified Solutions Developer (2746 ) Microsoft Certified Systems Engineer (2720 ) Microsoft Network and Database CertGuru (1855 ) MOS (2741 ) Network Administrator Certguru (5694 ) Network Engineer Certguru (1854 ) Network+ (2723 ) Oracle DBA (2745 ) Oracle Developer 2000 (2742 ) PC Technician (6321 ) Project Management Professional (1029 ) Security Project Manager (1030 ) Security+ (1028 ) WAN Specialist Certguru (1856 ) Web Developer/E-Commerce (2744 )
3601 Algonquin Road #605 Rolling Meadows IL, 60008
Mildun Training Center of Illinois Dental Assistant (1000960 ) EKG, Phlebotomy and Medical Billing (1000807 )
309 E. Dundee Road Wheeling IL, 60090
Harper College Environmental Scan Page 62
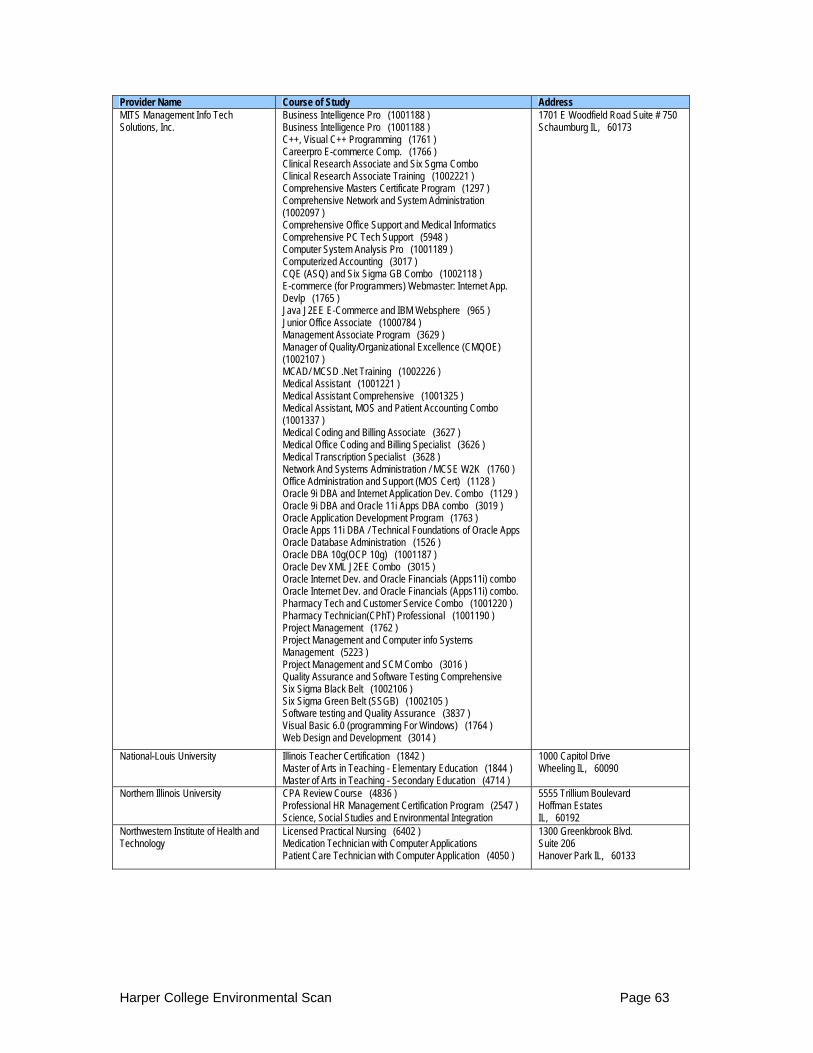
Provider Name Course of Study Address MITS Management Info Tech Solutions, Inc.
Business Intelligence Pro (1001188 ) Business Intelligence Pro (1001188 ) C++, Visual C++ Programming (1761 ) Careerpro E-commerce Comp. (1766 ) Clinical Research Associate and Six Sgma Combo Clinical Research Associate Training (1002221 ) Comprehensive Masters Certificate Program (1297 ) Comprehensive Network and System Administration (1002097 ) Comprehensive Office Support and Medical Informatics Comprehensive PC Tech Support (5948 ) Computer System Analysis Pro (1001189 ) Computerized Accounting (3017 ) CQE (ASQ) and Six Sigma GB Combo (1002118 ) E-commerce (for Programmers) Webmaster: Internet App. Devlp (1765 ) Java J2EE E-Commerce and IBM Websphere (965 ) Junior Office Associate (1000784 ) Management Associate Program (3629 ) Manager of Quality/Organizational Excellence (CMQOE) (1002107 ) MCAD/ MCSD .Net Training (1002226 ) Medical Assistant (1001221 ) Medical Assistant Comprehensive (1001325 ) Medical Assistant, MOS and Patient Accounting Combo (1001337 ) Medical Coding and Billing Associate (3627 ) Medical Office Coding and Billing Specialist (3626 ) Medical Transcription Specialist (3628 ) Network And Systems Administration / MCSE W2K (1760 ) Office Administration and Support (MOS Cert) (1128 ) Oracle 9i DBA and Internet Application Dev. Combo (1129 ) Oracle 9i DBA and Oracle 11i Apps DBA combo (3019 ) Oracle Application Development Program (1763 ) Oracle Apps 11i DBA / Technical Foundations of Oracle Apps Oracle Database Administration (1526 ) Oracle DBA 10g(OCP 10g) (1001187 ) Oracle Dev XML J2EE Combo (3015 ) Oracle Internet Dev. and Oracle Financials (Apps11i) combo Oracle Internet Dev. and Oracle Financials (Apps11i) combo. Pharmacy Tech and Customer Service Combo (1001220 ) Pharmacy Technician(CPhT) Professional (1001190 ) Project Management (1762 ) Project Management and Computer info Systems Management (5223 ) Project Management and SCM Combo (3016 ) Quality Assurance and Software Testing Comprehensive Six Sigma Black Belt (1002106 ) Six Sigma Green Belt (SSGB) (1002105 ) Software testing and Quality Assurance (3837 ) Visual Basic 6.0 (programming For Windows) (1764 ) Web Design and Development (3014 )
1701 E Woodfield Road Suite # 750 Schaumburg IL, 60173
National-Louis University Illinois Teacher Certification (1842 ) Master of Arts in Teaching - Elementary Education (1844 ) Master of Arts in Teaching - Secondary Education (4714 )
1000 Capitol Drive Wheeling IL, 60090
Northern Illinois University CPA Review Course (4836 ) Professional HR Management Certification Program (2547 ) Science, Social Studies and Environmental Integration
5555 Trillium Boulevard Hoffman Estates IL, 60192
Northwestern Institute of Health and Technology
Licensed Practical Nursing (6402 ) Medication Technician with Computer Applications Patient Care Technician with Computer Application (4050 )
1300 Greenkbrook Blvd. Suite 206 Hanover Park IL, 60133
Harper College Environmental Scan Page 63

Provider Name Course of Study Address Oakton Community College Accounting Associate, Associate in Applied Science Degree
Administrative Assistant Certificate Program (961 ) Advanced Web Site Development Certificate (3575 ) Animation and Multimedia Certificate (3304 ) Architectural Technology Certificate Program (5562 ) Architectural/CAD (2379 ) Automation Controls Certificate (2377 ) Automotive Service Excellence (447 ) Automotive Technology (Apprenticeship) Certificate (1100 ) Basic Nurse Assistant - Alliance (non-credit) (3569 ) Basic Nurse Assistant Program (oakton-credit) (2383 ) Cisco Certified Network Association (CCNA) Certificate CNC, CAM Programming (2378 ) Coding Certificate (2286 ) Computer User Certifcate (3400 ) Computer-Aided Design (2382 ) Construction Management Certificate (5929 ) Early Childhood Ed Ages 3-5 (451 ) e-Business Certificate (3302 ) Electronics and Computer Technology, AAS Degree (886 ) Electronics Computer Technician Certificate (1000434 ) Electronics Technology Certificate (1099 ) Financial Services (1002132 ) Fire Science Technology (1001901 ) Health Information Technology associate degree (944 ) Human Resource Specialist Certificate (1001910 ) Industrial Design Engineering (2285 ) Law Enforcement (associate degree) (947 ) Management and Supervision, AAS Degree (3226 ) Manufacturing Technology (1001019 ) Marketing Management - Associate in Applied Science Mechanical Design/CAD Certificate (3306 ) Medical Office Billing Certificate (450 ) Medical Office Management Certificate (449 ) Microsoft Certified Systems Engineer (MCSE) Certificate Network Administration Certificate (3401 ) Nursing (associate Degree) (946 ) Office Information Processing Specialist (3399 ) Pharmacy Technician (2284 ) Phlebotomy Certificate (3398 ) Physical Therapy Assistant program (945 ) Preparatory Substance Abuse Counseling Certificate (3403 ) Professional Accounting - CPA Preparation Certificate (967 ) Professional Selling Skills Certificate (2376 ) Real Estate Certificate (3303 ) Residential Comfort Control Certificate (1000475 ) Residential Comfort Systems Installer (446 ) Tool and Die Design and Engineering Certificate (448 ) Web Graphic Page Design Certificate (3305 ) Web Site Support and Maintenance Certificate (3301 )
1600 E. Golf Rd. Des Plaines IL, 60016
Olivet Nazarene University Associate of Arts Degree in Business (2191 ) 3405 Algonquin Road Rolling Meadows IL, 60008
Quality Technology Company (dba) Accelper Consulting
IPC-A-600 Instructor Training (5143 ) IPC-J-STD-001 Instructor Training (5137 )
1320 Tower Road Suite 139 Schaumburg IL 60173-4309
Harper College Environmental Scan Page 64
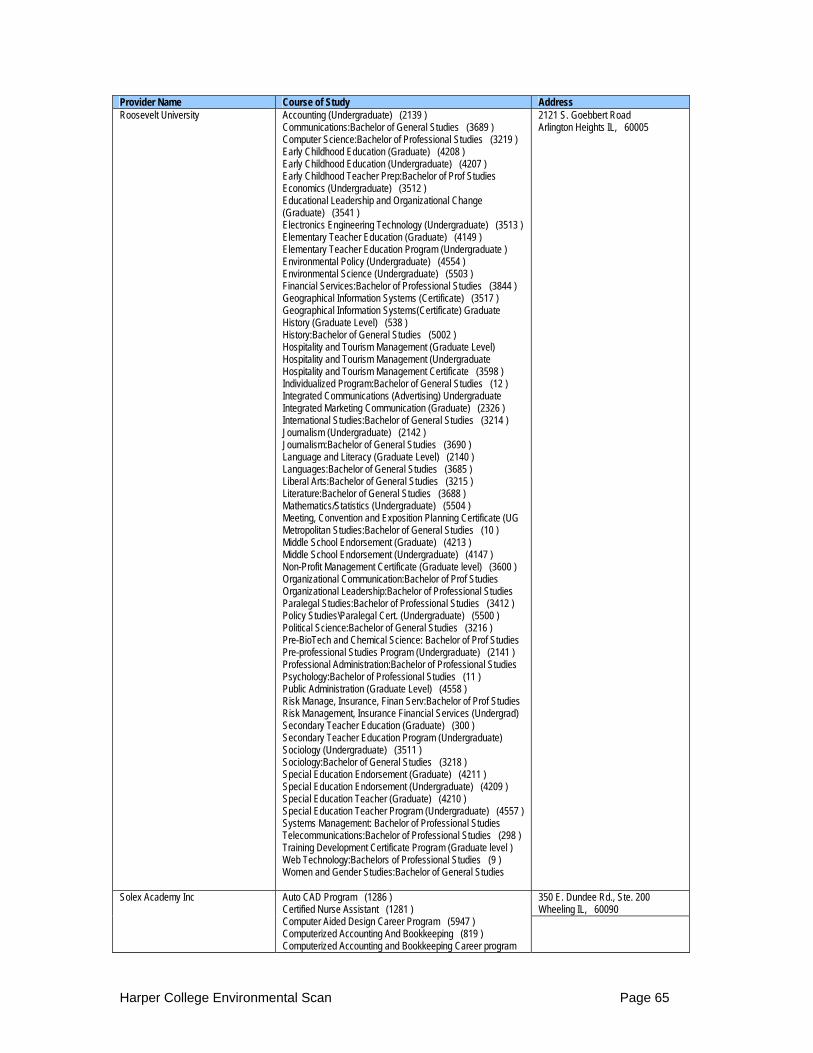
Provider Name Course of Study Address Roosevelt University Accounting (Undergraduate) (2139 )
Communications:Bachelor of General Studies (3689 ) Computer Science:Bachelor of Professional Studies (3219 ) Early Childhood Education (Graduate) (4208 ) Early Childhood Education (Undergraduate) (4207 ) Early Childhood Teacher Prep:Bachelor of Prof Studies Economics (Undergraduate) (3512 ) Educational Leadership and Organizational Change (Graduate) (3541 ) Electronics Engineering Technology (Undergraduate) (3513 ) Elementary Teacher Education (Graduate) (4149 ) Elementary Teacher Education Program (Undergraduate ) Environmental Policy (Undergraduate) (4554 ) Environmental Science (Undergraduate) (5503 ) Financial Services:Bachelor of Professional Studies (3844 ) Geographical Information Systems (Certificate) (3517 ) Geographical Information Systems(Certificate) Graduate History (Graduate Level) (538 ) History:Bachelor of General Studies (5002 ) Hospitality and Tourism Management (Graduate Level) Hospitality and Tourism Management (Undergraduate Hospitality and Tourism Management Certificate (3598 ) Individualized Program:Bachelor of General Studies (12 ) Integrated Communications (Advertising) Undergraduate Integrated Marketing Communication (Graduate) (2326 ) International Studies:Bachelor of General Studies (3214 ) Journalism (Undergraduate) (2142 ) Journalism:Bachelor of General Studies (3690 ) Language and Literacy (Graduate Level) (2140 ) Languages:Bachelor of General Studies (3685 ) Liberal Arts:Bachelor of General Studies (3215 ) Literature:Bachelor of General Studies (3688 ) Mathematics/Statistics (Undergraduate) (5504 ) Meeting, Convention and Exposition Planning Certificate (UG Metropolitan Studies:Bachelor of General Studies (10 ) Middle School Endorsement (Graduate) (4213 ) Middle School Endorsement (Undergraduate) (4147 ) Non-Profit Management Certificate (Graduate level) (3600 ) Organizational Communication:Bachelor of Prof Studies Organizational Leadership:Bachelor of Professional Studies Paralegal Studies:Bachelor of Professional Studies (3412 ) Policy Studies\Paralegal Cert. (Undergraduate) (5500 ) Political Science:Bachelor of General Studies (3216 ) Pre-BioTech and Chemical Science: Bachelor of Prof Studies Pre-professional Studies Program (Undergraduate) (2141 ) Professional Administration:Bachelor of Professional Studies Psychology:Bachelor of Professional Studies (11 ) Public Administration (Graduate Level) (4558 ) Risk Manage, Insurance, Finan Serv:Bachelor of Prof Studies Risk Management, Insurance Financial Services (Undergrad) Secondary Teacher Education (Graduate) (300 ) Secondary Teacher Education Program (Undergraduate) Sociology (Undergraduate) (3511 ) Sociology:Bachelor of General Studies (3218 ) Special Education Endorsement (Graduate) (4211 ) Special Education Endorsement (Undergraduate) (4209 ) Special Education Teacher (Graduate) (4210 ) Special Education Teacher Program (Undergraduate) (4557 ) Systems Management: Bachelor of Professional Studies Telecommunications:Bachelor of Professional Studies (298 ) Training Development Certificate Program (Graduate level ) Web Technology:Bachelors of Professional Studies (9 ) Women and Gender Studies:Bachelor of General Studies
2121 S. Goebbert Road Arlington Heights IL, 60005
350 E. Dundee Rd., Ste. 200 Wheeling IL, 60090
Solex Academy Inc Auto CAD Program (1286 ) Certified Nurse Assistant (1281 ) Computer Aided Design Career Program (5947 ) Computerized Accounting And Bookkeeping (819 ) Computerized Accounting and Bookkeeping Career program
Harper College Environmental Scan Page 65
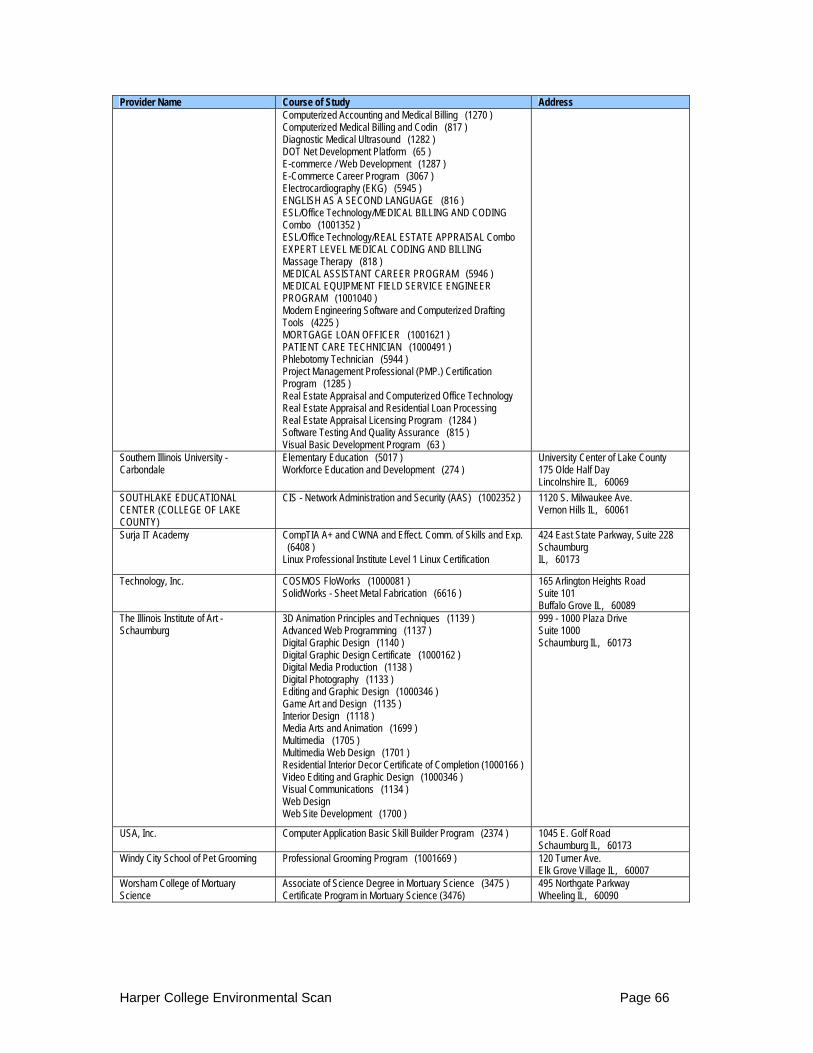
Provider Name Course of Study Address Computerized Accounting and Medical Billing (1270 )
Computerized Medical Billing and Codin (817 ) Diagnostic Medical Ultrasound (1282 ) DOT Net Development Platform (65 ) E-commerce / Web Development (1287 ) E-Commerce Career Program (3067 ) Electrocardiography (EKG) (5945 ) ENGLISH AS A SECOND LANGUAGE (816 ) ESL/Office Technology/MEDICAL BILLING AND CODING Combo (1001352 ) ESL/Office Technology/REAL ESTATE APPRAISAL Combo EXPERT LEVEL MEDICAL CODING AND BILLING Massage Therapy (818 ) MEDICAL ASSISTANT CAREER PROGRAM (5946 ) MEDICAL EQUIPMENT FIELD SERVICE ENGINEER PROGRAM (1001040 ) Modern Engineering Software and Computerized Drafting Tools (4225 ) MORTGAGE LOAN OFFICER (1001621 ) PATIENT CARE TECHNICIAN (1000491 ) Phlebotomy Technician (5944 ) Project Management Professional (PMP.) Certification Program (1285 ) Real Estate Appraisal and Computerized Office Technology Real Estate Appraisal and Residential Loan Processing Real Estate Appraisal Licensing Program (1284 ) Software Testing And Quality Assurance (815 ) Visual Basic Development Program (63 )
Southern Illinois University - Carbondale
Elementary Education (5017 ) Workforce Education and Development (274 )
University Center of Lake County 175 Olde Half Day Lincolnshire IL, 60069
SOUTHLAKE EDUCATIONAL CENTER (COLLEGE OF LAKE COUNTY)
CIS - Network Administration and Security (AAS) (1002352 ) 1120 S. Milwaukee Ave. Vernon Hills IL, 60061
Surja IT Academy CompTIA A+ and CWNA and Effect. Comm. of Skills and Exp. (6408 ) Linux Professional Institute Level 1 Linux Certification
424 East State Parkway, Suite 228 Schaumburg IL, 60173
Technology, Inc. COSMOS FloWorks (1000081 ) SolidWorks - Sheet Metal Fabrication (6616 )
165 Arlington Heights Road Suite 101 Buffalo Grove IL, 60089
The Illinois Institute of Art - Schaumburg
3D Animation Principles and Techniques (1139 ) Advanced Web Programming (1137 ) Digital Graphic Design (1140 ) Digital Graphic Design Certificate (1000162 ) Digital Media Production (1138 ) Digital Photography (1133 ) Editing and Graphic Design (1000346 ) Game Art and Design (1135 ) Interior Design (1118 ) Media Arts and Animation (1699 ) Multimedia (1705 ) Multimedia Web Design (1701 ) Residential Interior Decor Certificate of Completion (1000166 ) Video Editing and Graphic Design (1000346 ) Visual Communications (1134 ) Web Design Web Site Development (1700 )
999 - 1000 Plaza Drive Suite 1000 Schaumburg IL, 60173
USA, Inc. Computer Application Basic Skill Builder Program (2374 ) 1045 E. Golf Road Schaumburg IL, 60173
Windy City School of Pet Grooming Professional Grooming Program (1001669 ) 120 Turner Ave. Elk Grove Village IL, 60007
Worsham College of Mortuary Science
Associate of Science Degree in Mortuary Science (3475 ) Certificate Program in Mortuary Science (3476)
495 Northgate Parkway Wheeling IL, 60090
Harper College Environmental Scan Page 66
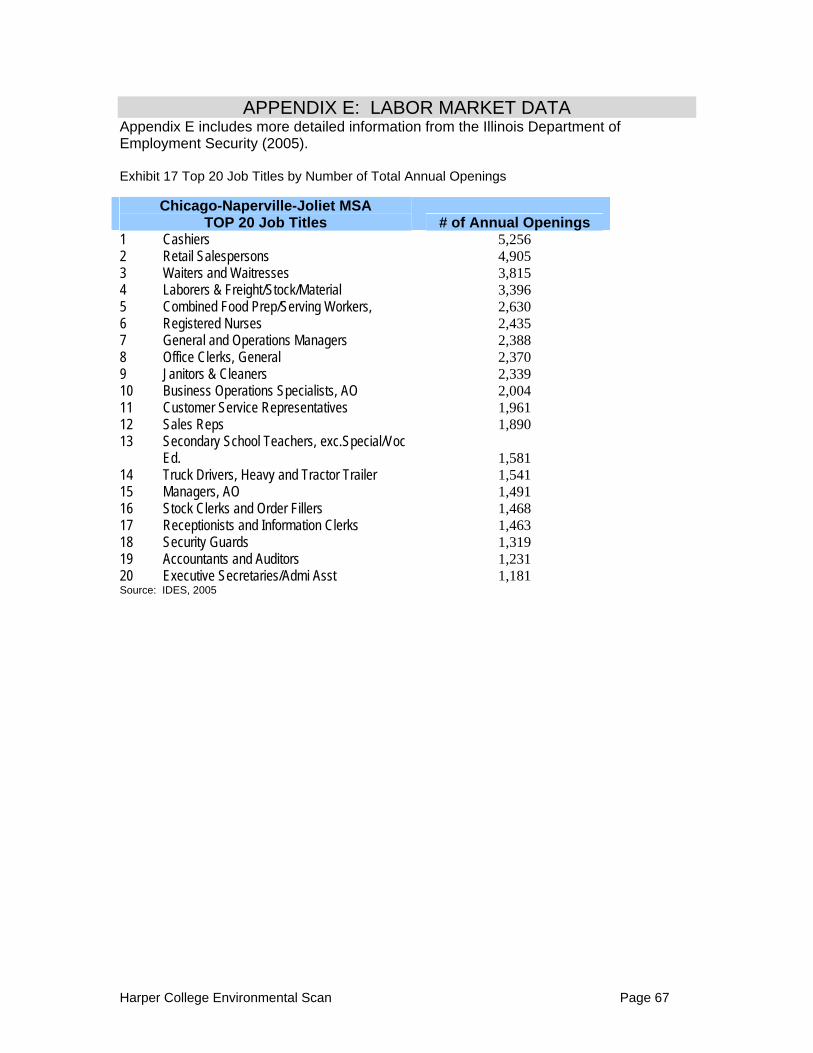
APPENDIX E: LABOR MARKET DATA Appendix E includes more detailed information from the Illinois Department of Employment Security (2005). Exhibit 17 Top 20 Job Titles by Number of Total Annual Openings
Chicago-Naperville-Joliet MSA TOP 20 Job Titles # of Annual Openings
1 Cashiers 5,256 2 Retail Salespersons 4,905 3 Waiters and Waitresses 3,815 4 Laborers & Freight/Stock/Material 3,396 5 Combined Food Prep/Serving Workers, 2,630 6 Registered Nurses 2,435 7 General and Operations Managers 2,388 8 Office Clerks, General 2,370 9 Janitors & Cleaners 2,339 10 Business Operations Specialists, AO 2,004 11 Customer Service Representatives 1,961 12 Sales Reps 1,890 13 Secondary School Teachers, exc.Special/Voc
Ed. 1,581 14 Truck Drivers, Heavy and Tractor Trailer 1,541 15 Managers, AO 1,491 16 Stock Clerks and Order Fillers 1,468 17 Receptionists and Information Clerks 1,463 18 Security Guards 1,319 19 Accountants and Auditors 1,231 20 Executive Secretaries/Admi Asst 1,181 Source: IDES, 2005
Harper College Environmental Scan Page 67

Exhibit 18 Top 20 Job Titles by Number of Annual Openings Due to Growth Chicago-Naperville-Joliet MSA
TOP 20 Job Titles # of Annual Openings 1 Registered Nurses 1,155 2 Business Operations Specialists, AO 1,154 3 Customer Service Representatives 1,065 4 Janitors & Cleaners, except Maids/Housekeepers 1,046 5 Retail Salespersons 993 6 General and Operations Managers 992 7 Waiters and Waitresses 896 8 Combined Food Prep/Serving Workers, Fast Food 847 9 Cashiers 797 10 Truck Drivers, Heavy and Tractor Trailer 759 11 Teachers, Primary, Secondary and Adult, AO 756 12 Sales Reps, Wholesale and Manufacturing 684 13 Nursing Aides, Orderlies and Attendants 680 14 Receptionists and Information Clerks 657 15 Computer Systems Analysts 642 16 Security Guards 627 17 Accountants and Auditors 565 18 Electricians 515 19 Landscaping and Groundskeepers 514 20 Carpenters 514 Source: IDES, 2005 More detailed information on the top 20 job titles with annual openings due to growth.
Base Year Proj Year Employment Change Average Annual Job Openings
Chicago - Naperville - Joliet MSA Employment Employment 2002 - 2012 Due To Standard Occupational Classification (SOC) Title 2002 2012 Number Percent Growth
Replace ments Total
Code Title 29-1111 Registered Nurses 61,257 72,806 11,550 18.85 1,155 1,280 2,435
13-1199 Business Operations Specialists, AO 49,987 61,528 11,541 23.09 1,154 850 2,004
43-4051 Customer Service Representatives 60,152 70,797 10,645 17.70 1,065 896 1,961
37-2011 Janitors & Cleaners, except Maids/Housekeepers 68,045 78,509 10,464 15.38 1,046 1,293 2,339
41-2031 Retail Salespersons 107,465 117,396 9,931 9.24 993 3,912 4,905
11-1021 General and Operations Managers 73,886 83,808 9,923 13.43 992 1,396 2,388
35-3031 Waiters and Waitresses 56,684 65,649 8,964 15.81 896 2,919 3,815
35-3021 Combined Food Prep/Serving Workers, Fast Food 41,186 49,658 8,472 20.57 847 1,783 2,630
41-2011 Cashiers 91,570 99,542 7,972 8.71 797 4,459 5,256
53-3032 Truck Drivers, Heavy and Tractor Trailer 47,985 55,576 7,591 15.82 759 782 1,541
25-3999 Teachers, Primary, Secondary and Adult, AO 26,480 34,036 7,555 28.53 756 326 1,082
Harper College Environmental Scan Page 68
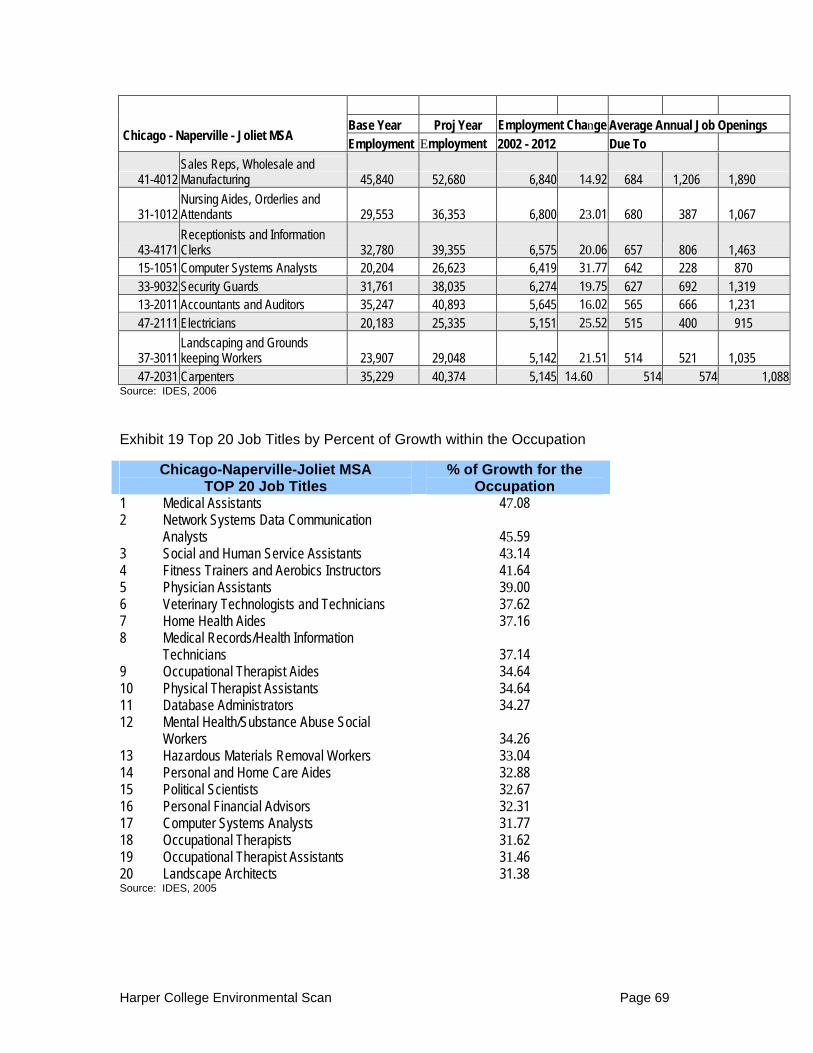
Base Year Proj Year Employment Change Average Annual Job Openings
Chicago - Naperville - Joliet MSA Employment Employment 2002 - 2012 Due To
41-4012 Sales Reps, Wholesale and Manufacturing 45,840 52,680 6,840 14.92 684 1,206 1,890
31-1012 Nursing Aides, Orderlies and Attendants 29,553 36,353 6,800 23.01 680 387 1,067
43-4171 Receptionists and Information Clerks 32,780 39,355 6,575 20.06 657 806 1,463
15-1051 Computer Systems Analysts 20,204 26,623 6,419 31.77 642 228 870 33-9032 Security Guards 31,761 38,035 6,274 19.75 627 692 1,319 13-2011 Accountants and Auditors 35,247 40,893 5,645 16.02 565 666 1,231 47-2111 Electricians 20,183 25,335 5,151 25.52 515 400 915
37-3011 Landscaping and Grounds keeping Workers 23,907 29,048 5,142 21.51 514 521 1,035
47-2031 Carpenters 35,229 40,374 5,145 14.60 514 574 1,088Source: IDES, 2006 Exhibit 19 Top 20 Job Titles by Percent of Growth within the Occupation
Chicago-Naperville-Joliet MSA TOP 20 Job Titles
% of Growth for the Occupation
1 Medical Assistants 47.08 2 Network Systems Data Communication
Analysts 45.59 3 Social and Human Service Assistants 43.14 4 Fitness Trainers and Aerobics Instructors 41.64 5 Physician Assistants 39.00 6 Veterinary Technologists and Technicians 37.62 7 Home Health Aides 37.16 8 Medical Records/Health Information
Technicians 37.14 9 Occupational Therapist Aides 34.64 10 Physical Therapist Assistants 34.64 11 Database Administrators 34.27 12 Mental Health/Substance Abuse Social
Workers 34.26 13 Hazardous Materials Removal Workers 33.04 14 Personal and Home Care Aides 32.88 15 Political Scientists 32.67 16 Personal Financial Advisors 32.31 17 Computer Systems Analysts 31.77 18 Occupational Therapists 31.62 19 Occupational Therapist Assistants 31.46 20 Landscape Architects 31.38 Source: IDES, 2005
Harper College Environmental Scan Page 69

More detail information on the top 20 jobs by percent of growth within the occupation.
2002-2012 Occupational Employment Projections Chicago-Naperville-Joliet MSA Base Year Proj Year Employment Change Average Annual Job Openings
Employ Ment
Employ ment 2002 – 2012 Due To
Standard Occupational Classification (SOC) 2002 2012 Number Percent Growth Replacem
ents Total Code Title 31-9092 Medical Assistants 5,722 8,416 2,694 47.08 269 106 375
15-1081 Network Systems Data Communication Analysts 4,367 6,358 1,991 45.59 199 52 251
21-1093 Social and Human Service Assistants 6,307 9,029 2,721 43.14 272 111 383
39-9031 Fitness Trainers and Aerobics Instructors 4,967 7,035 2,068 41.64 207 114 321
29-1071 Physician Assistants 754 1,048 294 39.00 29 12 41
29-2056 Veterinary Technologists and Technicians 1,190 1,637 448 37.62 45 15 60
31-1011 Home Health Aides 8,837 12,121 3,284 37.16 328 116 444
29-2071 Medical Records/Health Information Technicians 3,853 5,285 1,431 37.14 143 55 198
31-2012 Occupational Therapist Aides 201 271 70 34.64 7 3 10 31-2021 Physical Therapist Assistants 1,506 2,027 522 34.64 52 25 77 15-1061 Database Administrators 3,510 4,713 1,203 34.27 120 36 156
21-1023 Mental Health/Substance Abuse Social Workers 1,838 2,468 630 34.26 63 31 94
47-4041 Hazardous Materials Removal Workers 846 1,126 280 33.04 28 22 50
39-9021 Personal and Home Care Aides 11,108 14,761 3,653 32.88 365 178 543 19-3094 Political Scientists 100 133 33 32.67 3 2 5 13-2052 Personal Financial Advisors 3,690 4,882 1,192 32.31 119 48 167 15-1051 Computer Systems Analysts 20,204 26,623 6,419 31.77 642 228 870 29-1122 Occupational Therapists 2,786 3,667 881 31.62 88 38 126
31-2011 Occupational Therapist Assistants 407 535 128 31.46 13 5 18
17-1012 Landscape Architects 476 626 149 31.38 15 5 20 Source: IDES, 2006
Harper College Environmental Scan Page 70

Some occupations are predicted to lose jobs from 2002-2012. Exhibit 20 Job Titles Predicted to Lose the Most Jobs 2002-2012
Chicago-Naperville-Joliet MSA Bottom 20 Occupations # Jobs Eliminated
1 Secretaries, except Legal, Medical and Executive -492
2 Stock Clerks and Order Fillers -354 3 Data Entry Keyers -242 4 Secretaries, Adm. Assts. & Off. Supp. Wkrs,
AO -209 5 Word Processors and Typists -173 6 Team Assemblers -144 7 Telephone Operators -131 8 Postal Service Mail Sorters & Machine
Operators -129 9 Computer Operators -120 10 Order Clerks -117 11 Telemarketers -115 12 Electric and Electronic Equipment Assemblers -106 13 Brokerage Clerks -92 14 Travel Agents -78 15 File Clerks -66 16 Loan Interviewers and Clerks -65 17 Assemblers and Fabricators, AO -64 18 Prepress Technicians and Workers -56 19 Sewing Machine Operators -53 20 Communications Equipment Operators, AO -43 Source: IDES, 2005
Harper College Environmental Scan Page 71