2006 DR PEPPER BIG 12 FOOTBALL CHAMPIONSHIP · Dr Pepper Big 12 Football Championship December 2,...
54
2006 DR PEPPER BIG 12 FOOTBALL CHAMPIONSHIP BIG 12 FOOTBALL CHAMPIONSHIP - SCHEDULE OF EVENTS Friday, December 1 Noon - 6:00 p.m. Media Shuttle to-from Marriott Downtown & Arrowhead Stadium 12:30 - 3:30 p.m. Media Registration & Credential Pickup - Arrowhead Stadium Pavilion 2:30 p.m. Bob Stoops (OU) Press Conference - Arrowhead Stadium (Pavilion) 3:00 p.m. Bill Callahan (NU) Press Conference - Arrowhead Stadium (Pavilion) 4:45 - 5:15 p.m. State of the Conference Press Briefing - Big 12 Board of Directors Chair and University of Nebraska Chancel- lor Harvey Perlman, and Commissioner Kevin Weiberg - Marriott Downtown (Julia Lee A & B) Saturday, December 2 2:00 p.m. Parking Lots Open at Arrowhead Stadium 3:00 p.m. - 2:00 a.m. Media Shuttle 3:30 p.m. - 7:30 p.m. Media Registration & Credential Pickup - Arrowhead Stadium Media Entrance (Gate E) 4:30 p.m. Gates Open at Arrowhead Stadium 5:00 p.m. - 7:30 p.m. Media Pregame Meal - Arrowhead Stadium (Press Box) 7:13 p.m. Dr Pepper Big 12 Football Championship Game - Nebraska vs. Oklahoma (ABC) 10:00 p.m. - 12:00 a.m. Media Postgame Snack - Arrowhead Stadium (Press Box) All Times CST. TABLE OF CONTENTS Schedule of events -------- Page 1 Quick Facts, History --------------- 2 The Matchup --------------------- 3-4 Game Information ------------------ 5 Game Records------------------6-11 Bowl Information ----------------- 12 Postseason Honors --------- 13-14 Big 12 Notes/Media Info-------- 15 Team-By-Team Notes -------16-17 Conference Notes ----------- 18-21 Team-By-Team Results-----22-24 Statistics ------------------------ 25-54 2006 STANDINGS BIG 12 GAMES OVERALL NORTH DIVISION W-L Pct. PF PA W-L Pct. PF PA Home Road Neutral vs. Div. vs. Top 25 Streak Nebraska 6-2 .750 236 173 9-3 .750 407 218 6-1 3-2 0-0 5-0 2-2 Won 3 Missouri 4-4 .500 214 178 8-4 .667 353 215 6-1 2-3 0-0 3-2 1-1 Won 1 Kansas State 4-4 .500 188 218 7-5 .583 286 272 6-2 1-3 0-0 2-3 1-3 Lost 1 Kansas 3-5 .375 234 225 6-6 .500 348 306 5-2 1-4 0-0 3-2 0-1 Lost 1 Colorado 2-6 .250 160 199 2-10 .167 196 267 2-4 0-5 0-1 1-4 0-5 Lost 1 Iowa State 1-7 .125 120 262 4-8 .333 226 369 4-3 0-5 0-0 1-4 0-4 Won 1 SOUTH DIVISION Oklahoma 7-1 .875 208 121 10-2 .833 361 192 6-0 4-1 0-1 4-1 2-2 Won 7 Texas 6-2 .750 270 173 9-3 .750 441 214 5-2 2-1 2-0 4-1 2-1 Lost 2 Texas A&M 5-3 .625 193 174 9-3 .750 352 222 4-3 4-0 1-0 3-2 2-3 Won 1 Texas Tech 4-4 .500 240 235 7-5 .583 378 285 4-2 3-3 0-0 3-2 0-4 Won 1 Oklahoma State 3-5 .375 264 243 6-6 .500 424 302 4-2 1-4 1-0 1-4 1-3 Lost 2 Baylor 3-5 .375 194 320 4-8 .333 283 391 3-4 1-3 0-1 0-5 0-4 Lost 4
Transcript of 2006 DR PEPPER BIG 12 FOOTBALL CHAMPIONSHIP · Dr Pepper Big 12 Football Championship December 2,...

2006 DR PEPPERBIG 12 FOOTBALL CHAMPIONSHIP
BIG 12 FOOTBALL CHAMPIONSHIP - SCHEDULE OF EVENTSFriday, December 1 Noon - 6:00 p.m. Media Shuttle to-from Marriott Downtown & Arrowhead Stadium
12:30 - 3:30 p.m. Media Registration & Credential Pickup - Arrowhead Stadium Pavilion
2:30 p.m. Bob Stoops (OU) Press Conference - Arrowhead Stadium (Pavilion)
3:00 p.m. Bill Callahan (NU) Press Conference - Arrowhead Stadium (Pavilion) 4:45 - 5:15 p.m. State of the Conference Press Briefi ng - Big 12 Board of Directors Chair and University of Nebraska Chancel- lor Harvey Perlman, and Commissioner Kevin Weiberg - Marriott Downtown (Julia Lee A & B)
Saturday, December 2
2:00 p.m. Parking Lots Open at Arrowhead Stadium 3:00 p.m. - 2:00 a.m. Media Shuttle
3:30 p.m. - 7:30 p.m. Media Registration & Credential Pickup - Arrowhead Stadium Media Entrance (Gate E)
4:30 p.m. Gates Open at Arrowhead Stadium
5:00 p.m. - 7:30 p.m. Media Pregame Meal - Arrowhead Stadium (Press Box)
7:13 p.m. Dr Pepper Big 12 Football Championship Game - Nebraska vs. Oklahoma (ABC)
10:00 p.m. - 12:00 a.m. Media Postgame Snack - Arrowhead Stadium (Press Box)All Times CST.
TABLE OF CONTENTS Schedule of events -------- Page 1 Quick Facts, History ---------------2 The Matchup --------------------- 3-4 Game Information ------------------5 Game Records------------------6-11 Bowl Information ----------------- 12 Postseason Honors ---------13-14 Big 12 Notes/Media Info -------- 15 Team-By-Team Notes -------16-17 Conference Notes -----------18-21 Team-By-Team Results -----22-24 Statistics ------------------------25-54
2006 STANDINGS BIG 12 GAMES OVERALLNORTH DIVISION W-L Pct. PF PA W-L Pct. PF PA Home Road Neutral vs. Div. vs. Top 25 StreakNebraska 6-2 .750 236 173 9-3 .750 407 218 6-1 3-2 0-0 5-0 2-2 Won 3Missouri 4-4 .500 214 178 8-4 .667 353 215 6-1 2-3 0-0 3-2 1-1 Won 1Kansas State 4-4 .500 188 218 7-5 .583 286 272 6-2 1-3 0-0 2-3 1-3 Lost 1Kansas 3-5 .375 234 225 6-6 .500 348 306 5-2 1-4 0-0 3-2 0-1 Lost 1Colorado 2-6 .250 160 199 2-10 .167 196 267 2-4 0-5 0-1 1-4 0-5 Lost 1Iowa State 1-7 .125 120 262 4-8 .333 226 369 4-3 0-5 0-0 1-4 0-4 Won 1
SOUTH DIVISIONOklahoma 7-1 .875 208 121 10-2 .833 361 192 6-0 4-1 0-1 4-1 2-2 Won 7Texas 6-2 .750 270 173 9-3 .750 441 214 5-2 2-1 2-0 4-1 2-1 Lost 2Texas A&M 5-3 .625 193 174 9-3 .750 352 222 4-3 4-0 1-0 3-2 2-3 Won 1Texas Tech 4-4 .500 240 235 7-5 .583 378 285 4-2 3-3 0-0 3-2 0-4 Won 1 Oklahoma State 3-5 .375 264 243 6-6 .500 424 302 4-2 1-4 1-0 1-4 1-3 Lost 2Baylor 3-5 .375 194 320 4-8 .333 283 391 3-4 1-3 0-1 0-5 0-4 Lost 4

Dr Pepper Big 12 Football Championship December 2, 2006Arrowhead Stadium, Kansas City, Missouri Page 2
DR PEPPER BIG 12 FOOTBALL CHAMPIONSHIP
- JUST THE FACTS -
Which .................................................. 11th AnnualWhere Arrowhead Stadium, Kansas City, MissouriKickoff Time (approximate) .............. 7:13 p.m. CSTTV ....................................................................ABCABC Announcers .... Mike Patrick, Todd BlackledgeABC Sideline Reporter ..........................Holly RoweABC Producer .........................................Bo GarrettNational Radio ......................................Sports USASports USA Announcers ................... John Rooney, ..................................... Gary Barnett, Rich HerreraVisiting Team (Bench - Opposite Press Box) ..... NU Home Team (Bench - Press Box Side) ..............OU
ARROWHEAD STADIUM QUICK FACTSOpened .........................................August 17, 1972Cost ....................................................... $53 Million (Combined Cost of Truman Sports Complex)Playing Surface ..............................................GrassFootball Capacity ......................................... 79,451Luxury Suites ...................................................... 80Luxury Field Boxes ............................................. 33First Game ....................................August 12, 1972 Kansas City Chiefs 24, St. Louis Cardinals 14First College Game ..................... October 14, 1972 Grambling 27, Mississippi Valley State 21First Big 12 Game ......................... October 3, 1998 Nebraska 24, Oklahoma State 17Largest Football Crowd ..............November 5, 1972 82,094 Kansas City Chiefs 27, Oakland Raiders 14
A QUICK HISTORY OF THE DR PEPPER BIG 12 FOOTBALL CHAMPIONSHIPYear City Stadium Attend. Result Winning Team Bowl Result2005 Houston Reliant Stadium 71,107 No. 2/2 Texas 70, Colorado 3 Texas 41, USC 38 (Rose)
2004 Kansas City Arrowhead Stadium 62,130 No. 2/2 Oklahoma 42, USC 55, Oklahoma 19 (Rose) Colorado 32003 Kansas City Arrowhead Stadium 75,491 No. 13/13 Kansas State 35, Ohio State 35, Kansas State 28 (Fiesta) No. 1/1 Oklahoma 72002 Houston Reliant Stadium 63,332 No. 8/9 Oklahoma 29, Oklahoma 34, Washington State 14 (Rose) No. 12/12 Colorado 72001 Irving, Texas Texas Stadium 65,675 No. 9/10 Colorado 39, Oregon 38, Colorado 16 (Fiesta) No. 3/3 Texas 372000 Kansas City Arrowhead Stadium 79,655 No. 1/1 Oklahoma 27, Oklahoma 13, Florida State 2 (Orange) No. 7/8 Kansas State 24 1999 San Antonio Alamodome 65,035 No. 3/3 Nebraska 22, Nebraska 31, Tennessee 21 (Fiesta) No. 12/12 Texas 6 1998 St. Louis TWA Dome 60,798 No. 10/10 Texas A&M 36, Ohio State 24, Texas A&M 14 (Sugar) No. 2/1 Kansas State 33 (2ot)1997 San Antonio Alamodome 64,824 No. 2/2 Nebraska 54, Nebraska 42, Tennessee 17 (Orange) No. 14/14 Texas A&M 15 1996 St. Louis TWA Dome 63,109 Texas 37, Penn State 38, Texas 15 (Fiesta) No. 3/3 Nebraska 27 Home team in bold type; Rankings listed as Associated Press followed by USA Today
WELCOME TO THE 11TH ANNUAL DR PEPPER BIG 12 FOOTBALL CHAMPIONSHIP
For the 11th consecutive season, the Big 12 Conference will hold a football championship game. This season’s event will take place at Arrowhead Stadium, the fourth time the venue has hosted the contest - more than any other stadium.
Please contact any member of the Big 12 Communications staff should you need anything during the weekend. Staff members are housed at the Westin Crown Center, beginning on Thursday night. You can also reach them via cell phone at the numbers below. Best wishes for an enjoyable stay in Kansas City!
Bob Burda ......................................... 719/440-0216Rob Carolla ....................................... 214/208-1876Joni James ........................................ 214/263-7749Carmen Branch ................................. 214/418-6969Katie Davis ........................................ 618/920-8022
TICKET INFORMATIONTickets for the Dr Pepper Big 12 Football Championship can be purchased through Ticketmaster outlets, ticketmaster.com or (800) 676-5488. Group tickets and premium ticket packages available through Arrowhead Stadium at (888) 992-4433. Tickets are $80, $70, $60 and $50 based on location.
A GUIDE TO THE GAME - FOR FANS & MEDIA All parking lots at Arrowhead Stadium open at 2:00 p.m. CT.
Stadium gates will be opened to fans at 4:30 p.m. CT.
NO ALCOHOL will be sold in the general seating area at the Big 12 Football Championship.
All fans should plan to arrive as early as possible.

Dr Pepper Big 12 Football Championship December 2, 2006Arrowhead Stadium, Kansas City, Missouri Page 3
OKLAHOMA SOONERS
National Rankings: ...........No. 11 Harris, No. 8 AP; No. 10 USA TodayBowl Championship Series Ranking: ............................................ 12thLocation: .......................................................................Norman, Okla.Colors: .................................................................Crimson and CreamPresident: .................................................................... David. L. BorenDirector of Athletics: .....................................................Joe CastiglioneAssociate AD/Media Relations (Football Contact) ..... Kenny Mossman
Head Coach: .................................................Bob Stoops (Iowa, 1983)Overall Record: ..................................................85-18 (.825) / 8 yearsRecord at OU: ....................................................85-18 (.825) / 8 yearsBowl Record Overall/At OU: .............................. 4-3 (.571) / 4-3 (.571)
Oklahoma Record In Big 12 Championship Game: ..............3-1 (.750)Bob Stoops Record In Big 12 Championship Game: ............3-1 (.750)
Oklahoma Overall Bowl Record: .............................................24-14-1Oklahoma Bowl Record Since Big 12 Play Began (1996): .............. 4-3Last Bowl Appearance: .......................................... 2005 Holiday Bowl (Oklahoma 17, Oregon 14)
Series Record vs. Nebraska (All-Time) ......................... 42-37-3 (.530)Series Record vs. Nebraska (Big 12 Play) ............................3-3 (.500)
Bob Stoops vs. Nebraska ......................................................3-1 (.750) 10/29/05 ...................................Oklahoma 31, Nebraska 24 11/13/04 ......................................Oklahoma 30, Nebraska 3 10/27/01 ...................................Nebraska 20, Oklahoma 10 10/28/00 ...................................Oklahoma 31, Nebraska 14
2006 RESULTS (10-2, 7-1 BIG 12)S2 UAB ................................................................. W, 24-17S9 Washington ...................................................... W, 37-20S16 at Oregon............................................................. L, 33-34S23 Middle Tennessee State .................................. W, 59-0O7 vs. Texas ............................................................... L, 10-28O14 Iowa State........................................................ W, 34-9O21 Colorado .......................................................... W, 24-3O28 at Missouri ........................................................... W, 26-10N4 at Texas A&M....................................................... W, 17-16N11 Texas Tech ....................................................... W, 34-24N18 at Baylor .............................................................. W, 36-10N25 at Oklahoma State ............................................... W, 27-21D2 Dr Pepper Big 12 Championship, Kansas City, Mo. vs. Nebraska ......................................................... 7:00 p.m.
NEBRASKA CORNHUSKERS
National Ranking: ..........No. 20 Harris, No. 19 AP, No. 18 USA TodayBowl Championship Series Ranking: ............................................ 20thLocation: ................................................................. Lincoln, NebraskaColors: ................................................................... Scarlet and CreamChancellor: .........................................................Harvey Perlman, J.D.Director of Athletics: ....................................................Steve PedersonMedia Relations Director (Football Contact): .....................Keith Mann
Head Coach: .........................Bill Callahan (Illinois Benedictine, 1978)Overall Record: ..................................................21-13 (.618) / 3 yearsRecord at NU: .....................................................21-13 (.618) / 3 yearsBowl Record Overall/At NU: ............................ 1-0 (1.000)/1-0 (1.000)
Nebraska Record In Big 12 Championship Game:................2-1 (.667)Bill Callahan Record In Big 12 Championship Game: ...........0-0 (.000)
Nebraska Overall Bowl Record: .......................................22-21 (.512)Nebraska Bowl Record Since Big 12 Play Began (1996): .....6-3 (.667)Last Bowl Appearance: ............................................ 2005 Alamo Bowl (Nebraska 32, Michigan 28)
Series Record vs. Oklahoma (All-Time) ........................ 37-42-3 (.470)Series Record vs. Oklahoma (Big 12 Play) ...........................3-3 (.500)
Bill Callahan vs. Oklahoma....................................................0-2 (.000) 10/29/05 ...................................Oklahoma 31, Nebraska 24 11/13/04 ......................................Oklahoma 30, Nebraska 3
2006 RESULTS (9-3, 6-2 BIG 12)S2 Louisiana Tech ................................................. W, 49-10S9 Nicholls State................................................... W, 56-7S16 at USC ................................................................. L, 10-28S23 Troy ................................................................. W, 56-0S30 Kansas............................................................. W,39-32 (OT)O7 at at Iowa State.................................................... W, 28-14O14 at Kansas State ................................................... W, 21-3O21 Texas ............................................................... L, 20-22O28 at Oklahoma State ............................................... L, 29-41N4 Missouri ........................................................... W, 34-20N11 at Texas A&M....................................................... W, 28-27N24 Colorado .......................................................... W, 37-14D2 Dr Pepper Big 12 Championship, Kansas City, Mo. vs. Oklahoma ........................................................ 7:00 p.m.
- - PREVIEWING THE MATCHUP - -Nebraska (9-3, 6-2) vs. Oklahoma (10-2, 7-1)

Dr Pepper Big 12 Football Championship December 2, 2006Arrowhead Stadium, Kansas City, Missouri Page 4
- - PREVIEWING THE MATCHUP - -Nebraska (9-3, 6-2) vs. Oklahoma (10-2, 7-1)
SERIES NOTES
Oklahoma leads, 42-37-3 At Norman: Oklahoma leads, 22-16 At Lincoln: Nebraska leads, 21-18-2 Neutral Sites: Oklahoma leads, 2-0-1 1/1/78 - Oklahoma 31, Nebraska 24 (Miami, Fla.) 12/2/44 - Oklahoma 31, Nebraska 12 (Oklahoma City) 10/25/19 - Tied 7-7 (Omaha, Neb.) MATCHUP NOTEBOOK......Oklahoma (06, ‘04, ‘03, ‘02 ‘00) is playing in its league-leading fi fth and Nebraska (2006, ‘99, 97, ‘96) its fourth Dr Pepper Big 12 Championship, however the teams are facing each other for the fi rst time. NU made its previous three appearances prior to 2000 while OU’s previous appearances began in 2000.
NU joins Colorado and Texas as four-time participants in the championship game.
The Sooners lead the league with three conference crowns (2004, ‘02, ‘00) and the Huskers have two (1999, ‘97). UT also has won two championships (2005, ‘96) while Colorado (2001), Kansas State (2003) and Texas A&M (1998) have one each.
This marks the sixth time that the championship game participants have not played during the regular season. The fi ve “rematch” games were in 1999 (Nebraska-Texas), 2000 (Kansas State-Oklahoma), 2001 (Colorado-Texas), 2002 (Colorado-Oklahoma) and 2005 (Colorado-Texas). Oklahoma and Texas are the only teams to defeat an opponent twice in one season as OU downed K-State in 2000 and Colorado in 2002, and UT beat Colorado in 2005.
The South has a slight edge in the previous 10 title contests, holding a 6-4 advantage. North and South Teams alternated wins in the fi rst nine years of the game. The Texas win in 2005 gave the South a two-game win streak as Oklahoma came out on top in 2004.
The designated home team in each of the fi rst six Dr Pepper Big 12 Championship games (1996-01) was the winning squad. The visiting team has won three of the last four contests, including Texas last season. Nebraska is the visiting team for this year’s title event.
The Dr Pepper Big 12 Championship game has been held at fi ve different sites in its history. Kansas City’s Arrowhead Stadium is the game’s host for the fourth year and third time in the last four seasons. Arrowhead Stadium has hosted the event more than any other venue in the game’s 11-year history.
At least one participant in the game has been ranked among the top eight nationally in either the Associated Press or USA TODAY poll in each of the 11 Dr Pepper Big 12 Football Championships.
All-time, 21 of the 22 squads in the championship contest have been ranked at the time of the engagement. In addition, Texas jumped from unranked to No. 20 in the AP poll after upsetting then-No. 3 Nebraska, 37-27, in St. Louis in 1996.
TALE OF THE TAPE
Nebraska Oklahoma Avg. (Big 12/NCAA) Avg. (Big 12/NCAA)Rushing Offense 183.2 (4/18) 188.7 (3/14)Passing Offense 250.8 (4/18) 182.0 (11/80)Total Offense 434.0 (2/9) 370.7 (8/39)Scoring Offense 33.9 (3/9) 30.1 (5/23)Rushing Defense 126.9 (6/48) 99.0 (2/19)Passing Defense 219.8 (7/84) 174.1 (2/27)Total Defense 346.8 (8/71) 273.1 (14/77)Scoring Defense 18.2 (4/30) 16.0 (1/18)Punt Returns 8.4 (8/65) 8.5 (7/63)Net Punting 37.6 (3/14) 37.2 (6/24)Kickoff Returns 17.3 (11/114) 24.4 (4/9)Turnover Margin +4 (T4/38) -4 (9/79)
TOP PERFORMERS FROM 2006
NEBRASKA
Offense – Rushing: Brandon Jackson (12 G, 168-881 yards, 7 TD) Passing: Zac Taylor (12 G, 196-315-4-2,789 yards, 24 TD) Receiving: Terrence Nunn (12 G, 37-552 yards, 3 TD) Defense – Tackles: Stewart Bradley (12 G, 67, 35 solo) Sacks: Adam Carriker (12 G, 6-36 yards) Int.: Andrew Shanle (12 G, 3-19 yards)
Special Teams - Kickoff Returns: Brandon Jackson (7 returns, 121 yards, 19.2 avg.) Punt Returns: Terrence Nunn (18 returns, 153 yards, 8.5 avg.) Punting: Dan Titchener (54 punts, 2,145 yards, 39.7 avg.) Kicking: Jordan Congdon (5 FGM, 52 PAT, 67 points)
OKLAHOMA
Offense - Rushing: Allen Patrick (10 G, 143-665 yards, 3 TD) Passing: Paul Thompson (12 G, 166-270-7-2,169 yards, 18 TD) Receiving: Malcolm Kelly (12 G, 52-851 yards, 8 TD) Defense - Tackles: Rufus Alexander (12 G, 95, 55 solo) Sacks: Steven Coleman (12 G, 3-38 yards) Int.: Zach Latimer (12 G, 3-23 yards) Special Teams -
Kickoff Returns: Juaquin Iglesias (10 returns, 299 yards, 29.9 avg.) Punt Returns: Reggie Smith (31 returns, 260 yards, 8.4 avg.) Punting: Michael Cohen (37 punts, 1,559 yards, 42.1 avg.) Kicking: Garret Hartley (17 FGM, 42 PAT, 93 points)

Dr Pepper Big 12 Football Championship December 2, 2006Arrowhead Stadium, Kansas City, Missouri Page 5
CHAMPIONSHIP GAME TRENDS (1996-05)
Score At The End Of:(eventual winning team in bold)1st Quarter:1996 Texas 7, Nebraska 71997 Nebraska 16, Texas A&M 01998 Kansas State 10, Texas A&M 01999 Nebraska 10, Texas 02000 Oklahoma 3, Kansas State 02001 Colorado 7, Texas 72002 Oklahoma 7, Colorado 02003 Oklahoma 7, Kansas State 02004 Oklahoma 14, Colorado 02005 Texas 14, Colorado 0
1st Half:1996 Texas 20, Nebraska 171997 Nebraska 37, Texas A&M 31998 Kansas State 17, Texas A&M 61999 Nebraska 15, Texas 02000 Oklahoma 10, Kansas State 102001 Colorado 29, Texas 172002 Oklahoma 13, Colorado 02003 Kansas State 21, Oklahoma 72004 Oklahoma 28, Colorado 02005 Texas 42, Colorado 3
3rd Quarter:1996 Nebraska 24, Texas 231997 Nebraska 40, Texas A&M 31998 Kansas State 27, Texas A&M 121999 Nebraska 22, Texas 02000 Oklahoma 17, Kansas State 172001 Colorado 36, Texas 202002 Oklahoma 19, Colorado 72003 Kansas State 28, Oklahoma 72004 Oklahoma 35, Colorado 32005 Texas 70, Colorado 3
When Tied After 4th Quarter (Prior to overtime):1998 Kansas State 27, Texas A&M 27
When Tied After 1st Overtime:1998 Kansas State 30, Texas A&M 30
The Team With A Lead:After 1st Quarter Is: 6-2 (2 games tied)At Halftime Is: 8-1 (1 game tied)After 3rd Quarter Is: 7-2 (1 game tied)
Record For Team That:Scored First Points 7-3Has First Rushing TD 7-3Has First Passing TD 7-2 (No passing TDs in ‘99)Scored First Field Goal 6-3 (No fi eld goals in ‘03)Scored First Safety 1-0
Record For Team That Led In:1st Downs 6-43rd Down Conversions 6-2 (2 ties)Rushing Offense 8-2Passing Offense 6-4Total Offense 8-2Time of Possession 6-4Turnover Margin 6-2 (2 ties)
Ames, Iowa ____________228Austin, Texas ___________734Boulder, Colo. __________622College Station, Texas ____722Columbia, Mo. __________126Lawrence, Kan. __________40
MILEAGE CHART TO KANSAS CITY, MISSOURILincoln, Neb. ___________191Lubbock, Texas _________727Manhattan, Kan. ________121Norman, Okla. __________369Stillwater, Okla. _________315Waco, Texas ___________636
DR PEPPER BIG 12 FOOTBALL CHAMPIONSHIP SITES
1996 TWA Dome (St. Louis, Mo.)1997 Alamo Dome (San Antonio, Texas)1998 TWA Dome (St. Louis, Mo.)1999 Alamo Dome (San Antonio, Texas)2000 Arrowhead Stadium (Kansas City, Mo.)2001 Texas Stadium (Irving, Texas)2002 Reliant Stadium (Houston, Texas)2003 Arrowhead Stadium (Kansas City, Mo.)2004 Arrowhead Stadium (Kansas City, Mo.)2005 Reliant Stadium (Houston, Texas)Dec. 2, 2006 Arrowhead Stadium (Kansas City, Mo.)Dec. 1, 2007 Alamo Dome (San Antonio, Texas)
UNDEFEATED TEAMS FROM BIG 12 SCHOOLS
School Season RecordTexas 2005 13-0Oklahoma 2000 13-0Nebraska 1997 13-0
Nebraska 1995 12-0Nebraska 1994 13-0Oklahoma 1974 11-0Nebraska 1971 13-0Texas 1969 11-0Texas 1963 11-0Missouri 1960 11-0Oklahoma 1956 10-0Oklahoma 1955 11-0Oklahoma 1954 10-0Oklahoma 1949 11-0Oklahoma State 1945 9-0Texas A&M 1939 11-0Colorado 1923 9-0Texas 1920 9-0Texas A&M 1919 10-0Oklahoma 1918 6-0Texas 1918 9-0Texas A&M 1917 8-0Nebraka 1915 8-0Oklahoma 1915 10-0Colorado 1911 6-0Colorado 1910 6-0Colorado 1909 6-0Kansas 1908 9-0

Dr Pepper Big 12 Football Championship December 2, 2006Arrowhead Stadium, Kansas City, Missouri Page 6
TOTAL OFFENSE
PLAYS56 Michael Bishop, Kansas State vs. Texas A&M, 1998 (28 rush, 28 pass)55 Josh Heupel, Oklahoma vs. Kansas State, 2000 (11 rush, 44 pass)53 Jason White, Oklahoma vs. Kansas State, 2003 (3 rush, 50 pass)43 Branndon Stewart, Texas A&M vs. Nebraska, 1997 (5 rush, 38 pass)
YARDS GAINED442 Michael Bishop, Kansas State vs. Texas A&M, 1998 (101 rushing, 341 passing)360 James Brown, Texas vs. Nebraska, 1996 (7 rushing, 353 passing)300 Branndon Stewart, Texas A&M vs. Kansas State, 1998 (-24 rushing, 324 passing)292 Jason White, Oklahoma vs. Kansas State, 2003 (-6 rushing, 298 passing)
RUSHING
ATTEMPTS34 Ahman Green, Nebraska vs. Texas A&M, 199733 Chris Brown, Colorado vs. Texas, 200132 DeAngelo Evans, Nebraska vs. Texas, 199629 Quentin Griffi n, Oklahoma vs. Colorado, 2002
NET YARDS GAINED235 Darren Sproles, Kansas State vs. Oklahoma, 2003188 Quentin Griffi n, Oklahoma vs. Colorado, 2002182 Chris Brown, Colorado vs. Texas, 2001179 Ahman Green, Nebraska vs. Texas A&M, 1997
TOUCHDOWNS RUSHING3 Adrian Peterson, Oklahoma vs. Colorado, 20043 Chris Brown, Colorado vs. Texas, 20013 Ahman Green, Nebraska vs. Texas A&M, 19973 DeAngelo Evans, Nebraska vs. Texas, 19963 Priest Holmes, Texas vs. Nebraska, 1996
AVERAGE PER CARRY (Minimum 5 Attempts)13.3 Priest Holmes, Texas vs. Nebraska, 1996 (9 carries, 120 yards)10.7 Darren Sproles, Kansas State vs. Oklahoma, 2003 (22 carries, 235 yards) 8.9 Jamaal Charles, Texas vs. Colorado, 2005 (7 carries, 62 yards) 8.9 Bobby Purify, Colorado vs. Texas, 2001 (7 carries, 62 yards)
PASSING
YARDS PASSING353 James Brown, Texas vs. Nebraska, 1996 (28-19-2)341 Michael Bishop, Kansas State vs. Texas A&M, 1998 (28-19-1)324 Branndon Stewart, Texas A&M vs. Kansas State, 1998 (31-15-1)298 Jason White, Oklahoma vs. Kansas State, 2003 (50-27-2)
ATTEMPTS50 Jason White, Oklahoma vs. Kansas State, 2003 (27 comp.)44 Josh Heupel, Oklahoma vs. Kansas State, 2000 (24 comp.)42 Major Applewhite, Texas vs. Nebraska, 1999 (15 comp.)38 Branndon Stewart, Texas A&M vs. Nebraska, 1997 (18 comp.)
COMPLETIONS27 Jason White, Oklahoma vs. Kansas State, 2003 (50 att.)24 Josh Heupel, Oklahoma vs. Kansas State, 2000 (44 att.)22 Jason White, Oklahoma vs. Colorado, 2004 (29 att.)19 Michael Bishop, Kansas State vs. Texas A&M, 1998 (28 att.)19 James Brown, Texas vs. Nebraska, 1996 (28 att.)
YARDS PER COMPLETION(Minimum 10 Completions)22.7 Ell Roberson, Kansas State vs. Oklahoma, 2003 (10 for 227)21.6 Branndon Stewart, Texas A&M vs. Kansas State, 1998 (15 for 324)18.6 James Brown, Texas vs. Nebraska, 1996 (19 for 353)17.9 Michael Bishop, Kansas State vs. Texas A&M, 1998 (19 for 341)
YARDS PER ATTEMPT(Minimum 10 Attempts)13.4 Ell Roberson, Kansas State vs. Oklahoma, 2003 (17 for 227)12.6 James Brown, Texas vs. Nebraska, 1996 (28 for 353)12.2 Michael Bishop, Kansas State vs. Texas A&M, 1998 (28 for 341)11.4 Vince Young, Texas vs. Colorado, 2005 (17 for 193)
COMPLETION PERCENTAGE82.4 Vince Young, Texas vs. Colorado, 2005 (14 of 17)75.9 Jason White, Oklahoma vs. Colorado, 2004 (22 of 29)67.9 Michael Bishop, Kansas State vs. Texas A&M, 1998 (19 of 28)67.9 James Brown, Texas vs. Nebraska, 1996 (19 of 28)
LOWEST INTERCEPTION PCT. (Min. 5 Attempts)0.0 Nine Tied Last By: James Cox, Colorado vs. Texas, 2005 (0 of 8)
TOUCHDOWN PASSES4 Ell Roberson, Kansas State vs. Oklahoma, 20033 Vince Young, Texas vs. Colorado, 20053 Jason White, Oklahoma vs. Colorado, 20043 Branndon Stewart, Texas A&M vs. Kansas State, 1998
BIG 12 CHAMPIONSHIP GAME RECORDS (1996-2005)

Dr Pepper Big 12 Football Championship December 2, 2006Arrowhead Stadium, Kansas City, Missouri Page 7
RECEIVING
RECEPTIONS 8 Mark Clayton, Oklahoma vs. Colorado, 20048 Mark Clayton, Oklahoma vs. Kansas State, 20038 Will Peoples, Oklahoma vs. Kansas State, 20038 Trent Smith, Oklahoma vs. Kansas State, 2000
YARDS RECEIVING140 Darnell McDonald, Kansas State vs. Texas A&M, 1998107 B.J. Johnson, Texas vs. Colorado, 2001106 Mark Clayton, Oklahoma vs. Colorado, 2004104 Mark Clayton, Oklahoma vs. Kansas State, 2003
TOUCHDOWN RECEPTIONS2 Mark Clayton, Oklahoma vs. Colorado, 20042 B.J. Johnson, Texas vs. Colorado, 20012 Sirr Parker, Texas A&M vs. Kansas State, 1998
AVERAGE PER CATCH (Minimum 2 Receptions)32.0 Wane McGarity, Texas vs. Nebraska, 1996 (3 catches for 96 yards)31.5 James Terry, Kansas State vs. Oklahoma, 2003 (2 for 63)29.3 Darren Sproles, Kansas State vs. Oklahoma, 2003 (3 for 88)26.8 B.J. Johnson, Texas vs. Colorado, 2001 (4 for 107)
SCORING
POINTS18 Eight Tied Last By: Jamaal Charles, Texas vs. Colorado, 2005
TOUCHDOWNS3 Eight Tied Last By: Jamaal Charles, Texas vs. Colorado, 2005
EXTRA POINTS MADE10 David Pino, Texas vs. Colorado, 2005 6 Garrett Hartley, Oklahoma vs. Colorado, 2004 5 Joe Rheem, Kansas State vs. Oklahoma, 2003 5 Kris Brown, Nebraska vs. Texas A&M, 1997
EXTRA POINTS ATTEMPTED10 David Pino, Texas vs. Colorado, 2005 6 Garrett Hartley, Oklahoma vs. Colorado, 2004 5 Joe Rheem, Kansas State vs. Oklahoma, 2003 5 Kris Brown, Nebraska vs. Texas A&M, 1997
TWO-POINT CONVERSIONS MADE1 Sirr Parker, Texas A&M vs. Kansas State, 1998 (pass from Branndon Stewart)
TWO-POINT CONVERSION ATTEMPTS2 Branndon Stewart, Texas A&M vs. Nebraska, 19971 Four Tied Last By: Nate Hybl, Oklahoma vs. Colorado, 2002
FIELD GOALS MADE4 Martin Gramatica, Kansas State vs. Texas A&M, 1998 (5 attempts)4 Kris Brown, Nebraska vs. Texas A&M, 1997 (4 attempts)3 Dusty Mangum, Texas vs. Colorado, 2001 (4 attempts)3 Russell Bynum, Texas A&M vs. Kansas State, 1998 (3 attempts)3 Phil Dawson, Texas vs. Nebraska, 1996 (3 attempts)
FIELD GOALS ATTEMPTED5 Martin Gramatica, Kansas State vs. Texas A&M, 1998 (4 made)4 Dusty Mangum, Texas vs. Colorado, 2001 (3 made)4 Kris Brown, Nebraska vs. Texas A&M, 1997 (4 made)3 Four tied. Last By: Pat Brougham, Colorado vs. Oklahoma, 2002 (0 made)
PUNTING
HIGHEST AVERAGE47.8 Mark Mariscal, Colorado vs. Oklahoma, 2002 (6 for 287)47.6 Shane Lechler, Texas A&M vs. Nebraska, 1997 (7 for 333)46.8 Mark Mariscal, Colorado vs. Texas, 2001 (5 for 234)45.3 Shane Lechler, Texas A&M vs. Kansas State, 1998 (3 for 136)
MOST PUNTS9 John Torp, Colorado vs. Oklahoma, 20049 Dan Hadenfeldt, Nebraska vs. Texas, 19998 Ryan Long, Texas vs. Nebraska, 19997 Jared Brite, Kansas State vs. Oklahoma, 20037 Shane Lechler, Texas A&M vs. Nebraska, 1997
PUNT RETURNS
MOST RETURNS5 Antonio Perkins, Oklahoma vs. Kansas State, 2003 (1 yard)5 Antonio Perkins, Oklahoma vs. Colorado, 2002 (70 yards)4 Antonio Perkins, Oklahoma vs. Colorado, 2004 (16 yards)4 Nathan Vasher, Texas vs. Colorado, 2001 (54 yards)4 Courtnee Garcia, Texas vs. Nebraska, 1999 (32 yards)
YARDS90 Jeremy Bloom, Colorado vs. Oklahoma, 2002 (3 returns)70 Antonio Perkins, Oklahoma vs. Colorado, 2002 (5 returns)68 Aaron Lockett, Kansas State vs. Oklahoma, 2000 (2 returns)55 Bobby Newcombe, Nebraska vs. Texas A&M, 1997 (2 returns)
RETURN AVERAGE34.0 Aaron Lockett, Kansas State vs. Oklahoma, 2000 (2 for 68 yards)30.0 Jeremy Bloom, Colorado vs. Oklahoma, 2002 (3 for 90)27.5 Bobby Newcombe, Nebraska vs. Texas A&M, 1997 (2 for 55)26.0 Dante Hall, Texas A&M vs. Nebraska, 1997 (1 for 26)

Dr Pepper Big 12 Football Championship December 2, 2006Arrowhead Stadium, Kansas City, Missouri Page 8
RETURNS FOR TOUCHDOWNS1 Brandon Foster, Texas vs. Colorado, 2005 (0 yards, blocked punt)1 Jeremy Bloom, Colorado vs. Oklahoma, 2002 (80 yards)1 Aaron Lockett, Kansas State vs. Oklahoma, 2000 (58 yards)
KICKOFF RETURNS
MOST RETURNS6 Roman Hollowell, Colorado vs. Texas, 2001 (111 yards)5 Stephone Robinson, Colorado vs. Oklahoma, 2004 (92 yards)4 Victor Ike, Texas vs. Colorado, 2001 (117 yards)4 Aaron Lockett, Kansas State vs. Oklahoma, 2000 (99 yards)4 Damon Benning, Nebraska vs. Texas, 1996 (77 yards)
YARDS117 Victor Ike, Texas (4 returns) vs. Colorado, 2001111 Roman Hollowell, Colorado (6 returns) vs. Texas, 2001 99 Aaron Lockett, Kansas State (4 returns) vs. Oklahoma, 2000 92 Stephone Robinson, Colorado (5 returns) vs. Oklahoma, 2004
RETURN AVERAGE (Minimum 2 Returns)45.0 Roderick Sneed, Colorado vs. Texas, 2005 (2 for 90 yards)29.3 Victor Ike, Texas vs. Colorado, 2001 (4 for 111)26.7 Roderick Sneed, Colorado vs. Oklahoma, 2002 (3 for 80)24.3 Aaron Lockett, Kansas State vs. Oklahoma, 2000 (4 for 99)
RETURNS FOR TOUCHDOWNSNone
PASS INTERCEPTIONS
MOST INTERCEPTIONS1 22 Tied Last By: Tarell Brown, Colorado vs. Texas, 2005
RETURN YARDS73 Aaron Killion, Colorado vs. Texas, 200164 Medford Moorer, Colorado vs. Texas, 200154 Roderick Babers, Texas vs. Colorado, 200137 Dion Booker, Nebraska vs. Texas, 1999
RETURN AVERAGE73.0 Aaron Killion, Colorado vs. Texas, 2001 (1 for 73 yards)64.0 Medford Moorer, Colorado vs. Texas, 2001 (1 for 64)54.0 Roderick Babers, Texas vs. Colorado, 2001 (1 for 54)37.0 Dion Booker, Nebraska vs. Texas, 1999 (1 for 37)
RETURNS FOR TOUCHDOWNS1 Four Tied Last By: Ted Sims, Kansas State vs. Oklahoma, 2003 (27 yards)
DEFENSIVE RECORDS
TACKLES17 Dat Nguyen (9 UT), Texas A&M vs. Kansas State, 199816 Ahmad Brooks (6 UT), Texas vs. Colorado, 200114 Dusty Renfro (12 UT), Texas vs. Nebraska, 199614 Drew Wahlroos (6 UT), Colorado vs. Oklahoma, 2002
TACKLES FOR LOSS5 Teddy Lehman, Oklahoma vs. Kansas State, 2003 (-10 yards)4 Aaron Humphrey, Texas vs. Nebraska, 1999 (-15 yards)3 Eight Tied Last By: Jordan Dizon, Colorado vs. Texas, 2005 (-3 yards)
QUARTERBACK SACKS2 Marcus Tubbs, Texas vs. Colorado, 2001 (-16 yards)2 Loran Kaiser, Nebraska vs. Texas, 1999 (-13 yards)2 Ben Leber, Kansas State vs. Texas A&M, 1998 (-12 yards)
FUMBLE RECOVERIES1 15 Tied Last By: Lorenzo Sims, Colorado vs. Oklahoma, 2004
PASS DEFLECTIONS4 Rashad Washington, Kansas State vs. Oklahoma, 20034 Michael Thompson, Oklahoma vs. Kansas State, 20004 Ralph Brown, Nebraska vs. Texas, 19993 Lawrence Dampeer, Oklahoma vs. Colorado, 20043 Dyshod Carter, Kansas State vs. Oklahoma, 2000
LONG PLAYS80 Jeremy Bloom (punt return), Colorado vs. Oklahoma, 200279 Major Applewhite to B.J. Johnson (pass), Texas vs. Colorado, 200173 Aaron Killion (interception return), Colorado vs. Texas, 200169 Roderick Sneed (kickoff return) Colorado vs. Oklahoma, 200367 Shane Lechler (punt), Texas A&M vs. Nebraska, 199766 Michael Bishop to Darnell McDonald (pass), Kansas State vs. Texas, 199866 James Brown to Wane McGarity (pass), Texas vs. Nebraska, 199664 Medford Moorer (interception return), Colorado vs. Texas, 200163 Darren Sproles (rush), Kansas State vs. Oklahoma, 200363 Ell Roberson to James Terry (pass), Kansas State vs. Oklahoma, 200361 James Brown to Derek Lewis (pass), Texas vs. Nebraska, 199661 Priest Holmes (rush), Texas vs. Nebraska, 199658 Aaron Lockett (punt return), Kansas State vs. Oklahoma, 200057 Shane Lechler (punt), Texas A&M vs. Kansas State, 199856 Jared Brite (punt), Kansas State vs. Oklahoma, 200355 Correll Buckhalter (rush), Nebraska vs. Texas, 199954 Ramonce Taylor (kickoff return), Texas vs. Colorado, 200550 Dusty Mangum (longest fi eld goal), Texas vs. Colorado, 2001
Dr Pepper Big 12 Football Championship December 2, 2006Arrowhead Stadium, Kansas City, Missouri Page 9
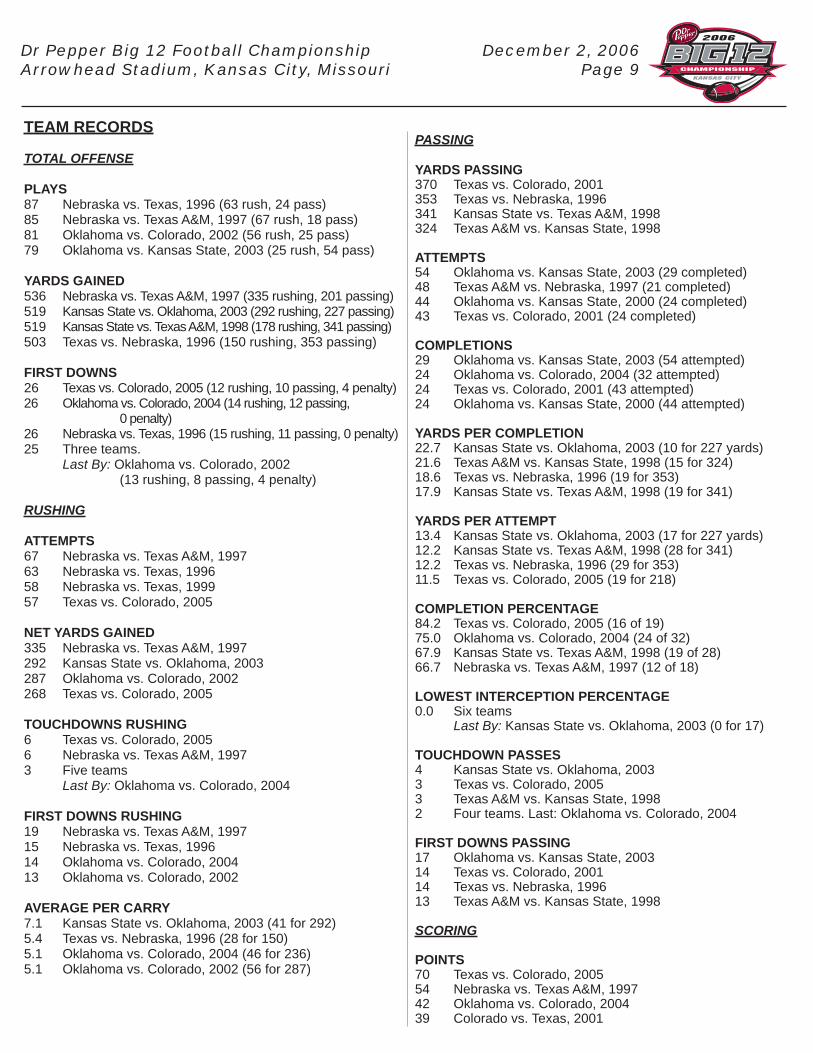
TEAM RECORDS
TOTAL OFFENSE
PLAYS87 Nebraska vs. Texas, 1996 (63 rush, 24 pass)85 Nebraska vs. Texas A&M, 1997 (67 rush, 18 pass)81 Oklahoma vs. Colorado, 2002 (56 rush, 25 pass)79 Oklahoma vs. Kansas State, 2003 (25 rush, 54 pass)
YARDS GAINED536 Nebraska vs. Texas A&M, 1997 (335 rushing, 201 passing)519 Kansas State vs. Oklahoma, 2003 (292 rushing, 227 passing)519 Kansas State vs. Texas A&M, 1998 (178 rushing, 341 passing)503 Texas vs. Nebraska, 1996 (150 rushing, 353 passing)
FIRST DOWNS26 Texas vs. Colorado, 2005 (12 rushing, 10 passing, 4 penalty)26 Oklahoma vs. Colorado, 2004 (14 rushing, 12 passing, 0 penalty)26 Nebraska vs. Texas, 1996 (15 rushing, 11 passing, 0 penalty)25 Three teams. Last By: Oklahoma vs. Colorado, 2002 (13 rushing, 8 passing, 4 penalty)
RUSHING
ATTEMPTS67 Nebraska vs. Texas A&M, 199763 Nebraska vs. Texas, 199658 Nebraska vs. Texas, 199957 Texas vs. Colorado, 2005
NET YARDS GAINED335 Nebraska vs. Texas A&M, 1997292 Kansas State vs. Oklahoma, 2003287 Oklahoma vs. Colorado, 2002268 Texas vs. Colorado, 2005
TOUCHDOWNS RUSHING6 Texas vs. Colorado, 20056 Nebraska vs. Texas A&M, 19973 Five teams Last By: Oklahoma vs. Colorado, 2004
FIRST DOWNS RUSHING19 Nebraska vs. Texas A&M, 199715 Nebraska vs. Texas, 199614 Oklahoma vs. Colorado, 200413 Oklahoma vs. Colorado, 2002
AVERAGE PER CARRY7.1 Kansas State vs. Oklahoma, 2003 (41 for 292)5.4 Texas vs. Nebraska, 1996 (28 for 150)5.1 Oklahoma vs. Colorado, 2004 (46 for 236)5.1 Oklahoma vs. Colorado, 2002 (56 for 287)
PASSING
YARDS PASSING370 Texas vs. Colorado, 2001353 Texas vs. Nebraska, 1996341 Kansas State vs. Texas A&M, 1998324 Texas A&M vs. Kansas State, 1998
ATTEMPTS54 Oklahoma vs. Kansas State, 2003 (29 completed)48 Texas A&M vs. Nebraska, 1997 (21 completed)44 Oklahoma vs. Kansas State, 2000 (24 completed)43 Texas vs. Colorado, 2001 (24 completed)
COMPLETIONS29 Oklahoma vs. Kansas State, 2003 (54 attempted)24 Oklahoma vs. Colorado, 2004 (32 attempted)24 Texas vs. Colorado, 2001 (43 attempted)24 Oklahoma vs. Kansas State, 2000 (44 attempted)
YARDS PER COMPLETION22.7 Kansas State vs. Oklahoma, 2003 (10 for 227 yards)21.6 Texas A&M vs. Kansas State, 1998 (15 for 324)18.6 Texas vs. Nebraska, 1996 (19 for 353)17.9 Kansas State vs. Texas A&M, 1998 (19 for 341)
YARDS PER ATTEMPT13.4 Kansas State vs. Oklahoma, 2003 (17 for 227 yards)12.2 Kansas State vs. Texas A&M, 1998 (28 for 341)12.2 Texas vs. Nebraska, 1996 (29 for 353)11.5 Texas vs. Colorado, 2005 (19 for 218)
COMPLETION PERCENTAGE84.2 Texas vs. Colorado, 2005 (16 of 19)75.0 Oklahoma vs. Colorado, 2004 (24 of 32)67.9 Kansas State vs. Texas A&M, 1998 (19 of 28)66.7 Nebraska vs. Texas A&M, 1997 (12 of 18)
LOWEST INTERCEPTION PERCENTAGE0.0 Six teams Last By: Kansas State vs. Oklahoma, 2003 (0 for 17)
TOUCHDOWN PASSES4 Kansas State vs. Oklahoma, 20033 Texas vs. Colorado, 20053 Texas A&M vs. Kansas State, 19982 Four teams. Last: Oklahoma vs. Colorado, 2004
FIRST DOWNS PASSING17 Oklahoma vs. Kansas State, 200314 Texas vs. Colorado, 200114 Texas vs. Nebraska, 199613 Texas A&M vs. Kansas State, 1998
SCORING
POINTS70 Texas vs. Colorado, 200554 Nebraska vs. Texas A&M, 199742 Oklahoma vs. Colorado, 200439 Colorado vs. Texas, 2001

Dr Pepper Big 12 Football Championship December 2, 2006Arrowhead Stadium, Kansas City, Missouri Page 10
TOUCHDOWNS10 Texas vs. Colorado, 2005 6 Oklahoma vs. Colorado, 2004 6 Nebraska vs. Texas A&M, 1997 5 Kansas State vs. Oklahoma, 2003 5 Colorado vs. Texas, 2001
EXTRA POINTS MADE10 Texas vs. Colorado, 2005 6 Oklahoma vs. Colorado, 2004 6 Nebraska vs. Texas A&M, 1997 5 Kansas State vs. Oklahoma, 2003
EXTRA POINTS ATTEMPTED10 Texas vs. Colorado, 2005 6 Oklahoma vs. Colorado, 2004 6 Colorado vs. Texas, 2001 6 Nebraska vs. Texas A&M, 1997
TWO-POINT CONVERSIONS MADE1 Texas A&M vs. Kansas State, 1998
TWO-POINT CONVERSION ATTEMPTS2 Texas A&M vs. Nebraska, 19971 Colorado vs. Texas, 20011 Texas vs. Nebraska, 19991 Texas A&M vs. Kansas State, 19981 Oklahoma vs. Colorado, 2002
SAFETIES1 Nebraska vs. Texas, 1999
FIELD GOALS MADE4 Kansas State vs. Texas A&M, 1998 (5 attempts)4 Nebraska vs. Texas A&M, 1997 (4 attempts)3 Texas vs. Colorado, 2001 (4 attempts)3 Texas A&M vs. Kansas State, 1998 (3 attempts)3 Texas vs. Nebraska, 1996 (3 attempts)
FIELD GOALS ATTEMPTED5 Kansas State vs. Texas A&M, 1998 (4 made)4 Texas vs. Colorado, 2001 (3 made)4 Nebraska vs. Texas A&M, 1997 (4 made)3 Four tied. Last: Colorado vs. Oklahoma, 2002 (0 made)
PUNTING
HIGHEST AVERAGE47.6 Texas A&M vs. Nebraska, 1997 (7 for 333)46.8 Colorado vs. Texas, 2001 (5 for 234)46.4 Colorado vs. Oklahoma, 2002 (7 for 325)45.3 Texas A&M vs. Kansas State, 1998 (3 for 136)
MOST PUNTS10 Texas vs. Nebraska, 19999 Colorado vs. Oklahoma, 20049 Kansas State vs. Oklahoma, 20009 Nebraska vs. Texas, 1999
FEWEST PUNTS1 Texas vs. Nebraska, 19962 Texas vs. Colorado, 20052 Kansas State vs. Texas A&M, 19982 Nebraska vs. Texas A&M, 1997
PUNT RETURNS
YARDS90 Colorado vs. Oklahoma, 2002 (3 returns)75 Kansas State vs. Oklahoma, 2000 (3 returns)74 Nebraska vs. Texas, 1999 (6 returns)70 Oklahoma vs. Colorado, 2002 (5 returns)
MOST RETURNS6 Nebraska vs. Texas, 1999 (74 yards)6 Texas vs. Nebraska, 1999 (44 yards)5 Oklahoma vs. Kansas State, 2003 (1 yard)5 Oklahoma vs. Colorado, 2002 (70 yards)
RETURNS FOR TOUCHDOWNS1 Colorado vs. Oklahoma, 2002 (80 yards)1 Kansas State vs. Oklahoma, 2000 (58 yards)
KICKOFF RETURNS
YARDS131 Kansas State vs. Oklahoma, 2000 (6 returns)123 Oklahoma vs. Kansas State, 2003 (6 returns)122 Colorado vs. Texas, 2001 (7 returns)117 Texas vs. Colorado, 2001 (4 returns)
MOST RETURNS7 Colorado vs. Texas, 2001 (122 yards)6 Colorado vs. Oklahoma, 2004 (105 yards)6 Oklahoma vs. Kansas State, 2003 (123 yards)6 Kansas State vs. Oklahoma, 2000 (131 yards)
RETURNS FOR TOUCHDOWNSNone
FUMBLES
MOST FUMBLES5 Kansas State vs. Texas A&M, 1998 (4 lost)5 Nebraska vs. Texas A&M, 1997 (4 lost)4 Colorado vs. Texas, 2005 (3 lost)3 Colorado vs. Oklahoma, 2002 (0 lost)3 Nebraska vs. Texas, 1996 (2 lost)
MOST FUMBLES LOST4 Nebraska vs. Texas A&M, 1997 (5 fumbles)3 Colorado vs. Texas, 2005 (4 fumbles)2 Nebraska vs. Texas, 1999 (2 fumbles)2 Nebraska vs. Texas, 1996 (3 fumbles)
FEWEST FUMBLES0 Nine teams Last By: Texas vs. Colorado, 2005 (0 lost)

Dr Pepper Big 12 Football Championship December 2, 2006Arrowhead Stadium, Kansas City, Missouri Page 11
FEWEST FUMBLES LOST0 10 teams Last By: Texas vs. Colorado, 2005 (0 fumbles)
PENALTIES
FEWEST PENALTIES4 Five teams Last By: Oklahoma vs. Kansas State, 2003 (30 yards)
FEWEST YARDS PENALIZED20 Nebraska vs. Texas, 1999 (4 penalties)22 Texas vs. Nebraska, 1999 (4 penalties)24 Texas vs. Nebraska, 1996 (4 penalties)30 Oklahoma vs. Kansas State, 2003 (3 penalties)30 Oklahoma vs. Kansas State, 2000 (4 penalties)
MOST PENALTIES13 Kansas State vs. Texas A&M, 1998 (110 yards)11 Texas vs. Colorado, 2005 (93 yards)10 Colorado vs. Texas, 2001 (60 yards)9 Oklahoma vs. Colorado, 2004 (90 yards)9 Kansas State vs. Oklahoma, 2003 (61 yards)
MOST YARDS PENALIZED110 Kansas State vs. Texas A&M, 1998 (13 penalties)93 Texas vs. Colorado, 2005 (11 penalties)90 Oklahoma vs. Colorado, 2004 (9 penalties)74 Colorado vs. Texas, 2005 (8 penalties)
TOTAL DEFENSE
FEWEST PLAYS ALLOWED44 Oklahoma vs. Colorado, 2004 (16 rush, 28 pass)47 Oklahoma vs. Colorado, 2002 (32 rush, 15 pass)57 Nebraska vs. Texas, 1996 (28 rush, 29 pass)58 Colorado vs. Texas, 2005 (26 rush, 32 pass)58 Oklahoma vs. Kansas State, 2003 (41 rush, 17 pass)
FEWEST YARDS ALLOWED46 Oklahoma vs. Colorado, 2004 (44 plays)178 Nebraska vs. Texas, 1999 (72 plays)191 Texas vs. Colorado, 2005 (58 plays)193 Oklahoma vs. Colorado, 2002 (47 plays)
FEWEST YARDS PER PLAY1.0 Oklahoma vs. Colorado, 2004 (44 plays, 46 yards)2.4 Nebraska vs. Texas, 1999 (72 plays, 178 yards)3.3 Texas vs. Colorado, 2005 (58 plays, 191 yards)3.6 Oklahoma vs. Kansas State, 2000 (66 plays, 239 yards)
FEWEST DEFENSIVE TOUCHDOWNS ALLOWED0 Texas vs. Colorado, 20050 Oklahoma vs. Colorado, 20040 Oklahoma vs. Colorado, 20020 Nebraska vs. Texas, 1999
RUSHING DEFENSE
FEWEST PLAYS ALLOWED16 Oklahoma vs. Colorado, 2004 (-4 yards)23 Colorado vs. Texas, 2001 (92 yards)23 Nebraska vs. Texas A&M, 1997 (13 yards)25 Kansas State vs. Oklahoma, 2003 (83 yards)
FEWEST YARDS ALLOWED-4 Oklahoma vs. Colorado, 2004 (16 plays) 6 Nebraska vs. Texas, 1999 (30 plays)13 Nebraska vs. Texas A&M, 1997 (23 plays)82 Texas vs. Colorado, 2005 (26 plays)
FEWEST TOUCHDOWNS ALLOWED0 Texas vs. Colorado, 20050 Oklahoma vs. Colorado, 20040 Oklahoma vs. Colorado, 20020 Nebraska vs. Texas, 1999
FEWEST RUSHING YARDS PER PLAY-0.3 Oklahoma vs. Colorado, 2004 (16 plays, -4 yards)0.2 Nebraska vs. Texas, 1999 (30 plays, 6 yards)0.6 Nebraska vs. Texas A&M, 1997 (23 plays, 13 yards)3.1 Kansas State vs. Texas A&M, 1998 (41 plays, 128 yards)
PASS DEFENSE
FEWEST COMPLETIONS ALLOWED6 Oklahoma vs. Colorado, 2002 (6 for 15)6 Texas vs. Nebraska, 1999 (6 for 15)9 Oklahoma vs. Colorado, 2004 (9 for 28)10 Oklahoma vs. Kansas State, 2003 (10 for 17)
FEWEST YARDS ALLOWED50 Oklahoma vs. Colorado, 2004 (28 passes)55 Texas vs. Nebraska, 1999 (15 passes)67 Oklahoma vs. Colorado, 2002 (15 passes)106 Oklahoma vs. Kansas State, 2000 (28 passes)
FEWEST TOUCHDOWNS ALLOWED0 Eight teams Last By: Texas vs. Colorado, 2005
FEWEST PASSING YARDS PER COMPLETION5.6 Oklahoma vs. Colorado, 2004 (9 passes, 50 yards)7.3 Texas vs. Colorado, 2005 (15 passes, 109 yards)8.1 Colorado vs. Oklahoma, 2002 (14 passes, 114 yards)8.4 Oklahoma vs. Kansas State, 2000 (12 passes, 105
COMPOSITE ATTENDANCE
1996 - 63,1091997 - 64,8241998 - 60,7981999 - 65,0352000 - 79,6552001 - 66,675
2002 - 63,3322003 - 79,4602004 - 62,1302005 - 71,707Total - 675,725(Average - 67,573)

Dr Pepper Big 12 Football Championship December 2, 2006Arrowhead Stadium, Kansas City, Missouri Page 12
BIG 12 ALL-TIME BOWL RECORDS
School All-Time Record Since 1996 First Appearance Latest AppearanceBaylor 8-8 0-0 1949 Dixie 1994 Alamo Bowl (Washington State 10, Baylor 3)Colorado 12-15 4-3 1938 Cotton 2005 Champs Sports Bowl (Clemson 19, Colorado 10)Iowa State 2-7 2-3 1971 Sun 2005 Houston Bowl (TCU 27, Iowa State 24)Kansas 4-6 1-1 1948 Orange 2005 Fort Worth Bowl (Kansas 42, Houston 13)Kansas State 6-6 4-4 1982 Independence 2004 Fiesta Bowl (Ohio State 35, Kansas State 28)Missouri 10-13 2-2 1924 Los Angeles 2005 Independence Bowl (Missouri 38, South Carolina 31) Christmas FestivalNebraska 22-21 6-3 1941 Rose 2005 Alamo Bowl (Nebraska 32, Michigan 28)Oklahoma 24-14-1 4-3 1939 Orange 2005 Holiday Bowl (Oklahoma 17, Oregon 14)Oklahoma State 10-6 1-3 1945 Cotton 2004 Alamo Bowl (Ohio State 33, Oklahoma State 7)Texas 22-21-2 5-4 1943 Cotton 2006 Rose Bowl (Texas 41, USC 38)Texas A&M 13-15 1-5 1922 Dixie Classic 2005 Cotton Bowl (Tennessee 38, Texas A&M 7)Texas Tech 8-20-1 3-5 1938 Sun 2006 Cotton Bowl (Alabama 13, Texas Tech 10)Totals 141-152-4 33-36
2006-07 FOOTBALL BOWL LINEUP Bowl Date / Time (ET) Site Participants TVSan Diego Co. Credit Union Poinsettia Dec. 19 / 8:00 p.m. San Diego, Calif. Mountain West vs. At-Large ESPN2GMAC Dec. 20 / 8:00 p.m. Mobile, Ala. Conference USA vs. MAC/WAC ESPNPioneer PureVision Las Vegas Dec. 21 / 8:00 p.m. Las Vegas, Nev. BYU vs. Pac-10 ESPNNew Orleans Dec. 22 / 8:00 p.m. New Orleans, La. Sun Belt vs. Conference USA ESPN2Birmingham Dec. 23 / 1:00 p.m. Birmingham, Ala. Big East vs. Conference USA ESPN2New Mexico Dec. 23 / 4:30 p.m. Albuquerque, N.M. Mountain West vs. WAC ESPNFort Worth Dec. 23 / 8:00 p.m. Fort Worth, Texas Conference USA vs. Mountain West ESPNSheraton Hawaii Dec. 24 / 8:00 p.m. Honolulu, Hawaii Pac-10 vs. Hawaii ESPNMotor City Dec. 26 / 7:30 p.m. Detroit, Mich. MAC vs. Big Ten ESPN Independence Dec. 27 / 4:30 p.m. Shreveport, La. Big 12 vs. SEC ESPNEmerald Dec. 27 / 8:00 p.m. San Francisco, Calif. Pac-10 vs. ACC ESPNTexas Dec. 28 / 8:00 p.m. Houston, Texas Big 12 vs. Big East NFLPacifi c Life Holiday Dec. 28 / 8:00 p.m. San Diego, Calif. Big 12 vs. Pac-10 ESPNGaylord Hotels Music City Dec. 29 / 1:00 p.m. Nashville, Tenn. ACC vs. SEC ESPNVitalis Sun Dec. 29 / 2:00 p.m. El Paso, Texas Big 12/Big East/Notre Dame vs. Pac-10 CBSAutoZone Liberty Dec. 29 / 3:30 p.m. Memphis, Tenn. Conference USA vs. SEC ESPNInsight Dec. 29 / 7:30 p.m. Tempe, Ariz. Big 12 vs. Minnesota NFLChamps Sports Dec. 29 / 8:00 p.m. Orlando, Fla. Purdue vs. ACC ESPNMeineke Car Care Dec. 30 / 1:00 p.m. Charlotte, N.C. ACC vs. Navy ESPNMasterCard Alamo Dec. 30 / 3:30 p.m. San Antonio, Texas Big 12 vs. Iowa ESPNChick-fi l-A Dec. 30 / 8:00 p.m. Atlanta, Ga. ACC vs. SEC ESPNMPC Computers Dec. 31 / 7:30 p.m. Boise, Idaho ACC vs. WAC ESPNOutback Jan. 1 / 11:00 a.m. Tampa, Fla. Penn State vs. SEC ESPNAT&T Cotton Jan. 1 / 11:30 a.m. Dallas, Texas Big 12 vs. SEC FOXToyota Gator Jan. 1 / 1:00 p.m. Jacksonville, Fla. ACC vs. Big 12/Big East/Notre Dame CBSCapital One Jan. 1 / 1:00 p.m. Orlando, Fla. Wisconsin vs. SEC ABCRose presented by Citi Jan. 1 / 5:00 p.m. Pasadena, Calif. BCS vs. BCS ABCTostitos Fiesta Jan. 1 / 8:30 p.m. Tempe, Ariz. BCS vs. BCS FOXFedEx Orange Jan. 2 / 8:00 p.m. Miami, Fla. BCS vs. BCS FOXAllstate Sugar Jan. 3 / 8:00 p.m. New Orleans, La. BCS vs. BCS FOXInternational Jan. 6 / Noon Toronto, Canada Big East vs. MAC ESPN2BCS National Championship Jan. 8 / 8:00 p.m. Phoenix, Ariz. BCS #1 vs. BCS #2 FOX(All Times Eastern; Teams listed in place of conference names have accepted bids as of November 2006)

Dr Pepper Big 12 Football Championship December 2, 2006Arrowhead Stadium, Kansas City, Missouri Page 13
CoSIDA Academic All-District VIFirst Team Daniel Sepulveda, Baylor, P Grant Walker, Texas Tech, WR Todd Walker, Texas Tech, WR
CoSIDA Academic All-District VIIFirst Team Jonathan Lamb, Kansas, WR Russell Brorsen, Kansas, DE
AFCA Good Works Team Dane Todd, Nebraska, FB Jacob Gutierrez, Oklahoma, RB
BIG 12 NATIONAL POSTSEASON HONORS(as of November 27, 2006)
Davey O’Brien AwardSemifi nalists - Bobby Reid, Oklahoma State, QB Colt McCoy, Texas, QB
Fred Biletnikoff AwardSemifi nalist - Adarius Bowman, Oklahoma State, WR
George Munger AwardSemifi nalist- Mack Brown, Texas, Coach
Jim Thorpe AwardFinalist - Aaron Ross, Texas, DB
John L. Toner Award DeLoss Dodd, Texas, AD
Johnny Unitas Golden Arm AwardSemifi nalists - Bobby Reid, Oklahoma State, QB Colt McCoy, Texas, QB
Liberty Mutual Coach of the Year Award Semifi nalists Bob Stoops, Oklahoma, Coach Mack Brown, Texas, Coach
Outland TrophyFinalist Justin Blalock, Texas, OT
Lou Groza Placekicking AwardSemifi nalists - Mason Crosby, Colorado, PK Jeff Wolfert, Missouri, PKFinalist - Garrett Hartley, Oklahoma, PK
Maxwell AwardSemifi nalist - Adrian Peterson, Oklahoma, RB
Ray Guy AwardFinalist - Daniel Sepulveda, Baylor, P
Rotary Lombardi TrophySemifi nalist - Justin Blalock, Texas, OT Brian Smith, Missouri, DEFinalist Justin Blalock, Texas, OT
Wuerffel TrophyFinalist - Carl Pendleton, Oklahoma, DT
MAJOR NATIONAL AWARDS FINALISTS & SEMIFINALISTS
DID YOU KNOW?? . . . . BIG 12 FOOTBALL
Through 2005, the Big 12 has sent eight teams to bowl games in four of the last fi ve seasons. With nine bowl eligible teams in 2006, the league will also fi ll all eight of its bowl slots this season.
From 2000-05, Big 12 teams have participated in 46 bowl games.
The Big 12 has had a team in the BCS National Championship game fi ve times in the past six years, including the last three, and won two titles.
For the third consecutive year, fi ve teams from one division are bowl-eligible. This year fi ve teams from the South Division have six wins, preceeded by fi ve from the North last season and fi ve from the South in 2004.
All-time, the South Division is 108-90 vs. the North, including a 13-5 mark in 2006.
The South Division held an average score advantage of 29.1-to-23.4 vs. the North in the 18 games played this season.
All-time, 21 of the 22 Big 12 Championship game participants have been nationally-ranked.
Average attendance at member institutions this season was 57,790 for 81 games, marking the third straight year the average has been over 57,000 and the second-highest average in conference history behind last year’s 58,397.
Doak Walker AwardSemifi nalist - Adrian Peterson, Oklahoma, RB
Ted Hendricks Defensive End AwardFinalist - Tim Crowder, Texas, DE

Dr Pepper Big 12 Football Championship December 2, 2006Arrowhead Stadium, Kansas City, Missouri Page 14
AT&T ALL-BIG 12 SECOND TEAMOFFENSEPos. Player, School, ClassQB Chase Daniel, Missouri, So.RB Jorvorskie Lane, Texas A&M, So.RB Brandon Jackson, Nebraska, Jr.FB Brandon McAnderson, Kansas, Jr.FB Chris Alexander, Texas A&M, Jr.WR Malcolm Kelly, Oklahoma, So.WR Maurice Purify, Nebraska, Jr.WR Dominique Zeigler, Baylor, Sr.TE Martellus Bennett, Texas A&M, So.TE Chase Coffman, Missouri, So.OL Scott Stephenson, Iowa State, Sr.OL David Ochoa, Kansas, Sr.OL Cody Wallace, Texas A&M, Jr.OL Lyle Sendlein, Texas, Sr.OL Glenn January, Texas Tech, Sr.PK Garrett Hartley, Oklahoma, Jr.KR/PR Aaron Ross, Texas, Sr.
DEFENSEDL Keyunta Dawson, Texas Tech, Sr.DL Brian Smith, Missouri, Sr.DL Tim Crowder, Texas, Sr.DL Victor DeGrate, Oklahoma State, Sr.DL Jay Moore, Nebraska, Sr.LB Brandon Archer, Kansas State, Sr.LB Alvin Bowen, Iowa State, Jr. LB Joe Pawelek, Baylor, Fr.DB Marcus Watts, Kansas State, Jr.DB Marcus Walker, Oklahoma, Jr.DB David Overstreet, Missouri, Sr.DB Nic Harris, Oklahoma, So.DB Reggie Smith, Oklahoma, So.P Matt Fodge, Oklahoma State, So.
Ties in the voting created additional positions on the second team for fullback and tight end.
AT&T ALL-BIG 12 HONORABLE MENTIONBaylor: Anthony Arline, DB; Shawn Bell, QB; Dwain Crawford, DB; Ryan Havens, PK; Maurice Linguist, DB; Trent Shelton, WR; C.J. Wilson, DB;Colorado: Brian Daniels, OL; Jordon Dizon, LB; George Hypolite, DL; Thaddaeus Washington, LB; Iowa State: Ryan Baum, PR/KR; Todd Blythe, WR; Aaron Brant, OL; Brent Curvey, DL; Shawn Moorehead, DL; Kansas: Jerome Kemp, DB; James McClinton, DL; Mike Rivera, LB; Bob Whitaker, OL; Kansas State: Zach Diles, LB; Yamon Figurs, WR; Rob Jackson, DL; Jermaine Moreira, WR; Leon Patton, PR/KR; Jeff Snodgrass, PK; Greg Wafford, OL; Kyle Williams, DB; Missouri: Will Franklin, WR; Xzavie Jackson, DL; Darnell Terrell, DB; Tony Temple, RB; Lorenzo Williams, DL; Dedrick Harrington, LB; Jeff Wolfert, PK; Nebraska: Stewart Bradley, LB; Brett Byford, OL; Cortney Grixby, DB; Marlon Lucky, RB; Corey McKeon, LB; Andrew Shanle, DB; Matt Slauson, OL; Oklahoma: Steven Coleman, DL; Brody Eldridge, FB; Joe Jon Finley, TE; Lendy Holmes, DB; Zach Latimer, LB; Allen Patrick, RB; George Robinson, OL; Reggie Smith, PR/KR; Paul Thompson, QB; Brandon Walker, OL; Darien Williams, DB; Oklahoma State: Perrish Cox, PR/KR; Nathan Peterson, DL; Brandon Pettigrew, TE; Andre Sexton, DB; D’Juan Woods, WR; Texas: Billy Pittman, WR; Tony Hills, OL; Colt McCoy, QB; Brian Robison, DL; Texas A&M: Justin Brantly, P; Mike Goodson, RB; Kirk Elder, OL; Chris Harrington, DL; Stephen McGee, QB; Chad Schroeder, WR; Misi Tupe, LB; Justin Warren, LB; Texas Tech: Joe Garcia, DB; Graham Harrell, QB; Chris Hudler, DL; Manuel Ramirez, OL; Jake Ratliff, DL; Alex Reyes, P; Brock Stratton, LB; Louis Vasquez, OL; Shannon Woods, RB
AT&T ALL-BIG 12 FIRST TEAMOFFENSEPos. Player, School, ClassQB Zac Taylor, Nebraska, Sr.RB Jon Cornish, Kansas, Sr.RB Adrian Peterson, Oklahoma, Jr. [3r]FB Dane Todd, Nebraska, Sr.WR Adarius Bowman, Oklahoma State, Jr.WR Joel Filani, Texas Tech, Sr. [r]WR Limas Sweed, Texas, Jr.TE Martin Rucker, Missouri, Jr.OL Justin Blalock, Texas, Sr. [3r]OL Kasey Studdard, Texas, Sr.OL Corey Hilliard, Oklahoma State, Sr.OL Joel Clinger, Missouri, Sr.OL Chris Messner, Oklahoma, Sr.PK Mason Crosby, Colorado, Jr. [3r]KR/PR Yamon Figurs, Kansas State, Sr.
DEFENSEDL C.J. Ah You, Oklahoma, Sr.DL Adam Carriker, Nebraska, Sr.DL Ian Campbell, Kansas State, So.DL Abraham Wright, Colorado, Sr.DL Larry Birdine, Oklahoma, Sr.LB Rufus Alexander, Oklahoma, Sr. [r]LB Marcus Bacon, Missouri, Sr.LB Bo Ruud, Nebraska, Jr. DB Michael Griffi n, Texas, Sr.DB Aaron Ross, Texas, Sr.DB Aqib Talib, Kansas, So.DB Melvin Bullitt, Texas A&M, Sr.DB Terrence Wheatley, Colorado, Jr.P Daniel Sepulveda, Baylor, Sr. [r04]
[3r] - 3 time All-Big 12 selection (2004, ‘05, ‘06)[r] - Repeat selection from 2005[r04] - Repeat selection from 2004
AT&T BIG 12 OFFENSIVE PLAYER OF THE YEAR Zac Taylor, Nebraska, Sr., QB, Norman, Okla.AT&T BIG 12 DEFENSIVE PLAYER OF THE YEAR Rufus Alexander, Oklahoma, Sr., LB, Baton Rouge, La.AT&T BIG 12 SPECIAL TEAMS PLAYER OF THE YEAR Daniel Sepulveda, Baylor, Sr., P, Dallas, TexasAT&T BIG 12 OFFENSIVE FRESHMAN OF THE YEAR Colt McCoy, Texas, RF, QB, Tuscola, TexasAT&T BIG 12 DEFENSIVE FRESHMAN OF THE YEAR Andre Sexton, Oklahoma State, RF, S, Houston, TexasAT&T BIG 12 OFFENSIVE NEWCOMER OF THE YEAR Adarius Bowman, Oklahoma State, Jr., WR, Chattanooga, Tenn.AT&T BIG 12 DEFENSIVE NEWCOMER OF THE YEAR Misi Tupe, Texas A&M, Jr., LB, St. George, UtahAT&T BIG 12 OFFENSIVE LINEMAN OF THE YEAR Justin Blalock, Texas, Sr., OT, Plano, TexasAT&T BIG 12 DEFENSIVE LINEMAN OF THE YEAR Adam Carriker, Nebraska, Sr., DE, Kennewick, Wash.AT&T BIG 12 COACH OF THE YEAR Bob Stoops, Oklahoma, 8th season
2006 AT&T BIG 12 FOOTBALL AWARDS

Dr Pepper Big 12 Football Championship December 2, 2006Arrowhead Stadium, Kansas City, Missouri Page 15
BIG 12 NOTEBOOKBig 12 Preseason Media PollMedia covering the conference have correctly predicted the division champions in three of the last four seasons (UT/CU-05, OU/KSU-03, CU/OU-02). Last year the media accurately predicted Texas to win the South and Colorado to win the North. Overall the top spot in each division has been accurately picked by the league’s media corps 11-of-20 times. Following are this season’s projections. North South 1. Nebraska Oklahoma 2. Iowa State Texas 3. Colorado Texas Tech 4. Kansas Texas A&M 5. Missouri Oklahoma State 6. Kansas State Baylor Big 12 Football Coaches Bowl TeleconferenceBig 12 football coaches participating in postseason bowl games will conduct a media teleconference on Monday, December 4, beginning at 10:00 a.m. CT. Each coach is available for ap-proximately 10 minutes. The schedule is listed below, with all times Central. 10:00 a.m. Mark Mangino, Kansas 10:10 a.m. Bob Stoops, Oklahoma 10:20 a.m. Mike Gundy, Oklahoma State 10:30 a.m. Ron Prince, Kansas State 10:40 a.m. Gary Pinkel, Missouri 10:50 a.m. Mike Leach, Texas Tech 11:20 a.m. Mack Brown, Texas 11:30 a.m. Dennis Franchione, Texas A&M 11:50 a.m. Bill Callahan, Nebraska
CollegePressBox.comThe offi cial media site for Big 12 football will provide one-stop access to updated contact information, media guides, game notes, game books, quotes, links and more for each of the con-ference’s 12 schools and the conference offi ce. Media should contact Big 12 Communications for a user name and password.
All-Time ChampionsIn the 10-year history of the Dr Pepper Big 12 Championship, there have been six different winners. All-time titlists include Texas (1996, 2005), Nebraska (1997, 1999), Texas A&M (1998), Oklahoma (2000, 2002, 2004), Colorado (2001) and Kansas State (2003).
Big 12 Bowl PartnersAgain this season, the Big 12 has eight bowl slots guaranteed. The Conference is partnered with nine bowls, with the the Gator Bowl and Sun Bowl taking a Big 12 team twice over a four-year period. In the two years in which the Gator does not select a Big 12 team, the Sun Bowl will. Following is the selection order: BCS - Fiesta Cotton Holiday Gator (when it selects a Big 12 team) Alamo Sun (when the Gator does not take a Big 12 team) Insight Independence Texas
Big 12 BCS SuccessThe 2005 season marked the third straight and fi fth time in the last six years that a Big 12 team played in the BCS National Championship game. Since the inception of the the BCS, the Big 12 is 2-3 in the National Championship game and leads all conferences with its fi ve appearances. Texas (2005) and Oklahoma (2000) have won titles, while Nebraska (2001) and Oklahoma (2003, ‘04) were denied crowns.
Bowl EligibilityThe Big 12 fi nds itself with nine teams currently at or better than the NCAA minimum six-win threshold for bowl eligibility. When fi lling a conference’s contracted bowl slots, six-win teams can only be selected provided there are no other teams with winning records available within the conference to fulfi ll its obligation(s). Teams with winning records must be selected to fi ll a conference’s bowl obligations before six-win teams within the conference can be chosen. Six-win teams are only able to fi ll at-large spots in bowls outside of existing bowl agreements if there are no other teams with winning records available within Division I-A. Clock ChangesA comparitive analysis on the effect of the clock operation changes on the average length of game and number of plays this season vs. last: No. of Plays Length of Game 2006 129 3:10 2005 141 3:25 Working OvertimeOvertime games in the Big 12 this season: Aug. 31 Iowa State 45, Toledo 43 3 OT Sept. 9 Texas Tech 38, UTEP 35 OT Sept. 15 Toledo 37, Kansas 31 2 OT Sept. 23 Army 27, Baylor 20 OT Sept. 30 Nebraska 39, Kansas 32 OT Oct. 7 Baylor 34, Colorado 31 3 OT Oct. 21 Texas A&M 34, Oklahoma State 33 OT
North v SouthBelow is a comparison of the North vs. South Divisions through the end of the 2006 regular season.
North Division Record vs. South - 90-108 (45.5%) Big 12 Championship Game Record - 4-6 (40%) Bowl Appearances - 32 Bowl Record - 18-14 (56.3%) Teams with 10 or More Victories - 14
South Division Record vs. North - 108-90 (54.5%) Big 12 Championship Game Record - 6-4 (60%) Bowl Appearances - 32 Bowl Record - 13-19 (40.6%) Teams with 10 or More Victories - 12

Dr Pepper Big 12 Football Championship December 2, 2006Arrowhead Stadium, Kansas City, Missouri Page 16
BAYLOR (4-8, 3-5)End of Season
COLORADO (2-10, 2-6)End of Season
KANSAS STATE (7-5, 4-4)Next: Bowl Game
MISSOURI (8-4, 4-4)Next: Bowl Game
Josh Freeman fi nished the 2006 regular season with 1,651 yards passing, which are the 16th-most in K-State single-season history and the most by a freshman.
Freshman tight end Jeron Mastrud had a career-high fi ve catches for a career-best 103 yards vs. KU in the regular season fi nale, marking the fi rst time he has gone over the century mark.
Leon Patton has three 100-yard rushing games on the season and has scored a rushing touchdown in fi ve consecutive games.
Brandon Archer has 259 career tackles, good for 20th in the school record book.
Jeff Snodgrass’ 16 fi eld goals this season are the fi fth-most in school history while his 26 career makes rank seventh.
Daniel Sepulveda fi nished his career with 94 punts of 50-plus yards and as the Big 12’s all-time leader in career punts with 278.
Trent Shelton’s 155 receptions rank fourth in Baylor history. He recorded a catch in 45 consecutive games, fourth in Division I-A annals. His 1,978 career receiving yards are fi fth in school history.
Dominique Zeigler ended his collegiate career with 166 receptions, second on Baylor’s all-time career receptions list and with 1,923 receiving yards, sixth on BU’s all-time career receiving yards list.
Baylor’s season total attendance of 259,559 is a school record, breaking the previous mark of 240,367 established in 1991. The Bears averaged 37,080 fans for seven games to average 37,000-plus for the second consecutive season.
Mizzou has eight regular season wins in a season for only the 10th time in school history and fi rst since 2003. Gary Pinkel joins former coaches Don Faurot and Dan Devine as the only MU coaches to accomplish the feat twice.
Chase Daniel threw for a career high 356 yards vs. KU to become the fi rst MU quarterback to record over 3,000 passing yards in a season. He also became the sixth Mizzou quarterback to throw for 350 yards in a game and the fi rst since Kirk Farmer against Baylor in 2001.
Daniel is 14 yards shy of breaking the Mizzou season total offense record. His 3,592 yards of total offense in 2006 trails Brad Smith’s 2005 record of 3,605. Daniel also upped his season touchdown passes record to 26.
Jeff Wolfert set the MU single-season kick scoring record with 91 points on the year, breaking P/K Adam Crossett’s previous record of 81 set in 2005. Wolfert also holds the Mizzou single-season fi eld goal record with 17.
Quarterback Bernard Jackson ended the season with a string of 66 passes without throwing an interception.
CU’s consecutive scoring streak is at 222 games. It is the 11th longest streak in NCAA history and the fi fth longest active streak.
Mason Crosby ends his career as CU’s all-time career scoring leader with 307 points. He fi nished with 66-of-88 fi eld goals made, the 75.0 percentage tying the school career record. Crosby was 19-of-28 this season, his average make was 40.6 yards and average miss from 52.1.
Thaddaeus Washington’s 335 career tackles is ninth all-time at CU. He fi nished the year with over 100 tackles, joining ILB Jordon Dizon as the fi rst set of inside linebackers to both post over 100 since Ted Johnson and Matt Russell did so in 1994.
KANSAS (6-6, 3-5)Next: Bowl Eligible
Jon Cornish became the all-time single season leading rusher in KU history with 1,457 yards, moving him past June Henley (1,349 yards in 1996) and Tony Sands (1,442 in 1991). He recorded his eighth 100-yard rushing game of the season in KU’s regular season fi nale, which tied Sands for the KU single season record.
Cornish is in 12th place on the KU career all-purpose yards list with a total of 2,604 yards.
The Jayhawks did not allow a fi rst quarter rushing touchdown by an opponent in the 2006 regular season.
Sophomore defensive back Aqib Talib took his fi rst career catch as a wide receiver 42 yards for a touchdown. Talib’s nation-leading pass break-up total stands at 22.
Dan McCarney ended his tenure at Iowa State as the winningest and longest-tenured head coach in school history with 56 wins and 141 games in 12 seasons. He led the Cyclones to fi ve of their nine all-time bowl appearances.
Senior Ryan Kock rushed for a career-high 179 yards and two touchdowns in his fi nal outing for ISU. He entered the game with 318 career yards.
Shawn Moorehead’s game-saving sack on the fi nal play against Missouri gave him 8.5 sacks for the season, an ISU single-season record. He closed his career with 18.5 sacks, also a school record.
Bret Meyer ended his junior campaign with a school-record 41 career touchdown passes and 7,979 yards of total offense (6th in Big 12).
IOWA STATE (4-8, 1-7)End of Season

Dr Pepper Big 12 Football Championship December 2, 2006Arrowhead Stadium, Kansas City, Missouri Page 17
NEBRASKA (9-3, 6-2)Next: Big 12 Championship Game
OKLAHOMA (10-2, 7-1)Next: Big 12 Championship Game
TEXAS (9-3, 6-2)Next: Bowl Game
OKLAHOMA STATE (6-6, 3-5)Next: Bowl Eligible
TEXAS A&M (9-3, 5-3)Next: Bowl Game
Nebraska’s 5-0 record in the North Division is the Huskers’ fi rst perfect divisional record since 1999. NU also earned its 35th nine-win season in the last 38 years and the fi rst since 2003.
Zac Taylor’s 43 career touchdown passes ties Tommie Frazier (1992 to 1995) for the most in school history. His 2,789 passing yards this season set a Nebraska season passing yards record, bettering his 2,653 yards a year ago. Taylor’s 2,746 yards of total offense are just 28 yards behind season record holder Jammal Lord who had 2,774 yards of total offense in 2002.
Adam Carriker has totaled fi ve sacks over the last four games, and has 19.5 career sacks, sixth on the Nebraska career list. He has 40 career tackles-for-loss, good for fi fth on the NU career list.
Oklahoma has advanced to the Big 12 Championship Game for the fourth time, all since 2000. OU is playing for its fourth Big 12 title and 40th conference title overall.
2006 marks the Sooners’ 29th season with 10-plus wins. Oklahoma is now No. 1 all-time in that category, breaking a tie with Alabama (28).
Allen Patrick’s career-long 65-yard touchdown run vs. OSU is the longest run by any Sooner this season. He had 163 yards in the game.
Juaquin Iglesias’ 29.9 yard kick return average (10 returns) currently ranks second all-time for a season (min. of 10 attempts). Brandon Daniels ranks fi rst with a 31.75 average (16 attempts in 1999).
Justin Blalock became the fi rst player in school history to start 50 consecutive games, eclipsing the former school record set by Dan Neil (49, 1993-96).
Colt McCoy moved into 10th place on Texas’ single-season passing list with his 2,262 yards. He set a UT record for total offense yards by a freshman with 2,429 yards, passing Major Applewhite (2,390) and Shea Morenz (2,365).
Selvin Young went over the 3,000-yard plateau for career all-purpose yardage, ending the regular season with 3,046 all-purpose yards.
Jamaal Charles has seven rushing touchdowns this season and four in the last three games. He has 19 rushing TDs in his career.
UT’s rush defense (59.8 ypg) leads the Big 12 and ranks second nationally.
The Aggies posted their fi rst nine-win season of the Franchione era and the fi rst since the Big 12 Championship season in 1998 when that team went 11-3. It is the 19th nine-win season all-time by the Aggies.
A&M has scored on its opening drive of the game seven times this season with four touchdowns and three fi eld goals.
Quarterback Stephen McGee is 5-0 as a starter away from Kyle Field (4-0 on the road and 1-0 at neutral sites). Prior to McGee’s ascension to the starting job, the Aggies were 3-13 in games away from Kyle Field.
The Aggies, ranked No. 3 nationally in time of possession, have had more than a 10-minute TOP advantage in fi ve games this season.
Robert Johnson recorded the fi fth 100-yard receiving game of his career and his fourth career multiple-touchdown game in Tech’s last regular season game. He totaled 108 receiving yards on eight catches and hauled in two touchdowns.
Junior placekicker Alex Trlica moved past former running back Ricky Williams (1997-01) for third place on the all-time scoring list at Texas Tech. Trlica now has 263 total points in his Red Raider career. He has made all 161 PAT attempts in his career.
For the fi rst time in school history, Texas Tech has two players with 10 or more touchdown receptions each – Joel Filani (12) and Robert Johnson (10).
Receiver L.A. Reed made his presence felt on special teams in the win over Oklahoma State with fi ve tackles and a forced fumble.
Sophomore quarterback Bobby Reid is in third place on OSU’s single-season total offense list. Reid has amassed 2,520 yards (2,054 passing, 466 rushing) in 2006.
Reid also is just the third quarterback in OSU history to pass for 2,000 yards in a season, joining Josh Fields and Mike Gundy on that list. A Cowboy quarterback has passed for 2,000 yards just six times in school history (Gundy three times, Fields twice).
Senior D’Juan Woods extended his streak of consecutive games with a catch to 33 in OSU’s regular season fi nale against OU. Woods also recorded a season high with 95 yards receiving against the Sooners.
Four of Oklahoma State’s six losses on the season were by six points or less.
TEXAS TECH (7-5, 4-4)Next: Bowl Game

Dr Pepper Big 12 Football Championship December 2, 2006Arrowhead Stadium, Kansas City, Missouri Page 18
Big 12 in the Weekly Rankings(Coaches/AP/Harris/BCS)
CU ISU KSU MU NU OU OSU UT A&M TTUPS RV/- RV/RV 22/20 5/10 2/3 RV/RV 25/259/5 - -/RV RV/- 21/21 15/10 2/2 RV/RV 24/249/10 - RV/- RV/RV 19/19 11/15 8/8 RV/RV 22/249/17 - - RV/RV 24/23 16/17 8/7 RV/RV RV/RV 9/24 - - RV/25/24 21/21/21 16/16/16 7/7/8 RV/RV/RV 24/RV/RV10/1 - - 25/23/23 22/22/21 13/14/14 7/7/8 RV/-/- 24/RV/RV10/8 - - 21/19/17 20/21/19 22/23/23 6/6/6 RV/-/- RV/RV/RV10/15 - - RV/24/25/24 16/17/16/17 20/20/20/22 5/5/5/9 25/23/RV/- -/-/RV/-10/22 - - 23/23/21/20 20/20/20/22 19/19/19/19 5/5/5/7 22/22/23/21 RV/-/RV/-10/29 - - 25/RV/RV/- RV/RV/RV/- 18/18/18/18 -/RV/RV/- 4/4/4/7 21/21/21/21 -11/5 - - RV/-/RV/- 25/RV/25/- 17/17/17/17 - 3/4/4/5 23/24/24/25 -11/12 - - RV/RV/RV/- RV/-/-/- 22/24/23/23 16/16/16/17 - 11/11/12/13 RV/RV/RV/- RV/-/-/-11/19 - - - - 19/23/22/22 14/13/14/15 - 10/11/11/13 RV/RV/RV/- RV/-/-/-11/26 - - - -/-/RV/- 18/19/20/20 10/8/11/12 - 17/17/17/19 24/22/24/23 -Final
USA Today Coaches PollNov. 26
No. School Rec Pts Prev 1. Ohio State 12-0 1575 1 2. USC 10-1 1491 2 3. Michigan 11-1 1445 3 4. Florida 11-1 1405 4 5. LSU 10-2 1255 8 6. Wisconsin 11-1 1221 9 7. Louisville 10-1 1169 11 8. Arkansas 10-2 1042 5 9. Boise State 12-0 1018 12 10. Oklahoma 10-2 994 14 11. Auburn 10-2 985 13 12. Notre Dame 10-2 928 6 13. Rutgers 10-1 777 16 14. Virginia Tech 10-2 744 17 15. West Virginia 9-2 668 7 16. Wake Forest 10-2 607 20 17. Texas 9-3 596 10 18. Nebraska 9-3 523 19 19. Tennessee 9-3 434 21 20. California 8-3 343 22 21. Brigham Young 10-2 339 23 22. Georgia Tech 9-3 259 15 23. Hawaii 10-2 203 25 24. Texas A&M 9-3 202 NR 25. Boston College 9-3 138 18
Harris Interactive PollNov. 26
No. School Rec Pts Prev 1. Ohio State 12-0 2,850 1 2. USC 10-1 2,711 2 3. Michigan 11-1 2,614 3 4. Florida 11-1 2,528 4 5. LSU 10-2 2,294 8 6. Wisconsin 11-1 2,176 9 7. Louisville 10-1 2,175 10 8. Arkansas 10-2 1,890 6 9. Boise State 12-0 1,872 1210. Notre Dame 10-2 1,765 511. Oklahoma 10-2 1,743 1412. Auburn 10-2 1,680 1313. Rutgers 10-1 1,558 1514. Virginia Tech 10-2 1,298 1715. West Virginia 9-2 1,226 716. Wake Forest 10-2 1,071 2017. Texas 9-3 945 1118. Tennessee 9-3 872 1919. BYU 10-2 798 2120. Nebraska 9-3 793 2221. California 8-3 598 2322. Georgia Tech 9-3 439 1623. Hawaii 10-2 370 2524. Texas A&M 9-3 349 NR25. Boston College 9-3 229 18RV: Missouri
Harris Poll U SA Today Computer Rankings BCS No. School Rk Pts Pct. Rk Pts Pct. A&H RB CM KM JS PW Pct. Avg Avg Prev 1 Ohio State 1 2850 1.000 1 1575 1.000 25 25 24 25 25 25 1.000 1 1.0000 1 2 USC 2 2711 .9512 2 1491 .9467 24 23 25 24 23 23 .940 2 .9460 3 3 Michigan 3 2614 .9172 3 1445 .9175 23 24 22 22 24 24 .930 3 .9216 2 4 Florida 4 2528 .8870 4 1405 .8921 22 22 23 23 22 22 .890 4 .8897 4 5 LSU 5 2294 .8049 5 1255 .7968 21 18 20 21 21 21 .830 5 .8106 10 6 Louisville 7 2175 .7632 7 1169 .7422 20 21 21 17 13 20 .780 6 .7618 9 7 Wisconsin 6 2176 .7635 6 1221 .7752 12 20 15 13 16 15 .590 12 .7096 8 8 Boise State 9 1872 .6568 9 1018 .6463 18 17 19 18 20 16 .720 7 .6744 11 9 Arkansas 8 1890 .6632 8 1042 .6616 15 12 14 20 19 18 .660 9 .6616 6 10 Notre Dame 10 1765 .6193 12 928 .5892 17 16 17 16 17 19 .670 8 .6262 5 11 Auburn 12 1680 .5895 11 985 .6254 16 11 16 19 18 14 .640 10 .6183 12 12 Oklahoma 11 1743 .6116 10 994 .6311 11 15 10 9 9 11 .410 15 .5509 15 13 Rutgers 13 1558 .5467 13 777 .4933 19 14 18 12 12 17 .610 11 .5500 14 14 Virginia Tech 14 1298 .4554 14 744 .4724 9 19 11 10 7 10 .400 16 .4426 17 15 West Virginia 15 1226 .4302 15 668 .4241 10 9 9 8 6 9 .350 17 .4014 7 16 Tennessee 18 872 .3060 19 434 .2756 14 10 12 14 14 13 .530 T-13 .3705 20 17 Wake Forest 16 1071 .3758 16 607 .3854 8 13 8 6 1 6 .280 18 .3471 21 18 California 21 598 .2098 20 343 .2178 13 7 13 15 15 12 .530 T-13 .3192 19 19 Texas 17 945 .3316 17 596 .3784 7 4 7 0 0 7 .180 21 .2967 13 20 Nebraska 20 793 .2782 18 523 .3321 5 2 4 0 0 1 .070 T-23 .2268 22 21 BYU 19 798 .2800 21 339 .2152 4 0 6 0 0 4 .080 22 .1917 23 22 Georgia Tech 22 439 .1540 22 259 .1644 2 0 2 0 0 3 .040 NR .1195 16 23 Texas A&M 24 349 .1225 24 202 .1283 3 8 1 0 0 0 .040 NR .0969 NR 24 Oregon State 29 14 .0049 28 16 .0102 6 0 5 11 11 5 .270 19 .0950 NR 25 Hawaii 23 370 .1298 23 203 .1289 0 1 0 0 0 0 .000 NR .0862 NR
2006 AT&T Players of the Week Offense Defense Special Teams9/4 Chase Daniel, So, QB, MU Ian Campbell, So, DE, KSU Perrish Cox, Fr, KR, OSU9/11 Adrian Peterson, Jr, RB, OU Marcus Bacon, Sr, LB, MU Alex Trlicia, Jr, PK, TTU9/18 Adrian Peterson, Jr, RB, OU Brian Smith, Sr, DE, MU Matt Fodge, So, P, OSU9/25 Marlon Lucky, So, RB, NU Tim Crowder, Sr, DE, UT Reggie Smith, So, PR, OU 10/2 Graham Harrell, So, QB, TT Dwain Crawford, So, FS, BU Byan Baum, Sr, PR, ISU 10/9 Stephen McGee, So, QB, TAMU Aaron Ross, Sr, CB, UT Leon Patton, Fr, KR, KSU10/16 Adarius Bowman, Jr, WR, OSU Tim Crowder, Sr, DE, UT Mason Crosby, Sr, PK, CU Ryan Walters, So, S, CU10/23 Shawn Bell, Sr, QB, BU David Overstreet, Sr, FS, MU Ryan Bailey, So, PK, UT 10/30 Colt McCoy, Fr, QB, UT Nate Peterson, Jr, DE, OSU Brandon Archer, Sr, LB, KSU11/6 Josh Freeman, Fr, QB, KSU Bo Ruud, Jr, LB, NU Daniel Sepulveda, Sr, P, BU11/13 Josh Freeman, Fr, QB, KSU Mark Dodge, Jr, LB, TAMU Mason Crosby, Sr, PK, CU Yamon Figurs, Sr, PR, KSU 11/20 Jon Cornish, Sr, RB, KU Reggie Smith, So, DB, OU Juaquin Iglesias, So, KR, OU11/27 Chase Daniel, So, QB, MU Mark Dodge, Jr, LB, TAMU Barry Turner, So, DE, NU
BCS RankingsNov. 26

Dr Pepper Big 12 Football Championship December 2, 2006Arrowhead Stadium, Kansas City, Missouri Page 19
Big 12 Attendance FiguresHome Games Only G Total Avg HighBaylor (50,000) 7 259,559 38,056 51,385Colorado (53,750) 6 276,286 46,048 50,233Iowa State (45,814) 7 323,197 48,659 55,518Kansas (50,971) 6 308,961 42,857 46,445Kansas State (50,000) 9 373,131 46,641 50,723Missouri (68,349) 7 418,669 59,810 64,657Nebraska (81,067) 7 595,309 85,044 85,800Oklahoma (82,112) 6 422,923 70,487 85,313Oklahoma State (44,700) 6 246,333 41,056 42,970Texas (80,082) 7 619,534 88,505 89,422 Texas A&M (82,600) 7 531,894 75,985 85,979Texas Tech (52,702) 6 305,243 51,957 52,913Total 81 4,681,039 57,790 89,422
Road/Neutral Games Only G Total Avg HighBaylor 5 257,764 51,553 88,966Colorado 6 425,827 70,971 92,748Iowa State 5 331,494 66,299 88,972Kansas 5 239,198 47,840 85,069Kansas State 4 189,926 46,035 64,657Missouri 5 272,820 58,297 85,197Nebraska 5 321,505 64,301 92,000Oklahoma 6 441,754 73,626 76,260Oklahoma State 6 227,772 36,463 41,203Texas 5 305,607 61,121 85,187Texas A&M 5 294,521 58,904 64,583Texas Tech 6 360,384 60,064 85,979Total 63 3,668,572 58,231 92,748
Big 12 vs. Non-Conference Opponents(Includes Bowl Games)
All-Time 2006 W L Pct. W L Pct.ACC 11 17 .393 0 0 .000Big East 16 5 .762 1 1 .500Big Ten 18 30 .375 0 2 .000Conference USA 64 12 .842 5 2 .714Independents 8 6 .571 1 1 .500MAC 23 5 .821 2 1 .667Mountain West 34 23 .596 2 2 .500Pac-10 27 27 .500 1 4 .200SEC 14 16 .467 1 1 .500Sun Belt 60 5 .923 8 0 1.000WAC 33 4 .892 2 0 1.000Non-IA 55 1 .982 10 1 .909Total 363 150 .708 33 15 .688
Big 12 Television ScheduleAgain this season the Big 12 has an extensive schedule of television appearances through its TV partners; ABC, FSN, and TBS. Following is a listing of appearances through the Big 12 contract with its television partners.
Date Game Network Time/ResultSept. 2 North Texas at Texas FSN UT 56-7 Louisiana Tech at Nebraska FSN NU 49-10 UAB at Oklahoma TBS OU 24-17Sept. 3 TCU at Baylor FSN TCU 17-7Sept. 9 Mississippi at Missouri FSN MU 34-7 Washington at Oklahoma ABC OU 37-20 Colorado vs. Colorado State CSTV* CSU 14-10 Oklahoma State at Ark. State ESPNU* OSU 35-7 Ohio State at Texas ABC Ohio State 24-7 Texas Tech at UTEP CSTV* TTU 38-35 (OT)Sept. 15 Kansas at Toledo ESPN2* TOL 37-31 (2OT)Sept. 16 Iowa State at Iowa ESPN* UI 27-17 Marshall at Kansas State FSN KSU 23-7 Oklahoma at Oregon ABC* Oregon 34-33 Texas at Rice ESPN2* UT 52-7 Texas Tech at TCU CSTV* TCU 12-3 Arizona State at Colorado TBS ASU 21-3 Nebraska at USC ABC* USC 28-10 Missouri at New Mexico MWCTV* MU 27-17 Texas A&M vs. Army ESPN2* TAMU 28-24Sept. 23 Louisville at Kansas State FSN LU 24-6 Colorado at Georgia LFS* UGA 14-13 Iowa State at Texas ABC UT 37-14 South Florida at Kansas FSN KU 13-7 Oklahoma State at Houston CSTV* UH 34-25Sept. 30 Colorado at Missouri FSN MU 28-13 Texas Tech at Texas A&M ABC TTU 31-27 Kansas at Nebraska FSN NU 39-32 (OT)Oct. 7 Texas A&M at Kansas FSN TAMU 21-18 Texas vs. Oklahoma ABC UT 28-10 Missouri at Texas Tech TBS MU 38-21 Nebraska at Iowa State ABC NU 28-14Oct. 14 Iowa State at Oklahoma FSN OU 34-9 Missouri at Texas A&M ABC TAMU 25-19 Baylor at Texas TBS UT 63-31Oct. 21 Texas at Nebraska ABC UT 22-20 Colorado at Oklahoma FSN OU 24-3Oct. 28 Oklahoma at Missouri ABC OU 26-10 Nebraska at Oklahoma State ABC OSU 41-29 Texas at Texas Tech TBS UT 35-31Nov. 4 Baylor at Texas Tech FSN TTU 55-21 Missouri at Nebraska ABC NU 34-20 Kansas State at Colorado FSN KSU 34-21 Oklahoma State at Texas TBS UT 36-10 Oklahoma at Texas A&M ABC OU 17-16Nov. 11 Baylor at Oklahoma State FSN OSU 66-24 Nebraska at Texas A&M ABC NU 28-27 Texas Tech at Oklahoma FSN OU 34-24 Texas at Kansas State ABC KSU 45-42Nov. 18 Oklahoma at Baylor FSN OU 36-10 Kansas State at Kansas FSN KU 39-20Nov. 24 Texas A&M at Texas ABC TAMU 12-7 Colorado at Nebraska ABC NU 37-14Nov. 25 Kansas at Missouri ABC MU 42-17 Oklahoma at Oklahoma State FSN OU 27-20Dec. 2 Nebraska vs. Oklahoma ABC 7:00 p.m. Big 12 Championship All Times listed as Central* Appearances outside Big 12 Conference television package.

Dr Pepper Big 12 Football Championship December 2, 2006Arrowhead Stadium, Kansas City, Missouri Page 20
2006 Big 12 Instant Replay Statistics Games with Big 12 Plays Plays Avg. Length Games with One Games with Two Coaches Challenges Replay Crew Reviewed Overturned of Review Coaches Challenge Coaches Challanges Upheld 9/2-3 12 13 3 1:23 4 0 0 9/9 9 10 0 1:16 5 0 0 9/16 4 3 1 2:01 1 0 0 9/23 9 9 0 1:40 2 0 0 9/30 6 10 3 2:12 2 0 0 10/7 6 11 2 1:36 0 1 0 10/14 6 9 4 2:09 2 0 0 10/21 6 9 0 1:36 1 0 0 10/28 6 12 4 1:50 2 1 1 11/4 6 12 4 1:49 4 0 1 11/11 5 7 3 1:37 2 0 0 11/18 4 8 1 1:38 3 0 0 11/25 4 7 2 1:36 2 0 0 12/2 Bowls Totals 83 120 27 1:43 30 2 2
Receiving Touchdowns3. Jarrett Hicks, TTU, Sr. 30
Field Goals Made1. Mason Crosby, CU, Sr 71 Field Goal Attempts1. Mason Crosby, CU, Sr 94
Punts1. Daniel Sepulveda, BU, Sr 278
Quarterback Sacks2. Brian Smith, MU, Sr 31.0
Rushing Yards5. Adrian Peterson, OU, Jr 3,968
Touchdowns9. Adrian Peterson, OU, Jr 40
Total Offensive Plays3. Bret Meyer, ISU, Jr 1,446
Total Offense6. Bret Meyer, ISU, Jr 7,979
Pass Attempts5. Bret Meyer, ISU, Jr 1,032
Passing Yards7. Bret Meyer, ISU, Jr 7,348
BIG 12 CAREER LEADERS SINGLE-SEASON RECORDSPassing Yards4. Cody Hodges, Texas Tech (2005) 4,2385. Graham Harrell, Texas Tech (2006) 4,110
Sacks1. Keith Mitchell, Texas A&M (1996) 14.51. Ron Warner, Kansas (1997) 14.53. Martin Chase, Oklahoma (1997) 14.03. Adell Duckett, Texas Tech (2003) 14.05. Greg Richmond, Oklahoma State (2003) 12.56. Abraham Wright, Colorado (2006) 12.07. Ian Campbell, Kansas State (2006) 11.57. Nyle Wiren, Kansas State (1996) 11.5
SINGLE-GAME RECORDSReceiving Yards1. Adarius Bowman, OSU, Jr 300 vs. Kansas (10/14)
Passing Yards - Sophomore1. Graham Harrell, Texas Tech 519 vs. Texas (10/28)
Total Offense - Sophomore1. Graham Harrell, Texas Tech 506 vs. Texas (10/28)
Yards Per Rush1. Marlon Lucky, NU, Fr 15.6 vs. Troy (9/23)

Dr Pepper Big 12 Football Championship December 2, 2006Arrowhead Stadium, Kansas City, Missouri Page 21
BIG 12 SUPERLATIVES300-Yard Passers7 - Graham Harrell, TTU, So 519 vs. Texas (10/28)3 - Chase Daniel, MU, So 356 vs. Kansas (11/25)2 - Shawn Bell, BU, Sr 394 vs. Kansas (10/21)1 - Bobby Reid, OSU, So 411 vs. Kansas (10/14)1 - Adam Barmann, KU, Sr 405 vs. Nebraska (9/30)1 - Zac Taylor, NU, Sr 395 vs. Kansas (9/30)1 - Colt McCoy, UT, Fr 346 vs. Oklahoma State (11/4)1 - Bret Meyer, ISU, Jr 323 vs. Northern Iowa (9/30)1 - Stephen McGee, TAMU, So 318 vs. La. Tech (9/23)1 - Paul Thompson, OU, Sr 309 vs. Texas Tech (11/11)
100-Yard Rushers8 - Jon Cornish, KU, Sr 201 vs. Kansas State (11/18)6 - Adrian Peterson, OU, Jr 211 vs. Oregon (9/16)4 - Brandon Jackson, NU, Jr 182 vs. Okla. State (10/28)4 - Allen Patrick, OU, Jr 173 vs. Texas A&M (11/4)4 - Dantrell Savage, OSU, Jr 134 vs. Texas A&M (10/21)3 - Leon Patton, KSU, Fr 151 vs. Oklahoma State (10/7)2 - Tony Temple, MU, Jr 168 vs. New Mexico (9/16)2 - Marlon Lucky, NU, So 156 vs. Troy (9/23)2 - James Johnson, KSU, Jr 127 vs. Missouri (10/21)2 - Jorvorskie Lane, TAMU, So 127 vs. Missouri (10/14)2 - Shannon Woods, TTU, So 125 vs. Baylor (11/4)2 - Hugh Charles, CU, Jr 119 vs. Texas Tech (10/15)1 - Ryan Kock, ISU, Sr 179 vs. Missouri (11/18)1 - Chris Brown, OU, Fr 169 vs. Baylor (11/18)1 - Mike Hamilton, OSU, So 155 vs. Missouri State (9/2)1 - Cody Glenn, NU, So 148 vs. Iowa State (10/7)1 - Stephen McGee, TAMU, So 142 vs. Army (9/16)1 - Mike Goodson, TAMU, Fr 127 vs. Oklahoma (11/4)1 - Mell Holiday, CU, Sr 126 vs. Iowa State (11/11)1 - Thomas Clayton, KSU, Sr 119 vs. Louisville (9/23)1 - Stevie Hicks, ISU, Sr 109 vs. UNLV (9/9)1 - Jamaal Charles, UT, So 109 vs. Rice (9/16)1 - Keith Toston, OSU, Fr 109 vs. Kansas State (10/7)1 - Kenny Wilson, NU, Jr 106 vs. Troy (9/23)1 - Bernard Jackson, CU, Jr 105 vs. Kansas St. (11/04)1 - Selvin Young, UT, Sr 101 vs. Rice (9/16)
100-Yard Receivers4 - Joel Filani, TTU, Sr 212 vs. Baylor (11/4)4 - Malcolm Kelly, OU, So 164 vs. MTSU (9/23)4 - Trent Shelton, BU, Sr 158 vs. Northwestern St. (9/9) 3 - Limas Sweed, UT, Jr 119 vs. Nebraska (10/21)2 - Adarius Bowman, OSU, Jr 300 vs. Kansas (10/14)2 - Dominique Zeigler, BU, Sr 180 vs. Texas A&M (10/28)2 - Robert Johnson, TTU, Sr 139 vs. SMU (9/2)2 - William Franklin, MU, Jr 138 vs. Murray State (9/2)2 - Yamon Figurs, KSU, Sr 123 vs. Texas (11/11)1 - Frantz Hardy, NU, Jr 159 vs. Kansas (9/30)1 - Jarrett Hicks, TTU, Sr 156 vs. Texas (10/28)1 - Martellus Bennett, TAMU, So 133 vs. Baylor (10/28)1 - Brian Murph, KU, Sr 129 vs. Nebraska (9/30)1 - Jon Davis, ISU, Sr 117 vs. Northern Iowa (9/30)1 - Jordy Nelson, KSU, Jr 117 vs. Colorado (11/4)1 - Kerry Franks, TAMU, Jr 115 vs. Missouri (10/14)1 - Milan Moses, ISU, Jr 109 vs. Kansas (11/4)1 - Dexton Fields, KU, So 108 vs. Nebraska (9/30)1 - Jeron Mastrud, KSU, Fr 103 vs. Kansas (11/18)1- Terrence Nunn, NU, Jr 102 vs.Troy (9/23)1 - Billy Pittman, UT, Jr 102 vs. Kansas State (11/11)1 - Chad Schroeder, TAMU, Sr 101 vs. The Citadel (9/2)1 - Quan Cosby, UT, So 101 vs. Oklahoma State (11/4)

Dr Pepper Big 12 Football Championship December 2, 2006Arrowhead Stadium, Kansas City, Missouri Page 22
BAYLOR (4-8, 3-5) BU Opp. Offense DefenseDate Time Opponent Att. HI C HI C Run Pass Total Passes TO Run Pass Total Passes TOS3 L 7-17 TCU 42,733 22^ 25 47 286 333 31-47-1 2 97 233 330 18-27-1 1S9 W 47-10 Northwestern State 31,125 20 330 350 27-46-1 1 147 182 329 14-28-3 5S16 L 15-17 vs. Washington State 41, 358 -10 256 246 31-49-2 4 51 285 336 25-38-2 4S23 L 20-27(OT) Army 36,218 62 241 303 26-35-0 0 140 138 278 15-22-0 1S 30 W 17-3 Kansas State 30,752 18 294 312 26-47-1 4 45 296 341 22-55-3 5O7 W 34-31 (3OT) at Colorado* 47,065 110 272 382 31-44-2 3 276 75 351 9-25-3 3O14 L 31-63 at Texas* 88,966 6 6 27 320 347 26-48-1 5 162 275 437 21-32-1 1O21 W 36-35 Kansas* 36,125 66 394 460 33-55-2 3 284 98 382 11-24-1 1O28 L 21-31 Texas A&M* 51,385 23 22 77 260 337 14-23-1 1 292 215 507 12-21-0 0N4 L 21-55 at Texas Tech* 51,303 20 197 217 16-30-1 3 175 507 682 38-58-1 0N11 L 24-66 at Oklahoma State* 35,430 93 262 355 24-41-3 6 387 123 510 13-15-0 0N18 L 10-36 Oklahoma* 31,221 16 16 -48 188 140 22-45-2 2 236 178 414 12-19-1 5^ denotes AP ranking
COLORADO (2-10, 2-6) CU Opp. Offense DefenseDate Time Opponent Att. HI C HI C Run Pass Total Passes TO Run Pass Total Passes TOS2 L 10-19 Montana State 45,513 RV 106 110 216 8-22-0 1 50 238 288 24-35-0 0S9 L 10-14 vs. Colorado State 65,701 75 71 146 9-15-0 0 15 233 248 20-23-0 1S16 L 3-21 Arizona State 47,723 22^ 23 133 86 219 8-18-1 3 182 248 430 21-37-2 4S23 L 13-14 at Georgia 92,746 9^ 7 173 140 313 14-27-1 2 54 230 284 18-29-0 2S30 L 13-28 at Missouri* 57,824 24 RV 183 190 373 13-27-0 0 100 253 353 23-37-2 2O7 L 31-34 (3OT) Baylor* 47,065 276 75 351 9-25-3 3 110 272 382 31-44-2 3O14 W 30-6 Texas Tech* 50,233 RV RV 228 152 380 12-19-0 2 31 245 276 29-45-3 5O21 L 3-24 at Oklahoma* 84,443 20 20 74 39 113 3-14-1 2 166 105 271 17-26-0 1O28 L 15-20 at Kansas* 39,313 172 144 316 10-28-2 2 161 180 341 18-29-3 4N4 L 21-34 Kansas State* 42,696 225 145 370 10-18-0 1 188 251 439 22-26-0 0N11 W 33-16 Iowa State* 43,056 263 200 463 13-19-0 0 102 209 311 18-29-0 0N24 L 14-37 at Nebraska* 85,800 22 19 166 131 297 11-23-0 0 190 278 468 20-30-0 2^ denotes AP ranking
IOWA STATE (4-8, 1-7) ISU Opp. Offense DefenseDate Time Opponent Att. HI C HI C Run Pass Total Passes TO Run Pass Total Passes TOA31 W 45-43 (3OT) Toledo 42,531 RV^ RV 159 234 393 17-26-0 1 45 367 412 39-49-1 2S9 W 16-10 UNLV 45,795 RV 137 203 340 14-21-1 1 74 218 292 24-35-1 1S16 L 17-27 at Iowa 70,858 RV 16^ 16 171 152 323 15-31-0 0 136 274 410 26-38-1 1S23 L 14-37 at Texas* 88,972 7^ 8 21 302 323 25-45-2 2 193 246 439 19-24-1 2S30 W 28-27 Northern Iowa 55,518 81 323 404 24-29-1 3 176 158 334 23-30-0 0O7 L 14-28 Nebraska* 55,338 21 22 53 262 315 18-39-1 1 251 131 382 17-21-0 1O14 L 9-34 at Oklahoma* 84,152 23 22 89 149 238 14-25-2 2 185 195 380 16-27-0 0O21 L 26-42 Texas Tech* 44,112 RV 75 146 221 14-34-2 2 107 368 475 31-40-0 2 O28 L 10-31 at Kansas State* 44,729 104 280 384 23-41-1 3 156 161 317 14-20-1 1N4 L 10-41 Kansas* 40,272 33 180 213 16-31-1 4 169 234 403 20-27-1 4N11 L 16-33 at Colorado* 43,056 102 209 311 18-29-0 0 263 200 463 13-19-0 0N18 W 21-16 Missouri* 39,631 RV 196 153 349 15-27-1 1 90 310 400 29-44-0 1^ denotes AP ranking
KANSAS (6-6, 3-5) KU Opp. Offense DefenseDate Time Opponent Att. HI C HI C Run Pass Total Passes TO Run Pass Total Passes TOS2 W 49-18 Northwestern St. 44,025 209 117 326 10-20-1 2 62 217 279 22-40-1 2S9 W 21-19 Louisiana Monroe 45,221 161 190 351 17-28-2 2 51 377 428 24-41-0 0S15 L 31-37 (2OT) at Toledo 22,118 148 243 391 23-41-4 5 101 136 237 15-47-0 0S23 W 13-7 South Florida 40,933 118 273 391 25-35-0 2 113 196 309 17-34-2 3S30 L 32-39 (OT) at Nebraska* 85,069 21 21 169 405 574 27-54-3 4 116 395 511 15-33-0 3O7 L 18-21 Texas A&M* 46,445 RV 113 175 288 14-32-0 1 146 240 386 25-45-0 1O14 L 32-42 Oklahoma State* 41,203 178 187 365 15-27-1 2 192 411 603 23-35-1 4O21 L 35-36 at Baylor* 36,125 284 98 382 11-24-1 1 66 394 460 33-55-2 3O28 W 20-15 Colorado* 39,313 161 180 341 18-29-3 4 172 144 316 10-28-2 2N4 W 41-10 at Iowa State* 40,272 169 234 403 20-27-1 4 33 180 213 16-31-1 4N18 W 39-20 Kansas State* 51,821 RV RV 249 108 357 11-23-2 4 118 244 362 23-44-3 6N25 L 17-42 at Missouri* 55,614 160 162 322 12-23-1 2 137 356 493 26-38-0 0^ denotes AP ranking

Dr Pepper Big 12 Football Championship December 2, 2006Arrowhead Stadium, Kansas City, Missouri Page 23
KANSAS STATE (7-5, 4-4) KSU Opp. Offense DefenseDate Time Opponent Att. HI C HI C Run Pass Total Passes TO Run Pass Total Passes TOS2 W 24-23 Illinois State 47,250 44 163 207 15-26-2 2 93 253 346 24-38-1 2S9 W 45-0 Florida Atlantic 43,953 221 125 346 10-24-1 1 59 141 200 12-25-1 1S16 W 23-7 Marshall 46,488 99 256 355 19-35-1 2 50 92 142 16-28-2 3S23 L 6-24 Louisville 45,855 8^ 9 108 139 247 17-45-2 2 228 173 401 18-26-1 3S30 L 3-17 at Baylor* 30,752 45 296 341 22-55-3 5 18 294 312 26-47-1 4O7 W 31-27 Oklahoma State* 46,616 180 177 357 10-15-0 0 193 138 331 14-22-1 1O14 L 3-21 Nebraska* 50,723 19 20 22 272 294 23-47-2 2 190 166 356 13-22-0 0O21 L 21-41 at Missouri* 64,657 25 RV 262 63 325 5-20-2 4 171 262 433 24-31-0 2O28 W 31-10 Iowa State* 44,729 156 161 317 14-20-1 1 104 280 384 23-41-1 3N4 W 34-21 at Colorado* 42,696 188 251 439 22-26-0 0 225 145 370 10-18-0 1N11 W 45-42 Texas* 47,933 4 3 23 323 346 22-34-1 2 143 241 384 17-35-0 2N18 L 20-39 at Kansas* 51,821 RV RV 118 244 362 23-44-3 6 249 108 357 11-23-2 4^ denotes AP ranking
MISSOURI (8-4, 4-4) MU Opp. Offense DefenseDate Time Opponent Att. HI C HI C Run Pass Total Passes TO Run Pass Total Passes TOS2 W 47-7 Murray State 50,074 256 333 589 24-35-1 2 27 123 150 20-30-1 2S9 W 34-7 Ole Miss 51,112 RV^ RV 218 253 471 25-41-0 1 72 90 162 13-29-3 3S16 W 27-17 at New Mexico 27,806 RV^ RV 197 199 396 25-36-1 2 33 168 201 16-31-1 3S23 W 31-6 Ohio 50,098 RV^ RV 170 258 428 18-34-1 3 43 145 188 17-33-1 2S30 W 28-13 Colorado* 57,824 24 RV 100 253 353 23-37-2 2 183 190 373 13-27-0 0O7 W38-21 at Texas Tech* 49,050 23 25 RV 24 133 173 306 15-22-1 1 78 378 456 44-61-2 5O14 L 19-25 at Texas A&M* 71,136 17 21 RV 74 306 380 22-31-0 3 180 223 403 20-24-0 0O21 W 41-21 Kansas State* 64,657 25 RV 171 262 433 24-31-0 2 262 63 325 5-20-2 4O28 L 10-26 Oklahoma* 62,045 21 23 19 19 76 284 360 23-46-3 4 231 127 358 11-19-0 2N4 L 20-34 at Nebraska* 85,197 RV 25 RV RV 119 244 363 20-38-2 3 183 236 419 14-22-0 2N18 L 16-21 at Iowa State* 39,631 RV RV 90 310 400 29-44-0 1 196 153 349 15-27-1 1N25 W 42-17 Kansas* 55,614 137 356 493 26-38-0 0 160 162 322 12-23-1 2^ denotes AP ranking
NEBRASKA (9-3, 6-2) NU Opp. Offense DefenseDate Time Opponent Att. HI C HI C Run Pass Total Passes TO Run Pass Total Passes TOS2 W 49-10 Louisiana Tech 85,181 20^ 22 252 332 584 24-36-1 2 67 238 305 13-32-1 3S9 W 56-7 Nicholls State 84,076 21^ 21 261 237 498 21-26-0 1 187 0 187 0-3-0 3S16 L 10-28 at USC 92,000 19^ 19 4^ 2 68 143 211 9-17-0 1 142 257 399 25-37-0 0S23 W 56-0 Troy 84,799 23^ 24 316 281 597 16-23-1 1 48 92 140 15-24-1 3S30 W 39-32 (OT) Kansas* 85,069 21 21 116 395 511 15-33-0 3 169 405 574 27-54-3 4O7 W 28-14 at Iowa State* 55,338 21 22 251 131 382 17-21-0 1 53 262 315 18-39-1 1O14 W 21-3 at Kansas State* 50,723 19 20 190 166 356 13-22-0 0 22 272 294 23-47-2 2O21 L 20-22 Texas* 85,187 16 16 5 5 38 302 340 16-29-1 3 128 220 348 25-40-0 1O28 L 29-41 at Oklahoma State* 40,108 20 20 211 241 452 21-39-0 1 267 229 496 13-21-1 2N4 W 34-20 Missouri* 85,197 RV RV RV 25 183 236 419 14-22-0 2 119 244 363 20-38-2 3N11 W 28-27 at Texas A&M* 83,336 25 25 24 23 123 267 390 21-36-1 1 155 288 443 19-32-0 0N24 W 37-14 Colorado* 85,800 22 19 190 278 468 20-30-0 2 166 131 297 11-23-0 0D2 7:00 p.m. Oklahoma! 20 18 11 10^ denotes AP ranking !Dr Pepper Big 12 Championship
OKLAHOMA (10-2, 7-1) OU Opp. Offense DefenseDate Time Opponent Att. HI C HI C Run Pass Total Passes TO Run Pass Total Passes TOS2 W 24-17 UAB 84,555 10^ 5 143 227 370 14-24-2 4 135 169 304 11-17-0 1S9 W 37-20 Washington 84,577 15^ 10 181 272 453 21-33-1 2 204 180 384 14-30-0 1S16 L 33-34 at Oregon 59,269 15^ 11 18^ 18 207 174 381 13-24-0 1 158 343 501 27-42-2 4S23 W 59-0 Middle Tennessee State 84,326 17^ 16 190 272 462 14-20-0 2 22 73 95 6-20-2 5O7 L 10-28 vs. Texas* 76,260 14 13 8 7 124 209 333 15-27-2 5 124 108 232 11-18-0 0O14 W 34-9 Iowa State* 84,152 23 22 185 195 380 16-27-0 0 89 149 238 14-25-2 2O21 W 24-3 Colorado* 84,443 20 20 166 105 271 17-26-0 1 74 39 113 3-14-1 2O28 W 26-10 at Missouri* 62,045 19 19 21 23 231 127 358 11-19-0 2 76 284 360 23-46-3 4N4 W 17-16 at Texas A&M* 85,697 18 18 21 21 224 39 263 3-12-0 2 204 63 267 8-18-1 1N11 W 34-24 Texas Tech* 85,313 17 17 139 309 448 24-31-1 4 31 250 281 26-48-1 1N18 W 36-10 at Baylor* 31,221 16 16 236 178 414 12-19-1 5 -48 188 140 22-45-2 2N25 W 27-21 at Oklahoma State* 42,819 14 14 238 77 315 7-11-0 0 119 243 362 17-31-0 1D2 7:00 p.m. Nebraska! 11 10 20 18 ^ denotes AP ranking !Dr Pepper Big 12 Championship

Dr Pepper Big 12 Football Championship December 2, 2006Arrowhead Stadium, Kansas City, Missouri Page 24
OKLAHOMA STATE (6-6, 3-5) OSU Opp. Offense DefenseDate Time Opponent Att. HI C HI C Run Pass Total Passes TO Run Pass Total Passes TOS2 W 52-10 Missouri State 41,393 230 213 443 12-24-0 1 68 266 334 19-31-1 2S9 W 35-7 at Arkansas State 23,816 171 167 338 11-18-3 3 110 78 188 7-19-1 3S16 W 48-8 Florida Atlantic 42,970 246 186 432 9-19-0 0 49 166 215 16-28-2 3S23 L 25-34 at Houston 28,260 165 281 446 13-22-0 2 196 313 509 21-28-0 1O7 L 27-31 Kansas State* 46,616 193 138 331 14-22-1 1 180 177 357 10-15-0 0O14 W 42-32 Kansas* 41,203 192 411 603 23-35-1 4 178 187 365 15-27-1 2O21 L, 33-34 (OT) Texas A&M* 43,006 RV 25 226 133 359 10-22-1 1 231 192 423 17-27-1 2O28 W 41-29 Nebraska* 40,108 20 20 267 229 496 13-21-1 2 211 241 452 21-39-0 1N4 L 10-36 at Texas* 89,036 RV 4 4 80 123 203 11-28-2 3 164 346 510 23-29-0 2N11 W 66-24 Baylor* 35,430 387 123 510 13-15-0 0 93 262 355 24-41-3 6N18 L 24-30 at Texas Tech* 45,457 RV 221 164 385 13-34-1 1 81 353 434 28-44-0 1 N25 L 21-27 Oklahoma* 42,819 14 14 119 243 362 17-31-0 1 238 77 315 7-11-0 0^ denotes AP ranking
TEXAS (9-3, 6-2) UT Opp. Offense DefenseDate Time Opponent Att. HI C HI C Run Pass Total Passes TO Run Pass Total Passes TOS2 W 56-7 North Texas 85,123 3^ 2 212 198 410 15-26-1 2 8 87 95 9-19-0 2S9 L 7-24 Ohio State 89,422 2^ 2 1^ 1 172 154 326 19-32-1 2 79 269 348 17-26-0 0S16 W 52-7 at Rice 40,069 8^ 8 330 163 493 10-11-0 2 -12 180 168 18-29-0 1S23 W 37-14 Iowa State* 88,972 7^ 8 193 246 439 19-24-1 2 21 302 323 25-45-2 2S30 W 56-3 Sam Houston 88,913 8 7 119 300 419 20-24-0 0 87 105 192 16-26-2 4O7 W 28-10 vs. Oklahoma* 76,260 8 7 14 13 124 108 232 11-18-0 0 124 209 333 15-27-2 5O14 W 63-31 Baylor* 88,966 6 6 162 275 437 21-32-1 1 27 320 347 26-48-1 5O21 W 22-20 at Nebraska* 85,187 5 5 16 16 128 220 348 25-40-0 1 38 302 340 16-29-1 3O28 W 35-31 at Texas Tech* 56,158 5 5 RV RV 227 256 483 21-31-1 4 -1 519 518 42-62-1 2N4 W 36-10 Oklahoma State* 89,036 4 4 RV 164 346 510 23-29-0 2 80 123 203 11-28-2 3N11 L 42-45 at Kansas State* 47,933 4 3 143 241 384 17-35-0 2 23 323 346 22-34-1 2N24 L 7-12 Texas A&M* 89,102 11 10 RV RV 70 160 230 17-29-4 4 244 58 302 7-13-0 1^ denotes AP ranking
TEXAS A&M (9-3, 5-3) TAMU Opp. Offense DefenseDate Time Opponent Att. HI C HI C Run Pass Total Passes TO Run Pass Total Passes TOS2 W 35-3 The Citadel 70,104 RV^ RV 184 200 384 16-25-0 4 115 128 243 19-38-0 1S9 W 51-7 UL Lafayette 67,079 RV^ RV 225 271 496 23-32-0 0 154 17 171 2-12-0 2S16 W 28-24 vs. Army 64,583 RV^ RV 262 102 364 7-11-0 1 186 136 322 17-32-3 3S23 W 45-14 Louisiana Tech 68,563 RV^ RV 153 336 489 21-33-0 1 73 229 302 13-32-0 1S30 L 27-31 Texas Tech* 85,979 RV RV RV 24 250 103 353 9-20-1 1 41 392 433 32-45-0 1O7 W 21-18 at Kansas* 46,445 RV 146 240 386 25-45-0 1 113 175 288 14-32-0 1O14 W 25-19 Missouri* 71,136 RV 17 21 180 223 403 20-24-0 0 74 306 380 22-31-0 3O21 W 34-33 (OT) at Oklahoma State* 43,006 RV 25 231 192 423 17-27-1 2 226 133 359 10-22-1 1O28 W 31-21 at Baylor* 51,385 23 22 292 215 507 12-21-0 0 77 260 337 14-23-1 1N4 L 16-17 Oklahoma* 85,697 21 21 18 18 204 63 267 8-18-1 1 224 39 263 3-12-0 2N11 L 27-28 Nebraska* 83,336 24 23 25 25 155 288 443 19-32-0 0 123 267 390 21-36-1 1N24 W 12-7 at Texas* 89,102 RV RV 11 10 244 58 302 7-13-0 1 70 160 230 17-29-4 4^ denotes AP ranking
TEXAS TECH (7-5, 4-4) TTU Opp. Offense DefenseDate Time Opponent Att. HI C HI C Run Pass Total Passes TO Run Pass Total Passes TOS2 W 35-3 SMU 50,362 25^ 25 138 363 501 38-54-1 1 118 71 189 10-19-0 1S9 W 38-35(OT) at UTEP 51,827 24^ 24 RV^ 103 376 479 40-53-1 1 120 375 495 35-52-2 2S16 L 3-12 at TCU 45,647 24^ 22 20^ 20 38 204 242 23-47-0 1 180 101 281 13-23-0 0S23 W 62-0 Southeastern Louisiana 52,913 RV^ RV 106 403 509 31-44-0 0 58 61 119 12-19-0 2S30 W 31-27 at Texas A&M* 85,979 RV 24 RV RV 41 392 433 32-45-0 1 250 103 353 9-20-1 1O7 L 21-38 Missouri* 49,050 RV 24 23 25 78 378 456 44-61-2 5 133 173 306 15-22-1 1O14 L 6-30 at Colorado* 50,233 RV RV 31 245 276 29-45-3 5 228 152 380 12-19-0 2O21 W 42-26 at Iowa State* 44,112 RV 107 368 475 31-40-0 2 75 146 221 14-34-2 2O28 L 31-35 Texas* 56,158 RV RV 5 5 -1 519 518 42-62-1 2 227 256 483 21-31-1 4N4 W 55-21 Baylor* 51,303 175 507 682 38-58-1 0 20 197 217 16-30-1 3N11 L 24-34 at Oklahoma* 85,313 17 17 31 250 281 26-48-1 1 139 309 448 24-31-1 4N18 W 30-24 Oklahoma State* 45,457 RV 81 353 434 28-44-0 1 221 164 385 13-34-1 1^ denotes AP ranking

2006 Big 12 Football Team Statistics Through games of Nov 27, 2006 (NCAA Rankings in Parentheses)
SCORING OFFENSE G TD XP 2XP DXP FG Saf Pts Avg RUSHING OFFENSE G Att Yds Avg TD Yds/G-------------------------------------------------------------- --------------------------------------------------------1. Texas............(5) 12 60 58 0 0 7 1 441 36.8 1. Texas A&M........(7) 12 502 2526 5.0 32 210.52. Oklahoma State...(8) 12 57 53 1 0 9 0 424 35.3 2. Oklahoma State...(8) 12 481 2497 5.2 25 208.13. Nebraska.........(9) 12 56 52 1 0 5 1 407 33.9 3. Oklahoma........(14) 12 492 2264 4.6 22 188.74. Texas Tech......(17) 12 48 46 1 0 14 0 378 31.5 4. Nebraska........(18) 12 495 2199 4.4 26 183.25. Oklahoma........(23) 12 44 42 0 0 17 2 361 30.1 5. Kansas..........(25) 12 438 2119 4.8 20 176.66. Missouri........(26) 12 43 40 0 0 17 2 353 29.4 6. Colorado........(28) 12 461 2075 4.5 12 172.97. Texas A&M.......(27) 12 45 35 4 0 13 0 352 29.3 7. Texas...........(30) 12 462 2044 4.4 23 170.38. Kansas..........(29) 12 44 37 2 0 13 2 348 29.0 8. Missouri........(49) 12 424 1741 4.1 14 145.19. Kansas State....(59) 12 34 32 1 0 16 0 286 23.8 9. Kansas State....(80) 12 351 1466 4.2 16 122.210.Baylor..........(62) 12 36 32 0 0 11 1 283 23.6 10.Iowa State......(99) 12 401 1221 3.0 16 101.811.Iowa State......(92) 12 29 24 1 0 8 1 226 18.8 11.Texas Tech.....(112) 12 195 928 4.8 9 77.312.Colorado.......(107) 12 20 19 0 0 19 0 196 16.3 12.Baylor.........(119) 12 235 482 2.1 9 40.2
SCORING DEFENSE G TD XP 2XP DXP FG Saf Pts Avg RUSHING DEFENSE G Rushes Yards Avg. TD Yds/G-------------------------------------------------------------- ----------------------------------------------------------1. Oklahoma........(18) 12 22 22 0 0 12 1 192 16.0 1. Texas............(2) 12 310 718 2.3 7 59.82. Texas...........(26) 12 28 25 0 0 7 0 214 17.8 2. Oklahoma........(19) 12 368 1188 3.2 9 99.03. Missouri........(28) 12 27 25 1 0 8 1 215 17.9 3. Kansas..........(29) 12 373 1308 3.5 13 109.04. Nebraska........(30) 12 27 21 1 0 11 0 218 18.2 4. Colorado........(30) 12 410 1349 3.3 12 112.45. Texas A&M.......(32) 12 28 26 0 0 8 2 222 18.5 5. Texas A&M.......(46) 12 367 1476 4.0 15 123.06. Colorado........(54) 12 34 31 0 0 10 1 267 22.2 6. Nebraska........(48) 12 373 1523 4.1 12 126.97. Kansas State....(60) 12 34 32 0 0 12 0 272 22.7 7. Missouri........(61) 12 437 1648 3.8 10 137.38. Texas Tech......(69) 12 34 30 0 0 17 0 285 23.8 8. Kansas State....(69) 12 436 1723 4.0 14 143.69. Oklahoma State..(81) 12 37 31 2 0 15 0 302 25.2 9. Texas Tech......(77) 12 464 1769 3.8 15 147.410.Kansas..........(84) 12 38 25 3 0 15 1 306 25.5 10.Oklahoma State..(86) 12 439 1799 4.1 15 149.911.Iowa State.....(105) 12 47 42 2 0 13 1 369 30.8 11.Iowa State......(89) 12 404 1845 4.6 19 153.812.Baylor.........(110) 12 51 48 1 0 11 1 391 32.6 12.Baylor.........(113) 12 461 2293 5.0 19 191.1
PASS OFFENSE G Att Cmp Int Pct. Yds Avg TD Yds/G TOTAL OFFENSE G Rush Pass Plays Yards Avg/P TD Yds/G------------------------------------------------------------------ ----------------------------------------------------------------1. Texas Tech.......(3) 12 601 402 10 66.9 4358 7.3 37 363.2 1. Texas Tech.......(7) 12 928 4358 796 5286 6.6 46 440.52. Baylor...........(8) 12 510 307 17 60.2 3300 6.5 24 275.0 2. Nebraska.........(9) 12 2199 3009 829 5208 6.3 56 434.03. Missouri........(11) 12 433 274 11 63.3 3231 7.5 26 269.2 3. Missouri........(13) 12 1741 3231 857 4972 5.8 40 414.34. Nebraska........(18) 12 334 207 4 62.0 3009 9.0 30 250.8 4. Oklahoma State..(16) 12 2497 2411 772 4908 6.4 51 409.05. Texas...........(41) 12 331 218 9 65.9 2667 8.1 29 222.2 5. Texas A&M.......(19) 12 2526 2291 803 4817 6.0 44 401.46. Iowa State......(46) 12 378 213 12 56.3 2593 6.9 12 216.1 6. Texas...........(24) 12 2044 2667 793 4711 5.9 52 392.67. Kansas State....(52) 12 391 202 18 51.7 2470 6.3 10 205.8 7. Kansas..........(34) 12 2119 2372 801 4491 5.6 39 374.28. Oklahoma State..(58) 12 291 159 10 54.6 2411 8.3 26 200.9 8. Oklahoma........(39) 12 2264 2184 765 4448 5.8 40 370.79. Kansas..........(62) 12 363 203 19 55.9 2372 6.5 19 197.7 9. Kansas State....(71) 12 1466 2470 742 3936 5.3 26 328.010.Texas A&M.......(68) 12 301 184 3 61.1 2291 7.6 12 190.9 10.Iowa State......(81) 12 1221 2593 779 3814 4.9 28 317.811.Oklahoma........(80) 12 273 167 7 61.2 2184 8.0 18 182.0 11.Baylor..........(85) 12 482 3300 745 3782 5.1 33 315.212.Colorado.......(116) 12 254 119 8 46.9 1422 5.6 7 118.5 12.Colorado.......(102) 12 2075 1422 715 3497 4.9 19 291.4
PASS DEFENSE G Att Cmp Int Pct. Yds Avg TD Yds/G TOTAL DEFENSE G Rush Pass Plys Yards Avg TD Yds/G------------------------------------------------------------------ ---------------------------------------------------------------1. Missouri........(22) 12 346 200 12 57.8 2058 5.9 15 171.5 1. Oklahoma........(14) 12 1188 2089 722 3277 4.5 19 273.12. Oklahoma........(27) 12 354 182 14 51.4 2089 5.9 10 174.1 2. Texas...........(23) 12 718 2797 696 3515 5.1 26 292.93. Texas Tech......(29) 12 334 194 10 58.1 2108 6.3 16 175.7 3. Missouri........(37) 12 1648 2058 783 3706 4.7 25 308.84. Texas A&M.......(39) 12 344 184 10 53.5 2242 6.5 13 186.8 4. Texas A&M.......(39) 12 1476 2242 711 3718 5.2 28 309.85. Kansas State....(44) 12 356 208 10 58.4 2293 6.4 16 191.1 5. Texas Tech......(50) 12 1769 2108 798 3877 4.9 31 323.16. Baylor..........(82) 12 364 210 16 57.7 2605 7.2 24 217.1 6. Kansas State....(62) 12 1723 2293 792 4016 5.1 30 334.77. Nebraska........(84) 12 390 209 11 53.6 2638 6.8 14 219.8 7. Colorado........(67) 12 1349 2742 800 4091 5.1 34 340.98. Oklahoma State..(86) 12 339 208 9 61.4 2658 7.8 19 221.5 8. Nebraska........(71) 12 1523 2638 763 4161 5.5 26 346.89. Colorado........(95) 12 390 261 12 66.9 2742 7.0 22 228.5 9. Oklahoma State..(91) 12 1799 2658 778 4457 5.7 34 371.410.Texas..........(100) 12 386 224 12 58.0 2797 7.2 19 233.1 10.Kansas..........(93) 12 1308 3229 843 4537 5.4 35 378.111.Iowa State.....(102) 12 374 271 6 72.5 2862 7.7 26 238.5 11.Iowa State.....(102) 12 1845 2862 778 4707 6.1 45 392.212.Kansas.........(119) 12 470 248 12 52.8 3229 6.9 22 269.1 12.Baylor.........(110) 12 2293 2605 825 4898 5.9 43 408.2
KICKOFF RETURNS G Ret Yds TD Avg PUNT RETURN AVG G Ret Yds TD Avg------------------------------------------------ ------------------------------------------------1. Kansas State.....(1) 12 31 866 3 27.9 1. Texas...........(11) 12 26 363 3 14.02. Texas A&M........(2) 12 21 579 1 27.6 2. Kansas..........(14) 12 24 324 2 13.53. Oklahoma State...(8) 12 44 1115 2 25.3 3. Oklahoma State..(16) 12 31 404 0 13.04. Oklahoma.........(9) 12 29 709 1 24.4 4. Kansas State....(30) 12 28 313 2 11.25. Baylor..........(24) 12 45 1027 0 22.8 5. Iowa State......(37) 12 20 213 1 10.66. Texas...........(31) 12 21 464 0 22.1 6. Texas Tech......(59) 12 39 340 0 8.77. Kansas..........(36) 12 45 971 0 21.6 7. Oklahoma........(63) 12 32 272 1 8.58. Iowa State......(91) 12 40 737 0 18.4 8. Nebraska........(65) 12 32 268 0 8.49. Colorado........(98) 12 32 583 0 18.2 9. Texas A&M.......(69) 12 21 169 0 8.010.Missouri.......(112) 12 23 401 0 17.4 10.Missouri........(74) 12 24 188 0 7.811.Nebraska.......(114) 12 23 399 0 17.3 11.Baylor..........(81) 12 30 228 0 7.612.Texas Tech.....(116) 12 32 531 0 16.6 12.Colorado.......(104) 12 22 123 0 5.6

2006 Big 12 Football Team Statistics Through games of Nov 27, 2006
PUNTING G No. Yards Avg/P PR Avg TB Net/P PASS EFFICIENCY G Att Cmp Pct Int Yds TD Effic--------------------------------------------------------------- --------------------------------------------------------------1. Baylor...........(3) 12 68 3111 45.8 298 4.4 8 39.0 1. Nebraska.........(5) 12 334 207 .620 4 3009 30 164.92. Texas Tech......(10) 12 43 1897 44.1 136 3.2 6 38.2 2. Texas...........(10) 12 331 218 .659 9 2667 29 157.03. Nebraska........(14) 12 55 2180 39.6 70 1.3 2 37.6 3. Oklahoma State..(23) 12 291 159 .546 10 2411 26 146.84. Texas A&M.......(15) 12 49 2202 44.9 242 4.9 6 37.6 4. Oklahoma........(25) 12 273 167 .612 7 2184 18 145.05. Texas...........(18) 12 47 1885 40.1 104 2.2 1 37.5 5. Texas Tech......(25) 12 601 402 .669 10 4358 37 144.86. Oklahoma........(24) 12 48 1928 40.2 64 1.3 4 37.2 6. Missouri........(31) 12 433 274 .633 11 3231 26 140.77. Colorado........(32) 12 56 2353 42.0 299 5.3 0 36.7 7. Texas A&M.......(38) 12 301 184 .611 3 2291 12 136.28. Oklahoma State..(43) 12 47 2089 44.4 316 6.7 4 36.0 8. Baylor..........(60) 12 510 307 .602 17 3300 24 123.49. Iowa State......(49) 12 56 2309 41.2 218 3.9 5 35.6 9. Iowa State......(77) 12 378 213 .563 12 2593 12 118.110.Kansas State....(60) 12 58 2354 40.6 213 3.7 6 34.8 10.Kansas..........(78) 12 363 203 .559 19 2372 19 117.611.Kansas..........(68) 12 59 2276 38.6 123 2.1 6 34.5 11.Kansas State...(105) 12 391 202 .517 18 2470 10 104.012.Missouri........(96) 12 43 1661 38.6 134 3.1 6 32.7 12.Colorado.......(114) 12 254 119 .469 8 1422 7 96.7
|--Gained--||---Lost---| PASS DEF EFFICIENCY G Att Cmp Int Pct. Yds TD EfficTURNOVER MARGIN G Fum Int Tot Fum Int Tot Mar Per/G ---------------------------------------------------------------------------------------------------------------------------- 1. Oklahoma........(11) 12 354 182 14 51.4 2089 10 102.41. Texas A&M.......(14) 12 11 10 21 9 3 12 +9 0.75 2. Texas A&M.......(31) 12 344 184 10 53.5 2242 13 114.92. Texas...........(17) 12 18 12 30 13 9 22 +8 0.67 3. Missouri........(32) 12 346 200 12 57.8 2058 15 115.1 Colorado........(17) 12 12 12 24 8 8 16 +8 0.67 4. Nebraska........(37) 12 390 209 11 53.6 2638 14 116.64. Oklahoma State..(38) 12 14 9 23 9 10 19 +4 0.33 5. Kansas..........(49) 12 470 248 12 52.8 3229 22 120.8 Nebraska........(38) 12 11 11 22 14 4 18 +4 0.33 6. Texas Tech......(50) 12 334 194 10 58.1 2108 16 120.96. Texas Tech......(50) 12 13 10 23 11 10 21 +2 0.17 7. Kansas State....(51) 12 356 208 10 58.4 2293 16 121.7 Missouri........(50) 12 14 12 26 13 11 24 +2 0.17 8. Texas...........(73) 12 386 224 12 58.0 2797 19 128.98. Kansas State....(66) 12 17 10 27 9 18 27 +0 0.00 9. Baylor..........(74) 12 364 210 16 57.7 2605 24 130.89. Oklahoma........(79) 12 10 14 24 21 7 28 -4 -0.33 10.Colorado........(92) 12 390 261 12 66.9 2742 22 138.410.Iowa State......(87) 12 9 6 15 8 12 20 -5 -0.42 11.Oklahoma State..(98) 12 339 208 9 61.4 2658 19 140.4 Kansas..........(87) 12 16 12 28 14 19 33 -5 -0.42 12.Iowa State.....(115) 12 374 271 6 72.5 2862 26 156.512.Baylor..........(96) 12 11 16 27 17 17 34 -7 -0.58
FIRST DOWNS G Rush Pass Pen Total 3RD-DN CONVERSIONS G Conv Att Pct----------------------------------------------- -------------------------------------------1. Texas Tech.......... 12 58 202 21 281 1. Texas A&M........... 12 85 166 51.22. Missouri............ 12 97 155 18 270 2. Missouri............ 12 87 177 49.23. Texas............... 12 122 115 30 267 3. Nebraska............ 12 82 170 48.24. Nebraska............ 12 113 125 13 251 4. Oklahoma State...... 12 69 154 44.85. Oklahoma State...... 12 128 109 10 247 5. Oklahoma............ 12 65 152 42.86. Texas A&M........... 12 136 92 16 244 6. Texas............... 12 59 141 41.87. Iowa State.......... 12 86 118 23 227 7. Iowa State.......... 12 61 158 38.68. Kansas.............. 12 107 98 19 224 8. Baylor.............. 12 63 165 38.29. Oklahoma............ 12 99 110 12 221 9. Kansas.............. 12 61 167 36.510.Baylor.............. 12 42 143 24 209 10.Kansas State........ 12 60 166 36.111.Kansas State........ 12 77 105 15 197 11.Texas Tech.......... 12 48 139 34.512.Colorado............ 12 100 73 9 182 12.Colorado............ 12 53 159 33.3
OPPONENT 1ST DOWNS G Rush Pass Pen Total OPP 3RD-DN CONVERT G Conv Att Pct----------------------------------------------- -------------------------------------------1. Oklahoma............ 12 73 95 8 176 1. Texas A&M........... 12 42 147 28.62. Texas............... 12 48 118 18 184 2. Oklahoma............ 12 51 163 31.33. Texas A&M........... 12 79 98 20 197 3. Nebraska............ 12 55 165 33.34. Nebraska............ 12 75 127 9 211 4. Oklahoma State...... 12 58 163 35.65. Missouri............ 12 95 101 20 216 5. Texas............... 12 56 157 35.76. Kansas State........ 12 91 104 23 218 6. Kansas State........ 12 62 171 36.37. Colorado............ 12 73 134 15 222 7. Missouri............ 12 64 166 38.68. Kansas.............. 12 77 135 16 228 8. Kansas.............. 12 75 186 40.3 Texas Tech.......... 12 96 110 22 228 9. Texas Tech.......... 12 67 165 40.610.Iowa State.......... 12 88 137 11 236 10.Baylor.............. 12 69 163 42.311.Oklahoma State...... 12 100 119 19 238 11.Iowa State.......... 12 71 157 45.212.Baylor.............. 12 125 104 15 244 12.Colorado............ 12 85 178 47.8
SACKS BY G Sacks Yards SACKS AGAINST G Sacks Yards--------------------------------------- ---------------------------------------1. Kansas State........ 12 39 221 1. Oklahoma............ 12 13 872. Oklahoma State...... 12 34 239 2. Texas Tech.......... 12 16 115 Texas............... 12 34 278 Missouri............ 12 16 1404. Missouri............ 12 33 200 4. Texas A&M........... 12 17 1005. Kansas.............. 12 31 208 Oklahoma State...... 12 17 1146. Texas Tech.......... 12 28 163 6. Texas............... 12 19 1367. Nebraska............ 12 25 200 7. Nebraska............ 12 25 1848. Iowa State.......... 12 24 142 Kansas State........ 12 25 175 Colorado............ 12 24 172 9. Kansas.............. 12 26 13610.Oklahoma............ 12 20 174 10.Colorado............ 12 30 17211.Texas A&M........... 12 19 136 11.Baylor.............. 12 36 32012.Baylor.............. 12 11 83 12.Iowa State.......... 12 38 244

2006 Big 12 Football Team Statistics Through games of Nov 27, 2006
PENALTIES G No Yds Avg/G FIELD GOALS G Made Att Pct------------------------------------------ --------------------------------------------1. Iowa State.......... 12 56 429 35.8 1. Oklahoma............ 12 17 18 .9442. Oklahoma............ 12 60 461 38.4 2. Missouri............ 12 17 20 .8503. Missouri............ 12 59 499 41.6 3. Oklahoma State...... 12 9 11 .8184. Nebraska............ 12 65 545 45.4 4. Baylor.............. 12 11 14 .7865. Kansas.............. 12 67 554 46.2 5. Iowa State.......... 12 8 11 .7276. Oklahoma State...... 12 65 557 46.4 6. Kansas.............. 12 13 18 .7227. Colorado............ 12 63 559 46.6 7. Nebraska............ 12 5 7 .7148. Texas A&M........... 12 72 590 49.2 8. Texas Tech.......... 12 14 20 .7009. Texas............... 12 66 601 50.1 Texas............... 12 7 10 .70010.Kansas State........ 12 80 673 56.1 10.Kansas State........ 12 16 23 .69611.Baylor.............. 12 77 678 56.5 11.Texas A&M........... 12 13 19 .68412.Texas Tech.......... 12 92 826 68.8 12.Colorado............ 12 19 28 .679
OPPONENT PENALTIES G No Yds Avg/G PAT KICKING G Made Att Pct------------------------------------------ --------------------------------------------1. Baylor.............. 12 94 814 67.8 1. Texas Tech.......... 12 46 46 1.0002. Texas............... 12 105 809 67.4 Missouri............ 12 40 40 1.0003. Iowa State.......... 12 72 701 58.4 Kansas State........ 12 32 32 1.0004. Colorado............ 12 84 674 56.2 Iowa State.......... 12 24 24 1.0005. Kansas.............. 12 69 609 50.8 Colorado............ 12 19 19 1.0006. Texas Tech.......... 12 65 590 49.2 6. Nebraska............ 12 52 53 .9817. Missouri............ 12 63 547 45.6 7. Oklahoma............ 12 42 43 .9778. Nebraska............ 12 68 513 42.8 8. Baylor.............. 12 32 33 .9709. Texas A&M........... 12 59 508 42.3 9. Texas............... 12 58 60 .96710.Kansas State........ 12 58 495 41.2 10.Oklahoma State...... 12 53 55 .96411.Oklahoma............ 12 64 492 41.0 11.Texas A&M........... 12 35 37 .94612.Oklahoma State...... 12 48 379 31.6 12.Kansas.............. 12 37 40 .925
4TH-DN CONVERSIONS G Conv Att Pct TIME OF POSSESSION G Total Time Avg/G------------------------------------------- ----------------------------------------------1. Nebraska............ 12 13 18 72.2 1. Texas A&M........... 12 401:44 33:282. Oklahoma............ 12 7 10 70.0 2. Nebraska............ 12 396:11 33:003. Texas............... 12 10 15 66.7 3. Oklahoma............ 12 377:58 31:29 Oklahoma State...... 12 12 18 66.7 4. Texas............... 12 374:56 31:14 Texas A&M........... 12 8 12 66.7 5. Kansas.............. 12 366:28 30:326. Missouri............ 12 8 16 50.0 6. Colorado............ 12 348:13 29:01 Kansas.............. 12 6 12 50.0 7. Iowa State.......... 12 347:51 28:598. Texas Tech.......... 12 10 21 47.6 8. Oklahoma State...... 12 347:26 28:579. Iowa State.......... 12 11 24 45.8 9. Texas Tech.......... 12 335:52 27:5910.Kansas State........ 12 9 20 45.0 10.Missouri............ 12 334:32 27:5211.Baylor.............. 12 4 11 36.4 11.Kansas State........ 12 333:59 27:4912.Colorado............ 12 2 13 15.4 Baylor.............. 12 333:57 27:49
OPP 4TH-DN CONVERT G Conv Att Pct KICKOFF COVERAGE G No. Yards Avg Retn TB NetAvg------------------------------------------- ------------------------------------------------------------1. Kansas.............. 12 4 16 25.0 1. Oklahoma............ 12 73 4418 60.5 680 29 43.32. Missouri............ 12 6 18 33.3 2. Oklahoma State...... 12 76 4824 63.5 1012 28 42.83. Nebraska............ 12 9 22 40.9 3. Texas A&M........... 12 70 4246 60.7 817 23 42.44. Oklahoma............ 12 7 17 41.2 4. Texas Tech.......... 12 72 4495 62.4 685 38 42.45. Texas............... 12 5 12 41.7 5. Kansas State........ 12 61 3602 59.0 554 25 41.86. Baylor.............. 12 5 11 45.5 6. Colorado............ 12 48 2956 61.6 392 28 41.87. Colorado............ 12 9 17 52.9 7. Kansas.............. 12 69 4367 63.3 814 35 41.38. Texas Tech.......... 12 6 11 54.5 8. Nebraska............ 12 72 4183 58.1 988 12 41.09. Kansas State........ 12 15 24 62.5 9. Iowa State.......... 12 46 2735 59.5 588 13 41.0 Texas A&M........... 12 10 16 62.5 10.Texas............... 12 78 4600 59.0 938 24 40.811.Iowa State.......... 12 8 12 66.7 11.Missouri............ 12 71 4263 60.0 1050 19 39.912.Oklahoma State...... 12 11 16 68.8 12.Baylor.............. 12 56 3306 59.0 716 24 37.7
RED ZONE OFFENSE G RedZone Percent TDs R/P FG-AT Fumb/Int/Downs/Other--------------------------------------------------------------------------------1. Oklahoma............ 12 42-45 93.3 28 18/10 14-14 1/ 1/ 0/ 12. Nebraska............ 12 41-46 89.1 38 20/18 3-4 2/ 1/ 0/ 13. Texas Tech.......... 12 45-52 86.5 31 8/23 14-18 1/ 0/ 2/ 04. Texas A&M........... 12 44-51 86.3 32 25/7 12-16 1/ 1/ 0/ 15. Missouri............ 12 47-56 83.9 32 14/18 15-16 1/ 0/ 4/ 36. Baylor.............. 12 31-37 83.8 23 7/16 8-8 0/ 3/ 1/ 27. Oklahoma State...... 12 37-45 82.2 31 20/11 6-6 2/ 0/ 2/ 48. Texas............... 12 43-53 81.1 36 23/13 7-8 4/ 1/ 3/ 19. Iowa State.......... 12 29-37 78.4 23 16/7 6-8 2/ 0/ 3/ 110.Kansas.............. 12 37-50 74.0 29 17/12 8-9 5/ 5/ 1/ 111.Colorado............ 12 24-33 72.7 11 8/3 13-15 2/ 0/ 5/ 112.Kansas State........ 12 21-32 65.6 12 8/4 9-12 1/ 1/ 3/ 3

2006 Big 12 Football Team Statistics Through games of Nov 27, 2006
RED ZONE DEFENSE G RedZone Percent TDs R/P FG-AT Fumb/Int/Downs/Other--------------------------------------------------------------------------------1. Texas A&M........... 12 24-33 72.7 17 11/6 7-7 2/ 2/ 3/ 22. Colorado............ 12 32-42 76.2 27 10/17 5-6 3/ 1/ 3/ 23. Missouri............ 12 26-34 76.5 20 9/11 6-8 0/ 1/ 4/ 14. Nebraska............ 12 29-37 78.4 19 9/10 10-11 1/ 1/ 4/ 15. Oklahoma............ 12 22-28 78.6 13 8/5 9-10 2/ 0/ 2/ 1 Kansas State........ 12 33-42 78.6 25 12/13 8-9 2/ 2/ 2/ 27. Texas Tech.......... 12 30-36 83.3 18 13/5 12-12 2/ 1/ 1/ 28. Baylor.............. 12 36-42 85.7 29 14/15 7-11 1/ 0/ 0/ 29. Kansas.............. 12 33-38 86.8 19 10/9 14-14 1/ 0/ 4/ 010.Texas............... 12 20-23 87.0 14 4/10 6-8 0/ 0/ 1/ 011.Iowa State.......... 12 41-47 87.2 33 16/17 8-10 2/ 0/ 1/ 112.Oklahoma State...... 12 36-40 90.0 23 11/12 13-13 1/ 2/ 1/ 0
ON-SIDE KICK SUCCESS G OnSide Percent ON-SIDE KICK ALLOWED G OnSide Percent------------------------------------------ ------------------------------------------1. Kansas State........ 12 2-2 100.0 1. Kansas State........ 12 0-3 0.0 Oklahoma State...... 12 1-1 100.0 Missouri............ 12 0-1 0.0 Texas A&M........... 12 1-1 100.0 Texas A&M........... 12 0-1 0.04. Colorado............ 12 0-3 0.0 Nebraska............ 12 0-1 0.0 Iowa State.......... 12 0-1 0.0 Iowa State.......... 12 0-0 0.0 Oklahoma............ 12 0-1 0.0 Baylor.............. 12 0-0 0.0 Texas Tech.......... 12 0-1 0.0 Texas............... 12 0-0 0.0 Texas............... 12 0-1 0.0 8. Kansas.............. 12 1-3 33.3 Baylor.............. 12 0-0 0.0 9. Colorado............ 12 1-2 50.0 Kansas.............. 12 0-0 0.0 10.Oklahoma............ 12 2-3 66.7 Missouri............ 12 0-0 0.0 11.Oklahoma State...... 12 1-1 100.0 Nebraska............ 12 0-0 0.0 Texas Tech.......... 12 1-1 100.0

2006 Big 12 Football Individual Statistics Through games of Nov 27, 2006 (NCAA Rankings in Parentheses)
RUSHING Team Cl G Att Yds Avg TD Long Yds/G INTERCEPTIONS Team Cl G Int Yds TD---------------------------------------------------------------- -----------------------------------------------1. Cornish, Jon....(10) KU SR 12 250 1457 5.8 8 69 121.4 1. Talib, Aqib......(4) KU SO 10 6 82 02. Jackson, Brandon(47) NU JR 12 168 881 5.2 7 48 73.4 2. Wheatley, Terren(19) CU JR 12 5 26 03. Charles, Jamaal.(48) UT SO 11 151 805 5.3 7 46 73.2 Ross, Aaron.....(19) UT SR 12 5 7 04. Temple, Tony....(53) MU JR 12 173 869 5.0 5 39 72.4 4. Wilson, C.J.....(50) BU SR 12 4 98 15. Savage,Dantrell.(55) OSU JR 10 107 708 6.6 7 70 70.8 Griffin, Michael(50) UT SR 12 4 41 06. Woods, Shannon..(64) TTU SO 12 133 817 6.1 7 51 68.1 6. Watts, Marcus....... KSU JR 8 3 68 07. Patrick, Allen..(65) OU JR 10 144 665 4.6 3 65 66.5 McBath, Darcel..(98) TTU SO 12 3 66 08. Goodson, Mike...(72) TAMU FR 12 114 785 6.9 4 64 65.4 Webb, Anthony...(98) KU FR 12 3 45 19. Charles, Hugh...(76) CU JR 12 139 779 5.6 1 44 64.9 Todd, James.....(98) BU SR 12 3 25 010.Lane, Jorvorskie(93) TAMU SO 12 159 689 4.3 19 25 57.4 Latimer, Zach...(98) OU SR 12 3 23 1
PASSING AVG/GAME Team Cl G Att Cmp Int Pct. Yds TD Avg/G PASS EFFICIENCY Team Cl G Att Cmp Int Pct. Yds TD Eff.------------------------------------------------------------------ ------------------------------------------------------------------1. Harrell, Graham..... TTU SO 12 562 376 10 66.9 4110 36 342.5 1. McCoy, Colt......(5) UT FR 12 278 191 7 68.7 2262 27 164.12. Daniel, Chase....... MU SO 12 423 271 10 64.1 3197 26 266.4 2. Taylor, Zac......(9) NU SR 12 315 196 4 62.2 2789 24 159.23. Bell, Shawn......... BU SR 10 383 241 10 62.9 2582 19 258.2 3. Reid,Bobby......(14) OSU SO 12 238 133 10 55.9 2054 23 151.94. Taylor, Zac......... NU SR 12 315 196 4 62.2 2789 24 232.4 4. Harrell, Graham.(22) TTU SO 12 562 376 10 66.9 4110 36 145.95. Meyer,Bret.......... ISU JR 12 374 211 12 56.4 2546 12 212.2 5. Thompson, Paul..(23) OU SR 12 270 166 7 61.5 2169 18 145.86. McCoy, Colt......... UT FR 12 278 191 7 68.7 2262 27 188.5 6. Daniel, Chase...(28) MU SO 12 423 271 10 64.1 3197 26 143.17. Thompson, Paul...... OU SR 12 270 166 7 61.5 2169 18 180.8 7. McGee, Stephen..(37) TAMU SO 12 287 177 2 61.7 2118 11 134.98. McGee, Stephen...... TAMU SO 12 287 177 2 61.7 2118 11 176.5 8. Bell, Shawn.....(42) BU SR 10 383 241 10 62.9 2582 19 130.79. Reid,Bobby.......... OSU SO 12 238 133 10 55.9 2054 23 171.2 9. Meier, Kerry....(58) KU FR 9 184 104 10 56.5 1193 13 123.410.Freeman, Josh....... KSU FR 10 249 130 13 52.2 1651 6 165.1 10.Meyer,Bret......(75) ISU JR 12 374 211 12 56.4 2546 12 117.8
TOTAL OFFENSE Team Cl G Rush Pass Plays Total Yds/G PUNT RETURN AVG Team Cl G Ret Yds TD Long Avg-------------------------------------------------------------- ----------------------------------------------------------1. Harrell, Graham..(3) TTU SO 12 -60 4110 589 4050 337.5 1. Cox,Perrish.....(12) OSU FR 11 24 308 0 63 12.82. Daniel, Chase....(5) MU SO 12 393 3197 561 3590 299.2 2. Figurs, Yamon...(16) KSU SR 11 20 245 1 81 12.23. Bell, Shawn.....(10) BU SR 10 -137 2582 410 2445 244.5 3. Ross, Aaron.....(21) UT SR 12 20 231 1 46 11.64. McGee, Stephen..(30) TAMU SO 12 635 2118 425 2753 229.4 4. Lamb, Jonathan..(26) KU SR 12 15 165 0 52 11.05. Taylor, Zac.....(31) NU SR 12 -43 2789 364 2746 228.8 5. Teasley, Q......(29) BU SO 9 11 114 0 47 10.46. Meyer,Bret......(34) ISU JR 12 177 2546 511 2723 226.9 6. Amendola, Danny.(41) TTU SO 12 38 340 0 54 8.97. Reid,Bobby......(42) OSU SO 12 466 2054 347 2520 210.0 7. Nunn, Terrence..(52) NU JR 12 18 153 0 31 8.58. McCoy, Colt.....(50) UT FR 12 167 2262 344 2429 202.4 8. Smith, Reggie...(53) OU SO 12 31 260 1 62 8.49. Thompson, Paul..(56) OU SR 12 111 2169 329 2280 190.0 9. Sims, Carl......(61) BU SO 9 15 114 0 24 7.610.Meier, Kerry....(69) KU FR 9 346 1193 283 1539 171.0 10.Schroeder, Chad.(62) TAMU SR 12 18 134 0 30 7.4
RECEPTIONS/GAME Team Cl G Rec Yds TD Long Avg/C Rec/G KICK RETURN AVG Team Cl G Ret Yds TD Long Avg---------------------------------------------------------------- ----------------------------------------------------------1. Johnson, Robert..(3) TTU SR 11 80 774 10 37 9.7 7.27 1. Jones,Grant......(1) OSU SR 12 15 456 1 89 30.42. Filani, Joel.....(9) TTU SR 12 80 1138 12 76 14.2 6.67 2. Herford, Marcus.(18) KU SO 11 29 757 0 88 26.13. Woods, Shannon..(14) TTU SO 12 72 553 2 54 7.7 6.00 3. Cox,Perrish.....(38) OSU FR 11 25 595 1 96 23.84. Zeigler, D......(43) BU SR 11 54 741 3 79 13.7 4.91 4. Baker, Mikail...(40) BU SO 12 22 522 0 58 23.75. Bowman,Adarius..(44) OSU JR 12 57 1131 11 75 19.8 4.75 5. Teasley, Q......(51) BU SO 9 15 341 0 59 22.76. Shelton, Trent..(62) BU SR 12 53 802 8 75 15.1 4.42 6. Moses,Milan.....(60) ISU JR 9 15 325 0 43 21.7 Coffman, Chase..(62) MU SO 12 53 555 8 25 10.5 4.42 7. Goldsmith, Earl.(85) MU SO 10 13 253 0 32 19.58. Franklin, Willia(66) MU JR 11 48 829 6 68 17.3 4.36 8. Woods, Shannon..(95) TTU SO 12 15 278 0 38 18.59. Kelly, Malcolm..(68) OU SO 12 52 851 8 73 16.4 4.33 9. Robinson, Stepho(99) CU JR 12 15 261 0 26 17.410.Amendola, Danny..... TTU SO 12 47 482 5 45 10.3 3.92
RECEIVE YDS/GAME Team Cl G Rec Yds TD Long Avg/C Yds/G PUNTING Team Cl G Punts Yds Long Avg---------------------------------------------------------------- ---------------------------------------------------------1. Filani, Joel.....(8) TTU SR 12 80 1138 12 76 14.2 94.8 1. Sepulveda, D.....(1) BU SR 12 66 3068 78 46.52. Bowman,Adarius...(9) OSU JR 12 57 1131 11 75 19.8 94.2 2. Fodge,Matt.......(3) OSU SO 12 45 2069 72 46.03. Franklin, Willia(24) MU JR 11 48 829 6 68 17.3 75.4 3. Brantly, Justin..(4) TAMU SO 12 47 2131 62 45.34. Kelly, Malcolm..(34) OU SO 12 52 851 8 73 16.4 70.9 4. Reyes, Alex......... TTU SR 12 42 1897 61 45.25. Johnson, Robert.(37) TTU SR 11 80 774 10 37 9.7 70.4 5. DiLallo,Matthew.(16) CU FR 12 47 2056 73 43.76. Zeigler, D......(44) BU SR 11 54 741 3 79 13.7 67.4 6. Cohen, Michael...... OU JR 11 37 1559 75 42.17. Shelton, Trent..(46) BU SR 12 53 802 8 75 15.1 66.8 7. Reyer, Tim......(26) KSU JR 12 56 2354 65 42.08. Sweed, Limas....(68) UT JR 12 43 731 11 60 17.0 60.9 8. Johnson, Greg...(39) UT SR 11 40 1650 54 41.29. Blythe,Todd.....(97) ISU JR 9 34 484 8 31 14.2 53.8 9. Brandtner,Mike..(40) ISU FR 12 56 2309 73 41.210.Woods,D'Juan........ OSU SR 12 38 621 5 72 16.3 51.8 10.Titchener, Dan..(56) NU SO 12 54 2145 58 39.7
ALL PURPOSE Team Cl G Rush Rcv PR KR Yds Avg/G SCORING Team Cl G TD XPT FG 2XP Pts Pts/G----------------------------------------------------------------- -------------------------------------------------------------1. Cornish, Jon....(17) KU SR 12 1457 194 0 0 1651 137.6 1. Lane, Jorvorskie.(6) TAMU SO 12 19 0 0 0 114 9.52. Woods, Shannon..(18) TTU SO 12 817 553 0 278 1648 137.3 2. Trlica, Alex....(17) TTU JR 11 0 46 14 0 88 8.03. Jackson, Brandon(51) NU JR 12 881 291 0 121 1293 107.8 3. Hartley, Garret.(22) OU JR 12 0 42 17 0 93 7.84. Filani, Joel....(78) TTU SR 12 34 1138 0 0 1172 97.7 4. Wolfert, Jeff...(27) MU SO 12 0 40 17 0 91 7.65. Bowman,Adarius..(85) OSU JR 12 1 1131 0 0 1132 94.3 5. Snodgrass, Jeff.(54) KSU SR 12 0 31 16 0 79 6.66. Patton, Leon....(96) KSU FR 11 595 125 0 256 976 88.7 6. Webb, Scott.....(68) KU JR 12 0 37 13 0 76 6.37. Young, Selvin....... UT SR 11 580 129 10 233 952 86.5 Crosby, Mason...(68) CU SR 12 0 19 19 0 76 6.38. Lucky, Marlon....... NU SO 12 640 272 0 113 1025 85.4 8. Ricks,Jason.....(74) OSU SO 11 0 43 8 0 67 6.19. Cox,Perrish......... OSU FR 11 0 0 308 595 924 84.0 9. Filani, Joel....(77) TTU SR 12 12 0 0 0 72 6.010.Figurs, Yamon....... KSU SR 11 71 418 245 186 920 83.6 10.Johnson, Robert.(96) TTU SR 11 10 0 0 2 62 5.6

2006 Big 12 Football Individual Statistics Through games of Nov 27, 2006
SCORING (TDs) Team Cl G TD Rush Pass Ret PAT Pts Pts/G FIELD GOALS Team Cl G FG FGA Pct. FG/G------------------------------------------------------------------ --------------------------------------------------------1. Lane, Jorvorskie.... TAMU SO 12 19 19 0 0 0 114 9.5 1. Crosby, Mason....(6) CU SR 12 19 28 67.9 1.582. Filani, Joel........ TTU SR 12 12 0 12 0 0 72 6.0 2. Hartley, Garret.(12) OU JR 12 17 18 94.4 1.423. Johnson, Robert..... TTU SR 11 10 0 10 0 1 62 5.6 Wolfert, Jeff...(12) MU SO 12 17 19 89.5 1.424. Bowman,Adarius...... OSU JR 12 11 0 11 0 0 66 5.5 4. Snodgrass, Jeff.(20) KSU SR 12 16 23 69.6 1.33 Sweed, Limas........ UT JR 12 11 0 11 0 0 66 5.5 5. Trlica, Alex....(27) TTU JR 11 14 20 70.0 1.276. Glenn, Cody......... NU SO 9 8 8 0 0 0 48 5.3 6. Webb, Scott.....(46) KU JR 12 13 18 72.2 1.08 Blythe,Todd......... ISU JR 9 8 0 8 0 0 48 5.3 7. Neumann, Layne..(51) TAMU SR 12 12 15 80.0 1.008. Woods, Shannon...... TTU SO 12 9 7 2 0 0 54 4.5 8. Havens, Ryan....(61) BU SR 12 11 14 78.6 0.92 Cornish, Jon........ KU SR 12 9 8 1 0 0 54 4.5 9. Ricks,Jason.....(82) OSU SO 11 8 10 80.0 0.73 Jackson, Brandon.... NU JR 12 9 7 2 0 0 54 4.5 10.Culbertson,Bret.(85) ISU JR 12 8 11 72.7 0.67
SCORING (KICK) Team Cl G PATs FGs Pts Pts/G FIELD GOAL PCT Team Cl G FG FGA Long Pct.------------------------------------------------------------ -------------------------------------------------------1. Trlica, Alex........ TTU JR 11 46-46 14-20 88 8.0 1. Hartley, Garret..... OU JR 12 17 18 46 94.42. Hartley, Garret..... OU JR 12 42-43 17-18 93 7.8 2. Wolfert, Jeff....... MU SO 12 17 19 54 89.53. Wolfert, Jeff....... MU SO 12 40-40 17-19 91 7.6 3. Neumann, Layne...... TAMU SR 12 12 15 39 80.04. Snodgrass, Jeff..... KSU SR 12 31-31 16-23 79 6.6 4. Havens, Ryan........ BU SR 12 11 14 47 78.65. Crosby, Mason....... CU SR 12 19-19 19-28 76 6.3 5. Webb, Scott......... KU JR 12 13 18 49 72.2 Webb, Scott......... KU JR 12 37-39 13-18 76 6.3 6. Trlica, Alex........ TTU JR 11 14 20 49 70.07. Ricks,Jason......... OSU SO 11 43-45 8-10 67 6.1 7. Snodgrass, Jeff..... KSU SR 12 16 23 53 69.68. Congdon, Jordan..... NU SO 12 52-53 5-7 67 5.6 8. Crosby, Mason....... CU SR 12 19 28 56 67.99. Havens, Ryan........ BU SR 12 32-33 11-14 65 5.410.Neumann, Layne...... TAMU SR 12 23-25 12-15 59 4.9
PAT KICKING PCT Team Cl G Made Att Pct. --------------------------------------------------- 1. Trlica, Alex........ TTU JR 11 46 46 100.0 Wolfert, Jeff....... MU SO 12 40 40 100.0 Snodgrass, Jeff..... KSU SR 12 31 31 100.0 Culbertson,Bret..... ISU JR 12 24 24 100.0 5. Congdon, Jordan..... NU SO 12 52 53 98.1 6. Hartley, Garret..... OU JR 12 42 43 97.7 Johnson, Greg....... UT SR 11 42 43 97.7 8. Havens, Ryan........ BU SR 12 32 33 97.0 9. Ricks,Jason......... OSU SO 11 43 45 95.6 10.Webb, Scott......... KU JR 12 37 39 94.9

2006 Big 12 Football Individual Statistics Through games of Nov 27, 2006
TACKLES (All positions) SACKS Team Cl G Pos Solo Ast Yds Total Avg/GPlayer Team Cl G Pos Solo Ast Total Avg/G Sack -------------------------------------------------------------------------------------------------------------------------------- 1. Wright, Abraham..(4) CU SR 12 DE 12 0 95 12.0 1.001. Bowen,Alvin......(1) ISU JR 12 LB 95 60 155 12.9 1.0 2. Campbell, Ian....(5) KSU SO 12 DE 11 1 71 11.5 0.962. McKenzie,Tyrone..(8) ISU SO 12 LB 59 70 129 10.8 2.0 3. DeGrate,Victor..(20) OSU SR 10 DL 8 1 49 8.5 0.853. Dizon, Jordon...(12) CU JR 12 LB 64 57 121 10.1 4.5 4. Moorehead,Shawn.(29) ISU SR 12 DE 8 1 41 8.5 0.714. Banks,Jon.......(52) ISU JR 12 DB 58 41 99 8.2 0.0 5. Peterson,Nathan.(34) OSU JR 12 DL 7 2 67 8.0 0.675. Bacon, Marcus...(54) MU SR 12 LB 40 58 98 8.2 3.0 6. Harrington, Chri(43) TAMU JR 12 DL 7 1 58 7.5 0.626. Archer, Brandon.(58) KSU SR 12 LB 51 46 97 8.1 2.5 Crowder, Tim....(29) UT SR 12 DE 7 1 48 7.5 0.627. Alexander, Rufu.(63) OU SR 12 LB 55 40 95 7.9 2.0 8. Curvey,Brent....(51) ISU SR 12 DL 6 2 46 7.0 0.588. Diles, Zach.....(75) KSU SR 12 LB 42 50 92 7.7 3.5 9. Jackson, Xzavie.(41) MU SR 11 DE 7 0 41 7.0 0.649. Warren, Justin..(85) TAMU SR 12 LB 30 60 90 7.5 1.0 10.Carriker, Adam..(73) NU SR 12 DE 6 0 36 6.0 0.50 Rivera, Mike....(85) KU SO 12 LB 50 40 90 7.5 1.511.Pawelek, Joe........ BU FR 12 LB 46 40 86 7.2 2.0 TACKLES FOR LOSS Team Cl G Pos Solo Ast Yds Total Avg/G Harrington, Dedrick. MU SR 12 LB 41 45 86 7.2 3.5 ----------------------------------------------------------------13.Stratton, Brock..... TTU JR 12 LB 37 47 84 7.0 0.5 1. Campbell, Ian...(19) KSU SO 12 DE 14 4 79 16.0 1.33 Washington,Thaddaeus CU SR 12 LB 46 38 84 7.0 0.5 2. McClinton, Jame.(37) KU JR 12 DT 11 7 60 14.5 1.2115.Kemp, Jerome........ KU SR 12 DB 47 35 82 6.8 1.0 3. Wright, Abraham.(37) CU SR 12 DE 13 2 99 14.0 1.17 Mortensen, Joe...... KU SO 12 LB 33 49 82 6.8 3.5 4. Crowder, Tim....(37) UT SR 12 DE 12 2 63 13.0 1.0817.Griffin, Michael.... UT SR 12 DB 56 22 78 6.5 1.0 Bobino, Rashad..(56) UT SO 12 LB 12 2 42 13.0 1.08 Garcia, Joe......... TTU JR 12 DB 43 35 78 6.5 0.0 Carriker, Adam..(56) NU SR 12 DE 11 4 52 13.0 1.0819.Bullitt, Melvin..... TAMU SR 12 DB 27 49 76 6.3 0.0 7. Curvey,Brent....(67) ISU SR 12 DL 11 3 57 12.5 1.04 Berg,Caleb.......... ISU JR 12 DB 41 35 76 6.3 0.0 Fountain,Marque.(76) OSU JR 12 DL 11 3 64 12.5 1.0421.Moore, Nick......... BU JR 12 LB 32 43 75 6.2 0.0 9. Jackson, Xzavie.(55) MU SR 11 DE 11 2 55 12.0 1.09 Sexton,Andre........ OSU FR 12 DB 57 18 75 6.2 0.0 10.Moorehead,Shawn.(76) ISU SR 12 DE 11 2 46 12.0 1.0023.Overstreet, David... MU SR 12 DB 31 43 74 6.2 0.524.Latimer, Zach....... OU SR 12 LB 36 37 73 6.1 2.0 FUMBLES FORCED Team Cl G Num Avg/G25.Linguist, M......... BU SR 12 DB 36 35 71 5.9 1.0 ----------------------------------------------26.McBath, Darcel...... TTU SO 12 DB 33 37 70 5.8 0.0 1. McKenzie,Tyrone..... ISU SO 12 4 0.3327.Christopher, Brock.. MU SO 12 LB 28 41 69 5.8 0.0 Griffin, Michael.... UT SR 12 4 0.3328.Williams, Darie..... OU JR 11 DB 36 26 62 5.6 2.0 3. Crowder, Tim........ UT SR 12 3 0.25 Huffman, A.......... TTU SR 11 DB 46 16 62 5.6 0.0 McBean,Ryan......... OSU SR 12 3 0.2530.Bradley, Stewart.... NU SR 12 LB 35 32 67 5.6 0.0 Como, Paul.......... KU SR 12 3 0.2531.Jones, Brad......... CU SO 12 LB 31 35 66 5.5 0.5 Sexton,Andre........ OSU FR 12 3 0.25 Lavine,Patrick...... OSU FR 12 LB 40 26 66 5.5 2.0 Ruud, Bo............ NU JR 12 3 0.25 Griffin, Marcus..... UT JR 10 DB 44 11 55 5.5 0.0 McClinton, Jame..... KU JR 12 3 0.25 Crawford, Dwain..... BU SO 10 DB 26 29 55 5.5 0.0 Ratliff, Jake....... TTU SO 12 3 0.2535.Garvin, Byron....... KSU JR 11 DB 39 19 58 5.3 2.0 Ross, Aaron......... UT SR 12 3 0.2536.Bobino, Rashad...... UT SO 12 LB 41 22 63 5.2 2.0 Johnson,Rodrick..... OSU JR 12 LB 42 21 63 5.2 2.0 FUMBLES RCVD Team Cl G Num Avg/G38.Jones, Andre........ NU JR 12 DB 41 21 62 5.2 0.0 ----------------------------------------------39.Terrell, Darnell.... MU JR 12 CB 32 29 61 5.1 0.0 1. Davis, Braelon...... BU JR 11 3 0.27 Williams, Kyle...... KSU SR 12 DB 34 27 61 5.1 0.0 Lewis, Aaron........ UT SO 11 3 0.27 Green, Tierre....... NU JR 12 DB 34 27 61 5.1 0.0 3. Brorsen, Russel..... KU SO 12 3 0.2542.Harris, Nic......... OU SO 12 DB 33 27 60 5.0 1.5 Williams, Lorenzo... MU JR 12 3 0.25 Ruud, Bo............ NU JR 12 LB 32 28 60 5.0 2.0 Campbell, Ian....... KSU SO 12 3 0.25 Campbell, Ian....... KSU SO 12 DE 40 20 60 5.0 11.5 Bacon, Marcus....... MU SR 12 3 0.25 McKeon, Corey....... NU JR 11 LB 26 29 55 5.0 1.0 Bradley, Stewart.... NU SR 12 3 0.2546.Wilson, C.J......... BU SR 12 CB 36 23 59 4.9 0.0 Dawson, Keyunta..... TTU SR 12 3 0.2547.Tupe, Misi.......... TAMU JR 11 LB 18 36 54 4.9 1.0 9. Nitschmann, S....... TTU SR 9 2 0.2248.Dawson, Keyunta..... TTU SR 12 DE 27 31 58 4.8 5.0 10.COLLIER, Blake...... TTU FR 10 2 0.20 Van Zant,Martel..... OSU JR 12 DB 40 18 58 4.8 0.050.Derry, Scott........ UT JR 12 LB 38 19 57 4.8 1.0 PASSES DEFENDED Team Cl G Brup Int Total Avg/G -------------------------------------------------------- 1. Talib, Aqib......... KU SO 10 22 6 28 2.80 2. Ross, Aaron......... UT SR 12 15 5 20 1.67 3. Wheatley, Terrence.. CU JR 12 7 5 12 1.00 4. Grixby, Cortney..... NU JR 12 10 1 11 0.92 Griffin, Michael.... UT SR 12 7 4 11 0.92 6. Peterson, Jordan.... TAMU FR 10 8 1 9 0.90 7. Walker, Marcus...... OU JR 12 8 2 10 0.83 Wilson, C.J......... BU SR 12 6 4 10 0.83 Smith, Reggie....... OU SO 12 8 2 10 0.83 10.Parker, Chris....... TTU JR 10 6 2 8 0.80

2006 Big 12 Football Individual Statistics Through games of Nov 27, 2006
TACKLES (Ends/lineman) TACKLES (Defensive backs)Player Team Cl G Pos Solo Ast Total Avg/G Sack Player Team Cl G Pos Solo Ast Total Avg/G Sack---------------------------------------------------------------- ----------------------------------------------------------------1. Campbell, Ian....... KSU SO 12 DE 40 20 60 5.0 11.5 1. Banks,Jon........... ISU JR 12 DB 58 41 99 8.2 0.02. Dawson, Keyunta..... TTU SR 12 DE 27 31 58 4.8 5.0 2. Kemp, Jerome........ KU SR 12 DB 47 35 82 6.8 1.03. Harrington, Chris... TAMU JR 12 DL 28 27 55 4.6 7.5 3. Griffin, Michael.... UT SR 12 DB 56 22 78 6.5 1.04. Nicolas,Brandon..... CU SO 12 DT 23 31 54 4.5 0.0 Garcia, Joe......... TTU JR 12 DB 43 35 78 6.5 0.05. McClinton, Jame..... KU JR 12 DT 29 22 51 4.2 5.5 5. Bullitt, Melvin..... TAMU SR 12 DB 27 49 76 6.3 0.06. Jackson, Xzavie..... MU SR 11 DE 22 24 46 4.2 7.0 Berg,Caleb.......... ISU JR 12 DB 41 35 76 6.3 0.07. DeGrate,Victor...... OSU SR 10 DL 25 15 40 4.0 8.5 7. Sexton,Andre........ OSU FR 12 DB 57 18 75 6.2 0.08. Hypolite,George..... CU SO 12 DT 24 23 47 3.9 2.5 8. Overstreet, David... MU SR 12 DB 31 43 74 6.2 0.59. Moorehead,Shawn..... ISU SR 12 DE 33 13 46 3.8 8.5 9. Linguist, M......... BU SR 12 DB 36 35 71 5.9 1.0 Curvey,Brent........ ISU SR 12 DL 24 22 46 3.8 7.0 10.McBath, Darcel...... TTU SO 12 DB 33 37 70 5.8 0.011.Ratliff, Jake....... TTU SO 12 DE 22 22 44 3.7 3.5 11.Williams, Darie..... OU JR 11 DB 36 26 62 5.6 2.012.Bake, Dek........... TTU SR 12 DT 22 21 43 3.6 4.5 Huffman, A.......... TTU SR 11 DB 46 16 62 5.6 0.0 Como, Paul.......... KU SR 12 DE 16 27 43 3.6 4.0 13.Crawford, Dwain..... BU SO 10 DB 26 29 55 5.5 0.014.Wright, Abraham..... CU SR 12 DE 26 16 42 3.5 12.0 Griffin, Marcus..... UT JR 10 DB 44 11 55 5.5 0.0 Boye-Doe,Walter..... CU SR 12 DE 21 21 42 3.5 1.5 15.Garvin, Byron....... KSU JR 11 DB 39 19 58 5.3 2.016.Williams, Lorenzo... MU JR 12 DL 16 22 38 3.2 5.0 16.Jones, Andre........ NU JR 12 DB 41 21 62 5.2 0.0 Lamb, Jason......... BU FR 12 DE 21 17 38 3.2 1.0 17.Terrell, Darnell.... MU JR 12 CB 32 29 61 5.1 0.018.Ah You, C.J......... OU SR 12 DE 20 16 36 3.0 3.0 Williams, Kyle...... KSU SR 12 DB 34 27 61 5.1 0.0 Birdine, Larry...... OU SR 12 DL 14 22 36 3.0 2.0 Green, Tierre....... NU JR 12 DB 34 27 61 5.1 0.0 Nelson, Geoff....... BU JR 12 DE 14 22 36 3.0 2.5 20.Harris, Nic......... OU SO 12 DB 33 27 60 5.0 1.5 Moore, Jay.......... NU SR 12 DE 17 19 36 3.0 4.0 21.Wilson, C.J......... BU SR 12 CB 36 23 59 4.9 0.022.Rhodes, Vincent..... BU SO 12 DT 17 18 35 2.9 2.0 22.Van Zant,Martel..... OSU JR 12 DB 40 18 58 4.8 0.023.Hood, Ziggy......... MU SO 9 DL 14 12 26 2.9 3.5 23.Woods,Donovan....... OSU JR 12 DB 36 21 57 4.8 0.024.Hudler, Chris....... TTU SR 12 DT 17 17 34 2.8 3.0 Gregg, Devin........ TAMU SO 12 DB 20 37 57 4.8 0.025.Brorsen, Russel..... KU SO 12 DE 16 17 33 2.8 4.0 25.Walters, Ryan....... CU SO 11 DB 34 18 52 4.7 0.0
TACKLES (Linebackers) TACKLES (Other positions)Player Team Cl G Pos Solo Ast Total Avg/G Sack Player Team Cl G Pos Solo Ast Total Avg/G Sack---------------------------------------------------------------- ----------------------------------------------------------------1. Bowen,Alvin......... ISU JR 12 LB 95 60 155 12.9 1.0 1. Carriker, Adam...... NU SR 12 21 27 48 4.0 6.02. McKenzie,Tyrone..... ISU SO 12 LB 59 70 129 10.8 2.0 2. Stiggers, B......... BU JR 12 32 15 47 3.9 0.53. Dizon, Jordon....... CU JR 12 LB 64 57 121 10.1 4.5 3. Brandenburgh, Lance. NU JR 12 17 21 38 3.2 0.54. Bacon, Marcus....... MU SR 12 LB 40 58 98 8.2 3.0 4. Brown, Cornelius.... MU JR 10 14 16 30 3.0 0.55. Archer, Brandon..... KSU SR 12 LB 51 46 97 8.1 2.5 5. Rubin,Ahtyba........ ISU JR 12 18 16 34 2.8 1.06. Alexander, Rufu..... OU SR 12 LB 55 40 95 7.9 2.0 6. Sipili, Michael..... CU FR 11 14 10 24 2.2 0.07. Diles, Zach......... KSU SR 12 LB 42 50 92 7.7 3.5 7. Cryer, Barry........ NU SR 12 14 11 25 2.1 2.58. Rivera, Mike........ KU SO 12 LB 50 40 90 7.5 1.5 8. Dagunduro, Ola...... NU SR 12 10 12 22 1.8 3.5 Warren, Justin...... TAMU SR 12 LB 30 60 90 7.5 1.0 9. Muhammed, Sadiq..... KU JR 9 11 5 16 1.8 0.010.Pawelek, Joe........ BU FR 12 LB 46 40 86 7.2 2.0 10.Steinkuhler, Ty..... NU SO 12 14 6 20 1.7 0.5 Harrington, Dedrick. MU SR 12 LB 41 45 86 7.2 3.5 11.Suh, Ndamukong...... NU SO 12 12 6 18 1.5 3.512.Stratton, Brock..... TTU JR 12 LB 37 47 84 7.0 0.5 12.Williams, B......... TTU FR 11 11 5 16 1.5 3.5 Washington,Thaddaeus CU SR 12 LB 46 38 84 7.0 0.5 13.Turner, Barry....... NU SO 12 11 6 17 1.4 1.514.Mortensen, Joe...... KU SO 12 LB 33 49 82 6.8 3.5 14.Young, Corey........ NU FR 10 9 3 12 1.2 0.015.Moore, Nick......... BU JR 12 LB 32 43 75 6.2 0.0 15.La Mar, Jake........ BU SO 9 4 6 10 1.1 0.016.Latimer, Zach....... OU SR 12 LB 36 37 73 6.1 2.0 16.Eisenhart, Ben...... NU JR 12 9 4 13 1.1 0.017.Christopher, Brock.. MU SO 12 LB 28 41 69 5.8 0.0 17.Erickson, Dan....... NU JR 12 6 6 12 1.0 0.018.Bradley, Stewart.... NU SR 12 LB 35 32 67 5.6 0.0 Jones, Zach......... BU JR 11 6 5 11 1.0 0.019.Lavine,Patrick...... OSU FR 12 LB 40 26 66 5.5 2.0 Culbert, Major...... NU FR 10 5 5 10 1.0 0.0 Jones, Brad......... CU SO 12 LB 31 35 66 5.5 0.5 Gatewood, Tyrell.... UT JR 10 8 2 10 1.0 0.021.Johnson,Rodrick..... OSU JR 12 LB 42 21 63 5.2 2.0 21.McAnderson, Bra..... KU JR 12 8 3 11 0.9 0.0 Bobino, Rashad...... UT SO 12 LB 41 22 63 5.2 2.0 22.Jackson, Erick...... UT JR 12 7 3 10 0.8 0.023.Ruud, Bo............ NU JR 12 LB 32 28 60 5.0 2.0 Brown, Pierre....... TAMU SO 12 3 7 10 0.8 0.0 McKeon, Corey....... NU JR 11 LB 26 29 55 5.0 1.0 Reed, L.A........... TTU SO 12 9 1 10 0.8 0.025.Tupe, Misi.......... TAMU JR 11 LB 18 36 54 4.9 1.0 25.Leone, Brandon...... TAMU SR 10 3 5 8 0.8 0.0

2006 Big 12 Football Conference Individual Game Highs Through games of Nov 27, 2006
INDIVIDUAL PLAYER GAME HIGHS
----------------------------------------------------------------------------------------------------------------------------------
Points scored............ 24 Lane, Jorvorskie, Texas A&M vs LOUISIANA-LAFAYETTE (Sep 09, 2006)
24 Bowman,Adarius, Oklahoma State at Kansas (Oct 14, 2006)
Touchdowns............... 4 Lane, Jorvorskie, Texas A&M vs LOUISIANA-LAFAYETTE (Sep 09, 2006)
4 Bowman,Adarius, Oklahoma State at Kansas (Oct 14, 2006)
TD responsibility........ 6 McCoy, Colt, Texas vs BAYLOR (Oct 14, 2006) [0r,6p]
6 Reid,Bobby, Oklahoma State at Kansas (Oct 14, 2006) [1r,5p]
6 Harrell, Graham, Texas Tech at Iowa State (Oct 21, 2006) [0r,6p]
Points scored kicking.... 15 Hartley, Garret, Oklahoma at Oregon (Sep 16, 2006) [4fg,3pat]
15 Crosby, Mason, Colorado vs IOWA STATE (Nov 11, 2006) [4fg,3pat]
15 Webb, Scott, Kansas vs KANSAS STATE (Nov 18, 2006) [4fg,3pat]
Total offense yards...... 506 Harrell, Graham, Texas Tech vs TEXAS (Oct 28, 2006) [-13r,519p]
496 Harrell, Graham, Texas Tech vs BAYLOR (Nov 04, 2006) [13r,483p]
Total offense plays...... 65 Harrell, Graham, Texas Tech vs TEXAS (Oct 28, 2006) [3r,62p]
64 Daniel, Chase, Missouri vs OKLAHOMA (Oct 28, 2006) [20r,44p]
Total offense yards/play. 18.8 Coleman, Brandon, Missouri vs MURRAY STATE (Sep 02, 2006) [4-75]
15.6 Lucky, Marlon, Nebraska vs TROY (Sept 23,2006) [10-156]
Rushing yards............ 211 Peterson, Adria, Oklahoma at Oregon (Sep 16, 2006)
201 Cornish, Jon, Kansas vs KANSAS STATE (Nov 18, 2006)
Rushing attempts......... 36 Patrick, Allen, Oklahoma at Missouri (Oct 28, 2006)
35 Patrick, Allen, Oklahoma vs COLORADO (Oct 21, 2006)
Yards per rush........... 15.6 Lucky, Marlon, Nebraska vs TROY (Sept 23,2006) [10-156]
14.0 McCoy, Jamie, Texas A&M vs LOUISIANA TECH (Sep 23, 2006) [3-42]
Rushing TDs.............. 4 Lane, Jorvorskie, Texas A&M vs LOUISIANA-LAFAYETTE (Sep 09, 2006)
3 Meyer,Bret, Iowa State vs TOLEDO (Aug 31, 2006)
3 Lane, Jorvorskie, Texas A&M vs Army (Sep 16, 2006)
3 Lucky, Marlon, Nebraska vs TROY (Sept 23,2006)
3 Peterson, Adria, Oklahoma vs MIDDLE TENNESSE (Sep 23, 2006)
3 Woods, Shannon, Texas Tech vs BAYLOR (Nov 04, 2006)
Longest rush............. 70 Savage,Dantrell, Oklahoma State vs FLORIDA ATLANTIC (Sep 16, 2006)
69 Cornish, Jon, Kansas vs NORTHWESTERN STATE (Sep 02, 2006)
69 Clayton, Thomas, Kansas State vs LOUISVILLE (Sep 23, 2006)
Passing yards............ 519 Harrell, Graham, Texas Tech vs TEXAS (Oct 28, 2006)
483 Harrell, Graham, Texas Tech vs BAYLOR (Nov 04, 2006)
Passing attempts......... 62 Harrell, Graham, Texas Tech vs TEXAS (Oct 28, 2006)
55 Harrell, Graham, Texas Tech vs MISSOURI (Oct 07, 2006)
55 Bell, Shawn, Baylor vs KANSAS (Oct 21, 2006)
Passing TDs.............. 6 McCoy, Colt, Texas vs BAYLOR (Oct 14, 2006)
6 Harrell, Graham, Texas Tech at Iowa State (Oct 21, 2006)
Longest pass............. 79 Bell, Shawn, Baylor vs TEXAS A&M (Oct 28, 2006)
78 Taylor, Zac, Nebraska vs KANSAS (Sept.30,2006)
Passes completed......... 42 Harrell, Graham, Texas Tech vs TEXAS (Oct 28, 2006)
40 HARRELL, Graham, Texas Tech at UTEP (Sep 09, 2006)
Had intercepted.......... 4 Meier, Kerry, Kansas at Toledo (Sep 15, 2006)
3 Reid,Bobby, Oklahoma State at Arkansas State (Sep 09, 2006)
3 Barmann, Adam, Kansas at Nebraska (Sept.30,2006)
3 Freeman, Josh, Kansas State at Baylor (Sep 30, 2006)
3 Jackson,Bernard, Colorado vs BAYLOR (Oct 07, 2006)
3 Harrell, Graham, Texas Tech at Colorado (Oct 14, 2006)
3 Daniel, Chase, Missouri vs OKLAHOMA (Oct 28, 2006)
3 Szymanski, B., Baylor at Oklahoma State (Nov 11, 2006)
3 Freeman, Josh, Kansas State at Kansas (Nov 18, 2006)
3 McCoy, Colt, Texas vs TEXAS A&M (Nov 24, 2006)
Pass completion pct...... 100.0 Barmann, Adam, Kansas vs NORTHWESTERN STATE (Sep 02, 2006) [2-2]
100.0 Snead, Jevan, Texas vs Rice (Sep 16, 2006) [3-3]

100.0 McCoy, Colt, Texas at Kansas State (Nov 11, 2006) [4-4]
Receiving yards.......... 300 Bowman,Adarius, Oklahoma State at Kansas (Oct 14, 2006)
212 Filani, Joel, Texas Tech vs BAYLOR (Nov 04, 2006)
Receptions............... 15 Johnson, Robert, Texas Tech vs SMU (Sep 02, 2006)
13 Bowman,Adarius, Oklahoma State at Kansas (Oct 14, 2006)
Yards per catch.......... 53.0 Hardy, Frantz, Nebraska vs KANSAS (Sept.30,2006) [3-159]
46.5 Bowman,Adarius, Oklahoma State vs FLORIDA ATLANTIC (Sep 16, 2006) [2-93]
Receiving TDs............ 4 Bowman,Adarius, Oklahoma State at Kansas (Oct 14, 2006)
3 Johnson, Robert, Texas Tech at Texas A&M (Sep 30, 2006)
3 Filani, Joel, Texas Tech at Iowa State (Oct 21, 2006)
3 Filani, Joel, Texas Tech vs BAYLOR (Nov 04, 2006)
Longest reception........ 79 Zeigler, D., Baylor vs TEXAS A&M (Oct 28, 2006)
78 Hardy, Frantz, Nebraska vs KANSAS (Sept.30,2006)
Field goal attempts...... 5 Trlica, Alex, Texas Tech at UTEP (Sep 09, 2006)
5 Hartley, Garret, Oklahoma at Oregon (Sep 16, 2006)
5 Crosby, Mason, Colorado vs IOWA STATE (Nov 11, 2006)
Field goals made......... 4 Hartley, Garret, Oklahoma at Oregon (Sep 16, 2006)
4 Crosby, Mason, Colorado vs IOWA STATE (Nov 11, 2006)
4 Webb, Scott, Kansas vs KANSAS STATE (Nov 18, 2006)
Longest field goal....... 56 Crosby, Mason, Colorado vs TEXAS TECH (Oct 14, 2006)
54 Wolfert, Jeff, Missouri at Nebraska (Nov. 4, 2006)
Field goal pct........... 100.0 Webb, Scott, Kansas vs KANSAS STATE (Nov 18, 2006) [4-4]
100.0 Hartley, Garret, Oklahoma vs WASHINGTON (Sep 09, 2006) [3-3]
100.0 Snodgrass, Jeff, Kansas State vs MARSHALL (Sep 16, 2006) [3-3]
100.0 Webb, Scott, Kansas vs TEXAS A&M (Oct 07, 2006) [3-3]
100.0 Crosby, Mason, Colorado vs TEXAS TECH (Oct 14, 2006) [3-3]
100.0 Crosby, Mason, Colorado at Kansas (Oct 28, 2006) [3-3]
100.0 Bailey, Ryan, Texas vs OKLAHOMA STATE (Nov 04, 2006) [3-3]
100.0 Neumann, Layne, Texas A&M vs OKLAHOMA (Nov 04, 2006) [3-3]
100.0 Trlica, Alex, Texas Tech vs OKLAHOMA STATE (Nov 18, 2006) [3-3]
100.0 Wolfert, Jeff, Missouri vs KANSAS (Nov 25, 2006) [3-3]
PAT kicks attempted...... 9 Johnson, Greg, Texas vs BAYLOR (Oct 14, 2006)
9 Redden,Bruce, Oklahoma State vs BAYLOR (Nov 11, 2006)
PAT kicks made........... 9 Johnson, Greg, Texas vs BAYLOR (Oct 14, 2006)
9 Redden,Bruce, Oklahoma State vs BAYLOR (Nov 11, 2006)
PAT kicks pct............ 100.0 Johnson, Greg, Texas vs BAYLOR (Oct 14, 2006) [9-9]
100.0 Redden,Bruce, Oklahoma State vs BAYLOR (Nov 11, 2006) [9-9]
100.0 Johnson, Greg, Texas vs NORTH TEXAS (Sep 02, 2006) [8-8]
100.0 Congdon, Jordan, Nebraska vs NICHOLLS STATE (Sept. 9,2006) [8-8]
100.0 Trlica, Alex, Texas Tech vs SE LOUISIANA (Sep 23, 2006) [8-8]
100.0 Congdon, Jordan, Nebraska vs TROY (Sept 23,2006) [8-8]
100.0 Hartley, Garret, Oklahoma vs MIDDLE TENNESSE (Sep 23, 2006) [8-8]
Punts.................... 10 Reyer, Tim, Kansas State at Baylor (Sep 30, 2006)
9 Sepulveda, D., Baylor vs KANSAS STATE (Sep 30, 2006)
9 Brandtner,Mike, Iowa State at Oklahoma (Oct 14, 2006)
Yards punted............. 469 Sepulveda, D., Baylor vs KANSAS STATE (Sep 30, 2006) [9-469]
453 Reyer, Tim, Kansas State at Baylor (Sep 30, 2006) [10-453]
Longest punt............. 79 Crossett, Adam, Missouri at Texas A&M (Oct 14, 2006)
78 Sepulveda, D., Baylor vs KANSAS STATE (Sep 30, 2006)
Punting avg.............. 59.7 Sepulveda, D., Baylor vs KANSAS (Oct 21, 2006) [3-179]
56.7 Brantly, Justin, Texas A&M vs THE CITADEL (Sep 02, 2006) [3-170]
Punt returns............. 6 Smith, Reggie, Oklahoma vs UAB (Sep 02, 2006)
6 Amendola, Danny, Texas Tech vs SMU (Sep 02, 2006)
6 Woods, Marcus, Missouri vs OLE MISS (Sep 09, 2006)
6 AMENDOLA, Danny, Texas Tech at TCU (Sep 16, 2006)
Punt return yards........ 133 Amendola, Danny, Texas Tech vs SE LOUISIANA (Sep 23, 2006)
103 Baum,Ryan, Iowa State vs UNI (Sep 30, 2006)
Longest punt return...... 81 Figurs, Yamon, Kansas State vs ILLINOIS STATE (Sep 2, 2006)
70 Murph, Brian, Kansas vs NORTHWESTERN STATE (Sep 02, 2006)
Punt return TDs.......... 1 Foster, Jeff, Kansas vs NORTHWESTERN STATE (Sep 02, 2006)
1 Murph, Brian, Kansas vs NORTHWESTERN STATE (Sep 02, 2006)
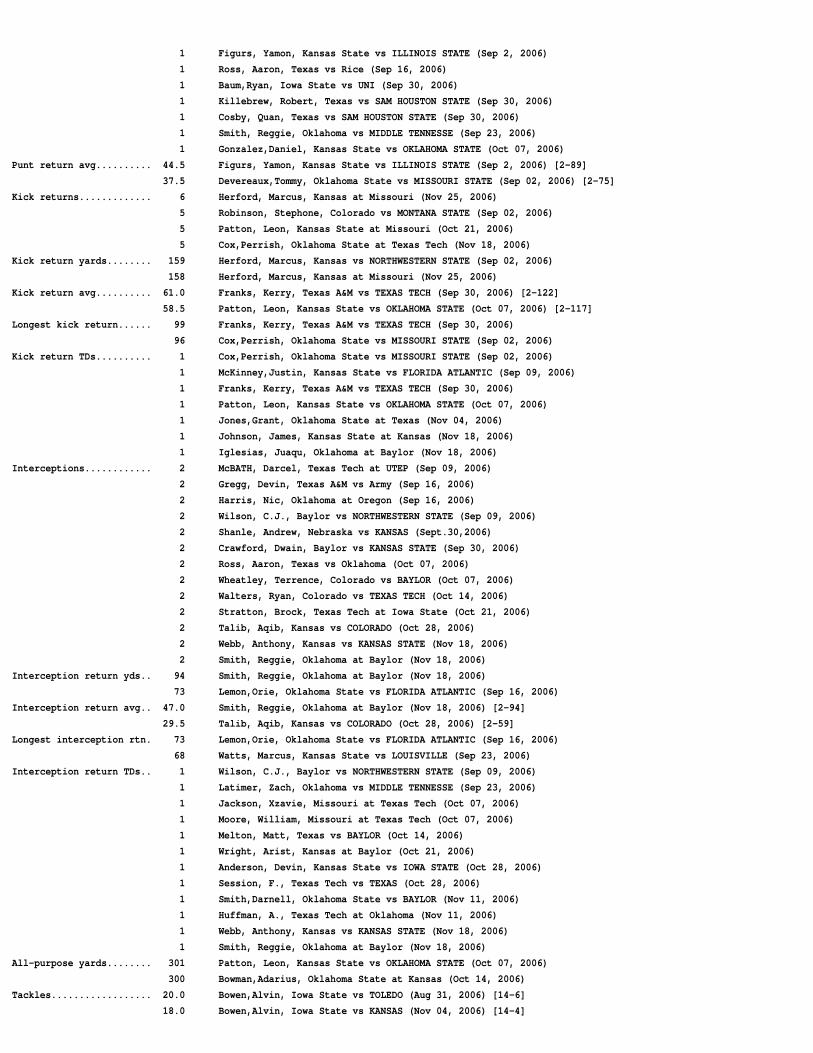
1 Figurs, Yamon, Kansas State vs ILLINOIS STATE (Sep 2, 2006)
1 Ross, Aaron, Texas vs Rice (Sep 16, 2006)
1 Baum,Ryan, Iowa State vs UNI (Sep 30, 2006)
1 Killebrew, Robert, Texas vs SAM HOUSTON STATE (Sep 30, 2006)
1 Cosby, Quan, Texas vs SAM HOUSTON STATE (Sep 30, 2006)
1 Smith, Reggie, Oklahoma vs MIDDLE TENNESSE (Sep 23, 2006)
1 Gonzalez,Daniel, Kansas State vs OKLAHOMA STATE (Oct 07, 2006)
Punt return avg.......... 44.5 Figurs, Yamon, Kansas State vs ILLINOIS STATE (Sep 2, 2006) [2-89]
37.5 Devereaux,Tommy, Oklahoma State vs MISSOURI STATE (Sep 02, 2006) [2-75]
Kick returns............. 6 Herford, Marcus, Kansas at Missouri (Nov 25, 2006)
5 Robinson, Stephone, Colorado vs MONTANA STATE (Sep 02, 2006)
5 Patton, Leon, Kansas State at Missouri (Oct 21, 2006)
5 Cox,Perrish, Oklahoma State at Texas Tech (Nov 18, 2006)
Kick return yards........ 159 Herford, Marcus, Kansas vs NORTHWESTERN STATE (Sep 02, 2006)
158 Herford, Marcus, Kansas at Missouri (Nov 25, 2006)
Kick return avg.......... 61.0 Franks, Kerry, Texas A&M vs TEXAS TECH (Sep 30, 2006) [2-122]
58.5 Patton, Leon, Kansas State vs OKLAHOMA STATE (Oct 07, 2006) [2-117]
Longest kick return...... 99 Franks, Kerry, Texas A&M vs TEXAS TECH (Sep 30, 2006)
96 Cox,Perrish, Oklahoma State vs MISSOURI STATE (Sep 02, 2006)
Kick return TDs.......... 1 Cox,Perrish, Oklahoma State vs MISSOURI STATE (Sep 02, 2006)
1 McKinney,Justin, Kansas State vs FLORIDA ATLANTIC (Sep 09, 2006)
1 Franks, Kerry, Texas A&M vs TEXAS TECH (Sep 30, 2006)
1 Patton, Leon, Kansas State vs OKLAHOMA STATE (Oct 07, 2006)
1 Jones,Grant, Oklahoma State at Texas (Nov 04, 2006)
1 Johnson, James, Kansas State at Kansas (Nov 18, 2006)
1 Iglesias, Juaqu, Oklahoma at Baylor (Nov 18, 2006)
Interceptions............ 2 McBATH, Darcel, Texas Tech at UTEP (Sep 09, 2006)
2 Gregg, Devin, Texas A&M vs Army (Sep 16, 2006)
2 Harris, Nic, Oklahoma at Oregon (Sep 16, 2006)
2 Wilson, C.J., Baylor vs NORTHWESTERN STATE (Sep 09, 2006)
2 Shanle, Andrew, Nebraska vs KANSAS (Sept.30,2006)
2 Crawford, Dwain, Baylor vs KANSAS STATE (Sep 30, 2006)
2 Ross, Aaron, Texas vs Oklahoma (Oct 07, 2006)
2 Wheatley, Terrence, Colorado vs BAYLOR (Oct 07, 2006)
2 Walters, Ryan, Colorado vs TEXAS TECH (Oct 14, 2006)
2 Stratton, Brock, Texas Tech at Iowa State (Oct 21, 2006)
2 Talib, Aqib, Kansas vs COLORADO (Oct 28, 2006)
2 Webb, Anthony, Kansas vs KANSAS STATE (Nov 18, 2006)
2 Smith, Reggie, Oklahoma at Baylor (Nov 18, 2006)
Interception return yds.. 94 Smith, Reggie, Oklahoma at Baylor (Nov 18, 2006)
73 Lemon,Orie, Oklahoma State vs FLORIDA ATLANTIC (Sep 16, 2006)
Interception return avg.. 47.0 Smith, Reggie, Oklahoma at Baylor (Nov 18, 2006) [2-94]
29.5 Talib, Aqib, Kansas vs COLORADO (Oct 28, 2006) [2-59]
Longest interception rtn. 73 Lemon,Orie, Oklahoma State vs FLORIDA ATLANTIC (Sep 16, 2006)
68 Watts, Marcus, Kansas State vs LOUISVILLE (Sep 23, 2006)
Interception return TDs.. 1 Wilson, C.J., Baylor vs NORTHWESTERN STATE (Sep 09, 2006)
1 Latimer, Zach, Oklahoma vs MIDDLE TENNESSE (Sep 23, 2006)
1 Jackson, Xzavie, Missouri at Texas Tech (Oct 07, 2006)
1 Moore, William, Missouri at Texas Tech (Oct 07, 2006)
1 Melton, Matt, Texas vs BAYLOR (Oct 14, 2006)
1 Wright, Arist, Kansas at Baylor (Oct 21, 2006)
1 Anderson, Devin, Kansas State vs IOWA STATE (Oct 28, 2006)
1 Session, F., Texas Tech vs TEXAS (Oct 28, 2006)
1 Smith,Darnell, Oklahoma State vs BAYLOR (Nov 11, 2006)
1 Huffman, A., Texas Tech at Oklahoma (Nov 11, 2006)
1 Webb, Anthony, Kansas vs KANSAS STATE (Nov 18, 2006)
1 Smith, Reggie, Oklahoma at Baylor (Nov 18, 2006)
All-purpose yards........ 301 Patton, Leon, Kansas State vs OKLAHOMA STATE (Oct 07, 2006)
300 Bowman,Adarius, Oklahoma State at Kansas (Oct 14, 2006)
Tackles.................. 20.0 Bowen,Alvin, Iowa State vs TOLEDO (Aug 31, 2006) [14-6]
18.0 Bowen,Alvin, Iowa State vs KANSAS (Nov 04, 2006) [14-4]

Sacks.................... 4.0 Smith, Brian, Missouri at New Mexico (Sep 16, 2006) [4-0]
3.0 Wright, Abraham, Colorado vs Colorado State (Sep 09, 2006) [3-0]
3.0 Campbell, Ian, Kansas State vs ILLINOIS STATE (Sep 2, 2006) [3-0]
Tackles for loss......... 5.0 Campbell, Ian, Kansas State vs ILLINOIS STATE (Sep 2, 2006) [5-0]
5.0 Crowder, Tim, Texas vs Rice (Sep 16, 2006) [5-0]
5.0 Smith, Brian, Missouri at New Mexico (Sep 16, 2006) [5-0]

2006 Big 12 Football Conference Team Game Highs Through games of Nov 27, 2006
TEAM HIGHS (highest totals made by)
----------------------------------------------------------------------------------------------------------------------------------
Points................... 66 Oklahoma State vs BAYLOR (Nov 11, 2006)
63 Texas vs BAYLOR (Oct 14, 2006)
Points scored kicking.... 15 Oklahoma at Oregon (Sep 16, 2006) [4fg,3pat]
15 Colorado vs IOWA STATE (Nov 11, 2006) [4fg,3pat]
15 Kansas vs KANSAS STATE (Nov 18, 2006) [4fg,3pat]
Touchdowns............... 9 Texas vs BAYLOR (Oct 14, 2006)
9 Oklahoma State vs BAYLOR (Nov 11, 2006)
Total offense yards...... 682 Texas Tech vs BAYLOR (Nov 04, 2006) [175r,507p]
603 Oklahoma State at Kansas (Oct 14, 2006) [192r,411p]
Total offense plays...... 94 Kansas at Nebraska (Sept.30,2006) [40r,54p]
84 Nebraska vs LOUISIANA TECH (Sept. 2,2006) [48r,36p]
84 Oklahoma State at Texas Tech (Nov 18, 2006) [50r,34p]
Total offense yards/play. 9.1 Texas vs Rice (Sep 16, 2006) [54-493]
9.1 Oklahoma State at Houston (Sep 23, 2006) [49-446]
Rushing yards............ 387 Oklahoma State vs BAYLOR (Nov 11, 2006)
330 Texas vs Rice (Sep 16, 2006)
Rushing attempts......... 54 Oklahoma State vs BAYLOR (Nov 11, 2006)
53 Oklahoma at Missouri (Oct 28, 2006)
Yards per rush........... 9.2 Texas Tech vs BAYLOR (Nov 04, 2006) [19-175]
7.7 Texas vs Rice (Sep 16, 2006) [43-330]
Rushing TDs.............. 6 Nebraska vs TROY (Sept 23,2006)
5 Texas A&M vs LOUISIANA-LAFAYETTE (Sep 09, 2006)
5 Oklahoma State vs BAYLOR (Nov 11, 2006)
5 Texas at Kansas State (Nov 11, 2006)
Longest rush............. 70 Oklahoma State vs FLORIDA ATLANTIC (Sep 16, 2006)
69 Kansas vs NORTHWESTERN STATE (Sep 02, 2006)
69 Kansas State vs LOUISVILLE (Sep 23, 2006)
Passing yards............ 519 Texas Tech vs TEXAS (Oct 28, 2006)
507 Texas Tech vs BAYLOR (Nov 04, 2006)
Passing attempts......... 62 Texas Tech vs TEXAS (Oct 28, 2006)
61 Texas Tech vs MISSOURI (Oct 07, 2006)
Passing TDs.............. 6 Texas vs BAYLOR (Oct 14, 2006)
6 Texas Tech at Iowa State (Oct 21, 2006)
Longest pass............. 79 Baylor vs TEXAS A&M (Oct 28, 2006)
78 Nebraska vs KANSAS (Sept.30,2006)
Passes completed......... 44 Texas Tech vs MISSOURI (Oct 07, 2006)
42 Texas Tech vs TEXAS (Oct 28, 2006)
Had intercepted.......... 4 Kansas at Toledo (Sep 15, 2006)
4 Texas vs TEXAS A&M (Nov 24, 2006)
Pass completion pct...... 90.9 Texas vs Rice (Sep 16, 2006) [10-11]
86.7 Oklahoma State vs BAYLOR (Nov 11, 2006) [13-15]
Yards per catch.......... 26.3 Nebraska vs KANSAS (Sept.30,2006) [15-395]
21.6 Oklahoma State at Houston (Sep 23, 2006) [13-281]
Field goal attempts...... 5 Texas Tech at UTEP (Sep 09, 2006)
5 Oklahoma at Oregon (Sep 16, 2006)
5 Texas at Nebraska (Oct.21, 2006)
5 Colorado vs IOWA STATE (Nov 11, 2006)
Field goals made......... 4 Oklahoma at Oregon (Sep 16, 2006)
4 Colorado vs IOWA STATE (Nov 11, 2006)
4 Kansas vs KANSAS STATE (Nov 18, 2006)
Longest field goal....... 56 Colorado vs TEXAS TECH (Oct 14, 2006)
54 Missouri at Nebraska (Nov. 4, 2006)
Field goal pct........... 100.0 Kansas vs KANSAS STATE (Nov 18, 2006) [4-4]
100.0 Oklahoma vs WASHINGTON (Sep 09, 2006) [3-3]

100.0 Kansas State vs MARSHALL (Sep 16, 2006) [3-3]
100.0 Kansas vs TEXAS A&M (Oct 07, 2006) [3-3]
100.0 Colorado vs TEXAS TECH (Oct 14, 2006) [3-3]
100.0 Colorado at Kansas (Oct 28, 2006) [3-3]
100.0 Texas vs OKLAHOMA STATE (Nov 04, 2006) [3-3]
100.0 Texas A&M vs OKLAHOMA (Nov 04, 2006) [3-3]
100.0 Texas Tech vs OKLAHOMA STATE (Nov 18, 2006) [3-3]
100.0 Missouri vs KANSAS (Nov 25, 2006) [3-3]
PAT kicks attempted...... 9 Texas vs BAYLOR (Oct 14, 2006)
9 Oklahoma State vs BAYLOR (Nov 11, 2006)
8 Texas vs NORTH TEXAS (Sep 02, 2006)
8 Nebraska vs NICHOLLS STATE (Sept. 9,2006)
8 Texas Tech vs SE LOUISIANA (Sep 23, 2006)
8 Nebraska vs TROY (Sept 23,2006)
8 Texas vs SAM HOUSTON STATE (Sep 30, 2006)
8 Oklahoma vs MIDDLE TENNESSE (Sep 23, 2006)
PAT kicks made........... 9 Texas vs BAYLOR (Oct 14, 2006)
9 Oklahoma State vs BAYLOR (Nov 11, 2006)
PAT kicks pct............ 100.0 Texas vs BAYLOR (Oct 14, 2006) [9-9]
100.0 Oklahoma State vs BAYLOR (Nov 11, 2006) [9-9]
100.0 Texas vs NORTH TEXAS (Sep 02, 2006) [8-8]
100.0 Nebraska vs NICHOLLS STATE (Sept. 9,2006) [8-8]
100.0 Texas Tech vs SE LOUISIANA (Sep 23, 2006) [8-8]
100.0 Nebraska vs TROY (Sept 23,2006) [8-8]
100.0 Texas vs SAM HOUSTON STATE (Sep 30, 2006) [8-8]
100.0 Oklahoma vs MIDDLE TENNESSE (Sep 23, 2006) [8-8]
Punts.................... 10 Kansas State at Baylor (Sep 30, 2006)
9 Baylor vs KANSAS STATE (Sep 30, 2006)
9 Iowa State at Oklahoma (Oct 14, 2006)
Longest punt............. 79 Missouri at Texas A&M (Oct 14, 2006)
78 Baylor vs KANSAS STATE (Sep 30, 2006)
Yards punted............. 469 Baylor vs KANSAS STATE (Sep 30, 2006) [9-469]
453 Kansas State at Baylor (Sep 30, 2006) [10-453]
Punting avg.............. 59.7 Baylor vs KANSAS (Oct 21, 2006) [3-179]
56.7 Texas A&M vs THE CITADEL (Sep 02, 2006) [3-170]
Punt returns............. 9 Missouri vs OLE MISS (Sep 09, 2006)
8 Nebraska vs NICHOLLS STATE (Sept. 9,2006)
Punt return yards........ 158 Oklahoma State vs MISSOURI STATE (Sep 02, 2006)
133 Texas Tech vs SE LOUISIANA (Sep 23, 2006)
Punt return avg.......... 45.0 Texas vs SAM HOUSTON STATE (Sep 30, 2006) [2-90]
44.5 Kansas State vs ILLINOIS STATE (Sep 2, 2006) [2-89]
Punt return TDs.......... 2 Kansas vs NORTHWESTERN STATE (Sep 02, 2006)
2 Texas vs SAM HOUSTON STATE (Sep 30, 2006)
Longest punt return...... 81 Kansas State vs ILLINOIS STATE (Sep 2, 2006)
70 Kansas vs NORTHWESTERN STATE (Sep 02, 2006)
Kick returns............. 8 Oklahoma State at Texas (Nov 04, 2006)
8 Baylor at Oklahoma State (Nov 11, 2006)
Kick return yards........ 206 Oklahoma State at Texas (Nov 04, 2006)
180 Kansas State at Missouri (Oct 21, 2006)
Kick return avg.......... 61.0 Texas A&M vs TEXAS TECH (Sep 30, 2006) [2-122]
59.5 Oklahoma State vs MISSOURI STATE (Sep 02, 2006) [2-119]
Longest kick return...... 99 Texas A&M vs TEXAS TECH (Sep 30, 2006)
96 Oklahoma State vs MISSOURI STATE (Sep 02, 2006)
Kick return TDs.......... 1 Oklahoma State vs MISSOURI STATE (Sep 02, 2006)
1 Kansas State vs FLORIDA ATLANTIC (Sep 09, 2006)
1 Texas A&M vs TEXAS TECH (Sep 30, 2006)
1 Kansas State vs OKLAHOMA STATE (Oct 07, 2006)
1 Oklahoma State at Texas (Nov 04, 2006)
1 Kansas State at Kansas (Nov 18, 2006)
1 Oklahoma at Baylor (Nov 18, 2006)
Interceptions............ 4 Texas A&M at Texas (Nov 24, 2006)

3 Missouri vs OLE MISS (Sep 09, 2006)
3 Texas A&M vs Army (Sep 16, 2006)
3 Baylor vs NORTHWESTERN STATE (Sep 09, 2006)
3 Nebraska vs KANSAS (Sept.30,2006)
3 Baylor vs KANSAS STATE (Sep 30, 2006)
3 Baylor at Colorado (Oct 07, 2006)
3 Colorado vs TEXAS TECH (Oct 14, 2006)
3 Colorado at Kansas (Oct 28, 2006)
3 Oklahoma at Missouri (Oct 28, 2006)
3 Oklahoma State vs BAYLOR (Nov 11, 2006)
3 Kansas vs KANSAS STATE (Nov 18, 2006)
Interception return yds.. 94 Oklahoma at Baylor (Nov 18, 2006)
73 Oklahoma State vs FLORIDA ATLANTIC (Sep 16, 2006)
Interception return avg.. 47.0 Oklahoma at Baylor (Nov 18, 2006) [2-94]
36.5 Oklahoma State vs FLORIDA ATLANTIC (Sep 16, 2006) [2-73]
Longest interception rtn. 73 Oklahoma State vs FLORIDA ATLANTIC (Sep 16, 2006)
68 Kansas State vs LOUISVILLE (Sep 23, 2006)
Interception return TDs.. 2 Missouri at Texas Tech (Oct 07, 2006)
1 Baylor vs NORTHWESTERN STATE (Sep 09, 2006)
1 Oklahoma vs MIDDLE TENNESSE (Sep 23, 2006)
1 Texas vs BAYLOR (Oct 14, 2006)
1 Kansas at Baylor (Oct 21, 2006)
1 Kansas State vs IOWA STATE (Oct 28, 2006)
1 Texas Tech vs TEXAS (Oct 28, 2006)
1 Oklahoma State vs BAYLOR (Nov 11, 2006)
1 Texas Tech at Oklahoma (Nov 11, 2006)
1 Kansas vs KANSAS STATE (Nov 18, 2006)
1 Oklahoma at Baylor (Nov 18, 2006)
Fumbles lost............. 4 Texas A&M vs THE CITADEL (Sep 02, 2006)
4 Baylor at Texas (Oct 14, 2006)
4 Oklahoma at Baylor (Nov 18, 2006)
Fumbles recovered........ 4 Texas vs BAYLOR (Oct 14, 2006)
4 Baylor vs OKLAHOMA (Nov 18, 2006)
Sacked by opp............ 7 Iowa State at Texas (Sep 23, 2006)
6 Iowa State at Kansas State (Oct 28, 2006)
6 Baylor at Texas Tech (Nov 04, 2006)
6 Iowa State vs KANSAS (Nov 04, 2006)
QB sacks................. 8 Missouri at New Mexico (Sep 16, 2006)
7 Texas vs IOWA STATE (Sep 23, 2006)
Turnovers committed...... 6 Baylor at Oklahoma State (Nov 11, 2006)
6 Kansas State at Kansas (Nov 18, 2006)
Turnovers caused......... 6 Oklahoma State vs BAYLOR (Nov 11, 2006)
6 Kansas vs KANSAS STATE (Nov 18, 2006)
First downs.............. 32 Texas Tech vs BAYLOR (Nov 04, 2006)
30 Nebraska vs LOUISIANA TECH (Sept. 2,2006)
30 Nebraska vs NICHOLLS STATE (Sept. 9,2006)
1st downs rushing........ 20 Oklahoma State vs BAYLOR (Nov 11, 2006)
17 Nebraska vs NICHOLLS STATE (Sept. 9,2006)
17 Kansas at Baylor (Oct 21, 2006)
1st downs passing........ 25 Texas Tech vs TEXAS (Oct 28, 2006)
24 Texas Tech vs BAYLOR (Nov 04, 2006)
1st downs by penalty..... 6 Texas Tech at UTEP (Sep 09, 2006)
5 Texas vs NORTH TEXAS (Sep 02, 2006)
5 Kansas vs SOUTH FLORIDA (Sep 23, 2006)
5 Iowa State vs TEXAS TECH (Oct 21, 2006)
Penalties................ 19 Texas vs Rice (Sep 16, 2006)
14 Kansas State vs MARSHALL (Sep 16, 2006)
14 Texas Tech at Iowa State (Oct 21, 2006)
Penalties yards.......... 148 Texas vs Rice (Sep 16, 2006)
129 Texas Tech at Iowa State (Oct 21, 2006)

2006 Big 12 Football Team Statistics Through games of Nov 26, 2006 (Conference games)
SCORING OFFENSE G TD XP 2XP DXP FG Saf Pts Avg RUSHING OFFENSE G Att Yds Avg TD Yds/G-------------------------------------------------------------- --------------------------------------------------------1. Texas............... 8 36 34 0 0 6 1 270 33.8 1. Texas A&M........... 8 343 1702 5.0 17 212.82. Oklahoma State...... 8 36 33 0 0 5 0 264 33.0 2. Oklahoma State...... 8 326 1685 5.2 16 210.63. Texas Tech.......... 8 31 30 0 0 8 0 240 30.0 3. Colorado............ 8 313 1588 5.1 9 198.54. Nebraska............ 8 32 28 1 0 4 1 236 29.5 4. Oklahoma............ 8 341 1543 4.5 14 192.95. Kansas.............. 8 29 23 1 0 11 1 234 29.2 5. Kansas.............. 8 292 1483 5.1 13 185.46. Missouri............ 8 26 23 0 0 11 1 214 26.8 6. Nebraska............ 8 315 1302 4.1 12 162.87. Oklahoma............ 8 26 24 0 0 8 2 208 26.0 7. Texas............... 8 302 1211 4.0 13 151.48. Baylor.............. 8 25 23 0 0 7 0 194 24.2 8. Kansas State........ 8 247 994 4.0 11 124.29. Texas A&M........... 8 23 14 4 0 11 0 193 24.1 9. Missouri............ 8 263 900 3.4 6 112.510.Kansas State........ 8 23 23 0 0 9 0 188 23.5 10.Iowa State.......... 8 259 673 2.6 8 84.111.Colorado............ 8 17 16 0 0 14 0 160 20.0 11.Texas Tech.......... 8 122 543 4.5 4 67.912.Iowa State.......... 8 15 13 0 0 5 1 120 15.0 12.Baylor.............. 8 165 363 2.2 8 45.4
SCORING DEFENSE G TD XP 2XP DXP FG Saf Pts Avg RUSHING DEFENSE G Rushes Yards Avg. TD Yds/G-------------------------------------------------------------- ----------------------------------------------------------1. Oklahoma............ 8 14 14 0 0 7 1 121 15.1 1. Texas............... 8 208 556 2.7 6 69.52. Texas............... 8 23 20 0 0 5 0 173 21.6 2. Oklahoma............ 8 228 669 2.9 5 83.6 Nebraska............ 8 21 15 1 0 10 0 173 21.6 3. Texas A&M........... 8 233 948 4.1 10 118.54. Texas A&M........... 8 22 20 0 0 6 2 174 21.8 4. Kansas.............. 8 261 981 3.8 8 122.65. Missouri............ 8 22 21 1 0 7 1 178 22.2 5. Colorado............ 8 277 1048 3.8 10 131.06. Colorado............ 8 26 23 0 0 6 1 199 24.9 6. Nebraska............ 8 247 1079 4.4 10 134.97. Kansas State........ 8 27 26 0 0 10 0 218 27.2 7. Texas Tech.......... 8 328 1293 3.9 14 161.68. Kansas.............. 8 28 20 2 0 11 0 225 28.1 Kansas State........ 8 296 1293 4.4 12 161.69. Texas Tech.......... 8 29 28 0 0 11 0 235 29.4 9. Oklahoma State...... 8 289 1376 4.8 13 172.010.Oklahoma State...... 8 30 25 1 0 12 0 243 30.4 10.Iowa State.......... 8 279 1414 5.1 15 176.811.Iowa State.......... 8 34 32 0 0 8 1 262 32.8 11.Missouri............ 8 327 1473 4.5 10 184.112.Baylor.............. 8 43 40 1 0 6 1 320 40.0 12.Baylor.............. 8 315 1857 5.9 18 232.1
PASS OFFENSE G Att Cmp Int Pct. Yds Avg TD Yds/G TOTAL OFFENSE G Rush Pass Plays Yards Avg/P TD Yds/G------------------------------------------------------------------ ----------------------------------------------------------------1. Texas Tech.......... 8 403 270 8 67.0 3012 7.5 25 376.5 1. Texas Tech.......... 8 543 3012 525 3555 6.8 29 444.42. Missouri............ 8 287 182 8 63.4 2188 7.6 17 273.5 2. Nebraska............ 8 1302 2016 547 3318 6.1 32 414.83. Baylor.............. 8 333 192 13 57.7 2187 6.6 16 273.4 3. Oklahoma State...... 8 1685 1564 534 3249 6.1 32 406.14. Nebraska............ 8 232 137 2 59.1 2016 8.7 20 252.0 4. Missouri............ 8 900 2188 550 3088 5.6 23 386.05. Texas............... 8 238 154 7 64.7 1852 7.8 20 231.5 5. Texas A&M........... 8 1702 1382 543 3084 5.7 22 385.56. Kansas State........ 8 261 141 12 54.0 1787 6.8 7 223.4 6. Texas............... 8 1211 1852 540 3063 5.7 33 382.97. Iowa State.......... 8 271 143 10 52.8 1681 6.2 7 210.1 7. Kansas.............. 8 1483 1549 531 3032 5.7 26 379.08. Oklahoma State...... 8 208 114 7 54.8 1564 7.5 16 195.5 8. Oklahoma............ 8 1543 1239 513 2782 5.4 24 347.89. Kansas.............. 8 239 128 12 53.6 1549 6.5 13 193.6 9. Kansas State........ 8 994 1787 508 2781 5.5 18 347.610.Texas A&M........... 8 200 117 3 58.5 1382 6.9 5 172.8 10.Colorado............ 8 1588 1015 485 2603 5.4 16 325.411.Oklahoma............ 8 172 105 4 61.0 1239 7.2 10 154.9 11.Baylor.............. 8 363 2187 498 2550 5.1 24 318.812.Colorado............ 8 172 80 6 46.5 1015 5.9 7 126.9 12.Iowa State.......... 8 673 1681 530 2354 4.4 15 294.2
PASS DEFENSE G Att Cmp Int Pct. Yds Avg TD Yds/G TOTAL DEFENSE G Rush Pass Plys Yards Avg TD Yds/G------------------------------------------------------------------ ---------------------------------------------------------------1. Oklahoma............ 8 245 124 10 50.6 1324 5.4 6 165.5 1. Oklahoma............ 8 669 1324 473 1993 4.2 11 249.12. Texas Tech.......... 8 221 124 8 56.1 1500 6.8 12 187.5 2. Texas A&M........... 8 948 1732 463 2680 5.8 22 335.03. Missouri............ 8 223 134 6 60.1 1532 6.9 11 191.5 3. Texas............... 8 556 2156 494 2712 5.5 21 339.04. Kansas State........ 8 239 138 5 57.7 1634 6.8 12 204.2 4. Texas Tech.......... 8 1293 1500 549 2793 5.1 26 349.15. Texas A&M........... 8 230 133 7 57.8 1732 7.5 12 216.5 5. Colorado............ 8 1048 1793 543 2841 5.2 26 355.16. Baylor.............. 8 249 138 10 55.4 1767 7.1 18 220.9 6. Kansas State........ 8 1293 1634 535 2927 5.5 24 365.97. Colorado............ 8 266 178 10 66.9 1793 6.7 16 224.1 7. Missouri............ 8 1473 1532 550 3005 5.5 21 375.68. Oklahoma State...... 8 233 145 5 62.2 1835 7.9 15 229.4 8. Nebraska............ 8 1079 2051 541 3130 5.8 20 391.29. Iowa State.......... 8 222 159 3 71.6 1845 8.3 18 230.6 9. Oklahoma State...... 8 1376 1835 522 3211 6.2 28 401.410.Nebraska............ 8 294 156 9 53.1 2051 7.0 10 256.4 10.Iowa State.......... 8 1414 1845 501 3259 6.5 33 407.411.Texas............... 8 286 164 10 57.3 2156 7.5 15 269.5 11.Kansas.............. 8 981 2303 569 3284 5.8 26 410.512.Kansas.............. 8 308 170 9 55.2 2303 7.5 18 287.9 12.Baylor.............. 8 1857 1767 564 3624 6.4 36 453.0
KICKOFF RETURNS G Ret Yds TD Avg PUNT RETURN AVG G Ret Yds TD Avg------------------------------------------------ ------------------------------------------------1. Texas A&M........... 8 13 355 1 27.3 1. Kansas.............. 8 16 207 0 12.92. Kansas State........ 8 24 632 2 26.3 2. Missouri............ 8 10 119 0 11.93. Oklahoma State...... 8 37 886 1 23.9 3. Kansas State........ 8 20 193 1 9.64. Oklahoma............ 8 17 404 1 23.8 4. Texas............... 8 14 133 0 9.55. Texas............... 8 16 356 0 22.2 5. Baylor.............. 8 18 157 0 8.76. Baylor.............. 8 33 706 0 21.4 6. Oklahoma State...... 8 15 114 0 7.67. Kansas.............. 8 31 606 0 19.5 7. Nebraska............ 8 15 113 0 7.58. Iowa State.......... 8 28 518 0 18.5 8. Texas A&M........... 8 10 73 0 7.39. Colorado............ 8 21 383 0 18.2 9. Texas Tech.......... 8 20 145 0 7.210.Missouri............ 8 17 290 0 17.1 10.Colorado............ 8 14 86 0 6.111.Nebraska............ 8 18 298 0 16.6 11.Oklahoma............ 8 19 65 0 3.412.Texas Tech.......... 8 25 384 0 15.4 12.Iowa State.......... 8 13 39 0 3.0

2006 Big 12 Football Team Statistics Through games of Nov 26, 2006 (Conference games)
PUNTING G No. Yards Avg/P PR Avg TB Net/P PASS EFFICIENCY G Att Cmp Pct Int Yds TD Effic--------------------------------------------------------------- --------------------------------------------------------------1. Baylor.............. 8 44 2091 47.5 179 4.1 1 43.0 1. Nebraska............ 8 232 137 .591 2 2016 20 158.82. Colorado............ 8 30 1299 43.3 109 3.6 0 39.7 2. Texas............... 8 238 154 .647 7 1852 20 151.93. Nebraska............ 8 44 1747 39.7 51 1.2 1 38.1 3. Texas Tech.......... 8 403 270 .670 8 3012 25 146.34. Texas Tech.......... 8 29 1275 44.0 74 2.6 5 38.0 4. Missouri............ 8 287 182 .634 8 2188 17 141.45. Oklahoma............ 8 34 1350 39.7 27 0.8 3 37.1 5. Oklahoma State...... 8 208 114 .548 7 1564 16 136.66. Texas A&M........... 8 37 1614 43.6 174 4.7 4 36.8 6. Oklahoma............ 8 172 105 .610 4 1239 10 136.17. Iowa State.......... 8 43 1794 41.7 155 3.6 3 36.7 7. Texas A&M........... 8 200 117 .585 3 1382 5 121.88. Kansas State........ 8 41 1754 42.8 169 4.1 5 36.2 8. Baylor.............. 8 333 192 .577 13 2187 16 120.99. Kansas.............. 8 41 1649 40.2 103 2.5 4 35.8 9. Kansas.............. 8 239 128 .536 12 1549 13 115.910.Texas............... 8 36 1389 38.6 90 2.5 1 35.5 10.Kansas State........ 8 261 141 .540 12 1787 7 111.211.Oklahoma State...... 8 34 1409 41.4 201 5.9 1 34.9 11.Iowa State.......... 8 271 143 .528 10 1681 7 106.012.Missouri............ 8 28 1119 40.0 112 4.0 3 33.8 12.Colorado............ 8 172 80 .465 6 1015 7 102.5
|--Gained--||---Lost---| PASS DEF EFFICIENCY G Att Cmp Int Pct. Yds TD EfficTURNOVER MARGIN G Fum Int Tot Fum Int Tot Mar Per/G ---------------------------------------------------------------------------------------------------------------------------- 1. Oklahoma............ 8 245 124 10 50.6 1324 6 95.91. Texas A&M........... 8 7 7 14 3 3 6 +8 1.00 2. Nebraska............ 8 294 156 9 53.1 2051 10 116.82. Texas............... 8 13 10 23 9 7 16 +7 0.88 3. Texas Tech.......... 8 221 124 8 56.1 1500 12 123.8 Colorado............ 8 7 10 17 4 6 10 +7 0.88 4. Kansas State........ 8 239 138 5 57.7 1634 12 127.64. Kansas.............. 8 14 9 23 10 12 22 +1 0.12 5. Missouri............ 8 223 134 6 60.1 1532 11 128.7 Oklahoma State...... 8 9 5 14 6 7 13 +1 0.12 6. Baylor.............. 8 249 138 10 55.4 1767 18 130.96. Nebraska............ 8 4 9 13 11 2 13 +0 0.00 7. Texas............... 8 286 164 10 57.3 2156 15 131.0 Texas Tech.......... 8 10 8 18 10 8 18 +0 0.00 8. Kansas.............. 8 308 170 9 55.2 2303 18 131.4 Missouri............ 8 10 6 16 8 8 16 +0 0.00 9. Texas A&M........... 8 230 133 7 57.8 1732 12 132.29. Kansas State........ 8 12 5 17 8 12 20 -3 -0.38 10.Colorado............ 8 266 178 10 66.9 1793 16 135.910.Iowa State.......... 8 8 3 11 5 10 15 -4 -0.50 11.Oklahoma State...... 8 233 145 5 62.2 1835 15 145.311.Oklahoma............ 8 3 10 13 15 4 19 -6 -0.75 12.Iowa State.......... 8 222 159 3 71.6 1845 18 165.512.Baylor.............. 8 6 10 16 14 13 27 -11 -1.38
FIRST DOWNS G Rush Pass Pen Total 3RD-DN CONVERSIONS G Conv Att Pct----------------------------------------------- -------------------------------------------1. Texas Tech.......... 8 34 139 12 185 1. Texas A&M........... 8 62 119 52.12. Texas............... 8 75 81 20 176 2. Missouri............ 8 57 117 48.73. Missouri............ 8 53 109 13 175 3. Oklahoma............ 8 49 106 46.2 Oklahoma State...... 8 91 79 5 175 4. Oklahoma State...... 8 48 107 44.95. Texas A&M........... 8 90 58 9 157 5. Nebraska............ 8 52 117 44.46. Nebraska............ 8 65 81 10 156 6. Texas............... 8 39 99 39.47. Oklahoma............ 8 68 68 9 145 7. Baylor.............. 8 39 108 36.18. Kansas.............. 8 73 63 8 144 8. Colorado............ 8 37 104 35.6 Iowa State.......... 8 49 78 17 144 9. Kansas State........ 8 38 109 34.910.Baylor.............. 8 31 89 16 136 10.Kansas.............. 8 37 110 33.611.Kansas State........ 8 55 72 7 134 11.Iowa State.......... 8 36 111 32.412.Colorado............ 8 71 53 7 131 12.Texas Tech.......... 8 27 88 30.7
OPPONENT 1ST DOWNS G Rush Pass Pen Total OPP 3RD-DN CONVERT G Conv Att Pct----------------------------------------------- -------------------------------------------1. Oklahoma............ 8 43 62 7 112 1. Texas A&M........... 8 23 85 27.12. Texas A&M........... 8 51 77 10 138 2. Oklahoma............ 8 34 111 30.63. Texas............... 8 37 91 13 141 3. Nebraska............ 8 37 112 33.04. Colorado............ 8 54 86 10 150 4. Kansas State........ 8 43 114 37.75. Nebraska............ 8 51 98 6 155 5. Oklahoma State...... 8 39 103 37.9 Kansas State........ 8 66 75 14 155 6. Texas............... 8 44 109 40.47. Iowa State.......... 8 64 85 7 156 7. Kansas.............. 8 50 119 42.08. Kansas.............. 8 60 92 12 164 8. Missouri............ 8 47 109 43.19. Missouri............ 8 79 75 13 167 9. Iowa State.......... 8 42 96 43.810.Oklahoma State...... 8 74 84 14 172 10.Baylor.............. 8 48 108 44.4 Texas Tech.......... 8 75 78 19 172 11.Texas Tech.......... 8 52 108 48.112.Baylor.............. 8 101 67 8 176 12.Colorado............ 8 62 121 51.2
SACKS BY G Sacks Yards SACKS AGAINST G Sacks Yards--------------------------------------- ---------------------------------------1. Kansas State........ 8 27 151 1. Oklahoma............ 8 9 672. Texas............... 8 24 193 2. Texas Tech.......... 8 11 763. Kansas.............. 8 21 151 3. Texas A&M........... 8 12 74 Texas Tech.......... 8 21 139 Missouri............ 8 12 1055. Oklahoma State...... 8 20 150 Oklahoma State...... 8 12 806. Nebraska............ 8 18 140 6. Texas............... 8 16 1127. Missouri............ 8 17 97 7. Kansas.............. 8 17 978. Iowa State.......... 8 16 93 Colorado............ 8 17 1029. Oklahoma............ 8 15 141 9. Kansas State........ 8 21 14910.Colorado............ 8 12 85 10.Nebraska............ 8 22 15611.Texas A&M........... 8 11 87 11.Baylor.............. 8 27 24612.Baylor.............. 8 5 40 12.Iowa State.......... 8 31 203

2006 Big 12 Football Team Statistics Through games of Nov 26, 2006 (Conference games)
PENALTIES G No Yds Avg/G FIELD GOALS G Made Att Pct------------------------------------------ --------------------------------------------1. Iowa State.......... 8 39 291 36.4 1. Missouri............ 8 11 11 1.0002. Oklahoma............ 8 38 304 38.0 Oklahoma............ 8 8 8 1.0003. Missouri............ 8 38 340 42.5 Oklahoma State...... 8 5 5 1.0004. Colorado............ 8 39 346 43.2 4. Nebraska............ 8 4 5 .8005. Kansas.............. 8 43 353 44.1 5. Kansas.............. 8 11 14 .7866. Baylor.............. 8 40 361 45.1 Texas A&M........... 8 11 14 .7867. Nebraska............ 8 44 364 45.5 7. Baylor.............. 8 7 9 .7788. Texas............... 8 37 366 45.8 8. Kansas State........ 8 9 12 .7509. Oklahoma State...... 8 47 378 47.2 Texas............... 8 6 8 .75010.Texas A&M........... 8 46 387 48.4 10.Colorado............ 8 14 19 .73711.Kansas State........ 8 49 397 49.6 11.Texas Tech.......... 8 8 11 .72712.Texas Tech.......... 8 67 600 75.0 12.Iowa State.......... 8 5 7 .714
OPPONENT PENALTIES G No Yds Avg/G PAT KICKING G Made Att Pct------------------------------------------ --------------------------------------------1. Texas............... 8 70 574 71.8 1. Texas Tech.......... 8 30 30 1.0002. Baylor.............. 8 57 517 64.6 Baylor.............. 8 23 23 1.0003. Iowa State.......... 8 52 513 64.1 Kansas State........ 8 23 23 1.0004. Colorado............ 8 54 450 56.2 Missouri............ 8 23 23 1.0005. Missouri............ 8 46 397 49.6 Colorado............ 8 16 16 1.0006. Kansas.............. 8 38 329 41.1 Iowa State.......... 8 13 13 1.0007. Nebraska............ 8 40 316 39.5 7. Nebraska............ 8 28 29 .9668. Oklahoma............ 8 39 306 38.2 8. Oklahoma............ 8 24 25 .9609. Texas Tech.......... 8 34 289 36.1 9. Texas............... 8 34 36 .94410.Texas A&M........... 8 35 283 35.4 10.Oklahoma State...... 8 33 35 .94311.Kansas State........ 8 32 267 33.4 11.Kansas.............. 8 23 26 .88512.Oklahoma State...... 8 30 246 30.8 12.Texas A&M........... 8 14 16 .875
4TH-DN CONVERSIONS G Conv Att Pct TIME OF POSSESSION G Total Time Avg/G------------------------------------------- ----------------------------------------------1. Nebraska............ 8 7 9 77.8 1. Texas A&M........... 8 278:48 34:51 Texas............... 8 7 9 77.8 2. Nebraska............ 8 262:32 32:493. Kansas.............. 8 6 9 66.7 3. Oklahoma............ 8 257:50 32:13 Oklahoma............ 8 4 6 66.7 4. Texas............... 8 251:59 31:295. Oklahoma State...... 8 8 13 61.5 5. Kansas.............. 8 238:39 29:496. Baylor.............. 8 3 6 50.0 6. Oklahoma State...... 8 235:21 29:25 Texas A&M........... 8 3 6 50.0 7. Iowa State.......... 8 234:50 29:218. Iowa State.......... 8 9 19 47.4 8. Colorado............ 8 230:57 28:529. Texas Tech.......... 8 7 15 46.7 9. Kansas State........ 8 230:07 28:4510.Missouri............ 8 6 13 46.2 10.Baylor.............. 8 222:25 27:4811.Kansas State........ 8 6 15 40.0 11.Texas Tech.......... 8 218:21 27:1712.Colorado............ 8 2 13 15.4 12.Missouri............ 8 218:11 27:16
OPP 4TH-DN CONVERT G Conv Att Pct KICKOFF COVERAGE G No. Yards Avg Retn TB NetAvg------------------------------------------- ------------------------------------------------------------1. Kansas.............. 8 2 10 20.0 1. Oklahoma............ 8 42 2490 59.3 393 15 42.82. Missouri............ 8 5 16 31.2 2. Iowa State.......... 8 28 1693 60.5 280 11 42.63. Nebraska............ 8 6 16 37.5 3. Texas Tech.......... 8 46 2856 62.1 550 18 42.34. Baylor.............. 8 3 7 42.9 4. Missouri............ 8 44 2722 61.9 646 11 42.25. Texas............... 8 5 11 45.5 5. Colorado............ 8 36 2182 60.6 307 19 41.56. Oklahoma............ 8 6 13 46.2 6. Texas A&M........... 8 42 2512 59.8 391 19 41.57. Texas Tech.......... 8 5 9 55.6 7. Baylor.............. 8 38 2381 62.7 416 20 41.28. Texas A&M........... 8 7 11 63.6 8. Oklahoma State...... 8 47 2982 63.4 680 19 40.99. Iowa State.......... 8 4 6 66.7 9. Kansas.............. 8 47 2960 63.0 499 27 40.9 Colorado............ 8 8 12 66.7 10.Kansas State........ 8 39 2274 58.3 395 16 40.011.Oklahoma State...... 8 7 10 70.0 11.Nebraska............ 8 43 2546 59.2 609 11 39.912.Kansas State........ 8 10 12 83.3 12.Texas............... 8 49 2838 57.9 652 15 38.5
RED ZONE OFFENSE G RedZone Percent TDs R/P FG-AT Fumb/Int/Downs/Other--------------------------------------------------------------------------------1. Nebraska............ 8 23-24 95.8 20 10/10 3-3 1/ 0/ 0/ 0 Oklahoma............ 8 23-24 95.8 17 10/7 6-6 0/ 0/ 0/ 13. Texas A&M........... 8 26-29 89.7 16 12/4 10-11 0/ 1/ 0/ 14. Baylor.............. 8 23-26 88.5 17 6/11 6-6 0/ 1/ 1/ 15. Missouri............ 8 29-33 87.9 19 6/13 10-10 0/ 0/ 3/ 16. Oklahoma State...... 8 23-27 85.2 19 12/7 4-4 1/ 0/ 1/ 27. Texas Tech.......... 8 24-29 82.8 16 3/13 8-10 1/ 0/ 2/ 08. Texas............... 8 28-34 82.4 22 13/9 6-7 2/ 1/ 1/ 19. Kansas.............. 8 26-34 76.5 19 12/7 7-7 4/ 3/ 1/ 010.Kansas State........ 8 13-18 72.2 9 6/3 4-4 1/ 0/ 3/ 111.Iowa State.......... 8 16-23 69.6 13 8/5 3-5 2/ 0/ 2/ 1 Colorado............ 8 16-23 69.6 8 5/3 8-9 1/ 0/ 5/ 1

2006 Big 12 Football Team Statistics Through games of Nov 26, 2006 (Conference games)
RED ZONE DEFENSE G RedZone Percent TDs R/P FG-AT Fumb/Int/Downs/Other--------------------------------------------------------------------------------1. Oklahoma............ 8 13-18 72.2 8 5/3 5-6 1/ 0/ 2/ 12. Missouri............ 8 23-30 76.7 17 9/8 6-7 0/ 1/ 4/ 1 Nebraska............ 8 23-30 76.7 14 7/7 9-10 1/ 1/ 4/ 04. Kansas State........ 8 25-32 78.1 19 10/9 6-7 2/ 1/ 1/ 25. Texas A&M........... 8 20-25 80.0 14 9/5 6-6 1/ 1/ 2/ 16. Texas Tech.......... 8 22-26 84.6 15 12/3 7-7 1/ 0/ 1/ 27. Colorado............ 8 23-27 85.2 20 8/12 3-3 2/ 1/ 0/ 18. Iowa State.......... 8 27-31 87.1 22 12/10 5-6 2/ 0/ 1/ 09. Baylor.............. 8 28-32 87.5 24 13/11 4-6 1/ 0/ 0/ 210.Kansas.............. 8 23-26 88.5 13 6/7 10-10 1/ 0/ 2/ 011.Oklahoma State...... 8 29-32 90.6 19 9/10 10-10 1/ 1/ 1/ 012.Texas............... 8 14-15 93.3 10 3/7 4-4 0/ 0/ 1/ 0
ON-SIDE KICK SUCCESS G OnSide Percent ON-SIDE KICK ALLOWED G OnSide Percent------------------------------------------ ------------------------------------------1. Kansas State........ 8 1-1 100.0 1. Kansas State........ 8 0-2 0.0 Texas A&M........... 8 1-1 100.0 Oklahoma............ 8 0-1 0.0 Oklahoma State...... 8 1-1 100.0 Nebraska............ 8 0-1 0.04. Colorado............ 8 0-3 0.0 Texas A&M........... 8 0-1 0.0 Iowa State.......... 8 0-1 0.0 Baylor.............. 8 0-0 0.0 Texas Tech.......... 8 0-1 0.0 Texas Tech.......... 8 0-0 0.0 Texas............... 8 0-1 0.0 Iowa State.......... 8 0-0 0.0 Oklahoma............ 8 0-1 0.0 Missouri............ 8 0-0 0.0 Baylor.............. 8 0-0 0.0 Texas............... 8 0-0 0.0 Kansas.............. 8 0-0 0.0 10.Colorado............ 8 1-2 50.0 Nebraska............ 8 0-0 0.0 Kansas.............. 8 1-2 50.0 Missouri............ 8 0-0 0.0 12.Oklahoma State...... 8 1-1 100.0

2006 Big 12 Football Individual Statistics Through games of Nov 26, 2006 (Conference games)
RUSHING Team Cl G Att Yds Avg TD Long Yds/G INTERCEPTIONS Team Cl G Int Yds TD---------------------------------------------------------------- -----------------------------------------------1. Cornish, Jon........ KU SR 8 168 1020 6.1 6 49 127.5 1. Talib, Aqib......... KU SO 8 5 82 02. Patrick, Allen...... OU JR 6 130 612 4.7 3 65 102.0 2. Griffin, Michael.... UT SR 8 4 41 03. Jackson, Brandon.... NU JR 8 145 755 5.2 5 48 94.4 Wheatley, Terrence.. CU JR 8 4 17 04. Goodson, Mike....... TAMU FR 8 86 642 7.5 4 64 80.2 Ross, Aaron......... UT SR 8 4 7 05. Savage,Dantrell..... OSU JR 8 96 600 6.2 6 60 75.0 5. Webb, Anthony....... KU FR 8 3 45 16. Charles, Hugh....... CU JR 8 94 553 5.9 1 44 69.1 Crawford, Dwain..... BU SO 6 3 15 07. Jackson,Bernard..... CU JR 8 104 552 5.3 5 62 69.0 7. Smith, Reggie....... OU SO 8 2 94 18. Charles, Jamaal..... UT SO 8 113 549 4.9 5 27 68.6 Stratton, Brock..... TTU JR 8 2 34 09. Patton, Leon........ KSU FR 8 90 545 6.1 6 44 68.1 Todd, James......... BU SR 8 2 25 010.Woods, Shannon...... TTU SO 8 88 521 5.9 4 51 65.1 Walker, Marcus...... OU JR 8 2 23 0
PASSING AVG/GAME Team Cl G Att Cmp Int Pct. Yds TD Avg/G PASS EFFICIENCY Team Cl G Att Cmp Int Pct. Yds TD Eff.------------------------------------------------------------------ ------------------------------------------------------------------1. Harrell, Graham..... TTU SO 8 385 259 8 67.3 2943 25 367.9 1. McCoy, Colt......... UT FR 8 204 140 6 68.6 1628 19 160.52. Daniel, Chase....... MU SO 8 281 181 8 64.4 2177 17 272.1 2. Taylor, Zac......... NU SR 8 226 133 2 58.8 1917 16 151.73. Bell, Shawn......... BU SR 6 212 128 6 60.4 1511 12 251.8 3. Harrell, Graham..... TTU SO 8 385 259 8 67.3 2943 25 148.84. Taylor, Zac......... NU SR 8 226 133 2 58.8 1917 16 239.6 4. Daniel, Chase....... MU SO 8 281 181 8 64.4 2177 17 143.85. Meyer,Bret.......... ISU JR 8 268 141 10 52.6 1634 7 204.2 5. Reid,Bobby.......... OSU SO 8 165 92 7 55.8 1255 13 137.26. Freeman, Josh....... KSU FR 8 235 127 12 54.0 1633 6 204.1 6. Thompson, Paul...... OU SR 8 172 105 4 61.0 1239 10 136.17. McCoy, Colt......... UT FR 8 204 140 6 68.6 1628 19 203.5 7. Bell, Shawn......... BU SR 6 212 128 6 60.4 1511 12 133.38. McGee, Stephen...... TAMU SO 8 197 115 2 58.4 1298 5 162.2 8. McGee, Stephen...... TAMU SO 8 197 115 2 58.4 1298 5 120.19. Reid,Bobby.......... OSU SO 8 165 92 7 55.8 1255 13 156.9 9. Freeman, Josh....... KSU FR 8 235 127 12 54.0 1633 6 110.610.Thompson, Paul...... OU SR 8 172 105 4 61.0 1239 10 154.9 10.Jackson,Bernard..... CU JR 8 162 78 5 48.1 1002 7 108.2
TOTAL OFFENSE Team Cl G Rush Pass Plays Total Yds/G PUNT RETURN AVG Team Cl G Ret Yds TD Long Avg-------------------------------------------------------------- ----------------------------------------------------------1. Harrell, Graham..... TTU SO 8 -52 2943 404 2891 361.4 1. Lamb, Jonathan...... KU SR 8 13 160 0 52 12.32. Daniel, Chase....... MU SO 8 262 2177 377 2439 304.9 2. Saunders, Tommy..... MU SO 8 10 119 0 41 11.93. Bell, Shawn......... BU SR 6 -90 1511 227 1421 236.8 3. Figurs, Yamon....... KSU SR 7 14 148 0 52 10.64. Taylor, Zac......... NU SR 8 -51 1917 262 1866 233.2 4. Cox,Perrish......... OSU FR 7 11 104 0 63 9.55. McCoy, Colt......... UT FR 8 130 1628 257 1758 219.8 5. Ross, Aaron......... UT SR 8 11 100 0 25 9.16. McGee, Stephen...... TAMU SO 8 416 1298 301 1714 214.2 6. Sims, Carl.......... BU SO 7 11 99 0 24 9.07. Meyer,Bret.......... ISU JR 8 -1 1634 355 1633 204.1 7. Amendola, Danny..... TTU SO 8 19 145 0 29 7.68. Freeman, Josh....... KSU FR 8 -4 1633 279 1629 203.6 8. Schroeder, Chad..... TAMU SR 8 10 73 0 30 7.39. Reid,Bobby.......... OSU SO 8 319 1255 247 1574 196.8 9. Smith, Reggie....... OU SO 8 18 53 0 11 2.910.Jackson,Bernard..... CU JR 8 552 1002 266 1554 194.2
RECEPTIONS/GAME Team Cl G Rec Yds TD Long Avg/C Rec/G KICK RETURN AVG Team Cl G Ret Yds TD Long Avg---------------------------------------------------------------- ----------------------------------------------------------1. Filani, Joel........ TTU SR 8 56 848 8 76 15.1 7.00 1. Jones,Grant......... OSU SR 8 14 436 1 89 31.12. Woods, Shannon...... TTU SO 8 54 451 2 54 8.4 6.75 2. Herford, Marcus..... KU SO 7 19 452 0 73 23.83. Johnson, Robert..... TTU SR 7 46 492 7 37 10.7 6.57 3. Baker, Mikail....... BU SO 8 16 356 0 58 22.24. Bowman,Adarius...... OSU JR 8 42 747 8 64 17.8 5.25 4. Moses,Milan......... ISU JR 7 15 325 0 43 21.75. Zeigler, D.......... BU SR 8 41 593 3 79 14.5 5.12 5. Cox,Perrish......... OSU FR 7 21 426 0 57 20.36. Coffman, Chase...... MU SO 8 37 399 7 25 10.8 4.62 6. Washington, Terry... CU SR 8 10 194 0 25 19.47. Kelly, Malcolm...... OU SO 8 35 472 4 57 13.5 4.38 7. Goldsmith, Earl..... MU SO 6 12 230 0 32 19.2 Amendola, Danny..... TTU SO 8 35 354 4 41 10.1 4.38 8. Morris, Eric........ TTU SO 8 12 201 0 32 16.89. Franklin, William... MU JR 7 28 486 2 64 17.4 4.00 Fields, Dexton...... KU SO 8 32 322 3 30 10.1 4.00
RECEIVE YDS/GAME Team Cl G Rec Yds TD Long Avg/C Yds/G PUNTING Team Cl G Punts Yds Long Avg---------------------------------------------------------------- ---------------------------------------------------------1. Filani, Joel........ TTU SR 8 56 848 8 76 15.1 106.0 1. Sepulveda, D........ BU SR 8 43 2069 78 48.12. Bowman,Adarius...... OSU JR 8 42 747 8 64 17.8 93.4 2. DiLallo,Matthew..... CU FR 8 27 1196 63 44.33. Zeigler, D.......... BU SR 8 41 593 3 79 14.5 74.1 3. Brantly, Justin..... TAMU SO 8 35 1543 58 44.14. Johnson, Robert..... TTU SR 7 46 492 7 37 10.7 70.3 4. Reyes, Alex......... TTU SR 8 29 1275 56 44.05. Franklin, William... MU JR 7 28 486 2 64 17.4 69.4 5. Reyer, Tim.......... KSU JR 8 40 1754 65 43.86. Sweed, Limas........ UT JR 8 31 497 7 55 16.0 62.1 6. Fodge,Matt.......... OSU SO 8 32 1389 71 43.47. Shelton, Trent...... BU SR 8 27 479 6 75 17.7 59.9 7. Brandtner,Mike...... ISU FR 8 43 1794 73 41.78. Kelly, Malcolm...... OU SO 8 35 472 4 57 13.5 59.0 8. Crossett, Adam...... MU JR 8 27 1119 79 41.49. Woods,D'Juan........ OSU SR 8 30 454 2 55 15.1 56.8 9. Cohen, Michael...... OU JR 8 26 1076 75 41.410.Woods, Shannon...... TTU SO 8 54 451 2 54 8.4 56.4 10.Johnson, Greg....... UT SR 7 30 1213 54 40.4
ALL PURPOSE Team Cl G Rush Rcv PR KR Yds Avg/G SCORING Team Cl G TD XPT FG 2XP Pts Pts/G----------------------------------------------------------------- -------------------------------------------------------------1. Woods, Shannon...... TTU SO 8 521 451 0 131 1103 137.9 1. Trlica, Alex........ TTU JR 7 0 30 8 0 54 7.72. Cornish, Jon........ KU SR 8 1020 76 0 0 1096 137.0 2. Crosby, Mason....... CU SR 8 0 16 14 0 58 7.23. Jackson, Brandon.... NU JR 8 755 230 0 106 1091 136.4 3. Wolfert, Jeff....... MU SO 8 0 23 11 0 56 7.04. Patton, Leon........ KSU FR 8 545 118 0 256 919 114.9 Webb, Scott......... KU JR 8 0 23 11 0 56 7.05. Filani, Joel........ TTU SR 8 34 848 0 0 882 110.2 5. Lane, Jorvorskie.... TAMU SO 8 9 0 0 0 54 6.86. Patrick, Allen...... OU JR 6 612 0 0 0 612 102.0 6. Snodgrass, Jeff..... KSU SR 8 0 23 9 0 50 6.27. Bowman,Adarius...... OSU JR 8 0 747 0 0 747 93.4 7. Filani, Joel........ TTU SR 8 8 0 0 0 48 6.08. Goodson, Mike....... TAMU FR 8 642 81 0 0 723 90.4 Johnson, Robert..... TTU SR 7 7 0 0 0 42 6.09. Moses,Milan......... ISU JR 7 0 282 0 325 607 86.7 Bowman,Adarius...... OSU JR 8 8 0 0 0 48 6.010.Figurs, Yamon....... KSU SR 7 33 329 148 59 569 81.3 Hartley, Garret..... OU JR 8 0 24 8 0 48 6.0

2006 Big 12 Football Individual Statistics Through games of Nov 26, 2006 (Conference games)
SCORING (TDs) Team Cl G TD Rush Pass Ret PAT Pts Pts/G FIELD GOALS Team Cl G FG FGA Pct. FG/G------------------------------------------------------------------ --------------------------------------------------------1. Lane, Jorvorskie.... TAMU SO 8 9 9 0 0 0 54 6.8 1. Crosby, Mason....... CU SR 8 14 19 73.7 1.752. Filani, Joel........ TTU SR 8 8 0 8 0 0 48 6.0 2. Wolfert, Jeff....... MU SO 8 11 11 100.0 1.38 Johnson, Robert..... TTU SR 7 7 0 7 0 0 42 6.0 Webb, Scott......... KU JR 8 11 14 78.6 1.38 Bowman,Adarius...... OSU JR 8 8 0 8 0 0 48 6.0 Neumann, Layne...... TAMU SR 8 11 14 78.6 1.385. Patton, Leon........ KSU FR 8 7 6 0 1 0 42 5.2 5. Trlica, Alex........ TTU JR 7 8 11 72.7 1.14 Sweed, Limas........ UT JR 8 7 0 7 0 0 42 5.2 6. Snodgrass, Jeff..... KSU SR 8 9 12 75.0 1.12 Jackson, Brandon.... NU JR 8 7 5 2 0 0 42 5.2 7. Hartley, Garret..... OU JR 8 8 8 100.0 1.00 Cornish, Jon........ KU SR 8 7 6 1 0 0 42 5.2 8. Havens, Ryan........ BU SR 8 7 9 77.8 0.88 Coffman, Chase...... MU SO 8 7 0 7 0 0 42 5.2 9. Culbertson,Bret..... ISU JR 8 5 7 71.4 0.6210.Glenn, Cody......... NU SO 6 5 5 0 0 0 30 5.0 10.Ricks,Jason......... OSU SO 7 4 4 100.0 0.57
SCORING (KICK) Team Cl G PATs FGs Pts Pts/G FIELD GOAL PCT Team Cl G FG FGA Long Pct.------------------------------------------------------------ -------------------------------------------------------1. Trlica, Alex........ TTU JR 7 30-30 8-11 54 7.7 1. Wolfert, Jeff....... MU SO 8 11 11 54 100.02. Crosby, Mason....... CU SR 8 16-16 14-19 58 7.2 Hartley, Garret..... OU JR 8 8 8 46 100.03. Webb, Scott......... KU JR 8 23-25 11-14 56 7.0 3. Webb, Scott......... KU JR 8 11 14 49 78.6 Wolfert, Jeff....... MU SO 8 23-23 11-11 56 7.0 Neumann, Layne...... TAMU SR 8 11 14 39 78.65. Snodgrass, Jeff..... KSU SR 8 23-23 9-12 50 6.2 5. Havens, Ryan........ BU SR 8 7 9 47 77.86. Hartley, Garret..... OU JR 8 24-25 8-8 48 6.0 6. Snodgrass, Jeff..... KSU SR 8 9 12 53 75.07. Neumann, Layne...... TAMU SR 8 14-16 11-14 47 5.9 7. Crosby, Mason....... CU SR 8 14 19 56 73.78. Havens, Ryan........ BU SR 8 23-23 7-9 44 5.5 8. Trlica, Alex........ TTU JR 7 8 11 37 72.79. Ricks,Jason......... OSU SO 7 24-26 4-4 36 5.110.Congdon, Jordan..... NU SO 8 28-29 4-5 40 5.0
PAT KICKING PCT Team Cl G Made Att Pct. --------------------------------------------------- 1. Trlica, Alex........ TTU JR 7 30 30 100.0 Snodgrass, Jeff..... KSU SR 8 23 23 100.0 Havens, Ryan........ BU SR 8 23 23 100.0 Wolfert, Jeff....... MU SO 8 23 23 100.0 Crosby, Mason....... CU SR 8 16 16 100.0 6. Congdon, Jordan..... NU SO 8 28 29 96.6 7. Hartley, Garret..... OU JR 8 24 25 96.0 8. Johnson, Greg....... UT SR 7 19 20 95.0 9. Ricks,Jason......... OSU SO 7 24 26 92.3 10.Webb, Scott......... KU JR 8 23 25 92.0

2006 Big 12 Football Individual Statistics Through games of Nov 26, 2006 (Conference games)
TACKLES (All positions) SACKS Team Cl G Pos Solo Ast Yds Total Avg/GPlayer Team Cl G Pos Solo Ast Total Avg/G Sack -------------------------------------------------------------------------------------------------------------------------------- 1. Wright, Abraham..... CU SR 8 DE 7 0 53 7.0 0.881. Bowen,Alvin......... ISU JR 8 LB 64 28 92 11.5 1.0 2. Moorehead,Shawn..... ISU SR 8 DE 6 1 33 6.5 0.812. Dizon, Jordon....... CU JR 8 LB 46 42 88 11.0 2.0 3. Campbell, Ian....... KSU SO 8 DE 6 0 33 6.0 0.753. McKenzie,Tyrone..... ISU SO 8 LB 37 47 84 10.5 2.0 4. Crowder, Tim........ UT SR 8 DE 5 1 40 5.5 0.694. Diles, Zach......... KSU SR 8 LB 29 41 70 8.8 2.5 5. DeGrate,Victor...... OSU SR 6 DL 5 1 31 5.5 0.925. Harrington, Dedrick. MU SR 8 LB 33 34 67 8.4 2.5 6. Carriker, Adam...... NU SR 8 5 0 29 5.0 0.626. Banks,Jon........... ISU JR 8 DB 40 25 65 8.1 0.0 7. Peterson,Nathan..... OSU JR 8 DL 4 1 40 4.5 0.567. Archer, Brandon..... KSU SR 8 LB 30 34 64 8.0 2.5 McClinton, Jame..... KU JR 8 DT 4 1 35 4.5 0.56 Overstreet, David... MU SR 8 DB 28 36 64 8.0 0.5 Curvey,Brent........ ISU SR 8 DL 4 1 33 4.5 0.569. Warren, Justin...... TAMU SR 8 LB 27 36 63 7.9 1.0 10.Harrington, Chris... TAMU JR 8 DL 4 0 38 4.0 0.50 Stratton, Brock..... TTU JR 8 LB 32 31 63 7.9 0.511.Kemp, Jerome........ KU SR 8 DB 35 26 61 7.6 1.0 TACKLES FOR LOSS Team Cl G Pos Solo Ast Yds Total Avg/G12.Pawelek, Joe........ BU FR 8 LB 35 25 60 7.5 1.0 ----------------------------------------------------------------13.Bacon, Marcus....... MU SR 8 LB 23 36 59 7.4 3.0 1. McClinton, Jame..... KU JR 8 DT 9 6 49 12.0 1.50 Alexander, Rufu..... OU SR 8 LB 37 22 59 7.4 1.0 2. Bobino, Rashad...... UT SO 8 LB 10 1 34 10.5 1.31 Bullitt, Melvin..... TAMU SR 8 DB 23 36 59 7.4 0.0 3. Carriker, Adam...... NU SR 8 8 3 41 9.5 1.1916.Washington,Thaddaeus CU SR 8 LB 31 27 58 7.2 0.0 4. Moorehead,Shawn..... ISU SR 8 DE 8 2 36 9.0 1.12 Griffin, Michael.... UT SR 8 DB 41 17 58 7.2 1.0 Jackson, Xzavie..... MU SR 8 DE 8 2 36 9.0 1.1218.Mortensen, Joe...... KU SO 8 LB 20 36 56 7.0 2.5 Curvey,Brent........ ISU SR 8 DL 8 2 40 9.0 1.1219.Sexton,Andre........ OSU FR 8 DB 46 9 55 6.9 0.0 7. Lavine,Patrick...... OSU FR 8 LB 8 0 25 8.0 1.00 Rivera, Mike........ KU SO 8 LB 31 24 55 6.9 1.0 Wright, Abraham..... CU SR 8 DE 7 2 56 8.0 1.0021.Lavine,Patrick...... OSU FR 8 LB 36 16 52 6.5 2.0 9. Moore, Jay.......... NU SR 8 DE 5 5 34 7.5 0.94 Garcia, Joe......... TTU JR 8 DB 28 24 52 6.5 0.0 Ah You, C.J......... OU SR 8 DE 7 1 43 7.5 0.9423.Jones, Andre........ NU JR 8 DB 34 16 50 6.2 0.024.Moore, Nick......... BU JR 8 LB 27 22 49 6.1 0.0 FUMBLES FORCED Team Cl G Num Avg/G Huffman, A.......... TTU SR 8 DB 35 14 49 6.1 0.0 ---------------------------------------------- Bobino, Rashad...... UT SO 8 LB 31 18 49 6.1 2.0 1. Griffin, Michael.... UT SR 8 4 0.50 Berg,Caleb.......... ISU JR 8 DB 29 20 49 6.1 0.0 2. McKenzie,Tyrone..... ISU SO 8 3 0.3828.McBath, Darcel...... TTU SO 8 DB 20 28 48 6.0 0.0 McBean,Ryan......... OSU SR 8 3 0.38 Linguist, M......... BU SR 8 DB 25 23 48 6.0 0.0 4. Griffin, Marcus..... UT JR 7 2 0.29 Terrell, Darnell.... MU JR 8 CB 28 20 48 6.0 0.0 Roland, Justin...... KSU JR 7 2 0.2931.Van Zant,Martel..... OSU JR 8 DB 36 11 47 5.9 0.0 6. McClinton, Jame..... KU JR 8 2 0.25 Christopher, Brock.. MU SO 8 LB 15 32 47 5.9 0.0 Boye-Doe,Walter..... CU SR 8 2 0.2533.Bradley, Stewart.... NU SR 8 LB 27 19 46 5.8 0.0 Garcia, Joe......... TTU JR 8 2 0.2534.Crawford, Dwain..... BU SO 6 DB 21 13 34 5.7 0.0 Thornton, Justi..... KU FR 8 2 0.2535.Jones, Brad......... CU SO 8 LB 21 24 45 5.6 0.5 Reed, L.A........... TTU SO 8 2 0.25 Latimer, Zach....... OU SR 8 LB 22 23 45 5.6 0.037.Garvin, Byron....... KSU JR 7 DB 25 14 39 5.6 2.0 FUMBLES RCVD Team Cl G Num Avg/G38.Massey, Brandon..... MU SR 7 DB 17 21 38 5.4 0.0 ----------------------------------------------39.Williams, Kyle...... KSU SR 8 DB 22 21 43 5.4 0.0 1. Davis, Braelon...... BU JR 7 3 0.43 Johnson,Rodrick..... OSU JR 8 LB 33 10 43 5.4 1.0 2. Campbell, Ian....... KSU SO 8 3 0.38 Harris, Lionel...... CU JR 8 DB 28 15 43 5.4 0.0 Brorsen, Russel..... KU SO 8 3 0.38 McClinton, Jame..... KU JR 8 DT 24 19 43 5.4 4.5 4. Collier, Blake...... TTU FR 7 2 0.2943.Ruud, Bo............ NU JR 8 LB 25 17 42 5.2 2.0 Figurs, Yamon....... KSU SR 7 2 0.29 Wilson, C.J......... BU SR 8 CB 26 16 42 5.2 0.0 Tupe, Misi.......... TAMU JR 7 2 0.2945.Griffin, Marcus..... UT JR 7 DB 31 5 36 5.1 0.0 7. Killebrew, Robert... UT JR 8 2 0.2546.Derry, Scott........ UT JR 8 LB 24 17 41 5.1 0.0 Peterson,Nathan..... OSU JR 8 2 0.25 Moore, William...... MU SO 8 DB 20 21 41 5.1 0.0 Overstreet, David... MU SR 8 2 0.2548.Green, Tierre....... NU JR 8 DB 24 16 40 5.0 0.0 Mortensen, Joe...... KU SO 8 2 0.2549.Washington, Terry... CU SR 8 CB 26 13 39 4.9 0.0 Campbell, Ian....... KSU SO 8 DE 23 16 39 4.9 6.0 PASSES DEFENDED Team Cl G Brup Int Total Avg/G -------------------------------------------------------- 1. Talib, Aqib......... KU SO 8 18 5 23 2.88 2. Ross, Aaron......... UT SR 8 14 4 18 2.25 3. Griffin, Michael.... UT SR 8 6 4 10 1.25 4. Grixby, Cortney..... NU JR 8 8 1 9 1.12 Wheatley, Terrence.. CU JR 8 5 4 9 1.12 6. Peterson, Jordan.... TAMU FR 8 7 1 8 1.00 Smith, Reggie....... OU SO 8 6 2 8 1.00 Crawford, Dwain..... BU SO 6 3 3 6 1.00 9. Webb, Anthony....... KU FR 8 4 3 7 0.88 Huffman, A.......... TTU SR 8 6 1 7 0.88

2006 Big 12 Football Individual Statistics Through games of Nov 26, 2006 (Conference games)
TACKLES (Ends/lineman) TACKLES (Defensive backs)Player Team Cl G Pos Solo Ast Total Avg/G Sack Player Team Cl G Pos Solo Ast Total Avg/G Sack---------------------------------------------------------------- ----------------------------------------------------------------1. McClinton, Jame..... KU JR 8 DT 24 19 43 5.4 4.5 1. Banks,Jon........... ISU JR 8 DB 40 25 65 8.1 0.02. Campbell, Ian....... KSU SO 8 DE 23 16 39 4.9 6.0 2. Overstreet, David... MU SR 8 DB 28 36 64 8.0 0.5 Jackson, Xzavie..... MU SR 8 DE 19 20 39 4.9 4.0 3. Kemp, Jerome........ KU SR 8 DB 35 26 61 7.6 1.04. Dawson, Keyunta..... TTU SR 8 DE 16 22 38 4.8 4.0 4. Bullitt, Melvin..... TAMU SR 8 DB 23 36 59 7.4 0.05. Harrington, Chris... TAMU JR 8 DL 18 19 37 4.6 4.0 5. Griffin, Michael.... UT SR 8 DB 41 17 58 7.2 1.06. DeGrate,Victor...... OSU SR 6 DL 19 8 27 4.5 5.5 6. Sexton,Andre........ OSU FR 8 DB 46 9 55 6.9 0.07. Nicolas,Brandon..... CU SO 8 DT 16 19 35 4.4 0.0 7. Garcia, Joe......... TTU JR 8 DB 28 24 52 6.5 0.0 Moorehead,Shawn..... ISU SR 8 DE 25 10 35 4.4 6.5 8. Jones, Andre........ NU JR 8 DB 34 16 50 6.2 0.0 Hypolite,George..... CU SO 8 DT 19 16 35 4.4 0.5 9. Huffman, A.......... TTU SR 8 DB 35 14 49 6.1 0.010.Brorsen, Russel..... KU SO 8 DE 16 17 33 4.1 4.0 Berg,Caleb.......... ISU JR 8 DB 29 20 49 6.1 0.011.Curvey,Brent........ ISU SR 8 DL 16 16 32 4.0 4.5 11.McBath, Darcel...... TTU SO 8 DB 20 28 48 6.0 0.012.Ah You, C.J......... OU SR 8 DE 17 13 30 3.8 3.0 Linguist, M......... BU SR 8 DB 25 23 48 6.0 0.0 Bake, Dek........... TTU SR 8 DT 19 11 30 3.8 3.5 Terrell, Darnell.... MU JR 8 CB 28 20 48 6.0 0.014.Boye-Doe,Walter..... CU SR 8 DE 13 16 29 3.6 0.0 14.Van Zant,Martel..... OSU JR 8 DB 36 11 47 5.9 0.015.Moore, Jay.......... NU SR 8 DE 11 17 28 3.5 2.0 15.Crawford, Dwain..... BU SO 6 DB 21 13 34 5.7 0.016.Ratliff, Jake....... TTU SO 8 DE 12 15 27 3.4 2.5 16.Garvin, Byron....... KSU JR 7 DB 25 14 39 5.6 2.0 Hudler, Chris....... TTU SR 8 DT 15 12 27 3.4 2.0 17.Massey, Brandon..... MU SR 7 DB 17 21 38 5.4 0.018.Williams, Lorenzo... MU JR 8 DL 14 12 26 3.2 4.0 18.Williams, Kyle...... KSU SR 8 DB 22 21 43 5.4 0.019.Como, Paul.......... KU SR 8 DE 9 16 25 3.1 2.0 Harris, Lionel...... CU JR 8 DB 28 15 43 5.4 0.0 Wright, Abraham..... CU SR 8 DE 15 10 25 3.1 7.0 20.Wilson, C.J......... BU SR 8 CB 26 16 42 5.2 0.021.Lamb, Jason......... BU FR 8 DE 16 8 24 3.0 1.0 21.Griffin, Marcus..... UT JR 7 DB 31 5 36 5.1 0.0 Rhodes, Vincent..... BU SO 8 DT 12 12 24 3.0 1.0 22.Moore, William...... MU SO 8 DB 20 21 41 5.1 0.0 Jackson, Rob........ KSU JR 8 DE 15 9 24 3.0 4.0 23.Green, Tierre....... NU JR 8 DB 24 16 40 5.0 0.024.Scott, Ken.......... TTU SR 8 DT 9 13 22 2.8 0.5 24.Washington, Terry... CU SR 8 CB 26 13 39 4.9 0.0 Obiozor, Cyril...... TAMU SO 8 DL 4 18 22 2.8 1.0 Harris, Nic......... OU SO 8 DB 21 18 39 4.9 0.5
TACKLES (Linebackers) TACKLES (Other positions)Player Team Cl G Pos Solo Ast Total Avg/G Sack Player Team Cl G Pos Solo Ast Total Avg/G Sack---------------------------------------------------------------- ----------------------------------------------------------------1. Bowen,Alvin......... ISU JR 8 LB 64 28 92 11.5 1.0 1. Stuckey, Darrel..... KU FR 7 16 16 32 4.6 0.02. Dizon, Jordon....... CU JR 8 LB 46 42 88 11.0 2.0 2. Carriker, Adam...... NU SR 8 16 18 34 4.2 5.03. McKenzie,Tyrone..... ISU SO 8 LB 37 47 84 10.5 2.0 3. Brandenburgh, Lance. NU JR 8 13 20 33 4.1 0.54. Diles, Zach......... KSU SR 8 LB 29 41 70 8.8 2.5 4. Stiggers, B......... BU JR 8 24 8 32 4.0 0.05. Harrington, Dedrick. MU SR 8 LB 33 34 67 8.4 2.5 5. Rubin,Ahtyba........ ISU JR 8 11 12 23 2.9 1.06. Archer, Brandon..... KSU SR 8 LB 30 34 64 8.0 2.5 6. Brown, Cornelius.... MU JR 6 9 6 15 2.5 0.07. Stratton, Brock..... TTU JR 8 LB 32 31 63 7.9 0.5 7. Cryer, Barry........ NU SR 8 11 8 19 2.4 2.0 Warren, Justin...... TAMU SR 8 LB 27 36 63 7.9 1.0 8. Sipili, Michael..... CU FR 7 8 8 16 2.3 0.09. Pawelek, Joe........ BU FR 8 LB 35 25 60 7.5 1.0 9. Dagunduro, Ola...... NU SR 8 6 11 17 2.1 2.510.Alexander, Rufu..... OU SR 8 LB 37 22 59 7.4 1.0 10.La Mar, Jake........ BU SO 6 4 5 9 1.5 0.0 Bacon, Marcus....... MU SR 8 LB 23 36 59 7.4 3.0 11.Culbert, Major...... NU FR 7 5 4 9 1.3 0.012.Washington,Thaddaeus CU SR 8 LB 31 27 58 7.2 0.0 12.Williams, B......... TTU FR 8 6 4 10 1.2 1.513.Mortensen, Joe...... KU SO 8 LB 20 36 56 7.0 2.5 Turner, Barry....... NU SO 8 7 3 10 1.2 1.514.Rivera, Mike........ KU SO 8 LB 31 24 55 6.9 1.0 Suh, Ndamukong...... NU SO 8 7 3 10 1.2 1.015.Lavine,Patrick...... OSU FR 8 LB 36 16 52 6.5 2.0 15.Gatewood, Tyrell.... UT JR 7 7 1 8 1.1 0.016.Bobino, Rashad...... UT SO 8 LB 31 18 49 6.1 2.0 16.Reed, L.A........... TTU SO 8 8 1 9 1.1 0.0 Moore, Nick......... BU JR 8 LB 27 22 49 6.1 0.0 17.Steinkuhler, Ty..... NU SO 8 4 4 8 1.0 0.518.Christopher, Brock.. MU SO 8 LB 15 32 47 5.9 0.0 Roux, Dominic....... KU SR 6 3 3 6 1.0 0.019.Bradley, Stewart.... NU SR 8 LB 27 19 46 5.8 0.0 19.Leone, Brandon...... TAMU SR 8 3 4 7 0.9 0.020.Jones, Brad......... CU SO 8 LB 21 24 45 5.6 0.5 Fine, Derek......... KU JR 8 3 4 7 0.9 0.0 Latimer, Zach....... OU SR 8 LB 22 23 45 5.6 0.0 McAnderson, Bra..... KU JR 8 5 2 7 0.9 0.022.Johnson,Rodrick..... OSU JR 8 LB 33 10 43 5.4 1.0 Eisenhart, Ben...... NU JR 8 5 2 7 0.9 0.023.Ruud, Bo............ NU JR 8 LB 25 17 42 5.2 2.0 23.Jones, Zach......... BU JR 7 4 2 6 0.9 0.024.Derry, Scott........ UT JR 8 LB 24 17 41 5.1 0.0 Young, Corey........ NU FR 7 5 1 6 0.9 0.025.McKeon, Corey....... NU JR 7 LB 16 18 34 4.9 1.0 25.Thenarse, Rickey.... NU FR 8 4 2 6 0.8 0.0

2006 Big 12 Football Conference Individual Game Highs Through games of Nov 26, 2006 (Conference games)
INDIVIDUAL PLAYER GAME HIGHS
----------------------------------------------------------------------------------------------------------------------------------
Points scored............ 24 Bowman,Adarius, Oklahoma State at Kansas (Oct 14, 2006)
18 Johnson, Robert, Texas Tech at Texas A&M (Sep 30, 2006)
18 Filani, Joel, Texas Tech at Iowa State (Oct 21, 2006)
18 Filani, Joel, Texas Tech vs BAYLOR (Nov 04, 2006)
18 Woods, Shannon, Texas Tech vs BAYLOR (Nov 04, 2006)
Touchdowns............... 4 Bowman,Adarius, Oklahoma State at Kansas (Oct 14, 2006)
3 Johnson, Robert, Texas Tech at Texas A&M (Sep 30, 2006)
3 Filani, Joel, Texas Tech at Iowa State (Oct 21, 2006)
3 Woods, Shannon, Texas Tech vs BAYLOR (Nov 04, 2006)
3 Filani, Joel, Texas Tech vs BAYLOR (Nov 04, 2006)
TD responsibility........ 6 McCoy, Colt, Texas vs BAYLOR (Oct 14, 2006) [0r,6p]
6 Reid,Bobby, Oklahoma State at Kansas (Oct 14, 2006) [1r,5p]
6 Harrell, Graham, Texas Tech at Iowa State (Oct 21, 2006) [0r,6p]
Points scored kicking.... 15 Crosby, Mason, Colorado vs IOWA STATE (Nov 11, 2006) [4fg,3pat]
15 Webb, Scott, Kansas vs KANSAS STATE (Nov 18, 2006) [4fg,3pat]
Total offense yards...... 506 Harrell, Graham, Texas Tech vs TEXAS (Oct 28, 2006) [-13r,519p]
496 Harrell, Graham, Texas Tech vs BAYLOR (Nov 04, 2006) [13r,483p]
Total offense plays...... 65 Harrell, Graham, Texas Tech vs TEXAS (Oct 28, 2006) [3r,62p]
64 Daniel, Chase, Missouri vs OKLAHOMA (Oct 28, 2006) [20r,44p]
Total offense yards/play. 13.3 Whitaker, B., Baylor at Colorado (Oct 07, 2006) [3-40]
12.8 Mosley, Paul, Baylor at Texas (Oct 14, 2006) [5-64]
Rushing yards............ 201 Cornish, Jon, Kansas vs KANSAS STATE (Nov 18, 2006)
196 Cornish, Jon, Kansas at Baylor (Oct 21, 2006)
Rushing attempts......... 36 Patrick, Allen, Oklahoma at Missouri (Oct 28, 2006)
35 Patrick, Allen, Oklahoma vs COLORADO (Oct 21, 2006)
Yards per rush........... 13.3 Whitaker, B., Baylor at Colorado (Oct 07, 2006) [3-40]
12.9 Reesing, Todd, Kansas vs COLORADO (Oct 28, 2006) [7-90]
Rushing TDs.............. 3 Woods, Shannon, Texas Tech vs BAYLOR (Nov 04, 2006)
2 Glenn, Cody, Nebraska at Iowa State (Oct 07, 2006)
2 Mosley, Paul, Baylor at Colorado (Oct 07, 2006)
2 Lane, Jorvorskie, Texas A&M at Kansas (Oct 07, 2006)
2 Temple, Tony, Missouri at Texas Tech (Oct 07, 2006)
2 Peterson, Adria, Oklahoma vs IOWA STATE (Oct 14, 2006)
2 Cornish, Jon, Kansas at Baylor (Oct 21, 2006)
2 Lane, Jorvorskie, Texas A&M at Oklahoma State (Oct 21, 2006)
2 Savage,Dantrell, Oklahoma State vs NEBRASKA (Oct 28, 2006)
2 Jackson, Brandon, Nebraska at Oklahoma State (Oct 28, 2006)
2 Szymanski, B., Baylor at Texas Tech (Nov 04, 2006)
2 Jackson,Bernard, Colorado vs KANSAS STATE (Nov 04, 2006)
2 McAnderson, Bra, Kansas at Iowa State (Nov 04, 2006)
2 Toston,Keith, Oklahoma State vs BAYLOR (Nov 11, 2006)
2 Glenn, Cody, Nebraska at Texas A&M (Nov 11, 2006)
2 Brown, Chris, Oklahoma vs TEXAS TECH (Nov 11, 2006)
2 Charles, Jamaal, Texas at Kansas State (Nov 11, 2006)
2 Cornish, Jon, Kansas vs KANSAS STATE (Nov 18, 2006)
2 Kock,Ryan, Iowa State vs MISSOURI (Nov 18, 2006)
2 Brown, Chris, Oklahoma at Oklahoma State (Nov 25, 2006)
Longest rush............. 65 Patrick, Allen, Oklahoma at Oklahoma State (Nov 25, 2006)
64 Goodson, Mike, Texas A&M at Baylor (Oct 28, 2006)
Passing yards............ 519 Harrell, Graham, Texas Tech vs TEXAS (Oct 28, 2006)
483 Harrell, Graham, Texas Tech vs BAYLOR (Nov 04, 2006)
Passing attempts......... 62 Harrell, Graham, Texas Tech vs TEXAS (Oct 28, 2006)
55 Harrell, Graham, Texas Tech vs MISSOURI (Oct 07, 2006)
55 Bell, Shawn, Baylor vs KANSAS (Oct 21, 2006)

Passing TDs.............. 6 McCoy, Colt, Texas vs BAYLOR (Oct 14, 2006)
6 Harrell, Graham, Texas Tech at Iowa State (Oct 21, 2006)
Longest pass............. 79 Bell, Shawn, Baylor vs TEXAS A&M (Oct 28, 2006)
78 Taylor, Zac, Nebraska vs KANSAS (Sept.30,2006)
Passes completed......... 42 Harrell, Graham, Texas Tech vs TEXAS (Oct 28, 2006)
39 Harrell, Graham, Texas Tech vs MISSOURI (Oct 07, 2006)
Had intercepted.......... 3 Barmann, Adam, Kansas at Nebraska (Sept.30,2006)
3 Freeman, Josh, Kansas State at Baylor (Sep 30, 2006)
3 Jackson,Bernard, Colorado vs BAYLOR (Oct 07, 2006)
3 Harrell, Graham, Texas Tech at Colorado (Oct 14, 2006)
3 Daniel, Chase, Missouri vs OKLAHOMA (Oct 28, 2006)
3 Szymanski, B., Baylor at Oklahoma State (Nov 11, 2006)
3 Freeman, Josh, Kansas State at Kansas (Nov 18, 2006)
3 McCoy, Colt, Texas vs TEXAS A&M (Nov 24, 2006)
Pass completion pct...... 100.0 McCoy, Colt, Texas at Kansas State (Nov 11, 2006) [4-4]
90.0 Reid,Bobby, Oklahoma State vs BAYLOR (Nov 11, 2006) [9-10]
Receiving yards.......... 300 Bowman,Adarius, Oklahoma State at Kansas (Oct 14, 2006)
212 Filani, Joel, Texas Tech vs BAYLOR (Nov 04, 2006)
Receptions............... 13 Bowman,Adarius, Oklahoma State at Kansas (Oct 14, 2006)
11 Woods, Shannon, Texas Tech vs MISSOURI (Oct 07, 2006)
11 Filani, Joel, Texas Tech vs MISSOURI (Oct 07, 2006)
11 Kelly, Malcolm, Oklahoma vs TEXAS TECH (Nov 11, 2006)
Yards per catch.......... 53.0 Hardy, Frantz, Nebraska vs KANSAS (Sept.30,2006) [3-159]
42.5 Sprague, Dusty, Colorado at Missouri (Sep 30, 2006) [2-85]
Receiving TDs............ 4 Bowman,Adarius, Oklahoma State at Kansas (Oct 14, 2006)
3 Johnson, Robert, Texas Tech at Texas A&M (Sep 30, 2006)
3 Filani, Joel, Texas Tech at Iowa State (Oct 21, 2006)
3 Filani, Joel, Texas Tech vs BAYLOR (Nov 04, 2006)
Longest reception........ 79 Zeigler, D., Baylor vs TEXAS A&M (Oct 28, 2006)
78 Hardy, Frantz, Nebraska vs KANSAS (Sept.30,2006)
Field goal attempts...... 5 Crosby, Mason, Colorado vs IOWA STATE (Nov 11, 2006)
4 Johnson, Greg, Texas at Nebraska (Oct.21, 2006)
4 Webb, Scott, Kansas vs KANSAS STATE (Nov 18, 2006)
Field goals made......... 4 Crosby, Mason, Colorado vs IOWA STATE (Nov 11, 2006)
4 Webb, Scott, Kansas vs KANSAS STATE (Nov 18, 2006)
Longest field goal....... 56 Crosby, Mason, Colorado vs TEXAS TECH (Oct 14, 2006)
54 Wolfert, Jeff, Missouri at Nebraska (Nov. 4, 2006)
Field goal pct........... 100.0 Webb, Scott, Kansas vs KANSAS STATE (Nov 18, 2006) [4-4]
100.0 Webb, Scott, Kansas vs TEXAS A&M (Oct 07, 2006) [3-3]
100.0 Crosby, Mason, Colorado vs TEXAS TECH (Oct 14, 2006) [3-3]
100.0 Crosby, Mason, Colorado at Kansas (Oct 28, 2006) [3-3]
100.0 Bailey, Ryan, Texas vs OKLAHOMA STATE (Nov 04, 2006) [3-3]
100.0 Neumann, Layne, Texas A&M vs OKLAHOMA (Nov 04, 2006) [3-3]
100.0 Trlica, Alex, Texas Tech vs OKLAHOMA STATE (Nov 18, 2006) [3-3]
100.0 Wolfert, Jeff, Missouri vs KANSAS (Nov 25, 2006) [3-3]
PAT kicks attempted...... 9 Johnson, Greg, Texas vs BAYLOR (Oct 14, 2006)
9 Redden,Bruce, Oklahoma State vs BAYLOR (Nov 11, 2006)
PAT kicks made........... 9 Johnson, Greg, Texas vs BAYLOR (Oct 14, 2006)
9 Redden,Bruce, Oklahoma State vs BAYLOR (Nov 11, 2006)
PAT kicks pct............ 100.0 Johnson, Greg, Texas vs BAYLOR (Oct 14, 2006) [9-9]
100.0 Redden,Bruce, Oklahoma State vs BAYLOR (Nov 11, 2006) [9-9]
Punts.................... 10 Reyer, Tim, Kansas State at Baylor (Sep 30, 2006)
9 Sepulveda, D., Baylor vs KANSAS STATE (Sep 30, 2006)
9 Brandtner,Mike, Iowa State at Oklahoma (Oct 14, 2006)
Yards punted............. 469 Sepulveda, D., Baylor vs KANSAS STATE (Sep 30, 2006) [9-469]
453 Reyer, Tim, Kansas State at Baylor (Sep 30, 2006) [10-453]
Longest punt............. 79 Crossett, Adam, Missouri at Texas A&M (Oct 14, 2006)
78 Sepulveda, D., Baylor vs KANSAS STATE (Sep 30, 2006)
Punting avg.............. 59.7 Sepulveda, D., Baylor vs KANSAS (Oct 21, 2006) [3-179]
55.7 Crossett, Adam, Missouri at Texas A&M (Oct 14, 2006) [3-167]
Punt returns............. 5 Smith, Reggie, Oklahoma vs IOWA STATE (Oct 14, 2006)

4 Teasley, Q., Baylor vs KANSAS STATE (Sep 30, 2006)
4 Robinson, Stephone, Colorado vs TEXAS TECH (Oct 14, 2006)
4 Sims, Carl, Baylor vs KANSAS (Oct 21, 2006)
4 Amendola, Danny, Texas Tech vs BAYLOR (Nov 04, 2006)
4 Amendola, Danny, Texas Tech vs OKLAHOMA STATE (Nov 18, 2006)
4 Smith, Reggie, Oklahoma at Baylor (Nov 18, 2006)
Punt return yards........ 71 Cox,Perrish, Oklahoma State at Kansas State (Oct 07, 2006)
61 Teasley, Q., Baylor vs KANSAS STATE (Sep 30, 2006)
Longest punt return...... 63 Cox,Perrish, Oklahoma State at Kansas State (Oct 07, 2006)
52 Lamb, Jonathan, Kansas at Baylor (Oct 21, 2006)
52 Figurs, Yamon, Kansas State vs TEXAS (Nov 11, 2006)
Punt return TDs.......... 1 Gonzalez,Daniel, Kansas State vs OKLAHOMA STATE (Oct 07, 2006)
Punt return avg.......... 27.5 Lamb, Jonathan, Kansas at Baylor (Oct 21, 2006) [2-55]
23.7 Cox,Perrish, Oklahoma State at Kansas State (Oct 07, 2006) [3-71]
Kick returns............. 6 Herford, Marcus, Kansas at Missouri (Nov 25, 2006)
5 Patton, Leon, Kansas State at Missouri (Oct 21, 2006)
5 Cox,Perrish, Oklahoma State at Texas Tech (Nov 18, 2006)
Kick return yards........ 158 Herford, Marcus, Kansas at Missouri (Nov 25, 2006)
157 Jones,Grant, Oklahoma State at Texas (Nov 04, 2006)
Kick return avg.......... 61.0 Franks, Kerry, Texas A&M vs TEXAS TECH (Sep 30, 2006) [2-122]
58.5 Patton, Leon, Kansas State vs OKLAHOMA STATE (Oct 07, 2006) [2-117]
Longest kick return...... 99 Franks, Kerry, Texas A&M vs TEXAS TECH (Sep 30, 2006)
95 Patton, Leon, Kansas State vs OKLAHOMA STATE (Oct 07, 2006)
Kick return TDs.......... 1 Franks, Kerry, Texas A&M vs TEXAS TECH (Sep 30, 2006)
1 Patton, Leon, Kansas State vs OKLAHOMA STATE (Oct 07, 2006)
1 Jones,Grant, Oklahoma State at Texas (Nov 04, 2006)
1 Johnson, James, Kansas State at Kansas (Nov 18, 2006)
1 Iglesias, Juaqu, Oklahoma at Baylor (Nov 18, 2006)
Interceptions............ 2 Shanle, Andrew, Nebraska vs KANSAS (Sept.30,2006)
2 Crawford, Dwain, Baylor vs KANSAS STATE (Sep 30, 2006)
2 Ross, Aaron, Texas vs Oklahoma (Oct 07, 2006)
2 Wheatley, Terrence, Colorado vs BAYLOR (Oct 07, 2006)
2 Walters, Ryan, Colorado vs TEXAS TECH (Oct 14, 2006)
2 Stratton, Brock, Texas Tech at Iowa State (Oct 21, 2006)
2 Talib, Aqib, Kansas vs COLORADO (Oct 28, 2006)
2 Webb, Anthony, Kansas vs KANSAS STATE (Nov 18, 2006)
2 Smith, Reggie, Oklahoma at Baylor (Nov 18, 2006)
Interception return yds.. 94 Smith, Reggie, Oklahoma at Baylor (Nov 18, 2006)
59 Talib, Aqib, Kansas vs COLORADO (Oct 28, 2006)
Interception return avg.. 47.0 Smith, Reggie, Oklahoma at Baylor (Nov 18, 2006) [2-94]
29.5 Talib, Aqib, Kansas vs COLORADO (Oct 28, 2006) [2-59]
Longest interception rtn. 59 Talib, Aqib, Kansas vs COLORADO (Oct 28, 2006)
54 Huffman, A., Texas Tech at Oklahoma (Nov 11, 2006)
Interception return TDs.. 1 Jackson, Xzavie, Missouri at Texas Tech (Oct 07, 2006)
1 Moore, William, Missouri at Texas Tech (Oct 07, 2006)
1 Melton, Matt, Texas vs BAYLOR (Oct 14, 2006)
1 Wright, Arist, Kansas at Baylor (Oct 21, 2006)
1 Anderson, Devin, Kansas State vs IOWA STATE (Oct 28, 2006)
1 Session, F., Texas Tech vs TEXAS (Oct 28, 2006)
1 Smith,Darnell, Oklahoma State vs BAYLOR (Nov 11, 2006)
1 Huffman, A., Texas Tech at Oklahoma (Nov 11, 2006)
1 Webb, Anthony, Kansas vs KANSAS STATE (Nov 18, 2006)
1 Smith, Reggie, Oklahoma at Baylor (Nov 18, 2006)
All-purpose yards........ 301 Patton, Leon, Kansas State vs OKLAHOMA STATE (Oct 07, 2006)
300 Bowman,Adarius, Oklahoma State at Kansas (Oct 14, 2006)
Tackles.................. 18.0 Bowen,Alvin, Iowa State vs KANSAS (Nov 04, 2006) [14-4]
17.0 Bowen,Alvin, Iowa State vs NEBRASKA (Oct 07, 2006) [7-10]
17.0 Washington,Thaddaeus, Colorado at Oklahoma (Oct 21, 2006) [8-9]
17.0 Dodge, Mark, Texas A&M vs NEBRASKA (Nov 11, 2006) [1-16]
17.0 Dizon, Jordon, Colorado at Nebraska (Nov.24, 2006) [8-9]
Sacks.................... 2.5 Crowder, Tim, Texas vs BAYLOR (Oct 14, 2006) [2-1]

2.5 Moorehead,Shawn, Iowa State vs KANSAS (Nov 04, 2006) [2-1]
Tackles for loss......... 4.0 Ah You, C.J., Oklahoma at Baylor (Nov 18, 2006) [4-0]
4.0 Bobino, Rashad, Texas vs TEXAS A&M (Nov 24, 2006) [4-0]

2006 Big 12 Football Conference Team Game Highs Through games of Nov 26, 2006 (Conference games)
TEAM HIGHS (highest totals made by)
----------------------------------------------------------------------------------------------------------------------------------
Points................... 66 Oklahoma State vs BAYLOR (Nov 11, 2006)
63 Texas vs BAYLOR (Oct 14, 2006)
Points scored kicking.... 15 Colorado vs IOWA STATE (Nov 11, 2006) [4fg,3pat]
15 Kansas vs KANSAS STATE (Nov 18, 2006) [4fg,3pat]
Touchdowns............... 9 Texas vs BAYLOR (Oct 14, 2006)
9 Oklahoma State vs BAYLOR (Nov 11, 2006)
Total offense yards...... 682 Texas Tech vs BAYLOR (Nov 04, 2006) [175r,507p]
603 Oklahoma State at Kansas (Oct 14, 2006) [192r,411p]
Total offense plays...... 94 Kansas at Nebraska (Sept.30,2006) [40r,54p]
84 Oklahoma State at Texas Tech (Nov 18, 2006) [50r,34p]
Total offense yards/play. 8.9 Texas Tech vs BAYLOR (Nov 04, 2006) [77-682]
8.1 Colorado vs IOWA STATE (Nov 11, 2006) [57-463]
Rushing yards............ 387 Oklahoma State vs BAYLOR (Nov 11, 2006)
292 Texas A&M at Baylor (Oct 28, 2006)
Rushing attempts......... 54 Oklahoma State vs BAYLOR (Nov 11, 2006)
53 Oklahoma at Missouri (Oct 28, 2006)
Yards per rush........... 9.2 Texas Tech vs BAYLOR (Nov 04, 2006) [19-175]
7.2 Oklahoma State vs BAYLOR (Nov 11, 2006) [54-387]
Rushing TDs.............. 5 Oklahoma State vs BAYLOR (Nov 11, 2006)
5 Texas at Kansas State (Nov 11, 2006)
Longest rush............. 65 Oklahoma at Oklahoma State (Nov 25, 2006)
64 Texas A&M at Baylor (Oct 28, 2006)
Passing yards............ 519 Texas Tech vs TEXAS (Oct 28, 2006)
507 Texas Tech vs BAYLOR (Nov 04, 2006)
Passing attempts......... 62 Texas Tech vs TEXAS (Oct 28, 2006)
61 Texas Tech vs MISSOURI (Oct 07, 2006)
Passing TDs.............. 6 Texas vs BAYLOR (Oct 14, 2006)
6 Texas Tech at Iowa State (Oct 21, 2006)
Longest pass............. 79 Baylor vs TEXAS A&M (Oct 28, 2006)
78 Nebraska vs KANSAS (Sept.30,2006)
Passes completed......... 44 Texas Tech vs MISSOURI (Oct 07, 2006)
42 Texas Tech vs TEXAS (Oct 28, 2006)
Had intercepted.......... 4 Texas vs TEXAS A&M (Nov 24, 2006)
3 Kansas at Nebraska (Sept.30,2006)
3 Kansas State at Baylor (Sep 30, 2006)
3 Colorado vs BAYLOR (Oct 07, 2006)
3 Texas Tech at Colorado (Oct 14, 2006)
3 Kansas vs COLORADO (Oct 28, 2006)
3 Missouri vs OKLAHOMA (Oct 28, 2006)
3 Baylor at Oklahoma State (Nov 11, 2006)
3 Kansas State at Kansas (Nov 18, 2006)
Pass completion pct...... 86.7 Oklahoma State vs BAYLOR (Nov 11, 2006) [13-15]
84.6 Kansas State at Colorado (Nov 04, 2006) [22-26]
Yards per catch.......... 26.3 Nebraska vs KANSAS (Sept.30,2006) [15-395]
18.9 Nebraska vs TEXAS (Oct.21, 2006) [16-302]
Field goal attempts...... 5 Texas at Nebraska (Oct.21, 2006)
5 Colorado vs IOWA STATE (Nov 11, 2006)
4 Kansas vs KANSAS STATE (Nov 18, 2006)
Field goals made......... 4 Colorado vs IOWA STATE (Nov 11, 2006)
4 Kansas vs KANSAS STATE (Nov 18, 2006)
Longest field goal....... 56 Colorado vs TEXAS TECH (Oct 14, 2006)
54 Missouri at Nebraska (Nov. 4, 2006)
Field goal pct........... 100.0 Kansas vs KANSAS STATE (Nov 18, 2006) [4-4]
100.0 Kansas vs TEXAS A&M (Oct 07, 2006) [3-3]

100.0 Colorado vs TEXAS TECH (Oct 14, 2006) [3-3]
100.0 Colorado at Kansas (Oct 28, 2006) [3-3]
100.0 Texas vs OKLAHOMA STATE (Nov 04, 2006) [3-3]
100.0 Texas A&M vs OKLAHOMA (Nov 04, 2006) [3-3]
100.0 Texas Tech vs OKLAHOMA STATE (Nov 18, 2006) [3-3]
100.0 Missouri vs KANSAS (Nov 25, 2006) [3-3]
PAT kicks attempted...... 9 Texas vs BAYLOR (Oct 14, 2006)
9 Oklahoma State vs BAYLOR (Nov 11, 2006)
7 Texas Tech vs BAYLOR (Nov 04, 2006)
6 Oklahoma State at Kansas (Oct 14, 2006)
6 Texas Tech at Iowa State (Oct 21, 2006)
6 Oklahoma State vs NEBRASKA (Oct 28, 2006)
6 Kansas at Iowa State (Nov 04, 2006)
6 Texas at Kansas State (Nov 11, 2006)
6 Kansas State vs TEXAS (Nov 11, 2006)
PAT kicks made........... 9 Texas vs BAYLOR (Oct 14, 2006)
9 Oklahoma State vs BAYLOR (Nov 11, 2006)
PAT kicks pct............ 100.0 Texas vs BAYLOR (Oct 14, 2006) [9-9]
100.0 Oklahoma State vs BAYLOR (Nov 11, 2006) [9-9]
Punts.................... 10 Kansas State at Baylor (Sep 30, 2006)
9 Baylor vs KANSAS STATE (Sep 30, 2006)
9 Iowa State at Oklahoma (Oct 14, 2006)
Longest punt............. 79 Missouri at Texas A&M (Oct 14, 2006)
78 Baylor vs KANSAS STATE (Sep 30, 2006)
Yards punted............. 469 Baylor vs KANSAS STATE (Sep 30, 2006) [9-469]
453 Kansas State at Baylor (Sep 30, 2006) [10-453]
Punting avg.............. 59.7 Baylor vs KANSAS (Oct 21, 2006) [3-179]
55.7 Missouri at Texas A&M (Oct 14, 2006) [3-167]
Punt returns............. 6 Kansas State at Baylor (Sep 30, 2006)
5 Baylor vs KANSAS STATE (Sep 30, 2006)
5 Oklahoma vs IOWA STATE (Oct 14, 2006)
Punt return yards........ 71 Oklahoma State at Kansas State (Oct 07, 2006)
66 Kansas State vs TEXAS (Nov 11, 2006)
Punt return avg.......... 27.5 Kansas at Baylor (Oct 21, 2006) [2-55]
23.7 Oklahoma State at Kansas State (Oct 07, 2006) [3-71]
Punt return TDs.......... 1 Kansas State vs OKLAHOMA STATE (Oct 07, 2006)
Longest punt return...... 63 Oklahoma State at Kansas State (Oct 07, 2006)
52 Kansas at Baylor (Oct 21, 2006)
52 Kansas State vs TEXAS (Nov 11, 2006)
Kick returns............. 8 Oklahoma State at Texas (Nov 04, 2006)
8 Baylor at Oklahoma State (Nov 11, 2006)
Kick return yards........ 206 Oklahoma State at Texas (Nov 04, 2006)
180 Kansas State at Missouri (Oct 21, 2006)
Kick return avg.......... 61.0 Texas A&M vs TEXAS TECH (Sep 30, 2006) [2-122]
55.5 Oklahoma at Baylor (Nov 18, 2006) [2-111]
Longest kick return...... 99 Texas A&M vs TEXAS TECH (Sep 30, 2006)
95 Kansas State vs OKLAHOMA STATE (Oct 07, 2006)
Kick return TDs.......... 1 Texas A&M vs TEXAS TECH (Sep 30, 2006)
1 Kansas State vs OKLAHOMA STATE (Oct 07, 2006)
1 Oklahoma State at Texas (Nov 04, 2006)
1 Kansas State at Kansas (Nov 18, 2006)
1 Oklahoma at Baylor (Nov 18, 2006)
Interceptions............ 4 Texas A&M at Texas (Nov 24, 2006)
3 Nebraska vs KANSAS (Sept.30,2006)
3 Baylor vs KANSAS STATE (Sep 30, 2006)
3 Baylor at Colorado (Oct 07, 2006)
3 Colorado vs TEXAS TECH (Oct 14, 2006)
3 Colorado at Kansas (Oct 28, 2006)
3 Oklahoma at Missouri (Oct 28, 2006)
3 Oklahoma State vs BAYLOR (Nov 11, 2006)
3 Kansas vs KANSAS STATE (Nov 18, 2006)

Interception return yds.. 94 Oklahoma at Baylor (Nov 18, 2006)
65 Kansas vs KANSAS STATE (Nov 18, 2006)
Interception return avg.. 47.0 Oklahoma at Baylor (Nov 18, 2006) [2-94]
29.5 Kansas vs COLORADO (Oct 28, 2006) [2-59]
Longest interception rtn. 59 Kansas vs COLORADO (Oct 28, 2006)
54 Texas Tech at Oklahoma (Nov 11, 2006)
Interception return TDs.. 2 Missouri at Texas Tech (Oct 07, 2006)
1 Texas vs BAYLOR (Oct 14, 2006)
1 Kansas at Baylor (Oct 21, 2006)
1 Kansas State vs IOWA STATE (Oct 28, 2006)
1 Texas Tech vs TEXAS (Oct 28, 2006)
1 Oklahoma State vs BAYLOR (Nov 11, 2006)
1 Texas Tech at Oklahoma (Nov 11, 2006)
1 Kansas vs KANSAS STATE (Nov 18, 2006)
1 Oklahoma at Baylor (Nov 18, 2006)
Fumbles lost............. 4 Baylor at Texas (Oct 14, 2006)
4 Oklahoma at Baylor (Nov 18, 2006)
Fumbles recovered........ 4 Texas vs BAYLOR (Oct 14, 2006)
4 Baylor vs OKLAHOMA (Nov 18, 2006)
Sacked by opp............ 7 Iowa State at Texas (Sep 23, 2006)
6 Iowa State at Kansas State (Oct 28, 2006)
6 Baylor at Texas Tech (Nov 04, 2006)
6 Iowa State vs KANSAS (Nov 04, 2006)
QB sacks................. 7 Texas vs IOWA STATE (Sep 23, 2006)
6 Kansas State vs IOWA STATE (Oct 28, 2006)
6 Texas Tech vs BAYLOR (Nov 04, 2006)
6 Kansas at Iowa State (Nov 04, 2006)
Turnovers committed...... 6 Baylor at Oklahoma State (Nov 11, 2006)
6 Kansas State at Kansas (Nov 18, 2006)
Turnovers caused......... 6 Oklahoma State vs BAYLOR (Nov 11, 2006)
6 Kansas vs KANSAS STATE (Nov 18, 2006)
First downs.............. 32 Texas Tech vs BAYLOR (Nov 04, 2006)
29 Texas Tech vs MISSOURI (Oct 07, 2006)
29 Nebraska at Oklahoma State (Oct 28, 2006)
29 Texas at Texas Tech (Oct 28, 2006)
1st downs rushing........ 20 Oklahoma State vs BAYLOR (Nov 11, 2006)
17 Kansas at Baylor (Oct 21, 2006)
1st downs passing........ 25 Texas Tech vs TEXAS (Oct 28, 2006)
24 Texas Tech vs BAYLOR (Nov 04, 2006)
1st downs by penalty..... 5 Iowa State vs TEXAS TECH (Oct 21, 2006)
4 Baylor vs KANSAS (Oct 21, 2006)
4 Texas at Texas Tech (Oct 28, 2006)
4 Texas vs OKLAHOMA STATE (Nov 04, 2006)
4 Baylor at Oklahoma State (Nov 11, 2006)
4 Oklahoma vs TEXAS TECH (Nov 11, 2006)
4 Texas at Kansas State (Nov 11, 2006)
Penalties................ 14 Texas Tech at Iowa State (Oct 21, 2006)
12 Texas Tech vs TEXAS (Oct 28, 2006)
Penalties yards.......... 129 Texas Tech at Iowa State (Oct 21, 2006)
127 Texas Tech vs TEXAS (Oct 28, 2006)