2006 AFR Financial - broward.org Mahadeo, Capital Payable Specialist Sandra Alston, Senior...
94
Broward County Aviation Department A Major Fund of Broward County, Florida Fort Lauderdale-Hollywood International Airport 2006 Annual Financial Report (Unaudited)
Transcript of 2006 AFR Financial - broward.org Mahadeo, Capital Payable Specialist Sandra Alston, Senior...

Broward County Aviation Department
A Major Fund of Broward County, Florida
Fort Lauderdale-Hollywood International Airport
2006 Annual Financial Report
(Unaudited)


)
Fort Lauderdale-Hollywood International Airport is 8 minutes to the beach, 10 minutes to the greens.
The airport is located in the heart of Broward County with convenient access to 4 major highways. For vacationers, it's minutes from 23 miles of white, sandy beaches in the Greater Ft. Lauderdale area. It's also close to over 30,000 hotel rooms, a major convention center, and the second largest cruise ship port in the world. Over 50 public and private golf courses and other sporting and cultural activities can be found only minutes away. For business travelers, often rushing to make a meeting, Ft. Lauderdale-Hollywood International Airport is close to business, industrial and government centers.
The fact is, if your destination is anywhere from North Miami through Broward County up to Boca Raton, we're your most convenient airport.


AVIATION DEPARTMENT
NOTICE
The Airport’s financial statements conform to the respective audited financial statements contained in Broward County’s basic financial statements. However, the financial statements, schedules and various analyses represented in this Annual Financial Report are:
“Unaudited”


BROWARD COUNTY AVIATION DEPARTMENT
A Major Fund of Broward County, Florida
FORT LAUDERDALE / HOLLYWOOD INTERNATIONAL AIRPORT NORTH PERRY AIRPORT
2006 ANNUAL FINANCIAL REPORT
Fiscal Year Ended September 30, 2006 (Unaudited)
Prepared By the Finance Division
Mark Spennacchio, Director of Finance
Natalie Otto, CPA, Assistant Director of Finance Jackie Jackson, Accounting Manager
Finance Division Staff
Aida Smith, Collection Specialist
Jane Bronshteyn, Accounts Payable Specialist Jeanne Cavelli, Division Administrative Assistant
Joann Daniels, Accounts Payable Specialist Karla Drummond, Accounts Payable Specialist
Anthony Davidson, Capital Projects Finance Manager Barbara Wright, Grants Administrator
Thomas Karakunnel, Property Accountant Angela Lambert, Procurement Coordinator Ishwar Mahadeo, Capital Payable Specialist Sandra Alston, Senior Revenue/Cost Analyst
Monique Burn, Billing Specialist Ron Rubin, General Ledger Accountant
Harriet Samar, Revenue Manager Mercedes Pichardo, Administrative Specialist
Shirley Spanie, Disbursement Accountant Pui King Liu, Capital Projects Accountant
Melva Cushman, Accounts Receivable Supervisor Manny Lax, Compliance Manager


BROWARD COUNTY AVIATION DEPARTMENT
ANNUAL FINANCIAL REPORT
For the Year Ended September 30, 2006 (Unaudited)
TABLE OF CONTENTS
I - FINANCIAL SECTION Overview and Analysis ....................................................................................................................................... I – 1 Financial Statements:
Comparative Statement of Net Assets ........................................................................................................... I – 10 Comparative Statements of Revenues, Expenses and Changes in Fund Net Assets...................................... I – 11 Comparative Statements of Cash Flows ........................................................................................................ I – 12 Notes to Financial Statements ....................................................................................................................... I – 13 Summary of Significant Accounting Policies......................................................................................... I – 14 Cash and Investments............................................................................................................................. I – 17 Accounts Receivable.............................................................................................................................. I – 18 Restricted Assets .................................................................................................................................... I – 18 Capital Assets......................................................................................................................................... I – 19 Lease and Concession Agreements ........................................................................................................ I – 20 Long-Term Liabilities ............................................................................................................................ I – 21 Capital Contributions ............................................................................................................................. I – 23 Airline-Airport Lease and Use Agreement............................................................................................. I – 24 Commitments and Contingent Liabilities............................................................................................... I – 24 Subsequent Events ................................................................................................................................. I – 24
II- SUPPLEMENTARY INFORMATION Supplementary Information Locator Guide ................................................................................................... II – 1 Combining Statement of Net Assets....................................................................................................... II – 2 Combining Statement of Revenues, Expenses and Changes in Net Assets ............................................ II – 4 Combining Statement of Cash Flows ..................................................................................................... II – 6 Debt Service Requirements to Maturity ................................................................................................. II – 8 Debt Service to Maturity by Series......................................................................................................... II – 9
Deposits to and Withdrawals from Special Funds and Accounts Created Airport Bond Resolutions and the Airline-Airport Lease & Use Agreement........................ II – 15 Airport System Revenue Bonds Debt Service Coverage........................................................................ II – 16 Passenger Facility Charge Convertible Lien Bonds – Sufficiency Test ................................................. II – 17

III - STATISTICAL SECTION Operating Statistics: Annual Enplaned Passengers......................................................................................................................... III – 1
Landed Weights............................................................................................................................................. III – 2 Aircraft Operations........................................................................................................................................ III – 3
Air Cargo Activity......................................................................................................................................... III – 4 Landing Fees ................................................................................................................................................. III – 5 Average Terminal Rent ................................................................................................................................. III – 6 Airline Cost per Enplaned Passenger ............................................................................................................ III – 7 Revenue Statistics: Total Concession Revenue per Enplaned Passenger ..................................................................................... III – 8 Food & Beverage Revenue per Enplaned Passenger..................................................................................... III – 9 News & Gifts Revenue per Enplaned Passenger ........................................................................................... III – 10 Rental Car Revenue per Enplaned Passenger................................................................................................ III – 11 Parking Revenue per Enplaned Passenger..................................................................................................... III – 12 Building & Ground Rental Revenue per Enplaned Passenger....................................................................... III – 13 Airfield Revenue per Enplaned Passenger .................................................................................................... III – 14 Terminal Rent Revenue per Enplaned Passenger .......................................................................................... III – 15 Other Revenue per Enplaned Passenger ........................................................................................................ III – 16 Expense Statistics: Personal Services Expense per Enplaned Passenger ..................................................................................... III – 17 Contractual Services Expense per Enplaned Passenger................................................................................. III – 18 General Operating Expense per Enplaned Passenger .................................................................................... III – 19 Financial Statistics: Passenger Facility Charges............................................................................................................................ III – 20 Cash/Investments and Yields ........................................................................................................................ III – 21 Current Liquidity Ratio ................................................................................................................................. III – 22 Debt to Capital Asset Ratio ........................................................................................................................... III – 23 Debt Service per Enplaned Passenger ........................................................................................................... III – 24 Airport Information: Airlines Servicing the Airport ....................................................................................................................... III – 25 Primary Origination & Destination for Airport Domestic Passenger Markets .............................................. III – 26 Scheduled Airlines ........................................................................................................................................ III – 27 Commuter Airlines, Charters, Cargo Carriers ............................................................................................... III – 28 Total Passengers............................................................................................................................................ III – 29 Airline Market Share ..................................................................................................................................... III – 30 Comparative Airline Cost Per Enplanement by Major FLL Airlines ............................................................ III – 31 Bond Ratings ................................................................................................................................................. III – 32 Airport Information ....................................................................................................................................... III – 33


FINANCIAL
AVIATION DEPARTMENT - FY 2006 ANNUAL FINANCIAL REPORT I - 1
OVERVIEW & ANALYSIS
This narrative summarizes the overview and analysis of the financial activities of Fort Lauderdale-International Airport (FLL) and North Perry Airport (HWO) for the fiscal year ended September 30, 2006. The financial activity of HWO, a small general aviation airport is immaterial, but together the two airports make up the financial activity regarding the Airport System for the five (5) fiscal years (FY) ending September 30, 2002 through September 30, 2006. All amounts, unless otherwise indicated, are expressed in thousands of dollars. Financial Highlights Airport management continues to emphasize cost containment practices and the pursuit of revenue enhancement opportunities. With increased passenger enplanements at FLL, operating revenues increased 59% during the five-year period, primarily from non-aviation revenues received from parking and concessions.
Airline cost per enplaned passenger (a common industry measure) is the net result of balancing these practices. Airline costs are those airport operating revenues received from the airlines. Terminal rent and landing fees are the major costs impacting the airline cost per enplanement. The following table illustrates the results of this measure and the low cost per enplaned passenger at FLL.
StatisticalMeasures 2006 2005 2004 2003 2002
Average Terminal Rent Per Square Foot 29.29$ 29.14$ 29.49$ 29.49$ 26.28$
Landing Fees Per 1,000 Pounds 0.95$ 0.95$ 0.97$ 1.01$ 0.99$
Total Revenues From Airlines ($000) 44,801$ 45,116$ 41,430$ 37,837$ 34,365$
Enplaned Passengers (000) 10,681 11,367 10,037 8,730 8,199
Airline Cost Per Enplaned Passenger 4.19$ 3.97$ 4.13$ 4.33$ 4.19$
Fiscal Years Ended September 30
Terminal rental rates and landing fees are calculated in accordance with the Airline-Airport Lease and Use Agreements. Terminal rental rates and landing fees have remained relatively constant during the five-year period. The airline cost per enplanement (revenues received from passenger and cargo airlines) remained level at $4.19 from FY 2002 to FY 2006 despite the increases in operating expenses of 73% for the same period.

FINANCIAL
AVIATION DEPARTMENT - FY 2006 ANNUAL FINANCIAL REPORT I - 2
Summary of Financial Position The following table summarizes BCAD's net assets as of September 30 for each of the last five years.
Statement of Net Assets ($000) 2006 2005 2004 2003 2002
Current Assets: Cash and Investments 42,232$ 48,526$ 36,906$ 36,495$ 39,935$ Receivables, Net 6,443 6,170 2,866 3,469 4,285 Inventory and Other Current Assets 2,663 1,921 1,602 2,018 1,362 Total Current Assets 51,338 56,617 41,374 41,982 45,582 Restricted and Noncurrent Assets: Restricted Cash and Investments 485,887 482,020 266,729 356,000 455,521 Grants Receivable 15,522 8,370 12,416 19,262 17,540 Land, Buildings and Equipment, Net 1,235,842 1,213,536 1,154,459 1,036,904 909,608 Deferred Charges 9,964 10,780 7,650 8,302 7,503 Total Restricted and Noncurrent Assets 1,747,215 1,714,706 1,441,254 1,420,468 1,390,172
Total Assets 1,798,553$ 1,771,323$ 1,482,628$ 1,462,450$ 1,435,754$
Current Liabilities: Accounts Payable and Accrued Liabilities 23,984$ 9,901$ 11,672$ 11,553$ 15,627$ Other Current Liabilities 2,404 8,847 2,143 2,911 1,472 Total Current Liabilities 26,388 18,748 13,815 14,464 17,099 Restricted and Noncurrent Liabilities: Liabilities Payable From Restricted Assets 69,208 84,141 80,362 75,917 70,568 Deferred Revenue 23,438 27,921 21,469 15,730 12,507 Bonds Payable From Restricted Assets 855,691 869,395 645,995 665,695 687,055 Other Long-Term Liabilities 9,660 8,856 3,244 4,143 2,119 Total Restricted and Noncurrent Liabilities 957,997 990,313 751,070 761,485 772,249
Total Liabilities 984,385 1,009,061 764,885 775,949 789,348 Net Assets: Invested in Capital Assets, Net of Related Debt 563,174 529,696 516,923 504,718 482,825 Restricted 215,463 188,774 166,316 148,817 151,545 Unrestricted 35,531 43,792 34,504 32,966 12,036 Total Net Assets 814,168$ 762,262$ 717,743$ 686,501$ 646,406$ Total Liabilities and Net Assets 1,798,553$ 1,771,323$ 1,482,628$ 1,462,450$ 1,435,754$
September 30
Net assets increased $167.7 million (26%) from $646.4 million in FY 2002 to $814.1 million in FY 2006. The increase is primarily the result of the additional investment in capital and restricted assets, less restricted and non-current liabilities.
FINANCIAL
AVIATION DEPARTMENT - FY 2006 ANNUAL FINANCIAL REPORT I - 3
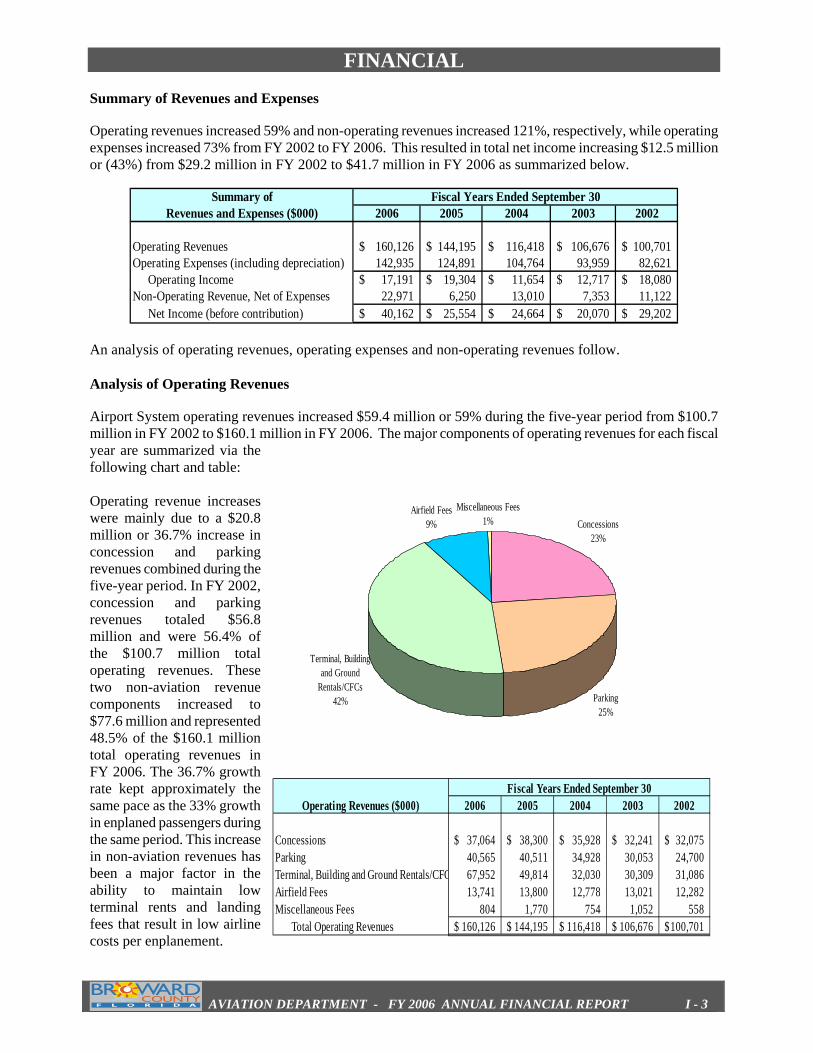
Summary of Revenues and Expenses Operating revenues increased 59% and non-operating revenues increased 121%, respectively, while operating expenses increased 73% from FY 2002 to FY 2006. This resulted in total net income increasing $12.5 million or (43%) from $29.2 million in FY 2002 to $41.7 million in FY 2006 as summarized below.
Summary ofRevenues and Expenses ($000) 2006 2005 2004 2003 2002
Operating Revenues 160,126$ 144,195$ 116,418$ 106,676$ 100,701$ Operating Expenses (including depreciation) 142,935 124,891 104,764 93,959 82,621 Operating Income 17,191$ 19,304$ 11,654$ 12,717$ 18,080$ Non-Operating Revenue, Net of Expenses 22,971 6,250 13,010 7,353 11,122 Net Income (before contribution) 40,162$ 25,554$ 24,664$ 20,070$ 29,202$
Fiscal Years Ended September 30
An analysis of operating revenues, operating expenses and non-operating revenues follow. Analysis of Operating Revenues
Airport System operating revenues increased $59.4 million or 59% during the five-year period from $100.7 million in FY 2002 to $160.1 million in FY 2006. The major components of operating revenues for each fiscal year are summarized via the following chart and table: Operating revenue increases were mainly due to a $20.8 million or 36.7% increase in concession and parking revenues combined during the five-year period. In FY 2002, concession and parking revenues totaled $56.8 million and were 56.4% of the $100.7 million total operating revenues. These two non-aviation revenue components increased to $77.6 million and represented 48.5% of the $160.1 million total operating revenues in FY 2006. The 36.7% growth rate kept approximately the same pace as the 33% growth in enplaned passengers during the same period. This increase in non-aviation revenues has been a major factor in the ability to maintain low terminal rents and landing fees that result in low airline costs per enplanement.
Operating Revenues ($000) 2006 2005 2004 2003 2002
Concessions 37,064$ 38,300$ 35,928$ 32,241$ 32,075$ Parking 40,565 40,511 34,928 30,053 24,700 Terminal, Building and Ground Rentals/CFC 67,952 49,814 32,030 30,309 31,086 Airfield Fees 13,741 13,800 12,778 13,021 12,282 Miscellaneous Fees 804 1,770 754 1,052 558 Total Operating Revenues 160,126$ 144,195$ 116,418$ 106,676$ 100,701$
Fiscal Years Ended September 30
Concessions23%
Parking25%
Terminal, Building and Ground
Rentals/CFCs42%
Airfield Fees9%
Miscellaneous Fees1%
FINANCIAL
AVIATION DEPARTMENT - FY 2006 ANNUAL FINANCIAL REPORT I - 4
Concession revenues increased $4.9 million (15.6%) from $32.0 million in FY 2002 to $37.0 million in FY 2006 due to increases in airport traffic and guaranteed minimum payments. These revenues accounted for 23.1% of total revenues in fiscal year 2006. Within the category of concessions, rental car concessions and food & beverage concessions amounted to $22.0 million (13.8%) and $6.3 million (3.9%) of operating revenues, respectively. Parking revenues increased $15.9 million (64.2%) during the same period and represent 25.3% of operating revenues for FY 2006. This growth was primarily due to increase in total airline passengers, the addition of valet parking service and an increase in short term parking rates in FY 2002.
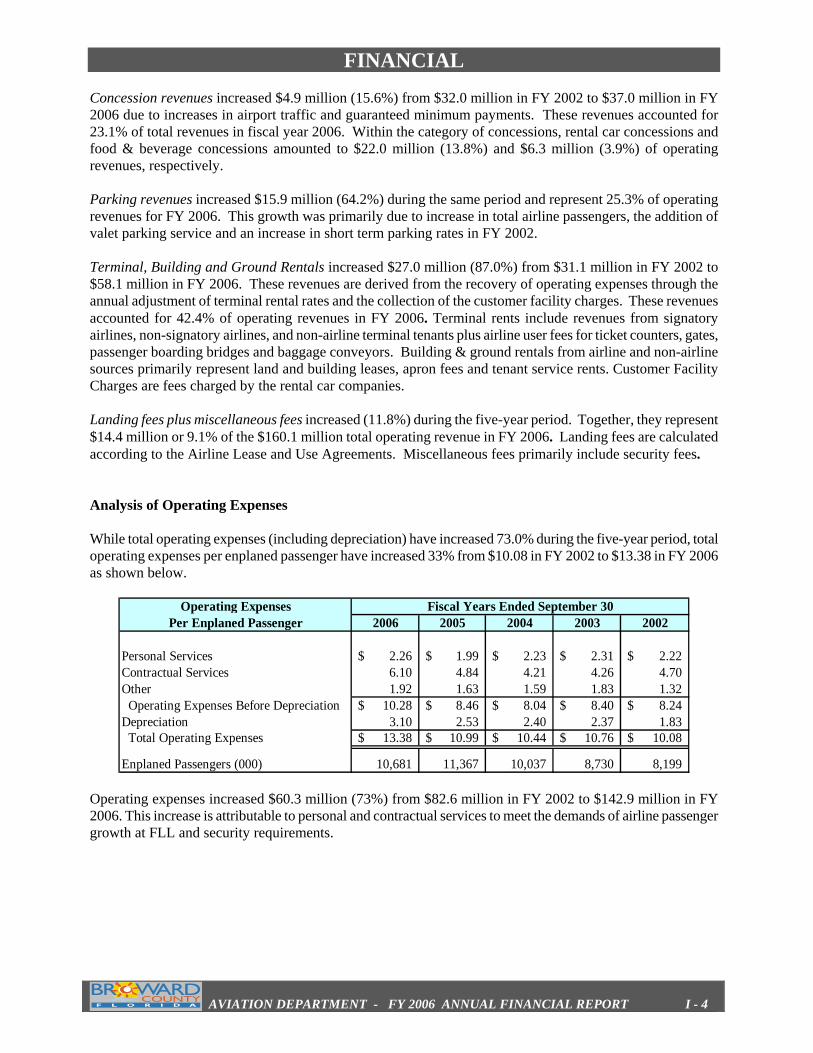
Terminal, Building and Ground Rentals increased $27.0 million (87.0%) from $31.1 million in FY 2002 to $58.1 million in FY 2006. These revenues are derived from the recovery of operating expenses through the annual adjustment of terminal rental rates and the collection of the customer facility charges. These revenues accounted for 42.4% of operating revenues in FY 2006. Terminal rents include revenues from signatory airlines, non-signatory airlines, and non-airline terminal tenants plus airline user fees for ticket counters, gates, passenger boarding bridges and baggage conveyors. Building & ground rentals from airline and non-airline sources primarily represent land and building leases, apron fees and tenant service rents. Customer Facility Charges are fees charged by the rental car companies. Landing fees plus miscellaneous fees increased (11.8%) during the five-year period. Together, they represent $14.4 million or 9.1% of the $160.1 million total operating revenue in FY 2006. Landing fees are calculated according to the Airline Lease and Use Agreements. Miscellaneous fees primarily include security fees. Analysis of Operating Expenses While total operating expenses (including depreciation) have increased 73.0% during the five-year period, total operating expenses per enplaned passenger have increased 33% from $10.08 in FY 2002 to $13.38 in FY 2006 as shown below.
Operating ExpensesPer Enplaned Passenger 2006 2005 2004 2003 2002
Personal Services 2.26$ 1.99$ 2.23$ 2.31$ 2.22$ Contractual Services 6.10 4.84 4.21 4.26 4.70Other 1.92 1.63 1.59 1.83 1.32 Operating Expenses Before Depreciation 10.28$ 8.46$ 8.04$ 8.40$ 8.24$ Depreciation 3.10 2.53 2.40 2.37 1.83 Total Operating Expenses 13.38$ 10.99$ 10.44$ 10.76$ 10.08$
Enplaned Passengers (000) 10,681 11,367 10,037 8,730 8,199
Fiscal Years Ended September 30
Operating expenses increased $60.3 million (73%) from $82.6 million in FY 2002 to $142.9 million in FY 2006. This increase is attributable to personal and contractual services to meet the demands of airline passenger growth at FLL and security requirements.

FINANCIAL
AVIATION DEPARTMENT - FY 2006 ANNUAL FINANCIAL REPORT I - 5
Other14%
Depreciation23%
Contractual Services
46%
Personal Services17%
Operating Expenses ($000) 2006 2005 2004 2003 2002
Personal Services 24,153$ 22,634$ 22,432$ 20,171$ 18,214$ Contractual Services 65,169 55,028 42,262 37,149 38,574 Other 20,481 18,501 15,965 15,981 10,800 Operating Expenses Before Depreciation 109,803 96,163 80,659 73,301 67,588 Depreciation 33,132 28,728 24,105 20,658 15,033 Total Operating Expenses 142,935$ 124,891$ 104,764$ 93,959$ 82,621$
Fiscal Years Ended September 30
Personal services (salaries & wages and all employee fringe benefits) increased $5.9 million or 33% from $18.2 million in FY 2002 to $24.1 million in FY 2006. During this period, total authorized staff positions grew from 400 in FY 2002 to 413 in FY 2006, a 3.2% increase. Personal services accounted for 17% of total operating expenses in FY 2006 compared to 22% in FY 2002.
Contractual services increased $27 million or 69% from FY 2002 to FY 2006. This growth is primarily attributable to increased costs in shuttle bus service, parking management, security, and janitorial services. These increased costs are directly related to the large increase in airport traffic that requires improving passenger services such as shuttle frequency and parking management with the opening of additional parking facilities in FY 2000. Other expenses totaling $20.5 million accounted for 14.3% of total operating expenses in FY 2006. Collectively, these expenses increased by $9.7 million (90%) from $10.8 million in FY 2002. These include such areas as legal, purchasing, information technology systems, human resources, central finance and accounting services and utilities. The increase costs are associated with the growth the airport has seen over the five years.
Depreciation expense of $33.1 million represents 23% of operating expenses in FY 2006 compared to $15.0 million (18%) in FY 2002.

FINANCIAL
AVIATION DEPARTMENT - FY 2006 ANNUAL FINANCIAL REPORT I - 6
Analysis of Non-Operating Revenues and Expenses The components of the non-operating revenues and expenses category are shown as follows.
Summary ofRevenues and Expenses ($000) 2006 2005 2004 2003 2002
Operating Revenues 160,126$ 144,195$ 116,418$ 106,676$ 100,701$ Operating Expenses (including depreciation) 142,935 124,891 104,764 93,959 82,621 Operating Income 17,191$ 19,304$ 11,654$ 12,717$ 18,080$ Non-Operating Revenue, Net of Expenses 22,971 6,250 13,010 7,353 11,122 Net Income (before contribution) 40,162$ 25,554$ 24,664$ 20,070$ 29,202$
Fiscal Years Ended September 30
Passenger Facility Charges increased 99% from $21.2 million in FY 2002 to $42.2 million in FY 2006 as a result of an increase in collections. PFCs are authorized for collection at FLL at $4.50 per enplaning passenger and remitted to the Airport net of a $0.11 collection charge retained by the airlines. See "PASSENGER FACILITY CHARGES." Interest income over the past five years has increased 90% from $11.4 million in FY 2002 to $21.7 million in FY 2006. This increase is primarily attributable to interest earned on invested bond proceeds.
Interest expense increased 105% from $21 million in FY 2002 to $43 million in FY 2006. This increase in interest expense is due to the issuance of additional bonds.
Summary of Cash Flow Activities The following shows a summary of the major sources and uses of cash and cash equivalents for the past five years. Cash equivalents are considered cash-on-hand, bank deposits and highly liquid investments with an original maturity of three months or less.
Summary ofCash Flow Activities ($000) 2006 2005 2004 2003 2002
Cash Flow from Operating Activities 44,816$ 56,786$ 39,039$ 36,143$ 33,859$ Cash Flow from Non Capital Financing Activities 1,280 1,286 1,033 187 1,551 Cash Flow from Capital and Related Financing Activities (70,249) 156,577 (134,564) (145,323) (112,161) Cash Flow from Investing Activities (268,500) (55,295) 138,583 129,397 (227,316) Net increase (decrease) in Cash and Cash Equivalents (292,653) 159,354 44,091 20,404 (304,067) Cash and Cash Equivalents: Beginning of Year 373,372 214,018 169,927 149,523 453,590 End of Year 80,719$ 373,372$ 214,018$ 169,927$ 149,523$
Fiscal Years Ended September 30
Cash and cash equivalents decreased $80.2 million or 18 % during the five year period from $453.6 million in FY 2002 to $373.4 million in FY 2006.

FINANCIAL
AVIATION DEPARTMENT - FY 2006 ANNUAL FINANCIAL REPORT I - 7
Capital Acquisitions and Construction Activities Property and Equipment (net of depreciation) increased $326.2 million (36%) from $909.6 million in FY 2002 to $1,235.8 million in FY 2006. Major projects nearing completion or under construction at September 30, 2006 had an aggregate cost of $92.8 million. Property and equipment as of September 30, 2006 consist of the following:
Property & Accumulated Percent EstimatedProperty and Equipment ($000) Equipment Depreciation Net Depreciated Lives
Land and Improvements 282,797$ -$ 282,797$ Buildings and Facilities 1,087,996 231,971 856,025 21.3% 3 - 40 YearsFurniture, Fixtures and Equipment 14,227 10,093 4,134 70.9% 3 - 15 YearsConstruction in Progress 92,886 - 92,886 Total Property and Equipment 1,477,906$ 242,064$ 1,235,842$
September 30, 2006
Outstanding Bonds
The following table summarizes the Airport System Revenue (ASR) Bond and Passenger Facility Charge (PFC) Convertible Lien Bond activity from September 30, 2002 to September 30, 2006. Outstanding bonds increased $162.2million (23%) from $705.8 million at September 30, 2002 to the current balance of $868.0 million. Series F, G, and H provided approximately $200 million funding for the 1998 Project. Series I provided funding for Terminal 1 and Series J provided funding for the Consolidated Rental Car Facility. Series L provided funding for Exit Road Funding Improvements and Grade Separated Pedestrian Bridges. Series M provided funding for Security Enhancements, Renewal and Replacement Projects, partial funding for Terminal 4 Renovation, Pay-on-Foot Upgraded Parking Revenue System, Airport Signage, Runway Implementation Plan Initiatives, additional Public Parking and Sanitary Sewer project. Other changes include the refunding of Series B with Series E in 1998, Series C with Series K and the scheduled retirements as noted below.
Bond Year ofSeries & Bond Interest Issue & Original Balance BalanceSecurity Type Rate Maturity Amount 09/30/02 Additions Payments 09/30/06C - ASRs Serial 4.10 - 5.25% 1993 - 2004 150,865$ 126,540$ -$ (126,540)$ - E - ASRs Serial 4.80 - 5.10% 1998 - 2013 75,560 75,560 - - 75,560 F - ASRs Serial 4.00 - 4.74% 1998 - 2009 10,530 9,160 (3,970) 5,190 G - ASRs Serial 3.70 - 5.125% 1998 - 2018 44,635 44,635 (7,630) 37,005 G - ASRs Term 5.00 % 1998 - 2023 18,880 18,880 18,880
J-1 - ASRs Term 5.25 - 5.75% 2001 - 2026 135,970 135,970 - 135,970 J-2 - ASRs Term 5.80 - 6.90% 2001 - 2021 149,185 149,185 - (1,905) 147,280 K - ASRs Serial 2.00 - 6.00% 2003 - 2009 87,360 - 87,360 (24,080) 63,280 L- ASRs Serial 2.00-4.60% 2005-2027 - 142,015 (3,665) 138,350
M1/M2 ASRs Serial 3.10-5.25% 2005-2029 - 105,225 (1,425) 103,800 H-1 PFCs(*) Serial 3.10 - 5.25% 1998 - 2015 66,620 66,620 - (22,510) 44,110 H-2 PFCs(*) Serial 4.70 - 5.125% 1998 - 2018 20,270 20,270 - 20,270 H-2 PFCs(*) Term 4.75 % 1998 - 2023 39,780 39,780 - 39,780 I - PFCs(*) Term 4.00 - 5.75% 2001 - 2026 41,855 41,855 - (3,360) 38,495
841,510$ 728,455$ 334,600$ (195,085)$ 867,970
(*) Secured by PFCs Through 10-1-2012 Conversion Date Then Secured by ASRs Effective 10-2-2012
Bond Amount ($000)

FINANCIAL
AVIATION DEPARTMENT - FY 2006 ANNUAL FINANCIAL REPORT I - 8
Airport System Revenue Bonds. The bond resolution contains a provision, among others, to set its revenue rates and charges at a level where net revenues plus excess Airline Fees & Charges from the prior year exceed required debt service payments by 125%. The following table illustrates the actual ASR debt service coverage percentage.
ASR Bond
Debt Service Coverage ($000) 2006 2005 2004 2003 2002
Operating Revenues 160,126$ 144,195$ 116,418$ 106,676$ 100,701$ Less Operating Expenses Before Depreciation (109,803) (96,163) (80,659) (73,301) (67,588) Net Revenues 50,323$ 48,032$ 35,759$ 33,375$ 33,113$ Transfer From Airline Fees & Charges Sub-Account of Prior Year 27,921 21,469 15,730 12,507 12,307 Net Revenues Available for Debt Service 78,244$ 69,501$ 51,489$ 45,882$ 45,420$
Total ASR Debt Service 50,562$ 37,775$ 26,812$ 26,815$ 27,711$
ASR Debt Service Coverage Calculated 155% 184% 192% 171% 164%ASR Debt Service Coverage Requirement 125% 125% 125% 125% 125%
Fiscal Years Ended September 30
PFC Convertible Lien Bonds. The following table illustrates the actual PFC revenues available for PFC debt service from FY 2002 to FY 2006 and the annual debt service requirement from FY 2002 to FY 2006 following the issuance of the PFC Convertible Lien Bonds during 1998. While there is no debt service coverage requirement, it is calculated at 188% in FY 2002 and 184% in FY 2006.
PFC Convertible Lien BondDebt Service Coverage ($000) 2006 2005 2004 2003 2002
PFC Collections 42,175$ 30,565$ 27,608$ 23,699$ 21,190$ PFC Revenue Fund Interest Income 3,748 1,831 883 1,017 1,596 PFC Revenues 45,923 32,396 28,491 24,716 22,786PFC Reserve Fund Interest - N.A. Surety Used - - - - - PFC Revenues Available for Debt Service 45,923$ 32,396$ 28,491$ 24,716$ 22,786$
Total PFC Debt Service 24,967$ 27,769$ 12,095$ 12,095$ 12,093$
PFC Debt Service Coverage Calculated 184% 117% 236% 204% 188%
PFC Debt Service Coverage Requirement None None None None None
Fiscal Years Ended September 30

FINANCIAL
AVIATION DEPARTMENT - FY 2006 ANNUAL FINANCIAL REPORT I - 9
Credit Ratings and Bond Insurance During October 2004, BCAD updated its credit ratings with the three major rating agencies and received the following ratings:
• Standard & Poor’s rating services assigned an “A+” to the County’s Airport System revenue (ASR) Bonds and to the County’s Passenger Facility Charge (PFC) Bonds an “A” rating with a positive outlook.
• Fitch Ratings also assigned the same ratings to the bonds with a stable outlook • Moody’s Investor’s Service assigned an Aa3 rating with a stable outlook to the ASR Bonds and an
A1 rating on the PFC Bonds. Passenger Facility Charge (PFC) Effective January 1, 1995, the FAA authorized the Aviation Department to impose and use collected PFCs of $3.00 per departing passenger at Fort Lauderdale - Hollywood International Airport (the Airport). In July 2005, the Airport receives approval by the FAA to implement a $4.50 PFC effective October 1, 2005. Through initial and subsequent FAA approvals, the Aviation Department is authorized to collect PFCs up to $498,900,000, of which $282,203,000 has been collected as of September 30, 2006. Request for Information Our Annual Financial Report is designed to provide detail information on BCAD’s operations. Questions concerning any of the information provided in this report or any request for additional information should be addressed to Mark Spennacchio, Finance Director, Broward County Aviation Department, 100 Aviation Boulevard, Fort Lauderdale, Florida 33315 or by e-mail to [email protected].

FINANCIAL
AVIATION DEPARTMENT - FY 2006 ANNUAL FINANCIAL REPORT I - 10
(Unaudited)
2006 2005ASSETSCurrent Assets: Cash and Cash Equivalents 42,232$ $48,526 Receivables (Net) 6,443 6,170 Inventory 333 308 Other Current Assets 2,330 1,613 Total Current Assets 51,338 56,617Noncurrent Assets: Restricted Assets: Cash and Cash Equivalents 38,487 324,846 Investments 447,400 157,174 Grant Receivables 15,522 8,370 Total Restricted Assets 501,409 490,390
Deferred Bond Issuance Cost 9,964 10,780 Capital Assets: Land and Improvements 282,797 282,797 Buildings and Facilities 1,087,996 1,064,806 Equipment 14,227 13,734 Construction in Progress 92,887 61,425 Total Capital Assets 1,477,907 1,422,762 Less Accumulated Depreciation (242,065) (209,226) Fixed Assets (Net) 1,235,842 1,213,536 Total Noncurrent Assets 1,747,215 1,714,706 Total Assets 1,798,553$ 1,765,029$
LIABILITIES AND NET ASSETSCurrent Liabilities: Vouchers Payable and Accrued Liabilities $25,155 $9,901 Due to Other County Funds - 5,350 Other Current Liabilities 1,233 3,497 Total Current Liabilities 26,388 18,748
Current Liabilities Payable from Restricted Assets: Vouchers Payable and Accrued Liabilities 14,583 9,509 Accrued Interest Payable 20,380 20,826 Revenue Bonds Payable 34,245 23,840 Deferred Revenue-Airline Fees and Charges 23,438 27,921 Total Current Liabilities Payable from Restricted Assets 92,646 82,096
Long Term Liabilities: Revenue Bonds Payable 833,725 869,395 Notes Payable 21,966 29,966 Other Long-Term Liabilities and Unamortized Discount 9,660 8,856 Total Long Term Liabilities 865,351 908,217
Total Liabilities 984,385 1,009,061
NET ASSETS Invested in Capital Assets, Net of Related Debt 563,174 529,696 Restricted: Rate Stabilization 14,000 14,000 Debt Service 51,773 49,403 Passenger Facility Charge 96,318 75,362 Capital Projects 67,372 64,009 Total Restricted 229,463 202,774 Unrestricted 21,531 29,792 Total Net Assets 814,168 762,262 Total Liabilities and Net Assets 1,798,553$ 1,771,323$
(in thousands)For Twelve Months Ended September 30, 2006 and 2005
COMPARATIVE STATEMENT OF NET ASSETS

FINANCIAL
AVIATION DEPARTMENT - FY 2006 ANNUAL FINANCIAL REPORT I - 11
(Unaudited)2006 2005
Operating Revenue: Concessions $37,064 38,300$ Parking 40,565 40,511 Terminal Rent and Charges 36,138 25,519 Airfield Fees and Charges 13,741 13,800 Building and Ground Rentals 8,253 8,121 Customer Facility Charges (CFC) 23,561 16,174 Miscellaneous Fees 804 1,770 Total Operating Revenue 160,126 144,195
Operating Expenses: Personal Services 24,153 22,634 Contractual Services 65,169 57,690 General Operating 20,481 15,839 Total Operating Expenses Before Depreciation 109,803 96,163 Operating Income Before Depreciation 50,323 48,032 Depreciation 33,132 28,728 Operating Income 17,191 19,304
Non-Operating Income (Expense): Grants 1,280 1,286 Passenger Facility Charges 42,175 30,565 Interest Income 21,726 12,262 Interest Expense (42,942) (38,015) Amortization of Bond Issuance Cost (817) (803) Gain (Loss) on Disposal of Assets (106) (576) Other Non-Operating 1,655 1,531 Total Non-Operating Income (Expenses) 22,971 6,250 Income Before Contributions and Transfers 40,162 25,554
Capital Contributions 11,743 18,965 Change in Net Assets 51,905 44,519Total Net Assets - Beginning 762,262 717,743
Total Net Assets - Ending 814,167$ 762,262$
COMPARATIVE STATEMENT OF REVENUES, EXPENSES AND CHANGES IN FUND NET ASSETSFor Twelve Months Ended September 30, 2006 and 2005
(in thousands)

FINANCIAL
AVIATION DEPARTMENT - FY 2006 ANNUAL FINANCIAL REPORT I - 12
(Unaudited)
2006 2005Cash Flows from Operating Activities: Cash Received from Customers $157,023 148,626$ Cash Payments to Suppliers for Goods and Services (88,632) (69,492) Cash Payments to Employees for Services (23,575) (22,348) Net Cash Provided by Operating Activities 44,816 56,786
Cash Flows from Noncapital Financing Activities: Grants 1,280 1,286 Net Cash Provided by Noncapital Financing Activities 1,280 1,286
Cash Flows from Capital and Related Financing Activities: Proceeds from Bond Sales 0 252,254 Loan Proceeds 0 0 Acquisition and Construction of Property, Plant and Equipment (48,262) (97,205) Proceeds from Sale of Assets 0 4,063 Debt Principal Payment (25,365) (19,700) Interest and Fiscal Charges (43,388) (36,411) Capital Contribution 4,591 23,011 Receipt of Passenger Facility Charges 42,175 30,565 Net Cash Used for Capital and Related Financing Activities (70,249) 156,577
Cash Flows from Investing Activities: Purchase of Investment Securities (1,089,443) (841,501) Proceeds from Sale and Maturities of Investment Securities 799,217 773,944 Interest and Dividends on Investments 21,726 12,262 Net Cash Provided by (Used for) Investing Activities (268,500) (55,295)
Net Increase (Decrease) in Cash and Cash Equivalents (292,653) 159,354
Cash and Cash Equivalents, Beginning of Period 373,372 214,018
Cash and Cash Equivalents, End of Period 80,719$ 373,372$
Cash and Cash Equivalents in Current Assets 42,232 48,526Cash and Cash Equivalents in Restricted Assets 38,487 324,846 Total Cash and Cash Equivalents (Above) 80,719$ 373,372$
Reconciliation of Operating Income to Net Cash Provided by Operating Activities:Operating Income 17,191$ 19,304$ Adjustments to Reconcile Operating Income to Cash Flows from Operating Activities: Depreciation Expense 33,132 28,728 Miscellaneous Non-Operating Expense 839 (30) Changes in Assets and Liabilities: (Increase) Decrease in Accounts Receivable (273) (3,304) (Increase) Decrease in Due from Other County Funds 0 (23) (Increase) Decrease in Inventory (25) 0 (Increase) Decrease in Other Current Assets (717) (296) Increase (Decrease) in Vouchers Payable and Accrued Liabilities (757) 10,819 Increase (Decrease) in Due to Other County Funds (5,350) 0 Increase (Decrease) in Due to Other Governments 1,123 746 Increase (Decrease) in Other Current Liabilities (347) 842 Net Adjustments 27,625 37,482
Net Cash Provided by Operating Activities 44,816$ 56,786$
COMPARATIVE STATEMENT OF CASH FLOWSFor Twelve Months Ended September 30, 2006 and 2005
(in thousands)

FINANCIAL
AVIATION DEPARTMENT - FY 2006 ANNUAL FINANCIAL REPORT I - 13
Notes to the Financial Statements
September 30, 2006 (Unaudited)
Note 1: Summary of Significant Accounting Policies .............................................................................I - 14 Note 2: Cash and Investments .................................................................................................................I - 17 Note 3: Accounts Receivable ..................................................................................................................I - 18 Note 4: Restricted Assets.........................................................................................................................I - 18 Note 5: Capital Assets .............................................................................................................................I - 19 Note 6: Lease and Concession Agreements.............................................................................................I - 20 Note 7: Long-Term Liabilities.................................................................................................................I - 21 Note 8: Capital Contributions..................................................................................................................I - 23 Note 9: Airline-Airport Lease and Use Agreement .................................................................................I - 23 Note 10: Commitments and Contingent Liabilities ...................................................................................I - 23 Note 11: Subsequent Events ......................................................................................................................I - 23

FINANCIAL
AVIATION DEPARTMENT - FY 2006 ANNUAL FINANCIAL REPORT I - 14
Notes to the Financial Statements
September 30, 2006 (Unaudited)
NOTE 1 - SUMMARY OF SIGNIFICANT ACCOUNTING POLICIES A. Reporting Entity The County owns and through the Aviation Fund of Broward County Aviation Department (BCAD), operates the Fort Lauderdale-Hollywood International Airport (FLL), a major air carrier airport and the North Perry Airport (HWO), a general aviation airport. The Aviation Fund is a major enterprise fund of Broward County. All accounts of FLL and HWO are included in the Aviation Fund. There are no other financial activities or funds considered for inclusion in BCAD’s reporting entity. B. Basis of Accounting The BCAD=s financial statements are presented using the flow of economic resources measurement focus and the accrual basis of accounting. The economic resources measurement focus accounts records capital assets and long-term debt on the statement of net assets. In turn, capital assets are depreciated and recorded as an expense on the operating statement. The accrual basis of accounting recognizes revenues when they are earned and expenses when incurred. However, during the fiscal year, BCAD operates using the flow of financial resources measurement focus and modified accrual basis of accounting to comply with the budgetary requirements of the County. Revenues from airlines, concessions, rental cars and parking are reported as operating revenues. Transactions which are capital, financing or investing related are reported as non-operating revenues. All expenses related to operating the airport are reported as operating expenses. Interest expense and financing costs are reported as non-operating expenses C. Net Assets Net assets represent the residual interest in BCAD’s assets after liabilities are deducted and consist of three sections: Invested in capital assets, net of related debt, restricted and unrestricted net assets. Net assets invested in capital assets, net of related debt includes capital assets, restricted and unrestricted, net of accumulated depreciation, reduced by outstanding debt expended for capital assets. Net assets are reported as restricted when constraints are imposed by third parties or enabling legislation. All other net assets are unrestricted. D. Proprietary Accounting and Financial Reporting Pursuant to GASB Statement No. 20, Accounting and Financial Reporting for Proprietary Funds and Other Governmental Entities That Use Proprietary Fund Accounting, BCAD applies all applicable GASB pronouncements as well as FASB Statements and Interpretations, APB Opinions, and ARB’s issued on or before November 30, 1989, unless those pronouncements conflict or contradict GASB pronouncements. E. Cash and Cash Equivalents Cash and cash equivalents consist of amounts in demand deposits as well as investments with a maturity of three months or less from the date of purchase.

FINANCIAL
AVIATION DEPARTMENT - FY 2006 ANNUAL FINANCIAL REPORT I - 15
Notes to the Financial Statements
September 30, 2006 (Unaudited)
F. Accounts Receivable Accounts receivable for the Aviation Fund are presented in the accompanying financial statements net of an allowance for uncollectible accounts of $1,947,000 and $1,991,000 at September 30, 2006 and 2005, respectively. G. Inventory Inventory consists of maintenance materials and supplies for consumption and is recorded at the lower of cost or market value, using the first-in, first-out method. H. Grants Receivable The amount due from other governments represents grants receivable from the Federal and State governments for their share of amounts expended on various capital projects. I. Deferred Bond Issue Costs Bond issue costs include underwriting spreads, insurance and various professional fees. The costs are deferred and amortized over lives of respective bond issues. J. Capital Assets Property, plant and equipment acquired by BCAD are carried at cost, net of accumulated depreciation. During construction of assets, interest incurred on related construction debt, less interest earned from investments whose use is related capital improvements, is capitalized from the time of borrowing until completion of the project. BCAD follows the policy of depreciating capital assets on the straight-line basis over the following estimated useful lives: Buildings and Facilities 3-40 years Furniture, Fixtures and Equipment 3-15 years K. Capitalized Interest Interest is capitalized during construction to Construction in Progress, and consists of interest expense on certain borrowings in excess of interest earned on related investments acquired with the proceeds of borrowings. L. Compensated Absences BCAD’s policy is to permit employees to accumulate vacation and sick leave. The cost of earned but unused vacation is accrued as a liability in the period in which the leave is earned. A liability for earned but unused sick leave is accrued only to the extent that the leave will result in cash payments at termination. At September 30, 2006 and 2005, such amounts aggregate $3,507,000 and $2,514,000 respectively and are included in other current and long term liabilities.

FINANCIAL
AVIATION DEPARTMENT - FY 2006 ANNUAL FINANCIAL REPORT I - 16
Notes to the Financial Statements
September 30, 2006 (Unaudited)
M. Deferred Revenues – Airline Fees and Charges Deferred revenues represent revenues earned in excess of certain required deposits in accordance with the Airline-Airport Lease and Use Agreement.
N. Capital Contributions Capital contributions consist mainly of grants from Federal and State governments. They are recognized as earned as related project costs are incurred. O. Passenger Facility Charges In 1990, Congress authorized domestic airports to impose a Passenger Facility Charge (PFC) on each departing passenger. Subsequently, the Federal Aviation Administration (FAA) issued regulations for the use and reporting of PFCs. Airports are authorized to use PFCs for projects that must meet at least one of the following eligibility requirements: (1) preserve or enhance safety, security, or capacity of the national transportation system; (2) reduce noise or reduce noise impacts resulting from an airport; or (3) furnish opportunities for enhanced competition between or among carriers. Effective January 1, 1995, the FAA authorized the Aviation Department to impose and use collected PFCs of $3.00 per departing passenger at Fort Lauderdale - Hollywood International Airport (the Airport). Through initial and subsequent FAA approvals, the Aviation Department is authorized to collect PFCs up to $498.9 million including interest, of which $282.2 million has been collected as of September 30, 2006. The net receipts from PFCs are non-refundable and restricted to be used on FAA approved capital projects and debt service on revenue bonds that fund approved PFC eligible projects. As of September 30, 2006, $185.9 million of the collected PFCs had been spent on approved projects or debt service, and the remaining $96.3 million was reflected in restricted net assets. The ticketing airline includes the departing PFC in the price of each ticket when it is sold to the traveler. The $4.50 PFC collected by the airlines is remitted monthly to the Airport, less an $0.11 per passenger administrative fee. Once received by the Airport, the PFC net collections are non-refundable and may only be used for the approved eligible capital projects and debt service on the Passenger Facility Charge / Airport System Revenue Convertible Lien Bonds that funded approved PFC eligible projects. P. Pension Costs
BCAD participates in the Florida Retirement System (FRS), a cost sharing, multiple-employer Public Employment Retirement System, which covers substantially all permanent full and part-time employees. The FRS is non-contributory and is totally administered by the State of Florida. Benefits are computed on the basis of age, average final compensation and service credit. Average final compensation is the average of the five highest fiscal years of earnings. The FRS provides vesting of benefits after six years of creditable service. Early retirement may be taken any time after vesting; however, there is a 5% benefit reduction for each year prior to normal retirement age or date. The FRS also provides death and disability benefits. A State Statute establishes benefits.

FINANCIAL
AVIATION DEPARTMENT - FY 2006 ANNUAL FINANCIAL REPORT I - 17
Notes to the Financial Statements
September 30, 2006 (Unaudited)
Q. Estimates The preparation of financial statements in conformity with generally accepted accounting principles requires management to make estimates and assumptions that affect certain reported amounts and disclosures. Accordingly, actual results could differ from those estimates. R. Reclassifications Certain amounts in the prior year financial statements have been reclassified to conform to the current year presentation. NOTE 2 - CASH AND INVESTMENTS The County maintains a pool for substantially all cash and investments. Each fund types portion of the pool is displayed on the balance sheet as Acash and cash equivalents or Arestricted assets as appropriate. BCAD also maintains bond proceeds and debt service accounts with Wachovia Bank who in turn makes investments. At September 30, 2006 and 2005, BCAD’s cash and investments consist of the following (in thousands):
September 30,2005 2004
Cash and Cash Equivalents: Pooled Cash 42,232$ 205,024$ Demand Deposits 38,487 168,348 Total Cash and Cash Equivalents 80,719 373,372
Investments: Commercial Paper - - U.S. Treasury - 81,348 Federal Home Loan Bank 90,003 75,826 Federal National Mortgage Association - - Federal Farm Credit Bank - - Money Market Funds 357,397 - Total Investments 447,400 157,174
Total Cash, Cash Equivalents and Investments 528,119$ 530,546$
FINANCIAL
AVIATION DEPARTMENT - FY 2006 ANNUAL FINANCIAL REPORT I - 18
Notes to the Financial Statements
September 30, 2006 (Unaudited)
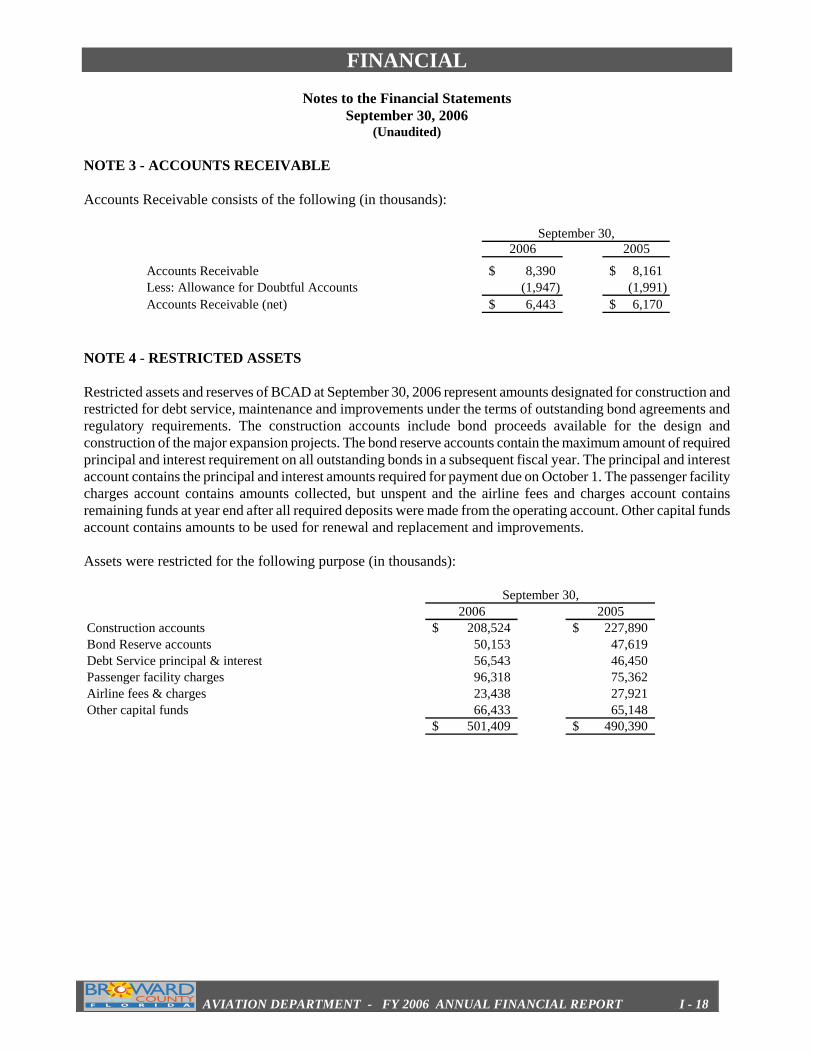
NOTE 3 - ACCOUNTS RECEIVABLE Accounts Receivable consists of the following (in thousands):
September 30,2006 2005
Accounts Receivable 8,390$ 8,161$ Less: Allowance for Doubtful Accounts (1,947) (1,991)Accounts Receivable (net) 6,443$ 6,170$
NOTE 4 - RESTRICTED ASSETS Restricted assets and reserves of BCAD at September 30, 2006 represent amounts designated for construction and restricted for debt service, maintenance and improvements under the terms of outstanding bond agreements and regulatory requirements. The construction accounts include bond proceeds available for the design and construction of the major expansion projects. The bond reserve accounts contain the maximum amount of required principal and interest requirement on all outstanding bonds in a subsequent fiscal year. The principal and interest account contains the principal and interest amounts required for payment due on October 1. The passenger facility charges account contains amounts collected, but unspent and the airline fees and charges account contains remaining funds at year end after all required deposits were made from the operating account. Other capital funds account contains amounts to be used for renewal and replacement and improvements. Assets were restricted for the following purpose (in thousands):
September 30,2006 2005
Construction accounts 208,524$ 227,890$ Bond Reserve accounts 50,153 47,619 Debt Service principal & interest 56,543 46,450 Passenger facility charges 96,318 75,362 Airline fees & charges 23,438 27,921 Other capital funds 66,433 65,148
501,409$ 490,390$

FINANCIAL
AVIATION DEPARTMENT - FY 2006 ANNUAL FINANCIAL REPORT I - 19
Notes to the Financial Statements
September 30, 2006 (Unaudited)
NOTE 5 - CAPITAL ASSETS A summary of changes in capital assets for the years ending September 30, 2006 and 2005 is as follows (in thousands):
Balance Transfers BalanceOctober 1, and September 30,
2005 Additions Deletions 2006
Capital Assets Not Being DepreciatedConstruction in Progress 61,425$ 57,603 26,142 92,886$ Land and Improvements 282,797 - - 282,797
Total Capital Asset Not Being Depreciated 344,222 57,603 26,142 375,683
Other Capital AssetsBuildings and Facilities 1,064,806 23,190 - 1,087,996 Equipment 13,734 898 405 14,227
Total Other Capital Assets 1,078,540 24,088 405 1,102,223
Less accumulated depreciation:Buildings and Facilities 199,989 31,982 - 231,971 Equipment 9,237 1,150 294 10,093
Total Accumulated Depreciation 209,226 33,132 294 242,064
Other Capital Assets, Net 869,314 (9,044) 111 860,159
Total Capital Assets 1,213,536$ 48,559$ 26,253$ 1,235,842$
Balance Transfers BalanceOctober 1, and September 30,
2004 Additions Deletions 2005
Capital Assets Not Being DepreciatedConstruction in Progress 268,610$ 95,523 302,708 61,425$ Land and Improvements 282,082 5,357 4,642 282,797
Total Capital Asset Not Being Depreciated 550,692 100,880 307,350 344,222
Other Capital AssetsBuildings and Facilities 771,808 292,998 - 1,064,806 Equipment 14,189 1,287 1,742 13,734
Total Other Capital Assets 785,997 294,285 1,742 1,078,540
Less accumulated depreciation:Buildings and Facilities 172,456 27,533 - 199,989 Equipment 9,774 1,195 1,732 9,237
Total Accumulated Depreciation 182,230 28,728 1,732 209,226
Other Capital Assets, Net 603,767 265,557 10 869,314
Total Capital Assets 1,154,459$ 366,437$ 307,360$ 1,213,536$

FINANCIAL
AVIATION DEPARTMENT - FY 2006 ANNUAL FINANCIAL REPORT I - 20
Notes to the Financial Statements
September 30, 2006 (Unaudited)
NOTE 6 - LEASE AND CONCESSION AGREEMENTS The following is a schedule by years of minimum future revenues on non-cancelable agreements:
Minimum Future RevenuesAs of September 30
(in thousands)
2007 50,096$ 2008 46,643 2009 45,196 2010 44,398 2011 43,524 Later Years 234,024 Total Minimum Future Revenues 463,881$
Total minimum future revenues do not include contingent revenues that may be received under certain concession leases on the basis of a percentage of the tenants gross revenue in excess of stipulated minimums. Contingent revenues amounted to approximately $ 37.1 million and $38.3 million for the years ended September 30, 2006 and 2005, respectively.

FINANCIAL
AVIATION DEPARTMENT - FY 2006 ANNUAL FINANCIAL REPORT I - 21
Notes to the Financial Statements
September 30, 2006 (Unaudited)
NOTE 7 - LONG-TERM LIABILITIES A summary of long-term liability activity for the years ended September 30, 2006 and 2005 was as follows (in thousands):
Balance Balance DueOctober 1, September 30, Within
2005 Issued Retired 2006 One YearNotes Payable 29,966$ 8000 21,966$ Bonds Payable:
Series C - -$ Series E 75,560 75,560$ - Series F 6,050 860 5,190$ 900Series G 57,525 1640 55,885$ 1710Series H 107,900 3740 104,160$ 3925Series I 39,345 850 38,495$ 890Series J 285,155 1905 283,250$ 5020Series K 74,460 11180 63,280$ 15745Series L 142,015 3665 138,350$ 4205Series M 105,225 1425 103,800$ 1850
923,201 - 33,265 889,936 34,245 Less: Current Portion (34,245)Long-term portion 855,691$
Balance Balance DueOctober 1, September 30, Within
2004 Issued Retired 2005 One YearNotes Payable 30,066$ -$ 100$ 29,966$ -$ Bonds Payable:
Series C - - - - - Series E 75,560 - - 75,560 - Series F 6,875 - 825 6,050 860 Series G 59,105 - 1,580 57,525 1,640 Series H 111,480 - 3,580 107,900 3,740 Series I 40,160 - 815 39,345 850 Series J 285,155 - - 285,155 1,905 Series K 87,360 - 12,900 74,460 11,180 Series L - 142,015 - 142,015 3,665 Series M - 105,225 - 105,225
695,761$ 247,240$ 19,800$ 923,201 23,840$ Less: Current Portion (23,840) Long-term portion 899,361$

FINANCIAL
AVIATION DEPARTMENT - FY 2006 ANNUAL FINANCIAL REPORT I - 22
Notes to the Financial Statements
September 30, 2006 (Unaudited)
A schedule of debt maturities is as follows:
Bonds Payable Fiscal Year Principal Interest2007 34,245 44,599 2008 35,875 42,845 2009 37,540 41,485 2010 57,910 39,795 2011 43,500 37,658
2012-2016 171,590 155,202 2017-2021 180,760 107,777 2022-2026 208,710 50,780 2027-2031 97,840 7,781
Total 867,970 527,922$
Notes Payable2008 4,800 2009 4,800 2010 4,800 2011 4,800 2012 2,766
Total 21,966$
$29,966,000 Notes Payable to Florida Department of Transportation due in fiscal years 2007-2012, is a non-interest bearing loan used to fund the terminal roadways capital project. A description of the bonds is as follows: $75,560,000 Airport System Revenue Refunding Bonds Series E, dated July 15, 1998 was issued for the purpose of redeeming $75,000,000 Airport System Revenue Bonds, Series B. $10,530,000 Airport System Revenue Bonds Series F, dated July 15, 1998 was issued to pay certain project costs and issuance costs. $63,515,000 Airport System Revenue Bonds Series G, dated December 16, 1998 were issued to pay costs of the 1998 Project and to fund additional reserves , capitalized interest and issuance costs. $126,670,000 Passenger Facility Charge/Airport System Revenue Convertible Lien Bonds Series H, dated December 16, 1998 was issued for the purpose of funding the 1998 Project and issuance costs. $41,855,000 Passenger Facility Charge/Airport System Revenue Convertible Lien Bonds Series I, dated May 24, 2001 was issued to pay a portion of the costs of the 2001 PFC Project and issuance costs. $285,155,000 Airport System Revenue Bonds Series J, dated May 24, 2001 was issued for the purpose of funding the consolidated rental car and public parking facility, capitalized interest and issuance costs. $87,360,000 Airport System Revenue Refunding Bonds Series K, dated July 2, 2003 was issued to redeem $89,160,000 Airport System Revenue Refunding Bonds, Series C.

FINANCIAL
AVIATION DEPARTMENT - FY 2006 ANNUAL FINANCIAL REPORT I - 23
$142,015,000 Airport System Revenue Bonds Series L, dated October 22, 2005 was issued to pay for the 2004 Project, capitalized interest and issuance costs. $105,225,000 Airport System Revenue Bonds, Series M, dated October 29, 2004 was issued to pay for the 2004 Project, fund the increase in Reserve Requirement, capitalized interest, and issuance costs.

FINANCIAL
AVIATION DEPARTMENT - FY 2006 ANNUAL FINANCIAL REPORT I - 24
NOTE 8 - CAPITAL CONTRIBUTIONS Grants and other contributions used to acquire capital assets are classified as capital contributions in the Statement of Revenues, Expenses and Changes in Net Assets. Capital contributions consisted of the following at September 30, (in thousands):
2006 2005
Federal Grants 3,294$ 11,745$ State of Florida Grants 8,448 7,220
11,742$ 18,965$
NOTE 9 – AIRLINE-AIRPORT LEASE AND USE AGREEMENT BCAD has entered into a 25-year lease and use agreement with its major airline tenants (signatory airlines) whereby a residual rate setting methodology was established for the terminal complex and the airfield. The Airline Agreements terminate on September 30, 2011. The agreements require that landing fees and terminal rentals be reviewed annually and adjusted as necessary so that the total revenue is sufficient to meet BCAD’s requirements as determined by the signatory airline agreements. At the end of the fiscal year, after all required deposits have been made; any remaining excess funds are used to meet the requirements in the following fiscal year. These excess funds have been recorded as deferred revenue by BCAD at September 30, 2006 and have been included in current liabilities payable from restricted assets. For the year ended September 30, 2006, these funds amounted to $23,438,000. NOTE 10 - COMMITMENTS AND CONTINGENT LIABILITIES Federal and State of Florida grants are subject to audit by the granting agencies to determine if activities comply with conditions of the grant. Management believes that no material liability will arise from any such audits. At September 30, 2006, BCAD had in process various uncompleted construction projects with remaining balances totaling $121,040,000. The retainage payable on these contracts totaled $5,394,000. Funding of these projects is to be made primarily through the proceeds of the related bond issues. NOTE 11 - SUBSEQUENT EVENTS None


SUPPLEMENTARY INFORMATION
AVIATION DEPARTMENT - FY 2006 ANNUAL FINANCIAL REPORT II - 1
Supplementary Information Locator Guide September 30, 2006
Combining Statement of Net Assets ..................................................................................................... II – 2 Combing Statement of Revenues, Expenses and Changes in Net Assets ............................................. II – 4 Combing Statements of Cash Flows ..................................................................................................... II – 6 Debt Service Requirements to Maturity ............................................................................................... II – 8 Debt Service to Maturity by Series....................................................................................................... II – 9 to 14 Deposits to and Withdrawals from Special Funds and Accounts Created by Airport Bond Resolutions and The Airline-Airport Lease & Use Agreement ………………………………………II – 15 Airport System Revenue Bonds Debt Service Coverage...................................................................... II – 16 Passenger Facility Charge Convertible Lien Bonds – Sufficiency Test ............................................... II – 17

SUPPLEMENTARY INFORMATION
AVIATION DEPARTMENT - FY 2006 ANNUAL FINANCIAL REPORT II - 2
COMBINING STATEMENT OF NET ASSETSSeptember 30, 2006
(in thousands)(Unaudited)
Airport SystemOperation and Airline Fees Renewal &Maintenance and Charges Replacement Improvement
ASSETS Total Account Account Account AccountCurrent Assets: Cash and Cash Equivalents 42,232$ 28,232$ 14,000$ -$ -$ Receivables (Net) 6,443 6,443 - - - Inventory 333 333 - - - Other Current Assets 2,330 2,330 - - - Total Current Assets 51,338 37,338 14,000 - - Restricted Assets: Cash and Cash Equivalents 247264 23438 23812 2923 Investments 238623 39569 - - - Grant Receivables 15522 1224 - 0 - Total Restricted Assets 501409 40793 23438 23812 2923Fixed Assets: Land and Improvements 282797 282797 - - - Buildings & Facilities 1087996 1087996 - - - Equipment 14227 14227 - - - Construction in Progress 92887 92887 - - - Total Fixed Assets (Gross) 1477907 1477907 - - - Less Accumulated Depreciation (242,065) (242,065) - - - Total Fixed Assets (Net) 1235842 1235842 - - - Other Assets: Deferred Bond Issuance Cost 9964 9964 - - - Total Assets 1798553 1323937 37438 23812 2923
LIABILITIES AND NET ASSETSLiabilities:Current Liabilities: Vouchers Payable and Accrued Liabilities 22,115 22,115 - - - Other Current Liabilities 4,273 4,273 - - - Total Current Liabilities 26,388 26,388 - - - Current Liabilities Payable from Restricted Assets: Vouchers Payable and Accrued Liabilities 14,583 - - 998 63 Accrued Interest Payable 20,380 20,380 - - - Revenue Bonds Payable 34,245 34,245 - - - Deferred Revenue-Airline Fees and Charges 23,438 - 23,438 - - Total Current Liabilities Payable from Restricted Assets 92,646 54,625 23,438 998 63 Long Term Liabilities: Revenue Bonds Payable 833,725 639,124 - - - Notes Payable 21,966 - - - - Other Long Term Liabilities 9,660 7,765 - - - Total Long Term Liabilities 865,351 646,889 - - - Total Liabilities 984,385 727,902 23,438 998 63 Net Assets: Invested in Capital Assets, Net of Related Debt 563,174 563,174 - - - Restricted Debt Service 51,773 51,773 - - - Passenger Facility Charge 96,318 - - - - Capital Projects 67,372 - - 22,814 2,860 Total Restricted 778,637 614,947 - 22,814 2,860 Unrestricted 35,531 21,531 14,000 - - Total Net Assets 814,168 636,478 14,000 22,814 2,860
Total Liabilities and Net Assets 1,798,553$ 1,364,380$ 37,438$ 23,812$ 2,923$

SUPPLEMENTARY INFORMATION
AVIATION DEPARTMENT - FY 2006 ANNUAL FINANCIAL REPORT II - 3
Facilities Passenger Improvement & Restricted FacilityDevelopment Discretionary Asset Charges ConstructionAccount Account Account Account Account
-$ -$ -$ -$ -$ - - - - - - - - - - - - - - - - - - - -
26002 12611 1085 96318 61,075- - - - 199054
1236 0 20 - 1304227238 12611 1105 96318 273171
- - - - - - - - - - - - - - - - - - - - - - - - - - - - - - - - - - -
- - - - - 27238 12611 1105 96318 273171
- - - - - - - - - - - - - - -
1,867 9 93 - 11,553 - - - - - - - - - - - - - - -
1,867 9 93 - 11,553
- - - - 194,601 - - - - 21,966 - - - - 1,895 - - - - 218,462
1,867 9 93 - 230,015
- - - - -
- - - - - - - - 96,318 -
25,371 12,063 1,011 - 3,253 25,371 12,063 1,011 96,318 3,253
- - - - - 25,371 12,063 1,011 96,318 3,253
27,238$ 12,072$ 1,104$ 96,318$ 233,268$

SUPPLEMENTARY INFORMATION
AVIATION DEPARTMENT - FY 2006 ANNUAL FINANCIAL REPORT II - 4
Reclass Airport Systemof Inter- Operation and Airline Fees Renewal &Account Maintenance and Charges Replacement Improvement
Total Balances Account Account Account Account
Operating Revenue: Concessions 37,064$ -$ 37,064$ -$ -$ -$ Parking 40,565 - 40,565 - - - Terminal Rents and Charges 36,138 - 36,138 - - - Airfield Fees and Charges 13,741 - 13,741 - - - Building and Ground Rentals 31,814 - 31,814 - - - Miscellaneous Fees 804 - 804 - - - Total Operating Revenue 160,126 - 160,126 - - -
Operating Expenses Before Depreciation: Personal Services 24,153 - 24,153 - - - Contractrual Services 65,169 - 64,245 - 540 118 Other 20,481 - 20,481 - - - Capital Outlay - - - - 350 249 Total Expenses Before Depreciation 109,803 - 108,879 - 890 367
Operating Income Before Depreciation 50,323 - 51,247 - (890) (367) Depreciation 33,132 33,132 - - - Operating Income 17,191 - 18,115 - (890) (367) Non-Operating Income (Expense): Federal & State Grants 1,280 - 1,280 - - - Passenger Facility Charges 42,175 - - - - - Interest Income 21,726 - 7,083 - 754 - Interest Expense (42,942) - (42,942) - - - Amortization of Bond Issuance Cost (817) - (817) - - - Gain (Loss) on Disposal of Asset (106) - (106) - - - Other Non-Operating 1,655 - 1,655 - - - Total Non-Operating Income 22,971 - (33,847) - 754 -
Net Income Before Contributions and Transfers 40,162 - (15,732) - (136) (367)
Capital Contributions 11,743 - - - 858 - Oper. Transfer In (Out) from Operating and Maint. Acct. 34,668 - 23,254 - 6,208 402 Oper. Transfer In (Out) from Airlines Fees & Charges Acct. - - - - - - Oper. Transfer In (Out) from Passenger Fac. Charges Acct. (34,668) - (9,701) - - - Oper. Transfer In (Out) From Construction Account - - - - - - Change in Net Assets 51,905 - (2,179) - 6,930 35
Total Net Assets, Beginning of period 762,262 - 608,891 14,000 23,105 4,135
Total Net Assets, End of period 814,167$ -$ 606,712$ 14,000$ 30,035$ 4,170$
September 30, 2006(In Thousands)
(Unaudited)
COMBINING STATEMENT OF REVENUES, EXPENSES AND CHANGES IN NET ASSETS
SUPPLEMENTARY INFORMATION
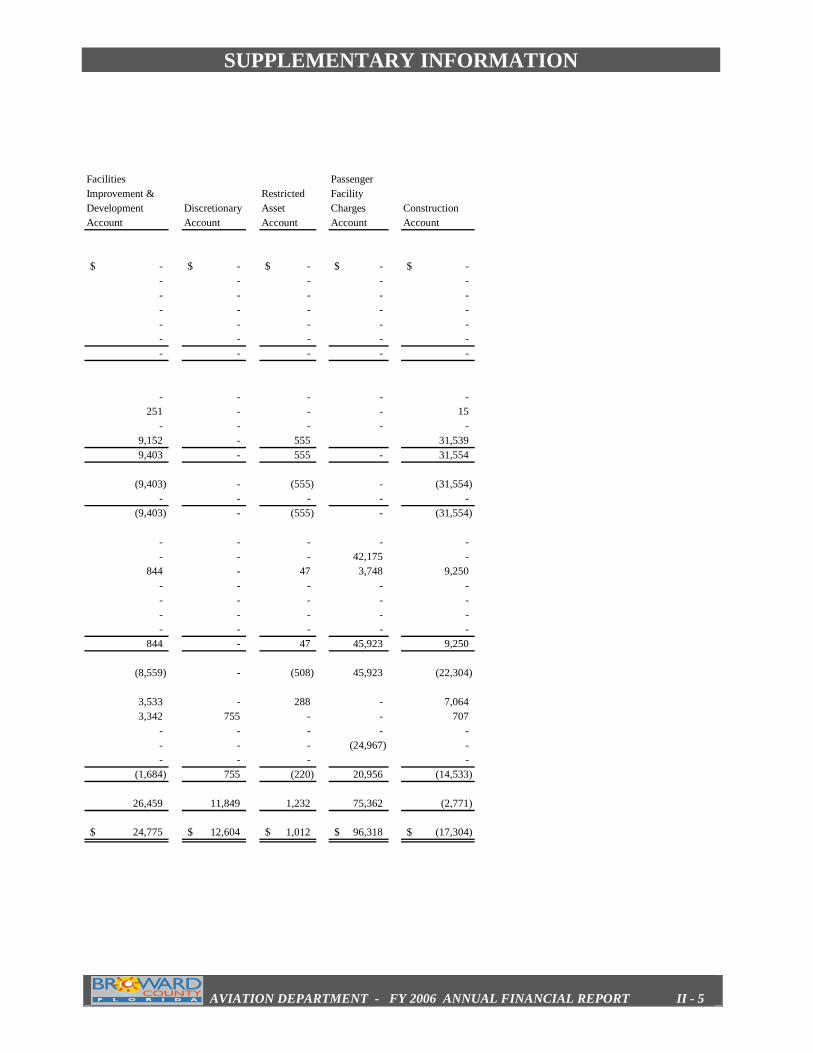
AVIATION DEPARTMENT - FY 2006 ANNUAL FINANCIAL REPORT II - 5
Facilities Passenger Improvement & Restricted FacilityDevelopment Discretionary Asset Charges ConstructionAccount Account Account Account Account
-$ -$ -$ -$ -$ - - - - - - - - - - - - - - - - - - - - - - - - - - - - - -
- - - - - 251 - - - 15
- - - - - 9,152 - 555 31,539 9,403 - 555 - 31,554
(9,403) - (555) - (31,554) - - - - -
(9,403) - (555) - (31,554)
- - - - - - - - 42,175 -
844 - 47 3,748 9,250 - - - - - - - - - - - - - - - - - - - -
844 - 47 45,923 9,250
(8,559) - (508) 45,923 (22,304)
3,533 - 288 - 7,064 3,342 755 - - 707
- - - - - - - - (24,967) - - - - -
(1,684) 755 (220) 20,956 (14,533)
26,459 11,849 1,232 75,362 (2,771)
24,775$ 12,604$ 1,012$ 96,318$ (17,304)$

SUPPLEMENTARY INFORMATION
AVIATION DEPARTMENT - FY 2006 ANNUAL FINANCIAL REPORT II - 6
Airport SystemOperation and Airline Fees Renewal &Maintenance and Charges Replacement
Total Account Account AccountCash Flows from Operating Activities:
Cash Received from Customers 157,023$ 161,505$ (4,482)$ -$ Cash Payments to Suppliers for Goods and Services (88,632) (87,708) - (540) Cash Payments to Employees for Services (23,575) (23,575) - - Net Cash Provided by (Used for) Operating Activities 44,816 50,222 (4,482) (540) Cash Flows from Noncapital Financing Activities: Grants 1,280 1,280 - - Operating Transfers In 1,713 (9,701) - 6,208 Operating Transfers Out (1,713) 23,254 - - Net Cash Provided by (Used for) Noncapital Financing Activities 1,280 14,833 - 6,208 Cash Flows from Capital and Related Financing Activities: Loan Proceeds - - - -
Acquisition and Construction of Property, Plant and Equipment (48,262) - - (350) Proceeds from Sale of Assets - - - -
Debt Principal Payment (25,365) (25,365) - - Interest and Fiscal Charges (43,388) (43,388) - - Capital Contribution 4,591 - - -
Receipt of Passenger Facility Charges 42,175 - - - Net Cash Provided by (Used for) Capital and Related Financing Activities (70,249) (68,753) - (350) Cash Flows from Investing Activities:
Purchase of Investment Securities (1,089,443) (173,441) - - Proceeds from Sale and Maturities of Investment Securities 799,217 - - - Interest and Dividends on Investments 21,726 7,083 - 754 Net Cash Provided by (Used for) Investing Activities (268,500) (166,358) - 754
Net Decrease in Cash and Cash Equivalents (292,653) (170,056) (4,482) 6,072 Cash and Cash Equivalents, Beginning of Period 373,372 47,292 36,182 17,689 Cash and Cash Equivalents, End of Period 80,719 (122,764) 31,700 23,761
Cash and Cash Equivalents in Current Assets 42,232 28,232 14,000 - Cash and Cash Equivalents in Restricted Assets 38,487 9,987 - - Total Cash and Cash Equivalents (Above) 80,719 38,219 14,000 -
Reconciliation of Operating Income to Net Cash Provided by (Used for) Operating Activities:Operating Income (Expense) 17,191 18,115 - (540) Adjustments to Reconcile Operating Income to Cash Flows from Operating Activities:
Depreciation Expense 33,132 33,132 - - Miscellaneous Non-Operating Income 839 839 - - Changes in Assets and Liabilities:
(Increase) Decrease in Accounts Receivable (273) (273) - - (Increase) Decrease in Inventory (25) (25) - -
(Increase) Decrease in Other Current Assets (6,067) (6,067) - - Increase (Decrease) in Vouchers Payable and Accrued Liabilities (757) 3,725 (4,482) - Increase (Decrease) in Other Current Liabilities 776 776 - - Net Adjustments 27,625 32,107 (4,482) -
Net Cash Provided by (Used for) Operating Activities 44,816$ 50,222$ (4,482)$ (540)$
(in thousands)(Unaudited)
COMBINING STATEMENT OF CASH FLOWSSeptember 30, 2006

SUPPLEMENTARY INFORMATION
AVIATION DEPARTMENT - FY 2006 ANNUAL FINANCIAL REPORT II - 7
Facilities Passenger Improvement & Restricted Facility
Improvement Development Discretionary Asset Charges ConstructionAccount Account Account Account Account Account
-$ -$ -$ -$ -$ -$ (118) (251) - - - (15)
- - - - - - (118) (251) - - - (15)
- - - - - - 402 3,342 755 - 707
- - - - (24,967) - 402 3,342 755 - (24,967) 707
- - - - - - - (249) (9,152) - (555) - (37,956)
- - - - - - - - - - - - - - - - - - - - - - - 4,591 - - - - - 42,175 -
(249) (9,152) - (555) 42,175 (33,365)
- - - - - - (916,002) - - - - - - 799,217 - 844 - 47 3,748 9,250 - 844 - 47 3,748 (107,535)
35 (5,217) 755 (508) 20,956 (140,208) 2,306 16,489 10,478 1,664 68,494 172,778 2,341 11,272 11,233 1,156 89,450 32,570
- - - - - - - - - - - 28,500 - - - - - 28,500
(118) (251) - - - (15)
- - - - - - - - - - - -
- - - - - - - - - - - - - - - - - - - - - - - - - - - - - - - - - - - -
(118)$ (251)$ -$ -$ -$ (15)$

SUPPLEMENTARY INFORMATION
AVIATION DEPARTMENT - FY 2006 ANNUAL FINANCIAL REPORT II - 8
FiscalYear Principal Interest Total2007 34,245,000 44,599,166 78,844,166 2008 35,875,000 42,845,076 78,720,076 2009 37,540,000 41,485,493 79,025,493
2010 57,910,000 39,794,943 97,704,943 2011 43,500,000 37,657,808 81,157,808 2012 46,065,000 35,449,646 81,514,646 2013 48,205,000 33,000,559 81,205,559 2014 17,990,000 30,709,588 48,699,588
2015 28,715,000 28,856,207 57,571,207 2016 30,615,000 27,186,457 57,801,457 2017 32,335,000 25,277,709 57,612,709 2018 33,980,000 25,477,828 59,457,828 2019 36,135,000 21,144,564 57,279,564
2020 37,995,000 19,040,443 57,035,443 2021 40,315,000 16,836,340 57,151,340 2022 42,430,000 14,483,782 56,913,782 2023 44,980,000 12,141,469 57,121,469 2024 47,245,000 9,944,608 57,189,608
2025 36,050,000 8,012,818 44,062,818 2026 38,005,000 6,197,010 44,202,010 2027 62,465,000 3,869,187 66,334,187 2028 18,250,000 2,125,886 20,375,886 2029 17,125,000 1,335,165 18,460,165
2030 - 450,873 450,873
Total 867,970,000$ 527,922,625$ 1,395,892,625$
SCHEDULE OF DEBT SERVICE REQUIREM ENTS TO M ATURITY - TOTALSeptember 30, 2006
(Unaudited)

SUPPLEMENTARY INFORMATION
AVIATION DEPARTMENT - FY 2006 ANNUAL FINANCIAL REPORT II - 9
Fiscal 1998 Series E Revenue Bonds 1998 Series F Revenue BondsYear Principal Interest Coupon Principal Interest Coupon2007 - 3,990,006 900,000 219,213 4.50%2008 - 3,990,006 940,000 177,813 4.50%2009 - 3,990,006 985,000 134,500 4.50%
2010 440,000 3,979,556 4.75% 2,365,000 56,169 4.75%2011 17,365,000 3,513,275 5.25% - - 2012 18,275,000 2,577,725 5.25% - - 2013 19,235,000 1,593,088 5.25% - - 2014 20,245,000 544,084 5.38% - -
2015 - - - - 2016 - - - - 2017 - - - - 2018 - - - - 2019 - - - -
2020 - - - - 2021 - - - - 2022 - - - - 2023 - - - - 2024 - - - -
2025 - - - - 2026 - - - - 2027 - - - - 2028 - - - - 2029 - - - -
2030 - - - -
Total 75,560,000$ 24,177,747$ 5,190,000$ 587,694$
SCHEDULE OF DEBT SERVICE TO MATURITY BY SERIESSeptember 30, 2006
(Unaudited)

SUPPLEMENTARY INFORMATION
AVIATION DEPARTMENT - FY 2006 ANNUAL FINANCIAL REPORT II - 10
Fiscal 1998 Series G Revenue Bonds 1998 Series H-1 PFC/ Revenue BondsYear Principal Interest Coupon Principal Interest Coupon2007 1,710,000 2,618,885 4.10% 3,925,000 2,179,538 5.00%2008 1,780,000 2,547,118 4.13% 4,120,000 1,978,413 5.00%2009 1,850,000 2,471,555 4.20% 4,325,000 1,767,288 5.00%
2010 3,955,000 2,347,673 4.30% 4,540,000 1,539,988 5.25%2011 4,115,000 2,172,110 4.40% 4,780,000 1,295,338 5.25%2012 4,300,000 1,984,830 4.50% 5,030,000 1,037,825 5.25%2013 4,490,000 1,784,810 4.60% 5,295,000 766,794 5.25%2014 - 1,681,540 1,150,000 601,206 4.63%
2015 2,680,000 1,617,220 4.80% 5,625,000 426,956 5.25%2016 2,810,000 1,481,034 4.90% 5,320,000 139,650 5.25%2017 2,950,000 1,333,575 5.13% - - 2018 3,105,000 1,178,416 5.13% - - 2019 3,260,000 1,021,425 4.75% - -
2020 3,415,000 858,625 5.00% - - 2021 3,590,000 683,500 5.00% - - 2022 3,765,000 499,625 5.00% - - 2023 3,955,000 306,625 5.00% - - 2024 4,155,000 103,875 5.00% - -
2025 - - - - 2026 - - - - 2027 - - - - 2028 - - - - 2029 - - - -
2030 - - - -
Total 55,885,000$ 26,692,440$ 44,110,000$ 11,732,994$
SCHEDULE OF DEBT SERVICE TO MATURITY BY SERIESSeptember 30, 2006
(Unaudited)

SUPPLEMENTARY INFORMATION
AVIATION DEPARTMENT - FY 2006 ANNUAL FINANCIAL REPORT II - 11
SCHEDULE OF DEBT SERVICE TO MATURITY BY SERIESSeptember 30, 2006
(Unaudited)
Fiscal 1998 Series H-2 PFC/ Revenue Bonds 2001 Series I PFC/ Revenue BondsYear Principal Interest Coupon Principal Interest Coupon2007 - 2,923,710 890,000 2,055,562 5.00%2008 - 2,923,710 935,000 2,008,769 5.25%2009 - 2,923,710 985,000 1,958,369 5.25%
2010 - 2,923,710 1,035,000 1,905,343 5.25%2011 - 2,923,710 1,090,000 1,849,563 5.25%2012 - 2,923,710 1,150,000 1,790,762 5.25%2013 - 2,923,710 1,210,000 1,725,788 5.75%2014 - 2,923,710 1,530,000 1,647,012 5.75%
2015 - 2,923,710 1,620,000 1,556,450 5.75%2016 605,000 2,909,493 4.70% 1,710,000 1,460,713 5.75%2017 6,230,000 2,736,038 5.13% & 4.80% 1,805,000 1,359,656 5.75%2018 6,550,000 2,408,956 5.13% 1,915,000 1,252,707 5.75%2019 6,885,000 2,065,331 5.13% & 4.90% 2,020,000 1,139,575 5.75%
2020 7,235,000 1,717,719 4.75% 2,140,000 1,025,325 5.25%2021 7,580,000 1,365,863 4.75% 2,250,000 910,087 5.25%2022 7,940,000 997,263 4.75% 2,365,000 788,944 5.25%2023 8,315,000 611,206 4.75% 2,495,000 661,369 5.25%2024 8,710,000 206,863 4.75% 2,625,000 526,969 5.25%
2025 - - 2,760,000 385,613 5.25%2026 - - 2,905,000 236,906 5.25%2027 - - 3,060,000 80,325 5.25%2028 - - - - 2029 - - - -
2030 - - - -
Total 60,050,000$ 41,332,120$ 38,495,000$ 26,325,807$

SUPPLEMENTARY INFORMATION
AVIATION DEPARTMENT - FY 2006 ANNUAL FINANCIAL REPORT II - 12
Fiscal 2001 Series J-1 Revenue Bonds 2001 Series J-2 Revenue BondsYear Principal Interest Coupon Principal Interest Coupon2007 - 7,194,350 5,020,000 9,733,610 5.97%2008 - 7,194,350 5,320,000 9,420,705 6.13%2009 - 7,194,350 5,645,000 9,079,830 6.30%
2010 1,205,000 7,162,718 5.25% 6,880,000 8,681,852 6.40%2011 1,270,000 7,097,750 5.25% 7,320,000 8,223,792 6.50%2012 1,330,000 7,029,501 5.25% 7,800,000 7,731,222 6.53%2013 1,405,000 6,954,193 5.75% 8,305,000 7,202,902 6.59%2014 1,090,000 6,882,462 5.75% 6,350,000 6,717,797 6.66%
2015 1,550,000 6,806,563 5.75% 9,275,000 6,193,312 6.75%2016 1,635,000 6,714,994 5.75% 9,905,000 5,543,510 6.80%2017 1,735,000 6,618,106 5.75% 10,575,000 4,841,902 6.90%2018 1,830,000 6,515,613 5.75% 11,305,000 4,087,043 6.90%2019 1,940,000 6,407,225 5.75% 12,085,000 3,280,087 6.90%
2020 2,050,000 6,297,637 5.75% 12,920,000 2,417,415 6.90%2021 2,155,000 6,187,256 5.75% 13,810,000 1,495,230 6.90%2022 2,270,000 6,071,100 5.25% 14,765,000 509,393 6.90%2023 18,170,000 5,534,550 5.25% - - 2024 19,125,000 4,555,556 5.25% - -
2025 20,130,000 3,525,113 5.25% - - 2026 21,185,000 2,440,594 5.25% - - 2027 35,895,000 942,244 5.25% - - 2028 - - - - 2029 - - - -
2030 - - - -
Total 135,970,000$ 125,326,225$ 147,280,000$ 95,159,602$
September 30, 2006(Unaudited)
SCHEDULE OF DEBT SERVICE TO MATURITY BY SERIES

SUPPLEMENTARY INFORMATION
AVIATION DEPARTMENT - FY 2006 ANNUAL FINANCIAL REPORT II - 13
Fiscal 2003 Series K Revenue Bonds 2005 Series L Revenue BondsYear Principal Interest Coupon Principal Interest Coupon2007 15,745,000 2,084,878 5.00% & 2.00% 4,280,000 7,781,775 3.00%2008 16,520,000 1,385,052 5.00% & 2.00% 4,495,000 7,562,400 3.00%2009 17,145,000 806,971 4.00% & 2.25% 4,715,000 7,332,150 3.00% & 5.00%
2010 13,870,000 272,045 4.00% & 2.60% 4,955,000 7,090,400 3.00% & 4.25%2011 - - 5,200,000 6,836,524 3.125% & 5.00%2012 - - 5,460,000 6,570,025 3.30% & 5.00%2013 - - 5,735,000 6,290,150 3.50% & 5.00%2014 - - 6,020,000 5,996,275 3.60% & 5.00%
2015 - - 6,320,000 5,687,775 3.625% & 5.00%2016 - - 6,640,000 5,363,775 5.00%2017 - - 6,970,000 5,023,525 5.00%2018 - - 7,320,000 4,666,275 5.00%2019 - - 7,685,000 4,291,150 4.00% & 5.00%
2020 - - 8,070,000 3,897,275 5.00%2021 - - 8,470,000 3,483,775 5.00%2022 - - 8,895,000 3,049,650 5.00%2023 - - 9,340,000 2,593,775 5.00%2024 - - 9,805,000 2,115,150 4.30%
2025 - - 10,300,000 1,612,525 5.00%2026 - - 10,810,000 1,071,263 4.50%2027 - - 11,380,000 488,775 4.60%2028 - - 3,620,000 95,025 4.60%2029 - - - -
2030 - - - -
Total 63,280,000$ 4,548,946$ 156,485,000$ 98,899,412$
SCHEDULE OF DEBT SERVICE TO MATURITY BY SERIESSeptember 30, 2006
(Unaudited)

SUPPLEMENTARY INFORMATION
AVIATION DEPARTMENT - FY 2006 ANNUAL FINANCIAL REPORT II - 14
Fiscal 2005 Series M Revenue BondsYear Principal Interest Coupon2007 1,725,000 5,502,875 Auction Rate2008 1,810,000 5,414,500 Auction Rate2009 1,900,000 5,316,750 Auction Rate
2010 1,995,000 5,219,375 Auction Rate2011 2,095,000 5,122,125 Auction Rate2012 2,200,000 5,014,750 Auction Rate2013 2,310,000 4,902,000 Auction Rate2014 2,430,000 4,783,500 Auction Rate
2015 2,550,000 4,659,000 Auction Rate2016 2,675,000 4,528,375 Auction Rate2017 2,810,000 4,391,250 Auction Rate2018 2,950,000 4,247,250 Auction Rate2019 3,100,000 4,096,000 Auction Rate
2020 3,255,000 3,937,125 Auction Rate2021 3,415,000 3,770,375 Auction Rate2022 3,585,000 3,595,375 Auction Rate2023 3,765,000 3,411,625 Auction Rate2024 3,955,000 3,218,625 Auction Rate
2025 4,150,000 3,016,000 Auction Rate2026 4,360,000 2,803,250 Auction Rate2027 4,575,000 2,579,875 Auction Rate2028 13,165,000 2,136,375 Auction Rate2029 17,630,000 1,366,500 Auction Rate
2030 18,515,000 462,875 Auction Rate
Total 110,920,000$ 93,495,750$
SCHEDULE OF DEBT SERVICE TO MATURITY BY SERIESSeptember 30, 2006
(Unaudited)

SUPPLEMENTARY INFORMATION
AVIATION DEPARTMENT - FY 2006 ANNUAL FINANCIAL REPORT II - 15
SCHEDULE OF DEPOSITS TO AND WITHDRAWALS FROM SPECIAL FUNDS AND ACCOUNTSCREATED BY AIRPORT BOND RESOLUTIONS AND THE AIRLINE-AIRPORT LEASE & USE AGREEMENT
For The Twelve Months Ended September 30, 2006(in thousands)(Unaudited)
Balances Balances Oct. 1, 2005 Deposits Withdrawals Sept. 30, 2006Restricted Accounts/Funds Bond Debt Service Accounts/Funds: Series E and F Principal and Interest 3,039$ $5,200 5,108$ 3,131$ Series G Principal and Interest 3,052 4,432 4,327 3,157 Series H Principal and Interest 6,543 9,284 9,034 6,793 Series I Principal and Interest 1,939 3,010 2,949 2,000 Series J Principal and Interest 10,602 22,412 19,038 13,976 Series K Principal and Interest 12,884 18,625 13,920 17,589 Series L Principal and Interest 6,616 10,982 10,044 7,554 Series M1 & M2 Principal and Interest 1,775 5,530 4,962 2,343 Bond Reserves 47,619 2,534 0 50,153 Total Bond Debt Service Accounts/Funds 94,069 82,009 69,382 106,696
Capital Construction Accounts/Funds: Construction Funds 219,520 41,609 66,528 194,601 Renewal and Replacement 20,912 7,820 4,920 23,812 Discretionary 11,858 754 1 12,611 Facilities Improvements and Development 28,255 8,386 10,639 26,002 Restricted Assets-North Perry 1,271 389 575 1,085 Improvements 2,852 438 367 2,923 Passenger Facilities Charges 75,362 45,923 24,967 96,318 Total Capital Construction Accounts/Funds 360,030 105,319 107,997 357,352
Airline Fees and Charges Sub-Account 27,921 23,438 27,921 23,438
Total Restricted Accounts/Funds 482,020$ 210,766$ 205,300$ 487,486$
Restricted Account Balances: Cash and Cash Equivalents 324,846 247,264 Investments 157,174 240,222
Total Restricted Accounts/Funds (As Above) 482,020 487,486
Revenue Account 48,526 196,635 202,929 42,232
Total Cash, Cash Equivalents and Investments 530,546$ 407,401$ 408,229$ 529,718$
Note:All ending balances include accrued interest

SUPPLEMENTARY INFORMATION
AVIATION DEPARTMENT - FY 2006 ANNUAL FINANCIAL REPORT II - 16
AIRPORT SYSTEM REVENUE BONDS - DEBT SERVICE COVERAGEFor The Twelve Months Ended September 30, 2006
(in thousands)(Unaudited)
Amount Available for Debt Service: Revenues 160,126$
Plus: Transfer from Airline Fees and Charges Sub-Account & Rate Stabilization 27,921 188,047$
Less: Operation and Maintenance Expenses (109,803)
Amount Available for Debt Service (A) 78,244$
Total ASR Debt Service (1):
Principal Interest TotalSeries E - 3,990 3,990 Series F 900 239 1,139 Series G 1,710 2,654 4,364 Series J 1,905 17,133 19,038 Series K 15,745 2,470 18,215 Series L 4,205 6,324 10,529 Series M2 1,425 3,970 5,395 ASR Debt Service 25,890$ 36,780$ 62,670$
Transfer from PFC Capital Improvement Fund (12,108)$
Total ASR Debt Service (B) 50,562$
ASR Actual Debt Service Coverage (A)/(B) 155%
ASR Required Debt Service Coverage (2) 125%
(1) Represents annual bond year debt service requirement.(2) Per Section 704 of the Bond Resolution.

SUPPLEMENTARY INFORMATION
AVIATION DEPARTMENT - FY 2006 ANNUAL FINANCIAL REPORT II - 17
Source:PFC Authority: Existing PFC Authority 498,882$ (a) Additional future PFC Authority - Total PFC Authority [A] 498,882
Expenditures and Committed Amounts: Amount spent on pay-as-you-go projects 1,713 (b) Committed for pay-as-you-go projects - (c) Series 1998H Convertible Lien Bond debt service 9,126 (d) Series 2001I Convertible Lien Bond debt service 2,968 (e) Series 2004L Airport System Revenue Bonds 10,529 Series 2004M Airport System Revenue Bonds 631 Total Expenditures and Committed Amounts: [B] 24,967 (f)
Previous Cummulative Outflow [B] 160,918
Unspent PFC Authority [A]-[B]=[C] 312,997$
Projected Aggregate Principal and Interest Requirements [D] 72,559$ (g)
Sufficiency Test [C] / [D] 4.31
Sufficiency Covenant requirement 1.05
Sources:(a) Latest Record of Decision from FAA - Authority to Collect. (b) PFC Reimbursement for Pay-go Approved Projects(c) Remaining encumbrances in PFC Projects at 9/30/06(d) Official Statement - Annual Debt Service Requirement payable from PFC Revenue(e) Official Statement - Annual Debt Service Requirement payable from PFC Revenue(f) Project-to-date PFC expenses + committed Pay-go encumbrances
(in thousands)(unaudited)
For The Twelve Months Ended September 30, 2006CONVERTIBLE LIEN BOND - SUFFICIENCY TEST
PASSENGER FACILITY CHARGE

AVIATION DEPARTMENT


STATISTICS
AVIATION DEPARTMENT - FY 2006 ANNUAL FINANCIAL REPORT III - 1
Fiscal Domestic InternationalYear Passengers Passengers Number % Change1997 5,410,183 678,059 6,088,242 -1998 5,551,979 618,687 6,170,666 1.4%1999 6,134,318 682,400 6,816,718 10.5%2000 6,919,181 718,961 7,638,142 12.1%2001 7,772,569 738,225 8,510,794 11.4%2002 7,606,900 592,716 8,199,616 -3.7%2003 8,099,727 630,437 8,730,164 6.5%2004 9,243,020 794,479 10,037,499 15.0%2005 10,303,438 1,063,553 11,366,991 13.3%2006 9,503,386 1,177,350 10,680,736 -6.0%
Enplaned Passengers
ANNUAL ENPLANED PASSENGERSFiscal Years Ended September 30, 1997 to 2006
0
2,000,000
4,000,000
6,000,000
8,000,000
10,000,000
12,000,000
1997 1998 1999 2000 2001 2002 2003 2004 2005 2006
ANNUAL ENPLANED PASSENGERSTen Year Analysis
Enplaned Passengers

STATISTICS
AVIATION DEPARTMENT - FY 2006 ANNUAL FINANCIAL REPORT III - 2
FiscalYear 1,000 lbs % Change 1,000 lbs % Change 1,000 lbs % Change
1997 7,579,431 933,714 8,513,1451998 7,791,520 2.8% 857,004 -8.2% 8,648,524 1.6%1999 8,620,046 10.6% 981,255 14.5% 9,601,301 11.0%2000 9,580,891 11.2% 1,164,694 18.7% 10,745,585 11.9%2001 10,521,348 9.8% 1,038,463 -10.8% 11,559,811 7.6%2002 10,392,454 -1.2% 768,754 -26.0% 11,161,208 -3.5%2003 11,034,689 6.2% 906,237 17.9% 11,940,926 7.0%2004 12,120,248 9.8% 1,155,553 27.5% 13,275,801 11.2%2005 13,419,416 10.7% 1,450,678 25.5% 14,870,094 12.0%2006 12,368,567 -7.8% 1,659,626 14.4% 14,028,193 -5.7%
Fiscal Years Ended September 30, 1997 to 2006
International
LANDED WEIGHTS
Domestic Total
0
2,000,000
4,000,000
6,000,000
8,000,000
10,000,000
12,000,000
14,000,000
1997 1998 1999 2000 2001 2002 2003 2004 2005 2006
LANDED WEIGHTSTen Year Analysis
Domestic Landed Weights International Landed Weights

STATISTICS
AVIATION DEPARTMENT - FY 2006 ANNUAL FINANCIAL REPORT III - 3
Fiscal Annual %Year Domestic International Total Change
1997 129,512 25,528 155,040 -1998 130,252 28,394 158,646 2.33%1999 133,402 33,726 167,128 5.35%2000 148,238 36,636 184,874 10.62%2001 160,052 38,812 198,864 7.57%2002 151,622 34,689 186,311 -6.31%2003 158,414 37,755 196,169 5.29%2004 168,474 40,210 208,684 6.38%2005 200,555 45,301 245,856 17.81%2006 183,882 46,905 230,787 -6.13%
AIRCRAFT OPERATIONSFiscal Years Ended September 30, 1997 to 2006
0
50,000
100,000
150,000
200,000
250,000
1997 1998 1999 2000 2001 2002 2003 2004 2005 2006
AIRCRAFT OPERATIONSTen Year Analysis
Domestic International
Domestic and international aircraft movements have increased 41.98% and 83.74%, respectively, between FY '97 and FY '06.
The increase in both international and domestic operations between 2003 to 2005 is attributable to the expansion of service by Delta (Song), jetBlue, Southwest Airlines, Spirit Airlines, and US Airways.

STATISTICS
AVIATION DEPARTMENT - FY 2006 ANNUAL FINANCIAL REPORT III - 4
Fiscal Annual %Year U.S. Mail Air Freight Total Change
1997 15,260 164,494 179,754 -1998 23,168 178,835 202,003 12.38%1999 26,593 203,117 229,710 13.72%2000 30,457 246,715 277,172 20.66%2001 23,511 191,439 214,950 -22.45%2002 12,596 167,970 180,566 -16.00%2003 12,065 161,187 173,252 -4.05%2004 13,330 165,882 179,212 3.44%2005 11,922 167,237 179,159 -0.03%2006 10,853 154,333 165,186 -7.80%
AIR CARGO ACTIVITYFiscal Years Ended September 30, 1997 to 2006
0
50,000
100,000
150,000
200,000
250,000
1997 1998 1999 2000 2001 2002 2003 2004 2005 2006
AIR CARGO ACTIVITYTen Year Analysis
U.S. Mail Air Freight
Since 1996, U.S. Mail and Air Freight activity has decreased 28.88% and 6.18%, respectively. The decrease is tied to the cessation of Amerijet and technology facilitating the transmission of electronic documents and messages via the internet.

STATISTICS
AVIATION DEPARTMENT - FY 2006 ANNUAL FINANCIAL REPORT III - 5
Fiscal Landing FeesYear Per 1,000 lbs. % Change1997 $0.90 -1998 $0.94 4.0%1999 $0.88 -6.0%2000 $0.96 8.0%2001 $0.96 0.0%2002 $0.99 3.0%2003 $1.01 2.0%2004 $0.97 -4.0%2005 $0.95 -2.0%2006 $0.95 0.0%
Fiscal Years Ended September 30, 1997 to 2006LANDING FEES
$0.90
$0.94
$0.88
$0.96 $0.96$0.99
$1.01
$0.97$0.95 $0.95
$0.80
$0.85
$0.90
$0.95
$1.00
$1.05
1997 1998 1999 2000 2001 2002 2003 2004 2005 2006
LANDING FEESTen Year Analysis
Landing Fees per 1,000 lbs.

STATISTICS
AVIATION DEPARTMENT - FY 2006 ANNUAL FINANCIAL REPORT III - 6
Fiscal Rentable Annual Average Terminal AnnualYear Square Feet % Change Rent Per Square Feet % Change1997 329,717 - $21.96 -1998 329,717 0.0% $22.44 2.2%1999 329,717 0.0% $20.96 -6.6%2000 443,217 34.4% $29.24 39.5%2001 532,882 20.2% $29.24 0.0%2002 583,674 9.5% $26.28 -10.1%2003 637,643 9.2% $29.49 12.2%2004 626,524 -1.7% $29.49 0.0%2005 626,524 0.0% $29.14 -1.2%2006 640,785 2.3% $29.29 0.5%
AVERAGE TERMINAL RENTFiscal Years Ended September 30, 1997 to 2006
$21.96 $22.44$20.96
$29.24$29.24$26.28
$29.49$29.49$29.14 $29.29
$0.00
$5.00
$10.00
$15.00
$20.00
$25.00
$30.00
1997 1998 1999 2000 2001 2002 2003 2004 2005 2006
AVERAGE TERMINAL RENTTen Year Analysis
Avg. Terminal Rent per Square Foot

STATISTICS
AVIATION DEPARTMENT - FY 2006 ANNUAL FINANCIAL REPORT III - 7
.
1996-97 1997-98 1998-99 1999-00 2000-01 2001-02 2002-03 2003-04 2004-05 2005-06AIRFIELD CHARGES/AVIATION FEES Terminal Rent & Airfield Charges $15,188 $15,132 $15,723 $18,802 $19,754 $22,129 $24,801 $27,575 $29,848 $30,261 Landing Fees (excluding Cargo Fees) 7,024 7,494 7,607 8,842 10,090 10,173 11,198 11,931 13,212 12,532 Security Fees 888 855 1,072 1,126 1,258 1,225 1,028 1,192 1,341 1,269
TOTAL AIRLINE REVENUES (w/o Carg $23,100 $23,481 $24,402 $28,770 $31,102 $33,527 $37,027 $40,698 $44,401 $44,061
Cargo Landing Fees 616 772 847 1,204 947 837 810 732 715 740
TOTAL AIRLINE REVENUES (w/ Cargo $23,716 $24,253 $25,249 $29,974 $32,049 $34,364 $37,837 $41,430 $45,116 $44,801
PASSENGER ENPLANEMENTS 6,088,242 6,170,666 6,816,718 7,638,142 8,510,794 8,199,616 8,730,164 10,037,499 11,366,991 10,680,736
Total Cost w/o Cargo Landing Fees per EPAX $3.79 $3.81 $3.58 $3.77 $3.65 $4.09 $4.24 $4.05 $3.92 $4.14
Total Cost w/ Cargo Landing Fees per EPAX $3.90 $3.93 $3.70 $3.92 $3.77 $4.19 $4.33 $4.13 $3.97 $4.19
FORT LAUDERDALE - HOLLYWOOD INTERNATIONAL AIRPORTAIRLINE COST PER ENPLANED PASSENGER
Fiscal Years Ended September 30, 1997 to 2006
$-
$0.50
$1.00
$1.50
$2.00
$2.50
$3.00
$3.50
$4.00
$4.50
1996-97
1997-98
1998-99
1999-00
2000-01
2001-02
2002-03
2003-04
2004-05
2005-06
AIRLINE COST PER ENPLANED PASSENGER
Cost w/o Cargo Per EPAX Cost w/ Cargo Per EPAX

STATISTICS
AVIATION DEPARTMENT - FY 2006 ANNUAL FINANCIAL REPORT III - 8
Fiscal Total Concession RevenueYear Amount % Change Number % Change Amount % Change
1997 $17,745,000 - 6,088,242 - $2.91 -1998 $21,642,000 22.0% 6,170,666 1.4% $3.51 20.6%1999 $21,796,000 0.7% 6,816,718 10.5% $3.20 -8.8%2000 $25,072,000 15.0% 7,638,142 12.1% $3.28 2.5%2001 $32,660,000 30.3% 8,510,794 11.4% $3.84 17.1%2002 $32,074,000 -1.8% 8,199,616 -3.7% $3.91 1.8%2003 $32,241,000 0.5% 8,730,164 6.5% $3.69 -5.6%2004 $35,928,000 11.4% 10,037,499 15.0% $3.58 -3.0%2005 $38,300,000 6.6% 11,366,991 13.3% $3.37 -5.9%2006 $37,064,000 -3.2% 10,680,736 -6.0% $3.47 3.0%
Enplaned Passenger (EPAX) Revenue per EPAX
Fiscal Years Ended September 30, 1997 to 2006TOTAL CONCESSION REVENUE PER ENPLANED PASSENGER
$2.91
$3.51$3.20 $3.28
$3.84 $3.91$3.69 $3.58 $3.37
$3.47
$0.00
$1.00
$2.00
$3.00
$4.00
1997 1998 1999 2000 2001 2002 2003 2004 2005 2006
TOTAL CONCESSION REVENUEPER ENPLANED PASSENGER
Ten Year Analysis
Concession Revenue per EPAX
Total concession revenue primarily consist of food and beverage, news and gifts, and rental car concessions described in the following pages. Other concession revenues include telephone, advertising, insurance and aircraft services.
The percentage change between total concession revenue and the number of enplaned passengers moves in the same direction from FY 1997 to FY 2005. The major differences, as displayed in the revenue per enplaned passenger, in (a) FY 1998 and FY 1999 are noted for news and gift revenues and (b) FY 2001 and FY 2003 are noted for rental car revenue in the following pages. Also, EPAX increased due to increase international routes from US Airways and Spirit Airlines.

STATISTICS
AVIATION DEPARTMENT - FY 2006 ANNUAL FINANCIAL REPORT III - 9
Fiscal Food and Beverage RevenueYear Amount % Change Number % Change Amount % Change
1997 $3,751,000 - 6,088,242 - $0.62 -1998 $4,056,000 8.1% 6,170,666 1.4% $0.66 -1999 $4,534,000 11.8% 6,816,718 10.5% $0.67 1.5%2000 $5,435,000 19.9% 7,638,142 12.1% $0.71 6.0%2001 $5,212,000 -4.1% 8,510,794 11.4% $0.61 -14.1%2002 $5,000,000 -4.1% 8,199,616 -3.7% $0.61 0.0%2003 $5,119,000 2.4% 8,730,164 6.5% $0.59 -3.3%2004 $5,396,000 5.4% 10,037,499 15.0% $0.54 -8.5%2005 $6,139,000 13.8% 11,366,991 13.3% $0.54 0.0%2006 $6,265,000 2.1% 10,680,736 -6.0% $0.59 9.3%
Enplaned Passenger (EPAX) Revenue per EPAX
Fiscal Years Ended September 30, 1997 to 2006FOOD and BEVERAGE REVENUE PER ENPLANED PASSENGER
$0.62 $0.66 $0.67 $0.71$0.61 $0.61 $0.59
$0.54 $0.54 $0.59
$0.00$0.10$0.20$0.30$0.40$0.50$0.60$0.70$0.80
1997 1998 1999 2000 2001 2002 2003 2004 2005 2006
FOOD and BEVERAGE REVENUEPER ENPLANED PASSENGER
Ten Year Analysis
Food and Beverage Revenue per EPAX
In FY 2006, revenues increased minimally due to a decline in enplanements. In FY 2005, the 13.8% gain in revenues kept pace with the 13.3% increase in enplanements, thus yielding $.54 for the Revenue per EPAX.

STATISTICS
AVIATION DEPARTMENT - FY 2006 ANNUAL FINANCIAL REPORT III - 10
Fiscal News and Gifts RevenueYear Amount % Change Number % Change Amount % Change
1997 $2,186,000 - 6,088,242 - $0.36 -1998 $4,189,000 91.6% 6,170,666 1.4% $0.68 88.9%1999 $3,107,000 -25.8% 6,816,718 10.5% $0.46 -32.4%2000 $2,849,000 -8.3% 7,638,142 12.1% $0.37 -19.6%2001 $3,350,000 17.6% 8,510,794 11.4% $0.39 5.4%2002 $3,463,000 3.4% 8,199,616 -3.7% $0.42 7.7%2003 $3,596,000 3.8% 8,730,164 6.5% $0.41 -2.4%2004 $4,501,000 25.2% 10,037,499 15.0% $0.45 9.8%2005 $4,701,000 4.4% 11,366,991 13.3% $0.41 -8.9%2006 $4,578,000 -2.6% 10,680,736 -6.0% $0.43 4.9%
Enplaned Passenger (EPAX) Revenue per EPAX
Fiscal Years Ended September 30, 1997 to 2006NEWS and GIFTS REVENUE PER ENPLANED PASSENGER
$0.36
$0.68
$0.46
$0.37$0.39
$0.42 $0.41 $0.45$0.41 $0.43
$0.00$0.10$0.20$0.30$0.40$0.50$0.60$0.70
1997 1998 1999 2000 2001 2002 2003 2004 2005 2006
NEWS and GIFTS REVENUE PER ENPLANED PASSENGER
Ten Year Analysis
News & Gifts Revenue per EPAX
In FY 2006, the decline in enplaned passengers resulted in a decrease in news and gifts revenues. For FY 2004, the $.04 in Revenue per EPAX was reflective of the growth in enplaned passengers. The change in FY03 resulted from Concourse B opening January 2003, the contract percentage due from the concessionaire was lowered. During FY 2001 both the guaranteed minimum payment and the percentage fee charged to the concessionaire were increased. The increase of 91.6% in FY 1998 was attributed to collection of the remainder of guaranteed minimum payments totaling $1.8M, in arrears for FY 1994 to 1998.

STATISTICS
AVIATION DEPARTMENT - FY 2006 ANNUAL FINANCIAL REPORT III - 11
Fiscal Rental Car RevenueYear Amount % Change Number % Change Amount % Change
1997 $7,776,000 - 6,088,242 - $1.28 -1998 $8,681,000 11.6% 6,170,666 1.4% $1.41 10.2%1999 $9,194,000 5.9% 6,816,718 10.5% $1.35 -4.3%2000 $10,283,000 11.8% 7,638,142 12.1% $1.35 0.0%2001 $19,604,000 90.6% 8,510,794 11.4% $2.30 -2002 $19,396,000 -1.1% 8,199,616 -3.7% $2.37 3.0%2003 $19,057,000 -1.8% 8,730,164 6.5% $2.18 -8.0%2004 $21,458,000 12.6% 10,037,499 15.0% $2.14 -1.8%2005 $23,273,000 8.5% 11,366,991 13.3% $2.05 -4.2%2006 $22,035,000 -5.3% 10,680,736 -6.0% $2.06 0.5%
Enplaned Passenger (EPAX) Revenue per EPAX
Fiscal Years Ended September 30, 1997 to 2006RENTAL CAR REVENUE PER ENPLANED PASSENGER
$1.28 $1.41 $1.35 $1.35
$2.30 $2.37$2.18 $2.14 $2.05 $2.06
$0.00
$0.50
$1.00
$1.50
$2.00
$2.50
1997 1998 1999 2000 2001 2002 2003 2004 2005 2006
RENTAL CAR REVENUEPER ENPLANED PASSENGER
Ten Year Analysis
Rental Car Revenue per EPAX
In 2006 and 2005 rental car revenues moved in tandem with the growth in enplaned passengers. The minimal decrease was tied to both the increase in enplements and car rental rates. In FY 2003, the number of on-airport rental car agencies decreasing from 12 to 10 and reduced minimum guaranteed payments led to a decline in revenues. The car rental revenue increase of 90.6% in FY 2001 reflects an increase in the number of on-airport car rental companies, from 5 to 12. As a result, the $3.95 per transaction fee collected from the previous 7 off-airport car rental companies was re-negotiated to 10% of sales.

STATISTICS
AVIATION DEPARTMENT - FY 2006 ANNUAL FINANCIAL REPORT III - 12
FiscalYear Amount % Change Number % Change Amount % Change1997 $16,549,000 - 6,088,242 - $2.72 -1998 $16,528,000 -0.1% 6,170,666 1.4% $2.68 -1.5%1999 $19,062,000 15.3% 6,816,718 10.5% $2.80 4.5%2000 $25,538,000 34.0% 7,638,142 12.1% $3.34 19.3%2001 $28,694,000 12.4% 8,510,794 11.4% $3.37 0.9%2002 $24,699,000 -13.9% 8,199,616 -3.7% $3.01 -10.7%2003 $30,053,000 21.7% 8,730,164 6.5% $3.44 14.3%2004 $34,928,000 16.2% 10,037,499 15.0% $3.48 1.2%2005 $40,511,000 16.0% 11,366,991 13.3% $3.56 2.3%2006 $40,565,000 0.1% 10,680,736 -6.0% $3.80 6.7%
Parking Revenue Enplaned Passenger (EPAX) Revenue per EPAX
PARKING REVENUE PER ENPLANED PASSENGERFiscal Years Ended September 30, 1997 to 2006
$2.72 $2.68 $2.80$3.34 $3.37
$3.01$3.44 $3.48 $3.56 $3.80
$0.00$0.50$1.00$1.50$2.00$2.50$3.00$3.50$4.00
1997 1998 1999 2000 2001 2002 2003 2004 2005 2006
PARKING REVENUE PER ENPLANED PASSENGER
Ten Year Analysis
Parking Revenue per EPAX
In FY 2006, revenues remained relatively flat due to a decrease in EPAX of 6%. The growth in parking revenues from FY 2003 to FY 2005 occurred due to the increase in the number of passengers, a rate increase in FY 2003, and restoration of the valet service on May 1, 2003. The decline in Revenue per EPAX in FY 2002, is attributable to a reduced number of persons using "close in" parking due to restrictions following the events of September 11. For FY 2000, the increase in parking revenues was attributable to the new "Hibiscus" parking garage, which opened October 1, 1999. Note, the proportional increases between parking revenues and enplaned passengers.

STATISTICS
AVIATION DEPARTMENT - FY 2006 ANNUAL FINANCIAL REPORT III - 13
FiscalYear Amount % Change Number % Change Amount % Change
1997 $4,425,000 - 6,088,242 - $0.73 -1998 $4,974,000 12.4% 6,170,666 1.4% $0.81 11.0%1999 $4,608,000 -7.4% 6,816,718 10.5% $0.68 -16.1%2000 $6,207,000 34.7% 7,638,142 12.1% $0.81 19.1%2001 $6,790,000 9.4% 8,510,794 11.4% $0.80 -1.2%2002 $8,591,000 26.5% 8,199,616 -3.7% $1.05 31.3%2003 $7,994,000 -7.0% 8,730,164 6.5% $0.92 -12.4%2004 $8,370,000 4.7% 10,037,499 15.0% $0.83 -9.8%2005 $8,121,000 -3.0% 11,366,991 13.3% $0.71 -14.5%2006 $8,253,000 1.6% 10,680,736 -6.0% $0.77 8.5%
Building & Ground Revenue Enplaned Passenger (EPAX) Revenue per EPAX
BUILDING & GROUND REVENUE PER ENPLANED PASSENGERFiscal Years Ended September 30, 1997 to 2006
$0.73$0.81
$0.68$0.81 $0.80
$1.05$0.92
$0.83
$0.71 $0.77
$0.00
$0.20
$0.40
$0.60
$0.80
$1.00
$1.20
1997 1998 1999 2000 2001 2002 2003 2004 2005 2006
BUILDING & GROUND REVENUEPER ENPLANED PASSENGER
Ten Year Analysis
Building & Ground Revenue per
In FY 2006, revenues increased minimally based on new appraisals in some of the leases.In FY 2005, revenues declined due the reallocation of Avis, Budget, Dollar, and National from off-airport location to the Rental Car Center. The FY 2004 decrease, $0.92 to $0.83, was as a result of a 4.7% revenue growth and in turn a 15% growth in enplaned passengers. During FY 2003 revenues declined by $600K, this was directly related to a non-recurring amount of $350K for advanced rent and lower interest (late) payment charges. The change in building and ground revenues between FY 2001 and FY 2002, mostly resulted from the implementation of late fee charges and market value increases in commercial rent and fuel service charges.
Note. The number of enplaned passengers does not affect the revenues generated.

STATISTICS
AVIATION DEPARTMENT - FY 2006 ANNUAL FINANCIAL REPORT III - 14
Fiscal LandingYear Fee Amount % Change Number % Change Amount % Change
1997 $0.95 $10,188,000 - 6,088,242 - $1.67 -1998 $0.90 $11,560,000 13.5% 6,170,666 1.4% $1.87 12.0%1999 $0.94 $11,259,000 -2.6% 6,816,718 10.5% $1.65 -11.8%2000 $0.88 $10,456,000 -7.1% 7,638,142 12.1% $1.37 -17.0%2001 $0.96 $12,206,000 16.7% 8,510,794 11.4% $1.43 4.4%2002 $0.96 $12,676,000 3.9% 8,199,616 -3.7% $1.55 8.4%2003 $0.99 $13,021,000 2.7% 8,730,164 6.5% $1.49 -3.9%2004 $1.01 $12,778,000 -1.9% 10,037,499 15.0% $1.27 -14.8%2005 $0.97 $13,800,000 8.0% 11,366,991 13.3% $1.21 -4.7%2006 $0.95 $13,741,000 -0.4% 10,680,736 -6.0% $1.29 6.6%
Airfield Revenue Enplaned Passengers (EPAX) Revenue per EPAX
AIRFIELD REVENUE PER ENPLANED PASSENGERFiscal Years Ended September 30, 1997 to 2006
$1.67$1.87
$1.65
$1.37 $1.43$1.55 $1.49
$1.27 $1.21 $1.29
$0.00$0.20$0.40$0.60$0.80$1.00$1.20$1.40$1.60$1.80$2.00
1997 1998 1999 2000 2001 2002 2003 2004 2005 2006
AIRFIELD REVENUEPER ENPLANED PASSENGER
Ten Year Analysis
Airfield Revenue per EPAX
Reduction in the landing fee from $1.01 to $.97 in FY 2004 (no change occurred for FY 2005) and growth in enplaned passengers led to the decline in Airfield Revenue per EPAX. Although, the landing fee increased from $.99 to $1.01 in FY 2003, Airfield Revenue per EPAX was flat. The increase in the FY 2002 revenues was attributable to the landing fee rate change from $0.96 to $0.99 and a decrease in the number of enplaned passengers. The change in airfield revenues (over $1.4 million) from FY 2000 to FY 2001 was as a result of an increase in the number of landings from 92,437 to 98,840.

STATISTICS
AVIATION DEPARTMENT - FY 2006 ANNUAL FINANCIAL REPORT III - 15
AverageFiscal Terminal Year Rental Rates Amount % Change Number % Change Amount % Change
1997 $21.28 $13,350,000 - 6,088,242 - $2.19 -1998 $21.96 $14,393,000 7.8% 6,170,666 1.4% $2.33 6.4%1999 $22.44 $14,216,000 -1.2% 6,816,718 10.5% $2.09 -10.3%2000 $20.96 $17,585,000 23.7% 7,638,142 12.1% $2.30 10.1%2001 $29.24 $20,022,000 13.9% 8,510,794 11.4% $2.35 2.2%2002 $29.24 $22,103,000 10.4% 8,199,616 -3.7% $2.70 14.9%2003 $26.28 $22,315,000 1.0% 8,730,164 6.5% $2.56 -5.2%2004 $29.49 $23,660,000 6.0% 10,037,499 15.0% $2.36 -7.8%2005 $29.49 $25,519,000 7.9% 11,366,991 13.3% $2.25 -4.7%2006 $29.29 $36,138,000 41.6% 10,680,736 -6.0% $3.38 50.2%
Terminal Rent Revenue Enplaned Passengers (EPAX) Revenue per EPAX
TERMINAL RENT REVENUE PER ENPLANED PASSENGERFiscal Years Ended September 30, 1997 to 2006
$2.19$2.33
$2.09 $2.30 $2.35$2.70 $2.56
$2.36 $2.25
$3.38
$0.00
$0.50
$1.00
$1.50
$2.00
$2.50
$3.00
$3.50
1997 1998 1999 2000 2001 2002 2003 2004 2005 2006
TERMINAL RENT REVENUEPER ENPLANED PASSENGER
Ten Year Analysis
Terminal Rent Revenue per EPAX
In FY 2006, revenue per EPAX increased due to a decline in EPAX. FY 2002 revenue increase reflects a full year's operation at Concourse C, even though a decrease in the number of enplaned passengers occurred. Terminal rent revenues increased in FY 2001 as a result of the new Terminal 1 - Concourse C, opened in May 2001, and Security revenues which were reclassed from the Other revenue category.

STATISTICS
AVIATION DEPARTMENT - FY 2006 ANNUAL FINANCIAL REPORT III - 16
FiscalYear Amount % Change Number % Change Amount % Change1997 $1,229,000 - 6,088,242 - $0.20 -1998 $1,364,000 11.0% 6,170,666 1.4% $0.22 10.0%1999 $1,765,000 29.4% 6,816,718 10.5% $0.26 18.2%2000 $1,785,000 1.1% 7,638,142 12.1% $0.23 -11.5%2001 $453,000 -74.6% 8,510,794 11.4% $0.05 -78.3%2002 $558,000 23.2% 8,199,616 -3.7% $0.07 40.0%2003 $1,052,000 88.5% 8,730,164 6.5% $0.12 71.4%2004 $754,000 -28.3% 10,037,499 15.0% $0.08 -33.3%2005 $1,770,000 134.8% 11,366,991 13.3% $0.16 100.0%2006 $804,000 -54.6% 10,680,736 -6.0% $0.08 -50.0%
Other Revenue Enplaned Passengers (EPAX) Revenue per EPAX
OTHER REVENUE PER ENPLANED PASSENGERFiscal Years Ended September 30, 1997 to 2006
$0.20$0.22
$0.26$0.23
$0.05$0.07
$0.12
$0.08
$0.16
$0.08
$0.00
$0.05
$0.10
$0.15
$0.20
$0.25
$0.30
1997 1998 1999 2000 2001 2002 2003 2004 2005 2006
OTHER REVENUEPER ENPLANED PASSENGER
Ten Year Analysis
Other Revenue per EPAX
In FY 2005 BCAD won a lawsuit settlement award of $725,000 which led to the significant precentage increase. The FY 2004 decrease revenues resulted from lower reimbursable Orange Alert related payroll expenses. During FY 2003, Other Revenue increased over $500,000 due to the reimbursement of Orange Alert expenses via the Liberty Shield Grant program. The revenue decrease in FY 2001 resulted from the reclassification of Security revenues to Other Terminal Fees under "Terminal Rent".

STATISTICS
AVIATION DEPARTMENT - FY 2006 ANNUAL FINANCIAL REPORT III - 17
FiscalYear Amount % Change Number % Change Amount % Change
1997 $12,098,000 - 6,088,242 - $1.99 -1998 $13,306,000 10.0% 6,170,666 1.4% $2.16 8.5%1999 $14,358,000 7.9% 6,816,718 10.5% $2.11 -2.3%2000 $15,498,000 7.9% 7,638,142 12.1% $2.03 -3.8%2001 $17,164,000 10.8% 8,510,794 11.4% $2.02 -0.5%2002 $18,214,000 6.1% 8,199,616 -3.7% $2.22 9.9%2003 $20,171,000 10.7% 8,730,164 6.5% $2.31 4.1%2004 $22,432,000 11.2% 10,037,499 15.0% $2.23 -3.5%2005 $22,634,000 0.9% 11,366,991 13.3% $1.99 -10.8%2006 $24,153,000 6.7% 10,680,736 -6.0% $2.26 13.6%
Personal Services Expenses Enplaned Passengers (EPAX) Expense per EPAX
PERSONAL SERVICES EXPENSE PER ENPLANED PASSENGERFiscal Years Ended September 30, 1997 to 2006
$1.99
$2.16$2.11
$2.03 $2.02
$2.22
$2.31
$2.23
$1.99
$2.26
$1.80
$1.90
$2.00
$2.10
$2.20
$2.30
$2.40
1997 1998 1999 2000 2001 2002 2003 2004 2005 2006
PERSONAL SERVICES PER ENPLANED PASSENGER
Personal Services Expense per EPAX
In FY 2006, the increase in personal services per EPAX was due to a decline in EPAX and filling vacation positions. In FY 2005 and FY 2004, the change from $2.23 to $1.99 was tied to the increase in enplaned passengers. The 4.1% increase in Personal Services per EPAX in FY 2003 was tied to vacant positions being filled, higher employee benefit cost, and annual wages increases. The increase per EPAX from FY 2001 to FY 2002 was as a result of a decrease in the number of passengers and an increase in the number of filled positions from 348 to 360

STATISTICS
AVIATION DEPARTMENT - FY 2006 ANNUAL FINANCIAL REPORT III - 18
FiscalYear Amount % Change Number % Change Amount % Change
1997 $18,441,000 - 6,088,242 - $3.03 -1998 $19,751,000 7.1% 6,170,666 1.4% $3.20 5.6%1999 $21,037,000 6.5% 6,816,718 10.5% $3.09 -3.4%2000 $23,106,000 9.8% 7,638,142 12.1% $3.03 -1.9%2001 $26,961,000 16.7% 8,510,794 11.4% $3.17 4.6%2002 $36,059,000 33.8% 8,199,616 -3.7% $4.40 38.8%2003 $37,149,000 3.0% 8,730,164 6.5% $4.26 -3.2%2004 $42,262,000 13.8% 10,037,499 15.0% $4.21 -1.2%2005 $55,028,000 30.2% 11,366,991 13.3% $4.84 15.0%2006 $65,169,000 18.4% 10,680,736 -6.0% $6.10 26.0%
Contractual Services Expense Enplaned Passengers (EPAX) Expense per EPAX
CONTRACTUAL SERVICES EXPENSE PER ENPLANED PASSENGERFiscal Years Ended September 30, 1997 to 2006
$3.03 $3.20 $3.09 $3.03 $3.17
$4.40 $4.26 $4.21
$4.84
$6.10
$0.00
$1.00
$2.00
$3.00
$4.00
$5.00
$6.00
$7.00
1997 1998 1999 2000 2001 2002 2003 2004 2005 2006
CONSTRACTUAL SERVICESPER ENPLANED PASSENGER
Ten Year Analysis
Contractual Services Expense per EPAX
In FY 2005, the 30% expenditure increase was mainly tied to BSO security services. Other contributing factors were the non-recurring Vision 2020 contract expenditure, new shuttle and janitorial service contracts, and a 6.5% rise in enplaned passengers.
The increase in Contractual Services per EPAX from FY 2001 to FY 2002 resulted from: 1) increased staffing at BSO security and AARF, $5.7M and $.5M, respectively, 2) increased janitorial services at the new terminal, for $.7M, 3) increased Vision 2020 contract expenses, $1.8M, and 4) increased shuttle service, $.9M.

STATISTICS
AVIATION DEPARTMENT - FY 2006 ANNUAL FINANCIAL REPORT III - 19
FiscalYear Amount % Change Number % Change Amount % Change
1997 $6,934,000 - 6,088,242 - $1.14 -1998 $7,359,000 6.1% 6,170,666 1.4% $1.19 4.4%1999 $7,935,000 7.8% 6,816,718 10.5% $1.16 -2.5%2000 $9,656,000 21.7% 7,638,142 12.1% $1.26 8.6%2001 $12,032,000 24.6% 8,510,794 11.4% $1.41 11.9%2002 $13,315,000 10.7% 8,199,616 -3.7% $1.62 14.9%2003 $15,981,000 20.0% 8,730,164 6.5% $1.83 13.0%2004 $15,965,000 -0.1% 10,037,499 15.0% $1.59 -13.1%2005 $18,501,000 15.9% 11,366,991 13.3% $1.63 2.5%2006 $20,481,000 10.7% 10,680,736 -6.0% $1.92 17.8%
Other Expense Enplaned Passengers (EPAX) Expense per EPAX
GENERAL OPERATING EXPENSE PER ENPLANED PASSENGERFiscal Years Ended September 30, 1997 to 2006
$1.14 $1.19 $1.16$1.26
$1.41$1.62
$1.83
$1.59 $1.63
$1.92
$0.00
$0.50
$1.00
$1.50
$2.00
1997 1998 1999 2000 2001 2002 2003 2004 2005 2006
GENERAL OPERATING EXPENSEPER ENPLANED PASSENGER
Ten Year Analysis
General Operating Expense per EPAX
The increase in FY 2005 reflects rate increases for both electricity and insurance. The decrease in the expense per EPAX was due the growth in enplaned passengers in FY 2004. The increase in expenses from FY 2000 to FY 2003 was due mainly to increases in insurance premiums, telephone and attorney charges. Additionally, Support Services, which encompasses legal, purchasing, information technology, human resources, and central finance and accounting, contributed to the change because of airport growth. Also, there was an increase in utilities per EPAX, tied directly to the operation of Terminal 1 in FY 2003, FY 2002 and FY 2001 (five months).

STATISTICS
AVIATION DEPARTMENT - FY 2006 ANNUAL FINANCIAL REPORT III - 20
Fiscal Number of Number of % of EnplanedYear Enplanements Paying PFC's Passengers PFC Revenue
1997 6,088,242 5,354,000 87.94% 15,634,0001998 6,170,666 5,912,000 95.81% 17,263,0001999 6,816,718 6,621,000 97.13% 19,334,0002000 7,638,142 6,986,000 91.46% 20,399,0002001 8,510,794 8,423,000 98.97% 24,596,0002002 8,199,616 7,257,000 88.50% 21,190,0002003 8,730,164 8,116,000 92.97% 23,699,0002004 10,037,499 9,455,000 94.20% 27,607,7552005 11,366,991 10,467,000 92.08% 30,564,9302006 10,680,736 14,444,000 135.23% 42,175,102
PASSENGER FACILITY CHARGESFiscal Years Ended September 30, 1997 to 2006
0
2,000,000
4,000,000
6,000,000
8,000,000
10,000,000
12,000,000
14,000,000
16,000,000
1997 1998 1999 2000 2001 2002 2003 2004 2005 2006
PASSENGER FACILITY CHARGE ANALYSISPassenger Activity
Enplanements Paying PFC's
PFC collections began January 1, 1995. In 1995, BCAD received PFC's from passengers during the period from January thru July, as a result of a 2 month lag in remittance. Passengers and Collections for FY1995 were for a partial year.
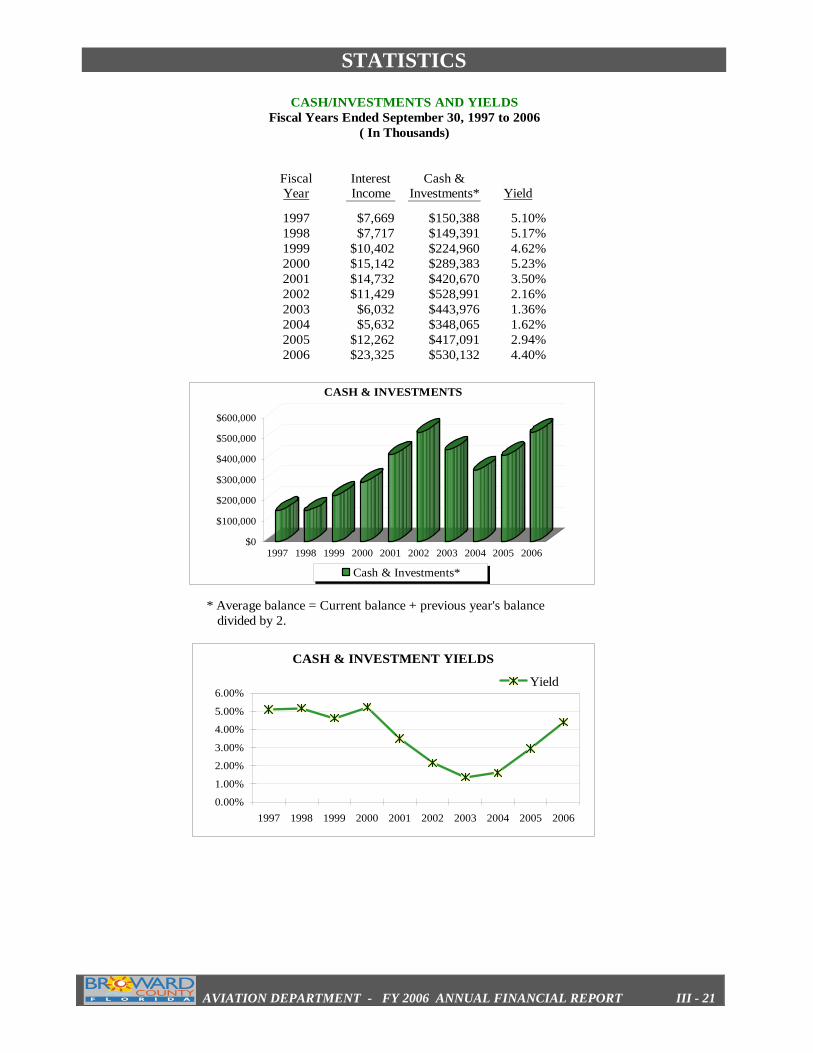
STATISTICS
AVIATION DEPARTMENT - FY 2006 ANNUAL FINANCIAL REPORT III - 21
Fiscal Interest Cash &Year Income Investments* Yield
1997 $7,669 $150,388 5.10%1998 $7,717 $149,391 5.17%1999 $10,402 $224,960 4.62%2000 $15,142 $289,383 5.23%2001 $14,732 $420,670 3.50%2002 $11,429 $528,991 2.16%2003 $6,032 $443,976 1.36%2004 $5,632 $348,065 1.62%2005 $12,262 $417,091 2.94%2006 $23,325 $530,132 4.40%
* Average balance = Current balance + previous year's balance divided by 2.
( In Thousands)Fiscal Years Ended September 30, 1997 to 2006
CASH/INVESTMENTS AND YIELDS
$0
$100,000
$200,000
$300,000
$400,000
$500,000
$600,000
1997 1998 1999 2000 2001 2002 2003 2004 2005 2006
CASH & INVESTMENTS
Cash & Investments*
CASH & INVESTMENT YIELDS
0.00%
1.00%
2.00%
3.00%
4.00%
5.00%
6.00%
1997 1998 1999 2000 2001 2002 2003 2004 2005 2006
Yield

STATISTICS
AVIATION DEPARTMENT - FY 2006 ANNUAL FINANCIAL REPORT III - 22
Fiscal Current CurrentYear Assets Liabilities Ratio
1997 $15,058 $7,253 2.081998 $19,427 $17,859 1.091999 $25,842 $23,873 1.082000 $24,724 $17,650 1.402001 $45,090 $15,392 2.932002 $45,582 $17,099 2.672003 $41,982 $14,464 2.902004 $41,374 $13,815 2.992005 $56,617 $18,748 3.022006 $51,338 $19,689 2.61
CURRENT LIQUIDITY RATIOFiscal Years Ended September 30, 1997 to 2006
(In Thousands)
$0
$10,000
$20,000
$30,000
$40,000
$50,000
$60,000
1997 1998 1999 2000 2001 2002 2003 2004 2005 2006
CURRENT LIQUIDITY RATIO
Current Assets Current Liabilities

STATISTICS
AVIATION DEPARTMENT - FY 2006 ANNUAL FINANCIAL REPORT III - 23
Fiscal Outstanding Capital Debt to Capital Enplaned Debt PerYear Debt Assets Asset Ratio Passengers EPAX
1997 $244,420 $474,415 0.52 6,088,242 $40.151998 $245,430 $518,289 0.47 6,170,666 $39.771999 $425,135 $599,559 0.71 6,816,718 $62.372000 $411,205 $687,134 0.60 7,638,142 $53.842001 $723,100 $805,329 0.90 8,510,794 $84.962002 $705,760 $909,608 0.78 8,199,616 $86.072003 $685,255 $1,036,904 0.66 8,730,164 $78.492004 $665,695 $1,154,459 0.58 10,037,499 $66.322005 $893,235 $1,213,536 0.74 11,366,991 $78.582006 $867,970 $1,229,143 0.71 10,680,736 $81.26
Fiscal Years Ended September 30, 1997 to 2006(In Thousands)
DEBT TO CAPITAL ASSET RATIO
$0
$200,000
$400,000
$600,000
$800,000
$1,000,000
$1,200,000
$1,400,000
1997 1998 1999 2000 2001 2002 2003 2004 2005 2006
DEBT TO CAPITAL ASSET RATIO
Outstanding Debt Capital Assets
$0.00
$20.00
$40.00
$60.00
$80.00
$100.00
1997 1998 1999 2000 2001 2002 2003 2004 2005 2006
DEBT PER ENPLANED PASSENGER

STATISTICS
AVIATION DEPARTMENT - FY 2006 ANNUAL FINANCIAL REPORT III - 24
AverageFiscal Principal Interest as Interest Principal Total Enplaned Debt ServiceYear Balance * % of Principal Payment Payment Debt Service Passengers Per EPAX
1997 $122,210 10.97% $13,412 $9,710 $23,122 6,088,242 $3.801998 $244,925 5.36% $13,120 $10,080 $23,200 6,170,666 $3.761999 $335,283 5.49% $18,420 $10,480 $28,900 6,816,718 $4.242000 $418,170 5.51% $23,022 $13,930 $36,952 7,638,142 $4.842001 $567,153 3.01% $17,067 $15,115 $32,182 8,510,794 $3.782002 $714,430 2.93% $20,917 $17,340 $38,257 8,199,616 $4.672003 $695,508 3.18% $22,088 $18,705 $40,793 8,730,164 $4.672004 $675,475 3.03% $20,469 $19,560 $40,029 10,037,499 $3.992005 $779,465 4.88% $38,015 $19,700 $57,715 11,366,991 $5.082006 $880,603 4.88% $42,942 $23,840 $66,782 10,680,736 $6.25
Fiscal Years Ended September 30, 1997 to 2006DEBT SERVICE PER ENPLANED PASSENGER
(In Thousands)
$0
$200,000
$400,000
$600,000
$800,000
$1,000,000
1997 1998 1999 2000 2001 2002 2003 2004 2005 2006
AVERAGE PRINCIPAL BALANCE
$0.00$1.00$2.00$3.00$4.00$5.00$6.00$7.00
1997 1998 1999 2000 2001 2002 2003 2004 2005 2006
DEBT SERVICE PER ENPLANED PASSENGER

STATISTICS
AVIATION DEPARTMENT - FY 2006 ANNUAL FINANCIAL REPORT III - 25
Domestic Airlines Regional/Commuter AirlinesAirTran Airways Air SunshineAmerica West Airlines American EagleAmerican Airlines (*) Cape AirATA Airlines1(*) Chalk's Ocean AirwaysContinental Airlines (*) Comair (Delta Connection)Delta Air Lines (*) Chautauqua (Delta Connection)Frontier Airlines Florida CoastaljetBlue Airlines (*) Gulfstream Int’l Airlines (*) (Continental Connection)Midwest Airlines Island ExpressNorthwest Airlines (*)Song Airlines Charter Passenger ServiceSouthwest Airlines (*) Air Columbus/KelownaSpirit Airlines (*) ChampionUnited Airlines/TED (*) Hooters AirUS Airways (*) Jetsgo2
USA 3000 Airlines Miami AirTravelspan
Foreign Flag Airlines SkyserviceAir Canada (*)Air Jamaica Cargo ServiceAir Transat ABX AirAvianca Air Transport Int’l d/b/a Burlington Air ExpressBahamasair Astar Air Cargo d/b/a DHLCanJet3 UPS-Supply Chain SolutionsCayman Airways Federal ExpressLaker Airways (Bahamas) Ltd Mountain Air CargoLynx Air International United Parcel ServiceUniversal
1 – Service to Fort Lauderdale-Hollywood discontinued as of April 20052 – Ceased operations as of March 20053 – Began service to Fort Lauderdale-Hollywood in January 20054 – Service to Fort Lauderdale-Hollywood discontinued as of January 2005
Airlines servicing the Airport include scheduled and charter passenger service as well as cargo service. The airlinesnoted with an asterisk (*) represent the “Signatory Airlines” to the Airline – Airport Lease and Use Agreement (SeeSection 3) and act as the majority in interest (MII) of all airlines at the Airport regarding approvals for major capitalimprovement projects and bonded debt secured by airport revenues.
Airline Service Aviation Activity

STATISTICS
AVIATION DEPARTMENT - FY 2006 ANNUAL FINANCIAL REPORT III - 26
The following table shows the primary domestic destinations of passengers using the Airport for the 12 month period ending June 30, 2005. The top five markets for the Airport's passengers - New York, Washington, D.C./Baltimore, Atlanta, Chicago and Boston represented approximately 41.9 percent of domestic scheduled passengers for this period.
Primary Originations and Destinations for the Airport Domestic Passenger Markets
M arket of Origin or Destination1 Airport Code
Air M iles from FLL
Total Passengers % Share
New York 4,327,020 21.4% John F Kennedy I JFK 1,069 1,518,920 7.5% La Guardia LGA 1,076 2,021,430 10.0% Newark Intl EW R 1,065 567,980 2.8% Islip (M acArthur ISP 1,093 218,690 1.1%
W ashington D.C./Baltimore 1,247,590 6.2% Baltimore/W ash Int'l BW I 925 479,140 2.4% Dulles Intl IAD 901 371,560 1.8% Ronald Reagan Nt DCA 899 396,890 2.0%
Chicago 1,004,300 5.0% O 'Hare Intl ORD 1,174 646,270 3.2% Chicago M idway M DW 358,030 1.8% Boston BOS 1,237 866,390 6.4% Philadelphia Int PHL 992 693,680 3.4% Atlanta ATL 581 592,040 2.9% Los Angeles Intl LAX 2,316 495,640 2.4% Detroit DTW 1,127 434,920 2.1% Tampa Intl TPA 197 373,460 1.8% Denver Intl DEN 1,700 272,550 1.3% San Juan, P.R. SJU 1,046 356,370 1.8% Las Vegas LAS 2,174 317,340 1.6% Hartford BDL 1,173 311,930 1.5% Jacksonville Int JAX 318 273,100 1.3% Orlando Intl M CO 178 193,690 1.0% Dallas/Ft W or In DFW 1,114 270,460 1.3% Atlantic Cty Int ACY 977 201,490 1.0% Pittsburgh Intl PIT 994 214,560 1.1% Indianapolis IND 1,005 179,360 0.9% Nashville BNA 793 166,370 0.8% Providence PVD 1,188 223,740 1.1% Phoenix PHX 1,969 170,810 0.8% St. Louis STL 1,058 178,850 0.9% Cleveland CLE 1,062 151,790 0.7%Cities Listed 13,517,450 66.8%All Others Cities (Domestic) 6,723,108 33.2%Total Domestic 20,240,558 100.0%
______________ (1) Markets with 1.0 percent or more of total inbound and outbound domestic passengers on scheduled airlines at
the Airport on the basis of a 10 percent sample for the 12 months ended June 30, 2006.

STATISTICS
AVIATION DEPARTMENT - FY 2006 ANNUAL FINANCIAL REPORT III - 27
SCHEDULED AIRLINES

STATISTICS
AVIATION DEPARTMENT - FY 2006 ANNUAL FINANCIAL REPORT III - 28
COMMUTER AIRLINES
CHARTERS
CARGO CARRIERS

STATISTICS
AVIATION DEPARTMENT - FY 2006 ANNUAL FINANCIAL REPORT III - 29
.
Fiscal Annual %Year Enplaned Deplaned Total Change
1997 6,088,242 6,075,266 12,163,508 -1998 6,170,666 6,128,196 12,298,862 1.11%1999 6,816,718 6,819,267 13,635,985 10.87%2000 7,638,142 7,619,942 15,258,084 11.90%2001 8,510,794 8,476,133 16,986,927 11.33%2002 8,200,703 8,206,356 16,407,059 -3.41%2003 8,730,164 8,697,067 17,427,231 6.22%2004 10,037,499 10,047,827 20,085,326 15.25%2005 11,366,991 11,385,190 22,752,181 13.28%2006 10,680,736 10,643,076 21,323,812 -6.28%
NOTES: Enplaned vs. deplaned passengers have shown to be relatively equal reflecting this FLL status as an origination and destination (O & D) airport.
TOTAL PASSENGERSFiscal Years Ended September 30, 1997 to 2006
0
2,000,000
4,000,000
6,000,000
8,000,000
10,000,000
12,000,000
1997 1998 1999 2000 2001 2002 2003 2004 2005 2006
TOTAL PASSENGERSTen Year Analysis
Enplaned Deplaned

STATISTICS
AVIATION DEPARTMENT - FY 2006 ANNUAL FINANCIAL REPORT III - 30
Enplaned Enplaned Deplaned Deplaned TotalAirline Passengers % of Total Passengers % of Total Passengers
Air Tran 492,204 4.61% 490,629 4.61% 982,833American 927,429 8.68% 922,281 8.67% 1,849,710Continental 791,592 7.41% 795,514 7.47% 1,587,106Delta 1,587,233 14.86% 1,600,183 15.03% 3,187,416Delta Connection* 193,351 1.81% 192,798 1.81% 386,149JetBlue 1,288,813 12.07% 1,301,559 12.23% 2,590,372Northwest 339,596 3.18% 344,094 3.23% 683,690Southwest 1,355,599 12.69% 1,344,963 12.64% 2,700,562Spirit 1,062,687 9.95% 1,009,725 9.49% 2,072,412United 302,997 2.84% 305,527 2.87% 608,524U S Airways 1,082,668 10.14% 1,085,817 10.20% 2,168,485Others 1,256,567 11.76% 1,249,986 11.74% 2,506,553
Totals 10,680,736 100.00% 10,643,076 100.00% 21,323,812
* The Delta Connection family includes Chautauqua Airlines and Comair, Inc.
AIRLINE MARKET SHAREFiscal Year Ended September 30, 2006
AIRLINE MARKET SHAREFY 2006 Total Passengers
Others, 2,506,553
U S Airways, 2,168,485
United, 608,524
Spirit, 2,072,412
Southwest, 2,700,562Northwest, 683,690
JetBlue, 2,590,372
Delta, 3,187,416Delta Connection*,
386,149
Continental, 1,587,106
American, 1,849,710Air Tran, 982,833

STATISTICS
AVIATION DEPARTMENT - FY 2006 ANNUAL FINANCIAL REPORT III - 31
FY03 FY04 FY05 FY06Air Canada $4.56 $3.60 $4.66 $3.13Air Tran $4.46 $4.15 $3.94 $3.73American $3.46 $3.11 $3.72 $3.58Continental $4.50 $4.37 $4.09 $3.94Delta $4.15 $3.81 $3.59 $4.03jetBlue $3.54 $3.30 $3.13 $3.30Northwest $5.40 $4.60 $3.93 $4.08Southwest $4.25 $4.16 $3.60 $3.68Spirit $3.84 $3.39 $3.85 $4.43United $5.92 $4.10 $4.45 $4.52US Airways $3.93 $3.58 $3.54 $4.25Average* $4.33 $4.07 $3.97 $4.19
* - Cost without Cargo Landing Fees per EPAX
Fiscal Year Ended September 30, 2006By Major FLL Airlines - FY 2003 thru FY 2006
Comparative Airline Cost Per Enplanement
$0.00
$1.00
$2.00
$3.00
$4.00
$5.00
$6.00
Air Cana
da
Air Tran
American
Contin
ental
Delta
jetBlue
Northw
est
Southw
estSpir
it
United
US Airw
ays
Average
*
COMPARATIVE AIRLINE COST PER ENPLANEMENTBy MAJOR FLL AIRLINES
FY03 FY04 FY05 FY06

STATISTICS
AVIATION DEPARTMENT - FY 2006 ANNUAL FINANCIAL REPORT III - 32
Rating Agency Airport System Revenue Passenger Facility Charge Outlook
Fitch A+ A Stable
Moody's Aa3 A1 Stable
S&P A+ A Positive
Ambac Insured Rating AAA AAA
FORT LAUDERDALE - HOLLYWOOD INTERNATIONAL AIRPORTFLL Bond Ratings - October 2006
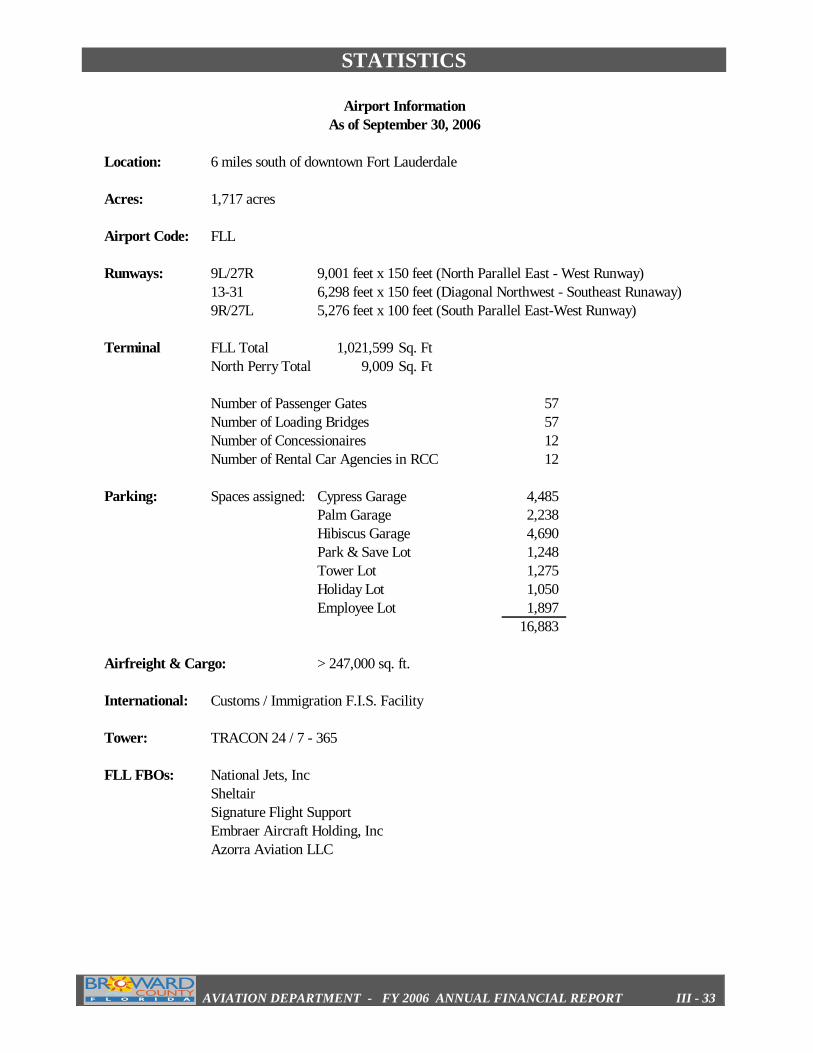
STATISTICS
AVIATION DEPARTMENT - FY 2006 ANNUAL FINANCIAL REPORT III - 33
Location: 6 miles south of downtown Fort Lauderdale
Acres: 1,717 acres
Airport Code: FLL
Runways: 9L/27R 9,001 feet x 150 feet (North Parallel East - West Runway) 13-31 6,298 feet x 150 feet (Diagonal Northwest - Southeast Runaway)9R/27L 5,276 feet x 100 feet (South Parallel East-West Runway)
Terminal FLL Total 1,021,599 Sq. FtNorth Perry Total 9,009 Sq. Ft
Number of Passenger Gates 57 Number of Loading Bridges 57 Number of Concessionaires 12 Number of Rental Car Agencies in RCC 12
Parking: Spaces assigned: Cypress Garage 4,485 Palm Garage 2,238 Hibiscus Garage 4,690 Park & Save Lot 1,248 Tower Lot 1,275 Holiday Lot 1,050 Employee Lot 1,897
16,883
Airfreight & Cargo: > 247,000 sq. ft.
International: Customs / Immigration F.I.S. Facility
Tower: TRACON 24 / 7 - 365
FLL FBOs: National Jets, IncSheltairSignature Flight SupportEmbraer Aircraft Holding, IncAzorra Aviation LLC
Airport InformationAs of September 30, 2006

FORT LAUDERDALE – HOLLYWOOD INTERNATIONAL AIRPORT 100 Aviation Boulevard
Fort Lauderdale, Florida USA 33315
954-359-6100 www.fll.net
www.broward.org/airport/