2005 THIRD-PARTY LOGISTICS - Supply Chain Magazine · 2005 Third-Party Logistics ... part of this...
16
2005 THIRD-PARTY LOGISTICS Results and Findings of the 10th Annual Study
-
Upload
trinhquynh -
Category
Documents
-
view
217 -
download
0
Transcript of 2005 THIRD-PARTY LOGISTICS - Supply Chain Magazine · 2005 Third-Party Logistics ... part of this...
2005THIRD-PARTYLOGISTICS
Results and Findingsof the 10th Annual Study

2005 Third-Party LogisticsResults and Findings of the 10th Annual Study
Participants:C. John Langley Jr., Ph.D., Georgia Institute of Technology Erik van Dort, CapgeminiAlec Ang, DHLScott R. Sykes, SAP
Table of Contents
Introduction and 10-Year Retrospective..............................................2
Study Objectives and Methodology .....................................................4
Summary of Key Findings ....................................................................8
Logistics Outsourcing Practices ........................................................10
3PL Service Offerings and Capabilities .............................................15
Management and Relationship Issues ..............................................18
Customer Value Framework...............................................................24
Technology Enablement .....................................................................27
Strategic Assessment.........................................................................31
Appendix: 3PL User Focus Groups and Capgemini AcceleratedSolutions Environment (ASE) Meetings.............................................36
About the Participants........................................................................38
Contact Information............................................................................41
Supporting Organization
1
3PL 2005: Results and Findings of the 10th Annual Study
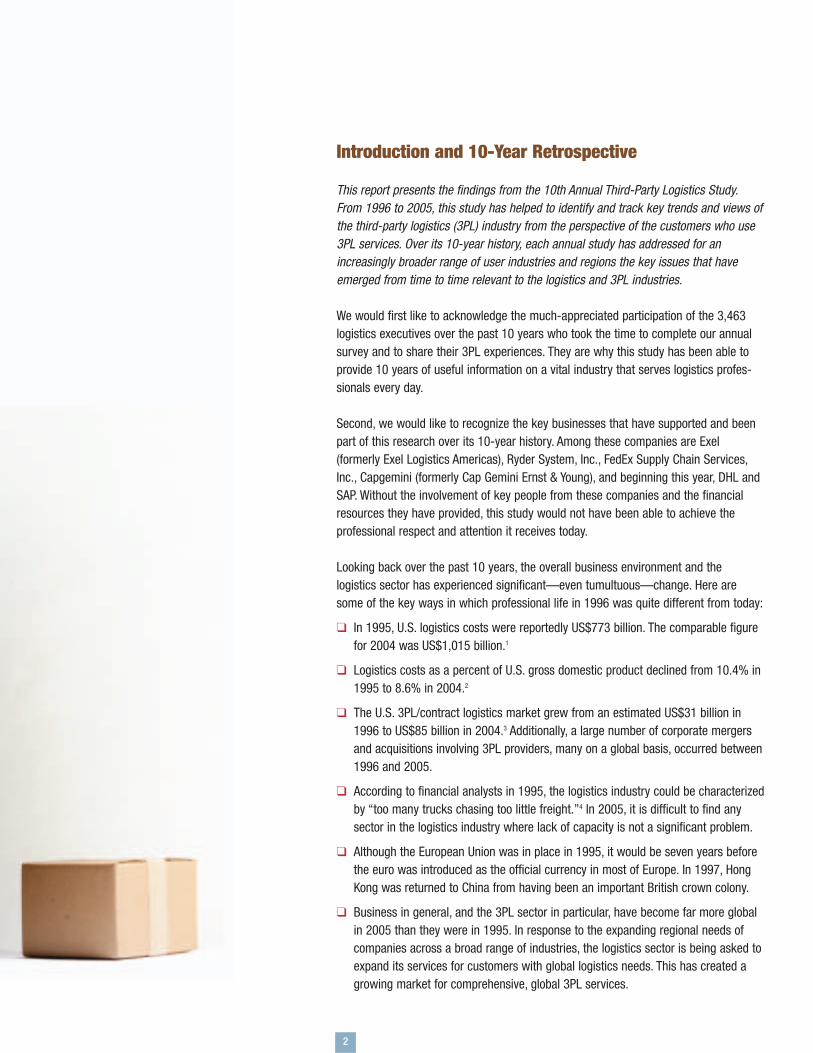
Introduction and 10-Year Retrospective
This report presents the findings from the 10th Annual Third-Party Logistics Study.From 1996 to 2005, this study has helped to identify and track key trends and views ofthe third-party logistics (3PL) industry from the perspective of the customers who use3PL services. Over its 10-year history, each annual study has addressed for anincreasingly broader range of user industries and regions the key issues that haveemerged from time to time relevant to the logistics and 3PL industries.
We would first like to acknowledge the much-appreciated participation of the 3,463logistics executives over the past 10 years who took the time to complete our annualsurvey and to share their 3PL experiences. They are why this study has been able toprovide 10 years of useful information on a vital industry that serves logistics profes-sionals every day.
Second, we would like to recognize the key businesses that have supported and beenpart of this research over its 10-year history. Among these companies are Exel(formerly Exel Logistics Americas), Ryder System, Inc., FedEx Supply Chain Services,Inc., Capgemini (formerly Cap Gemini Ernst & Young), and beginning this year, DHL andSAP. Without the involvement of key people from these companies and the financialresources they have provided, this study would not have been able to achieve theprofessional respect and attention it receives today.
Looking back over the past 10 years, the overall business environment and thelogistics sector has experienced significant—even tumultuous—change. Here aresome of the key ways in which professional life in 1996 was quite different from today:
❑ In 1995, U.S. logistics costs were reportedly US$773 billion. The comparable figurefor 2004 was US$1,015 billion.1
❑ Logistics costs as a percent of U.S. gross domestic product declined from 10.4% in1995 to 8.6% in 2004.2
❑ The U.S. 3PL/contract logistics market grew from an estimated US$31 billion in1996 to US$85 billion in 2004.3 Additionally, a large number of corporate mergersand acquisitions involving 3PL providers, many on a global basis, occurred between1996 and 2005.
❑ According to financial analysts in 1995, the logistics industry could be characterizedby “too many trucks chasing too little freight.”4 In 2005, it is difficult to find anysector in the logistics industry where lack of capacity is not a significant problem.
❑ Although the European Union was in place in 1995, it would be seven years beforethe euro was introduced as the official currency in most of Europe. In 1997, HongKong was returned to China from having been an important British crown colony.
❑ Business in general, and the 3PL sector in particular, have become far more globalin 2005 than they were in 1995. In response to the expanding regional needs ofcompanies across a broad range of industries, the logistics sector is being asked toexpand its services for customers with global logistics needs. This has created agrowing market for comprehensive, global 3PL services.
2

Over the years, this study has provided significant insight into how customers view anduse outsourced providers of logistics services. The first six years of the study, 1996 to2001, focused exclusively on the trends in North America. Since 2002, the study alsosurveyed users in Western Europe, Asia-Pacific, Latin America, South Africa, and theMiddle East. The following are some of the changes we have seen in the 3PL industryover the past 10 years:
❑ While for the first six years of the study about 72% of the survey respondents fromNorth America described themselves as “users” of 3PL services, this percentagehas increased about 80% in the past four years. Significant use of 3PL providersand services also exists in the other regions studied.
❑ In all the years of the study, we asked logistics executives what factors wereaffecting their businesses. Exhibit 1 shows four major factors and changes in thosefactor’s rankings. In recent years, respondents have also cited increases in theimportance of “emphasis on improved supply chain management” and “intensifyinggovernment and regulatory policies,” among other factors.
❑ Annually, the most prevalent logistics services outsourced to 3PL providers aretransportation (outbound and inbound) and warehousing. In the past 10 years,however, many services have increasingly been outsourced, including customsclearance and brokerage, freight forwarding,cross-docking/shipment consolidation, andorder fulfillment and distribution.
❑ Throughout the history of this study, 3PLusers have given their outsourced 3PL effortshigh ratings in terms of “success.” As isdiscussed each year, however, 3PL users stillexpect their 3PL providers to improve in anumber of service areas.
❑ Survey findings in recent years indicate that logistics is increasingly an importantarea of activity within a company. Results from each of the regions studiedsubstantiate the fact that logistics represents a strategic, competitive advantage.
One conclusion stands out, though: The 3PL industry is still growing. Among thepriorities currently facing 3PL providers are regional expansion, broadening services tomeet the needs of current and future customers, integrating information technologies,and developing relationships with customers and other business firms that willfacilitate the growth and expansion that lies ahead.
It has been very exciting to see the 3PL industry develop over the past 10 years. Weexpect to see in the years ahead significant changes and enhancements to theprovision and use of outsourced logistics services.
3
3PL 2005: Results and Findings of the 10th Annual Study
Factors Perceived by Logistics Executives, 1996-2005Factor 1996 North 2005
America North America All RegionsPressure to reduce cost 87% 96% 91% -100%Pressure to enhance customer service 65 80 74 - 84Globalization 58 80 63 - 90Develop new information technologies 47 82 81 - 96
© 2005, C. John Langley Jr., Ph.D., and Capgemini U.S. LLC. All rights reserved.
1 16th Annual State of Logistics Report. Oak Brook, IL: Council of Supply ChainManagement Professionals, 2005.
2 Ibid.3 Armstrong and Associates, www.3PLogistics.com.4 7th Annual State of Logistics Report. St. Louis, MO: Cass Information Systems,
1996, page 11.
Exhibit 1
Study Objectives and Methodology
During the spring and summer of 2005, C. John Langley Jr., Ph.D., of the GeorgiaInstitute of Technology, with Capgemini, DHL, and SAP, conducted an extensive studyabout using 3PL services in North America, Western Europe, Asia-Pacific, LatinAmerica, South Africa, and the Middle East.5,6 This is now the 10th annual researchstudy to examine critical trends and issues among key markets and key customers inthe 3PL industry.
Study Objectives❑ Measure the development and growth of the 3PL industry across major industry
segments and across several diverse regions of the world.❑ Summarize the current use of 3PL services.❑ Identify customer needs and how well 3PL providers are responding to those needs.❑ Understand how customers select and manage 3PL providers.❑ Examine why customers outsource or elect not to outsource to 3PL providers.❑ Investigate leading topics, including 3PL service offerings and capabilities,
structuring and managing effective 3PL relationships, how customers view successand value from 3PL relationships, and technology enablement.
❑ Provide a strategic assessment of the future of the 3PL industry.
Methodology and Research ApproachThis study identifies and tracks key trends and views of the 3PL industry from theperspective of customers who purchase and use 3PL services. In addition, a number ofrespondents who are not using 3PL services provide key information as to why they donot currently outsource logistics services and what their plans may be in the future. Asis done every year, the 2005 3PL study incorporates appropriate revisions of contentand terminology from past year’s surveys to be current and to respond to recentchanges in the logistics, supply chain, and 3PL/4PL industries.
Survey recipients were asked to think of a “third-party logistics (3PL) provider” as onethat provides multiple logistics services for its clients and customers. Following severalexamples of firms that would be typical of such a definition,7 recipients were asked tothink of a “fourth-party logistics (4PL) provider” as one that may include more advancedlogistics outsourcing services than a conventional 3PL normally would provide.8
The study methodology included using e-mail to contact logistics and supply chainexecutives across North America, Western Europe, Asia-Pacific, Latin America, SouthAfrica, and the Middle East. (In this study, an “executive” holds the title of manager,director, or vice president of logistics or supply chain management.)9 Executives willingto participate in the survey were asked to click an Internet link that would lead them toan online survey. Although surveys had been sent by mail in earlier years of this study,the Internet has been used for the past several years to contact participants and tofacilitate their involvement. The 2005 3PL study used a web-based commercial firm to
4
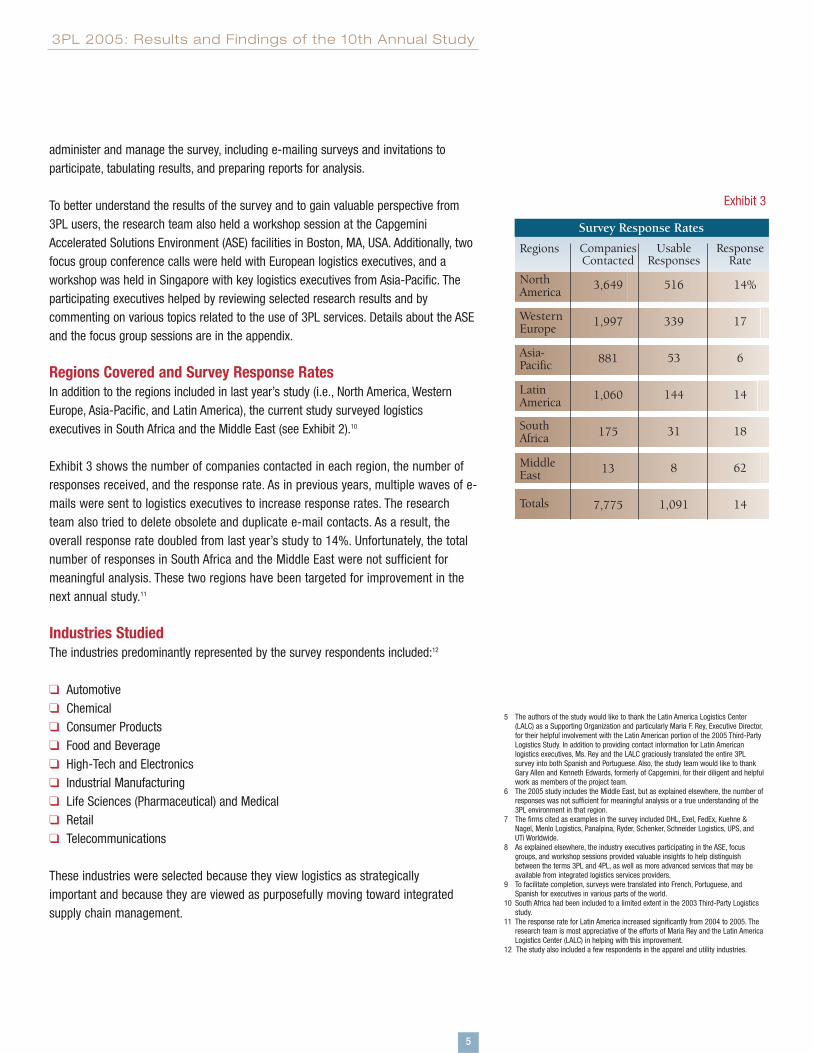
Regions Surveyed
North America
Western Europe
Asia-Pacific
Latin America
South Africa
Middle East
Exhibit 2
administer and manage the survey, including e-mailing surveys and invitations toparticipate, tabulating results, and preparing reports for analysis.
To better understand the results of the survey and to gain valuable perspective from3PL users, the research team also held a workshop session at the CapgeminiAccelerated Solutions Environment (ASE) facilities in Boston, MA, USA. Additionally, twofocus group conference calls were held with European logistics executives, and aworkshop was held in Singapore with key logistics executives from Asia-Pacific. Theparticipating executives helped by reviewing selected research results and bycommenting on various topics related to the use of 3PL services. Details about the ASEand the focus group sessions are in the appendix.
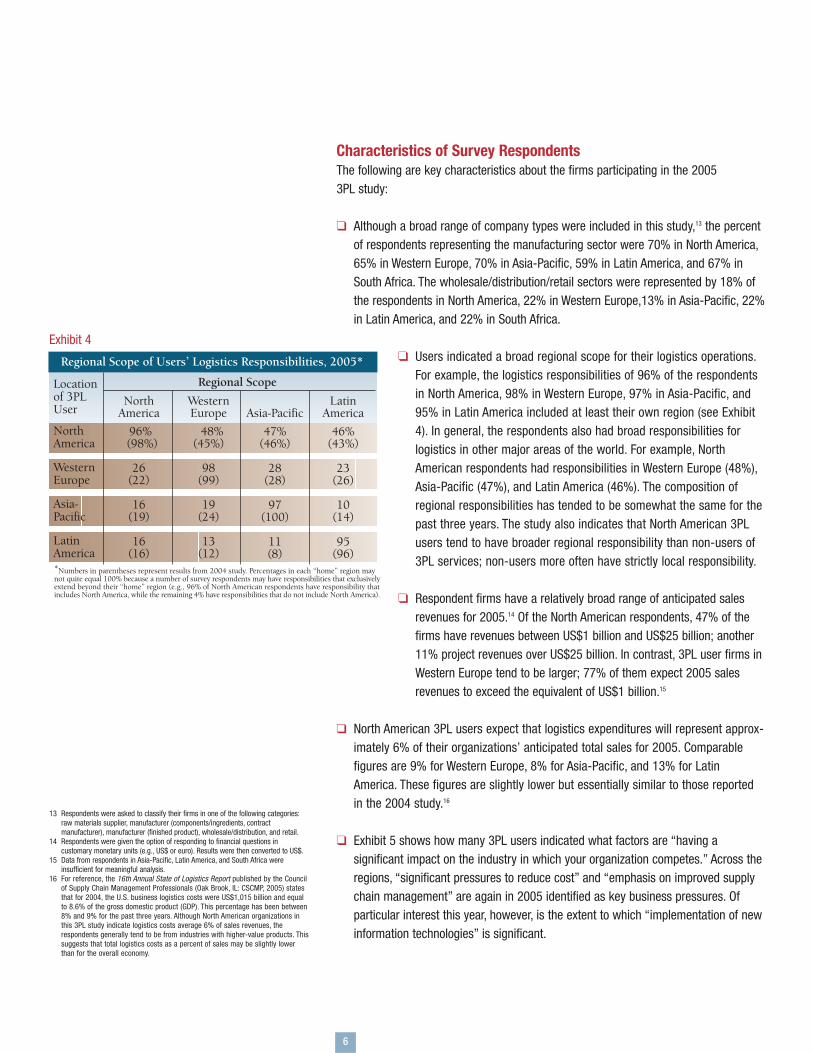
Regions Covered and Survey Response RatesIn addition to the regions included in last year’s study (i.e., North America, WesternEurope, Asia-Pacific, and Latin America), the current study surveyed logisticsexecutives in South Africa and the Middle East (see Exhibit 2).10
Exhibit 3 shows the number of companies contacted in each region, the number ofresponses received, and the response rate. As in previous years, multiple waves of e-mails were sent to logistics executives to increase response rates. The researchteam also tried to delete obsolete and duplicate e-mail contacts. As a result, theoverall response rate doubled from last year’s study to 14%. Unfortunately, the totalnumber of responses in South Africa and the Middle East were not sufficient formeaningful analysis. These two regions have been targeted for improvement in thenext annual study.11
Industries StudiedThe industries predominantly represented by the survey respondents included:12
❑ Automotive❑ Chemical❑ Consumer Products❑ Food and Beverage❑ High-Tech and Electronics❑ Industrial Manufacturing❑ Life Sciences (Pharmaceutical) and Medical❑ Retail ❑ Telecommunications
These industries were selected because they view logistics as strategicallyimportant and because they are viewed as purposefully moving toward integratedsupply chain management.
5
3PL 2005: Results and Findings of the 10th Annual Study
5 The authors of the study would like to thank the Latin America Logistics Center(LALC) as a Supporting Organization and particularly Maria F. Rey, Executive Director,for their helpful involvement with the Latin American portion of the 2005 Third-PartyLogistics Study. In addition to providing contact information for Latin Americanlogistics executives, Ms. Rey and the LALC graciously translated the entire 3PLsurvey into both Spanish and Portuguese. Also, the study team would like to thankGary Allen and Kenneth Edwards, formerly of Capgemini, for their diligent and helpfulwork as members of the project team.
6 The 2005 study includes the Middle East, but as explained elsewhere, the number ofresponses was not sufficient for meaningful analysis or a true understanding of the3PL environment in that region.
7 The firms cited as examples in the survey included DHL, Exel, FedEx, Kuehne &Nagel, Menlo Logistics, Panalpina, Ryder, Schenker, Schneider Logistics, UPS, andUTi Worldwide.
8 As explained elsewhere, the industry executives participating in the ASE, focusgroups, and workshop sessions provided valuable insights to help distinguishbetween the terms 3PL and 4PL, as well as more advanced services that may beavailable from integrated logistics services providers.
9 To facilitate completion, surveys were translated into French, Portuguese, andSpanish for executives in various parts of the world.
10 South Africa had been included to a limited extent in the 2003 Third-Party Logisticsstudy.
11 The response rate for Latin America increased significantly from 2004 to 2005. Theresearch team is most appreciative of the efforts of Maria Rey and the Latin AmericaLogistics Center (LALC) in helping with this improvement.
12 The study also included a few respondents in the apparel and utility industries.
Exhibit 3
Survey Response Rates
NorthAmerica
WesternEurope
Asia-Pacific
CompaniesContacted
3,649
1,997
881
1,060
175
13
7,775
ResponseRate
14%
17
6
14
18
62
14
UsableResponses
516
339
53
144
31
8
1,091
LatinAmerica
Totals
Regions
SouthAfrica
MiddleEast
Characteristics of Survey RespondentsThe following are key characteristics about the firms participating in the 2005 3PL study:
❑ Although a broad range of company types were included in this study,13 the percentof respondents representing the manufacturing sector were 70% in North America,65% in Western Europe, 70% in Asia-Pacific, 59% in Latin America, and 67% inSouth Africa. The wholesale/distribution/retail sectors were represented by 18% ofthe respondents in North America, 22% in Western Europe,13% in Asia-Pacific, 22%in Latin America, and 22% in South Africa.
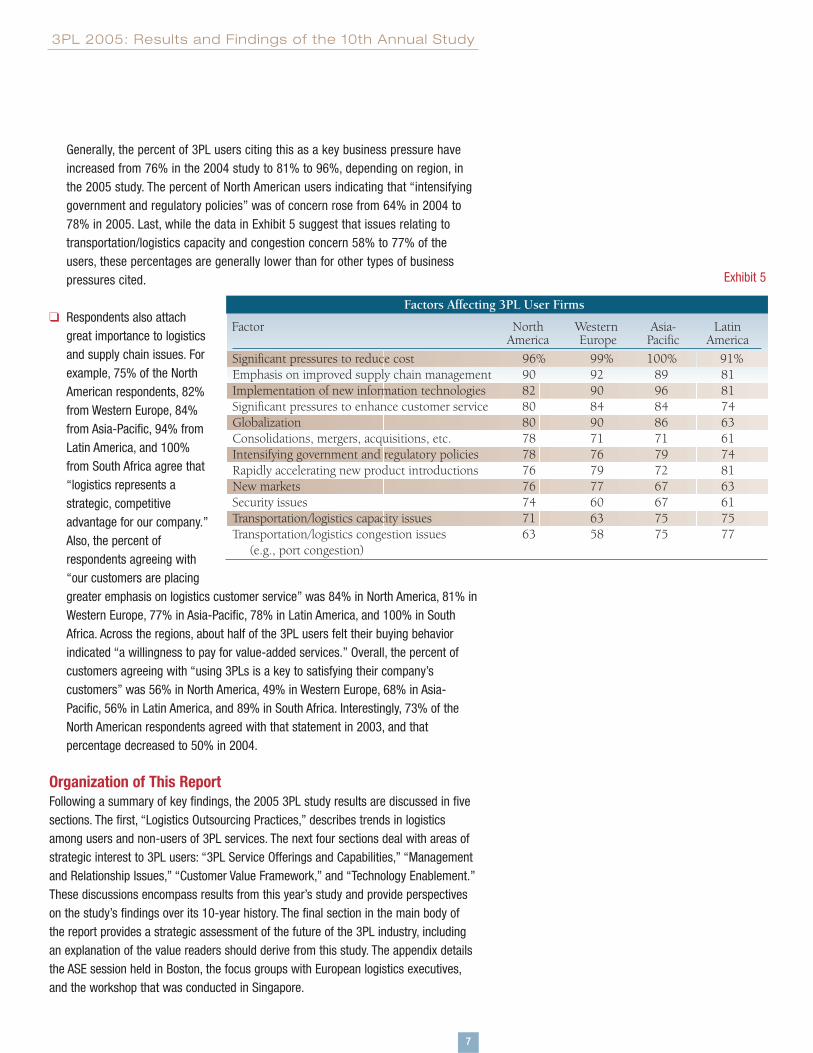
❑ Users indicated a broad regional scope for their logistics operations.For example, the logistics responsibilities of 96% of the respondentsin North America, 98% in Western Europe, 97% in Asia-Pacific, and95% in Latin America included at least their own region (see Exhibit4). In general, the respondents also had broad responsibilities forlogistics in other major areas of the world. For example, NorthAmerican respondents had responsibilities in Western Europe (48%),Asia-Pacific (47%), and Latin America (46%). The composition ofregional responsibilities has tended to be somewhat the same for thepast three years. The study also indicates that North American 3PLusers tend to have broader regional responsibility than non-users of3PL services; non-users more often have strictly local responsibility.
❑ Respondent firms have a relatively broad range of anticipated salesrevenues for 2005.14 Of the North American respondents, 47% of thefirms have revenues between US$1 billion and US$25 billion; another11% project revenues over US$25 billion. In contrast, 3PL user firms inWestern Europe tend to be larger; 77% of them expect 2005 salesrevenues to exceed the equivalent of US$1 billion.15
❑ North American 3PL users expect that logistics expenditures will represent approx-imately 6% of their organizations’ anticipated total sales for 2005. Comparablefigures are 9% for Western Europe, 8% for Asia-Pacific, and 13% for LatinAmerica. These figures are slightly lower but essentially similar to those reportedin the 2004 study.16
❑ Exhibit 5 shows how many 3PL users indicated what factors are “having asignificant impact on the industry in which your organization competes.” Across theregions, “significant pressures to reduce cost” and “emphasis on improved supplychain management” are again in 2005 identified as key business pressures. Ofparticular interest this year, however, is the extent to which “implementation of newinformation technologies” is significant.
6
13 Respondents were asked to classify their firms in one of the following categories:raw materials supplier, manufacturer (components/ingredients, contractmanufacturer), manufacturer (finished product), wholesale/distribution, and retail.
14 Respondents were given the option of responding to financial questions incustomary monetary units (e.g., US$ or euro). Results were then converted to US$.
15 Data from respondents in Asia-Pacific, Latin America, and South Africa wereinsufficient for meaningful analysis.
16 For reference, the 16th Annual State of Logistics Report published by the Councilof Supply Chain Management Professionals (Oak Brook, IL: CSCMP, 2005) statesthat for 2004, the U.S. business logistics costs were US$1,015 billion and equalto 8.6% of the gross domestic product (GDP). This percentage has been between8% and 9% for the past three years. Although North American organizations inthis 3PL study indicate logistics costs average 6% of sales revenues, therespondents generally tend to be from industries with higher-value products. Thissuggests that total logistics costs as a percent of sales may be slightly lowerthan for the overall economy.
Regional Scope of Users’ Logistics Responsibilities, 2005*
NorthAmerica
WesternEurope
Asia-Pacific
NorthAmerica
96% (98%)
26(22)
16(19)
16(16)
Asia-Pacific47%
(46%)
28(28)
97(100)
11(8)
WesternEurope 48%(45%)
98(99)
19(24)
13(12)
LatinAmerica*Numbers in parentheses represent results from 2004 study. Percentages in each “home” region maynot quite equal 100% because a number of survey respondents may have responsibilities that exclusivelyextend beyond their “home” region (e.g., 96% of North American respondents have responsibility thatincludes North America, while the remaining 4% have responsibilities that do not include North America).
LatinAmerica
46%(43%)
23(26)
10(14)
95(96)
Locationof 3PLUser
Regional Scope
Exhibit 4
Generally, the percent of 3PL users citing this as a key business pressure haveincreased from 76% in the 2004 study to 81% to 96%, depending on region, inthe 2005 study. The percent of North American users indicating that “intensifyinggovernment and regulatory policies” was of concern rose from 64% in 2004 to78% in 2005. Last, while the data in Exhibit 5 suggest that issues relating totransportation/logistics capacity and congestion concern 58% to 77% of theusers, these percentages are generally lower than for other types of businesspressures cited.
❑ Respondents also attachgreat importance to logisticsand supply chain issues. Forexample, 75% of the NorthAmerican respondents, 82%from Western Europe, 84%from Asia-Pacific, 94% fromLatin America, and 100%from South Africa agree that“logistics represents astrategic, competitiveadvantage for our company.”Also, the percent ofrespondents agreeing with“our customers are placinggreater emphasis on logistics customer service” was 84% in North America, 81% inWestern Europe, 77% in Asia-Pacific, 78% in Latin America, and 100% in SouthAfrica. Across the regions, about half of the 3PL users felt their buying behaviorindicated “a willingness to pay for value-added services.” Overall, the percent ofcustomers agreeing with “using 3PLs is a key to satisfying their company’scustomers” was 56% in North America, 49% in Western Europe, 68% in Asia-Pacific, 56% in Latin America, and 89% in South Africa. Interestingly, 73% of theNorth American respondents agreed with that statement in 2003, and thatpercentage decreased to 50% in 2004.
Organization of This ReportFollowing a summary of key findings, the 2005 3PL study results are discussed in fivesections. The first, “Logistics Outsourcing Practices,” describes trends in logisticsamong users and non-users of 3PL services. The next four sections deal with areas ofstrategic interest to 3PL users: “3PL Service Offerings and Capabilities,” “Managementand Relationship Issues,” “Customer Value Framework,” and “Technology Enablement.”These discussions encompass results from this year’s study and provide perspectiveson the study’s findings over its 10-year history. The final section in the main body ofthe report provides a strategic assessment of the future of the 3PL industry, includingan explanation of the value readers should derive from this study. The appendix detailsthe ASE session held in Boston, the focus groups with European logistics executives,and the workshop that was conducted in Singapore.
7
3PL 2005: Results and Findings of the 10th Annual Study
Exhibit 5
Factors Affecting 3PL User Firms
Factor North Western Asia- LatinAmerica Europe Pacific America
Significant pressures to reduce cost 96% 99% 100% 91%Emphasis on improved supply chain management 90 92 89 81Implementation of new information technologies 82 90 96 81Significant pressures to enhance customer service 80 84 84 74Globalization 80 90 86 63Consolidations, mergers, acquisitions, etc. 78 71 71 61Intensifying government and regulatory policies 78 76 79 74Rapidly accelerating new product introductions 76 79 72 81New markets 76 77 67 63Security issues 74 60 67 61Transportation/logistics capacity issues 71 63 75 75Transportation/logistics congestion issues 63 58 75 77 (e.g., port congestion)
Summary of Key Findings
This study helps provide a better understanding of the marketplace for 3PL servicesand the ways providers of such services continue to develop and grow. Consideringthat the total annual revenues of U.S.-based 3PL providers in 2004 are approximatelyUS$85 billion,17 the services offered by 3PL providers continue to consume a significantportion of overall logistics and supply chain budgets.18
Here are the major findings of this year’s 3PL study:
❑ LOGISTICS OUTSOURCING PRACTICES. The use of 3PL services is significant inthe five regions studied. Between 1996 through 2001, the percentage of 3PL usersremained relatively constant among North American respondents (between 68%and 73%). In the years 2002 to 2005, however, the percentage of North Americanusers has shown modest growth and this year is at 80%. Based on the three mostrecent years of survey data, the percent of firms using 3PL services in WesternEurope has been 77%. In Asia-Pacific, the use of 3PL providers is high (84% in2004 and 83% in 2005), but in Latin America, outsourced logistics is less prevalentthan in the other regions (67% in 2004 and 72% in 2005). In South Africa, the 3PLusage rate was 74%.
❑ 3PL SERVICE OFFERINGS AND CAPABILITIES. This year’s survey shows continuedimprovements in overall service levels from suppliers. Moreover, 3PL users continueto view a collaborative partnership approach with their 3PL providers as key toimproving the user-company 3PL performance. However, unlike in past surveys,pricing has become the most important attribute in selecting a 3PL provider. This isdifferent from last year’s study where value-added services was ranked first. Infact, this year the proficiency of a 3PL provider’s core services was consideredmore important than the provider’s ability to deliver value-added services. This shiftfrom frills to core services is a major change; in past surveys, a 3PL provider’sdelivery of core services was considered a “given.” The “value” that is created by a3PL relationship is a function of several factors, including benefits derived fromservice offerings, price versus perceived benefit, standardized versus customizedservice offerings, breadth of service offerings, integration (operational andtechnology integration), and geographic coverage.
❑ MANAGEMENT AND RELATIONSHIP ISSUES. This year, 88% of those surveyedview their relationship with their service provider as successful. Although users aregenerally satisfied with their 3PL providers, the providers are continually pressuredto expand their service offerings. For 3PL providers to properly address thischallenge, they must determine their market positioning, business models, andapproach to exceeding customer satisfaction. Pressure to “be all things to allcustomers,” to continually grow, and to maintain profitability makes it difficult for3PL providers to address this challenge.
8
❑ CUSTOMER VALUE FRAMEWORK. Across all the regions studied, 3PL users arebenefiting from their choice to outsource certain logistics services. Logistics costreductions were relatively consistent at 10% or 11% across North America, WesternEurope, Asia-Pacific, and Latin America. Order fill rates in each of the regionssuggest improvements occurred as the order fill rates increased in all regions.Reductions in average order-cycle length of approximately 25% to 30% were seenin North America, Western Europe, and Asia-Pacific, while the average order-cyclereduction in Latin America was halved. Inventory turns increased for 3PL users inNorth America and Asia-Pacific, and decreased in both Western Europe and LatinAmerica. In terms of cash-to-cash cycles, the number of days reduction rangedfrom 2.8 days in Latin America to 4.5 days in North America. Last, 3PL usersagreed that service levels had improved (North American executives in agreement,62%; Western European, 67%; Asian-Pacific, 64%; and Latin American, 77%).Nevertheless, additional study results indicate these user-provider relationships arenot without areas for improvement.
❑ TECHNOLOGY ENABLEMENT. Approximately 90% of respondents agreed thatinformation technology (IT) capabilities are a necessary element of overall 3PLprovider expertise. Implementing IT ranked third behind cost pressures (97%) andimproving supply chain management (89%) as a leading factor affecting 3PL userorganizations in 2005. While a high percentage of users identify IT as a necessaryelement of overall 3PL provider expertise, far fewer (38%) are satisfied with theirproviders’ capabilities. In general, 3PL users have yet to think of their 3PL providersin a newer, more strategic light. Not only do over 70% of the survey respondentscharacterize their 3PL provider relationships as tactical in nature, their IT-basedservices align with this thinking. The survey suggests that as more firms progressfurther into outsourced logistics relationships, the complexity of those relationshipsnecessitates a combination of effective IT services for a broad spectrum of supplychain processes.
❑ STRATEGIC ASSESSMENT. Since the inception of this survey, customer evaluationof outsourcing success has ranged between 82% and 90%. In the last four years,satisfaction rates have consistently been around 90%. Along with high satisfactionrates, users have stated continued benefits over the last six years. Plus, the 3PLindustry has continued to achieve annual growth rates greater than 10% over thelast decade, while also experiencing a tremendous amount of mergers andacquisitions. Customer expectations have continually increased from year to yearwhile 3PL providers are pressured into ongoing development of new capabilities.Although many 3PL providers satisfy user requirements around basic services, suchas transportation or warehousing, users continue to identify ongoing developmentof capabilities as a key issue. The stated need for advanced supply chain servicesand for organizations that can serve as “integrators” has validated a “strategicservice” model in meeting—and servicing—the needs of 3PL users. The continualgap between user expectations and what 3PL providers deliver is a clear signal that3PL providers and users need to “re-invent” themselves to be more capablebusiness partners to one another.
9
3PL 2005: Results and Findings of the 10th Annual Study
17 Source: Armstrong & Associates, Inc., www.3plogistics.com. Estimated total contractlogistics market revenues were US$56.6 billion for 2000, US$65.3 billion for 2001,US$71.1 billion for 2002, and US$76.9 for 2003.
18 16th Annual State of Logistics Report (Oak Brook, IL: Council of Supply ChainManagement Professionals, June, 2005) states that for 2004, U.S. business logisticscosts were US$1,015 billion and equal to 8.6% of the U.S. GDP.
Logistics Outsourcing Practices
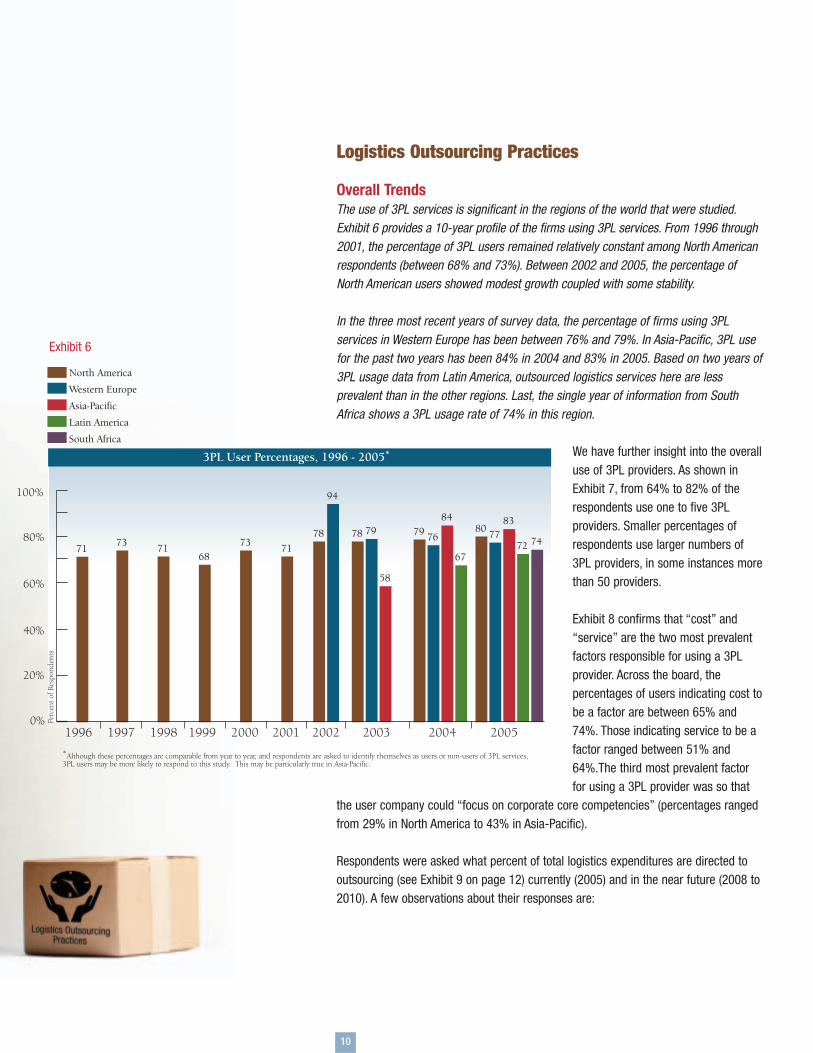
Overall TrendsThe use of 3PL services is significant in the regions of the world that were studied.Exhibit 6 provides a 10-year profile of the firms using 3PL services. From 1996 through2001, the percentage of 3PL users remained relatively constant among North Americanrespondents (between 68% and 73%). Between 2002 and 2005, the percentage ofNorth American users showed modest growth coupled with some stability.
In the three most recent years of survey data, the percentage of firms using 3PLservices in Western Europe has been between 76% and 79%. In Asia-Pacific, 3PL usefor the past two years has been 84% in 2004 and 83% in 2005. Based on two years of3PL usage data from Latin America, outsourced logistics services here are lessprevalent than in the other regions. Last, the single year of information from SouthAfrica shows a 3PL usage rate of 74% in this region.
We have further insight into the overalluse of 3PL providers. As shown inExhibit 7, from 64% to 82% of therespondents use one to five 3PLproviders. Smaller percentages ofrespondents use larger numbers of3PL providers, in some instances morethan 50 providers.
Exhibit 8 confirms that “cost” and“service” are the two most prevalentfactors responsible for using a 3PLprovider. Across the board, thepercentages of users indicating cost tobe a factor are between 65% and74%. Those indicating service to be afactor ranged between 51% and64%.The third most prevalent factorfor using a 3PL provider was so that
the user company could “focus on corporate core competencies” (percentages rangedfrom 29% in North America to 43% in Asia-Pacific).
Respondents were asked what percent of total logistics expenditures are directed tooutsourcing (see Exhibit 9 on page 12) currently (2005) and in the near future (2008 to2010). A few observations about their responses are:
10
1996 1997 1998 1999 2000 2001 2002 2003
North America
Western Europe
Asia-Pacific
Latin America
South Africa
0%
20%
40%
60%
80%
100%
3PL User Percentages, 1996 - 2005*
*Although these percentages are comparable from year to year, and respondents are asked to identify themselves as users or non-users of 3PL services,3PL users may be more likely to respond to this study. This may be particularly true in Asia-Pacific.
Perc
ent o
f Res
pond
ents
2005
7978
58
767984
67
778083
72
2004
7173 71
6873 71
78
94
74
Exhibit 6
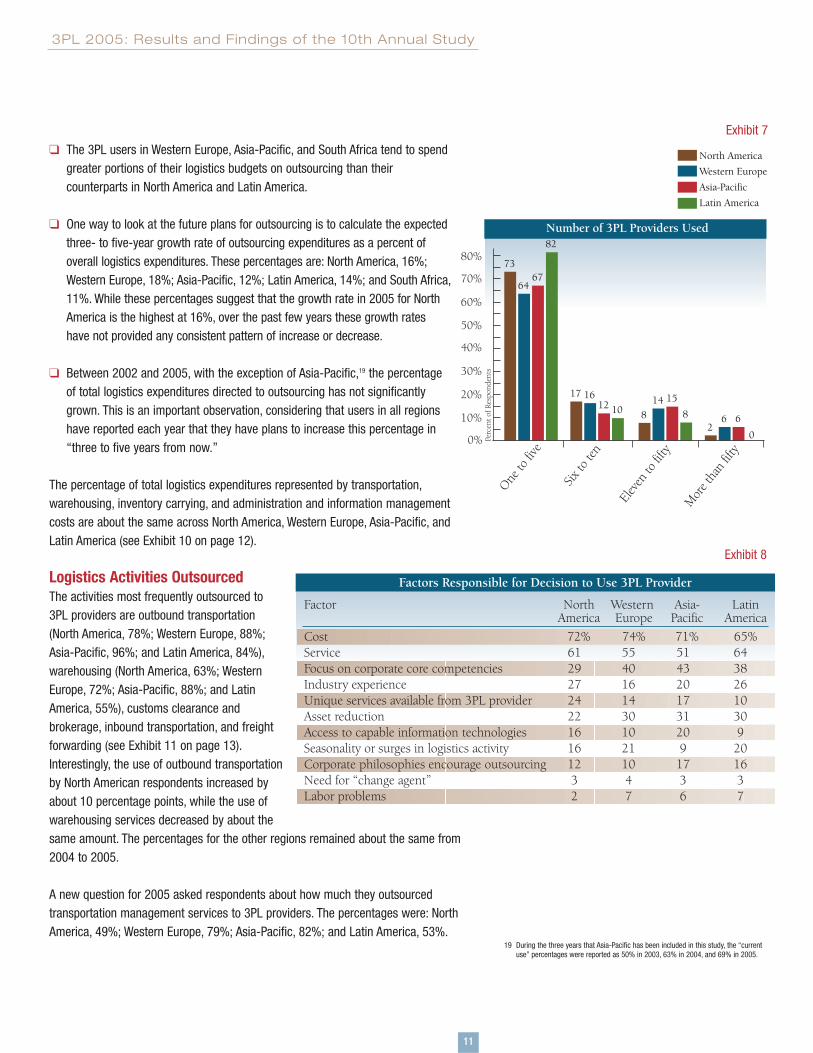
❑ The 3PL users in Western Europe, Asia-Pacific, and South Africa tend to spendgreater portions of their logistics budgets on outsourcing than theircounterparts in North America and Latin America.
❑ One way to look at the future plans for outsourcing is to calculate the expectedthree- to five-year growth rate of outsourcing expenditures as a percent ofoverall logistics expenditures. These percentages are: North America, 16%;Western Europe, 18%; Asia-Pacific, 12%; Latin America, 14%; and South Africa,11%. While these percentages suggest that the growth rate in 2005 for NorthAmerica is the highest at 16%, over the past few years these growth rateshave not provided any consistent pattern of increase or decrease.
❑ Between 2002 and 2005, with the exception of Asia-Pacific,19 the percentageof total logistics expenditures directed to outsourcing has not significantlygrown. This is an important observation, considering that users in all regionshave reported each year that they have plans to increase this percentage in“three to five years from now.”
The percentage of total logistics expenditures represented by transportation,warehousing, inventory carrying, and administration and information managementcosts are about the same across North America, Western Europe, Asia-Pacific, andLatin America (see Exhibit 10 on page 12).
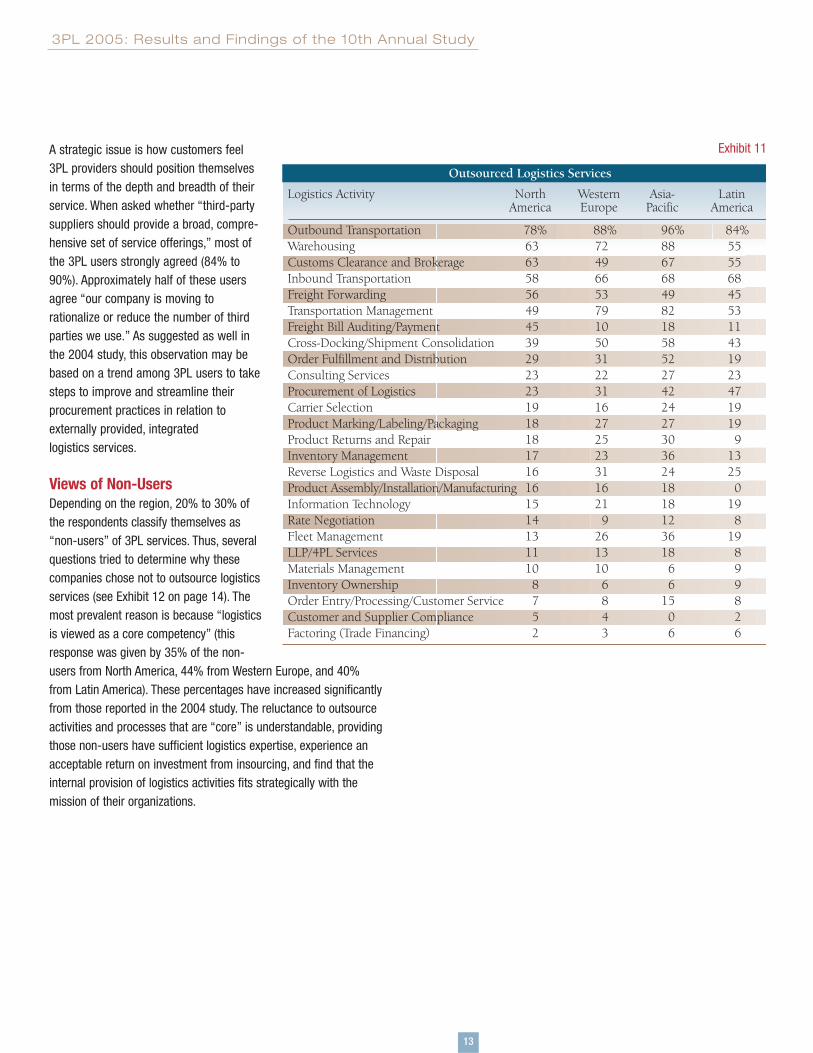
Logistics Activities OutsourcedThe activities most frequently outsourced to3PL providers are outbound transportation(North America, 78%; Western Europe, 88%;Asia-Pacific, 96%; and Latin America, 84%),warehousing (North America, 63%; WesternEurope, 72%; Asia-Pacific, 88%; and LatinAmerica, 55%), customs clearance andbrokerage, inbound transportation, and freightforwarding (see Exhibit 11 on page 13).Interestingly, the use of outbound transportationby North American respondents increased byabout 10 percentage points, while the use ofwarehousing services decreased by about thesame amount. The percentages for the other regions remained about the same from2004 to 2005.
A new question for 2005 asked respondents about how much they outsourcedtransportation management services to 3PL providers. The percentages were: NorthAmerica, 49%; Western Europe, 79%; Asia-Pacific, 82%; and Latin America, 53%.
11
3PL 2005: Results and Findings of the 10th Annual Study
Exhibit 7
Exhibit 8
Number of 3PL Providers Used
0%
20%
40%
60%
80%
Perc
ent o
f Res
pond
ents
North America
Western Europe
Asia-Pacific
Latin America
161712 10
62
6
0
148
15
8
Six to
ten
Elev
en to
fifty
Mor
e tha
n fift
y
One to
five
64
7367
82
10%
30%
50%
70%
Factors Responsible for Decision to Use 3PL Provider
Factor North Western Asia- LatinAmerica Europe Pacific America
Cost 72% 74% 71% 65%Service 61 55 51 64Focus on corporate core competencies 29 40 43 38Industry experience 27 16 20 26Unique services available from 3PL provider 24 14 17 10Asset reduction 22 30 31 30Access to capable information technologies 16 10 20 9Seasonality or surges in logistics activity 16 21 9 20Corporate philosophies encourage outsourcing 12 10 17 16Need for “change agent” 3 4 3 3Labor problems 2 7 6 7
19 During the three years that Asia-Pacific has been included in this study, the “currentuse” percentages were reported as 50% in 2003, 63% in 2004, and 69% in 2005.
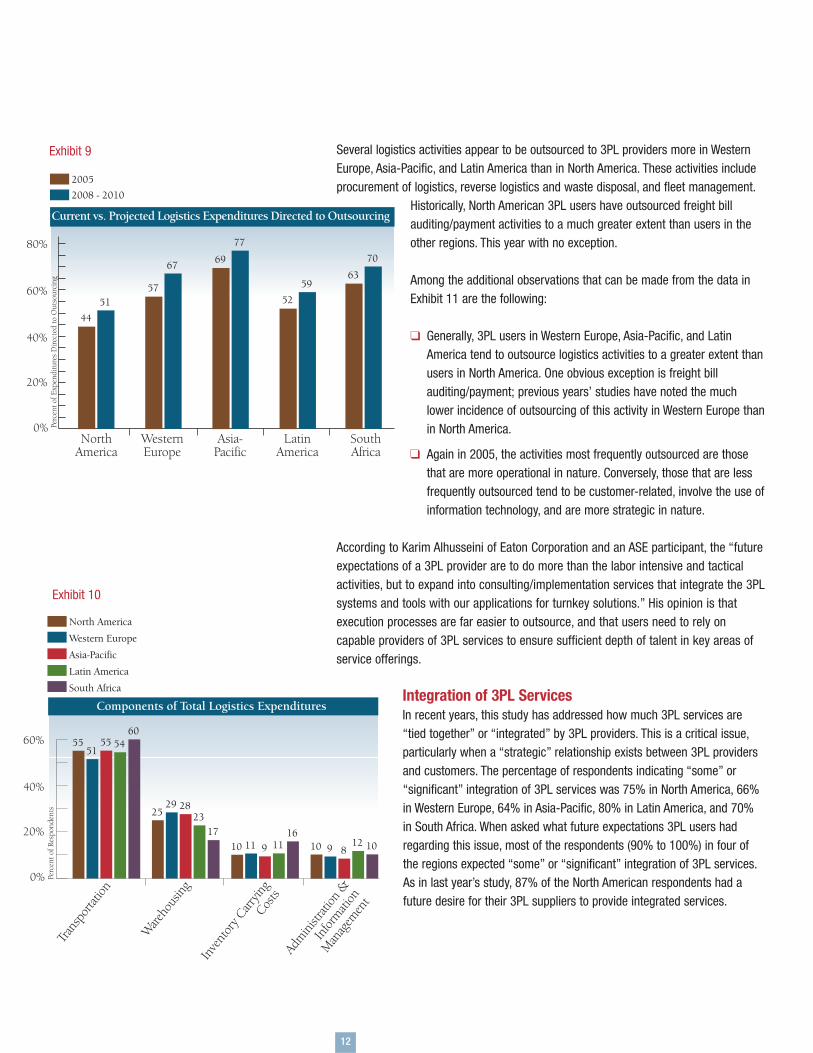
Several logistics activities appear to be outsourced to 3PL providers more in WesternEurope, Asia-Pacific, and Latin America than in North America. These activities includeprocurement of logistics, reverse logistics and waste disposal, and fleet management.
Historically, North American 3PL users have outsourced freight billauditing/payment activities to a much greater extent than users in theother regions. This year with no exception.
Among the additional observations that can be made from the data inExhibit 11 are the following:
❑ Generally, 3PL users in Western Europe, Asia-Pacific, and LatinAmerica tend to outsource logistics activities to a greater extent thanusers in North America. One obvious exception is freight billauditing/payment; previous years’ studies have noted the muchlower incidence of outsourcing of this activity in Western Europe thanin North America.
❑ Again in 2005, the activities most frequently outsourced are thosethat are more operational in nature. Conversely, those that are lessfrequently outsourced tend to be customer-related, involve the use ofinformation technology, and are more strategic in nature.
According to Karim Alhusseini of Eaton Corporation and an ASE participant, the “futureexpectations of a 3PL provider are to do more than the labor intensive and tacticalactivities, but to expand into consulting/implementation services that integrate the 3PLsystems and tools with our applications for turnkey solutions.” His opinion is thatexecution processes are far easier to outsource, and that users need to rely oncapable providers of 3PL services to ensure sufficient depth of talent in key areas ofservice offerings.
Integration of 3PL ServicesIn recent years, this study has addressed how much 3PL services are“tied together” or “integrated” by 3PL providers. This is a critical issue,particularly when a “strategic” relationship exists between 3PL providersand customers. The percentage of respondents indicating “some” or“significant” integration of 3PL services was 75% in North America, 66%in Western Europe, 64% in Asia-Pacific, 80% in Latin America, and 70%in South Africa. When asked what future expectations 3PL users hadregarding this issue, most of the respondents (90% to 100%) in four ofthe regions expected “some” or “significant” integration of 3PL services.As in last year’s study, 87% of the North American respondents had afuture desire for their 3PL suppliers to provide integrated services.
12
Exhibit 9
Current vs. Projected Logistics Expenditures Directed to Outsourcing
0%
20%
40%
60%
80%
Perc
ent o
f Exp
endi
ture
s D
irect
ed to
Out
sour
cing
LatinAmerica
NorthAmerica
WesternEurope
SouthAfrica
Asia-Pacific
2005
2008 - 2010
51
44
67
57
77
69
59
52
70
63
Exhibit 10
North America
Western Europe
Asia-Pacific
Latin America
South Africa
0%
20%
40%
60%
Components of Total Logistics Expenditures
Perc
ent o
f Res
pond
ents
910 812 101110 9 11
16
2925
2823
17
5155 55 54
60
Trans
porta
tion
Ware
hous
ing
Inve
ntor
y Carr
ying
Costs
Adm
inist
ration
&
Infor
mati
on
Man
agem
ent
A strategic issue is how customers feel3PL providers should position themselvesin terms of the depth and breadth of theirservice. When asked whether “third-partysuppliers should provide a broad, compre-hensive set of service offerings,” most ofthe 3PL users strongly agreed (84% to90%). Approximately half of these usersagree “our company is moving torationalize or reduce the number of thirdparties we use.” As suggested as well inthe 2004 study, this observation may bebased on a trend among 3PL users to takesteps to improve and streamline theirprocurement practices in relation toexternally provided, integratedlogistics services.
Views of Non-UsersDepending on the region, 20% to 30% ofthe respondents classify themselves as“non-users” of 3PL services. Thus, severalquestions tried to determine why thesecompanies chose not to outsource logisticsservices (see Exhibit 12 on page 14). Themost prevalent reason is because “logisticsis viewed as a core competency” (thisresponse was given by 35% of the non-users from North America, 44% from Western Europe, and 40%from Latin America). These percentages have increased significantlyfrom those reported in the 2004 study. The reluctance to outsourceactivities and processes that are “core” is understandable, providingthose non-users have sufficient logistics expertise, experience anacceptable return on investment from insourcing, and find that theinternal provision of logistics activities fits strategically with themission of their organizations.
13
3PL 2005: Results and Findings of the 10th Annual Study
Exhibit 11
Outsourced Logistics Services
Logistics Activity North Western Asia- LatinAmerica Europe Pacific America
Outbound Transportation 78% 88% 96% 84%Warehousing 63 72 88 55Customs Clearance and Brokerage 63 49 67 55Inbound Transportation 58 66 68 68Freight Forwarding 56 53 49 45Transportation Management 49 79 82 53Freight Bill Auditing/Payment 45 10 18 11Cross-Docking/Shipment Consolidation 39 50 58 43Order Fulfillment and Distribution 29 31 52 19Consulting Services 23 22 27 23Procurement of Logistics 23 31 42 47Carrier Selection 19 16 24 19Product Marking/Labeling/Packaging 18 27 27 19Product Returns and Repair 18 25 30 9Inventory Management 17 23 36 13Reverse Logistics and Waste Disposal 16 31 24 25Product Assembly/Installation/Manufacturing 16 16 18 0Information Technology 15 21 18 19Rate Negotiation 14 9 12 8Fleet Management 13 26 36 19LLP/4PL Services 11 13 18 8Materials Management 10 10 6 9Inventory Ownership 8 6 6 9Order Entry/Processing/Customer Service 7 8 15 8Customer and Supplier Compliance 5 4 0 2Factoring (Trade Financing) 2 3 6 6
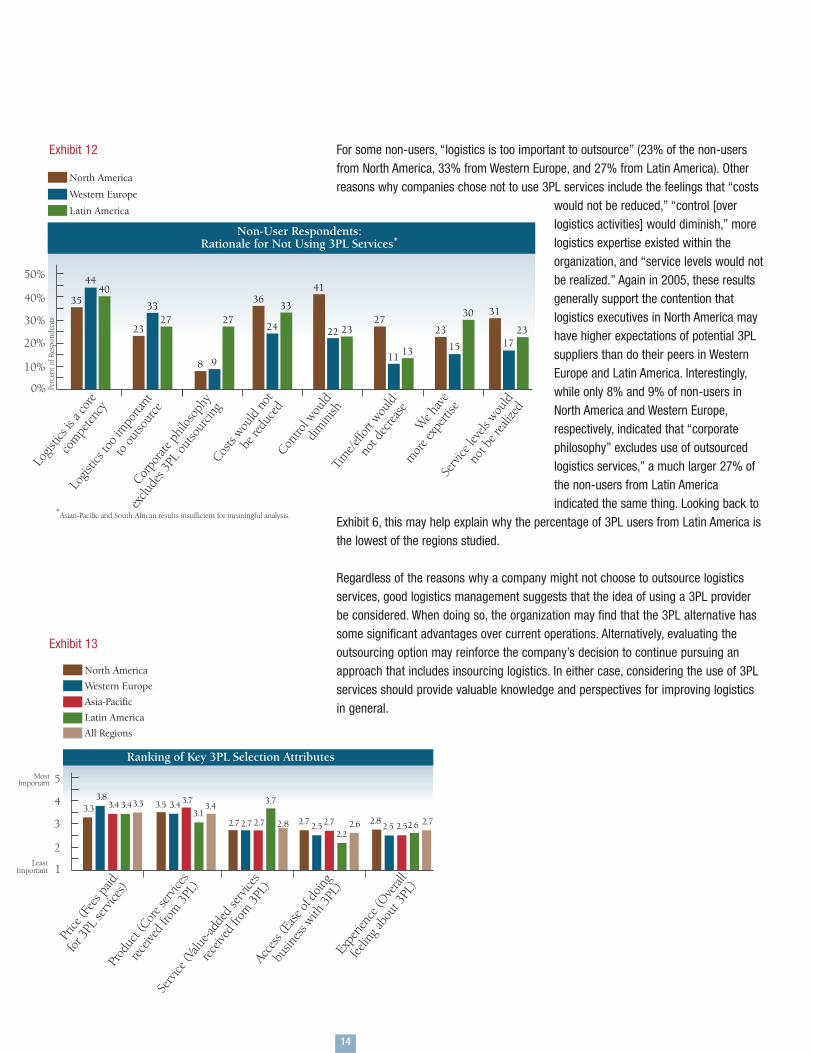
For some non-users, “logistics is too important to outsource” (23% of the non-usersfrom North America, 33% from Western Europe, and 27% from Latin America). Otherreasons why companies chose not to use 3PL services include the feelings that “costs
would not be reduced,” “control [overlogistics activities] would diminish,” morelogistics expertise existed within theorganization, and “service levels would notbe realized.” Again in 2005, these resultsgenerally support the contention thatlogistics executives in North America mayhave higher expectations of potential 3PLsuppliers than do their peers in WesternEurope and Latin America. Interestingly,while only 8% and 9% of non-users inNorth America and Western Europe,respectively, indicated that “corporatephilosophy” excludes use of outsourcedlogistics services,” a much larger 27% ofthe non-users from Latin Americaindicated the same thing. Looking back to
Exhibit 6, this may help explain why the percentage of 3PL users from Latin America isthe lowest of the regions studied.
Regardless of the reasons why a company might not choose to outsource logisticsservices, good logistics management suggests that the idea of using a 3PL providerbe considered. When doing so, the organization may find that the 3PL alternative hassome significant advantages over current operations. Alternatively, evaluating theoutsourcing option may reinforce the company’s decision to continue pursuing anapproach that includes insourcing logistics. In either case, considering the use of 3PLservices should provide valuable knowledge and perspectives for improving logisticsin general.
14
Exhibit 13
1
3
Ranking of Key 3PL Selection Attributes
5
4
2
Acce
ss (E
ase o
f doin
g
busin
ess w
ith 3
PL)
Serv
ice (V
alue-a
dded
serv
ices
receiv
ed fr
om 3
PL)
Expe
rienc
e (Ove
rall
feelin
g abo
ut 3
PL)
LeastImportant
Prod
uct (
Core s
ervic
es
receiv
ed fr
om 3
PL)
2.7 2.82.7 2.7
3.73.3 3.5
3.83.4 3.4
2.7 2.62.5 2.72.2
2.8 2.72.5 2.52.6
North America
Western Europe
Asia-Pacific
Latin America
All Regions
MostImportant
3.5 3.43.4 3.7
Price
(Fee
s paid
for 3
PL se
rvice
s)
3.1
0%
20%
50%
Non-User Respondents:Rationale for Not Using 3PL Services*
40%
30%
10%
Contro
l wou
lddim
inish
We h
ave
mor
e exp
ertise
Serv
ice le
vels
would
not b
e rea
lized
Time/e
ffort
would
not d
ecrea
se
*Asian-Pacific and South African results insufficient for meaningful analysis.
Perc
ent o
f Res
pond
ents
24
3633
11
27
13
22
41
23
15
23
30
Corpo
rate p
hilos
ophy
exclu
des 3
PL ou
tsour
cing
98
27
Logis
tics t
oo im
porta
nt
to ou
tsour
ce
33
2327
Logis
tics i
s a co
re
com
peten
cy
4440
35
Costs
would
not
be re
duce
d
17
31
23
North America
Western Europe
Latin America
Exhibit 12