Sintetizador de 76 Teclas Contrapesado PC3- Kurzweil - Manual Sonigate

Title: 2005 Price Controls Review � Draft Proposals Issue No.: 1 Rev (0) Prepared by:
AR/MPC/MMH Document No. CR/E02/022 Issue Date: 27/07/05
Approved by: NSC
Page 1 of 137
2005 Price Controls Review
Draft Proposals for PC3
July 2005
DOCUMENT NO.: APPROVED BY: NO. OF CONTROLLED DOCUMENT ISSUED.
CR/E02/022
DIRECTOR GENERAL
1. AADC 2. ADDC 3. ADWEA 4. ADWEC 5. RASCO 6. TRANSCO 7. Bureau�s Library
Total: 7

Title: 2005 Price Controls Review � Draft Proposals Issue No.: 1 Rev (0) Prepared by:
AR/MPC/MMH Document No. CR/E02/022 Issue Date: 27/07/05
Approved by: NSC
Page 2 of 137
TABLE OF CONTENTS
FOREWORD............................................................................................................................................... 4
1 SUMMARY OF DRAFT PROPOSALS ........................................................................................... 5 1.1 INTRODUCTION ........................................................................................................................ 5 1.2 FORM OF CONTROLS (SECTION 3) ............................................................................................. 5 1.3 FRAMEWORK FOR PRICE CONTROL CALCULATIONS (SECTION 4) ............................................... 5 1.4 REVENUE DRIVERS (SECTION 5) ............................................................................................... 6 1.5 OPERATING EXPENDITURE (SECTION 6) .................................................................................... 7 1.6 CAPITAL EXPENDITURE (SECTION 7)......................................................................................... 8 1.7 COST OF CAPITAL AND PROFIT MARGIN (SECTION 8) .............................................................. 10 1.8 FINANCIAL ADJUSTMENTS (SECTION 9) .................................................................................. 10 1.9 PRICE CONTROL CALCULATIONS (SECTION 10) ....................................................................... 11 1.10 PERFORMANCE INCENTIVE SCHEME (SECTION 11)................................................................... 12
2 BACKGROUND.............................................................................................................................. 13 2.1 PRICE-CONTROLLED COMPANIES ........................................................................................... 13 2.2 MAIN FEATURES OF CURRENT PRICE CONTROLS..................................................................... 14 2.3 PRESENT PRICE CONTROLS FOR AADC, ADDC, ADWEC AND TRANSCO ............................ 16 2.4 PRESENT PRICE CONTROLS FOR RASCO ................................................................................ 17 2.5 PROGRESS ON THE 2005 PRICE CONTROLS REVIEW ................................................................. 18
3 FORM OF CONTROLS.................................................................................................................. 21 3.1 INTRODUCTION ...................................................................................................................... 21 3.2 TYPE OF REGULATION............................................................................................................ 21 3.3 FORM OF CONTROLS .............................................................................................................. 21 3.4 DURATION OF CONTROLS....................................................................................................... 22 3.5 SEPARATION OF CONTROLS .................................................................................................... 22 3.6 SCOPE OF CONTROLS ............................................................................................................. 24 3.7 REVENUE DRIVERS FOR PC3 .................................................................................................. 26 3.8 SUMMARY OF STRUCTURE OF PC3 CONTROLS ........................................................................ 29
4 FRAMEWORK FOR PRICE CONTROL CALCULATIONS...................................................... 32 4.1 OVERALL APPROACH ............................................................................................................. 32 4.2 WEIGHTS OF REVENUE DRIVERS IN PRICE CONTROL CALCULATIONS....................................... 32 4.3 X FACTOR ............................................................................................................................. 33
5 REVENUE DRIVER PROJECTIONS ........................................................................................... 34 5.1 INTRODUCTION ...................................................................................................................... 34 5.2 OVERALL APPROACH ............................................................................................................. 34 5.3 REVENUE DRIVER PROJECTIONS FOR AADC........................................................................... 35 5.4 REVENUE DRIVER PROJECTIONS FOR ADDC........................................................................... 37 5.5 REVENUE DRIVER PROJECTIONS FOR TRANSCO.................................................................... 38 5.6 SUMMARY OF REVENUE DRIVER PROJECTIONS ....................................................................... 40
6 ASSESSMENT OF OPERATING EXPENDITURES.................................................................... 42 6.1 INTRODUCTION ...................................................................................................................... 42 6.2 OPERATING EXPENDITURE � TO DATE.................................................................................... 42 6.3 COMPANIES� OPEX PROJECTIONS FOR PC3 ............................................................................. 43 6.4 OVERALL APPROACH ............................................................................................................. 44 6.5 ASSESSMENT OF BASE LEVEL OF OPERATING EXPENDITURE.................................................... 44 6.6 ADJUSTMENT TO BASE LEVEL OF OPEX FOR DEMAND INCREASES ........................................... 48

Title: 2005 Price Controls Review � Draft Proposals Issue No.: 1 Rev (0) Prepared by:
AR/MPC/MMH Document No. CR/E02/022 Issue Date: 27/07/05
Approved by: NSC
Page 3 of 137
6.7 ADJUSTMENT TO DEMAND-ADJUSTED OPEX FOR EFFICIENCY IMPROVEMENTS......................... 50 6.8 FURTHER ADJUSTMENT TO OPEX PROJECTIONS FOR OTHER FACTORS...................................... 51 6.9 SUMMARY OF OPEX PROJECTIONS .......................................................................................... 54
7 TREATMENT OF CAPITAL EXPENDITURE AND ASSET VALUATION .............................. 55 7.1 INTRODUCTION ...................................................................................................................... 55 7.2 BUREAU�S APPROACH AT THE PREVIOUS REVIEWS.................................................................. 56 7.3 BUREAU�S REVIEW OF PC1 CAPEX......................................................................................... 57 7.4 REVIEW OF EFFICIENT PC2 CAPEX ......................................................................................... 65 7.5 TREATMENT AND ASSESSMENT OF PC3 CAPEX ....................................................................... 66 7.6 UPDATING OF REGULATORY ASSET VALUES (RAVS).............................................................. 70 7.7 PREPARATION FOR INTRODUCTION OF EX ANTE APPROACH AT NEXT REVIEW ......................... 71
8 COST OF CAPITAL AND PROFIT MARGIN ............................................................................. 72 8.1 INTRODUCTION ...................................................................................................................... 72 8.2 BUREAU�S INITIAL COST OF CAPITAL CALCULATIONS FOR PC3............................................... 72 8.3 BUREAU�S INITIAL ESTIMATE OF PROFIT MARGIN ................................................................... 76 8.4 DRAFT PROPOSALS FOR COST OF CAPITAL AND PROFIT MARGIN ............................................. 77
9 FINANCIAL ADJUSTMENTS....................................................................................................... 79 9.1 INTRODUCTION ...................................................................................................................... 79 9.2 RASCO-RELATED FINANCIAL ADJUSTMENTS FOR AADC AND ADDC ................................... 79 9.3 FINANCIAL ADJUSTMENTS FOR PERFORMANCE ON PIS CATEGORY B DURING PC2 PERIOD ...... 80 9.4 PCR-RELATED FINANCIAL ADJUSTMENTS FOR PC1 PERIOD.................................................... 82 9.5 FINANCIAL ADJUSTMENTS FOR ASSET DISPOSAL OR TRANSFER............................................... 84 9.6 FINANCIAL ADJUSTMENT FOR INFORMATION SUBMISSION....................................................... 85 9.7 FINANCIAL ADJUSTMENT FOR TRANSCO �MANPOWER SERVICES� INCOME IN PC1 ................ 86 9.8 INCENTIVE FOR INCOME COLLECTION BY DISTRIBUTION COMPANIES....................................... 87 9.9 NO FINANCIAL ADJUSTMENT FOR RASCO�S SUBSIDY SHORTFALL DURING 2001-2003............ 87 9.10 IMPACT OF TRANSMISSION SYSTEM DELAYS........................................................................... 88 9.11 SUMMARY OF FINANCIAL ADJUSTMENTS ................................................................................ 88
10 PRICE CONTROL CALCULATIONS .......................................................................................... 90 10.1 INTRODUCTION ...................................................................................................................... 90 10.2 PRICE CONTROL CALCULATIONS ............................................................................................ 91 10.3 SUMMARY RESULTS OF PRICE CONTROL CALCULATIONS � DRAFT PROPOSALS........................ 94 10.4 ANALYSIS OF THE DRAFT PROPOSALS..................................................................................... 95
11 PERFORMANCE INCENTIVE SCHEME.................................................................................... 98 11.1 INTRODUCTION ...................................................................................................................... 98 11.2 CURRENT PERFORMANCE INCENTIVE SCHEME (PIS) ............................................................... 98 11.3 CATEGORY A INDICATORS FOR PC3 ..................................................................................... 101 11.4 TARGETS FOR CATEGORY A INDICATORS FOR PC3................................................................ 105 11.5 INCENTIVE RATES FOR CATEGORY A INDICATORS FOR PC3 .................................................. 106 11.6 EXCEPTIONAL EVENTS AND PERFORMANCE AUDIT FOR PC3 ................................................. 109 11.7 OPERATION OF PIS FOR CATEGORY A INDICATORS FOR PC3 ................................................. 111 11.8 FUTURE CAP ON INCENTIVES FOR CATEGORY A INDICATORS ................................................ 114 11.9 FUTURE CATEGORY B INDICATORS ...................................................................................... 114
APPENDICES A.1 � A.10: UPDATING RAV .................................................................................... 116
APPENDICES B.1 � B.12: PRICE CONTROL CALCULATIONS................................................... 126

Title: 2005 Price Controls Review � Draft Proposals Issue No.: 1 Rev (0) Prepared by:
AR/MPC/MMH Document No. CR/E02/022 Issue Date: 27/07/05
Approved by: NSC
Page 4 of 137
Foreword
In August 2004, the Regulation and Supervision Bureau (the �Bureau�) commenced a review of the price controls that apply to the following companies:
• Al Ain Distribution Company (AADC);
• Abu Dhabi Distribution Company (ADDC);
• Abu Dhabi Water and Electricity Company (ADWEC);
• Abu Dhabi Company for Servicing Remote Areas (more commonly known as the Remote Area Services Company, or �RASCO�); and
• Abu Dhabi Transmission and Despatch Company (TRANSCO).
The present price controls for all five companies are due to expire on 31 December 2005. In the case of RASCO, the Bureau has decided to extend the present price controls for a further two years (2006 and 2007). New price controls for the other four companies are required to take effect from 1 January 2006. These new controls are termed the �third price controls�, or �PC3�.
The Bureau has published the First and Second Consultation Papers in August 2004 and February 2005, respectively, setting out the important issues which need to be considered in setting the PC3 controls. Detailed and helpful responses have been received which have been used by the Bureau to refine its proposed approach.
This document sets out the Bureau�s Draft Proposals for the PC3 controls, all of which are of the CPI-X type and will last for four years (2006 � 2009).
Written responses to the Draft Proposals are requested by 20 September 2005 to the following address:
Mark Clifton Director of Economic Regulation Regulation and Supervision Bureau P.O. Box 32800, Abu Dhabi Fax: 642-4217; Email: [email protected] Following consideration of responses to the Draft Proposals, the Bureau will issue its Final Proposals and proposed licence modifications by mid-November 2005. Each company will then have 28 days to accept or reject them.
NICK CARTER DIRECTOR GENERAL REGULATION AND SUPERVISION BUREAU

Title: 2005 Price Controls Review � Draft Proposals Issue No.: 1 Rev (0) Prepared by:
AR/MPC/MMH Document No. CR/E02/022 Issue Date: 27/07/05
Approved by: NSC
Page 5 of 137
1 Summary of Draft Proposals
1.1 Introduction
Monopoly companies in the sector are subject to price controls set by the Bureau to protect customers and to promote efficiency. The present price controls are due to be replaced by new or third price controls (�PC3�) with effect from 1 January 2006.
This document describes the Bureau�s Draft Proposals for PC3 for AADC, ADDC, ADWEC and TRANSCO taking into account the responses to the Second Consultation Paper issued by the Bureau in February 2005.
In the case of RASCO, for the reasons discussed in Section 2.5 of this document, the Bureau has decided to extend the present price controls for a further two years (2006 and 2007).
1.2 Form of Controls (Section 3)
Broadly-speaking, the form of controls will remain as at present � that is, a CPI-X revenue cap linked to �revenue drivers� and a Performance Incentive Scheme (PIS). The PC3 controls will however incorporate some new structural features compared to the existing controls:
• All controls to be of four years duration (2006 � 2009).
• Separate controls for the water and electricity businesses of ADWEC.
• Separate controls for the supply and distribution businesses of AADC and ADDC.
• Charges levied by the distribution businesses to be pass-through items in the price controls for the supply businesses.
• Income outside of �regulated revenue� to be explicitly defined in advance within a new term, �Excluded Income�.
• ADWEC will be required to produce a formal report to the Bureau if its unit production costs (water or electricity) increase compared to the previous year.
1.3 Framework for Price Control Calculations (Section 4)
Consistent with the approach taken to date, a net present value (NPV) framework is adopted to establish the level and profile of price-controlled revenue for each business:
• The NPV of required revenue over the control period is calculated for the network companies using the �building-block� approach as the sum of the NPVs of (1) opex; (2) depreciation; (3) return on capital; and (4) financial adjustments described in Section 9.
• 70% of revenue is assumed to be recovered via the fixed term (�a�). The remaining 30% of revenue is recovered from the variable revenue drivers (�b� and �c�), equally apportioned between revenue drivers whenever there are two revenue drivers.

Title: 2005 Price Controls Review � Draft Proposals Issue No.: 1 Rev (0) Prepared by:
AR/MPC/MMH Document No. CR/E02/022 Issue Date: 27/07/05
Approved by: NSC
Page 6 of 137
• For ADWEC, the NPV of required revenue is calculated as the sum of the NPV of (1) operating and capital expenditures, (2) allowed profits on turnover, and (3) financial adjustments; and the weight for the fixed term (�A�) for both water and electricity businesses is 100%.
• �X� has been set at zero for all businesses.
1.4 Revenue Drivers (Section 5)
The definitions of revenue drivers are unchanged from PC2 except for the following:
• Following the separation of distribution and supply price controls, customer accounts and metered units distributed will be the revenue drivers for each distribution business, while customer accounts will be the revenue driver for each supply business.
• The peak demand-related revenue drivers for TRANSCO (for both water and electricity) will in future be based only on metered units.
The Bureau�s projections for the variable revenue drivers are summarised in Table 1.1.
Table 1.1: Revenue Driver Projections � Draft Proposals
2006 2007 2008 2009 AADC Electricity customer accounts Customers 93,944 97,274 100,122 102,802 Metered electricity units distributed GWh 6,604 7,233 7,922 8,765 Water customer accounts Customers 48,525 50,048 51,217 52,238 Metered water units distributed MG 20,965 31,660 41,470 51,048 ADDC Electricity customer accounts Customers 205,554 210,008 214,557 218,863 Metered electricity units distributed GWh 14,842 16,106 17,478 18,957 Water customer accounts Customers 176,468 180,324 184,264 188,290 Metered water units distributed MG 69,154 80,137 104,965 129,208 TRANSCO Metered electricity peak demand MW 4,397 4,824 5,073 5,632 Metered electricity units transmitted GWh 23,419 27,043 28,443 31,573 Metered water peak demand MGD 526 557 587 622 Metered water units transmitted MG 175,056 197,206 207,827 220,219
The approach to projecting revenue drivers has been as follows:
• The Bureau has adopted the distribution companies� forecasts of customer numbers, as they are consistent with past trends.
• Overall peak demands, and total units transmitted and distributed, have, in general, been assumed to increase in line with ADWEC�s sector peak demand forecasts.
Title: 2005 Price Controls Review � Draft Proposals Issue No.: 1 Rev (0) Prepared by:
AR/MPC/MMH Document No. CR/E02/022 Issue Date: 27/07/05
Approved by: NSC
Page 7 of 137
• The metering of transmission system exit points is assumed to be complete by mid-2006.
• Distribution companies are assumed to have metered 97% of all final customer demands (water and electricity) by 2009.
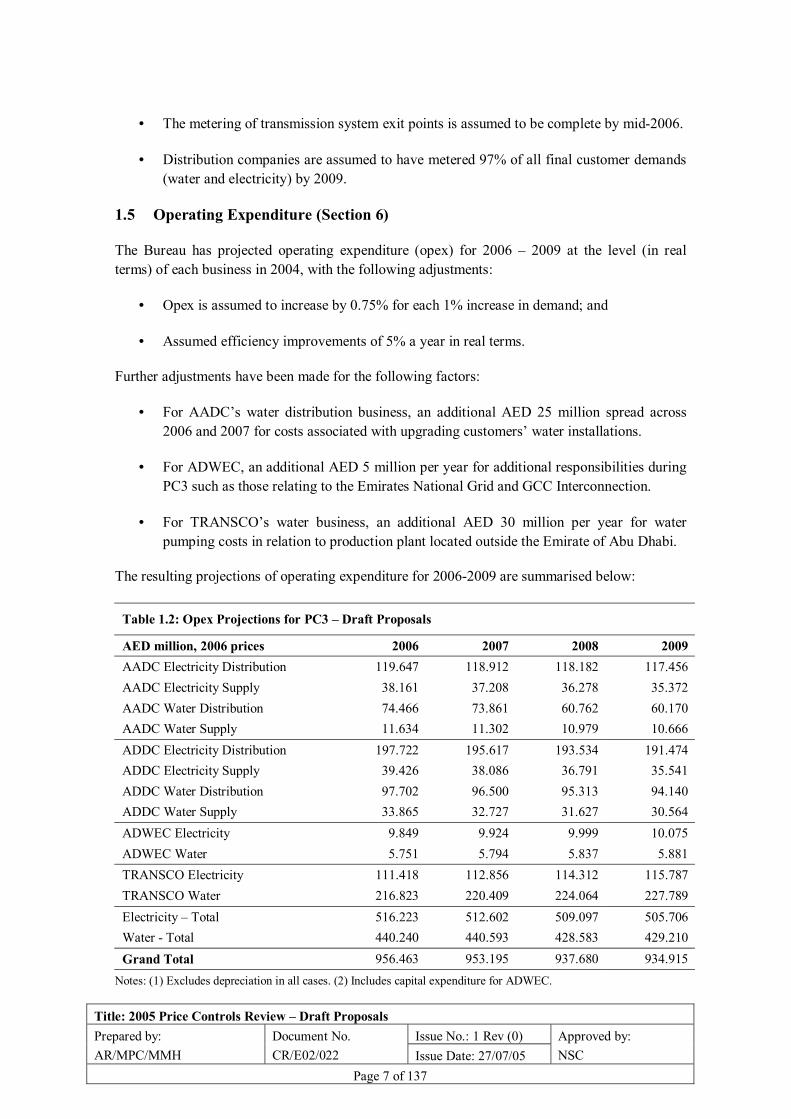
1.5 Operating Expenditure (Section 6)
The Bureau has projected operating expenditure (opex) for 2006 � 2009 at the level (in real terms) of each business in 2004, with the following adjustments:
• Opex is assumed to increase by 0.75% for each 1% increase in demand; and
• Assumed efficiency improvements of 5% a year in real terms.
Further adjustments have been made for the following factors:
• For AADC�s water distribution business, an additional AED 25 million spread across 2006 and 2007 for costs associated with upgrading customers� water installations.
• For ADWEC, an additional AED 5 million per year for additional responsibilities during PC3 such as those relating to the Emirates National Grid and GCC Interconnection.
• For TRANSCO�s water business, an additional AED 30 million per year for water pumping costs in relation to production plant located outside the Emirate of Abu Dhabi.
The resulting projections of operating expenditure for 2006-2009 are summarised below:
Table 1.2: Opex Projections for PC3 � Draft Proposals
AED million, 2006 prices 2006 2007 2008 2009 AADC Electricity Distribution 119.647 118.912 118.182 117.456 AADC Electricity Supply 38.161 37.208 36.278 35.372 AADC Water Distribution 74.466 73.861 60.762 60.170 AADC Water Supply 11.634 11.302 10.979 10.666 ADDC Electricity Distribution 197.722 195.617 193.534 191.474 ADDC Electricity Supply 39.426 38.086 36.791 35.541 ADDC Water Distribution 97.702 96.500 95.313 94.140 ADDC Water Supply 33.865 32.727 31.627 30.564 ADWEC Electricity 9.849 9.924 9.999 10.075 ADWEC Water 5.751 5.794 5.837 5.881 TRANSCO Electricity 111.418 112.856 114.312 115.787 TRANSCO Water 216.823 220.409 224.064 227.789 Electricity � Total 516.223 512.602 509.097 505.706 Water - Total 440.240 440.593 428.583 429.210 Grand Total 956.463 953.195 937.680 934.915
Notes: (1) Excludes depreciation in all cases. (2) Includes capital expenditure for ADWEC.
Title: 2005 Price Controls Review � Draft Proposals Issue No.: 1 Rev (0) Prepared by:
AR/MPC/MMH Document No. CR/E02/022 Issue Date: 27/07/05
Approved by: NSC
Page 8 of 137
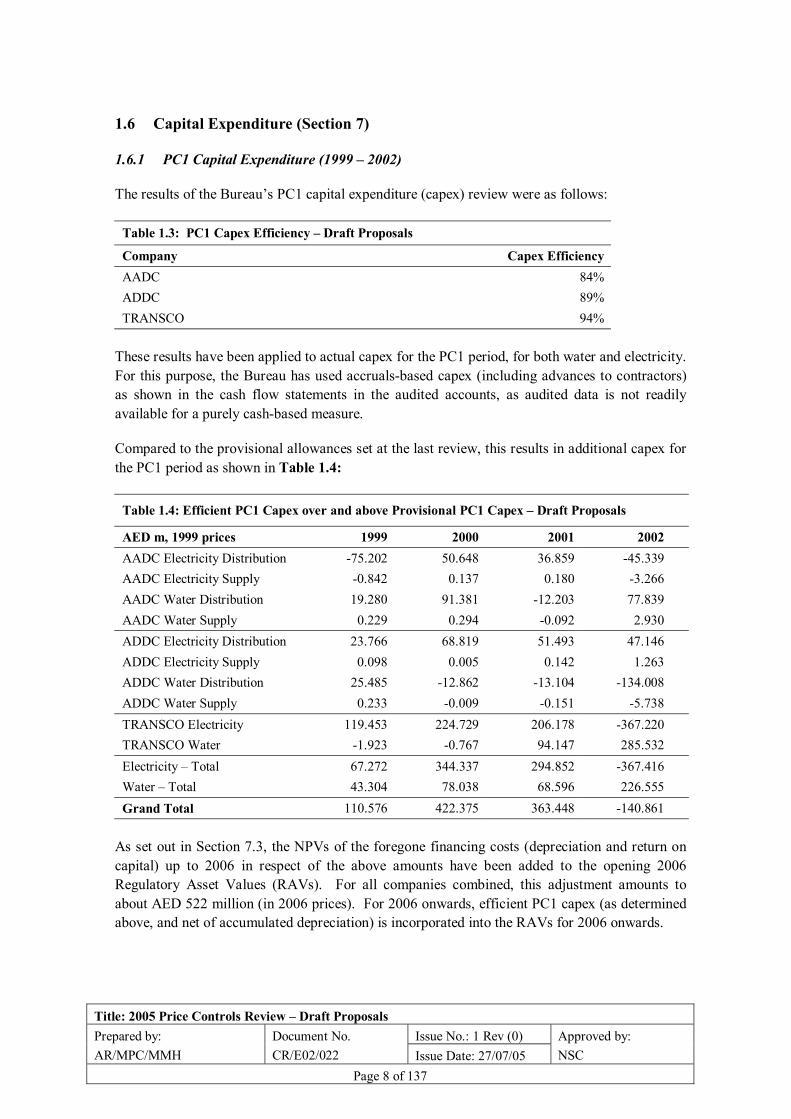
1.6 Capital Expenditure (Section 7)
1.6.1 PC1 Capital Expenditure (1999 � 2002)
The results of the Bureau�s PC1 capital expenditure (capex) review were as follows:
Table 1.3: PC1 Capex Efficiency � Draft Proposals
Company Capex Efficiency AADC 84% ADDC 89% TRANSCO 94%
These results have been applied to actual capex for the PC1 period, for both water and electricity. For this purpose, the Bureau has used accruals-based capex (including advances to contractors) as shown in the cash flow statements in the audited accounts, as audited data is not readily available for a purely cash-based measure.
Compared to the provisional allowances set at the last review, this results in additional capex for the PC1 period as shown in Table 1.4:
Table 1.4: Efficient PC1 Capex over and above Provisional PC1 Capex � Draft Proposals
AED m, 1999 prices 1999 2000 2001 2002 AADC Electricity Distribution -75.202 50.648 36.859 -45.339 AADC Electricity Supply -0.842 0.137 0.180 -3.266 AADC Water Distribution 19.280 91.381 -12.203 77.839 AADC Water Supply 0.229 0.294 -0.092 2.930 ADDC Electricity Distribution 23.766 68.819 51.493 47.146 ADDC Electricity Supply 0.098 0.005 0.142 1.263 ADDC Water Distribution 25.485 -12.862 -13.104 -134.008 ADDC Water Supply 0.233 -0.009 -0.151 -5.738 TRANSCO Electricity 119.453 224.729 206.178 -367.220 TRANSCO Water -1.923 -0.767 94.147 285.532 Electricity � Total 67.272 344.337 294.852 -367.416 Water � Total 43.304 78.038 68.596 226.555 Grand Total 110.576 422.375 363.448 -140.861
As set out in Section 7.3, the NPVs of the foregone financing costs (depreciation and return on capital) up to 2006 in respect of the above amounts have been added to the opening 2006 Regulatory Asset Values (RAVs). For all companies combined, this adjustment amounts to about AED 522 million (in 2006 prices). For 2006 onwards, efficient PC1 capex (as determined above, and net of accumulated depreciation) is incorporated into the RAVs for 2006 onwards.
Title: 2005 Price Controls Review � Draft Proposals Issue No.: 1 Rev (0) Prepared by:
AR/MPC/MMH Document No. CR/E02/022 Issue Date: 27/07/05
Approved by: NSC
Page 9 of 137
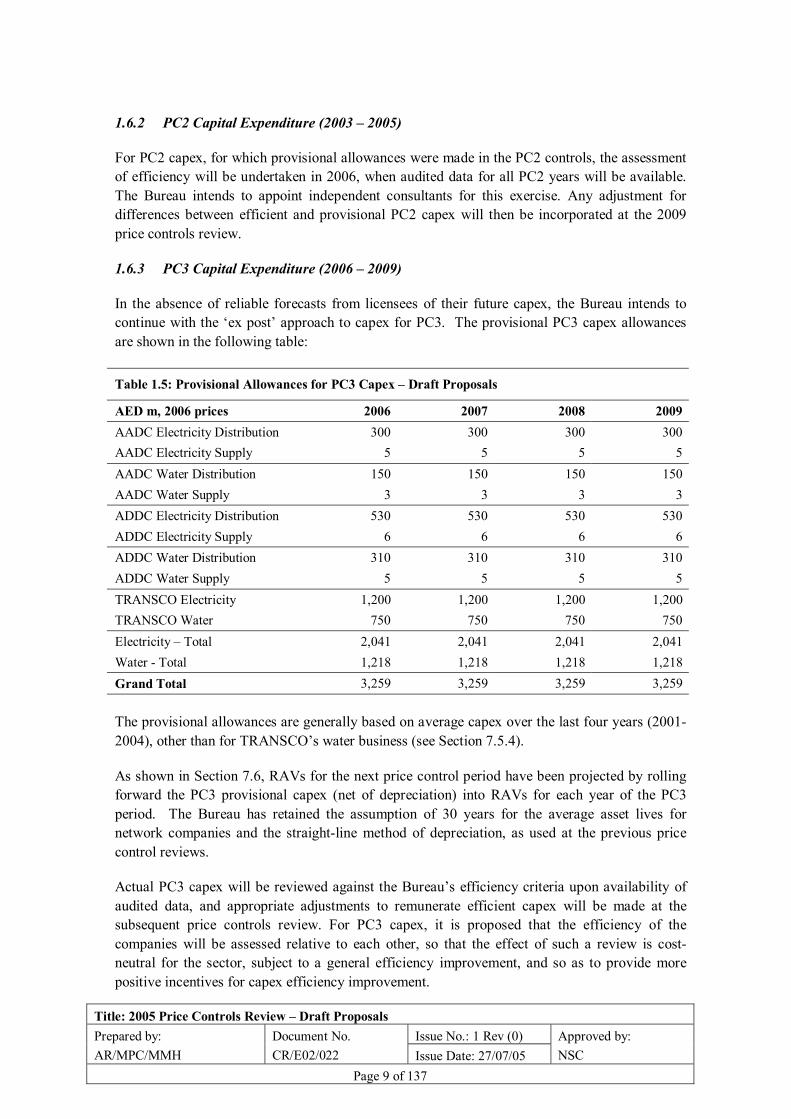
1.6.2 PC2 Capital Expenditure (2003 � 2005)
For PC2 capex, for which provisional allowances were made in the PC2 controls, the assessment of efficiency will be undertaken in 2006, when audited data for all PC2 years will be available. The Bureau intends to appoint independent consultants for this exercise. Any adjustment for differences between efficient and provisional PC2 capex will then be incorporated at the 2009 price controls review.
1.6.3 PC3 Capital Expenditure (2006 � 2009)
In the absence of reliable forecasts from licensees of their future capex, the Bureau intends to continue with the �ex post� approach to capex for PC3. The provisional PC3 capex allowances are shown in the following table:
Table 1.5: Provisional Allowances for PC3 Capex � Draft Proposals
AED m, 2006 prices 2006 2007 2008 2009 AADC Electricity Distribution 300 300 300 300 AADC Electricity Supply 5 5 5 5 AADC Water Distribution 150 150 150 150 AADC Water Supply 3 3 3 3 ADDC Electricity Distribution 530 530 530 530 ADDC Electricity Supply 6 6 6 6 ADDC Water Distribution 310 310 310 310 ADDC Water Supply 5 5 5 5 TRANSCO Electricity 1,200 1,200 1,200 1,200 TRANSCO Water 750 750 750 750 Electricity � Total 2,041 2,041 2,041 2,041 Water - Total 1,218 1,218 1,218 1,218 Grand Total 3,259 3,259 3,259 3,259 The provisional allowances are generally based on average capex over the last four years (2001-2004), other than for TRANSCO�s water business (see Section 7.5.4).
As shown in Section 7.6, RAVs for the next price control period have been projected by rolling forward the PC3 provisional capex (net of depreciation) into RAVs for each year of the PC3 period. The Bureau has retained the assumption of 30 years for the average asset lives for network companies and the straight-line method of depreciation, as used at the previous price control reviews.
Actual PC3 capex will be reviewed against the Bureau�s efficiency criteria upon availability of audited data, and appropriate adjustments to remunerate efficient capex will be made at the subsequent price controls review. For PC3 capex, it is proposed that the efficiency of the companies will be assessed relative to each other, so that the effect of such a review is cost-neutral for the sector, subject to a general efficiency improvement, and so as to provide more positive incentives for capex efficiency improvement.

Title: 2005 Price Controls Review � Draft Proposals Issue No.: 1 Rev (0) Prepared by:
AR/MPC/MMH Document No. CR/E02/022 Issue Date: 27/07/05
Approved by: NSC
Page 10 of 137
The Bureau has retained the present efficiency criteria for PC3 capex with additional guidance on interpretation of these criteria provided in the Bureau�s PC1 capex review reports.
In order to facilitate the possible introduction of an �ex ante� approach to capex regulation at the 2009 price controls review, there will be a new licence requirement on the distribution companies to produce an annual 5 year planning statement.
1.7 Cost of Capital and Profit Margin (Section 8)
The Bureau�s proposals in respect of the cost of capital are summarised below:
Table 1.6: Cost of Capital or Profit Margin � Draft Proposals
Cost of Capital (%, real, post-tax) Margin on Turnover (%) AADC / ADDC (all businesses) 5.30% - ADWEC (both businesses) - 0.021% TRANSCO (both businesses) 5.00% -
The proposed cost of capital for TRANSCO lies towards the middle of the range calculated in the Second Consultation Paper based on evidence from overseas regulators and local/regional capital markets. For AADC and ADDC, the Bureau has added a premium of 0.30% for specific risks associated with the distribution and supply businesses.
For ADWEC, which has few capital assets, the Bureau has allowed a margin of 0.021% on projected total turnover. This has been calculated by adjusting the margin allowed in setting the PC2 controls for ADWEC for the reduced cost of capital (of 5%).
1.8 Financial Adjustments (Section 9)
The Bureau has proposed a number of additional adjustments to the PC3 revenue requirement:
• For costs incurred by AADC and ADDC in 2001 and 2002 which have previously not been financed associated with distribution and supply assets inherited from RASCO (positive adjustment).
• For TRANSCO�s economic despatch performance during PC2 (negative adjustment).
• For necessary amendments to audited PCRs for AADC, ADDC and TRANSCO for PC1 (negative adjustments).
• For ADWEC�s Information Submissions in 2003 and 2004 (negative adjustment).
• For TRANSCO�s income from unlicensed activities erroneously financed within the PC1 controls (negative adjustment).
The total financial adjustments for all businesses amount to about -AED 196 million, which is equivalent to less than 1.5% of the total NPV of MARs projected for the PC3 period.

Title: 2005 Price Controls Review � Draft Proposals Issue No.: 1 Rev (0) Prepared by:
AR/MPC/MMH Document No. CR/E02/022 Issue Date: 27/07/05
Approved by: NSC
Page 11 of 137
1.9 Price Control Calculations (Section 10)
Section 10 presents the price control calculations for each business. The resulting notified values of �a�, �b�, �c� and X are given in the following table:
Table 1.7: Notified Values for PC3 � Draft Proposals
Values for 2006 X a or A b c
AADC Electricity Distribution 0.00 299.45 AEDm 652.46 AED/customer account 0.85 fils/kWh metered AADC Electricity Supply 0.00 27.59 AEDm 120.23 AED/customer account AADC Water Distribution 0.00 112.35 AEDm 477.44 AED/customer account 0.68 AED/TIG metered AADC Water Supply 0.00 8.78 AEDm 74.62 AED/customer account ADDC Electricity Distribution 0.00 579.54 AEDm 585.90 AED/customer account 0.74 fils/kWh metered ADDC Electricity Supply 0.00 29.16 AEDm 58.95 AED/customer account ADDC Water Distribution 0.00 225.20 AEDm 265.03 AED/customer account 0.51 AED/TIG metered ADDC Water Supply 0.00 24.35 AEDm 57.32 AED/customer account ADWEC Electricity 0.00 10.56 AEDm n/a n/a ADWEC Water 0.00 6.33 AEDm n/a n/a TRANSCO Electricity 0.00 706.27 AEDm 30.53 AED/kW metered 0.55 fils/kWh metered TRANSCO Water 0.00 599.82 AEDm 225.08 AED/TIGD metered 0.65 AED/TIG metered
The annual Maximum Allowed Revenues (MARs) projected for each business over the PC3 period in respect of its �own costs� are summarised below:
Table 1.8: Projected MARs for PC3 Period (Excluding Pass-Through Costs) � Draft Proposals
AED million, 2006 prices 2006 2007 2008 2009 AADC Electricity Distribution 416.61 424.11 431.79 440.67 AADC Electricity Supply 38.88 39.28 39.63 39.95 AADC Water Distribution 149.69 157.64 164.82 171.78 AADC Water Supply 12.40 12.51 12.60 12.68 ADDC Electricity Distribution 809.96 821.94 834.77 848.26 ADDC Electricity Supply 41.28 41.54 41.81 42.06 ADDC Water Distribution 307.27 313.90 327.61 341.05 ADDC Water Supply 34.47 34.69 34.91 35.15 ADWEC Electricity 10.56 10.56 10.56 10.56 ADWEC Water 6.33 6.33 6.33 6.33 TRANSCO Electricity 969.57 1,002.57 1,017.91 1,052.21 TRANSCO Water 831.17 852.44 866.05 881.92 Electricity � Total 2,286.87 2,340.01 2,376.47 2,433.70 Water � Total 1,341.33 1,377.52 1,412.34 1,448.92 Grand Total 3,628.20 3,717.52 3,788.80 3,882.62

Title: 2005 Price Controls Review � Draft Proposals Issue No.: 1 Rev (0) Prepared by:
AR/MPC/MMH Document No. CR/E02/022 Issue Date: 27/07/05
Approved by: NSC
Page 12 of 137
Total annual price-controlled revenue excluding pass-through costs during the PC3 period is expected to increase to about AED 3.9 billion by 2009. However, as a result of these Draft Proposals and due to growth in demand, unit costs for electricity and water are expected in 2009 to be, respectively, 13% and 27% lower (in real terms) than in 1999.
1.10 Performance Incentive Scheme (Section 11)
The Bureau proposes to extend the Performance Incentive Scheme (PIS) for additional �Category A� indicators. The overall cap on the revenue adjustments for the good (or poor) performance of the business on Category A indicators via the term �Q� will be increased to 4% of MAR in respect of �own costs� in that year.
The proposed Category A measures are as follows (note: �*� indicates new Category A indicator for which the first year of assessment will be for performance in 2007):
• Timeliness of Audited Separate Business Accounts (SBAs) (all businesses).
• Timeliness of Audited Price Control Return (PCRs) (all businesses).
• Timeliness of Annual Information Submission (AIS) (all businesses).*
• Accuracy of Annual Peak Demand Forecasts (ADWEC�s water and electricity businesses).*
• Water Quality (network water businesses).*
• Availability and Energy Lost (TRANSCO�s electricity business).*
• Number of Interruptions and Customer Minutes Lost (ADDC/AADC electricity distribution businesses).*
Detailed definitions, incentive rates and targets for the above indicators are given in Section 11. Data for each indicator will be required to be audited as part of the annual PCR.
There will be a new requirement for licensees to commission a �Technical Assessor� � an independent consulting engineer, approved by the Bureau - to verify the accuracy of technical information, although the overall PCR will ultimately still need to be signed off by the auditors.
For most of the new indicators, allowance will be made for �exceptional events� outside the licensee�s control.
The Bureau has also proposed a number of �Category B� performance indicators which will be monitored over the PC3 period, with positive or negative financial adjustments at the next review for good or poor performance, respectively. The overall Category B adjustment for each business will not exceed 2% of the MAR (excluding pass-through costs) in any year and will be limited to indicators where the performance is found to be exceptionally good or poor.
Title: 2005 Price Controls Review � Draft Proposals Issue No.: 1 Rev (0) Prepared by:
AR/MPC/MMH Document No. CR/E02/022 Issue Date: 27/07/05
Approved by: NSC
Page 13 of 137
2 Background
2.1 Price-Controlled Companies
The Abu Dhabi water and electricity sector is characterised by a �single-buyer� structure and independent regulation by the Bureau established by Law No (2) of 1998. The following five sector companies are monopolies and hence are subject to controls on their prices set by the Bureau to protect customers from market power and to promote economic efficiency:
− ADWEC, the �single buyer�, which is responsible for planning and contracting for new production capacity for the sector. It purchases capacity and output from Generation and Desalination Companies (GDs) under the terms of Power and Water Purchase Agreements (PWPAs) and also purchases fuel for supply to GDs. ADWEC then sells bulk supplies of water and electricity to the distribution companies at the Bulk Supply Tariffs (BSTs).
− TRANSCO, which is responsible for the transmission and despatch of both electricity and water and which earns revenue from the distribution companies in the form of Transmission Use-of-System (TUoS) charges and, potentially, connection charges.
− ADDC and AADC, which undertake the distribution and supply of water and electricity in the municipality areas of Abu Dhabi and Al Ain, respectively. They purchase water and electricity from ADWEC and RASCO, pay TUoS charges to TRANSCO, and receive revenue from final customers and subsidy from the Government.
− RASCO, which undertakes electricity generation and water production in remote areas.1 While RASCO has contracted out the operation of these activities to the two distribution companies, they remain RASCO�s legal responsibility.
The first price controls (PC1) for AADC, ADDC, ADWEC and TRANSCO ran from 1999 to 2002. The second price controls (PC2) were set in 2002 to apply for three years (2003-2005).
A set of price controls was established for RASCO in 2003 to apply for two years (2004 and 2005). Previously, some activities of RASCO were subject to tariffs approved by the Bureau.
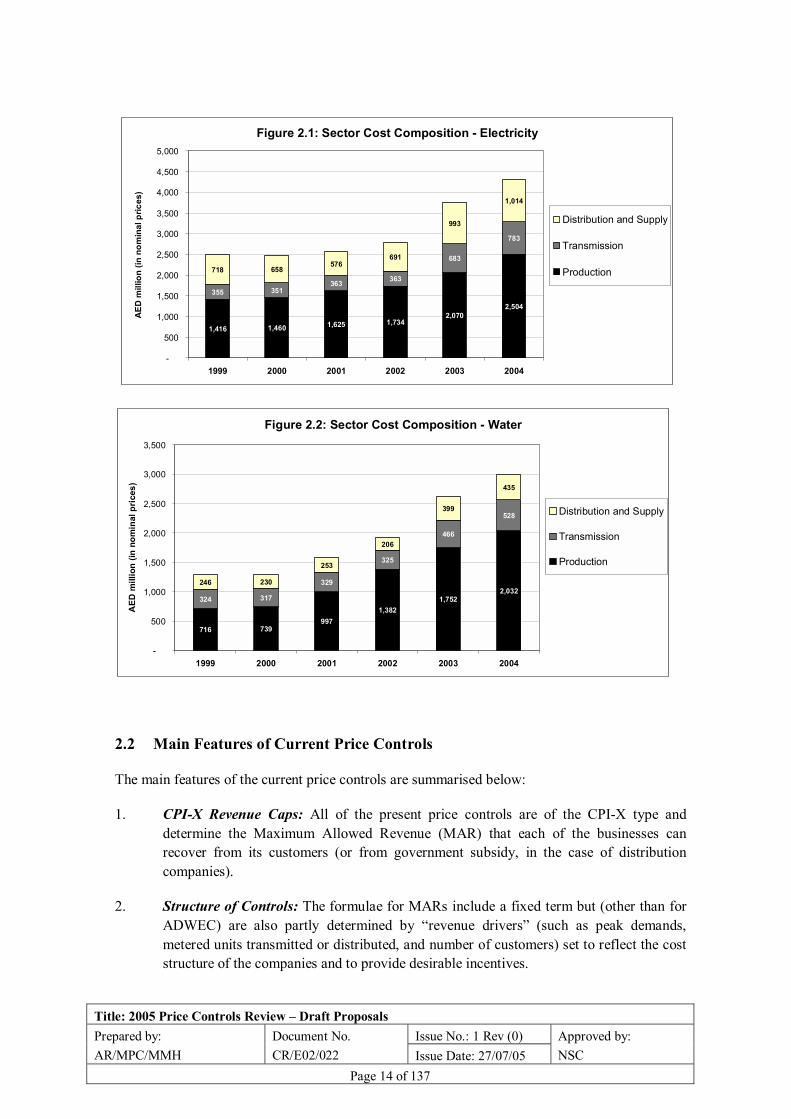
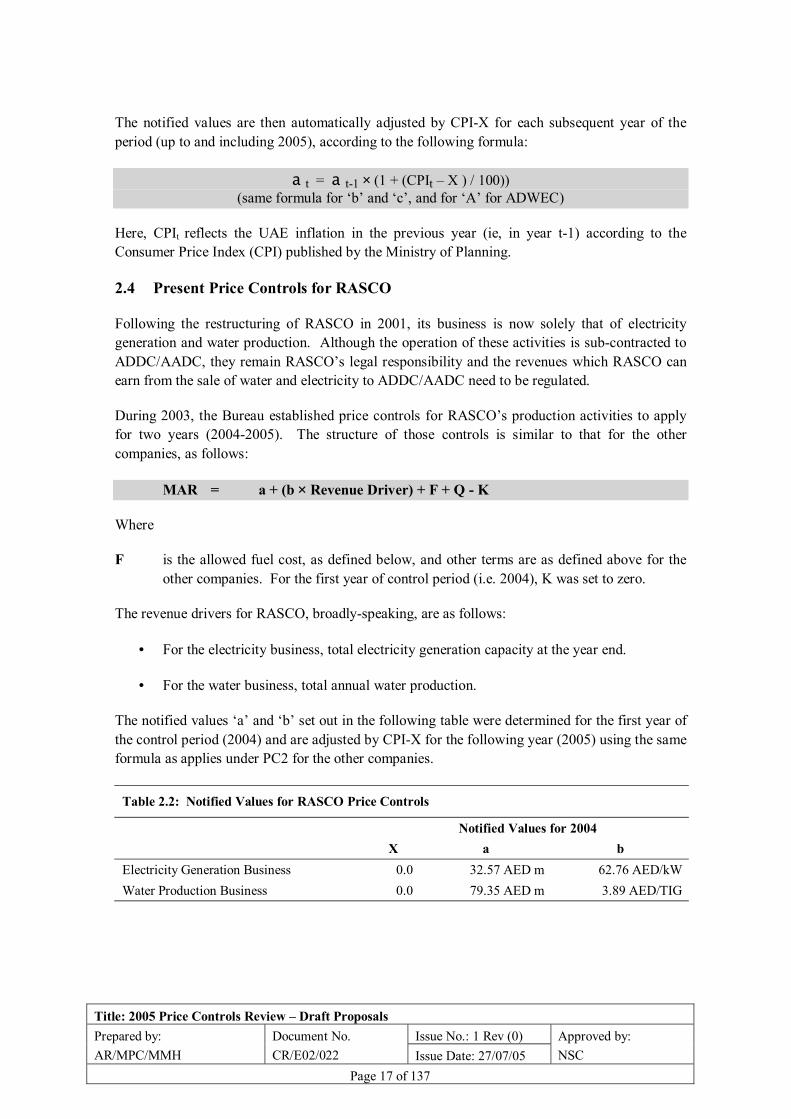
Sector turnover in 2004 was about AED 7.3 billion, about 60% of which relates to electricity. Figures 2.1 and 2.2 indicate the composition of electricity and water costs, respectively, in terms of revenue from production, transmission, and distribution and supply businesses. Production costs account for about 60% of electricity costs and about 65% of water costs. The remaining costs are subject to the price controls set by the Bureau.
1 RASCO�s distribution and supply assets were transferred to the distribution companies in 2001.
Title: 2005 Price Controls Review � Draft Proposals Issue No.: 1 Rev (0) Prepared by:
AR/MPC/MMH Document No. CR/E02/022 Issue Date: 27/07/05
Approved by: NSC
Page 14 of 137
Figure 2.1: Sector Cost Composition - Electricity
1,416 1,460 1,625 1,7342,070
2,504
355 351363 363
683
783
718 658576
691
993
1,014
-
500
1,000
1,500
2,000
2,500
3,000
3,500
4,000
4,500
5,000
1999 2000 2001 2002 2003 2004
AED
mill
ion
(in n
omin
al p
rices
)
Distribution and Supply
Transmission
Production
Figure 2.2: Sector Cost Composition - Water
716 739997
1,3821,752
2,032324 317
329
325
466
528
246 230
253
206
399
435
-
500
1,000
1,500
2,000
2,500
3,000
3,500
1999 2000 2001 2002 2003 2004
AED
mill
ion
(in n
omin
al p
rices
)
Distribution and Supply
Transmission
Production
2.2 Main Features of Current Price Controls
The main features of the current price controls are summarised below:
1. CPI-X Revenue Caps: All of the present price controls are of the CPI-X type and determine the Maximum Allowed Revenue (MAR) that each of the businesses can recover from its customers (or from government subsidy, in the case of distribution companies).
2. Structure of Controls: The formulae for MARs include a fixed term but (other than for ADWEC) are also partly determined by �revenue drivers� (such as peak demands, metered units transmitted or distributed, and number of customers) set to reflect the cost structure of the companies and to provide desirable incentives.

Title: 2005 Price Controls Review � Draft Proposals Issue No.: 1 Rev (0) Prepared by:
AR/MPC/MMH Document No. CR/E02/022 Issue Date: 27/07/05
Approved by: NSC
Page 15 of 137
3. Separation of Controls: To date, there have been separate price controls for the water and electricity businesses of all the companies, except ADWEC, which has been subject to a single price control. For the distribution companies, the current price controls (separate for water and electricity) cover both distribution and supply activities.
4. Pass-Through Costs: Price controls apply directly to companies� �own costs�, which are considered to be within their control. Costs which are subject to competition, or to regulation elsewhere in the supply chain, are treated on a pass-through basis. These include: PWPA and fuel costs for ADWEC; and power/water purchase costs and transmission costs for AADC and ADDC.
5. Efficient Levels of Costs: The price controls were set to allow the companies to recover an efficient level of costs, comprising allowances for operating expenditure, depreciation and a return on capital.
6. Treatment of Opex: While setting the current price controls, operating expenditure (opex) was projected to remain constant in real terms. Effectively this meant that the costs of demand growth were assumed to be financed out of efficiency improvements amounting to 5% a year.
7. Treatment of Capex: With the exception of RASCO, allowances for capex have been set on the basis of �ex-post� assessment � i.e., allowed capital expenditure is determined after the event (based on efficiency criteria established by the Bureau). While the PC1 controls made no allowance for capex over 1999�2002, the PC2 controls included provisional capex allowances for both 1999-2002 and 2003-2005. It was agreed that once the Bureau receives audited data on actual capex over 1999-2002 and 2003-2005, it will be reviewed against its efficiency criteria. Any difference between efficient past capex and the provisional allowances will be reflected in a financial adjustment (to future revenues) at the subsequent price controls review.
8. Cost of Capital: A real post-tax cost of capital of 6% has been used to date in setting the price controls for all companies. In the case of ADWEC, which has few physical capital assets, the return was expressed as a return on turnover (profit margin of 0.025%).
9. Performance Incentive Scheme: A Performance Incentive Scheme (PIS) was introduced as part of the present price controls to incentivise the companies to improve their performance on various aspects of their operations. Certain output measures (termed �Category A� indicators) are directly linked to the price controls while other output measures (termed �Category B� indicators) are monitored by the Bureau for possible financial adjustment for good or poor performance at a later date.

Title: 2005 Price Controls Review � Draft Proposals Issue No.: 1 Rev (0) Prepared by:
AR/MPC/MMH Document No. CR/E02/022 Issue Date: 27/07/05
Approved by: NSC
Page 16 of 137
2.3 Present Price Controls for AADC, ADDC, ADWEC and TRANSCO
The PC2 price controls for AADC, ADDC, ADWEC and TRANSCO are summarised below:
ADDC & AADC (separate water and electricity price controls)
MAR = Electricity or Water Purchase Costs + Transmission Charges + DSR + Q - K
DSR = a + (b × Number of Customers) + (c × Metered Units Distributed)
ADWEC
MAR = PWPA Costs + Fuel Costs + A + Q � K
TRANSCO (separate water and electricity price controls)
MAR = a + (b × Peak Demand) + (c × Metered Units Transmitted) + A + Q - K
Where:
�A� for ADWEC means its maximum allowed procurement cost;
�A� for TRANSCO�s electricity business means its allowed ancillary services costs;
�a� is the notified value for the fixed amount;
�b� and �c� are the notified values for first and second variable revenue drivers respectively;
�DSR� is the allowed distribution and supply revenue for ADDC and AADC;
�K� is the correction factor adjusting any over- or under-recovery in the preceding year; and
�Q� is the revenue adjustment for performance under the PIS in the previous year.
The notified values of, �a�, �b� and �c�, and of �A� for ADWEC, were determined for the first year of the PC2 control period (2003) as shown in Table 2.1 below.
Table 2.1: Notified Values for PC2
Notified Values for 2003 X A or a b c ADWEC Procurement 0.0 10.72 AED m n/a n/a TRANSCO Electricity 0.0 522.77 AED m 44.28 AED/kW 1.05 fils/kWh TRANSCO Water 0.0 347.75 AED m 305.57 AED/TIG 0.44 AED/TIG ADDC Electricity 0.0 442.01 AED m 761.40 AED/customer account 0.45 fils/kWh ADDC Water 0.0 197.56 AED m 382.74 AED/customer account 0.69 AED/TIG AADC Electricity 0.0 235.68 AED m 1,028.83 AED/customer account 0.57 fils/kWh AADC Water 0.0 92.74 AED m 586.50 AED/customer account 1.75 AED/TIG
Title: 2005 Price Controls Review � Draft Proposals Issue No.: 1 Rev (0) Prepared by:
AR/MPC/MMH Document No. CR/E02/022 Issue Date: 27/07/05
Approved by: NSC
Page 17 of 137
The notified values are then automatically adjusted by CPI-X for each subsequent year of the period (up to and including 2005), according to the following formula:
a t = a t-1 × (1 + (CPIt � X ) / 100)) (same formula for �b� and �c�, and for �A� for ADWEC)
Here, CPIt reflects the UAE inflation in the previous year (ie, in year t-1) according to the Consumer Price Index (CPI) published by the Ministry of Planning.
2.4 Present Price Controls for RASCO
Following the restructuring of RASCO in 2001, its business is now solely that of electricity generation and water production. Although the operation of these activities is sub-contracted to ADDC/AADC, they remain RASCO�s legal responsibility and the revenues which RASCO can earn from the sale of water and electricity to ADDC/AADC need to be regulated.
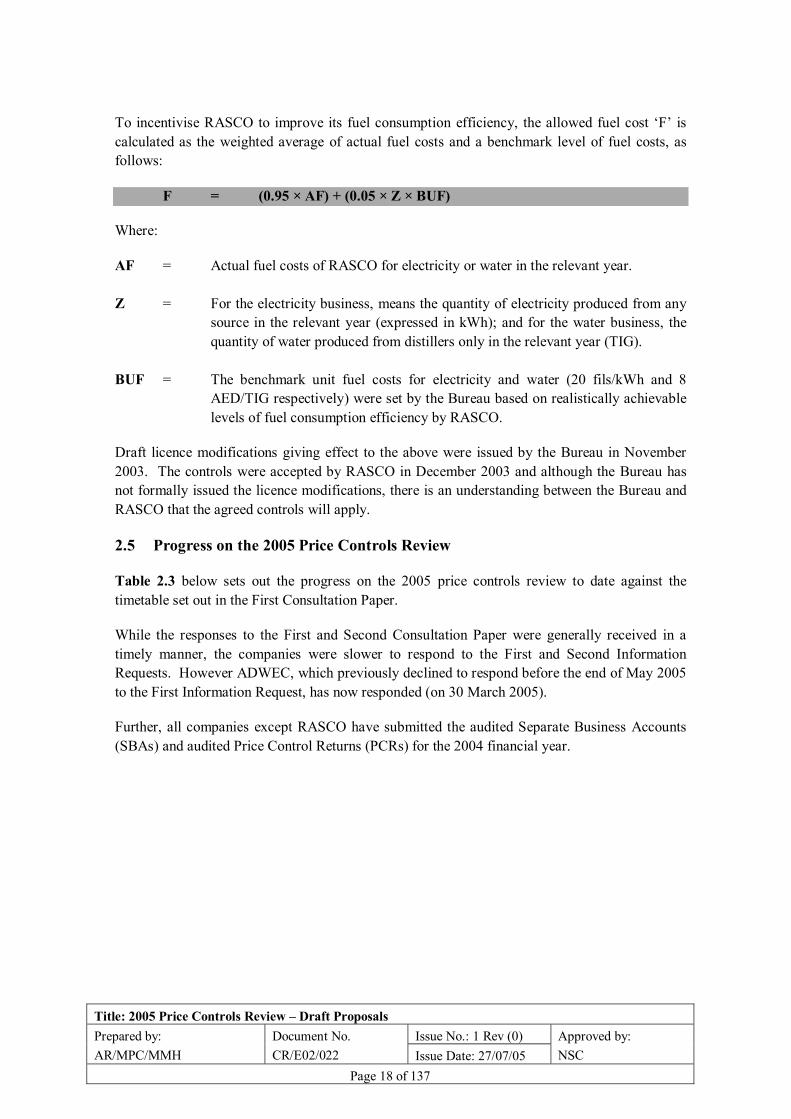
During 2003, the Bureau established price controls for RASCO�s production activities to apply for two years (2004-2005). The structure of those controls is similar to that for the other companies, as follows:
MAR = a + (b × Revenue Driver) + F + Q - K
Where
F is the allowed fuel cost, as defined below, and other terms are as defined above for the other companies. For the first year of control period (i.e. 2004), K was set to zero.
The revenue drivers for RASCO, broadly-speaking, are as follows:
• For the electricity business, total electricity generation capacity at the year end.
• For the water business, total annual water production.
The notified values �a� and �b� set out in the following table were determined for the first year of the control period (2004) and are adjusted by CPI-X for the following year (2005) using the same formula as applies under PC2 for the other companies.
Table 2.2: Notified Values for RASCO Price Controls
Notified Values for 2004 X a b Electricity Generation Business 0.0 32.57 AED m 62.76 AED/kW Water Production Business 0.0 79.35 AED m 3.89 AED/TIG
Title: 2005 Price Controls Review � Draft Proposals Issue No.: 1 Rev (0) Prepared by:
AR/MPC/MMH Document No. CR/E02/022 Issue Date: 27/07/05
Approved by: NSC
Page 18 of 137
To incentivise RASCO to improve its fuel consumption efficiency, the allowed fuel cost �F� is calculated as the weighted average of actual fuel costs and a benchmark level of fuel costs, as follows:
F = (0.95 × AF) + (0.05 × Z × BUF)
Where:
AF = Actual fuel costs of RASCO for electricity or water in the relevant year. Z = For the electricity business, means the quantity of electricity produced from any
source in the relevant year (expressed in kWh); and for the water business, the quantity of water produced from distillers only in the relevant year (TIG).
BUF = The benchmark unit fuel costs for electricity and water (20 fils/kWh and 8
AED/TIG respectively) were set by the Bureau based on realistically achievable levels of fuel consumption efficiency by RASCO.
Draft licence modifications giving effect to the above were issued by the Bureau in November 2003. The controls were accepted by RASCO in December 2003 and although the Bureau has not formally issued the licence modifications, there is an understanding between the Bureau and RASCO that the agreed controls will apply.
2.5 Progress on the 2005 Price Controls Review
Table 2.3 below sets out the progress on the 2005 price controls review to date against the timetable set out in the First Consultation Paper.
While the responses to the First and Second Consultation Paper were generally received in a timely manner, the companies were slower to respond to the First and Second Information Requests. However ADWEC, which previously declined to respond before the end of May 2005 to the First Information Request, has now responded (on 30 March 2005).
Further, all companies except RASCO have submitted the audited Separate Business Accounts (SBAs) and audited Price Control Returns (PCRs) for the 2004 financial year.

Title: 2005 Price Controls Review � Draft Proposals Issue No.: 1 Rev (0) Prepared by:
AR/MPC/MMH Document No. CR/E02/022 Issue Date: 27/07/05
Approved by: NSC
Page 19 of 137
Table 2.3: Progress to Date on 2005 Price Controls Review
Target Date Task Actual Date First Phase � Issues and Data 30 August 2004 Bureau published First Consultation Paper 30 August 2004 15 September 2004 Bureau made presentation to Companies 15 September 2004 15 September 2004 Bureau issued First Information Request 15 September 2004 13 October 2004 Responses to First Consultation Paper:
AADC ADDC ADWEC RASCO TRANSCO
13 October 2004 13 October 2004 19 October 2004 No response 16 October 2004
10 November 2004 Responses to First Information Request: AADC ADDC ADWEC RASCO TRANSCO
17 January 2005 (partial) 18 December 2004 (partial) No response No response 5 December 2004 (partial)
Second Phase � Analysis and Assessment 2 February 2005 Bureau published Second Consultation Paper 2 February 2005 16 February 2005 Bureau made presentation to Companies 14 February 2005 16 February 2005 Bureau issued Second Information Request 15 February 2005 16 March 2005 Responses to Second Consultation Paper:
AADC ADDC ADWEC RASCO TRANSCO
15 March 2005 19 March 2005 20 March 2005 No response 26 March 2005
13 April 2005 Responses to Second Information Request: AADC ADDC ADWEC RASCO TRANSCO
4 May 2005 3 May 2005 30 March 2005 No response 14 April 2005
Title: 2005 Price Controls Review � Draft Proposals Issue No.: 1 Rev (0) Prepared by:
AR/MPC/MMH Document No. CR/E02/022 Issue Date: 27/07/05
Approved by: NSC
Page 20 of 137
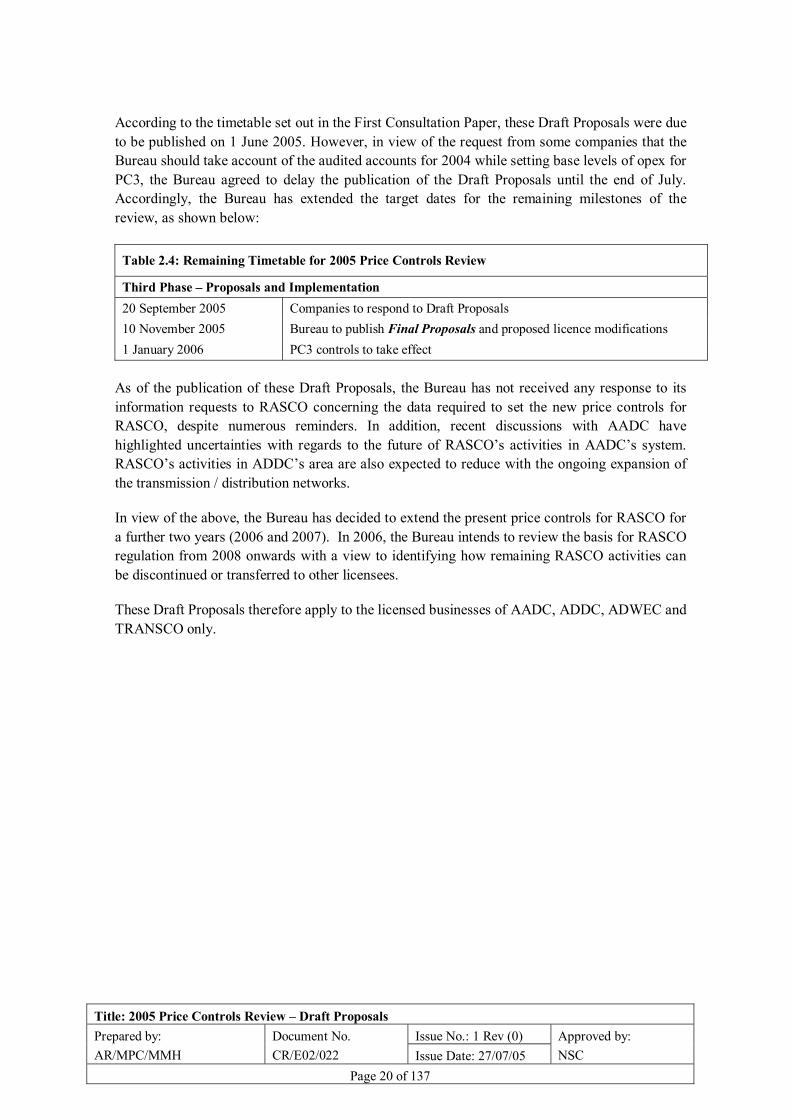
According to the timetable set out in the First Consultation Paper, these Draft Proposals were due to be published on 1 June 2005. However, in view of the request from some companies that the Bureau should take account of the audited accounts for 2004 while setting base levels of opex for PC3, the Bureau agreed to delay the publication of the Draft Proposals until the end of July. Accordingly, the Bureau has extended the target dates for the remaining milestones of the review, as shown below:
Table 2.4: Remaining Timetable for 2005 Price Controls Review
Third Phase � Proposals and Implementation 20 September 2005 Companies to respond to Draft Proposals 10 November 2005 Bureau to publish Final Proposals and proposed licence modifications 1 January 2006 PC3 controls to take effect
As of the publication of these Draft Proposals, the Bureau has not received any response to its information requests to RASCO concerning the data required to set the new price controls for RASCO, despite numerous reminders. In addition, recent discussions with AADC have highlighted uncertainties with regards to the future of RASCO�s activities in AADC�s system. RASCO�s activities in ADDC�s area are also expected to reduce with the ongoing expansion of the transmission / distribution networks.
In view of the above, the Bureau has decided to extend the present price controls for RASCO for a further two years (2006 and 2007). In 2006, the Bureau intends to review the basis for RASCO regulation from 2008 onwards with a view to identifying how remaining RASCO activities can be discontinued or transferred to other licensees.
These Draft Proposals therefore apply to the licensed businesses of AADC, ADDC, ADWEC and TRANSCO only.
Title: 2005 Price Controls Review � Draft Proposals Issue No.: 1 Rev (0) Prepared by:
AR/MPC/MMH Document No. CR/E02/022 Issue Date: 27/07/05
Approved by: NSC
Page 21 of 137
3 Form of Controls
3.1 Introduction
This section discusses the overall design of the controls for the PC3 period:
• the type of regulation (CPI-X);
• the form of the controls and the definition of revenue drivers;
• the duration of the controls;
• the separation of controls; and
• the scope of the controls (definition of �regulated revenue�).
As discussed above, the Bureau has decided to extend the present price controls for RASCO to 2006 and 2007, and so the discussion in the following sections applies only to AADC, ADDC, ADWEC and TRANSCO.
3.2 Type of Regulation
The monopoly companies in the sector are presently subject to CPI-X price controls. This means that their allowed revenues are constrained to change each year by a measure of price inflation (CPI) less a factor, X.
The Second Consultation Paper proposed the continuation of the existing CPI-X type of regulation, in view of its strong efficiency incentives, consistency of regulation and supportive views from all the respondents to the earlier paper.
CPI-X regulation continues to have the support of all respondents, and so has been adopted for these Draft Proposals.
AADC and ADWEC commented on the effects of CPI-X regulation on the cost of capital and operating expenditure, respectively, which are discussed in the relevant sections of this paper.
3.3 Form of Controls
The price controls have to date taken the form of revenue caps comprising a fixed component and one or two components linked to �revenue drivers�. These revenue caps are constrained to change each year by CPI-X and by the changes in the values of the revenue drivers. The exception to this is ADWEC whose revenue cap, at its own request, comprises only a fixed term.
The First and Second Consultation Papers considered other forms for the PC3 controls, such as a �revenue yield� (average revenue) control and a pure revenue cap. However, the continuation of the existing form of control was considered to be the best way of meeting the various objectives identified by the Bureau and licensees. The existing form of controls is now well understood by sector participants and has provided a clear and universally accepted methodology for calculating

Title: 2005 Price Controls Review � Draft Proposals Issue No.: 1 Rev (0) Prepared by:
AR/MPC/MMH Document No. CR/E02/022 Issue Date: 27/07/05
Approved by: NSC
Page 22 of 137
the sector subsidy requirement. By appropriate weighting of the fixed term and the revenue drivers, cost risks arising from demand growth can be limited while preserving the incentive to meet growing demands. It also provides strong incentives to increase metering and to reduce losses.
All the respondents to the Second Consultation Paper supported the continuation of the existing form of controls.
3.4 Duration of Controls
Both the PC1 and PC2 price controls were set for three years, although the PC1 controls were subsequently extended for a further year. A relatively short duration was justified in view of a general lack of reliable (audited) data on companies� performance. In principle, the duration of a price control must strike a balance between providing incentives for efficiency and reducing exposure to unanticipated outcomes. There is evidence that a longer duration provides stronger incentives for companies to implement efficiency savings. On the other hand, a longer duration also increases the possibility of performance being significantly at variance with expectations at the time that a control is set.
In view of the above, the availability at this review for the first time of audited data, and consistency with international best practice, the Second Consultation Paper suggested that the PC3 controls should be extended in duration to four years. In general, the respondents to that paper supported the proposal, which has therefore been adopted in the Draft Proposals.
In the course of the consultation process, several licensees expressed concern that a longer duration would increase the risk that allowed revenues would deviate from cost, particularly in view of uncertainties in the sector. Some suggestions put forward by the licensees as ways of mitigating such risks (�floor and ceiling arrangements�, �trigger mechanisms�, �responsibility-based approach�) were discussed at length in the Second Consultation Paper.
The Bureau has concluded that the licensees� concerns are not without foundation but that the best way of addressing them is to forecast future workloads and associated costs as accurately as possible. In addition, as suggested by ADWEC, the Bureau will continue its policy of assessing at the subsequent review whether companies have acquired significant new responsibilities which were not anticipated at the previous review, and, if so, to consider making an adjustment to retrospectively finance an efficient level of costs so incurred. The same will apply in reverse to any significant responsibilities which were anticipated but did not in fact materialise. The Bureau will be mindful in its application of any such adjustments to exercise its discretion judiciously so as to ensure that the efficiency properties of CPI-X regulation are not adversely impacted.
3.5 Separation of Controls
The earlier papers discussed two possible further separations for the PC3 controls:
3.5.1 Separate Controls for ADWEC�s Water and Electricity Activities
The First and Second Consultation Papers discussed the arguments for separating ADWEC�s controls (and hence its businesses and its accounts) between water and electricity. These included

Title: 2005 Price Controls Review � Draft Proposals Issue No.: 1 Rev (0) Prepared by:
AR/MPC/MMH Document No. CR/E02/022 Issue Date: 27/07/05
Approved by: NSC
Page 23 of 137
consistency with other companies, the magnitude of costs which ADWEC manages (more than half of total sector costs), and the enhanced transparency of costs (and hence subsidy requirements) separately for water and electricity that would result.
The respondents to the First Consultation Paper were supportive of this suggestion but with some caveats. ADWEC itself highlighted some issues in relation to the apportionment of its costs, particularly fuel costs.
In response, the Bureau indicated its willingness to consider a simple basis of cost allocation as long as it is verifiable and considered reasonable by the auditors. ADWEC already separates electricity and water costs for the purposes of the BST and already provides water and electricity information separately for each PWPA in its audited PCRs.
Respondents to the Second Consultation Paper continued to generally support the proposed separation of controls. ADWEC in its response asked the Bureau to propose a fuel allocation methodology in the Draft Proposals. It however expressed a preference to split the fuel costs �at the end of each year by applying the BST fuel allocation methodology using monthly hourly averages�. Such an approach, according to ADWEC, would be consistent with the BST and achieve the stated aim without incurring any unnecessary additional costs.
The Bureau notes ADWEC�s suggestion but would wish to discuss the matter further prior to the preparation of ADWEC�s separate business accounts for water and electricity for the 2006 financial year. In particular, the Bureau considers that ADWEC should, where applicable, utilise any allocation of fuel costs specified in the PWPAs.
The Bureau does not anticipate any major hurdle in agreeing a simple but cost-reflective and auditable basis of cost allocation with ADWEC. The Draft Proposals are therefore based on separate price controls for water and electricity for ADWEC.
3.5.2 Separate Controls for Distribution and Supply Businesses
ADDC and AADC each have four separate businesses (with a licence requirement for separate accounts): electricity distribution, electricity supply, water distribution, and water supply. However, each company presently has only two price controls: one for electricity (covering both electricity distribution and electricity supply), and one for water (covering both water distribution and water supply).
Earlier consultation papers set out the benefits that would arise from the separation of distribution and supply controls. In the short term, it would facilitate the calculation of special tariffs for large users (who may have a direct connection to the transmission system and thus not require a �distribution� component of cost). In the medium/long term, it may facilitate the introduction of competition into the supply activity. It would also be largely costless to implement, as the companies already produces separate accounts for distribution and supply (there would be no requirement for any greater physical or structural separation of the activities than exists at present).
Title: 2005 Price Controls Review � Draft Proposals Issue No.: 1 Rev (0) Prepared by:
AR/MPC/MMH Document No. CR/E02/022 Issue Date: 27/07/05
Approved by: NSC
Page 24 of 137
The recent availability of audited separate accounts, and the introduction of an internal charging mechanism between distribution and supply businesses in the form of Distribution Use of System (DUoS) charging, also provide a much firmer foundation for having separate controls for distribution and supply than was previously the case.
The respondents to the First Consultation Paper generally supported the suggestion. The distribution companies however highlighted certain factors that need consideration; in particular, the importance of fixed costs within the cost structure of the supply business, the need for the development of a more robust basis of DUoS charges, the need to ensure revenue drivers are appropriate, and risks associated with the businesses.
The Second Consultation Paper acknowledged the above comments but argued they could be addressed through the design of the controls. The paper also suggested retaining similar revenue drivers for both supply and distribution businesses as the current distribution price controls so as to reflect the cost drivers of the business and in order to aid simplicity.
In response to the Second Consultation Paper, AADC sought assurance that separate controls would not result in undue costs of separation. This issue had already been discussed in the Second Consultation Paper and the Bureau has confirmed that it will not require any additional structural separation of the businesses to support the separate controls.
In view of the above, the Bureau has developed these Draft Proposals with separate price controls for distribution and supply.
3.6 Scope of Controls
During the PC1 and PC2 periods, there has been discussion between licensees and the Bureau regarding the scope of the term �regulated revenue� used in the licences to define revenue covered by the price controls.
The First and Second Consultation Papers discussed the scope of the present price controls in some detail and, for ease of exposition, categorised the activities (and hence associated costs and revenues) of the companies into four potential classes:
(1) licensed activities not subject to competition;
(2) licensed activities subject to competition (none at present);
(3) unlicensed activities for which companies have received the Bureau�s consent; and
(4) activities indirectly related to licensed activities.
It was suggested for the PC3 controls that any income derived directly from the licensed activities (whether subject to competition or not) - that is, items (1) and (2) above - should fall

Title: 2005 Price Controls Review � Draft Proposals Issue No.: 1 Rev (0) Prepared by:
AR/MPC/MMH Document No. CR/E02/022 Issue Date: 27/07/05
Approved by: NSC
Page 25 of 137
within the scope of �regulated revenue� or MAR (with certain specific exceptions for ADWEC2, as at present).
However, any income from unlicensed activities, that is item (3) above, will be outside the scope of �regulated revenue� and will require separate accounts. These activities include the following:
• Management of RASCO�s production assets by ADDC and AADC on behalf of RASCO;
• ADDC�s central laboratory services for third parties;
• TRANSCO�s manpower services for third parties;
• Procurement by ADWEC of water and electricity from UWEC for sale to third parties outside the Emirate of Abu Dhabi;
• Transmission by TRANSCO of water and electricity produced by UWEC for third parties outside the Emirate of Abu Dhabi; and
• Other possible unlicensed activities which licensees may undertake in future in connection with the Emirates National Grid and/or GCC Interconnection.
Complications arise in relation to the activities only indirectly related to licensed activities (item (4) above). The companies have identified a number of items that potentially fall into this category, such as income from contractors, insurance claims, bank interest, and foreign exchange gains/losses. As the companies are subject to a revenue cap, if such items are included within regulated revenue their ability to raise revenue from customers (or subsidy, in the case of distribution companies) is correspondingly reduced. Conversely, excluding such items allows the companies to collect greater revenue from customers within the cap on MAR provided by the price controls. The treatment of these �indirect� items can thus have a significant impact on the profits of the companies.
The Bureau has argued that since these items have arisen only because the companies are undertaking regulated businesses, and the costs associated with these incomes are financed via the price controls, the incomes from these activities should fall within the scope of PC3 controls or MARs and should be treated as within the scope of �regulated revenue�.
However, respondents to the First Consultation Paper argued that this treatment may weaken the incentives for the companies to collect such income, which they argued would not be in the interests of the sector. They particularly highlighted the income from contractors in the form of penalties, liquidated damages, claims or late-payment interest receipts. The Second Consultation Paper acknowledged some merits in these concerns and therefore suggested that there may be a limited number of items which will be explicitly defined in advance, termed �Excluded Income�, and excluded from the scope of the controls.
2 ADWEC�s regulated revenue excludes any income received from production companies in the
form of damages, claims, late payments or events of default.

Title: 2005 Price Controls Review � Draft Proposals Issue No.: 1 Rev (0) Prepared by:
AR/MPC/MMH Document No. CR/E02/022 Issue Date: 27/07/05
Approved by: NSC
Page 26 of 137
Respondents to the Second Consultation Paper, particularly AADC and ADDC, supported the concept of defining �Excluded Income�. AADC argued that �the base level for excluded income should be founded on the lowest historical value of this revenue stream� as �this ensures that AADC has the incentive to collect this revenue while at the same time as satisfying the Bureau�s concerns�. ADDC suggested that the excluded items should be similar to the revenue streams currently treated by ADDC as excluded under its PCRs for PC2.
Based on these responses, the Bureau proposes to define income from contractors as �Excluded Income� for the network companies. None of the responses to the Second Consultation Paper provided a particularly strong rationale for any other income to be defined as an �Excluded Income�. The Bureau is not proposing any change to the scope of ADWEC�s control.
The following table summarises the exclusions from the scope of PC3 controls as used in these Draft Proposals for each company:
Table 3.1: Exclusions from Scope of PC3 � Draft Proposals
Company Excluded Income Unlicensed Activities ADDC Any income from contractors − Management of RASCO�s production assets
− Central laboratory services for third parties AADC Any income from contractors − Management of RASCO�s production assets ADWEC Any income received from production
companies in the form of damages, claims, late payments or events of default
− Procurement of water and electricity from UWEC for third parties outside the Emirate of Abu Dhabi
TRANSCO Any income from contractors − TRANSCO�s manpower services for third parties
− Transmission of water and electricity from UWEC for third parties outside the Emirate of Abu Dhabi
3.7 Revenue Drivers for PC3
The earlier consultation papers indicated that, in principle, the present revenue drivers remain appropriate for the PC3 controls but discussed some refinements to the definitions of the revenue drivers at this review. These mainly reflected the introduction of separate price controls for distribution and supply businesses, and the desire to further strengthen the system metering. The Second Consultation Paper therefore made the following suggestions:
1. Given separate distribution and supply controls, customer accounts and metered units distributed should continue to be the revenue drivers for each distribution business, and customer accounts should be adopted as the only revenue driver for each supply business.
2. The definitions of the revenue drivers for the distribution companies should reflect the customers of the respective businesses (distribution or supply).
Title: 2005 Price Controls Review � Draft Proposals Issue No.: 1 Rev (0) Prepared by:
AR/MPC/MMH Document No. CR/E02/022 Issue Date: 27/07/05
Approved by: NSC
Page 27 of 137
3. Water and electricity peak demands for TRANSCO should be amended to be based solely on metered units only.
The respondents to the Second Consultation Paper commented as follows:
• AADC supported the continued use of the existing revenue drivers for the distribution businesses, emphasising that the �number of customers� revenue driver should continue to be based on customer accounts (rather than connections). AADC agreed with the Bureau�s proposal for the supply business revenue driver (customer accounts). AADC also suggested certain other drivers that should be considered at the next (2009) price review.
• Like AADC, ADDC suggested that the �number of customers� revenue driver for the distribution businesses should not refer to the number of connections. ADDC, while agreeing in principle that customers whose supply does not pass through the distribution network should be excluded from the distribution business revenue driver, expressed concern about including tanker customers within the customer number revenue driver for the water supply business, as it would be difficult to define accurately. The inclusion of tankered customers could also weaken the incentive to connect all customers to the distribution network.
• TRANSCO supported the principle of metering all units. However, it noted that it has suffered a significant financial impact during the PC2 period due to the delay in the metering project said to be outside of its control. TRANSCO therefore suggested a �glide-path mechanism� while setting the PC3 revenue driver projections to take account of expected progress on the metering project.
Based on these responses, the Bureau has now concluded that the same customer numbers should be used for the distribution businesses as for supply, and that this should continue to refer to customer accounts, as at present, rather than to connections (the Second Consultation Paper had not, in fact, suggested otherwise on this latter point). This is because the accuracy of measurement of revenue drivers is very important and the present customer accounts revenue drivers are understood to be based on reasonably robust measurement. Further, the difference between customer accounts for distribution and supply businesses as proposed in the Second Consultation Paper may not be significant.
The Bureau thus does not intend to proceed with the suggestion in the Second Consultation Paper to have different measures of customer numbers for the distribution and supply businesses, which in both cases will continue to be based on customer accounts registered with the licensee at the end of the year in question.
In respect of TRANSCO, the Bureau notes TRANSCO�s support for the metered peak demand revenue drivers. The revenue driver projections discussed in Section 5 of this paper take into account TRANSCO�s suggestion above for a �glide-path� approach to projecting metered units.
The Draft Proposals for PC3 are therefore based on the following variable revenue drivers:

Title: 2005 Price Controls Review � Draft Proposals Issue No.: 1 Rev (0) Prepared by:
AR/MPC/MMH Document No. CR/E02/022 Issue Date: 27/07/05
Approved by: NSC
Page 28 of 137
Table 3.2: Revenue Drivers for PC3 � Draft Proposals
Revenue Driver 1 Revenue Driver 2 AADC / ADDC Electricity Distribution Electricity customer accounts Metered electricity units distributed AADC / ADDC Electricity Supply Electricity customer accounts AADC / ADDC Water Distribution Water customer accounts Metered water units distributed AADC / ADDC Water Supply Water customer accounts TRANSCO Electricity Metered peak electricity demand Metered electricity units transmitted TRANSCO Water Metered peak water demand Metered water units transmitted
The following table sets out the proposed licence definitions of the revenue drivers for the various companies showing the proposed changes in bold:
Table 3.3: Definitions of Revenue Drivers for PC3 � Draft Proposals
Company Revenue Driver Proposed Definition ADDC/AADC Electricity Distribution & Supply
Electricity Customer Accounts
The number of electricity customer accounts registered with the Licensee as of 31 December of relevant year t for the supply of electricity by the Licensee in that relevant year.
Electricity Distribution
Metered Electricity Units Distributed
The aggregate quantity of electricity units distributed (expressed in kilowatt-hours) through the Licensee's electricity distribution system in relevant year t metered at exit points on leaving the Licensee's distribution system.
Water Distribution & Supply
Water Customer Accounts
The number of water customer accounts registered with the Licensee as of 31 December of relevant year t for the supply of water by the Licensee in that relevant year.
Water Distribution
Metered Water Units Distributed
The aggregate quantity of water units distributed (expressed in imperial gallons) through the Licensee's water distribution system in relevant year t metered at exit points on leaving the Licensee's distribution system.
TRANSCO Electricity Metered Peak
Electricity Demand The maximum average electricity demand in an hour (expressed in kilowatts) as metered or otherwise measured (in compliance with the Metering and Data Exchange Code) at exit points on leaving the Licensee�s electricity transmission system in relevant year t.
Metered Electricity Units Transmitted
The aggregate quantity of electricity units transmitted (expressed in kilowatt-hours) through the Licensee�s electricity transmission system in relevant year t metered (in compliance with the Metering and Data Exchange Code) at exit points on leaving the Licensee�s transmission system.
Water Metered Peak Water Demand
The maximum average water demand in a day (expressed in imperial gallons per day) as metered or otherwise measured (in compliance with the Metering and Data Exchange Code) at exit points on leaving the Licensee�s water transmission system in relevant year t.
Metered Water Units Transmitted
The aggregate quantity of water units transmitted (expressed in imperial gallons) through the Licensee�s water transmission system in relevant year t metered (in compliance with the Metering and Data Exchange Code) at exit points on leaving the Licensee�s transmission system.

Title: 2005 Price Controls Review � Draft Proposals Issue No.: 1 Rev (0) Prepared by:
AR/MPC/MMH Document No. CR/E02/022 Issue Date: 27/07/05
Approved by: NSC
Page 29 of 137
3.8 Summary of Structure of PC3 Controls
3.8.1 MAR Formulae for PC3
Based on the preceding discussion, the proposed structure of the PC3 controls is as follows:
AADC and ADDC Supply Businesses (separate water and electricity price controls)
MAR = Electricity or Water Purchase Costs + Transmission Charges + Distribution Charges + SR + Q - K
SR = a + (b × Number of Customer Accounts)
AADC and ADDC Distribution Businesses (separate water and electricity price controls)
MAR = a + (b × Number of Customer Accounts) + (c × Metered Units Distributed) + Q - K
ADWEC (separate water and electricity price controls)
MAR = PWPA Costs + Fuel Costs + A + Q � K
TRANSCO (separate water and electricity price controls)
MAR = a + (b × Metered Peak Demand) + (c × Metered Units Transmitted) + A + Q - K
Where �SR� is the allowed supply revenue for distribution companies, and other items are as defined in Section 2.3.
3.8.2 Pass-Through Terms
The following costs are presently treated on a pass-through basis in the price control formulae:
− For ADWEC, PWPA3 and fuel costs;
− For TRANSCO�s electricity business, allowed ancillary services costs; and
− For ADDC and AADC, power and water purchases, and transmission charges.
The First and Second Consultation Papers indicated the Bureau�s intention to continue with the pass-through treatment of these costs during the PC3 period. One possible exception to this was PWPA and fuel costs for ADWEC, as further discussed below. In addition, the Second Consultation Paper also identified that the Distribution Use-of-System (DUoS) charge will be introduced as a new pass-through item in the price controls for supply businesses.
The previous papers highlighted that, since 1999, for various reasons, the unit cost of electricity and water procured by ADWEC has increased substantially. This increasing trend is at a time when cost reductions should have been expected, due to efficiency improvements and economies
3 The definition of the �PWPA� term in ADWEC�s licence includes ancillary services costs.
Title: 2005 Price Controls Review � Draft Proposals Issue No.: 1 Rev (0) Prepared by:
AR/MPC/MMH Document No. CR/E02/022 Issue Date: 27/07/05
Approved by: NSC
Page 30 of 137
of scale. The papers therefore sought suggestions as to other forms of price control which may provide a better incentive for ADWEC to minimise purchase costs.
The Second Consultation Paper suggested that PWPA and fuel costs should only be treated as an automatic pass-through for ADWEC if the unit production costs of electricity and water in any year are equal to or less than those in the previous year. Otherwise, the pass through would be capped at the level implied by the previous year�s unit production cost.
Two respondents to the Second Consultation Paper commented on this issue as follows:
• ADWEC disagreed with the proposal without giving any reason.
• AADC did not support the Bureau�s proposal, principally due to the higher risks to which ADWEC would be exposed. However, AADC expressed concern that ADWEC was not at that time providing good quality information to the Bureau, and suggested that the Bureau use its powers under Law No (2) to ensure compliance.
Since the Second Consultation Paper, ADWEC has responded to the Bureau�s information request, albeit after a delay of six months. The Bureau is also now in receipt of audited plant-wise data as part of ADWEC�s PCR for 2004.
The Bureau is pleased to note the positive steps taken by ADWEC since the Second Consultation Paper to improve its responses to the Bureau�s requirements. Given this, and the risks associated with any alternative approach, the Bureau has decided to continue with the pass-through treatment of PWPA and fuel costs. ADWEC�s costs are in any case subject to the existing economic purchasing obligation, which is carefully monitored by the Bureau. However, if the unit cost of water or electricity in a year is higher than the previous year, the Bureau proposes that ADWEC will in future additionally be required to submit a formal report to the Bureau to accompany its audited PCR identifying (and quantifying) the reasons for such an increase. A licence amendment will be required to implement this proposal.
3.8.3 Correction Factor
The Bureau does not propose any changes to the correction factor mechanism, which adjusts the MAR for one year (�t�) for any over or under-recovery of MAR in the preceding year (�t-1�) along with interest accrued, as follows:
Kt = (Actual Revenuet-1 � MARt-1) x (1 + it / 100)
Where �it� means that interest rate which is equal to:
− the �average specified rate� (the average one-year inter-bank deposit rates published by the UAE Central Bank for the year �t-1�) when there is over-recovery by 2% or less of MAR or when there is any under-recovery; and
− the average specified rate plus a 3% �penalty� rate if there is over-recovery by more than 2% of MAR.

Title: 2005 Price Controls Review � Draft Proposals Issue No.: 1 Rev (0) Prepared by:
AR/MPC/MMH Document No. CR/E02/022 Issue Date: 27/07/05
Approved by: NSC
Page 31 of 137
However, during PC1, the above mechanism caused undesirable volatility in the financial performance of ADWEC from year to year. The Bureau and ADWEC therefore agreed for the 2004 and 2005 BSTs to adjust any over- or under-recovery of BST revenue in the same year in the form of exceptional charges payable between ADWEC and the distribution companies. This approach has led to zero correction factors and zero interest payments for recent years and hence eliminated the risk associated with over-recoveries for ADWEC.
The First Consultation Paper highlighted that, if such an approach continues, ADWEC is no longer exposed to the risk of demand forecasting errors through the BST and the incentive for ADWEC to forecast demands accurately may therefore need to be enhanced via the PIS. In its response to that paper, ADWEC proposed introducing electricity and water demand forecasting accuracy measures as new Category A indicators for PC3. The Bureau has accepted this idea in the Second Consultation Paper and it is incorporated into these Draft Proposals (see Section 11).

Title: 2005 Price Controls Review � Draft Proposals Issue No.: 1 Rev (0) Prepared by:
AR/MPC/MMH Document No. CR/E02/022 Issue Date: 27/07/05
Approved by: NSC
Page 32 of 137
4 Framework for Price Control Calculations
4.1 Overall Approach
Setting the price controls means, for each business, determining the values of the co-efficients of the fixed and variable terms in the MAR formulae (�A� or �a�, �b� and �c�) , and the �X� factor.
Allowed revenues are calculated by setting the net present value (NPV) of the MARs for each business equal to the NPV of its required revenue (sufficient to finance an efficient business) over the control period (2006 � 2009). That is:
Over the control period:
NPV of projected annual MARs = NPV of Required Revenues
All calculated are carried out in real 2006 price terms (ie, excluding the effect of inflation). For the purposes of the calculation, pass-through costs and Q terms are excluded and the correction factor is assumed to be zero.
The required revenue is calculated using the �building block approach�, as follows:
For each year (to be summed over control period in NPV terms):
Required Revenue = Operating Expenditure + Depreciation + Return on Assets
This requires projections of operating expenditures (opex), capital expenditures (capex), depreciation and regulatory asset values (RAVs); and a decision on the cost of capital to be used as the rate of return on RAVs and as the discount rate to calculate the NPVs.
4.2 Weights of Revenue Drivers in Price Control Calculations
At the last price controls review, allowed revenue was split in the ratio 65:35 between the fixed term and the variable components (except for ADWEC, which had full 100% weight for the fixed term). These weights were applied to the present value of total revenue over the control period. The weights thus varied slightly from year to year, depending on the relative movement in revenue drivers in each year.
The weights needs to strike a suitable balance between (1) the cost structure of the company, and (2) the incentives for the company to perform well against the objectives of the revenue drivers (for example, to improve metering or to meet new demand). A higher weight for a variable term means a greater incentive for performance on that revenue driver. However, a higher weight for the fixed term means greater surety for companies to earn revenue irrespective of the outturn demand or revenue driver performance.
The respondents to the First Consultation Paper generally supported the retention of the same weights as at present or a higher weight for the fixed revenue term for the PC3 controls.
Title: 2005 Price Controls Review � Draft Proposals Issue No.: 1 Rev (0) Prepared by:
AR/MPC/MMH Document No. CR/E02/022 Issue Date: 27/07/05
Approved by: NSC
Page 33 of 137
The Second Consultation Paper thus suggested that the weight for the fixed term should be 70% and that for the variable term(s) should be 30% (equally apportioned where there are two revenue drivers).
The respondents to the Second Consultation Paper generally supported the above weights, although AADC proposed a weight of 85% for the fixed term for the supply businesses.
In view of the generally supportive responses, and the desirability of consistency between the different businesses of the licensees, the Draft Proposals have used the weights as suggested in the Second Consultation Paper.
4.3 X Factor
The price control calculations also require a decision on the �X� factor for PC3. To date, the X factor has been used as a revenue profiling or smoothing mechanism and does not necessarily represent the underlying efficiency improvement assumption. For example, X was set to zero at the last review in view of the following considerations:
− To avoid any confusion between the efficiency improvement (which was assumed to be 5% a year and incorporated into opex projections separately) and the X factor; and
− To allow lower revenue in the early part of the control period and higher in the later part of the period (than would have been the case with a higher X factor), consistent with the companies� expectations of generally increasing costs and demands (implying increasing requirement for revenue) over the control period.
For these Draft Proposals, the Bureau has continued to use a zero value for the X factor for all businesses for the PC3 period.

Title: 2005 Price Controls Review � Draft Proposals Issue No.: 1 Rev (0) Prepared by:
AR/MPC/MMH Document No. CR/E02/022 Issue Date: 27/07/05
Approved by: NSC
Page 34 of 137
5 Revenue Driver Projections
5.1 Introduction
In order to set the controls, projections are required for the revenue drivers as defined in Table 3.3. The earlier consultation papers highlighted the following:
• Setting revenue drivers �too high� or �too low� can unreasonably under- or over-state the coefficients of the revenue drivers.
• Revenue driver projections should be made on the same basis as the actual revenue driver would be measured in the future.
• Further adjustments to the projections may be necessary to reflect stronger incentives for performance and/or to reflect realistic achievable targets for performance.
• The accuracy of the revenue driver projections also depends on the companies� reaction to the incentives provided by the revenue drivers.
Revenue driver projections are also a key input into the opex projections discussed in Section 6 of this paper.
5.2 Overall Approach
Companies� projections have been assessed by comparing them with other data available to the Bureau. In general, the Bureau has paid most regard to the latest overall peak demand forecasts of ADWEC, for both water and electricity. This is because ADWEC�s demand forecasts are well documented and reviewed by the Bureau annually. In contrast, the distribution companies� forecasts are not well documented and can change significantly from one submission to another. TRANSCO has generally adopted ADWEC�s forecasts.
Figure 5.1 presents ADWEC�s current projections of water and electricity peak demands up to 2009. These projections show that electricity peak demand in the sector has shown an average growth rate of 6.83% over the period 1999-2004 and is expected to exhibit a growth of 8.36% from 2004 to 2009. Water peak demand has grown at an average rate of 15.59% during 1999-2004 and is expected to grow at 7.87% during 2004-2009. In both cases, the Bureau has assumed similar growth rates in annual units transmitted/distributed.
For customer accounts, in the absence of any other information, the Bureau has adopted the distribution companies� projections. However, these projections have been assessed against actual growth in customer accounts in recent years.
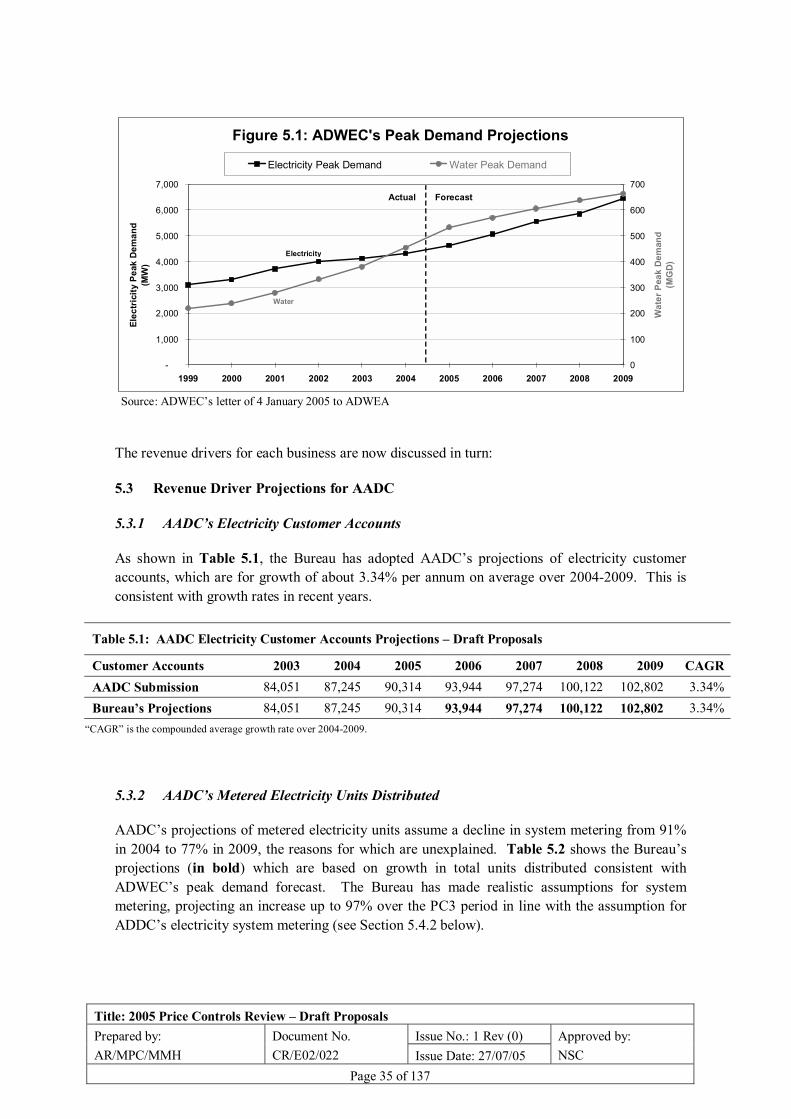
Title: 2005 Price Controls Review � Draft Proposals Issue No.: 1 Rev (0) Prepared by:
AR/MPC/MMH Document No. CR/E02/022 Issue Date: 27/07/05
Approved by: NSC
Page 35 of 137
Figure 5.1: ADWEC's Peak Demand Projections
-
1,000
2,000
3,000
4,000
5,000
6,000
7,000
1999 2000 2001 2002 2003 2004 2005 2006 2007 2008 2009
Elec
tric
ity P
eak
Dem
and
(MW
)
0
100
200
300
400
500
600
700
Wat
er P
eak
Dem
and
(MG
D)
Electricity Peak Demand Water Peak Demand
Actual Forecast
Electricity
Water
Source: ADWEC�s letter of 4 January 2005 to ADWEA
The revenue drivers for each business are now discussed in turn: 5.3 Revenue Driver Projections for AADC
5.3.1 AADC�s Electricity Customer Accounts
As shown in Table 5.1, the Bureau has adopted AADC�s projections of electricity customer accounts, which are for growth of about 3.34% per annum on average over 2004-2009. This is consistent with growth rates in recent years.
Table 5.1: AADC Electricity Customer Accounts Projections � Draft Proposals
Customer Accounts 2003 2004 2005 2006 2007 2008 2009 CAGRAADC Submission 84,051 87,245 90,314 93,944 97,274 100,122 102,802 3.34% Bureau�s Projections 84,051 87,245 90,314 93,944 97,274 100,122 102,802 3.34%
�CAGR� is the compounded average growth rate over 2004-2009.
5.3.2 AADC�s Metered Electricity Units Distributed
AADC�s projections of metered electricity units assume a decline in system metering from 91% in 2004 to 77% in 2009, the reasons for which are unexplained. Table 5.2 shows the Bureau�s projections (in bold) which are based on growth in total units distributed consistent with ADWEC�s peak demand forecast. The Bureau has made realistic assumptions for system metering, projecting an increase up to 97% over the PC3 period in line with the assumption for ADDC�s electricity system metering (see Section 5.4.2 below).
Title: 2005 Price Controls Review � Draft Proposals Issue No.: 1 Rev (0) Prepared by:
AR/MPC/MMH Document No. CR/E02/022 Issue Date: 27/07/05
Approved by: NSC
Page 36 of 137
Table 5.2: AADC Metered Electricity Units Distributed Projections � Draft Proposals
GWh 2003 2004 2005 2006 2007 2008 2009 CAGRAADC Submission Total at Exit Points 6,164 6,048 7,546 8,175 8,751 9,262 9,698 9.90% Metered 5,619 5,508 5,871 6,288 6,728 7,112 7,488 6.34% % Metered 91.16% 91.06% 77.81% 76.91% 76.88% 76.78% 77.22% Bureau�s Projections Total at Exit Points 6,164 6,048 6,554 7,101 7,695 8,339 9,036 8.36% Metered at Exit Points 5,619 5,508 6,029 6,604 7,233 7,922 8,765 9.74%
As % of Total at Exit 91.16% 91.06% 92.00% 93.00% 94.00% 95.00% 97.00% �Exit� refers to exit from the distribution system.
5.3.3 AADC�s Water Customer Accounts
As shown in Table 5.3, the Bureau has adopted AADC�s projections for this revenue driver:
Table 5.3: AADC Water Customer Accounts Projections � Draft Proposals
Customer Accounts 2003 2004 2005 2006 2007 2008 2009 CAGRAADC Submission 42,894 45,360 46,773 48,525 50,048 51,217 52,238 2.86% Bureau�s Projections 42,894 45,360 46,773 48,525 50,048 51,217 52,238 2.86%
Water customer accounts are expected to grow by about 2.86% per annum on average over 2004-2009. This growth is similar to the average growth rate of 2.75% over 1999-2004.
AADC has in the past been inconsistent in its estimation of water customer numbers: its forecasts for PC1 were significantly under-stated while those for PC2 were significantly over-stated. The Bureau will monitor AADC�s future PCRs carefully and if there is any change to the basis of reporting by AADC of its water customer numbers (or of any other revenue driver) that works to the detriment of customers the Bureau will make appropriate adjustments at the next review.
5.3.4 AADC�s Metered Water Units Distributed
AADC�s latest information submission projects water system metering of only 68% by 2009. This is significantly less than its projection in its first information submission, of 90% metering by 2009. Table 5.4 shows the Bureau�s projections for AADC�s metered water units distributed (in bold) which have been derived using the same approach as for electricity units. That is, the growth in total units distributed from 2004 onwards is based on ADWEC�s projected (water) peak demand growth rate and the system metering projections are based on the Bureau�s assumptions for distribution companies� metering improvement (97% by end of the PC3 period).

Title: 2005 Price Controls Review � Draft Proposals Issue No.: 1 Rev (0) Prepared by:
AR/MPC/MMH Document No. CR/E02/022 Issue Date: 27/07/05
Approved by: NSC
Page 37 of 137
Table 5.4: AADC Metered Water Units Distributed Projections � Draft Proposals
MG 2003 2004 2005 2006 2007 2008 2009 CAGR AADC Submission Total at Exit Points 26,901 36,037 44,256 47,417 51,842 55,636 59,429 10.52%
Metered 1,880 6,872 9,550 19,550 34,550 37,936 40,522 42.60% % Metered 6.99% 19.07% 21.58% 41.23% 66.64% 68.19% 68.19% Bureau�s Projections Total at Exit Points 26,901 36,037 38,872 41,930 45,229 48,788 52,626 7.87% Metered at Exit Points 1,880 6,872 11,662 20,965 31,660 41,470 51,048 49.34%
As % of Total at Exit 6.99% 19.07% 30.00% 50.00% 70.00% 85.00% 97.00% �Exit� refers to exit from the distribution system.
5.4 Revenue Driver Projections for ADDC
5.4.1 ADDC�s Electricity Customer Accounts
As for AADC, the Bureau has based its projections for ADDC�s customer accounts on the data provided by ADDC in its response to the information request and the audited PCRs. This is shown in Table 5.5 below:
Table 5.5: ADDC Electricity Customer Accounts Projections � Draft Proposals
Customer Accounts 2003 2004 2005 2006 2007 2008 2009 CAGRADDC Submission 191,556 196,929 201,195 205,554 210,008 214,557 218,863 2.13% Bureau�s Projections 191,556 196,929 201,195 205,554 210,008 214,557 218,863 2.13%
5.4.2 ADDC�s Metered Electricity Units Distributed
The Bureau�s projections for this driver in Table 5.6 below (in bold) are based on metering assumptions as contained in ADDC�s response to the information request. However, in line with the approach used for AADC, the total units distributed have been projected to grow at an average rate of 8.36%.
Table 5.6: ADDC Metered Electricity Units Distributed Projections � Draft Proposals
GWh 2003 2004 2005 2006 2007 2008 2009 CAGR ADDC Submission Total at Exit Points 11,534 12,959 13,850 14,712 15,619 16,632 17,370 6.04% Metered 11,172 12,597 13,488 14,351 15,258 16,271 17,009 6.19% % Metered 96.86% 97.21% 97.39% 97.54% 97.68% 97.83% 97.92% Bureau�s Projections Total at Exit Points 11,534 12,959 14,042 15,216 16,488 17,866 19,360 8.36% Metered at Exit Points 11,172 12,597 13,675 14,842 16,106 17,478 18,957 8.52%
As % of Total at Exit 96.86% 97.21% 97.39% 97.54% 97.68% 97.83% 97.92% �Exit� refers to exit from the distribution system.

Title: 2005 Price Controls Review � Draft Proposals Issue No.: 1 Rev (0) Prepared by:
AR/MPC/MMH Document No. CR/E02/022 Issue Date: 27/07/05
Approved by: NSC
Page 38 of 137
5.4.3 ADDC�s Water Customer Accounts
The Bureau has based its projections for water customer accounts on ADDC�s information submission. This is shown in Table 5.7 below:
Table 5.7: ADDC Water Customer Accounts Projections � Draft Proposals
Customer Accounts 2003 2004 2005 2006 2007 2008 2009 CAGRADDC Submission 164,757 169,002 172,695 176,468 180,324 184,264 188,290 2.19% Bureau�s Projections 164,757 169,002 172,695 176,468 180,324 184,264 188,290 2.19%
5.4.4 ADDC�s Metered Water Units Distributed
As with AADC, the Bureau has not used the system metering indicated by ADDC�s information submission for water units. This is because ADDC�s submission shows only a slight improvement in system metering, from approximately 63% of demands in 2005 to 72% in 2009. The Bureau has therefore modified ADDC�s metering assumptions for 2007 onwards to bring them in line with those adopted for AADC by 2009 and in line with ADDC�s own projection for electricity metering � that is, metering of 97% of demands by 2009.
Table 5.8 shows the Bureau�s projections for ADDC�s metered water units distributed (in bold). The total units distributed have been projected to grow at an average rate of 7.87% as per ADWEC�s forecasts for water peak demand (same as used for AADC).
Table 5.8: ADDC Metered Water Units Distributed Projections � Draft Proposals
MG 2003 2004 2005 2006 2007 2008 2009 CAGR ADDC Submission Total at Exit Points 72,600 91,214 96,479 99,922 104,377 108,427 113,490 4.47% Metered 24,436 54,437 60,889 65,108 70,568 75,532 81,736 8.47% % Metered 33.66% 59.68% 63.11% 65.16% 67.61% 69.66% 72.02% Bureau�s Projections Total at Exit Points 72,600 91,214 98,390 106,131 114,481 123,488 133,204 7.87% Metered at Exit Points 24,436 54,437 62,096 69,154 80,137 104,965 129,208 18.87%
As % of Total at Exit 33.66% 59.68% 63.11% 65.16% 70.00% 85.00% 97.00% �Exit� refers to exit from the distribution system.
5.5 Revenue Driver Projections for TRANSCO
The Bureau has generally relied on TRANSCO�s projections, as these are broadly consistent with ADWEC�s forecasts. However in the tables below we note some minor discrepancies in 2003 and 2004 between some of the data provided by TRANSCO in its Information Submission in comparison to corresponding data in the audited PCRs.

Title: 2005 Price Controls Review � Draft Proposals Issue No.: 1 Rev (0) Prepared by:
AR/MPC/MMH Document No. CR/E02/022 Issue Date: 27/07/05
Approved by: NSC
Page 39 of 137
5.5.1 TRANSCO�s Metered Electricity Peak Demand
Table 5.9 shows the Bureau�s projections (in bold) for this revenue driver, which are as per the forecasts provided by TRANSCO in its information submission. They show that the electricity peak demand will grow at an average rate of 8.26% over the period 2004-2009, which is similar to ADWEC�s forecast growth rate of 8.36% discussed earlier.
Table 5.9: TRANSCO Metered Electricity Peak Demand Projections � Draft Proposals
MW 2003 2004 2005 2006 2007 2008 2009 CAGRTRANSCO Submission 3,672 3,742 4,049 4,397 4,824 5,073 5,632 8.52% TRANSCO Audited PCR 3,672 3,788 Bureau�s Projections 3,672 3,788 4,049 4,397 4,824 5,073 5,632 8.26%
Different tables in TRANSCO�s information submission contain different projections for peak demand. The Bureau has adopted that data from TRANSCO�s submission which has a figure for 2004 closest (3,742 MW) to the reliable figure for 2004 from the audited PCR (3,788 MW).
The Bureau understands that the peak demand has not been fully metered to date. Therefore, the data provided by TRANSCO and used for 2005 and earlier years may not be fully consistent with the proposed new definition of the revenue driver (to be based on metered demands only). However, TRANSCO�s expectation for progress on its system metering project indicates that peak demand for 2006 onwards will be fully metered.
5.5.2 TRANSCO�s Metered Electricity Units Transmitted
The Bureau has also adopted TRANSCO�s forecasts for this revenue driver, as shown in bold in the following table. TRANSCO�s information submission indicates that system metering will improve significantly, from 11% of demands compliant with MDEC in 2004 to 95% in 2006 and 100% in 2007 onwards. The 95% metering in 2006 indicates that the transmission system should be fully metered before the system peak demand for 2006 (see previous sub-section).
Table 5.10: TRANSCO Metered Electricity Units Transmitted Projections � Draft Proposals
GWh 2003 2004 2005 2006 2007 2008 2009 CAGR TRANSCO Submission Total at Exit Points 19,700 20,981 22,700 24,651 27,043 28,443 31,573 8.52% Metered 0 4,574 12,485 23,419 27,043 28,443 31,573 47.17%
% Metered 21.8% 55.0% 95.0% 100.0% 100.0% 100.0% TRANSCO Audited PCR Metered 0 2,421 Bureau�s Projections Total at Exit Points 19,700 20,981 22,700 24,651 27,043 28,443 31,573 8.52% Metered at Exit - 2,421 12,485 23,419 27,043 28,443 31,573 67.13%
As % of Total at Exit 0.00% 11.54% 55.00% 95.00% 100.00% 100.00% 100.00% �Exit� refers to exit from the transmission system.

Title: 2005 Price Controls Review � Draft Proposals Issue No.: 1 Rev (0) Prepared by:
AR/MPC/MMH Document No. CR/E02/022 Issue Date: 27/07/05
Approved by: NSC
Page 40 of 137
5.5.3 TRANSCO�s Metered Water Peak Demand
Table 5.11 shows the Bureau�s projections (in bold) for water metered peak demand which are also based on TRANSCO�s projections.
Table 5.11: TRANSCO Metered Water Peak Demand Projections � Draft Proposals
MGD 2003 2004 2005 2006 2007 2008 2009 CAGRTRANSCO Submission 380 420 511 526 557 587 622 8.17% TRANSCO Audited PCR 380 421 Bureau�s Projections 380 421 511 526 557 587 622 8.14%
These are consistent with ADWEC�s forecasts, and TRANSCO�s expectation for progress on system metering project indicates that the peak demand for 2006 onwards will be fully metered.
5.5.4 TRANSCO�s Metered Water Units Transmitted
The following table shows the Bureau�s projections for this revenue driver which are taken from TRANSCO�s information submission:
Table 5.12: TRANSCO Metered Water Units Transmitted Projections � Draft Proposals
MG 2003 2004 2005 2006 2007 2008 2009 CAGR TRANSCO Submission Total at Exit Points 122,413 134,832 166,873 186,230 197,206 207,827 220,219 10.31% Metered 0 13,483 91,780 175,056 197,206 207,827 220,219 74.83%
% Metered 0.00% 10.00% 55.00% 94.00% 100.00% 100.00% 100.00% TRANSCO Audited PCR Metered 0 0 Bureau�s Projections Total at Exit Points 122,413 134,832 166,873 186,230 197,206 207,827 220,219 10.31% Metered at Exit 0 13,483 91,780 175,056 197,206 207,827 220,219 74.83%
As % of Total at Exit 0.00% 10.00% 55.00% 94.00% 100.00% 100.00% 100.00% �Exit� refers to exit from the transmission system.
5.6 Summary of Revenue Driver Projections
The Bureau has adopted TRANSCO�s revenue driver projections, as they are generally consistent with ADWEC�s forecasts and assume reasonable levels of metering (100% metering of both water and electricity during the first half of 2006).
In the case of the distribution companies, the Bureau has adopted the companies� forecasts of customer numbers, as they are consistent with past trends. However, the Bureau is concerned that distribution companies� forecasts of units distributed may not be reliable and, in some cases, assume levels of metering which are too low. The Bureau has therefore generally projected units distributed based on growth in line with ADWEC�s forecasts of peak demand growth, as the

Title: 2005 Price Controls Review � Draft Proposals Issue No.: 1 Rev (0) Prepared by:
AR/MPC/MMH Document No. CR/E02/022 Issue Date: 27/07/05
Approved by: NSC
Page 41 of 137
latter forecasts are thoroughly reviewed and approved by the Bureau each year. The Bureau�s projections also assume customer metering of 97% of demand by 2009 for AADC and ADDC, for both water and electricity. This is based on the metering coverage already achieved by ADDC�s electricity distribution business.
The projections adopted for each revenue driver in these Draft Proposals are summarised below:
Table 5.13: Revenue Driver Projections � Draft Proposals
2006 2007 2008 2009 AADC Electricity customer accounts Customers 93,944 97,274 100,122 102,802 Metered electricity units distributed GWh 6,604 7,233 7,922 8,765 Water customer accounts Customers 48,525 50,048 51,217 52,238 Metered water units distributed MG 20,965 31,660 41,470 51,048 ADDC Electricity customer accounts Customers 205,554 210,008 214,557 218,863 Metered electricity units distributed GWh 14,842 16,106 17,478 18,957 Water customer accounts Customers 176,468 180,324 184,264 188,290 Metered water units distributed MG 69,154 80,137 104,965 129,208 TRANSCO Metered electricity peak demand MW 4,397 4,824 5,073 5,632 Metered electricity units transmitted GWh 23,419 27,043 28,443 31,573 Metered water peak demand MGD 526 557 587 622 Metered water units transmitted MG 175,056 197,206 207,827 220,219

Title: 2005 Price Controls Review � Draft Proposals Issue No.: 1 Rev (0) Prepared by:
AR/MPC/MMH Document No. CR/E02/022 Issue Date: 27/07/05
Approved by: NSC
Page 42 of 137
6 Assessment of Operating Expenditures
6.1 Introduction
This section sets out the Bureau�s methodology for developing opex projections for PC3.4 As discussed in the First and Second Consultation Papers, there are two main considerations in assessing the future opex requirements for PC3: (1) the sufficiency of allowed revenue to enable the companies to finance their businesses, and (2) ensuring the economy and efficiency of the sector (requiring the opex projections to be set on reasonably efficient levels). Thus, while the companies� historical level of costs, and their future projections of costs, are taken into account when determining the Bureau�s cost projections, adjustments need to be made where necessary to ensure that future projections of �efficient costs� are not over-stated.
6.2 Operating Expenditure � To Date
Table 6.1 below reports out-turn opex for 1999 � 2003. For ADWEC, the total opex has been split between water and electricity as per its information submission. The table shows opex for all the businesses has increased by 9.23% a year in real terms over 1999-2003.
Table 6.1: Audited Out-turn Operating Expenditure (excluding depreciation)
AED million, nominal prices 1999 2000 2001 2002 2003 CAGR (nominal)
CAGR (real)
AADC Electricity Distribution 67.162 73.737 79.954 90.560 103.024 11.29% 8.78% Electricity Supply 18.324 21.502 25.091 29.885 35.636 18.09% 15.43% Water Distribution 53.747 68.493 74.328 75.886 72.456 7.75% 5.32% Water Supply 4.082 3.499 4.479 8.029 10.046 25.25% 22.42% ADDC Electricity Distribution 136.243 156.853 165.023 175.099 168.480 5.45% 3.07% Electricity Supply 19.122 22.603 25.920 30.158 34.101 15.56% 12.95% Water Distribution 65.491 76.452 84.508 96.807 114.437 14.97% 12.38% Water Supply 17.140 20.565 23.055 26.087 28.905 13.96% 11.38% ADWEC Electricity 4.450 5.702 5.713 5.403 5.444 5.17% 2.63% Water 1.880 2.227 2.656 3.531 3.889 19.92% 17.02% TRANSCO Electricity 57.573 76.887 82.822 109.867 101.548 15.24% 12.64% Water 91.672 100.524 106.488 116.734 159.418 14.84% 12.24% TOTAL Electricity 302.874 357.284 384.523 440.972 448.233 10.30% 7.81% Water 234.012 271.760 295.514 327.074 389.151 13.56% 10.99% Grand Total 536.886 629.044 680.037 768.046 837.384 11.75% 9.23%
Notes: Opex (excluding depreciation) calculated from the audited accounts as the sum of (1) �Staff costs�, (2) �Repairs, maintenance and consumables used�, (3) �Administrative and other operating expenses� and (4) �Tanker hire cost� (ADDC and AADC water distribution businesses from 2001 only). For ADWEC, total opex from audited accounts has been allocated between water and electricity based on the allocation implied by its information submission for respective years.
4 �Opex�, in this document generally refers to operating costs excluding depreciation. The
exception to this is ADWEC, which has few capital assets and for which (for ease of price control calculations) we have defined �opex� to include a small capital expenditure amount.

Title: 2005 Price Controls Review � Draft Proposals Issue No.: 1 Rev (0) Prepared by:
AR/MPC/MMH Document No. CR/E02/022 Issue Date: 27/07/05
Approved by: NSC
Page 43 of 137
6.3 Companies� Opex Projections for PC3
The Second Consultation Paper reported the companies� opex projections for 2004-2009 as per their information submissions at that time. These showed opex for the network increasing by more than 50% in real terms by 2009. The paper indicated that, in the Bureau�s view, the rise in opex projected by the companies was excessive in view of the expected rate of growth in demand, the existence of a significant proportion of fixed costs, and the scope for efficiency improvement.
The Bureau is now in receipt of an information submission from ADWEC and revised submissions from AADC, ADDC and TRANSCO. AADC and (in particular) TRANSCO have now significantly lowered their opex projections. ADDC�s opex projections however remain the same as previously. The following table shows the companies� latest projections for 2004-2009:
Table 6.2: Companies� Projections of Operating Expenditure (excluding depreciation)
AED million, 2004 prices 2004 2005 2006 2007 2008 2009 CAGR (real)
AADC Electricity Distribution 111.961 120.373 129.461 138.984 149.127 159.116 7.28%
Electricity Supply 37.299 39.910 42.304 44.627 45.966 47.345 4.89%
Water Distribution 80.764 91.264 109.628 116.847 116.927 123.848 8.93%
Water Supply 10.203 10.713 11.249 11.812 12.402 13.022 5.00%
ADDC Electricity Distribution 190.118 218.677 228.096 237.833 247.879 258.433 6.33%
Electricity Supply 39.765 66.845 68.851 70.916 73.044 75.235 13.60%
Water Distribution 94.222 122.875 127.214 132.987 138.966 145.160 9.03%
Water Supply 34.130 45.610 46.978 48.387 49.839 51.334 8.51%
ADWEC Electricity 5.572 10.034 9.854 10.248 10.658 11.084 14.78%
Water 4.218 7.569 8.062 8.385 8.720 9.069 16.58%
TRANSCO Electricity 112.077 107.090 110.258 115.114 117.361 120.022 1.38%
Water 191.743 246.665 255.401 265.570 274.792 284.798 8.23%
TOTAL Electricity 496.791 562.928 588.824 617.724 644.035 671.236 6.20%
Water 415.280 524.696 558.532 583.988 601.647 627.231 8.60%
Grand Total 912.071 1,087.624 1,147.356 1,201.712 1,245.681 1,298.467 7.32%
Note: For any business, the above opex does not include provision for slow moving stocks and provision for bad debts.
As the above table shows, ADWEC has projected its opex to increase over 2004-2009 at a growth rate much higher than that observed in the past. ADDC has also projected its opex to increase in real terms over this period at a higher rate than that observed in the past. Total opex for all the businesses is projected by the licensees in real terms to increase at an average annual growth rate of 7.32% per annum over 2004-2009 compared to 9.23% per annum observed over 1999-2003. However, this still amounts to an increase of over 40%, which the Bureau still regards as excessive.

Title: 2005 Price Controls Review � Draft Proposals Issue No.: 1 Rev (0) Prepared by:
AR/MPC/MMH Document No. CR/E02/022 Issue Date: 27/07/05
Approved by: NSC
Page 44 of 137
6.4 Overall Approach
Respondents to the Second Consultation Paper generally supported the four-step approach to opex projections proposed by the Bureau:
1. Determine a base level of opex by using the recent actual level of opex;
2. Adjust the base level of opex to reflect increased costs for future demand increases;
3. Adjust the demand-adjusted opex for expected efficiency improvement; and
4. Make further adjustments to opex projections which may be appropriate � for example, for one-off costs (or cost reductions) which are known about in advance.
This approach pays regard to the current levels of opex of the companies while at the same time providing strong incentives for future efficiency improvement.
6.5 Assessment of Base Level of Operating Expenditure
6.5.1 Overall Approach to Setting Base Level
The Second Consultation Paper indicated an intention to use audited opex for 2003 as the base level of opex for PC3. This was expected to be the latest available information at the time of publishing the Draft Proposals. The respondents suggested that the Bureau modifies the timetable for this review to allow the use of audited opex for 2004 (required to be submitted by 30 June 2005) as the base level. The Bureau has therefore modified its timetable accordingly and adopted 2004 audited opex as the base level of opex for future opex projections in these Draft Proposals.
One issue in determining the base level of costs relates to the change in the provision for slow moving stock, which is a significant item in the Income Statement for transmission and distribution businesses. This shows as a cost to the company whenever there is an increase in the provision. In earlier discussions with TRANSCO, the Bureau questioned whether increases in this provision should be financed within the price controls. TRANSCO has argued strongly that the change in the provision should be financed, while acknowledging that it could be reduced over time from present levels.
The Bureau remains concerned at the level of provision in recent years, and considers that, as TRANSCO accepts, there is scope for reduction by more efficient stock management processes. The Bureau is thus unwilling to finance its increase. In these Draft Proposals, the increase in the provision has therefore been excluded from the base level of opex.
Similar issues arise in relation to changes in the provision for bad debts for the supply businesses of ADDC and AADC. This provision should also be expected to reduce as companies become more efficient at collecting income from customers, and hence the increase in the provision in 2004 has been also been excluded from the cost base in these Draft Proposals.

Title: 2005 Price Controls Review � Draft Proposals Issue No.: 1 Rev (0) Prepared by:
AR/MPC/MMH Document No. CR/E02/022 Issue Date: 27/07/05
Approved by: NSC
Page 45 of 137
6.5.2 Benchmarking of Network Businesses
(a) Introduction
The First and Second Consultation Papers discussed the possibility of using benchmarking to support the Bureau�s analysis of a reasonable level of opex. Respondents generally supported the view of the Bureau, which was that the usefulness of benchmarking is limited by the difficulties in identifying suitable comparators and in ensuring that comparisons are undertaken on a like-for-like basis. However, respondents agreed that benchmarking can, in some circumstances, provide a useful cross-check on other results. AADC additionally asked to be given the opportunity to comment on any benchmarking analysis used by the Bureau.
The Bureau has therefore explored the extent to which benchmarking can inform upon the efficient level of opex. The Bureau found that comparisons for water businesses are not readily available, due to the fact that few overseas water industries are structured in the same manner as in Abu Dhabi, where water transmission and distribution are undertaken as separate businesses. However, some analysis is possible for electricity transmission and electricity distribution. Our results, which are based on 2003 data, are summarised in the following sections.
(b) Benchmarking of Electricity Distribution Businesses
The following table shows the results of the benchmarking of the electricity distribution businesses of AADC and ADDC against 14 electricity distribution businesses from the UK based on a number of different opex-to-output ratios:
Table 6.3: Opex Benchmarking of Electricity Distribution Businesses
2003 data, 2003 prices Opex per unit(fils/kWh)
Opex per customer(AED/customer)
Opex per circuit length(AED/km)
AADC 1.67 1,226 6,383 ADDC 1.46 877 5,870 UK Average 1.62 186 6,543 UK Minimum 1.11 135 4,373 UK Maximum 2.48 302 11,848
Source: (1) AADC/ADDC�s audited accounts for 2003 and PC3 first information submission (2) �Electricity Distribution Price Control Review�, Final Proposals, Ofgem, November 2004.
For opex per unit distributed and opex per circuit length, AADC and ADDC are close to the UK average. However, on opex per customer, the ratios are higher than the UK average. These results reflect the very high electricity consumption per customer in the sector, which means that they should be expected to perform well on per unit measures but poorly on per customer measures. The fact that AADC and ADDC perform only averagely on a per unit measure (the measure that should favour them) suggests some inefficiency compared to their UK counterparts.
Recognising the potential trade-off between opex and assets, the Bureau has also assessed the businesses on similar ratios for assets. This shows similar results to the opex benchmarking, as shown in the following two graphs (each business is shown as a point on the graph):

Title: 2005 Price Controls Review � Draft Proposals Issue No.: 1 Rev (0) Prepared by:
AR/MPC/MMH Document No. CR/E02/022 Issue Date: 27/07/05
Approved by: NSC
Page 46 of 137
Figure 6.1: Opex/ Asset Benchmarking of Electricity Distribution Businesses
Opex and Asset per Unit Benchmarking
0.00
0.50
1.00
1.50
2.00
2.50
3.00
- 10.00 20.00 30.00 40.00 50.00 60.00
Asset per unit (fils/kWh)
Ope
x pe
r uni
t (fil
s/kW
h)
AADCADDC
Opex and Asset per Customer Benchmarking
-
200
400
600
800
1,000
1,200
1,400
- 5,000 10,000 15,000 20,000 25,000
Asset per Customer (AED/customer)
Ope
x pe
r Cus
tom
er
(AED
/cus
tom
er) AADC
ADDC
The above analysis relates to 2003. The following graphs show the unit cost performance of AADC and ADDC from 1999 to 2003. While ADDC�s performance on opex ratios has been fairly stable, AADC�s performance has deteriorated since 2000.
Figure 6.2: AADC and ADDC's Operating Efficiency (1999-2003)
Opex per unit distributed
1.00
1.20
1.40
1.60
1.80
2.00
2.20
2.40
1999 2000 2001 2002 2003
Fils
/kW
h(in
nom
inal
pric
es)
AADC
ADDC
Opex per Customer
800
900
1,000
1,100
1,200
1,300
1999 2000 2001 2002 2003
AED
per
cus
tom
er(in
nom
inal
pric
es)
AADC
ADDC
(c) Benchmarking of Electricity Transmission Business
The following table shows the results of benchmarking the electricity transmission business of TRANSCO against 5 electricity transmission businesses from Australia for 2003:
Table 6.4: Benchmarking of Electricity Transmission Business
2003 data, 2003 prices Opex per unit(fils/kWh)
Opex per peak demand(AED/kW)
Opex per line length(AED/km)
TRANSCO 0.515 27.65 33,910 Australian Average 0.554 30.22 20,800 Australian Minimum 0.332 20.98 15,440 Australian Maximum 0.935 39.11 26,270
Source: (1) TRANSCO�s audited accounts for 2003 and PC3 first information submission (2) �Tasmanian Transmission Network Revenue Cap 2004 � 2008/09�, Draft Decision, ACCC, 24 September 2003.
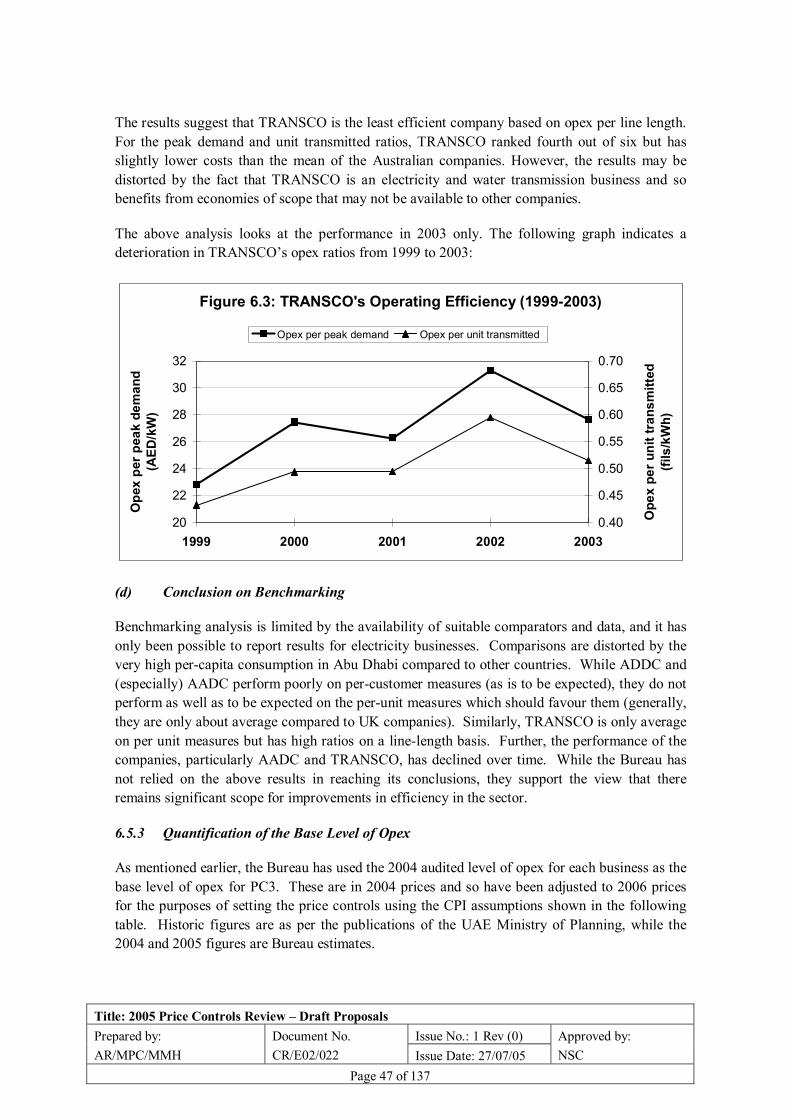
Title: 2005 Price Controls Review � Draft Proposals Issue No.: 1 Rev (0) Prepared by:
AR/MPC/MMH Document No. CR/E02/022 Issue Date: 27/07/05
Approved by: NSC
Page 47 of 137
The results suggest that TRANSCO is the least efficient company based on opex per line length. For the peak demand and unit transmitted ratios, TRANSCO ranked fourth out of six but has slightly lower costs than the mean of the Australian companies. However, the results may be distorted by the fact that TRANSCO is an electricity and water transmission business and so benefits from economies of scope that may not be available to other companies.
The above analysis looks at the performance in 2003 only. The following graph indicates a deterioration in TRANSCO�s opex ratios from 1999 to 2003:
Figure 6.3: TRANSCO's Operating Efficiency (1999-2003)
20
22
24
26
28
30
32
1999 2000 2001 2002 2003
Ope
x pe
r pea
k de
man
d (A
ED/k
W)
0.40
0.45
0.50
0.55
0.60
0.65
0.70
Ope
x pe
r uni
t tra
nsm
itted
(fi
ls/k
Wh)
Opex per peak demand Opex per unit transmitted
(d) Conclusion on Benchmarking
Benchmarking analysis is limited by the availability of suitable comparators and data, and it has only been possible to report results for electricity businesses. Comparisons are distorted by the very high per-capita consumption in Abu Dhabi compared to other countries. While ADDC and (especially) AADC perform poorly on per-customer measures (as is to be expected), they do not perform as well as to be expected on the per-unit measures which should favour them (generally, they are only about average compared to UK companies). Similarly, TRANSCO is only average on per unit measures but has high ratios on a line-length basis. Further, the performance of the companies, particularly AADC and TRANSCO, has declined over time. While the Bureau has not relied on the above results in reaching its conclusions, they support the view that there remains significant scope for improvements in efficiency in the sector.
6.5.3 Quantification of the Base Level of Opex
As mentioned earlier, the Bureau has used the 2004 audited level of opex for each business as the base level of opex for PC3. These are in 2004 prices and so have been adjusted to 2006 prices for the purposes of setting the price controls using the CPI assumptions shown in the following table. Historic figures are as per the publications of the UAE Ministry of Planning, while the 2004 and 2005 figures are Bureau estimates.

Title: 2005 Price Controls Review � Draft Proposals Issue No.: 1 Rev (0) Prepared by:
AR/MPC/MMH Document No. CR/E02/022 Issue Date: 27/07/05
Approved by: NSC
Page 48 of 137
Table 6.5: UAE CPI Inflation Data
Actual for 2000 � 2003 as per Ministry of Planning 1998 1999 2000 2001 2002 2003 2004 2005
UAE CPI (1995=100) 106.9 109.2 110.7 n/a n/a n/a n/a n/a
UAE CPI (2000=100) 100.0 102.8 105.8 109.1 n/a n/a
UAE Inflation (includes assumptions for 2004 & 2005) 2.15% 1.37% 2.80% 2.92% 3.12% 3.00% 3.00% The following table shows the base levels of opex for each business in 2006 prices:
Table 6.6: Base Levels of Opex (based on 2004) for PC3 � Draft Proposals
AED million 2004(in 2004 prices)
2004(in 2006 prices)
AADC Electricity Distribution 114.176 121.129 Electricity Supply 37.837 40.141 Water Distribution 59.565 63.193 Water Supply 11.619 12.327 ADDC Electricity Distribution 190.404 202.000 Electricity Supply 39.824 42.249 Water Distribution 94.402 100.151 Water Supply 34.180 36.262 ADWEC Electricity 5.376 5.704 Water 4.399 4.667 TRANSCO Electricity 102.364 108.598 Water 169.528 179.852 TOTAL Total Electricity 489.981 519.821 Total Water 373.693 396.451 Grand Total 863.674 916.272
6.6 Adjustment to Base Level of Opex for Demand Increases
At the 2002 price control review, the Bureau assumed that each 1% increase in demand would lead to an increase in opex of about 0.5%, all else being equal, due to economies of scale. The respondents to the First Consultation Paper argued that this assumption was too demanding and referred to a study undertaken by consultants for Ofwat which they said concluded that a 1% increase in scale is associated with a 1.7% increase in long run costs. However, the Bureau noted that Ofwat�s study relates to combined water and sewerage companies. In the case of water-only businesses, Ofwat�s consultants found evidence of economies of scale.
The Second Consultation Paper referred to a recent World Bank5 study that finds evidence for economies of scale for water service providers based on cost data from 270 companies in 33 countries and various measures of �size�. For small providers, the study reports an increase in
Title: 2005 Price Controls Review � Draft Proposals Issue No.: 1 Rev (0) Prepared by:
AR/MPC/MMH Document No. CR/E02/022 Issue Date: 27/07/05
Approved by: NSC
Page 49 of 137
operating costs by 63% - 86% for a 100% increase in the volume of water, again supporting an expectation of economies of scale.
In view of the respondents� comments and the evidence cited above, the Second Consultation Paper suggested that, for PC3, the base level of opex should be increased by 0.6 � 0.9% for each 1% increase in demand.
The respondents to the Second Consultation Paper commented as follows:
• AADC argued that the Bureau�s proposed treatment of opex was overly simplistic, and should take account of factors such as service levels and functional scope. It also suggested that the Bureau has misinterpreted the findings of the World Bank study. AADC further suggested the other research reviewed by the Bureau may be biased. AADC suggested that the best indicator of AADC�s scope for efficiency improvements was provided by its past cost trends.
• In relation to the World Bank�s study on economies of scale, ADDC considered that it falls within the �large� company category, which shows economies of scale between 75 and 118. Indeed, as diseconomies increase for larger companies, ADDC maintained that the 1:1.7 ratio identified in the Stone & Webster report for Ofwat remains appropriate. On this basis, ADDC argued that it had been efficient in the past and that its future opex projections are �challenging�.
• TRANSCO�s arguments for higher adjustment to opex for demand were based on additional opex requirements to operate new assets and additional regulatory and reporting requirements during the PC3 period.
The Bureau acknowledges that the results of the World Bank�s study are open to interpretation but considers that the diseconomies of scale identified by the respondents are not directly applicable to the sector companies. Furthermore, no respondent has put forward any convincing reason why, in principle, diseconomies of scale should be expected.
For these Draft Proposals, the Bureau has therefore adopted an assumption of a 0.75% increase in opex for each 1% increase in demand. This is the mid-point of the range suggested in the Second Consultation Paper and is significantly more generous than the assumption adopted at the 2002 price review.
The following table shows the demand growth over the period 2004-2009 for each business based on the revenue driver projections in Section 5. Where there are two demand measures for a business, a simple average of the respective demand growths has been calculated. For ADWEC, growth in gross peak demand has been used as the demand measure. In the final column the table reports the annual adjustment to the base opex level resulting from the assumed opex-demand relationship discussed above.
5 �Optimal Size for Utilities? Returns to Scale in Water: Evidence from Benchmarking�, Note
Number 283, Public Policy for the Private Sector, The World Bank, January 2005.

Title: 2005 Price Controls Review � Draft Proposals Issue No.: 1 Rev (0) Prepared by:
AR/MPC/MMH Document No. CR/E02/022 Issue Date: 27/07/05
Approved by: NSC
Page 50 of 137
Table 6.7: Annual Opex Adjustment for Demand Growth (2004-2009) � Draft Proposals
% Increase Demand Measures Annual Demand
Growth Rate
Annual Opex Adjustment for
Demand GrowthAADC Electricity Distribution Units distributed, Customer accounts 5.85% 4.39% Electricity Supply Customer accounts 3.34% 2.50% Water Distribution Units distributed, Customer accounts 5.37% 4.02% Water Supply Customer accounts 2.86% 2.15% ADDC Electricity Distribution Units distributed, Customer accounts 5.25% 3.94% Electricity Supply Customer accounts 2.13% 1.60% Water Distribution Units distributed, Customer accounts 5.03% 3.77% Water Supply Customer accounts 2.19% 1.64% ADWEC Electricity Gross peak demand 8.36% 6.27% Water Gross peak demand 7.87% 5.90% TRANSCO Electricity Peak demand, Units transmitted 8.39% 6.29% Water Peak demand, Units transmitted 9.23% 6.92%
Note: Annual opex adjustment in the final column has been derived by multiplying annual demand growth figure by 0.75.
6.7 Adjustment to Demand-Adjusted Opex for Efficiency Improvements
At the 2002 price controls review, the Bureau adopted an opex efficiency improvement of 5% a year in real terms based on evidence that efficiency improvements of 3% � 7% a year (real) had been made by similar firms in comparable circumstances.
The Second Consultation Paper presented recent studies for the UK regulators showing opex efficiency improvements in the range of 2.5% - 7.7% achieved by comparable businesses in the UK. The paper therefore suggested that the demand-adjusted base level of opex should be reduced by 3 - 7% a year for assumed efficiency improvement.
In response, TRANSCO considered that the impact of the proposed 3% - 7% efficiency improvement is likely to be significant and argued that there are a number of additional regulatory and reporting requirements which will be in place during the PC3 period. However, since its response to the Second Consultation Paper, TRANSCO has submitted its revised information showing significant reductions in its opex projections compared to its previous submission in view of its plans for various efficiency improvements.
Overall, the Bureau has not been persuaded that the scope for efficiency improvements is not substantial. In fact, we consider that the proposed range may be conservative. Nevertheless, to allow scope for licensees to outperform the efficiency assumption, the Draft Proposals are based on an assumed opex efficiency improvement of 5% a year, the same as adopted at the 2002 price controls review.
The following table shows the combined effect of the demand growth and efficiency adjustment on the resulting opex projections for PC3:

Title: 2005 Price Controls Review � Draft Proposals Issue No.: 1 Rev (0) Prepared by:
AR/MPC/MMH Document No. CR/E02/022 Issue Date: 27/07/05
Approved by: NSC
Page 51 of 137
Table 6.8: Opex Projections for PC3 � Draft Proposals
AED million, 2006 prices Annual Opex Adjustment
2004 2005 2006 2007 2008 2009
AADC Electricity Distribution -0.61% 121.129 120.386 119.647 118.912 118.182 117.456 AADC Electricity Supply -2.50% 40.141 39.139 38.161 37.208 36.278 35.372 AADC Water Distribution -0.98% 63.193 62.576 61.966 61.361 60.762 60.170 AADC Water Supply -2.85% 12.327 11.975 11.634 11.302 10.979 10.666 ADDC Electricity Distribution -1.06% 202.000 199.849 197.722 195.617 193.534 191.474 ADDC Electricity Supply -3.40% 42.249 40.813 39.426 38.086 36.791 35.541 ADDC Water Distribution -1.23% 100.151 98.919 97.702 96.500 95.313 94.140 ADDC Water Supply -3.36% 36.262 35.043 33.865 32.727 31.627 30.564 ADWEC Electricity 1.27% 5.704 5.776 5.849 5.924 5.999 6.075 ADWEC Water 0.90% 4.667 4.709 4.751 4.794 4.837 4.881 TRANSCO Electricity 1.29% 108.598 109.999 111.418 112.856 114.312 115.787 TRANSCO Water 1.92% 179.852 183.305 186.823 190.409 194.064 197.789 Total Electricity 519.821 515.962 512.223 508.602 505.097 501.706 Total Water 396.451 396.526 396.740 397.093 397.583 398.210
Grand Total 916.272 912.488 908.963 905.695 902.680 899.915 Note: �Annual Opex Adjustment� is the combined effect of the demand growth adjustment and the efficiency improvement and has been
derived by adding -5.00% (assumed annual efficiency improvement) to the final column of Table 6.7.
It can be seen from the above table that the total opex for all the businesses is projected at a level of about AED 900 million for each year of the PC3 period. Opex is projected to slightly increase each year for ADWEC and TRANSCO and to slightly decrease each year for AADC and ADDC. This is because of the underlying demand growth projections for the respective businesses. In particular, customer numbers for AADC and ADDC, which is one of the cost drivers adopted for the distribution businesses, and the only cost driver for the supply businesses, are expected to grow at lower rates than the cost drivers for ADWEC and TRANSCO.
Separately, the Bureau has written to AADC asking for an explanation of its relatively high level of costs (given the number of customers served) of its electricity supply business.
6.8 Further Adjustment to Opex Projections for Other Factors
Recent meetings with AADC, ADWEC and TRANSCO highlighted the need for a number of adjustments to opex projections for PC3 to take account of certain costs not fully reflected in the 2004 level of costs. These adjustments relate to the financing of: (a) AADC�s costs of certain water fittings within water customers� premises in Al Ain; (b) new responsibilities which ADWEC is expected to undertake during the PC3 period; and (c) increases in costs of electricity supply to water pumps of TRANSCO.
These adjustments are consistent with the Bureau�s approach to date towards financing new workloads or responsibilities, as discussed in Section 3.4.

Title: 2005 Price Controls Review � Draft Proposals Issue No.: 1 Rev (0) Prepared by:
AR/MPC/MMH Document No. CR/E02/022 Issue Date: 27/07/05
Approved by: NSC
Page 52 of 137
6.8.1 Additional Opex for AADC�s Water Fittings
In order to facilitate the completion of a 24-hour water supply in the AADC area, the company has identified that significant amounts of rectification work need to be undertaken on assets in or adjacent to customer premises, such as the installation of float valves and ancillary tank connection pieces.
Although, in principle, these are customer responsibilities, the Bureau has agreed to finance AADC undertaking such works.
AADC has estimated the cost at AED 25 million, to be spread over two years: 2006 and 2007. This is based on undertaking a survey of all of its water customers and an assumption that, of these, 15,000 will require minor works and 5,000 will require significant works.
The Bureau has reviewed AADC�s cost estimates and regards them as reasonable. The opex allowances for AADC�s water distribution business set out in the following table therefore include an additional AED 25 million spread over 2006 and 2007. The Bureau will closely monitor the expenditure to ensure that the financed activities are undertaken and that it is appropriately accounted for (as an operating cost rather than capex).
Table 6.9: AADC Water Distribution�s Adjusted Opex Projections for PC3 � Draft Proposals
AED million, 2006 prices 2006 2007 2008 2009 AADC Water Distribution Opex Projections (Table 6.8) 61.966 61.361 60.762 60.170
Additional Opex for Water Fittings 12.500 12.500 - - Adjusted Opex Projections 74.466 73.861 60.762 60.170
6.8.2 Additional Opex for ADWEC�s New Responsibilities
ADWEC is expected to acquire new responsibilities during the PC3 period in relation to the Emirates National Grid (ENG) and the Gulf Co-operation Council (GCC) Interconnection. In addition, ADWEC has begun purchasing water from outside the Emirate of Abu Dhabi for sale within the Emirate as part of its licensed activities. However, other developments, such as sales of water and electricity to customers in other Emirates, are not part of ADWEC�s licensed activities to which the price controls relate.
ADWEC has said that it expects the operating costs of its licensed business (water and electricity combined) to increase from about AED 10 million in 2004 to around AED 21 million in 2005 and AED 26 million by 2009 as a result of the above developments.
The Bureau has reviewed ADWEC�s estimates in some detail and considers them likely to be excessive. Nevertheless, it is important that ADWEC should be appropriately resourced so as to achieve the best possible outcome for the sector in relation to these developments. In these Draft Proposals, the Bureau has therefore assumed the following additional allowances for PC3:
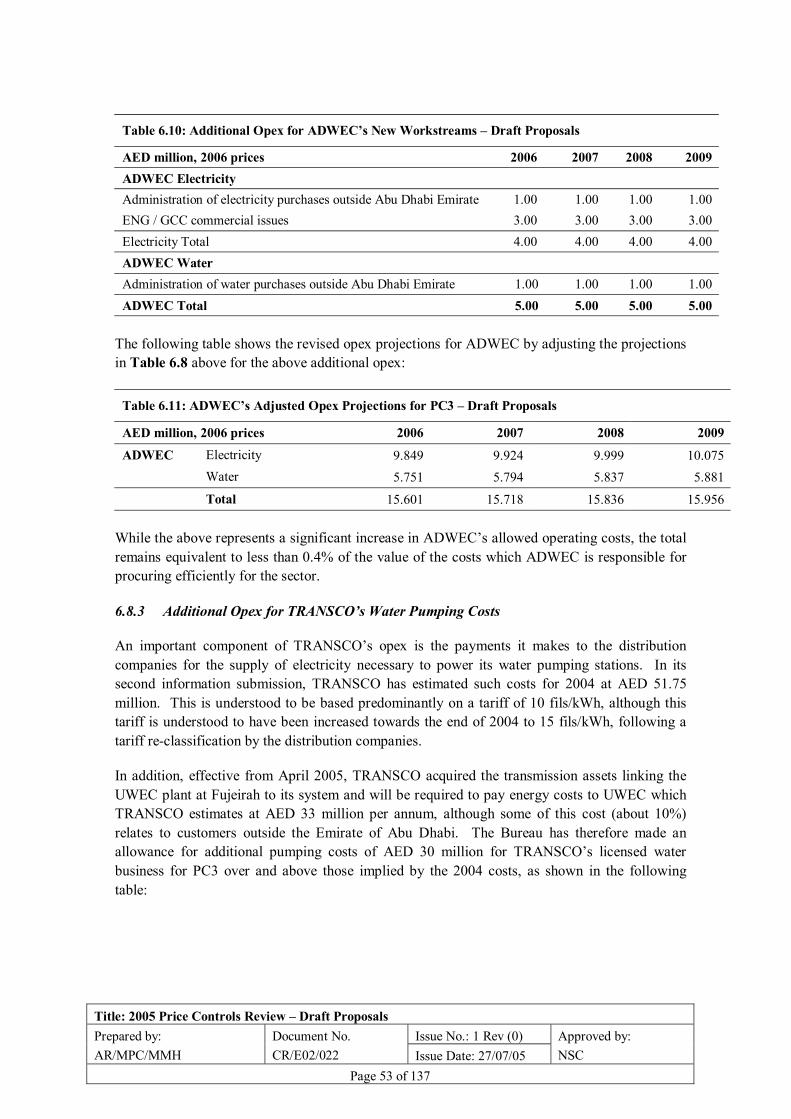
Title: 2005 Price Controls Review � Draft Proposals Issue No.: 1 Rev (0) Prepared by:
AR/MPC/MMH Document No. CR/E02/022 Issue Date: 27/07/05
Approved by: NSC
Page 53 of 137
Table 6.10: Additional Opex for ADWEC�s New Workstreams � Draft Proposals
AED million, 2006 prices 2006 2007 2008 2009 ADWEC Electricity Administration of electricity purchases outside Abu Dhabi Emirate 1.00 1.00 1.00 1.00 ENG / GCC commercial issues 3.00 3.00 3.00 3.00 Electricity Total 4.00 4.00 4.00 4.00 ADWEC Water Administration of water purchases outside Abu Dhabi Emirate 1.00 1.00 1.00 1.00 ADWEC Total 5.00 5.00 5.00 5.00
The following table shows the revised opex projections for ADWEC by adjusting the projections in Table 6.8 above for the above additional opex:
Table 6.11: ADWEC�s Adjusted Opex Projections for PC3 � Draft Proposals
AED million, 2006 prices 2006 2007 2008 2009
ADWEC Electricity 9.849 9.924 9.999 10.075 Water 5.751 5.794 5.837 5.881 Total 15.601 15.718 15.836 15.956
While the above represents a significant increase in ADWEC�s allowed operating costs, the total remains equivalent to less than 0.4% of the value of the costs which ADWEC is responsible for procuring efficiently for the sector.
6.8.3 Additional Opex for TRANSCO�s Water Pumping Costs
An important component of TRANSCO�s opex is the payments it makes to the distribution companies for the supply of electricity necessary to power its water pumping stations. In its second information submission, TRANSCO has estimated such costs for 2004 at AED 51.75 million. This is understood to be based predominantly on a tariff of 10 fils/kWh, although this tariff is understood to have been increased towards the end of 2004 to 15 fils/kWh, following a tariff re-classification by the distribution companies.
In addition, effective from April 2005, TRANSCO acquired the transmission assets linking the UWEC plant at Fujeirah to its system and will be required to pay energy costs to UWEC which TRANSCO estimates at AED 33 million per annum, although some of this cost (about 10%) relates to customers outside the Emirate of Abu Dhabi. The Bureau has therefore made an allowance for additional pumping costs of AED 30 million for TRANSCO�s licensed water business for PC3 over and above those implied by the 2004 costs, as shown in the following table:

Title: 2005 Price Controls Review � Draft Proposals Issue No.: 1 Rev (0) Prepared by:
AR/MPC/MMH Document No. CR/E02/022 Issue Date: 27/07/05
Approved by: NSC
Page 54 of 137
Table 6.12: TRANSCO Water Transmission�s Adjusted Opex Projections for PC3 � Draft Proposals
AED million, 2006 prices 2006 2007 2008 2009
TRANSCO Water Opex Projections (Table 6.8) 186.823 190.409 194.064 197.789 Additional Opex for Energy Costs 30.000 30.000 30.000 30.000
Adjusted Opex Projections 216.823 220.409 224.064 227.789 TRANSCO has argued for a further increase in allowed energy costs, to reflect the fact that the 2004 figure does not show the full impact of the increase in the electricity tariff (which was increased by the distribution companies in the course of the year). However, according to the licences of the distribution companies, TRANSCO is entitled to a special tariff (based predominantly on the BST and TUoS tariff), due to the size of its demand. Any special tariff is likely to be lower than the standard tariff, due to the constant nature of TRANSCO�s demand throughout the year (high load factor) and its limited use of the distribution systems. This will provide TRANSCO with a strong incentive to manage its demand for electricity to avoid system peaks.
TRANSCO has also projected increases in energy costs over PC3 due to general expansion of the network and the higher water volumes required to be pumped around the system. Cost increases due to this factor will be accommodated by the Bureau�s approach to projecting base costs forward to PC3 described above, which relates cost projections to anticipated demand increases.
6.9 Summary of Opex Projections
Opex projections adopted for each business in these Draft Proposals are summarised below:
Table 6.13: Opex Projections for PC3 � Draft Proposals
AED million, 2006 prices 2006 2007 2008 2009
AADC Electricity Distribution 119.647 118.912 118.182 117.456 Electricity Supply 38.161 37.208 36.278 35.372 Water Distribution 74.466 73.861 60.762 60.170 Water Supply 11.634 11.302 10.979 10.666
ADDC Electricity Distribution 197.722 195.617 193.534 191.474 Electricity Supply 39.426 38.086 36.791 35.541 Water Distribution 97.702 96.500 95.313 94.140 Water Supply 33.865 32.727 31.627 30.564
ADWEC Electricity 9.849 9.924 9.999 10.075 Water 5.751 5.794 5.837 5.881
TRANSCO Electricity 111.418 112.856 114.312 115.787 Water 216.823 220.409 224.064 227.789
TOTAL Electricity 516.223 512.602 509.097 505.706 Water 440.240 440.593 428.583 429.210
Grand Total 956.463 953.195 937.680 934.915

Title: 2005 Price Controls Review � Draft Proposals Issue No.: 1 Rev (0) Prepared by:
AR/MPC/MMH Document No. CR/E02/022 Issue Date: 27/07/05
Approved by: NSC
Page 55 of 137
7 Treatment of Capital Expenditure and Asset Valuation
7.1 Introduction
The allowances for capital expenditure (capex) for the network companies have significant implications for the price controls since they affect the regulatory asset values (RAVs) and hence the calculation of depreciation and the return on assets.
The treatment of capex varied between PC1 and PC2, but was essentially based on �ex-post� assessment � i.e., allowed capex is determined after the event (based on efficiency criteria established by the Bureau). While the PC1 controls were set financing no capex for the PC1 period (1999-2002), the PC2 controls were set with provisional capex allowances for both the PC1 period and the PC2 period (2003-2005).
It was agreed at the 2002 price controls review that once audited PC1 and PC2 capex was received, it would be reviewed against the efficiency criteria established by the Bureau. Any difference between efficient capex and the provisional allowances would be reflected in a financial adjustment (to future revenues) at the subsequent price controls review. In 2004, audited data for the PC1 period became available and the Bureau thus commenced a review of PC1 capex. Audited capex data for the full PC2 period is expected to be available in 2006.
The 2004-2005 price controls for RASCO were, by contrast, set on the basis of an �ex-ante� assessment of capex � i.e., the capex allowance was set in advance and is not subject to review.
The Draft Proposals for PC3 are based on the following:
• PC1 Capex: The Bureau proposes to apply the efficiency scores resulting from its PC1 capex review to determine the efficient PC1 capex to be used in PC3 price control calculations.
• PC2 Capex: The assessment of PC2 capex efficiency is proposed to be undertaken in 2006 for incorporation at the subsequent review. The Bureau intends to appoint independent consultants to undertake the PC2 capex review.
• PC3 Capex: The earlier consultation papers expressed the Bureau�s preference to adopt an �ex ante� approach at this review to the assessment and treatment of PC3 capex. However, the lack of robust investment plans and various difficulties highlighted by the companies in their responses make this approach inappropriate at this review. The Draft Proposals are therefore based on continuing the ex post approach, with provisional allowances based on the average capex spent during the last four years. However, this document discusses a proposed refinement of the ex post approach for PC3 to provide a more positive incentive to the most efficient companies.
This section also sets out additional requirements on distribution companies to improve the planning and reporting of capex during PC3.
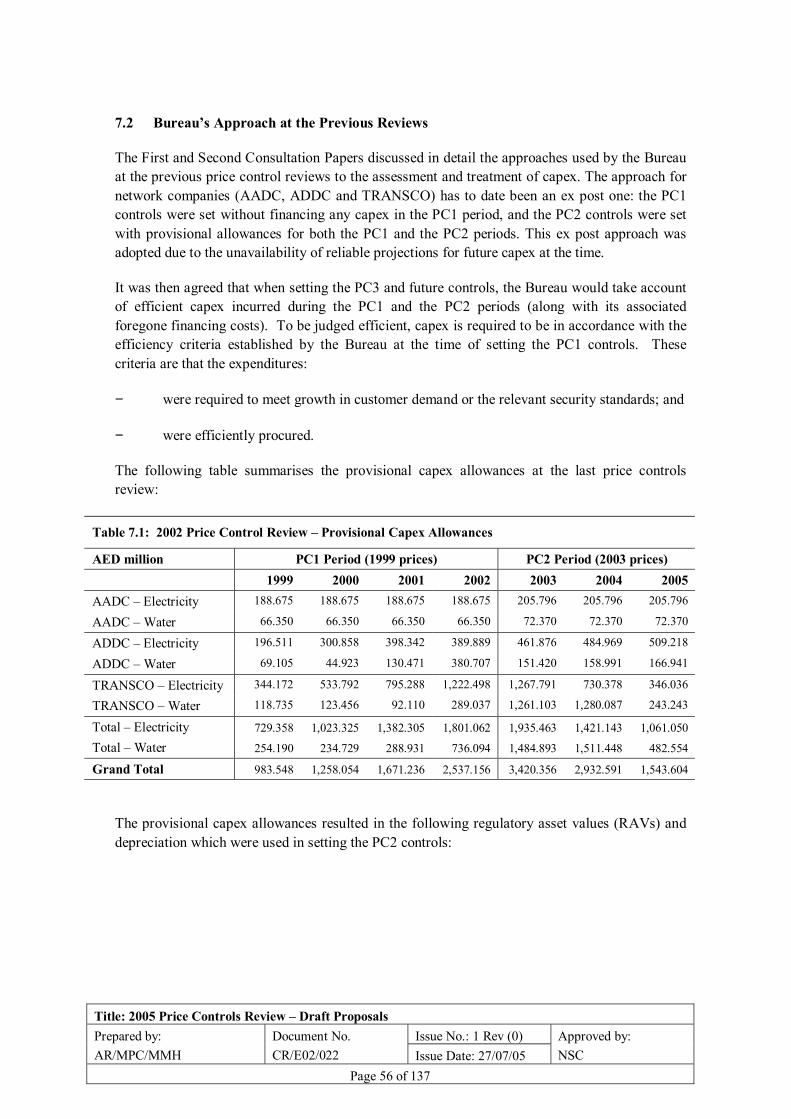
Title: 2005 Price Controls Review � Draft Proposals Issue No.: 1 Rev (0) Prepared by:
AR/MPC/MMH Document No. CR/E02/022 Issue Date: 27/07/05
Approved by: NSC
Page 56 of 137
7.2 Bureau�s Approach at the Previous Reviews
The First and Second Consultation Papers discussed in detail the approaches used by the Bureau at the previous price control reviews to the assessment and treatment of capex. The approach for network companies (AADC, ADDC and TRANSCO) has to date been an ex post one: the PC1 controls were set without financing any capex in the PC1 period, and the PC2 controls were set with provisional allowances for both the PC1 and the PC2 periods. This ex post approach was adopted due to the unavailability of reliable projections for future capex at the time.
It was then agreed that when setting the PC3 and future controls, the Bureau would take account of efficient capex incurred during the PC1 and the PC2 periods (along with its associated foregone financing costs). To be judged efficient, capex is required to be in accordance with the efficiency criteria established by the Bureau at the time of setting the PC1 controls. These criteria are that the expenditures:
− were required to meet growth in customer demand or the relevant security standards; and
− were efficiently procured.
The following table summarises the provisional capex allowances at the last price controls review:
Table 7.1: 2002 Price Control Review � Provisional Capex Allowances
AED million PC1 Period (1999 prices) PC2 Period (2003 prices) 1999 2000 2001 2002 2003 2004 2005 AADC � Electricity 188.675 188.675 188.675 188.675 205.796 205.796 205.796
AADC � Water 66.350 66.350 66.350 66.350 72.370 72.370 72.370
ADDC � Electricity 196.511 300.858 398.342 389.889 461.876 484.969 509.218
ADDC � Water 69.105 44.923 130.471 380.707 151.420 158.991 166.941
TRANSCO � Electricity 344.172 533.792 795.288 1,222.498 1,267.791 730.378 346.036
TRANSCO � Water 118.735 123.456 92.110 289.037 1,261.103 1,280.087 243.243
Total � Electricity 729.358 1,023.325 1,382.305 1,801.062 1,935.463 1,421.143 1,061.050
Total � Water 254.190 234.729 288.931 736.094 1,484.893 1,511.448 482.554
Grand Total 983.548 1,258.054 1,671.236 2,537.156 3,420.356 2,932.591 1,543.604
The provisional capex allowances resulted in the following regulatory asset values (RAVs) and depreciation which were used in setting the PC2 controls:

Title: 2005 Price Controls Review � Draft Proposals Issue No.: 1 Rev (0) Prepared by:
AR/MPC/MMH Document No. CR/E02/022 Issue Date: 27/07/05
Approved by: NSC
Page 57 of 137
Table 7.2: 2002 Price Control Review - Opening RAVs and Depreciation
AED m, 2003 prices 2003 2004 2005 2006 Annual Depreciation
on Opening 2003 RAVs*
Depreciation in 2006 on
Provisional PC2 Capex
AADC � Electricity 2,237.50 2,324.91 2,405.47 2,479.17 111.52 20.58 AADC � Water 455.90 512.24 566.16 617.67 13.62 7.24
ADDC � Electricity 4,180.40 4,440.40 4,707.32 4,981.52 186.48 48.54 ADDC � Water 1,408.11 1,470.82 1,535.81 1,603.18 83.66 15.91
TRANSCO � Electricity 6,150.55 7,149.01 7,585.72 7,626.55 227.07 78.14 TRANSCO � Water 2,480.35 3,555.19 4,606.34 4,612.53 144.23 92.81
* excluding depreciation on provisional PC2 capex
The above table shows the RAV at the start of each of 2003, 2004, 2005 and 2006, based on the provisional capex allowances for PC1 and PC2. The penultimate column shows the annual depreciation during the PC2 period on the opening RAV in 2003 (i.e., including provisional PC1 capex). The final column shows the level of depreciation by the end of PC2 on the provisional PC2 capex. These final two columns are shown as they are inputs into the price control calculations for PC3 in later sections.
7.3 Bureau�s Review of PC1 Capex
7.3.1 Findings of PC1 Capex Review
In 2004, the Bureau undertook a review of capex undertaken by the network companies during the PC1 period to assess such capex against the efficiency criteria. The overall approach was to review the processes undertaken by the companies in planning, procuring and managing capex projects and to assess a number of selected projects.
The First Consultation Paper reported that the capex review was expected to show a total amount of efficient capex for the PC1 period, while less than the capex actually spent, in excess of the provisional capex allowance made at the 2002 price controls review. While TRANSCO found these indications in line with its expectations, AADC and ADDC argued, in essence, that all of their PC1 (and PC2) capex should be considered efficient.
Following the publication of the First Consultation Paper, the Bureau forwarded its reports on the PC1 capex review to the respective network companies. These reports explain the methodology used by the Bureau to assess the PC1 capex against the efficiency criteria. The reports also list the selected capex projects that were reviewed.
The following table summarises the high-level findings of the Bureau�s PC1 capex review in the form of overall efficiency �scores� awarded according to the methodology explained in the review reports. The earlier consultation papers indicated the Bureau�s intention to apply the results to both electricity and water capex.

Title: 2005 Price Controls Review � Draft Proposals Issue No.: 1 Rev (0) Prepared by:
AR/MPC/MMH Document No. CR/E02/022 Issue Date: 27/07/05
Approved by: NSC
Page 58 of 137
Table 7.3: High-Level Findings of Bureau�s PC1 Capex Review
Company Efficiency Scores Planning Procurement Project Management Overall AADC 83% 85% 84% 84% ADDC 87% 96% 85% 89% TRANSCO 95% 92% 94% 94%
The Second Consultation Paper discussed how the above findings could be used to determine the efficient PC1 capex for each business. Three broad possibilities were identified:
1. Adopt the above scores without any further adjustment as the proportion of the outturn PC1 capex to be allowed as efficient capex; or
2. Adjust the above scores downwards to allow for the fact that only projects for which information was readily available from the companies could be assessed (documentation for other projects was less extensive); or
3. Adjust the above scores upwards for the earlier years of the PC1 period to allow for the possibility that the newly established sector companies needed some time to adjust to the new regulatory environment, and that this justified a more lenient treatment in those years.
7.3.2 Companies� Responses to PC1 Capex Efficiency Review
In response to the Second Consultation Paper and the Bureau�s report on the PC1 capex review, companies generally expressed concern at the Bureau�s findings and intentions. The responses of AADC and ADDC were particularly extensive.
While AADC undertook to follow up the recommendations of the Bureau�s PC1 capex report, it expressed the following concerns:
• The Bureau�s efficiency criteria should not be interpreted as extending to the efficiency with which projects have been executed. AADC suggested it has been fully efficient against its own interpretation of the criteria. AADC suggested that the efficiency criteria be clarified for PC2 onwards.
• The assessment of capex processes should not be applied to capex outcomes.
• The sample of projects is too small and does not include water.
• Insufficient account has been taken of external factors (eg, municipality approval) and of AADC�s operating environment (eg, remoteness).
• The assessments in the Bureau�s capex report are too subjective.
• AADC thought the review could have a substantial financial impact and implied excessive regulatory risk.

Title: 2005 Price Controls Review � Draft Proposals Issue No.: 1 Rev (0) Prepared by:
AR/MPC/MMH Document No. CR/E02/022 Issue Date: 27/07/05
Approved by: NSC
Page 59 of 137
ADDC stated it was assessing the recommendations of the Bureau�s PC1 capex review to see if they can, have or should be incorporated into ADDC�s processes. However, the company argued that the total PC1 capex on a cash basis should be allowed, for the following reasons:
• The penalties are one-sided and increase the cost of capital (past as well as future).
• The methodology used to make the project assessments was subjective. ADDC provided a large number of detailed comments on this aspect.
• The review did not adequately test the Bureau�s first efficiency criteria (required for demand and security of supply).
• As the projects were put out to competitive tender, they were efficiently procured.
• The range implied between different companies is implausible, particularly considering the role of ADWEA Projects department.
• The presumption of a direct correlation between the efficiency of processes and outcomes can not be supported.
• The results should not be applied to water.
TRANSCO believed that the interests of the sector would be best served by a forward-looking approach that provides an incentive to companies to improve performance and reduce costs in areas that can be shown to be inefficient. TRANSCO acknowledged that there is likely to be significant scope for reducing capital cost within the sector whilst delivering the required outputs. The company suggested that the findings of the capex review should be applied in such a way as to positively encourage continued improvements in performance across the sector and expressed concern that the way the Bureau intends to apply these findings will retrospectively penalise companies for past performance over a long period into the future.
7.3.3 Bureau�s Views on Companies� Responses
The Bureau acknowledges that the respondents to the Second Consultation Paper raised certain valid issues in relation to regulatory risks associated with any treatment of capex. However, some risk is inevitable and in some cases necessary to provide correct incentives to licensees but should be kept to the minimum consistent with the achievement of the Bureau�s overall statutory duties. The Bureau considers that it has adopted a transparent and consistent approach throughout, strictly in accordance with the pre-agreed efficiency criteria. The Bureau consulted extensively with the companies during the previous price control reviews and during the capex efficiency review on the efficiency criteria and the methodology it used for the efficiency review.
The Bureau wrote to the companies on 6 April 2005 to provide its views on their responses:
• The Bureau believes it would be inappropriate to increase the allowed return to reflect any increased regulatory risk inherent in the �ex post� approach to the regulation of capex. The �ex post� approach is adopted because the licensees have to date been unable

Title: 2005 Price Controls Review � Draft Proposals Issue No.: 1 Rev (0) Prepared by:
AR/MPC/MMH Document No. CR/E02/022 Issue Date: 27/07/05
Approved by: NSC
Page 60 of 137
to provide sufficiently reliable capex forecasts. To allow additional returns would not provide any incentive for licensees to produce more reliable capex forecasts in the future.
• With regard to ADDC�s argument that the one-sided nature of the adjustments proposed was not reflected in the cost of capital agreed for PC1 and PC2, the Bureau has been consistent in stating that PC1 capex would only be allowed if it met the Bureau�s efficiency criteria. The same will apply for PC2 capex. It was therefore to be expected that the adjustments would be one-sided. However, as discussed further below, the Bureau is receptive to TRANSCO�s suggestions that a more balanced reward/penalty arrangement may be considered for capex undertaken during PC3, provided improvements in capital efficiency can be demonstrated.
• The Bureau does not agree with the very limited interpretation of the efficiency criteria suggested by AADC and ADDC - for example, that capex can be regarded as having been procured 100% efficiently simply because it has been put out to competitive tender. A capex review which did not also take into account the execution of projects would not be credible. The meaning of �to procure� in this context is �to bring about or to effect� and thus includes the execution of projects. The Bureau rejects the suggestion that �the rules� (the efficiency criteria) have been changed after the event.
• The PC1 capex review provides the source of �guidance� requested by certain licensees as to the Bureau�s interpretation of the efficiency criteria going forward.
• The Bureau does not agree that the PC1 capex review could have an excessive financial impact, as suggested by AADC. In fact, these Draft Proposals actually result in substantial additional income (see below) from that which has been previously allowed. In any case, the Bureau is required under Article 96 of Law No (2) to take into consideration the effect of its proposals on the financial position of licensees, which limits the regulatory risks.
• The Bureau does not agree with the argument put forward by both distribution companies that there is no linkage between the efficiency of capex processes and outcomes. The PC1 capex review encompassed both capex processes and a review of particular projects. While the Bureau did not rely solely on its review of processes, it believes that efficient capex processes are, all else equal, more likely to lead to efficient capex outcomes.
• With regard to concerns expressed as to the scope and nature of the review, the Bureau notes that the companies were consulted on these matters prior to commencing the review. That correspondence indicated that the results were intended to be applied to water as well as to electricity, and would encompass project management as well as the planning and tendering stages.
The Bureau has therefore directly used the efficiency scores from its PC1 capex review to determine the efficient PC1 capex for these Draft Proposals.

Title: 2005 Price Controls Review � Draft Proposals Issue No.: 1 Rev (0) Prepared by:
AR/MPC/MMH Document No. CR/E02/022 Issue Date: 27/07/05
Approved by: NSC
Page 61 of 137
7.3.4 Determining Efficient Levels of PC1 Capex
The following table shows outturn capex for the PC1 period as per the audited cash flow statements in the company accounts:
Table 7.4: Audited Outturn PC1 Capex � Accrual Basis including Advances to Contractors
AED m, nominal prices 1999 2000 2001 2002 AADC Electricity Distribution 132.599 290.419 276.904 165.584 AADC Electricity Supply 1.485 0.786 1.355 11.928 AADC Water Distribution 101.015 191.556 66.143 179.682 AADC Water Supply 1.198 0.617 0.496 6.764 ADDC Electricity Distribution 246.599 424.281 522.128 510.573 ADDC Electricity Supply 1.013 0.028 1.436 13.682 ADDC Water Distribution 105.578 36.764 134.826 276.382 ADDC Water Supply 0.965 0.025 1.558 11.835 TRANSCO Electricity 493.218 824.299 1,103.261 968.596 TRANSCO Water 124.268 133.328 205.189 650.695 Total Electricity 874.914 1,539.813 1,905.084 1,670.363 Total Water 333.024 362.290 408.212 1,125.358 Grand Total 1,207.938 1,902.103 2,313.296 2,795.721 Source: �Property, Plant and Equipment� (including �Advances to Contractors�) from the Audited Separate Business Accounts (Cashflow Statements)
Note that while, in principle, capex on a cash flow basis should be used in the price control calculations, this is not available in the audited accounts. Rather the audited cash flow statements for the businesses only show capex on an accruals basis (in the line �Purchase of Property, Plant and Equipment�), which are adopted in the above table (figures also include �Advances to Contractors�).
This matter was discussed in detail with the companies and their auditors. Companies at the Bureau�s request provided their estimates of PC1 capex on a cash flow basis, but these figures were not audited. The auditors indicated that audited figures for capex on a cash flow basis could only be produced for ADWEA�s accounts, as ADWEA presently makes the cash payments to contractors for most of the projects for each business.
Based on the data provided by the companies, use of accruals-based capex will generally result in higher allowed capex than using cash-based capex, reflecting the inclusions of amounts due to the year in question for which a cash payment has not yet been made. This accelerated financing of capex will thus to some extent offset the concerns of the companies as to the impact of the PC1 capex assessment, discussed above. Furthermore, the use of audited data clearly referenced to the published accounts will provide a much sounder and more transparent basis for the remuneration of capex, and thus minimise regulatory risk.
Note also that minor adjustments have been made in Table 7.4 for AADC in 1999 and 2000 to reflect income from asset sales (see section 9.5).

Title: 2005 Price Controls Review � Draft Proposals Issue No.: 1 Rev (0) Prepared by:
AR/MPC/MMH Document No. CR/E02/022 Issue Date: 27/07/05
Approved by: NSC
Page 62 of 137
For AADC and ADDC, the provisional capex allowances for PC1 were set without distinction between distribution and supply. In order to separate price controls, their provisional allowances shown in Table 7.1 need to be split between distribution and supply. The following table shows this split based on the ratio implied by the audited PC1 capex for each year for the respective businesses (separately for water and electricity):
Table 7.5: Provisional PC1 Capex Allowances - Split between Distribution and Supply
AED m, 1999 prices 1999 2000 2001 2002 AADC Electricity Distribution 186.59 188.17 187.76 176.00 AADC Electricity Supply 2.09 0.51 0.92 12.68 AADC Water Distribution 65.57 66.14 65.86 63.94 AADC Water Supply 0.78 0.21 0.49 2.41 ADDC Electricity Distribution 195.71 300.84 397.25 379.71 ADDC Electricity Supply 0.80 0.02 1.09 10.18 ADDC Water Distribution 68.48 44.89 128.98 365.07 ADDC Water Supply 0.63 0.03 1.49 15.63 TRANSCO Electricity 344.17 533.79 795.29 1,222.50 TRANSCO Water 118.74 123.46 92.11 289.04
As discussed previously, the Bureau has applied the efficiency scores from its capex review (see Table 7.3 above) to the actual PC1 capex (Table 7.4) to determine the efficient levels of PC1 capex. The provisional PC1 capex (Table 7.5) has then been subtracted to determine the additional PC1 capex which needs to be financed in the PC3 controls. This is shown in the following table (in 1999 prices):
Table 7.6: Efficient PC1 Capex over and above Provisional PC1 Capex � Draft Proposals
AED m, 1999 prices 1999 2000 2001 2002 AADC Electricity Distribution -75.202 50.648 36.859 -45.339 AADC Electricity Supply -0.842 0.137 0.180 -3.266 AADC Water Distribution 19.280 91.381 -12.203 77.839 AADC Water Supply 0.229 0.294 -0.092 2.930 ADDC Electricity Distribution 23.766 68.819 51.493 47.146 ADDC Electricity Supply 0.098 0.005 0.142 1.263 ADDC Water Distribution 25.485 -12.862 -13.104 -134.008 ADDC Water Supply 0.233 -0.009 -0.151 -5.738 TRANSCO Electricity 119.453 224.729 206.178 -367.220 TRANSCO Water -1.923 -0.767 94.147 285.532 Total Electricity 67.272 344.337 294.852 -367.416 Total Water 43.304 78.038 68.596 226.555 Grand Total 110.576 422.375 363.448 -140.861
Note: PC1 provisional capex allowances were set in 1999 prices. However, the audited PC1 capex (and hence the efficient PC1 capex) were in nominal terms. The efficient PC1 capex has been adjusted to 1999 prices using CPI data given in Table 6.5. Positive (negative) signs indicate that efficient capex determined is higher (lower) than the provisional capex allowance.

Title: 2005 Price Controls Review � Draft Proposals Issue No.: 1 Rev (0) Prepared by:
AR/MPC/MMH Document No. CR/E02/022 Issue Date: 27/07/05
Approved by: NSC
Page 63 of 137
The above table indicates that, over 1999-2002, about AED 756 million in 1999 prices (a simple sum before present value adjustments) in respect of PC1 capex needs to be converted into present value terms and financed at this review.
7.3.5 Updating RAVs for PC1 Capex
The 2006 opening RAVs for AADC and ADDC shown in Table 7.2 need to be split between distribution and supply businesses in order to set separate price controls for these businesses at this review. The Bureau has split the RAVs between these businesses based on the ratio implied by the fixed asset closing values for 2002 (i.e., the time of transition from PC1 to PC2) shown in the audited accounts for these businesses, as shown in the following table. The table also shows the allocation of depreciation on provisional PC1 and PC2 capex from Table 7.2 on the same basis:
Table 7.7: 2006 Opening RAVs and Depreciation � Split between Distribution and Supply
AED m, 2003 prices 2006 Opening RAVs
Depreciation on Opening 2003 RAVs
Depreciation in 2006 on Provisional PC2 Capex
AADC Electricity Distribution 2,458.59 110.59 20.41 AADC Electricity Supply 20.58 0.93 0.17 AADC Water Distribution 610.97 13.48 7.16 AADC Water Supply 6.70 0.15 0.08 ADDC Electricity Distribution 4,953.55 185.44 48.26 ADDC Electricity Supply 27.97 1.05 0.27 ADDC Water Distribution 1,583.53 82.63 15.72 ADDC Water Supply 19.64 1.03 0.19 As agreed at the previous price control reviews, the efficient PC1 capex over and above the provisional PC1 capex allowances (ie, the amounts in Table 7.6 above) needs to be rolled into the RAVs along with the foregone financing costs (both depreciation and return on capital) relating to the period between when the capex was undertaken and when it will be financed. Appendices A.1 through A.10 to this paper show how this has been done for each business of AADC, ADDC and TRANSCO. The format of tables and calculations in each of these appendices is standardised and can be summarised as follows:
• Lines 1-14 show various inputs, such as CPI data, actual and provisional PC1 capex, relevant capex efficiency score, average asset life (30 years), initial opening 2006 RAVs (before adjustment for efficient PC1 capex), initial depreciation on these RAVs, and the cost of capital (6%) used for the PC1 and PC2 controls.
• Lines 15-20 show the calculation and adjustment to 1999 prices of efficient PC1 capex (over the provisional allowances), whose results are shown in Table 7.6 above.
• Lines 21-24 show the calculation of depreciation foregone (in 1999 prices) during 1999-2005 on the efficient PC1 capex.

Title: 2005 Price Controls Review � Draft Proposals Issue No.: 1 Rev (0) Prepared by:
AR/MPC/MMH Document No. CR/E02/022 Issue Date: 27/07/05
Approved by: NSC
Page 64 of 137
• Lines 25-31 show the calculation of return on capital foregone (in 1999 prices) during 1999-2005 on the efficient PC1 capex.
• Lines 32-37 show the calculation of net present value (NPV) (in 1999 prices) at 1 January 2006 of total foregone financing costs during 1999-2005.
• Lines 38-43 show how the efficient PC1 capex over and above the provisional PC1 allowances has been rolled forward in the RAV and how the NPV of foregone financing costs has been added to the opening 2006 RAV. These lines also show the adjustment of the resulting RAV to 2006 prices, which is required for PC3 price control calculations.
• Lines 44-48 show the calculation of total annual depreciation on opening 2006 RAV after the above adjustments.
• Lines 49-55 relate to the provisional allowances for PC3 capex discussed in Section 7.5 below.
The following table summarises the results of the above calculations in terms of the NPV of foregone financing costs on efficient PC1 capex, opening 2006 RAVs, and total annual depreciation on 2006 RAVs:
Table 7.8: 2006 Opening RAVs and Depreciation (after adjustments for efficient PC1 capex)
AED m, 2006 prices NPV of Adjustment for Foregone
Financing Costs
2006 Opening RAVs Depreciation on Opening 2006 RAVs
AADC Electricity Distribution -26.215 2,631.975 141.997 AADC Electricity Supply -1.872 16.709 1.048 AADC Water Distribution 104.489 950.416 29.617 AADC Water Supply 1.569 12.408 0.382 ADDC Electricity Distribution 114.876 5,726.063 263.306 ADDC Electricity Supply 0.691 32.871 1.504 ADDC Water Distribution -51.109 1,537.370 102.222 ADDC Water Supply -2.302 13.169 1.108 TRANSCO Electricity 212.196 8,708.954 341.210 TRANSCO Water 169.295 5,611.030 274.387 Total Electricity 299.675 17,116.571 749.065 Total Water 221.942 8,124.394 407.716 Grand Total 521.617 25,240.965 1,156.781 The above table indicates that the total NPV of adjustments for foregone financing costs up to 2006 for all businesses amounts to about AED 522 million (in 2006 prices) � divided between AED 300 million for electricity and AED 222 million for water. These adjustments amount to about AED 78 million for AADC, AED 62 million for ADDC, and AED 381 million for TRANSCO.

Title: 2005 Price Controls Review � Draft Proposals Issue No.: 1 Rev (0) Prepared by:
AR/MPC/MMH Document No. CR/E02/022 Issue Date: 27/07/05
Approved by: NSC
Page 65 of 137
The total opening 2006 RAV for all the businesses has increased from about AED 22 billion (before adjustments for efficient PC1 capex, see Table 7.2 above) to about AED 25 billion (after adjustments for efficient PC1 capex). Similarly, the total annual depreciation on the opening 2006 RAV for all businesses has increased from about AED 1 billion to about AED 1.16 billion after the adjustments for efficient PC1 capex. These increases amount to approximately 15% and 12%, respectively, over the original values. These increases also reflect the change in price basis from 2003 prices to prices 2006 (i.e. due to CPI inflation).
All calculations of depreciation in these Draft Proposals, including the above, retain the 30-year average asset life assumption for network companies from the previous reviews. In response to ADDC�s suggestion for a review of this assumption for different businesses, the Second Consultation Paper sought evidence from companies concerning the asset life assumptions. In its response to that paper, ADDC argued that separate price controls for distribution and supply should take into account the shorter asset lives in the latter. ADDC suggested that a simple treatment for PC3 would be to maintain the current depreciation assumption for distribution assets but assume 5 year depreciation for supply business assets. However, ADDC provided no evidence in support of this suggestion, and the audited accounts contain insufficient data to make such an adjustment. In order to facilitate a �clean� separation of controls, the 30 year asset life assumption has been retained for all businesses in the Draft Proposals. However, this assumption is likely to overstate asset lives for supply and understate asset lives for transmission and distribution and thus may be reviewed at the next price controls review.
7.4 Review of Efficient PC2 Capex
The Second Consultation Paper suggested that the assessment of PC2 capex efficiency should be deferred until audited data for all PC2 years is available in 2006.
In response, AADC and ADDC reiterated their earlier suggestion that PC2 capex should be reviewed at this review, to minimise adjustments carried forward to the next control period. The respondents argued that audited information will be available for 2003 and 2004 and, for 2005, AADC suggested using its forecast of 2005 capex and reviewing variations to such a forecast at the next review. Further, AADC argued that the results of the Bureau�s PC1 capex review should not be applied to PC2 capex and all of its capex should be assumed to be efficient.
For the reasons explained in the Second Consultation Paper, the Bureau still considers it impractical and undesirable to review PC2 capex at this review:
• The quality of capex forecasts received from the companies has not been satisfactory to the extent that AADC�s suggestion mentioned above is impractical.
• There is insufficient time left before the publication of the Final Proposals for PC3 for a robust process of review and consultation on PC2 capex.
• In any case, audited data for 2005 will not become available until after this review.
• Any partial assessment of PC2 capex at this review with different treatments applying to different years would unduly increase the complexity of the regulatory arrangements.

Title: 2005 Price Controls Review � Draft Proposals Issue No.: 1 Rev (0) Prepared by:
AR/MPC/MMH Document No. CR/E02/022 Issue Date: 27/07/05
Approved by: NSC
Page 66 of 137
These Draft Proposals therefore do not make any adjustment to the provisional allowances for PC2 capex included in the PC2 controls. The assessment of PC2 capex efficiency will be undertaken in 2006, when audited data for all PC2 years will be available. The Bureau intends to appoint independent consultants for this exercise. Any adjustment for differences between efficient and provisional PC2 capex (including foregone financing costs) will then be incorporated at the 2009 price controls review.
7.5 Treatment and Assessment of PC3 Capex
7.5.1 Ex Post Approach for PC3 Capex with Provisional Allowances
The Bureau has adopted a transparent and consistent approach to the regulation of capex over PC1 and PC2, which has very strong efficiency properties (capex is not financed unless it is shown to be efficient against clearly-stated criteria). However, the Bureau has previously identified that the methodology could be further developed if companies can improve the quality of their capex forecasts and the reliability of output measurements.
The First and Second Consultation Papers discussed in detail the two potential approaches to the assessment and treatment of future capex while setting the price controls:
1. Ex Ante approach which includes an allowance for efficient future capex within the price controls with no (or limited) review subsequently of actual capex incurred; and
2. Ex Post approach which includes a provisional allowance for future capex in the price controls and then makes an adjustment at the subsequent price control review for the capex judged by the regulator to have been efficiently incurred.
Other than for RASCO, the ex post approach has been used to date. In earlier consultation papers, the Bureau reiterated its desire, in principle, to move towards an ex ante approach for all companies. However, this would require the companies to submit robust projections of future capex and to demonstrate to the Bureau that the projects underlying these projections are required to meet demand or security standards, and that the estimated costs are efficient. Further, in practice, an ex ante approach would still require an ex post assessment for certain factors such as for any unanticipated investment obligations, for under-spends against the allowed capex and for output performance.
In response to the Second Consultation Paper, AADC supported the continuation of the �ex post� approach for PC3 capex. However, it suggested that the Bureau should clarify the efficiency criteria and accept AADC�s capex projections for the PC3 period. ADDC also supported the use of the ex post capex approach for the PC3 period and suggested that the preferred ex ante method should be tested for possible introduction in PC4. TRANSCO argued that the approach should allow scope for rewards for good performance, rather than simply penalties for poor performance.
Based on the above responses, the Bureau has determined that the ex post approach to capex regulation should continue to be adopted for PC3, with provisional allowances for PC3 capex

Title: 2005 Price Controls Review � Draft Proposals Issue No.: 1 Rev (0) Prepared by:
AR/MPC/MMH Document No. CR/E02/022 Issue Date: 27/07/05
Approved by: NSC
Page 67 of 137
made at this review. However, the Bureau has also considered ways in which the approach can be developed to allow scope for rewards as well as penalties in future, as discussed below.
7.5.2 Proposed Refinement of Treatment of PC3 Capex
Respondents, in particular TRANSCO, have argued that the approach to capex regulation adopted for PC1 and PC2 is one-sided, in that it only penalises companies for inefficient capex but does not reward them for efficient capex.
The Bureau, while considering it inappropriate to retrospectively amend the approach for PC1 and PC2, accepts that it may be reasonable to refine the approach for PC3, while retaining the ex post framework, to provide a more positive efficiency incentive in future.
A refinement of the approach for PC3 may be considered appropriate if, as companies have argued, many of the recommendations of the Bureau�s PC1 capex review have already been implemented or else the companies have undertaken to implement outstanding recommendations in the near future. Thus it may be reasonable to assume that, by the start of the PC3 period, some of the inefficient practices inherited by the sector in 1999 will have been addressed.
For PC3 capex, the Bureau therefore intends to amend the treatment of capex so that the effect of the ex post review is cost-neutral for the sector, subject to a general efficiency factor. This would work as follows:
1. PC3 actual capex will be assessed in 2010 against the efficiency criteria, and the companies will be awarded �efficiency scores�, in the same manner as for the PC1 capex review and as for the forthcoming PC2 capex review. The Bureau intends to appoint independent consultants for this purpose.
2. However, in contrast to the PC1 and PC2 approach, the benchmark level of efficiency will not be set at 100%. Rather, the benchmark level will be set such that positive adjustments for the relatively efficient companies will be offset by corresponding negative adjustments for the relatively inefficient companies. For example, for three equally-sized companies with efficiency scores of 98%, 92% and 86% respectively, the efficiency benchmark for PC3 would be set at 92%. If the companies are not equally sized, then the benchmark would be a weighted average, such that the overall financial impact on the sector of the adjustments is neutral.
3. The resultant adjusted efficiency scores would then be subject to a further adjustment, to reflect movement in the capex efficiency frontier of the whole sector of, say, 3% a year.6 This is to reflect improvements in capital efficiency that should be expected of the sector as a whole. This is similar to the approach that has been adopted by Ofwat for the water industry in England and Wales. The assumed movement in the capital efficiency frontier will be identified based on international evidence/best practice.
6 Assumed improvements in capex efficiency may be lower than assumed improvements in opex
efficiency due to a gradual substitution of capex for opex over time, all else equal (�capital substitution effect�).

Title: 2005 Price Controls Review � Draft Proposals Issue No.: 1 Rev (0) Prepared by:
AR/MPC/MMH Document No. CR/E02/022 Issue Date: 27/07/05
Approved by: NSC
Page 68 of 137
The final adjusted efficiency score of the most efficient company would (in this example) be (98/92) * (1 - 0.03) = 103.3%. Similarly, the scores for the other two companies would be 97.0% and 90.7% respectively. Efficient capex will then be calculated by applying these ratios to audited actual capex, with the appropriate financial adjustments (compared to the provisional PC3 capex allowance) incorporated at the subsequent price control review.
In this way, it can be seen that the most efficient company (or companies) may receive an allowance in excess of their actual spend, dependent on the extent of their relative efficiency and the relationship to the assumed movement in the efficiency frontier. Less efficient companies will receive less than their actual spend, but the shortfall can be minimised by matching the efficiency of other firms in the sector. Overall, customers would benefit from the efficiency improvement inherent within the movement of the sector�s capital efficiency frontier.
This approach will be consistent with the efficiency incentive characteristics of CPI-X regulation, and introduce a form of competition or yardstick regulation into the sector. The approach would reduce the perceived regulatory risk and the possible impact of the efficiency review while at the same time providing a more positive incentive for capex efficiency. The Bureau would welcome companies� views on the above proposal for PC3 capex.
7.5.3 Efficiency Criteria for PC3 Capex
As with PC1 and PC2 capex, PC3 capex will be reviewed against the Bureau�s efficiency criteria. These require that capex:
1. was required to meet growth in demand or the relevant security standards; and
2. was efficiently procured.
A number of licensees have criticised the Bureau�s efficiency criteria but without suggesting specific alternatives. Even if licensees were uncertain as to the Bureau�s interpretation of the criteria, this has been clarified by the PC1 capex review reports. In particular, this has confirmed that �efficiently procured� includes in this context the efficiency with which projects were executed. The Bureau does not therefore propose any change to the efficiency criteria for PC3.
7.5.4 Provisional Allowances for PC3 Capex
The Second Consultation Paper indicated that the Bureau would consider the capex projections provided by the companies in their information submissions to see whether they make a suitable basis for the provisional projections required under the ex post approach. If not, the Bureau would substitute alternative figures.
In response, AADC suggested that the Bureau should accept its capex projections for the PC3 period.
In general, the Bureau does not consider that the companies� PC3 capex projections are sufficiently robust, for various reasons. There is almost no explanation or justification for these projections, which have changed significantly from one submission to another over a short time. In some cases, the estimates are high in some years and low in other years (predominantly in the

Title: 2005 Price Controls Review � Draft Proposals Issue No.: 1 Rev (0) Prepared by:
AR/MPC/MMH Document No. CR/E02/022 Issue Date: 27/07/05
Approved by: NSC
Page 69 of 137
later years). The Bureau has however not fully disregarded these projections but has used them as a cross-check for projections arrived at using alternative approaches.
The Bureau considered a number of techniques to make reasonable projections for PC3 capex. For example, it attempted to project PC3 capex based on the relationship between past capex and past growth in demand (in terms of peak demands, units transmitted or distributed, and customer numbers, as appropriate). However, there was an insufficiently clear pattern in the past spending to be useful for the future projections.
While the precise pattern or profile of future investment is difficult to ascertain, the Bureau has used an average of the expenditures over the last four years (2001-2004) to produce the provisional projections for PC3 capex. Earlier years (1999 and 2000) were excluded from this assessment because of the very low levels of capex in those years, which might be due to the fact that the sector was adjusting to the new structure that came into effect on 1 January 1999.
The average capex for each business was rounded up appropriately. The Bureau made a downward adjustment to the average capex for TRANSCO�s water business in view of the exceptional capex undertaken in 2003 and 2004 associated with the Shuweihat production plant.
The following table shows the resulting projections for PC3 capex which haves been adopted for these Draft Proposals. They amount to AED 3.26 billion per year for the sector as a whole (equivalent to about AED 1 million per year for every 100 connected customers).
Table 7.9: Provisional Allowances for PC3 Capex � Draft Proposals
AED m, 2006 prices 2006 2007 2008 2009 AADC Electricity Distribution 300.00 300.00 300.00 300.00 AADC Electricity Supply 5.00 5.00 5.00 5.00 AADC Electricity 305.00 305.00 305.00 305.00 AADC Water Distribution 150.00 150.00 150.00 150.00 AADC Water Supply 3.00 3.00 3.00 3.00 AADC Water 153.00 153.00 153.00 153.00 ADDC Electricity Distribution 530.00 530.00 530.00 530.00 ADDC Electricity Supply 6.00 6.00 6.00 6.00 ADDC Electricity 536.00 536.00 536.00 536.00 ADDC Water Distribution 310.00 310.00 310.00 310.00 ADDC Water Supply 5.00 5.00 5.00 5.00 ADDC Water 315.00 315.00 315.00 315.00 TRANSCO Electricity 1,200.00 1,200.00 1,200.00 1,200.00 TRANSCO Water 750.00 750.00 750.00 750.00 Total Electricity 2,041.00 2,041.00 2,041.00 2,041.00 Total Water 1,218.00 1,218.00 1,218.00 1,218.00 Grand Total 3,259.00 3,259.00 3,259.00 3,259.00

Title: 2005 Price Controls Review � Draft Proposals Issue No.: 1 Rev (0) Prepared by:
AR/MPC/MMH Document No. CR/E02/022 Issue Date: 27/07/05
Approved by: NSC
Page 70 of 137
7.6 Updating of Regulatory Asset Values (RAVs)
The provisional allowances for PC3 capex set out in Table 7.9 above have been rolled forward into the opening 2006 RAVs set out in Table 7.8. For each year of the PC3 control period, provisional PC3 capex is added to, and depreciation on both the opening 2006 RAV and such provisional capex is deducted from, the opening RAV to calculate the closing RAV.
These calculations are shown in lines 49-55 of Appendices A.1 - A.10. The resulting opening RAVs and total depreciation (in 2006 prices) for each year are shown in the following two tables:
Table 7.10: Opening RAVs over PC3 Period � Draft Proposals
AED m, 2006 prices 2006 2007 2008 2009 2010 AADC Electricity Distribution 2,631.975 2,784.978 2,927.981 3,060.984 3,183.987 AADC Electricity Supply 16.709 20.577 24.279 27.814 31.183 AADC Water Distribution 950.416 1,068.300 1,181.183 1,289.066 1,391.949 AADC Water Supply 12.408 14.977 17.445 19.813 22.081 ADDC Electricity Distribution 5,726.063 5,983.923 6,224.117 6,446.644 6,651.504 ADDC Electricity Supply 32.871 37.267 41.463 45.459 49.255 ADDC Water Distribution 1,537.370 1,739.981 1,932.259 2,114.204 2,285.816 ADDC Water Supply 13.169 16.978 20.619 24.094 27.402 TRANSCO Electricity 8,708.954 9,547.744 10,346.534 11,105.324 11,824.115 TRANSCO Water 5,611.030 6,074.143 6,512.255 6,925.368 7,313.481 Total Electricity 17,116.571 18,374.490 19,564.375 20,686.226 21,740.044 Total Water 8,124.394 8,914.378 9,663.762 10,372.546 11,040.729 Grand Total 25,240.965 27,288.867 29,228.136 31,058.772 32,780.774
Table 7.11: Total Annual Depreciation over PC3 Period � Draft Proposals
AED m, 2006 prices 2006 2007 2008 2009 AADC Electricity Distribution 146.997 156.997 166.997 176.997 AADC Electricity Supply 1.131 1.298 1.465 1.631 AADC Water Distribution 32.117 37.117 42.117 47.117 AADC Water Supply 0.432 0.532 0.632 0.732 ADDC Electricity Distribution 272.140 289.806 307.473 325.140 ADDC Electricity Supply 1.604 1.804 2.004 2.204 ADDC Water Distribution 107.389 117.722 128.055 138.389 ADDC Water Supply 1.192 1.358 1.525 1.692 TRANSCO Electricity 361.210 401.210 441.210 481.210 TRANSCO Water 286.887 311.887 336.887 361.887 Total Electricity 783.082 851.115 919.148 987.182 Total Water 428.016 468.616 509.216 549.816 Grand Total 1,211.098 1,319.731 1,428.364 1,536.998

Title: 2005 Price Controls Review � Draft Proposals Issue No.: 1 Rev (0) Prepared by:
AR/MPC/MMH Document No. CR/E02/022 Issue Date: 27/07/05
Approved by: NSC
Page 71 of 137
The total RAV of all the businesses increases from AED 25.2 billion to AED 32.8 billion over the PC3 period; that is, by about AED 7.5 billion or 30% in real terms.
The total annual depreciation of all the businesses increases from AED 1.21 billion to AED 1.54 billion over the PC3 period; that is, by about AED 0.33 billion or by 27%.
7.7 Preparation for Introduction of Ex Ante Approach at Next Review
As discussed earlier, the Bureau as well as the sector companies have a strong desire to move towards an ex ante approach to the regulation of future capex as early as possible. Recent discussions with some companies highlighted the need for a system to be in place that will help such a development at the 2009 review.
TRANSCO has a licence obligation to produce a Five Year Planning Statement. The distribution companies do not have a corresponding licence requirement (although they do have related obligations under the Transmission Codes). The absence of a formal planning statement has limited their ability to compile accurate projections of future capex requirements.
The Bureau therefore proposes, as part of the licence amendments to give effect to the PC3 proposals, to introduce a new licence requirement on the distribution companies to produce a five year planning statement, as follows:
�The Licensee shall, by 30 June each year, prepare statements (separately for the Licensee�s electricity distribution system and water distribution system) in a form approved by the Bureau showing in respect of each of the succeeding five financial years:
(a) capacity, forecast flows and loading on each part of the licensee�s relevant distribution systems;
(b) the licensee�s plans for capital expenditure necessary to ensure the licensee�s relevant distribution systems meet security standards and future demands; and
(c) a quantification of the capital expenditure plans under (b) above with particular reference to the cost of major schemes.
The statements shall also include a commentary explaining material differences between capital expenditure undertaken in the previous year compared to capital expenditure envisaged for that year in such statement submitted in earlier years�.
Such a mechanism should ensure that, by the 2009 price review, the distribution companies will have a �track record� of at least three such planning statements, which should provide a much firmer basis for the estimation of robust capex projections for price control purposes and would facilitate the introduction of the �ex ante� approach to capex regulation at that review.
Title: 2005 Price Controls Review � Draft Proposals Issue No.: 1 Rev (0) Prepared by:
AR/MPC/MMH Document No. CR/E02/022 Issue Date: 27/07/05
Approved by: NSC
Page 72 of 137
8 Cost of Capital and Profit Margin
8.1 Introduction
The cost of capital is a key input to setting price controls for capital-intensive businesses, such as the network businesses in Abu Dhabi. This is because it determines the allowed return on capital, which is a significant element of the future revenue requirement. The cost of capital can also incentivise or otherwise a business to make an investment.
The Second Consultation Paper suggested that a cost of capital in the range of 4.5% - 5.6% (real, post-tax) is appropriate for PC3, based on current evidence. However, the paper invited the respondents� views on whether a slightly higher cost of capital is justified for the distribution businesses, due to their relatively small capital size, risks associated with customers/subsidy, and uncertainties surrounding the future of these businesses.
For ADWEC, which has negligible capital assets but is exposed to risks associated with large financial flows, a profit margin approach is adopted. The Second Consultation Paper suggested a margin on turnover in the range of 0.019% - 0.023% consistent with the approach developed for the PC2 controls. While the paper suggested a similar return for the supply businesses of the two distribution companies, it recognised that the higher capital-intensity of these businesses compared to ADWEC may justify a higher margin.
Based on further consideration of the issues and on the responses to the Second Consultation Paper, the Bureau now proposes to apply to the supply businesses the same approach to calculating the return on capital element as for the network businesses (that is, cost of capital applied to RAVs instead of a profit margin approach).
The Bureau also considers that a slightly higher cost of capital is appropriate for the distribution and supply businesses than for TRANSCO. For these Draft Proposals, the Bureau has adopted a cost of capital (real, post-tax) of 5.00% for TRANSCO and 5.30% for AADC and ADDC. A profit margin of 0.021% has been determined for ADWEC. The following sections explain the Bureau�s approach and the reasons for these proposals.
8.2 Bureau�s Initial Cost of Capital Calculations for PC3
8.2.1 Overall Approach
The overall approach cost of capital calculations is summarised below:
• The cost of capital is calculated as the weighted average cost of capital (WACC) using standard models for the cost of debt and of equity, such as the Capital Asset Pricing Model (CAPM).
• The Bureau�s cost of capital calculations draw on the cost of capital components recently estimated by regulators of similar businesses in the UK and Australia.

Title: 2005 Price Controls Review � Draft Proposals Issue No.: 1 Rev (0) Prepared by:
AR/MPC/MMH Document No. CR/E02/022 Issue Date: 27/07/05
Approved by: NSC
Page 73 of 137
• The Bureau has cross-checked these estimates against the information available from local and regional capital markets in order to capture any particular factors that may be specific to the businesses operating in Abu Dhabi.
WACC is calculated as a weighted-average of the cost of debt finance and the cost of equity finance, as follows:
Real Post-Tax WACC = [Real Cost of Equity × (1-Gearing)] + [Real Cost of Debt × Gearing × (1-Tax Rate)]
Where:
• The cost of debt is estimated by adding a suitable corporate debt premium to a risk-free rate:
Cost of Debt = Risk Free Rate + Debt Premium
• The cost of equity is estimated by using the Capital Asset Pricing Model (CAPM):
Cost of Equity = Risk Free Rate + (Equity Beta × Market Risk Premium)
• Keeping in view the risks and cost advantages of debt, the gearing (the ratio of debt to debt plus equity) needs to be set at an optimal level where overall risks and hence the WACC are at a minimum.
• Since price controls are forward-looking, the Bureau�s cost of capital calculations are based, where possible, on forward-looking estimates rather than simply historical data.
In Abu Dhabi, the tax rate is zero and so the quoted cost of capital is comparable to that reported on a post-tax basis in other jurisdictions.
8.2.2 Use of Recent Overseas Regulators� Calculations
At the previous reviews, in view of a lack of information on the cost of capital from the UAE capital markets, the Bureau�s cost of capital calculations drew heavily on estimates of the cost of capital of network businesses in the UK, USA and Australia. The Bureau views such calculations of the cost of capital as relevant because (i) these countries have developed capital markets and readily available information, (ii) the regulatory regime in Abu Dhabi has drawn deliberately on best practice in the UK and elsewhere, and (iii) the Abu Dhabi businesses, due to the UAE/Abu Dhabi�s country rating, can be expected to have similar credit rating as that of comparable businesses in the UK and Australia.
Accordingly, the Bureau�s initial cost of calculations described in detail in the Second Consultation Paper were mainly based on the recent regulatory decisions or proposals in the UK and Australia for water and electricity network businesses subject to CPI-X regulation. However, these calculations were cross-checked against the cost of capital estimates available from the UAE and other countries in the region, for which more information is now available.

Title: 2005 Price Controls Review � Draft Proposals Issue No.: 1 Rev (0) Prepared by:
AR/MPC/MMH Document No. CR/E02/022 Issue Date: 27/07/05
Approved by: NSC
Page 74 of 137
8.2.3 Bureau�s Initial Calculations for PC3
The Bureau�s initial cost of capital calculations described in detail in the Second Consultation Paper are summarised in the following table. Estimates for each component are based on (1) the mid-point estimates from UK and Australian examples (�Low� scenario) and (2) the highest of the latest UK final decisions (�High� scenario). For the �High� scenario, the Bureau considered it appropriate to assume a lower gearing (of 45%) than that assumed by Ofwat (of 55%), to allow some time for the Abu Dhabi companies to adjust their gearing to an optimal level. This produced a �High� scenario cost of capital of 5.6% (compared to Ofwat�s 5.1%).
Table 8.1: Bureau�s Initial Cost of Calculations
LOW SCENARIO HIGH SCENARIO Based on Latest UK and
Australian Decisions (mid-point) Based on Latest UK Decision
with Lower Gearing Risk-free rate (nominal) 5.3% 5.5% Risk-free rate (real) 2.9% 3.0% Debt premium 1.3% 1.3% Corporation Tax 30.0% 30.0% Post-tax cost of debt (nominal) 4.6% 4.8% Post-tax cost of debt (real) 2.9% 3.0% Equity Risk Premium 4.3% 4.7% Equity Beta 0.86 1.00 Post-tax cost of equity (nominal) 9.0% 10.2% Post-tax cost of equity (real) 6.5% 7.7% Gearing 55.0% 45.0% Post-tax WACC (nominal) 6.6% 7.8% Post-tax WACC (real) 4.5% 5.6%
The Second Consultation Paper therefore suggested that a cost of capital in the range of 4.5% to 5.6% (real, post-tax) is generally appropriate for the PC3 controls.
The paper presented a comparison of the proposed cost of capital for PC3 with the cost of capital adopted for PC1 and PC2 (6%), and found that the main reason for the reduction was the decline in the cost of debt since the earlier reviews (it is well established that interest rates worldwide are close to historical lows).
8.2.4 Assessment against Local and Overseas Capital Markets Data
The Second Consultation Paper assessed the Bureau�s initial estimates for PC3 against the data gathered through extensive research into local and regional capital markets.
The paper noted that there is a general lack of data on various parameters of the cost of capital from the local or regional markets. For example, the UAE or Abu Dhabi government does not presently issue debt instruments which can be used as the basis of the risk-free rate. The Bureau therefore assessed the interest rates on the bonds issued by other regional governments with a
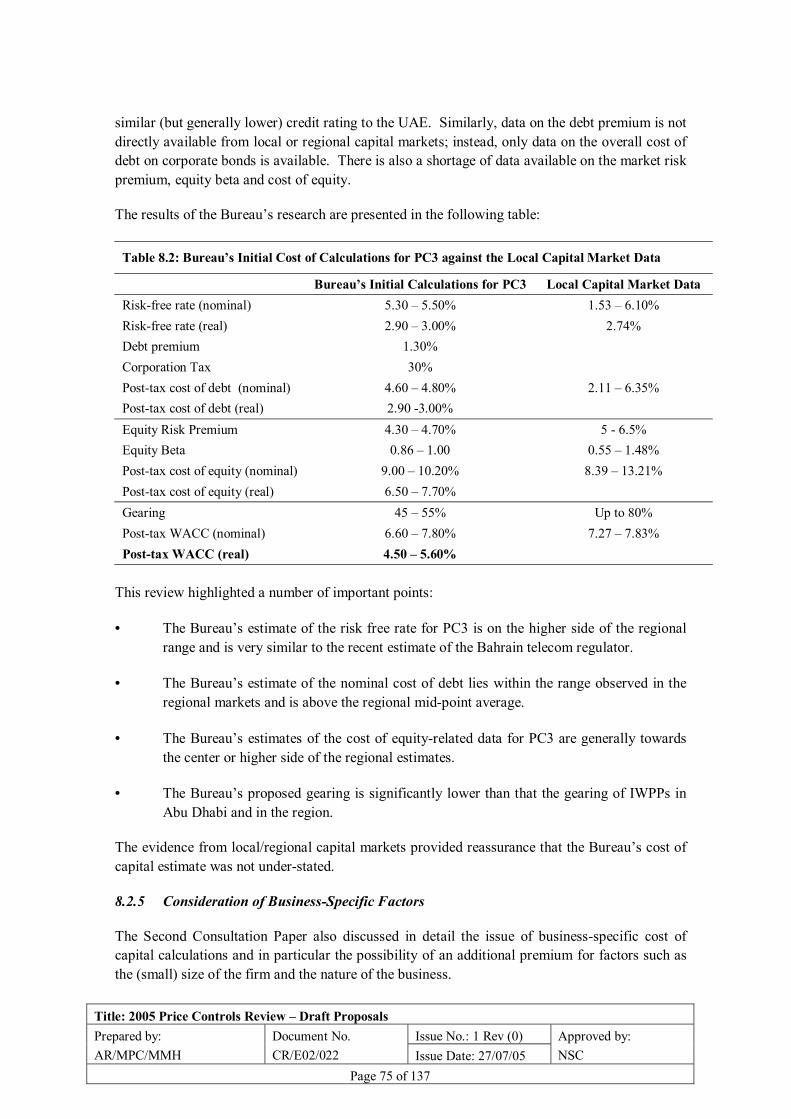
Title: 2005 Price Controls Review � Draft Proposals Issue No.: 1 Rev (0) Prepared by:
AR/MPC/MMH Document No. CR/E02/022 Issue Date: 27/07/05
Approved by: NSC
Page 75 of 137
similar (but generally lower) credit rating to the UAE. Similarly, data on the debt premium is not directly available from local or regional capital markets; instead, only data on the overall cost of debt on corporate bonds is available. There is also a shortage of data available on the market risk premium, equity beta and cost of equity.
The results of the Bureau�s research are presented in the following table:
Table 8.2: Bureau�s Initial Cost of Calculations for PC3 against the Local Capital Market Data
Bureau�s Initial Calculations for PC3 Local Capital Market Data Risk-free rate (nominal) 5.30 � 5.50% 1.53 � 6.10% Risk-free rate (real) 2.90 � 3.00% 2.74% Debt premium 1.30% Corporation Tax 30% Post-tax cost of debt (nominal) 4.60 � 4.80% 2.11 � 6.35% Post-tax cost of debt (real) 2.90 -3.00% Equity Risk Premium 4.30 � 4.70% 5 - 6.5% Equity Beta 0.86 � 1.00 0.55 � 1.48% Post-tax cost of equity (nominal) 9.00 � 10.20% 8.39 � 13.21% Post-tax cost of equity (real) 6.50 � 7.70% Gearing 45 � 55% Up to 80% Post-tax WACC (nominal) 6.60 � 7.80% 7.27 � 7.83% Post-tax WACC (real) 4.50 � 5.60%
This review highlighted a number of important points:
• The Bureau�s estimate of the risk free rate for PC3 is on the higher side of the regional range and is very similar to the recent estimate of the Bahrain telecom regulator.
• The Bureau�s estimate of the nominal cost of debt lies within the range observed in the regional markets and is above the regional mid-point average.
• The Bureau�s estimates of the cost of equity-related data for PC3 are generally towards the center or higher side of the regional estimates.
• The Bureau�s proposed gearing is significantly lower than that the gearing of IWPPs in Abu Dhabi and in the region.
The evidence from local/regional capital markets provided reassurance that the Bureau�s cost of capital estimate was not under-stated.
8.2.5 Consideration of Business-Specific Factors
The Second Consultation Paper also discussed in detail the issue of business-specific cost of capital calculations and in particular the possibility of an additional premium for factors such as the (small) size of the firm and the nature of the business.

Title: 2005 Price Controls Review � Draft Proposals Issue No.: 1 Rev (0) Prepared by:
AR/MPC/MMH Document No. CR/E02/022 Issue Date: 27/07/05
Approved by: NSC
Page 76 of 137
The paper argued that the Bureau�s calculations of the cost of capital are based on a wide range of businesses in terms of their nature and size and showed that the UK regulators have not distinguished between water and electricity businesses as far as business-specific parameters (such as debt premium and equity beta) are concerned. However, the paper noted that Ofwat in its final determination of December 2004 allowed a �small company premium� on the cost of capital, in the range of 0.3% - 0.9% for water-only companies, depending upon the RAV of the company. While the paper acknowledged that small companies can be argued to face more difficulties (and hence higher costs) in accessing various sources of funds and raising financing than large companies, it argued that other regulators have not made such a distinction and that it may not be appropriate for the sector while all the businesses remain wholly-owned by a common shareholder (ADWEA).
The Second Consultation Paper presented evidence that the Bureau�s initial cost of capital calculations are based on a wide range of different sized businesses. The evidence suggested that, while the cost of capital estimated by overseas� regulators is clearly relevant to a company of the size of TRANSCO, there may be some justification for a distinction in the case of the smaller companies in the sector.
The paper therefore expressed the Bureau�s willingness to consider a higher cost of capital for AADC and ADDC than for TRANSCO, not only for their relatively small size but also for specific risks associated with dealing with final customers, including those associated with income collection / subsidy.
8.3 Bureau�s Initial Estimate of Profit Margin
8.3.1 Overall Approach
In contrast to the network companies, ADWEC and the supply businesses of the distribution companies have few capital assets but are exposed to risks associated with large financial flows. Therefore, the application of a cost of capital to an asset value may not be the best means of estimating the allowed returns for non-network businesses.
Broadly speaking, at the 2002 price control review, the Bureau adopted a methodology which calculated the amount of hypothetical capital that would be required by a standalone company exposed to ADWEC�s risks, and then calculated the profit margin that would be consistent with the application of the cost of capital to this hypothetical capital base. The following steps were thus involved in calculating an appropriate profit margin for ADWEC for PC2:
• Identify the risks to which ADWEC is exposed;
• Calculate ADWEC�s potential exposure to these risks;
• Calculate the capital required by a standalone company in order to �back� these risks;
• Apply the cost of capital to this hypothetical capital value; and
• Express the resulting return in the form of a margin on BST turnover.

Title: 2005 Price Controls Review � Draft Proposals Issue No.: 1 Rev (0) Prepared by:
AR/MPC/MMH Document No. CR/E02/022 Issue Date: 27/07/05
Approved by: NSC
Page 77 of 137
8.3.2 Bureau�s Initial Estimates of Profit Margin for PC3
In view of the supportive responses to the First Consultation Paper, the Second Consultation Paper suggested a profit margin approach for calculating return element for both ADWEC and the supply businesses.
In the case of ADWEC, earlier consultation papers argued that a continuation of the approach to the treatment of over- or under-recovery of ADWEC�s BST revenue (see Section 3.8.3) would mean lower risks than were assumed for the PC2 calculation of the profit margin of 0.025%. On the other hand, the introduction of a new indicator under the PIS to provide an incentive for ADWEC to accurately forecast demand could be argued to increase risk.
Overall, the Second Consultation Paper argued that a lower profit margin for ADWEC for PC3 would be justifiable in view of the expected lower cost of capital allowed for PC3 than PC2. The calculation of 0.025% profit margin was based on the cost of capital of 6% adopted for PC2. A reduction in the cost of capital to 4.5% - 5.6% for PC3 would lead to a proportional reduction in the profit margin to 0.019% - 0.023%. Note that although the margin is reduced, the absolute level of profits is increased due to the increase in ADWEC�s turnover since PC2.
In the case of the supply businesses of the distribution companies, the paper recognised that these businesses have more assets than ADWEC and are subject to specific risks in relation to their relationship to final consumers and the receipt of subsidy. The paper therefore stated that the Bureau was assessing the impact of using the RAVs of the supply businesses, rather than the hypothetical capital approach, to calculate the profit margin for supply businesses. Initial indications at the time were that the capital-to-turnover ratio of the supply businesses is about 2-3 times that of ADWEC.
8.4 Draft Proposals for Cost of Capital and Profit Margin
The respondents to the Second Consultation Paper generally argued for a higher cost of capital. The responses are summarised below:
• AADC supported the use of CAPM and suggested that the cost of capital should include a small-company premium for itself and RASCO. AADC requested clarification on the steps involved in the Bureau�s proposed approach to calculating the profit margin but argued that the approach is subjective and should not be used in isolation to calculate allowed returns for supply businesses. AADC noted that the Bureau recognises that the supply businesses have more assets than ADWEC and are subject to specific risks in their relationship to final customers and the receipt of subsidy. AADC identified what it thought were possible comparators for its supply businesses from the Australian gas industry and American shoe retailers.
Furthermore, AADC argued that the �supervision� element of the Bureau�s role is unusual or unique amongst countries with CPI-X regulation, and creates additional risks that should be reflected in the cost of capital.

Title: 2005 Price Controls Review � Draft Proposals Issue No.: 1 Rev (0) Prepared by:
AR/MPC/MMH Document No. CR/E02/022 Issue Date: 27/07/05
Approved by: NSC
Page 78 of 137
• ADDC, while acknowledging the thoroughness of the Bureau�s analysis, argued that the cost of capital for past and future periods should be adjusted upwards as the capex review was one-sided (only �penalties�). It argued that a cost of capital of 6% or above is required in order to take account of the differences between Abu Dhabi and UK/Australia (particularly the relative maturity/stability of the sectors and regulatory frameworks) and of the risks associated with the PIS and revenue/subsidy. In relation to the supply businesses� profit margin, ADDC supported further calculations being undertaken by the Bureau and thought that the 1.5% margin allowed by Ofgem in the UK in 1999 was reasonable.
• TRANSCO while recognizing that the size of the companies within the sector does vary significantly argued that if the proposed capex efficiency assessment is applied, it is likely to have a far greater effect on each company�s cost of capital and equity beta than the variation in the size of the companies.
In response, the Bureau believes that its initial cost of capital calculations take account of many of the risks identified by the respondents, since the comparator businesses which are the basis of these calculations are subject to similar risks. With regards to the capex efficiency assessment, the use of data on an accrual basis rather than on a cash flow basis has significantly diluted the impact of the PC1 capex efficiency assessment (as discussed in Section 7). While the Bureau does not agree with AADC that the Bureau�s role is atypical among regulators, the proposed cost of capital is on the higher side amongst the comparator countries. Further, adoption of a conservative gearing estimate has increased the range of cost for the capital in the Bureau�s initial calculations.
The Bureau therefore considers that its initial estimates of the cost of capital (i.e. 4.5% - 5.6%) remain reasonable. Accordingly, the Bureau has adopted a cost of capital of 5.00% for TRANSCO in these Draft Proposals, towards the centre of the range. However, for AADC and ADDC, the Bureau proposes to use a higher cost of capital, 5.30%, to reflect the risks unique to their businesses as discussed earlier by incorporating a premium from the lower end of the small business premium range (0.3% - 0.9%).
In relation to the supply businesses, the Bureau is now of the view that an approach which applies the cost of capital to the RAVs rather than the profit margin approach is appropriate in view of their significant capital assets. Accordingly, the Bureau has adopted a cost of capital of 5.30% for these businesses, the same as that for the distribution businesses.
For ADWEC, the Bureau has adopted a profit margin of 0.021% on forecast turnover for these Draft Proposals, consistent with the central cost of capital of 5%.

Title: 2005 Price Controls Review � Draft Proposals Issue No.: 1 Rev (0) Prepared by:
AR/MPC/MMH Document No. CR/E02/022 Issue Date: 27/07/05
Approved by: NSC
Page 79 of 137
9 Financial Adjustments
9.1 Introduction
The earlier Consultation Papers discussed the following potential financial adjustments to the PC3 revenue requirement:
1. For AADC and ADDC, for opex and any capital costs incurred during 2001 and 2002 associated with the distribution and supply assets transferred from RASCO in 2001;
2. For performance on PIS Category B indicators during PC2;
3. For over-statement of revenue drivers and under-statement of regulated revenue in the audited PCRs for 1999-2002;
4. For asset transfers / disposals during PC1;
5. For failure to provide information and for exclusion of certain unlicensed income; and
6. For RASCO�s past revenue or subsidy shortfall (2001 � 2003).
Detailed calculations of these financial adjustments were presented in the Second Consultation Paper. These adjustments were calculated in 2006 prices in terms of their NPV at 1 January 2006 based on a discount rate of 6% (the cost of capital used in setting the earlier price controls).
In the absence of significant new information, the results of these calculations have in general been retained in these Draft Proposals, with some adjustments. Further, in the case of RASCO, the adjustment for past revenue or subsidy shortfall (item 6 above) will not be implemented as the Bureau is not now proposing to amend RASCO�s present price controls.
In this paper we also discuss an additional issue: the impact of delays in the completion of the water transmission system necessary to utilise output from the Shuweihat production plant.
Given the scale and number of adjustments, the Second Consultation Paper indicated the Bureau�s thinking to apply all the financial adjustments to the RAVs, both to spread the effect over a longer term and to treat them consistently. However, the respondents to the Second Consultation Paper continued to prefer adjustments to be made directly to the PC3 revenue requirement in NPV terms in order to phase out the effect of these adjustments as early as possible. In these Draft Proposals, the Bureau has accepted this suggestion.
9.2 RASCO-Related Financial Adjustments for AADC and ADDC
The transfer of the distribution and supply activities of RASCO to the distribution companies with effect from 1 January 2001 necessitated certain financial adjustments at this review:
1. Opex relating to these activities incurred by ADDC and AADC during 2001-2002 (not taken into account while setting PC1 and PC2) needs to be remunerated.

Title: 2005 Price Controls Review � Draft Proposals Issue No.: 1 Rev (0) Prepared by:
AR/MPC/MMH Document No. CR/E02/022 Issue Date: 27/07/05
Approved by: NSC
Page 80 of 137
2. If AADC and ADDC paid for the distribution and supply assets inherited from RASCO, the distribution companies should be remunerated for the associated capital costs (both return on capital and depreciation) since 2001.
In the absence of any other reliable information, the Bureau referenced the audited accounts of RASCO for 2000 and 2001 (the years immediately before and after the transfer) to see the approximate impact of the transfer of RASCO�s distribution and supply assets on opex. The Second Consultation Paper presented calculations of the required adjustments for AADC and ADDC, which have been retained for these Draft Proposals. In view of the introduction of separate PC3 controls for distribution and supply businesses, the financial adjustments have now been allocated to their separate businesses based on their opening 2006 RAVs reported in Table 7.8 as suggested in the Second Consultation Paper:
Table 9.1: Financial Adjustment for Opex due to RASCO Asset Transfer � Draft Proposals
AEDm, 2006 prices AADC ADDCElectricity Distribution 12.909 88.751 Electricity Supply 0.082 0.509 Water Distribution 4.662 23.828 Water Supply 0.061 0.204 Total 17.713 113.293
The Second Consultation Paper discussed in some detail the issues relating to the potential financial adjustment for capital costs incurred by AADC and ADDC in relation to the asset transfer. In particular, the Bureau noted that the audited accounts for 2001 suggest that ADDC and AADC have not paid for the assets acquired - they are described as �non-cash transactions� - which would mean that no adjustment for capital costs is required at this review. None of the respondents to that paper have provided evidence that contradicts this assessment. Therefore no financial adjustment has been made in this regard in these Draft Proposals.
9.3 Financial Adjustments for Performance on PIS Category B during PC2 Period
It was agreed at the 2002 price controls review that companies will be rewarded or penalised for exceptionally good or poor performance against Category B performance indicators during the current control period. This will be implemented via financial adjustment to the future revenue requirement at this review, capped at 2% of the MAR for the period to which the performance relates. The Second Consultation Paper presented the Bureau�s assessment of companies� performance during the PC2 period.
In response to the Second Consultation Paper, ADDC and TRANSCO argued against any financial adjustment for companies� performance on Category B indicators due to the lack of precise definition of these indicators. Combined with the treatment of past capex, ADDC felt that this exposed too much of companies� income to regulatory risk. The companies also considered that this was in contrast to the discretionary incentive schemes in the UK which embodied only rewards and not penalties.
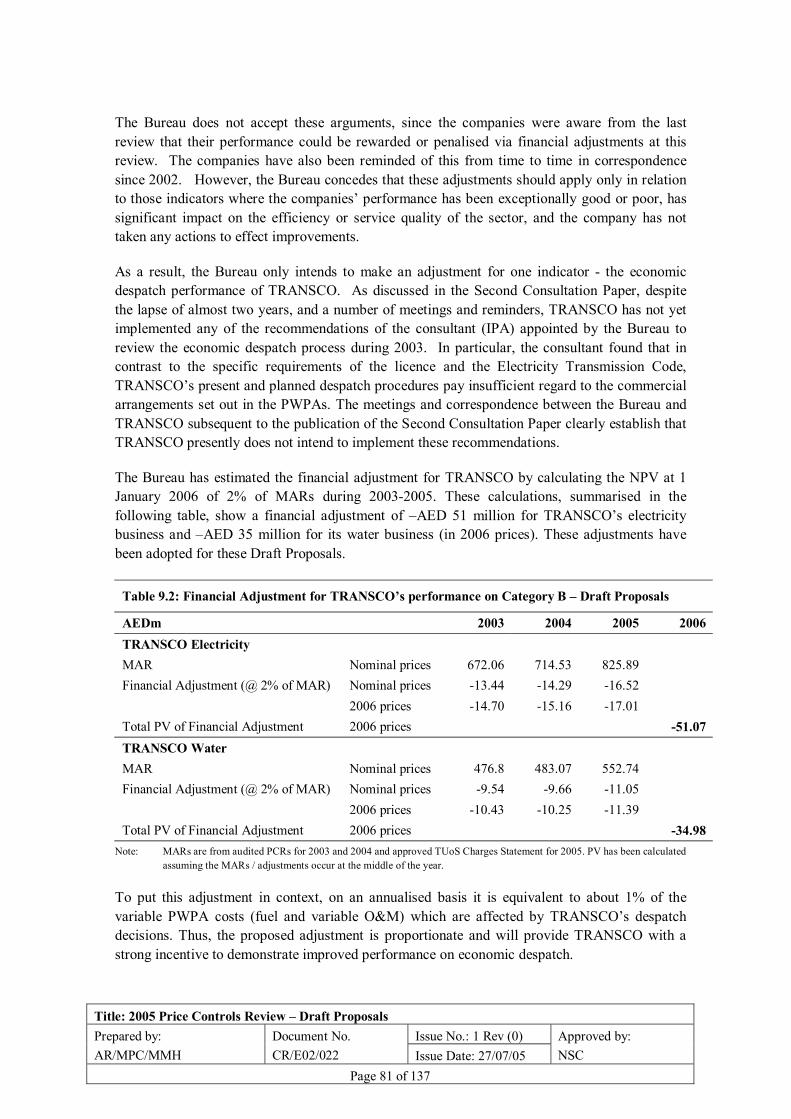
Title: 2005 Price Controls Review � Draft Proposals Issue No.: 1 Rev (0) Prepared by:
AR/MPC/MMH Document No. CR/E02/022 Issue Date: 27/07/05
Approved by: NSC
Page 81 of 137
The Bureau does not accept these arguments, since the companies were aware from the last review that their performance could be rewarded or penalised via financial adjustments at this review. The companies have also been reminded of this from time to time in correspondence since 2002. However, the Bureau concedes that these adjustments should apply only in relation to those indicators where the companies� performance has been exceptionally good or poor, has significant impact on the efficiency or service quality of the sector, and the company has not taken any actions to effect improvements.
As a result, the Bureau only intends to make an adjustment for one indicator - the economic despatch performance of TRANSCO. As discussed in the Second Consultation Paper, despite the lapse of almost two years, and a number of meetings and reminders, TRANSCO has not yet implemented any of the recommendations of the consultant (IPA) appointed by the Bureau to review the economic despatch process during 2003. In particular, the consultant found that in contrast to the specific requirements of the licence and the Electricity Transmission Code, TRANSCO�s present and planned despatch procedures pay insufficient regard to the commercial arrangements set out in the PWPAs. The meetings and correspondence between the Bureau and TRANSCO subsequent to the publication of the Second Consultation Paper clearly establish that TRANSCO presently does not intend to implement these recommendations.
The Bureau has estimated the financial adjustment for TRANSCO by calculating the NPV at 1 January 2006 of 2% of MARs during 2003-2005. These calculations, summarised in the following table, show a financial adjustment of �AED 51 million for TRANSCO�s electricity business and �AED 35 million for its water business (in 2006 prices). These adjustments have been adopted for these Draft Proposals.
Table 9.2: Financial Adjustment for TRANSCO�s performance on Category B � Draft Proposals
AEDm 2003 2004 2005 2006 TRANSCO Electricity MAR Nominal prices 672.06 714.53 825.89 Financial Adjustment (@ 2% of MAR) Nominal prices -13.44 -14.29 -16.52 2006 prices -14.70 -15.16 -17.01 Total PV of Financial Adjustment 2006 prices -51.07 TRANSCO Water MAR Nominal prices 476.8 483.07 552.74 Financial Adjustment (@ 2% of MAR) Nominal prices -9.54 -9.66 -11.05 2006 prices -10.43 -10.25 -11.39 Total PV of Financial Adjustment 2006 prices -34.98
Note: MARs are from audited PCRs for 2003 and 2004 and approved TUoS Charges Statement for 2005. PV has been calculated assuming the MARs / adjustments occur at the middle of the year.
To put this adjustment in context, on an annualised basis it is equivalent to about 1% of the variable PWPA costs (fuel and variable O&M) which are affected by TRANSCO�s despatch decisions. Thus, the proposed adjustment is proportionate and will provide TRANSCO with a strong incentive to demonstrate improved performance on economic despatch.

Title: 2005 Price Controls Review � Draft Proposals Issue No.: 1 Rev (0) Prepared by:
AR/MPC/MMH Document No. CR/E02/022 Issue Date: 27/07/05
Approved by: NSC
Page 82 of 137
The Bureau will continue to monitor TRANSCO�s despatch performance over the PC3 period with a possible positive or negative financial adjustment at the 2009 review. In this regard, the Bureau wrote to TRANSCO on 4 May 2005 listing the specific steps which TRANSCO must take to avoid a negative adjustment or to receive a positive adjustment at the next review.
9.4 PCR-Related Financial Adjustments for PC1 Period
The First and Second Consultation Papers discussed certain adjustments in relation to the values of revenue drivers and the regulated revenue used in the audited PCRs for 1999-2002 for AADC, ADDC and TRANSCO which were not fully consistent with the licences and/or the intent of the PC1 controls.
9.4.1 Financial Adjustments for AADC�s Water Customer Accounts in PC1
The audited PCRs submitted by AADC for the years 1999 � 2002 contained significantly higher figures for the water customer numbers revenue driver than assumed when setting the PC1 price control. It transpired that the reason for this was that the information provided by AADC for setting PC1 was based on an old billing system (WANG), whereas the information used by AADC in its audited PCRs is based on AADC�s current billing system (OMNIX).
If left uncorrected, this would lead to an inappropriate �windfall� gain for AADC. A similar issue arose for ADDC, but this was resolved by the company, with the approval of the Bureau and the auditors, effectively �re-setting� the figures reported in its PCRs to the base figure for water customer numbers for 1999 used in setting the PC1 controls. The Bureau indicated its preference for AADC to make the same adjustment but informed it that if it made no adjustment to its PCRs (as has turned out to be the case) an adjustment would be made by the Bureau at the present price control review instead.
The following table shows the calculations in the Second Consultation Paper, now split between AADC�s water distribution and supply businesses based on their opening 2006 RAVs:
Table 9.3: Financial Adjustment for AADC�s PC1 Water Customer Accounts � Draft Proposals
AEDm , 2006 prices Financial Adjustment AADC Water Distribution -28.00 AADC Water Supply -0.36 Total -28.36
In response to the Second Consultation Paper, AADC agreed in principle to the need for certain PCR-related financial adjustments but disagreed with the detail of the calculation. AADC also argued that such adjustments should be applied equally to under- and over-statements, and presented to the Bureau details of a similar adjustment (for under-estimation of water customer numbers in that case) that should also be made for the PC2 period. It also argued that as many as possible of any such adjustments should be made now rather than being held over until PC4.
The Bureau considers that AADC�s proposed adjustment for PC2 could remove the incentive for companies to provide accurate forecasts. Nevertheless, consistent with the approach taken for

Title: 2005 Price Controls Review � Draft Proposals Issue No.: 1 Rev (0) Prepared by:
AR/MPC/MMH Document No. CR/E02/022 Issue Date: 27/07/05
Approved by: NSC
Page 83 of 137
PC1, the Bureau will review the PC2 outcome at the 2009 review, when the full audited data for the PC2 period will be available.
9.4.2 Financial Adjustments for ADDC�s Metered Units Distributed in PC1
During the course of preparing the audited PCRs for 1999 � 2002, ADDC alerted the Bureau to the possibility that its estimates of metered water and electricity units distributed may include, for 1999 and 2000, some units that were produced and distributed by RASCO (rather than via ADDC�s distribution system), contrary to the licence definition of the revenue driver. This would result in a higher MAR than justified.
In response to the Second Consultation Paper, AADC informed the Bureau that its auditors had confirmed that a corresponding adjustment is not required in its case.
The Second Consultation Paper calculated the PV (at 1 January 2006) of the required adjustments estimated by ADDC. These adjustments have again been allocated to its distribution and supply businesses based on their opening 2006 RAVs, as shown in the following table:
Table 9.4: Financial Adjustment for ADDC�s PC1 Metered Units Distributed � Draft Proposals
AEDm, 2006 prices Electricity Water
ADDC Distribution -1.55 -0.66 ADDC Supply -0.01 -0.01
Total -1.56 -0.67 9.4.3 Financial Adjustments for �Other Income� in PC1 Period
The Second Consultation Paper suggested financial adjustments be made at this review to remove the gains earned by AADC, ADDC and TRANSCO due to the inappropriate exclusion of certain incomes from the regulated revenue in their audited PCRs for the PC1 period. Such income included: compensation, claims, penalties and damages from the general public, contractors and insurers; interest on deposits; and foreign exchange loss or gains. The Bureau considers that such exclusion is not in line with the licence definition of regulated revenue for the PC1 period and the consultation papers issued in 1999 for the PC1 controls. (This is separate to income from unlicensed activities for which the Bureau has issued consents, which is also outside regulated revenue).
The required financial adjustments are presented in Table 9.5 below, allocated between the distribution and supply businesses of AADC and ADDC based on their opening 2006 RAVs. Compared to the calculations presented in the Second Consultation Paper, an adjustment has been made to remove, for AADC, income received in 2001 and 2002 in relation to the management of RASCO�s production activities, which is an unlicensed activity for which AADC has the Bureau�s consent (a corresponding adjustment had already been made for ADDC). This has reduced the financial adjustment for AADC to about AED 44 million in total.

Title: 2005 Price Controls Review � Draft Proposals Issue No.: 1 Rev (0) Prepared by:
AR/MPC/MMH Document No. CR/E02/022 Issue Date: 27/07/05
Approved by: NSC
Page 84 of 137
Table 9.5: Financial Adjustment for �Other Income� � Draft Proposals
AEDm, 2006 prices AADC ADDC TRANSCO
Electricity Distribution -36.333 -60.803 Electricity Supply -0.231 -0.349
Electricity -36.563 -61.152 -65.357
Water Distribution -7.342 -15.410 Water Supply -0.096 -0.132
Water -7.438 -15.542 -4.570
For TRANSCO, the Bureau has also considered whether a similar adjustment is required for income from its unlicensed activities (�Manpower Services�). However we note that other income in the PCRs is lower than the income from �Manpower Services� shown in the audited accounts. The Bureau has therefore assumed that such unlicensed income has already been excluded from other income and hence no further adjustment to the above figures is required.
In response to the Second Consultation Paper, AADC disagreed with the proposed adjustment as it regards the licensees as having met the licence definition and considered that the Bureau gave tacit approval for the exclusion of certain items. ADDC supported such adjustments if an error has been made but does not think this is applicable in its case.
The Bureau does not agree: the definitions set out in the licence applicable to the PC1 period, read in conjunction with the consultation papers for the 1999 price control review, clearly indicate that the regulated revenue for the PC1 period includes all incomes directly or indirectly from the licensed activities. This is in contrast to the PC2 period, where the Bureau agreed to the exclusion of certain income streams.
Further, AADC is incorrect to state that the Bureau gave tacit approval for the exclusion of certain income items. The Bureau�s position on this matter was set out in its letter of 18 January 2004 advising licensees to treat all PC1 income (other than unlicensed/consented activities) as regulated revenue. The Bureau reminded AADC during the audit work (correspondence of 28 July 2004) that �� for the purpose of the audit, some other income could be excluded at the discretion of the auditors but that these would be reviewed at the PC3 review and any financial adjustments made at that time for inappropriately excluded items.� This was advised to avoid any further delay in completion of the audit of the PCRs for 1999-2002.
9.5 Financial Adjustments for Asset Disposal or Transfer
The earlier consultation papers indicated that where companies have disposed of assets with a positive residual value, they should not earn any return on asset and depreciation under the price controls from the date of the transfer.
Since the Second Consultation Paper, the Bureau has discussed the matter with the auditors and has clarified that the following disposals of assets with a residual value took place during the PC1 period, as shown in the audited separate business accounts:

Title: 2005 Price Controls Review � Draft Proposals Issue No.: 1 Rev (0) Prepared by:
AR/MPC/MMH Document No. CR/E02/022 Issue Date: 27/07/05
Approved by: NSC
Page 85 of 137
Table 9.6: Asset Disposals During PC1
AED m, nominal prices 1999 2000 2001 2002 TRANSCO Electricity - - - 1.435 AADC Electricity Distribution - 1.651 - - AADC Electricity Supply - 0.564 - - AADC Water Distribution 18.728 0.950 AADC Water Supply - 0.075 - - For businesses not mentioned above, no asset disposals are shown in the audited accounts for this period.
The accounts also indicate that whereas AADC received income from the asset sales equivalent to the figures shown in the above table, TRANSCO did not receive any income for the sale of its assets in 2002.
After further consideration, the Bureau�s view is that in the case of AADC, for which income has been received from the disposal of assets, the capex allowances need to be reduced accordingly but that no adjustment is required for TRANSCO. The appropriate adjustments have been made to the PC1 capex figures reported in Table 7.4 and no further adjustment is required in this section.
Finally, we note that both ADDC and AADC included some income from asset disposals within their analysis of �other income� (sent to the Bureau on 29 February 2004 and 27 July 2004 respectively) which is understood to have been excluded from regulated revenue in the audited PCRs for PC1. In AADC�s case, these showed income from assets sales in 2000 (only) of AED 2.244 million. In ADDC�s case, income from sales of assets (of AED 0.46 million) is shown in 1999. The Bureau is unable to reconcile these figures to the relevant company�s audited accounts and does not propose to make any further adjustment for these items.
9.6 Financial Adjustment for Information Submission
The First and Second Consultation Papers expressed the Bureau�s concern about the unavailability (or delay in availability) of data from certain companies. In particular, ADWEC did not respond to the Bureau�s annual information requests in 2003 and 2004 and suggested that the Bureau should compile its own information from other sources.
The provision of accurate and timely information to the Bureau, in the format specified by the Bureau, is necessary if the Bureau is to carry out its duties effectively. Since the vast majority of ADWEC�s costs are treated on a pass-through basis subject to ADWEC�s economic purchasing obligation, it is important for the Bureau to keep ADWEC�s costs and other data under regular review.
Earlier consultation papers therefore showed the Bureau�s intention to make an adjustment at this review to ADWEC�s future allowed revenues to reflect past performance on the provision of information.

Title: 2005 Price Controls Review � Draft Proposals Issue No.: 1 Rev (0) Prepared by:
AR/MPC/MMH Document No. CR/E02/022 Issue Date: 27/07/05
Approved by: NSC
Page 86 of 137
Since the Second Consultation Paper, ADWEC submitted (on 30 March 2005) substantially complete information for the PC3 information submission. This was still four months behind the original deadline (of 10 November 2004). Nevertheless, the Bureau now proposes to limit the financial adjustment to performance in 2003 and 2004 only.
The Bureau has calculated the financial adjustment as the NPV (at 1 January 2006) of 2% of ADWEC�s MARs for 2003 and 2004 (in 2006 prices), as shown in the following table:
Table 9.7: Financial Adjustment for ADWEC�s Information Submission Performance � Draft Proposals
AEDm 2003 2004 2006 ADWEC Electricity MAR (Procurement Cost) Nominal prices 6.01 6.29 Financial Adjustment (@ 2% of MAR) Nominal prices -0.12 -0.13 2006 prices -0.13 -0.13 Total PV of Financial Adjustment 2006 prices -0.30 ADWEC Water MAR (Procurement Cost) Nominal prices 4.71 4.76 Financial Adjustment (@ 2% of MAR) Nominal prices -0.09 -0.10 2006 prices -0.10 -0.10 Total PV of Financial Adjustment 2006 prices -0.23
Note: MARs for water and electricity for 2003 and 2004 are from the approved BSTs for 2004 and 2005 and are in total reconciled to the audited PCRs for 2003 and 2004. PV has been calculated assuming the MARs / adjustments occur at the middle of the year.
The Bureau very much welcomes the belated completion by ADWEC of the PC3 Information Submission. We also acknowledge that ADWEC produces a number of other informative documents relating to sector costs and performance. With the introduction of new PIS Category A indicator for PC3 for the Annual Information Submission (AIS, see section 11), ADWEC and other licensees can benefit in future from the timely submission of complete information. The Bureau intends to consult with licensees on the content of the AISs prior to their issue.
9.7 Financial Adjustment for TRANSCO �Manpower Services� Income in PC1
The First and Second Consultation Papers discussed certain services - �Manpower Services� - which TRANSCO provide to AADC and ADDC outside of its licensed activities, for which the Bureau has issued its consent.
While the provision of manpower services constitutes an unlicensed activity, the costs associated with these services were erroneously financed within the PC1 and PC2 price controls (as the price controls were set on the basis of costs which, unknown to the Bureau at that time, included the costs of these services). Furthermore, in the audited PCRs for TRANSCO, the income from these services has been treated as �other� income and excluded from its regulated revenue. Thus, the costs have been fully-financed within the price controls and TRANSCO has retained the revenue outside of regulated revenue.
Earlier papers therefore indicated the Bureau�s intention to make a negative financial adjustment at this review to remove this double counting. In the absence of any further information, the

Title: 2005 Price Controls Review � Draft Proposals Issue No.: 1 Rev (0) Prepared by:
AR/MPC/MMH Document No. CR/E02/022 Issue Date: 27/07/05
Approved by: NSC
Page 87 of 137
Draft Proposals have adopted the financial adjustments estimated in the Second Consultation Paper as summarised below:
Table 9.8: Financial Adjustment for TRANSCO�s PC1 Manpower Service Income � Draft Proposals
AEDm , 2006 prices Financial Adjustment
TRANSCO Electricity -17.14 TRANSCO Water -1.89
Any necessary adjustment for the PC2 period will be considered at the 2009 review. 9.8 Incentive for Income Collection by Distribution Companies
To incentivise the distribution companies to collect from their customers the income to which they are entitled, the licence modifications issued to ADDC and AADC with the new PC2 controls set out that the subsidy paid by the Government to the sector should be calculated as the difference between (i) the audited MARs (including pass-through costs) of the distribution companies and (ii) the revenue they should have collected (emphasis added) from customers as per the approved tariffs. Otherwise, any failure to collect revenue would simply be made up by a corresponding increase in the subsidy.
The Bureau notes that the audited PCRs for 2003 (the first year of the PC2 controls) showed the same revenue for AADC and ADDC from the sale of electricity and water as their audited separate business accounts. This suggests that the auditors are satisfied that the distribution companies have collected all the income to which they are entitled.
Subsequent to the Second Consultation Paper, the Bureau discussed this matter with the auditors who stated that they consider themselves to have undertaken an appropriate analysis of the income for the PCR audit. The Bureau clarified that the significance of the phrase �should have collected� in the definition of regulated revenue refers not only to accrued income but also to the necessity of charging all customers on the correct tariff. The Bureau intends to request the auditors� analysis of this matter as part of the audited PCRs for future years (via paragraphs 19 and 38 of Schedule 2 of the distribution companies� licences).
9.9 No Financial Adjustment for RASCO�s Subsidy Shortfall during 2001-2003
RASCO�s production activities during 2001-2003 were not subject to any specific regulation by the Bureau. The Bureau agreed to apply the present price controls for RASCO retrospectively to 2001-2003 to determine the subsidy requirements for that period. The Second Consultation Paper therefore proposed a one-off adjustment at this review to remunerate RASCO for the subsidy shortfall in accordance with the present price controls applied retrospectively to 2001-2003.
However, the Bureau has received insufficient information to enable a full review of RASCO�s price controls. It is therefore proposed to roll forward the existing controls for a further two years (2006 and 2007) and thus not implement the above adjustment.

Title: 2005 Price Controls Review � Draft Proposals Issue No.: 1 Rev (0) Prepared by:
AR/MPC/MMH Document No. CR/E02/022 Issue Date: 27/07/05
Approved by: NSC
Page 88 of 137
9.10 Impact of Transmission System Delays
During 2004 and 2005, there have been delays to the completion of the water transmission system necessary to fully utilise the water produced by the new generation and desalination plant located at Shuweihat, for which the sector (ADWEC) has been incurring the cost of availability payments.
In February 2005, the Bureau wrote to TRANSCO outlining its concerns and enquiring into the reasons for the delay. Based on TRANSCO�s reply, the Bureau concluded that not all of the reasons for the delay could be considered as being outside the direct control of the licensee and announced its intention to implement a negative adjustment to TRANSCO�s future allowed revenues so as:
− To recover some of the unnecessary costs that have been incurred by the sector to date.
− To provide an incentive to minimise further delays in completion of the Shuweihat water transmission scheme.
− To ensure that similar issues do not re-occur in future on other projects.
Having considered the matter further, the Bureau now proposes to implement the adjustment at the 2009 price controls review, so as to allow the full impact of the delays to be assessed. The Bureau�s intention is to calculate the adjustment for TRANSCO as 50% of the cost of the availability payments which were unnecessarily incurred by ADWEC as a result of the delays.
9.11 Summary of Financial Adjustments
Table 9.9 overleaf summarises all the financial adjustments proposed in this Section 9 to be made at this price controls review:
The total financial adjustments for all businesses amount to about -AED 196 million, which is less than 1.5% of the total NPV of MARs projected for the 4-year PC3 period.

Titl
e: 2
005
Pric
e C
ontr
ols R
evie
w �
Dra
ft Pr
opos
als
Issu
e N
o.: 1
Rev
(0)
Prep
ared
by:
A
R/M
PC/M
MH
D
ocum
ent N
o.
CR/
E02/
022
Issu
e D
ate:
27/
07/0
5 A
ppro
ved
by:
NSC
Pa
ge 8
9 of
137
Tab
le 9
.9:
Sum
mar
y of
Fin
anci
al A
djus
tmen
ts �
Dra
ft P
ropo
sals
AE
D m
illio
n PC
1 PC
R-R
elat
ed
Tot
al
2006
pri
ces
RA
SCO
-R
elat
ed
PIS
Cat
egor
y B
W
ater
C
usto
mer
sM
eter
ed U
nits
O
ther
Inco
me
Info
rmat
ion
Sub
mis
sion
Man
pow
er S
ervi
ces
AA
DC
Elec
trici
ty D
istri
butio
n 12
.909
-3
6.33
3
-23.
423
Elec
trici
ty S
uppl
y 0.
082
-0.2
31
-0
.149
W
ater
Dis
tribu
tion
4.66
2
-27.
995
-7
.342
-30.
676
Wat
er S
uppl
y 0.
061
-0
.365
-0.0
96
-0
.400
AD
DC
Elec
trici
ty D
istri
butio
n 88
.751
-1.5
50
-60.
803
26
.397
El
ectri
city
Sup
ply
0.50
9
-0.0
09
-0.3
49
0.
152
Wat
er D
istri
butio
n 23
.828
-0.6
60
-15.
410
7.
758
Wat
er S
uppl
y 0.
204
-0
.006
-0
.132
0.06
6
AD
WE
C
Elec
trici
ty
-0.2
98
-0.2
98
Wat
er
-0.2
30
-0.2
30
TR
AN
SCO
Elec
trici
ty
-5
1.07
2
-65.
375
-1
7.14
2 -1
33.5
90
Wat
er
-3
4.97
7
-4.5
70
-1
.891
-4
1.43
7

Title: 2005 Price Controls Review � Draft Proposals Issue No.: 1 Rev (0) Prepared by:
AR/MPC/MMH Document No. CR/E02/022 Issue Date: 27/07/05
Approved by: NSC
Page 90 of 137
10 Price Control Calculations
10.1 Introduction
Section 4 introduced the overall framework for the price control calculations used in these Draft Proposals. In essence, these calculations involve equating the required revenue (that which would be sufficient to finance an efficient business) to the forecast revenue based on the revenue driver projections and subject to the proportions of revenue recovered by the fixed and variable revenue terms.
The required revenue is calculated using the �building-block� approach; that is, as the sum of operating expenditure, depreciation and return on capital. The projections of these components for the PC3 period (2006-2009) in 2006 prices are presented in Sections 6 and 7 of this paper. The required revenue so determined must also be adjusted by the financial adjustments discussed in Section 9.
In the case of ADWEC, which has few capital assets, the required revenue is calculated in a slightly different manner as the sum of operating expenditure, capital expenditure and profits on turnover over the control period.
Consistent with the approach taken to setting the price controls to date, the Bureau has used a net present value (NPV) framework to establish the level and profile of price controlled revenue. The NPV of costs or revenues is calculated on a mid-year basis; that is, the cost or revenue is assumed to be spread uniformly over a year or occur at the middle of the year.
The discount rate used in the present value calculation is the cost of capital discussed and set out in Section 8 of this paper; that is 5.00% (real, post-tax) for ADWEC and TRANSCO and 5.30% (real, post-tax) for the distribution companies (both distribution and supply businesses). All costs and revenues are expressed in 2006 prices (that is, excluding the effect of inflation) and all calculations are carried out in 2006 prices, consistent with the use of a real cost of capital.
As discussed in Section 4, once the NPV of the required revenue is established, the control itself can be sculpted in different ways to yield the same present value of revenue. That is, different combinations of values of a, b, c and X are possible to satisfy the equality condition. However, a unique set of values of a, b, c and X is obtained when constraints are put on shares of different revenue terms in the total revenue and on the value of X. The choice of �X� is largely an arbitrary one and has been set to zero in these Draft Proposals for all businesses.
The above calculation methodology applies to MARs for all businesses of AADC, ADDC, ADWEC and TRANSCO, excluding any pass-through costs. The Bureau has used a solver (an optimisation tool in Excel) for this purpose, as explained below.

Title: 2005 Price Controls Review � Draft Proposals Issue No.: 1 Rev (0) Prepared by:
AR/MPC/MMH Document No. CR/E02/022 Issue Date: 27/07/05
Approved by: NSC
Page 91 of 137
10.2 Price Control Calculations
Appendices B.1 through B.12 to this paper present detailed price control calculations for each business, electronic versions of which are available to the companies upon request. These calculations are presented in a standard format, albeit with some differences for ADWEC. They are explained below with reference to Line numbers for network companies while highlighting any differences for ADWEC.
Inputs (Lines 1-14)
Lines 1-14 for all the companies show the inputs to the main price control calculations:
• Line 1 shows the operating expenditure allowances in 2006 prices as per Section 6.
• Lines 2 and 3 list the opening and closing RAVs, respectively, for each year of the next control period (see Section 7 and Appendices A1-A10 for details). Line 4 shows the mid-year RAV for each year calculated as the average of the opening and closing RAVs for that year.
For ADWEC, for which the concept of RAV does not apply, Line 2 shows the forecast of BST turnover for the PC3 period. The Bureau has forecasted BST turnover for the PC3 period in 2006 prices, separately for water and electricity, by adjusting the values of PWPA capacity payments, variable O&M payments and fuel costs from the 2005 BST for expected increases in production capacity, output and fuel price. Line 3 shows the profit margin of 0.021% on turnover as set out in Section 8. Line 4 calculates the profit on turnover in AED millions (in 2006 terms) by applying this profit margin to the turnover in Line 2.
• Line 5 lists the total annual depreciation over the PC3 period as determined in Section 7. This Line is not used for ADWEC.
• Lines 6-8 list the assumptions for the revenue drivers. The assumptions for the variable revenue drivers are as per Section 5, whereas the fixed revenue driver is set to unity.
These Lines are not used for ADWEC, which does not have any variable revenue driver.
• Line 9 shows the NPV of financial adjustments discussed in Section 9.
• Line 10 shows the post-tax real cost of capital as discussed in Section 8. This is used in the calculation of NPVs.
• Lines 11-13 list the weights for the revenue drivers in the price-controlled revenue as per Section 4. These Lines are not used for ADWEC.
• Line 14 shows the Bureau�s assumption for the X factor.
Required Revenue Calculations (Lines 15-21)
Lines 15-21 show the calculations of required revenue:

Title: 2005 Price Controls Review � Draft Proposals Issue No.: 1 Rev (0) Prepared by:
AR/MPC/MMH Document No. CR/E02/022 Issue Date: 27/07/05
Approved by: NSC
Page 92 of 137
• For network companies, Lines 15 and 16 reproduce the annual opex allowances and depreciation for the PC3 period from Lines 1 and 5. Line 17 calculates the annual return on capital by multiplying the mid-year RAVs (Line 4) by the cost of capital (Line 10). The final column in each line shows the NPV of the relevant allowances over the PC3 period.
For ADWEC, Lines 15 and 17 reproduce the annual opex allowances and profit on turnover for the PC3 period from Lines 1 and 4. Line 16 is not used for ADWEC.
• Line 18 calculates the annual revenue requirement for the PC3 period, by adding Lines 15-17. The final column of Line 18 calculates the NPV of the annual revenue requirements over the PC3 period.
• Line 19 calculates, on an annual basis, the discounted annual revenue requirements. The last column figure is the simple sum of these discounted annual revenue requirements over the period and reconciles to the last column figure of Line 18.
• The last column in Line 20 reproduces the NPV of financial adjustments from Line 9.
• Line 21 shows the NPV of the revenue requirement after financial adjustments, calculated by adding the last columns of Lines 19 and 20. This is the figure used in setting the controls.
Revenue Forecast and Profiling (Lines 22-35)
Lines 22-35 describe the process for calibrating the controls, which utilises the Excel �Solver� function:
• Lines 22-25 relate to the fixed revenue term (referred to as Revenue Driver 1 in the model), Lines 26-29 relate to the first variable revenue term (or Revenue Driver 2), and Lines 30-33 to the second variable revenue term (or Revenue Driver 3). Lines 30-33 are not used for price control calculations for supply businesses which have only one variable revenue driver.
Lines 22-33 are not used for ADWEC, for which the MAR formulae contains a fixed revenue term only and no variable revenue drivers.
• Lines 22-25 relate to Revenue Driver 1 (the fixed revenue term) and run as follows:
− Line 22 shows the revenue driver forecast, which in this case is set to unity due to the fixed nature of this driver.
− Line 23 shows the notified value �a� for each year of the control period. Initially, this value is unknown. However, the model incorporates formulae which ensure that the value �a� changes by the X factor from year to year. Therefore, once the value for 2006 is known, those for 2007, 2008 and 2009 are automatically calculated.
− In Line 24, a forecast of revenue from this revenue driver is calculated by multiplying Line 22 (driver forecast) with Line 23 (value of �a�). The last figure in Line 24 is the NPV of the revenue forecast related to Revenue Driver 1 over the control period.

Title: 2005 Price Controls Review � Draft Proposals Issue No.: 1 Rev (0) Prepared by:
AR/MPC/MMH Document No. CR/E02/022 Issue Date: 27/07/05
Approved by: NSC
Page 93 of 137
− Line 25 calculates the share of revenue related to Revenue Driver 1 in the total annual revenue by dividing Line 24 (revenue forecast for Revenue Driver 1) by Line 34 (annual revenue). The last column figure in Line 25 is the ratio of the NPV of revenue forecast for Revenue Driver 1 to the NPV of total revenue shown as the second last column of Line 35 (total discounted allowed revenue at 1 January 2006). This NPV share is unknown initially but is one of the constraints used in Excel solver.
• Lines 26-29 and Lines 30-33 follow the same format as Lines 22-25 but are related to Revenue Drivers 2 and 3 (i.e. the two variable revenue drivers), respectively.
• Line 34 calculates the annual revenue forecast as the sum of revenue forecasts for each of the three revenue drivers (i.e. Lines 25, 29 and 33).
For ADWEC, whose price control formulae have only a fixed term, Line 34 shows the value for the fixed term (the notified value �a�) for each year of the control period. Similar to the case of network companies, initially, the value for �a� is unknown and changes by the X factor from year to year. Once the value for 2006 is known, those for 2007, 2008 and 2009 are automatically calculated.
• For all companies, Line 35 simply shows, on an annual basis, the discounted figures for annual revenues shown in Line 34 and, in the penultimate column, the total NPV of the revenues over the control period. The last column in Line 35 (�Difference�) is used to equate this to the NPV of the total required revenue after financial adjustments from Line 21.
• After inputting the required data and formulae in Lines 22-35, the Excel solver is run to set the last column figure in Line 35 (the �Difference�). The solver is able to do so by changing the values of �a�, �b� and �c� for 2006 (in Lines 23, 27 and 31), subject to the constraint that the shares of the NPVs of revenue forecasts for the revenue drivers (shown at the end of Lines 25, 29 and 33) in the NPV of total revenue forecast (Line 35) must be equal to the weights set out in Section 4 (as shown in Lines 11, 12 and 13, respectively). The target cell, variable cells and constraint cells for the solver are shown as shaded cells in the appendices and also indicated by arrows.
• As the result of the solver run, the values of �a�, �b� and �c� for 2006 are determined. The values of �a�, �b� and �c� for 2007, 2008 and 2009 are then automatically calculated by the model.
Results (Lines 36-39)
These lines summarise the values of the �a�, �b� and �c� and the X factor as set by the above calculations.
Implied Financial Indicators (Lines 40-41)
• For all companies, Line 40 shows the implied annual profit, calculated by subtracting Line 1 (operating expenditure allowance) and Line 5 (depreciation) from Line 34 (annual allowed revenue).

Title: 2005 Price Controls Review � Draft Proposals Issue No.: 1 Rev (0) Prepared by:
AR/MPC/MMH Document No. CR/E02/022 Issue Date: 27/07/05
Approved by: NSC
Page 94 of 137
• For network companies, Line 41 calculates the implied return on the mid-year RAVs in percentage terms by dividing Line 40 (implied annual profit) by Line 4 (mid-year RAVs).
In the case of ADWEC, Line 41 calculates the profit margin on turnover by dividing Line 40 (implied annual profit) by Line 2 (BST turnover projected for ADWEC).
10.3 Summary Results of Price Control Calculations � Draft Proposals
10.3.1 Notified Values
Based on the price control calculations explained above, the Bureau�s Draft Proposals for the notified values for all the regulated businesses of AADC, ADDC, ADWEC and TRANSCO are summarised in Table 10.1 below. These proposals are the same as calculated in Appendices B.1 through B.12 to this paper. The notified values given in Table 10.1 (to the accuracy expressed therein) will be those used to calculate MARs when the new price controls are implemented.
Table 10.1: Notified Values for PC3 � Draft Proposals
Values for 2006 2006 prices X A or a b c AADC Electricity Distribution 0.00 299.45 AEDm 652.46 AED/customer account 0.85 fils/kWh metered AADC Electricity Supply 0.00 27.59 AEDm 120.23 AED/customer account AADC Water Distribution 0.00 112.35 AEDm 477.44 AED/customer account 0.68 AED/TIG metered AADC Water Supply 0.00 8.78 AEDm 74.62 AED/customer account ADDC Electricity Distribution 0.00 579.54 AEDm 585.90 AED/customer account 0.74 fils/kWh metered ADDC Electricity Supply 0.00 29.16 AEDm 58.95 AED/customer account ADDC Water Distribution 0.00 225.20 AEDm 265.03 AED/customer account 0.51 AED/TIG metered ADDC Water Supply 0.00 24.35 AEDm 57.32 AED/customer account ADWEC Electricity 0.00 10.56 AEDm n/a n/a ADWEC Water 0.00 6.33 AEDm n/a n/a TRANSCO Electricity 0.00 706.27 AEDm 30.53 AED/kW metered 0.55 fils/kWh metered TRANSCO Water 0.00 599.82 AEDm 225.08 AED/TIGD metered 0.65 AED/TIG metered
10.3.2 Projected Allowed Revenues
Table 10.2 presents the projected MAR in respect of �own costs� (that is, excluding pass-through costs, if applicable) for each business and in total for 2006-2009.
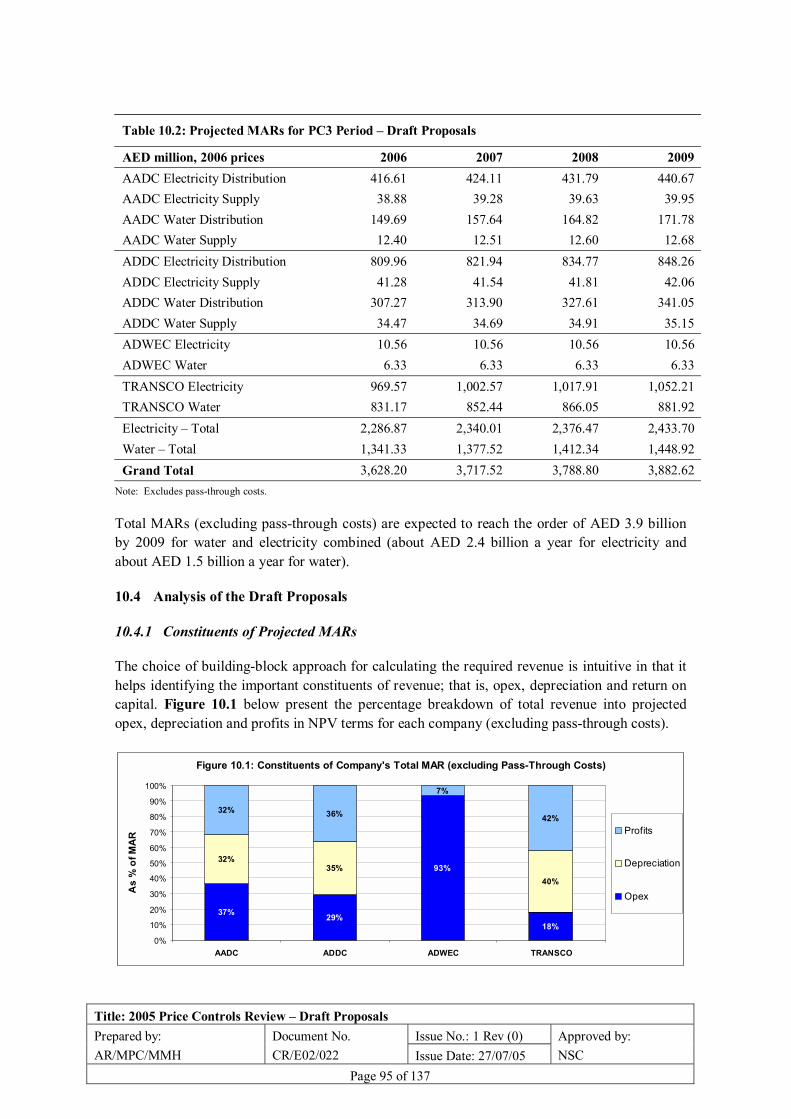
Title: 2005 Price Controls Review � Draft Proposals Issue No.: 1 Rev (0) Prepared by:
AR/MPC/MMH Document No. CR/E02/022 Issue Date: 27/07/05
Approved by: NSC
Page 95 of 137
Table 10.2: Projected MARs for PC3 Period � Draft Proposals
AED million, 2006 prices 2006 2007 2008 2009 AADC Electricity Distribution 416.61 424.11 431.79 440.67 AADC Electricity Supply 38.88 39.28 39.63 39.95 AADC Water Distribution 149.69 157.64 164.82 171.78 AADC Water Supply 12.40 12.51 12.60 12.68 ADDC Electricity Distribution 809.96 821.94 834.77 848.26 ADDC Electricity Supply 41.28 41.54 41.81 42.06 ADDC Water Distribution 307.27 313.90 327.61 341.05 ADDC Water Supply 34.47 34.69 34.91 35.15 ADWEC Electricity 10.56 10.56 10.56 10.56 ADWEC Water 6.33 6.33 6.33 6.33 TRANSCO Electricity 969.57 1,002.57 1,017.91 1,052.21 TRANSCO Water 831.17 852.44 866.05 881.92 Electricity � Total 2,286.87 2,340.01 2,376.47 2,433.70 Water � Total 1,341.33 1,377.52 1,412.34 1,448.92 Grand Total 3,628.20 3,717.52 3,788.80 3,882.62
Note: Excludes pass-through costs.
Total MARs (excluding pass-through costs) are expected to reach the order of AED 3.9 billion by 2009 for water and electricity combined (about AED 2.4 billion a year for electricity and about AED 1.5 billion a year for water).
10.4 Analysis of the Draft Proposals
10.4.1 Constituents of Projected MARs
The choice of building-block approach for calculating the required revenue is intuitive in that it helps identifying the important constituents of revenue; that is, opex, depreciation and return on capital. Figure 10.1 below present the percentage breakdown of total revenue into projected opex, depreciation and profits in NPV terms for each company (excluding pass-through costs).
Figure 10.1: Constituents of Company's Total MAR (excluding Pass-Through Costs)
37% 29%
93%
18%
32%35%
40%
32% 36%
7%
42%
0%
10%
20%
30%
40%
50%
60%
70%
80%
90%
100%
AADC ADDC ADWEC TRANSCO
As
% o
f MA
R Profits
Depreciation
Opex

Title: 2005 Price Controls Review � Draft Proposals Issue No.: 1 Rev (0) Prepared by:
AR/MPC/MMH Document No. CR/E02/022 Issue Date: 27/07/05
Approved by: NSC
Page 96 of 137
This figure shows that depreciation and return on capital account for a significant proportion of the revenue for AADC (about 63%), ADDC (71%) and TRANSCO (82%), even with the reduction in the cost of capital implemented in these Draft Proposals. This highlights the capital intensity of these businesses. In contrast, opex accounts for the majority (about 93%) of the revenue for ADWEC�s businesses (and also for supply businesses), confirming their small capital base.
Overall, the total profits for the price-controlled businesses in the sector are expected to be of the order of AED 1.435 billion a year on average over the PC3 period, more for the electricity businesses (approximately AED 963 million a year) than the water businesses (about AED 471 million a year). The difference in the magnitudes of the expected profits for different businesses reflects the respective capital sizes of these businesses.
10.4.2 Effect of Draft Proposals on Sector Costs
Figure 10.2 shows the expected effect of these Draft Proposals on price-controlled sector costs (separately for electricity and water). This excludes the effect of changes in the purchase price of water and electricity (i.e. BST costs), which are treated on pass-through basis.
Figure 10.2: Overall Price-Controlled Sector MAR - Projected Trend
-
500
1,000
1,500
2,000
2,500
3,000
1999 2000 2001 2002 2003 2004 2005 2006 2007 2008 2009
MA
R e
xlcu
ding
Pas
s-Th
roug
h C
osts
(AED
m
illio
n, 2
006
pric
es)
Electricity MAR Water MAR
Note: Excluding pass-through costs
The overall MAR for the price-controlled businesses is expected to increase from 2005 to 2009 by about AED 754 million (in 2006 prices) for water and electricity combined.
However, the annual increases in MAR are significantly lower than the forecast demand increases over the same period. The Draft Proposals are therefore expected to result in a declining trend for unit costs of water and particular electricity, in relation to price-controlled costs. This is graphically shown in Figure 10.3 below:

Title: 2005 Price Controls Review � Draft Proposals Issue No.: 1 Rev (0) Prepared by:
AR/MPC/MMH Document No. CR/E02/022 Issue Date: 27/07/05
Approved by: NSC
Page 97 of 137
Figure 10.3: MAR per unit transmitted - Trend (in 2006 prices)
0.00
2.00
4.00
6.00
8.00
10.00
1999 2000 2001 2002 2003 2004 2005 2006 2007 2008 2009
Elec
tric
ity M
AR
per
uni
t(fi
ls/k
Wh)
0.00
2.00
4.00
6.00
8.00
10.00
Wat
er M
AR
per
uni
t(A
ED/T
IG)
Electricity MAR per unit Water MAR per unit
Note: Excluding pass-through costs
This shows that, as a result of the Draft Proposals, unit costs for electricity and water are expected to be, respectively 13% and 27% lower (in real terms) than in 1999. This continues the ongoing downward trend over the period (the discontinuity in 2002/2003 was due to the delay in financing PC1 capex).

Title: 2005 Price Controls Review � Draft Proposals Issue No.: 1 Rev (0) Prepared by:
AR/MPC/MMH Document No. CR/E02/022 Issue Date: 27/07/05
Approved by: NSC
Page 98 of 137
11 Performance Incentive Scheme
11.1 Introduction
The Performance Incentive Scheme (PIS) links important aspects of each company�s performance to its price controls. Under this scheme, companies are rewarded for improved service and output performance and penalised for deteriorating performance. The current PIS for all businesses has two types of performance indicator: Category A indicators with precise definitions, targets and incentive rates, and an automatic annual revenue adjustment for performance via a term �Q� in the MAR formulae, subject to a cap; and Category B indicators, less precisely defined but subject to a possible financial adjustment at the following review for especially good or poor performance.
Based on the positive experience with the current PIS, earlier consultation papers suggested further development of the present scheme for PC3, particularly by introducing new Category A indicators based on key measures of technical performance.
The papers also highlighted the need to (i) increase the cap on incentives for Category A to accommodate new indicators and further strengthen the incentives for performance improvement, and (ii) define a cap on financial adjustments for Category B at the next review to address companies� concerns about the undefined financial impact associated with Category B.
In general, the respondents to those papers supported the Bureau�s suggestions, with some reservations. However, they argued against financial adjustments at the next review for performance on Category B, as they perceived this allowed undue regulatory discretion. There was a mixed reaction to the proposed increase in the cap on incentives for Category A. The respondents also expressed concerns about a lack of clarity on the definitions and targets for certain new Category A indicators, the unavailability of reliable data, and the timing for implementation.
The following sections set out the Bureau�s Draft Proposals on the PIS for PC3. In essence, these proposals retain the suggestions of the Second Consultation Paper, but with some modifications. The Bureau now proposes an expanded Category A with an increased overall cap of 4% of MAR (in relation to licensees� �own� costs). In the case of Category B, the Bureau now proposes to set the overall cap at 2% of MAR (in relation to their �own� costs). The Bureau also attempted to address the companies� concerns regarding the definition/measurement of new Category A indicators.
One further important change, compared to the Second Consultation Paper, is that the Bureau does not now propose to introduce an indicator for Significant Safety Incidents.
11.2 Current Performance Incentive Scheme (PIS)
11.2.1 Main Features of the Current PIS
There are presently two Category A indicators: audited accounts timeliness, and audited PCR timeliness. Performance on both measures is assessed as the difference (in months) between the

Title: 2005 Price Controls Review � Draft Proposals Issue No.: 1 Rev (0) Prepared by:
AR/MPC/MMH Document No. CR/E02/022 Issue Date: 27/07/05
Approved by: NSC
Page 99 of 137
actual date of submission and the target date for submission to the Bureau of the statements for the previous year. Good or poor performance is then rewarded or penalised through a mechanistic annual financial adjustment to the company�s MAR in the next year via the term �Q� in the price control formula.
There are separate Category A indicators (and hence separate Q terms) for each of the price controls of the monopoly companies. Each has been precisely defined along with a clear-cut target date and incentive rate. Incentive rates have been defined as an amount expressed in AED per month of delay or earliness and were set in proportion to the size of each business.
While the licences set out the due dates for the submission of audited accounts and audited PCRs (30 June and 31 March, respectively), the target dates for the purposes of the PIS were set on a �glide-path� basis, initially allowing more time for the companies to adjust to the newly introduced PIS and to clear the backlog of previous years� audited statements. However, by 2005, the PIS target date is aligned to the licence target date. In 2005, the reward for submitting the statements on time was set as six times the monthly penalty for being late.
The total reward or penalty under the PIS for any business (that is, the Q term) for performance in any year was capped at 2% (5% for RASCO) of the MAR in relation to its �own� costs in that year. �Own� costs means procurement cost for ADWEC, transmission costs for TRANSCO, distribution and supply costs for AADC/ADDC, or whole MAR for RASCO.
There are a number of Category B performance indicators within the current PIS, which are monitored during the current control period. However, in contrast to Category A indicators, the performance against the Category B indicators is not subject to an automatic or mechanistic annual revenue adjustment for good or poor performance. This is because the measures did not yet meet all the Bureau�s criteria for inclusion as a Category A indicator.7 The objective of Category B was two-fold: first, indicators can be further developed for consideration as Category A indicators at this price control review; secondly, companies can be rewarded or penalised for exceptionally good or poor performance during the current control period at this review (see Section 9 for financial adjustments at this review for Category B performance during PC2).
Earlier consultation papers can be referred to for more details on the current PIS.
11.2.2 Assessment of Experience to Date
The experience with the present PIS has shown very positive results. In particular, the Category A indicators have been able to influence the companies to initiate to the Bureau the audited separate accounts and audited PCRs for 2004 and earlier years in a more timely manner. For example, the delay in receipt of ADDC�s accounts reduced from 17 months (2002 accounts) to 5 months (2003 accounts). Its accounts for the 2004 financial year were submitted on time, as were those for all other companies except RASCO.
7 The 2002 price controls review established that Category A indicators must meet the following
criteria: measurable, verifiable, non-manipulable, non-distortionary and customer-oriented.

Title: 2005 Price Controls Review � Draft Proposals Issue No.: 1 Rev (0) Prepared by:
AR/MPC/MMH Document No. CR/E02/022 Issue Date: 27/07/05
Approved by: NSC
Page 100 of 137
Table 11.1 summarises the performance of the companies on Category A indicators to date in terms of the submission dates and the resulting penalties/rewards. The cap on the overall adjustment for each business has been ignored in these calculations.
Table 11.1: Performance of Companies on Category A Indicators
Financial Year 2002 / Formula Year 2004
Financial Year 2003 / Formula Year 2005
Financial Year 2004 / Formula Year 2006
Company / Business
Performance Indicator
Submission Date Reward AED m
Submission Date Reward AED m
Submission Date Reward AED m
ADWEC Audited Accounts 26 May 2004 -0.090 6 October 2004 0.000 4 July 2005 +0.108 Audited PCR N/C -0.162 3 August 2004 -0.018 6 April 2005 +0.108
Audited Accounts 7 April 2004 -4.005 11 May 2004 +8.010 14 June 2005 +8.010 TRANSCO Electricity Audited PCR 7 April 2004 -8.010 14 April 2004 +8.010 13 April 2005 +8.010
Audited Accounts 7 April 2004 -2.679 11 May 2004 +5.358 14 June 2005 +5.358 TRANSCO Water Audited PCR 7 April 2004 -5.358 14 April 2004 +5.358 13 April 2005 +5.358
Audited Accounts 7 December 2004 -10.224 7 December 2004 -2.272 2 July 2005 +6.816 ADDC Electricity Audited PCR 11 August 2004 -10.224 13 October 2004 -3.408 5 April 2005 +6.816
Audited Accounts 7 December 2004 -4.545 7 December 2004 -1.010 2 July 2005 +3.030 ADDC Water Audited PCR 11 August 2004 -4.545 13 October 2004 -1.515 5 April 2005 +3.030
Audited Accounts 13 December 2004 -5.445 14 December 2004 -1.210 2 July 2005 +3.630 AADC Electricity Audited PCR 5 December 2004 -5.445 5 December 2004 -3.025 12 April 2005 +3.630
Audited Accounts 13 December 2004 -2.133 14 December 2004 -0.474 2 July 2005 +1.422 AADC Water Audited PCR 5 December 2004 -2.133 5 December 2004 -1.185 12 April 2005 +1.422
Audited Accounts N/A N/A N/C -3.330 N/R tbd RASCO Electricity Audited PCR N/A N/A N/A N/A N/R tbd
Audited Accounts N/A N/A N/C -6.453 N/R tbd RASCO Water Audited PCR N/A N/A N/A N/A N/R tbd
Notes: �N/R� denotes �not received� by the Bureau. �N/C� denotes �not complete� (incomplete statement received by the Bureau). �N/A� denotes �not applicable�.
�tbd� denotes �to be determined� � indicates date for maximum penalty not yet reached.
Note that during PC2 companies were granted, as a transitional measure, a 15-day �grace period�, such that submissions received up to the 15th of the month would be regarded, for the purpose of the PIS, as having been received the previous month.
Note that subsequent to the issue of the Second Consultation Paper (which treated ADWEC�s PCRs for the 2002 and 2003 financial years as incomplete), ADWEC provided confirmation that the information provided on 3 August 2004 had been audited. Accordingly, the Bureau now considers ADWEC�s PCR for 2003 as complete on that date, as reflected in the above table.
In the case of RASCO, the company provided audited accounts for the 2003 financial year to the Bureau in December 2004 but did not submit its accounts separately for water and electricity as required by the licence modification agreed for the 2004-2005 price controls. The submitted audited accounts for RASCO for 2003 are also therefore classified as �not complete�. No audited returns have (as of 16 July 2005) been received from RASCO relating to the 2004 financial year.

Title: 2005 Price Controls Review � Draft Proposals Issue No.: 1 Rev (0) Prepared by:
AR/MPC/MMH Document No. CR/E02/022 Issue Date: 27/07/05
Approved by: NSC
Page 101 of 137
The introduction of Category B indicators has also generally had a positive impact on the companies� performance, as discussed in earlier papers. There is only one Category B indicator (TRANSCO�s economic despatch performance) where the Bureau judges that a financial adjustment is required for exceptionally good or poor performance (see Section 9 of this paper).
11.3 Category A Indicators for PC3
11.3.1 Second Consultation Paper
The respondents to the earlier consultation papers supported the Bureau�s suggestion to retain and develop the Category A indicators. Furthermore, with the further separation of controls, separate Q terms for the electricity and water businesses of ADWEC and TRANSCO, and separate Q terms for the four separate businesses of each of AADC and ADDC, are required at this review. Accordingly, separate Category A indicators will need to be defined for each business.
11.3.2 Draft Proposals
Based on the responses to the Second Consultation Paper, the Bureau intends to proceed with the following Category A indicators for PC3:
Table 11.2: Category A Indicators for PC3 � Draft Proposals
AADC and ADDC Electricity Supply Electricity Distribution Water Supply Water Distribution
1. Audited Accounts 2. Audited PCR 3. Information
Submission
1. Audited Accounts 2. Audited PCR 3. Information Submission 4. Number of Interruptions 5. Customer Minutes Lost
1. Audited Accounts 2. Audited PCR 3. Information
Submission
1. Audited Accounts 2. Audited PCR 3. Information Submission 4. Water Quality
ADWEC Electricity Water
1. Timeliness of Audited Accounts 2. Timeliness of Audited PCR 3. Timeliness of Information Submission 4. Accuracy of Annual Peak Demand Forecast
1. Timeliness of Audited Accounts 2. Timeliness of Audited PCR 3. Timeliness of Information Submission 4. Accuracy of Annual Peak Demand Forecast
TRANSCO Electricity Water
1. Timeliness of Audited Accounts 2. Timeliness of Audited PCR 3. Timeliness of Information Submission 4. Availability 5. Energy Lost
1. Timeliness of Audited Accounts 2. Timeliness of Audited PCR 3. Timeliness of Information Submission 4. Water Quality
Title: 2005 Price Controls Review � Draft Proposals Issue No.: 1 Rev (0) Prepared by:
AR/MPC/MMH Document No. CR/E02/022 Issue Date: 27/07/05
Approved by: NSC
Page 102 of 137
11.3.3 Defining PC3 Category A Indicators
Each of the proposed Category A indicators for PC3 is discussed below, along with the Bureau�s views on the issues raised by the respondents to the Second Consultation Paper:
• Audited Accounts Timeliness for all businesses: This is the same as the existing Category A indicator, defined separately for each separate business. For any business, it is the difference (measured in months) between the actual date and the target date for submission to the Bureau of audited accounts for the relevant business for the preceding year.
• Audited PCR Timeliness for all businesses: Again, this is the same as the existing indicator. For any business, it is the difference (measured in months) between the actual date and the target date for submission to the Bureau of audited PCR for the relevant business for the preceding year.
The Bureau also consulted, for both of the above indicators, on whether it remains appropriate to give bonuses simply for meeting licence obligations, or should it rely instead just on penalties for non-compliance. For example, in each of the last two years, TRANSCO has received bonuses of almost AED 27 million. In principle, the Bureau considers that licensees should not receive bonuses simply for licence compliance, although licensees thought otherwise. However, in view of the proposed introduction at this review of new indicators, the targets for which may be challenging, the Bureau proposes to retain the potential bonuses for the audited timeliness indicators, to ensure the overall scheme cannot be regarded as �one-sided�.
• Timeliness of Annual Information Submission (AIS) for all businesses: This is a new indicator proposed to be introduced to improve on the performance to date of the companies on their submission of requested information to the Bureau. A new formal requirement for an Annual Information Submission (AIS) to be received by the Bureau by 30 September each year, in a format prescribed by the Bureau, will be included in the licence. For any business, performance on this indicator will be measured as the difference (measured in months) between the actual date and the target date for submission to the Bureau of an AIS and associated Technical Assessor�s Statement (see below) for the relevant business for the preceding year. The Bureau will consult on whether any changes to the existing pro-formas for its information requests as used to date are required before issuing the first AIS request.
While AADC did not consider this indicator as required, ADDC and other respondents to the Second Consultation Paper supported this indicator. As suggested by ADDC, the contents of the submission would not be subject to audit. However, the AIS will be required to be accompanied by a statement by a independent consulting engineer approved by the Bureau (�Technical Assessor�s Statement�) confirming that the submission is complete and that the methods and assumptions adopted are reasonable (see also Section 11.6.2).
• Accuracy of Annual Peak Demand Forecasts for ADWEC: As discussed in Section 3.8 of this paper, the present practice of retrospective adjustment to the previous year�s BST resulting in a zero correction factor has highlighted the need for appropriate incentives for ADWEC to forecast demands for the forthcoming year as accurately as possible. In line with
Title: 2005 Price Controls Review � Draft Proposals Issue No.: 1 Rev (0) Prepared by:
AR/MPC/MMH Document No. CR/E02/022 Issue Date: 27/07/05
Approved by: NSC
Page 103 of 137
ADWEC�s response to the First Consultation Paper, the Second Consultation Paper proposed, separately for water and electricity, the accuracy of annual peak demand forecasts as new Category A indicators for ADWEC. Therefore, by 31 December each year, ADWEC will be required to formally submit to the Bureau its gross peak electricity and water demand forecasts for the coming year. The accuracy of these forecasts will be measured against the actual outturn gross peak demands and ADWEC will be rewarded or penalised through pre-defined incentive rates if its forecasting accuracy is better or poorer than a target accuracy.
This indicator is measured as the difference between forecast and outturn gross peak demands, expressed in relation to the target accuracy (see section 11.4).
In response to the Second Consultation Paper, ADWEC raised a concern in relation to the target accuracy, which is discussed in Section 11.4.
• Water Quality Indicators for Transmission and Distribution Businesses: The water transmission and distribution businesses of TRANSCO, AADC and ADDC have statutory obligations to comply with the Bureau�s Water Quality Regulations. A new Category A indicator is therefore proposed for these businesses to incentivise them to improve on their performance regarding compliance with the Water Quality Regulations. This indicator is proposed to be defined as the ratio between (i) the total number of parameter tests that pass and (ii) the total number of parameter tests required to be taken, for the preceding year, in accordance with the Water Quality Regulations.
The Bureau believes that this definition provides the clarity sought by the respondents to the Second Consultation Paper: AADC considered this indicator to be �contradictory� with Water Quality Regulations; ADDC suggested inconsistencies between this indicator (or the proposed target of 100% compliance) and the Key Performance Indicators (KPIs) being developed by the Bureau; and both AADC and ADDC considered the target of 100% compliance one-sided or too harsh.
The Bureau considers that the Category A indicators and the KPIs are complementary means of facilitating improved performance against the Water Quality Regulations � the PIS simply introduces an additional financial incentive. The scheme is not one-sided, as there will be a substantial bonus for 100% compliance (see Section 11.7 below). The target is also now structured so that there will be no penalty if the licensee achieves compliance of 95% or better, or improves by 10% or more on its performance in the previous year.
• Number of Interruptions Indicator for Electricity Distribution Businesses and Availability Indicator for Electricity Transmission Business: To improve security of electricity supplies to customers, the Bureau proposes a new Category A indicator to incentivise the electricity transmission business of TRANSCO and the electricity distribution businesses of AADC and ADDC to reduce the number of incidents or events resulting in interruption of electricity supplies. In line with the discussion with ADDC, the Bureau proposes not to distinguish between planned and unplanned outages for this new indicator.
For distribution companies, this indicator will be defined as the total number of interruptions in a year, whether due to planned or unplanned outages.

Title: 2005 Price Controls Review � Draft Proposals Issue No.: 1 Rev (0) Prepared by:
AR/MPC/MMH Document No. CR/E02/022 Issue Date: 27/07/05
Approved by: NSC
Page 104 of 137
In the case of TRANSCO, the number of interruptions is highly volatile, and the Bureau now considers that, consistent with international best practice, the availability of the network is a more suitable measure for a transmission business. This will be defined as number of circuit-hours available over total number of circuit-hours.
In response to the Second Consultation Paper, ADDC supported this indicator but AADC did not agree due to the lack of reliable data (it also raised similar concerns in relation to the �energy lost� indicator discussed below). ADDC suggested that time was needed before this indicator could be introduced. The Bureau�s proposal to only assess performance from 2007 onwards based on data audited from 2006 onwards addresses these concerns.
• Energy Lost Indicator for Electricity Transmission Business and Customer Minutes Lost Indicator for Electricity Distribution Businesses: While the preceding indicator is designed to promote the reduction of the number of network outages, it will not directly incentivise the relevant businesses to reduce the scale of the effect of any such outages on customers. The Second Consultation Paper therefore suggested a further new indicator to incentivise the businesses to reduce the impact of outages.
For TRANSCO, the Bureau considers the appropriate measure to be the total energy lost in a year due to transmission network interruptions (whether planned or unplanned), as proposed in the Second Consultation Paper.
In the case of the distribution companies, following discussions with ADDC the Bureau has given further consideration to the precise definition of this indicator and now proposes to define the �scale� indicator for distribution customers in terms of customer minutes lost, rather than energy lost, consistent with international best practice for distribution companies � ie, defined as the total customer minutes lost in a year due to distribution network interruptions (whether planned or unplanned. This requires, for each interruption, the duration of the interruption to be multiplied by the number of customers affected, and summed across all interruptions.
For all the above indicators involving interruptions, the Bureau considers an interruption to be any interruption having a duration in excess of 3 minutes.
The Second Consultation Paper also suggested a new Category A indicator for each of the water and electricity transmission or distribution businesses of AADC, ADDC and TRANSCO to incentivise these businesses to reduce the occurrence of significant safety incidents.
Several respondents expressed concerns in relation to this indicator, as a result of which the Bureau has reconsidered the matter and now considers that it would not be appropriate to financially reward or penalise safety performance. The goal of all licensees should be to avoid any such incidents. Instead, the Bureau will continue to work closely with licensees to ensure compliance with licence requirements.
As mentioned above, performance data for some of the above Category A indicators will require auditing. This is discussed in Section 11.6.2 below, where the Bureau proposes the introduction a system of �Technical Assessors� to verify data relating to technical indicators, similar to the

Title: 2005 Price Controls Review � Draft Proposals Issue No.: 1 Rev (0) Prepared by:
AR/MPC/MMH Document No. CR/E02/022 Issue Date: 27/07/05
Approved by: NSC
Page 105 of 137
approach adopted by Ofwat and other regulators in the UK. Where targets are based on the previous year�s performance, the previous year�s performance will also need to be audited. The first year of performance assessment under the PIS for the new Category A indicators will be 2007, to allow time for any required systems to be introduced and data for 2006 (the first target in some cases) to be audited. Further, as discussed in Section 11.6.1, the businesses will not be penalised or rewarded on most of the new Category A indicators for performance due to factors outside the companies� reasonable control.
11.4 Targets for Category A Indicators for PC3
11.4.1 Second Consultation Paper
The First and Second Consultation Papers discussed in some detail the important question of how the future performance target for any indicator should be set.
The Second Consultation Paper indicated the Bureau�s intention to proceed as follows:
• For the present Category A indicators, the targets should be the licence due dates. That is, 31 March for audited PCRs and 30 June for audited accounts.
• For the new Annual Information Submission (AIS), the target date should be 30 September each year (to be incorporated into the licence) - this will spread the companies� workload over the year.
• For the water quality indicators, 100% compliance was proposed.
• For ADWEC�s demand forecast accuracy indicator, it was considered appropriate to set a range of 2% (ie, plus or minus 1%) consistent with the one-sided threshold of 2% used by the licence for the application of the additional 3% �penalty� interest rate on over-recovery of revenue for the purposes of calculation of the correction factor.
• For other new Category A indicators, the targets should be set keeping in view the companies� recent reasonable performance � in general, this meant (audited) performance in the previous year
11.4.2 Companies� Responses and Bureau�s Views
AADC agreed that the setting of targets should be prescribed in the licences but suggested that the new Category A indicators should be implemented only when at least 12 months of reliable data is available. Further, independent audit should be undertaken prior to introducing such indicators. ADDC considered that, where �previous year performance� was proposed to be the target for the next year performance, introduction of such an indicator for performance in 2006 might not be achievable.
The Bureau agrees with the above comments, which are reflected in our proposal that performance on the new Category A indicators will be assessed only from 2007 onwards.

Title: 2005 Price Controls Review � Draft Proposals Issue No.: 1 Rev (0) Prepared by:
AR/MPC/MMH Document No. CR/E02/022 Issue Date: 27/07/05
Approved by: NSC
Page 106 of 137
ADWEC considered that the target of +/-1% is too narrow for demand forecast accuracy as it believes the random variation in temperature alone is greater than the range proposed.
The Bureau�s analysis of historical data shows that ADWEC has, on occasion, achieved such a target. Nevertheless, it is important that the target is fair. The Bureau therefore proposes thresholds of 100 MW and 10 MGD, respectively, for electricity and water, for the demand forecasting error. That is, a demand forecasting error of less than 100 MW or 10 MGD (plus or minus) from the actual demand will be rewarded (the lower the error, the greater will be the reward) and a demand forecasting error of more than 100 MW or 10 MGD (plus or minus) from the actual demand will be penalised (the higher the error, the greater will be the penalty). These accuracy thresholds are equivalent to about +/- 2% of current peak demands.
11.4.3 Draft Proposals
The Bureau�s proposed targets for Category A indicators for PC3 are summarised in Table 11.3:
Table 11.3: Performance Targets for PC3 Category A Indicators � Draft Proposals
Category A Indicator Businesses Proposed Target Audited Accounts Timeliness All 30 June each year
Audited PCR Timeliness All 31 March each year
Information Submission Timeliness All 30 September each year
Water Quality Indicator All network water businesses 100% Peak Demand Forecast Accuracy ADWEC�s water and electricity businesses Accuracy within 10 MGD and 100 MW
Availability TRANSCO�s electricity transmission business Previous year performance
Number of Interruptions Electricity distribution businesses Previous year performance
Energy Lost TRANSCO�s electricity transmission business Previous year performance
Customer Minutes Lost Electricity distribution businesses Previous year performance
11.5 Incentive Rates for Category A Indicators for PC3
11.5.1 Overall Approach
The Bureau has calculated the incentive rates for Category A indicators based on the approach it used at the previous price control reviews, as discussed in earlier consultation papers. That is, for each business:
− First, determine the total amount �at risk� for Category A indicators as a whole (the total maximum penalty or reward) according to the cap on the Q term (4% of average forecast MAR for the PC3 period in relation to �own costs� � see Section 11.8 below).
− Second, the resulting amount is equally apportioned between all the Category A indicators of the business concerned.
− Third, the incentive rate for each indicator can be derived by dividing the relevant amount apportioned as above by (a) for timeliness Category A indicators, the variance
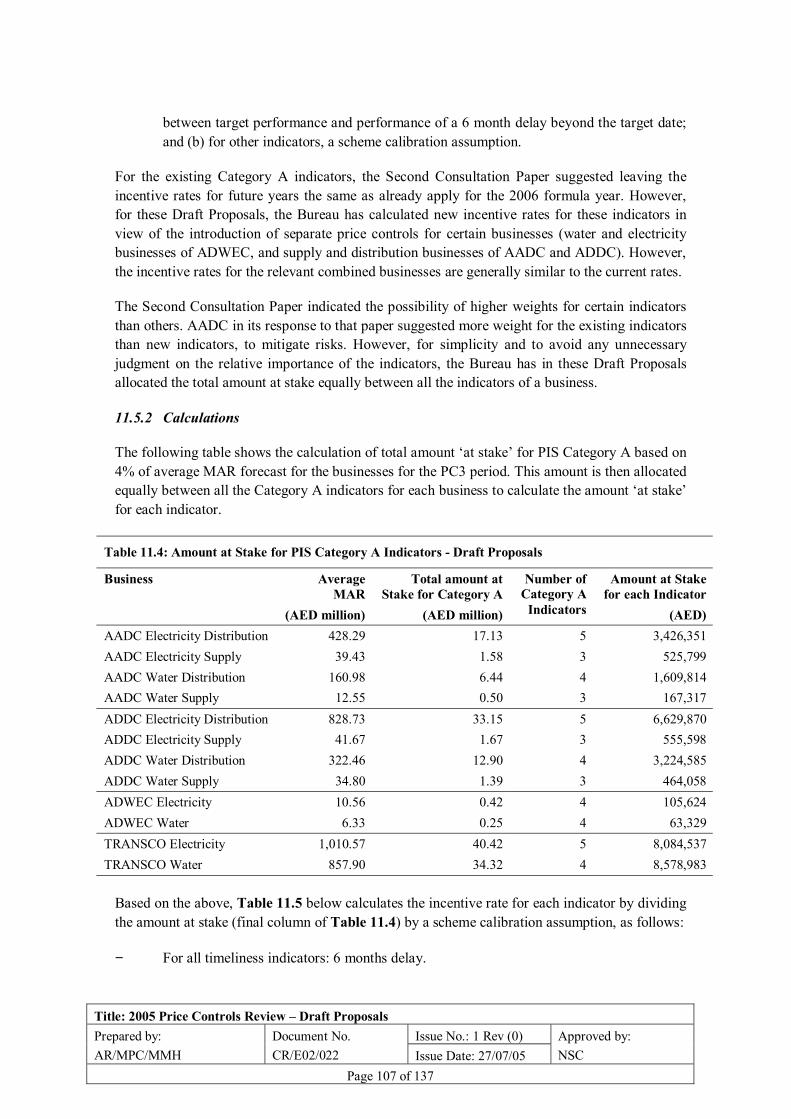
Title: 2005 Price Controls Review � Draft Proposals Issue No.: 1 Rev (0) Prepared by:
AR/MPC/MMH Document No. CR/E02/022 Issue Date: 27/07/05
Approved by: NSC
Page 107 of 137
between target performance and performance of a 6 month delay beyond the target date; and (b) for other indicators, a scheme calibration assumption.
For the existing Category A indicators, the Second Consultation Paper suggested leaving the incentive rates for future years the same as already apply for the 2006 formula year. However, for these Draft Proposals, the Bureau has calculated new incentive rates for these indicators in view of the introduction of separate price controls for certain businesses (water and electricity businesses of ADWEC, and supply and distribution businesses of AADC and ADDC). However, the incentive rates for the relevant combined businesses are generally similar to the current rates.
The Second Consultation Paper indicated the possibility of higher weights for certain indicators than others. AADC in its response to that paper suggested more weight for the existing indicators than new indicators, to mitigate risks. However, for simplicity and to avoid any unnecessary judgment on the relative importance of the indicators, the Bureau has in these Draft Proposals allocated the total amount at stake equally between all the indicators of a business.
11.5.2 Calculations
The following table shows the calculation of total amount �at stake� for PIS Category A based on 4% of average MAR forecast for the businesses for the PC3 period. This amount is then allocated equally between all the Category A indicators for each business to calculate the amount �at stake� for each indicator.
Table 11.4: Amount at Stake for PIS Category A Indicators - Draft Proposals
Business Average MAR
(AED million)
Total amount at Stake for Category A
(AED million)
Number of Category A
Indicators
Amount at Stake for each Indicator
(AED)AADC Electricity Distribution 428.29 17.13 5 3,426,351 AADC Electricity Supply 39.43 1.58 3 525,799 AADC Water Distribution 160.98 6.44 4 1,609,814 AADC Water Supply 12.55 0.50 3 167,317 ADDC Electricity Distribution 828.73 33.15 5 6,629,870 ADDC Electricity Supply 41.67 1.67 3 555,598 ADDC Water Distribution 322.46 12.90 4 3,224,585 ADDC Water Supply 34.80 1.39 3 464,058 ADWEC Electricity 10.56 0.42 4 105,624 ADWEC Water 6.33 0.25 4 63,329 TRANSCO Electricity 1,010.57 40.42 5 8,084,537 TRANSCO Water 857.90 34.32 4 8,578,983
Based on the above, Table 11.5 below calculates the incentive rate for each indicator by dividing the amount at stake (final column of Table 11.4) by a scheme calibration assumption, as follows:
− For all timeliness indicators: 6 months delay.

Title: 2005 Price Controls Review � Draft Proposals Issue No.: 1 Rev (0) Prepared by:
AR/MPC/MMH Document No. CR/E02/022 Issue Date: 27/07/05
Approved by: NSC
Page 108 of 137
− For ADWEC�s demand forecasting accuracy indicators: 100 MW or 10 MGD error.
− For water quality indicators: 50% non-compliance with the Water Quality Regulations.
− For (i) availability, (ii) number of interruptions, (iii) energy lost and (iv) customer minutes lost (CML) indicators: 20% change on the previous year�s performance.
It is important to note that the above assumptions are purely hypothetical and used only for the purpose of the initial calibration of the scheme and play no further role in the implementation of the scheme. The resulting incentive rates are then rounded off appropriately and expressed in the appropriate units, as shown in Table 11.5:
Table 11.5: PIS Category A Indicators for PC3 - Draft Proposals
Business Timeliness Indicator
(3 indicators)*
Demand Forecasting
Accuracy Indicator
Water Quality Indicator
Availability, Interruptions,
Energy Lost and CML Indicators
(AED / month)
(AED/MW or AED/MGD)
(AED / 1% non-compliance) (AED / 1% change)
AADC Electricity Distribution 570,000 170,000
AADC Electricity Supply 90,000
AADC Water Distribution 270,000 30,000
AADC Water Supply 30,000
ADDC Electricity Distribution 1,100,000 330,000
ADDC Electricity Supply 90,000
ADDC Water Distribution 540,000 60,000
ADDC Water Supply 80,000
ADWEC Electricity 18,000 1,000
ADWEC Water 11,000 6,000
TRANSCO Electricity 1,350,000 400,000
TRANSCO Water 1,430,000 90,000 * Timeliness of audited Separate Business Accounts (SBAs), audited Price Control Returns (PCRs) and Annual Information Submission (AIS)
Examples of the operation of the scheme are given in Section 11.7 below. For existing Category A indicators, these rates will apply to the Q terms in the 2007 formula year onwards (ie, relating to performance in 2006 in submitting audited accounts and PCRs for the 2005 financial year). For new Category A indicators, they will apply to the Q terms in the 2009 formula year onwards (ie, assessing performance in 2007 onwards as submitted in 2008).
For any business, each of the three timeliness indicators (audited accounts, audited PCRs and AISs) has the same incentive rate as shown in the table, as the same amount is at stake for the indicator and the same calibration assumption has been used. Similar is the case for the four technical indicators specific to the electricity network businesses (that is, availability, number of interruptions, energy lost and CML).

Title: 2005 Price Controls Review � Draft Proposals Issue No.: 1 Rev (0) Prepared by:
AR/MPC/MMH Document No. CR/E02/022 Issue Date: 27/07/05
Approved by: NSC
Page 109 of 137
As expected, the incentive rates vary significantly from business to business, reflecting the size of each business. In general, transmission businesses have higher rates than distribution businesses and electricity businesses have higher rates than water businesses. AADC has lower incentive rates than ADDC. ADWEC has the lowest incentive rates among the companies.
11.6 Exceptional Events and Performance Audit for PC3
Earlier consultation papers highlighted that certain Category A indicators would require the companies to have their annual performance data on these indicators audited by an independent, suitably-qualified organisation approved by the Bureau.
Further, the Second Consultation Paper suggested a company should not be penalised or rewarded for certain exceptional events, if such events are material and outside the company�s control, in relation to certain of the new indicators.
None of the respondents to the Second Consultation Paper commented on these arrangements. The Bureau has given further thought to the matter and its proposals are as follows:
11.6.1 Exceptional Events
The companies� performance on certain Category A indicators should be excused (that is, should not be rewarded or penalised under the PIS) for exceptional events. An �exceptional event� will be defined in the licence as follows:
�An event or circumstance not within the reasonable control, directly or indirectly, of the relevant business caused by or arising out of (i) an event or incident occurring on a water or electricity system upstream of the system of the business, or (ii) of acts of war, riots, terrorism, lightning, fire, earthquake, tsunami, unusual flood, storm, cyclone, typhoon, tornado or other natural calamity, and epidemic or plague, but only if and to the extent that (a) such circumstance, despite the exercise of reasonable diligence, cannot be prevented, avoided or removed by the business, (b) such event materially affects the performance of the business or its system and the business has taken all reasonable precautions, due care and reasonable alternative measures to avoid the effect of such event on the business or its system and to mitigate the consequences of such an event, and (c) such event is not the direct or indirect result of the performance or failure of the business or its system, provided further that the business shall make all reasonable efforts to prevent and reduce to a minimum and mitigate the effect of any such event including recourse to alternate sources of services, equipment and materials, and that the business shall use its best efforts to ensure resumption of normal performance of the business or its system as soon as possible after cessation of such an event.�
The above proposed definition is similar to that of a force majeure event found in a contract for an infrastructure project or utility system including the PWPAs in Abu Dhabi. A business wishing to exclude the impact of a certain event from the operation of the PIS would need to demonstrate to the Technical Assessor (see below) that the event satisfies the requirements of the above definition.
Title: 2005 Price Controls Review � Draft Proposals Issue No.: 1 Rev (0) Prepared by:
AR/MPC/MMH Document No. CR/E02/022 Issue Date: 27/07/05
Approved by: NSC
Page 110 of 137
The Bureau proposes to make allowance for exceptional events in the case of the following indicators (only):
• Water Quality;
• Availability (electricity transmission) or Number of Interruptions (electricity distribution); and
• Energy Lost (electricity transmission) or Customer Minutes Lost (electricity distribution).
Exceptional events will not be applicable to any other indicator.
11.6.2 Performance Audit and Technical Assessor�s Statement
Some of the PC3 Category A indicators are of a more technical nature than previously. The companies will therefore be required to commission a statement by a suitably-qualified independent organisation approved by the Bureau (to be termed �Technical Assessor�), verifying the accuracy of the data. This is similar to the concept of �Reporters� used by Ofwat to confirm the accuracy of (principally) technical data submitted by water and sewerage companies in England and Wales. Other overseas� regulators use similar methods. However, the overall PCR will still need to be signed off by the licensee�s auditors (presently Ernst & Young), cross-referencing the Technical Assessor�s statements where necessary.
Technical Assessors will be expected to be consulting engineers. They will be required to be independent of the licensee (ie, no conflict of interest) and will be asked to examine the AIS and the non-financial elements of the information that companies submit to the Bureau in the PCRs. In relation to the technical PIS indicators, they will be asked to assess whether the companies have systems in place to collect and record accurately the information required by the Bureau and to confirm the data submitted by licensees. They will also be asked to confirm any exclusions that have been made for �exceptional events�. The Technical Assessor�s professional opinion on the above matters will be required to be presented in a formal report to the Bureau and the licensee�s auditors to accompany the PCR. In the case of the AIS, the Technical Assessors will be asked to expose, examine and challenge all material assumptions, again in the form of a formal report.
The role of Technical Assessors will be defined within the proposed licence modifications that will accompany the Final Proposals. While appointed by the licensees, the Technical Assessor�s primary duty of care will be to the Bureau, with the primary objective of assisting the Bureau to fulfill its statutory duties. The Bureau may issue additional guidance to the Technical Assessors and auditors concerning their respective roles, if necessary.
The companies should provide their annual performance data for each year for all Category A indicators by the end of first quarter of the following year, as part of the audited PCR. The related adjustments to MARs via the Q terms will be made in the year following the year in which the due dates for the said PCRs fall. That is, the performance in 2007 will be reported in 2008 and rewarded/penalised via the Q term in 2009, in line with the design of the existing PIS.

Title: 2005 Price Controls Review � Draft Proposals Issue No.: 1 Rev (0) Prepared by:
AR/MPC/MMH Document No. CR/E02/022 Issue Date: 27/07/05
Approved by: NSC
Page 111 of 137
Performance in 2006 on the new Category A indicators shall not be subject to a reward or penalty. However, where the performance target for each year is based on the previous year�s performance, there will be a requirement for the companies in 2007 to provide audited data for performance in 2006 as part of the PCRs to be delivered on 31 March 2007, so as to determine the target benchmark for 2007 performance. In order to maintain the integrity of the PIS, the Bureau will reserve the right to direct an adjustment of the targets for 2007 in the case of exceptionally poor performance in 2006 on new Category A indicators, but does not expect to need to exercise this option.
11.7 Operation of PIS for Category A Indicators for PC3
As previously suggested, these Draft Proposals are based on the same scheme of operation for timeliness-related Category A indicators as applies for the last year of the PC2 scheme. However, introduction of new Category A indicators requires some modifications, as suggested below:
The term Qt, the performance adjustment for year t, is calculated in AED terms as follows:
Qt = Q1t + Q2t + Q3t +� + QNt
where Q1t �. QNt are the revenue adjustments in respect of the Category A indicators 1, 2, �., N, respectively. The following sub-sections describe the Bureau�s proposed formulae to determine the Q terms for various Category A indicators for the PC3 period. These formulae are structured so that the Q term will automatically take a positive sign if a reward is required (i.e. actual performance is better than the target) and a negative sign if a penalty is required (i.e. actual performance is below the target).
11.7.1 Q Terms for Timeliness Category A Indicators
For audited accounts, audited PCRs and Annual Information Submission (AIS) indicators:
• For any delay beyond the target date in any year, the company will receive a penalty calculated as follows:
Q Term = - Incentive Rate × Number of months of delay from target date
• For any submission on or before the target date in any year, the company will receive a reward calculated as follows:
Q Term = 6 × Incentive Rate
• In contrast to the existing PIS, there will not be any 15 days �grace period� for PC3 on top of the target dates. The number of months shall be rounded up to whole calendar months. That is, the submission will effectively be treated as having been received on the last day of the month in which it was received.
• As for the existing PIS, the maximum delay in any timeliness related Category A indicator will be capped at the penalty that would be incurred if the statement is submitted on the

Title: 2005 Price Controls Review � Draft Proposals Issue No.: 1 Rev (0) Prepared by:
AR/MPC/MMH Document No. CR/E02/022 Issue Date: 27/07/05
Approved by: NSC
Page 112 of 137
target date for the same indicator for the following year. Such a cap is required in order to finalise the Q terms for these indicators in a timely manner.
For the PC3 period, this effectively means the maximum penalty for a timeliness indicator will be capped by a delay of 12 months. That is, the maximum penalty will be:
Q Term = - 12 × Incentive Rate
There will be no cap on individual Q terms for any other indicator.
11.7.2 Q Terms for ADWEC�s Demand Forecasting Accuracy Indicators
• For ADWEC�s electricity gross peak demand forecasting accuracy indicator, the reward or penalty in any year will be calculated as follows:
Q Term = Incentive Rate × [100 � Absolute value of (Forecast demand � Actual demand)]
• For ADWEC�s water gross peak demand forecasting accuracy indicator, the reward or penalty in any year will be calculated as follows:
Q Term = Incentive Rate × [10 � Absolute value of (Forecast demand � Actual demand)]
These formulae mean the reward for ADWEC will increase as the difference between forecast and actual peak demands decreases below the target error (100 MW for electricity and 10 MGD for water) and the penalty will increase as such difference increases above the target error. Each 1 MW of difference will accrue a reward or penalty, as the case may be, of AED 1,000 and each 1 MGD of difference will result in a reward or penalty of AED 6,000. The reward or penalty will be zero if such a difference is precisely equal to the target error.
11.7.3 Q Terms for Water Quality Indicators
For the water quality indicators:
• If the business does not achieve 95% or more compliance in a year, it will be subject to a penalty calculated as follows:
Q Term = - Incentive Rate × [1- (No. of samples passed tests / No. of samples required to be taken)] x 100
• However, there will be no penalty if performance improves by 10% or more on the previous year, even if compliance is less than 95%.
• If the business fully complies (100%) with the Water Quality Regulations in a year, it will receive a reward calculated as follows:
Q Term = 50 x Incentive Rate
For example, if AADC�s water business is required pursuant to the Water Quality Regulations to take 100,000 parameter tests in a year but only 75,000 pass the tests, the compliance is 75%. The

Title: 2005 Price Controls Review � Draft Proposals Issue No.: 1 Rev (0) Prepared by:
AR/MPC/MMH Document No. CR/E02/022 Issue Date: 27/07/05
Approved by: NSC
Page 113 of 137
non-compliance is thus 25% and (unless it has improved by 10% or more from the previous year) the company will be subject to a penalty of AED 750,000 (that is, incentive rate of AED 30,000 times non-compliance of 25).
11.7.4 Q Terms for Availability, Number of Interruptions, Energy Lost and CML
For these indicators for electricity transmission and distribution businesses of AADC, ADDC and TRANSCO, the penalty or reward in a year will be calculated as follows:
Q Term = Incentive Rate × [(Target performance � Actual performance)/ Target Performance] x 100
This formula means that, for example, if ADDC�s business records 9 interruptions in a year compared to a target of 10 interruptions (that is, the actual performance is 10% better than the target), it will receive a bonus of AED 3,300,000 (that is, incentive rate of AED 330,000 per 1% times 10% performance improvement) for that year.
Similarly, if TRANSCO�s business records 11 GWh of energy lost in a year as compared to a target of 10 GWh, it will see a penalty of AED 4,000,000 for that year.
11.7.5 Q Terms for existing Category A Indicators for 2006
The present licences already set out the Q terms in relation to the existing Category A indicators for the 2006 formula year. The licence modification which is required to give effect to the PC3 controls will need to continue with the Q terms agreed at the last review for 2006, and to set out the incentive rates and Q term mechanisms for 2007 onwards. However, the introduction at this review of separate price controls for the water and electricity businesses of ADWEC, and for the distribution and supply businesses of AADC and ADDC, means the incentive rates and Q terms agreed at the last review need to be allocated appropriately to these separate businesses for 2006.
The Bureau�s proposed allocations are set out in Table 11.6 below (TRANSCO is unaffected) based on the corresponding ratios for the PC3 incentive rates:
Table 11.6: Incentive Rates for Existing Category A Indicators for 2006 - Draft Proposals
Business Audited Accounts Timeliness Audited PCR Timeliness
(AED / month) (AED / month) AADC Electricity Distribution 525,000 525,000 AADC Electricity Supply 80,000 80,000 AADC Water Distribution 217,000 217,000 AADC Water Supply 20,000 20,000 ADDC Electricity Distribution 1,051,000 1,051,000 ADDC Electricity Supply 85,000 85,000 ADDC Water Distribution 440,000 440,000 ADDC Water Supply 65,000 65,000 ADWEC Electricity 11,000 11,000 ADWEC Water 7,000 7,000

Title: 2005 Price Controls Review � Draft Proposals Issue No.: 1 Rev (0) Prepared by:
AR/MPC/MMH Document No. CR/E02/022 Issue Date: 27/07/05
Approved by: NSC
Page 114 of 137
11.8 Future Cap on Incentives for Category A Indicators
In carrying out its functions, the Bureau has a duty under Law Number 2 (Article 96) to take into account the need for licensees to finance and plan their businesses with a reasonable degree of assurance.
At the previous price control reviews, the Bureau therefore capped the total incentive and penalty for Category A under the PIS for each year at 2% of MAR (5% of MAR for RASCO) in relation to their �own costs� (i.e. excluding pass-through items). This was in addition to the caps that at present apply separately to individual Category A performance indicators.
The First Consultation Paper suggested that, to accommodate an increase in the number of Category A indicators and/or to provide stronger incentives for improved performance, the present annual caps on the term �Q� may need to be increased to say 5% or 10% of MAR in respect of companies� own costs. The First Consultation Paper indicated that the experience with past operation of the scheme should allow the cap to be increased for all companies at this review.
In their responses to the First Consultation Paper, while AADC, ADDC and ADWEC proposed retention of the 2% cap on the Q term for PC3, TRANSCO cautiously supported an increase in the cap.
The Second Consultation Paper indicated that the 2% cap may remain appropriate for PC3 only if just the existing two Category A indicators are maintained. However, the expected significant increase in the number of Category A indicators at this review may justify a higher cap of up to 5% for PC3. This range is similar to the 4% limit on penalties for performance adopted by the UK energy regulator, Ofgem, in its recent determination for the electricity distribution companies.
The respondents to the Second Consultation Paper generally reiterated their previous position. Taking into account the concerns of respondents in combination with the significant increase in the number of Category A indicators, and the importance of providing strong incentives, the Bureau has adopted a cap of 4% on the Q term for all businesses in these Draft Proposals for PC3. Although the cap is increased, the increased number of indicators means that the risk from poor performance on any given indicator is diversified.
11.9 Future Category B Indicators
11.9.1 Retention of Existing Concept
In general, the respondents to the Second Consultation Paper, while supporting the continuation of Category B indicators, argued against the possibility of financial adjustments at the next review for performance on Category B. AADC, ADDC and TRANSCO�s arguments were mainly based on the lack of clarity on the definitions and the subjective nature of assessment. AADC also argued that reporting on �regulatory specific� indicators may require additional funding.

Title: 2005 Price Controls Review � Draft Proposals Issue No.: 1 Rev (0) Prepared by:
AR/MPC/MMH Document No. CR/E02/022 Issue Date: 27/07/05
Approved by: NSC
Page 115 of 137
While the Bureau agrees that the Category B indicators do not fully meet the objective criteria established for Category A, this is precisely the distinction between the two categories � otherwise these indicators would be in Category A. Nevertheless, to address respondents� concerns, and in recognition that there is not a major extension of the Category B scheme, the Bureau proposes to retain the cap on the overall Category B adjustment at 2% of MARs, the same it used for PC2.
11.9.2 Category B Indicators � Draft Proposals
The Second Consultation Paper suggested a number of Category B indicators for PC3. It highlighted that the Bureau is presently working with the licensees (outside of the price controls review) to develop a number of Key Performance Indicators (KPIs) across various aspects of each licensee�s technical performance. Keeping in view the ongoing development of companies� technical and network performance indicators as a separate workstream, the paper suggested splitting Category B indicators for AADC, ADDC and TRANSCO between two groups:
(i) all technical- and network-related performance indicators under KPIs to be agreed between the Bureau and the respective companies outside of this review (�Technical KPIs�); and
(ii) other economic and information-related indicators.
No respondent to the Second Consultation Paper suggested any precise change in the proposed list of Category B indicators. The Bureau has therefore retained these Category B indicators for the Draft Proposals, but has now also separately identified Meter Reading as an indicator for the distribution companies (supply businesses).
The proposed Category B indicators for the PC3 period are listed in the following table:
Table 11.7 Category B Performance Indicators for PC3 � Draft Proposals
S. No. ADDC/AADC ADWEC TRANSCO
1. Technical KPIs Generation Security Standard Technical KPIs
2. Customer Satisfaction Desalination Security Standard Settlement Data Accuracy and Timeliness
3. Interim P&L Account Timeliness
Interim P&L Account Timeliness
Planning Data Accuracy and Timeliness
4. Meter Reading Seven-Year Planning Statement Timeliness
Interim P&L Account Timeliness
5. BST Timeliness Five-Year Planning Statement Timeliness
6. Economic Purchase Indicator Statement of Connection and Use of System Charges Timeliness
7. PWPA Timeliness Economic Despatch

Title: 2005 Price Controls Review � Draft Proposals Issue No.: 1 Rev (0) Prepared by:
AR/MPC/MMH Document No. CR/E02/022 Issue Date: 27/07/05
Approved by: NSC
Page 116 of 137
Appendices A.1 � A.10: Updating RAV
Appendix A.1: AADC Electricity Distribution � Updating RAV
Line No.
UAE CPI Assumptions 1998 1999 2000 2001 2002 2003 2004 20051 Historical CPI (1995 = 100) - end year value 106.90 109.20 110.702 Historical CPI (2000 = 100) - end year value 100.00 102.80 105.80 109.103 Historical CPI Inflation 2.15% 1.37% 2.80% 2.92% 3.12%4 Forecast CPI Inflation 3.00% 3.00%5 CPI (2000 = 100) used in calculations 96.57 98.64 100.00 102.80 105.80 109.10 112.37 115.74
Inputs 1999 2000 2001 20026 Provisional PC1 capex allowed at PC2 AEDm, 1999 prices 186.59 188.17 187.76 176.00 7 Actual PC1 capex AEDm, nominal prices 132.60 290.42 276.90 165.58 8 Applied capex efficiency factor % 84.00%9 Initial Opening 2006 RAV (with provisional PC1 and PC2 capex) AEDm, 2003 p 2,458.59
10 Depreciation on Opening 2003 RAV AEDm, 2003 p 110.59 11 Depreciation on provisional capex for 2003-2005 AEDm, 2003 p 20.41 12 Depreciation on Initial Opening 2006 RAV AEDm, 2003 p 131.00 13 Assumed average asset life for new investment years 3014 Cost of capital (real) % 6.00%
Calculation of Additional Efficient PC1 Capex to be allowed at this Review 1999 2000 2001 200215 Actual PC1 capex AEDm, nominal prices 132.60 290.42 276.90 165.58 16 Applied capex efficiency factor % 84.00%17 Efficient PC1 capex AEDm, nominal prices 111.38 243.95 232.60 139.09 18 Efficient PC1 capex AEDm, 1999 prices 111.38 238.81 224.61 130.66 19 Provisional PC1 capex AEDm, 1999 prices 186.59 188.17 187.76 176.00 20 Additional efficient PC1 capex to be allowed at PC3 AEDm, 1999 prices (75.20) 50.65 36.86 -45.34
Calculation of Depreciation foregone on Additonal Efficient PC1 Capex 1999 2000 2001 2002 2003 2004 200521 Assumed average asset life for new investment years 3022 Additional efficient PC1 capex to be allowed at PC3 AEDm, 1999 prices -75.20 50.65 36.86 -45.3423 Depreciation on additional efficient PC1 capex AEDm, 1999 prices -1.25 -1.66 -0.20 -0.35 -1.10 -1.10 -1.1024 (half-year depreciation for the first year of each annual capex)
Calculation of Return on Capital foregone on Additional Efficient PC1 Capex 1999 2000 2001 2002 2003 2004 200525 Additional efficient PC1 capex - Opening value AEDm, 1999 prices 0.00 -73.95 -21.64 15.42 -29.57 -28.47 -27.3726 Additional efficient PC1 capex AEDm, 1999 prices -75.20 50.65 36.86 -45.3427 Depreciation on additional efficient PC1 capex AEDm, 1999 prices -1.25 -1.66 -0.20 -0.35 -1.10 -1.10 -1.1028 Additional efficient PC1 capex - Closing value AEDm, 1999 prices -73.95 -21.64 15.42 -29.57 -28.47 -27.37 -26.2729 Average of Opening and Closing values AEDm, 1999 prices -36.97 -47.79 -3.11 -7.07 -29.02 -27.92 -26.8230 Cost of capital (real) % 6.00%31 Return on capital foregone AEDm, 1999 prices -2.22 -2.87 -0.19 -0.42 -1.74 -1.68 -1.61
Calculation of Financing Costs foregone on Additional Efficient PC1 Capex 1999 2000 2001 2002 2003 2004 200532 Depreciation foregone AEDm, 1999 prices -1.25 -1.66 -0.20 -0.35 -1.10 -1.10 -1.1033 Return on capital foregone AEDm, 1999 prices -2.22 -2.87 -0.19 -0.42 -1.74 -1.68 -1.6134 Total financing costs foregone AEDm, 1999 prices -3.47 -4.53 -0.39 -0.77 -2.84 -2.78 -2.7135 Years from year mid point to 1 Jan 2006 AEDm, 1999 prices 6.50 5.50 4.50 3.50 2.50 1.50 0.5036 NPV @ 1 Jan 2006 of financing costs foregone AEDm, 1999 prices -5.07 -6.24 -0.51 -0.94 -3.29 -3.03 -2.7937 Accumulated NPV (@ 1 Jan 2006) of financing costs foregone AEDm, 1999 prices -21.87
AEDm, 2006 prices -26.22
Calculation of 2006 Opening RAV (including Financing Costs foregone on Additional Efficient PC1 Capex) 200638 Initial Opening 2006 RAV (with provisional PC1 and PC2 capex) AEDm, 2003 prices 2,458.59 39 Initial Opening 2006 RAV (with provisional PC1 and PC2 capex) AEDm, 1999 prices 2,244.04 40 Add: Additional efficient PC1 capex - Closing value @ 31 Dec 2005 AEDm, 1999 prices (26.27) 41 Add: Accumulated NPV (@ 1 Jan 2006) of financing costs foregone AEDm, 1999 prices (21.87) 42 Opening 2006 RAV including Financing Costs foregone on Efficient PC1 capex AEDm, 1999 prices 2,195.90 43 Opening 2006 RAV including Financing Costs foregone on Efficient PC1 capex AEDm, 2006 prices 2,631.97
Calculation of Total Depreciation (on Initial 2006 Opening RAV and Additional Efficient PC1 Capex) 200644 Depreciation on Initial Opening 2006 RAV AEDm, 2003 prices 131.00 45 Depreciation on Initial Opening 2006 RAV AEDm, 1999 prices 119.57 46 Depreciation on additional efficient PC1 capex AEDm, 1999 prices (1.10) 47 Total Depreciation for 2006 onwards AEDm, 1999 prices 118.47 48 Total Annual Depreciation for 2006 onwards AEDm, 2006 prices 142.00
Inputs 2006 2007 2008 200949 Provisional PC3 capex AEDm, 2006 prices 300.00 300.00 300.00 300.00 50 Assumed average asset life for new investment years 3051 Opening 2006 RAV including Financing Costs foregone on Efficient PC1 capex AEDm, 2006 prices 2,631.97 52 Depreciation on Opening 2006 RAV AEDm, 2006 prices 142.00 142.00 142.00 142.00
Calculations 2006 2007 2008 200950 Opening RAV AEDm, 2006 prices 2,631.97 2,784.98 2,927.98 3,060.98 51 Provisional PC3 capex AEDm, 2006 prices 300.00 300.00 300.00 300.00 52 Depreciation on Opening 2006 RAV AEDm, 2006 prices 142.00 142.00 142.00 142.00 53 Depreciation on provisional PC3 capex (half-year depreciation for first year) AEDm, 2006 prices 5.00 15.00 25.00 35.00 54 Total depreciation for PC3 AEDm, 2006 prices 147.00 157.00 167.00 177.00 55 Closing RAV AEDm, 2006 prices 2,784.98 2,927.98 3,060.98 3,183.99
Updating 2006 Opening RAV for PC1 Efficient Capex
Updating PC3 RAVs for PC3 Provisional Capex

Title: 2005 Price Controls Review � Draft Proposals Issue No.: 1 Rev (0) Prepared by:
AR/MPC/MMH Document No. CR/E02/022 Issue Date: 27/07/05
Approved by: NSC
Page 117 of 137
Appendix A.2: AADC Electricity Supply � Updating RAV
Line No.
UAE CPI Assumptions 1998 1999 2000 2001 2002 2003 2004 20051 Historical CPI (1995 = 100) - end year value 106.90 109.20 110.702 Historical CPI (2000 = 100) - end year value 100.00 102.80 105.80 109.103 Historical CPI Inflation 2.15% 1.37% 2.80% 2.92% 3.12%4 Forecast CPI Inflation 3.00% 3.00%5 CPI (2000 = 100) used in calculations 96.57 98.64 100.00 102.80 105.80 109.10 112.37 115.74
Inputs 1999 2000 2001 20026 Provisional PC1 capex allowed at PC2 AEDm, 1999 prices 2.09 0.51 0.92 12.68 7 Actual PC1 capex AEDm, nominal prices 1.49 0.79 1.36 11.93 8 Applied capex efficiency factor % 84.00%9 Initial Opening 2006 RAV (with provisional PC1 and PC2 capex) AEDm, 2003 p 20.58
10 Depreciation on Opening 2003 RAV AEDm, 2003 p 0.93 11 Depreciation on provisional capex for 2003-2005 AEDm, 2003 p 0.17 12 Depreciation on Initial Opening 2006 RAV AEDm, 2003 p 1.10 13 Assumed average asset life for new investment years 3014 Cost of capital (real) % 6.00%
Calculation of Additional Efficient PC1 Capex to be allowed at this Review 1999 2000 2001 200215 Actual PC1 capex AEDm, nominal prices 1.49 0.79 1.36 11.93 16 Applied capex efficiency factor % 84.00%17 Efficient PC1 capex AEDm, nominal prices 1.25 0.66 1.14 10.02 18 Efficient PC1 capex AEDm, 1999 prices 1.25 0.65 1.10 9.41 19 Provisional PC1 capex AEDm, 1999 prices 2.09 0.51 0.92 12.68 20 Additional efficient PC1 capex to be allowed at PC3 AEDm, 1999 prices (0.84) 0.14 0.18 -3.27
Calculation of Depreciation foregone on Additonal Efficient PC1 Capex 1999 2000 2001 2002 2003 2004 200521 Assumed average asset life for new investment years 3022 Additional efficient PC1 capex to be allowed at PC3 AEDm, 1999 prices -0.84 0.14 0.18 -3.2723 Depreciation on additional efficient PC1 capex AEDm, 1999 prices -0.01 -0.03 -0.02 -0.07 -0.13 -0.13 -0.1324 (half-year depreciation for the first year of each annual capex)
Calculation of Return on Capital foregone on Additional Efficient PC1 Capex 1999 2000 2001 2002 2003 2004 200525 Additional efficient PC1 capex - Opening value AEDm, 1999 prices 0.00 -0.83 -0.67 -0.46 -3.66 -3.53 -3.4126 Additional efficient PC1 capex AEDm, 1999 prices -0.84 0.14 0.18 -3.2727 Depreciation on additional efficient PC1 capex AEDm, 1999 prices -0.01 -0.03 -0.02 -0.07 -0.13 -0.13 -0.1328 Additional efficient PC1 capex - Closing value AEDm, 1999 prices -0.83 -0.67 -0.46 -3.66 -3.53 -3.41 -3.2829 Average of Opening and Closing values AEDm, 1999 prices -0.41 -0.75 -0.56 -2.06 -3.60 -3.47 -3.3430 Cost of capital (real) % 6.00%31 Return on capital foregone AEDm, 1999 prices -0.02 -0.04 -0.03 -0.12 -0.22 -0.21 -0.20
Calculation of Financing Costs foregone on Additional Efficient PC1 Capex 1999 2000 2001 2002 2003 2004 200532 Depreciation foregone AEDm, 1999 prices -0.01 -0.03 -0.02 -0.07 -0.13 -0.13 -0.1333 Return on capital foregone AEDm, 1999 prices -0.02 -0.04 -0.03 -0.12 -0.22 -0.21 -0.2034 Total financing costs foregone AEDm, 1999 prices -0.04 -0.07 -0.05 -0.20 -0.34 -0.33 -0.3335 Years from year mid point to 1 Jan 2006 AEDm, 1999 prices 6.50 5.50 4.50 3.50 2.50 1.50 0.5036 NPV @ 1 Jan 2006 of financing costs foregone AEDm, 1999 prices -0.06 -0.10 -0.07 -0.24 -0.40 -0.37 -0.3437 Accumulated NPV (@ 1 Jan 2006) of financing costs foregone AEDm, 1999 prices -1.56
AEDm, 2006 prices -1.87
Calculation of 2006 Opening RAV (including Financing Costs foregone on Additional Efficient PC1 Capex) 200638 Initial Opening 2006 RAV (with provisional PC1 and PC2 capex) AEDm, 2003 prices 20.58 39 Initial Opening 2006 RAV (with provisional PC1 and PC2 capex) AEDm, 1999 prices 18.78 40 Add: Additional efficient PC1 capex - Closing value @ 31 Dec 2005 AEDm, 1999 prices (3.28) 41 Add: Accumulated NPV (@ 1 Jan 2006) of financing costs foregone AEDm, 1999 prices (1.56) 42 Opening 2006 RAV including Financing Costs foregone on Efficient PC1 capex AEDm, 1999 prices 13.94 43 Opening 2006 RAV including Financing Costs foregone on Efficient PC1 capex AEDm, 2006 prices 16.71
Calculation of Total Depreciation (on Initial 2006 Opening RAV and Additional Efficient PC1 Capex) 200644 Depreciation on Initial Opening 2006 RAV AEDm, 2003 prices 1.10 45 Depreciation on Initial Opening 2006 RAV AEDm, 1999 prices 1.00 46 Depreciation on additional efficient PC1 capex AEDm, 1999 prices (0.13) 47 Total Depreciation for 2006 onwards AEDm, 1999 prices 0.87 48 Total Annual Depreciation for 2006 onwards AEDm, 2006 prices 1.05
Inputs 2006 2007 2008 200949 Provisional PC3 capex AEDm, 2006 prices 5.00 5.00 5.00 5.00 50 Assumed average asset life for new investment years 3051 Opening 2006 RAV including Financing Costs foregone on Efficient PC1 capex AEDm, 2006 prices 16.71 52 Depreciation on Opening 2006 RAV AEDm, 2006 prices 1.05 1.05 1.05 1.05
Calculations 2006 2007 2008 200950 Opening RAV AEDm, 2006 prices 16.71 20.58 24.28 27.81 51 Provisional PC3 capex AEDm, 2006 prices 5.00 5.00 5.00 5.00 52 Depreciation on Opening 2006 RAV AEDm, 2006 prices 1.05 1.05 1.05 1.05 53 Depreciation on provisional PC3 capex (half-year depreciation for first year) AEDm, 2006 prices 0.08 0.25 0.42 0.58 54 Total depreciation for PC3 AEDm, 2006 prices 1.13 1.30 1.46 1.63 55 Closing RAV AEDm, 2006 prices 20.58 24.28 27.81 31.18
Updating 2006 Opening RAV for PC1 Efficient Capex
Updating PC3 RAVs for PC3 Provisional Capex

Title: 2005 Price Controls Review � Draft Proposals Issue No.: 1 Rev (0) Prepared by:
AR/MPC/MMH Document No. CR/E02/022 Issue Date: 27/07/05
Approved by: NSC
Page 118 of 137
Appendix A.3: AADC Water Distribution � Updating RAV
Line No.
UAE CPI Assumptions 1998 1999 2000 2001 2002 2003 2004 20051 Historical CPI (1995 = 100) - end year value 106.90 109.20 110.702 Historical CPI (2000 = 100) - end year value 100.00 102.80 105.80 109.103 Historical CPI Inflation 2.15% 1.37% 2.80% 2.92% 3.12%4 Forecast CPI Inflation 3.00% 3.00%5 CPI (2000 = 100) used in calculations 96.57 98.64 100.00 102.80 105.80 109.10 112.37 115.74
Inputs 1999 2000 2001 20026 Provisional PC1 capex allowed at PC2 AEDm, 1999 prices 65.57 66.14 65.86 63.94 7 Actual PC1 capex AEDm, nominal prices 101.02 191.56 66.14 179.68 8 Applied capex efficiency factor % 84.00%9 Initial Opening 2006 RAV (with provisional PC1 and PC2 capex) AEDm, 2003 p 610.97
10 Depreciation on Opening 2003 RAV AEDm, 2003 p 13.48 11 Depreciation on provisional capex for 2003-2005 AEDm, 2003 p 7.16 12 Depreciation on Initial Opening 2006 RAV AEDm, 2003 p 20.63 13 Assumed average asset life for new investment years 3014 Cost of capital (real) % 6.00%
Calculation of Additional Efficient PC1 Capex to be allowed at this Review 1999 2000 2001 200215 Actual PC1 capex AEDm, nominal prices 101.02 191.56 66.14 179.68 16 Applied capex efficiency factor % 84.00%17 Efficient PC1 capex AEDm, nominal prices 84.85 160.91 55.56 150.93 18 Efficient PC1 capex AEDm, 1999 prices 84.85 157.52 53.65 141.78 19 Provisional PC1 capex AEDm, 1999 prices 65.57 66.14 65.86 63.94 20 Additional efficient PC1 capex to be allowed at PC3 AEDm, 1999 prices 19.28 91.38 (12.20) 77.84
Calculation of Depreciation foregone on Additonal Efficient PC1 Capex 1999 2000 2001 2002 2003 2004 200521 Assumed average asset life for new investment years 3022 Additional efficient PC1 capex to be allowed at PC3 AEDm, 1999 prices 19.28 91.38 -12.20 77.8423 Depreciation on additional efficient PC1 capex AEDm, 1999 prices 0.32 2.17 3.49 4.58 5.88 5.88 5.8824 (half-year depreciation for the first year of each annual capex)
Calculation of Return on Capital foregone on Additional Efficient PC1 Capex 1999 2000 2001 2002 2003 2004 200525 Additional efficient PC1 capex - Opening value AEDm, 1999 prices 0.00 18.96 108.17 92.49 165.75 159.87 153.9926 Additional efficient PC1 capex AEDm, 1999 prices 19.28 91.38 -12.20 77.8427 Depreciation on additional efficient PC1 capex AEDm, 1999 prices 0.32 2.17 3.49 4.58 5.88 5.88 5.8828 Additional efficient PC1 capex - Closing value AEDm, 1999 prices 18.96 108.17 92.49 165.75 159.87 153.99 148.1229 Average of Opening and Closing values AEDm, 1999 prices 9.48 63.57 100.33 129.12 162.81 156.93 151.0530 Cost of capital (real) % 6.00%31 Return on capital foregone AEDm, 1999 prices 0.57 3.81 6.02 7.75 9.77 9.42 9.06
Calculation of Financing Costs foregone on Additional Efficient PC1 Capex 1999 2000 2001 2002 2003 2004 200532 Depreciation foregone AEDm, 1999 prices 0.32 2.17 3.49 4.58 5.88 5.88 5.8833 Return on capital foregone AEDm, 1999 prices 0.57 3.81 6.02 7.75 9.77 9.42 9.0634 Total financing costs foregone AEDm, 1999 prices 0.89 5.98 9.51 12.33 15.64 15.29 14.9435 Years from year mid point to 1 Jan 2006 AEDm, 1999 prices 6.50 5.50 4.50 3.50 2.50 1.50 0.5036 NPV @ 1 Jan 2006 of financing costs foregone AEDm, 1999 prices 1.30 8.24 12.35 15.11 18.10 16.69 15.3837 Accumulated NPV (@ 1 Jan 2006) of financing costs foregone AEDm, 1999 prices 87.18
AEDm, 2006 prices 104.49
Calculation of 2006 Opening RAV (including Financing Costs foregone on Additional Efficient PC1 Capex) 200638 Initial Opening 2006 RAV (with provisional PC1 and PC2 capex) AEDm, 2003 prices 610.97 39 Initial Opening 2006 RAV (with provisional PC1 and PC2 capex) AEDm, 1999 prices 557.66 40 Add: Additional efficient PC1 capex - Closing value @ 31 Dec 2005 AEDm, 1999 prices 148.12 41 Add: Accumulated NPV (@ 1 Jan 2006) of financing costs foregone AEDm, 1999 prices 87.18 42 Opening 2006 RAV including Financing Costs foregone on Efficient PC1 capex AEDm, 1999 prices 792.95 43 Opening 2006 RAV including Financing Costs foregone on Efficient PC1 capex AEDm, 2006 prices 950.42
Calculation of Total Depreciation (on Initial 2006 Opening RAV and Additional Efficient PC1 Capex) 200644 Depreciation on Initial Opening 2006 RAV AEDm, 2003 prices 20.63 45 Depreciation on Initial Opening 2006 RAV AEDm, 1999 prices 18.83 46 Depreciation on additional efficient PC1 capex AEDm, 1999 prices 5.88 47 Total Depreciation for 2006 onwards AEDm, 1999 prices 24.71 48 Total Annual Depreciation for 2006 onwards AEDm, 2006 prices 29.62
Inputs 2006 2007 2008 200949 Provisional PC3 capex AEDm, 2006 prices 150.00 150.00 150.00 150.00 50 Assumed average asset life for new investment years 3051 Opening 2006 RAV including Financing Costs foregone on Efficient PC1 capex AEDm, 2006 prices 950.42 52 Depreciation on Opening 2006 RAV AEDm, 2006 prices 29.62 29.62 29.62 29.62
Calculations 2006 2007 2008 200950 Opening RAV AEDm, 2006 prices 950.42 1,068.30 1,181.18 1,289.07 51 Provisional PC3 capex AEDm, 2006 prices 150.00 150.00 150.00 150.00 52 Depreciation on Opening 2006 RAV AEDm, 2006 prices 29.62 29.62 29.62 29.62 53 Depreciation on provisional PC3 capex (half-year depreciation for first year) AEDm, 2006 prices 2.50 7.50 12.50 17.50 54 Total depreciation for PC3 AEDm, 2006 prices 32.12 37.12 42.12 47.12 55 Closing RAV AEDm, 2006 prices 1,068.30 1,181.18 1,289.07 1,391.95
Updating 2006 Opening RAV for PC1 Efficient Capex
Updating PC3 RAVs for PC3 Provisional Capex
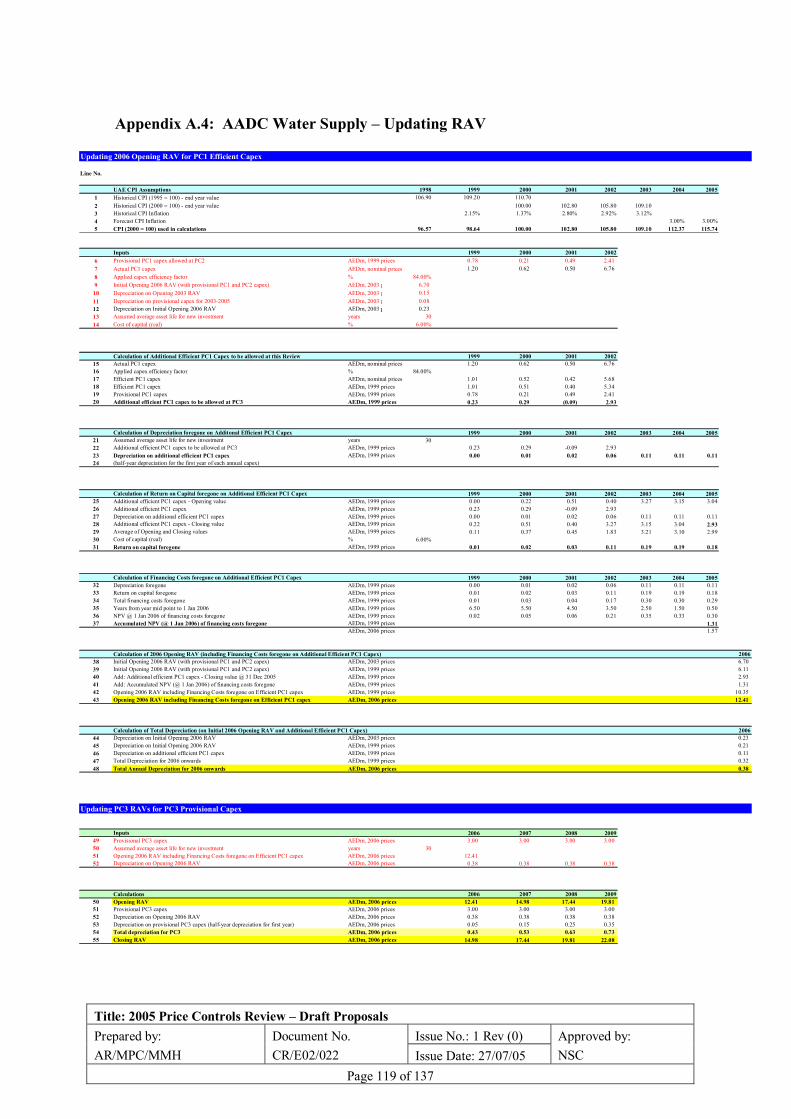
Title: 2005 Price Controls Review � Draft Proposals Issue No.: 1 Rev (0) Prepared by:
AR/MPC/MMH Document No. CR/E02/022 Issue Date: 27/07/05
Approved by: NSC
Page 119 of 137
Appendix A.4: AADC Water Supply � Updating RAV
Line No.
UAE CPI Assumptions 1998 1999 2000 2001 2002 2003 2004 20051 Historical CPI (1995 = 100) - end year value 106.90 109.20 110.702 Historical CPI (2000 = 100) - end year value 100.00 102.80 105.80 109.103 Historical CPI Inflation 2.15% 1.37% 2.80% 2.92% 3.12%4 Forecast CPI Inflation 3.00% 3.00%5 CPI (2000 = 100) used in calculations 96.57 98.64 100.00 102.80 105.80 109.10 112.37 115.74
Inputs 1999 2000 2001 20026 Provisional PC1 capex allowed at PC2 AEDm, 1999 prices 0.78 0.21 0.49 2.41 7 Actual PC1 capex AEDm, nominal prices 1.20 0.62 0.50 6.76 8 Applied capex efficiency factor % 84.00%9 Initial Opening 2006 RAV (with provisional PC1 and PC2 capex) AEDm, 2003 p 6.70
10 Depreciation on Opening 2003 RAV AEDm, 2003 p 0.15 11 Depreciation on provisional capex for 2003-2005 AEDm, 2003 p 0.08 12 Depreciation on Initial Opening 2006 RAV AEDm, 2003 p 0.23 13 Assumed average asset life for new investment years 3014 Cost of capital (real) % 6.00%
Calculation of Additional Efficient PC1 Capex to be allowed at this Review 1999 2000 2001 200215 Actual PC1 capex AEDm, nominal prices 1.20 0.62 0.50 6.76 16 Applied capex efficiency factor % 84.00%17 Efficient PC1 capex AEDm, nominal prices 1.01 0.52 0.42 5.68 18 Efficient PC1 capex AEDm, 1999 prices 1.01 0.51 0.40 5.34 19 Provisional PC1 capex AEDm, 1999 prices 0.78 0.21 0.49 2.41 20 Additional efficient PC1 capex to be allowed at PC3 AEDm, 1999 prices 0.23 0.29 (0.09) 2.93
Calculation of Depreciation foregone on Additonal Efficient PC1 Capex 1999 2000 2001 2002 2003 2004 200521 Assumed average asset life for new investment years 3022 Additional efficient PC1 capex to be allowed at PC3 AEDm, 1999 prices 0.23 0.29 -0.09 2.9323 Depreciation on additional efficient PC1 capex AEDm, 1999 prices 0.00 0.01 0.02 0.06 0.11 0.11 0.1124 (half-year depreciation for the first year of each annual capex)
Calculation of Return on Capital foregone on Additional Efficient PC1 Capex 1999 2000 2001 2002 2003 2004 200525 Additional efficient PC1 capex - Opening value AEDm, 1999 prices 0.00 0.22 0.51 0.40 3.27 3.15 3.0426 Additional efficient PC1 capex AEDm, 1999 prices 0.23 0.29 -0.09 2.9327 Depreciation on additional efficient PC1 capex AEDm, 1999 prices 0.00 0.01 0.02 0.06 0.11 0.11 0.1128 Additional efficient PC1 capex - Closing value AEDm, 1999 prices 0.22 0.51 0.40 3.27 3.15 3.04 2.9329 Average of Opening and Closing values AEDm, 1999 prices 0.11 0.37 0.45 1.83 3.21 3.10 2.9930 Cost of capital (real) % 6.00%31 Return on capital foregone AEDm, 1999 prices 0.01 0.02 0.03 0.11 0.19 0.19 0.18
Calculation of Financing Costs foregone on Additional Efficient PC1 Capex 1999 2000 2001 2002 2003 2004 200532 Depreciation foregone AEDm, 1999 prices 0.00 0.01 0.02 0.06 0.11 0.11 0.1133 Return on capital foregone AEDm, 1999 prices 0.01 0.02 0.03 0.11 0.19 0.19 0.1834 Total financing costs foregone AEDm, 1999 prices 0.01 0.03 0.04 0.17 0.30 0.30 0.2935 Years from year mid point to 1 Jan 2006 AEDm, 1999 prices 6.50 5.50 4.50 3.50 2.50 1.50 0.5036 NPV @ 1 Jan 2006 of financing costs foregone AEDm, 1999 prices 0.02 0.05 0.06 0.21 0.35 0.33 0.3037 Accumulated NPV (@ 1 Jan 2006) of financing costs foregone AEDm, 1999 prices 1.31
AEDm, 2006 prices 1.57
Calculation of 2006 Opening RAV (including Financing Costs foregone on Additional Efficient PC1 Capex) 200638 Initial Opening 2006 RAV (with provisional PC1 and PC2 capex) AEDm, 2003 prices 6.70 39 Initial Opening 2006 RAV (with provisional PC1 and PC2 capex) AEDm, 1999 prices 6.11 40 Add: Additional efficient PC1 capex - Closing value @ 31 Dec 2005 AEDm, 1999 prices 2.93 41 Add: Accumulated NPV (@ 1 Jan 2006) of financing costs foregone AEDm, 1999 prices 1.31 42 Opening 2006 RAV including Financing Costs foregone on Efficient PC1 capex AEDm, 1999 prices 10.35 43 Opening 2006 RAV including Financing Costs foregone on Efficient PC1 capex AEDm, 2006 prices 12.41
Calculation of Total Depreciation (on Initial 2006 Opening RAV and Additional Efficient PC1 Capex) 200644 Depreciation on Initial Opening 2006 RAV AEDm, 2003 prices 0.23 45 Depreciation on Initial Opening 2006 RAV AEDm, 1999 prices 0.21 46 Depreciation on additional efficient PC1 capex AEDm, 1999 prices 0.11 47 Total Depreciation for 2006 onwards AEDm, 1999 prices 0.32 48 Total Annual Depreciation for 2006 onwards AEDm, 2006 prices 0.38
Inputs 2006 2007 2008 200949 Provisional PC3 capex AEDm, 2006 prices 3.00 3.00 3.00 3.00 50 Assumed average asset life for new investment years 3051 Opening 2006 RAV including Financing Costs foregone on Efficient PC1 capex AEDm, 2006 prices 12.41 52 Depreciation on Opening 2006 RAV AEDm, 2006 prices 0.38 0.38 0.38 0.38
Calculations 2006 2007 2008 200950 Opening RAV AEDm, 2006 prices 12.41 14.98 17.44 19.81 51 Provisional PC3 capex AEDm, 2006 prices 3.00 3.00 3.00 3.00 52 Depreciation on Opening 2006 RAV AEDm, 2006 prices 0.38 0.38 0.38 0.38 53 Depreciation on provisional PC3 capex (half-year depreciation for first year) AEDm, 2006 prices 0.05 0.15 0.25 0.35 54 Total depreciation for PC3 AEDm, 2006 prices 0.43 0.53 0.63 0.73 55 Closing RAV AEDm, 2006 prices 14.98 17.44 19.81 22.08
Updating 2006 Opening RAV for PC1 Efficient Capex
Updating PC3 RAVs for PC3 Provisional Capex
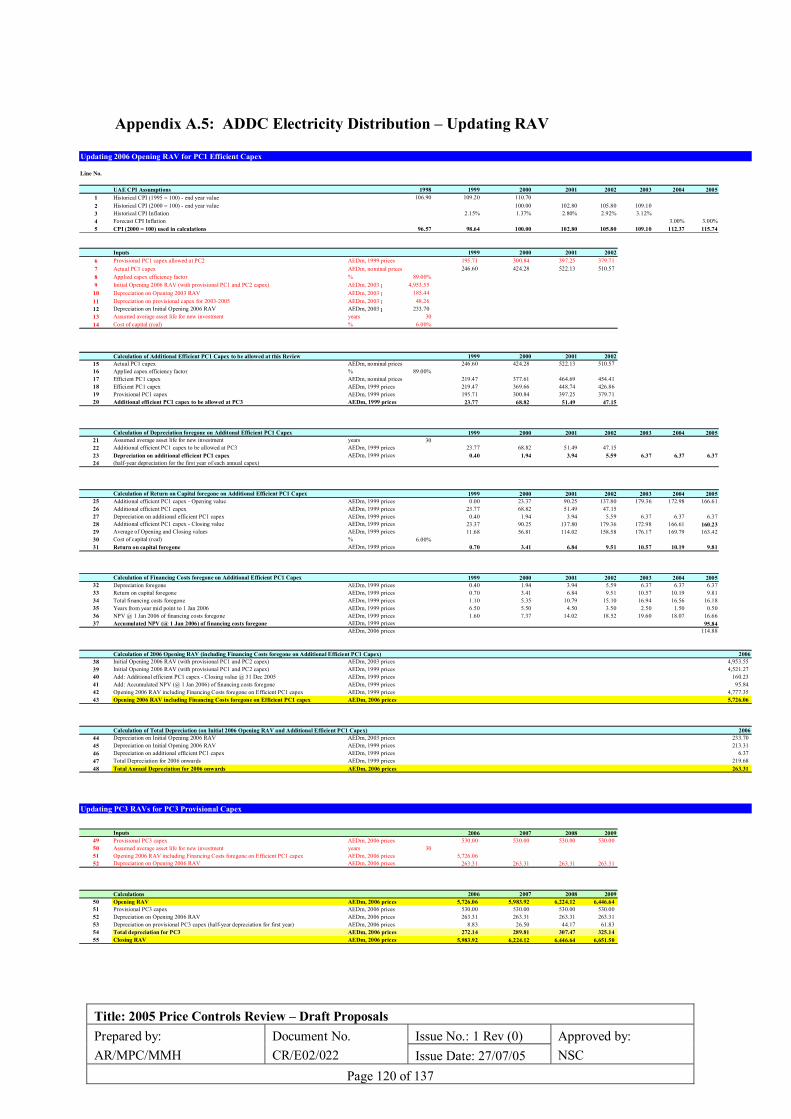
Title: 2005 Price Controls Review � Draft Proposals Issue No.: 1 Rev (0) Prepared by:
AR/MPC/MMH Document No. CR/E02/022 Issue Date: 27/07/05
Approved by: NSC
Page 120 of 137
Appendix A.5: ADDC Electricity Distribution � Updating RAV
Line No.
UAE CPI Assumptions 1998 1999 2000 2001 2002 2003 2004 20051 Historical CPI (1995 = 100) - end year value 106.90 109.20 110.702 Historical CPI (2000 = 100) - end year value 100.00 102.80 105.80 109.103 Historical CPI Inflation 2.15% 1.37% 2.80% 2.92% 3.12%4 Forecast CPI Inflation 3.00% 3.00%5 CPI (2000 = 100) used in calculations 96.57 98.64 100.00 102.80 105.80 109.10 112.37 115.74
Inputs 1999 2000 2001 20026 Provisional PC1 capex allowed at PC2 AEDm, 1999 prices 195.71 300.84 397.25 379.71 7 Actual PC1 capex AEDm, nominal prices 246.60 424.28 522.13 510.57 8 Applied capex efficiency factor % 89.00%9 Initial Opening 2006 RAV (with provisional PC1 and PC2 capex) AEDm, 2003 p 4,953.55
10 Depreciation on Opening 2003 RAV AEDm, 2003 p 185.44 11 Depreciation on provisional capex for 2003-2005 AEDm, 2003 p 48.26 12 Depreciation on Initial Opening 2006 RAV AEDm, 2003 p 233.70 13 Assumed average asset life for new investment years 3014 Cost of capital (real) % 6.00%
Calculation of Additional Efficient PC1 Capex to be allowed at this Review 1999 2000 2001 200215 Actual PC1 capex AEDm, nominal prices 246.60 424.28 522.13 510.57 16 Applied capex efficiency factor % 89.00%17 Efficient PC1 capex AEDm, nominal prices 219.47 377.61 464.69 454.41 18 Efficient PC1 capex AEDm, 1999 prices 219.47 369.66 448.74 426.86 19 Provisional PC1 capex AEDm, 1999 prices 195.71 300.84 397.25 379.71 20 Additional efficient PC1 capex to be allowed at PC3 AEDm, 1999 prices 23.77 68.82 51.49 47.15
Calculation of Depreciation foregone on Additonal Efficient PC1 Capex 1999 2000 2001 2002 2003 2004 200521 Assumed average asset life for new investment years 3022 Additional efficient PC1 capex to be allowed at PC3 AEDm, 1999 prices 23.77 68.82 51.49 47.1523 Depreciation on additional efficient PC1 capex AEDm, 1999 prices 0.40 1.94 3.94 5.59 6.37 6.37 6.3724 (half-year depreciation for the first year of each annual capex)
Calculation of Return on Capital foregone on Additional Efficient PC1 Capex 1999 2000 2001 2002 2003 2004 200525 Additional efficient PC1 capex - Opening value AEDm, 1999 prices 0.00 23.37 90.25 137.80 179.36 172.98 166.6126 Additional efficient PC1 capex AEDm, 1999 prices 23.77 68.82 51.49 47.1527 Depreciation on additional efficient PC1 capex AEDm, 1999 prices 0.40 1.94 3.94 5.59 6.37 6.37 6.3728 Additional efficient PC1 capex - Closing value AEDm, 1999 prices 23.37 90.25 137.80 179.36 172.98 166.61 160.2329 Average of Opening and Closing values AEDm, 1999 prices 11.68 56.81 114.02 158.58 176.17 169.79 163.4230 Cost of capital (real) % 6.00%31 Return on capital foregone AEDm, 1999 prices 0.70 3.41 6.84 9.51 10.57 10.19 9.81
Calculation of Financing Costs foregone on Additional Efficient PC1 Capex 1999 2000 2001 2002 2003 2004 200532 Depreciation foregone AEDm, 1999 prices 0.40 1.94 3.94 5.59 6.37 6.37 6.3733 Return on capital foregone AEDm, 1999 prices 0.70 3.41 6.84 9.51 10.57 10.19 9.8134 Total financing costs foregone AEDm, 1999 prices 1.10 5.35 10.79 15.10 16.94 16.56 16.1835 Years from year mid point to 1 Jan 2006 AEDm, 1999 prices 6.50 5.50 4.50 3.50 2.50 1.50 0.5036 NPV @ 1 Jan 2006 of financing costs foregone AEDm, 1999 prices 1.60 7.37 14.02 18.52 19.60 18.07 16.6637 Accumulated NPV (@ 1 Jan 2006) of financing costs foregone AEDm, 1999 prices 95.84
AEDm, 2006 prices 114.88
Calculation of 2006 Opening RAV (including Financing Costs foregone on Additional Efficient PC1 Capex) 200638 Initial Opening 2006 RAV (with provisional PC1 and PC2 capex) AEDm, 2003 prices 4,953.55 39 Initial Opening 2006 RAV (with provisional PC1 and PC2 capex) AEDm, 1999 prices 4,521.27 40 Add: Additional efficient PC1 capex - Closing value @ 31 Dec 2005 AEDm, 1999 prices 160.23 41 Add: Accumulated NPV (@ 1 Jan 2006) of financing costs foregone AEDm, 1999 prices 95.84 42 Opening 2006 RAV including Financing Costs foregone on Efficient PC1 capex AEDm, 1999 prices 4,777.35 43 Opening 2006 RAV including Financing Costs foregone on Efficient PC1 capex AEDm, 2006 prices 5,726.06
Calculation of Total Depreciation (on Initial 2006 Opening RAV and Additional Efficient PC1 Capex) 200644 Depreciation on Initial Opening 2006 RAV AEDm, 2003 prices 233.70 45 Depreciation on Initial Opening 2006 RAV AEDm, 1999 prices 213.31 46 Depreciation on additional efficient PC1 capex AEDm, 1999 prices 6.37 47 Total Depreciation for 2006 onwards AEDm, 1999 prices 219.68 48 Total Annual Depreciation for 2006 onwards AEDm, 2006 prices 263.31
Inputs 2006 2007 2008 200949 Provisional PC3 capex AEDm, 2006 prices 530.00 530.00 530.00 530.00 50 Assumed average asset life for new investment years 3051 Opening 2006 RAV including Financing Costs foregone on Efficient PC1 capex AEDm, 2006 prices 5,726.06 52 Depreciation on Opening 2006 RAV AEDm, 2006 prices 263.31 263.31 263.31 263.31
Calculations 2006 2007 2008 200950 Opening RAV AEDm, 2006 prices 5,726.06 5,983.92 6,224.12 6,446.64 51 Provisional PC3 capex AEDm, 2006 prices 530.00 530.00 530.00 530.00 52 Depreciation on Opening 2006 RAV AEDm, 2006 prices 263.31 263.31 263.31 263.31 53 Depreciation on provisional PC3 capex (half-year depreciation for first year) AEDm, 2006 prices 8.83 26.50 44.17 61.83 54 Total depreciation for PC3 AEDm, 2006 prices 272.14 289.81 307.47 325.14 55 Closing RAV AEDm, 2006 prices 5,983.92 6,224.12 6,446.64 6,651.50
Updating 2006 Opening RAV for PC1 Efficient Capex
Updating PC3 RAVs for PC3 Provisional Capex

Title: 2005 Price Controls Review � Draft Proposals Issue No.: 1 Rev (0) Prepared by:
AR/MPC/MMH Document No. CR/E02/022 Issue Date: 27/07/05
Approved by: NSC
Page 121 of 137
Appendix A.6: ADDC Electricity Supply � Updating RAV
Line No.
UAE CPI Assumptions 1998 1999 2000 2001 2002 2003 2004 20051 Historical CPI (1995 = 100) - end year value 106.90 109.20 110.702 Historical CPI (2000 = 100) - end year value 100.00 102.80 105.80 109.103 Historical CPI Inflation 2.15% 1.37% 2.80% 2.92% 3.12%4 Forecast CPI Inflation 3.00% 3.00%5 CPI (2000 = 100) used in calculations 96.57 98.64 100.00 102.80 105.80 109.10 112.37 115.74
Inputs 1999 2000 2001 20026 Provisional PC1 capex allowed at PC2 AEDm, 1999 prices 0.80 0.02 1.09 10.18 7 Actual PC1 capex AEDm, nominal prices 1.01 0.03 1.44 13.68 8 Applied capex efficiency factor % 89.00%9 Initial Opening 2006 RAV (with provisional PC1 and PC2 capex) AEDm, 2003 p 27.97
10 Depreciation on Opening 2003 RAV AEDm, 2003 p 1.05 11 Depreciation on provisional capex for 2003-2005 AEDm, 2003 p 0.27 12 Depreciation on Initial Opening 2006 RAV AEDm, 2003 p 1.32 13 Assumed average asset life for new investment years 3014 Cost of capital (real) % 6.00%
Calculation of Additional Efficient PC1 Capex to be allowed at this Review 1999 2000 2001 200215 Actual PC1 capex AEDm, nominal prices 1.01 0.03 1.44 13.68 16 Applied capex efficiency factor % 89.00%17 Efficient PC1 capex AEDm, nominal prices 0.90 0.02 1.28 12.18 18 Efficient PC1 capex AEDm, 1999 prices 0.90 0.02 1.23 11.44 19 Provisional PC1 capex AEDm, 1999 prices 0.80 0.02 1.09 10.18 20 Additional efficient PC1 capex to be allowed at PC3 AEDm, 1999 prices 0.10 0.00 0.14 1.26
Calculation of Depreciation foregone on Additonal Efficient PC1 Capex 1999 2000 2001 2002 2003 2004 200521 Assumed average asset life for new investment years 3022 Additional efficient PC1 capex to be allowed at PC3 AEDm, 1999 prices 0.10 0.00 0.14 1.2623 Depreciation on additional efficient PC1 capex AEDm, 1999 prices 0.00 0.00 0.01 0.03 0.05 0.05 0.0524 (half-year depreciation for the first year of each annual capex)
Calculation of Return on Capital foregone on Additional Efficient PC1 Capex 1999 2000 2001 2002 2003 2004 200525 Additional efficient PC1 capex - Opening value AEDm, 1999 prices 0.00 0.10 0.10 0.23 1.47 1.42 1.3726 Additional efficient PC1 capex AEDm, 1999 prices 0.10 0.00 0.14 1.2627 Depreciation on additional efficient PC1 capex AEDm, 1999 prices 0.00 0.00 0.01 0.03 0.05 0.05 0.0528 Additional efficient PC1 capex - Closing value AEDm, 1999 prices 0.10 0.10 0.23 1.47 1.42 1.37 1.3229 Average of Opening and Closing values AEDm, 1999 prices 0.05 0.10 0.17 0.85 1.44 1.39 1.3430 Cost of capital (real) % 6.00%31 Return on capital foregone AEDm, 1999 prices 0.00 0.01 0.01 0.05 0.09 0.08 0.08
Calculation of Financing Costs foregone on Additional Efficient PC1 Capex 1999 2000 2001 2002 2003 2004 200532 Depreciation foregone AEDm, 1999 prices 0.00 0.00 0.01 0.03 0.05 0.05 0.0533 Return on capital foregone AEDm, 1999 prices 0.00 0.01 0.01 0.05 0.09 0.08 0.0834 Total financing costs foregone AEDm, 1999 prices 0.00 0.01 0.02 0.08 0.14 0.13 0.1335 Years from year mid point to 1 Jan 2006 AEDm, 1999 prices 6.50 5.50 4.50 3.50 2.50 1.50 0.5036 NPV @ 1 Jan 2006 of financing costs foregone AEDm, 1999 prices 0.01 0.01 0.02 0.10 0.16 0.15 0.1337 Accumulated NPV (@ 1 Jan 2006) of financing costs foregone AEDm, 1999 prices 0.58
AEDm, 2006 prices 0.69
Calculation of 2006 Opening RAV (including Financing Costs foregone on Additional Efficient PC1 Capex) 200638 Initial Opening 2006 RAV (with provisional PC1 and PC2 capex) AEDm, 2003 prices 27.97 39 Initial Opening 2006 RAV (with provisional PC1 and PC2 capex) AEDm, 1999 prices 25.53 40 Add: Additional efficient PC1 capex - Closing value @ 31 Dec 2005 AEDm, 1999 prices 1.32 41 Add: Accumulated NPV (@ 1 Jan 2006) of financing costs foregone AEDm, 1999 prices 0.58 42 Opening 2006 RAV including Financing Costs foregone on Efficient PC1 capex AEDm, 1999 prices 27.42 43 Opening 2006 RAV including Financing Costs foregone on Efficient PC1 capex AEDm, 2006 prices 32.87
Calculation of Total Depreciation (on Initial 2006 Opening RAV and Additional Efficient PC1 Capex) 200644 Depreciation on Initial Opening 2006 RAV AEDm, 2003 prices 1.32 45 Depreciation on Initial Opening 2006 RAV AEDm, 1999 prices 1.20 46 Depreciation on additional efficient PC1 capex AEDm, 1999 prices 0.05 47 Total Depreciation for 2006 onwards AEDm, 1999 prices 1.25 48 Total Annual Depreciation for 2006 onwards AEDm, 2006 prices 1.50
Inputs 2006 2007 2008 200949 Provisional PC3 capex AEDm, 2006 prices 6.00 6.00 6.00 6.00 50 Assumed average asset life for new investment years 3051 Opening 2006 RAV including Financing Costs foregone on Efficient PC1 capex AEDm, 2006 prices 32.87 52 Depreciation on Opening 2006 RAV AEDm, 2006 prices 1.50 1.50 1.50 1.50
Calculations 2006 2007 2008 200950 Opening RAV AEDm, 2006 prices 32.87 37.27 41.46 45.46 51 Provisional PC3 capex AEDm, 2006 prices 6.00 6.00 6.00 6.00 52 Depreciation on Opening 2006 RAV AEDm, 2006 prices 1.50 1.50 1.50 1.50 53 Depreciation on provisional PC3 capex (half-year depreciation for first year) AEDm, 2006 prices 0.10 0.30 0.50 0.70 54 Total depreciation for PC3 AEDm, 2006 prices 1.60 1.80 2.00 2.20 55 Closing RAV AEDm, 2006 prices 37.27 41.46 45.46 49.25
Updating 2006 Opening RAV for PC1 Efficient Capex
Updating PC3 RAVs for PC3 Provisional Capex

Title: 2005 Price Controls Review � Draft Proposals Issue No.: 1 Rev (0) Prepared by:
AR/MPC/MMH Document No. CR/E02/022 Issue Date: 27/07/05
Approved by: NSC
Page 122 of 137
Appendix A.7: ADDC Water Distribution � Updating RAV
Line No.
UAE CPI Assumptions 1998 1999 2000 2001 2002 2003 2004 20051 Historical CPI (1995 = 100) - end year value 106.90 109.20 110.702 Historical CPI (2000 = 100) - end year value 100.00 102.80 105.80 109.103 Historical CPI Inflation 2.15% 1.37% 2.80% 2.92% 3.12%4 Forecast CPI Inflation 3.00% 3.00%5 CPI (2000 = 100) used in calculations 96.57 98.64 100.00 102.80 105.80 109.10 112.37 115.74
Inputs 1999 2000 2001 20026 Provisional PC1 capex allowed at PC2 AEDm, 1999 prices 68.48 44.89 128.98 365.07 7 Actual PC1 capex AEDm, nominal prices 105.58 36.76 134.83 276.38 8 Applied capex efficiency factor % 89.00%9 Initial Opening 2006 RAV (with provisional PC1 and PC2 capex) AEDm, 2003 p 1,583.53
10 Depreciation on Opening 2003 RAV AEDm, 2003 p 82.63 11 Depreciation on provisional capex for 2003-2005 AEDm, 2003 p 15.72 12 Depreciation on Initial Opening 2006 RAV AEDm, 2003 p 98.35 13 Assumed average asset life for new investment years 3014 Cost of capital (real) % 6.00%
Calculation of Additional Efficient PC1 Capex to be allowed at this Review 1999 2000 2001 200215 Actual PC1 capex AEDm, nominal prices 105.58 36.76 134.83 276.38 16 Applied capex efficiency factor % 89.00%17 Efficient PC1 capex AEDm, nominal prices 93.96 32.72 120.00 245.98 18 Efficient PC1 capex AEDm, 1999 prices 93.96 32.03 115.88 231.07 19 Provisional PC1 capex AEDm, 1999 prices 68.48 44.89 128.98 365.07 20 Additional efficient PC1 capex to be allowed at PC3 AEDm, 1999 prices 25.49 (12.86) (13.10) -134.01
Calculation of Depreciation foregone on Additonal Efficient PC1 Capex 1999 2000 2001 2002 2003 2004 200521 Assumed average asset life for new investment years 3022 Additional efficient PC1 capex to be allowed at PC3 AEDm, 1999 prices 25.49 -12.86 -13.10 -134.0123 Depreciation on additional efficient PC1 capex AEDm, 1999 prices 0.42 0.64 0.20 -2.25 -4.48 -4.48 -4.4824 (half-year depreciation for the first year of each annual capex)
Calculation of Return on Capital foregone on Additional Efficient PC1 Capex 1999 2000 2001 2002 2003 2004 200525 Additional efficient PC1 capex - Opening value AEDm, 1999 prices 0.00 25.06 11.56 -1.74 -133.50 -129.02 -124.5426 Additional efficient PC1 capex AEDm, 1999 prices 25.49 -12.86 -13.10 -134.0127 Depreciation on additional efficient PC1 capex AEDm, 1999 prices 0.42 0.64 0.20 -2.25 -4.48 -4.48 -4.4828 Additional efficient PC1 capex - Closing value AEDm, 1999 prices 25.06 11.56 -1.74 -133.50 -129.02 -124.54 -120.0529 Average of Opening and Closing values AEDm, 1999 prices 12.53 18.31 4.91 -67.62 -131.26 -126.78 -122.2930 Cost of capital (real) % 6.00%31 Return on capital foregone AEDm, 1999 prices 0.75 1.10 0.29 -4.06 -7.88 -7.61 -7.34
Calculation of Financing Costs foregone on Additional Efficient PC1 Capex 1999 2000 2001 2002 2003 2004 200532 Depreciation foregone AEDm, 1999 prices 0.42 0.64 0.20 -2.25 -4.48 -4.48 -4.4833 Return on capital foregone AEDm, 1999 prices 0.75 1.10 0.29 -4.06 -7.88 -7.61 -7.3434 Total financing costs foregone AEDm, 1999 prices 1.18 1.73 0.50 -6.31 -12.36 -12.09 -11.8235 Years from year mid point to 1 Jan 2006 AEDm, 1999 prices 6.50 5.50 4.50 3.50 2.50 1.50 0.5036 NPV @ 1 Jan 2006 of financing costs foregone AEDm, 1999 prices 1.72 2.39 0.65 -7.73 -14.30 -13.19 -12.1737 Accumulated NPV (@ 1 Jan 2006) of financing costs foregone AEDm, 1999 prices -42.64
AEDm, 2006 prices -51.11
Calculation of 2006 Opening RAV (including Financing Costs foregone on Additional Efficient PC1 Capex) 200638 Initial Opening 2006 RAV (with provisional PC1 and PC2 capex) AEDm, 2003 prices 1,583.53 39 Initial Opening 2006 RAV (with provisional PC1 and PC2 capex) AEDm, 1999 prices 1,445.35 40 Add: Additional efficient PC1 capex - Closing value @ 31 Dec 2005 AEDm, 1999 prices (120.05) 41 Add: Accumulated NPV (@ 1 Jan 2006) of financing costs foregone AEDm, 1999 prices (42.64) 42 Opening 2006 RAV including Financing Costs foregone on Efficient PC1 capex AEDm, 1999 prices 1,282.65 43 Opening 2006 RAV including Financing Costs foregone on Efficient PC1 capex AEDm, 2006 prices 1,537.37
Calculation of Total Depreciation (on Initial 2006 Opening RAV and Additional Efficient PC1 Capex) 200644 Depreciation on Initial Opening 2006 RAV AEDm, 2003 prices 98.35 45 Depreciation on Initial Opening 2006 RAV AEDm, 1999 prices 89.77 46 Depreciation on additional efficient PC1 capex AEDm, 1999 prices (4.48) 47 Total Depreciation for 2006 onwards AEDm, 1999 prices 85.29 48 Total Annual Depreciation for 2006 onwards AEDm, 2006 prices 102.22
Inputs 2006 2007 2008 200949 Provisional PC3 capex AEDm, 2006 prices 310.00 310.00 310.00 310.00 50 Assumed average asset life for new investment years 3051 Opening 2006 RAV including Financing Costs foregone on Efficient PC1 capex AEDm, 2006 prices 1,537.37 52 Depreciation on Opening 2006 RAV AEDm, 2006 prices 102.22 102.22 102.22 102.22
Calculations 2006 2007 2008 200950 Opening RAV AEDm, 2006 prices 1,537.37 1,739.98 1,932.26 2,114.20 51 Provisional PC3 capex AEDm, 2006 prices 310.00 310.00 310.00 310.00 52 Depreciation on Opening 2006 RAV AEDm, 2006 prices 102.22 102.22 102.22 102.22 53 Depreciation on provisional PC3 capex (half-year depreciation for first year) AEDm, 2006 prices 5.17 15.50 25.83 36.17 54 Total depreciation for PC3 AEDm, 2006 prices 107.39 117.72 128.06 138.39 55 Closing RAV AEDm, 2006 prices 1,739.98 1,932.26 2,114.20 2,285.82
Updating 2006 Opening RAV for PC1 Efficient Capex
Updating PC3 RAVs for PC3 Provisional Capex

Title: 2005 Price Controls Review � Draft Proposals Issue No.: 1 Rev (0) Prepared by:
AR/MPC/MMH Document No. CR/E02/022 Issue Date: 27/07/05
Approved by: NSC
Page 123 of 137
Appendix A.8: ADDC Water Supply � Updating RAV
Line No.
UAE CPI Assumptions 1998 1999 2000 2001 2002 2003 2004 20051 Historical CPI (1995 = 100) - end year value 106.90 109.20 110.702 Historical CPI (2000 = 100) - end year value 100.00 102.80 105.80 109.103 Historical CPI Inflation 2.15% 1.37% 2.80% 2.92% 3.12%4 Forecast CPI Inflation 3.00% 3.00%5 CPI (2000 = 100) used in calculations 96.57 98.64 100.00 102.80 105.80 109.10 112.37 115.74
Inputs 1999 2000 2001 20026 Provisional PC1 capex allowed at PC2 AEDm, 1999 prices 0.63 0.03 1.49 15.63 7 Actual PC1 capex AEDm, nominal prices 0.97 0.03 1.56 11.84 8 Applied capex efficiency factor % 89.00%9 Initial Opening 2006 RAV (with provisional PC1 and PC2 capex) AEDm, 2003 p 19.64
10 Depreciation on Opening 2003 RAV AEDm, 2003 p 1.03 11 Depreciation on provisional capex for 2003-2005 AEDm, 2003 p 0.19 12 Depreciation on Initial Opening 2006 RAV AEDm, 2003 p 1.22 13 Assumed average asset life for new investment years 3014 Cost of capital (real) % 6.00%
Calculation of Additional Efficient PC1 Capex to be allowed at this Review 1999 2000 2001 200215 Actual PC1 capex AEDm, nominal prices 0.97 0.03 1.56 11.84 16 Applied capex efficiency factor % 89.00%17 Efficient PC1 capex AEDm, nominal prices 0.86 0.02 1.39 10.53 18 Efficient PC1 capex AEDm, 1999 prices 0.86 0.02 1.34 9.89 19 Provisional PC1 capex AEDm, 1999 prices 0.63 0.03 1.49 15.63 20 Additional efficient PC1 capex to be allowed at PC3 AEDm, 1999 prices 0.23 (0.01) (0.15) -5.74
Calculation of Depreciation foregone on Additonal Efficient PC1 Capex 1999 2000 2001 2002 2003 2004 200521 Assumed average asset life for new investment years 3022 Additional efficient PC1 capex to be allowed at PC3 AEDm, 1999 prices 0.23 -0.01 -0.15 -5.7423 Depreciation on additional efficient PC1 capex AEDm, 1999 prices 0.00 0.01 0.00 -0.09 -0.19 -0.19 -0.1924 (half-year depreciation for the first year of each annual capex)
Calculation of Return on Capital foregone on Additional Efficient PC1 Capex 1999 2000 2001 2002 2003 2004 200525 Additional efficient PC1 capex - Opening value AEDm, 1999 prices 0.00 0.23 0.21 0.06 -5.59 -5.40 -5.2126 Additional efficient PC1 capex AEDm, 1999 prices 0.23 -0.01 -0.15 -5.7427 Depreciation on additional efficient PC1 capex AEDm, 1999 prices 0.00 0.01 0.00 -0.09 -0.19 -0.19 -0.1928 Additional efficient PC1 capex - Closing value AEDm, 1999 prices 0.23 0.21 0.06 -5.59 -5.40 -5.21 -5.0229 Average of Opening and Closing values AEDm, 1999 prices 0.11 0.22 0.13 -2.77 -5.49 -5.31 -5.1230 Cost of capital (real) % 6.00%31 Return on capital foregone AEDm, 1999 prices 0.01 0.01 0.01 -0.17 -0.33 -0.32 -0.31
Calculation of Financing Costs foregone on Additional Efficient PC1 Capex 1999 2000 2001 2002 2003 2004 200532 Depreciation foregone AEDm, 1999 prices 0.00 0.01 0.00 -0.09 -0.19 -0.19 -0.1933 Return on capital foregone AEDm, 1999 prices 0.01 0.01 0.01 -0.17 -0.33 -0.32 -0.3134 Total financing costs foregone AEDm, 1999 prices 0.01 0.02 0.01 -0.26 -0.52 -0.51 -0.5035 Years from year mid point to 1 Jan 2006 AEDm, 1999 prices 6.50 5.50 4.50 3.50 2.50 1.50 0.5036 NPV @ 1 Jan 2006 of financing costs foregone AEDm, 1999 prices 0.02 0.03 0.02 -0.32 -0.60 -0.55 -0.5137 Accumulated NPV (@ 1 Jan 2006) of financing costs foregone AEDm, 1999 prices -1.92
AEDm, 2006 prices -2.30
Calculation of 2006 Opening RAV (including Financing Costs foregone on Additional Efficient PC1 Capex) 200638 Initial Opening 2006 RAV (with provisional PC1 and PC2 capex) AEDm, 2003 prices 19.64 39 Initial Opening 2006 RAV (with provisional PC1 and PC2 capex) AEDm, 1999 prices 17.93 40 Add: Additional efficient PC1 capex - Closing value @ 31 Dec 2005 AEDm, 1999 prices (5.02) 41 Add: Accumulated NPV (@ 1 Jan 2006) of financing costs foregone AEDm, 1999 prices (1.92) 42 Opening 2006 RAV including Financing Costs foregone on Efficient PC1 capex AEDm, 1999 prices 10.99 43 Opening 2006 RAV including Financing Costs foregone on Efficient PC1 capex AEDm, 2006 prices 13.17
Calculation of Total Depreciation (on Initial 2006 Opening RAV and Additional Efficient PC1 Capex) 200644 Depreciation on Initial Opening 2006 RAV AEDm, 2003 prices 1.22 45 Depreciation on Initial Opening 2006 RAV AEDm, 1999 prices 1.11 46 Depreciation on additional efficient PC1 capex AEDm, 1999 prices (0.19) 47 Total Depreciation for 2006 onwards AEDm, 1999 prices 0.92 48 Total Annual Depreciation for 2006 onwards AEDm, 2006 prices 1.11
Inputs 2006 2007 2008 200949 Provisional PC3 capex AEDm, 2006 prices 5.00 5.00 5.00 5.00 50 Assumed average asset life for new investment years 3051 Opening 2006 RAV including Financing Costs foregone on Efficient PC1 capex AEDm, 2006 prices 13.17 52 Depreciation on Opening 2006 RAV AEDm, 2006 prices 1.11 1.11 1.11 1.11
Calculations 2006 2007 2008 200950 Opening RAV AEDm, 2006 prices 13.17 16.98 20.62 24.09 51 Provisional PC3 capex AEDm, 2006 prices 5.00 5.00 5.00 5.00 52 Depreciation on Opening 2006 RAV AEDm, 2006 prices 1.11 1.11 1.11 1.11 53 Depreciation on provisional PC3 capex (half-year depreciation for first year) AEDm, 2006 prices 0.08 0.25 0.42 0.58 54 Total depreciation for PC3 AEDm, 2006 prices 1.19 1.36 1.53 1.69 55 Closing RAV AEDm, 2006 prices 16.98 20.62 24.09 27.40
Updating 2006 Opening RAV for PC1 Efficient Capex
Updating PC3 RAVs for PC3 Provisional Capex

Title: 2005 Price Controls Review � Draft Proposals Issue No.: 1 Rev (0) Prepared by:
AR/MPC/MMH Document No. CR/E02/022 Issue Date: 27/07/05
Approved by: NSC
Page 124 of 137
Appendix A.9: TRANSCO Electricity � Updating RAV
Line No.
UAE CPI Assumptions 1998 1999 2000 2001 2002 2003 2004 20051 Historical CPI (1995 = 100) - end year value 106.90 109.20 110.702 Historical CPI (2000 = 100) - end year value 100.00 102.80 105.80 109.103 Historical CPI Inflation 2.15% 1.37% 2.80% 2.92% 3.12%4 Forecast CPI Inflation 3.00% 3.00%5 CPI (2000 = 100) used in calculations 96.57 98.64 100.00 102.80 105.80 109.10 112.37 115.74
Inputs 1999 2000 2001 20026 Provisional PC1 capex allowed at PC2 AEDm, 1999 prices 344.17 533.79 795.29 1,222.50 7 Actual PC1 capex AEDm, nominal prices 493.22 824.30 1,103.26 968.60 8 Applied capex efficiency factor % 94.00%9 Initial Opening 2006 RAV (with provisional PC1 and PC2 capex) AEDm, 2003 p 7,626.55
10 Depreciation on Opening 2003 RAV AEDm, 2003 p 227.07 11 Depreciation on provisional capex for 2003-2005 AEDm, 2003 p 78.14 12 Depreciation on Initial Opening 2006 RAV AEDm, 2003 p 305.21 13 Assumed average asset life for new investment years 3014 Cost of capital (real) % 6.00%
Calculation of Additional Efficient PC1 Capex to be allowed at this Review 1999 2000 2001 200215 Actual PC1 capex AEDm, nominal prices 493.22 824.30 1,103.26 968.60 16 Applied capex efficiency factor % 94.00%17 Efficient PC1 capex AEDm, nominal prices 463.62 774.84 1,037.07 910.48 18 Efficient PC1 capex AEDm, 1999 prices 463.62 758.52 1,001.47 855.28 19 Provisional PC1 capex AEDm, 1999 prices 344.17 533.79 795.29 1,222.50 20 Additional efficient PC1 capex to be allowed at PC3 AEDm, 1999 prices 119.45 224.73 206.18 -367.22
Calculation of Depreciation foregone on Additonal Efficient PC1 Capex 1999 2000 2001 2002 2003 2004 200521 Assumed average asset life for new investment years 3022 Additional efficient PC1 capex to be allowed at PC3 AEDm, 1999 prices 119.45 224.73 206.18 -367.2223 Depreciation on additional efficient PC1 capex AEDm, 1999 prices 1.99 7.73 14.91 12.23 6.10 6.10 6.1024 (half-year depreciation for the first year of each annual capex)
Calculation of Return on Capital foregone on Additional Efficient PC1 Capex 1999 2000 2001 2002 2003 2004 200525 Additional efficient PC1 capex - Opening value AEDm, 1999 prices 0.00 117.46 334.46 525.73 146.29 140.18 134.0826 Additional efficient PC1 capex AEDm, 1999 prices 119.45 224.73 206.18 -367.2227 Depreciation on additional efficient PC1 capex AEDm, 1999 prices 1.99 7.73 14.91 12.23 6.10 6.10 6.1028 Additional efficient PC1 capex - Closing value AEDm, 1999 prices 117.46 334.46 525.73 146.29 140.18 134.08 127.9729 Average of Opening and Closing values AEDm, 1999 prices 58.73 225.96 430.10 336.01 143.24 137.13 131.0330 Cost of capital (real) % 6.00%31 Return on capital foregone AEDm, 1999 prices 3.52 13.56 25.81 20.16 8.59 8.23 7.86
Calculation of Financing Costs foregone on Additional Efficient PC1 Capex 1999 2000 2001 2002 2003 2004 200532 Depreciation foregone AEDm, 1999 prices 1.99 7.73 14.91 12.23 6.10 6.10 6.1033 Return on capital foregone AEDm, 1999 prices 3.52 13.56 25.81 20.16 8.59 8.23 7.8634 Total financing costs foregone AEDm, 1999 prices 5.51 21.29 40.71 32.39 14.70 14.33 13.9735 Years from year mid point to 1 Jan 2006 AEDm, 1999 prices 6.50 5.50 4.50 3.50 2.50 1.50 0.5036 NPV @ 1 Jan 2006 of financing costs foregone AEDm, 1999 prices 8.05 29.33 52.92 39.71 17.00 15.64 14.3837 Accumulated NPV (@ 1 Jan 2006) of financing costs foregone AEDm, 1999 prices 177.04
AEDm, 2006 prices 212.20
Calculation of 2006 Opening RAV (including Financing Costs foregone on Additional Efficient PC1 Capex) 200638 Initial Opening 2006 RAV (with provisional PC1 and PC2 capex) AEDm, 2003 prices 7,626.55 39 Initial Opening 2006 RAV (with provisional PC1 and PC2 capex) AEDm, 1999 prices 6,961.01 40 Add: Additional efficient PC1 capex - Closing value @ 31 Dec 2005 AEDm, 1999 prices 127.97 41 Add: Accumulated NPV (@ 1 Jan 2006) of financing costs foregone AEDm, 1999 prices 177.04 42 Opening 2006 RAV including Financing Costs foregone on Efficient PC1 capex AEDm, 1999 prices 7,266.03 43 Opening 2006 RAV including Financing Costs foregone on Efficient PC1 capex AEDm, 2006 prices 8,708.95
Calculation of Total Depreciation (on Initial 2006 Opening RAV and Additional Efficient PC1 Capex) 200644 Depreciation on Initial Opening 2006 RAV AEDm, 2003 prices 305.21 45 Depreciation on Initial Opening 2006 RAV AEDm, 1999 prices 278.57 46 Depreciation on additional efficient PC1 capex AEDm, 1999 prices 6.10 47 Total Depreciation for 2006 onwards AEDm, 1999 prices 284.68 48 Total Annual Depreciation for 2006 onwards AEDm, 2006 prices 341.21
Inputs 2006 2007 2008 200949 Provisional PC3 capex AEDm, 2006 prices 1,200.00 1,200.00 1,200.00 1,200.00 50 Assumed average asset life for new investment years 3051 Opening 2006 RAV including Financing Costs foregone on Efficient PC1 capex AEDm, 2006 prices 8,708.95 52 Depreciation on Opening 2006 RAV AEDm, 2006 prices 341.21 341.21 341.21 341.21
Calculations 2006 2007 2008 200950 Opening RAV AEDm, 2006 prices 8,708.95 9,547.74 10,346.53 11,105.32 51 Provisional PC3 capex AEDm, 2006 prices 1,200.00 1,200.00 1,200.00 1,200.00 52 Depreciation on Opening 2006 RAV AEDm, 2006 prices 341.21 341.21 341.21 341.21 53 Depreciation on provisional PC3 capex (half-year depreciation for first year) AEDm, 2006 prices 20.00 60.00 100.00 140.00 54 Total depreciation for PC3 AEDm, 2006 prices 361.21 401.21 441.21 481.21 55 Closing RAV AEDm, 2006 prices 9,547.74 10,346.53 11,105.32 11,824.11
Updating 2006 Opening RAV for PC1 Efficient Capex
Updating PC3 RAVs for PC3 Provisional Capex

Title: 2005 Price Controls Review � Draft Proposals Issue No.: 1 Rev (0) Prepared by:
AR/MPC/MMH Document No. CR/E02/022 Issue Date: 27/07/05
Approved by: NSC
Page 125 of 137
Appendix A.10: TRANSCO Water � Updating RAV
Line No.
UAE CPI Assumptions 1998 1999 2000 2001 2002 2003 2004 20051 Historical CPI (1995 = 100) - end year value 106.90 109.20 110.702 Historical CPI (2000 = 100) - end year value 100.00 102.80 105.80 109.103 Historical CPI Inflation 2.15% 1.37% 2.80% 2.92% 3.12%4 Forecast CPI Inflation 3.00% 3.00%5 CPI (2000 = 100) used in calculations 96.57 98.64 100.00 102.80 105.80 109.10 112.37 115.74
Inputs 1999 2000 2001 20026 Provisional PC1 capex allowed at PC2 AEDm, 1999 prices 118.74 123.46 92.11 289.04 7 Actual PC1 capex AEDm, nominal prices 124.27 133.33 205.19 650.70 8 Applied capex efficiency factor % 94.00%9 Initial Opening 2006 RAV (with provisional PC1 and PC2 capex) AEDm, 2003 p 4,612.53
10 Depreciation on Opening 2003 RAV AEDm, 2003 p 144.23 11 Depreciation on provisional capex for 2003-2005 AEDm, 2003 p 92.81 12 Depreciation on Initial Opening 2006 RAV AEDm, 2003 p 237.05 13 Assumed average asset life for new investment years 3014 Cost of capital (real) % 6.00%
Calculation of Additional Efficient PC1 Capex to be allowed at this Review 1999 2000 2001 200215 Actual PC1 capex AEDm, nominal prices 124.27 133.33 205.19 650.70 16 Applied capex efficiency factor % 94.00%17 Efficient PC1 capex AEDm, nominal prices 116.81 125.33 192.88 611.65 18 Efficient PC1 capex AEDm, 1999 prices 116.81 122.69 186.26 574.57 19 Provisional PC1 capex AEDm, 1999 prices 118.74 123.46 92.11 289.04 20 Additional efficient PC1 capex to be allowed at PC3 AEDm, 1999 prices (1.92) (0.77) 94.15 285.53
Calculation of Depreciation foregone on Additonal Efficient PC1 Capex 1999 2000 2001 2002 2003 2004 200521 Assumed average asset life for new investment years 3022 Additional efficient PC1 capex to be allowed at PC3 AEDm, 1999 prices -1.92 -0.77 94.15 285.5323 Depreciation on additional efficient PC1 capex AEDm, 1999 prices -0.03 -0.08 1.48 7.81 12.57 12.57 12.5724 (half-year depreciation for the first year of each annual capex)
Calculation of Return on Capital foregone on Additional Efficient PC1 Capex 1999 2000 2001 2002 2003 2004 200525 Additional efficient PC1 capex - Opening value AEDm, 1999 prices 0.00 -1.89 -2.58 90.09 367.81 355.24 342.6826 Additional efficient PC1 capex AEDm, 1999 prices -1.92 -0.77 94.15 285.5327 Depreciation on additional efficient PC1 capex AEDm, 1999 prices -0.03 -0.08 1.48 7.81 12.57 12.57 12.5728 Additional efficient PC1 capex - Closing value AEDm, 1999 prices -1.89 -2.58 90.09 367.81 355.24 342.68 330.1129 Average of Opening and Closing values AEDm, 1999 prices -0.95 -2.24 43.75 228.95 361.53 348.96 336.3930 Cost of capital (real) % 6.00%31 Return on capital foregone AEDm, 1999 prices -0.06 -0.13 2.63 13.74 21.69 20.94 20.18
Calculation of Financing Costs foregone on Additional Efficient PC1 Capex 1999 2000 2001 2002 2003 2004 200532 Depreciation foregone AEDm, 1999 prices -0.03 -0.08 1.48 7.81 12.57 12.57 12.5733 Return on capital foregone AEDm, 1999 prices -0.06 -0.13 2.63 13.74 21.69 20.94 20.1834 Total financing costs foregone AEDm, 1999 prices -0.09 -0.21 4.10 21.54 34.26 33.50 32.7535 Years from year mid point to 1 Jan 2006 AEDm, 1999 prices 6.50 5.50 4.50 3.50 2.50 1.50 0.5036 NPV @ 1 Jan 2006 of financing costs foregone AEDm, 1999 prices -0.13 -0.29 5.34 26.42 39.63 36.56 33.7237 Accumulated NPV (@ 1 Jan 2006) of financing costs foregone AEDm, 1999 prices 141.25
AEDm, 2006 prices 169.29
Calculation of 2006 Opening RAV (including Financing Costs foregone on Additional Efficient PC1 Capex) 200638 Initial Opening 2006 RAV (with provisional PC1 and PC2 capex) AEDm, 2003 prices 4,612.53 39 Initial Opening 2006 RAV (with provisional PC1 and PC2 capex) AEDm, 1999 prices 4,210.02 40 Add: Additional efficient PC1 capex - Closing value @ 31 Dec 2005 AEDm, 1999 prices 330.11 41 Add: Accumulated NPV (@ 1 Jan 2006) of financing costs foregone AEDm, 1999 prices 141.25 42 Opening 2006 RAV including Financing Costs foregone on Efficient PC1 capex AEDm, 1999 prices 4,681.38 43 Opening 2006 RAV including Financing Costs foregone on Efficient PC1 capex AEDm, 2006 prices 5,611.03
Calculation of Total Depreciation (on Initial 2006 Opening RAV and Additional Efficient PC1 Capex) 200644 Depreciation on Initial Opening 2006 RAV AEDm, 2003 prices 237.05 45 Depreciation on Initial Opening 2006 RAV AEDm, 1999 prices 216.36 46 Depreciation on additional efficient PC1 capex AEDm, 1999 prices 12.57 47 Total Depreciation for 2006 onwards AEDm, 1999 prices 228.93 48 Total Annual Depreciation for 2006 onwards AEDm, 2006 prices 274.39
Inputs 2006 2007 2008 200949 Provisional PC3 capex AEDm, 2006 prices 750.00 750.00 750.00 750.00 50 Assumed average asset life for new investment years 3051 Opening 2006 RAV including Financing Costs foregone on Efficient PC1 capex AEDm, 2006 prices 5,611.03 52 Depreciation on Opening 2006 RAV AEDm, 2006 prices 274.39 274.39 274.39 274.39
Calculations 2006 2007 2008 200950 Opening RAV AEDm, 2006 prices 5,611.03 6,074.14 6,512.26 6,925.37 51 Provisional PC3 capex AEDm, 2006 prices 750.00 750.00 750.00 750.00 52 Depreciation on Opening 2006 RAV AEDm, 2006 prices 274.39 274.39 274.39 274.39 53 Depreciation on provisional PC3 capex (half-year depreciation for first year) AEDm, 2006 prices 12.50 37.50 62.50 87.50 54 Total depreciation for PC3 AEDm, 2006 prices 286.89 311.89 336.89 361.89 55 Closing RAV AEDm, 2006 prices 6,074.14 6,512.26 6,925.37 7,313.48
Updating 2006 Opening RAV for PC1 Efficient Capex
Updating PC3 RAVs for PC3 Provisional Capex

Title: 2005 Price Controls Review � Draft Proposals Issue No.: 1 Rev (0) Prepared by:
AR/MPC/MMH Document No. CR/E02/022 Issue Date: 27/07/05
Approved by: NSC
Page 126 of 137
Appendices B.1 � B.12: Price Control Calculations
Appendix B.1: AADC Electricity Distribution � Price Control Calculations
Line No. (all AED amounts are in 2006 prices)
Inputs 2006 2007 2008 20091 Operating expenditure allowance AEDm 119.65 118.91 118.18 117.46 2 Opening RAV AEDm 2,631.97 2,784.98 2,927.98 3,060.98 3 Closing RAV AEDm 2,784.98 2,927.98 3,060.98 3,183.99 4 Mid-Year RAV AEDm 2,708.48 2,856.48 2,994.48 3,122.49 5 Total depreciation for PC3 AEDm 147.00 157.00 167.00 177.00 6 Forecast for revenue driver 1 Fixed term 1.00 1.00 1.00 1.00 7 Forecast for revenue driver 2 Customer Accounts 93,944 97,274 100,122 102,8028 Forecast for revenue driver 3 GWh 6,604 7,233 7,922 8,7659 PV of financial adjustments AEDm -23.42
10 Cost of capital (real) 5.30%11 Weight in revenue for Revenue driver 1 70.00%12 Weight in revenue for Revenue driver 2 15.00%13 Weight in revenue for Revenue driver 3 15.00%14 Negative X Factor 0.00
PC3 Required Revenue Calculations 2006 2007 2008 2009
15 Operating expenditure allowance AEDm 119.65 118.91 118.18 117.46 428.55 16 Total depreciation for PC3 AEDm 147.00 157.00 167.00 177.00 583.04 17 Return on mid-year RAV AEDm 143.55 151.39 158.71 165.49 557.61 18 Annual revenue requirement before financial adjustment AEDm 410.19 427.30 443.89 459.95 1,569.20 19 Discounted annual revenue requirement before financial adjustment AEDm 399.74 395.45 390.12 383.89 1,569.20 20 PV of financial adjustments AEDm -23.4221 PV of revenue requirement after financial adjustment AEDm 1,545.78
PC3 Required Forecast and Profiling 2006 2007 2008 200922 Revenue driver 1 Revenue driver forecast 1.00 1.00 1.00 1.0023 Fixed revenue term (a) AEDm 299.45 299.45 299.45 299.45 24 Revenue forecast AEDm 299.45 299.45 299.45 299.45 1,082.04 25 Share of revenue % 72% 72% 72% 72% 70%
26 Revenue driver 2 Revenue driver forecast Customer Accounts 93,944 97,274 100,122 102,802 Constraints for Solver Run27 Co-efficeint of variable revenue term (b) AED / Customer 652.46 652.46 652.46 652.46 28 Revenue forecast AEDm 61 63 65 67 231.87 29 Share of revenue % 15% 15% 16% 16% 15%
30 Revenue driver 3 Revenue driver forecast kWh 6,604,391,606 7,233,471,333 7,921,575,379 8,764,532,00031 Co-efficeint of variable revenue term (c) fils / kWh 0.85 0.85 0.85 0.85 32 Revenue forecast AEDm 55.87 61.19 67.02 74.15 231.87 33 Share of revenue % 13% 15% 16% 18% 15%
Variables for Solver Run34 Annual revenue AEDm 416.61 424.11 431.79 440.67 TOTAL Difference35 Discounted annual revenue at 1 January 2006 AEDm 405.99 392.49 379.49 367.80 1,545.8 0.00
Target for Solver Run
Results 200636 X Factor 0.037 Fixed revenue term (a) AED million 299.4538 Co-efficeint of variable revenue term (b) AED / Customer Account 652.4639 Co-efficeint of variable revenue term (c) fils / kWh metered 0.85
Implied Financial Indicators 2006 2007 2008 2009
40 Implied annual profit AEDm 149.97 148.20 146.61 146.21 147.7541 Implied return on mid-point RAV % 5.54% 5.19% 4.90% 4.68% 5.08%
PV over PC3 Periodat 1 January 2006
PV Share in TOTAL
Average
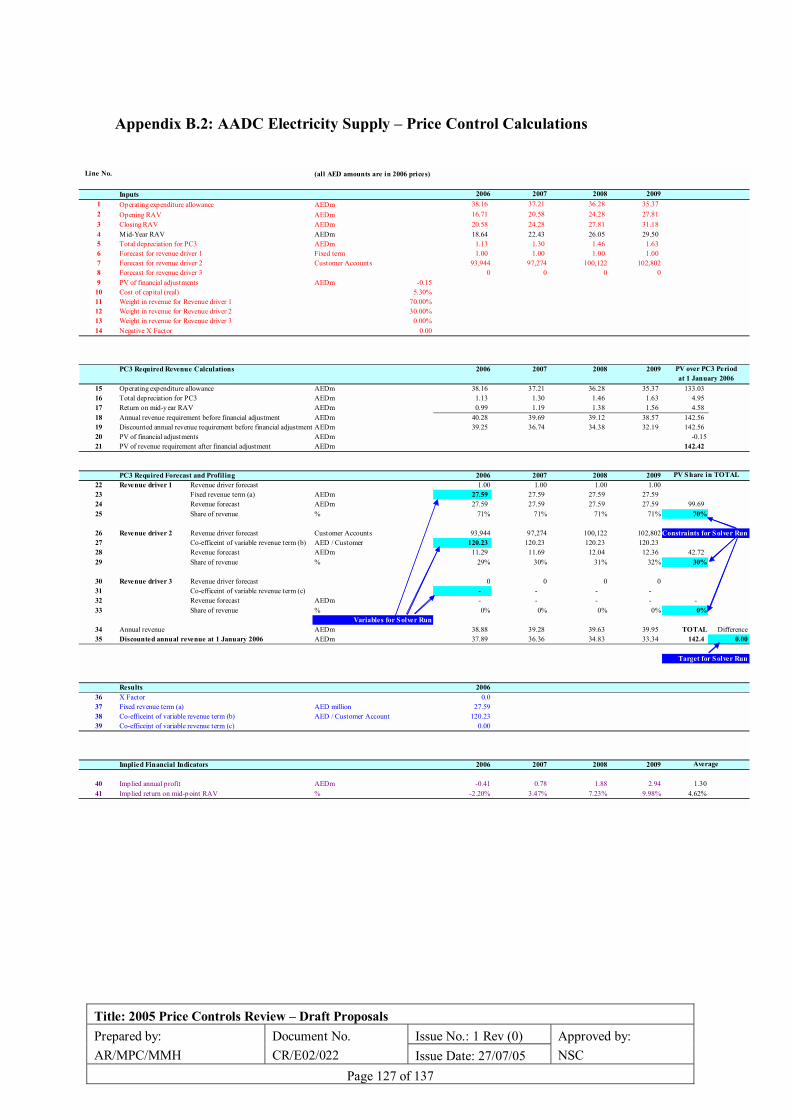
Title: 2005 Price Controls Review � Draft Proposals Issue No.: 1 Rev (0) Prepared by:
AR/MPC/MMH Document No. CR/E02/022 Issue Date: 27/07/05
Approved by: NSC
Page 127 of 137
Appendix B.2: AADC Electricity Supply � Price Control Calculations
Line No. (all AED amounts are in 2006 prices)
Inputs 2006 2007 2008 20091 Operating expenditure allowance AEDm 38.16 37.21 36.28 35.37 2 Opening RAV AEDm 16.71 20.58 24.28 27.81 3 Closing RAV AEDm 20.58 24.28 27.81 31.18 4 Mid-Year RAV AEDm 18.64 22.43 26.05 29.50 5 Total depreciation for PC3 AEDm 1.13 1.30 1.46 1.63 6 Forecast for revenue driver 1 Fixed term 1.00 1.00 1.00 1.00 7 Forecast for revenue driver 2 Customer Accounts 93,944 97,274 100,122 102,8028 Forecast for revenue driver 3 0 0 0 09 PV of financial adjustments AEDm -0.15
10 Cost of capital (real) 5.30%11 Weight in revenue for Revenue driver 1 70.00%12 Weight in revenue for Revenue driver 2 30.00%13 Weight in revenue for Revenue driver 3 0.00%14 Negative X Factor 0.00
PC3 Required Revenue Calculations 2006 2007 2008 2009
15 Operating expenditure allowance AEDm 38.16 37.21 36.28 35.37 133.03 16 Total depreciation for PC3 AEDm 1.13 1.30 1.46 1.63 4.95 17 Return on mid-year RAV AEDm 0.99 1.19 1.38 1.56 4.58 18 Annual revenue requirement before financial adjustment AEDm 40.28 39.69 39.12 38.57 142.56 19 Discounted annual revenue requirement before financial adjustment AEDm 39.25 36.74 34.38 32.19 142.56 20 PV of financial adjustments AEDm -0.1521 PV of revenue requirement after financial adjustment AEDm 142.42
PC3 Required Forecast and Profiling 2006 2007 2008 200922 Revenue driver 1 Revenue driver forecast 1.00 1.00 1.00 1.0023 Fixed revenue term (a) AEDm 27.59 27.59 27.59 27.59 24 Revenue forecast AEDm 27.59 27.59 27.59 27.59 99.69 25 Share of revenue % 71% 71% 71% 71% 70%
26 Revenue driver 2 Revenue driver forecast Customer Accounts 93,944 97,274 100,122 102,802 Constraints for Solver Run27 Co-efficeint of variable revenue term (b) AED / Customer 120.23 120.23 120.23 120.23 28 Revenue forecast AEDm 11.29 11.69 12.04 12.36 42.72 29 Share of revenue % 29% 30% 31% 32% 30%
30 Revenue driver 3 Revenue driver forecast 0 0 0 031 Co-efficeint of variable revenue term (c) - - - - 32 Revenue forecast AEDm - - - - - 33 Share of revenue % 0% 0% 0% 0% 0%
Variables for Solver Run34 Annual revenue AEDm 38.88 39.28 39.63 39.95 TOTAL Difference35 Discounted annual revenue at 1 January 2006 AEDm 37.89 36.36 34.83 33.34 142.4 0.00
Target for Solver Run
Results 200636 X Factor 0.037 Fixed revenue term (a) AED million 27.5938 Co-efficeint of variable revenue term (b) AED / Customer Account 120.2339 Co-efficeint of variable revenue term (c) 0.00
Implied Financial Indicators 2006 2007 2008 2009
40 Implied annual profit AEDm -0.41 0.78 1.88 2.94 1.3041 Implied return on mid-point RAV % -2.20% 3.47% 7.23% 9.98% 4.62%
PV over PC3 Periodat 1 January 2006
PV Share in TOTAL
Average

Title: 2005 Price Controls Review � Draft Proposals Issue No.: 1 Rev (0) Prepared by:
AR/MPC/MMH Document No. CR/E02/022 Issue Date: 27/07/05
Approved by: NSC
Page 128 of 137
Appendix B.3: AADC Water Distribution � Price Control Calculations
Line No. (all AED amounts are in 2006 prices)
Inputs 2006 2007 2008 20091 Operating expenditure allowance AEDm 74.47 73.86 60.76 60.17 2 Opening RAV AEDm 950.42 1,068.30 1,181.18 1,289.07 3 Closing RAV AEDm 1,068.30 1,181.18 1,289.07 1,391.95 4 Mid-Year RAV AEDm 1,009.36 1,124.74 1,235.12 1,340.51 5 Total depreciation for PC3 AEDm 32.12 37.12 42.12 47.12 6 Forecast for revenue driver 1 Fixed term 1.00 1.00 1.00 1.00 7 Forecast for revenue driver 2 Customer Accounts 48,525 50,048 51,217 52,2388 Forecast for revenue driver 3 M G 20,965 31,660 41,470 51,0489 PV of financial adjustments AEDm -30.68
10 Cost of capital (real) 5.30%11 Weight in revenue for Revenue driver 1 70.00%12 Weight in revenue for Revenue driver 2 15.00%13 Weight in revenue for Revenue driver 3 15.00%14 Negative X Factor 0.00
PC3 Required Revenue Calculations 2006 2007 2008 2009
15 Operating expenditure allowance AEDm 74.47 73.86 60.76 60.17 244.55 16 Total depreciation for PC3 AEDm 32.12 37.12 42.12 47.12 141.99 17 Return on mid-year RAV AEDm 53.50 59.61 65.46 71.05 224.13 18 Annual revenue requirement before financial adjustment AEDm 160.08 170.59 168.34 178.33 610.67 19 Discounted annual revenue requirement before financial adjustment AEDm 156.00 157.87 147.95 148.84 610.67 20 PV of financial adjustments AEDm -30.6821 PV of revenue requirement after financial adjustment AEDm 579.99
PC3 Required Forecast and Profiling 2006 2007 2008 200922 Revenue driver 1 Revenue driver forecast 1.00 1.00 1.00 1.0023 Fixed revenue term (a) AEDm 112.35 112.35 112.35 112.35 24 Revenue forecast AEDm 112.35 112.35 112.35 112.35 405.99 25 Share of revenue % 75% 75% 75% 75% 70%
26 Revenue driver 2 Revenue driver forecast Customer Accounts 48,525 50,048 51,217 52,238 Constraints for Solver Run27 Co-efficeint of variable revenue term (b) AED / Customer 477.44 477.44 477.44 477.44 28 Revenue forecast AEDm 23.17 23.89 24.45 24.94 87.00 29 Share of revenue % 15% 16% 16% 17% 15%
30 Revenue driver 3 Revenue driver forecast TIG 20,965,160 31,660,498 41,469,631 51,047,50431 Co-efficeint of variable revenue term (c) AED / TIG 0.68 0.68 0.68 0.68 32 Revenue forecast AEDm 14.16 21.39 28.01 34.48 87.00 33 Share of revenue % 9% 14% 19% 23% 15%
Variables for Solver Run34 Annual revenue AEDm 149.69 157.64 164.82 171.78 TOTAL Difference35 Discounted annual revenue at 1 January 2006 AEDm 145.87 145.89 144.86 143.38 580.0 0.00
Target for Solver Run
Results 200636 X Factor 0.037 Fixed revenue term (a) AED million 112.3538 Co-efficeint of variable revenue term (b) AED / Customer Account 477.4439 Co-efficeint of variable revenue term (c) AED / TIG 0.68
Implied Financial Indicators 2006 2007 2008 2009
40 Implied annual profit AEDm 43.10 46.66 61.94 64.49 54.0541 Implied return on mid-point RAV % 4.27% 4.15% 5.02% 4.81% 4.56%
PV over PC3 Periodat 1 January 2006
PV Share in TOTAL
Average

Title: 2005 Price Controls Review � Draft Proposals Issue No.: 1 Rev (0) Prepared by:
AR/MPC/MMH Document No. CR/E02/022 Issue Date: 27/07/05
Approved by: NSC
Page 129 of 137
Appendix B.4: AADC Water Supply � Price Control Calculations
Line No. (all AED amounts are in 2006 prices)
Inputs 2006 2007 2008 20091 Operating expenditure allowance AEDm 11.63 11.30 10.98 10.67 2 Opening RAV AEDm 12.41 14.98 17.44 19.81 3 Closing RAV AEDm 14.98 17.44 19.81 22.08 4 Mid-Year RAV AEDm 13.69 16.21 18.63 20.95 5 Total depreciation for PC3 AEDm 0.43 0.53 0.63 0.73 6 Forecast for revenue driver 1 Fixed term 1.00 1.00 1.00 1.00 7 Forecast for revenue driver 2 Customer Accounts 48,525 50,048 51,217 52,2388 Forecast for revenue driver 3 0 0 0 09 PV of financial adjustments AEDm -0.40
10 Cost of capital (real) 5.30%11 Weight in revenue for Revenue driver 1 70.00%12 Weight in revenue for Revenue driver 2 30.00%13 Weight in revenue for Revenue driver 3 0.00%14 Negative X Factor 0.00
PC3 Required Revenue Calculations 2006 2007 2008 2009
15 Operating expenditure allowance AEDm 11.63 11.30 10.98 10.67 40.35 16 Total depreciation for PC3 AEDm 0.43 0.53 0.63 0.73 2.08 17 Return on mid-year RAV AEDm 0.73 0.86 0.99 1.11 3.30 18 Annual revenue requirement before financial adjustment AEDm 12.79 12.69 12.60 12.51 45.72 19 Discounted annual revenue requirement before financial adjustment AEDm 12.46 11.75 11.07 10.44 45.72 20 PV of financial adjustments AEDm -0.4021 PV of revenue requirement after financial adjustment AEDm 45.32
PC3 Required Forecast and Profiling 2006 2007 2008 200922 Revenue driver 1 Revenue driver forecast 1.00 1.00 1.00 1.0023 Fixed revenue term (a) AEDm 8.78 8.78 8.78 8.78 24 Revenue forecast AEDm 8.78 8.78 8.78 8.78 31.73 25 Share of revenue % 71% 71% 71% 71% 70%
26 Revenue driver 2 Revenue driver forecast Customer Accounts 48,525 50,048 51,217 52,238 Constraints for Solver Run27 Co-efficeint of variable revenue term (b) AED / Customer 74.62 74.62 74.62 74.62 28 Revenue forecast AEDm 3.62 3.73 3.82 3.90 13.60 29 Share of revenue % 29% 30% 31% 31% 30%
30 Revenue driver 3 Revenue driver forecast 0 0 0 031 Co-efficeint of variable revenue term (c) - - - - 32 Revenue forecast AEDm - - - - - 33 Share of revenue % 0% 0% 0% 0% 0%
Variables for Solver Run34 Annual revenue AEDm 12.40 12.51 12.60 12.68 TOTAL Difference35 Discounted annual revenue at 1 January 2006 AEDm 12.08 11.58 11.08 10.58 45.3 0.00
Target for Solver Run
Results 200636 X Factor 0.037 Fixed revenue term (a) AED million 8.7838 Co-efficeint of variable revenue term (b) AED / Customer Account 74.6239 Co-efficeint of variable revenue term (c) 0.00
Implied Financial Indicators 2006 2007 2008 2009
40 Implied annual p rofit AEDm 0.34 0.68 0.99 1.28 0.8241 Implied return on mid-point RAV % 2.45% 4.20% 5.32% 6.11% 4.52%
PV over PC3 Periodat 1 January 2006
PV Share in TOTAL
Average

Title: 2005 Price Controls Review � Draft Proposals Issue No.: 1 Rev (0) Prepared by:
AR/MPC/MMH Document No. CR/E02/022 Issue Date: 27/07/05
Approved by: NSC
Page 130 of 137
Appendix B.5: ADDC Electricity Distribution � Price Control Calculations
Line No. (all AED amounts are in 2006 prices)
Inputs 2006 2007 2008 20091 Operating expenditure allowance AEDm 197.72 195.62 193.53 191.47 2 Opening RAV AEDm 5,726.06 5,983.92 6,224.12 6,446.64 3 Closing RAV AEDm 5,983.92 6,224.12 6,446.64 6,651.50 4 Mid-Year RAV AEDm 5,854.99 6,104.02 6,335.38 6,549.07 5 Total depreciation for PC3 AEDm 272.14 289.81 307.47 325.14 6 Forecast for revenue driver 1 Fixed term 1.00 1.00 1.00 1.00 7 Forecast for revenue driver 2 Customer Accounts 205,554 210,008 214,557 218,8638 Forecast for revenue driver 3 GWh 14,842 16,106 17,478 18,9579 PV of financial adjustments AEDm 26.40
10 Cost of capital (real) 5.30%11 Weight in revenue for Revenue driver 1 70.00%12 Weight in revenue for Revenue driver 2 15.00%13 Weight in revenue for Revenue driver 3 15.00%14 Negative X Factor 0.00
PC3 Required Revenue Calculations 2006 2007 2008 2009
15 Operating expenditure allowance AEDm 197.72 195.62 193.53 191.47 703.62 16 Total depreciation for PC3 AEDm 272.14 289.81 307.47 325.14 1,075.01 17 Return on mid-year RAV AEDm 310.31 323.51 335.78 347.10 1,186.61 18 Annual revenue requirement before financial adjustment AEDm 780.18 808.94 836.78 863.71 2,965.25 19 Discounted annual revenue requirement before financial adjustment AEDm 760.29 748.64 735.43 720.89 2,965.25 20 PV of financial adjustments AEDm 26.4021 PV of revenue requirement after financial adjustment AEDm 2,991.65
PC3 Required Forecast and Profiling 2006 2007 2008 200922 Revenue driver 1 Revenue driver forecast 1.00 1.00 1.00 1.0023 Fixed revenue term (a) AEDm 579.54 579.54 579.54 579.54 24 Revenue forecast AEDm 579.54 579.54 579.54 579.54 2,094.15 25 Share of revenue % 72% 72% 72% 72% 70%
26 Revenue driver 2 Revenue driver forecast Customer Accounts 205,554 210,008 214,557 218,863 Constraints for Solver Run27 Co-efficeint of variable revenue term (b) AED / Customer 585.90 585.90 585.90 585.90 28 Revenue forecast AEDm 120.43 123.04 125.71 128.23 448.75 29 Share of revenue % 15% 15% 16% 16% 15%
30 Revenue driver 3 Revenue driver forecast kWh 14,841,930,876 16,106,248,916 17,477,920,879 18,956,962,26231 Co-efficeint of variable revenue term (c) fils / kWh 0.74 0.74 0.74 0.74 32 Revenue forecast AEDm 109.99 119.36 129.53 140.49 448.75 33 Share of revenue % 14% 15% 16% 17% 15%
Variables for Solver Run34 Annual revenue AEDm 809.96 821.94 834.77 848.26 TOTAL Difference35 Discounted annual revenue at 1 January 2006 AEDm 789.32 760.67 733.66 707.99 2,991.6 0.00
Target for Solver Run
Results 200636 X Factor 0.037 Fixed revenue term (a) AED million 579.5438 Co-efficeint of variable revenue term (b) AED / Customer Account 585.9039 Co-efficeint of variable revenue term (c) fils / kWh metered 0.74
Implied Financial Indicators 2006 2007 2008 2009
40 Implied annual profit AEDm 340.10 336.52 333.77 331.64 335.5141 Implied return on mid-point RAV % 5.81% 5.51% 5.27% 5.06% 5.41%
PV over PC3 Periodat 1 January 2006
PV Share in TOTAL
Average

Title: 2005 Price Controls Review � Draft Proposals Issue No.: 1 Rev (0) Prepared by:
AR/MPC/MMH Document No. CR/E02/022 Issue Date: 27/07/05
Approved by: NSC
Page 131 of 137
Appendix B.6: ADDC Electricity Supply � Price Control Calculations
Line No. (all AED amounts are in 2006 prices)
Inputs 2006 2007 2008 20091 Operating expenditure allowance AEDm 39.43 38.09 36.79 35.54 2 Opening RAV AEDm 32.87 37.27 41.46 45.46 3 Closing RAV AEDm 37.27 41.46 45.46 49.25 4 Mid-Year RAV AEDm 35.07 39.36 43.46 47.36 5 Total depreciation for PC3 AEDm 1.60 1.80 2.00 2.20 6 Forecast for revenue driver 1 Fixed term 1.00 1.00 1.00 1.00 7 Forecast for revenue driver 2 Customer Accounts 205,554 210,008 214,557 218,8638 Forecast for revenue driver 3 0 0 0 09 PV of financial adjustments AEDm 0.15
10 Cost of capital (real) 5.30%11 Weight in revenue for Revenue driver 1 70.00%12 Weight in revenue for Revenue driver 2 30.00%13 Weight in revenue for Revenue driver 3 0.00%14 Negative X Factor 0.00
PC3 Required Revenue Calculations 2006 2007 2008 2009
15 Operating expenditure allowance AEDm 39.43 38.09 36.79 35.54 135.67 16 Total depreciation for PC3 AEDm 1.60 1.80 2.00 2.20 6.83 17 Return on mid-year RAV AEDm 1.86 2.09 2.30 2.51 7.86 18 Annual revenue requirement before financial adjustment AEDm 42.89 41.98 41.10 40.25 150.36 19 Discounted annual revenue requirement before financial adjustment AEDm 41.80 38.85 36.12 33.60 150.36 20 PV of financial adjustments AEDm 0.1521 PV of revenue requirement after financial adjustment AEDm 150.51
PC3 Required Forecast and Profiling 2006 2007 2008 200922 Revenue driver 1 Revenue driver forecast 1.00 1.00 1.00 1.0023 Fixed revenue term (a) AEDm 29.16 29.16 29.16 29.16 24 Revenue forecast AEDm 29.16 29.16 29.16 29.16 105.36 25 Share of revenue % 71% 71% 71% 71% 70%
26 Revenue driver 2 Revenue driver forecast Customer Accounts 205,554 210,008 214,557 218,863 Constraints for Solver Run27 Co-efficeint of variable revenue term (b) AED / Customer 58.95 58.95 58.95 58.95 28 Revenue forecast AEDm 12.12 12.38 12.65 12.90 45.15 29 Share of revenue % 29% 30% 31% 31% 30%
30 Revenue driver 3 Revenue driver forecast 0 0 0 031 Co-efficeint of variable revenue term (c) - - - - 32 Revenue forecast AEDm - - - - - 33 Share of revenue % 0% 0% 0% 0% 0%
Variables for Solver Run34 Annual revenue AEDm 41.28 41.54 41.81 42.06 TOTAL Difference35 Discounted annual revenue at 1 January 2006 AEDm 40.22 38.44 36.74 35.11 150.5 0.00
Target for Solver Run
Results 200636 X Factor 0.037 Fixed revenue term (a) AED million 29.1638 Co-efficeint of variable revenue term (b) AED / Customer Account 58.9539 Co-efficeint of variable revenue term (c) 0.00
Implied Financial Indicators 2006 2007 2008 2009
40 Implied annual profit AEDm 0.25 1.65 3.01 4.32 2.3141 Implied return on mid-point RAV % 0.70% 4.19% 6.93% 9.11% 5.23%
PV over PC3 Periodat 1 January 2006
PV Share in TOTAL
Average
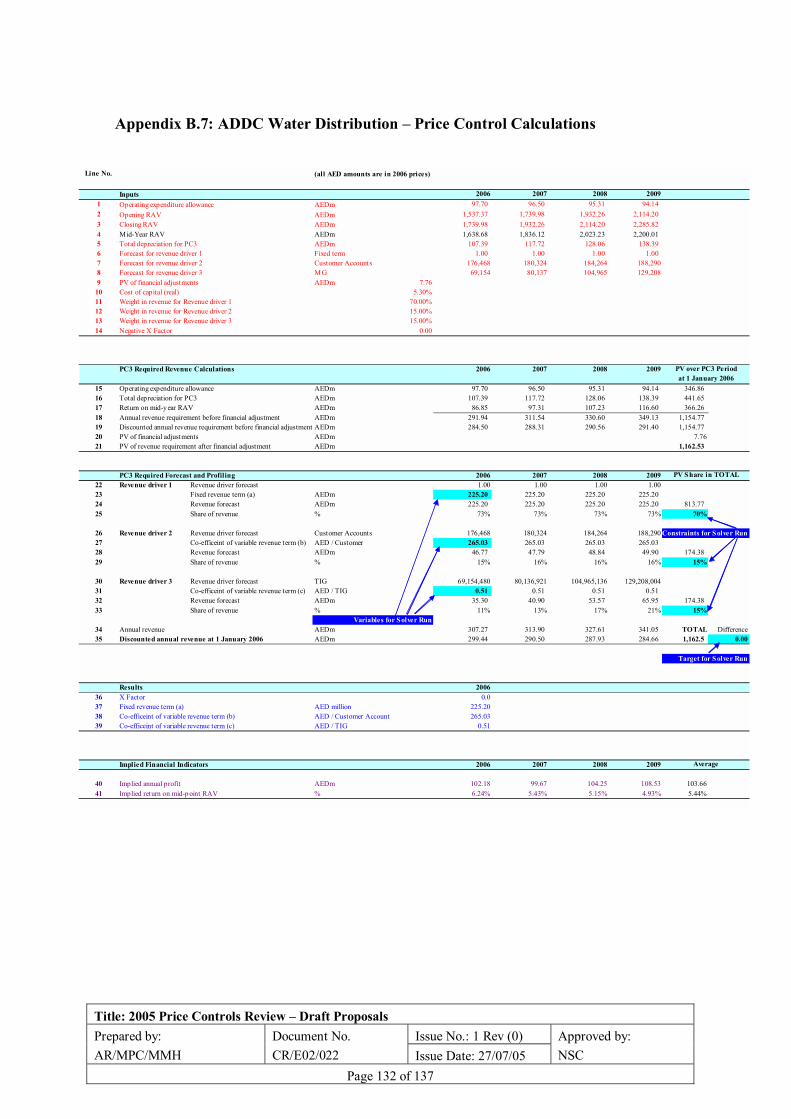
Title: 2005 Price Controls Review � Draft Proposals Issue No.: 1 Rev (0) Prepared by:
AR/MPC/MMH Document No. CR/E02/022 Issue Date: 27/07/05
Approved by: NSC
Page 132 of 137
Appendix B.7: ADDC Water Distribution � Price Control Calculations
Line No. (all AED amounts are in 2006 prices)
Inputs 2006 2007 2008 20091 Operating expenditure allowance AEDm 97.70 96.50 95.31 94.14 2 Opening RAV AEDm 1,537.37 1,739.98 1,932.26 2,114.20 3 Closing RAV AEDm 1,739.98 1,932.26 2,114.20 2,285.82 4 Mid-Year RAV AEDm 1,638.68 1,836.12 2,023.23 2,200.01 5 Total depreciation for PC3 AEDm 107.39 117.72 128.06 138.39 6 Forecast for revenue driver 1 Fixed term 1.00 1.00 1.00 1.00 7 Forecast for revenue driver 2 Customer Accounts 176,468 180,324 184,264 188,2908 Forecast for revenue driver 3 M G 69,154 80,137 104,965 129,2089 PV of financial adjustments AEDm 7.76
10 Cost of capital (real) 5.30%11 Weight in revenue for Revenue driver 1 70.00%12 Weight in revenue for Revenue driver 2 15.00%13 Weight in revenue for Revenue driver 3 15.00%14 Negative X Factor 0.00
PC3 Required Revenue Calculations 2006 2007 2008 2009
15 Operating expenditure allowance AEDm 97.70 96.50 95.31 94.14 346.86 16 Total depreciation for PC3 AEDm 107.39 117.72 128.06 138.39 441.65 17 Return on mid-year RAV AEDm 86.85 97.31 107.23 116.60 366.26 18 Annual revenue requirement before financial adjustment AEDm 291.94 311.54 330.60 349.13 1,154.77 19 Discounted annual revenue requirement before financial adjustment AEDm 284.50 288.31 290.56 291.40 1,154.77 20 PV of financial adjustments AEDm 7.7621 PV of revenue requirement after financial adjustment AEDm 1,162.53
PC3 Required Forecast and Profiling 2006 2007 2008 200922 Revenue driver 1 Revenue driver forecast 1.00 1.00 1.00 1.0023 Fixed revenue term (a) AEDm 225.20 225.20 225.20 225.20 24 Revenue forecast AEDm 225.20 225.20 225.20 225.20 813.77 25 Share of revenue % 73% 73% 73% 73% 70%
26 Revenue driver 2 Revenue driver forecast Customer Accounts 176,468 180,324 184,264 188,290 Constraints for Solver Run27 Co-efficeint of variable revenue term (b) AED / Customer 265.03 265.03 265.03 265.03 28 Revenue forecast AEDm 46.77 47.79 48.84 49.90 174.38 29 Share of revenue % 15% 16% 16% 16% 15%
30 Revenue driver 3 Revenue driver forecast TIG 69,154,480 80,136,921 104,965,136 129,208,00431 Co-efficeint of variable revenue term (c) AED / TIG 0.51 0.51 0.51 0.51 32 Revenue forecast AEDm 35.30 40.90 53.57 65.95 174.38 33 Share of revenue % 11% 13% 17% 21% 15%
Variables for Solver Run34 Annual revenue AEDm 307.27 313.90 327.61 341.05 TOTAL Difference35 Discounted annual revenue at 1 January 2006 AEDm 299.44 290.50 287.93 284.66 1,162.5 0.00
Target for Solver Run
Results 200636 X Factor 0.037 Fixed revenue term (a) AED million 225.2038 Co-efficeint of variable revenue term (b) AED / Customer Account 265.0339 Co-efficeint of variable revenue term (c) AED / TIG 0.51
Implied Financial Indicators 2006 2007 2008 2009
40 Implied annual profit AEDm 102.18 99.67 104.25 108.53 103.6641 Implied return on mid-point RAV % 6.24% 5.43% 5.15% 4.93% 5.44%
PV over PC3 Periodat 1 January 2006
PV Share in TOTAL
Average

Title: 2005 Price Controls Review � Draft Proposals Issue No.: 1 Rev (0) Prepared by:
AR/MPC/MMH Document No. CR/E02/022 Issue Date: 27/07/05
Approved by: NSC
Page 133 of 137
Appendix B.8: ADDC Water Supply � Price Control Calculations
Line No. (all AED amounts are in 2006 prices)
Inputs 2006 2007 2008 20091 Operating expenditure allowance AEDm 33.86 32.73 31.63 30.56 2 Opening RAV AEDm 13.17 16.98 20.62 24.09 3 Closing RAV AEDm 16.98 20.62 24.09 27.40 4 Mid-Year RAV AEDm 15.07 18.80 22.36 25.75 5 Total depreciation for PC3 AEDm 1.19 1.36 1.53 1.69 6 Forecast for revenue driver 1 Fixed term 1.00 1.00 1.00 1.00 7 Forecast for revenue driver 2 Customer Accounts 176,468 180,324 184,264 188,2908 Forecast for revenue driver 3 0 0 0 09 PV of financial adjustments AEDm 0.07
10 Cost of capital (real) 5.30%11 Weight in revenue for Revenue driver 1 70.00%12 Weight in revenue for Revenue driver 2 30.00%13 Weight in revenue for Revenue driver 3 0.00%14 Negative X Factor 0.00
PC3 Required Revenue Calculations 2006 2007 2008 2009
15 Operating expenditure allowance AEDm 33.86 32.73 31.63 30.56 116.59 16 Total depreciation for PC3 AEDm 1.19 1.36 1.53 1.69 5.17 17 Return on mid-year RAV AEDm 0.80 1.00 1.18 1.36 3.88 18 Annual revenue requirement before financial adjustment AEDm 35.86 35.08 34.34 33.62 125.65 19 Discounted annual revenue requirement before financial adjustment AEDm 34.94 32.47 30.18 28.06 125.65 20 PV of financial adjustments AEDm 0.0721 PV of revenue requirement after financial adjustment AEDm 125.71
PC3 Required Forecast and Profiling 2006 2007 2008 200922 Revenue driver 1 Revenue driver forecast 1.00 1.00 1.00 1.0023 Fixed revenue term (a) AEDm 24.35 24.35 24.35 24.35 24 Revenue forecast AEDm 24.35 24.35 24.35 24.35 88.00 25 Share of revenue % 71% 71% 71% 71% 70%
26 Revenue driver 2 Revenue driver forecast Customer Accounts 176,468 180,324 184,264 188,290 Constraints for Solver Run27 Co-efficeint of variable revenue term (b) AED / Customer 57.32 57.32 57.32 57.32 28 Revenue forecast AEDm 10.12 10.34 10.56 10.79 37.71 29 Share of revenue % 29% 30% 31% 31% 30%
30 Revenue driver 3 Revenue driver forecast 0 0 0 031 Co-efficeint of variable revenue term (c) - - - - 32 Revenue forecast AEDm - - - - - 33 Share of revenue % 0% 0% 0% 0% 0%
Variables for Solver Run34 Annual revenue AEDm 34.47 34.69 34.91 35.15 TOTAL Difference35 Discounted annual revenue at 1 January 2006 AEDm 33.59 32.10 30.69 29.33 125.7 0.00
Target for Solver Run
Results 200636 X Factor 0.037 Fixed revenue term (a) AED million 24.3538 Co-efficeint of variable revenue term (b) AED / Customer Account 57.3239 Co-efficeint of variable revenue term (c) 0.00
Implied Financial Indicators 2006 2007 2008 2009
40 Implied annual profit AEDm -0.59 0.60 1.76 2.89 1.1741 Implied return on mid-point RAV % -3.90% 3.21% 7.89% 11.23% 4.61%
PV over PC3 Periodat 1 January 2006
PV Share in TOTAL
Average
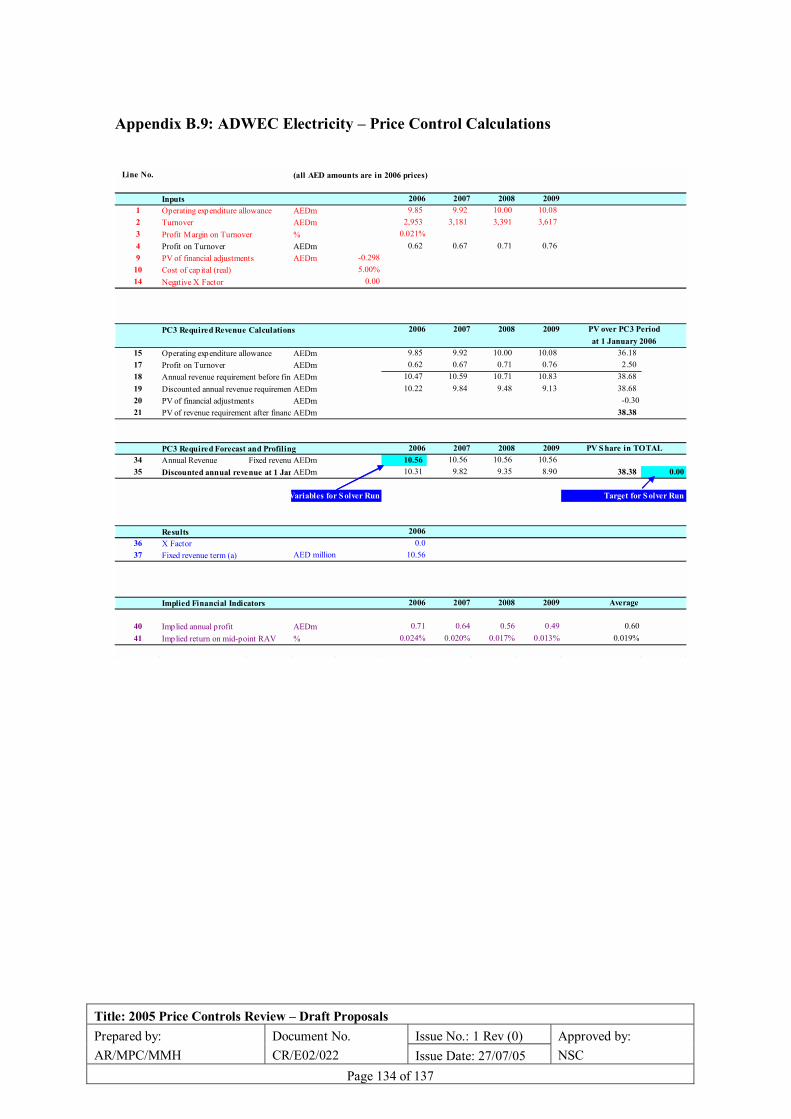
Title: 2005 Price Controls Review � Draft Proposals Issue No.: 1 Rev (0) Prepared by:
AR/MPC/MMH Document No. CR/E02/022 Issue Date: 27/07/05
Approved by: NSC
Page 134 of 137
Appendix B.9: ADWEC Electricity � Price Control Calculations
Line No. (all AED amounts are in 2006 prices)
Inputs 2006 2007 2008 20091 Operating expenditure allowance AEDm 9.85 9.92 10.00 10.08 2 Turnover AEDm 2,953 3,181 3,391 3,617 3 Profit Margin on Turnover % 0.021%4 Profit on Turnover AEDm 0.62 0.67 0.71 0.76 9 PV of financial adjustments AEDm -0.298
10 Cost of capital (real) 5.00%14 Negative X Factor 0.00
PC3 Required Revenue Calculations 2006 2007 2008 2009
15 Operating expenditure allowance AEDm 9.85 9.92 10.00 10.08 36.18 17 Profit on Turnover AEDm 0.62 0.67 0.71 0.76 2.50 18 Annual revenue requirement before finaAEDm 10.47 10.59 10.71 10.83 38.68 19 Discounted annual revenue requiremen AEDm 10.22 9.84 9.48 9.13 38.68 20 PV of financial adjustments AEDm -0.3021 PV of revenue requirement after financ AEDm 38.38
PC3 Required Forecast and Profiling 2006 2007 2008 200934 Annual Revenue Fixed revenu AEDm 10.56 10.56 10.56 10.56 35 Discounted annual revenue at 1 JanAEDm 10.31 9.82 9.35 8.90 38.38 0.00
Variables for S olver Run Target for S olver Run
Results 200636 X Factor 0.037 Fixed revenue term (a) AED million 10.56
Implied Financial Indicators 2006 2007 2008 2009
40 Implied annual profit AEDm 0.71 0.64 0.56 0.49 0.6041 Implied return on mid-point RAV % 0.024% 0.020% 0.017% 0.013% 0.019%
Average
PV over PC3 Periodat 1 January 2006
PV S hare in TOTAL
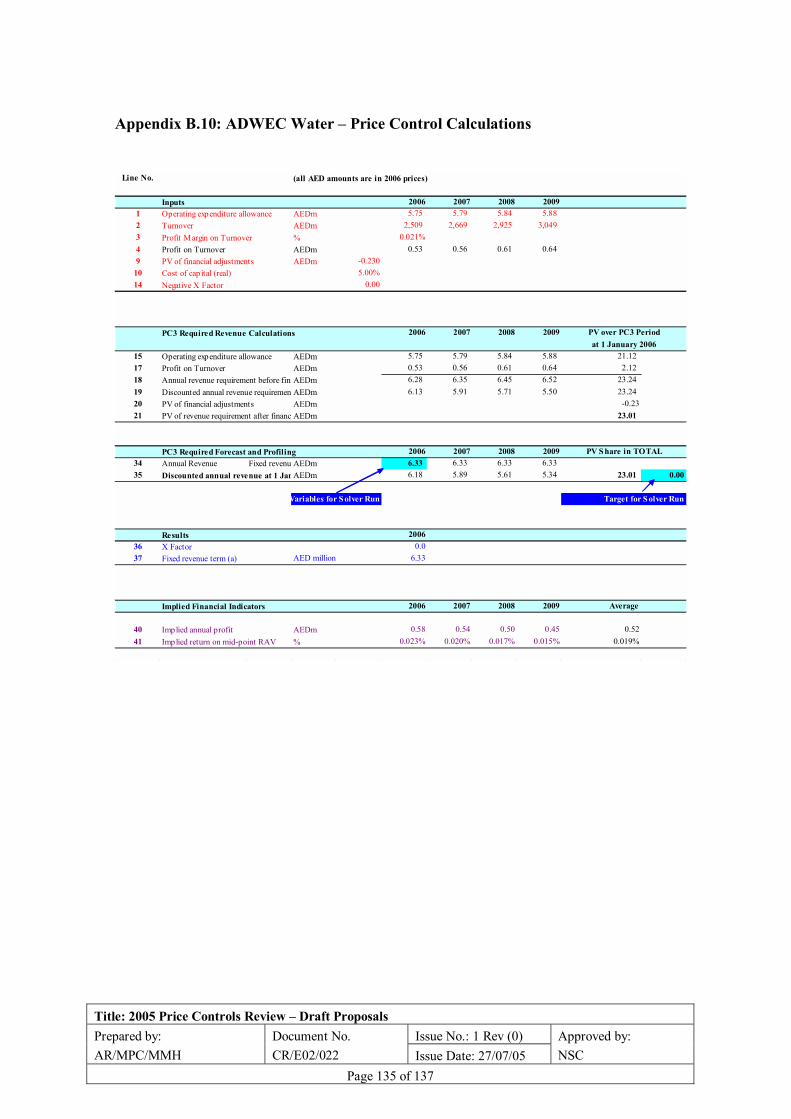
Title: 2005 Price Controls Review � Draft Proposals Issue No.: 1 Rev (0) Prepared by:
AR/MPC/MMH Document No. CR/E02/022 Issue Date: 27/07/05
Approved by: NSC
Page 135 of 137
Appendix B.10: ADWEC Water � Price Control Calculations
Line No. (all AED amounts are in 2006 prices)
Inputs 2006 2007 2008 20091 Operating expenditure allowance AEDm 5.75 5.79 5.84 5.88 2 Turnover AEDm 2,509 2,669 2,925 3,049 3 Profit Margin on Turnover % 0.021%4 Profit on Turnover AEDm 0.53 0.56 0.61 0.64 9 PV of financial adjustments AEDm -0.230
10 Cost of capital (real) 5.00%14 Negative X Factor 0.00
PC3 Required Revenue Calculations 2006 2007 2008 2009
15 Operating expenditure allowance AEDm 5.75 5.79 5.84 5.88 21.12 17 Profit on Turnover AEDm 0.53 0.56 0.61 0.64 2.12 18 Annual revenue requirement before finaAEDm 6.28 6.35 6.45 6.52 23.24 19 Discounted annual revenue requiremen AEDm 6.13 5.91 5.71 5.50 23.24 20 PV of financial adjustments AEDm -0.2321 PV of revenue requirement after financ AEDm 23.01
PC3 Required Forecast and Profiling 2006 2007 2008 200934 Annual Revenue Fixed revenu AEDm 6.33 6.33 6.33 6.33 35 Discounted annual revenue at 1 JanAEDm 6.18 5.89 5.61 5.34 23.01 0.00
Variables for S olver Run Target for S olver Run
Results 200636 X Factor 0.037 Fixed revenue term (a) AED million 6.33
Implied Financial Indicators 2006 2007 2008 2009
40 Implied annual profit AEDm 0.58 0.54 0.50 0.45 0.5241 Implied return on mid-point RAV % 0.023% 0.020% 0.017% 0.015% 0.019%
Average
PV over PC3 Periodat 1 January 2006
PV S hare in TOTAL

Title: 2005 Price Controls Review � Draft Proposals Issue No.: 1 Rev (0) Prepared by:
AR/MPC/MMH Document No. CR/E02/022 Issue Date: 27/07/05
Approved by: NSC
Page 136 of 137
Appendix B.11: TRANSCO Electricity � Price Control Calculations
Line No. (all AED amounts are in 2006 prices)
Inputs 2006 2007 2008 20091 Operating expenditure allowance AEDm 111.42 112.86 114.31 115.79 2 Opening RAV AEDm 8,708.95 9,547.74 10,346.53 11,105.32 3 Closing RAV AEDm 9,547.74 10,346.53 11,105.32 11,824.11 4 Mid-Year RAV AEDm 9,128.35 9,947.14 10,725.93 11,464.72 5 Total depreciation for PC3 AEDm 361.21 401.21 441.21 481.21 6 Forecast for revenue driver 1 Fixed term 1.00 1.00 1.00 1.00 7 Forecast for revenue driver 2 M W 4,397 4,824 5,073 5,6328 Forecast for revenue driver 3 GWh 23,419 27,043 28,443 31,5739 PV of financial adjustments AEDm -133.59
10 Cost of capital (real) 5.00%11 Weight in revenue for Revenue driver 1 70.00%12 Weight in revenue for Revenue driver 2 15.00%13 Weight in revenue for Revenue driver 3 15.00%14 Negative X Factor 0.00
PC3 Required Revenue Calculations 2006 2007 2008 2009
15 Operating expenditure allowance AEDm 111.42 112.86 114.31 115.79 412.42 16 Total depreciation for PC3 AEDm 361.21 401.21 441.21 481.21 1,521.62 17 Return on mid-year RAV AEDm 456.42 497.36 536.30 573.24 1,865.64 18 Annual revenue requirement before financial adjustment AEDm 929.05 1,011.42 1,091.82 1,170.23 3,799.68 19 Discounted annual revenue requirement before financial adjustment AEDm 906.66 940.05 966.45 986.53 3,799.68 20 PV of financial adjustments AEDm -133.5921 PV of revenue requirement after financial adjustment AEDm 3,666.09
PC3 Required Forecast and Profiling 2006 2007 2008 200922 Revenue driver 1 Revenue driver forecast 1.00 1.00 1.00 1.0023 Fixed revenue term (a) AEDm 706.27 706.27 706.27 706.27 24 Revenue forecast AEDm 706.27 706.27 706.27 706.27 2,566.26 25 Share of revenue % 73% 73% 73% 73% 70%
26 Revenue driver 2 Revenue driver forecast kW 4,396,959 4,823,581 5,073,263 5,631,607 Constraints for Solver Run27 Co-efficeint of variable revenue term (b) AED / kW 30.53 30.53 30.53 30.53 28 Revenue forecast AEDm 134.24 147.26 154.88 171.93 549.91 29 Share of revenue % 14% 15% 16% 18% 15%
30 Revenue driver 3 Revenue driver forecast kWh 23,418,555,391 27,042,924,518 28,442,741,683 31,573,041,48531 Co-efficeint of variable revenue term (c) fils / kWh 0.55 0.55 0.55 0.55 32 Revenue forecast AEDm 129.06 149.04 156.75 174.00 549.91 33 Share of revenue % 13% 15% 16% 18% 15%
Variables for Solver Run34 Annual revenue AEDm 969.57 1,002.57 1,017.91 1,052.21 TOTAL Difference35 Discounted annual revenue at 1 January 2006 AEDm 946.21 931.82 901.02 887.03 3,666.1 0.00
Target for Solver Run
Results 200636 X Factor 0.037 Fixed revenue term (a) AED million 706.2738 Co-efficeint of variable revenue term (b) AED / kW metered 30.5339 Co-efficeint of variable revenue term (c) fils / kWh metered 0.55
Implied Financial Indicators 2006 2007 2008 2009
40 Implied annual profit AEDm 496.95 488.51 462.39 455.21 475.7641 Implied return on mid-point RAV % 5.44% 4.91% 4.31% 3.97% 4.66%
PV Share in TOTAL
Average
PV over PC3 Periodat 1 January 2006

Title: 2005 Price Controls Review � Draft Proposals Issue No.: 1 Rev (0) Prepared by:
AR/MPC/MMH Document No. CR/E02/022 Issue Date: 27/07/05
Approved by: NSC
Page 137 of 137
Appendix B.12: TRANSCO Water � Price Control Calculations
Line No. (all AED amounts are in 2006 prices)
Inputs 2006 2007 2008 20091 Operating expenditure allowance AEDm 216.82 220.41 224.06 227.79 2 Opening RAV AEDm 5,611.03 6,074.14 6,512.26 6,925.37 3 Closing RAV AEDm 6,074.14 6,512.26 6,925.37 7,313.48 4 Mid-Year RAV AEDm 5,842.59 6,293.20 6,718.81 7,119.42 5 Total depreciation for PC3 AEDm 286.89 311.89 336.89 361.89 6 Forecast for revenue driver 1 Fixed term 1.00 1.00 1.00 1.00 7 Forecast for revenue driver 2 M IGD 526 557 587 6228 Forecast for revenue driver 3 M G 175,056 197,206 207,827 220,2199 PV of financial adjustments AEDm -41.44
10 Cost of capital (real) 5.00%11 Weight in revenue for Revenue driver 1 70.00%12 Weight in revenue for Revenue driver 2 15.00%13 Weight in revenue for Revenue driver 3 15.00%14 Negative X Factor 0.00
PC3 Required Revenue Calculations 2006 2007 2008 2009
15 Operating expenditure allowance AEDm 216.82 220.41 224.06 227.79 806.82 16 Total depreciation for PC3 AEDm 286.89 311.89 336.89 361.89 1,173.13 17 Return on mid-year RAV AEDm 292.13 314.66 335.94 355.97 1,175.00 18 Annual revenue requirement before financial adjustment AEDm 795.84 846.96 896.89 945.65 3,154.95 19 Discounted annual revenue requirement before financial adjustment AEDm 776.66 787.19 793.90 797.20 3,154.95 20 PV of financial adjustments AEDm -41.4421 PV of revenue requirement after financial adjustment AEDm 3,113.51
PC3 Required Forecast and Profiling 2006 2007 2008 200922 Revenue driver 1 Revenue driver forecast 1.00 1.00 1.00 1.0023 Fixed revenue term (a) AEDm 599.82 599.82 599.82 599.82 24 Revenue forecast AEDm 599.82 599.82 599.82 599.82 2,179.46 25 Share of revenue % 72% 72% 72% 72% 70%
26 Revenue driver 2 Revenue driver forecast TIGD 526,000 557,000 587,000 622,000 Constraints for Solver Run27 Co-efficeint of variable revenue term (b) AED / TIGD 225.08 225.08 225.08 225.08 28 Revenue forecast AEDm 118.39 125.37 132.12 140.00 467.03 29 Share of revenue % 14% 15% 16% 17% 15%
30 Revenue driver 3 Revenue driver forecast TIG 175,056,482 197,205,850 207,827,350 220,219,10031 Co-efficeint of variable revenue term (c) AED / TIG 0.65 0.65 0.65 0.65 32 Revenue forecast AEDm 112.96 127.26 134.11 142.11 467.03 33 Share of revenue % 14% 15% 16% 17% 15%
Variables for Solver Run34 Annual revenue AEDm 831.17 852.44 866.05 881.92 TOTAL Difference35 Discounted annual revenue at 1 January 2006 AEDm 811.14 792.29 766.60 743.48 3,113.5 0.00
Target for Solver Run
Results 200636 X Factor 0.037 Fixed revenue term (a) AED million 599.8238 Co-efficeint of variable revenue term (b) AED / TIGD metered 225.0839 Co-efficeint of variable revenue term (c) AED / TIG metered 0.65
Implied Financial Indicators 2006 2007 2008 2009
40 Implied annual profit AEDm 327.46 320.15 305.10 292.25 311.24 41 Implied return on mid-point RAV % 5.60% 5.09% 4.54% 4.10% 4.83%
PV over PC3 Periodat 1 January 2006
PV Share in TOTAL
Average