2005-06 Private School Universe Survey (PSS) Data …€“06 Private School Universe Survey (PSS)...
213
NCES 2009-310 U.S. DEPARTMENT OF EDUCATION 2005–06 Private School Universe Survey (PSS) Data File User’s Manual and Survey Documentation
-
Upload
truongminh -
Category
Documents
-
view
216 -
download
2
Transcript of 2005-06 Private School Universe Survey (PSS) Data …€“06 Private School Universe Survey (PSS)...

NCES 2009-310 U.S. DEPARTMENT OF EDUCATION
2005–06 Private School Universe Survey (PSS) Data File User’s Manual and Survey Documentation

2005–06 Private School Universe Survey (PSS) Data File User’s Manual and Survey Documentation March 2009 Steven Tourkin Nancy Swaim Xiaodong Guan Jennifer Peterson Robert Abramson Bei Zhang Randall Parmer Sarah Andriani Jill Harbison Meagan Wilson Julie McCune Joel Martin U.S. Census Bureau Patrick Keaton Formerly of the U.S. Census Bureau Stephen Broughman National Center for Education Statistics Elizabeth Walter Synectics for Management Decisions, Inc.
NCES 2009-310 U.S. DEPARTMENT OF EDUCATION

U.S. Department of Education Arne Duncan Secretary
Institute of Education Sciences Sue Betka Acting Director
National Center for Education Statistics Stuart Kerachsky Acting Commissioner
The National Center for Education Statistics (NCES) is the primary federal entity for collecting, analyzing, and reporting data related to education in the United States and other nations. It fulfills a congressional mandate to collect, collate, analyze, and report full and complete statistics on the condition of education in the United States; conduct and publish reports and specialized analyses of the meaning and significance of such statistics; assist state and local education agencies in improving their statistical systems; and review and report on education activities in foreign countries.
NCES activities are designed to address high-priority education data needs; provide consistent, reliable, complete, and accurate indicators of education status and trends; and report timely, useful, and high-quality data to the U.S. Department of Education, the Congress, the states, other education policymakers, practitioners, data users, and the general public. Unless specifically noted, all information contained herein is in the public domain.
We strive to make our products available in a variety of formats and in language that is appropriate to a variety of audiences. You, as our customer, are the best judge of our success in communicating information effectively. If you have any comments or suggestions about this or any other NCES product or report, we would like to hear from you. Please direct your comments to
National Center for Education Statistics Institute of Education Sciences U.S. Department of Education 1990 K Street NW Washington, DC 20006-5651
March 2009
The NCES World Wide Web Home Page address is http://nces.ed.gov. The NCES World Wide Web Electronic Catalog is http://nces.ed.gov/pubsearch.
This publication is only available online. To download, view, and print the report as a PDF file, go to the NCES World Wide Web Electronic Catalog address shown above.
Suggested Citation Tourkin, S., Swaim, N., Guan, X., Peterson, J., Abramson, R., Zhang, B., Parmer, R., Andriani, S., Harbison, J., Wilson, M., McCune, J., Martin, J., Keaton, P., Broughman, S., & Walter, E. (2009). 2005–06 Private School Universe Survey (PSS) Data File User’s Manual and Survey Documentation (NCES 2009-310). National Center for Education Statistics, Institute of Education Sciences, U.S. Department of Education. Washington, DC.
Content Contact Stephen Broughman (202) 502-7315 [email protected]

iii
Contents List of Tables ................................................................................................................................................ v I. Overview ................................................................................................................................................... 1
Target Population ..................................................................................................................................... 1 Purpose and Content of the Survey .......................................................................................................... 1 Content of the Manual .............................................................................................................................. 1
II. Frame Creation ......................................................................................................................................... 2
List Frame ................................................................................................................................................. 2 Area Frame ............................................................................................................................................... 3
Certainty PSUs ..................................................................................................................................... 3 Noncertainty PSUs ............................................................................................................................... 3 Total Area-Frame Sample .................................................................................................................... 4
Changes in Frame Creation Methodology From 2003–04 to 2005–06 .................................................... 4 III. Data Collection ....................................................................................................................................... 5
Time Frame of the Survey ........................................................................................................................ 5 Data Collection Procedures ...................................................................................................................... 5
Questionnaire Mailings and Reminder Postcards ................................................................................ 5 Nonresponse Follow-up ....................................................................................................................... 5 Status at the End of Data Collection .................................................................................................... 7
Changes in Data Collection Procedures From 2003–04 to 2005–06 ........................................................ 8 IV. Response Rates ....................................................................................................................................... 9
Survey Response Rates ............................................................................................................................. 9 Item Response Rates ............................................................................................................................... 10
V. Data Processing and Imputation ............................................................................................................. 13
Questionnaire Check-in .......................................................................................................................... 13 Data Capture ........................................................................................................................................... 13 Reformatting ........................................................................................................................................... 13
Merging Data Files ............................................................................................................................. 13 Name and Address Updates ............................................................................................................... 13
Preliminary Interview Status .................................................................................................................. 13 Computer Pre-Edit .................................................................................................................................. 14 Computer Edit ........................................................................................................................................ 14 Final Interview Status ............................................................................................................................. 14 Imputation ............................................................................................................................................... 15
First-Stage Imputation ........................................................................................................................ 15 Second-Stage Imputation ................................................................................................................... 16 Clerical Imputation ............................................................................................................................. 16 Changes to PSS Variables During Imputation ................................................................................... 17

iv 2005–06 PSS Data File User’s Manual and Survey Documentation
VI. Weighting and Variance Estimation ..................................................................................................... 18 Weighting ............................................................................................................................................... 18 Variance Estimation ............................................................................................................................... 19
Producing Replicate Weights ............................................................................................................. 19 Applying Replicate Weights .............................................................................................................. 19
Changes in Weighting Procedures From 2003–04 to 2005–06 .............................................................. 20 VII. Quality of PSS Data ............................................................................................................................ 21
Reviewing the Quality of PSS Data........................................................................................................ 21 Area Frame Contribution to Estimates ................................................................................................... 21 Capture-Recapture Estimate of PSS Coverage ....................................................................................... 24 Comparability With Other Estimates ...................................................................................................... 24
Current Population Survey Data ........................................................................................................ 25 National Catholic Educational Association Data ............................................................................... 25 Prior PSS Data .................................................................................................................................... 26
VIII. Information on Data Files .................................................................................................................. 27
Availability of Data ................................................................................................................................ 27 Restricted-Use Data File .................................................................................................................... 27 Public-Use Data File .......................................................................................................................... 28 Address Data File ............................................................................................................................... 28
Understanding the Data Files ................................................................................................................. 29 Categories of Variables ...................................................................................................................... 29 Linking to PSS Files for Other Years ................................................................................................. 29
IX. User Notes and Cautions ...................................................................................................................... 30 References ................................................................................................................................................... 31 Appendixes Appendix A. Key Terms for PSS ......................................................................................................... A-1 Appendix B. Questionnaire .................................................................................................................. B-1 Appendix C. Private School Lists Received and Processed ................................................................. C-1 Appendix D. 2005–06 PSS Area Frame Counties ................................................................................ D-1 Appendix E. Selected Weighted Response Rate Tables ...................................................................... E-1 Appendix F. Pre-Edit Rejections of PSS Data ...................................................................................... F-1 Appendix G. Count of Changes Made During Editing and Imputation ............................................... G-1 Appendix H. Variable Categories Used in Developing Adjustment Factor Cells for Weighting ........ H-1 Appendix I. PSS Public-Use Codebook ................................................................................................I-1 Appendix J. Variable List for the 2005–06 PSS Address File ............................................................. J-1

Contents v
List of Tables Table Page 1. Number and percentage of PSS cases, by source: 2005–06 .............................................................. 2 2. PSS data collection time schedule: 2005–06 ..................................................................................... 5 3. Number and percentage of PSS cases in telephone follow-up, by response status and
telephone center: 2005–06 ................................................................................................................. 6 4. Number and percentage of PSS cases in field follow-up, by response status: 2005–06 ................... 6 5. Number and percentage of PSS cases, by interview status at end of data collection: 2005–06 ........ 7 6. Number and percentage of completed PSS interviews at end of data collection, by mode of
data collection: 2005–06 .................................................................................................................... 8 7. Weighted and unweighted number of PSS interviews and noninterviews, and weighted
response rates, by frame: 2005–06 .................................................................................................... 9 8. Weighted and unweighted number of PSS interviews and noninterviews, and weighted
response rates, for traditional private schools, by frame: 2005–06 ................................................... 9 9. Weighted and unweighted number of PSS interviews and noninterviews, and weighted
response rates, for kindergarten-terminal private schools, by frame: 2005–06 ............................... 10 10. PSS item response rates for traditional private schools: 2005–06 ................................................... 11 11. PSS item response rates for kindergarten-terminal private schools: 2005–06 ................................ 12 12. Summary of changes made to PSS questionnaire variables during the pre-edit and edit:
2005–06 ........................................................................................................................................... 14 13. Number of PSS cases, by preliminary and final interview status, and the percentage change
between preliminary and final interview status: 2005–06 ............................................................... 15 14. Summary of changes made to PSS questionnaire variables during imputation, by type of
change: 2005–06 .............................................................................................................................. 17 15. Weighted number of traditional private schools by frame and percentage of total schools
from the area frame, by NCES typology: 2005–06 ......................................................................... 22 16. Weighted number of traditional private school students by frame and percentage of total
students from the area frame, by NCES typology: 2005–06 ........................................................... 22 17. Weighted number of traditional private school teachers (headcount) by frame and percentage
of total teachers from the area frame, by NCES typology: 2005–06 ............................................... 23 18. Weighted number of kindergarten-terminal private schools, students, and teachers
(headcount) by frame and the percentage of schools, students, and teachers from the area frame, by NCES three-level typology: 2005–06 ............................................................................. 23
19. Weighted number of PSS Catholic schools, students, and teachers compared to those of the National Catholic Educational Association, by level: 2005–06 ...................................................... 25
20. Weighted number of private schools, students, and teachers, by level: 1989–90, 1991–92, 1993–94, 1995–96, 1997–98, 1999–2000, 2001–02, 2003–04, and 2005–06 ................................. 26
C-1. Private school association lists received and processed: 2005–06 ................................................ C-1 C-2. State agency early childhood center lists, by state, selection for follow-up, and whether
received or processed: 2005–06 .................................................................................................... C-2 D-1. PSS area frame counties, by PSS county number, state, and overlap/nonoverlap status:
2005–06 ......................................................................................................................................... D-1 E-1. Weighted and unweighted number of PSS interviews and noninterviews, and weighted
response rates, by NCES typology: 2005–06 ................................................................................ E-2

vi 2005–06 PSS Data File User’s Manual and Survey Documentation
Table Page E-2. Weighted and unweighted number of PSS interviews and noninterviews, and weighted
response rates, by religious or nonsectarian orientation of school: 2005–06 ................................ E-3 E-3. Final weighted item response rates for traditional private schools for item 9d-2yr
(percentage of last-years graduates that went to 2-year colleges), by selected characteristics: 2005–06 ......................................................................................................................................... E-4
E-4. Final weighted item response rates for kindergarten-terminal private schools for item 7a (number of Hispanic students), by selected characteristics: 2005–06 ........................................... E-5
E-5. Final weighted item response rates for kindergarten-terminal private schools for item 7b (number of White, non-Hispanic students), by selected characteristics: 2005–06 ........................ E-6
E-6. Final weighted item response rates for kindergarten-terminal private schools for item 7c (number of Black, non-Hispanic students), by selected characteristics: 2005–06 ........................ E-7
E-7. Final weighted item response rates for kindergarten-terminal private schools for item 7d (number of Asian or Pacific Islander students), by selected characteristics: 2005–06 .................. E-8
E-8. Final weighted item response rates for kindergarten-terminal private schools for item 7e (number of American Indian or Alaska Native students), by selected characteristics: 2005–06 ......................................................................................................................................... E-9
E-9. Final weighted item response rates for kindergarten-terminal private schools for item 8b (number of male students), by selected characteristics: 2005–06 ............................................... E-10
E-10. Final weighted item response rates for kindergarten-terminal private schools for item 15 (membership in private school associations), by selected characteristics: 2005–06 ................... E-11
E-11. Final weighted item response rates for kindergarten-terminal private schools for item 16 (number of days in the school year), by selected characteristics: 2005–06 ................................. E-12
F-1. Number and percentage of pre-edit rejections of PSS data, by rejection reason:
2005–06 .......................................................................................................................................... F-1 F-2. Number of changes made to PSS variables during the pre-edit: 2005–06 ..................................... F-4 G-1. PSS second-stage imputation variables: 2005–06 ......................................................................... G-1 G-2. PSS second-stage imputation matching variables and collapsing order: 2005–06 ........................ G-2 G-3. Number of changes made to PSS variables during editing and imputation: 2005–06 ................... G-3
1
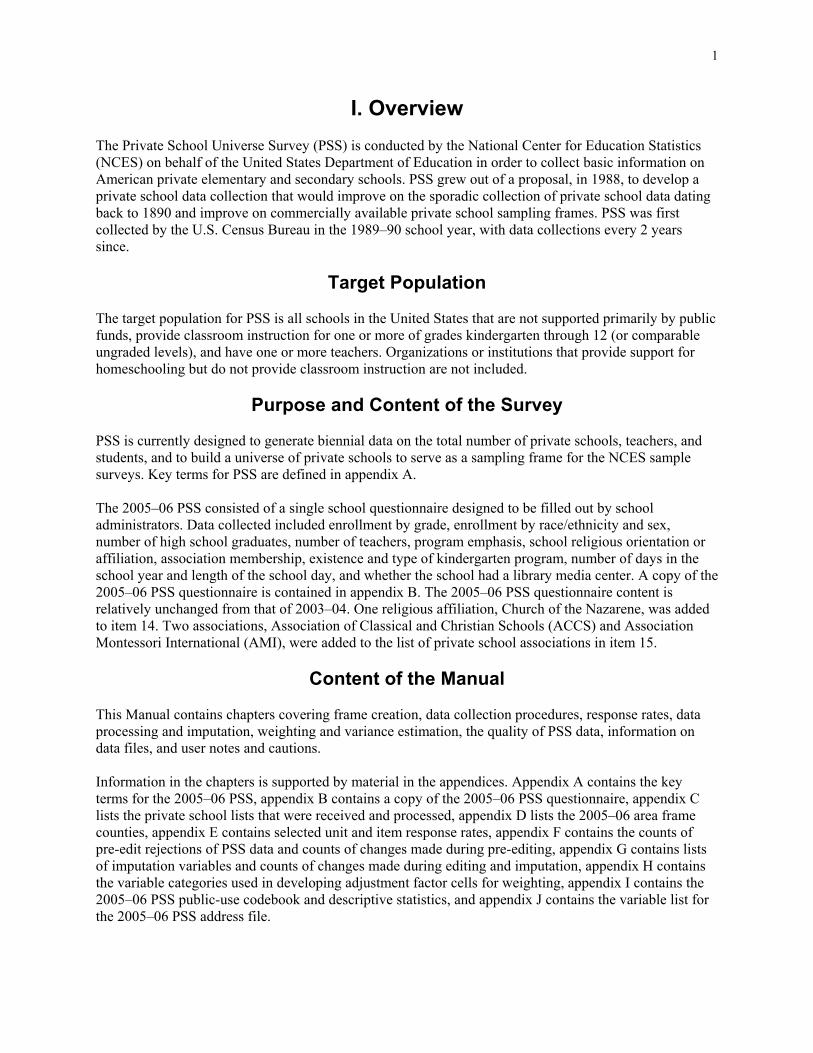
I. Overview The Private School Universe Survey (PSS) is conducted by the National Center for Education Statistics (NCES) on behalf of the United States Department of Education in order to collect basic information on American private elementary and secondary schools. PSS grew out of a proposal, in 1988, to develop a private school data collection that would improve on the sporadic collection of private school data dating back to 1890 and improve on commercially available private school sampling frames. PSS was first collected by the U.S. Census Bureau in the 1989–90 school year, with data collections every 2 years since.
Target Population The target population for PSS is all schools in the United States that are not supported primarily by public funds, provide classroom instruction for one or more of grades kindergarten through 12 (or comparable ungraded levels), and have one or more teachers. Organizations or institutions that provide support for homeschooling but do not provide classroom instruction are not included.
Purpose and Content of the Survey PSS is currently designed to generate biennial data on the total number of private schools, teachers, and students, and to build a universe of private schools to serve as a sampling frame for the NCES sample surveys. Key terms for PSS are defined in appendix A. The 2005–06 PSS consisted of a single school questionnaire designed to be filled out by school administrators. Data collected included enrollment by grade, enrollment by race/ethnicity and sex, number of high school graduates, number of teachers, program emphasis, school religious orientation or affiliation, association membership, existence and type of kindergarten program, number of days in the school year and length of the school day, and whether the school had a library media center. A copy of the 2005–06 PSS questionnaire is contained in appendix B. The 2005–06 PSS questionnaire content is relatively unchanged from that of 2003–04. One religious affiliation, Church of the Nazarene, was added to item 14. Two associations, Association of Classical and Christian Schools (ACCS) and Association Montessori International (AMI), were added to the list of private school associations in item 15.
Content of the Manual This Manual contains chapters covering frame creation, data collection procedures, response rates, data processing and imputation, weighting and variance estimation, the quality of PSS data, information on data files, and user notes and cautions. Information in the chapters is supported by material in the appendices. Appendix A contains the key terms for the 2005–06 PSS, appendix B contains a copy of the 2005–06 PSS questionnaire, appendix C lists the private school lists that were received and processed, appendix D lists the 2005–06 area frame counties, appendix E contains selected unit and item response rates, appendix F contains the counts of pre-edit rejections of PSS data and counts of changes made during pre-editing, appendix G contains lists of imputation variables and counts of changes made during editing and imputation, appendix H contains the variable categories used in developing adjustment factor cells for weighting, appendix I contains the 2005–06 PSS public-use codebook and descriptive statistics, and appendix J contains the variable list for the 2005–06 PSS address file.

2
II. Frame Creation Since PSS attempts to include every private school in the United States, a universe list of private schools meeting the PSS definition (i.e., not supported primarily by public funds, providing classroom instruction for one or more of grades kindergarten through 12—or comparable ungraded levels, and having one or more teachers) must be created. Since 1983, NCES has used a dual frame approach for building the private school universe (Beller 1984). The dual frame consists of a list frame and an area frame. The combination of the list frame schools and additional schools identified in the area search comprised schools included in the 2005–06 PSS.
List Frame The list-building component was the primary means for improving coverage of private schools. The basis for the 2005–06 PSS list frame was the 31,287 private schools from the 2003–04 PSS list frame (table 1). Additionally, 2,280 programs identified in the 2003–04 PSS as prekindergarten only were included in case any of these programs included at least a kindergarten in the 2005–06 school year. In order to provide coverage of private schools founded since 2003 and to improve coverage of private schools existing in 2003, the Census Bureau requested membership lists from 29 private school associations and religious denominations; all 29 lists were received and processed. (See table C-1 in appendix C.) The departments of education from each of the 50 states and the District of Columbia were asked to provide lists of private schools, and all 51 lists were received and processed. Additional private schools that submitted requests to NCES to be included in PSS were added to the list frame. Table 1. Number and percentage of PSS cases, by source: 2005–06
Source Number Percent Total 40,501 100.0
List frame 38,695 95.5
2003–04 PSS 33,567 82.9 Base list 31,287 77.2 Prekindergarten-only cases 2,280 5.6
2005 lists 5,128 12.7 Traditional lists1 3,736 9.2 Early-childhood lists 1,392 3.4
Area frame 1,806 4.5 1 Traditional lists are those received from state departments of education or private school associations. NOTE: Detail may not sum to totals because of rounding. SOURCE: U.S. Department of Education, National Center for Education Statistics, Private School Universe Survey (PSS), 2005–06. Beginning in 1995, the PSS private school definition was expanded to include schools for which kindergarten is the highest grade (kindergarten terminal or k-terminal schools). In 2005, a separate list-building operation (early childhood operation) was conducted to identify k-terminal schools. Requests for lists of programs that might include a kindergarten were made to sources other than state departments of education in all 50 states and the District of Columbia, including state departments of health or recreation, state child care licensing agencies, and child care referral agencies. Although early childhood lists were

II. Frame Creation 3
requested for all states and the District of Columbia, 19 states were selected in advance for follow-up in the event that they did not respond to the initial request for lists. If the remaining 32 states did not respond to the initial early childhood list request, no additional effort was made to obtain the lists. In 2005, 27 lists were received and 19 lists were processed. (See table C-2 in appendix C.) Schools on private school association membership lists, the state lists, and the early childhood lists were compared to the base list, and any school that did not match a school on the base list was added to the NCES private school universe list. The total number of private schools added by the 2005–06 list frame operation was 5,128, including 3,736 from the traditional operation and 1,392 from the early childhood operation (table 1).
Area Frame To identify private schools that may have been overlooked in the list-building component, a group of geographic areas were selected to be searched for private schools. The United States is divided by the Census Bureau into 2,062 primary sampling units (PSUs), each PSU consisting of a single county, independent city, or group of contiguous counties. The area frame consists of a sample of these 2,062 PSUs. The 2005–06 PSS area frame was designed to produce an approximately 50 percent overlap with the 2003–04 PSS area frame to maintain the reliability of estimates of change at a reasonable level. Certainty PSUs The eight PSUs (Los Angeles and Orange Counties, California; Harris County, Texas; Cook County, Illinois; Queens and Kings Counties, New York; Miami-Dade County, Florida; and Philadelphia County, Pennsylvania) with the highest private school enrollment in the 2000 decennial census were included in the 2005–06 PSS area frame with certainty. Noncertainty PSUs All 58 noncertainty PSUs that had been selected for the 2003–04 PSS area frame as nonoverlap sample PSUs were selected again for the 2005–06 PSS. An additional 58 PSUs were selected independently1 of the overlap sample from the 2,054 noncertainty PSUs. The strata for selecting the nonoverlap PSUs were defined the same way as in the 2003–04 PSS area frame design. Initially, 16 strata were created: region (Northeast, Midwest, South, West), metro/nonmetro status, and high/low percent private enrollment within metro/nonmetro status (i.e., above or below the median private school enrollment within each metro/nonmetro status). The high/low cutoffs were then adjusted so as to more nearly equalize the expected variance between the two strata. The purpose of this was to try to lower the overall standard errors resulting from the sample of PSUs. Sample sizes were determined for each metropolitan statistical area status within each region, proportional to the measure of size.2 Some adjustments were made so that each sample size was an even number and that sample size was evenly distributed between the high and low groups. This was done in
1 The nonoverlap PSUs are selected independently of the overlap sample to avoid the complicated calculation of conditional probabilities of selection that a dependent selection would entail. If an overlap sample PSU is selected for the nonoverlap sample, that PSU would be considered as part of the overlap sample and the number of PSUs in the nonoverlap sample would be reduced by one. 2 The PSS sample PSUs were selected systematically with probabilities proportional to the square root of the Census 2000 PSU private school enrollment.

4 2005–06 PSS Data File User’s Manual and Survey Documentation
order to have an even number of cases in each stratum (with a minimum of two) for pairing purposes for calculating the PSS variances. Total Area-Frame Sample A total of 124 PSUs (162 counties) were in the area sample. The 2005–06 PSS area frame counties are listed in table D-1 of appendix D. Within each of these PSUs, the Census Bureau attempted to find all eligible private schools. A block-by-block listing of all private schools in a sample of PSUs was not attempted. Rather, regional office field staff created the frame by using such sources as yellow pages, local Catholic dioceses, non-Catholic religious institutions, local education agencies, and local government offices. Once the area search lists were constructed, they were matched with the list frame. Schools that did not match the list frame were considered part of the area frame. The number of schools added to the universe by the 2005–06 area-frame operation was 1,806 (table 1).
Changes in Frame Creation Methodology From 2003–04 to 2005–06
There was one change in the 2005–06 PSS frame creation methodology. For the 2003–04 PSS area frame, ten PSUs were selected with certainty. Eight of these ten PSUs were originally designated as “certainty PSUs” for the 1983 National Private School Survey3 based on their large population size; these were the eight PSUs whose populations exceeded 1.7 million in the 1980 Census of Population. Prior to the selection of the 2003–04 area frame, an evaluation of the set of eight certainty PSUs was conducted using PSU private school enrollment counts from the 2000 decennial census. The eight PSUs with the highest private school enrollment were selected to be the new “certainty PSUs.” This revised set of certainty PSUs contains two new certainty PSUs (Miami-Dade County, Florida, and Philadelphia County, Pennsylvania) that were not members of the eight original certainty PSUs. Two of the original eight certainty PSUs (San Diego County, California, and Wayne County, Michigan) were dropped as certainty PSUs. In order to maintain the reliability of estimates of change during the transition from the original (2001–02 PSS) set of eight certainty PSUs to the revised set of eight certainty PSUs, all of the original eight and the two new PSUs were included with certainty for 2003–04. In 2005–06, the two outgoing certainty PSUs were dropped from certainty status and included in the noncertainty PSU selection as described above.
3 The PSUs designated as “certainty PSUs” for the 1983 National Private School Survey include the counties of Los Angeles, Orange, and San Diego, California; Harris County, Texas; Cook County, Illinois; Wayne County, Michigan; and Queens and Kings Counties, New York.

5
III. Data Collection
Time Frame of the Survey The 2005–06 PSS data were collected during the 2005–06 school year. Table 2 shows the specific data collection activities and the time frame when each occurred. Table 2. PSS data collection time schedule: 2005–06
Activity Month of activity Initial mailing Nov. 2005 Initial mailing of reminder postcards Nov. 2005 Internet data collection Nov. 2005–Jan. 2006 Second mailing of PSS questionnaires Dec. 2005 Second mailing of PSS reminder postcards Jan. 2006 Telephone follow-up for PSS nonresponse cases Jan.–Mar. 2006 Field follow-up for cases with no phone numbers Feb.–Mar. 2006 Field follow-up for mail and telephone nonresponse cases Apr.–May 2006
SOURCE: U.S. Department of Education, National Center for Education Statistics, Private School Universe Survey (PSS), 2005–06.
Data Collection Procedures The 2005–06 PSS utilized a mailout/mailback and Internet data collection methodology. Follow-up of nonresponding cases was conducted first by computer-assisted telephone interviewing (CATI), and then by Census Bureau field representatives. Questionnaire Mailings and Reminder Postcards The Census Bureau began mailing PSS questionnaires to a total of 38,3844 private schools on November 7, 2005. Beginning on December 27, 2005, and finishing on December 30, 2005, a second PSS questionnaire was sent to schools not responding to the first. A reminder postcard was sent 1 week after each mailout. The PSS (mail and Internet) return rate at the end of the first PSS mailout period (December 22, 2005) was 41 percent, and the cumulative return rate at the end of the second PSS mailout period (January 31, 2006) was 53 percent.5 Nonresponse Follow-up
Telephone Follow-up Telephone interviewing for PSS schools that had not responded by mail or Internet but for which phone numbers were available began on January 31, 2006. An additional 1,806 schools from the area frame
4 The first mailout excluded 245 schools affected by Hurricanes Katrina and Rita, but these schools were subsequently mailed a PSS questionnaire. 5 The return rates cited in the data collection portion of the documentation are unweighted return rates calculated by dividing the total number of returns (interviews, refusals, and out-of-scopes) less undeliverable as addressed/blank questionnaires by the total number of schools in the private school universe.

6 2005–06 PSS Data File User’s Manual and Survey Documentation
operation and 66 new list frame schools were added to the workload at this time. Telephone interviewing took place at the Census Bureau’s CATI facilities located in Jeffersonville, Indiana, and Tucson, Arizona. CATI follow-up for PSS cases continued through March 13, 2006. Of the 19,304 telephone follow-up cases, 51 percent were completed by CATI interviews, 17 percent were out-of-scope (i.e., were not eligible schools), 21 percent were noninterviews (i.e., cases that refused to participate or did not respond), and 10 percent were late mail returns6 (table 3). Table 3. Number and percentage of PSS cases in telephone follow-up, by response status and
telephone center: 2005–06
Telephone center
Completed interview
Total Out-of-scope Noninterview Late mail return
workload Number Percent Number Percent Number Percent Number Percent Total 19,304 9,905 51.3 3,242 16.8 4,147 21.5 2,010 10.4
Jeffersonville, Indiana 11,583 6,000 51.8 2,142 18.5 2,242 19.4 1,199 10.4 Tucson, Arizona 7,721 3,905 50.6 1,100 14.3 1,905 24.7 811 10.5
NOTE: Detail may not sum to totals because of rounding. SOURCE: U.S. Department of Education, National Center for Education Statistics, Private School Universe Survey (PSS), 2005–06.
Field Follow-up On February 2, 2006, the Census Bureau’s 12 Regional Offices began follow-up on 983 PSS cases that did not have a telephone number listed. Field follow-up of these schools continued through March 17, 2006. Of the 983 schools, approximately 77 percent were completed interviews, 14 percent were out-of-scope, and 3 percent were noninterviews; the remaining 6 percent were late mail returns (table 4). Table 4. Number and percentage of PSS cases in field follow-up, by response status: 2005–06
Activity
Completed interview
Field Out-of-scope Noninterview Late mail return
workload Number Percent Number Percent Number Percent Number Percent Total field 2,903 1,483 51.1 1,055 36.3 206 7.1 159 5.5
Schools with no phone number 983 752 76.5 140 14.2 34 3.5 57 5.8 Mail and computer- assisted telephone interviewing (CATI) nonresponse 1,920 731 38.1 915 47.7 172 9.0 102 5.3
NOTE: Detail may not sum to totals because of rounding. SOURCE: U.S. Department of Education, National Center for Education Statistics, Private School Universe Survey (PSS), 2005–06.
6 Late mail returns were questionnaires returned after the closeout of the second mailout period.

III. Data Collection 7
Following CATI closeout in mid-March, additional follow-up of 1,920 mail and telephone nonresponse cases7 was conducted by Census Bureau field representatives. Field follow-up continued through May 31, 2006. Of the 1,920 mail and telephone nonresponse cases sent to field follow-up, approximately 38 percent were completed interviews, 48 percent were out-of-scope, 9 percent were noninterviews, and the remaining 5 percent were late mail returns (table 4). Status at the End of Data Collection By the end of data collection, Census Bureau staff were able to reconcile the status (interview, noninterview, or out-of-scope case) for virtually all PSS cases. At the end of data collection, 75 percent (30,565) of the 40,501 cases were interviews, 20 percent (8,209) were out-of-scope, and 4 percent (1,727) were noninterviews (table 5). The 1,727 noninterviews consisted of 1,548 refusals and 179 nonrespondents. Of the 30,565 completed interviews, 57 percent were completed during the mailout period (36 percent by mail and 21 percent by Internet), 30 percent were completed during telephone follow-up, 5 percent were completed during field follow-up, and 8 percent were late mail returns (table 6). Table 5. Number and percentage of PSS cases, by interview status at end of data collection:
2005–06
Interview status Number Percent Total 40,501 100.0 Completed interview 30,565 75.5 Out-of-scope 8,209 20.3 Noninterview 1,727 4.3 Refusal 1,548 3.8 Other noninterviews 179 0.4
NOTE: After the end of data collection, another 781 cases were determined to be out-of-scope or noninterviews (641 out-of-scope and 140 noninterviews). Detail may not sum to totals because of rounding. SOURCE: U.S. Department of Education, National Center for Education Statistics, Private School Universe Survey (PSS), 2005–06.
7 Of the 4,147 cases that were noninterviews at the end of telephone follow-up, 1,393 were ineligible for field follow-up because they were refusals. An additional 838 of the noninterview cases that were out-of-scope in the 2003–04 PSS were declared out-of-scope for the 2005–06 PSS. Four mail nonresponse cases that were not included in telephone follow-up were added to field follow-up at this point.

8 2005–06 PSS Data File User’s Manual and Survey Documentation
Table 6. Number and percentage of completed PSS interviews at end of data collection, by mode of data collection: 2005–06
Mode of data collection Number Percent Total 30,565 100.0 First mailout 9,316 30.5 Second mailout 1,588 5.2 Late mail returns 2,534 8.3 Internet 6,467 21.2 Computer-assisted telephone interviewing (CATI) follow-up 9,177 30.0 Field follow-up 1,483 4.9
NOTE: After the end of data collection, another 781 cases were determined to be out-of-scope or noninterviews. Detail may not sum to totals because of rounding. SOURCE: U.S. Department of Education, National Center for Education Statistics, Private School Universe Survey (PSS), 2005–06.
Changes in Data Collection Procedures From 2003–04 to 2005–06
Below is a summary of the changes to the 2005–06 PSS data collection procedures.
• In 2003–04, telephone follow-up was conducted from three Census Bureau CATI facilities (Tucson, Arizona; Jeffersonville, Indiana; and Hagerstown, Maryland). In 2005–06, telephone follow-up was conducted from two Census Bureau CATI facilities (Jeffersonville, Indiana, and Tucson, Arizona).
• For the 2005–06 PSS, respondents were given the option during the mailout period of completing
the questionnaire online instead of completing the paper questionnaire. The Internet option was offered to nearly all respondents and was offered concurrently with the mail data collection. Amish and Mennonite schools were excluded from the Internet option. Schools affected by Hurricanes Katrina and Rita were given the option of completing the questionnaire online during the second mailout period.
• In 2003–04, PSS coincided with the data collection phase of the private school component of the
2003–04 Schools and Staffing Survey (SASS). The list-frame private schools selected for SASS were initially excluded from PSS, receiving a SASS private school questionnaire only. SASS was not collected in 2005–06.

9
IV. Response Rates
Survey Response Rates The weighted survey response rates by frame for the 2005–06 PSS are presented in table 7. The weighted survey response rates by frame for traditional and kindergarten-terminal schools are presented in tables 8 and 9, respectively. The weighted response rates were calculated by dividing the number of interview cases weighted by the base weight by the total number of eligible cases weighted by the base weight. The base weight for each sample case is the inverse of the probability of selection. Overall there were 32,865 interviews and 2,159 noninterviews, resulting in a response rate of 93.8 percent (table 7). The response rate for list-frame schools was 94.3 percent, while that for area-frame schools was 90.5 percent. The response rate for traditional schools was 93.6 percent—94.2 percent for list-frame schools and 88.4 percent for area-frame schools (table 8). The response rate for kindergarten-terminal schools was 95.0 percent—94.9 percent for list-frame schools and 95.2 percent for area-frame schools (table 9). Because the response rates for traditional and kindergarten-terminal schools by frame were all greater that 85 percent, no bias analysis was performed. See appendix tables E-1 and E-2 for the number of interviews and noninterviews, and weighted response rates, by NCES typology and by the religious and nonsectarian orientation of the school. Table 7. Weighted and unweighted number of PSS interviews and noninterviews, and weighted
response rates, by frame: 2005–06
Frame type Interviews Noninterviews Weighted response rate
Unweighted Weighted Unweighted Weighted (percent) Total 29,784 32,865 1,867 2,159 93.8 List frame 29,178 29,178 1,771 1,771 94.3 Area frame 606 3,687 96 388 90.5
NOTE: Weighted using the inverse of the probability of selection. After the end of data collection, another 781 cases were determined to be out-of-scope or noninterviews (641 out-of-scope and 140 noninterviews), lowering the number of completed interviews from 30,565 to 29,784, and increasing the number of noninterviews from 1,727 to 1,867. Detail may not sum to totals because of rounding. SOURCE: U.S. Department of Education, National Center for Education Statistics, Private School Universe Survey (PSS), “Documentation Data File,” 2005–06. Table 8. Weighted and unweighted number of PSS interviews and noninterviews, and weighted
response rates, for traditional private schools, by frame: 2005–06
Frame type Interviews Noninterviews Weighted response rate
Unweighted Weighted Unweighted Weighted (percent) Total 24,961 27,093 1,598 1,854 93.6 List frame 24,569 24,569 1,524 1,524 94.2 Area frame 392 2,524 74 330 88.4
NOTE: Weighted using the inverse of the probability of selection. Traditional schools are those for which the highest grade is 1 through 12 or ungraded. Detail may not sum to totals because of rounding. SOURCE: U.S. Department of Education, National Center for Education Statistics, Private School Universe Survey (PSS), “Documentation Data File,” 2005–06.

10 2005–06 PSS Data File User’s Manual and Survey Documentation
Table 9. Weighted and unweighted number of PSS interviews and noninterviews, and weighted response rates, for kindergarten-terminal private schools, by frame: 2005–06
Frame type Interviews Noninterviews Weighted response rate
Unweighted Weighted Unweighted Weighted (percent) Total 4,823 5,771 269 305 95.0 List frame 4,609 4,609 247 247 94.9 Area frame1 214 1,162 22 58 95.2
1 Caution should be used when looking at area frame kindergarten-terminal nonresponse because all cases that lacked sufficient information to determine k-terminal or traditional status were classified as traditional school cases. NOTE: Weighted using the inverse of the probability of selection. Kindergarten-terminal schools are those in which the highest grade is kindergarten. Detail may not sum to totals because of rounding. SOURCE: U.S. Department of Education, National Center for Education Statistics, Private School Universe Survey (PSS), “Documentation Data File,” 2005–06.
Item Response Rates The unweighted and weighted item response rates are presented in tables 10 (traditional schools) and 11 (kindergarten-terminal schools). The unweighted item response rates are the number of sample cases responding to an item divided by the number of sample cases eligible to answer the item, excluding the survey nonrespondents. The weighted item response rates are the number of sample cases weighted by the final weight divided by the number of sample cases eligible to answer the item, excluding the survey nonrespondents, weighted by the final weight. For traditional schools, one item had a weighted response rate of less than 85 percent. The item response rate for item 9d (the percentage of graduates that went to 2-year colleges) was 83.4 percent. For kindergarten-terminal schools, eight items had a weighted item response rate of less than 85 percent. The weighted item response rates for items 7a (number of Hispanic students), 7b (number of White, non-Hispanic students), 7c (number of Black, non-Hispanic students), 7d (number of Asian or Pacific Islander students), 7e (number of American Indian or Alaska Native students), 8b (number of male students), 15 (membership in private school associations), and 16 (days in the school year) were 83.0, 83,6, 83.0, 82.8, 81.1, 79.4, 78.2, and 81.0 percent, respectively. See appendix tables E-3 through E-11 for a breakdown of weighted item response rates for the nine items that had rates below 85 percent by NCES typology, school level, size, and urbanicity type. See chapter V for a description of the imputation procedures used to compensate for item nonresponse.

IV. Response Rates 11
Table 10. PSS item response rates for traditional private schools: 2005–06
Item number Unweighted
response rate Final weighted
response rate Item number Unweighted
response rate Final weighted
response rate 5a 94.9 95.3 9a 99.9 99.9 5b 96.6 96.4 9b 96.3 95.4 5c 96.3 95.2 9c 97.3 97.4 5d 95.7 95.7 9d - 4yr 86.7 86.6 5e 93.0 93.1 9d - 2yr 83.5 83.4
5f 96.2 94.9 10a 99.1 99.1 5g 96.0 94.8 10b 97.9 98.0 5h 95.9 95.0 11a 98.6 98.5 5i 95.9 95.0 11b 96.7 96.8 5j 95.8 94.8 11c 97.0 97.0
5k 95.6 94.5 11d 96.5 96.5 5l 95.5 94.3 11e 96.3 96.4 5m 95.5 94.2 11f 97.1 97.3 5n 93.5 91.6 12a 98.0 98.0 5o 93.4 91.3 12b 99.1 99.2
5p 93.3 91.2 13 99.9 99.8 5q 93.2 90.9 14a 99.8 99.8 6 98.6 98.7 14b 97.4 97.5 7a 90.6 89.6 14c 99.3 99.4 7b 90.6 89.6 14d 97.2 97.3
7c 90.5 89.7 15 89.4 87.2 7d 90.0 89.2 16 94.7 93.5 7e 86.2 85.8 17 98.1 98.0 8a 99.6 99.6 18 99.4 99.2 8b 89.9 90.1
NOTE: Traditional schools are those for which the highest grade is 1 through 12 or ungraded. SOURCE: U.S. Department of Education, National Center for Education Statistics, Private School Universe Survey (PSS), “Documentation Data File,” 2005–06.

12 2005–06 PSS Data File User’s Manual and Survey Documentation
Table 11. PSS item response rates for kindergarten-terminal private schools: 2005–06
Item number Unweighted
response rate Final weighted
response rate Item number Unweighted
response rate Final weighted
response rate 5a † † 9a 100.0 100.0 5b 97.9 97.7 9b † † 5c 98.1 98.1 9c † † 5d 96.6 96.7 9d - 4yr † † 5e 94.6 94.6 9d - 2yr † †
5f † † 10a 95.8 95.4 5g † † 10b 98.3 98.6 5h † † 11a 97.6 97.9 5i † † 11b 94.1 95.0 5j † † 11c 94.0 94.9
5k † † 11d 93.8 94.7 5l † † 11e 93.9 94.8 5m † † 11f 94.2 95.0 5n † † 12a 99.4 99.1 5o † † 12b 98.7 98.7
5p † † 13 99.8 99.8 5q † † 14a 99.5 99.6 6 99.1 99.3 14b 95.6 96.4 7a 83.7 83.0 14c 97.0 97.6 7b 84.5 83.6 14d 93.4 91.7
7c 83.7 83.0 15 81.6 78.2 7d 83.6 82.8 16 81.7 81.0 7e 81.5 81.1 17 86.4 86.9 8a 98.3 98.6 18 99.0 99.1 8b 77.9 79.4
† Not applicable. NOTE: Kindergarten-terminal are schools in which the highest grade is kindergarten. SOURCE: U.S. Department of Education, National Center for Education Statistics, Private School Universe Survey (PSS), “Documentation Data File,” 2005–06.

13
V. Data Processing and Imputation
Questionnaire Check-in Paper questionnaires returned by individual respondents and those completed by field representatives during field follow-up were sent to the Census Bureau’s National Processing Center (NPC) in Jeffersonville, Indiana. Upon receipt, codes were assigned to each questionnaire to indicate its status (e.g., complete interview, refusal, school closed). Then the questionnaires were grouped into batches for data capture.
Data Capture Manual data keying for the 2005–06 PSS was accomplished using a Key from Paper (KFP) data capture system. The KFP system was programmed to present screens of questionnaire items to data keying staff, who worked through each page of the questionnaire and keyed any entries into the appropriate fields on the screens. All non-blank data fields were 100 percent verified. Following data capture, the questionnaires were disassembled and each page was scanned. After all the batches had been processed, the output file was sent to the Census Bureau’s Demographic Surveys Division (DSD) for review. Any problems with the data were reported to NPC for correction and resubmission of the output file to DSD.
Reformatting Merging Data Files After the PSS questionnaire data were captured, the output files from the different sources (keyed, Internet, and CATI) were reformatted into SAS datasets and then merged into one file. Some variables on the CATI output files had to be recoded to be consistent with those from the PSS paper questionnaire output file. Name and Address Updates Corrections to the name, address, and telephone numbers supplied by the respondents were applied to the PSS file during the reformatting phase. These corrections were keyed, either by NPC or during the CATI interviews. Name, address, or telephone number corrections were made only to records where the respondent indicated that a change was necessary. To minimize the introduction of address errors to the PSS file, the address corrections were checked with Postalsoft software, a commercial software package that corrects and standardizes addresses.
Preliminary Interview Status The next step in processing was to make a preliminary determination of each case’s interview status recode (ISR); that is, whether it was an interview, a noninterview, or out-of-scope. In general, those cases with “out-of-scope” check-in codes (assigned by clerks to the paper questionnaires when they were received by the Census Bureau) or “out-of-scope” final outcome codes (assigned by CATI interviewers) were classified as out-of-scope (ISR = 3) for the preliminary ISR. Otherwise, cases with data entries were classified as interviews (ISR = 1) and those with no data were classified as noninterviews (ISR = 2).

14 2005–06 PSS Data File User’s Manual and Survey Documentation
Computer Pre-Edit After the preliminary ISR classification, interview records (ISR = 1) on the data file were processed through a computer pre-edit designed to identify inconsistencies and invalid entries. This pre-edit program generated lists of cases where there were potential data problems. Census Bureau staff reviewed the computer record of cases that met each pre-edit rejection condition. Whenever possible, unacceptable entries were corrected by using information reported in other questionnaire items or information from other sources. Wrong entries that could not be corrected were blanked in the data record. The procedures described above are referred to as “pre-edits” because they took place before the regular PSS editing and imputation. (See appendix table F-1 for the number of records rejected by pre-edit rejection reason.) The changes made during the pre-edit are summarized in table 12. (See appendix table F-2 for the number of changes made to the PSS variables during the pre-edit.)
Computer Edit After pre-edit corrections were made, the file was submitted to a computer edit. This edit consisted of a range check, a consistency edit, and a blanking edit. The range check deleted entries that were outside the range of acceptable values. The consistency edit identified inconsistent entries within each record. The fields compared could be within items (e.g., if the response in item 9a, whether any students were enrolled in 12th grade last year, was “No,” but the second part of the question reported 12th graders enrolled the previous year) or between items (e.g., if kindergarten was reported in item 5c and item 10a reported the school did not offer kindergarten). Entries were corrected for those inconsistencies that could be resolved; for those that could not be resolved, the entries were deleted. The blanking edit deleted inappropriate entries and assigned the “not answered” (.N) code to items that should have been answered but were not. Only records classified as interviews in the preliminary ISR were edited. The changes made during the edit are summarized in table 12. Table 12. Summary of changes made to PSS questionnaire variables during the pre-edit and
edit: 2005–06
Source of change
Number of variables where
changes were made
Range of numbers of
records affected Percent of
records affected Pre-edit 83 1–1,145 < 0.01–2.83 Edit 63 15–28,886 0.04–71.32
SOURCE: U.S. Department of Education, National Center for Education Statistics, Private School Universe Survey (PSS), 2005–06.
Final Interview Status After the range check, consistency edit, and blanking edit were complete, the records were put through an edit to make a final determination of whether the case was in-scope and, if so, whether sufficient data had been collected for the case to be classified as an interview. A final ISR value was assigned to each case as a result of the edit. A case was classified as out-of-scope (ISR = 3) if
• the school was prekindergarten only (item 5); or • any of the five screening questions was marked “No” (item 3); or

V. Data Processing and Imputation 15
• the school was located in a private home that was used primarily as a family residence (item 13) and had less than six students (item 6); or
• the school was located in a private home that was used primarily as a family residence (item 13) and had all ungraded students (item 5).
A case was classified as an interview (ISR = 1) if
• none of the conditions for out-of-scope case was met; and • there were valid entries for either total number of students enrolled (item 6) or total number of
teachers (item 11); and • there were valid entries in at least two of the following items—
- whether school had any students enrolled in 12th grade in the last school year (item 9a), - type of school (item 12a), - whether school had religious orientation or purpose (item 14a), or - number of days in the school year (item 16).
A case was classified as a noninterview (ISR = 2) if the conditions for out-of-scope case or interview case were not met. The preliminary ISR and final ISR counts and the percent of change between the preliminary and final ISR counts are presented in table 13. Table 13. Number of PSS cases, by preliminary and final interview status, and the percentage
change between preliminary and final interview status: 2005–06
Interview status Preliminary ISR Final ISR Percent change Total 40,501 40,501 † Interview 30,506 29,784 -2.4 Noninterview 1,317 1,867 29.5 Out-of-scope 8,678 8,850 1.9
† Not applicable. SOURCE: U.S. Department of Education, National Center for Education Statistics, Private School Universe Survey (PSS), 2005–06.
Imputation After the edit and final ISR processing were complete, there were missing values within some records classified as interviews (ISR = 1). These were cases where the respondent had not answered some applicable questionnaire items (and data for these items were not added in the consistency edit) or the response had been deleted during editing. Values were imputed to the missing data in three stages, which are described below. First-Stage Imputation In the first stage of imputation, the following sources were used to create entries for items with missing data:
• Other items on the 2005–06 PSS questionnaire. Based on entries from related items on the school record, assumptions were made about how the respondent should have answered items
16 2005–06 PSS Data File User’s Manual and Survey Documentation
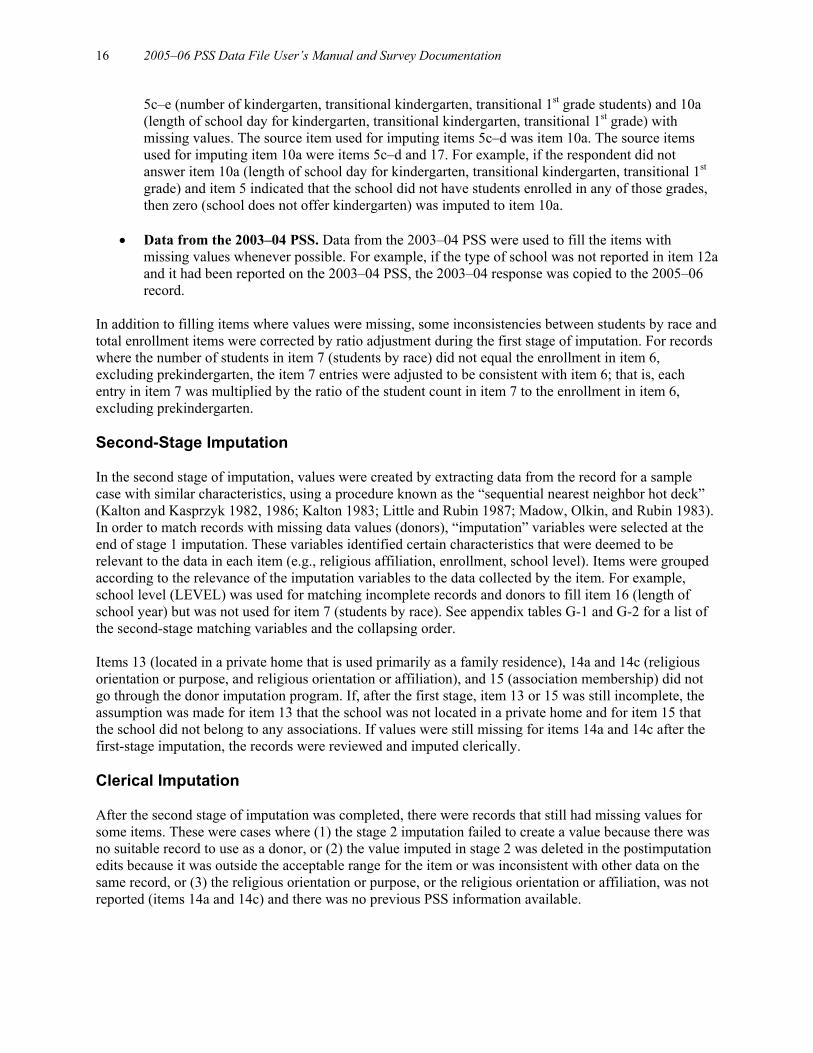
5c–e (number of kindergarten, transitional kindergarten, transitional 1st grade students) and 10a (length of school day for kindergarten, transitional kindergarten, transitional 1st grade) with missing values. The source item used for imputing items 5c–d was item 10a. The source items used for imputing item 10a were items 5c–d and 17. For example, if the respondent did not answer item 10a (length of school day for kindergarten, transitional kindergarten, transitional 1st grade) and item 5 indicated that the school did not have students enrolled in any of those grades, then zero (school does not offer kindergarten) was imputed to item 10a.
• Data from the 2003–04 PSS. Data from the 2003–04 PSS were used to fill the items with
missing values whenever possible. For example, if the type of school was not reported in item 12a and it had been reported on the 2003–04 PSS, the 2003–04 response was copied to the 2005–06 record.
In addition to filling items where values were missing, some inconsistencies between students by race and total enrollment items were corrected by ratio adjustment during the first stage of imputation. For records where the number of students in item 7 (students by race) did not equal the enrollment in item 6, excluding prekindergarten, the item 7 entries were adjusted to be consistent with item 6; that is, each entry in item 7 was multiplied by the ratio of the student count in item 7 to the enrollment in item 6, excluding prekindergarten. Second-Stage Imputation In the second stage of imputation, values were created by extracting data from the record for a sample case with similar characteristics, using a procedure known as the “sequential nearest neighbor hot deck” (Kalton and Kasprzyk 1982, 1986; Kalton 1983; Little and Rubin 1987; Madow, Olkin, and Rubin 1983). In order to match records with missing data values (donors), “imputation” variables were selected at the end of stage 1 imputation. These variables identified certain characteristics that were deemed to be relevant to the data in each item (e.g., religious affiliation, enrollment, school level). Items were grouped according to the relevance of the imputation variables to the data collected by the item. For example, school level (LEVEL) was used for matching incomplete records and donors to fill item 16 (length of school year) but was not used for item 7 (students by race). See appendix tables G-1 and G-2 for a list of the second-stage matching variables and the collapsing order. Items 13 (located in a private home that is used primarily as a family residence), 14a and 14c (religious orientation or purpose, and religious orientation or affiliation), and 15 (association membership) did not go through the donor imputation program. If, after the first stage, item 13 or 15 was still incomplete, the assumption was made for item 13 that the school was not located in a private home and for item 15 that the school did not belong to any associations. If values were still missing for items 14a and 14c after the first-stage imputation, the records were reviewed and imputed clerically. Clerical Imputation After the second stage of imputation was completed, there were records that still had missing values for some items. These were cases where (1) the stage 2 imputation failed to create a value because there was no suitable record to use as a donor, or (2) the value imputed in stage 2 was deleted in the postimputation edits because it was outside the acceptable range for the item or was inconsistent with other data on the same record, or (3) the religious orientation or purpose, or the religious orientation or affiliation, was not reported (items 14a and 14c) and there was no previous PSS information available.

V. Data Processing and Imputation 17
For these cases, values were clerically imputed to the items with missing data. That is, staff reviewed the data record, sample file record, and the questionnaire and identified a value consistent with the information from these sources for imputation. Changes to PSS Variables During Imputation The changes made during imputation are summarized in table 14 below. The number of changes made to the PSS variables during editing and imputation are listed in table G-3 in appendix G. Table 14. Summary of changes made to PSS questionnaire variables during imputation, by type
of change: 2005–06
Type of change
Number of variables where
changes were made
Range of numbers of
records affected Percent of
records affected Ratio adjustment 5 4,286–11,807 10.58–29.15 Imputed from same record or previous PSS record 110 21–3,450 0.05–8.74 Imputed from a donor record 62 1–726 < 0.01–1.79 Imputed clerically 63 1–629 < 0.01–1.55
SOURCE: U.S. Department of Education, National Center for Education Statistics, Private School Universe Survey (PSS), 2005–06.

18
VI. Weighting and Variance Estimation This chapter describes the weighting procedure used for the 2005–06 PSS. The final weights are needed to have the estimates reflect the population of private schools when analyzing the data. In addition, the method of estimating sampling errors for weighted estimates in PSS using the replicate weights is discussed. Weighting is presented first, followed by variance estimation.
Weighting The data from the area frame component were weighted to reflect the sampling rates (probability of selection) of the PSUs. Survey data from both the list and area frame components were adjusted for school nonresponse. The final weight for PSS data items is the product of the Base Weight and the Nonresponse Adjustment Factor, where:
Base Weight is the inverse of the probability of selection of the school. The base weight is equal to one for all list-frame schools. For area-frame schools, the base weight is equal to the inverse of the probability of selecting the PSU in which the school resides and a subsampling factor. The subsampling factor is equal to the inverse of the probability of a school being named by a subsampled non-Catholic religious institution for those schools that were named solely on non-Roman Catholic religious institution lists and equal to one for all other area-frame schools.8 Nonresponse Adjustment Factor is an adjustment that accounts for school nonresponse. It is the weighted (base weight) ratio of the total eligible in-scope schools (interviewed schools plus noninterviewed schools) to the total responding in-scope schools (interviewed schools) within cells. Noninterviewed and out-of-scope cases are assigned a nonresponse adjustment factor of zero.
The cells used to compute the nonresponse adjustment were defined differently for list-frame and area-frame schools. For schools in the list frame, the cells were defined by affiliation (17 categories), community type (3 categories), grade level (4 categories), region (varying number of categories), and enrollment (varying number of categories). (See appendix H.) The nonresponse adjustment cells for area frame schools were defined by certainty/noncertainty PSU status (2 categories), three-level typology (3 categories), and grade level (4 categories). (See appendix H.) If the number of schools in a cell was less than 15 or the nonresponse adjustment factor was greater than 1.5, then that cell was collapsed into a similar cell. The variables used to collapse the cells and the collapse order varied according to whether the school was from the list or area frame and whether a school was a traditional or k-terminal school. The cells for traditional schools from the list frame were collapsed within enrollment category, community type, grade level, and census region. Cells for k-terminal schools from the list frame were collapsed within enrollment category, community type, region (if applicable), and affiliation. Cells for traditional schools from the area frame were collapsed within grade level and then within three-level typology. Cells for k-terminal schools from the area frame were collapsed within three-level typology.
8 See the “Area Frame” section of chapter II.

VI. Weighting and Variance Estimation 19
Variance Estimation This section describes the variance estimation used for the 2005–06 PSS, how the replicates were assigned, and how to use the replicate weights to compute variances. Producing Replicate Weights In surveys with complex sample designs, direct estimates of sampling errors that assume a simple random sample will typically underestimate the variability in the estimates. The PSS sample design and estimation included procedures that deviate from the assumption of simple random sampling, primarily resulting from the stratified cluster sampling occurring in the area frame. The preferred method of calculating sampling errors to reflect these aspects of the complex sample design of PSS is using replication. Replication methods involve constructing a number of subsamples, or replicates, from the full sample and computing the statistic of interest for each replicate. The mean square error of the replicate estimates around the full sample estimate provides an estimate of the variance of the statistic. The replicate weights are used to compute the variance of a statistic, Y, as given below:
Variance ∑ −⎟⎠⎞
⎜⎝⎛=
rr YY
nY 2)(1)(
where: Yr = the estimate of Y using the rth set of replicate weights n = the number of replicates PSS uses a procedure known as balanced repeated replication (BRR) for the calculation of sampling variance. BRR assumes sampling is done with replacement, and hence, BRR does not reflect the increase in precision due to sampling a large proportion of a finite population. To execute the BRR procedure, half-samples are defined by pairing sample PSUs within each sampling stratum, forming variance strata. The final product is 88 replicate weights. After the variance strata were assigned, an orthogonal matrix (matrix H where: HHT = nIn where In is the identity matrix of order n) was used to form the 88 balanced half-sample replicates. Applying Replicate Weights Each PSS data file includes a set of 88 replicate weights designed to produce variance estimates. Replicate weights were created for each of the 88 samples using the same estimation procedures used for the full sample and are included in the data file. The replicate weights for PSS are REPW1–REPW88. The computation of sampling errors using these replicate weights can be done easily using one of the following software: WesVar Complex Sample Software, SUDAAN (Research Triangle Institute 2008), or AM Statistical Software.
• WesVar. The user needs to create a new WesVar data file by specifying the full sample weight variable and the replicate weight variables as defined above, and the replication method, BRR. The replicate weights and the full sample weight can be highlighted and dragged to their appropriate place on the “New WesVar Data File” window. For more information, visit http://www.westat.com/westat/statistical_software/wesvar/index.cfm.

20 2005–06 PSS Data File User’s Manual and Survey Documentation
• SUDAAN. The user needs to specify the sample design as a “Balanced Repeated replication” design as well as specifying the replicate weight variables. Specifying the sample design (DESIGN = BRR) is done in the procedure call statement (i.e., PROC DESCRIPT DESIGN = BRR;). The specification of the replicate weights is done with the REPWGT statement (i.e., to produce the sampling errors for estimates use the statement: REPWGT REPW1-REPW88;). For more information, visit www.rti.org/sudaan/.
• AM. The user needs to set the replicate weights along with the replication method using the right-
click context menu in the variable list window. Once the “Set Replicate Weights” window is displayed, the replicate weights as identified above can be highlighted and dragged into the window. At the bottom of the window are four options for replication method; BRR should be selected. For more information, visit http://am.air.org.
Changes in Weighting Procedures From 2003–04 to 2005–06
Below is a summary of the changes to the 2005–06 PSS weighting procedures.
• The cells used to compute the nonresponse adjustment for list-frame schools were defined differently for the 2005–06 PSS than for the 2003–04 PSS. The two grade level categories for combined schools, Combined-Regular and Combined-Other, in the 2003–04 PSS were merged into one category, Combined, for 2005–06. See appendix H for the 2005–06 PSS nonresponse adjustment cell definitions.

21
VII. Quality of PSS Data This chapter describes the steps taken to review the quality of the PSS data and some indicators of the quality of the PSS data, such as the area-frame contribution, coverage estimates, and comparisons with other data sources.
Reviewing the Quality of PSS Data NCES program staff members have the responsibility of ensuring that the PSS data file is acceptable for public release. Before files are released to the public, staff members review the data for errors associated with frame construction, data collection, or processing. Below are aspects of the datasets that were reviewed:
1. Unit nonresponse. Response rates were calculated for traditional and k-terminal schools by frame. (See chapter IV for unit response rate information.) Because these response rates were all greater than 85 percent, no bias analysis was performed.
2. Item nonresponse. Item response rates were calculated separately for traditional and k-terminal schools for each item. (See chapter IV for item response rate information.)
3. Edits. The validity of the skip patterns in the questionnaire was established during the processing of the data; that is, Census Bureau analysts verified that each item had the number of responses it should have if skip instructions were followed correctly.
4. Reasonableness of data. Multivariate tabulations of key survey variables were obtained and compared to estimates from the 2003–04 PSS survey. Tabulations were reviewed to determine whether the estimates were within reasonable bounds, allowing for elements of change (such as random fluctuations in variance, or secular growth).
Area Frame Contribution to Estimates
The standard error of an estimate is an indicator of the precision of that estimate for a given sample size. Because all list-frame cases are included in PSS, the list-frame component of the standard error is always zero. Since only the area frame contributes to the standard error for PSS, the contribution of the area frame to an estimate is a measure of the precision of that estimate. For the 2005–06 PSS, approximately 10 percent of traditional private schools (table 15), 5 percent of traditional private school enrollment (table 16), and 5 percent of the number of traditional private school teachers (headcount) (table 17) were from the area frame. Approximately 20 percent of k-terminal private schools, 19 percent of k-terminal private school enrollment, and 16 percent of the number of k-terminal private school teachers (headcount) were from the area frame (table 18).

22 2005–06 PSS Data File User’s Manual and Survey Documentation
Table 15. Weighted number of traditional private schools by frame and percentage of total schools from the area frame, by NCES typology: 2005–06
NCES typology Total List frame Area frame Area frame as
percent of total Total 28,996 26,099 2,896 10.0 Catholic 7,634 7,437 197 2.6 Parochial 3,669 3,633 37 1.0 Diocesan 2,972 2,904 68 2.3 Private 993 900 93 9.4 Other religious 14,445 12,685 1,760 12.2 Conservative Christian 5,704 5,158 546 9.6 Affiliated 3,655 3,463 192 5.3 Unaffiliated 5,086 4,064 1,022 20.1 Nonsectarian 6,916 5,978 939 13.6 Regular 2,770 2,457 313 11.3 Special emphasis 2,626 2,132 494 18.8 Special education 1,521 1,389 132 8.7
NOTE: Detail may not sum to totals because of rounding. SOURCE: U.S. Department of Education, National Center for Education Statistics, Private School Universe Survey (PSS), 2005–06. Table 16. Weighted number of traditional private school students by frame and percentage of
total students from the area frame, by NCES typology: 2005–06
NCES typology Total List frame Area frame Area frame as
percent of total Total 5,057,520 4,824,923 232,597 4.6 Catholic 2,246,240 2,206,783 39,456 1.8 Parochial 892,380 969,299 13,081 1.3 Diocesan 895,840 878,887 16,953 1.9 Private 368,020 358,597 9,423 2.6 Other religious 1,884,616 1,779,916 104,700 5.6 Conservative Christian 823,696 794,210 29,486 3.6 Affiliated 584,979 568,271 16,708 2.9 Unaffiliated 475,942 417,436 58,506 12.3 Nonsectarian 926,664 838,224 88,440 9.5 Regular 604,383 547,552 56,831 9.4 Special emphasis 218,123 189,887 28,236 12.9 Special education 104,158 100,785 3,374 3.2
NOTE: Detail may not sum to totals because of rounding. SOURCE: U.S. Department of Education, National Center for Education Statistics, Private School Universe Survey (PSS), 2005–06.

VII. Quality of PSS Data 23
Table 17. Weighted number of traditional private school teachers (headcount) by frame and percentage of total teachers from the area frame, by NCES typology: 2005–06
NCES typology Total List frame Area frame Area frame as
percent of total Total 479,775 454,158 25,617 5.3 Catholic 160,920 157,663 3,256 2.0 Parochial 66,373 65,542 830 1.3 Diocesan 62,377 61,277 1,100 1.8 Private 32,170 30,843 1,327 4.1 Other religious 197,762 184,821 12,941 6.5 Conservative Christian 80,196 76,713 3,483 4.3 Affiliated 66,069 63,282 2,787 4.2 Unaffiliated 51,497 44,826 6,671 13.0 Nonsectarian 121,094 111,674 9,419 7.8 Regular 72,092 66,852 5,240 7.3 Special emphasis 30,157 26,548 3,609 12.0 Special education 18,845 18,274 571 3.0
NOTE: Detail may not sum to totals because of rounding. SOURCE: U.S. Department of Education, National Center for Education Statistics, Private School Universe Survey (PSS), 2005–06. Table 18. Weighted number of kindergarten-terminal private schools, students, and teachers
(headcount) by frame and the percentage of schools, students, and teachers from the area frame, by NCES three-level typology: 2005–06
NCES typology Total List frame Area frame Area frame as
percent of total Schools Total 6,058 4,850 1,209 20.0 Catholic 110 106 5 4.4 Other religious 1,719 1,338 381 22.2 Nonsectarian 4,229 3,406 823 19.5 Students Total 89,294 72,081 17,213 19.3 Catholic 2,724 2,648 75 2.8 Other religious 26,852 21,134 5,718 21.3 Nonsectarian 59,718 48,299 11,420 19.1 Teachers Total 16,570 13,930 2,641 15.9 Catholic 379 367 12 3.1 Other religious 4,745 4,036 709 15.0 Nonsectarian 11,446 9,527 1,920 16.8
NOTE: Detail may not sum to totals because of rounding. SOURCE: U.S. Department of Education, National Center for Education Statistics, Private School Universe Survey (PSS), 2005–06.

24 2005–06 PSS Data File User’s Manual and Survey Documentation
Capture-Recapture Estimate of PSS Coverage Because PSS uses a dual frame approach, it is possible to estimate the coverage or completeness of PSS. A capture-recapture methodology (Sekar and Deming 1949) was used to estimate the number of traditional private schools in the United States and to estimate the coverage of traditional private schools in the 2005–06 PSS. The list frame “captured” 26,099 schools. In the subsequent area frame, 23,712 schools (weighted) were “captured,” of which 20,816 were “recaptured” (i.e., already on the list frame). Solution for x in the equation 23,712*(26,099/x) = 20,816 reveals an estimated population (capture-recapture estimate) of 29,730 private schools. The coverage of the traditional PSS estimate is the ratio of the PSS estimate (28,996) to the traditional capture-recapture estimate (29,730) and is equal to 97.5 percent. The capture-recapture estimate of 29,730 traditional private schools is based on the assumption that the probability of observing a school from a frame has the same expected value for all units. Violation of this assumption tends to underestimate the undercoverage. Using poststratification cells to compute the capture-recapture estimate can alleviate concerns about this. Separate traditional private school capture-recapture estimates were computed for four different sets of poststratification cells: typology (30,049), grade level (29,854), three-level typology—Catholic, other religious, nonsectarian (29,833), and three-level typology within grade level (29,920). Using the highest estimate makes it least likely that the above-mentioned assumption would be violated. The largest traditional private school capture-recapture estimate is produced using the typology poststratification cells (30,049). The most conservative traditional private school coverage rate, then, is equal to 96.5 percent. The same capture-recapture methodology was used to estimate the number of k-terminal private schools in the United States and to estimate the coverage of k-terminal private schools in the 2005–06 PSS. The list frame “captured” 4,850 schools. In the subsequent area frame, 3,888 schools (weighted) were “captured,” of which 2,679 were “recaptured” (i.e., already on the list frame). Solution for x in the equation 3,888*(4,850/x) = 2,679 reveals an estimated population (capture-recapture estimate) of 7,039 private schools. The coverage of the k-terminal private school PSS estimate is the ratio of the PSS estimate (6,058) to the k-terminal private school capture-recapture estimate (7,039) and is equal to 86.1 percent. The capture-recapture estimate of 7,039 k-terminal private schools is also based on the assumption that the probability of observing a school from a frame has the same expected value for all units. Separate k-terminal private school capture-recapture estimates were computed for two different sets of poststratification cells: nine-level typology (7,220) and three-level typology—Catholic, other religious, nonsectarian (7,055). The higher k-terminal private school capture-recapture estimate is produced using the nine-level typology poststratification cells (7,220). The more conservative k-terminal private school coverage rate, then, is equal to 83.9 percent.
Comparability With Other Estimates One way to verify the external validity of the 2005–06 PSS data is to make comparisons to estimates computed from other sources. The 2005–06 PSS estimates were compared to those produced using 2005 Current Population Survey and 2005–06 National Catholic Educational Association (NCEA) data and prior PSS data.

VII. Quality of PSS Data 25
Current Population Survey Data A comparison of the PSS estimate of K–12 students enrolled in all private schools (traditional and k-terminal) with the household survey estimate from the 2005 October Supplement of the Current Population Survey (CPS) (U.S. Census Bureau 2006) shows that the PSS estimate of 5,146,814 does not statistically differ from the CPS estimate of the number of private school students in grades kindergarten through 12 in October 2005 of 5,318,000. National Catholic Educational Association Data Comparisons of the PSS estimates for Catholic schools, students, and full-time equivalent (FTE) teachers (traditional schools) with the National Catholic Educational Association (NCEA 2006) data for the 2005–06 school year show differences in the student (2,246,240 versus 2,363,220) and FTE teacher counts (149,436 versus 152,502) between the two data sources (table 19). The difference between the PSS estimate of 7,634 Catholic schools and the NCEA count of 7,589 schools is not statistically significant. The survey methodologies used by NCES and NCEA are quite different; NCES surveys private schools directly while NCEA surveys archdiocesan and diocesan offices of education and some state Catholic conferences. The NCEA and PSS computations of FTEs differ in the weight assigned to part-time teachers, thus the FTE teacher counts are not strictly comparable between PSS and NCEA. Table 19. Weighted number of PSS Catholic schools, students, and teachers compared to those
of the National Catholic Educational Association, by level: 2005–06
Level NCEA PSS Schools Total 7,589 7,634 Elementary 6,386 6,251 Secondary 1,203 1,079 Combined — 305 Students Total 2,363,220 2,246,240 Elementary 1,726,773 1,549,040 Secondary 636,447 597,568 Combined — 99,633 Teachers Total 152,502 149,436 Elementary 103,481 97,080 Secondary 49,021 42,678 Combined — 9,678
— Not available. NOTE: Teachers are in full-time equivalents. Detail may not sum to totals because of rounding. SOURCE: U.S. Department of Education, National Center for Education Statistics, Private School Universe Survey (PSS), 2005–06; United States Catholic Elementary and Secondary Schools, 2005–06: Annual Statistical Report on Schools, Enrollment, and Staffing, National Catholic Educational Association (NCEA).

26 2005–06 PSS Data File User’s Manual and Survey Documentation
Prior PSS Data The number of schools, students, and FTE teachers (traditional schools) for each PSS collection are presented in table 20. The estimated number of FTE teachers increased between 2003–04 and 2005–06 (by 10,247 FTE teachers). The estimated number of private schools and students in 2005–06 were not statistically different from those of 2003–04. Table 20. Weighted number of private schools, students, and teachers, by level: 1989–90,
1991–92, 1993–94, 1995–96, 1997–98, 1999–2000, 2001–02, 2003–04, and 2005–06
Level 1989–90 1991–92 1993–94 1995–96 1997–981999–
2000 2001–02 2003–04 2005–06 Schools Total 26,712 25,998 26,093 27,686 27,402 27,223 29,273 28,384 28,996 Elementary 16,514 15,716 15,571 16,744 16,623 16,530 17,427 17,197 16,812 Secondary 2,490 2,475 2,506 2,533 2,487 2,538 2,704 2,694 2,927 Combined 7,707 7,807 8,016 8,409 8,292 8,155 9,142 8,494 9,257 Students Total 4,838,497 4,889,545 4,836,442 5,032,200 5,076,119 5,162,684 5,341,513 5,122,772 5,057,520 Elementary 2,764,118 2,766,059 2,759,771 2,835,247 2,824,844 2,831,372 2,883,010 2,694,494 2,551,196 Secondary 842,040 818,570 791,235 811,422 798,339 806,639 835,328 845,083 859,453 Combined 1,232,339 1,304,917 1,285,437 1,385,531 1,452,937 1,524,673 1,623,175 1,583,194 1,646,871 Teachers Total 331,533 339,267 338,162 361,909 376,544 395,317 425,406 425,238 435,485 Elementary 158,025 160,125 163,641 176,148 180,452 187,833 202,071 199,064 195,183 Secondary 62,971 62,198 58,497 59,880 60,885 62,737 67,318 68,344 70,676 Combined 110,537 116,944 116,025 125,881 135,207 144,746 156,017 157,830 169,626
NOTE: Teachers are in full time equivalents. Detail may not sum to totals because of rounding. SOURCE: U.S. Department of Education, National Center for Education Statistics, Private School Universe Survey (PSS), 1989–90, 1991–92, 1993–94, 1995–96, 1997–98, 1999–2000, 2001–02, 2003–04, 2005–06.

27
VIII. Information on Data Files
Availability of Data The 2005–06 PSS data are available as restricted-use, public-use, and address data. Access to the restricted-use data file is limited to individuals associated with organizations that have received a license to use PSS data, while the public-use data file is available to the public. The address file is a public-use file containing the contact information for the schools and a select subset of PSS variables. Restricted-Use Data File The restricted-use data are available on CD-ROM in SAS, SPSS, and text format. The data are restricted because they contain information that can be used to indirectly disclose individually identifiable information, which is confidential and protected by law. Access to the restricted-use data files is limited to individuals associated with organizations that have received a license.
How to Get a Restricted-Use Data File Researchers who can demonstrate a need for more detailed information may request a license to use the restricted-use dataset for statistical research purposes. Applicants should review the Restricted-Use Data Procedures Manual (available at http://nces.ed.gov/statprog/rudman) before submitting their application. The manual specifies required procedures and details the security requirements. Researchers requesting access to the restricted-use dataset must supply the following information through the Electronic Application System:
• the name, title, and contact information of the Principal Project Officer(s) at the institution who will be heading up the research effort;
• the name, title, and contact information of the Senior Official who has the legal authority to sign a contract;
• the name, title, and contact information of the Systems Security Official; • the exact year and name of the data to which access is desired; • project title; • a detailed description of the statistical research project and objectives for which the restricted-use
data are needed; • an explanation and justification of why the restricted-use data are needed (e.g., instead of the
public data version); • a description of what other data may be linked to the restricted-use data; • an explanation of who will be serviced by conducting this statistical research project; • the estimated loan period (not to exceed 5 years); and • the name(s), and title(s) of professional and technical staff, including graduate students, who will
be accessing the restricted-use dataset. Additional Electronic Application System instructions are at http://nces.ed.gov/statprog/instruct.asp. Applicants must also submit hard copies of the following three items to the IES Data Security Program to complete the application process:
28 2005–06 PSS Data File User’s Manual and Survey Documentation
• a signed IES License Document (http://nces.ed.gov/statprog/rudman/pdf/IES_License_Document.pdf);
• signed and notarized Affidavit(s) of Nondisclosure (http://nces.ed.gov/statprog/rudman/pdf/g.pdf); and
• a completed and signed Security Plan Form (http://nces.ed.gov/statprog/rudman/pdf/j.pdf). Send these documents to
IES Data Security Office Department of Education/NCES/ODC/SSP
1990 K Street NW, Room 9060 Washington, DC 20006
[email protected] After the online request and the documents have been reviewed, the applicants will be informed whether the license application has been approved. Applicants and/or institutions that violate the license agreement are subject to a class E felony and can be imprisoned up to five years, and/or fined up to $250,000, or both (under the provisions of 18 U.S.C. 3559 and 3571). The confidentiality provisions that NCES must follow by law can be found at http://nces.ed.gov/statprog/confproc.asp. Public-Use Data File Public-use data are, as the name implies, available to the public. The PSS restricted-use and public-use data files are exactly the same except the restricted-use file contains one variable (P355—the number of students who graduated from the 12th grade in school year 2004–05) that is not on the public-use file. This variable is not available on the public-use file because of the possibility of using this variable to disclose individually identifiable information, which is confidential and protected by law.
How to Access Public-Use Data The public-use data file is available online in SAS, SPSS, and text format and can be accessed at http://nces.ed.gov/surveys/pss/pssdata.asp. Address Data File The PSS address data is the version of the public-use data used to populate the private school search tools on the NCES website. The address data is intended for users who want the school contact information for the 2005–06 PSS schools. Since the address file does not contain the weighting variables, it is not possible to produce weighted estimates with this file. Also, the data in the address file do not contain the imputations for item nonresponse. See appendix J for the list of variables contained in the address file.
How to Access the Address Data The address file is available online in Excel format through the Search for Private Schools tool at http://nces.ed.gov/surveys/pss/privateschoolsearch/; users can download the results of their search(es).

VIII. Information on Data Files 29
Understanding the Data Files Categories of Variables Variables on the restricted-use and public-use PSS data files fall into one of the following five categories: frame, survey, created, weighting, and imputation flag variables. The purpose of these categories is to help the user better understand what types of variables are included on the files and what the sources were for the variables. Variables were classified as frame variables if they were drawn from the 2003–04 PSS file or based on the 2005–06 PSS frame update. Examples of frame variables include the school’s permanent identification number (PPIN) or the ZIP code of the school’s mailing address (PZIP). Survey variables are the actual variables drawn from the questionnaire responses. Each item on the questionnaire has a small number printed to the left. This series of numbers is the source code. A single letter “P” was added to the beginning of the series to create the corresponding variable name. For example, item 6a has the source code 305 printed to the left. On the data file, the variable name for this item is P305. Created variables are based on survey variables, frame variables, or other created variables. These variables are frequently used in NCES publications and have been added to the files to facilitate data analysis. There are two types of weighting variables on the file. (For more information on weighting and standard errors, see chapter VI.) The first is the final weight for the respondent, and the second includes the 88 replicate weights. The final weight adjusts for nonresponse and the sampling rates of the area-frame PSUs and is used so that estimates represent the population of private schools. The replicate weights are used as a set to generate standard errors for estimates. On the file, the final weight is called PFNLWT and the replicate weights are REPW1–REPW88. The imputation flags identify whether or not a survey item was imputed for missing data. (See chapter V for details.) All survey variables have a corresponding imputation flag that indicates whether a value was imputed and, if so, what method was used. All survey imputation flags begin with “F_” and are followed by the name of the variable. For example, the imputation flag for P135 is F_P135. The variable names, descriptions, and weighted and weighted frequencies for all variables on the public-use file are contained in appendix I. The variables contained in the address file are listed in appendix J. Linking to PSS Files for Other Years The 2005–06 PSS school records can be matched to those of other years by using the school’s permanent identification number (PPIN). PPIN is a unique 8-character code assigned when a private school is first included in PSS.
30
IX. User Notes and Cautions Although the definition of the eight-category locale code (LOCALE) remains unchanged from the 2001–02 PSS, caution should be used when comparing the 2005–06 geographic classifications of schools to those of previous years. The eight-digit locale code (LOCALE) that exists on the 2005–06 PSS data files is based on the Consolidated Statistical Area (CSA)/Core-Based Statistical Area (CBSA) rather than the Standard Metropolitan Statistical Area (SMSA)/Metropolitan Statistical Area (MSA) that was used prior to the 2003–04 PSS. Also, the 2005–06 LOCALE is based on 2000 Census data; for the 2001–02 and earlier PSS, LOCALE was based on 1990 Census information. The 2005–06 PSS restricted-use and public-use data files also contain a 12-category locale code (ULOCALE). ULOCALE is based on a new (2003) geographic classification of schools and will replace LOCALE on future PSS files. LOCALE and ULOCALE are both included on the 2005–06 PSS files, so that users may evaluate the effects of the change during the transition period. Caution should also be used when comparing the community type classification of schools in the 2003–04 and 2005–06 PSS with the classification used in earlier years. Community type is derived from the eight-category locale code, so any changes over time in the assignment of locale codes could induce changes in the community type. In addition, the definition of community type changed for the 1999–2000 PSS. Beginning with the 1999–2000 PSS, schools that were “rural within a CBSA” were included in the “rural/small town” community type, while prior to the 1999–2000 PSS they were included in the “urban fringe/large town” community type. Two community type variables are on the 2005–06 PSS file: one corresponding to the current definition of community type (COMMTYPE) and one corresponding to the pre-1999–2000 definition (COMMTYP2).

31
References Beller, N.D. (1984). Private Elementary and Secondary Education, 1983 Enrollment, Teachers, and Schools (Bulletin). U.S. Department of Education. Washington, DC: National Center for Education Statistics. Kalton, G. (1983). Compensating for Missing Survey Data. Ann Arbor: Survey Research Center, University of Michigan. Kalton, G., and Kasprzyk, D. (1982). Imputing for Missing Survey Responses. American Statistical Association 1982 Proceedings of the Section on Survey Research Methods, 22–31. Kalton, G., and Kasprzyk, D. (1986). The Treatment of Missing Survey Data. Survey Methodology, 12(1): 1–16. Little, R.J.A., and Rubin, D.B. (1987). Statistical Analysis with Missing Data. New York: John Wiley and Sons. Madow, W.G., Olkin, I., and Rubin, D.B. (Eds.) (1983). Incomplete Data in Sample Surveys, Vols. 1, 2, and 3, New York: Academic Press. National Catholic Educational Association. (2006). United States Catholic Elementary and Secondary Schools, 2005–06: Annual Statistical Report on Schools, Enrollment, and Staffing. Washington, DC: Author. Research Triangle Institute. (2008). SUDAAN Language Manual, Release 10.0. Research Triangle Park, NC: Research Triangle Institute. Sekar, C., and Deming, E. (1949). On a Method of Estimating Birth and Death Rates and Extent of Registration. Journal of the American Statistical Association, 44: 101–115. U.S. Census Bureau. (2006). School Enrollment-Social and Economic Characteristics of Students: October 2005. Retrieved March 24, 2008, from http://www.census.gov/population/www/socdemo/school/cps2005.html.

A-1
Appendix A. Key Terms for PSS Full-time equivalent (FTE) Full-time equivalent (FTE) quantifies private school teacher positions in proportion to a full-time position. For example, if a full-time teacher works 35 hours per week in school X, then a teacher who works 21 hours would have an FTE of 0.6 in that school. Kindergarten-terminal school A school is kindergarten-terminal (k-terminal) if kindergarten is the highest grade offered at the school. Private school A private school is a school that is not supported primarily by public funds. It must provide classroom instruction for one or more of grades K–12 (or comparable ungraded levels), and have one or more teachers. Organizations or institutions that provide support for homeschooling but do not offer classroom instruction for students are not included. Program emphasis Private schools are classified according to one of seven types of program emphasis:
• Regular. The PSS questionnaire does not provide a definition of this term. Regular schools do not specialize in special, vocational/technical, or alternative education; or in having a Montessori or special program emphasis, although they may offer these programs in addition to the regular curriculum.
• Montessori. The PSS questionnaire does not provide a definition of this term. Montessori schools provide instruction using Montessori teaching methods.
• Special program emphasis. A science/mathematics school, a performing arts high school, a foreign language immersion school, and a talented/gifted school are examples of schools that offer a special program emphasis.
• Special education. Special education schools primarily serve students with disabilities. • Vocational. Vocation schools primarily serve students who are being trained for occupations. • Alternative. Alternative schools provide nontraditional education and may serve as adjuncts to
regular schools. They fall outside the categories of regular, special education, and vocational education, although they may provide similar services or curriculum. Schools that provide a nontraditional setting or nontraditional system of teaching are considered alternative.
• Early childhood. Early childhood program schools serve students in prekindergarten, kindergarten, transitional (or readiness) kindergarten, and/or transitional 1st (or pre-1st) grade.
Region Private schools are assigned to one of four geographic regions.
• Northeast. Maine, New Hampshire, Vermont, Massachusetts, Rhode Island, Connecticut, New York, New Jersey, and Pennsylvania.
• Midwest. Ohio, Indiana, Illinois, Michigan, Wisconsin, Minnesota, Iowa, Missouri, North Dakota, South Dakota, Nebraska, and Kansas.

A-2 2005–06 PSS Data File User’s Manual and Survey Documentation
• South. Delaware, Maryland, District of Columbia, Virginia, West Virginia, North Carolina, South Carolina, Georgia, Florida, Kentucky, Tennessee, Alabama, Mississippi, Arkansas, Louisiana, Oklahoma, and Texas.
• West. Montana, Idaho, Wyoming, Colorado, New Mexico, Arizona, Utah, Nevada, Washington, Oregon, California, Alaska, and Hawaii.
School level Private schools are classified using respondent-provided highest and lowest grades in the school according to one of three instructional levels:
• Elementary. A school is elementary if it has one or more of grades K–6 and does not have any grade higher than grade 8; for example, schools with grades K–6, 1–3, or 6–8 are classified as elementary schools.
• Secondary. A school is secondary if it has one or more of grades 7–12 and does not have any grade lower than grade 7; for example, schools with grades 9–12, 7–8, 10–12, or 7–9 are classified as secondary schools.
• Combined. A school is classified as combined if it has one or more of grades K–6 and one or more of grades 9–12; for example, schools with grades K–12, 6–12, 6–9, or 1–12 are classified as having combined grades. Schools in which all students are ungraded (i.e., not classified by standard grade levels) are also classified as combined.
Teacher Any full-time or part-time school staff member who teaches one or more regularly scheduled classes in any of grades K–12 (or comparable ungraded levels). The following types of teachers are included:
• regular classroom teachers; • teachers who teach subjects such as music, art, physical education, and special education; and • teaching principals or administrators who teach a regularly scheduled class.
Short-term substitute teachers, student teachers, and teacher aides are not included. Traditional private school A traditional school provides instruction for one or more of grades 1 through 12 (or comparable ungraded levels). Typology Private schools are assigned to one of three major categories (Catholic, other religious, or nonsectarian—”3-level typology”) based on the school’s religious affiliation provided by respondents and, within each major category, one of three subcategories (“9-level typology”):
• Catholic. Catholic schools are categorized according to governance, provided by Catholic school respondents, into parochial, diocesan, and private schools.
• Other religious. Other religious schools have a religious orientation or purpose, but are not Roman Catholic. Other religious schools are categorized according to religious association membership, provided by respondents, into conservative Christian, affiliated, and unaffiliated schools.

Appendix A. Key Terms for PSS A-3
o Conservative Christian schools are those “Other Religious” schools with membership in at least one of four associations: Accelerated Christian Education, American Association of Christian Schools, Association of Christian Schools International, or Oral Roberts University Educational Fellowship.
o Affiliated schools are those “Other Religious” schools, not classified as Conservative Christian, with membership in at least 1 of 11 associations: Association of Christian Teachers and Schools, Christian Schools International, Evangelical Lutheran Education Association, Friends Council on Education, General Conference of the Seventh-Day Adventist Church, Islamic School League of America, National Association of Episcopal Schools, National Christian School Association, National Society for Hebrew Day Schools, Solomon Schechter Day Schools, Southern Baptist Association of Christian Schools—or indicating membership in “other religious school associations.”
o Unaffiliated schools are those “Other Religious” schools that have a religious orientation or purpose, but are not classified as Conservative Christian or affiliated.
• Nonsectarian. Nonsectarian schools do not have a religious orientation or purpose and are categorized according to program emphasis, provided by respondents, into regular, special emphasis, and special education schools. Regular schools are those that have a regular elementary/secondary or early childhood program emphasis. Special emphasis schools are those that have a Montessori, vocation/technical, alternative, or special program emphasis. Special education schools are those that have a special education program emphasis.
Ungraded students Ungraded students are those who are not assigned to a particular grade level (kindergarten, 1st grade, 2nd grade, etc.); for example, special education centers and alternative schools often classify their students as ungraded. Students in Montessori schools are also considered ungraded if the school assigns them to “primary” and “intermediate” levels instead of specific grades.

B-1
Appendix B. Questionnaire The PSS questionnaire for the 2005–06 school year appears on the following pages.

To learn more about the Private School Survey(PSS) and to access reports from earlier
collections, see the PSS web site at:
http://nces.ed.gov/surveys/pss
Additional data collected by the National Centerfor Education Statistics (NCES) on a variety of
topics in elementary, secondary, postsecondary,and international education are available from
NCES’ web site at:
http://nces.ed.gov
For additional data collected by various Federalagencies, including the Department of Education,
visit the FedStats site at:
http://www.fedstats.gov
16
FORM PSS-1 (7-26-2005)
▲
▼▼
▲
PRIVATE SCHOOL SURVEY2005–2006 SCHOOL YEAR
OMB No. 1850-0641: Approval Expires 10/31/2006NOTICE – This survey is authorized by Public Law 107-129, Title I, Part E,Sections 151(b) and 153(a) of the Education Sciences Reform Act of 2002.
PLEASE NOTE:
The 2005–2006 Private School Survey is intended to include all private –SCHOOLS that teach ANY of the following –
• Transitional first (or prefirst) grade – extra year of school for children who have attendedkindergarten but have been judged not ready for first grade
• Kindergarten – traditional year of school primarily for 5-year-olds prior to first grade• Transitional (or readiness) kindergarten – extra year of school for kindergarten-age
children who are judged not ready for kindergarten
EARLY CHILDHOOD PROGRAMS AND CHILD CARE CENTERS that haveANY of the following –
• Transitional first (or prefirst) grade
• Kindergarten• Transitional (or readiness) kindergarten
For example:An early childhood center that has a nursery school, a prekindergarten program, and a kindergartenwould be eligible for this survey, since it includes a kindergarten.But an early childhood center that has a nursery school and a prekindergarten program ONLYwould NOT be eligible for this survey, since it does not include a kindergarten. You would markbox 2 in item 2d.
▼▼
PLEASE CONTINUE WITH ITEM 1 ON PAGE 3.
• Ungraded students between 5 and 18 years old
FORM(7-26-2005)
PSS-1
U.S. DEPARTMENT OF EDUCATIONNATIONAL CENTER FOR EDUCATION STATISTICS
Conducted by:U.S. DEPARTMENT OF COMMERCE
Economics and Statistics Administration
▲
▼▼
▲
U.S. CENSUS BUREAU
• At least one of grades 1 – 12
§’"$¤ 060103§’1&¤ 061605

15
FORM PSS-1 (7-26-2005)
THANK YOU FOR PARTICIPATING IN THIS IMPORTANT SURVEY.YOUR TIME AND EFFORT ARE APPRECIATED.
PLEASE RETURN THE QUESTIONNAIRE IN THE ENCLOSED ENVELOPE.IF YOU DO NOT HAVE THE RETURN ENVELOPE, MAIL YOUR QUESTIONNAIRE TO:
U.S. Census BureauCurrent Surveys Check-in Unit 60A1201 East 10th StreetJeffersonville, IN 47132-0001
21. Please verify this school’s/program’s name and mailing address that are printedon the front of this questionnaire.
School/program name
Mailing address
City
State ZIP Code + 4
If any part of the name and mailing address is incorrect, enter the correction(s),as necessary, in the appropriate space(s) below.
700
701
702
703 704
▲
▼▼
▲
SINCERELY,
JEFFREY A. OWINGSASSOCIATE COMMISSIONERNATIONAL CENTER FOR EDUCATION STATISTICSELEMENTARY/SECONDARY AND LIBRARY STUDIES DIVISION
U.S. Census BureauCurrent Surveys Check-in Unit 60A1201 East 10th StreetJeffersonville, IN 47132-0001
DEAR ADMINISTRATOR:
WHO IS CONDUCTING THIS SURVEY?
The National Center for Education Statistics (NCES) of the U.S. Department of Education requests yourparticipation in the 2005-2006 Private School Survey. The U.S. Census Bureau is conducting the surveyfor NCES as authorized by Public Law 107-279, Title I, Part E, Sections 151(b) and 153(a) of theEducation Sciences Reform Act of 2002.
WHY IS NCES SPONSORING THIS SURVEY?
The purpose of this data collection effort is to obtain current information about private schools, suchas type of school, length of school year, number of students and teachers, and number of highschool graduates, if any. We will use the data to produce a web-based private school search tool andstatistical summaries about the providers of private education in the United States.
WHO SHOULD PARTICIPATE IN THIS SURVEY?
The 2005-2006 Private School Survey includes all private schools and early childhood programs thatprovide educational instruction to students in kindergarten or at least one of grades 1-12.
WHY SHOULD YOUR SCHOOL PARTICIPATE IN THIS SURVEY?
Private schools are a significant segment of the nation’s educational system. Results from previoussurveys show that approximately 25 percent of all elementary and secondary schools in the UnitedStates are private; these schools enroll approximately 10 percent of the nation’s children and employ13 percent of the nation’s teachers. The National Center for Education Statistics has instituted thissurvey in recognition of the importance of private education in the United States.
While there is no penalty for not responding, a high response rate is very important to the success ofthe survey. We encourage you to participate in this voluntary survey.
WHERE SHOULD YOU MAIL YOUR COMPLETED QUESTIONNAIRE?
Please return your completed questionnaire using the enclosed envelope. If you do not have thereturn envelope, mail your questionnaire to:
THANK YOU FOR YOUR COOPERATION IN THIS VERY IMPORTANT EFFORT.
We are requesting your participation in an important national data collection that is very valuable toprivate schools across the country.
2
FORM PSS-1 (7-26-2005)
According to the Paperwork Reduction Act of 1995, no persons are required to respond to a collection ofinformation unless such collection displays a valid OMB control number. The valid OMB control numberfor this information collection is 1850-0641. The time required to complete this information collection isestimated to average 20 minutes per response, including the time to review instructions, search existingdata resources, gather the data needed, and complete and review the information collection. If you haveany comments concerning the accuracy of the time estimate(s) or suggestions for improving this form,please write to: U.S. Department of Education, Washington, DC 20202-4651. If you have comments orconcerns about the contents of this questionnaire, write directly to: Private School Survey, NationalCenter for Education Statistics, 1990 K Street, N.W., #9012, Washington, DC 20006-5651.
Paperwork Burden Statement
▲
▼▼
▲
-
Is the physical or street address of this school/program the same as the mailingaddress?
22a.
2
1 Yes
No
b. Please print this school’s/program’s physical or street address.
705
Street
City
State ZIP Code
706
707
708 709
§’0’¤ 061506§’##¤ 060202

If you marked "Yes" for all of items 2a–e above, continue with item 4.
Is the institution or organization named on the front of this questionnaire a school?
If you marked "No" for any of items 2a–e, do not complete this questionnaire. Please return itin the enclosed envelope. If you do not have the return envelope, mail your questionnaire to:
2a.
U.S. Census BureauCurrent Surveys Check-in Unit 60A1201 East 10th StreetJeffersonville, IN 47132-0001
3.
2
YOUR NAME
TITLE
1.
1
Please print your name, title, and school telephone number in case we have questionsabout any of your responses.
051
050
Area code Number
3
FORM PSS-1 (7-26-2005)
——
For questions regarding this survey, please call the Census Bureau at 1–800–221–1204, Monday throughFriday, between 8:30 a.m. and 5:00 p.m. (Eastern time).
Yes
No – Please explain ➔➔ 106
b. Is this school a private school? (For this survey, all elementary or secondary schools that arenon-public are considered private schools, e.g., Roman Catholic schools, Hebrew day schools, Lutheranschools, private boarding schools, nonsectarian private schools, private schools that provide specialeducation services to public school districts, etc.)
2
1 Yes
No – Please describe the type of school (e.g., public school, Bureau of Indian Affairs school,state school, charter school, etc.)
➔131
c. Is this school still in operation?
2
1 Yes
No – Please record the date when the school closed.
➔YearMonth Day
101
d. Does this school teach any students in AT LEAST one of grades K to 12, or comparableungraded levels?
2
115 1 Yes
No – Please record the grade level(s) taught in this school (e.g., nursery and prekindergarten,adult education, postsecondary).
116
052
105
130
100
▲
▼▼
▲
➔
e. Is this school located in the United States?
2
1 Yes
No – Please specify the country in which this school is located.
126
125
14
FORM PSS-1 (7-26-2005)
19. Not counting interruptions, how many minutes did it take to complete thisquestionnaire?
20. Please record the date you completed this form.
YearMonth Day
16.
Days per school year
How many days are in the school year for students in this school/program?
17.Report BOTH hours and minutes, e.g., "5" hours and "45" minutes, "6" hours and "0"minutes, etc. If the length of day varies by grade level, record the longest day. Include thetime for lunch and recess.
How long is the school day for students in this school/program?
18. Does this school have a library or library media center?
2
1
Hours
Minutes
AND
650
655
Minutes
645
660
665
670
Yes
No
(A library media center is an organized collection of printed and/or audiovisual and/orcomputer resources which is administered as a unit, is located in a designated place orplaces, and makes resources and services available to students, teachers, andadministrators.)
(A library media center may be called a library, media center, resource center, informationcenter, instructional materials center, learning resource center, or some other name.)
▲
▼▼
▲
2 0 0671 672
SCHOOL TELEPHONE NUMBER
102 103
GO TO item 3 below.
GO TO item 3 below.
GO TO item 3 below.
GO TO item 3 below.
§’$"¤ 060301§’/(¤ 061407

8
13
FORM PSS-1 (7-26-2005)
1
1
1
1
1
1
1
1
1
1
1
1
1
1
1
1
15. Continued –
American Montessori Society (AMS)
Association Montessori International (AMI)
Other Montessori association(s)
Association of Military Colleges and Schools (AMCS)
Association of Waldorf Schools of North America (AWSNA)
Bilingual School Association (BSA)
Council of Bilingual Education (CBE)
Council for Exceptional Children (CEC)
National Association of Private Special Education Centers (NAPSEC)
Other association(s) for exceptional children
European Council for International Schools (ECIS)
National Association for the Education of Young Children (NAEYC)
National Association of Bilingual Education (NABE)
National Association of Laboratory Schools (NALS)
National Coalition of Girls’ Schools (NCGS)
Other special emphasis association(s) – Specify
Alternative School Network (ASN)
Institute for Independent Education (IIE)
National Association of Independent Schools (NAIS)
State or regional independent school association
National Coalition of Alternative Community Schools (NCACS)
National Independent Private Schools Association (NIPSA)
The Association of Boarding Schools (TABS)
Other school association(s) – Specify
SPECIAL EMPHASIS
OTHER SCHOOL ASSOCIATIONS OR ORGANIZATIONS
To which of the following associations or organizations does thisschool/program belong?
542
1
1
1
1
1
1
1
1
Mark (X) all that apply.
545
550
555
560
565
570
575
580
585
590
595
600
602
605
606
610
615
620
622
625
630
635
640
641
▲
▼▼
▲
5.
INSTRUCTIONS
How many students were enrolled in each of the following grade levels aroundthe first of October?
Grade levels
Ungraded (including ungradedspecial education students) 140
Does thisschool/program have
students in this grade?
135a.
Report only for the school/program named on the front of this questionnaire.
b.
• Please print all information clearly, using a black ball point pen.
Do NOT include postsecondary or adult education students, or children who are enrolledonly in day care at this school/program.
• If you have any questions, please call the Census Bureau at 1–800–221–1204, Monday throughFriday, between 8:30 a.m. and 5:00 p.m. (Eastern time).
In column (1), mark (X) "Yes" or "No" for each grade level.
Nursery and prekindergarten
Transitional (or readiness)kindergarten (extra year of school forkindergarten-age children who arejudged not ready for kindergarten)
Kindergarten (traditional year ofschool primarily for 5-year-olds priorto first grade)
Transitional first (or prefirst) grade(extra year of school for children whohave attended kindergarten but havebeen judged not ready for first grade)
c.
d.
e.
155
165
175
160
180
4
FORM PSS-1 (7-26-2005)
2
150145
At the end of this questionnaire, you will be asked how long it took to complete thisquestionnaire. To help you with this, please record the time you begin.
4.
:
▲
▼▼
▲
• If you are unsure about how to answer a question, please give the best answer you can ratherthan leave it blank.
Time started
• When recording your answers, please write only one digit in an individual space, e.g.,
0 1 2 3 4 5 6 7 9
No
1 Yes ➔
2 No
1 Yes ➔
2 No
1 Yes ➔
2 No
1 Yes ➔
2 No
1 Yes ➔
,
(1)Number of students
in this grade
(2)
540
In column (2), record the number of students for each grade level with "Yes" marked incolumn (1).
,
,
170 ,
,
§’.)¤ 061308§’%!¤ 060400

12
FORM PSS-1 (7-26-2005)
Accelerated Christian Education (ACE) (or School of Tomorrow)
American Association of Christian Schools (AACS)
Association of Christian Schools International (ACSI)
Association of Christian Teachers and Schools (ACTS)
Association of Classical and Christian Schools (ACCS)
Christian Schools International (CSI)
Evangelical Lutheran Education Association (ELEA)
Friends Council on Education (FCE)
General Conference of the Seventh-Day Adventist Church (GCSDAC)
Islamic School League of America (ISLA)
Jesuit Secondary Education Association (JSEA)
National Association of Episcopal Schools (NAES)
National Catholic Educational Association (NCEA)
National Christian School Association (NCSA)
National Society for Hebrew Day Schools (NSHDS)
Oral Roberts University Educational Fellowship (ORUEF)
Solomon Schechter Day Schools (SSDS)
Southern Baptist Association of Christian Schools (SBACS)
Other religious school association(s) – Specify
1
1
1
1
1
1
1
1
1
1
1
1
1
1
1
1
1
1
1
15. To which of the following associations or organizations does thisschool/program belong?
Mark (X) all that apply.
This school/program does NOT belong to ANY associations or organizations.
RELIGIOUS
450 1
455
460
465
467
470
480
485
490
495
500
505
510
515
520
525
530
535
536
▲
▼▼
▲
5.
How many students were enrolled in each of the following grade levels aroundthe first of October?
Grade levels
What was the total number of students enrolled in thisschool/program around the first of October?
1st
2nd
3rd
4th
5th
7th
8th
6th
9th
10th
11th
12th
6.
StudentsPlease sum lines 5(a) through 5(q).
f.
g.
h.
i.
j.
k.
l.
m.
n.
o.
p.
q.
5
FORM PSS-1(7-26-2005)
Continued –
190185
205
195
305
215
225
235
245
255
265
275
285
295
210
200
220
230
240
250
260
270
280
290
300
▲
▼▼
▲
Does thisschool/program have
students in this grade?
2 No
1 Yes ➔,
(1)Number of students
in this grade
(2)
2 No
1 Yes ➔
2 No
1 Yes ➔
2 No
1 Yes ➔
2 No
1 Yes ➔
2 No
1 Yes ➔
2 No
1 Yes ➔
2 No
1 Yes ➔
2 No
1 Yes ➔
2 No
1 Yes ➔
2 No
1 Yes ➔
2 No
1 Yes ➔
468
492
,
,
,
,
,
,
,
,
,
,
,
,
§’&*¤ 060509§’-*¤ 061209

6
FORM PSS-1 (7-26-2005)
How many MALE students attended this school/program around the first of October?
Is this school/program coeducational?8a.
Yes
No, it is an all-female school
No, it is an all-male school
b.
7. Around the first of October, how many students were:
Do not include nursery, prekindergarten, postsecondary, or adult education students, orchildren who are enrolled only in day care at this school/program.
➔ GO TO item 9a on page 7.
1
2
3
⎫⎬⎭
0
Do NOT include nursery, prekindergarten, postsecondary, or adult educationstudents, or children who are enrolled only in daycare at this school/program.
a. Hispanic, regardless of race?
320 Students0 None or
b. White, not of Hispanic origin?
330 0
c. Black, not of Hispanic origin?
325 0
d.
American Indian or Alaska Native?
310
0
e.
Asian or Pacific Islander?
315
0
335
340
▲
▼▼
▲
GO TO item 15 on page 12.
11
FORM PSS-1 (7-26-2005)
14a. Does this school/program have a religious orientation or purpose?
b. Is this school/program affiliated with a religious organization or institution?
c. What is this school’s/program’s religious orientation or affiliation?
Roman Catholic
African Methodist Episcopal
Amish
Assembly of God
Baptist
Brethren
Calvinist
Christian (no specific denomination)
Church of Christ
Church of God
Church of God in Christ
Church of the Nazarene
Disciples of Christ
Episcopal
Friends
Greek Orthodox
Islamic
Jewish
Latter Day Saints
Lutheran Church -- Missouri Synod
Evangelical Lutheran Church in America (formerly AELC, ALC, or LCA)
Wisconsin Evangelical Lutheran Synod
Other Lutheran
Mennonite
Methodist
Pentecostal
Presbyterian
Seventh-Day Adventist
Other – Specify
1
2
430 Yes
No ➔
1
2
Yes
No
1
2
3
4
5
6
7
8
9
10
11
12
13
14
15
16
17
18
19
20
440
21
22
23
24
25
26
27
28
29
435
441
▲
▼▼
▲
If none, please mark (X) the box.
StudentsNone or
StudentsNone or
StudentsNone or
StudentsNone or
Male studentsNone or
If none, please mark (X) the box.
,
1
2
3
Parochial (or inter-parochial)
Diocesan
Private
445Is this school –Mark (X) only one box.Mark (X) only one box.
,
,
,
,
,
§’,!¤ 061100§’’)¤ 060608

10
FORM PSS-1 (7-26-2005)
13. Is this school/program located in a private home that is used primarily as a familyresidence?
425
415 REGULAR elementary or secondary
12a. Which of the following best describes this school/program?
b. Is a major role of this school/program to support homeschooling?
Elementary or secondary with a SPECIAL PROGRAMEMPHASIS (such as science/math school,performing arts school, foreign languageimmersion school, talented/gifted school, etc.)
SPECIAL EDUCATION school – primarily serves students with disabilities
VOCATIONAL/TECHNICAL school – primarily servesstudents being trained for occupations
ALTERNATIVE – offers a curriculum designed toprovide alternative or nontraditional education;does not specifically fall into the categories ofregular, special program emphasis, specialeducation, or vocational school – Please describe.
Mark (X) only one box.
420
MONTESSORI
EARLY CHILDHOOD PROGRAM/CHILD CARE CENTER(e.g., kindergarten only, prekindergarten andkindergarten only, kindergarten and transitionalfirst grade only, day care and transitionalkindergarten only, etc.)
Yes
No
1
2
1
2
3
4
5
7
6
Yes
No
1
2
416
▲
▼▼
▲
7
FORM PSS-1 (7-26-2005)
How many students graduated from the 12th grade last school year (2004-2005)?
Last school year (2004–2005), were any students enrolled in 12th grade?9a.
Yes
No
b.
➔ GO TO item 10a below.
1
2
12th graders
Graduates
How many students were enrolled in 12th grade around October 1, 2004?
c.
➔ GO TO item 10a below.0
Include 2005 summer graduates. Do not include students who received only vocationalcertificates, certificates of attendance, or certificates of completion.
None
Of those who graduated with a diploma last year, what PERCENTAGE went to:
Four-year colleges?
Two-year colleges?
d.
Percent
Percent
How long is the school day for a kindergarten, transitional kindergarten, ortransitional first grade student?
10a.
School/program does not offer kindergarten,transitional kindergarten, or transitional first grade
Full day (4 hours or more per day)
Half day (less than 4 hours per day)
Both offered
b. How many days per week does a kindergarten, transitional kindergarten, ortransitional first grade student attend?
If the number of days per week varies (e.g., some students attend 3 days per week andsome attend 5 days per week), record the most days that a student would attend in a week.
Days per week
0
1
2
3
➔ GO TO instructions foritem 11 at top of page 8.
345
Mark (X) only one box.
⎧⎨⎩
350
355
360
361
365
370
▲
▼▼
▲
,
,
§’((¤ 060707§’+"¤ 061001

8
FORM PSS-1 (7-26-2005)
▲
▼▼
▲
9
FORM PSS-1 (7-26-2005)
▲
▼▼
▲
INSTRUCTIONS AND AN EXAMPLE FOR ITEM 11
In item 11, we ask for the number of teachers for grades K – 12 by the amount of time theyteach at THIS school/program.
Full-time teachers
Teach at least 3⁄4 time but less than full time
Teach at least 1⁄2 time but less than 3⁄4 time
Teach at least 1⁄4 time but less than 1⁄2 time
Teach less than 1⁄4 time
TOTAL TEACHERS
If this school/program has eight full-time teachers for grades 1–8, one full-time teacher whoteaches kindergarten 1/2 time and prekindergarten 1/2 time, a music teacher who teachestwo days each week, a physical education teacher who teaches three days each week, and ateaching principal who teaches one 30-minute class each day, you would complete item 11as follows:
This number includes the one full-time teacher whoteaches kindergarten 1⁄2 time and prekindergarten 1⁄2 time.The time he/she spends teaching prekindergarten is notcounted in item 11.
This number also includes the physical education teacherwho teaches three days a week.
This includes the music teacher who teaches two days a week.
This includes the principal who teaches one 30-minute classeach day. The time he/she spends working as a principal is notincluded in item 11.
0 None or
0 X
11. Around October 1, 2005, how many persons were teaching in grades K–12 and/orCOMPARABLE ungraded levels at this school/program in the following timecategories?
Consider only the amount of time an individual works as a teacher during a typical weekat THIS school/program.
INCLUDE:
• Regular classroom teachers;• Teachers who teach subjects such as music, art, physical education, and special
education;• Teaching principals/administrators who teach a regularly scheduled class at this
school/program.
• Counselors, library media specialists/librarians, speech therapists, social workers, oradministrators UNLESS they also teach a regularly scheduled class at THISschool/program.
• Student teachers, teacher aides, day care aides, or short-term substitute teachers;• Teachers who teach ONLY nursery, prekindergarten, postsecondary, or adult education;
Do NOT include:
385
390
395
400
405
410
None or
0 None or
0 None or
0 None or
Full-time teachers
Teach at least 3⁄4 time but less than full time
Teach at least 1⁄2 time but less than 3⁄4 time
Teach at least 1⁄4 time but less than 1⁄2 time
Teach less than 1⁄4 time
TOTAL TEACHERS
0 None or
0 None or
0 None or
0 None or
0 None or
If none, please mark (X) the box.
§’*&¤ 060905§’)’¤ 060806

10
FORM PSS-1 (7-26-2005)
13. Is this school/program located in a private home that is used primarily as a familyresidence?
425
415 REGULAR elementary or secondary
12a. Which of the following best describes this school/program?
b. Is a major role of this school/program to support homeschooling?
Elementary or secondary with a SPECIAL PROGRAMEMPHASIS (such as science/math school,performing arts school, foreign languageimmersion school, talented/gifted school, etc.)
SPECIAL EDUCATION school – primarily serves students with disabilities
VOCATIONAL/TECHNICAL school – primarily servesstudents being trained for occupations
ALTERNATIVE – offers a curriculum designed toprovide alternative or nontraditional education;does not specifically fall into the categories ofregular, special program emphasis, specialeducation, or vocational school – Please describe.
Mark (X) only one box.
420
MONTESSORI
EARLY CHILDHOOD PROGRAM/CHILD CARE CENTER(e.g., kindergarten only, prekindergarten andkindergarten only, kindergarten and transitionalfirst grade only, day care and transitionalkindergarten only, etc.)
Yes
No
1
2
1
2
3
4
5
7
6
Yes
No
1
2
416
▲
▼▼
▲
7
FORM PSS-1 (7-26-2005)
How many students graduated from the 12th grade last school year (2004-2005)?
Last school year (2004–2005), were any students enrolled in 12th grade?9a.
Yes
No
b.
➔ GO TO item 10a below.
1
2
12th graders
Graduates
How many students were enrolled in 12th grade around October 1, 2004?
c.
➔ GO TO item 10a below.0
Include 2005 summer graduates. Do not include students who received only vocationalcertificates, certificates of attendance, or certificates of completion.
None
Of those who graduated with a diploma last year, what PERCENTAGE went to:
Four-year colleges?
Two-year colleges?
d.
Percent
Percent
How long is the school day for a kindergarten, transitional kindergarten, ortransitional first grade student?
10a.
School/program does not offer kindergarten,transitional kindergarten, or transitional first grade
Full day (4 hours or more per day)
Half day (less than 4 hours per day)
Both offered
b. How many days per week does a kindergarten, transitional kindergarten, ortransitional first grade student attend?
If the number of days per week varies (e.g., some students attend 3 days per week andsome attend 5 days per week), record the most days that a student would attend in a week.
Days per week
0
1
2
3
➔ GO TO instructions foritem 11 at top of page 8.
345
Mark (X) only one box.
⎧⎨⎩
350
355
360
361
365
370
▲
▼▼
▲
,
,
§’((¤ 060707§’+"¤ 061001

6
FORM PSS-1 (7-26-2005)
How many MALE students attended this school/program around the first of October?
Is this school/program coeducational?8a.
Yes
No, it is an all-female school
No, it is an all-male school
b.
7. Around the first of October, how many students were:
Do not include nursery, prekindergarten, postsecondary, or adult education students, orchildren who are enrolled only in day care at this school/program.
➔ GO TO item 9a on page 7.
1
2
3
⎫⎬⎭
0
Do NOT include nursery, prekindergarten, postsecondary, or adult educationstudents, or children who are enrolled only in daycare at this school/program.
a. Hispanic, regardless of race?
320 Students0 None or
b. White, not of Hispanic origin?
330 0
c. Black, not of Hispanic origin?
325 0
d.
American Indian or Alaska Native?
310 0
e.
Asian or Pacific Islander?
315 0
335
340
▲
▼▼
▲
GO TO item 15 on page 12.
11
FORM PSS-1 (7-26-2005)
14a. Does this school/program have a religious orientation or purpose?
b. Is this school/program affiliated with a religious organization or institution?
c. What is this school’s/program’s religious orientation or affiliation?
Roman Catholic
African Methodist Episcopal
Amish
Assembly of God
Baptist
Brethren
Calvinist
Christian (no specific denomination)
Church of Christ
Church of God
Church of God in Christ
Church of the Nazarene
Disciples of Christ
Episcopal
Friends
Greek Orthodox
Islamic
Jewish
Latter Day Saints
Lutheran Church -- Missouri Synod
Evangelical Lutheran Church in America (formerly AELC, ALC, or LCA)
Wisconsin Evangelical Lutheran Synod
Other Lutheran
Mennonite
Methodist
Pentecostal
Presbyterian
Seventh-Day Adventist
Other – Specify
1
2
430 Yes
No ➔
1
2
Yes
No
1
2
3
4
5
6
7
8
9
10
11
12
13
14
15
16
17
18
19
20
440
21
22
23
24
25
26
27
28
29
435
441
▲
▼▼
▲
If none, please mark (X) the box.
StudentsNone or
StudentsNone or
StudentsNone or
StudentsNone or
Male studentsNone or
If none, please mark (X) the box.
,
1
2
3
Parochial (or inter-parochial)
Diocesan
Private
445Is this school –Mark (X) only one box.Mark (X) only one box.
,
,
,
,
,
§’,!¤ 061100§’’)¤ 060608

12
FORM PSS-1 (7-26-2005)
Accelerated Christian Education (ACE) (or School of Tomorrow)
American Association of Christian Schools (AACS)
Association of Christian Schools International (ACSI)
Association of Christian Teachers and Schools (ACTS)
Association of Classical and Christian Schools (ACCS)
Christian Schools International (CSI)
Evangelical Lutheran Education Association (ELEA)
Friends Council on Education (FCE)
General Conference of the Seventh-Day Adventist Church (GCSDAC)
Islamic School League of America (ISLA)
Jesuit Secondary Education Association (JSEA)
National Association of Episcopal Schools (NAES)
National Catholic Educational Association (NCEA)
National Christian School Association (NCSA)
National Society for Hebrew Day Schools (NSHDS)
Oral Roberts University Educational Fellowship (ORUEF)
Solomon Schechter Day Schools (SSDS)
Southern Baptist Association of Christian Schools (SBACS)
Other religious school association(s) – Specify
1
1
1
1
1
1
1
1
1
1
1
1
1
1
1
1
1
1
1
15. To which of the following associations or organizations does thisschool/program belong?
Mark (X) all that apply.
This school/program does NOT belong to ANY associations or organizations.
RELIGIOUS
450 1
455
460
465
467
470
480
485
490
495
500
505
510
515
520
525
530
535
536
▲
▼▼
▲
5.
How many students were enrolled in each of the following grade levels aroundthe first of October?
Grade levels
What was the total number of students enrolled in thisschool/program around the first of October?
1st
2nd
3rd
4th
5th
7th
8th
6th
9th
10th
11th
12th
6.
StudentsPlease sum lines 5(a) through 5(q).
f.
g.
h.
i.
j.
k.
l.
m.
n.
o.
p.
q.
5
FORM PSS-1(7-26-2005)
Continued –
190185
205
195
305
215
225
235
245
255
265
275
285
295
210
200
220
230
240
250
260
270
280
290
300
▲
▼▼
▲
Does thisschool/program have
students in this grade?
2 No
1 Yes ➔,
(1)Number of students
in this grade
(2)
2 No
1 Yes ➔
2 No
1 Yes ➔
2 No
1 Yes ➔
2 No
1 Yes ➔
2 No
1 Yes ➔
2 No
1 Yes ➔
2 No
1 Yes ➔
2 No
1 Yes ➔
2 No
1 Yes ➔
2 No
1 Yes ➔
2 No
1 Yes ➔
468
492
,
,
,
,
,
,
,
,
,
,
,
,
§’&*¤ 060509§’-*¤ 061209

8
13
FORM PSS-1 (7-26-2005)
1
1
1
1
1
1
1
1
1
1
1
1
1
1
1
1
15. Continued –
American Montessori Society (AMS)
Association Montessori International (AMI)
Other Montessori association(s)
Association of Military Colleges and Schools (AMCS)
Association of Waldorf Schools of North America (AWSNA)
Bilingual School Association (BSA)
Council of Bilingual Education (CBE)
Council for Exceptional Children (CEC)
National Association of Private Special Education Centers (NAPSEC)
Other association(s) for exceptional children
European Council for International Schools (ECIS)
National Association for the Education of Young Children (NAEYC)
National Association of Bilingual Education (NABE)
National Association of Laboratory Schools (NALS)
National Coalition of Girls’ Schools (NCGS)
Other special emphasis association(s) – Specify
Alternative School Network (ASN)
Institute for Independent Education (IIE)
National Association of Independent Schools (NAIS)
State or regional independent school association
National Coalition of Alternative Community Schools (NCACS)
National Independent Private Schools Association (NIPSA)
The Association of Boarding Schools (TABS)
Other school association(s) – Specify
SPECIAL EMPHASIS
OTHER SCHOOL ASSOCIATIONS OR ORGANIZATIONS
To which of the following associations or organizations does thisschool/program belong?
542
1
1
1
1
1
1
1
1
Mark (X) all that apply.
545
550
555
560
565
570
575
580
585
590
595
600
602
605
606
610
615
620
622
625
630
635
640
641
▲
▼▼
▲
5.
INSTRUCTIONS
How many students were enrolled in each of the following grade levels aroundthe first of October?
Grade levels
Ungraded (including ungradedspecial education students) 140
Does thisschool/program have
students in this grade?
135a.
Report only for the school/program named on the front of this questionnaire.
b.
• Please print all information clearly, using a black ball point pen.
Do NOT include postsecondary or adult education students, or children who are enrolledonly in day care at this school/program.
• If you have any questions, please call the Census Bureau at 1–800–221–1204, Monday throughFriday, between 8:30 a.m. and 5:00 p.m. (Eastern time).
In column (1), mark (X) "Yes" or "No" for each grade level.
Nursery and prekindergarten
Transitional (or readiness)kindergarten (extra year of school forkindergarten-age children who arejudged not ready for kindergarten)
Kindergarten (traditional year ofschool primarily for 5-year-olds priorto first grade)
Transitional first (or prefirst) grade(extra year of school for children whohave attended kindergarten but havebeen judged not ready for first grade)
c.
d.
e.
155
165
175
160
180
4
FORM PSS-1 (7-26-2005)
2
150145
At the end of this questionnaire, you will be asked how long it took to complete thisquestionnaire. To help you with this, please record the time you begin.
4.
:
▲
▼▼
▲
• If you are unsure about how to answer a question, please give the best answer you can ratherthan leave it blank.
Time started
• When recording your answers, please write only one digit in an individual space, e.g.,
0 1 2 3 4 5 6 7 9
No
1 Yes ➔
2 No
1 Yes ➔
2 No
1 Yes ➔
2 No
1 Yes ➔
2 No
1 Yes ➔
,
(1)Number of students
in this grade
(2)
540
In column (2), record the number of students for each grade level with "Yes" marked incolumn (1).
,
,
170 ,
,
§’.)¤ 061308§’%!¤ 060400
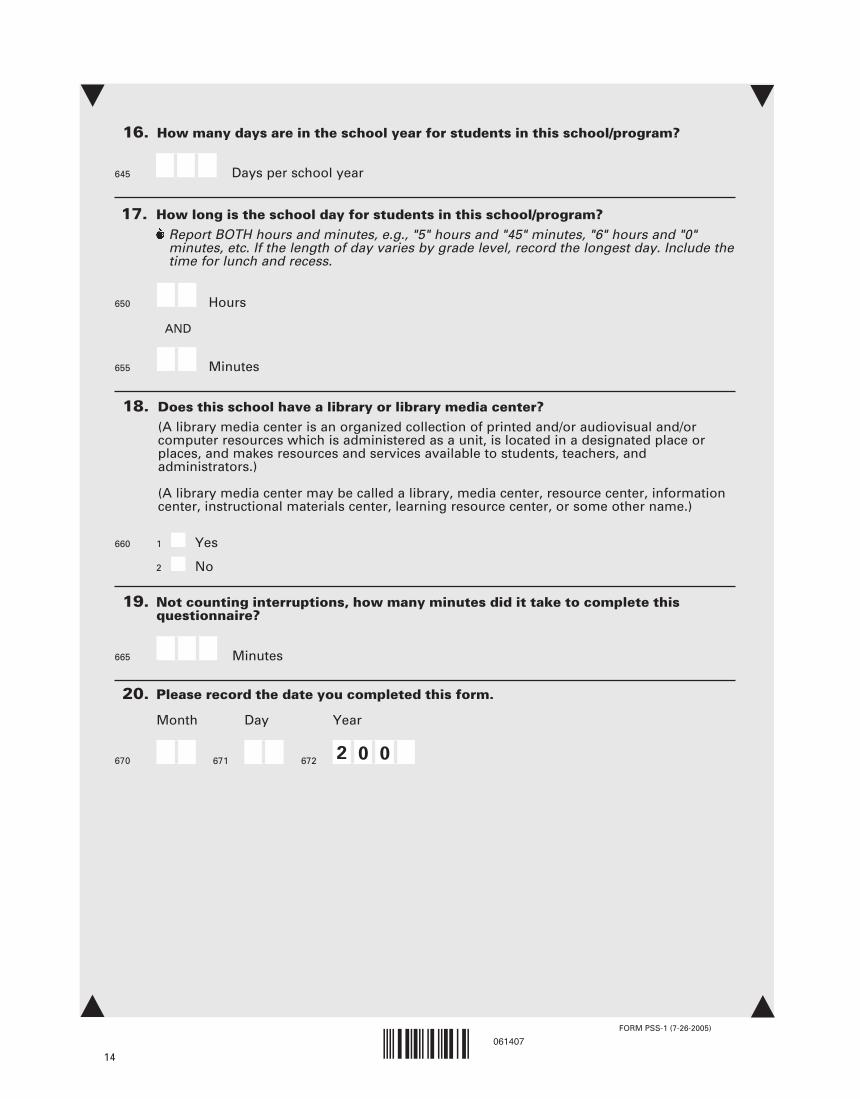
If you marked "Yes" for all of items 2a–e above, continue with item 4.
Is the institution or organization named on the front of this questionnaire a school?
If you marked "No" for any of items 2a–e, do not complete this questionnaire. Please return itin the enclosed envelope. If you do not have the return envelope, mail your questionnaire to:
2a.
U.S. Census BureauCurrent Surveys Check-in Unit 60A1201 East 10th StreetJeffersonville, IN 47132-0001
3.
2
YOUR NAME
TITLE
1.
1
Please print your name, title, and school telephone number in case we have questionsabout any of your responses.
051
050
Area code Number
3
FORM PSS-1 (7-26-2005)
——
For questions regarding this survey, please call the Census Bureau at 1–800–221–1204, Monday throughFriday, between 8:30 a.m. and 5:00 p.m. (Eastern time).
Yes
No – Please explain ➔➔ 106
b. Is this school a private school? (For this survey, all elementary or secondary schools that arenon-public are considered private schools, e.g., Roman Catholic schools, Hebrew day schools, Lutheranschools, private boarding schools, nonsectarian private schools, private schools that provide specialeducation services to public school districts, etc.)
2
1 Yes
No – Please describe the type of school (e.g., public school, Bureau of Indian Affairs school,state school, charter school, etc.)
➔131
c. Is this school still in operation?
2
1 Yes
No – Please record the date when the school closed.
➔YearMonth Day
101
d. Does this school teach any students in AT LEAST one of grades K to 12, or comparableungraded levels?
2
115 1 Yes
No – Please record the grade level(s) taught in this school (e.g., nursery and prekindergarten,adult education, postsecondary).
116
052
105
130
100
▲
▼▼
▲
➔
e. Is this school located in the United States?
2
1 Yes
No – Please specify the country in which this school is located.
126
125
14
FORM PSS-1 (7-26-2005)
19. Not counting interruptions, how many minutes did it take to complete thisquestionnaire?
20. Please record the date you completed this form.
YearMonth Day
16.
Days per school year
How many days are in the school year for students in this school/program?
17.Report BOTH hours and minutes, e.g., "5" hours and "45" minutes, "6" hours and "0"minutes, etc. If the length of day varies by grade level, record the longest day. Include thetime for lunch and recess.
How long is the school day for students in this school/program?
18. Does this school have a library or library media center?
2
1
Hours
Minutes
AND
650
655
Minutes
645
660
665
670
Yes
No
(A library media center is an organized collection of printed and/or audiovisual and/orcomputer resources which is administered as a unit, is located in a designated place orplaces, and makes resources and services available to students, teachers, andadministrators.)
(A library media center may be called a library, media center, resource center, informationcenter, instructional materials center, learning resource center, or some other name.)
▲
▼▼
▲
2 0 0671 672
SCHOOL TELEPHONE NUMBER
102 103
GO TO item 3 below.
GO TO item 3 below.
GO TO item 3 below.
GO TO item 3 below.
§’$"¤ 060301§’/(¤ 061407

15
FORM PSS-1 (7-26-2005)
THANK YOU FOR PARTICIPATING IN THIS IMPORTANT SURVEY.YOUR TIME AND EFFORT ARE APPRECIATED.
PLEASE RETURN THE QUESTIONNAIRE IN THE ENCLOSED ENVELOPE.IF YOU DO NOT HAVE THE RETURN ENVELOPE, MAIL YOUR QUESTIONNAIRE TO:
U.S. Census BureauCurrent Surveys Check-in Unit 60A1201 East 10th StreetJeffersonville, IN 47132-0001
21. Please verify this school’s/program’s name and mailing address that are printedon the front of this questionnaire.
School/program name
Mailing address
City
State ZIP Code + 4
If any part of the name and mailing address is incorrect, enter the correction(s),as necessary, in the appropriate space(s) below.
700
701
702
703 704
▲
▼▼
▲
SINCERELY,
JEFFREY A. OWINGSASSOCIATE COMMISSIONERNATIONAL CENTER FOR EDUCATION STATISTICSELEMENTARY/SECONDARY AND LIBRARY STUDIES DIVISION
U.S. Census BureauCurrent Surveys Check-in Unit 60A1201 East 10th StreetJeffersonville, IN 47132-0001
DEAR ADMINISTRATOR:
WHO IS CONDUCTING THIS SURVEY?
The National Center for Education Statistics (NCES) of the U.S. Department of Education requests yourparticipation in the 2005-2006 Private School Survey. The U.S. Census Bureau is conducting the surveyfor NCES as authorized by Public Law 107-279, Title I, Part E, Sections 151(b) and 153(a) of theEducation Sciences Reform Act of 2002.
WHY IS NCES SPONSORING THIS SURVEY?
The purpose of this data collection effort is to obtain current information about private schools, suchas type of school, length of school year, number of students and teachers, and number of highschool graduates, if any. We will use the data to produce a web-based private school search tool andstatistical summaries about the providers of private education in the United States.
WHO SHOULD PARTICIPATE IN THIS SURVEY?
The 2005-2006 Private School Survey includes all private schools and early childhood programs thatprovide educational instruction to students in kindergarten or at least one of grades 1-12.
WHY SHOULD YOUR SCHOOL PARTICIPATE IN THIS SURVEY?
Private schools are a significant segment of the nation’s educational system. Results from previoussurveys show that approximately 25 percent of all elementary and secondary schools in the UnitedStates are private; these schools enroll approximately 10 percent of the nation’s children and employ13 percent of the nation’s teachers. The National Center for Education Statistics has instituted thissurvey in recognition of the importance of private education in the United States.
While there is no penalty for not responding, a high response rate is very important to the success ofthe survey. We encourage you to participate in this voluntary survey.
WHERE SHOULD YOU MAIL YOUR COMPLETED QUESTIONNAIRE?
Please return your completed questionnaire using the enclosed envelope. If you do not have thereturn envelope, mail your questionnaire to:
THANK YOU FOR YOUR COOPERATION IN THIS VERY IMPORTANT EFFORT.
We are requesting your participation in an important national data collection that is very valuable toprivate schools across the country.
2
FORM PSS-1 (7-26-2005)
According to the Paperwork Reduction Act of 1995, no persons are required to respond to a collection ofinformation unless such collection displays a valid OMB control number. The valid OMB control numberfor this information collection is 1850-0641. The time required to complete this information collection isestimated to average 20 minutes per response, including the time to review instructions, search existingdata resources, gather the data needed, and complete and review the information collection. If you haveany comments concerning the accuracy of the time estimate(s) or suggestions for improving this form,please write to: U.S. Department of Education, Washington, DC 20202-4651. If you have comments orconcerns about the contents of this questionnaire, write directly to: Private School Survey, NationalCenter for Education Statistics, 1990 K Street, N.W., #9012, Washington, DC 20006-5651.
Paperwork Burden Statement
▲
▼▼
▲
-
Is the physical or street address of this school/program the same as the mailingaddress?
22a.
2
1 Yes
No
b. Please print this school’s/program’s physical or street address.
705
Street
City
State ZIP Code
706
707
708 709
§’0’¤ 061506§’##¤ 060202

To learn more about the Private School Survey(PSS) and to access reports from earlier
collections, see the PSS web site at:
http://nces.ed.gov/surveys/pss
Additional data collected by the National Centerfor Education Statistics (NCES) on a variety of
topics in elementary, secondary, postsecondary,and international education are available from
NCES’ web site at:
http://nces.ed.gov
For additional data collected by various Federalagencies, including the Department of Education,
visit the FedStats site at:
http://www.fedstats.gov
16
FORM PSS-1 (7-26-2005)
▲
▼▼
▲
PRIVATE SCHOOL SURVEY2005–2006 SCHOOL YEAR
OMB No. 1850-0641: Approval Expires 10/31/2006NOTICE – This survey is authorized by Public Law 107-129, Title I, Part E,Sections 151(b) and 153(a) of the Education Sciences Reform Act of 2002.
PLEASE NOTE:
The 2005–2006 Private School Survey is intended to include all private –SCHOOLS that teach ANY of the following –
• Transitional first (or prefirst) grade – extra year of school for children who have attendedkindergarten but have been judged not ready for first grade
• Kindergarten – traditional year of school primarily for 5-year-olds prior to first grade• Transitional (or readiness) kindergarten – extra year of school for kindergarten-age
children who are judged not ready for kindergarten
EARLY CHILDHOOD PROGRAMS AND CHILD CARE CENTERS that haveANY of the following –
• Transitional first (or prefirst) grade
• Kindergarten• Transitional (or readiness) kindergarten
For example:An early childhood center that has a nursery school, a prekindergarten program, and a kindergartenwould be eligible for this survey, since it includes a kindergarten.But an early childhood center that has a nursery school and a prekindergarten program ONLYwould NOT be eligible for this survey, since it does not include a kindergarten. You would markbox 2 in item 2d.
▼▼
PLEASE CONTINUE WITH ITEM 1 ON PAGE 3.
• Ungraded students between 5 and 18 years old
FORM(7-26-2005)
PSS-1
U.S. DEPARTMENT OF EDUCATIONNATIONAL CENTER FOR EDUCATION STATISTICS
Conducted by:U.S. DEPARTMENT OF COMMERCE
Economics and Statistics Administration
▲
▼▼
▲
U.S. CENSUS BUREAU
• At least one of grades 1 – 12
§’"$¤ 060103§’1&¤ 061605

C-1
Appendix C. Private School Lists Received and Processed Table C-1. Private school association lists received and processed: 2005–06
Association name American Association of Christian Schools American Montessori Society Association Montessori International Association of Christian Schools International Association of Christian Teachers and Schools
Association of Military Colleges and Schools of the United States Association of Waldorf Schools of North America Census of Jewish Schools Christian Schools International Conference of Seventh Day Adventists
Evangelical Lutheran Church in America Friends Council on Education International Christian Accrediting Association Institute for Independent Education Islamic School League of America
Jesuit Secondary Education Association Lutheran Church—Missouri Synod (LCMS) Lutheran Schools National Association of Episcopal Schools National Association of Independent Schools National Association of Private Special Education Centers
National Catholic Educational Association National Christian School Association National Coalition of Alternative Community Schools National Coalition of Girls’ Schools National Independent Private School Association
Solomon Schechter Day School Association Southern Baptist Association of Christian Schools Torah U’Mesora - National Society for Hebrew Day Schools Wisconsin Evangelical Lutheran Synod
SOURCE: U.S. Department of Education, National Center for Education Statistics, Private School Universe Survey (PSS), 2005–06.

C-2 2005–06 PSS Data File User’s Manual and Survey Documentation
Table C-2. State agency early childhood center lists, by state, selection for follow-up, and whether received or processed: 2005–06
State Follow-up1 Received Processed
State Follow-up1 Received Processed Alabama No No † New Jersey No No † Alaska Yes Yes Yes New Mexico No Yes No Arizona Yes Yes Yes New York Yes Yes Yes Arkansas No No † North Carolina Yes Yes Yes California No No † North Dakota No Yes No
Colorado Yes Yes Yes Ohio No Yes No Connecticut Yes Yes Yes Oklahoma No Yes No Delaware No No † Oregon No No † District of Columbia No No † Pennsylvania Yes Yes Yes Florida Yes Yes Yes Rhode Island No No †
Georgia No No † South Carolina No No † Hawaii No Yes No South Dakota Yes Yes Yes Idaho No No † Tennessee No No † Illinois Yes Yes Yes Texas No No † Indiana No No † Utah No No †
Iowa No Yes No Vermont No No † Kansas Yes Yes Yes Virginia Yes Yes Yes Kentucky No No † Washington Yes Yes Yes Louisiana Yes Yes Yes West Virginia No No † Maine No No † Wisconsin No No †
Maryland No No † Wyoming Yes Yes Yes Massachusetts No No † Michigan Yes Yes Yes Minnesota No Yes No Mississippi No Yes No
Missouri No No † Montana No No † Nebraska Yes Yes Yes Nevada Yes Yes Yes New Hampshire Yes Yes Yes
† Not applicable. 1 State or jurisdiction was selected in advance for follow-up in the event that there was no response to the initial request. SOURCE: U.S. Department of Education, National Center for Education Statistics, Private School Universe Survey (PSS), 2005–06.
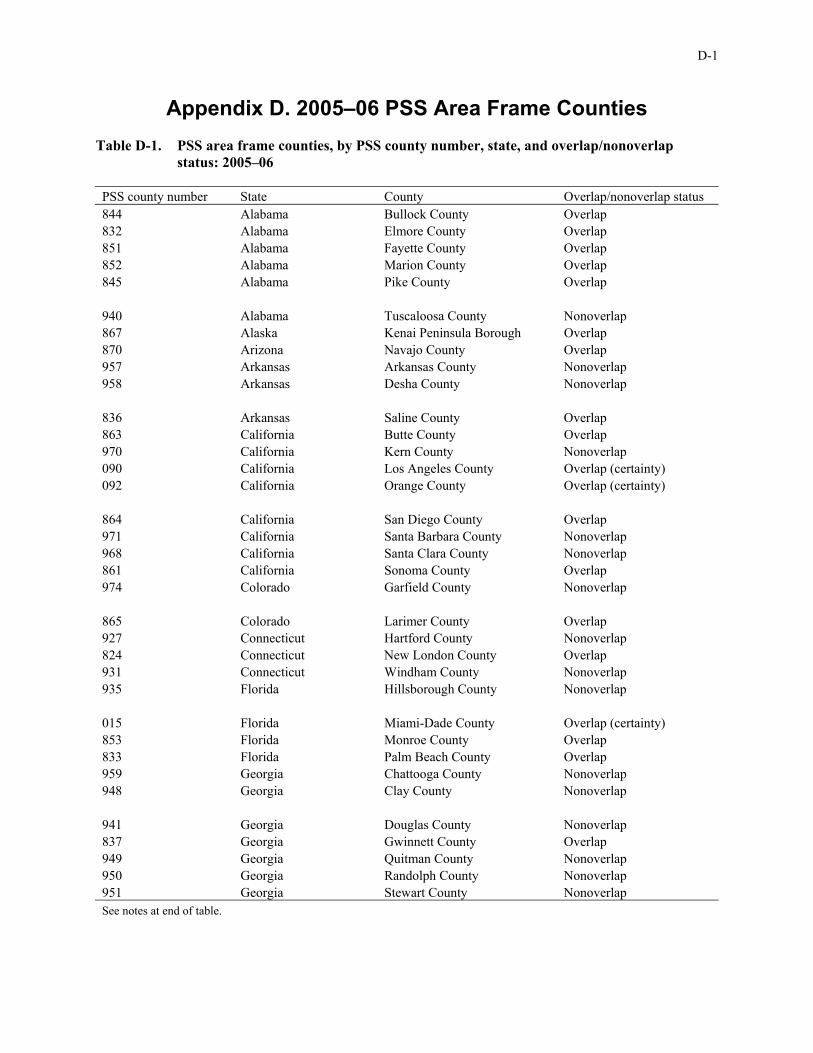
D-1
Appendix D. 2005–06 PSS Area Frame Counties Table D-1. PSS area frame counties, by PSS county number, state, and overlap/nonoverlap
status: 2005–06
PSS county number State County Overlap/nonoverlap status 844 Alabama Bullock County Overlap 832 Alabama Elmore County Overlap 851 Alabama Fayette County Overlap 852 Alabama Marion County Overlap 845 Alabama Pike County Overlap
940 Alabama Tuscaloosa County Nonoverlap 867 Alaska Kenai Peninsula Borough Overlap 870 Arizona Navajo County Overlap 957 Arkansas Arkansas County Nonoverlap 958 Arkansas Desha County Nonoverlap
836 Arkansas Saline County Overlap 863 California Butte County Overlap 970 California Kern County Nonoverlap 090 California Los Angeles County Overlap (certainty) 092 California Orange County Overlap (certainty)
864 California San Diego County Overlap 971 California Santa Barbara County Nonoverlap 968 California Santa Clara County Nonoverlap 861 California Sonoma County Overlap 974 Colorado Garfield County Nonoverlap
865 Colorado Larimer County Overlap 927 Connecticut Hartford County Nonoverlap 824 Connecticut New London County Overlap 931 Connecticut Windham County Nonoverlap 935 Florida Hillsborough County Nonoverlap
015 Florida Miami-Dade County Overlap (certainty) 853 Florida Monroe County Overlap 833 Florida Palm Beach County Overlap 959 Georgia Chattooga County Nonoverlap 948 Georgia Clay County Nonoverlap
941 Georgia Douglas County Nonoverlap 837 Georgia Gwinnett County Overlap 949 Georgia Quitman County Nonoverlap 950 Georgia Randolph County Nonoverlap 951 Georgia Stewart County Nonoverlap See notes at end of table.

D-2 2005–06 PSS Data File User’s Manual and Survey Documentation
Table D-1. PSS area frame counties, by PSS county number, state, and overlap/nonoverlap status: 2005–06—Continued
PSS county number State County Overlap/nonoverlap status 972 Idaho Ada County Nonoverlap 023 Illinois Cook County Overlap (certainty) 908 Illinois Douglas County Nonoverlap 914 Illinois Knox County Nonoverlap 804 Illinois Macon County Overlap
909 Illinois Moultrie County Nonoverlap 915 Illinois Stark County Nonoverlap 900 Indiana Allen County Nonoverlap 808 Indiana Franklin County Overlap 814 Indiana Greene County Overlap
904 Indiana Hancock County Nonoverlap 815 Indiana Owen County Overlap 809 Indiana Union County Overlap 800 Iowa Dubuque County Overlap 910 Iowa Henry County Nonoverlap
911 Iowa Lee County Nonoverlap 805 Iowa Woodbury County Overlap 816 Kansas Cherokee County Overlap 916 Kansas Cheyenne County Nonoverlap 810 Kansas Harvey County Overlap
917 Kansas Rawlins County Nonoverlap 918 Kansas Sherman County Nonoverlap 919 Kansas Thomas County Nonoverlap 854 Kentucky Estill County Overlap 936 Kentucky Kenton County Nonoverlap
855 Kentucky Powell County Overlap 834 Louisiana Lafayette Parish Overlap 846 Louisiana Madison Parish Overlap 847 Louisiana Richland Parish Overlap 952 Louisiana St. Mary Parish Nonoverlap
933 Maine Hancock County Nonoverlap 830 Maine Piscataquis County Overlap 937 Maryland Baltimore (city) Nonoverlap 923 Massachusetts Essex County Nonoverlap 828 Massachusetts Franklin County Overlap See notes at end of table.
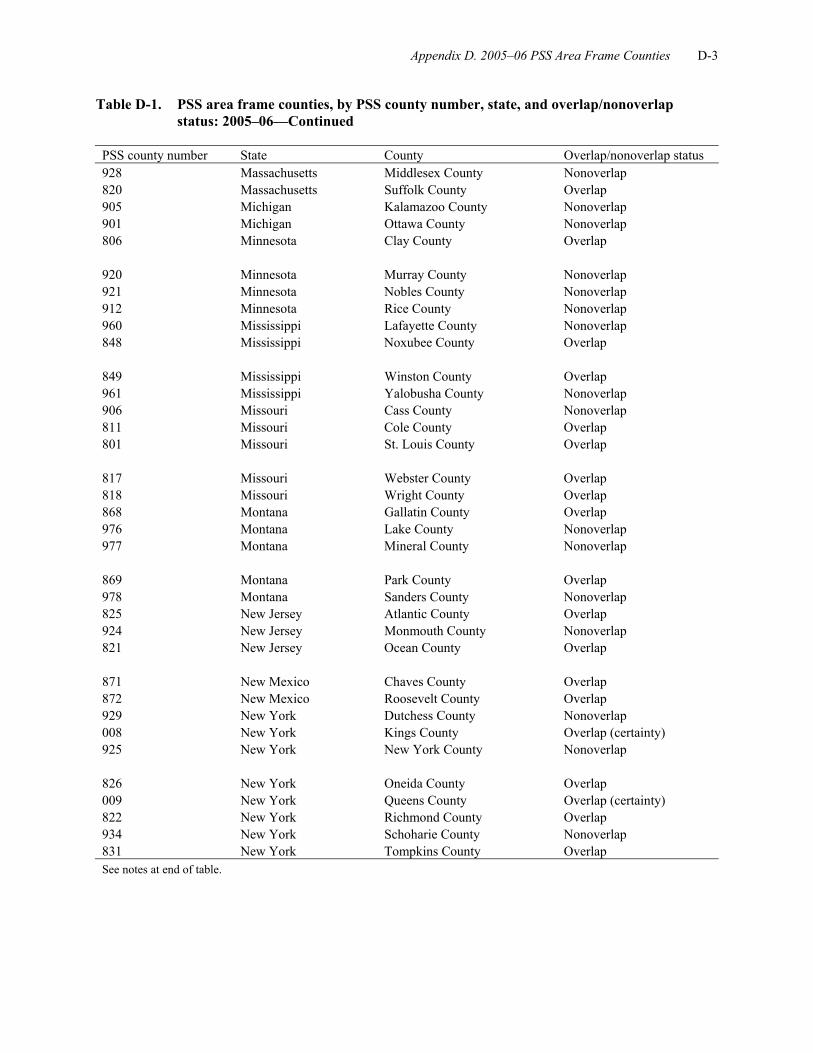
Appendix D. 2005–06 PSS Area Frame Counties D-3
Table D-1. PSS area frame counties, by PSS county number, state, and overlap/nonoverlap status: 2005–06—Continued
PSS county number State County Overlap/nonoverlap status 928 Massachusetts Middlesex County Nonoverlap 820 Massachusetts Suffolk County Overlap 905 Michigan Kalamazoo County Nonoverlap 901 Michigan Ottawa County Nonoverlap 806 Minnesota Clay County Overlap
920 Minnesota Murray County Nonoverlap 921 Minnesota Nobles County Nonoverlap 912 Minnesota Rice County Nonoverlap 960 Mississippi Lafayette County Nonoverlap 848 Mississippi Noxubee County Overlap
849 Mississippi Winston County Overlap 961 Mississippi Yalobusha County Nonoverlap 906 Missouri Cass County Nonoverlap 811 Missouri Cole County Overlap 801 Missouri St. Louis County Overlap
817 Missouri Webster County Overlap 818 Missouri Wright County Overlap 868 Montana Gallatin County Overlap 976 Montana Lake County Nonoverlap 977 Montana Mineral County Nonoverlap
869 Montana Park County Overlap 978 Montana Sanders County Nonoverlap 825 New Jersey Atlantic County Overlap 924 New Jersey Monmouth County Nonoverlap 821 New Jersey Ocean County Overlap
871 New Mexico Chaves County Overlap 872 New Mexico Roosevelt County Overlap 929 New York Dutchess County Nonoverlap 008 New York Kings County Overlap (certainty) 925 New York New York County Nonoverlap
826 New York Oneida County Overlap 009 New York Queens County Overlap (certainty) 822 New York Richmond County Overlap 934 New York Schoharie County Nonoverlap 831 New York Tompkins County Overlap See notes at end of table.

D-4 2005–06 PSS Data File User’s Manual and Survey Documentation
Table D-1. PSS area frame counties, by PSS county number, state, and overlap/nonoverlap status: 2005–06—Continued
PSS county number State County Overlap/nonoverlap status 930 New York Washington County Nonoverlap 953 North Carolina Brunswick County Nonoverlap 942 North Carolina Cabarrus County Nonoverlap 856 North Carolina Edgecombe County Overlap 838 North Carolina Gaston County Overlap
835 North Carolina Mecklenburg County Overlap 922 Ohio Athens County Nonoverlap 902 Ohio Cuyahoga County Nonoverlap 807 Ohio Franklin County Overlap 913 Ohio Huron County Nonoverlap
802 Ohio Lorain County Overlap 819 Ohio Paulding County Overlap 907 Ohio Wood County Nonoverlap 962 Oklahoma Choctaw County Nonoverlap 963 Oklahoma McCurtain County Nonoverlap
975 Oregon Linn County Nonoverlap 969 Oregon Washington County Nonoverlap 827 Pennsylvania Centre County Overlap 932 Pennsylvania Crawford County Nonoverlap 926 Pennsylvania Delaware County Nonoverlap
823 Pennsylvania Lackawanna County Overlap 054 Pennsylvania Philadelphia County Overlap (certainty) 829 Pennsylvania Schuylkill County Overlap 850 South Carolina Laurens County Overlap 857 Tennessee Carter County Overlap
858 Tennessee Johnson County Overlap 839 Tennessee Montgomery County Overlap 943 Tennessee Unicoi County Nonoverlap 944 Tennessee Washington County Nonoverlap 945 Texas Fort Bend County Nonoverlap
964 Texas Hale County Nonoverlap 069 Texas Harris County Overlap (certainty) 840 Texas Hays County Overlap 859 Texas Newton County Overlap 860 Texas Sabine County Overlap See notes at end of table.

Appendix D. 2005–06 PSS Area Frame Counties D-5
Table D-1. PSS area frame counties, by PSS county number, state, and overlap/nonoverlap status: 2005–06—Continued
PSS county number State County Overlap/nonoverlap status 965 Texas Swisher County Nonoverlap 947 Virginia Bristol (city) Nonoverlap 939 Virginia Fairfax (city) Nonoverlap 938 Virginia Fairfax County Nonoverlap 956 Virginia Franklin (city) Nonoverlap
842 Virginia Manassas (city) Overlap 843 Virginia Manassas Park (city) Overlap 966 Virginia Montgomery County Nonoverlap 841 Virginia Prince William County Overlap 967 Virginia Radford (city) Nonoverlap
954 Virginia Southampton County Nonoverlap 955 Virginia Sussex County Nonoverlap 946 Virginia Washington County Nonoverlap 866 Washington Benton County Overlap 862 Washington King County Overlap
973 Washington Pierce County Nonoverlap 812 Wisconsin Adams County Overlap 903 Wisconsin Eau Claire County Nonoverlap 803 Wisconsin Waukesha County Overlap 813 Wisconsin Wood County Overlap
979 Wyoming Goshen County Nonoverlap 980 Wyoming Platte County Nonoverlap
NOTE: All certainty counties were part of the overlap sample in 2005–06. SOURCE: U.S. Department of Education, National Center for Education Statistics, Private School Universe Survey (PSS), 2005–06.

E-1
Appendix E. Selected Weighted Response Rate Tables Tables E-1 and E-2 of this section present the number of interviews and noninterviews, and weighted response rates by NCES typology and by the religious and nonsectarian orientation of the school. Tables E-3 through E-11 of this section provide a breakdown of the weighted item response rates for the nine PSS items that had weighted item response rates of below 85 percent by NCES typology, school level, size, and urbanicity type. The weighted response rates presented in this section are provided for the purpose of ascertaining the quality of the data of these five items. Item wording can be found in the 2005–06 PSS questionnaire contained in appendix B of this report or online at http://nces.ed.gov/surveys/pss/pssdata.asp, where the questionnaire is available as a downloadable PDF file.

E-2 2005–06 PSS Data File User’s Manual and Survey Documentation
Table E-1. Weighted and unweighted number of PSS interviews and noninterviews, and weighted response rates, by NCES typology: 2005–06
NCES typology Interviews Noninterviews
Weighted response rate
Unweighted Weighted Unweighted Weighted (percent) Total 29,784 32,865 1,867 2,159 93.8 Catholic 6,928 6,928 236 236 96.7 Parochial 3,507 3,507 124 124 96.6 Diocesan 2,622 2,622 80 80 97.0 Private 799 799 32 32 96.1 Other religious 11,297 11,297 434 434 96.3 Conservative Christian 4,048 4,048 137 137 96.7 Affiliated 2,948 2,948 81 81 97.3 Unaffiliated 4,301 4,301 216 216 95.2 Nonsectarian 7,356 7,356 374 374 95.2 Regular 3,742 3,742 190 190 95.2 Special emphasis 2,476 2,476 123 123 95.3 Special education 1,138 1,138 61 61 94.9 Unknown 4,203 7,284 823 1,115 86.7
NOTE: Weighted using the inverse of the probability of selection. Religious or nonsectarian orientation status of school is that known prior to data collection. Detail may not sum to totals because of rounding. SOURCE: U.S. Department of Education, National Center for Education Statistics, Private School Universe Survey (PSS), 2005–06.

Appendix E. Selected Weighted Response Rate Tables E-3
Table E-2. Weighted and unweighted number of PSS interviews and noninterviews, and weighted response rates, by religious or nonsectarian orientation of school: 2005–06
Religious or nonsectarian category
Interviews Noninterviews Weighted response
rate (percent) Unweighted Weighted Unweighted Weighted
Total 29,784 32,865 1,867 2,159 93.8
Religious orientation 18,225 18,225 670 670 96.5
Roman Catholic 6,928 6,928 236 236 96.7 African Methodist Episcopal 10 10 1 1 90.9 Amish 550 550 16 16 97.2 Assembly of God 341 341 13 13 96.3 Baptist 1,746 1,746 95 95 94.8
Brethren 63 63 1 1 98.4 Calvinist 128 128 2 2 98.5 Christian (unspecified) 3,001 3,001 128 128 95.9 Church of Christ 160 160 2 2 98.8 Church of God 105 105 2 2 98.1
Church of God in Christ 19 19 0 0 100.0 Disciples of Christ 9 9 0 0 100.0 Episcopal 371 371 11 11 97.1 Friends 70 70 0 0 100.0 Greek Orthodox 23 23 1 1 95.8
Islamic 149 149 10 10 93.7 Jewish 642 642 64 64 90.9 Latter Day Saints 4 4 2 2 66.7 Lutheran Church—Missouri Synod 1,106 1,106 16 16 98.6 Evangelical Lutheran Church In America 160 160 3 3 98.2
Wisconsin Evangelical Lutheran Synod 333 333 6 6 98.2 Other Lutheran 70 70 3 3 95.9 Mennonite 320 320 5 5 98.5 Methodist 239 239 6 6 97.6 Pentecostal 266 266 11 11 96.0
Presbyterian 228 228 9 9 96.2 Seventh-Day Adventist 800 800 17 17 97.9 Other 384 384 10 10 97.5
Nonsectarian 7,356 7,356 374 374 95.2
Unknown 4,203 7,284 823 1,115 86.7 NOTE: Weighted using the inverse of the probability of selection. Religious or nonsectarian orientation status of school is that known prior to data collection. Detail may not sum to totals because of rounding. SOURCE: U.S. Department of Education, National Center for Education Statistics, Private School Universe Survey (PSS), 2005–06.

E-4 2005–06 PSS Data File User’s Manual and Survey Documentation
Table E-3. Final weighted item response rates for traditional private schools for item 9d-2yr (percentage of last-years graduates that went to 2-year colleges), by selected characteristics: 2005–06
Selected characteristic Number in universe Number of responses Final weighted item response
rate (percent) Total 8,419 7,022 83.4
NCES typology Catholic Parochial 185 165 88.9 Diocesan 541 487 90.1 Private 541 487 90.2
Other religious Conservative Christian 2,677 2,228 83.3 Affiliated 1,050 862 82.1 Unaffiliated 1,184 981 82.8
Nonsectarian Regular 1,048 920 87.8 Special emphasis 561 394 70.1 Special education 632 498 78.9
School level Elementary 49 34 68.5 Secondary 2,586 2,180 84.3 Combined 5,783 4,808 83.1
Size (number of students) Less than 50 1,855 1,519 81.9 50–149 2,317 1,837 79.3 150–299 1,669 1,398 83.7 300–499 1,080 956 88.5 500–749 788 691 87.7 750 or more 710 621 87.5
Urbanicity type City 2,763 2,309 83.6 Suburban 2,651 2,211 83.4 Town 918 774 84.3 Rural 2,086 1,729 82.9
NOTE: Detail may not sum to totals because of rounding or missing values in cells with too few sample cases. SOURCE: U.S. Department of Education, National Center for Education Statistics, Private School Universe Survey (PSS), “Documentation Data File,” 2005–06.

Appendix E. Selected Weighted Response Rate Tables E-5
Table E-4. Final weighted item response rates for kindergarten-terminal private schools for item 7a (number of Hispanic students), by selected characteristics: 2005–06
Selected characteristic Number in universe Number of responses Final weighted item response
rate (percent) Total 6,058 5,027 83.0
NCES typology Catholic Parochial 23 19 82.7 Diocesan 25 23 91.6 Private 62 52 83.3
Other religious Conservative Christian 206 180 87.5 Affiliated 370 305 82.4 Unaffiliated 1,144 957 83.7
Nonsectarian Regular 2,985 2,419 81.0 Special emphasis 1,215 1,051 86.5 Special education 29 22 73.1
School level Elementary 6,058 5,027 83.0 Secondary † † † Combined † † †
Size (number of students) Less than 50 5,916 4,953 83.7 50–149 131 69 52.5 150–299 9 3 34.1 300–499 1 1 100.0 500–749 1 1 100.0 750 or more 0 0 †
Urbanicity type City 2,039 1,679 82.3 Suburban 3,079 2,544 82.6 Town 378 327 86.5 Rural 562 476 84.8
† Not applicable. NOTE: Detail may not sum to totals because of rounding or missing values in cells with too few sample cases. SOURCE: U.S. Department of Education, National Center for Education Statistics, Private School Universe Survey (PSS), “Documentation Data File,” 2005–06.

E-6 2005–06 PSS Data File User’s Manual and Survey Documentation
Table E-5. Final weighted item response rates for kindergarten-terminal private schools for item 7b (number of White, non-Hispanic students), by selected characteristics: 2005–06
Selected characteristic Number in universe Number of responses Final weighted item response
rate (percent) Total 6,058 5,063 83.6
NCES typology Catholic Parochial 23 20 87.2 Diocesan 25 24 95.8 Private 62 55 88.2
Other religious Conservative Christian 206 180 87.5 Affiliated 370 306 82.7 Unaffiliated 1,144 965 84.4
Nonsectarian Regular 2,985 2,420 81.1 Special emphasis 1,215 1,072 88.3 Special education 29 22 73.1
School level Elementary 6,058 5,063 83.6 Secondary † † † Combined † † †
Size (number of students) Less than 50 5,916 4,986 84.3 50–149 131 71 54.1 150–299 9 4 44.7 300–499 1 1 100.0 500–749 1 1 100.0 750 or more 0 0 †
Urbanicity type City 2,039 1,691 82.9 Suburban 3,079 2,568 83.4 Town 378 329 87.0 Rural 562 475 84.6
† Not applicable. NOTE: Detail may not sum to totals because of rounding or missing values in cells with too few sample cases. SOURCE: U.S. Department of Education, National Center for Education Statistics, Private School Universe Survey (PSS), “Documentation Data File,” 2005–06.

Appendix E. Selected Weighted Response Rate Tables E-7
Table E-6. Final weighted item response rates for kindergarten-terminal private schools for item 7c (number of Black, non-Hispanic students), by selected characteristics: 2005–06
Selected characteristic Number in universe Number of responses Final weighted item response
rate (percent) Total 6,058 5,027 83.0
NCES typology Catholic Parochial 23 20 87.2 Diocesan 25 23 91.6 Private 62 54 86.6
Other religious Conservative Christian 206 177 86.0 Affiliated 370 303 81.8 Unaffiliated 1,144 958 83.7
Nonsectarian Regular 2,985 2,408 80.7 Special emphasis 1,215 1,063 87.5 Special education 29 22 73.1
School level Elementary 6,058 5,027 83.0 Secondary † † † Combined † † †
Size (number of students) Less than 50 5,916 4,951 83.7 50–149 131 70 53.3 150–299 9 4 44.7 300–499 1 1 100.0 500–749 1 1 100.0 750 or more 0 0 †
Urbanicity type City 2,039 1,685 82.6 Suburban 3,079 2,540 82.5 Town 378 328 86.8 Rural 562 473 84.2
† Not applicable. NOTE: Detail may not sum to totals because of rounding or missing values in cells with too few sample cases. SOURCE: U.S. Department of Education, National Center for Education Statistics, Private School Universe Survey (PSS), “Documentation Data File,” 2005–06.

E-8 2005–06 PSS Data File User’s Manual and Survey Documentation
Table E-7. Final weighted item response rates for kindergarten-terminal private schools for item 7d (number of Asian or Pacific Islander students), by selected characteristics: 2005–06
Selected characteristic Number in universe Number of responses Final weighted item response
rate (percent) Total 6,058 5,015 82.8
NCES typology Catholic Parochial 23 20 87.2 Diocesan 25 23 91.6 Private 62 51 81.7
Other religious Conservative Christian 206 177 86.0 Affiliated 370 301 81.5 Unaffiliated 1,144 956 83.6
Nonsectarian Regular 2,985 2,394 80.2 Special emphasis 1,215 1,071 88.2 Special education 29 22 73.1
School level Elementary 6,058 5,015 82.8 Secondary † † † Combined † † †
Size (number of students) Less than 50 5,916 4,940 83.5 50–149 131 70 53.3 150–299 9 4 44.7 300–499 1 0 0.0 500–749 1 1 100.0 750 or more 0 0 †
Urbanicity type City 2,039 1,675 82.1 Suburban 3,079 2,539 82.5 Town 378 327 86.5 Rural 562 474 84.4
† Not applicable. NOTE: Detail may not sum to totals because of rounding or missing values in cells with too few sample cases. SOURCE: U.S. Department of Education, National Center for Education Statistics, Private School Universe Survey (PSS), “Documentation Data File,” 2005–06.

Appendix E. Selected Weighted Response Rate Tables E-9
Table E-8. Final weighted item response rates for kindergarten-terminal private schools for item 7e (number of American Indian or Alaska Native students), by selected characteristics: 2005–06
Selected characteristic Number in universe Number of responses Final weighted item response
rate (percent) Total 6,058 4,915 81.1
NCES typology Catholic Parochial 23 19 82.7 Diocesan 25 22 87.4 Private 62 50 80.1
Other religious Conservative Christian 206 168 81.5 Affiliated 370 295 79.9 Unaffiliated 1,144 939 82.1
Nonsectarian Regular 2,985 2,364 79.2 Special emphasis 1,215 1,038 85.5 Special education 29 21 69.6
School level Elementary 6,058 4,915 81.1 Secondary † † † Combined † † †
Size (number of students) Less than 50 5,916 4,846 81.9 50–149 131 65 49.3 150–299 9 3 34.1 300–499 1 0 0.0 500–749 1 1 100.0 750 or more 0 0 †
Urbanicity type City 2,039 1,641 80.5 Suburban 3,079 2,483 80.6 Town 378 325 85.9 Rural 562 466 82.9
† Not applicable. NOTE: Detail may not sum to totals because of rounding or missing values in cells with too few sample cases. SOURCE: U.S. Department of Education, National Center for Education Statistics, Private School Universe Survey (PSS), “Documentation Data File,” 2005–06.

E-10 2005–06 PSS Data File User’s Manual and Survey Documentation
Table E-9. Final weighted item response rates for kindergarten-terminal private schools for item 8b (number of male students), by selected characteristics: 2005–06
Selected characteristic Number in universe Number of responses Final weighted item response
rate (percent) Total 6,032 4,792 79.4
NCES typology Catholic Parochial 23 22 95.2 Diocesan 25 19 75.1 Private 60 46 76.0
Other religious Conservative Christian 205 157 76.7 Affiliated 368 297 80.7 Unaffiliated 1,141 896 78.5
Nonsectarian Regular 2,969 2,434 82.0 Special emphasis 1,212 898 74.1 Special education 29 24 82.8
School level Elementary 6,032 4,792 79.4 Secondary † † † Combined † † †
Size (number of students) Less than 50 5,890 4,680 79.4 50–149 130 106 81.6 150–299 9 5 56.3 300–499 1 1 100.0 500–749 1 0 0.0 750 or more 0 0 †
Urbanicity type City 2,026 1,600 79.0 Suburban 3,069 2,423 79.0 Town 376 310 82.3 Rural 562 459 81.8
† Not applicable. NOTE: Detail may not sum to totals because of rounding or missing values in cells with too few sample cases. SOURCE: U.S. Department of Education, National Center for Education Statistics, Private School Universe Survey (PSS), “Documentation Data File,” 2005–06.

Appendix E. Selected Weighted Response Rate Tables E-11
Table E-10. Final weighted item response rates for kindergarten-terminal private schools for item 15 (membership in private school associations), by selected characteristics: 2005–06
Selected characteristic Number in universe Number of responses Final weighted item response
rate (percent) Total 6,058 4,738 78.2
NCES typology Catholic Parochial 23 21 91.5 Diocesan 25 23 91.8 Private 62 58 93.5
Other religious Conservative Christian 206 183 88.9 Affiliated 370 351 95.0 Unaffiliated 1,144 861 75.3
Nonsectarian Regular 2,985 2,152 72.1 Special emphasis 1,215 1,062 87.4 Special education 29 27 93.2
School level Elementary 6,058 4,738 78.2 Secondary † † † Combined † † †
Size (number of students) Less than 50 5,916 4,615 78.0 50–149 131 114 86.8 150–299 9 8 89.3 300–499 1 1 100.0 500–749 1 0 0.0 750 or more 0 0 †
Urbanicity type City 2,039 1,577 77.3 Suburban 3,079 2,440 79.2 Town 378 287 76.0 Rural 562 434 77.3
† Not applicable. NOTE: Detail may not sum to totals because of rounding or missing values in cells with too few sample cases. SOURCE: U.S. Department of Education, National Center for Education Statistics, Private School Universe Survey (PSS), “Documentation Data File,” 2005–06.

E-12 2005–06 PSS Data File User’s Manual and Survey Documentation
Table E-11. Final weighted item response rates for kindergarten-terminal private schools for item 16 (number of days in the school year), by selected characteristics: 2005–06
Selected characteristic Number in universe Number of responses Final weighted item response
rate (percent) Total 6,058 4,905 81.0
NCES typology Catholic Parochial 23 22 95.7 Diocesan 25 23 91.8 Private 62 52 83.5
Other religious Conservative Christian 206 178 86.5 Affiliated 370 312 84.5 Unaffiliated 1,144 977 85.4
Nonsectarian Regular 2,985 2,299 77.0 Special emphasis 1,215 1,029 84.7 Special education 29 12 41.4
School level Elementary 6,058 4,905 81.0 Secondary † † † Combined † † †
Size (number of students) Less than 50 5,916 4,793 81.0 50–149 131 103 78.6 150–299 9 8 89.3 300–499 1 1 100.0 500–749 1 0 0.0 750 or more 0 0 †
Urbanicity type City 2,039 1,590 78.0 Suburban 3,079 2,514 81.6 Town 378 316 83.5 Rural 562 485 86.3
† Not applicable. NOTE: Detail may not sum to totals because of rounding or missing values in cells with too few sample cases. SOURCE: U.S. Department of Education, National Center for Education Statistics, Private School Universe Survey (PSS), “Documentation Data File,” 2005–06.
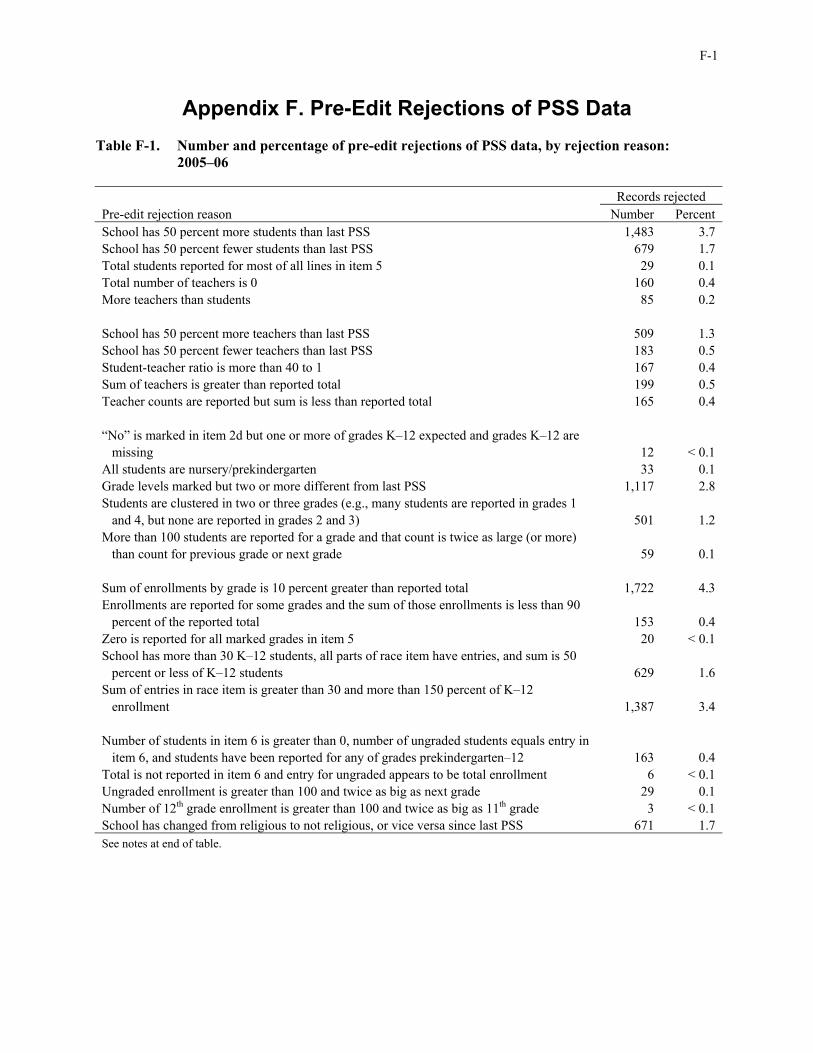
F-1
Appendix F. Pre-Edit Rejections of PSS Data Table F-1. Number and percentage of pre-edit rejections of PSS data, by rejection reason:
2005–06
Records rejected Pre-edit rejection reason Number Percent School has 50 percent more students than last PSS 1,483 3.7 School has 50 percent fewer students than last PSS 679 1.7 Total students reported for most of all lines in item 5 29 0.1 Total number of teachers is 0 160 0.4 More teachers than students 85 0.2
School has 50 percent more teachers than last PSS 509 1.3 School has 50 percent fewer teachers than last PSS 183 0.5 Student-teacher ratio is more than 40 to 1 167 0.4 Sum of teachers is greater than reported total 199 0.5 Teacher counts are reported but sum is less than reported total 165 0.4
“No” is marked in item 2d but one or more of grades K–12 expected and grades K–12 are missing 12 < 0.1 All students are nursery/prekindergarten 33 0.1 Grade levels marked but two or more different from last PSS 1,117 2.8 Students are clustered in two or three grades (e.g., many students are reported in grades 1
501 1.2 and 4, but none are reported in grades 2 and 3) More than 100 students are reported for a grade and that count is twice as large (or more)
59 0.1 than count for previous grade or next grade
Sum of enrollments by grade is 10 percent greater than reported total 1,722 4.3 Enrollments are reported for some grades and the sum of those enrollments is less than 90
153 0.4 percent of the reported total Zero is reported for all marked grades in item 5 20 < 0.1 School has more than 30 K–12 students, all parts of race item have entries, and sum is 50
629 1.6 percent or less of K–12 students Sum of entries in race item is greater than 30 and more than 150 percent of K–12 enrollment 1,387 3.4
Number of students in item 6 is greater than 0, number of ungraded students equals entry in 163 0.4 item 6, and students have been reported for any of grades prekindergarten–12
Total is not reported in item 6 and entry for ungraded appears to be total enrollment 6 < 0.1 Ungraded enrollment is greater than 100 and twice as big as next grade 29 0.1 Number of 12th grade enrollment is greater than 100 and twice as big as 11th grade 3 < 0.1 School has changed from religious to not religious, or vice versa since last PSS 671 1.7 See notes at end of table.

F-2 2005–06 PSS Data File User’s Manual and Survey Documentation
Table F-1. Number and percentage of pre-edit rejections of PSS data, by rejection reason: 2005–06—Continued
Pre-edit rejection reason Records rejected
Number Percent School has changed from one religion to another since last PSS 1,598 3.9 School has reported that it is not religious but name includes “Christ” or “God” 192 0.5 School has reported that it is not religious but belongs to a religious association 274 0.7 “Other” is marked for religious affiliation (may need to be recoded) 1,139 2.8 Type of school is different from previous PSS 1,174 2.9
Type of school is alternative (entry may need to be recoded into one of the other categories) 2,996 7.4 School is not early childhood center, has any of grades 1–12, school day is less than 4 hours
125 0.3 per day, and entry is different from value in last PSS School day is greater than 20 hours per day, and school is not a day care center or
142 0.4 Montessori school, and entry is different from value from last PSS Type of school is vocational 15 < 0.1 Number of students is greater than 30, school is not an early childhood center, and item 12
82 0.2 indicates school is located in a private home
Students are reported in item 5, item 10 indicates school has kindergarten, and no 767 1.9 kindergarten students are reported in item 5
School is not in South Dakota, North Dakota, Oklahoma, Arizona, New Mexico, or Alaska 340 0.8 and more than 30 percent of students are American Indian or Alaska Native
Entries for students by race may be percentages (sum of entries is 99, 100, or 101) 104 0.3 School with more than 30 students is in Hawaii but less than half of students are Asian or
51 0.1 Pacific Islander School is not in South Dakota, North Dakota, Oklahoma, Arizona, New Mexico, or Alaska
120 0.3 and more than 100 students are American Indian or Alaska Native
School is not in Hawaii or California and more than 50 percent of K–12 students are Asian 182 0.4 or Pacific Islander
School is not in Hawaii or California and more than 100 students are Asian or Pacific Islander 66 0.2 School is Jewish and more than half the K–12 students are not White 18 < 0.1 School is Jewish and number of White students is 0 16 < 0.1 Entry for Hispanic students appears to be sum of other categories 121 0.3
School is all male but was not in last PSS 31 0.1 School is not all male but was in last PSS 67 0.2 School is all female but was not in last PSS 51 0.1 School is not all female but was in last PSS 57 0.1 Coed is marked, but all students are male or no students are male 601 1.5 See notes at end of table.

Appendix F. Pre-Edit Rejections of PSS Data F-3
Table F-1. Number and percentage of pre-edit rejections of PSS data, by rejection reason: 2005–06—Continued
Pre-edit rejection reason Records rejected
Number Percent Total number of students is 10 or less and school is in a private home or supports
276 0.7 homeschooling Number of teachers is greater than or equal to number of students and school supports
49 0.1 homeschooling or is in a private home School has more than 30 students, is not special ed or alternative, is not located in a private
1,142 2.8 home, and student-teacher ratio is less than 5 to 1 School supports homeschool and is located in a private home 216 0.5 School located in private home and does not support homeschooling 194 0.5
School had more graduates than 12th graders last year 246 0.6 Number of 12th graders this year is 30 percent more than number reported for last year 129 0.3 Number of 12th graders this year is 30 percent less than number reported for last year 63 0.2 Entries in item 9d appear to be counts instead of percentages 318 0.8 Highest grade in school is 8th or lower, but 12th graders or graduates are reported for last year 69 0.2
Days in school year are less than 150 and entry is different from value from last PSS 351 0.9 School is not Montessori, special ed, alternative, or early childhood, and days in school year
390 1.0 are more than 200, and entry is different from value from last PSS “No” is marked for religious orientation or purpose but association is religious 274 0.7 Affiliation is Catholic but association is some other religion 6 < 0.1 Association is Islamic, Quaker, SDA, Catholic, Episcopal, Jewish, or Baptist but affiliation
4 < 0.1 is some other religion
Affiliation is Episcopal but association is some other religion 1 < 0.1 Affiliation is Islamic but association is some other religion 34 0.1 Affiliation is Jewish but association is some other religion 3 < 0.1
SOURCE: U.S. Department of Education, National Center for Education Statistics, Private School Universe Survey (PSS), 2005–06.

F-4 2005–06 PSS Data File User’s Manual and Survey Documentation
Table F-2. Number of changes made to PSS variables during the pre-edit: 2005–06
Item Variable Records where Percent of
Item Variable Records where Percent of
values changed total records values changed total records 5a 135 37 0.1 5p 285 18 < 0.1
140 36 0.1 290 18 < 0.1 5b 145 3 < 0.1 5q 295 18 < 0.1
150 7 < 0.1 300 25 0.1 5c 155 2 < 0.1 6 305 14 < 0.1
160 4 < 0.1 7a 320 7 < 0.1
5d 165 1 < 0.1 7b 330 4 < 0.1 170 1 < 0.1 7c 325 1 < 0.1
5e 175 1 < 0.1 7d 315 13 < 0.1 180 2 < 0.1 7e 310 † †
5f 185 15 < 0.1 8a 335 † †
190 15 < 0.1 8b 340 † † 5g 195 15 < 0.1 9a 345 † †
200 15 < 0.1 9b 350 † † 5h 205 15 < 0.1 9c 355 † †
210 16 < 0.1 9d 360 † †
5i 215 15 < 0.1 361 † † 220 15 < 0.1 10a 365 † †
5j 225 17 < 0.1 10b 370 † † 230 18 < 0.1 11 385 4 < 0.1
5k 235 17 < 0.1 390 2 < 0.1
240 17 < 0.1 395 1 < 0.1 5l 245 19 < 0.1 400 1 < 0.1
250 19 < 0.1 405 4 < 0.1 5m 255 23 0.1 410 77 0.2
260 26 0.1 12a 415 1,001 2.5
5n 265 20 < 0.1 12b 420 † † 270 21 0.1 13 425 174 0.4
5o 275 19 < 0.1 14a 430 329 0.8 280 19 < 0.1 14b 435 177 0.4 See notes at end of table.

Appendix F. Pre-Edit Rejections of PSS Data F-5
Table F-2. Number of changes made to PSS variables during the pre-edit: 2005–06—Continued
Item Variable Records where Percent of
Item Variable Records where Percent of
values changed total records values changed total records
14c 440 840 2.1 15—Cont. 550 † †
445 † † 555 5 < 0.1 15 450 4 < 0.1 560 2 < 0.1
455 57 0.1 565 † † 460 22 0.1 570 41 0.1
465 7 < 0.1 575 24 0.1 467 6 < 0.1 580 73 0.2 468 13 < 0.1 585 1 < 0.1 470 13 < 0.1 590 67 0.2 480 40 0.1 595 † †
485 4 < 0.1 600 † † 490 39 0.1 602 † † 492 30 0.1 605 292 0.7 495 4 < 0.1 610 † † 500 17 < 0.1 615 † †
505 221 0.5 620 44 0.1 510 7 < 0.1 622 556 1.4 515 25 0.1 625 † † 520 4 < 0.1 630 3 < 0.1 525 4 < 0.1 635 9 < 0.1
530 11 < 0.1 640 1,411 3.5 535 1,484 3.7 16 645 51 0.1 540 34 0.1 17 650 10 < 0.1 542 108 0.3 655 † †
545 244 0.6 18 660 † † † Not applicable. SOURCE: U.S. Department of Education, National Center for Education Statistics, Private School Universe Survey (PSS), 2005–06.

G-1
Appendix G. Count of Changes Made During Editing and Imputation
Table G-1. PSS second-stage imputation variables: 2005–06
Matching variables: name and description Values TYP_9 Nine-level NCES typology 1 = Catholic, parochial
2 = Catholic, diocesan 3 = Catholic, private 4 = Other religious, conservative Christian 5 = Other religious, affiliated with an established religious group or denomination 6 = Other religious, not affiliated with any established religious group or denomination 7 = Nonsectarian, regular school 8 = Nonsectarian, special program 9 = Nonsectarian, special education
TYP_3 Three-level NCES typology 1 = Catholic 2 = Other religious 3 = Nonsectarian
ENR School enrollment category 1 = Less than 150 students 2 = 150–399 students 3 = 400 students or more
LEVEL School level 1 = Elementary 2 = Secondary 3 = Combined or ungraded
TYPE School type 1 = Regular, Montessori, or Special Program Emphasis 2 = Special education 3 = Vocational education 4 = Alternative 5 = Early childhood/day care
UNGRADED School organization 1 = All students are ungraded (not assigned to grades 1, 2, etc.) 2 = Some or all students are assigned to grade levels
URB Type of community where 1 = City school is located 2 = Suburb
3 = Town 4 = Rural
SOURCE: U.S. Department of Education, National Center for Education Statistics, Private School Universe Survey (PSS), 2005–06.

G-2 2005–06 PSS Data File User’s Manual and Survey Documentation
Table G-2. PSS second-stage imputation matching variables and collapsing order: 2005–06
Item Matching variables Order of collapse 5, 6 LEVEL, TYP_3, ENR, URB URB, ENR
7 TYP_3, TYP_9, URB, ENR ENR, URB, TYP_9
8 TYP_3, LEVEL, URB, TYP_9 TYP_9, URB, LEVEL
9, 10 TYP_3, LEVEL, ENR, URB URB, ENR, LEVEL
11 TYP_3, LEVEL, TYPE, ENR ENR, TYPE, LEVEL
12a, 12b TYP_3, UNGRADED, LEVEL, TYP_9 TYP_9, LEVEL, UNGRADED
14b TYP_3, TYP_9 TYP_9
16, 17, 18 TYP_3, TYP_9, LEVEL, TYPE TYPE, LEVEL, TYP_9 SOURCE: U.S. Department of Education, National Center for Education Statistics, Private School Universe Survey (PSS), 2005–06.

Appendix G. Count of Changes Made During Editing and Imputation G-3
Table G-3. Number of changes made to PSS variables during editing and imputation: 2005–06
Item Variable Records where Percent of
Item Variable Records where Percent of
values changed total records values changed total records 5a 135 975 2.4 5p 285 524 1.3
140 1,015 2.5 290 1,043 2.6 5b 145 577 1.4 5q 295 534 1.3
150 1,049 2.6 300 1,039 2.6 5c 155 331 0.8 6 305 403 1.0
160 1,058 2.6 7a 320 13,039 32.2
5d 165 1,001 2.5 7b 330 14,889 36.8 170 1,026 2.5 7c 325 13,337 32.9
5e 175 1,003 2.5 7d 315 12,372 30.5 180 1,015 2.5 7e 310 7,048 17.4
5f 185 302 0.7 8a 335 172 0.4
190 1,041 2.6 8b 340 3,472 8.6 5g 195 291 0.7 9a 345 25 0.1
200 1,049 2.6 9b 350 279 0.7 5h 205 286 0.7 9c 355 206 0.5
210 1,056 2.6 9d 360 965 2.4
5i 215 289 0.7 361 1,199 3 220 1,059 2.6 10a 365 432 1.1
5j 225 290 0.7 10b 370 500 1.2 230 1,062 2.6 11 385 465 1.1
5k 235 282 0.7 390 1,121 2.8
240 1,063 2.6 395 1,030 2.5 5l 245 310 0.8 400 1,175 2.9
250 1,061 2.6 405 1,207 3 5m 255 310 0.8 410 1,014 2.5
260 1,059 2.6 12a 415 523 1.3
5n 265 489 1.2 12b 420 283 0.7 270 1,040 2.6 13 425 45 0.1
5o 275 513 1.3 14a 430 84 0.2 280 1,045 2.6 14b 435 614 1.5 See notes at end of table.

G-4 2005–06 PSS Data File User’s Manual and Survey Documentation
Table G-3. Number of changes made to PSS variables during editing and imputation: 2005–06—Continued
Item Variable Records where Percent of
Item Variable Records where Percent of
values changed total records values changed total records 15—
14c 440 218 0.5 Cont. 550 3,540 8.7 445 350 0.9 555 3,540 8.7
15 450 3,541 8.7 560 3,540 8.7 455 3,540 8.7 565 3,540 8.7 460 3,540 8.7 570 3,540 8.7
465 3,540 8.7 575 3,540 8.7 467 3,540 8.7 580 3,540 8.7 468 3,540 8.7 585 3,538 8.7 470 3,540 8.7 590 3,540 8.7 480 3,540 8.7 595 3,540 8.7
485 3,540 8.7 600 3,540 8.7 490 3,540 8.7 602 3,540 8.7 492 3,540 8.7 605 3,540 8.7 495 3,540 8.7 610 3,540 8.7 500 3,540 8.7 615 3,540 8.7
505 3,540 8.7 620 3,540 8.7 510 3,540 8.7 622 3,540 8.7 515 3,540 8.7 625 3,540 8.7 520 3,540 8.7 630 3,540 8.7 525 3,540 8.7 635 3,540 8.7
530 3,540 8.7 640 3,541 8.7 535 3,540 8.7 16 645 2,200 5.4 540 3,540 8.7 17 650 1,119 2.8 542 3,540 8.7 655 1,117 2.8
545 3,540 8.7 18 660 211 0.5 SOURCE: U.S. Department of Education, National Center for Education Statistics, Private School Universe Survey (PSS), 2005–06.

H-1
Appendix H. Variable Categories Used in Developing Adjustment Factor Cells for Weighting
A detailed listing of the weighting classes, or cells, is contained in this appendix. The nonresponse adjustment cells for list-frame schools are presented first, followed by the cells for area-frame schools. Refer to chapter VI on weighting for a more general description of the weighting procedure.
Nonresponse Adjustment Cells for List-Frame Schools: Affiliation by Grade Level by Enrollment
Affiliation is also divided into three community types (central city, urban fringe, and rural). These divisions are not shown. Grade level has four categories: K-terminal schools, elementary schools, secondary schools, and combined schools. Catholic—Parochial Schools: Grade Level by Enrollment K-terminal: No enrollment categories Elementary: Less than 100, 100–149, 150–174, 175–199, 200–224, 225–249,
250–274, 275–299, 300–349, 350–449, 450–549, 550 or more Secondary1: Less than 100, 100–149, 150–174, 175–199, 200–224, 225–249,
250–274, 275–299, 300–349, 350–449, 450–549, 550 or more Combined1: Less than 100, 100–149, 150–174, 175–199, 200–224, 225–249,
250–274, 275–299, 300–349, 350–449, 450–549, 550 or more Catholic—Diocesan: Grade Level by Enrollment K-terminal: No enrollment categories Elementary: Less than 75, 75–99, 100–124, 125–149, 150–174, 175–199, 200–224,
225–249, 250–274, 275–299, 300–349, 350–399, 400–449, 450–499, 500–549, 550–649, 650–749, 750–849, 850–949, 950–1,149, 1,150 or more
Secondary1: Less than 75, 75–99, 100–124, 125–149, 150–174, 175–199, 200–224, 225–249, 250–274, 275–299, 300–349, 350–399, 400–449, 450–499, 500–549, 550–649, 650–749, 750–849, 850–949, 950–1,149, 1,150 or more
Combined1: Less than 75, 75–99, 100–124, 125–149, 150–174, 175–199, 200–224, 225–249, 250–274, 275–299, 300–349, 350–399, 400–449, 450–499, 500–549, 550–649, 650–749, 750–849, 850–949, 950–1,149, 1,150 or more
1 Grade level is not divided into community types.
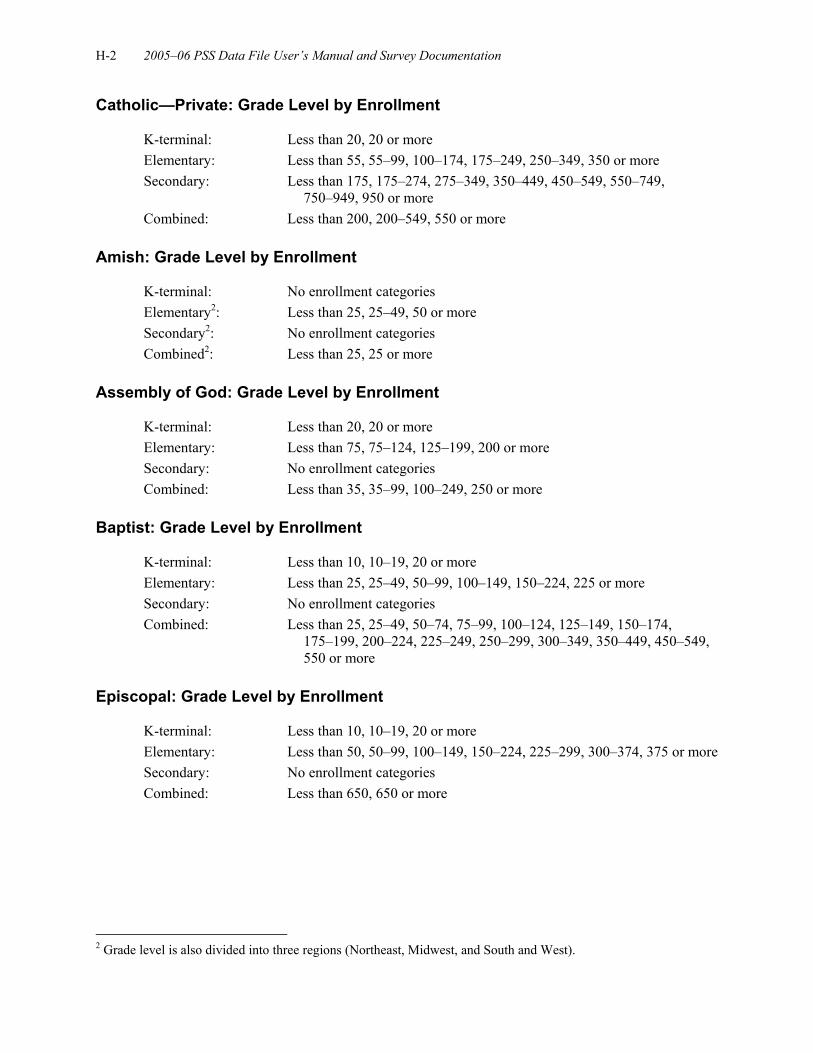
H-2 2005–06 PSS Data File User’s Manual and Survey Documentation
Catholic—Private: Grade Level by Enrollment K-terminal: Less than 20, 20 or more Elementary: Less than 55, 55–99, 100–174, 175–249, 250–349, 350 or more Secondary: Less than 175, 175–274, 275–349, 350–449, 450–549, 550–749,
750–949, 950 or more Combined: Less than 200, 200–549, 550 or more Amish: Grade Level by Enrollment K-terminal: No enrollment categories Elementary2: Less than 25, 25–49, 50 or more Secondary2: No enrollment categories Combined2: Less than 25, 25 or more Assembly of God: Grade Level by Enrollment K-terminal: Less than 20, 20 or more Elementary: Less than 75, 75–124, 125–199, 200 or more Secondary: No enrollment categories Combined: Less than 35, 35–99, 100–249, 250 or more Baptist: Grade Level by Enrollment K-terminal: Less than 10, 10–19, 20 or more Elementary: Less than 25, 25–49, 50–99, 100–149, 150–224, 225 or more Secondary: No enrollment categories Combined: Less than 25, 25–49, 50–74, 75–99, 100–124, 125–149, 150–174,
175–199, 200–224, 225–249, 250–299, 300–349, 350–449, 450–549, 550 or more
Episcopal: Grade Level by Enrollment K-terminal: Less than 10, 10–19, 20 or more Elementary: Less than 50, 50–99, 100–149, 150–224, 225–299, 300–374, 375 or more Secondary: No enrollment categories Combined: Less than 650, 650 or more
2 Grade level is also divided into three regions (Northeast, Midwest, and South and West).

Appendix H. Variable Categories Used in Developing Adjustment Factor Cells for Weighting H-3
Jewish: Grade Level by Enrollment K-terminal: Less than 15, 15 or more Elementary: Less than 50, 50–99, 100–149, 150–199, 200–274, 275–449, 450 or more Secondary: Less than 50, 50–99, 100–199, 200 or more Combined: Less than 225, 225–349, 350–649, 650 or more Lutheran Church—Missouri Synod: Grade Level by Enrollment K-terminal: Less than 10, 10–19, 20 or more Elementary: Less than 25, 25–49, 50–74, 75–99, 100–124, 125–149, 150–174,
175–199, 200–249, 250–299, 300 or more Secondary: Less than 200, 200 or more Combined: No enrollment categories Evangelical Lutheran Church—Wisconsin Synod: Grade Level by Enrollment K-terminal: No enrollment categories Elementary: Less than 35, 35–69, 70–99, 100–149, 150 or more Secondary: No enrollment categories Combined: No enrollment categories Mennonite: Grade Level by Enrollment K-terminal: No enrollment categories Elementary: Less than 25, 25–49, 50 or more Secondary: No enrollment categories Combined: Less than 25, 25–49, 50–74, 75 or more Pentacostal: Grade Level by Enrollment K-terminal: No enrollment categories Elementary: Less than 75, 75 or more Secondary: No enrollment categories Combined: Less than 25, 25–49, 50–99, 100 or more Seventh-Day Adventist: Grade Level by Enrollment K-terminal: No enrollment categories Elementary: Less than 25, 25–49, 50–99, 100 or more Secondary: Less than 125, 125 or more Combined: Less than 25, 25–49, 50–124, 125 or more

H-4 2005–06 PSS Data File User’s Manual and Survey Documentation
Other Religious: Grade Level by Enrollment K-terminal3: Less than 10, 10–19, 20 or more Elementary: Less than 25, 25–49, 50–74, 75–99, 100–124, 125–149, 150–174,
175–199, 200–224, 225–274, 275–324, 325–374, 375–449, 450–549, 550–749, 750 or more
Secondary: Less than 25, 25–49, 50–74, 75–99, 100–124, 125–149, 150–174, 175–199, 200–224, 225–274, 275–324, 325–374, 375–449, 450–549, 550–749, 750 or more
Combined: Less than 25, 25–49, 50–74, 75–99, 100–124, 125–149, 150–174, 175–199, 200–224, 225–274, 275–324, 325–374, 375–449, 450–549, 550–749, 750 or more
Nonsectarian—Regular: Grade Level by Enrollment K-terminal3: Less than 10, 10–19, 20 or more Elementary: Less than 25, 25–49, 50–74, 75–99, 100–124, 125–149, 150–184,
185–224, 225–274, 275–349, 350 or more Secondary: Less than 25, 25–49, 50–74, 75–124, 125–274, 275 or more Combined: Less than 25, 25–49, 50–74, 75–124, 125–274, 275–449, 450–649,
650–849, 850 or more Nonsectarian—Special Emphasis: Grade Level by Enrollment K-terminal3: Less than 10, 10–19, 20 or more Elementary3: Less than 25, 25–49, 50–74, 75–99, 100–124, 125–149, 150–199,
200 or more Secondary3: No enrollment categories Combined3: Less than 25, 25–49, 50–199, 200 or more Nonsectarian—Special Education: Grade Level by Enrollment K-terminal: No enrollment categories Elementary: No enrollment categories Secondary: No enrollment categories Combined: No enrollment categories
3 Grade level is also divided into four regions (Northeast, Midwest, South, and West).

Appendix H. Variable Categories Used in Developing Adjustment Factor Cells for Weighting H-5
Nonresponse Adjustment Cells for Area-Frame Schools: PSU Status by Three-Level Typology by Grade Level
Certainty PSU: Three-Level Typology by Grade Level Catholic: K-terminal, elementary, secondary, combined Other religious: K-terminal, elementary, secondary, combined Nonsectarian: K-terminal, elementary, secondary, combined Noncertainty PSU: Three-Level Typology by Grade Level Catholic: K-terminal, elementary, secondary, combined Other religious: K-terminal, elementary, secondary, combined Nonsectarian: K-terminal, elementary, secondary, combined

I-1
Appendix I. Public-Use Codebook This appendix is arranged in the following order. Following the list of variables below, there are descriptive statistics for the unweighted continuous variables, categorical variables, and location variables and then descriptive statistics for the weighted continuous variables, categorical variables, and location variables. Variable name Type Question # Label Question wording/Long description PFNLWT Numeric Weighting
Variable Final Weight for School
Final Weight for School
REPW1 Numeric Weighting Variable
Replicate Weight 1
Replicate weight for variance estimation. These weights may be input into variance estimation software which uses the balanced repeated replication method.
REPW2 Numeric Weighting Variable
Replicate Weight 2
Replicate weight for variance estimation. These weights may be input into variance estimation software which uses the balanced repeated replication method.
REPW3 Numeric Weighting Variable
Replicate Weight 3
Replicate weight for variance estimation. These weights may be input into variance estimation software which uses the balanced repeated replication method.
REPW4 Numeric Weighting Variable
Replicate Weight 4
Replicate weight for variance estimation. These weights may be input into variance estimation software which uses the balanced repeated replication method.
REPW5 Numeric Weighting Variable
Replicate Weight 5
Replicate weight for variance estimation. These weights may be input into variance estimation software which uses the balanced repeated replication method.
REPW6 Numeric Weighting Variable
Replicate Weight 6
Replicate weight for variance estimation. These weights may be input into variance estimation software which uses the balanced repeated replication method.
REPW7 Numeric Weighting Variable
Replicate Weight 7
Replicate weight for variance estimation. These weights may be input into variance estimation software which uses the balanced repeated replication method.
REPW8 Numeric Weighting Variable
Replicate Weight 8
Replicate weight for variance estimation. These weights may be input into variance estimation software which uses the balanced repeated replication method.

I-2 2005–06 PSS Data File User’s Manual and Survey Documentation
Variable name Type Question # Label Question wording/Long description REPW9 Numeric Weighting
Variable Replicate Weight 9
Replicate weight for variance estimation. These weights may be input into variance estimation software which uses the balanced repeated replication method.
REPW10 Numeric Weighting Variable
Replicate Weight 10
Replicate weight for variance estimation. These weights may be input into variance estimation software which uses the balanced repeated replication method.
REPW11 Numeric Weighting Variable
Replicate Weight 11
Replicate weight for variance estimation. These weights may be input into variance estimation software which uses the balanced repeated replication method.
REPW12 Numeric Weighting Variable
Replicate Weight 12
Replicate weight for variance estimation. These weights may be input into variance estimation software which uses the balanced repeated replication method.
REPW13 Numeric Weighting Variable
Replicate Weight 13
Replicate weight for variance estimation. These weights may be input into variance estimation software which uses the balanced repeated replication method.
REPW14 Numeric Weighting Variable
Replicate Weight 14
Replicate weight for variance estimation. These weights may be input into variance estimation software which uses the balanced repeated replication method.
REPW15 Numeric Weighting Variable
Replicate Weight 15
Replicate weight for variance estimation. These weights may be input into variance estimation software which uses the balanced repeated replication method.
REPW16 Numeric Weighting Variable
Replicate Weight 16
Replicate weight for variance estimation. These weights may be input into variance estimation software which uses the balanced repeated replication method.
REPW17 Numeric Weighting Variable
Replicate Weight 17
Replicate weight for variance estimation. These weights may be input into variance estimation software which uses the balanced repeated replication method.
REPW18 Numeric Weighting Variable
Replicate Weight 18
Replicate weight for variance estimation. These weights may be input into variance estimation software which uses the balanced repeated replication method.
REPW19 Numeric Weighting Variable
Replicate Weight 19
Replicate weight for variance estimation. These weights may be input into variance estimation software which uses the balanced repeated replication method.
REPW20 Numeric Weighting Variable
Replicate Weight 20
Replicate weight for variance estimation. These weights may be input into variance estimation software which uses the balanced repeated replication method.
REPW21 Numeric Weighting Variable
Replicate Weight 21
Replicate weight for variance estimation. These weights may be input into variance estimation software which uses the balanced repeated replication method.

Appendix I. Public-Use Codebook I-3
Variable name Type Question # Label Question wording/Long description REPW22 Numeric Weighting
Variable Replicate Weight 22
Replicate weight for variance estimation. These weights may be input into variance estimation software which uses the balanced repeated replication method.
REPW23 Numeric Weighting Variable
Replicate Weight 23
Replicate weight for variance estimation. These weights may be input into variance estimation software which uses the balanced repeated replication method.
REPW24 Numeric Weighting Variable
Replicate Weight 24
Replicate weight for variance estimation. These weights may be input into variance estimation software which uses the balanced repeated replication method.
REPW25 Numeric Weighting Variable
Replicate Weight 25
Replicate weight for variance estimation. These weights may be input into variance estimation software which uses the balanced repeated replication method.
REPW26 Numeric Weighting Variable
Replicate Weight 26
Replicate weight for variance estimation. These weights may be input into variance estimation software which uses the balanced repeated replication method.
REPW27 Numeric Weighting Variable
Replicate Weight 27
Replicate weight for variance estimation. These weights may be input into variance estimation software which uses the balanced repeated replication method.
REPW28 Numeric Weighting Variable
Replicate Weight 28
Replicate weight for variance estimation. These weights may be input into variance estimation software which uses the balanced repeated replication method.
REPW29 Numeric Weighting Variable
Replicate Weight 29
Replicate weight for variance estimation. These weights may be input into variance estimation software which uses the balanced repeated replication method.
REPW30 Numeric Weighting Variable
Replicate Weight 30
Replicate weight for variance estimation. These weights may be input into variance estimation software which uses the balanced repeated replication method.
REPW31 Numeric Weighting Variable
Replicate Weight 31
Replicate weight for variance estimation. These weights may be input into variance estimation software which uses the balanced repeated replication method.
REPW32 Numeric Weighting Variable
Replicate Weight 32
Replicate weight for variance estimation. These weights may be input into variance estimation software which uses the balanced repeated replication method.
REPW33 Numeric Weighting Variable
Replicate Weight 33
Replicate weight for variance estimation. These weights may be input into variance estimation software which uses the balanced repeated replication method.
REPW34 Numeric Weighting Variable
Replicate Weight 34
Replicate weight for variance estimation. These weights may be input into variance estimation software which uses the balanced repeated replication method.

I-4 2005–06 PSS Data File User’s Manual and Survey Documentation
Variable name Type Question # Label Question wording/Long description REPW35 Numeric Weighting
Variable Replicate Weight 35
Replicate weight for variance estimation. These weights may be input into variance estimation software which uses the balanced repeated replication method.
REPW36 Numeric Weighting Variable
Replicate Weight 36
Replicate weight for variance estimation. These weights may be input into variance estimation software which uses the balanced repeated replication method.
REPW37 Numeric Weighting Variable
Replicate Weight 37
Replicate weight for variance estimation. These weights may be input into variance estimation software which uses the balanced repeated replication method.
REPW38 Numeric Weighting Variable
Replicate Weight 38
Replicate weight for variance estimation. These weights may be input into variance estimation software which uses the balanced repeated replication method.
REPW39 Numeric Weighting Variable
Replicate Weight 39
Replicate weight for variance estimation. These weights may be input into variance estimation software which uses the balanced repeated replication method.
REPW40 Numeric Weighting Variable
Replicate Weight 40
Replicate weight for variance estimation. These weights may be input into variance estimation software which uses the balanced repeated replication method.
REPW41 Numeric Weighting Variable
Replicate Weight 41
Replicate weight for variance estimation. These weights may be input into variance estimation software which uses the balanced repeated replication method.
REPW42 Numeric Weighting Variable
Replicate Weight 42
Replicate weight for variance estimation. These weights may be input into variance estimation software which uses the balanced repeated replication method.
REPW43 Numeric Weighting Variable
Replicate Weight 43
Replicate weight for variance estimation. These weights may be input into variance estimation software which uses the balanced repeated replication method.
REPW44 Numeric Weighting Variable
Replicate Weight 44
Replicate weight for variance estimation. These weights may be input into variance estimation software which uses the balanced repeated replication method.
REPW45 Numeric Weighting Variable
Replicate Weight 45
Replicate weight for variance estimation. These weights may be input into variance estimation software which uses the balanced repeated replication method.
REPW46 Numeric Weighting Variable
Replicate Weight 46
Replicate weight for variance estimation. These weights may be input into variance estimation software which uses the balanced repeated replication method.
REPW47 Numeric Weighting Variable
Replicate Weight 47
Replicate weight for variance estimation. These weights may be input into variance estimation software which uses the balanced repeated replication method.

Appendix I. Public-Use Codebook I-5
Variable name Type Question # Label Question wording/Long description REPW48 Numeric Weighting
Variable Replicate Weight 48
Replicate weight for variance estimation. These weights may be input into variance estimation software which uses the balanced repeated replication method.
REPW49 Numeric Weighting Variable
Replicate Weight 49
Replicate weight for variance estimation. These weights may be input into variance estimation software which uses the balanced repeated replication method.
REPW50 Numeric Weighting Variable
Replicate Weight 50
Replicate weight for variance estimation. These weights may be input into variance estimation software which uses the balanced repeated replication method.
REPW51 Numeric Weighting Variable
Replicate Weight 51
Replicate weight for variance estimation. These weights may be input into variance estimation software which uses the balanced repeated replication method.
REPW52 Numeric Weighting Variable
Replicate Weight 52
Replicate weight for variance estimation. These weights may be input into variance estimation software which uses the balanced repeated replication method.
REPW53 Numeric Weighting Variable
Replicate Weight 53
Replicate weight for variance estimation. These weights may be input into variance estimation software which uses the balanced repeated replication method.
REPW54 Numeric Weighting Variable
Replicate Weight 54
Replicate weight for variance estimation. These weights may be input into variance estimation software which uses the balanced repeated replication method.
REPW55 Numeric Weighting Variable
Replicate Weight 55
Replicate weight for variance estimation. These weights may be input into variance estimation software which uses the balanced repeated replication method.
REPW56 Numeric Weighting Variable
Replicate Weight 56
Replicate weight for variance estimation. These weights may be input into variance estimation software which uses the balanced repeated replication method.
REPW57 Numeric Weighting Variable
Replicate Weight 57
Replicate weight for variance estimation. These weights may be input into variance estimation software which uses the balanced repeated replication method.
REPW58 Numeric Weighting Variable
Replicate Weight 58
Replicate weight for variance estimation. These weights may be input into variance estimation software which uses the balanced repeated replication method.
REPW59 Numeric Weighting Variable
Replicate Weight 59
Replicate weight for variance estimation. These weights may be input into variance estimation software which uses the balanced repeated replication method.
REPW60 Numeric Weighting Variable
Replicate Weight 60
Replicate weight for variance estimation. These weights may be input into variance estimation software which uses the balanced repeated replication method.

I-6 2005–06 PSS Data File User’s Manual and Survey Documentation
Variable name Type Question # Label Question wording/Long description REPW61 Numeric Weighting
Variable Replicate Weight 61
Replicate weight for variance estimation. These weights may be input into variance estimation software which uses the balanced repeated replication method.
REPW62 Numeric Weighting Variable
Replicate Weight 62
Replicate weight for variance estimation. These weights may be input into variance estimation software which uses the balanced repeated replication method.
REPW63 Numeric Weighting Variable
Replicate Weight 63
Replicate weight for variance estimation. These weights may be input into variance estimation software which uses the balanced repeated replication method.
REPW64 Numeric Weighting Variable
Replicate Weight 64
Replicate weight for variance estimation. These weights may be input into variance estimation software which uses the balanced repeated replication method.
REPW65 Numeric Weighting Variable
Replicate Weight 65
Replicate weight for variance estimation. These weights may be input into variance estimation software which uses the balanced repeated replication method.
REPW66 Numeric Weighting Variable
Replicate Weight 66
Replicate weight for variance estimation. These weights may be input into variance estimation software which uses the balanced repeated replication method.
REPW67 Numeric Weighting Variable
Replicate Weight 67
Replicate weight for variance estimation. These weights may be input into variance estimation software which uses the balanced repeated replication method.
REPW68 Numeric Weighting Variable
Replicate Weight 68
Replicate weight for variance estimation. These weights may be input into variance estimation software which uses the balanced repeated replication method.
REPW69 Numeric Weighting Variable
Replicate Weight 69
Replicate weight for variance estimation. These weights may be input into variance estimation software which uses the balanced repeated replication method.
REPW70 Numeric Weighting Variable
Replicate Weight 70
Replicate weight for variance estimation. These weights may be input into variance estimation software which uses the balanced repeated replication method.
REPW71 Numeric Weighting Variable
Replicate Weight 71
Replicate weight for variance estimation. These weights may be input into variance estimation software which uses the balanced repeated replication method.
REPW72 Numeric Weighting Variable
Replicate Weight 72
Replicate weight for variance estimation. These weights may be input into variance estimation software which uses the balanced repeated replication method.
REPW73 Numeric Weighting Variable
Replicate Weight 73
Replicate weight for variance estimation. These weights may be input into variance estimation software which uses the balanced repeated replication method.

Appendix I. Public-Use Codebook I-7
Variable name Type Question # Label Question wording/Long description REPW74 Numeric Weighting
Variable Replicate Weight 74
Replicate weight for variance estimation. These weights may be input into variance estimation software which uses the balanced repeated replication method.
REPW75 Numeric Weighting Variable
Replicate Weight 75
Replicate weight for variance estimation. These weights may be input into variance estimation software which uses the balanced repeated replication method.
REPW76 Numeric Weighting Variable
Replicate Weight 76
Replicate weight for variance estimation. These weights may be input into variance estimation software which uses the balanced repeated replication method.
REPW77 Numeric Weighting Variable
Replicate Weight 77
Replicate weight for variance estimation. These weights may be input into variance estimation software which uses the balanced repeated replication method.
REPW78 Numeric Weighting Variable
Replicate Weight 78
Replicate weight for variance estimation. These weights may be input into variance estimation software which uses the balanced repeated replication method.
REPW79 Numeric Weighting Variable
Replicate Weight 79
Replicate weight for variance estimation. These weights may be input into variance estimation software which uses the balanced repeated replication method.
REPW80 Numeric Weighting Variable
Replicate Weight 80
Replicate weight for variance estimation. These weights may be input into variance estimation software which uses the balanced repeated replication method.
REPW81 Numeric Weighting Variable
Replicate Weight 81
Replicate weight for variance estimation. These weights may be input into variance estimation software which uses the balanced repeated replication method.
REPW82 Numeric Weighting Variable
Replicate Weight 82
Replicate weight for variance estimation. These weights may be input into variance estimation software which uses the balanced repeated replication method.
REPW83 Numeric Weighting Variable
Replicate Weight 83
Replicate weight for variance estimation. These weights may be input into variance estimation software which uses the balanced repeated replication method.
REPW84 Numeric Weighting Variable
Replicate Weight 84
Replicate weight for variance estimation. These weights may be input into variance estimation software which uses the balanced repeated replication method.
REPW85 Numeric Weighting Variable
Replicate Weight 85
Replicate weight for variance estimation. These weights may be input into variance estimation software which uses the balanced repeated replication method.
REPW86 Numeric Weighting Variable
Replicate Weight 86
Replicate weight for variance estimation. These weights may be input into variance estimation software which uses the balanced repeated replication method.

I-8 2005–06 PSS Data File User’s Manual and Survey Documentation
Variable name Type Question # Label Question wording/Long description REPW87 Numeric Weighting
Variable Replicate Weight 87
Replicate weight for variance estimation. These weights may be input into variance estimation software which uses the balanced repeated replication method.
REPW88 Numeric Weighting Variable
Replicate Weight 88
Replicate weight for variance estimation. These weights may be input into variance estimation software which uses the balanced repeated replication method.
CSOURCE Numeric Frame Variable
Method of Interview
Method of Interview 1 = Mail 2 = Internet 3 = CATI (computer-assisted telephone interview) 4 = Regional Office follow-up
P135 Numeric Q5A_GRD 5A Ungraded Offered
Does this school/program have ungraded students? 1 = Yes 2 = No
P140 Numeric Q5A_ENR 5A Ungraded Enrollment
How many students were enrolled as ungraded around the first of October?
P145 Numeric Q5B_GRD 5B Nursery/ Prekinder-garten Offered
Does this school/program have nursery and prekindergarten students?
1 = Yes 2 = No
P150 Numeric Q5B_ENRL 5B Nursery/ Prekinder-garten Enrollment
How many students were enrolled in nursery and prekindergarten around the first of October?
P155 Numeric Q5C_GRD 5C Kinder-garten Offered
Does this school/program have kindergarten students? 1 = Yes 2 = No
P160 Numeric Q5C_ENRL 5C Kinder-garten Enrollment
How many of students were enrolled in kindergarten around the first of October?
P165 Numeric Q5D_GRD 5D Transi-tional Kindergar-ten Offered
Does this school/program have transitional kindergarten students?
1 = Yes 2 = No
P170 Numeric Q5D_ENRL 5D Transi-
tional Kindergar-ten Enrollment
How many students were enrolled in transitional kindergarten around the first of October?

Appendix I. Public-Use Codebook I-9
Variable name Type Question # Label Question wording/Long description P175 Numeric Q5E_GRD 5E Transit-
ional First Grade Offered
Does this school/program have transitional first grade students?
1 = Yes 2 = No
P180 Numeric Q5E_ENRL 5E Transi-
tional First Grade Enrollment
How many students were enrolled in transitional first grade around the first of October?
P185 Numeric Q5F_GRD 5F First Grade Offered
Does this school/program have 1st grade students? 1 = Yes 2 = No
P190 Numeric Q5F_ENRL 5F First Grade Enrollment
How many students were enrolled in 1st grade around the first of October?
P195 Numeric Q5G_GRD 5G Second Grade Offered
Does this school/program have 2nd grade students? 1 = Yes 2 = No
P200 Numeric Q5G_ENRL 5G Second Grade Enrollment
How many students were enrolled in 2nd grade around the first of October?
P205 Numeric Q5H_GRD 5H Third Grade Offered
Does this school/program have 3rd grade students? 1 = Yes 2 = No
P210 Numeric Q5H_ENRL 5H Third Grade Enrollment
How many students were enrolled in 3rd grade around the first of October?
P215 Numeric Q5I_GRD 5I Fourth Grade Offered
Does this school/program have 4th grade students? 1 = Yes 2 = No
P220 Numeric Q5I_ENRL 5I Fourth Grade Enrollment
How many students were enrolled in 4th grade around the first of October?
P225 Numeric Q5J_GRD 5J Fifth Grade Offered
Does this school/program have 5th grade students? 1 = Yes 2 = No
P230 Numeric Q5J_ENRL 5J Fifth Grade Enrollment
How many students were enrolled in 5th grade around the first of October?
P235 Numeric Q5K_GRD 5K Sixth Grade Offered
Does this school/program have 6th grade students? 1 = Yes 2 = No
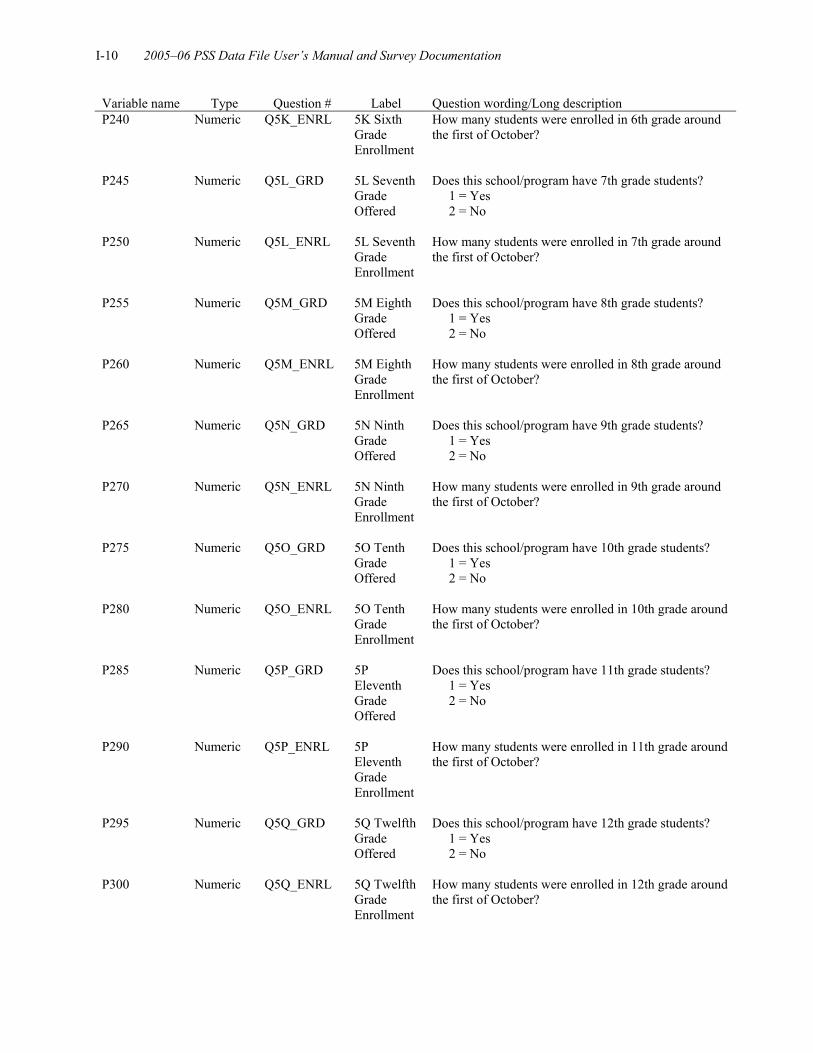
I-10 2005–06 PSS Data File User’s Manual and Survey Documentation
Variable name Type Question # Label Question wording/Long description P240 Numeric Q5K_ENRL 5K Sixth
Grade Enrollment
How many students were enrolled in 6th grade around the first of October?
P245 Numeric Q5L_GRD 5L Seventh Grade Offered
Does this school/program have 7th grade students? 1 = Yes 2 = No
P250 Numeric Q5L_ENRL 5L Seventh Grade Enrollment
How many students were enrolled in 7th grade around the first of October?
P255 Numeric Q5M_GRD 5M Eighth Grade Offered
Does this school/program have 8th grade students? 1 = Yes 2 = No
P260 Numeric Q5M_ENRL 5M Eighth Grade Enrollment
How many students were enrolled in 8th grade around the first of October?
P265 Numeric Q5N_GRD 5N Ninth Grade Offered
Does this school/program have 9th grade students? 1 = Yes 2 = No
P270 Numeric Q5N_ENRL 5N Ninth Grade Enrollment
How many students were enrolled in 9th grade around the first of October?
P275 Numeric Q5O_GRD 5O Tenth Grade Offered
Does this school/program have 10th grade students? 1 = Yes 2 = No
P280 Numeric Q5O_ENRL 5O Tenth Grade Enrollment
How many students were enrolled in 10th grade around the first of October?
P285 Numeric Q5P_GRD 5P Eleventh Grade Offered
Does this school/program have 11th grade students? 1 = Yes 2 = No
P290 Numeric Q5P_ENRL 5P Eleventh Grade Enrollment
How many students were enrolled in 11th grade around the first of October?
P295 Numeric Q5Q_GRD 5Q Twelfth Grade Offered
Does this school/program have 12th grade students? 1 = Yes 2 = No
P300 Numeric Q5Q_ENRL 5Q Twelfth Grade Enrollment
How many students were enrolled in 12th grade around the first of October?

Appendix I. Public-Use Codebook I-11
Variable name Type Question # Label Question wording/Long description P305 Numeric Q6_TOTAL 6 Total
Student Enrollment
What was the total number of students who were enrolled in this school around the first of October?
P320 Numeric Q7A 7A Hispanic Students
Around the first of October, how many students (K–12, UG) were: Hispanic, regardless of race?
P330 Numeric Q7B 7B White Students
Around the first of October, how many students (K–12, UG) were: White, not of Hispanic origin?
P325 Numeric Q7C 7C Black Students
Around the first of October, how many students (K–12, UG) were: Black, not of Hispanic origin?
P315 Numeric Q7D 7D Asian Or Pacific Islander Students
Around the first of October, how many students (K–12, UG) were: Asian or Pacific Islander?
P310 Numeric Q7E 7E Am Indian/ Alaska Native Students
Around the first of October, how many students (K–12, UG) were: American Indian or Alaska Native?
P335 Numeric Q8A 8A Is School Coeduca-tional
Is this school coeducational? 1 = Yes 2 = No, it is an all-female school 3 = No, it is an all-male school
P340 Numeric Q8B 8B Number of Male Students
How many MALE students (K–12, UG) attended this school/program around the first of October 2004–2005?
P345 Numeric Q9A 9A Students in 12th Grade Last Year
Last school year (2004–2005), were any students enrolled in 12th grade?
1 = Yes 2 = No
P350 Numeric Q9B 9B How Many In 12th Grade Last Year
How many students were enrolled in 12th grade around October 1, 2004?
P360 Numeric Q9D_%4_YR 9D Percent To 4 Year Colleges
Of those who graduated with a diploma last year, what percentage went to four-year colleges?
P361 Numeric Q9D_%2_YR 9D Percent To 2 Year Colleges
Of those who graduated with a diploma last year, what percentage went to two-year colleges?

I-12 2005–06 PSS Data File User’s Manual and Survey Documentation
Variable name Type Question # Label Question wording/Long description P365 Numeric Q10A 10A Half
Day Or Full Day
How long is the school day for a kindergarten, transitional kindergarten, or transitional first grade student?
0 = School /program does not offer kindergarten, transitional kindergarten, or transitional first grade 1 = Full day ( 4 hours or more per day) 2 = Half day (less than 4 hours per day) 3 = Both offered
P370 Numeric Q10B 10B Days
Per Week How many days per week does a kindergarten, transitional kindergarten, or transitional first grade student attend?
P385 Numeric Q11_FT 11 Full-Time Teachers
Around October 1, 2005, how many persons were teaching in grades K–12 and/or COMPARABLE ungraded levels at this school/program in the following time categories? Teachers who taught full time?
P390 Numeric Q11_>3/4 11 More Than 3/4 Time Teachers
Around October 1, 2005, how many persons were teaching in grades K–12 and/or COMPARABLE ungraded levels at this school/program in the following time categories? Teachers who taught at least 3/4 time but less than full time?
P395 Numeric Q11_>1/2 11 More Than 1/2 Time Teachers
Around October 1, 2005, how many persons were teaching in grades K–12 and/or COMPARABLE ungraded levels at this school/program in the following time Categories? Teachers who taught at least 1/2 time but less than 3/4 time?
P400 Numeric Q11_>1/4 11 More Than 1/4 Time Teachers
Around October 1, 2005, how many persons were teaching in grades K–12 and/or COMPARABLE ungraded levels at this school/program in the following time categories? Teachers who taught at least 1/4 time but less than 1/2 time?
P405 Numeric Q11_<1/4 11 Less Than 1/4 Time Teachers
Around October 1, 2005, how many persons were teaching in grades K–12 and/or COMPARABLE ungraded levels at this school/program in the following time categories? Teachers who taught less than 1/4 time?
P410 Numeric Q11_TOTAL 11 Total Number Of Teachers
Around October 1, 2005, how many persons were teaching in grades K–12 and/or COMPARABLE ungraded levels at this school/program in the following time categories? Total K–12 Teachers

Appendix I. Public-Use Codebook I-13
Variable name Type Question # Label Question wording/Long description P415 Numeric Q12A 12A Type
of School Which of the following best describes this school/program?
1 = Regular elementary or secondary 2 = Montessori 3 = Elementary and/or secondary with a Special Program Emphasis 4 = Special Education 5 = Vocational/Technical 6 = Alternative 7 = Early childhood program/child care center
P420 Numeric Q12B 12B School
Support Home Schooling
Is a major role of this school/program to support home schooling?
1 = Yes 2 = No
P425 Numeric Q13 13 Is School Located In Private Home
Is this school/program located in a private home that is used primarily as a family residence?
1 = Yes 2 = No
P430 Numeric Q14A 14A Does School Have Religious Orientation
Does this school/program have a religious orientation or purpose?
1 = Yes 2 = No
P435 Numeric Q14B 14B School Affiliated W/Reli-gious
Is this school/program affiliated with a religious organization or institution?
1 = Yes 2 = No
P440 Numeric Q14C 14C
Religious Orienta-tion/ Affiliation
What is this school’s/program’s religious orientation or affiliation?
01 = Roman Catholic 02 = African Methodist Episcopal 03 = Amish 04 = Assembly of God 05 = Baptist 06 = Brethren 07 = Calvinist 08 = Christian (no specific denomination) 09 = Church of Christ 10 = Church of God 11 = Church of God in Christ 12 = Church of the Nazarene 13 = Disciples of Christ 14 = Episcopal 15 = Friends 16 = Greek Orthodox 17 = Islamic 18 = Jewish 19 = Latter Day Saints

I-14 2005–06 PSS Data File User’s Manual and Survey Documentation
Variable name Type Question # Label Question wording/Long description P440 (Continued)
Numeric Q14C 14C Religious Orienta-tion/ Affiliation
20 = Lutheran Church - Missouri Synod 21 = Evangelical Lutheran Church in America 22 = Wisconsin Evangelical Lutheran Synod 23 = Other Lutheran 24 = Mennonite 25 = Methodist 26 = Pentecostal 27 = Presbyterian 28 = Seventh-Day Adventist 29 = Other
P445 Numeric Q14C 14C What
Type of Catholic School
Type of Catholic school 1 = Parochial 2 = Diocesan 3 = Private
P450 Numeric Q15_0 15 No Associa-tions
To which associations or organizations does this school/program belong?
1 = This school/program does not belong to any associations or organizations
P455 Numeric Q15_1 15
Accelera-ted Christian Education
To which associations or organizations does this school/program belong?
1 = Accelerated Christian Education (or School of Tomorrow) 0 = Does not belong to the Accelerated Christian Education (or School of Tomorrow)
P460 Numeric Q15_2 15
American Association of Christian Schools
To which associations or organizations does this school/program belong?
1 = American Association of Christian Schools 0 = Does not belong to the American Association of Christian Schools
P465 Numeric Q15_3 15
Association of Christian Schools Interna-tional
To which associations or organizations does this school/program belong?
1 = Association of Christian Schools International 0 = Does not belong to the Association of Christian Schools International
P467 Numeric Q15_4 15 Association of Christian Teachers and Schools
To which associations or organizations does this school/program belong?
1 = Association of Christian Teachers and Schools 0 = Does not belong to the Association of Christian Teachers and Schools
P468 Numeric Q15_5 15 Association of Classical and Christian Schools
To which associations or organizations does this school/program belong?
1 = Association of Classical and Christian Schools 0 = Does not belong to the Association of Classical and Christian Schools

Appendix I. Public-Use Codebook I-15
Variable name Type Question # Label Question wording/Long description P470 Numeric Q15_6 15
Christian Schools Interna-tional
To which associations or organizations does this school/program belong?
1 = Christian Schools International 0 = Does not belong to the Christian Schools International
P480 Numeric Q15_7 15
Evangelical Lutheran Education Association
To which associations or organizations does this school/program belong?
1 = Evangelical Lutheran Education Association 0 = Does not belong to the Evangelical Lutheran Education Association
P485 Numeric Q15_8 15 Friends Council on Education
To which associations or organizations does this school/program belong?
1 = Friends Council on Education 0 = Does not belong to the Friends Council on Education
P490 Numeric Q15_9 15 General
Conference of SDA Church
To which associations or organizations does this school/program belong?
1 = General Conference of the Seventh-Day Adventist Church 0 = Does not belong to the General Conference of the Seventh-Day Adventist Church
P492 Numeric Q15_10 15 Islamic
School League of America
To which associations or organizations does this school/program belong?
1 = Islamic School League of America 0 = Does not belong to the Islamic School League of America
P495 Numeric Q15_11 15 Jesuit
Secondary Education Association
To which associations or organizations does this school/program belong?
1 = Jesuit Secondary Education Association 0 = Does not belong to the Jesuit Secondary Education Association
P500 Numeric Q15_12 15 National Association of Episcopal Schools
To which associations or organizations does this school/program belong?
1 = National Association of Episcopal Schools 0 = Does not belong to the National Association of Episcopal Schools
P505 Numeric Q15_13 15 National Catholic Education-al Association
To which associations or organizations does this school/program belong?
1 = National Catholic Educational Association 0 = Does not belong to the National Catholic Educational Association
P510 Numeric Q15_14 15 National Christian School Association
To which associations or organizations does this school/program belong?
1 = National Christian School Association 0 = Does not belong to the National Christian School Association

I-16 2005–06 PSS Data File User’s Manual and Survey Documentation
Variable name Type Question # Label Question wording/Long description P515 Numeric Q15_15 15 National
Society of Hebrew Day Schools
To which associations or organizations does this school/program belong?
1 = National Society of Hebrew Day Schools 0 = Does not belong to the National Society of Hebrew Day Schools
P520 Numeric Q15_16 15 Oral Roberts University Education-al Fellowship
To which associations or organizations does this school/program belong?
1 = Oral Roberts University Educational Fellowship0 = Does not belong to the Oral Roberts University Educational Fellowship
P525 Numeric Q15_17 15 Solomon Schechter Day Schools
To which associations or organizations does this school/program belong?
1 = Solomon Schechter Day Schools 0 = Does not belong to the Solomon Schechter Day Schools
P530 Numeric Q15_18 15
Southern Baptist Association of Christian Schools
To which associations or organizations does this school/program belong?
1 = Southern Baptist Association of Christian Schools 0 = Does not belong to the Southern Baptist Association of Christian Schools
P535 Numeric Q15_19 15 Other Religious School Associa-tions
To which associations or organizations does this school/program belong?
1 = Other religious school associations 0 = Does not belong to other religious school associations
P540 Numeric Q15_20 15
American Montessori Society
To which associations or organizations does this school/program belong?
1 = American Montessori Society 0 = Does not belong to the American Montessori Society
P542 Numeric Q15_21 15 Association Montessori Interna-tional
To which associations or organizations does this school/program belong?
1 = Association Montessori International 0 = Does not belong to the Association Montessori International
P545 Numeric Q15_22 15 Other Montessori associa-tions
To which associations or organizations does this school/program belong?
1 = Other Montessori associations 0 = Does not belong to other Montessori Associations
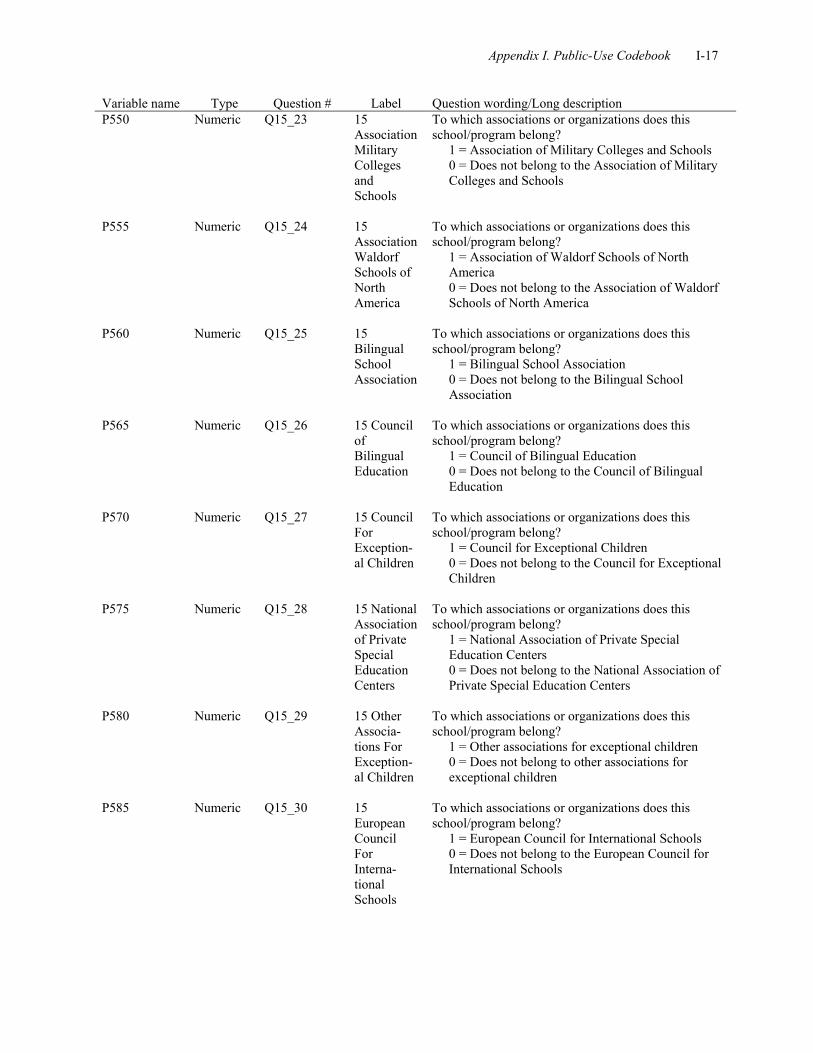
Appendix I. Public-Use Codebook I-17
Variable name Type Question # Label Question wording/Long description P550 Numeric Q15_23 15
Association Military Colleges and Schools
To which associations or organizations does this school/program belong?
1 = Association of Military Colleges and Schools 0 = Does not belong to the Association of Military Colleges and Schools
P555 Numeric Q15_24 15 Association Waldorf Schools of North America
To which associations or organizations does this school/program belong?
1 = Association of Waldorf Schools of North America 0 = Does not belong to the Association of Waldorf Schools of North America
P560 Numeric Q15_25 15 Bilingual School Association
To which associations or organizations does this school/program belong?
1 = Bilingual School Association 0 = Does not belong to the Bilingual School Association
P565 Numeric Q15_26 15 Council of Bilingual Education
To which associations or organizations does this school/program belong?
1 = Council of Bilingual Education 0 = Does not belong to the Council of Bilingual Education
P570 Numeric Q15_27 15 Council For Exception-al Children
To which associations or organizations does this school/program belong?
1 = Council for Exceptional Children 0 = Does not belong to the Council for Exceptional Children
P575 Numeric Q15_28 15 National
Association of Private Special Education Centers
To which associations or organizations does this school/program belong?
1 = National Association of Private Special Education Centers 0 = Does not belong to the National Association of Private Special Education Centers
P580 Numeric Q15_29 15 Other Associa-tions For Exception-al Children
To which associations or organizations does this school/program belong?
1 = Other associations for exceptional children 0 = Does not belong to other associations for exceptional children
P585 Numeric Q15_30 15 European Council For Interna-tional Schools
To which associations or organizations does this school/program belong?
1 = European Council for International Schools 0 = Does not belong to the European Council for International Schools

I-18 2005–06 PSS Data File User’s Manual and Survey Documentation
Variable name Type Question # Label Question wording/Long description P590 Numeric Q15_31 15 National
Association For The Education of Young Children
To which associations or organizations does this school/program belong?
1 = National Association for the Education of Young Children 0 = Does not belong to the National Association for the Education of Young Children
P595 Numeric Q15_32 15 National
Association of Bilingual Education
To which associations or organizations does this school/program belong?
1 = National Association of Bilingual Education 0 = Does not belong to the National Association of Bilingual Education
P600 Numeric Q15_33 15 National Association of Laboratory Schools
To which associations or organizations does this school/program belong?
1 = National Association of Laboratory Schools 0 = Does not belong to the National Association of Laboratory Schools
P602 Numeric Q15_34 15 National Coalition of Girls’ Schools
To which associations or organizations does this school/program belong?
1 = National Coalition of Girls’ Schools 0 = Does not belong to the National Coalition of Girls’ Schools
P605 Numeric Q15_35 15 Other
Special Emphasis Associa-tions
To which associations or organizations does this school/program belong?
1 = Other special emphasis associations 0 = Does not belong to other special emphasis associations
P610 Numeric Q15_36 15
Alternative School Network
To which associations or organizations does this school/program belong?
1 = Alternative School Network 0 = Does not belong to the Alternative School Network
P615 Numeric Q15_37 15 Institute For Indepen-dent Education
To which associations or organizations does this school/program belong?
1 = Institute for Independent Education 0 = Does not belong to the Institute for Independent Education
P620 Numeric Q15_38 15 National Association of Indepen-dent Schools
To which associations or organizations does this school/program belong?
1 = National Association of Independent Schools 0 = Does not belong to the National Association of Independent Schools
P622 Numeric Q15_39 15 State or regional indepen-dent school association
To which associations or organizations does this school/program belong?
1 = State or regional independent school association0 = Does not belong to state or regional independent school association

Appendix I. Public-Use Codebook I-19
Variable name Type Question # Label Question wording/Long description P625 Numeric Q15_40 15 National
Coalition of Alternative Commun-ity Schools
To which associations or organizations does this school/program belong?
1 = National Coalition of Alternative Community Schools 0 = Does not belong to the National Coalition of Alternative Community Schools
P630 Numeric Q15_41 15 National Indepen-dent Private Schools Association
To which associations or organizations does this school/program belong?
1 = National Independent Private Schools Association 0 = Does not belong to the National Independent Private Schools Association
P635 Numeric Q15_42 15 The Association of Boarding Schools
To which associations or organizations does this school/program belong?
1 = The Association of Boarding Schools 0 = Does not belong to The Association of Boarding Schools
P640 Numeric Q15_43 15 Other school associa-tions
To which associations or organizations does this school/program belong?
1 = Other school associations 0 = Does not belong to other school associations
P645 Numeric Q16 16 Days In School Year
How many days are in the school year for students in this school/program?
P650 Numeric Q17_HRS 17 Hours In School Day For Students
How long is the school day for students in this school/program?
P655 Numeric Q17_MIN 17 Minutes In School Day For Students
How long is the school day for students in this school/program?
P660 Numeric Q18 18 Library or library media center
Does this school/program have a library or library media center?
1 = Yes 2 = No
P665 Numeric Q19 19 Minutes
To Complete Question-naire
Not counting interruptions, how many minutes did it take to complete this questionnaire?
PPIN Character Frame Variable
Permanent Identifica-tion Number
Permanent Identification Number

I-20 2005–06 PSS Data File User’s Manual and Survey Documentation
Variable name Type Question # Label Question wording/Long description PINST Character Frame
Variable
School name
School name
PCITY Character Frame Variable
City of mailing address
City of mailing address
PSTABB Character Frame Variable
State postal code of mailing address
State postal code of mailing address
PZIP Character Frame Variable
Zip code of mailing address
Zip code of mailing address
PZIP4 Character Frame Variable
Zip4 code of mailing address
Zip4 code of mailing address
PCNTY Character Frame Variable
FIPS County Code
FIPS County Code of mailing address (The Federal Information Processing Standards county codes are available on the National Institute of Standards and Technology at http://www.itl.nist.gov/fipspubs/co-codes/states.htm)
PCNTNM Character Frame Variable
County name
County Name of mailing address
PL_CIT Character Frame Variable
City for school’s physical location
City for school’s physical location
PL_STABB Character Frame Variable
State for school’s physical location
State for school’s physical location
PL_ZIP Character Frame Variable
Zip code for school’s physical location
Zip code for school’s physical location
PL_ZIP4 Character Frame Variable
Zip4 code for school’s physical location
Zip4 code for school’s physical location

Appendix I. Public-Use Codebook I-21
Variable name Type Question # Label Question wording/Long description REGION Numeric Created
Variable Census Region
Census Region 1 = Northeast (CT, ME, MA, NH, NJ, NY, PA, RI, VT) 2 = Midwest (IL, IN, IA, KS, MI, MN, MO, NE, ND, OH, SD, WI) 3 = South (AL, AR, DE, DC, FL, GA, KY, LA, MD, MS, NC, OK, SC, TN, TX, VA, WV) 4 = West (AK, AZ, CA, CO, HI, ID, MT, NV, NM, OR, UT, WA, WY)
PSTFIP Numeric Frame
Variable FIPS State Code (mailing address of school)
FIPS State Code (mailing address of school) 01 = ALABAMA 02 = ALASKA 04 = ARIZONA 05 = ARKANSAS 06 = CALIFORNIA 08 = COLORADO 09 = CONNECTICUT 10 = DELAWARE 11 = DISTRICT OF COLUMBIA 12 = FLORIDA 13 = GEORGIA 15 = HAWAII 16 = IDAHO 17 = ILLINOIS 18 = INDIANA 19 = IOWA 20 = KANSAS 21 = KENTUCKY 22 = LOUISIANA 23 = MAINE 24 = MARYLAND 25 = MASSACHUSETTS 26 = MICHIGAN 27 = MINNESOTA 28 = MISSISSIPPI 29 = MISSOURI 30 = MONTANA 31 = NEBRASKA
32 = NEVADA 33 = NEW HAMPSHIRE 34 = NEW JERSEY 35 = NEW MEXICO 36 = NEW YORK 37 = NORTH CAROLINA 38 = NORTH DAKOTA 39 = OHIO 40 = OKLAHOMA 41 = OREGON 42 = PENNSYLVANIA 44 = RHODE ISLAND 45 = SOUTH CAROLINA

I-22 2005–06 PSS Data File User’s Manual and Survey Documentation
Variable name Type Question # Label Question wording/Long description PSTFIP (Continued)
Numeric Frame Variable
FIPS State Code (mailing address of school)
46 = SOUTH DAKOTA 47 = TENNESSEE 48 = TEXAS 49 = UTAH 50 = VERMONT 51 = VIRGINIA 53 = WASHINGTON 54 = WEST VIRGINIA 55 = WISCONSIN 56 = WYOMING
LOCALE Numeric Created
Variable New Urbanicity Defined (Census assigned)
New Urbanicity Defined (Census assigned, based on 2000 Census geography)
1 = Large city (A principal city of a Metropolitan Core Based Statistical Area (CBSA) with the city having a population greater than or equal to 250,000) 2 = Mid-size city (A principal city of a Metropolitan CBSA, with the city having a population less than 250,000) 3 = Urban fringe of large city (Any incorporated place, Census designated place, or non-place territory within a Metropolitan CBSA of a Large City and defined as urban by the Census Bureau) 4 = Urban Fringe of mid-size city (Any incorporated place, Census designated place, or non-place territory within a CBSA of a Mid-Size City and defined as urban by the Census Bureau) 5 = Large town (An incorporated place or Census designated place with a population greater than or equal to 25,000 and located outside a Metropolitan CBSA or inside a Micropolitan CBSA) 6 = Small town (An incorporated place or Census designated place with a population less than 25,000 and greater than or equal to 2,500 and located outside a Metropolitan CBSA or inside a Micropolitan CBSA)
7 = Rural - outside CBSA (Any incorporated place, Census designated place (CDP), or non-place territory not within a Metropolitan CBSA or within a Micropolitan CBSA and defined as rural by the Census Bureau) 8 = Rural - inside CBSA (Any incorporated place, Census designated place, or non-place territory within a Metropolitan CBSA and defined as rural by the Census Bureau)

Appendix I. Public-Use Codebook I-23
Variable name Type Question # Label Question wording/Long description ULOCALE Numeric Created
Variable Urban-centric locale code (NCES assigned)
Urban-centric locale code (NCES assigned) 11 = City, Large: Territory inside an urbanized area and inside a principal city with population of 250,000 or more. 12 = City, Midsize: Territory inside an urbanized area and inside a principal city with population less than 250,000 and greater than or equal to 100,000. 13 = City, Small: Territory inside an urbanized area and inside a principal city with population less than 100,000. 21 = Suburb, Large: Territory outside a principal city and inside an urbanized area with population of 250,000 or more. 22 = Suburb, Midsize: Territory outside a principal city and inside an urbanized area with population less than 250,000 and greater than or equal to 100,000. 23 = Suburb, Small: Territory outside a principal city and inside an urbanized area with population less than 100,000. 31 = Town, Fringe: Territory inside an urban cluster that is less than or equal to 10 miles from an urbanized area. 32 = Town, Distant: Territory inside an urban cluster that is more than 10 miles and less than or equal to 35 miles from an urbanized area. 33 = Town, Remote: Territory inside an urban cluster that is more than 35 miles of an urbanized area. 41 = Rural, Fringe: Census-defined rural territory that is less than or equal to 5 miles from an urbanized area, as well as rural territory that is less than or equal to 2.5 miles from an urban cluster. 42 = Rural, Distant: Census-defined rural territory that is more than 5 miles but less than or equal to 25 miles from an urbanized area, as well as rural territory that is more than 2.5 miles but less than or equal to 10 miles from an urban cluster.
43 = Rural, Remote: Census-defined rural territory that is more than 25 miles from an urbanized area and is also more than 10 miles from an urban cluster.
LATITUDE Numeric Created Variable
Latitude The 3 digits to the left of the decimal represent the number of degrees from the equator; the 6 digits to the right of the decimal represent the fraction of the next degree carried out to six decimal places. (This describes the combination of Latitude and Latsign.)

I-24 2005–06 PSS Data File User’s Manual and Survey Documentation
Variable name Type Question # Label Question wording/Long description LONGITUDE Numeric Created
Variable Longitude The 3 digits to the left of the decimal represent the
number of degrees from the prime meridian; the 6 digits to the right of the decimal represent the fraction of the next degree carried out to six decimal places. (This describes the combination of Longitude and Longsign.)
LOGR2006 Numeric Created Variable
2005–2006 Lowest Grade Level Recode
2005–2006 Lowest Grade Level Recode 01 = All Ungraded 02 = Lowest grade in school is prekindergarten 03 = Lowest grade in school is kindergarten 04 = Lowest grade in school is transitional kindergarten 05 = Lowest grade in school is transitional first grade 06 = Lowest grade in school is 1st grade 07 = Lowest grade in school is 2nd grade 08 = Lowest grade in school is 3rd grade 09 = Lowest grade in school is 4th grade 10 = Lowest grade in school is 5th grade 11 = Lowest grade in school is 6th grade 12 = Lowest grade in school is 7th grade 13 = Lowest grade in school is 8th grade 14 = Lowest grade in school is 9th grade 15 = Lowest grade in school is 10th grade 16 = Lowest grade in school is 11th grade 17 = Lowest grade in school is 12th grade
HIGR2006 Numeric Created
Variable 2005–2006 Highest Grade Level Recode
2005–2006 Highest Grade Level Recode 01 = All Ungraded 02 = Highest grade in school is prekindergarten 03 = Highest grade in school is kindergarten 04 = Highest grade in school is transitional kindergarten 05 = Highest grade in school is transitional first grade 06 = Highest grade in school is 1st grade 07 = Highest grade in school is 2nd grade 08 = Highest grade in school is 3rd grade 09 = Highest grade in school is 4th grade 10 = Highest grade in school is 5th grade 11 = Highest grade in school is 6th grade 12 = Highest grade in school is 7th grade 13 = Highest grade in school is 8th grade 14 = Highest grade in school is 9th grade 15 = Highest grade in school is 10th grade 16 = Highest grade in school is 11th grade 17 = Highest grade in school is 12th grade
FRAME Character Frame
Variable Universe frame to which school belongs
Universe frame to which school belongs ‘LIST’ = School is part of list frame ‘AREA’ = School is part of area frame

Appendix I. Public-Use Codebook I-25
Variable name Type Question # Label Question wording/Long description TABFLAG Numeric Created
Variable Tabulation flag
Tabulation flag 1 = Schools offering ungraded or grade 1 or above 2 = Schools offering no grade higher than kindergarten
TYPOLOGY Numeric Created Variable
School Typology
School Typology 1 = Catholic, parochial (Relig = 1 and P445 = 1) 2 = Catholic, diocesan (Relig = 1 and P445 = 2) 3 = Catholic, private (Relig = 1 and P445 = 3) 4 = Other religious, conservative Christian (Relig = 2 and (P455 = 1 or P460 = 1 or P465 = 1 or P520 = 1) P480 = 1 or P485 = 1 or P490 = 1 or P492 = 1 or P500 = 1 or P510 = 1 or P515 = 1 or P525 = 1 or P530 = 1 or P535 = 1) 5 = Other religious, affiliated with an established religious group or denomination (Relig = 2, P455 = 0, P460 = 0, P465 = 0, 520 = 0 and (P467 = 1 or P470 = 1 or 6 = Other religious, not affiliated with any established religious group or denomination (Relig = 2 and the following = 0: P455, P460, P465, P520, P467, P470, P480, P485, P490, P492, P500, P510, P515, P525, P530, P535) 7 = Nonsectarian, regular school (Relig = 3 and P415 = 1 or 7) 8 = Nonsectarian, special program emphasis (Relig = 3 and P415 = 2, 3, 5, 6) 9 = Nonsectarian, special education (Relig = 3 and P415 = 4)
RELIG Numeric Created Variable
Affiliation Affiliation 1 = Catholic (P430 = 1 and P440 = 1) 2 = Other religious (P430 = 1 and P440 ne 1) 3 = Nonsectarian (P430 = 2)
ORIENT Numeric Created Variable
School orientation
School orientation 01 = Roman Catholic 02 = African Methodist Episcopal 03 = Amish 04 = Assembly of God 05 = Baptist 06 = Brethren 07 = Calvinist 08 = Christian (no specific denomination) 09 = Church of Christ 10 = Church of God 11 = Church of God in Christ 12 = Church of the Nazarene 13 = Disciples of Christ 14 = Episcopal 15 = Friends 16 = Greek Orthodox 17 = Islamic

I-26 2005–06 PSS Data File User’s Manual and Survey Documentation
Variable name Type Question # Label Question wording/Long description ORIENT (Continued)
Numeric Created Variable
School orientation
18 = Jewish 19 = Latter Day Saints 20 = Lutheran Church - Missouri Synod 21 = Evangelical Lutheran Church in America 22 = Wisconsin Evangelical Lutheran Synod 23 = Other Lutheran 24 = Mennonite 25 = Methodist 26 = Pentecostal 27 = Presbyterian 28 = Seventh-Day Adventist 29 = Other 30 = Nonsectarian
DIOCESE Numeric Created
Variable Diocese or archdiocese for Catholic schools
Diocese or archdiocese for Catholic schools 0101 = Diocese of Birmingham, AL 0102 = Diocese of Mobile, AL
0201 = Archdiocese of Anchorage, AK 0202 = Diocese of Fairbanks, AK 0203 = Diocese of Juneau, AK
0401 = Diocese of Phoenix, AZ 0402 = Diocese of Tucson, AZ
0501 = Diocese of Little Rock, AR
0601 = Archdiocese of Los Angeles, CA 0602 = Archdiocese of San Francisco, CA 0603 = Diocese of Fresno, CA 0604 = Diocese of Monterey, CA 0605 = Diocese of Oakland, CA 0606 = Diocese of Orange, CA 0607 = Diocese of Sacramento, CA 0608 = Diocese of San Bernardino, CA 0609 = Diocese of San Diego, CA 0610 = Diocese of San Jose, CA 0611 = Diocese of Santa Rosa, CA 0612 = Diocese of Stockton, CA
0801 = Archdiocese of Denver, CO 0802 = Diocese of Colorado Springs, CO 0803 = Diocese of Pueblo, CO 0901 = Archdiocese of Hartford, CT 0902 = Diocese of Bridgeport, CT 0903 = Diocese of Norwich, CT 1001 = Diocese of Wilmington, DE
1101 = Archdiocese of Washington, DC

Appendix I. Public-Use Codebook I-27
Variable name Type Question # Label Question wording/Long description DIOCESE (Continued)
Numeric Created Variable
Diocese or archdiocese for Catholic schools
1201 = Archdiocese of Miami, FL 1202 = Diocese of Pensacola-Tallahassee, FL 1203 = Diocese of Orlando, FL 1204 = Diocese of Palm Beach, FL 1205 = Diocese of St. Augustine, FL 1206 = Diocese of St. Petersburg, FL 1207 = Diocese of Venice, FL
1301 = Archdiocese of Atlanta, GA 1302 = Diocese of Savannah, GA
1501 = Diocese of Honolulu, HI
1601 = Diocese of Boise, ID 1701 = Archdiocese of Chicago, IL 1702 = Diocese of Belleville, IL 1703 = Diocese of Joliet, IL 1704 = Diocese of Peoria, IL 1705 = Diocese of Rockford, IL 1706 = Diocese of Springfield, IL
1801 = Archdiocese of Indianapolis, IN 1802 = Diocese of Evansville, IN 1803 = Diocese of Ft. Wayne-South Bend, IN 1804 = Diocese of Gary, IN 1805 = Diocese of Lafayette, IN 1901 = Archdiocese of Dubuque, IA 1902 = Diocese of Davenport, IA 1903 = Diocese of Des Moines, IA 1904 = Diocese of Sioux City, IA 2001 = Archdiocese of Kansas City, KS 2002 = Diocese of Dodge City, KS 2003 = Diocese of Salina, KS 2004 = Diocese of Wichita, KS
2101 = Archdiocese of Louisville, KY 2102 = Diocese of Covington, KY 2103 = Diocese of Lexington, KY 2104 = Diocese of Owensboro, KY
2201 = Archdiocese of New Orleans, LA 2202 = Diocese of Alexandria, LA 2203 = Diocese of Baton Rouge, LA 2204 = Diocese of Houma-Thibodaux, LA 2205 = Diocese of Lafayette, LA 2206 = Diocese of Lake Charles, LA 2207 = Diocese of Shreveport, LA 2301 = Diocese of Portland, ME
2401 = Archdiocese of Baltimore, MD
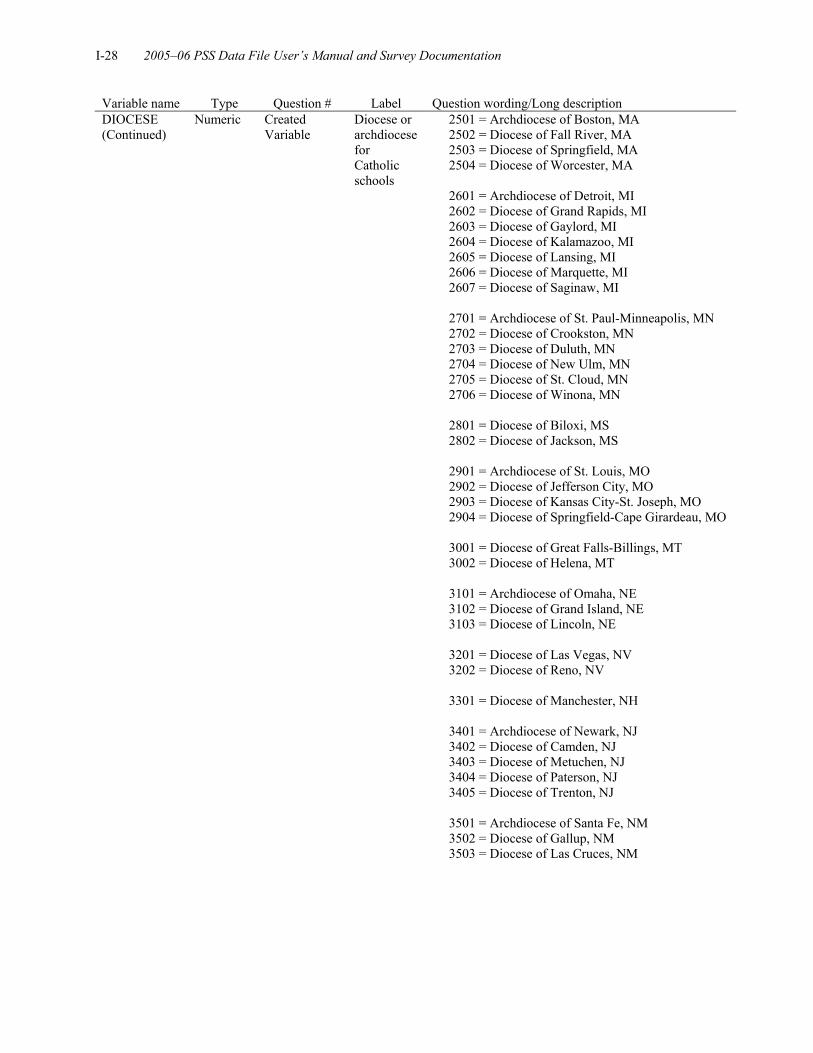
I-28 2005–06 PSS Data File User’s Manual and Survey Documentation
Variable name Type Question # Label Question wording/Long description DIOCESE (Continued)
Numeric Created Variable
Diocese or archdiocese for Catholic schools
2501 = Archdiocese of Boston, MA 2502 = Diocese of Fall River, MA 2503 = Diocese of Springfield, MA 2504 = Diocese of Worcester, MA 2601 = Archdiocese of Detroit, MI 2602 = Diocese of Grand Rapids, MI 2603 = Diocese of Gaylord, MI 2604 = Diocese of Kalamazoo, MI 2605 = Diocese of Lansing, MI 2606 = Diocese of Marquette, MI 2607 = Diocese of Saginaw, MI
2701 = Archdiocese of St. Paul-Minneapolis, MN 2702 = Diocese of Crookston, MN 2703 = Diocese of Duluth, MN 2704 = Diocese of New Ulm, MN 2705 = Diocese of St. Cloud, MN 2706 = Diocese of Winona, MN 2801 = Diocese of Biloxi, MS 2802 = Diocese of Jackson, MS
2901 = Archdiocese of St. Louis, MO 2902 = Diocese of Jefferson City, MO 2903 = Diocese of Kansas City-St. Joseph, MO 2904 = Diocese of Springfield-Cape Girardeau, MO
3001 = Diocese of Great Falls-Billings, MT 3002 = Diocese of Helena, MT
3101 = Archdiocese of Omaha, NE 3102 = Diocese of Grand Island, NE 3103 = Diocese of Lincoln, NE
3201 = Diocese of Las Vegas, NV 3202 = Diocese of Reno, NV 3301 = Diocese of Manchester, NH 3401 = Archdiocese of Newark, NJ 3402 = Diocese of Camden, NJ 3403 = Diocese of Metuchen, NJ 3404 = Diocese of Paterson, NJ 3405 = Diocese of Trenton, NJ 3501 = Archdiocese of Santa Fe, NM 3502 = Diocese of Gallup, NM 3503 = Diocese of Las Cruces, NM

Appendix I. Public-Use Codebook I-29
Variable name Type Question # Label Question wording/Long description DIOCESE (Continued)
Numeric Created Variable
Diocese or archdiocese for Catholic schools
3601 = Archdiocese of New York, NY 3602 = Diocese of Albany, NY 3603 = Diocese of Brooklyn, NY 3604 = Diocese of Buffalo, NY 3605 = Diocese of Ogdensburg, NY 3606 = Diocese of Rochester, NY 3607 = Diocese of Rockville Centre, NY 3608 = Diocese of Syracuse, NY 3701 = Diocese of Charlotte, NC 3702 = Diocese of Raleigh, NC
3801 = Diocese of Bismarck, ND 3802 = Diocese of Fargo, ND
3901 = Archdiocese of Cincinnati, OH 3902 = Diocese of Cleveland, OH 3903 = Diocese of Columbus, OH 3904 = Diocese of Steubenville, OH 3905 = Diocese of Toledo, OH 3906 = Diocese of Youngstown, OH 4001 = Archdiocese of Oklahoma City, OK 4002 = Diocese of Tulsa, OK
4101 = Archdiocese of Portland, OR 4102 = Diocese of Baker, OR
4201 = Archdiocese of Philadelphia, PA 4202 = Diocese of Allentown, PA 4203 = Diocese of Altoona-Johnstown, PA 4204 = Diocese of Erie, PA 4205 = Diocese of Greensburg, PA 4206 = Diocese of Harrisburg, PA 4207 = Diocese of Pittsburgh, PA 4208 = Diocese of Scranton, PA
4401 = Diocese of Providence, RI
4501 = Diocese of Charleston, SC
4601 = Diocese of Rapid City, SD 4602 = Diocese of Sioux Falls, SD
4701 = Diocese of Knoxville, TN 4702 = Diocese of Memphis, TN 4703 = Diocese of Nashville, TN
4801 = Archdiocese of San Antonio, TX 4802 = Diocese of Amarillo, TX 4803 = Diocese of Austin, TX 4804 = Diocese of Beaumont, TX 4805 = Diocese of Brownsville, TX 4806 = Diocese of Corpus Christi, TX

I-30 2005–06 PSS Data File User’s Manual and Survey Documentation
Variable name Type Question # Label Question wording/Long description DIOCESE (Continued)
Numeric Created Variable
Diocese or archdiocese for Catholic schools
4807 = Diocese of Dallas, TX 4808 = Diocese of El Paso, TX 4809 = Diocese of Ft. Worth, TX 4810 = Diocese of Galveston-Houston, TX 4811 = Diocese of Lubbock, TX 4812 = Diocese of San Angelo, TX 4813 = Diocese of Tyler, TX 4814 = Diocese of Victoria, TX 4815 = Diocese of Laredo, TX 4901 = Diocese of Salt Lake, UT
5001 = Diocese of Burlington, VT 5101 = Diocese of Arlington, VA 5102 = Diocese of Richmond, VA 5301 = Archdiocese of Seattle, WA 5302 = Diocese of Spokane, WA 5303 = Diocese of Yakima, WA
5401 = Diocese of Wheeling-Charleston, WV
5501 = Archdiocese of Milwaukee, WI 5502 = Diocese of Green Bay, WI 5503 = Diocese of La Crosse, WI 5504 = Diocese of Madison, WI 5505 = Diocese of Superior, WI
5601 = Diocese of Cheyenne, WY
LEVEL Numeric Created Variable
Level of Instruction
Level of Instruction 1 = Elementary (Students reported in grades kindergarten through 6 and no students in grades 9 through 12) 2 = Secondary (Students reported in grades 7 through 12 and no students in grades prekindergarten through 6) 3 = Combined elementary and secondary (All students ungraded or students reported in grades 6 or below and 9 or above)
NUMSTUDS Numeric Created
Variable Total number of students in school (K–12, UG)
Total number of students in school (K–12, UG)

Appendix I. Public-Use Codebook I-31
Variable name Type Question # Label Question wording/Long description SIZE Numeric Created
Variable Size of school (K–12, UG)
Size of school (enrollment recode based on NUMSTUDS)
1 = Less than 50 students 2 = 50–149 students 3 = 150–299 students 4 = 300–499 students 5 = 500–749 students 6 = 750 students or more
NUMTEACH Numeric Created Variable
Number of K–12 teachers (FTE)
Number of K–12 teachers, in estimated FTEs (full-time equivalents)
PERMINOR Numeric Created Variable
Percent minority students (K–12, UG)
Percent minority students (K–12, UG) 1 = None 2 = 1–9 percent 3 = 10–29 percent 4 = 30–49 percent 5 = 50 percent or more
PMINOR Numeric Created Variable
Percent minority students (K–12, UG)
Percent minority students (K–12, UG)
MINOR Numeric Created Variable
Number of minority students (K–12, UG)
Number of minority students (K–12, UG)
COMMTYPE Numeric Created Variable
Commun-ity type
Community type 1 = Principal city (locale = 1, 2) 2 = Urban fringe, large town (locale = (3, 4, 5) 3 = Rural or small town (locale = (6, 7, 8)
COMMTYP2 Numeric Created Variable
Commun-ity type 2
Community type 2 1 = Principal city (locale = 1, 2) 2 = Urban fringe, large town, rural-inside CBSA (locale = 3, 4, 5, 8) 3 = Rural-outside CBSA or small town (locale = 6, 7)
UCOMMTYP Numeric Created Variable
Urban-centric community type (NCES assigned)
Urban-centric community type (NCES assigned, based on 2000 Census geography)
1 = City (Ulocale = 11, 12, 13) 2 = Suburb (Ulocale = 21, 22, 23) 3 = Town (Ulocale = 31, 32, 33) 4 = Rural (Ulocale = 41, 42, 43)

I-32 2005–06 PSS Data File User’s Manual and Survey Documentation
Variable name Type Question # Label Question wording/Long description TOTHRS Numeric Created
Variable Length of school day in hours
Length of school day in hours
MALES Numeric Created Variable
Number of male students (K–12, UG)
Number of male students (K–12, UG)
F_P135 Numeric Imputation Flag
Imputation Flag For P135
Imputation Flags 0 = Not imputed (original data) 1 = Ratio adjustment of original data 2 = Imputed by using data from other variables within the same 2005–2006 PSS record or unimputed data from the school’s 2003–2004 PSS record. 3 = Imputed by using a donor value from another record on the 2005-2006 PSS file or by using donor-imputed data from the school’s 2003–2004 PSS record. 4 = Clerical imputation
F_P140 Numeric Imputation Flag
Imputation Flag For P140
Imputation Flag For P140
F_P145 Numeric Imputation Flag
Imputation Flag For P145
Imputation Flag For P145
F_P150 Numeric Imputation Flag
Imputation Flag For P150
Imputation Flag For P150
F_P155 Numeric Imputation Flag
Imputation Flag For P155
Imputation Flag For P155
F_P160 Numeric Imputation Flag
Imputation Flag For P160
Imputation Flag For P160
F_P165 Numeric Imputation Flag
Imputation Flag For P165
Imputation Flag For P165
F_P170 Numeric Imputation Flag
Imputation Flag For P170
Imputation Flag For P170

Appendix I. Public-Use Codebook I-33
Variable name Type Question # Label Question wording/Long description F_P175 Numeric Imputation
Flag Imputation Flag For P175
Imputation Flag For P175
F_P180 Numeric Imputation Flag
Imputation Flag For P180
Imputation Flag For P180
F_P185 Numeric Imputation Flag
Imputation Flag For P185
Imputation Flag For P185
F_P190 Numeric Imputation Flag
Imputation Flag For P190
Imputation Flag For P190
F_P195 Numeric Imputation Flag
Imputation Flag For P195
Imputation Flag For P195
F_P200 Numeric Imputation Flag
Imputation Flag For P200
Imputation Flag For P200
F_P205 Numeric Imputation Flag
Imputation Flag For P205
Imputation Flag For P205
F_P210 Numeric Imputation Flag
Imputation Flag For P210
Imputation Flag For P210
F_P215 Numeric Imputation Flag
Imputation Flag For P215
Imputation Flag For P215
F_P220 Numeric Imputation Flag
Imputation Flag For P220
Imputation Flag For P220
F_P225 Numeric Imputation Flag
Imputation Flag For P225
Imputation Flag For P225
F_P230 Numeric Imputation Flag
Imputation Flag For P230
Imputation Flag For P230
F_P235 Numeric Imputation Flag
Imputation Flag For P235
Imputation Flag For P235

I-34 2005–06 PSS Data File User’s Manual and Survey Documentation
Variable name Type Question # Label Question wording/Long description F_P240 Numeric Imputation
Flag Imputation Flag For P240
Imputation Flag For P240
F_P245 Numeric Imputation Flag
Imputation Flag For P245
Imputation Flag For P245
F_P250 Numeric Imputation Flag
Imputation Flag For P250
Imputation Flag For P250
F_P255 Numeric Imputation Flag
Imputation Flag For P255
Imputation Flag For P255
F_P260 Numeric Imputation Flag
Imputation Flag For P260
Imputation Flag For P260
F_P265 Numeric Imputation Flag
Imputation Flag For P265
Imputation Flag For P265
F_P270 Numeric Imputation Flag
Imputation Flag For P270
Imputation Flag For P270
F_P275 Numeric Imputation Flag
Imputation Flag For P275
Imputation Flag For P275
F_P280 Numeric Imputation Flag
Imputation Flag For P280
Imputation Flag For P280
F_P285 Numeric Imputation Flag
Imputation Flag For P285
Imputation Flag For P285
F_P290 Numeric Imputation Flag
Imputation Flag For P290
Imputation Flag For P290
F_P295 Numeric Imputation Flag
Imputation Flag For P295
Imputation Flag For P295
F_P300 Numeric Imputation Flag
Imputation Flag For P300
Imputation Flag For P300

Appendix I. Public-Use Codebook I-35
Variable name Type Question # Label Question wording/Long description F_P305 Numeric Imputation
Flag Imputation Flag For P305
Imputation Flag For P305
F_P310 Numeric Imputation Flag
Imputation Flag For P310
Imputation Flag For P310
F_P315 Numeric Imputation Flag
Imputation Flag For P315
Imputation Flag For P315
F_P320 Numeric Imputation Flag
Imputation Flag For P320
Imputation Flag For P320
F_P325 Numeric Imputation Flag
Imputation Flag For P325
Imputation Flag For P325
F_P330 Numeric Imputation Flag
Imputation Flag For P330
Imputation Flag For P330
F_P335 Numeric Imputation Flag
Imputation Flag For P335
Imputation Flag For P335
F_P340 Numeric Imputation Flag
Imputation Flag For P340
Imputation Flag For P340
F_P345 Numeric Imputation Flag
Imputation Flag For P345
Imputation Flag For P345
F_P350 Numeric Imputation Flag
Imputation Flag For P350
Imputation Flag For P350
F_P360 Numeric Imputation Flag
Imputation Flag For P360
Imputation Flag For P360
F_P361 Numeric Imputation Flag
Imputation Flag For P361
Imputation Flag For P361
F_P365 Numeric Imputation Flag
Imputation Flag For P365
Imputation Flag For P365

I-36 2005–06 PSS Data File User’s Manual and Survey Documentation
Variable name Type Question # Label Question wording/Long description F_P370 Numeric Imputation
Flag Imputation Flag For P370
Imputation Flag For P370
F_P385 Numeric Imputation Flag
Imputation Flag For P385
Imputation Flag For P385
F_P390 Numeric Imputation Flag
Imputation Flag For P390
Imputation Flag For P390
F_P395 Numeric Imputation Flag
Imputation Flag For P395
Imputation Flag For P395
F_P400 Numeric Imputation Flag
Imputation Flag For P400
Imputation Flag For P400
F_P405 Numeric Imputation Flag
Imputation Flag For P405
Imputation Flag For P405
F_P410 Numeric Imputation Flag
Imputation Flag For P410
Imputation Flag For P410
F_P415 Numeric Imputation Flag
Imputation Flag For P415
Imputation Flag For P415
F_P420 Numeric Imputation Flag
Imputation Flag For P420
Imputation Flag For P420
F_P425 Numeric Imputation Flag
Imputation Flag For P425
Imputation Flag For P425
F_P430 Numeric Imputation Flag
Imputation Flag For P430
Imputation Flag For P430
F_P435 Numeric Imputation Flag
Imputation Flag For P435
Imputation Flag For P435
F_P440 Numeric Imputation Flag
Imputation Flag For P440
Imputation Flag For P440

Appendix I. Public-Use Codebook I-37
Variable name Type Question # Label Question wording/Long description F_P445 Numeric Imputation
Flag Imputation Flag For P445
Imputation Flag For P445
F_P450 Numeric Imputation Flag
Imputation Flag For P450
Imputation Flag For P450
F_P455 Numeric Imputation Flag
Imputation Flag For P455
Imputation Flag For P455
F_P460 Numeric Imputation Flag
Imputation Flag For P460
Imputation Flag For P460
F_P465 Numeric Imputation Flag
Imputation Flag For P465
Imputation Flag For P465
F_P467 Numeric Imputation Flag
Imputation Flag For P467
Imputation Flag For P467
F_P468 Numeric Imputation Flag
Imputation Flag For P468
Imputation Flag For P468
F_P470 Numeric Imputation Flag
Imputation Flag For P470
Imputation Flag For P470
F_P480 Numeric Imputation Flag
Imputation Flag For P480
Imputation Flag For P480
F_P485 Numeric Imputation Flag
Imputation Flag For P485
Imputation Flag For P485
F_P490 Numeric Imputation Flag
Imputation Flag For P490
Imputation Flag For P490
F_P492 Numeric Imputation Flag
Imputation Flag For P492
Imputation Flag For P492
F_P495 Numeric Imputation Flag
Imputation Flag For P495
Imputation Flag For P495

I-38 2005–06 PSS Data File User’s Manual and Survey Documentation
Variable name Type Question # Label Question wording/Long description F_P500 Numeric Imputation
Flag Imputation Flag For P500
Imputation Flag For P500
F_P505 Numeric Imputation Flag
Imputation Flag For P505
Imputation Flag For P505
F_P510 Numeric Imputation Flag
Imputation Flag For P510
Imputation Flag For P510
F_P515 Numeric Imputation Flag
Imputation Flag For P515
Imputation Flag For P515
F_P520 Numeric Imputation Flag
Imputation Flag For P520
Imputation Flag For P520
F_P525 Numeric Imputation Flag
Imputation Flag For P525
Imputation Flag For P525
F_P530 Numeric Imputation Flag
Imputation Flag For P530
Imputation Flag For P530
F_P535 Numeric Imputation Flag
Imputation Flag For P535
Imputation Flag For P535
F_P540 Numeric Imputation Flag
Imputation Flag For P540
Imputation Flag For P540
F_P542 Numeric Imputation Flag
Imputation Flag For P542
Imputation Flag For P542
F_P545 Numeric Imputation Flag
Imputation Flag For P545
Imputation Flag For P545
F_P550 Numeric Imputation Flag
Imputation Flag For P550
Imputation Flag For P550
F_P555 Numeric Imputation Flag
Imputation Flag For P555
Imputation Flag For P555

Appendix I. Public-Use Codebook I-39
Variable name Type Question # Label Question wording/Long description F_P560 Numeric Imputation
Flag Imputation Flag For P560
Imputation Flag For P560
F_P565 Numeric Imputation Flag
Imputation Flag For P565
Imputation Flag For P565
F_P570 Numeric Imputation Flag
Imputation Flag For P570
Imputation Flag For P570
F_P575 Numeric Imputation Flag
Imputation Flag For P575
Imputation Flag For P575
F_P580 Numeric Imputation Flag
Imputation Flag For P580
Imputation Flag For P580
F_P585 Numeric Imputation Flag
Imputation Flag For P585
Imputation Flag For P585
F_P590 Numeric Imputation Flag
Imputation Flag For P590
Imputation Flag For P590
F_P595 Numeric Imputation Flag
Imputation Flag For P595
Imputation Flag For P595
F_P600 Numeric Imputation Flag
Imputation Flag For P600
Imputation Flag For P600
F_P602 Numeric Imputation Flag
Imputation Flag For P602
Imputation Flag For P602
F_P605 Numeric Imputation Flag
Imputation Flag For P605
Imputation Flag For P605
F_P610 Numeric Imputation Flag
Imputation Flag For P610
Imputation Flag For P610
F_P615 Numeric Imputation Flag
Imputation Flag For P615
Imputation Flag For P615

I-40 2005–06 PSS Data File User’s Manual and Survey Documentation
Variable name Type Question # Label Question wording/Long description F_P620 Numeric Imputation
Flag Imputation Flag For P620
Imputation Flag For P620
F_P622 Numeric Imputation Flag
Imputation Flag For P622
Imputation Flag For P622
F_P625 Numeric Imputation Flag
Imputation Flag For P625
Imputation Flag For P625
F_P630 Numeric Imputation Flag
Imputation Flag For P630
Imputation Flag For P630
F_P635 Numeric Imputation Flag
Imputation Flag For P635
Imputation Flag For P635
F_P640 Numeric Imputation Flag
Imputation Flag For P640
Imputation Flag For P640
F_P645 Numeric Imputation Flag
Imputation Flag For P645
Imputation Flag For P645
F_P650 Numeric Imputation Flag
Imputation Flag For P650
Imputation Flag For P650
F_P655 Numeric Imputation Flag
Imputation Flag For P655
Imputation Flag For P655
F_P660 Numeric Imputation Flag
Imputation Flag For P660
Imputation Flag For P660
S_KG Numeric Created Variable
Total number of kindergar-ten students
Total kindergarten enrollment (Sum of Kindergarten, Transitional Kindergarten, and Transitional First Grade)
P_INDIAN Numeric Created Variable
% of American Indian or Alaska Native students (K–12, UG)
Percentage of American Indian or Alaska Native students (K–12, UG)

Appendix I. Public-Use Codebook I-41
Variable name Type Question # Label Question wording/Long description P_ASIAN Numeric Created
Variable % of Asian or Pacific Islanders students (K–12, UG)
Percentage of Asian or Pacific Islanders students (K–12, UG)
P_HISP Numeric Created Variable
% of Hispanic students (K–12, UG)
Percentage of Hispanic students (K–12, UG)
P_WHITE Numeric Created Variable
% of White students (K–12, UG)
Percentage of White students (K–12, UG)
P_BLACK Numeric Created Variable
% of Black students (K–12, UG)
Percentage of Black students (K–12, UG)
STTCH_RT Numeric Created Variable
Student teacher ratio
Student teacher ratio

I-42 2005–06 PSS Data File User’s Manual and Survey Documentation
Descriptive Statistics for Continuous Variables—Unweighted
Variable Label Minimum Maximum Mean N Valid
skip PFNLWT Final Weight for School 1.000 75.789 1.177 29,784 . REPW1 Replicate Weights 1 0.000 131.645 1.174 29,784 . REPW2 Replicate Weights 2 0.000 151.579 1.188 29,784 . REPW3 Replicate Weights 3 0.000 132.716 1.179 29,784 . REPW4 Replicate Weights 4 0.000 128.704 1.175 29,784 . REPW5 Replicate Weights 5 0.000 132.716 1.187 29,784 . REPW6 Replicate Weights 6 0.000 151.196 1.168 29,784 . REPW7 Replicate Weights 7 0.000 128.704 1.180 29,784 . REPW8 Replicate Weights 8 0.000 151.579 1.195 29,784 . REPW9 Replicate Weights 9 0.000 132.716 1.183 29,784 . REPW10 Replicate Weights 10 0.000 151.196 1.181 29,784 . REPW11 Replicate Weights 11 0.000 151.196 1.170 29,784 . REPW12 Replicate Weights 12 0.000 151.579 1.192 29,784 . REPW13 Replicate Weights 13 0.000 151.579 1.179 29,784 . REPW14 Replicate Weights 14 0.000 132.716 1.148 29,784 . REPW15 Replicate Weights 15 0.000 151.579 1.188 29,784 . REPW16 Replicate Weights 16 0.000 151.196 1.149 29,784 . REPW17 Replicate Weights 17 0.000 151.579 1.162 29,784 . REPW18 Replicate Weights 18 0.000 151.579 1.182 29,784 . REPW19 Replicate Weights 19 0.000 151.196 1.173 29,784 . REPW20 Replicate Weights 20 0.000 151.579 1.177 29,784 . REPW21 Replicate Weights 21 0.000 151.579 1.175 29,784 . REPW22 Replicate Weights 22 0.000 151.196 1.180 29,784 . REPW23 Replicate Weights 23 0.000 132.716 1.172 29,784 . REPW24 Replicate Weights 24 0.000 151.579 1.185 29,784 . REPW25 Replicate Weights 25 0.000 132.716 1.166 29,784 . REPW26 Replicate Weights 26 0.000 151.579 1.196 29,784 . REPW27 Replicate Weights 27 0.000 151.196 1.203 29,784 . REPW28 Replicate Weights 28 0.000 151.196 1.183 29,784 . REPW29 Replicate Weights 29 0.000 151.579 1.166 29,784 . REPW30 Replicate Weights 30 0.000 151.579 1.174 29,784 . REPW31 Replicate Weights 31 0.000 151.579 1.168 29,784 . REPW32 Replicate Weights 32 0.000 151.196 1.187 29,784 . REPW33 Replicate Weights 33 0.000 151.579 1.188 29,784 . REPW34 Replicate Weights 34 0.000 151.579 1.198 29,784 . REPW35 Replicate Weights 35 0.000 151.579 1.189 29,784 . REPW36 Replicate Weights 36 0.000 151.579 1.164 29,784 . REPW37 Replicate Weights 37 0.000 151.579 1.181 29,784 . REPW38 Replicate Weights 38 0.000 131.645 1.191 29,784 . REPW39 Replicate Weights 39 0.000 151.196 1.185 29,784 . REPW40 Replicate Weights 40 0.000 131.645 1.154 29,784 . REPW41 Replicate Weights 41 0.000 151.579 1.173 29,784 . REPW42 Replicate Weights 42 0.000 151.196 1.191 29,784 .

Appendix I. Public-Use Codebook: Descriptive Statistics for Continuous Variables—Unweighted I-43
Variable Label Minimum Maximum Mean N Valid
skip REPW43 Replicate Weights 43 0.000 151.579 1.156 29,784 . REPW44 Replicate Weights 44 0.000 151.579 1.160 29,784 . REPW45 Replicate Weights 45 0.000 132.716 1.185 29,784 . REPW46 Replicate Weights 46 0.000 151.579 1.196 29,784 . REPW47 Replicate Weights 47 0.000 131.645 1.183 29,784 . REPW48 Replicate Weights 48 0.000 132.716 1.160 29,784 . REPW49 Replicate Weights 49 0.000 128.704 1.192 29,784 . REPW50 Replicate Weights 50 0.000 151.196 1.167 29,784 . REPW51 Replicate Weights 51 0.000 132.716 1.192 29,784 . REPW52 Replicate Weights 52 0.000 151.579 1.169 29,784 . REPW53 Replicate Weights 53 0.000 128.704 1.159 29,784 . REPW54 Replicate Weights 54 0.000 151.196 1.167 29,784 . REPW55 Replicate Weights 55 0.000 151.196 1.178 29,784 . REPW56 Replicate Weights 56 0.000 151.579 1.183 29,784 . REPW57 Replicate Weights 57 0.000 151.579 1.167 29,784 . REPW58 Replicate Weights 58 0.000 128.704 1.164 29,784 . REPW59 Replicate Weights 59 0.000 151.579 1.176 29,784 . REPW60 Replicate Weights 60 0.000 151.196 1.181 29,784 . REPW61 Replicate Weights 61 0.000 151.579 1.155 29,784 . REPW62 Replicate Weights 62 0.000 151.579 1.175 29,784 . REPW63 Replicate Weights 63 0.000 151.196 1.197 29,784 . REPW64 Replicate Weights 64 0.000 151.579 1.189 29,784 . REPW65 Replicate Weights 65 0.000 151.579 1.167 29,784 . REPW66 Replicate Weights 66 0.000 151.196 1.176 29,784 . REPW67 Replicate Weights 67 0.000 131.645 1.168 29,784 . REPW68 Replicate Weights 68 0.000 151.579 1.152 29,784 . REPW69 Replicate Weights 69 0.000 92.239 1.140 29,784 . REPW70 Replicate Weights 70 0.000 151.579 1.167 29,784 . REPW71 Replicate Weights 71 0.000 151.196 1.175 29,784 . REPW72 Replicate Weights 72 0.000 151.196 1.187 29,784 . REPW73 Replicate Weights 73 0.000 151.579 1.202 29,784 . REPW74 Replicate Weights 74 0.000 151.579 1.196 29,784 . REPW75 Replicate Weights 75 0.000 151.579 1.156 29,784 . REPW76 Replicate Weights 76 0.000 151.196 1.158 29,784 . REPW77 Replicate Weights 77 0.000 151.579 1.170 29,784 . REPW78 Replicate Weights 78 0.000 151.579 1.175 29,784 . REPW79 Replicate Weights 79 0.000 151.579 1.185 29,784 . REPW80 Replicate Weights 80 0.000 151.579 1.184 29,784 . REPW81 Replicate Weights 81 0.000 151.579 1.192 29,784 . REPW82 Replicate Weights 82 0.000 132.716 1.184 29,784 . REPW83 Replicate Weights 83 0.000 151.196 1.182 29,784 . REPW84 Replicate Weights 84 0.000 132.716 1.165 29,784 . REPW85 Replicate Weights 85 0.000 151.579 1.185 29,784 . REPW86 Replicate Weights 86 0.000 151.196 1.189 29,784 . REPW87 Replicate Weights 87 0.000 151.579 1.187 29,784 . REPW88 Replicate Weights 88 0.000 151.579 1.180 29,784 .

I-44 2005–06 PSS Data File User’s Manual and Survey Documentation
Variable Label Minimum Maximum Mean N Valid
skip P140 5A Ungraded Enrollment 1.000 541.000 42.637 1,591 28,193
P150 5B Nursery/Prekindergarten
Enrollment 0.000 753.000 45.167 17,828 11,956 P160 5C Kindergarten Enrollment 1.000 525.000 20.723 22,642 7,142
P170 5D Transitional Kindergarten
Enrollment 1.000 240.000 12.045 1,149 28,635
P180 5E Transitional First Grade
Enrollment 1.000 197.000 9.943 529 29,255 P190 5F First Grade Enrollment 1.000 358.000 19.626 19,579 10,205 P200 5G Second Grade Enrollment 1.000 353.000 19.205 19,295 10,489 P210 5H Third Grade Enrollment 1.000 526.000 18.960 19,264 10,520 P220 5I Fourth Grade Enrollment 1.000 528.000 18.929 18,964 10,820 P230 5J Fifth Grade Enrollment 1.000 520.000 18.952 18,884 10,900 P240 5K Sixth Grade Enrollment 1.000 537.000 19.692 18,334 11,450 P250 5L Seventh Grade Enrollment 1.000 511.000 20.622 17,160 12,624 P260 5M Eighth Grade Enrollment 1.000 506.000 20.720 16,961 12,823 P270 5N Ninth Grade Enrollment 1.000 1,320.000 36.763 8,760 21,024 P280 5O Tenth Grade Enrollment 1.000 999.000 37.732 8,285 21,499 P290 5P Eleventh Grade Enrollment 1.000 691.000 37.365 7,901 21,883 P300 5Q Twelfth Grade Enrollment 1.000 1,000.000 37.151 7,640 22,144 P305 6 Total Student Enrollment 1.000 3,223.000 183.936 29,784 . P320 7A Hispanic Students 0.000 1,249.000 14.739 29,784 . P330 7B White Students 0.000 3,128.000 117.856 29,784 . P325 7C Black Students 0.000 938.000 15.150 29,784 . P315 7D Asian Or Pacific Islander
Students 0.000 3,000.000 6.309 29,784 . P310 7E Am Indian/Alaska Native
Students 0.000 744.000 2.846 29,784 . P340 8B Number of Male Students 0.000 1,833.000 76.353 28,587 1,197 P350 9B How Many In 12th Grade Last
Year 1.000 658.000 37.794 7,324 22,460 P360 9D Percent To 4 Year College 0.000 100.000 58.862 7,160 22,624 P361 9D Percent To 2 Year College 0.000 100.000 19.373 7,160 22,624 P385 11 Full-Time Teachers 0.000 271.000 11.867 29,784 . P390 11 More Than 3/4 Time Teachers 0.000 80.000 0.667 29,784 . P395 11 More Than 1/2 Time Teachers 0.000 156.000 1.252 29,784 . P400 11 More Than 1/4 Time Teachers 0.000 55.000 0.639 29,784 . P405 11 Less Than 1/4 Time Teachers 0.000 100.000 0.494 29,784 . P410 11 Total Number Of Teachers 1.000 291.000 14.919 29,784 . P645 16 Days In School Year 99.000 261.000 181.449 29,784 . P650 17 Hours In School Day For
Students 1.000 10.000 6.301 29,784 . P665 19 Minutes tTo Complete
Questionnaire 1.000 500.000 17.293 29,135 649 NUMSTUDS Total number of students in school
(K–12, UG) 1.000 3,128.000 156.900 29,784 . NUMTEACH Number of K-12 teachers (FTE) 0.100 271.000 13.543 29,784 .
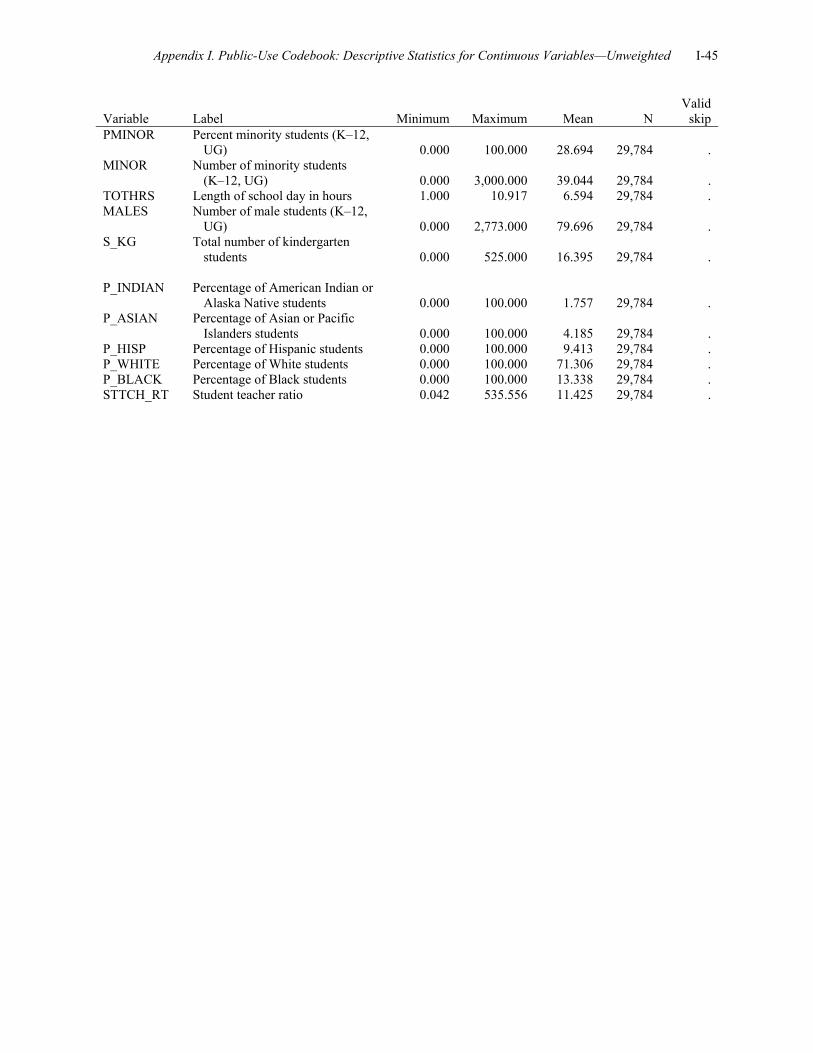
Appendix I. Public-Use Codebook: Descriptive Statistics for Continuous Variables—Unweighted I-45
Variable Label Minimum Maximum Mean N Valid
skip PMINOR Percent minority students (K–12,
UG) 0.000 100.000 28.694 29,784 . MINOR Number of minority students
(K–12, UG) 0.000 3,000.000 39.044 29,784 . TOTHRS Length of school day in hours 1.000 10.917 6.594 29,784 . MALES Number of male students (K–12,
UG) 0.000 2,773.000 79.696 29,784 . S_KG Total number of kindergarten
students 0.000 525.000 16.395 29,784 . P_INDIAN Percentage of American Indian or
Alaska Native students 0.000 100.000 1.757 29,784 . P_ASIAN Percentage of Asian or Pacific
Islanders students 0.000 100.000 4.185 29,784 . P_HISP Percentage of Hispanic students 0.000 100.000 9.413 29,784 . P_WHITE Percentage of White students 0.000 100.000 71.306 29,784 . P_BLACK Percentage of Black students 0.000 100.000 13.338 29,784 . STTCH_RT Student teacher ratio 0.042 535.556 11.425 29,784 .

I-46 2005–06 PSS Data File User’s Manual and Survey Documentation
Descriptive Statistics for Categorical Variables—Unweighted Method of Interview Cumulative Cumulative csource Frequency Percent Frequency Percent Mail 13114 44.030 13114 44.030 Internet 6403 21.498 19517 65.528 CATI (computer‐assisted telephone interview) 8851 29.717 28368 95.246 Regional Office follow‐up 1416 4.754 29784 100.000 5A Ungraded Offered Cumulative Cumulative P135 Frequency Percent Frequency Percent Yes 1591 5.342 1591 5.342 No 28193 94.658 29784 100.000 5B Nursery/Prekindergarten Offered Cumulative Cumulative P145 Frequency Percent Frequency Percent Yes 17190 57.716 17190 57.716 No 12594 42.284 29784 100.000 5C Kindergarten Offered Cumulative Cumulative P155 Frequency Percent Frequency Percent Yes 22642 76.021 22642 76.021 No 7142 23.979 29784 100.000 5D Transitional Kindergarten Offered Cumulative Cumulative P165 Frequency Percent Frequency Percent Yes 1149 3.858 1149 3.858 No 28635 96.142 29784 100.000 5E Transitional First Grade Offered Cumulative Cumulative P175 Frequency Percent Frequency Percent Yes 529 1.776 529 1.776 No 29255 98.224 29784 100.000 5F First Grade Offered Cumulative Cumulative P185 Frequency Percent Frequency Percent Yes 19579 65.737 19579 65.737 No 10205 34.263 29784 100.000 5G Second Grade Offered Cumulative Cumulative P195 Frequency Percent Frequency Percent Yes 19295 64.783 19295 64.783 No 10489 35.217 29784 100.000

Appendix I. Public-Use Codebook: Descriptive Statistics for Categorical Variables—Unweighted I-47
5H Third Grade Offered Cumulative Cumulative P205 Frequency Percent Frequency Percent Yes 19264 64.679 19264 64.679 No 10520 35.321 29784 100.000 5I Fourth Grade Offered Cumulative Cumulative P215 Frequency Percent Frequency Percent Yes 18964 63.672 18964 63.672 No 10820 36.328 29784 100.000 5J Fifth Grade Offered Cumulative Cumulative P225 Frequency Percent Frequency Percent Yes 18884 63.403 18884 63.403 No 10900 36.597 29784 100.000 5K Sixth Grade Offered Cumulative Cumulative P235 Frequency Percent Frequency Percent Yes 18334 61.557 18334 61.557 No 11450 38.443 29784 100.000 5L Seventh Grade Offered Cumulative Cumulative P245 Frequency Percent Frequency Percent Yes 17160 57.615 17160 57.615 No 12624 42.385 29784 100.000 5M Eighth Grade Offered Cumulative Cumulative P255 Frequency Percent Frequency Percent Yes 16961 56.947 16961 56.947 No 12823 43.053 29784 100.000 5N Ninth Grade Offered Cumulative Cumulative P265 Frequency Percent Frequency Percent Yes 8760 29.412 8760 29.412 No 21024 70.588 29784 100.000 5O Tenth Grade Offered Cumulative Cumulative P275 Frequency Percent Frequency Percent Yes 8285 27.817 8285 27.817 No 21499 72.183 29784 100.000

I-48 2005–06 PSS Data File User’s Manual and Survey Documentation
5P Eleventh Grade Offered Cumulative Cumulative P285 Frequency Percent Frequency Percent Yes 7901 26.528 7901 26.528 No 21883 73.472 29784 100.000 5Q Twelfth Grade Offered Cumulative Cumulative P295 Frequency Percent Frequency Percent Yes 7640 25.651 7640 25.651 No 22144 74.349 29784 100.000 8A Is School Coeducational Cumulative Cumulative P335 Frequency Percent Frequency Percent Coeducational 28587 95.981 28587 95.981 all‐female school 541 1.816 29128 97.797 all‐male school 656 2.203 29784 100.000 9A Students in 12th Grade Last Year Cumulative Cumulative P345 Frequency Percent Frequency Percent Yes 7324 24.590 7324 24.590 No 22460 75.410 29784 100.000 10A Half Day Or Full Day Cumulative Cumulative P365 Frequency Percent Frequency Percent None 6957 23.358 6957 23.358 Full day 17602 59.099 24559 82.457 Half day 2774 9.314 27333 91.771 Both offered 2451 8.229 29784 100.000 10B Days Per Week Cumulative Cumulative P370 Frequency Percent Frequency Percent Valid Skip 6957 23.358 6957 23.358 1 18 0.060 6975 23.419 2 38 0.128 7013 23.546 3 602 2.021 7615 25.567 4 363 1.219 7978 26.786 5 21806 73.214 29784 100.000 12A Type of School Cumulative Cumulative P415 Frequency Percent Frequency Percent Regular elementary/secondary 20268 68.050 20268 68.050 Montessori 2206 7.407 22474 75.457 Special Program Emphasis 1051 3.529 23525 78.985 Special Education 1542 5.177 25067 84.163 Vocational/Technical 7 0.024 25074 84.186 Alternative 861 2.891 25935 87.077 Early childhood 3849 12.923 29784 100.000

Appendix I. Public-Use Codebook: Descriptive Statistics for Categorical Variables—Unweighted I-49
12B School Support Home Schooling Cumulative Cumulative P420 Frequency Percent Frequency Percent Yes 1145 3.844 1145 3.844 No 28639 96.156 29784 100.000 13 Is School Located In Private Home Cumulative Cumulative P425 Frequency Percent Frequency Percent Yes 151 0.507 151 0.507 No 29633 99.493 29784 100.000 14A Does School Have Religious Orientation Cumulative Cumulative P430 Frequency Percent Frequency Percent Yes 20739 69.631 20739 69.631 No 9045 30.369 29784 100.000 14B School Affiliated W/Religious Cumulative Cumulative P435 Frequency Percent Frequency Percent Valid Skip 9045 30.369 9045 30.369 Yes 18096 60.757 27141 91.126 No 2643 8.874 29784 100.000 14C Religious Orientation/Affiliation Cumulative Cumulative P440 Frequency Percent Frequency Percent Valid Skip 9045 30.369 9045 30.369 Roman Catholic 7292 24.483 16337 54.852 African Methodist Episcopal 13 0.044 16350 54.895 Amish 664 2.229 17014 57.125 Assembly of God 393 1.320 17407 58.444 Baptist 2049 6.880 19456 65.324 Brethren 81 0.272 19537 65.596 Calvinist 131 0.440 19668 66.035 Christian (no specific denomination) 3833 12.869 23501 78.905 Church of Christ 156 0.524 23657 79.429 Church of God 114 0.383 23771 79.811 Church of God in Christ 35 0.118 23806 79.929 Church of the Nazarene 89 0.299 23895 80.228 Disciples of Christ 14 0.047 23909 80.275 Episcopal 402 1.350 24311 81.624 Friends 83 0.279 24394 81.903 Greek Orthodox 33 0.111 24427 82.014 Islamic 181 0.608 24608 82.622 Jewish 820 2.753 25428 85.375 Latter Day Saints 6 0.020 25434 85.395 Lutheran Church ‐ Missouri Synod 1169 3.925 26603 89.320 Evangelical Lutheran Church in America 182 0.611 26785 89.931 Wisconsin Evangelical Lutheran Synod 354 1.189 27139 91.119 Other Lutheran 73 0.245 27212 91.364 Mennonite 374 1.256 27586 92.620 Methodist 290 0.974 27876 93.594 Pentecostal 334 1.121 28210 94.715 Presbyterian 249 0.836 28459 95.551 Seventh‐Day Adventist 863 2.898 29322 98.449 Other 462 1.551 29784 100.000

I-50 2005–06 PSS Data File User’s Manual and Survey Documentation
14C What Type of Catholic School Cumulative Cumulative P445 Frequency Percent Frequency Percent Valid Skip 22492 75.517 22492 75.517 Parochial 3524 11.832 26016 87.349 Diocesan 2837 9.525 28853 96.874 Private 931 3.126 29784 100.000 15 No Associations Cumulative Cumulative P450 Frequency Percent Frequency Percent Does belong to an organization/association 22823 76.628 22823 76.628 Does not belong to an organization/association 6961 23.372 29784 100.000 15 Accelerated Christian Education Cumulative Cumulative P455 Frequency Percent Frequency Percent Not member 28716 96.414 28716 96.414 Member 1068 3.586 29784 100.000 15 American Association of Christian Schools Cumulative Cumulative P460 Frequency Percent Frequency Percent Not member 28936 97.153 28936 97.153 Member 848 2.847 29784 100.000 15 Association of Christian Schools International Cumulative Cumulative P465 Frequency Percent Frequency Percent Not member 26419 88.702 26419 88.702 Member 3365 11.298 29784 100.000 15 Association of Christian Teachers And Schools Cumulative Cumulative P467 Frequency Percent Frequency Percent Not member 29547 99.204 29547 99.204 Member 237 0.796 29784 100.000 15 Association of Classical and Christian Schools Cumulative Cumulative P468 Frequency Percent Frequency Percent Not member 29669 99.614 29669 99.614 Member 115 0.386 29784 100.000 15 Christian Schools International Cumulative Cumulative P470 Frequency Percent Frequency Percent Not member 29423 98.788 29423 98.788 Member 361 1.212 29784 100.000

Appendix I. Public-Use Codebook: Descriptive Statistics for Categorical Variables—Unweighted I-51
15 Evangelical Lutheran Education Association Cumulative Cumulative P480 Frequency Percent Frequency Percent Not member 29489 99.010 29489 99.010 Member 295 0.990 29784 100.000 15 Friends Council on Education Cumulative Cumulative P485 Frequency Percent Frequency Percent Not member 29723 99.795 29723 99.795 Member 61 0.205 29784 100.000 15 General Conference of SDA Church Cumulative Cumulative P490 Frequency Percent Frequency Percent Not member 29096 97.690 29096 97.690 Member 688 2.310 29784 100.000 15 Islamic School League of America Cumulative Cumulative P492 Frequency Percent Frequency Percent Not member 29700 99.718 29700 99.718 Member 84 0.282 29784 100.000 15 Jesuit Secondary Education Association Cumulative Cumulative P495 Frequency Percent Frequency Percent Not member 29735 99.835 29735 99.835 Member 49 0.165 29784 100.000 15 National Association of Episcopal Schools Cumulative Cumulative P500 Frequency Percent Frequency Percent Not member 29466 98.932 29466 98.932 Member 318 1.068 29784 100.000 15 National Catholic Educational Association Cumulative Cumulative P505 Frequency Percent Frequency Percent Not member 23277 78.153 23277 78.153 Member 6507 21.847 29784 100.000 15 National Christian School Association Cumulative Cumulative P510 Frequency Percent Frequency Percent Not member 29646 99.537 29646 99.537 Member 138 0.463 29784 100.000

I-52 2005–06 PSS Data File User’s Manual and Survey Documentation
15 National Society of Hebrew Day Schools Cumulative Cumulative P515 Frequency Percent Frequency Percent Not member 29537 99.171 29537 99.171 Member 247 0.829 29784 100.000 15 Oral Roberts University Educational Fellowship Cumulative Cumulative P520 Frequency Percent Frequency Percent Not member 29698 99.711 29698 99.711 Member 86 0.289 29784 100.000 15 Solomon Schechter Day Schools Cumulative Cumulative P525 Frequency Percent Frequency Percent Not member 29728 99.812 29728 99.812 Member 56 0.188 29784 100.000 15 Southern Baptist Association of Christian Schools Cumulative Cumulative P530 Frequency Percent Frequency Percent Not member 29622 99.456 29622 99.456 Member 162 0.544 29784 100.000 15 Other Religious School Associations Cumulative Cumulative P535 Frequency Percent Frequency Percent Not member 27353 91.838 27353 91.838 Member 2431 8.162 29784 100.000 15 American Montessori Society Cumulative Cumulative P540 Frequency Percent Frequency Percent Not member 28596 96.011 28596 96.011 Member 1188 3.989 29784 100.000 15 Association Montessori International Cumulative Cumulative P542 Frequency Percent Frequency Percent Not member 29241 98.177 29241 98.177 Member 543 1.823 29784 100.000 15 Other Montessori associations Cumulative Cumulative P545 Frequency Percent Frequency Percent Not member 28833 96.807 28833 96.807 Member 951 3.193 29784 100.000

Appendix I. Public-Use Codebook: Descriptive Statistics for Categorical Variables—Unweighted I-53
15 Association Military Colleges And Schools Cumulative Cumulative P550 Frequency Percent Frequency Percent Not member 29761 99.923 29761 99.923 Member 23 0.077 29784 100.000 15 Association Waldorf Schools of North America Cumulative Cumulative P555 Frequency Percent Frequency Percent Not member 29668 99.611 29668 99.611 Member 116 0.389 29784 100.000 15 Bilingual School Association Cumulative Cumulative P560 Frequency Percent Frequency Percent Not member 29761 99.923 29761 99.923 Member 23 0.077 29784 100.000 15 Council of Bilingual Education Cumulative Cumulative P565 Frequency Percent Frequency Percent Not member 29769 99.950 29769 99.950 Member 15 0.050 29784 100.000 15 Council For Exceptional Children Cumulative Cumulative P570 Frequency Percent Frequency Percent Not member 29401 98.714 29401 98.714 Member 383 1.286 29784 100.000
15 National Association of Private Special Education Centers Cumulative Cumulative P575 Frequency Percent Frequency Percent Not member 29436 98.832 29436 98.832 Member 348 1.168 29784 100.000 15 Other Associations For Exceptional Children Cumulative Cumulative P580 Frequency Percent Frequency Percent Not member 29445 98.862 29445 98.862 Member 339 1.138 29784 100.000
15 European Council For International Schools Cumulative Cumulative P585 Frequency Percent Frequency Percent Not member 29765 99.936 29765 99.936 Member 19 0.064 29784 100.000

I-54 2005–06 PSS Data File User’s Manual and Survey Documentation
15 National Association For The Education of Young Children Cumulative Cumulative P590 Frequency Percent Frequency Percent Not member 27566 92.553 27566 92.553 Member 2218 7.447 29784 100.000 15 National Association of Bilingual Education Cumulative Cumulative P595 Frequency Percent Frequency Percent Not member 29777 99.976 29777 99.976 Member 7 0.024 29784 100.000 15 National Association of Laboratory Schools Cumulative Cumulative P600 Frequency Percent Frequency Percent Not member 29763 99.929 29763 99.929 Member 21 0.071 29784 100.000 15 National Coalition of Girls' Schools Cumulative Cumulative P602 Frequency Percent Frequency Percent Not member 29700 99.718 29700 99.718 Member 84 0.282 29784 100.000 15 Other Special Emphasis Associations Cumulative Cumulative P605 Frequency Percent Frequency Percent Not member 28531 95.793 28531 95.793 Member 1253 4.207 29784 100.000 15 Alternative School Network Cumulative Cumulative P610 Frequency Percent Frequency Percent Not member 29750 99.886 29750 99.886 Member 34 0.114 29784 100.000 15 Institute For Independent Education Cumulative Cumulative P615 Frequency Percent Frequency Percent Not member 29711 99.755 29711 99.755 Member 73 0.245 29784 100.000 15 National Association of Independent Schools Cumulative Cumulative P620 Frequency Percent Frequency Percent Not member 28189 94.645 28189 94.645 Member 1595 5.355 29784 100.000

Appendix I. Public-Use Codebook: Descriptive Statistics for Categorical Variables—Unweighted I-55
15 State or regional independent school association Cumulative Cumulative P622 Frequency Percent Frequency Percent Not member 27792 93.312 27792 93.312 Member 1992 6.688 29784 100.000 15 National Coalition of Alternative Community Schools Cumulative Cumulative P625 Frequency Percent Frequency Percent Not member 29735 99.835 29735 99.835 Member 49 0.165 29784 100.000 15 National Independent Private Schools Association Cumulative Cumulative P630 Frequency Percent Frequency Percent Not member 29524 99.127 29524 99.127 Member 260 0.873 29784 100.000 15 The Association of Boarding Schools Cumulative Cumulative P635 Frequency Percent Frequency Percent Not member 29586 99.335 29586 99.335 Member 198 0.665 29784 100.000 15 Other school associations Cumulative Cumulative P640 Frequency Percent Frequency Percent Not member 27383 91.939 27383 91.939 Member 2401 8.061 29784 100.000 17 Minutes In School Day For Students Cumulative Cumulative P655 Frequency Percent Frequency Percent 0 12571 42.207 12571 42.207 1 10 0.034 12581 42.241 2 21 0.071 12602 42.311 3 28 0.094 12630 42.405 4 3 0.010 12633 42.415 5 429 1.440 13062 43.856 6 12 0.040 13074 43.896 7 10 0.034 13084 43.930 8 16 0.054 13100 43.983 9 11 0.037 13111 44.020 10 680 2.283 13791 46.303 11 5 0.017 13796 46.320 12 21 0.071 13817 46.391 13 4 0.013 13821 46.404 14 10 0.034 13831 46.438 15 2085 7.000 15916 53.438 16 4 0.013 15920 53.452 17 9 0.030 15929 53.482 18 13 0.044 15942 53.525 19 5 0.017 15947 53.542 20 654 2.196 16601 55.738 21 4 0.013 16605 55.751 22 11 0.037 16616 55.788 23 13 0.044 16629 55.832 24 10 0.034 16639 55.866

I-56 2005–06 PSS Data File User’s Manual and Survey Documentation
17 Minutes In School Day For Students (Continued)
Cumulative Cumulative P655 Frequency Percent Frequency Percent 25 333 1.118 16972 56.984 26 5 0.017 16977 57.000 27 4 0.013 16981 57.014 28 10 0.034 16991 57.047 29 14 0.047 17005 57.094 30 7692 25.826 24697 82.920 31 5 0.017 24702 82.937 32 2 0.007 24704 82.944 33 9 0.030 24713 82.974 34 11 0.037 24724 83.011 35 422 1.417 25146 84.428 36 13 0.044 25159 84.472 37 4 0.013 25163 84.485 38 10 0.034 25173 84.519 39 10 0.034 25183 84.552 40 754 2.532 25937 87.084 41 4 0.013 25941 87.097 42 18 0.060 25959 87.158 43 6 0.020 25965 87.178 44 3 0.010 25968 87.188 45 2676 8.985 28644 96.172 46 11 0.037 28655 96.209 47 13 0.044 28668 96.253 48 14 0.047 28682 96.300 49 3 0.010 28685 96.310 50 712 2.391 29397 98.701 51 5 0.017 29402 98.717 52 11 0.037 29413 98.754 53 8 0.027 29421 98.781 54 7 0.024 29428 98.805 55 330 1.108 29758 99.913 56 4 0.013 29762 99.926 57 8 0.027 29770 99.953 58 12 0.040 29782 99.993 59 2 0.007 29784 100.000 18 Library or library media center Cumulative Cumulative P660 Frequency Percent Frequency Percent Yes 23749 79.737 23749 79.737 No 6035 20.263 29784 100.000 Census Region Cumulative Cumulative region Frequency Percent Frequency Percent Northeast 7432 24.953 7432 24.953 Midwest 7082 23.778 14514 48.731 South 8699 29.207 23213 77.938 West 6571 22.062 29784 100.000

Appendix I. Public-Use Codebook: Descriptive Statistics for Categorical Variables—Unweighted I-57
FIPS State Code (mailing address of school) Cumulative Cumulative pstfip Frequency Percent Frequency Percent ALABAMA 375 1.259 375 1.259 ALASKA 66 0.222 441 1.481 ARIZONA 379 1.272 820 2.753 ARKANSAS 171 0.574 991 3.327 CALIFORNIA 3783 12.701 4774 16.029 COLORADO 444 1.491 5218 17.519 CONNECTICUT 384 1.289 5602 18.809 DELAWARE 130 0.436 5732 19.245 DISTRICT OF COLUMBIA 87 0.292 5819 19.537 FLORIDA 1819 6.107 7638 25.645 GEORGIA 594 1.994 8232 27.639 HAWAII 118 0.396 8350 28.035 IDAHO 118 0.396 8468 28.431 ILLINOIS 1578 5.298 10046 33.730 INDIANA 726 2.438 10772 36.167 IOWA 242 0.813 11014 36.980 KANSAS 223 0.749 11237 37.728 KENTUCKY 359 1.205 11596 38.934 LOUISIANA 377 1.266 11973 40.199 MAINE 153 0.514 12126 40.713 MARYLAND 773 2.595 12899 43.308 MASSACHUSETTS 828 2.780 13727 46.089 MICHIGAN 931 3.126 14658 49.214 MINNESOTA 542 1.820 15200 51.034 MISSISSIPPI 223 0.749 15423 51.783 MISSOURI 595 1.998 16018 53.781 MONTANA 107 0.359 16125 54.140 NEBRASKA 226 0.759 16351 54.899 NEVADA 159 0.534 16510 55.432 NEW HAMPSHIRE 324 1.088 16834 56.520 NEW JERSEY 1234 4.143 18068 60.663 NEW MEXICO 174 0.584 18242 61.248 NEW YORK 1961 6.584 20203 67.832 NORTH CAROLINA 553 1.857 20756 69.688 NORTH DAKOTA 49 0.165 20805 69.853 OHIO 953 3.200 21758 73.053 OKLAHOMA 175 0.588 21933 73.640 OREGON 432 1.450 22365 75.091 PENNSYLVANIA 2253 7.564 24618 82.655 RHODE ISLAND 171 0.574 24789 83.229 SOUTH CAROLINA 383 1.286 25172 84.515 SOUTH DAKOTA 82 0.275 25254 84.790 TENNESSEE 503 1.689 25757 86.479 TEXAS 1342 4.506 27099 90.985 UTAH 122 0.410 27221 91.395 VERMONT 121 0.406 27342 91.801 VIRGINIA 697 2.340 28039 94.141 WASHINGTON 632 2.122 28671 96.263 WEST VIRGINIA 141 0.473 28812 96.737 WISCONSIN 935 3.139 29747 99.876 WYOMING 37 0.124 29784 100.000 New Urbanicity Defined (Census assigned) Cumulative Cumulative locale Frequency Percent Frequency Percent Large city 5393 18.107 5393 18.107 Mid‐size city 4906 16.472 10299 34.579 Urban fringe of large city 9056 30.406 19355 64.985 Urban Fringe of mid‐size city 3366 11.301 22721 76.286 Large town 528 1.773 23249 78.059 Small town 1648 5.533 24897 83.592 Rural ‐ outside CBSA 2329 7.820 27226 91.411 Rural ‐ inside CBSA 2558 8.589 29784 100.000

I-58 2005–06 PSS Data File User’s Manual and Survey Documentation
Urban‐centric locale code (NCES assigned) Cumulative Cumulative ulocale Frequency Percent Frequency Percent City, Large 5396 18.117 5396 18.117 City, Midsize 2240 7.521 7636 25.638 City, Small 2802 9.408 10438 35.046 Suburb, Large 9568 32.125 20006 67.170 Suburb, Midsize 882 2.961 20888 70.132 Suburb, Small 581 1.951 21469 72.082 Town, Fringe 792 2.659 22261 74.741 Town, Distant 1154 3.875 23415 78.616 Town, Remote 938 3.149 24353 81.765 Rural, Fringe 2966 9.958 27319 91.724 Rural, Distant 1768 5.936 29087 97.660 Rural, Remote 697 2.340 29784 100.000 2005‐2006 Lowest Grade Level Recode Cumulative Cumulative logr2006 Frequency Percent Frequency Percent All Ungraded 642 2.156 642 2.156 Lowest grade in school is prekindergarten 17190 57.716 17832 59.871 Lowest grade in school is kindergarten 5831 19.578 23663 79.449 Lowest grade in school is transitional KG 42 0.141 23705 79.590 Lowest grade in school is transitional 1st grade 32 0.107 23737 79.697 Lowest grade in school is 1st grade 1999 6.712 25736 86.409 Lowest grade in school is 2nd grade 337 1.131 26073 87.540 Lowest grade in school is 3rd grade 264 0.886 26337 88.427 Lowest grade in school is 4th grade 208 0.698 26545 89.125 Lowest grade in school is 5th grade 223 0.749 26768 89.874 Lowest grade in school is 6th grade 529 1.776 27297 91.650 Lowest grade in school is 7th grade 528 1.773 27825 93.423 Lowest grade in school is 8th grade 203 0.682 28028 94.104 Lowest grade in school is 9th grade 1670 5.607 29698 99.711 Lowest grade in school is 10th grade 41 0.138 29739 99.849 Lowest grade in school is 11th grade 17 0.057 29756 99.906 Lowest grade in school is 12th grade 28 0.094 29784 100.000 2005‐2006 Highest Grade Level Recode Cumulative Cumulative higr2006 Frequency Percent Frequency Percent All Ungraded 642 2.156 642 2.156 Highest grade in school is prekindergarten 82 0.275 724 2.431 Highest grade in school is kindergarten 4462 14.981 5186 17.412 Highest grade in school is transitional KG 490 1.645 5676 19.057 Highest grade in school is transitional 1st grade 84 0.282 5760 19.339 Highest grade in school is 1st grade 398 1.336 6158 20.676 Highest grade in school is 2nd grade 304 1.021 6462 21.696 Highest grade in school is 3rd grade 385 1.293 6847 22.989 Highest grade in school is 4th grade 357 1.199 7204 24.187 Highest grade in school is 5th grade 1077 3.616 8281 27.804 Highest grade in school is 6th grade 1779 5.973 10060 33.777 Highest grade in school is 7th grade 590 1.981 10650 35.757 Highest grade in school is 8th grade 9942 33.380 20592 69.138 Highest grade in school is 9th grade 530 1.779 21122 70.917 Highest grade in school is 10th grade 428 1.437 21550 72.354 Highest grade in school is 11th grade 594 1.994 22144 74.349 Highest grade in school is 12th grade 7640 25.651 29784 100.000

Appendix I. Public-Use Codebook: Descriptive Statistics for Categorical Variables—Unweighted I-59
Universe frame to which school belongs Cumulative Cumulative frame Frequency Percent Frequency Percent School is part of area frame 606 2.035 606 2.035 School is part of list frame 29178 97.965 29784 100.000 Tabulation flag Cumulative Cumulative tabflag Frequency Percent Frequency Percent Schools offering ungraded or grade 1 or above 24961 83.807 24961 83.807 Schools offering no grade higher than KG 4823 16.193 29784 100.000 School Typology Cumulative Cumulative typology Frequency Percent Frequency Percent Catholic, parochial 3524 11.832 3524 11.832 Catholic, diocesan 2837 9.525 6361 21.357 Catholic, private 931 3.126 7292 24.483 Other religious, conservative Christian 5039 16.918 12331 41.401 Other religious, affiliated 3605 12.104 15936 53.505 Other religious, unaffiliated 4803 16.126 20739 69.631 Nonsectarian, regular school 4668 15.673 25407 85.304 Nonsectarian, special program emphasis 3023 10.150 28430 95.454 Nonsectarian, special education 1354 4.546 29784 100.000 Affiliation Cumulative Cumulative relig Frequency Percent Frequency Percent Catholic 7292 24.483 7292 24.483 Other religious 13447 45.148 20739 69.631 Nonsectarian 9045 30.369 29784 100.000
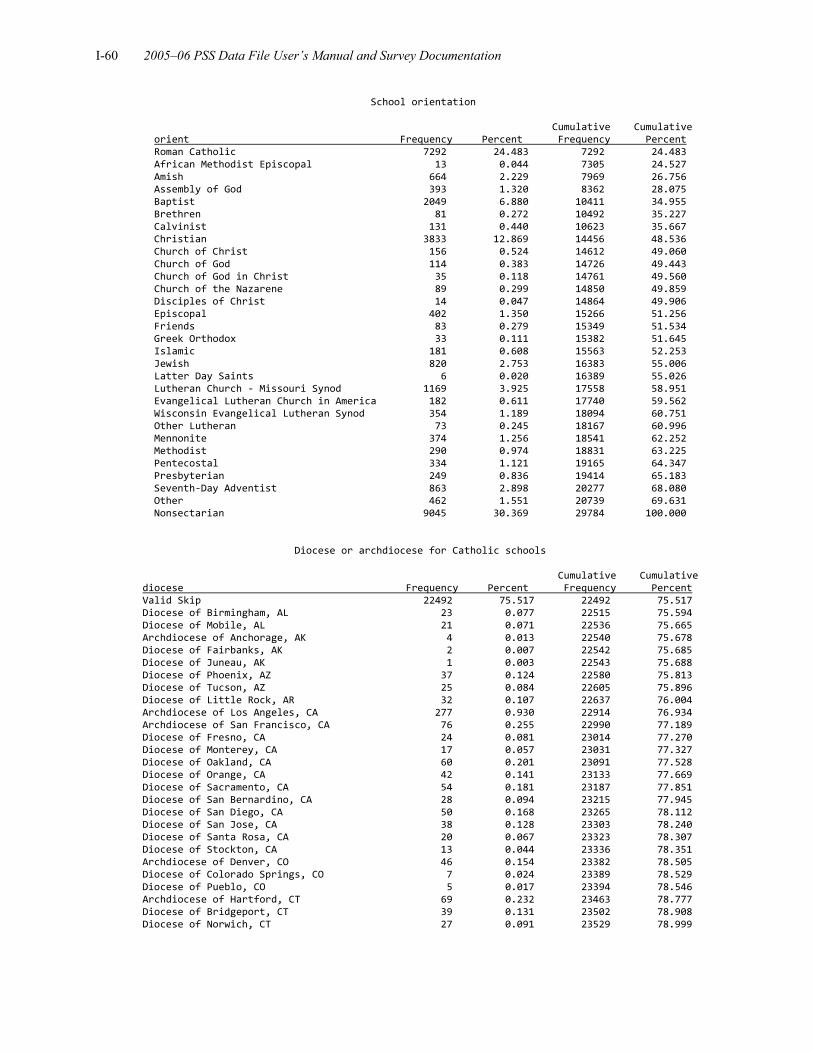
I-60 2005–06 PSS Data File User’s Manual and Survey Documentation
School orientation Cumulative Cumulative orient Frequency Percent Frequency Percent Roman Catholic 7292 24.483 7292 24.483 African Methodist Episcopal 13 0.044 7305 24.527 Amish 664 2.229 7969 26.756 Assembly of God 393 1.320 8362 28.075 Baptist 2049 6.880 10411 34.955 Brethren 81 0.272 10492 35.227 Calvinist 131 0.440 10623 35.667 Christian 3833 12.869 14456 48.536 Church of Christ 156 0.524 14612 49.060 Church of God 114 0.383 14726 49.443 Church of God in Christ 35 0.118 14761 49.560 Church of the Nazarene 89 0.299 14850 49.859 Disciples of Christ 14 0.047 14864 49.906 Episcopal 402 1.350 15266 51.256 Friends 83 0.279 15349 51.534 Greek Orthodox 33 0.111 15382 51.645 Islamic 181 0.608 15563 52.253 Jewish 820 2.753 16383 55.006 Latter Day Saints 6 0.020 16389 55.026 Lutheran Church ‐ Missouri Synod 1169 3.925 17558 58.951 Evangelical Lutheran Church in America 182 0.611 17740 59.562 Wisconsin Evangelical Lutheran Synod 354 1.189 18094 60.751 Other Lutheran 73 0.245 18167 60.996 Mennonite 374 1.256 18541 62.252 Methodist 290 0.974 18831 63.225 Pentecostal 334 1.121 19165 64.347 Presbyterian 249 0.836 19414 65.183 Seventh‐Day Adventist 863 2.898 20277 68.080 Other 462 1.551 20739 69.631 Nonsectarian 9045 30.369 29784 100.000 Diocese or archdiocese for Catholic schools Cumulative Cumulative diocese Frequency Percent Frequency Percent Valid Skip 22492 75.517 22492 75.517 Diocese of Birmingham, AL 23 0.077 22515 75.594 Diocese of Mobile, AL 21 0.071 22536 75.665 Archdiocese of Anchorage, AK 4 0.013 22540 75.678 Diocese of Fairbanks, AK 2 0.007 22542 75.685 Diocese of Juneau, AK 1 0.003 22543 75.688 Diocese of Phoenix, AZ 37 0.124 22580 75.813 Diocese of Tucson, AZ 25 0.084 22605 75.896 Diocese of Little Rock, AR 32 0.107 22637 76.004 Archdiocese of Los Angeles, CA 277 0.930 22914 76.934 Archdiocese of San Francisco, CA 76 0.255 22990 77.189 Diocese of Fresno, CA 24 0.081 23014 77.270 Diocese of Monterey, CA 17 0.057 23031 77.327 Diocese of Oakland, CA 60 0.201 23091 77.528 Diocese of Orange, CA 42 0.141 23133 77.669 Diocese of Sacramento, CA 54 0.181 23187 77.851 Diocese of San Bernardino, CA 28 0.094 23215 77.945 Diocese of San Diego, CA 50 0.168 23265 78.112 Diocese of San Jose, CA 38 0.128 23303 78.240 Diocese of Santa Rosa, CA 20 0.067 23323 78.307 Diocese of Stockton, CA 13 0.044 23336 78.351 Archdiocese of Denver, CO 46 0.154 23382 78.505 Diocese of Colorado Springs, CO 7 0.024 23389 78.529 Diocese of Pueblo, CO 5 0.017 23394 78.546 Archdiocese of Hartford, CT 69 0.232 23463 78.777 Diocese of Bridgeport, CT 39 0.131 23502 78.908 Diocese of Norwich, CT 27 0.091 23529 78.999

Appendix I. Public-Use Codebook: Descriptive Statistics for Categorical Variables—Unweighted I-61
Diocese or archdiocese for Catholic schools (Continued) Cumulative Cumulative diocese Frequency Percent Frequency Percent Diocese of Wilmington, DE 37 0.124 23566 79.123 Archdiocese of Washington, DC 93 0.312 23659 79.435 Archdiocese of Miami, FL 79 0.265 23738 79.701 Diocese of Pensacola‐Tallahassee, FL 11 0.037 23749 79.737 Diocese of Orlando, FL 38 0.128 23787 79.865 Diocese of Palm Beach, FL 19 0.064 23806 79.929 Diocese of St. Augustine, FL 28 0.094 23834 80.023 Diocese of St. Petersburg, FL 38 0.128 23872 80.150 Diocese of Venice, FL 16 0.054 23888 80.204 Archdiocese of Atlanta, GA 20 0.067 23908 80.271 Diocese of Savannah, GA 21 0.071 23929 80.342 Diocese of Honolulu, HI 29 0.097 23958 80.439 Diocese of Boise, ID 18 0.060 23976 80.500 Archdiocese of Chicago, IL 256 0.860 24232 81.359 Diocese of Belleville, IL 37 0.124 24269 81.483 Diocese of Joliet, IL 67 0.225 24336 81.708 Diocese of Peoria, IL 51 0.171 24387 81.880 Diocese of Rockford, IL 47 0.158 24434 82.037 Diocese of Springfield, IL 53 0.178 24487 82.215 Archdiocese of Indianapolis, IN 70 0.235 24557 82.450 Diocese of Evansville, IN 27 0.091 24584 82.541 Diocese of Ft. Wayne‐South Bend, IN 44 0.148 24628 82.689 Diocese of Gary, IN 25 0.084 24653 82.773 Diocese of Lafayette, IN 21 0.071 24674 82.843 Archdiocese of Dubuque, IA 59 0.198 24733 83.041 Diocese of Davenport, IA 23 0.077 24756 83.118 Diocese of Des Moines, IA 16 0.054 24772 83.172 Diocese of Sioux City, IA 30 0.101 24802 83.273 Archdiocese of Kansas City, KS 45 0.151 24847 83.424 Diocese of Dodge City, KS 8 0.027 24855 83.451 Diocese of Salina, KS 16 0.054 24871 83.505 Diocese of Wichita, KS 36 0.121 24907 83.625 Archdiocese of Louisville, KY 51 0.171 24958 83.797 Diocese of Covington, KY 34 0.114 24992 83.911 Diocese of Lexington, KY 16 0.054 25008 83.965 Diocese of Owensboro, KY 18 0.060 25026 84.025 Archdiocese of New Orleans, LA 71 0.238 25097 84.263 Diocese of Alexandria, LA 9 0.030 25106 84.294 Diocese of Baton Rouge, LA 31 0.104 25137 84.398 Diocese of Houma‐Thibodaux, LA 12 0.040 25149 84.438 Diocese of Lafayette, LA 32 0.107 25181 84.545 Diocese of Lake Charles, LA 8 0.027 25189 84.572 Diocese of Shreveport, LA 7 0.024 25196 84.596 Diocese of Portland, ME 20 0.067 25216 84.663 Archdiocese of Baltimore, MD 89 0.299 25305 84.962 Archdiocese of Boston, MA 144 0.483 25449 85.445 Diocese of Fall River, MA 32 0.107 25481 85.553 Diocese of Springfield, MA 26 0.087 25507 85.640 Diocese of Worcester, MA 32 0.107 25539 85.747 Archdiocese of Detroit, MI 112 0.376 25651 86.123 Diocese of Grand Rapids, MI 39 0.131 25690 86.254 Diocese of Gaylord, MI 16 0.054 25706 86.308 Diocese of Kalamazoo, MI 21 0.071 25727 86.379 Diocese of Lansing, MI 45 0.151 25772 86.530 Diocese of Marquette, MI 11 0.037 25783 86.567 Diocese of Saginaw, MI 25 0.084 25808 86.651 Archdiocese of St. Paul‐Minneapolis, MN 105 0.353 25913 87.003 Diocese of Crookston, MN 10 0.034 25923 87.037 Diocese of Duluth, MN 9 0.030 25932 87.067 Diocese of New Ulm, MN 17 0.057 25949 87.124 Diocese of St. Cloud, MN 38 0.128 25987 87.252 Diocese of Winona, MN 27 0.091 26014 87.342 Diocese of Biloxi, MS 16 0.054 26030 87.396

I-62 2005–06 PSS Data File User’s Manual and Survey Documentation
Diocese or archdiocese for Catholic schools (Continued) Cumulative Cumulative diocese Frequency Percent Frequency Percent Diocese of Jackson, MS 16 0.054 26046 87.450 Archdiocese of St. Louis, MO 146 0.490 26192 87.940 Diocese of Jefferson City, MO 38 0.128 26230 88.067 Diocese of Kansas City‐St. Joseph, MO 38 0.128 26268 88.195 Diocese of Springfield‐Cape Girardeau, MO 26 0.087 26294 88.282 Diocese of Great Falls‐Billings, MT 14 0.047 26308 88.329 Diocese of Helena, MT 7 0.024 26315 88.353 Archdiocese of Omaha, NE 71 0.238 26386 88.591 Diocese of Grand Island, NE 9 0.030 26395 88.621 Diocese of Lincoln, NE 31 0.104 26426 88.725 Diocese of Las Vegas, NV 9 0.030 26435 88.756 Diocese of Reno, NV 7 0.024 26442 88.779 Diocese of Manchester, NH 38 0.128 26480 88.907 Archdiocese of Newark, NJ 145 0.487 26625 89.394 Diocese of Camden, NJ 59 0.198 26684 89.592 Diocese of Metuchen, NJ 47 0.158 26731 89.750 Diocese of Paterson, NJ 66 0.222 26797 89.971 Diocese of Trenton, NJ 53 0.178 26850 90.149 Archdiocese of Santa Fe, NM 19 0.064 26869 90.213 Diocese of Gallup, NM 11 0.037 26880 90.250 Diocese of Las Cruces, NM 5 0.017 26885 90.267 Archdiocese of New York, NY 259 0.870 27144 91.136 Diocese of Albany, NY 37 0.124 27181 91.260 Diocese of Brooklyn, NY 140 0.470 27321 91.730 Diocese of Buffalo, NY 88 0.295 27409 92.026 Diocese of Ogdensburg, NY 15 0.050 27424 92.076 Diocese of Rochester, NY 49 0.165 27473 92.241 Diocese of Rockville Centre, NY 70 0.235 27543 92.476 Diocese of Syracuse, NY 35 0.118 27578 92.593 Diocese of Charlotte, NC 19 0.064 27597 92.657 Diocese of Raleigh, NC 23 0.077 27620 92.734 Diocese of Bismarck, ND 14 0.047 27634 92.781 Diocese of Fargo, ND 12 0.040 27646 92.822 Archdiocese of Cincinnati, OH 123 0.413 27769 93.235 Diocese of Cleveland, OH 128 0.430 27897 93.664 Diocese of Columbus, OH 54 0.181 27951 93.846 Diocese of Steubenville, OH 18 0.060 27969 93.906 Diocese of Toledo, OH 89 0.299 28058 94.205 Diocese of Youngstown, OH 43 0.144 28101 94.349 Archdiocese of Oklahoma City, OK 22 0.074 28123 94.423 Diocese of Tulsa, OK 12 0.040 28135 94.463 Archdiocese of Portland, OR 53 0.178 28188 94.641 Diocese of Baker, OR 1 0.003 28189 94.645 Archdiocese of Philadelphia, PA 238 0.799 28427 95.444 Diocese of Allentown, PA 63 0.212 28490 95.655 Diocese of Altoona‐Johnstown, PA 29 0.097 28519 95.753 Diocese of Erie, PA 38 0.128 28557 95.880 Diocese of Greensburg, PA 20 0.067 28577 95.947 Diocese of Harrisburg, PA 46 0.154 28623 96.102 Diocese of Pittsburgh, PA 92 0.309 28715 96.411 Diocese of Scranton, PA 46 0.154 28761 96.565 Diocese of Providence, RI 54 0.181 28815 96.747 Diocese of Charleston, SC 28 0.094 28843 96.841 Diocese of Rapid City, SD 6 0.020 28849 96.861 Diocese of Sioux Falls, SD 25 0.084 28874 96.945 Diocese of Knoxville, TN 9 0.030 28883 96.975 Diocese of Memphis, TN 27 0.091 28910 97.066 Diocese of Nashville, TN 21 0.071 28931 97.136 Archdiocese of San Antonio, TX 45 0.151 28976 97.287 Diocese of Amarillo, TX 7 0.024 28983 97.311 Diocese of Austin, TX 20 0.067 29003 97.378 Diocese of Beaumont, TX 6 0.020 29009 97.398 Diocese of Brownsville, TX 11 0.037 29020 97.435

Appendix I. Public-Use Codebook: Descriptive Statistics for Categorical Variables—Unweighted I-63
Diocese or archdiocese for Catholic schools (Continued) Cumulative Cumulative diocese Frequency Percent Frequency Percent Diocese of Corpus Christi, TX 15 0.050 29035 97.485 Diocese of Dallas, TX 37 0.124 29072 97.609 Diocese of El Paso, TX 11 0.037 29083 97.646 Diocese of Ft. Worth, TX 19 0.064 29102 97.710 Diocese of Galveston‐Houston, TX 62 0.208 29164 97.918 Diocese of Lubbock, TX 2 0.007 29166 97.925 Diocese of San Angelo, TX 2 0.007 29168 97.932 Diocese of Tyler, TX 4 0.013 29172 97.945 Diocese of Victoria, TX 14 0.047 29186 97.992 Diocese of Laredo, TX 7 0.024 29193 98.016 Diocese of Salt Lake, UT 15 0.050 29208 98.066 Diocese of Burlington, VT 16 0.054 29224 98.120 Diocese of Arlington, VA 48 0.161 29272 98.281 Diocese of Richmond, VA 30 0.101 29302 98.382 Archdiocese of Seattle, WA 68 0.228 29370 98.610 Diocese of Spokane, WA 17 0.057 29387 98.667 Diocese of Yakima, WA 7 0.024 29394 98.691 Diocese of Wheeling‐Charleston, WV 34 0.114 29428 98.805 Archdiocese of Milwaukee, WI 141 0.473 29569 99.278 Diocese of Green Bay, WI 73 0.245 29642 99.523 Diocese of La Crosse, WI 72 0.242 29714 99.765 Diocese of Madison, WI 48 0.161 29762 99.926 Diocese of Superior, WI 16 0.054 29778 99.980 Diocese of Cheyenne, WY 6 0.020 29784 100.000 Level of Instruction Cumulative Cumulative level Frequency Percent Frequency Percent Elementary 19825 66.563 19825 66.563 Secondary 2497 8.384 22322 74.946 Combined 7462 25.054 29784 100.000 Size of school (K‐12, UG) Cumulative Cumulative size Frequency Percent Frequency Percent Less than 50 students 11995 40.273 11995 40.273 50‐149 students 7494 25.161 19489 65.434 150‐299 students 5726 19.225 25215 84.660 300‐499 students 2616 8.783 27831 93.443 500‐749 students 1206 4.049 29037 97.492 750 students or more 747 2.508 29784 100.000 Percent minority students (K‐12, UG) Cumulative Cumulative perminor Frequency Percent Frequency Percent None 4106 13.786 4106 13.786 1 ‐ 9 percent 7838 26.316 11944 40.102 10 ‐ 29 percent 7813 26.232 19757 66.334 30 ‐ 49 percent 3390 11.382 23147 77.716 50 percent or more 6637 22.284 29784 100.000

I-64 2005–06 PSS Data File User’s Manual and Survey Documentation
Community type Cumulative Cumulative commtype Frequency Percent Frequency Percent Principal city 10299 34.579 10299 34.579 Urban fringe, large town 12950 43.480 23249 78.059 Rural or small town 6535 21.941 29784 100.000 Community type 2 Cumulative Cumulative commtyp2 Frequency Percent Frequency Percent Principal city 10299 34.579 10299 34.579 Urban fringe, large town, rural‐inside CBSA 15508 52.068 25807 86.647 Rural‐outside CBSA or small town 3977 13.353 29784 100.000 Urban‐centric community type (NCES assigned) Cumulative Cumulative ucommtyp Frequency Percent Frequency Percent City 10438 35.046 10438 35.046 Suburb 11031 37.037 21469 72.082 Town 2884 9.683 24353 81.765 Rural 5431 18.235 29784 100.000 Imputation Flag For P135 Cumulative Cumulative f_p135 Frequency Percent Frequency Percent Not imputed (original data) 28809 96.726 28809 96.726 Imputed by using other variables 972 3.263 29781 99.990 Imputed by using a donor value 1 0.003 29782 99.993 Clerical imputation 2 0.007 29784 100.000 Imputation Flag For P140 Cumulative Cumulative f_p140 Frequency Percent Frequency Percent Not imputed (original data) 28769 96.592 28769 96.592 Imputed by using other variables 1012 3.398 29781 99.990 Imputed by using a donor value 1 0.003 29782 99.993 Clerical imputation 2 0.007 29784 100.000 Imputation Flag For P145 Cumulative Cumulative f_p145 Frequency Percent Frequency Percent Not imputed (original data) 29207 98.063 29207 98.063 Imputed by using other variables 568 1.907 29775 99.970 Imputed by using a donor value 1 0.003 29776 99.973 Clerical imputation 8 0.027 29784 100.000 Imputation Flag For P150 Cumulative Cumulative f_p150 Frequency Percent Frequency Percent Not imputed (original data) 28735 96.478 28735 96.478 Imputed by using other variables 988 3.317 29723 99.795 Imputed by using a donor value 54 0.181 29777 99.976 Clerical imputation 7 0.024 29784 100.000

Appendix I. Public-Use Codebook: Descriptive Statistics for Categorical Variables—Unweighted I-65
Imputation Flag For P155 Cumulative Cumulative f_p155 Frequency Percent Frequency Percent Not imputed (original data) 29453 98.889 29453 98.889 Imputed by using other variables 323 1.084 29776 99.973 Imputed by using a donor value 1 0.003 29777 99.976 Clerical imputation 7 0.024 29784 100.000 Imputation Flag For P160 Cumulative Cumulative f_p160 Frequency Percent Frequency Percent Not imputed (original data) 28726 96.448 28726 96.448 Imputed by using other variables 957 3.213 29683 99.661 Imputed by using a donor value 93 0.312 29776 99.973 Clerical imputation 8 0.027 29784 100.000 Imputation Flag For P165 Cumulative Cumulative f_p165 Frequency Percent Frequency Percent Not imputed (original data) 28783 96.639 28783 96.639 Imputed by using other variables 995 3.341 29778 99.980 Imputed by using a donor value 1 0.003 29779 99.983 Clerical imputation 5 0.017 29784 100.000 Imputation Flag For P170 Cumulative Cumulative f_p170 Frequency Percent Frequency Percent Not imputed (original data) 28758 96.555 28758 96.555 Imputed by using other variables 1021 3.428 29779 99.983 Imputed by using a donor value 2 0.007 29781 99.990 Clerical imputation 3 0.010 29784 100.000 Imputation Flag For P175 Cumulative Cumulative f_p175 Frequency Percent Frequency Percent Not imputed (original data) 28781 96.632 28781 96.632 Imputed by using other variables 998 3.351 29779 99.983 Imputed by using a donor value 1 0.003 29780 99.987 Clerical imputation 4 0.013 29784 100.000 Imputation Flag For P180 Cumulative Cumulative f_p180 Frequency Percent Frequency Percent Not imputed (original data) 28769 96.592 28769 96.592 Imputed by using other variables 1013 3.401 29782 99.993 Imputed by using a donor value 2 0.007 29784 100.000 Imputation Flag For P185 Cumulative Cumulative f_p185 Frequency Percent Frequency Percent Not imputed (original data) 29482 98.986 29482 98.986 Imputed by using other variables 294 0.987 29776 99.973 Imputed by using a donor value 1 0.003 29777 99.976 Clerical imputation 7 0.024 29784 100.000

I-66 2005–06 PSS Data File User’s Manual and Survey Documentation
Imputation Flag For P190 Cumulative Cumulative f_p190 Frequency Percent Frequency Percent Not imputed (original data) 28743 96.505 28743 96.505 Imputed by using other variables 948 3.183 29691 99.688 Imputed by using a donor value 87 0.292 29778 99.980 Clerical imputation 6 0.020 29784 100.000 Imputation Flag For P195 Cumulative Cumulative f_p195 Frequency Percent Frequency Percent Not imputed (original data) 29493 99.023 29493 99.023 Imputed by using other variables 285 0.957 29778 99.980 Imputed by using a donor value 1 0.003 29779 99.983 Clerical imputation 5 0.017 29784 100.000 Imputation Flag For P200 Cumulative Cumulative f_p200 Frequency Percent Frequency Percent Not imputed (original data) 28735 96.478 28735 96.478 Imputed by using other variables 956 3.210 29691 99.688 Imputed by using a donor value 88 0.295 29779 99.983 Clerical imputation 5 0.017 29784 100.000 Imputation Flag For P205 Cumulative Cumulative f_p205 Frequency Percent Frequency Percent Not imputed (original data) 29498 99.040 29498 99.040 Imputed by using other variables 280 0.940 29778 99.980 Imputed by using a donor value 1 0.003 29779 99.983 Clerical imputation 5 0.017 29784 100.000 Imputation Flag For P210 Cumulative Cumulative f_p210 Frequency Percent Frequency Percent Not imputed (original data) 28728 96.454 28728 96.454 Imputed by using other variables 960 3.223 29688 99.678 Imputed by using a donor value 91 0.306 29779 99.983 Clerical imputation 5 0.017 29784 100.000 Imputation Flag For P215 Cumulative Cumulative f_p215 Frequency Percent Frequency Percent Not imputed (original data) 29495 99.030 29495 99.030 Imputed by using other variables 283 0.950 29778 99.980 Imputed by using a donor value 1 0.003 29779 99.983 Clerical imputation 5 0.017 29784 100.000 Imputation Flag For P220 Cumulative Cumulative f_p220 Frequency Percent Frequency Percent Not imputed (original data) 28726 96.448 28726 96.448 Imputed by using other variables 964 3.237 29690 99.684 Imputed by using a donor value 90 0.302 29780 99.987 Clerical imputation 4 0.013 29784 100.000

Appendix I. Public-Use Codebook: Descriptive Statistics for Categorical Variables—Unweighted I-67
Imputation Flag For P225 Cumulative Cumulative f_p225 Frequency Percent Frequency Percent Not imputed (original data) 29494 99.026 29494 99.026 Imputed by using other variables 285 0.957 29779 99.983 Imputed by using a donor value 1 0.003 29780 99.987 Clerical imputation 4 0.013 29784 100.000 Imputation Flag For P230 Cumulative Cumulative f_p230 Frequency Percent Frequency Percent Not imputed (original data) 28722 96.434 28722 96.434 Imputed by using other variables 969 3.253 29691 99.688 Imputed by using a donor value 89 0.299 29780 99.987 Clerical imputation 4 0.013 29784 100.000 Imputation Flag For P235 Cumulative Cumulative f_p235 Frequency Percent Frequency Percent Not imputed (original data) 29502 99.053 29502 99.053 Imputed by using other variables 275 0.923 29777 99.976 Imputed by using a donor value 1 0.003 29778 99.980 Clerical imputation 6 0.020 29784 100.000 Imputation Flag For P240 Cumulative Cumulative f_p240 Frequency Percent Frequency Percent Not imputed (original data) 28721 96.431 28721 96.431 Imputed by using other variables 968 3.250 29689 99.681 Imputed by using a donor value 92 0.309 29781 99.990 Clerical imputation 3 0.010 29784 100.000 Imputation Flag For P245 Cumulative Cumulative f_p245 Frequency Percent Frequency Percent Not imputed (original data) 29474 98.959 29474 98.959 Imputed by using other variables 304 1.021 29778 99.980 Imputed by using a donor value 1 0.003 29779 99.983 Clerical imputation 5 0.017 29784 100.000 Imputation Flag For P250 Cumulative Cumulative f_p250 Frequency Percent Frequency Percent Not imputed (original data) 28723 96.438 28723 96.438 Imputed by using other variables 974 3.270 29697 99.708 Imputed by using a donor value 83 0.279 29780 99.987 Clerical imputation 4 0.013 29784 100.000 Imputation Flag For P255 Cumulative Cumulative f_p255 Frequency Percent Frequency Percent Not imputed (original data) 29474 98.959 29474 98.959 Imputed by using other variables 303 1.017 29777 99.976 Imputed by using a donor value 1 0.003 29778 99.980 Clerical imputation 6 0.020 29784 100.000

I-68 2005–06 PSS Data File User’s Manual and Survey Documentation
Imputation Flag For P260 Cumulative Cumulative f_p260 Frequency Percent Frequency Percent Not imputed (original data) 28725 96.444 28725 96.444 Imputed by using other variables 974 3.270 29699 99.715 Imputed by using a donor value 82 0.275 29781 99.990 Clerical imputation 3 0.010 29784 100.000 Imputation Flag For P265 Cumulative Cumulative f_p265 Frequency Percent Frequency Percent Not imputed (original data) 29295 98.358 29295 98.358 Imputed by using other variables 485 1.628 29780 99.987 Imputed by using a donor value 1 0.003 29781 99.990 Clerical imputation 3 0.010 29784 100.000 Imputation Flag For P270 Cumulative Cumulative f_p270 Frequency Percent Frequency Percent Not imputed (original data) 28744 96.508 28744 96.508 Imputed by using other variables 958 3.216 29702 99.725 Imputed by using a donor value 79 0.265 29781 99.990 Clerical imputation 3 0.010 29784 100.000 Imputation Flag For P275 Cumulative Cumulative f_p275 Frequency Percent Frequency Percent Not imputed (original data) 29271 98.278 29271 98.278 Imputed by using other variables 508 1.706 29779 99.983 Imputed by using a donor value 1 0.003 29780 99.987 Clerical imputation 4 0.013 29784 100.000 Imputation Flag For P280 Cumulative Cumulative f_p280 Frequency Percent Frequency Percent Not imputed (original data) 28739 96.491 28739 96.491 Imputed by using other variables 973 3.267 29712 99.758 Imputed by using a donor value 69 0.232 29781 99.990 Clerical imputation 3 0.010 29784 100.000 Imputation Flag For P285 Cumulative Cumulative f_p285 Frequency Percent Frequency Percent Not imputed (original data) 29260 98.241 29260 98.241 Imputed by using other variables 518 1.739 29778 99.980 Imputed by using a donor value 1 0.003 29779 99.983 Clerical imputation 5 0.017 29784 100.000 Imputation Flag For P290 Cumulative Cumulative f_p290 Frequency Percent Frequency Percent Not imputed (original data) 28741 96.498 28741 96.498 Imputed by using other variables 969 3.253 29710 99.752 Imputed by using a donor value 72 0.242 29782 99.993 Clerical imputation 2 0.007 29784 100.000

Appendix I. Public-Use Codebook: Descriptive Statistics for Categorical Variables—Unweighted I-69
Imputation Flag For P295 Cumulative Cumulative f_p295 Frequency Percent Frequency Percent Not imputed (original data) 29250 98.207 29250 98.207 Imputed by using other variables 528 1.773 29778 99.980 Imputed by using a donor value 1 0.003 29779 99.983 Clerical imputation 5 0.017 29784 100.000 Imputation Flag For P300 Cumulative Cumulative f_p300 Frequency Percent Frequency Percent Not imputed (original data) 28745 96.512 28745 96.512 Imputed by using other variables 965 3.240 29710 99.752 Imputed by using a donor value 71 0.238 29781 99.990 Clerical imputation 3 0.010 29784 100.000 Imputation Flag For P305 Cumulative Cumulative f_p305 Frequency Percent Frequency Percent Not imputed (original data) 29381 98.647 29381 98.647 Imputed by using other variables 368 1.236 29749 99.882 Clerical imputation 35 0.118 29784 100.000 Imputation Flag For P310 Cumulative Cumulative f_p310 Frequency Percent Frequency Percent Not imputed (original data) 21258 71.374 21258 71.374 Ratio adjustment of original data 4286 14.390 25544 85.764 Imputed by using other variables 3224 10.825 28768 96.589 Imputed by using a donor value 394 1.323 29162 97.912 Clerical imputation 622 2.088 29784 100.000 Imputation Flag For P315 Cumulative Cumulative f_p315 Frequency Percent Frequency Percent Not imputed (original data) 18894 63.437 18894 63.437 Ratio adjustment of original data 7529 25.279 26423 88.715 Imputed by using other variables 2332 7.830 28755 96.545 Imputed by using a donor value 400 1.343 29155 97.888 Clerical imputation 629 2.112 29784 100.000 Imputation Flag For P320 Cumulative Cumulative f_p320 Frequency Percent Frequency Percent Not imputed (original data) 16744 56.218 16744 56.218 Ratio adjustment of original data 9905 33.256 26649 89.474 Imputed by using other variables 2138 7.178 28787 96.653 Imputed by using a donor value 384 1.289 29171 97.942 Clerical imputation 613 2.058 29784 100.000
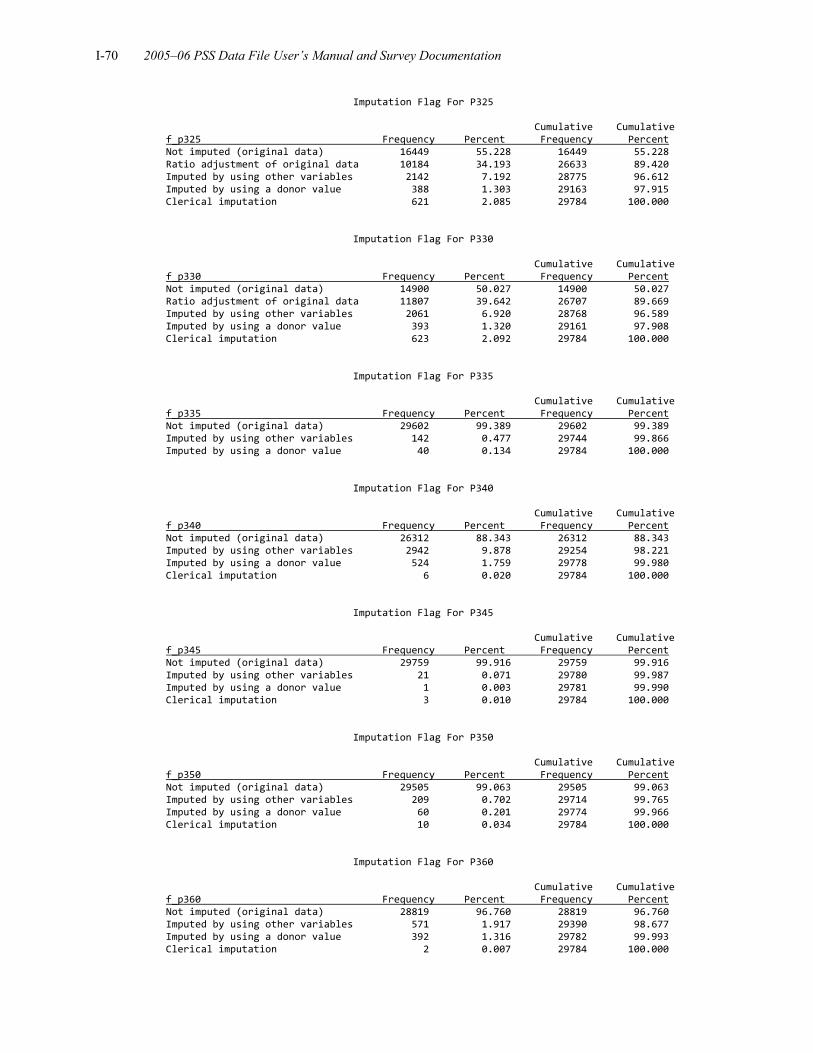
I-70 2005–06 PSS Data File User’s Manual and Survey Documentation
Imputation Flag For P325 Cumulative Cumulative f_p325 Frequency Percent Frequency Percent Not imputed (original data) 16449 55.228 16449 55.228 Ratio adjustment of original data 10184 34.193 26633 89.420 Imputed by using other variables 2142 7.192 28775 96.612 Imputed by using a donor value 388 1.303 29163 97.915 Clerical imputation 621 2.085 29784 100.000 Imputation Flag For P330 Cumulative Cumulative f_p330 Frequency Percent Frequency Percent Not imputed (original data) 14900 50.027 14900 50.027 Ratio adjustment of original data 11807 39.642 26707 89.669 Imputed by using other variables 2061 6.920 28768 96.589 Imputed by using a donor value 393 1.320 29161 97.908 Clerical imputation 623 2.092 29784 100.000 Imputation Flag For P335 Cumulative Cumulative f_p335 Frequency Percent Frequency Percent Not imputed (original data) 29602 99.389 29602 99.389 Imputed by using other variables 142 0.477 29744 99.866 Imputed by using a donor value 40 0.134 29784 100.000 Imputation Flag For P340 Cumulative Cumulative f_p340 Frequency Percent Frequency Percent Not imputed (original data) 26312 88.343 26312 88.343 Imputed by using other variables 2942 9.878 29254 98.221 Imputed by using a donor value 524 1.759 29778 99.980 Clerical imputation 6 0.020 29784 100.000 Imputation Flag For P345 Cumulative Cumulative f_p345 Frequency Percent Frequency Percent Not imputed (original data) 29759 99.916 29759 99.916 Imputed by using other variables 21 0.071 29780 99.987 Imputed by using a donor value 1 0.003 29781 99.990 Clerical imputation 3 0.010 29784 100.000 Imputation Flag For P350 Cumulative Cumulative f_p350 Frequency Percent Frequency Percent Not imputed (original data) 29505 99.063 29505 99.063 Imputed by using other variables 209 0.702 29714 99.765 Imputed by using a donor value 60 0.201 29774 99.966 Clerical imputation 10 0.034 29784 100.000 Imputation Flag For P360 Cumulative Cumulative f_p360 Frequency Percent Frequency Percent Not imputed (original data) 28819 96.760 28819 96.760 Imputed by using other variables 571 1.917 29390 98.677 Imputed by using a donor value 392 1.316 29782 99.993 Clerical imputation 2 0.007 29784 100.000

Appendix I. Public-Use Codebook: Descriptive Statistics for Categorical Variables—Unweighted I-71
Imputation Flag For P361 Cumulative Cumulative f_p361 Frequency Percent Frequency Percent Not imputed (original data) 28585 95.974 28585 95.974 Imputed by using other variables 794 2.666 29379 98.640 Imputed by using a donor value 403 1.353 29782 99.993 Clerical imputation 2 0.007 29784 100.000 Imputation Flag For P365 Cumulative Cumulative f_p365 Frequency Percent Frequency Percent Not imputed (original data) 29352 98.550 29352 98.550 Imputed by using other variables 240 0.806 29592 99.355 Imputed by using a donor value 49 0.165 29641 99.520 Clerical imputation 143 0.480 29784 100.000 Imputation Flag For P370 Cumulative Cumulative f_p370 Frequency Percent Frequency Percent Not imputed (original data) 29284 98.321 29284 98.321 Imputed by using other variables 388 1.303 29672 99.624 Imputed by using a donor value 111 0.373 29783 99.997 Clerical imputation 1 0.003 29784 100.000 Imputation Flag For P385 Cumulative Cumulative f_p385 Frequency Percent Frequency Percent Not imputed (original data) 29319 98.439 29319 98.439 Imputed by using other variables 374 1.256 29693 99.694 Imputed by using a donor value 90 0.302 29783 99.997 Clerical imputation 1 0.003 29784 100.000 Imputation Flag For P390 Cumulative Cumulative f_p390 Frequency Percent Frequency Percent Not imputed (original data) 28663 96.236 28663 96.236 Imputed by using other variables 1020 3.425 29683 99.661 Imputed by using a donor value 100 0.336 29783 99.997 Clerical imputation 1 0.003 29784 100.000 Imputation Flag For P395 Cumulative Cumulative f_p395 Frequency Percent Frequency Percent Not imputed (original data) 28754 96.542 28754 96.542 Imputed by using other variables 928 3.116 29682 99.658 Imputed by using a donor value 101 0.339 29783 99.997 Clerical imputation 1 0.003 29784 100.000 Imputation Flag For P400 Cumulative Cumulative f_p400 Frequency Percent Frequency Percent Not imputed (original data) 28609 96.055 28609 96.055 Imputed by using other variables 1071 3.596 29680 99.651 Imputed by using a donor value 103 0.346 29783 99.997 Clerical imputation 1 0.003 29784 100.000
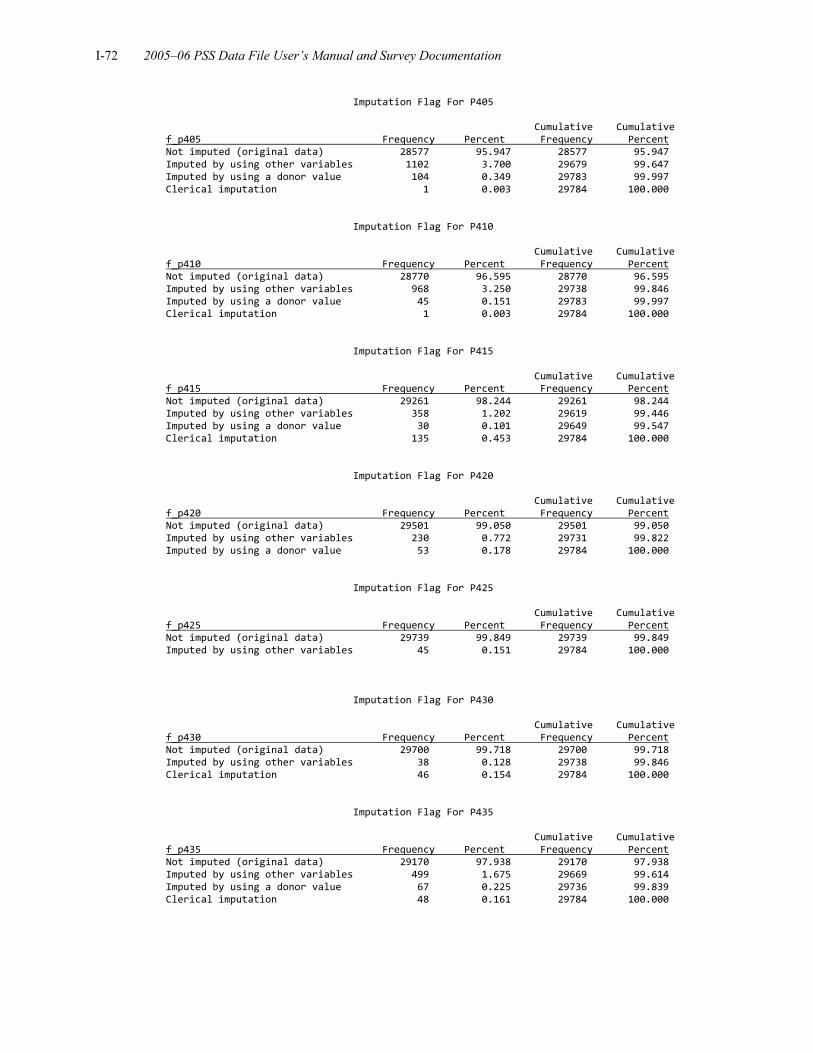
I-72 2005–06 PSS Data File User’s Manual and Survey Documentation
Imputation Flag For P405 Cumulative Cumulative f_p405 Frequency Percent Frequency Percent Not imputed (original data) 28577 95.947 28577 95.947 Imputed by using other variables 1102 3.700 29679 99.647 Imputed by using a donor value 104 0.349 29783 99.997 Clerical imputation 1 0.003 29784 100.000 Imputation Flag For P410 Cumulative Cumulative f_p410 Frequency Percent Frequency Percent Not imputed (original data) 28770 96.595 28770 96.595 Imputed by using other variables 968 3.250 29738 99.846 Imputed by using a donor value 45 0.151 29783 99.997 Clerical imputation 1 0.003 29784 100.000 Imputation Flag For P415 Cumulative Cumulative f_p415 Frequency Percent Frequency Percent Not imputed (original data) 29261 98.244 29261 98.244 Imputed by using other variables 358 1.202 29619 99.446 Imputed by using a donor value 30 0.101 29649 99.547 Clerical imputation 135 0.453 29784 100.000 Imputation Flag For P420 Cumulative Cumulative f_p420 Frequency Percent Frequency Percent Not imputed (original data) 29501 99.050 29501 99.050 Imputed by using other variables 230 0.772 29731 99.822 Imputed by using a donor value 53 0.178 29784 100.000 Imputation Flag For P425 Cumulative Cumulative f_p425 Frequency Percent Frequency Percent Not imputed (original data) 29739 99.849 29739 99.849 Imputed by using other variables 45 0.151 29784 100.000 Imputation Flag For P430 Cumulative Cumulative f_p430 Frequency Percent Frequency Percent Not imputed (original data) 29700 99.718 29700 99.718 Imputed by using other variables 38 0.128 29738 99.846 Clerical imputation 46 0.154 29784 100.000 Imputation Flag For P435 Cumulative Cumulative f_p435 Frequency Percent Frequency Percent Not imputed (original data) 29170 97.938 29170 97.938 Imputed by using other variables 499 1.675 29669 99.614 Imputed by using a donor value 67 0.225 29736 99.839 Clerical imputation 48 0.161 29784 100.000

Appendix I. Public-Use Codebook: Descriptive Statistics for Categorical Variables—Unweighted I-73
Imputation Flag For P440 Cumulative Cumulative f_p440 Frequency Percent Frequency Percent Not imputed (original data) 29566 99.268 29566 99.268 Imputed by using other variables 158 0.530 29724 99.799 Clerical imputation 60 0.201 29784 100.000 Imputation Flag For P445 Cumulative Cumulative f_p445 Frequency Percent Frequency Percent Not imputed (original data) 29434 98.825 29434 98.825 Imputed by using other variables 302 1.014 29736 99.839 Imputed by using a donor value 18 0.060 29754 99.899 Clerical imputation 30 0.101 29784 100.000 Imputation Flag For P450 Cumulative Cumulative f_p450 Frequency Percent Frequency Percent Not imputed (original data) 25519 85.680 25519 85.680 Imputed by using other variables 4264 14.316 29783 99.997 Clerical imputation 1 0.003 29784 100.000 Imputation Flag For P455 Cumulative Cumulative f_p455 Frequency Percent Frequency Percent Not imputed (original data) 25520 85.684 25520 85.684 Imputed by using other variables 4264 14.316 29784 100.000 Imputation Flag For P460 Cumulative Cumulative f_p460 Frequency Percent Frequency Percent Not imputed (original data) 25520 85.684 25520 85.684 Imputed by using other variables 4264 14.316 29784 100.000 Imputation Flag For P465 Cumulative Cumulative f_p465 Frequency Percent Frequency Percent Not imputed (original data) 25520 85.684 25520 85.684 Imputed by using other variables 4264 14.316 29784 100.000 Imputation Flag For P467 Cumulative Cumulative f_p467 Frequency Percent Frequency Percent Not imputed (original data) 25520 85.684 25520 85.684 Imputed by using other variables 4264 14.316 29784 100.000 Imputation Flag For P468 Cumulative Cumulative f_p468 Frequency Percent Frequency Percent Not imputed (original data) 25520 85.684 25520 85.684 Imputed by using other variables 4264 14.316 29784 100.000
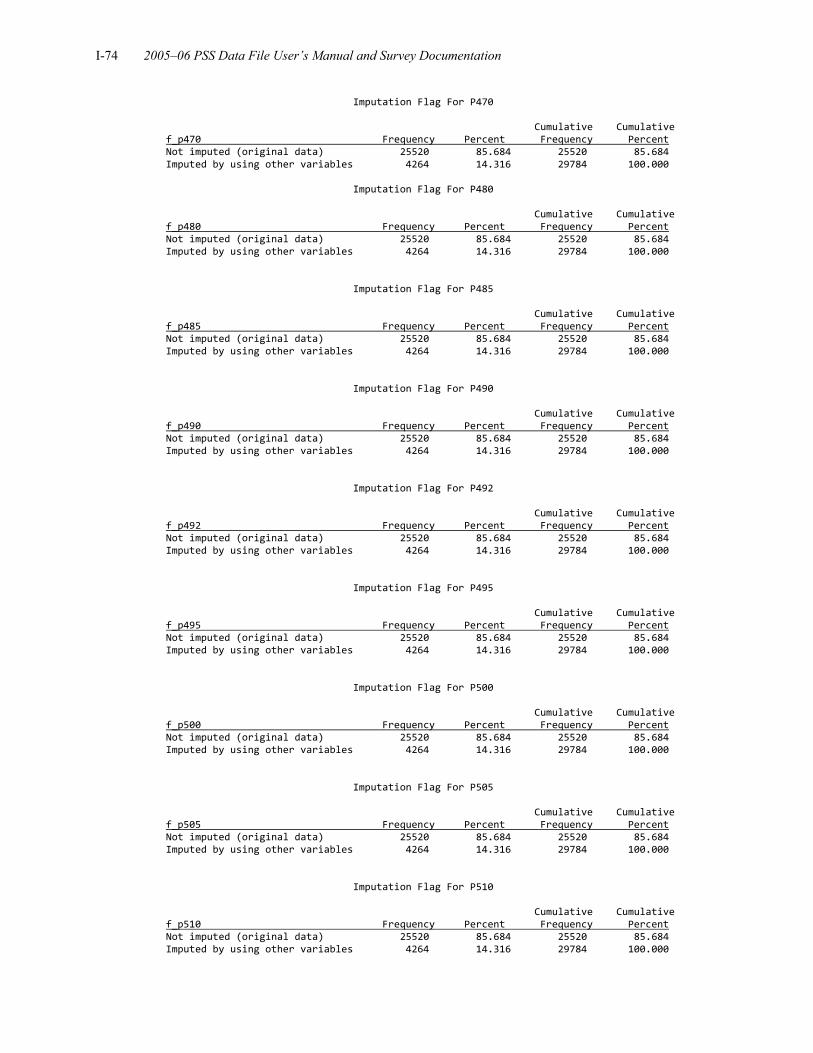
I-74 2005–06 PSS Data File User’s Manual and Survey Documentation
Imputation Flag For P470 Cumulative Cumulative f_p470 Frequency Percent Frequency Percent Not imputed (original data) 25520 85.684 25520 85.684 Imputed by using other variables 4264 14.316 29784 100.000 Imputation Flag For P480 Cumulative Cumulative f_p480 Frequency Percent Frequency Percent Not imputed (original data) 25520 85.684 25520 85.684 Imputed by using other variables 4264 14.316 29784 100.000 Imputation Flag For P485 Cumulative Cumulative f_p485 Frequency Percent Frequency Percent Not imputed (original data) 25520 85.684 25520 85.684 Imputed by using other variables 4264 14.316 29784 100.000 Imputation Flag For P490 Cumulative Cumulative f_p490 Frequency Percent Frequency Percent Not imputed (original data) 25520 85.684 25520 85.684 Imputed by using other variables 4264 14.316 29784 100.000 Imputation Flag For P492 Cumulative Cumulative f_p492 Frequency Percent Frequency Percent Not imputed (original data) 25520 85.684 25520 85.684 Imputed by using other variables 4264 14.316 29784 100.000 Imputation Flag For P495 Cumulative Cumulative f_p495 Frequency Percent Frequency Percent Not imputed (original data) 25520 85.684 25520 85.684 Imputed by using other variables 4264 14.316 29784 100.000 Imputation Flag For P500 Cumulative Cumulative f_p500 Frequency Percent Frequency Percent Not imputed (original data) 25520 85.684 25520 85.684 Imputed by using other variables 4264 14.316 29784 100.000 Imputation Flag For P505 Cumulative Cumulative f_p505 Frequency Percent Frequency Percent Not imputed (original data) 25520 85.684 25520 85.684 Imputed by using other variables 4264 14.316 29784 100.000 Imputation Flag For P510 Cumulative Cumulative f_p510 Frequency Percent Frequency Percent Not imputed (original data) 25520 85.684 25520 85.684 Imputed by using other variables 4264 14.316 29784 100.000

Appendix I. Public-Use Codebook: Descriptive Statistics for Categorical Variables—Unweighted I-75
Imputation Flag For P515 Cumulative Cumulative f_p515 Frequency Percent Frequency Percent Not imputed (original data) 25520 85.684 25520 85.684 Imputed by using other variables 4264 14.316 29784 100.000 Imputation Flag For P520 Cumulative Cumulative f_p520 Frequency Percent Frequency Percent Not imputed (original data) 25520 85.684 25520 85.684 Imputed by using other variables 4264 14.316 29784 100.000 Imputation Flag For P525 Cumulative Cumulative f_p525 Frequency Percent Frequency Percent Not imputed (original data) 25520 85.684 25520 85.684 Imputed by using other variables 4264 14.316 29784 100.000 Imputation Flag For P530 Cumulative Cumulative f_p530 Frequency Percent Frequency Percent Not imputed (original data) 25520 85.684 25520 85.684 Imputed by using other variables 4264 14.316 29784 100.000 Imputation Flag For P535 Cumulative Cumulative f_p535 Frequency Percent Frequency Percent Not imputed (original data) 25520 85.684 25520 85.684 Imputed by using other variables 4264 14.316 29784 100.000 Imputation Flag For P540 Cumulative Cumulative f_p540 Frequency Percent Frequency Percent Not imputed (original data) 25520 85.684 25520 85.684 Imputed by using other variables 4264 14.316 29784 100.000 Imputation Flag For P542 Cumulative Cumulative f_p542 Frequency Percent Frequency Percent Not imputed (original data) 25520 85.684 25520 85.684 Imputed by using other variables 4264 14.316 29784 100.000 Imputation Flag For P545 Cumulative Cumulative f_p545 Frequency Percent Frequency Percent Not imputed (original data) 25520 85.684 25520 85.684 Imputed by using other variables 4264 14.316 29784 100.000

I-76 2005–06 PSS Data File User’s Manual and Survey Documentation
Imputation Flag For P550 Cumulative Cumulative f_p550 Frequency Percent Frequency Percent Not imputed (original data) 25520 85.684 25520 85.684 Imputed by using other variables 4264 14.316 29784 100.000 Imputation Flag For P555 Cumulative Cumulative f_p555 Frequency Percent Frequency Percent Not imputed (original data) 25520 85.684 25520 85.684 Imputed by using other variables 4264 14.316 29784 100.000 Imputation Flag For P560 Cumulative Cumulative f_p560 Frequency Percent Frequency Percent Not imputed (original data) 25520 85.684 25520 85.684 Imputed by using other variables 4264 14.316 29784 100.000 Imputation Flag For P565 Cumulative Cumulative f_p565 Frequency Percent Frequency Percent Not imputed (original data) 25520 85.684 25520 85.684 Imputed by using other variables 4264 14.316 29784 100.000 Imputation Flag For P570 Cumulative Cumulative f_p570 Frequency Percent Frequency Percent Not imputed (original data) 25520 85.684 25520 85.684 Imputed by using other variables 4264 14.316 29784 100.000 Imputation Flag For P575 Cumulative Cumulative f_p575 Frequency Percent Frequency Percent Not imputed (original data) 25520 85.684 25520 85.684 Imputed by using other variables 4264 14.316 29784 100.000 Imputation Flag For P580 Cumulative Cumulative f_p580 Frequency Percent Frequency Percent Not imputed (original data) 25520 85.684 25520 85.684 Imputed by using other variables 4264 14.316 29784 100.000 Imputation Flag For P585 Cumulative Cumulative f_p585 Frequency Percent Frequency Percent Not imputed (original data) 25522 85.690 25522 85.690 Imputed by using other variables 4262 14.310 29784 100.000
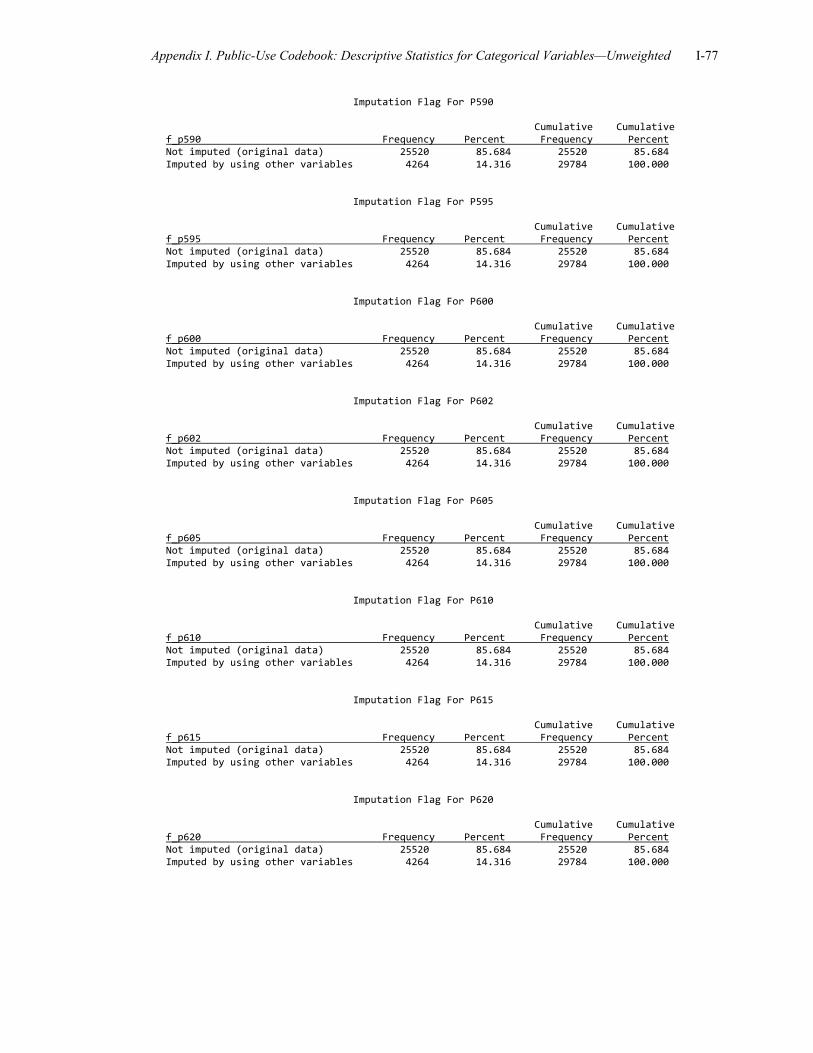
Appendix I. Public-Use Codebook: Descriptive Statistics for Categorical Variables—Unweighted I-77
Imputation Flag For P590 Cumulative Cumulative f_p590 Frequency Percent Frequency Percent Not imputed (original data) 25520 85.684 25520 85.684 Imputed by using other variables 4264 14.316 29784 100.000 Imputation Flag For P595 Cumulative Cumulative f_p595 Frequency Percent Frequency Percent Not imputed (original data) 25520 85.684 25520 85.684 Imputed by using other variables 4264 14.316 29784 100.000 Imputation Flag For P600 Cumulative Cumulative f_p600 Frequency Percent Frequency Percent Not imputed (original data) 25520 85.684 25520 85.684 Imputed by using other variables 4264 14.316 29784 100.000 Imputation Flag For P602 Cumulative Cumulative f_p602 Frequency Percent Frequency Percent Not imputed (original data) 25520 85.684 25520 85.684 Imputed by using other variables 4264 14.316 29784 100.000 Imputation Flag For P605 Cumulative Cumulative f_p605 Frequency Percent Frequency Percent Not imputed (original data) 25520 85.684 25520 85.684 Imputed by using other variables 4264 14.316 29784 100.000 Imputation Flag For P610 Cumulative Cumulative f_p610 Frequency Percent Frequency Percent Not imputed (original data) 25520 85.684 25520 85.684 Imputed by using other variables 4264 14.316 29784 100.000 Imputation Flag For P615 Cumulative Cumulative f_p615 Frequency Percent Frequency Percent Not imputed (original data) 25520 85.684 25520 85.684 Imputed by using other variables 4264 14.316 29784 100.000 Imputation Flag For P620 Cumulative Cumulative f_p620 Frequency Percent Frequency Percent Not imputed (original data) 25520 85.684 25520 85.684 Imputed by using other variables 4264 14.316 29784 100.000

I-78 2005–06 PSS Data File User’s Manual and Survey Documentation
Imputation Flag For P622 Cumulative Cumulative f_p622 Frequency Percent Frequency Percent Not imputed (original data) 25520 85.684 25520 85.684 Imputed by using other variables 4264 14.316 29784 100.000 Imputation Flag For P625 Cumulative Cumulative f_p625 Frequency Percent Frequency Percent Not imputed (original data) 25520 85.684 25520 85.684 Imputed by using other variables 4264 14.316 29784 100.000 Imputation Flag For P630 Cumulative Cumulative f_p630 Frequency Percent Frequency Percent Not imputed (original data) 25520 85.684 25520 85.684 Imputed by using other variables 4264 14.316 29784 100.000 Imputation Flag For P635 Cumulative Cumulative f_p635 Frequency Percent Frequency Percent Not imputed (original data) 25520 85.684 25520 85.684 Imputed by using other variables 4264 14.316 29784 100.000 Imputation Flag For P640 Cumulative Cumulative f_p640 Frequency Percent Frequency Percent Not imputed (original data) 25519 85.680 25519 85.680 Imputed by using other variables 4264 14.316 29783 99.997 Clerical imputation 1 0.003 29784 100.000 Imputation Flag For P645 Cumulative Cumulative f_p645 Frequency Percent Frequency Percent Not imputed (original data) 27584 92.613 27584 92.613 Imputed by using other variables 1462 4.909 29046 97.522 Imputed by using a donor value 726 2.438 29772 99.960 Clerical imputation 12 0.040 29784 100.000 Imputation Flag For P650 Cumulative Cumulative f_p650 Frequency Percent Frequency Percent Not imputed (original data) 28665 96.243 28665 96.243 Imputed by using other variables 705 2.367 29370 98.610 Imputed by using a donor value 397 1.333 29767 99.943 Clerical imputation 17 0.057 29784 100.000

Appendix I. Public-Use Codebook: Descriptive Statistics for Categorical Variables—Unweighted I-79
Imputation Flag For P655 Cumulative Cumulative f_p655 Frequency Percent Frequency Percent Not imputed (original data) 28667 96.250 28667 96.250 Imputed by using other variables 709 2.380 29376 98.630 Imputed by using a donor value 377 1.266 29753 99.896 Clerical imputation 31 0.104 29784 100.000 Imputation Flag For P660 Cumulative Cumulative f_p660 Frequency Percent Frequency Percent Not imputed (original data) 29573 99.292 29573 99.292 Imputed by using other variables 173 0.581 29746 99.872 Imputed by using a donor value 38 0.128 29784 100.000

I-80 2005–06 PSS Data File User’s Manual and Survey Documentation
Descriptive Statistics for Location Variables—Unweighted
Variable Labels N Missing PPIN Permanent Identification Number 29,784 . PINST School name 29,784 . PADDRS Mailing address 29,767 17 PCITY City of mailing address 29,784 . PSTABB State postal code of mailing address 29,784 . PZIP Zip code of mailing address 29,784 . PZIP4 Zip4 code of mailing address 29,421 363 PCNTY FIPS County Code (mailing address of school) 29,784 . PCNTNM County name 29,784 . PL_ADD Street address for school's physical location 3,570 26,214 PL_CIT City for school's physical location 3,570 26,214 PL_STABB State for school's physical location 3,570 26,214 PL_ZIP Zip code for school's physical location 3,570 26,214 PL_ZIP4 Zip4 code for school's physical location 2,645 27,139 LATITUDE Latitude 26,831 2,953 LONGITUDE Longitude 26,831 2,953

Appendix I. Public-Use Codebook: Descriptive Statistics for Continuous Variables—Weighted I-81
Descriptive Statistics for Continuous Variables—Weighted
Variable Label Mean Standard deviation N
Valid skip
PFNLWT Final Weight for School 3.229 . 35,054 . REPW1 Replicate Weights 1 3.357 . 35,054 . REPW2 Replicate Weights 2 3.379 . 35,054 . REPW3 Replicate Weights 3 2.899 . 35,054 . REPW4 Replicate Weights 4 3.049 . 35,054 . REPW5 Replicate Weights 5 3.105 . 35,054 . REPW6 Replicate Weights 6 2.944 . 35,054 . REPW7 Replicate Weights 7 2.945 . 35,054 . REPW8 Replicate Weights 8 3.668 . 35,054 . REPW9 Replicate Weights 9 3.344 . 35,054 . REPW10 Replicate Weights 10 3.494 . 35,054 . REPW11 Replicate Weights 11 2.842 . 35,054 . REPW12 Replicate Weights 12 3.266 . 35,054 . REPW13 Replicate Weights 13 3.893 . 35,054 . REPW14 Replicate Weights 14 2.633 . 35,054 . REPW15 Replicate Weights 15 3.318 . 35,054 . REPW16 Replicate Weights 16 2.330 . 35,054 . REPW17 Replicate Weights 17 3.280 . 35,054 . REPW18 Replicate Weights 18 3.618 . 35,054 . REPW19 Replicate Weights 19 2.938 . 35,054 . REPW20 Replicate Weights 20 2.663 . 35,054 . REPW21 Replicate Weights 21 3.151 . 35,054 . REPW22 Replicate Weights 22 3.102 . 35,054 . REPW23 Replicate Weights 23 3.262 . 35,054 . REPW24 Replicate Weights 24 4.199 . 35,054 . REPW25 Replicate Weights 25 3.238 . 35,054 . REPW26 Replicate Weights 26 3.257 . 35,054 . REPW27 Replicate Weights 27 3.501 . 35,054 . REPW28 Replicate Weights 28 2.887 . 35,054 . REPW29 Replicate Weights 29 3.020 . 35,054 . REPW30 Replicate Weights 30 2.854 . 35,054 . REPW31 Replicate Weights 31 3.569 . 35,054 . REPW32 Replicate Weights 32 3.449 . 35,054 . REPW33 Replicate Weights 33 3.908 . 35,054 . REPW34 Replicate Weights 34 3.744 . 35,054 . REPW35 Replicate Weights 35 3.501 . 35,054 . REPW36 Replicate Weights 36 2.842 . 35,054 . REPW37 Replicate Weights 37 3.350 . 35,054 . REPW38 Replicate Weights 38 3.501 . 35,054 . REPW39 Replicate Weights 39 3.859 . 35,054 . REPW40 Replicate Weights 40 2.640 . 35,054 . REPW41 Replicate Weights 41 3.113 . 35,054 . REPW42 Replicate Weights 42 3.294 . 35,054 .

I-82 2005–06 PSS Data File User’s Manual and Survey Documentation
Variable Label Mean Standard deviation N
Valid skip
REPW43 Replicate Weights 43 3.214 . 35,054 . REPW44 Replicate Weights 44 3.159 . 35,054 . REPW45 Replicate Weights 45 2.892 . 35,054 . REPW46 Replicate Weights 46 3.576 . 35,054 . REPW47 Replicate Weights 47 3.341 . 35,054 . REPW48 Replicate Weights 48 2.713 . 35,054 . REPW49 Replicate Weights 49 3.066 . 35,054 . REPW50 Replicate Weights 50 3.126 . 35,054 . REPW51 Replicate Weights 51 3.187 . 35,054 . REPW52 Replicate Weights 52 2.625 . 35,054 . REPW53 Replicate Weights 53 2.926 . 35,054 . REPW54 Replicate Weights 54 3.114 . 35,054 . REPW55 Replicate Weights 55 3.490 . 35,054 . REPW56 Replicate Weights 56 3.048 . 35,054 . REPW57 Replicate Weights 57 3.101 . 35,054 . REPW58 Replicate Weights 58 2.958 . 35,054 . REPW59 Replicate Weights 59 3.704 . 35,054 . REPW60 Replicate Weights 60 3.621 . 35,054 . REPW61 Replicate Weights 61 3.007 . 35,054 . REPW62 Replicate Weights 62 3.282 . 35,054 . REPW63 Replicate Weights 63 3.673 . 35,054 . REPW64 Replicate Weights 64 3.669 . 35,054 . REPW65 Replicate Weights 65 3.492 . 35,054 . REPW66 Replicate Weights 66 3.311 . 35,054 . REPW67 Replicate Weights 67 2.931 . 35,054 . REPW68 Replicate Weights 68 2.981 . 35,054 . REPW69 Replicate Weights 69 2.417 . 35,054 . REPW70 Replicate Weights 70 3.155 . 35,054 . REPW71 Replicate Weights 71 3.120 . 35,054 . REPW72 Replicate Weights 72 3.489 . 35,054 . REPW73 Replicate Weights 73 3.994 . 35,054 . REPW74 Replicate Weights 74 3.827 . 35,054 . REPW75 Replicate Weights 75 2.981 . 35,054 . REPW76 Replicate Weights 76 2.477 . 35,054 . REPW77 Replicate Weights 77 3.015 . 35,054 . REPW78 Replicate Weights 78 3.163 . 35,054 . REPW79 Replicate Weights 79 3.311 . 35,054 . REPW80 Replicate Weights 80 3.650 . 35,054 . REPW81 Replicate Weights 81 3.295 . 35,054 . REPW82 Replicate Weights 82 2.820 . 35,054 . REPW83 Replicate Weights 83 2.947 . 35,054 . REPW84 Replicate Weights 84 3.084 . 35,054 . REPW85 Replicate Weights 85 3.837 . 35,054 . REPW86 Replicate Weights 86 3.392 . 35,054 . REPW87 Replicate Weights 87 3.698 . 35,054 . REPW88 Replicate Weights 88 3.037 . 35,054 .

Appendix I. Public-Use Codebook: Descriptive Statistics for Continuous Variables—Weighted I-83
Variable Label Mean Standard deviation N
Valid skip
P140 5A Ungraded Enrollment 40.646 59.867 1,867 33,187 P150 5B Nursery/Prekindergarten Enrollment 45.127 49.705 20,529 14,525 P160 5C Kindergarten Enrollment 19.933 20.738 26,439 8,615 P170 5D Transitional Kindergarten Enrollment 12.008 15.281 1,241 33,813 P180 5E Transitional First Grade Enrollment 9.903 15.575 574 34,480 P190 5F First Grade Enrollment 18.832 19.678 22,362 12,692 P200 5G Second Grade Enrollment 18.369 19.492 22,073 12,981 P210 5H Third Grade Enrollment 18.192 20.208 21,884 13,170 P220 5I Fourth Grade Enrollment 18.149 20.374 21,573 13,481 P230 5J Fifth Grade Enrollment 18.227 20.603 21,381 13,673 P240 5K Sixth Grade Enrollment 18.875 22.176 20,833 14,221 P250 5L Seventh Grade Enrollment 19.882 24.017 19,643 15,411 P260 5M Eighth Grade Enrollment 19.941 24.491 19,443 15,611 P270 5N Ninth Grade Enrollment 33.246 64.414 10,712 24,342 P280 5O Tenth Grade Enrollment 34.938 65.813 9,966 25,088 P290 5P Eleventh Grade Enrollment 33.997 61.157 9,597 25,458 P300 5Q Twelfth Grade Enrollment 34.804 61.432 9,059 25,995 P305 6 Total Student Enrollment 173.253 229.974 35,054 . P320 7A Hispanic Students 13.572 48.270 35,054 . P330 7B White Students 110.624 190.929 35,054 . P325 7C Black Students 14.069 41.980 35,054 . P315 7D Asian Or Pacific Islander Students 5.965 35.625 35,054 . P310 7E Am Indian/Alaska Native Students 2.595 16.147 35,054 . P340 8B Number of Male Students 71.405 108.935 33,701 1,353 P350 9B How Many In 12th Grade Last Year 36.335 60.998 8,605 26,449 P360 9D Percent To 4 Year College 57.556 42.218 8,418 26,636 P361 9D Percent To 2 Year College 20.054 29.790 8,418 26,636 P385 11 Full-Time Teachers 11.212 17.530 35,054 . P390 11 More Than 3/4 Time Teachers 0.645 2.146 35,054 . P395 11 More Than 1/2 Time Teachers 1.214 3.738 35,054 . P400 11 More Than 1/4 Time Teachers 0.611 1.728 35,054 . P405 11 Less Than 1/4 Time Teachers 0.477 1.816 35,054 . P410 11 Total Number Of Teachers 14.159 20.190 35,054 . P645 16 Days In School Year 181.426 17.842 35,054 . P650 17 Hours In School Day For Students 6.289 1.206 35,054 . P665 19 Minutes To Complete Questionnaire 16.680 16.712 34,351 703 NUMSTUDS Total number of students in school (K–12,
UG) 146.825 224.252 35,054 . NUMTEACH Number of K–12 teachers (FTE) 12.832 18.939 35,054 . PMINOR Percent minority students (K–12, UG) 28.193 34.149 35,054 . MINOR Number of minority students (K–12, UG) 36.201 85.074 35,054 . TOTHRS Length of school day in hours 6.575 1.175 35,054 . MALES Number of male students (K–12, UG) 74.577 125.235 35,054 . S_KG Total number of kindergarten students 15.621 21.238 35,054 . P_INDIAN Percentage of American Indian or Alaska
Native students 1.637 7.728 35,054 .

I-84 2005–06 PSS Data File User’s Manual and Survey Documentation
Variable Label Mean Standard deviation N
Valid skip
P_ASIAN Percentage of Asian or Pacific Islanders students 4.253 11.805 35,054 .
P_HISP Percentage of Hispanic students 9.361 19.034 35,054 . P_WHITE Percentage of White students 71.807 34.149 35,054 . P_BLACK Percentage of Black students 12.942 26.442 35,054 . STTCH_RT Student teacher ratio 11.243 11.326 35,054 .

Appendix I. Public-Use Codebook: Descriptive Statistics for Categorical Variables—Weighted I-85
Descriptive Statistics for Categorical Variables—Weighted Method of Interview Cumulative Cumulative csource Frequency Percent Frequency Percent Mail 13881.796 39.601 13881.796 39.601 Internet 6760.151 19.285 20641.947 58.886 CATI (computer‐assisted telephone interview) 12708.950 36.255 33350.897 95.141 Regional Office follow‐up 1703.193 4.859 35054.090 100.000 5A Ungraded Offered Cumulative Cumulative P135 Frequency Percent Frequency Percent Yes 1867.373 5.327 1867.373 5.327 No 33186.717 94.673 35054.090 100.000 5B Nursery/Prekindergarten Offered Cumulative Cumulative P145 Frequency Percent Frequency Percent Yes 19837.705 56.592 19837.705 56.592 No 15216.385 43.408 35054.090 100.000 5C Kindergarten Offered Cumulative Cumulative P155 Frequency Percent Frequency Percent Yes 26438.616 75.422 26438.616 75.422 No 8615.474 24.578 35054.090 100.000 5D Transitional Kindergarten Offered Cumulative Cumulative P165 Frequency Percent Frequency Percent Yes 1240.872 3.540 1240.872 3.540 No 33813.217 96.460 35054.090 100.000 5E Transitional First Grade Offered Cumulative Cumulative P175 Frequency Percent Frequency Percent Yes 573.658 1.636 573.658 1.636 No 34480.432 98.364 35054.090 100.000 5F First Grade Offered Cumulative Cumulative P185 Frequency Percent Frequency Percent Yes 22361.850 63.792 22361.850 63.792 No 12692.240 36.208 35054.090 100.000 5G Second Grade Offered Cumulative Cumulative P195 Frequency Percent Frequency Percent Yes 22073.137 62.969 22073.137 62.969 No 12980.952 37.031 35054.090 100.000

I-86 2005–06 PSS Data File User’s Manual and Survey Documentation
5H Third Grade Offered Cumulative Cumulative P205 Frequency Percent Frequency Percent Yes 21884.326 62.430 21884.326 62.430 No 13169.764 37.570 35054.090 100.000 5I Fourth Grade Offered Cumulative Cumulative P215 Frequency Percent Frequency Percent Yes 21573.326 61.543 21573.326 61.543 No 13480.763 38.457 35054.090 100.000 5J Fifth Grade Offered Cumulative Cumulative P225 Frequency Percent Frequency Percent Yes 21381.351 60.995 21381.351 60.995 No 13672.739 39.005 35054.090 100.000 5K Sixth Grade Offered Cumulative Cumulative P235 Frequency Percent Frequency Percent Yes 20833.327 59.432 20833.327 59.432 No 14220.762 40.568 35054.090 100.000 5L Seventh Grade Offered Cumulative Cumulative P245 Frequency Percent Frequency Percent Yes 19643.164 56.037 19643.164 56.037 No 15410.926 43.963 35054.090 100.000 5M Eighth Grade Offered Cumulative Cumulative P255 Frequency Percent Frequency Percent Yes 19443.041 55.466 19443.041 55.466 No 15611.048 44.534 35054.090 100.000 5N Ninth Grade Offered Cumulative Cumulative P265 Frequency Percent Frequency Percent Yes 10711.845 30.558 10711.845 30.558 No 24342.245 69.442 35054.090 100.000 5O Tenth Grade Offered Cumulative Cumulative P275 Frequency Percent Frequency Percent Yes 9965.946 28.430 9965.946 28.430 No 25088.144 71.570 35054.090 100.000

Appendix I. Public-Use Codebook: Descriptive Statistics for Categorical Variables—Weighted I-87
5P Eleventh Grade Offered Cumulative Cumulative P285 Frequency Percent Frequency Percent Yes 9596.513 27.376 9596.513 27.376 No 25457.576 72.624 35054.090 100.000 5Q Twelfth Grade Offered Cumulative Cumulative P295 Frequency Percent Frequency Percent Yes 9059.034 25.843 9059.034 25.843 No 25995.056 74.157 35054.090 100.000 8A Is School Coeducational Cumulative Cumulative P335 Frequency Percent Frequency Percent Coeducational 33701.186 96.141 33701.186 96.141 all‐female school 589.956 1.683 34291.142 97.824 all‐male school 762.947 2.176 35054.090 100.000 9A Students in 12th Grade Last Year Cumulative Cumulative P345 Frequency Percent Frequency Percent Yes 8605.399 24.549 8605.399 24.549 No 26448.690 75.451 35054.090 100.000 10A Half Day Or Full Day Cumulative Cumulative P365 Frequency Percent Frequency Percent None 8407.010 23.983 8407.010 23.983 Full day 20293.350 57.892 28700.360 81.874 Half day 3449.641 9.841 32150.001 91.715 Both offered 2904.089 8.285 35054.090 100.000 10B Days Per Week Cumulative Cumulative P370 Frequency Percent Frequency Percent Valid Skip 8407.010 23.983 8407.010 23.983 1 19.607 0.056 8426.617 24.039 2 40.712 0.116 8467.329 24.155 3 786.165 2.243 9253.494 26.398 4 540.321 1.541 9793.815 27.939 5 25260.274 72.061 35054.090 100.000 12A Type of School Cumulative Cumulative P415 Frequency Percent Frequency Percent Regular elementary/secondary 23368.378 66.664 23368.378 66.664 Montessori 2757.971 7.868 26126.349 74.532 Special Program Emphasis 1261.503 3.599 27387.853 78.130 Special Education 1773.089 5.058 29160.942 83.188 Vocational/Technical 18.897 0.054 29179.839 83.242 Alternative 1037.566 2.960 30217.405 86.202 Early childhood 4836.684 13.798 35054.090 100.000

I-88 2005–06 PSS Data File User’s Manual and Survey Documentation
12B School Support Home Schooling Cumulative Cumulative P420 Frequency Percent Frequency Percent Yes 1563.063 4.459 1563.063 4.459 No 33491.027 95.541 35054.090 100.000 13 Is School Located In Private Home Cumulative Cumulative P425 Frequency Percent Frequency Percent Yes 211.856 0.604 211.856 0.604 No 34842.233 99.396 35054.090 100.000 14A Does School Have Religious Orientation Cumulative Cumulative P430 Frequency Percent Frequency Percent Yes 23908.407 68.204 23908.407 68.204 No 11145.683 31.796 35054.090 100.000 14B School Affiliated W/Religious Cumulative Cumulative P435 Frequency Percent Frequency Percent Valid Skip 11145.683 31.796 11145.683 31.796 Yes 20592.432 58.745 31738.115 90.540 No 3315.975 9.460 35054.090 100.000 14C Religious Orientation/Affiliation Cumulative Cumulative P440 Frequency Percent Frequency Percent Valid Skip 11145.683 31.796 11145.683 31.796 Roman Catholic 7744.435 22.093 18890.118 53.888 African Methodist Episcopal 13.582 0.039 18903.700 53.927 Amish 823.537 2.349 19727.236 56.277 Assembly of God 433.842 1.238 20161.079 57.514 Baptist 2806.804 8.007 22967.882 65.521 Brethren 87.826 0.251 23055.708 65.772 Calvinist 136.935 0.391 23192.643 66.162 Christian (no specific denomination) 4802.742 13.701 27995.385 79.863 Church of Christ 196.844 0.562 28192.230 80.425 Church of God 123.109 0.351 28315.338 80.776 Church of God in Christ 54.589 0.156 28369.927 80.932 Church of the Nazarene 100.893 0.288 28470.820 81.220 Disciples of Christ 14.724 0.042 28485.544 81.262 Episcopal 418.138 1.193 28903.681 82.455 Friends 88.090 0.251 28991.772 82.706 Greek Orthodox 35.294 0.101 29027.065 82.807 Islamic 202.724 0.578 29229.789 83.385 Jewish 963.110 2.747 30192.899 86.132 Latter Day Saints 6.498 0.019 30199.396 86.151 Lutheran Church ‐ Missouri Synod 1222.716 3.488 31422.112 89.639 Evangelical Lutheran Church in America 197.212 0.563 31619.324 90.202 Wisconsin Evangelical Lutheran Synod 368.867 1.052 31988.191 91.254 Other Lutheran 90.521 0.258 32078.712 91.512 Mennonite 478.299 1.364 32557.011 92.876 Methodist 333.248 0.951 32890.259 93.827 Pentecostal 424.210 1.210 33314.469 95.037 Presbyterian 280.112 0.799 33594.581 95.836 Seventh‐Day Adventist 892.042 2.545 34486.622 98.381 Other 567.468 1.619 35054.090 100.000

Appendix I. Public-Use Codebook: Descriptive Statistics for Categorical Variables—Weighted I-89
14C What Type of Catholic School Cumulative Cumulative P445 Frequency Percent Frequency Percent Valid Skip 27309.654 77.907 27309.654 77.907 Parochial 3692.918 10.535 31002.573 88.442 Diocesan 2996.436 8.548 33999.009 96.990 Private 1055.081 3.010 35054.090 100.000 15 No Associations Cumulative Cumulative P450 Frequency Percent Frequency Percent Does belong to an organization/association 25695.241 73.302 25695.241 73.302 Does not belong to an organization/association 9358.849 26.698 35054.090 100.000 15 Accelerated Christian Education Cumulative Cumulative P455 Frequency Percent Frequency Percent Not member 33598.576 95.848 33598.576 95.848 Member 1455.514 4.152 35054.090 100.000 15 American Association of Christian Schools Cumulative Cumulative P460 Frequency Percent Frequency Percent Not member 34136.416 97.382 34136.416 97.382 Member 917.674 2.618 35054.090 100.000 15 Association of Christian Schools International Cumulative Cumulative P465 Frequency Percent Frequency Percent Not member 31262.991 89.185 31262.991 89.185 Member 3791.099 10.815 35054.090 100.000 15 Association of Christian Teachers And Schools Cumulative Cumulative P467 Frequency Percent Frequency Percent Not member 34802.781 99.283 34802.781 99.283 Member 251.309 0.717 35054.090 100.000 15 Association of Classical and Christian Schools Cumulative Cumulative P468 Frequency Percent Frequency Percent Not member 34893.307 99.541 34893.307 99.541 Member 160.782 0.459 35054.090 100.000 15 Christian Schools International Cumulative Cumulative P470 Frequency Percent Frequency Percent Not member 34663.781 98.887 34663.781 98.887 Member 390.309 1.113 35054.090 100.000

I-90 2005–06 PSS Data File User’s Manual and Survey Documentation
15 Evangelical Lutheran Education Association Cumulative Cumulative P480 Frequency Percent Frequency Percent Not member 34738.506 99.100 34738.506 99.100 Member 315.583 0.900 35054.090 100.000 15 Friends Council on Education Cumulative Cumulative P485 Frequency Percent Frequency Percent Not member 34989.823 99.817 34989.823 99.817 Member 64.267 0.183 35054.090 100.000 15 General Conference of SDA Church Cumulative Cumulative P490 Frequency Percent Frequency Percent Not member 34341.645 97.968 34341.645 97.968 Member 712.444 2.032 35054.090 100.000 15 Islamic School League of America Cumulative Cumulative P492 Frequency Percent Frequency Percent Not member 34964.205 99.744 34964.205 99.744 Member 89.885 0.256 35054.090 100.000 15 Jesuit Secondary Education Association Cumulative Cumulative P495 Frequency Percent Frequency Percent Not member 35002.009 99.851 35002.009 99.851 Member 52.080 0.149 35054.090 100.000 15 National Association of Episcopal Schools Cumulative Cumulative P500 Frequency Percent Frequency Percent Not member 34722.870 99.055 34722.870 99.055 Member 331.220 0.945 35054.090 100.000 15 National Catholic Educational Association Cumulative Cumulative P505 Frequency Percent Frequency Percent Not member 28219.683 80.503 28219.683 80.503 Member 6834.407 19.497 35054.090 100.000 15 National Christian School Association Cumulative Cumulative P510 Frequency Percent Frequency Percent Not member 34886.682 99.522 34886.682 99.522 Member 167.408 0.478 35054.090 100.000
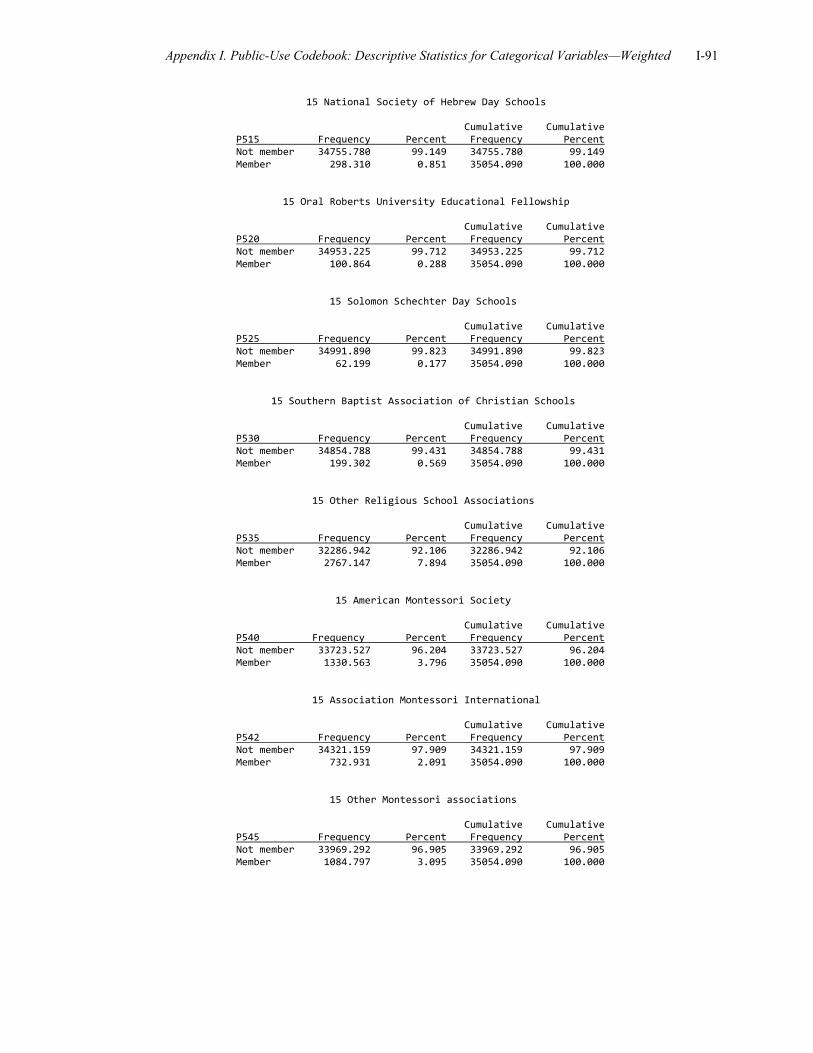
Appendix I. Public-Use Codebook: Descriptive Statistics for Categorical Variables—Weighted I-91
15 National Society of Hebrew Day Schools Cumulative Cumulative P515 Frequency Percent Frequency Percent Not member 34755.780 99.149 34755.780 99.149 Member 298.310 0.851 35054.090 100.000 15 Oral Roberts University Educational Fellowship Cumulative Cumulative P520 Frequency Percent Frequency Percent Not member 34953.225 99.712 34953.225 99.712 Member 100.864 0.288 35054.090 100.000 15 Solomon Schechter Day Schools Cumulative Cumulative P525 Frequency Percent Frequency Percent Not member 34991.890 99.823 34991.890 99.823 Member 62.199 0.177 35054.090 100.000 15 Southern Baptist Association of Christian Schools Cumulative Cumulative P530 Frequency Percent Frequency Percent Not member 34854.788 99.431 34854.788 99.431 Member 199.302 0.569 35054.090 100.000 15 Other Religious School Associations Cumulative Cumulative P535 Frequency Percent Frequency Percent Not member 32286.942 92.106 32286.942 92.106 Member 2767.147 7.894 35054.090 100.000 15 American Montessori Society Cumulative Cumulative P540 Frequency Percent Frequency Percent Not member 33723.527 96.204 33723.527 96.204 Member 1330.563 3.796 35054.090 100.000 15 Association Montessori International Cumulative Cumulative P542 Frequency Percent Frequency Percent Not member 34321.159 97.909 34321.159 97.909 Member 732.931 2.091 35054.090 100.000 15 Other Montessori associations Cumulative Cumulative P545 Frequency Percent Frequency Percent Not member 33969.292 96.905 33969.292 96.905 Member 1084.797 3.095 35054.090 100.000

I-92 2005–06 PSS Data File User’s Manual and Survey Documentation
15 Association Military Colleges And Schools Cumulative Cumulative P550 Frequency Percent Frequency Percent Not member 35029.097 99.929 35029.097 99.929 Member 24.993 0.071 35054.090 100.000 15 Association Waldorf Schools of North America Cumulative Cumulative P555 Frequency Percent Frequency Percent Not member 34929.735 99.645 34929.735 99.645 Member 124.354 0.355 35054.090 100.000 15 Bilingual School Association Cumulative Cumulative P560 Frequency Percent Frequency Percent Not member 35030.090 99.932 35030.090 99.932 Member 24.000 0.068 35054.090 100.000 15 Council of Bilingual Education Cumulative Cumulative P565 Frequency Percent Frequency Percent Not member 35038.467 99.955 35038.467 99.955 Member 15.623 0.045 35054.090 100.000 15 Council For Exceptional Children Cumulative Cumulative P570 Frequency Percent Frequency Percent Not member 34648.478 98.843 34648.478 98.843 Member 405.612 1.157 35054.090 100.000 15 National Association of Private Special Education Centers Cumulative Cumulative P575 Frequency Percent Frequency Percent Not member 34685.756 98.949 34685.756 98.949 Member 368.334 1.051 35054.090 100.000 15 Other Associations For Exceptional Children Cumulative Cumulative P580 Frequency Percent Frequency Percent Not member 34694.093 98.973 34694.093 98.973 Member 359.997 1.027 35054.090 100.000
15 European Council For International Schools Cumulative Cumulative P585 Frequency Percent Frequency Percent Not member 35034.179 99.943 35034.179 99.943 Member 19.911 0.057 35054.090 100.000

Appendix I. Public-Use Codebook: Descriptive Statistics for Categorical Variables—Weighted I-93
15 National Association For The Education of Young Children Cumulative Cumulative P590 Frequency Percent Frequency Percent Not member 32562.346 92.892 32562.346 92.892 Member 2491.744 7.108 35054.090 100.000 15 National Association of Bilingual Education Cumulative Cumulative P595 Frequency Percent Frequency Percent Not member 35046.759 99.979 35046.759 99.979 Member 7.331 0.021 35054.090 100.000 15 National Association of Laboratory Schools Cumulative Cumulative P600 Frequency Percent Frequency Percent Not member 35032.037 99.937 35032.037 99.937 Member 22.053 0.063 35054.090 100.000 15 National Coalition of Girls' Schools Cumulative Cumulative P602 Frequency Percent Frequency Percent Not member 34959.408 99.730 34959.408 99.730 Member 94.682 0.270 35054.090 100.000 15 Other Special Emphasis Associations Cumulative Cumulative P605 Frequency Percent Frequency Percent Not member 33597.761 95.845 33597.761 95.845 Member 1456.329 4.155 35054.090 100.000 15 Alternative School Network Cumulative Cumulative P610 Frequency Percent Frequency Percent Not member 35016.939 99.894 35016.939 99.894 Member 37.151 0.106 35054.090 100.000 15 Institute For Independent Education Cumulative Cumulative P615 Frequency Percent Frequency Percent Not member 34975.528 99.776 34975.528 99.776 Member 78.562 0.224 35054.090 100.000 15 National Association of Independent Schools Cumulative Cumulative P620 Frequency Percent Frequency Percent Not member 33311.871 95.030 33311.871 95.030 Member 1742.219 4.970 35054.090 100.000

I-94 2005–06 PSS Data File User’s Manual and Survey Documentation
15 State or regional independent school association Cumulative Cumulative P622 Frequency Percent Frequency Percent Not member 32835.238 93.670 32835.238 93.670 Member 2218.851 6.330 35054.090 100.000 15 National Coalition of Alternative Community Schools Cumulative Cumulative P625 Frequency Percent Frequency Percent Not member 35000.234 99.846 35000.234 99.846 Member 53.856 0.154 35054.090 100.000 15 National Independent Private Schools Association Cumulative Cumulative P630 Frequency Percent Frequency Percent Not member 34734.943 99.090 34734.943 99.090 Member 319.147 0.910 35054.090 100.000 15 The Association of Boarding Schools Cumulative Cumulative P635 Frequency Percent Frequency Percent Not member 34839.070 99.387 34839.070 99.387 Member 215.019 0.613 35054.090 100.000 15 Other school associations Cumulative Cumulative P640 Frequency Percent Frequency Percent Not member 32353.300 92.295 32353.300 92.295 Member 2700.790 7.705 35054.090 100.000

Appendix I. Public-Use Codebook: Descriptive Statistics for Categorical Variables—Weighted I-95
17 Minutes In School Day For Students Cumulative Cumulative P655 Frequency Percent Frequency Percent 0 15257.532 43.526 15257.532 43.526 1 10.529 0.030 15268.061 43.556 2 22.852 0.065 15290.913 43.621 3 29.567 0.084 15320.480 43.705 4 3.260 0.009 15323.740 43.715 5 515.843 1.472 15839.583 45.186 6 12.566 0.036 15852.149 45.222 7 10.461 0.030 15862.610 45.252 8 17.151 0.049 15879.761 45.301 9 11.668 0.033 15891.429 45.334 10 732.524 2.090 16623.953 47.424 11 5.231 0.015 16629.184 47.439 12 22.065 0.063 16651.249 47.502 13 4.328 0.012 16655.577 47.514 14 10.799 0.031 16666.376 47.545 15 2294.657 6.546 18961.033 54.091 16 4.117 0.012 18965.149 54.103 17 9.644 0.028 18974.794 54.130 18 19.479 0.056 18994.273 54.186 19 5.219 0.015 18999.492 54.200 20 703.820 2.008 19703.312 56.208 21 4.103 0.012 19707.415 56.220 22 11.257 0.032 19718.671 56.252 23 13.897 0.040 19732.568 56.292 24 10.417 0.030 19742.986 56.321 25 349.828 0.998 20092.814 57.319 26 5.339 0.015 20098.153 57.335 27 4.283 0.012 20102.436 57.347 28 10.521 0.030 20112.957 57.377 29 14.801 0.042 20127.759 57.419 30 9297.483 26.523 29425.242 83.942 31 5.311 0.015 29430.553 83.958 32 2.241 0.006 29432.793 83.964 33 9.611 0.027 29442.405 83.991 34 11.599 0.033 29454.004 84.024 35 482.124 1.375 29936.127 85.400 36 13.942 0.040 29950.070 85.440 37 4.162 0.012 29954.232 85.451 38 10.779 0.031 29965.011 85.482 39 10.832 0.031 29975.843 85.513 40 797.832 2.276 30773.674 87.789 41 4.161 0.012 30777.836 87.801 42 18.726 0.053 30796.562 87.854 43 6.270 0.018 30802.832 87.872 44 3.210 0.009 30806.042 87.881 45 3032.652 8.651 33838.693 96.533 46 11.566 0.033 33850.259 96.566 47 13.973 0.040 33864.231 96.606 48 14.631 0.042 33878.863 96.647 49 3.362 0.010 33882.224 96.657 50 754.602 2.153 34636.826 98.810 51 5.174 0.015 34642.000 98.824 52 11.366 0.032 34653.366 98.857 53 8.477 0.024 34661.844 98.881 54 7.419 0.021 34669.262 98.902 55 357.227 1.019 35026.490 99.921 56 4.192 0.012 35030.682 99.933 57 8.611 0.025 35039.293 99.958 58 12.649 0.036 35051.942 99.994 59 2.148 0.006 35054.090 100.000

I-96 2005–06 PSS Data File User’s Manual and Survey Documentation
18 Library or library media center Cumulative Cumulative P660 Frequency Percent Frequency Percent Yes 27791.711 79.282 27791.711 79.282 No 7262.379 20.718 35054.090 100.000 Census Region Cumulative Cumulative Region Frequency Percent Frequency Percent Northeast 8277.701 23.614 8277.701 23.614 Midwest 8163.211 23.287 16440.912 46.902 South 10829.852 30.895 27270.763 77.796 West 7783.327 22.204 35054.090 100.000

Appendix I. Public-Use Codebook: Descriptive Statistics for Categorical Variables—Weighted I-97
FIPS State Code (mailing address of school) Cumulative Cumulative pstfip Frequency Percent Frequency Percent ALABAMA 502.166 1.433 502.166 1.433 ALASKA 92.157 0.263 594.323 1.695 ARIZONA 398.858 1.138 993.181 2.833 ARKANSAS 229.963 0.656 1223.144 3.489 CALIFORNIA 4180.726 11.927 5403.870 15.416 COLORADO 496.698 1.417 5900.568 16.833 CONNECTICUT 420.250 1.199 6320.818 18.032 DELAWARE 139.379 0.398 6460.197 18.429 DISTRICT OF COLUMBIA 92.095 0.263 6552.292 18.692 FLORIDA 2083.706 5.944 8635.998 24.636 GEORGIA 794.267 2.266 9430.264 26.902 HAWAII 124.232 0.354 9554.497 27.256 IDAHO 169.384 0.483 9723.881 27.740 ILLINOIS 1813.059 5.172 11536.940 32.912 INDIANA 891.535 2.543 12428.475 35.455 IOWA 288.140 0.822 12716.614 36.277 KANSAS 414.567 1.183 13131.182 37.460 KENTUCKY 517.870 1.477 13649.052 38.937 LOUISIANA 438.813 1.252 14087.864 40.189 MAINE 179.982 0.513 14267.847 40.702 MARYLAND 829.559 2.367 15097.406 43.069 MASSACHUSETTS 960.154 2.739 16057.559 45.808 MICHIGAN 989.183 2.822 17046.743 48.630 MINNESOTA 608.366 1.736 17655.109 50.365 MISSISSIPPI 326.130 0.930 17981.239 51.296 MISSOURI 708.731 2.022 18689.970 53.318 MONTANA 264.832 0.755 18954.802 54.073 NEBRASKA 234.736 0.670 19189.538 54.743 NEVADA 169.371 0.483 19358.909 55.226 NEW HAMPSHIRE 343.582 0.980 19702.491 56.206 NEW JERSEY 1378.426 3.932 21080.917 60.138 NEW MEXICO 203.584 0.581 21284.501 60.719 NEW YORK 2220.892 6.336 23505.394 67.055 NORTH CAROLINA 659.674 1.882 24165.067 68.937 NORTH DAKOTA 50.626 0.144 24215.694 69.081 OHIO 1090.346 3.110 25306.040 72.191 OKLAHOMA 251.095 0.716 25557.135 72.908 OREGON 718.847 2.051 26275.982 74.958 PENNSYLVANIA 2459.936 7.018 28735.918 81.976 RHODE ISLAND 181.450 0.518 28917.368 82.494 SOUTH CAROLINA 444.145 1.267 29361.513 83.761 SOUTH DAKOTA 85.084 0.243 29446.597 84.003 TENNESSEE 643.015 1.834 30089.612 85.838 TEXAS 1737.798 4.957 31827.411 90.795 UTAH 130.494 0.372 31957.905 91.167 VERMONT 129.969 0.371 32087.874 91.538 VIRGINIA 993.272 2.834 33081.146 94.372 WASHINGTON 794.276 2.266 33875.421 96.638 WEST VIRGINIA 149.965 0.428 34025.386 97.065 WISCONSIN 988.837 2.821 35014.223 99.886 WYOMING 39.867 0.114 35054.090 100.000

I-98 2005–06 PSS Data File User’s Manual and Survey Documentation
New Urbanicity Defined (Census assigned) Cumulative Cumulative locale Frequency Percent Frequency Percent Large city 5932.363 16.923 5932.363 16.923 Mid‐size city 5740.117 16.375 11672.480 33.298 Urban fringe of large city 10500.387 29.955 22172.867 63.253 Urban Fringe of mid‐size city 4012.247 11.446 26185.114 74.699 Large town 643.907 1.837 26829.021 76.536 Small town 2199.044 6.273 29028.065 82.809 Rural ‐ outside CBSA 2914.343 8.314 31942.407 91.123 Rural ‐ inside CBSA 3111.682 8.877 35054.090 100.000 Urban‐centric locale code (NCES assigned) Cumulative Cumulative ulocale Frequency Percent Frequency Percent City, Small 3334.710 9.513 11813.219 33.700 Suburb, Large 11060.956 31.554 22874.176 65.254 Suburb, Midsize 1083.686 3.091 23957.862 68.345 Suburb, Small 654.114 1.866 24611.976 70.211 Town, Fringe 952.349 2.717 25564.324 72.928 Town, Distant 1384.737 3.950 26949.061 76.879 Town, Remote 1228.708 3.505 28177.768 80.384 Rural, Fringe 3677.004 10.490 31854.773 90.873 Rural, Distant 2331.977 6.653 34186.750 97.526 Rural, Remote 867.340 2.474 35054.090 100.000 2005‐2006 Lowest Grade Level Recode Cumulative Cumulative logr2006 Frequency Percent Frequency Percent All Ungraded 825.597 2.355 825.597 2.355 Lowest grade in school is prekindergarten 19837.705 56.592 20663.302 58.947 Lowest grade in school is kindergarten 7039.818 20.083 27703.120 79.030 Lowest grade in school is transitional KG 49.709 0.142 27752.829 79.171 Lowest grade in school is transitional 1st grade 35.312 0.101 27788.141 79.272 Lowest grade in school is 1st grade 2376.968 6.781 30165.109 86.053 Lowest grade in school is 2nd grade 507.871 1.449 30672.980 87.502 Lowest grade in school is 3rd grade 296.674 0.846 30969.654 88.348 Lowest grade in school is 4th grade 262.821 0.750 31232.475 89.098 Lowest grade in school is 5th grade 250.471 0.715 31482.946 89.812 Lowest grade in school is 6th grade 654.875 1.868 32137.821 91.681 Lowest grade in school is 7th grade 716.021 2.043 32853.842 93.723 Lowest grade in school is 8th grade 225.514 0.643 33079.356 94.367 Lowest grade in school is 9th grade 1868.497 5.330 34947.853 99.697 Lowest grade in school is 10th grade 48.948 0.140 34996.801 99.837 Lowest grade in school is 11th grade 26.292 0.075 35023.093 99.912 Lowest grade in school is 12th grade 30.997 0.088 35054.090 100.000

Appendix I. Public-Use Codebook: Descriptive Statistics for Categorical Variables—Weighted I-99
2005‐2006 Highest Grade Level Recode Cumulative Cumulative higr2006 Frequency Percent Frequency Percent All Ungraded 825.597 2.355 825.597 2.355 Highest grade in school is prekindergarten 91.225 0.260 916.822 2.615 Highest grade in school is kindergarten 5662.338 16.153 6579.160 18.769 Highest grade in school is transitional KG 534.116 1.524 7113.276 20.292 Highest grade in school is transitional 1st grade 94.810 0.270 7208.086 20.563 Highest grade in school is 1st grade 647.828 1.848 7855.913 22.411 Highest grade in school is 2nd grade 432.253 1.233 8288.167 23.644 Highest grade in school is 3rd grade 473.211 1.350 8761.378 24.994 Highest grade in school is 4th grade 403.016 1.150 9164.394 26.144 Highest grade in school is 5th grade 1209.066 3.449 10373.459 29.593 Highest grade in school is 6th grade 1999.052 5.703 12372.511 35.295 Highest grade in school is 7th grade 688.245 1.963 13060.756 37.259 Highest grade in school is 8th grade 10774.978 30.738 23835.734 67.997 Highest grade in school is 9th grade 698.379 1.992 24534.113 69.989 Highest grade in school is 10th grade 510.199 1.455 25044.312 71.445 Highest grade in school is 11th grade 950.744 2.712 25995.056 74.157 Highest grade in school is 12th grade 9059.034 25.843 35054.090 100.000 Universe frame to which school belongs Cumulative Cumulative frame Frequency Percent Frequency Percent School is part of area frame 4105.090 11.711 4105.090 11.711 School is part of list frame 30949.000 88.289 35054.090 100.000 Tabulation flag Cumulative Cumulative tabflag Frequency Percent Frequency Percent Schools offering ungraded or grade 1 or above 28995.618 82.717 28995.618 82.717 Schools offering no grade higher than KG 6058.472 17.283 35054.090 100.000 School Typology Cumulative Cumulative typology Frequency Percent Frequency Percent Catholic, parochial 3692.918 10.535 3692.918 10.535 Catholic, diocesan 2996.436 8.548 6689.354 19.083 Catholic, private 1055.081 3.010 7744.435 22.093 Other religious, conservative Christian 5909.282 16.858 13653.717 38.950 Other religious, affiliated 4025.086 11.483 17678.803 50.433 Other religious, unaffiliated 6229.604 17.771 23908.407 68.204 Nonsectarian, regular school 5754.683 16.417 29663.089 84.621 Nonsectarian, special program emphasis 3840.451 10.956 33503.541 95.577 Nonsectarian, special education 1550.549 4.423 35054.090 100.000 Affiliation Cumulative Cumulative relig Frequency Percent Frequency Percent Catholic 7744.435 22.093 7744.435 22.093 Other religious 16163.972 46.112 23908.407 68.204 Nonsectarian 11145.683 31.796 35054.090 100.000

I-100 2005–06 PSS Data File User’s Manual and Survey Documentation
School orientation Cumulative Cumulative orient Frequency Percent Frequency Percent Roman Catholic 7744.435 22.093 7744.435 22.093 African Methodist Episcopal 13.582 0.039 7758.017 22.132 Amish 823.537 2.349 8581.554 24.481 Assembly of God 433.842 1.238 9015.396 25.719 Baptist 2806.804 8.007 11822.199 33.726 Brethren 87.826 0.251 11910.025 33.976 Calvinist 136.935 0.391 12046.961 34.367 Christian 4802.742 13.701 16849.703 48.068 Church of Christ 196.844 0.562 17046.547 48.629 Church of God 123.109 0.351 17169.656 48.980 Church of God in Christ 54.589 0.156 17224.244 49.136 Church of the Nazarene 100.893 0.288 17325.137 49.424 Disciples of Christ 14.724 0.042 17339.861 49.466 Episcopal 418.138 1.193 17757.999 50.659 Friends 88.090 0.251 17846.089 50.910 Greek Orthodox 35.294 0.101 17881.382 51.011 Islamic 202.724 0.578 18084.107 51.589 Jewish 963.110 2.747 19047.216 54.337 Latter Day Saints 6.498 0.019 19053.714 54.355 Lutheran Church ‐ Missouri Synod 1222.716 3.488 20276.429 57.843 Evangelical Lutheran Church in America 197.212 0.563 20473.641 58.406 Wisconsin Evangelical Lutheran Synod 368.867 1.052 20842.508 59.458 Other Lutheran 90.521 0.258 20933.030 59.716 Mennonite 478.299 1.364 21411.328 61.081 Methodist 333.248 0.951 21744.576 62.031 Pentecostal 424.210 1.210 22168.786 63.242 Presbyterian 280.112 0.799 22448.898 64.041 Seventh‐Day Adventist 892.042 2.545 23340.939 66.585 Other 567.468 1.619 23908.407 68.204 Nonsectarian 11145.683 31.796 35054.090 100.000

Appendix I. Public-Use Codebook: Descriptive Statistics for Categorical Variables—Weighted I-101
Diocese or archdiocese for Catholic schools Cumulative Cumulative diocese Frequency Percent Frequency Percent Valid Skip 27309.654 77.907 27309.654 77.907 Diocese of Birmingham, AL 24.070 0.069 27333.724 77.976 Diocese of Mobile, AL 21.682 0.062 27355.407 78.038 Archdiocese of Anchorage, AK 4.166 0.012 27359.573 78.050 Diocese of Fairbanks, AK 2.085 0.006 27361.658 78.056 Diocese of Juneau, AK 1.027 0.003 27362.685 78.058 Diocese of Phoenix, AZ 38.903 0.111 27401.589 78.169 Diocese of Tucson, AZ 25.965 0.074 27427.554 78.244 Diocese of Little Rock, AR 33.128 0.095 27460.682 78.338 Archdiocese of Los Angeles, CA 291.039 0.830 27751.721 79.168 Archdiocese of San Francisco, CA 79.630 0.227 27831.351 79.395 Diocese of Fresno, CA 25.215 0.072 27856.566 79.467 Diocese of Monterey, CA 17.922 0.051 27874.488 79.519 Diocese of Oakland, CA 62.316 0.178 27936.804 79.696 Diocese of Orange, CA 43.729 0.125 27980.532 79.821 Diocese of Sacramento, CA 56.344 0.161 28036.877 79.982 Diocese of San Bernardino, CA 29.456 0.084 28066.333 80.066 Diocese of San Diego, CA 52.329 0.149 28118.661 80.215 Diocese of San Jose, CA 47.351 0.135 28166.012 80.350 Diocese of Santa Rosa, CA 20.984 0.060 28186.996 80.410 Diocese of Stockton, CA 13.584 0.039 28200.580 80.449 Archdiocese of Denver, CO 48.316 0.138 28248.896 80.587 Diocese of Colorado Springs, CO 7.342 0.021 28256.238 80.608 Diocese of Pueblo, CO 5.015 0.014 28261.253 80.622 Archdiocese of Hartford, CT 78.329 0.223 28339.582 80.845 Diocese of Bridgeport, CT 40.653 0.116 28380.235 80.961 Diocese of Norwich, CT 34.855 0.099 28415.090 81.061 Diocese of Wilmington, DE 38.934 0.111 28454.024 81.172 Archdiocese of Washington, DC 97.144 0.277 28551.168 81.449 Archdiocese of Miami, FL 82.973 0.237 28634.141 81.686 Diocese of Pensacola‐Tallahassee, FL 11.555 0.033 28645.697 81.719 Diocese of Orlando, FL 39.801 0.114 28685.498 81.832 Diocese of Palm Beach, FL 19.778 0.056 28705.276 81.889 Diocese of St. Augustine, FL 29.257 0.083 28734.533 81.972 Diocese of St. Petersburg, FL 45.830 0.131 28780.363 82.103 Diocese of Venice, FL 16.673 0.048 28797.036 82.150 Archdiocese of Atlanta, GA 20.755 0.059 28817.791 82.209 Diocese of Savannah, GA 21.957 0.063 28839.748 82.272 Diocese of Honolulu, HI 29.827 0.085 28869.575 82.357 Diocese of Boise, ID 18.847 0.054 28888.422 82.411 Archdiocese of Chicago, IL 267.816 0.764 29156.239 83.175 Diocese of Belleville, IL 38.081 0.109 29194.319 83.284 Diocese of Joliet, IL 69.734 0.199 29264.054 83.483 Diocese of Peoria, IL 52.905 0.151 29316.958 83.633 Diocese of Rockford, IL 49.088 0.140 29366.046 83.774 Diocese of Springfield, IL 54.801 0.156 29420.847 83.930 Archdiocese of Indianapolis, IN 72.384 0.206 29493.232 84.136 Diocese of Evansville, IN 28.278 0.081 29521.509 84.217 Diocese of Ft. Wayne‐South Bend, IN 50.862 0.145 29572.371 84.362 Diocese of Gary, IN 25.984 0.074 29598.356 84.436 Diocese of Lafayette, IN 21.502 0.061 29619.858 84.498 Archdiocese of Dubuque, IA 81.211 0.232 29701.069 84.729 Diocese of Davenport, IA 23.600 0.067 29724.669 84.797 Diocese of Des Moines, IA 16.540 0.047 29741.209 84.844 Diocese of Sioux City, IA 30.652 0.087 29771.861 84.931 Archdiocese of Kansas City, KS 46.470 0.133 29818.332 85.064 Diocese of Dodge City, KS 8.207 0.023 29826.539 85.087 Diocese of Salina, KS 16.472 0.047 29843.010 85.134 Diocese of Wichita, KS 37.461 0.107 29880.471 85.241 Archdiocese of Louisville, KY 53.230 0.152 29933.701 85.393 Diocese of Covington, KY 35.722 0.102 29969.423 85.495 Diocese of Lexington, KY 16.468 0.047 29985.891 85.542 Diocese of Owensboro, KY 18.605 0.053 30004.496 85.595 Archdiocese of New Orleans, LA 73.968 0.211 30078.464 85.806 Diocese of Alexandria, LA 9.256 0.026 30087.720 85.832

I-102 2005–06 PSS Data File User’s Manual and Survey Documentation
Diocese or archdiocese for Catholic schools (Continued) Cumulative Cumulative diocese Frequency Percent Frequency Percent Diocese of Baton Rouge, LA 32.549 0.093 30120.269 85.925 Diocese of Houma‐Thibodaux, LA 12.478 0.036 30132.746 85.961 Diocese of Lafayette, LA 32.715 0.093 30165.462 86.054 Diocese of Lake Charles, LA 8.267 0.024 30173.729 86.078 Diocese of Shreveport, LA 7.260 0.021 30180.988 86.098 Diocese of Portland, ME 20.634 0.059 30201.622 86.157 Archdiocese of Baltimore, MD 93.327 0.266 30294.949 86.423 Archdiocese of Boston, MA 152.715 0.436 30447.664 86.859 Diocese of Fall River, MA 33.418 0.095 30481.082 86.954 Diocese of Springfield, MA 27.158 0.077 30508.240 87.032 Diocese of Worcester, MA 33.535 0.096 30541.775 87.128 Archdiocese of Detroit, MI 117.392 0.335 30659.167 87.462 Diocese of Grand Rapids, MI 40.509 0.116 30699.676 87.578 Diocese of Gaylord, MI 16.328 0.047 30716.004 87.625 Diocese of Kalamazoo, MI 21.590 0.062 30737.594 87.686 Diocese of Lansing, MI 46.952 0.134 30784.546 87.820 Diocese of Marquette, MI 11.253 0.032 30795.799 87.852 Diocese of Saginaw, MI 25.908 0.074 30821.708 87.926 Archdiocese of St. Paul‐Minneapolis, MN 120.066 0.343 30941.773 88.269 Diocese of Crookston, MN 10.229 0.029 30952.002 88.298 Diocese of Duluth, MN 9.457 0.027 30961.459 88.325 Diocese of New Ulm, MN 17.323 0.049 30978.782 88.374 Diocese of St. Cloud, MN 39.652 0.113 31018.434 88.487 Diocese of Winona, MN 27.855 0.079 31046.289 88.567 Diocese of Biloxi, MS 16.821 0.048 31063.110 88.615 Diocese of Jackson, MS 16.520 0.047 31079.630 88.662 Archdiocese of St. Louis, MO 157.696 0.450 31237.326 89.112 Diocese of Jefferson City, MO 39.012 0.111 31276.339 89.223 Diocese of Kansas City‐St. Joseph, MO 39.708 0.113 31316.047 89.336 Diocese of Springfield‐Cape Girardeau, MO 26.558 0.076 31342.606 89.412 Diocese of Great Falls‐Billings, MT 14.632 0.042 31357.238 89.454 Diocese of Helena, MT 7.408 0.021 31364.646 89.475 Archdiocese of Omaha, NE 73.820 0.211 31438.465 89.686 Diocese of Grand Island, NE 9.433 0.027 31447.898 89.712 Diocese of Lincoln, NE 32.414 0.092 31480.312 89.805 Diocese of Las Vegas, NV 9.222 0.026 31489.534 89.831 Diocese of Reno, NV 7.263 0.021 31496.797 89.852 Diocese of Manchester, NH 39.401 0.112 31536.199 89.964 Archdiocese of Newark, NJ 151.054 0.431 31687.253 90.395 Diocese of Camden, NJ 61.143 0.174 31748.396 90.570 Diocese of Metuchen, NJ 48.705 0.139 31797.101 90.709 Diocese of Paterson, NJ 68.364 0.195 31865.465 90.904 Diocese of Trenton, NJ 55.215 0.158 31920.680 91.061 Archdiocese of Santa Fe, NM 19.543 0.056 31940.223 91.117 Diocese of Gallup, NM 11.435 0.033 31951.658 91.150 Diocese of Las Cruces, NM 5.227 0.015 31956.885 91.164 Archdiocese of New York, NY 278.976 0.796 32235.861 91.960 Diocese of Albany, NY 38.501 0.110 32274.362 92.070 Diocese of Brooklyn, NY 146.611 0.418 32420.974 92.488 Diocese of Buffalo, NY 91.549 0.261 32512.522 92.750 Diocese of Ogdensburg, NY 15.292 0.044 32527.814 92.793 Diocese of Rochester, NY 51.079 0.146 32578.893 92.939 Diocese of Rockville Centre, NY 73.373 0.209 32652.266 93.148 Diocese of Syracuse, NY 36.462 0.104 32688.728 93.252 Diocese of Charlotte, NC 19.816 0.057 32708.544 93.309 Diocese of Raleigh, NC 23.858 0.068 32732.402 93.377 Diocese of Bismarck, ND 14.552 0.042 32746.953 93.418 Diocese of Fargo, ND 12.168 0.035 32759.121 93.453 Archdiocese of Cincinnati, OH 127.965 0.365 32887.086 93.818 Diocese of Cleveland, OH 142.458 0.406 33029.544 94.225 Diocese of Columbus, OH 55.963 0.160 33085.507 94.384 Diocese of Steubenville, OH 18.950 0.054 33104.457 94.438 Diocese of Toledo, OH 92.321 0.263 33196.779 94.702 Diocese of Youngstown, OH 44.555 0.127 33241.334 94.829 Archdiocese of Oklahoma City, OK 22.858 0.065 33264.192 94.894

Appendix I. Public-Use Codebook: Descriptive Statistics for Categorical Variables—Weighted I-103
Diocese or archdiocese for Catholic schools (Continued) Cumulative Cumulative diocese Frequency Percent Frequency Percent Diocese of Tulsa, OK 12.409 0.035 33276.600 94.929 Archdiocese of Portland, OR 60.143 0.172 33336.743 95.101 Diocese of Baker, OR 1.012 0.003 33337.755 95.104 Archdiocese of Philadelphia, PA 249.243 0.711 33586.998 95.815 Diocese of Allentown, PA 65.228 0.186 33652.226 96.001 Diocese of Altoona‐Johnstown, PA 30.086 0.086 33682.312 96.087 Diocese of Erie, PA 39.282 0.112 33721.595 96.199 Diocese of Greensburg, PA 20.963 0.060 33742.558 96.259 Diocese of Harrisburg, PA 47.485 0.135 33790.042 96.394 Diocese of Pittsburgh, PA 95.904 0.274 33885.947 96.668 Diocese of Scranton, PA 55.452 0.158 33941.399 96.826 Diocese of Providence, RI 56.065 0.160 33997.464 96.986 Diocese of Charleston, SC 29.199 0.083 34026.663 97.069 Diocese of Rapid City, SD 6.234 0.018 34032.897 97.087 Diocese of Sioux Falls, SD 25.585 0.073 34058.483 97.160 Diocese of Knoxville, TN 9.329 0.027 34067.812 97.186 Diocese of Memphis, TN 28.210 0.080 34096.022 97.267 Diocese of Nashville, TN 21.631 0.062 34117.653 97.329 Archdiocese of San Antonio, TX 46.417 0.132 34164.070 97.461 Diocese of Amarillo, TX 7.175 0.020 34171.245 97.481 Diocese of Austin, TX 20.844 0.059 34192.089 97.541 Diocese of Beaumont, TX 6.168 0.018 34198.257 97.559 Diocese of Brownsville, TX 11.571 0.033 34209.828 97.592 Diocese of Corpus Christi, TX 15.411 0.044 34225.239 97.636 Diocese of Dallas, TX 38.101 0.109 34263.340 97.744 Diocese of El Paso, TX 11.292 0.032 34274.632 97.776 Diocese of Ft. Worth, TX 19.701 0.056 34294.333 97.833 Diocese of Galveston‐Houston, TX 64.247 0.183 34358.580 98.016 Diocese of Lubbock, TX 2.140 0.006 34360.720 98.022 Diocese of San Angelo, TX 2.068 0.006 34362.789 98.028 Diocese of Tyler, TX 4.220 0.012 34367.009 98.040 Diocese of Victoria, TX 14.192 0.040 34381.201 98.080 Diocese of Laredo, TX 7.187 0.021 34388.388 98.101 Diocese of Salt Lake, UT 15.532 0.044 34403.919 98.145 Diocese of Burlington, VT 16.493 0.047 34420.412 98.192 Diocese of Arlington, VA 72.936 0.208 34493.348 98.400 Diocese of Richmond, VA 55.946 0.160 34549.295 98.560 Archdiocese of Seattle, WA 74.493 0.213 34623.788 98.772 Diocese of Spokane, WA 17.862 0.051 34641.650 98.823 Diocese of Yakima, WA 7.288 0.021 34648.937 98.844 Diocese of Wheeling‐Charleston, WV 35.291 0.101 34684.229 98.945 Archdiocese of Milwaukee, WI 147.387 0.420 34831.616 99.365 Diocese of Green Bay, WI 75.576 0.216 34907.192 99.581 Diocese of La Crosse, WI 74.677 0.213 34981.869 99.794 Diocese of Madison, WI 49.541 0.141 35031.410 99.935 Diocese of Superior, WI 16.502 0.047 35047.912 99.982 Diocese of Cheyenne, WY 6.178 0.018 35054.090 100.000 Level of Instruction Cumulative Cumulative level Frequency Percent Frequency Percent Elementary 22869.998 65.242 22869.998 65.242 Secondary 2926.806 8.349 25796.804 73.591 Combined 9257.286 26.409 35054.090 100.000

I-104 2005–06 PSS Data File User’s Manual and Survey Documentation
Size of school (K‐12, UG) Cumulative Cumulative size Frequency Percent Frequency Percent Less than 50 students 15435.661 44.034 15435.661 44.034 50‐149 students 8408.121 23.986 23843.782 68.020 150‐299 students 6211.298 17.719 30055.080 85.739 300‐499 students 2844.254 8.114 32899.334 93.853 500‐749 students 1342.942 3.831 34242.276 97.684 750 students or more 811.814 2.316 35054.090 100.000 Percent minority students (K‐12, UG) Cumulative Cumulative perminor Frequency Percent Frequency Percent None 5319.649 15.176 5319.649 15.176 1 ‐ 9 percent 8748.420 24.957 14068.069 40.132 10 ‐ 29 percent 9213.176 26.283 23281.245 66.415 30 ‐ 49 percent 4218.370 12.034 27499.615 78.449 50 percent or more 7554.475 21.551 35054.090 100.000 Community type Cumulative Cumulative commtype Frequency Percent Frequency Percent Principal city 11672.480 33.298 11672.480 33.298 Urban fringe, large town 15156.541 43.238 26829.021 76.536 Rural or small town 8225.069 23.464 35054.090 100.000 Community type 2 Cumulative Cumulative commtyp2 Frequency Percent Frequency Percent Principal city 11672.480 33.298 11672.480 33.298 Urban fringe, large town, rural‐inside CBSA 18268.223 52.114 29940.703 85.413 Rural‐outside CBSA or small town 5113.387 14.587 35054.090 100.000 Urban‐centric community type (NCES assigned) Cumulative Cumulative ucommtyp Frequency Percent Frequency Percent City 11813.219 33.700 11813.219 33.700 Suburb 12798.756 36.511 24611.976 70.211 Town 3565.793 10.172 28177.768 80.384 Rural 6876.321 19.616 35054.090 100.000 Imputation Flag For P135 Cumulative Cumulative f_p135 Frequency Percent Frequency Percent Not imputed (original data) 33507.839 95.589 33507.839 95.589 Imputed by using other variables 1543.007 4.402 35050.846 99.991 Imputed by using a donor value 1.000 0.003 35051.846 99.994 Clerical imputation 2.244 0.006 35054.090 100.000 Imputation Flag For P140 Cumulative Cumulative f_p140 Frequency Percent Frequency Percent Not imputed (original data) 33464.574 95.466 33464.574 95.466 Imputed by using other variables 1586.127 4.525 35050.701 99.990 Imputed by using a donor value 1.000 0.003 35051.701 99.993 Clerical imputation 2.389 0.007 35054.090 100.000

Appendix I. Public-Use Codebook: Descriptive Statistics for Categorical Variables—Weighted I-105
Imputation Flag For P145 Cumulative Cumulative f_p145 Frequency Percent Frequency Percent Not imputed (original data) 34053.486 97.146 34053.486 97.146 Imputed by using other variables 991.095 2.827 35044.581 99.973 Imputed by using a donor value 1.000 0.003 35045.581 99.976 Clerical imputation 8.508 0.024 35054.090 100.000 Imputation Flag For P150 Cumulative Cumulative f_p150 Frequency Percent Frequency Percent Not imputed (original data) 33473.543 95.491 33473.543 95.491 Imputed by using other variables 1481.322 4.226 34954.865 99.717 Imputed by using a donor value 91.894 0.262 35046.759 99.979 Clerical imputation 7.330 0.021 35054.090 100.000 Imputation Flag For P155 Cumulative Cumulative f_p155 Frequency Percent Frequency Percent Not imputed (original data) 34536.047 98.522 34536.047 98.522 Imputed by using other variables 509.490 1.453 35045.537 99.976 Imputed by using a donor value 1.000 0.003 35046.537 99.978 Clerical imputation 7.552 0.022 35054.090 100.000 Imputation Flag For P160 Cumulative Cumulative f_p160 Frequency Percent Frequency Percent Not imputed (original data) 33454.665 95.437 33454.665 95.437 Imputed by using other variables 1396.348 3.983 34851.013 99.421 Imputed by using a donor value 194.495 0.555 35045.508 99.976 Clerical imputation 8.582 0.024 35054.090 100.000 Imputation Flag For P165 Cumulative Cumulative f_p165 Frequency Percent Frequency Percent Not imputed (original data) 33479.719 95.509 33479.719 95.509 Imputed by using other variables 1568.012 4.473 35047.731 99.982 Imputed by using a donor value 1.000 0.003 35048.731 99.985 Clerical imputation 5.359 0.015 35054.090 100.000 Imputation Flag For P170 Cumulative Cumulative f_p170 Frequency Percent Frequency Percent Not imputed (original data) 33453.006 95.433 33453.006 95.433 Imputed by using other variables 1595.713 4.552 35048.719 99.985 Imputed by using a donor value 2.074 0.006 35050.793 99.991 Clerical imputation 3.296 0.009 35054.090 100.000 Imputation Flag For P175 Cumulative Cumulative f_p175 Frequency Percent Frequency Percent Not imputed (original data) 33477.517 95.502 33477.517 95.502 Imputed by using other variables 1571.340 4.483 35048.858 99.985 Imputed by using a donor value 1.000 0.003 35049.858 99.988 Clerical imputation 4.232 0.012 35054.090 100.000

I-106 2005–06 PSS Data File User’s Manual and Survey Documentation
Imputation Flag For P180 Cumulative Cumulative f_p180 Frequency Percent Frequency Percent Not imputed (original data) 33464.577 95.466 33464.577 95.466 Imputed by using other variables 1587.391 4.528 35051.968 99.994 Imputed by using a donor value 2.122 0.006 35054.090 100.000 Imputation Flag For P185 Cumulative Cumulative f_p185 Frequency Percent Frequency Percent Not imputed (original data) 34563.953 98.602 34563.953 98.602 Imputed by using other variables 481.778 1.374 35045.731 99.976 Imputed by using a donor value 1.000 0.003 35046.731 99.979 Clerical imputation 7.359 0.021 35054.090 100.000 Imputation Flag For P190 Cumulative Cumulative f_p190 Frequency Percent Frequency Percent Not imputed (original data) 33440.084 95.396 33440.084 95.396 Imputed by using other variables 1430.260 4.080 34870.344 99.476 Imputed by using a donor value 177.303 0.506 35047.647 99.982 Clerical imputation 6.442 0.018 35054.090 100.000 Imputation Flag For P195 Cumulative Cumulative f_p195 Frequency Percent Frequency Percent Not imputed (original data) 34573.686 98.630 34573.686 98.630 Imputed by using other variables 474.072 1.352 35047.759 99.982 Imputed by using a donor value 1.000 0.003 35048.759 99.985 Clerical imputation 5.331 0.015 35054.090 100.000 Imputation Flag For P200 Cumulative Cumulative f_p200 Frequency Percent Frequency Percent Not imputed (original data) 33431.413 95.371 33431.413 95.371 Imputed by using other variables 1424.144 4.063 34855.557 99.434 Imputed by using a donor value 193.163 0.551 35048.719 99.985 Clerical imputation 5.371 0.015 35054.090 100.000 Imputation Flag For P205 Cumulative Cumulative f_p205 Frequency Percent Frequency Percent Not imputed (original data) 34515.872 98.465 34515.872 98.465 Imputed by using other variables 531.821 1.517 35047.693 99.982 Imputed by using a donor value 1.000 0.003 35048.693 99.985 Clerical imputation 5.397 0.015 35054.090 100.000 Imputation Flag For P210 Cumulative Cumulative f_p210 Frequency Percent Frequency Percent Not imputed (original data) 33423.925 95.350 33423.925 95.350 Imputed by using other variables 1428.564 4.075 34852.489 99.425 Imputed by using a donor value 196.209 0.560 35048.698 99.985 Clerical imputation 5.392 0.015 35054.090 100.000

Appendix I. Public-Use Codebook: Descriptive Statistics for Categorical Variables—Weighted I-107
Imputation Flag For P215 Cumulative Cumulative f_p215 Frequency Percent Frequency Percent Not imputed (original data) 34495.235 98.406 34495.235 98.406 Imputed by using other variables 552.532 1.576 35047.767 99.982 Imputed by using a donor value 1.000 0.003 35048.767 99.985 Clerical imputation 5.323 0.015 35054.090 100.000 Imputation Flag For P220 Cumulative Cumulative f_p220 Frequency Percent Frequency Percent Not imputed (original data) 33422.877 95.347 33422.877 95.347 Imputed by using other variables 1445.481 4.124 34868.358 99.470 Imputed by using a donor value 181.397 0.517 35049.755 99.988 Clerical imputation 4.335 0.012 35054.090 100.000 Imputation Flag For P225 Cumulative Cumulative f_p225 Frequency Percent Frequency Percent Not imputed (original data) 34500.916 98.422 34500.916 98.422 Imputed by using other variables 547.986 1.563 35048.902 99.985 Imputed by using a donor value 1.000 0.003 35049.902 99.988 Clerical imputation 4.187 0.012 35054.090 100.000 Imputation Flag For P230 Cumulative Cumulative f_p230 Frequency Percent Frequency Percent Not imputed (original data) 33417.599 95.332 33417.599 95.332 Imputed by using other variables 1444.755 4.122 34862.354 99.453 Imputed by using a donor value 187.401 0.535 35049.755 99.988 Clerical imputation 4.335 0.012 35054.090 100.000 Imputation Flag For P235 Cumulative Cumulative f_p235 Frequency Percent Frequency Percent Not imputed (original data) 34534.760 98.518 34534.760 98.518 Imputed by using other variables 511.657 1.460 35046.417 99.978 Imputed by using a donor value 1.000 0.003 35047.417 99.981 Clerical imputation 6.672 0.019 35054.090 100.000 Imputation Flag For P240 Cumulative Cumulative f_p240 Frequency Percent Frequency Percent Not imputed (original data) 33416.561 95.329 33416.561 95.329 Imputed by using other variables 1441.545 4.112 34858.106 99.441 Imputed by using a donor value 192.704 0.550 35050.810 99.991 Clerical imputation 3.279 0.009 35054.090 100.000 Imputation Flag For P245 Cumulative Cumulative f_p245 Frequency Percent Frequency Percent Not imputed (original data) 34518.670 98.473 34518.670 98.473 Imputed by using other variables 529.033 1.509 35047.703 99.982 Imputed by using a donor value 1.000 0.003 35048.703 99.985 Clerical imputation 5.387 0.015 35054.090 100.000
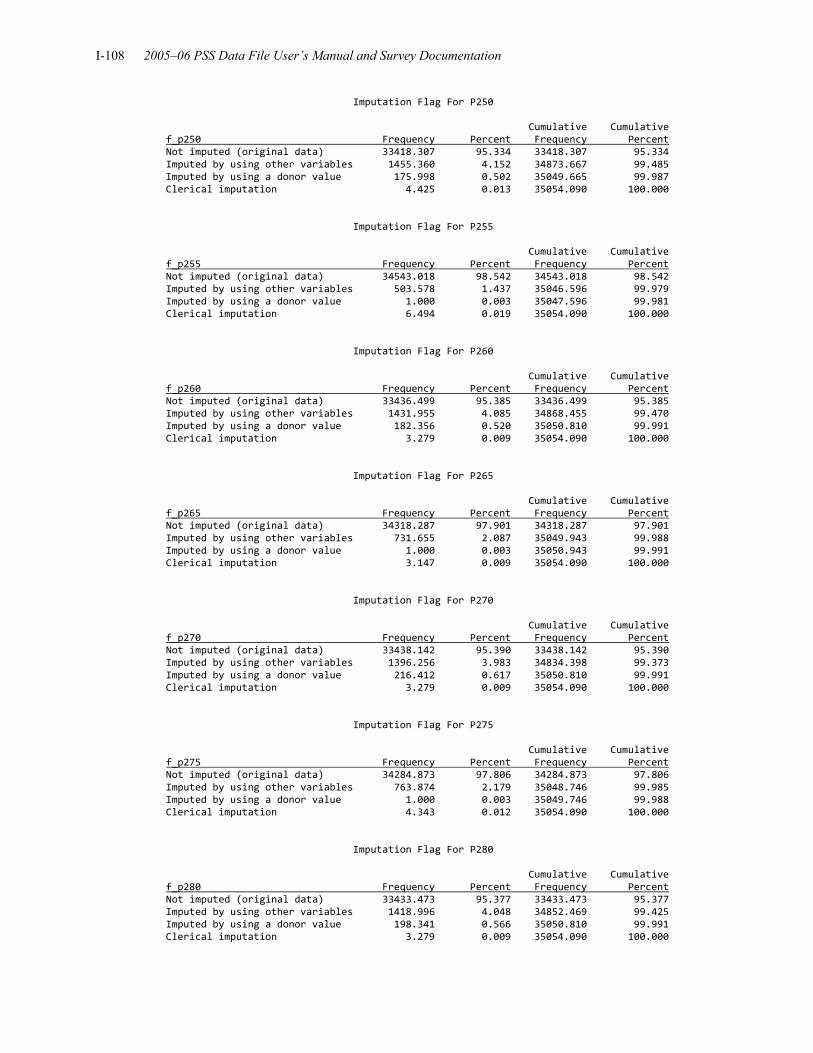
I-108 2005–06 PSS Data File User’s Manual and Survey Documentation
Imputation Flag For P250 Cumulative Cumulative f_p250 Frequency Percent Frequency Percent Not imputed (original data) 33418.307 95.334 33418.307 95.334 Imputed by using other variables 1455.360 4.152 34873.667 99.485 Imputed by using a donor value 175.998 0.502 35049.665 99.987 Clerical imputation 4.425 0.013 35054.090 100.000 Imputation Flag For P255 Cumulative Cumulative f_p255 Frequency Percent Frequency Percent Not imputed (original data) 34543.018 98.542 34543.018 98.542 Imputed by using other variables 503.578 1.437 35046.596 99.979 Imputed by using a donor value 1.000 0.003 35047.596 99.981 Clerical imputation 6.494 0.019 35054.090 100.000 Imputation Flag For P260 Cumulative Cumulative f_p260 Frequency Percent Frequency Percent Not imputed (original data) 33436.499 95.385 33436.499 95.385 Imputed by using other variables 1431.955 4.085 34868.455 99.470 Imputed by using a donor value 182.356 0.520 35050.810 99.991 Clerical imputation 3.279 0.009 35054.090 100.000 Imputation Flag For P265 Cumulative Cumulative f_p265 Frequency Percent Frequency Percent Not imputed (original data) 34318.287 97.901 34318.287 97.901 Imputed by using other variables 731.655 2.087 35049.943 99.988 Imputed by using a donor value 1.000 0.003 35050.943 99.991 Clerical imputation 3.147 0.009 35054.090 100.000 Imputation Flag For P270 Cumulative Cumulative f_p270 Frequency Percent Frequency Percent Not imputed (original data) 33438.142 95.390 33438.142 95.390 Imputed by using other variables 1396.256 3.983 34834.398 99.373 Imputed by using a donor value 216.412 0.617 35050.810 99.991 Clerical imputation 3.279 0.009 35054.090 100.000 Imputation Flag For P275 Cumulative Cumulative f_p275 Frequency Percent Frequency Percent Not imputed (original data) 34284.873 97.806 34284.873 97.806 Imputed by using other variables 763.874 2.179 35048.746 99.985 Imputed by using a donor value 1.000 0.003 35049.746 99.988 Clerical imputation 4.343 0.012 35054.090 100.000 Imputation Flag For P280 Cumulative Cumulative f_p280 Frequency Percent Frequency Percent Not imputed (original data) 33433.473 95.377 33433.473 95.377 Imputed by using other variables 1418.996 4.048 34852.469 99.425 Imputed by using a donor value 198.341 0.566 35050.810 99.991 Clerical imputation 3.279 0.009 35054.090 100.000

Appendix I. Public-Use Codebook: Descriptive Statistics for Categorical Variables—Weighted I-109
Imputation Flag For P285 Cumulative Cumulative f_p285 Frequency Percent Frequency Percent Not imputed (original data) 34264.644 97.748 34264.644 97.748 Imputed by using other variables 783.031 2.234 35047.675 99.982 Imputed by using a donor value 1.000 0.003 35048.675 99.985 Clerical imputation 5.415 0.015 35054.090 100.000 Imputation Flag For P290 Cumulative Cumulative f_p290 Frequency Percent Frequency Percent Not imputed (original data) 33435.196 95.382 33435.196 95.382 Imputed by using other variables 1414.717 4.036 34849.912 99.418 Imputed by using a donor value 201.923 0.576 35051.835 99.994 Clerical imputation 2.255 0.006 35054.090 100.000 Imputation Flag For P295 Cumulative Cumulative f_p295 Frequency Percent Frequency Percent Not imputed (original data) 34253.651 97.717 34253.651 97.717 Imputed by using other variables 794.047 2.265 35047.698 99.982 Imputed by using a donor value 1.000 0.003 35048.698 99.985 Clerical imputation 5.392 0.015 35054.090 100.000 Imputation Flag For P300 Cumulative Cumulative f_p300 Frequency Percent Frequency Percent Not imputed (original data) 33439.913 95.395 33439.913 95.395 Imputed by using other variables 1410.176 4.023 34850.090 99.418 Imputed by using a donor value 200.721 0.573 35050.810 99.991 Clerical imputation 3.279 0.009 35054.090 100.000 Imputation Flag For P305 Cumulative Cumulative f_p305 Frequency Percent Frequency Percent Not imputed (original data) 34622.264 98.768 34622.264 98.768 Imputed by using other variables 394.208 1.125 35016.472 99.893 Clerical imputation 37.618 0.107 35054.090 100.000 Imputation Flag For P310 Cumulative Cumulative f_p310 Frequency Percent Frequency Percent Not imputed (original data) 25315.199 72.218 25315.199 72.218 Ratio adjustment of original data 4569.223 13.035 29884.422 85.252 Imputed by using other variables 3452.642 9.849 33337.064 95.102 Imputed by using a donor value 661.934 1.888 33998.998 96.990 Clerical imputation 1055.091 3.010 35054.090 100.000 Imputation Flag For P315 Cumulative Cumulative f_p315 Frequency Percent Frequency Percent Not imputed (original data) 22556.877 64.349 22556.877 64.349 Ratio adjustment of original data 8219.041 23.447 30775.918 87.796 Imputed by using other variables 2549.930 7.274 33325.848 95.070 Imputed by using a donor value 660.328 1.884 33986.175 96.954 Clerical imputation 1067.914 3.046 35054.090 100.000

I-110 2005–06 PSS Data File User’s Manual and Survey Documentation
Imputation Flag For P320 Cumulative Cumulative f_p320 Frequency Percent Frequency Percent Not imputed (original data) 20254.389 57.780 20254.389 57.780 Ratio adjustment of original data 10760.890 30.698 31015.279 88.478 Imputed by using other variables 2340.883 6.678 33356.162 95.156 Imputed by using a donor value 647.000 1.846 34003.163 97.002 Clerical imputation 1050.927 2.998 35054.090 100.000 Imputation Flag For P325 Cumulative Cumulative f_p325 Frequency Percent Frequency Percent Not imputed (original data) 19941.792 56.889 19941.792 56.889 Ratio adjustment of original data 11097.840 31.659 31039.632 88.548 Imputed by using other variables 2307.837 6.584 33347.469 95.131 Imputed by using a donor value 647.054 1.846 33994.523 96.977 Clerical imputation 1059.567 3.023 35054.090 100.000 Imputation Flag For P330 Cumulative Cumulative f_p330 Frequency Percent Frequency Percent Not imputed (original data) 18149.004 51.774 18149.004 51.774 Ratio adjustment of original data 12912.524 36.836 31061.527 88.610 Imputed by using other variables 2265.775 6.464 33327.302 95.074 Imputed by using a donor value 665.065 1.897 33992.367 96.971 Clerical imputation 1061.722 3.029 35054.090 100.000 Imputation Flag For P335 Cumulative Cumulative f_p335 Frequency Percent Frequency Percent Not imputed (original data) 34861.647 99.451 34861.647 99.451 Imputed by using other variables 149.662 0.427 35011.309 99.878 Imputed by using a donor value 42.781 0.122 35054.090 100.000 Imputation Flag For P340 Cumulative Cumulative f_p340 Frequency Percent Frequency Percent Not imputed (original data) 31073.032 88.643 31073.032 88.643 Imputed by using other variables 3175.047 9.058 34248.079 97.701 Imputed by using a donor value 799.791 2.282 35047.871 99.982 Clerical imputation 6.219 0.018 35054.090 100.000 Imputation Flag For P345 Cumulative Cumulative f_p345 Frequency Percent Frequency Percent Not imputed (original data) 35026.115 99.920 35026.115 99.920 Imputed by using other variables 23.487 0.067 35049.602 99.987 Imputed by using a donor value 1.107 0.003 35050.709 99.990 Clerical imputation 3.381 0.010 35054.090 100.000
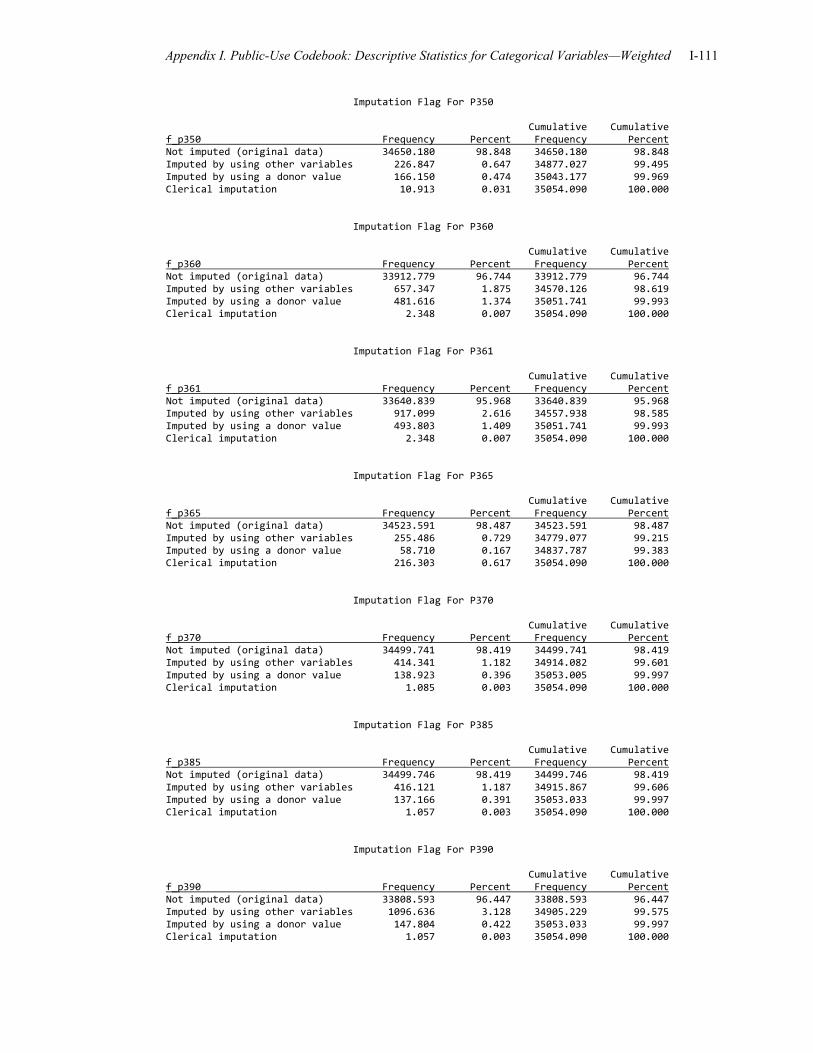
Appendix I. Public-Use Codebook: Descriptive Statistics for Categorical Variables—Weighted I-111
Imputation Flag For P350 Cumulative Cumulative f_p350 Frequency Percent Frequency Percent Not imputed (original data) 34650.180 98.848 34650.180 98.848 Imputed by using other variables 226.847 0.647 34877.027 99.495 Imputed by using a donor value 166.150 0.474 35043.177 99.969 Clerical imputation 10.913 0.031 35054.090 100.000 Imputation Flag For P360 Cumulative Cumulative f_p360 Frequency Percent Frequency Percent Not imputed (original data) 33912.779 96.744 33912.779 96.744 Imputed by using other variables 657.347 1.875 34570.126 98.619 Imputed by using a donor value 481.616 1.374 35051.741 99.993 Clerical imputation 2.348 0.007 35054.090 100.000 Imputation Flag For P361 Cumulative Cumulative f_p361 Frequency Percent Frequency Percent Not imputed (original data) 33640.839 95.968 33640.839 95.968 Imputed by using other variables 917.099 2.616 34557.938 98.585 Imputed by using a donor value 493.803 1.409 35051.741 99.993 Clerical imputation 2.348 0.007 35054.090 100.000 Imputation Flag For P365 Cumulative Cumulative f_p365 Frequency Percent Frequency Percent Not imputed (original data) 34523.591 98.487 34523.591 98.487 Imputed by using other variables 255.486 0.729 34779.077 99.215 Imputed by using a donor value 58.710 0.167 34837.787 99.383 Clerical imputation 216.303 0.617 35054.090 100.000 Imputation Flag For P370 Cumulative Cumulative f_p370 Frequency Percent Frequency Percent Not imputed (original data) 34499.741 98.419 34499.741 98.419 Imputed by using other variables 414.341 1.182 34914.082 99.601 Imputed by using a donor value 138.923 0.396 35053.005 99.997 Clerical imputation 1.085 0.003 35054.090 100.000 Imputation Flag For P385 Cumulative Cumulative f_p385 Frequency Percent Frequency Percent Not imputed (original data) 34499.746 98.419 34499.746 98.419 Imputed by using other variables 416.121 1.187 34915.867 99.606 Imputed by using a donor value 137.166 0.391 35053.033 99.997 Clerical imputation 1.057 0.003 35054.090 100.000 Imputation Flag For P390 Cumulative Cumulative f_p390 Frequency Percent Frequency Percent Not imputed (original data) 33808.593 96.447 33808.593 96.447 Imputed by using other variables 1096.636 3.128 34905.229 99.575 Imputed by using a donor value 147.804 0.422 35053.033 99.997 Clerical imputation 1.057 0.003 35054.090 100.000

I-112 2005–06 PSS Data File User’s Manual and Survey Documentation
Imputation Flag For P395 Cumulative Cumulative f_p395 Frequency Percent Frequency Percent Not imputed (original data) 33885.021 96.665 33885.021 96.665 Imputed by using other variables 1019.113 2.907 34904.134 99.572 Imputed by using a donor value 148.899 0.425 35053.033 99.997 Clerical imputation 1.057 0.003 35054.090 100.000 Imputation Flag For P400 Cumulative Cumulative f_p400 Frequency Percent Frequency Percent Not imputed (original data) 33732.772 96.231 33732.772 96.231 Imputed by using other variables 1169.288 3.336 34902.060 99.566 Imputed by using a donor value 150.973 0.431 35053.033 99.997 Clerical imputation 1.057 0.003 35054.090 100.000 Imputation Flag For P405 Cumulative Cumulative f_p405 Frequency Percent Frequency Percent Not imputed (original data) 33699.536 96.136 33699.536 96.136 Imputed by using other variables 1201.524 3.428 34901.060 99.563 Imputed by using a donor value 151.973 0.434 35053.033 99.997 Clerical imputation 1.057 0.003 35054.090 100.000 Imputation Flag For P410 Cumulative Cumulative f_p410 Frequency Percent Frequency Percent Not imputed (original data) 33956.210 96.868 33956.210 96.868 Imputed by using other variables 1040.505 2.968 34996.715 99.836 Imputed by using a donor value 56.318 0.161 35053.033 99.997 Clerical imputation 1.057 0.003 35054.090 100.000 Imputation Flag For P415 Cumulative Cumulative f_p415 Frequency Percent Frequency Percent Not imputed (original data) 34420.590 98.193 34420.590 98.193 Imputed by using other variables 379.413 1.082 34800.003 99.275 Imputed by using a donor value 52.442 0.150 34852.444 99.425 Clerical imputation 201.645 0.575 35054.090 100.000 Imputation Flag For P420 Cumulative Cumulative f_p420 Frequency Percent Frequency Percent Not imputed (original data) 34731.004 99.078 34731.004 99.078 Imputed by using other variables 243.865 0.696 34974.868 99.774 Imputed by using a donor value 79.221 0.226 35054.090 100.000 Imputation Flag For P425 Cumulative Cumulative f_p425 Frequency Percent Frequency Percent Not imputed (original data) 34996.965 99.837 34996.965 99.837 Imputed by using other variables 57.125 0.163 35054.090 100.000

Appendix I. Public-Use Codebook: Descriptive Statistics for Categorical Variables—Weighted I-113
Imputation Flag For P430 Cumulative Cumulative f_p430 Frequency Percent Frequency Percent Not imputed (original data) 34962.868 99.740 34962.868 99.740 Imputed by using other variables 40.646 0.116 35003.514 99.856 Clerical imputation 50.576 0.144 35054.090 100.000 Imputation Flag For P435 Cumulative Cumulative f_p435 Frequency Percent Frequency Percent Not imputed (original data) 34391.815 98.111 34391.815 98.111 Imputed by using other variables 529.296 1.510 34921.111 99.621 Imputed by using a donor value 80.691 0.230 35001.802 99.851 Clerical imputation 52.287 0.149 35054.090 100.000 Imputation Flag For P440 Cumulative Cumulative f_p440 Frequency Percent Frequency Percent Not imputed (original data) 34821.363 99.336 34821.363 99.336 Imputed by using other variables 167.512 0.478 34988.875 99.814 Clerical imputation 65.214 0.186 35054.090 100.000 Imputation Flag For P445 Cumulative Cumulative f_p445 Frequency Percent Frequency Percent Not imputed (original data) 34682.084 98.939 34682.084 98.939 Imputed by using other variables 317.921 0.907 35000.005 99.846 Imputed by using a donor value 20.957 0.060 35020.962 99.905 Clerical imputation 33.127 0.095 35054.090 100.000 Imputation Flag For P450 Cumulative Cumulative f_p450 Frequency Percent Frequency Percent Not imputed (original data) 28694.420 81.858 28694.420 81.858 Imputed by using other variables 6358.632 18.139 35053.051 99.997 Clerical imputation 1.039 0.003 35054.090 100.000 Imputation Flag For P455 Cumulative Cumulative f_p455 Frequency Percent Frequency Percent Not imputed (original data) 28695.458 81.861 28695.458 81.861 Imputed by using other variables 6358.632 18.139 35054.090 100.000 Imputation Flag For P460 Cumulative Cumulative f_p460 Frequency Percent Frequency Percent Not imputed (original data) 28695.458 81.861 28695.458 81.861 Imputed by using other variables 6358.632 18.139 35054.090 100.000 Imputation Flag For P465 Cumulative Cumulative f_p465 Frequency Percent Frequency Percent Not imputed (original data) 28695.458 81.861 28695.458 81.861 Imputed by using other variables 6358.632 18.139 35054.090 100.000

I-114 2005–06 PSS Data File User’s Manual and Survey Documentation
Imputation Flag For P467 Cumulative Cumulative f_p467 Frequency Percent Frequency Percent Not imputed (original data) 28695.458 81.861 28695.458 81.861 Imputed by using other variables 6358.632 18.139 35054.090 100.000 Imputation Flag For P468 Cumulative Cumulative f_p468 Frequency Percent Frequency Percent Not imputed (original data) 28695.458 81.861 28695.458 81.861 Imputed by using other variables 6358.632 18.139 35054.090 100.000 Imputation Flag For P470 Cumulative Cumulative f_p470 Frequency Percent Frequency Percent Not imputed (original data) 28695.458 81.861 28695.458 81.861 Imputed by using other variables 6358.632 18.139 35054.090 100.000 Imputation Flag For P480 Cumulative Cumulative f_p480 Frequency Percent Frequency Percent Not imputed (original data) 28695.458 81.861 28695.458 81.861 Imputed by using other variables 6358.632 18.139 35054.090 100.000 Imputation Flag For P485 Cumulative Cumulative f_p485 Frequency Percent Frequency Percent Not imputed (original data) 28695.458 81.861 28695.458 81.861 Imputed by using other variables 6358.632 18.139 35054.090 100.000 Imputation Flag For P490 Cumulative Cumulative f_p490 Frequency Percent Frequency Percent Not imputed (original data) 28695.458 81.861 28695.458 81.861 Imputed by using other variables 6358.632 18.139 35054.090 100.000 Imputation Flag For P492 Cumulative Cumulative f_p492 Frequency Percent Frequency Percent Not imputed (original data) 28695.458 81.861 28695.458 81.861 Imputed by using other variables 6358.632 18.139 35054.090 100.000 Imputation Flag For P495 Cumulative Cumulative f_p495 Frequency Percent Frequency Percent Not imputed (original data) 28695.458 81.861 28695.458 81.861 Imputed by using other variables 6358.632 18.139 35054.090 100.000

Appendix I. Public-Use Codebook: Descriptive Statistics for Categorical Variables—Weighted I-115
Imputation Flag For P500 Cumulative Cumulative f_p500 Frequency Percent Frequency Percent Not imputed (original data) 28695.458 81.861 28695.458 81.861 Imputed by using other variables 6358.632 18.139 35054.090 100.000 Imputation Flag For P505 Cumulative Cumulative f_p505 Frequency Percent Frequency Percent Not imputed (original data) 28695.458 81.861 28695.458 81.861 Imputed by using other variables 6358.632 18.139 35054.090 100.000 Imputation Flag For P510 Cumulative Cumulative f_p510 Frequency Percent Frequency Percent Not imputed (original data) 28695.458 81.861 28695.458 81.861 Imputed by using other variables 6358.632 18.139 35054.090 100.000 Imputation Flag For P515 Cumulative Cumulative f_p515 Frequency Percent Frequency Percent Not imputed (original data) 28695.458 81.861 28695.458 81.861 Imputed by using other variables 6358.632 18.139 35054.090 100.000 Imputation Flag For P520 Cumulative Cumulative f_p520 Frequency Percent Frequency Percent Not imputed (original data) 28695.458 81.861 28695.458 81.861 Imputed by using other variables 6358.632 18.139 35054.090 100.000 Imputation Flag For P525 Cumulative Cumulative f_p525 Frequency Percent Frequency Percent Not imputed (original data) 28695.458 81.861 28695.458 81.861 Imputed by using other variables 6358.632 18.139 35054.090 100.000 Imputation Flag For P530 Cumulative Cumulative f_p530 Frequency Percent Frequency Percent Not imputed (original data) 28695.458 81.861 28695.458 81.861 Imputed by using other variables 6358.632 18.139 35054.090 100.000 Imputation Flag For P535 Cumulative Cumulative f_p535 Frequency Percent Frequency Percent Not imputed (original data) 28695.458 81.861 28695.458 81.861 Imputed by using other variables 6358.632 18.139 35054.090 100.000

I-116 2005–06 PSS Data File User’s Manual and Survey Documentation
Imputation Flag For P540 Cumulative Cumulative f_p540 Frequency Percent Frequency Percent Not imputed (original data) 28695.458 81.861 28695.458 81.861 Imputed by using other variables 6358.632 18.139 35054.090 100.000 Imputation Flag For P542 Cumulative Cumulative f_p542 Frequency Percent Frequency Percent Not imputed (original data) 28695.458 81.861 28695.458 81.861 Imputed by using other variables 6358.632 18.139 35054.090 100.000 Imputation Flag For P545 Cumulative Cumulative f_p545 Frequency Percent Frequency Percent Not imputed (original data) 28695.458 81.861 28695.458 81.861 Imputed by using other variables 6358.632 18.139 35054.090 100.000 Imputation Flag For P550 Cumulative Cumulative f_p550 Frequency Percent Frequency Percent Not imputed (original data) 28695.458 81.861 28695.458 81.861 Imputed by using other variables 6358.632 18.139 35054.090 100.000 Imputation Flag For P555 Cumulative Cumulative f_p555 Frequency Percent Frequency Percent Not imputed (original data) 28695.458 81.861 28695.458 81.861 Imputed by using other variables 6358.632 18.139 35054.090 100.000 Imputation Flag For P560 Cumulative Cumulative f_p560 Frequency Percent Frequency Percent Not imputed (original data) 28695.458 81.861 28695.458 81.861 Imputed by using other variables 6358.632 18.139 35054.090 100.000 Imputation Flag For P565 Cumulative Cumulative f_p565 Frequency Percent Frequency Percent Not imputed (original data) 28695.458 81.861 28695.458 81.861 Imputed by using other variables 6358.632 18.139 35054.090 100.000 Imputation Flag For P570 Cumulative Cumulative f_p570 Frequency Percent Frequency Percent Not imputed (original data) 28695.458 81.861 28695.458 81.861 Imputed by using other variables 6358.632 18.139 35054.090 100.000

Appendix I. Public-Use Codebook: Descriptive Statistics for Categorical Variables—Weighted I-117
Imputation Flag For P575 Cumulative Cumulative f_p575 Frequency Percent Frequency Percent Not imputed (original data) 28695.458 81.861 28695.458 81.861 Imputed by using other variables 6358.632 18.139 35054.090 100.000 Imputation Flag For P580 Cumulative Cumulative f_p580 Frequency Percent Frequency Percent Not imputed (original data) 28695.458 81.861 28695.458 81.861 Imputed by using other variables 6358.632 18.139 35054.090 100.000 Imputation Flag For P585 Cumulative Cumulative f_p585 Frequency Percent Frequency Percent Not imputed (original data) 28697.622 81.867 28697.622 81.867 Imputed by using other variables 6356.468 18.133 35054.090 100.000 Imputation Flag For P590 Cumulative Cumulative f_p590 Frequency Percent Frequency Percent Not imputed (original data) 28695.458 81.861 28695.458 81.861 Imputed by using other variables 6358.632 18.139 35054.090 100.000 Imputation Flag For P595 Cumulative Cumulative f_p595 Frequency Percent Frequency Percent Not imputed (original data) 28695.458 81.861 28695.458 81.861 Imputed by using other variables 6358.632 18.139 35054.090 100.000 Imputation Flag For P600 Cumulative Cumulative f_p600 Frequency Percent Frequency Percent Not imputed (original data) 28695.458 81.861 28695.458 81.861 Imputed by using other variables 6358.632 18.139 35054.090 100.000 Imputation Flag For P602 Cumulative Cumulative f_p602 Frequency Percent Frequency Percent Not imputed (original data) 28695.458 81.861 28695.458 81.861 Imputed by using other variables 6358.632 18.139 35054.090 100.000 Imputation Flag For P605 Cumulative Cumulative f_p605 Frequency Percent Frequency Percent Not imputed (original data) 28695.458 81.861 28695.458 81.861 Imputed by using other variables 6358.632 18.139 35054.090 100.000

I-118 2005–06 PSS Data File User’s Manual and Survey Documentation
Imputation Flag For P610 Cumulative Cumulative f_p610 Frequency Percent Frequency Percent Not imputed (original data) 28695.458 81.861 28695.458 81.861 Imputed by using other variables 6358.632 18.139 35054.090 100.000 Imputation Flag For P615 Cumulative Cumulative f_p615 Frequency Percent Frequency Percent Not imputed (original data) 28695.458 81.861 28695.458 81.861 Imputed by using other variables 6358.632 18.139 35054.090 100.000 Imputation Flag For P620 Cumulative Cumulative f_p620 Frequency Percent Frequency Percent Not imputed (original data) 28695.458 81.861 28695.458 81.861 Imputed by using other variables 6358.632 18.139 35054.090 100.000 Imputation Flag For P622 Cumulative Cumulative f_p622 Frequency Percent Frequency Percent Not imputed (original data) 28695.458 81.861 28695.458 81.861 Imputed by using other variables 6358.632 18.139 35054.090 100.000 Imputation Flag For P625 Cumulative Cumulative f_p625 Frequency Percent Frequency Percent Not imputed (original data) 28695.458 81.861 28695.458 81.861 Imputed by using other variables 6358.632 18.139 35054.090 100.000 Imputation Flag For P630 Cumulative Cumulative f_p630 Frequency Percent Frequency Percent Not imputed (original data) 28695.458 81.861 28695.458 81.861 Imputed by using other variables 6358.632 18.139 35054.090 100.000 Imputation Flag For P635 Cumulative Cumulative f_p635 Frequency Percent Frequency Percent Not imputed (original data) 28695.458 81.861 28695.458 81.861 Imputed by using other variables 6358.632 18.139 35054.090 100.000 Imputation Flag For P640 Cumulative Cumulative f_p640 Frequency Percent Frequency Percent Not imputed (original data) 28694.420 81.858 28694.420 81.858 Imputed by using other variables 6358.632 18.139 35053.051 99.997 Clerical imputation 1.039 0.003 35054.090 100.000

Appendix I. Public-Use Codebook: Descriptive Statistics for Categorical Variables—Weighted I-119
Imputation Flag For P645 Cumulative Cumulative f_p645 Frequency Percent Frequency Percent Not imputed (original data) 32011.659 91.321 32011.659 91.321 Imputed by using other variables 1558.315 4.445 33569.975 95.766 Imputed by using a donor value 1471.050 4.197 35041.024 99.963 Clerical imputation 13.065 0.037 35054.090 100.000 Imputation Flag For P650 Cumulative Cumulative f_p650 Frequency Percent Frequency Percent Not imputed (original data) 33680.824 96.082 33680.824 96.082 Imputed by using other variables 749.473 2.138 34430.296 98.220 Imputed by using a donor value 605.863 1.728 35036.159 99.949 Clerical imputation 17.930 0.051 35054.090 100.000 Imputation Flag For P655 Cumulative Cumulative f_p655 Frequency Percent Frequency Percent Not imputed (original data) 33682.903 96.088 33682.903 96.088 Imputed by using other variables 753.688 2.150 34436.592 98.238 Imputed by using a donor value 584.895 1.669 35021.486 99.907 Clerical imputation 32.603 0.093 35054.090 100.000 Imputation Flag For P660 Cumulative Cumulative f_p660 Frequency Percent Frequency Percent Not imputed (original data) 34781.824 99.223 34781.824 99.223 Imputed by using other variables 184.667 0.527 34966.491 99.750 Imputed by using a donor value 87.599 0.250 35054.090 100.000

I-120 2005–06 PSS Data File User’s Manual and Survey Documentation
Descriptive Statistics for Location Variables—Weighted Variable Labels N Missing PPIN Permanent Identification Number 35,054.090 . PINST School name 35,054.090 . PADDRS Mailing address 35,036.608 17.481 PCITY City of mailing address 35,054.090 . PSTABB State postal code of mailing address 35,054.090 . PZIP Zip code of mailing address 35,054.090 . PZIP4 Zip4 code of mailing address 34,670.346 383.744 PCNTY FIPS County Code (mailing address of school) 35,054.090 . PCNTNM County name 35,054.090 . PL_ADD Street address for school's physical location 4,396.642 30,657.448 PL_CIT City for school's physical location 4,396.642 30,657.448 PL_STABB State for school's physical location 4,396.642 30,657.448 PL_ZIP Zip code for school's physical location 4,396.642 30,657.448 PL_ZIP4 Zip4 code for school's physical location 3,298.808 31,755.281 LATITUDE Latitude 31,115.355 3,938.735 LONGITUDE Longitude 31,115.355 3,938.735

J-1
Appendix J. Variable List for the 2005–06 PSS Address File Variable name Variable description PSS_SCHOOL_ID Unique school ID (NCES assigned) PSS_INST Name of the private school PSS_ADDRESS Mailing address PSS_CITY City name PSS_COUNTY_FIPS FIPS state and county code PSS_COUNTY_NAME County name PSS_FIPS FIPS state number PSS_STABB USPS state abbreviation PSS_ZIP5 5-digit zip code PSS_ZIP4 Zip+4 if assigned PSS_ZIP 9-digit zip code PSS_PHONE Telephone number of school PSS_LOGRADE Lowest grade taught PSS_HIGRADE Highest grade taught PSS_ENROLL_UG Count of ungraded students PSS_ENROLL_PK Count of prekindergarten students PSS_ENROLL_K Count of kindergarten students PSS_ENROLL_1 Count of 1st-grade students PSS_ENROLL_2 Count of 2nd-grade students PSS_ENROLL_3 Count of 3rd-grade students PSS_ENROLL_4 Count of 4th-grade students PSS_ENROLL_5 Count of 5th-grade students PSS_ENROLL_6 Count of 6th-grade students PSS_ENROLL_7 Count of 7th-grade students PSS_ENROLL_8 Count of 8th-grade students PSS_ENROLL_9 Count of 9th-grade students PSS_ENROLL_10 Count of 10th-grade students PSS_ENROLL_11 Count of 11th-grade students PSS_ENROLL_12 Count of 12th-grade students PSS_ENROLL_T Total students (ungraded & PK–12) PSS_ENROLL_TK12 Total students (ungraded & K–12) PSS_RACE_AI Count of American Indian/Alaska native students PSS_INDIAN_PCT Percentage of American Indian/Alaska native students PSS_RACE_AS Count of Asian/Pacific Islander students PSS_ASIAN_PCT Percentage of Asian/Pacific Islander students PSS_RACE_H Count of Hispanic students PSS_HISP_PCT Percentage of Hispanic students PSS_RACE_B Count of Black students PSS_BLACK_PCT Percentage of Black students PSS_RACE_W Count of White students PSS_WHITE_PCT Percentage of White students PSS_FTE_TEACH Count of full-time equivalent teachers PSS_STDTCH_RT Student/teacher ratio (PSS_ENROLL_TK12/PSS_FTE_TEACH) PSS_LOCALE Locale (Community type) PSS_COED Indicator (whether school is all-male, all-female, or coed) PSS_TYPE School program type/emphasis PSS_LEVEL School level (elementary, secondary, or combined)

J-2 2005–06 PSS Data File User’s Manual and Survey Documentation
Variable name Variable description PSS_RELIG School’s religious affiliation or orientation PSS_COMM_TYPE School urbanicity (collapsed locale code) PSS_SCH_DAYS Days per school year PSS_STU_DAY_HRS Length of school day in total hours (Including report minutes) PSS_LIBRARY Library or library media center PSS_ORIENT Religious orientation PSS_ASSOC_1- PSS_ASSOC_7 Membership affiliation (1)