2004 Floods in Bangladesh - World Bankdocuments.worldbank.org/curated/en/... · 2004 Floods in...
63
2004 Floods in Bangladesh Damage and Needs Assessment and Proposed Recovery Program PART 11 - SECTOR ANNEXES A Joint Report by The Asian Development Bank and The World Bank To the Government of Bangladesh January 5,2005 Public Disclosure Authorized Public Disclosure Authorized Public Disclosure Authorized Public Disclosure Authorized Public Disclosure Authorized Public Disclosure Authorized Public Disclosure Authorized Public Disclosure Authorized
Transcript of 2004 Floods in Bangladesh - World Bankdocuments.worldbank.org/curated/en/... · 2004 Floods in...
2004 Floods in Bangladesh
Damage and Needs Assessment and Proposed Recovery Program
PART 11 - SECTOR ANNEXES
A Joint Report by The Asian Development Bank
and The World Bank
To the Government of Bangladesh January 5,2005
Pub
lic D
iscl
osur
e A
utho
rized
Pub
lic D
iscl
osur
e A
utho
rized
Pub
lic D
iscl
osur
e A
utho
rized
Pub
lic D
iscl
osur
e A
utho
rized
Pub
lic D
iscl
osur
e A
utho
rized
Pub
lic D
iscl
osur
e A
utho
rized
Pub
lic D
iscl
osur
e A
utho
rized
Pub
lic D
iscl
osur
e A
utho
rized
Administrator
31628 V. 2


CURRENCY EQUIVALENTS Exchange rate effective September 26,2004
Currency Unit = Taka (Tk) 1 Taka = U S Dollar 0.0 16
1 U S Dollar = Taka 59
Acronyms and Abbreviations
ADB ADP AusAID BADC BMDA BMD BRDB BWDB CI DER DflD DPHE
DWASA ECLAC EMOP FA0 FAP FBCCI FFW FFWC FSS FY GDP GOB IDA E O IMF I-PRSP LCG LGED
MDG MFA MFDM NBR N C B NGO NHA OCHA PEDP 11 PFDS
Asian Development Bank Annual Development Plan Australian Agency for International Development Bangladesh Agriculture Development Corporation Barind Multipurpose Development Authority Bangladesh Meteorological Department Bangladesh Rural Development Board Bangladesh Water Development Board Cormgated Iron Disaster Emergency Response UK Department for International Development Department o f Public Health Engineering, Ministry o f Local Govemment, Rural Development and Cooperatives Dhaka Water and Sewerage Authority UN Economic Commission for Latin America and the Caribbean Emergency Operation Food and Agriculture Organization o f the United Nations Flood Action Plan Federation o f Bangladesh Chamber o f Commerce and Industry Food for Work Flood Forecasting and Waming Center Flood Forecasting System Fiscal Year Gross Domestic Product Govemment o f Bangladesh International Development Association International Labor Organization International Monetary Fund Interim Poverty Reduction Strategy Paper Local Consultative Group Local Govemment Engineering Department, Ministry o f Local Govemment, Rural Development and Cooperatives Millennium Development Goals Multi-Fiber Arrangement Ministry o f Food and Disaster Management National Board o f Revenue Nationalized Commercial Bank Non-governmental Organization National Housing Authority UN Office for Coordination o f Humanitarian Affairs Primary Education Development Project I1 Public Food Distribution System

Acronyms and Abbreviations (Cont’d)
PKSF PO PRGF PRSP PWD RHD SME SPARRSO SWAP TA UN UNDP UNESCO UNICEF USAID UZR UR VGF WB WFP
Palli Karma-Sahayak Foundation Partner Organizations Poverty Reduction and Growth Facility Poverty Reduction Strategy Paper Public Works Department, Ministry o f Housing and Public Works Roads and Highways Department, Ministry o f Communications Small and Medium Enterprises Bangladesh Space Research and Remote Sensing Organization Sector Wide Approach Technical Assistance United Nations United Nations Development Programme United Nations Educational and Scientific Organization United Nations Children’s Fund United States Agency for International Development Upazila Roads Union Roads Vulnerable Group Feeding World Bank World Food Program
.. 11

2004 FLOODS IN BANGLADESH DAMAGE AND NEEDS ASSESSMENT AND PROPOSED RECOVERY PROGRAM
PART - SECTOR ANNEXES
Preface
This report presents the preliminary assessment o f damage and needs resulting from the floods that affected Bangladesh from July through September 2004, and the proposed recovery and long- term mitigation program. Part I constitutes the main report, while this volume includes annexes with detailed assessments o f selected sectors.
The report was prepared by a joint team from the Asian Development Bank and the World Bank, in collaboration with the Govemment o f Bangladesh. Team members from the ADB include: Hans Carlsson (Joint Mission Team Leader), Kamal Ahmad, Faruque Ahmed, Shamsuddin Ahmed, Stefan Ekelund, Ki Hee Eye, Zahid Hossain, Nao Ikemoto, Eafiqul Islam, Eezaul Kar im Khan, Jamal Mahmood, S. Motin, Arun Saha, Ferdousi Sultana, and Tomoo Ueeda. Team members from the World Bank include: Mohinder S. Mudahar and Enrique Pantoja (Joint Mission Team Leaders), Nilufar Ahmad, G. M. Khurshid Alam, Mahmudul Alam, Mi tch Asada, Rafael Cortez, Subrata Dhar, Paul Dorosh, Eaihan Elahi, Nuran Ercan, Fabio Galli, Chandra Godavitame, Zahid Hussain, Zahed H. Khan, Kar in Kemper, Qaiser Khan, Khwaja Minnatullah, Jelena Pantelic, Christoph Pusch, Moh i U z Zaman Quazi, S.A.M. Eafiquzzaman, and Zoe Elena Trohanis.
To complete the assessment, the joint team worked closely with GOB and consulted widely with non-governmental organizations, other bilateral and intemational agencies, members o f academia, and the private sector. The team also visited several flood affected districts, including Bogra, Comilla, Gaibandha, Manikganj , Maulvibazar, Munshiganj , Mymensingh, Narayanganj , Sirajganj, Sunamganj, and Sylhet to meet with local authorities and communities and collect damage information.
The assessment team i s grateful to GOB for i t s considerable work to produce the preliminary damage assessments for al l o f the affected sectors, and i ts valuable comments on the draft Report. The team gratefully acknowledges the comprehensive reports prepared by the Disaster Emergency Response (DER) o f the Local Consultative Group (LCG) and other organizations that provided valuable insights, information and data on the impacts o f the floods.
The interim conclusions o f the assessment were discussed with GOB at the end o f September, and the draft report shared in mid November 2004. It should be kept in mind, however, that this i s a preliminary assessment based on the information available at the moment o f completion o f the report. Understanding o f the effects o f the floods can be expected to evolve as more information becomes available.
iii


TABLE OF CONTENTS
PART 11 . SECTOR -XES
ANNEX 1 . MACROECONOMIC IMPACTS ...................................................................................... 1 Short-term Macroeconomic Impact .................................................................................... 1 fiscal implications ............................................................................................................... 4 Economic Growth ........ : ...................................................................................................... 7 Developing an Appropriate Policy Response ................................................................... 10
A. B . C . D.
ANNEX 2 . SOCIAL IMPACTS ....................................................................................................... 11 A . B . C . D .
Food Security: Availability and Prices o f Food ................................................................ 11 Impact o f the 2004 floods on Assets. Employment. and Incomes .................................... 13 Government Response: Food Distribution Programs ....................................................... 14 Special Needs o f Women and Children ............................................................................ 15
ANNEX 3 . RAPID ENVIRONMENTAL IMPACT ASSESSMENT ..................................................... 18 A . B .
Environmental Impacts ..................................................................................................... 18 Needs and Actions ............................................................................................................ 19
ANNEX 4 . HOUSING .................................................................................................................... 20 A . Estimated Housing Damage ............................................................................................. 20 B . Estimated ReconstructionlRecovery Needs.. .................................................................... 22 C . Response to Housing Needs ............................................................................................. 22 D . Recommendations ............................................................................................................. 23
ANNEX 5 . TRANSPORT INFRASTRUCTURE ................................................................................ 25 Damage Assessment ......................................................................................................... 25 Reconstruction and Recovery Needs ................................................................................ 29 Social and Environmental Aspects ................................................................................... 30
A . B . C .
ANNEX 6 . WATER SUPPLY AND SANITATION ............................................................................ 31 Damage Assessment ......................................................................................................... 31
Implementation Arrangements and Coordination ............................................................. 33 Environmental and Social Aspects ................................................................................... 34
A . B . C . D .
Reconstruction And recovery Needs ................................................................................ 33
ANNEX 7 . PRIMARY AND POST-PRIMARY EDUCATION ............................................................ 35 Damage Assessment ......................................................................................................... 35 Reconstruction and Recovery needs ................................................................................. 36 Preparing for better flood r i sk management ..................................................................... 36
A . B. C .
ANNEX 8 . HEALTH AND NUTRITION .......................................................................................... 37 Response to Health Risks due to the Floods ..................................................................... 37 Damage Assessment ......................................................................................................... 37 Preparing for Better Flood Risk Management .................................................................. 38
A . B . C .
iv

ANNEX 9 . WATER RESOURCES MANAGEMENT ........................................................................ 39
Reconstruction And Recovery Needs ............................................................................... 40 A . B .
Damage Assessment ......................................................................................................... 39
ANNEX 10 . URBAN AND MUNICIPAL INFRASTRUCTURE .......................................................... 42 Damage Assessment ......................................................................................................... 42 Reconstruction and Recovery Needs ................................................................................ 42
A . B .
ANNEX 11 . TRADE AND INDUSTRY ............................................................................................ 44 Damage and Output loss Assessment ............................................................................... 44 Recovery Strategy ............................................................................................................ 46
A . B .
ANNEX 12 . AGRICULTURE (CROPS. LMSTOCK. AND FISHER~~ES) ......................................... 48 A . B . C .
Damage and Loss Assessment .......................................................................................... 48 Flood-Related Govemment Programs .............................................................................. 49 Recovery Needs and Strategy ........................................................................................... 50
ANNEX 13 . MICROCREDIT .......................................................................................................... 52 Possible Impact ofthe Floods ........................................................................................... 52 Funding Needs .................................................................................................................. 52 Policy Implications ........................................................................................................... 52
A . B . C .
V

ANNEX 1 - MACROECONOMIC IMPACTS
1.1 In addition to causing invaluable losses o f human lives and physical damage, the 2004 floods might impact efforts to meet some o f the Millennium Development Goals (MDGs). More specifically, total assets and output losses due to the floods i s estimated at around Tk 134 bi l l ion (US$2.3 billion), constituting 4.0 percent of GDP (see Table 1.1). While flooding significantly affected assets and outputs, the extent o f the former i s much larger than that o f the latter (damage to assets was almost 1.5 times as large as output losses), The private sector suffered almost al l o f the output losses, with agriculture accounting for nearly half o f the total losses, and 57 percent o f total asset losses. Housing, transport infrastructure, and agriculture suffered the most damage.
Table 1.1: Preliminary Estimates of Asset and Output Loss due to the 2004 Floods (Tk in million)
Housing
Transport Infrastructure
BWDB’s FCDf i Schemes
Water Supply and Sanitation
Dhaka W A S A
Urban Municipalities
Primary Schools
Post-Primary (Sec. schools and colleges)
Health
Agriculture, Livestock & Fisheries
Industry
Wholesale & Retail Trade
Power
Others (small losses from several agencies)
Total in Tk Million
Total in US$ Million
Percent of (FY04) GDP
Asset Loss 1 Output Loss I
27,500 i i
20,000 1 11,500 1
4,000 i 900 . I 1,400
3,100
2,400
1,800
400
1 1,800
4,000 ’
1,600
900
79,800
26,600
5,600
1 1,000
I 54,700
1,350 1 930
2.4 I I 1.6 i
Total 27,500
3 1,500
4,000
900
1,400
3,100
2,400
1,800
400
38,400
9,600
1 1,000
1,600
900
134,500
2,280
4.0
YO of Total 20.4
23.4
3.0
0.7
1 .o 2.3
1.8
1.3
0.3
28.6
7.1
8.2
1.2
0.7
100
Sources: Based on GOB data & Asian Development Bank I World Bank Staff estimates. Notes: Table includes public and private sector losses; the nominal exchange rate i s Tk 59 per U S dollar.
A. SHORT-TERM MACROECONOMIC IMPACT
1.2 T h i s section focuses on the short-term (2004105) macroeconomic impact o f the floods on Bangladesh’s economy, particularly on the balance o f payments, the central government budget, economic growth, inflation, and food security. Table 1.2 summarizes the impact on key economic indicators.
1

Table 1.2: Impact of Floods on Key Economic Indicators
GDP Growth ( percent) Agriculture ( percent) Manufacturing ( percent) CPI Inflation Balance of Payments Exports
FY02 1 FY03 I FY04 I FYO5
4.4 i 5.3 i 5.5 / 5.5 / 5.2 .01 1 3.1 2.7 I 3.3 1 3.0
' 1 I I Pre-Flood , PostFlood
5.5 1 6.8 I 7.4 1 6.2 1 5.3 2.8 , 4.4 I 5.8 1 5.5 I 7.5 $ in billions 5.9 1 6.5 1 7.6 I 7.9 1 8.4
(Annual percent change)
(Annual percent change) Gross official reserves Reserves in months o f imports
Imports ! 12.0 I 11.3 I 15.0 1 3.2 / 2.9
-7.6 1 9.5 1 16.1 I 5.1 7.7 i 9.7 10.9 I 11.1 -8.7 1 13.0 12.5 I 10.0 1.6 . 1 2.5 1 2.7 1 3.0 2.1 , 2.9 I 2.7 j 3.0
~
Central government operations Total Revenue Total Expenditure
Domestic financing Overall budget deficit
Money and credit Broad money Private sector credit
1.3 The balance of payments position may worsen somewhat on account of the floods. Export growth reached 16.1 percent in FY04, which was stronger than expected as compared to 9.5 percent in FY03. Growth was driven by the ready-made garment (RMG) and frozen food industries. Import growth was also buoyant, mainly reflecting increases in inputs required by the garment sector. Combined with continued strong remittances, the extemal current account balance had a surplus equivalent to 0.1 percent o f GDP in FY04, compared to 0.6 percent surplus in FY03. FY05 started with improved current, account surplus amounting to US$200 mil l ion in July 2004, compared to US$158 mil l ion in July 2003. This reflected 28 percent growth in exports and nearly 11 percent growth in remittances, which swamped 19 percent growth in imports. However, for the year as a whole before the flood, the current account was projected to have a deficit equivalent to 0.9 percent o f GDP, as a slowdown in export growth was expected with the W A phase-out. The flood i s l ikely to exacerbate this slowdown.
Percent of GDP
14.9 i 13.7 ' 13.3 15.5 ! 15.4
2.6 I 1.3 , 2.1 , 1.9 , 2.4 End of year, percent Change 13.1 15.6 1 13.4 j 12.6 1 14.0 13.9 12.6 1 12.0 * 13.3 1 13.8
10.2 , 10.3 1 10.1 1 11.1 1 10.7
4.7 3.4 1 3.2 1 4.3 i 4.7
1.4 A reduced export growth rate and additional flood-induced imports could result in a widening o f the current account deficit to 1.1 percent o f GDP in FY05, even after taking into account increases in remittances' and current official grants in response to the UN Flash Appeal. Assuming an unchanged pre-flood foreign exchange reserve target o f US$3 bi l l ion by end-June FY05, the extemal financing gap could be in the order o f US$SOO mill ion. If not met by additional assistance, this would create pressure on reserves. Fortunately, unlike in 1998, this year Bangladesh has in place a floating exchange rate regime which will absorb the pressure on reserves. At the end o f June in 1998, Bangladesh's gross reserves were US$1.8 bil l ion (equivalent to 2.8 months o f imports), whereas now gross reserves are US$3.1 bi l l ion (equivalent to 3.7 months o f imports). The Government i s committed to this regime and should continue to confine i t s interventions to countering disorderly conditions and building reserves to desired levels.
Remittances during July-August 2004 had 15.7 percent growth relative to the corresponding period ofthe previous year.
2

1.5 I m p o r t levels are projected to increase, although the impact of the floods on import demand cannot be easily estimated. On the one hand, post-flood relief and rehabilitation i s l ikely to require the import o f selected products, particularly construction materials (CI sheets, cement, and steel) for making repairs to road links, rehabilitating damaged embankments and repairing schools, and health and sanitation facilities. Aided food imports are also l ikely to be higher than they otherwise would have been in the absence o f floods. On the other hand, a fall in real income and import-intensive exports has a depressing effect on import demand. Historically, however, import growth in dollar terms has tended to increase in the aftermath o f floods, both in 1987188 and 1998. Import growth in FY05 was projected to decline to 10.0 percent, compared to the 13.6 percent achieved in FY04, because o f a decline in export growth. Given current trends, this figure i s likely to be higher at about 15.0 percent.
Box 1: Impact of the Flood on External Sector Indicators Floods temporarily reduce export growth, increase imports, remittances and foreign assistance.
Chart 1.1: Export growth (%) I 1-Annual QfOwth -$year moving average g m ~ ( h
Chart 1.3: RMG Export growth FY90-04
I
40
20
0
-7a -Annual gmWm -&year moving average growth
Chart 1.5: Remittance growth (%)
Chart 1.2: RMG Export growth FY81-89
200 100 h d 0
Chart 1.4: Import growth
50 .
-Annual growth -5-year moving average growth
Chart 1.6: Foreign Assistance growth (%)
3

1.6 Export performance i s likely to be affected, but not as much as after the 1998 floods. Export growth in July 2004 relative to July 2003 was 28 percent, driven by 27.4 percent growth in export volume (Box 1). Knitwear exports +creased by nearly 48 percent and woven garment exports by almost 18 percent. Frozen food exports declined by 0.6 percent. Exports to United States markets increased by 27 percent and to the European Union (EU) by 28 percent. The floods clearly did not affect July exports. However, production in many o f the RMG units in Dhaka and Narayanganj were disrupted by the floods for 3 to 4 weeks. The fisheries and shrimp sectors also suffered. A number o f export-oriented units suffered indirectly because their workers were unable to come to the factories andor because supply o f raw materials was disrupted.
1.7 While export growth has tended to decline in the flood year, it has historically bounced back the year after. Export growth in FY99 declined to 3.5 percent, compared to 17.7 percent in FY98 since the 1998 floods made both the production and shipment o f goods extremely difficult in FY99. A large number o f garment and knitwear factories were under water for over 8 weeks on average, Most road and rai l links were cut-off, including the critical Dhaka-Chittagong route, making the shipment o f goods difficult and expensive, Some export orders were affected due to buyers’ loss o f confidence in the ability o f the exporters to meet delivery schedules.
1.8 The above adversities seemed to have been o f a smaller scale during the 2004 floods. Because o f the shorter duration and smaller extent o f flooding, the export-oriented manufacturing sector was not affected as much in 2004 as it was in 1998. The garment sector i s more resilient now and can be expected to make up for the production time lost during July 2004, as it has done in previous years when the sector was adversely affected by hartah (strikes) and political agitation. Export growth was projected to decline from the 16.1 percent achieved in FY04 to 5.1 percent in FY05 because o f the MFA phase out. Recent trends have been more positive than expected, however, and overall export growth could reach at least 12.0 percent this fiscal year.
B. FISCAL IMPLICATIONS
The Budget
1.9 The relief effort, expansion in food-assisted safety nets, repairs to public property and the impact o f the floods on economic growth are l ikely to put pressure on both the revenue and expenditure sides o f the budget. The overall budget deficit can be expected to rise from 3.2 percent o f GDP in FY04 to 4.7 percent in FY05, overshooting the original FY05 target o f 4.3 percent o f GDP. As a result, a financing gap i s l ikely to emerge, given the ambitious external financing target in the FY05 budget. A redeeming feature o f the fiscal situation i s that the FY05 budget already has an ostensible pro-agriculture, pro-poor stance. Increased budgetary allocations towards supporting agriculture and rural development and expanding the targeted poverty alleviation programs are already in place. Full and effective utilization o f these funds can go a long way towards the rehabilitation o f the rural economy and restoring the livelihoods o f the flood-affected poor.
1.10 The experience o f both the 1988 and 1998 floods show that current expenditures tend to rise significantly in the flood year, but then growth declines in the succeeding year (Box 2). There i s some probability that the revenue ,expenditures would overshoot the overall target despite the allocations that exist in FY05 Revenue Budget and the FY05 Food Account. These include the Tk 6 bil l ion provided for farm subsidies, Tk 12 bi l l ion for Unforeseen Expenditure Management, Tk 4.6 bi l l ion for “Others” Block Allocations, Tk 2 bi l l ion for the Micro Entrepreneur Development Fund, and an additional Tk 4 bi l l ion allocated for a food-based safety net program in the food budget.
4

Box 2: Impact of the Flood on Fiscal Indicators Tax revenues are adversely affected by floods and both recurrent and ADP expenditures get a boost.
Chart 2.1: Tax revenue growth
--
-Annual growth -&year moving average
Chart 2.3: ADP growth (%)
I 30
20
10
0
-10
-20
Chart 2.2: Revenue expenditure growth
-Annual growth -5-yr moving average Ir.
Chart 2.4 Growth in credit to Central Govt
loo I
-Annual growth -5-yr moving eveage I I -Annual gmwth -5-y moving average
1.1 1 The Government, however, i s committed to meet pre-existing, competing demands, including subsidies to electricity consumption in irrigation and agriculture-related activities, increased cash incentives (from 25 to 30 percent) for export o f agricultural products (especially fruits and vegetables), expansion in programs for the socially disadvantaged, expanded microcredit programs through Government departments and the Palli Karma-Sahayak Foundation (PKSF), Pay Commission awards, and the retraining and creation o f employment opportunities for voluntarily-retired state owned enterprise (SOE) employees and unemployed garment workers.
1.12 The floods created additional, urgent demands. The Government will have to help the flood-affected farmers commence production. The most immediate need was to re-plant rice for the winter crops under the Transplanted aman rice cultivation program. The farmers needed seeds, fertilizer, farm machines and fuel. Farmers may also use STWIDTW-based irrigation wate? for the winter crops. In addition to providing 5 kg seed o f aman rice and 25 kg fertilizers each to 1.9 mil l ion marginal farmers, the Government needs to ensure adequate supplies o f seeds o f maize, pulses, wheat, vegetables and bovo so that these are available to the farmers in time.
1.13 Another area where the farmers need assistance i s with the health o f their cattle. Thousands o f cattle have already died, which might create a draught power crisis in the coming season, The surviving ones in the affected areas are l ikely to suffer from malnutrition and disease.
STW shallow tubewell; DTW deep tubewell.
5

The Govemment needed to provide essential veterinary medicines and vaccines to the seriously affected areas. The FY05 target for food distribution through the Public Food Distribution System (PFDS) i s 1.3 mill ion mt. This will be revised upwards to take into account the additional food distributed as flood relief. Other costs l ikely to increase current expenditures include the need to provide assistance to the manufacturing sector for rehabilitation; grants to dislocated people; and other increased operations and maintenance (O&M) expenditures to repair infrastructure damage.
1.14 The Government would redirect expenditures from the Annual Development Program (ADP) towards the repair of damaged infrastructure. Actual ADP implementation i s usually wel l below the budgeted ADP. Floods tend to reduce the ADP shortfall by augmenting demand for fast disbursing expenditures. Considering t h i s and assuming that the Govemment would be able to achieve significant reallocation o f ADP funds to finance non-food imports and pay for repairing damages to public assets, it seems reasonable to assume that the actual ADP expenditures can st i l l be contained within the FY05 budget target Tk 220 billion. Implementation shortfall o f the ADP i s normally about 10-15 percent relative to the original budget target, but this tends to improve in flood years. ADP utilization was almost 100 percent o f the original budget target in both FY89 and FY90. In FY99, ADP implementation shortfall dropped to 8 percent relative to the original budget target, compared with 14 percent the previous year. Th is year the funds that can possibly be reallocated are potentially sizeable. The Govemment has indicated willingness to reallocate 10 percent o f ADP for post-flood rehabilitation and reconstruction activities. As a result, i t i s therefore reasonable to assume that the ADP implementation shortfall could decline to less than 10 percent.
1.15 The flood i s also likely to have an adverse impact on revenue collections. The FY05 budget revenue targets are ambitious. The revenue-GDP ratio i s projected to increase from 10.5 percent in FY04 to 11 percent in FY05, implying a revenue growth o f about 20 percent relative to the FY04 revenue outturn. The largest increase i s assumed to be from taxes, which are projected to grow by nearly 23 percent relative to the actual FY04 tax collection estimate. While this i s not unprecedented, achieving it would require diligent implementation o f the strategy adopted for the expansion o f tax base, simplification and rationalization o f the tax system, increased transparency and efficiency in revenue administration, creation o f a Central Intelligence Cell in the National Board o f Revenue (NBR), decentralization o f revenue administration, reduction o f the discretionary powers o f tax officials, increase in manpower o f the revenue collection authorities, and efficient application o f information technology for strengthening monitoring activities and preventing tax evasion. Historically, in both 1988 and 1998, growth in revenue collections declined in both the flood year and the subsequent one. Thus the challenge o f achieving the FY05 budget revenue target has become al l the more formidable with the shrinking o f the tax base resulting from lower than expected growth because o f the floods. In the absence o f new measures to broaden the tax base, strengthen the incentive for compliance and plug leakage, i t will be difficult for the Government to even come close to achieving the revenue targets.
Money and Credit
1.16 Monetary accommodation may need to continue. Monetary policy stance started to become somewhat accommodative toward erid June 2004. However, for the year as a whole, monetary growth declined from 15.6 percent in FY03 to 13.4 percent in FY04. Private sector credit grew by 13.3 percent in FY04, driven mostly by lending o f private banks.3 Monetary growth was targeted to decline further to 12.6 percent in FY05 under the monetary program
Lending from nationalized commercial banks (NCBs) was restrained according to the memoranda o f understanding (MOU) with the individual banks.
6

agreed as part o f the Fund’s Poverty Reduction and Growth Facility (PRGF). Th is figure required adjustment to accommodate the rise in private sector credit needs. The Government has already taken steps for increased credit disbursement towards agricultural rehabilitation. The Finance Ministry has issued guidelines for Bangladesh Bank, the three NCBs, and two specialized banks to disburse new credit and suspend realization o f farm loans in the flood-affected areas for a year, including rescheduling all outstanding loans and relaxing rules for down-payment by the defaulters. The NCBs, specialized banks and state-run non-bank financial institutions increased their agricultural loan disbursement target for the fiscal year by 25 percent.
1.17 A moderate expansionary stance in monetary management may thus be desirable for the sake o f economic recovery if the increased disbursements were to meet the genuine short-run working capital needs and if the credit was paid back in time. Given the need to ensure adequate credit for agriculture in the aftermath o f the flood, a modest increase in the FY05 targets for private sector credit from 13.4 percent to 15.0 percent, and broad money growth from 12.6 percent to 14.0 percent should be considered. At the same
Impact of Flood on Private Sector Credit Growth
70 60 I
I -Annual growth -5-yr moving average
fime, the authorities need to maintain caution to make sure that the suspension o f loan recoveries i s strictly contained. Given that, a modest upward revision o f the net lending limit by each N C B from the current 5 percent to 8 percent, in line with the upward revision in private sector credit growth target, could be considered.
C. ECONOMIC GROWTH
1.18 Although the floods caused enormous suffering, impoverishment, and extensive damage to real assets in the public and private sectors, i t s impact on economic growth i s not l ikely to be dramatically large, provided that the economic recovery effort i s wel l managed and additional shocks do not occur in the next few months. Assumptions on the likely growth in the 15 national accounts sectors are based on past flood experience and recent growth trends (Box 1.3). The overall GDP growth for FY05 i s projected at 5.2 percent, lowered than the pre-flood projection o f 5.5 percent and the Government target o f 6 percent. The overall growth impact does not reflect the proportional impact o f the floods on the poor. While farmers can replant crops and businesses can recoup losses by working extra shifts, those earning their livelihoods on a daily basis, such as day laborers, are the worst affected by the disruption in economic activities.
1.19 The immediate, most visible impact of the floods i s the direct and indirect effects on the economy’s output. Output losses in agriculture and industry and disruption in the provision o f services during the floods directly affect growth. The indirect effects arise from the damage caused to the stock o f capital, infrastructure assets, raw and intermediate materials and erosion and sedimentation o f land. In general, the magnitude o f losses depends on the extent o f flooding, i t s duration, and water levels during the floods. The impact o f these losses on growth depends on the timing o f the floods, the recession o f water, and the pace o f reconstruction and rehabilitation o f infrastructure, as well as overall economic management, In comparison to the flood o f 1998 and 1987188, the floods in 2004 have been less severe in terms of the extent o f area inundated, duration o f flood, and persons affected, but more severe in terms o f damage caused to areas adjacent to major rivers. Preliminary estimates indicate that direct output losses due to floods in 2004 may have been about 1.5 percent o f GDP, almost entirely in the private sector, Losses to
7

assets may have been in the order o f 2.3 percent o f GDP, o f which 43 percent i s in the public sector on account o f damage to infrastructure.
Box 1.3: Impact of the Flood on Overall and Sectoral Growth Rates
]-A& growth -$yea mwim averagegrowth
Chart 3.1: GDP growth
I
+0' +B" 60' ++ +@ .@ #at -Annual gmMh -5-9 moving average
growth (%)
I
Chart 3.5: Transport & communication I
I ' 0 1 I
O l ....................... 1 $4 +"" *.81 e"" *493 e"" e@ +d"
-Annual growth -.%year moving average gnrnnh
manufacturing growth (%)
cc"' *& *<@ @"" @93 cc"" .$@ $=id" I -Annual gmwth -5-year moving average growth
Chart 3.2: Wholesale 8 retail trade
IO, 1
-Annual gmwth -5-9 moving average
Chart 3.4 Growth in large & mediumscale manufacturing
1 5 1 I
-Annual growth -&year moving average growl
Chart 3.6: Construction growth
*."' .$@ *-id $A"" *.Q% .$"" *@ *& -Annuel gmwth -&year moving average growth
Chart 3.8: Fisheries growth ( X )
1 1 1 1 . 1 1
-x, J
- A m growth -Byear mwng averagegrowti
1.20 The timing o f this year's flood was in between the harvesting o f boro crop and the transplanting o f aman, the two major rice crops. Since the flood came early in 2004 and started receding in late July, the farmers may not have completely missed planting high yielding varieties o f aman, whose cut-off transplanting date i s August 15. Farmers also had the opportunity to transplant local variety aman whose cut-off transplanting date i s generally between September 15
8
and 30. If the availability and distribution o f seeds, fertilizer and credit i s managed satisfactorily, there i s a possibility of partly (if not completely) recovering the damage to crop sector growth caused by the floods. After the 1998 floods, crop growth in FY99 was higher than in FY98. Damage to poultry and livestock were about the same this year as in FY98. Growth in this sector in FY99 was about the same as in FY98. Pond fisheries were severely affected, causing losses at the individual level, but not necessarily to the economy. The fish have been released to open water where they will breed and grow. Due to the vast flooded area available as habitat, the actual fish catch may increase after the recession o f flood water.
1.2 1 According to the Board o f Investment (BOI), damage to industry this year has not been as severe as in 1998. Knit industries in Narayanganj and Narsingdi and small industries (handlooms) in Sirajgong have been affected. Small scale manufacturing growth i s likely to be hit harder than the large scale manufacturing sector, as took place both during the 1998 and 1987188 floods. In 1998, over 5,000 small, medium and large industries were inundated by 4 to 6 feet o f water for about 8-10 weeks. Rapid submersion o f smaller scale units located in rural and semi-urban areas resulted in closures, damage to machinery, and production losses.
1.22 The road network was badly affected in 2004, but unlike during the 1998 floods, neither the Dhaka-Chittagong road link nor the rai l link was disrupted. Thus, the overall impact on the transportation sector should not be too negative, The reconstruction effort could provide a boon to construction, but all o f i t may not necessarily take place this fiscal year. Floods reportedly slowed activities in commercial banks, but this will change when rehabilitation activities start in the rural areas. Wholesale and retail trade may have been disrupted, but not for a long period. Loss in growth on account o f disruption during the floods should at least be partially recovered due to increased reconstruction and rehabilitation-related trading activities.
Inflation
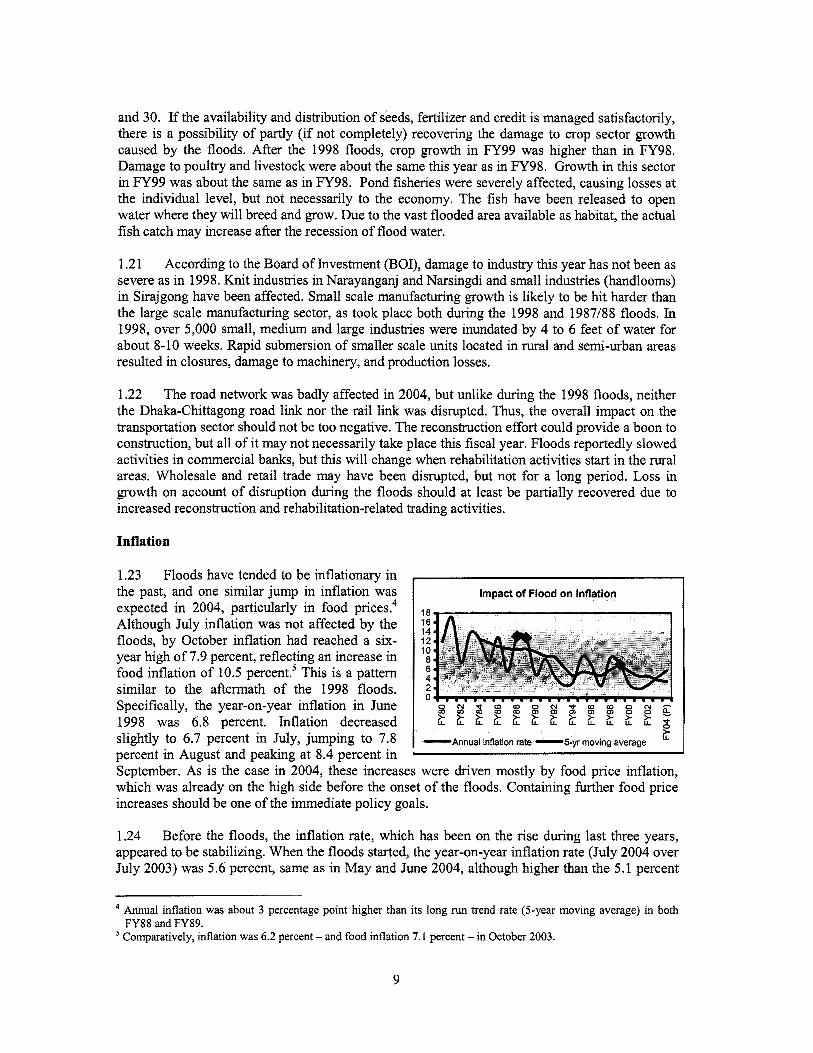
1.23 Floods have tended to be inflationary in the past, and one similar jump in inflation was expected in 2004, particularly in food prices? Although July inflation was not affected by the floods, by October inflation had reached a six- year high o f 7.9 percent, reflecting an increase in food inflation o f 10.5 ~ e r c e n t . ~ This i s a pattern similar to the aftermath o f the 1998 floods. Specifically, the year-on-year inflation in June 1998 was 6.8 percent. Inflation decreased slightly to 6.7 percent in July, jumping to 7.8 percent in August and peaking at 8.4 percent in
Impact of Flood on Inflation
A I
El I -Annual inflation rate -5-yr moving average
September. As i s the case in 2004, these increases were driven mostly by food price inflation, which was already on the high side before the onset o f the floods. Containing further food price increases should be one o f the immediate policy goals.
1.24 Before the floods, the inflation rate, which has been on the rise during last three years, appeared to be stabilizing. When the floods started, the year-on-year inflation rate (July 2004 over July 2003) was 5.6 percent, same as in M a y and June 2004, although higher than the 5.1 percent
Annual inflation was about 3 percentage point higher than its long run trend rate (5-year moving average) in both FY88 and FY89. Comparatively, inflation was 6.2 percent - and food inflation 7.1 percent - in October 2003.
9

year-on-year inflation rate in July 2003. Food inflation rate in July 2004 was 6.5 percent, compared with 6.6 percent in May-June 2004 and 5.9 percent in July 2003. Nonfood inflation was stable: i t was 4.4 percent in July 2004, compared with 4.4 and 4.3 percent respectively in May and June 2004 and 4.1 percent in July 2003
D. DEVELOPING AN APPROPRIATE POLICY RTiSPONSE
1.25 The near-term economic prospects o f Bangladesh have suffered a setback due to the floods. Growth prospects have been shadowed by the impact o f the devastating monsoon floods. In addition, the multi fiber arrangement (MFA) phase out at the end o f 2004 and higher o i l prices represent significant risks for growth and inflation. Business confidence i s also weakened by renewed security concerns and increased political confrontations between the major political parties. Given these adversities, the Govemment’s immediate policy response should focus on mitigating the sufferings o f the flood-affected poor and helping them recoup losses incurred. It should also try to enable the garment industry to better prepare for the post-MFA era by removing policy distortions, such as restricting the import o f yam through the Benapole border.
1.26 The Government would need to revise the medium-term macroeconomic framework to incorporate the impact o f floods and the persistence o f higher o i l prices, Fortunately, the impact o f these shocks are most l ikely to be temporary, implying that the medium and long-term strategy for poverty reducing growth does not need to change from what has been envisaged in the structural and policy reform program agreed under the Fund’s PRGF and the Bank’s Development Support Credits. Thus, the medium-term fiscal strategy should remain centered on stronger revenue mobilization and reorientation o f expenditures to better support growth and the goals o f the interim Poverty Reduction Strategy Paper (I-PRSP), while maintaining fiscal sustainability. A cautious monetary policy i s necessary to balance support for coping with the floods while containing inflation. Interventions in the foreign exchange markets need to remain confined to countering disorderly conditions and building reserves to a more comfortable level, Further liberalization o f the foreign trade and investment regime remain a high priority. Implementation o f structural reforms to improve the performance o f SOEs, NCBs, tax administration and to address infrastructure bottlenecks to growth and poverty reduction must be more vigorously pursued. Finally, concerted actions to develop an anti-corruption strategy and improve the law and order situation remain top priorities.
10

ANNEX 2 - SOCIAL IMPACTS
2.1 Though floods may affect both poor and non-poor households, poor households are generally least able to withstand the negative impacts o f floods on prices o f food and other essentials, household income, individual health and nutritional outcomes. T h i s Annex covers the impacts o f the 2004 floods on several key aspects o f social and individual welfare, including food prices and food security, household income and wealth losses, household coping strategies, and special concerns related to women and children.
A. FOOD SECURITY: AVAILABILITY AND PRICES OF FOOD
2.2 The recent floods in Bangladesh have caused less damage to rice production than the 1998 floods, private sector imports are helping to stabilize prices, and government stocks are sufficient for planned distribution.6 Availability o f food (either in terms o f total availability or government stocks) i s not currently a constraint on food security. Instead, access to food for poor households, particularly severely flood-affected households, may be constrained due to lost production opportunities, loss of assets, and lack o f employment, which limits their purchasing power.
2.3 In spite o f severe damage to selected areas, the total rice crop production loss associated with 2004 floods appears to be relatively small - on the order o f perhaps 1 mil l ion tons: equal to about 4 percent o f total production in 2003104 o f 26.4 mil l ion tons. By comparison, the 1998 floods resulted in a 2.2 mil l ion ton reduction (relative to original targets) to the aus and aman crops.’ (See Annex Table 2.1.)
2.4 The aus rice crop, typically planted in MarchfApril and harvested in JulylAugust9 suffered the greatest damage - 400 thousand tons (a 20-25 percent production loss compared to 2003104 production o f 1.832 mil l ion tons), Damage to the monsoon season aman rice crop i s estimated at about 400 thousand tons o f broadcast (generally deepwater) aman, with perhaps a 100 thousand ton loss in aman production due to reduced yields in some areas. The boro rice crop (planted in DecemberlJanuary and harvested in May1June) i s l ikely to be somewhat greater than the 2003104 harvest, however, due to , increased soil fertility resulting from sediment deposited from the 2004 floods.” These rice production losses to the aman and aus rice crops were particularly severe in the northeast o f Bangladesh, and along major rivers.
2.5 Government stocks are sufficient for planned distribution. Due mainly to large-scale procurement o f the boro rice crop in M a y and June o f 2004 (490 thousand tons in these months),
This analysis i s based on data available in mid-September 2004. Loss estimates o f the Ministry o f Agriculture as o f September 14,2004 were: aus 394 thousand tons, broadcast aman 335 thousand tons and transplanted aman 94 thousand tons, totaling 823 thousand tons. Th is larger 1 million ton estimate allows for additional damage caused by heavy rains during the week o f September 12, 2004 and regional flooding in the Jessore area in mid-September, It should be noted that the Ministry o f Agriculture estimates are subject to reyision. The flood damage to the aus and aman crop was equal in 1998199 was 11 percent o f the original 1998199 target rice production o f 19.2 mill ion tons Crop planting and harvesting times vary somewhat across Bangladesh. The months indicated in this paragraph are indicative o f the major months o f planting and harvest.
'%ate, however, that though there was a substantial jump in boro production following the 1988 and 1998 floods, a part o f this effect may have been due to increased market prices in these years and extensive losses of the aman crop. Given that market prices are not substantially increased.and at flood damage was more restricted in 2004 than in 1988 and 1998, the increase in boro production may not be as large as in these latter years.
11

gross stocks at the end of the 2003-04 fiscal year (end-June 2004) were 839 thousand tons (net stocks were about 100 thousand tons less). Given the additional 213 thousand tons o f rice procured from the boro and aus crops in July and August 2004, stocks at the end o f August 2004 were even higher: 942 thousand tons (about 842 thousand tons net). These stocks are more than sufficient to cover planned distribution from September through March (less than 700 thousand tons), even without food aid inflows expected at about 448 thousand tons over this period, Taking into account the timing o f expected food aid inflows, other procurement, and distribution, the end-month stocks are expected to vary between about 580 thousand and 1.1 mil l ion tons between September 2004 and June 2005.
2.6 Private Imports. Following the 1998 floods, more than 2 mil l ion tons o f private imports o f rice (almost exclusively from India) supplied domestic markets and stabilized market prices. Changes in Bangladesh wheat production, and prices o f grain in India and in the broader world market have led to a shift in market incentives, but private sector imports, now mainly o f wheat, are again a major source o f domestic supply and price stability.
2.7 In 2003104, the private sector imported 797 thousand tons o f rice and 1.684 mil l ion tons o f wheat, mainly from India. Most o f this rice trade occurred from July 2003 through March 2004; from April through August 2004, only about 82 thousand tons o f rice have been imported (an average o f 16 thousand tons per month compared with 84 thousand tons per month). Given the bumper boro crop and relatively small production losses associated with the flood, domestic prices o f rice remain relatively l ow (14.1 Twkg national average wholesale, DG Food, 19 September 2004), and there i s little incentive for larger scale private sector imports as o f mid- September. A seasonal price rise i s to be expected, however, and prices could increase to import parity levels, providing incentives for larger scale private imports of rice."
2.8 Private sector wheat imports are currently several times larger than are rice imports, due to lower domestic production, increased domestic food and feed demand, and relative price changes, Wheat production in Bangladesh has declined steadily in recent years, from 1.67 mil l ion tons in 2000101 to only 1.25 mil l ion tons in 2003104 as maize production (mainly destined for the growing poultry feed indus!xy) has increased. Meanwhile, wheat demand, both for food and for animal feed (again, mainly poultry), has increased. India's pricing policies have played a major role, as well, as export subsidies to private traders exporting Food Corporation of India excess stocks have encouraged exports. Private sector wheat imports have averaged 142 thousand tons per month from April through August 2004, (80 percent o f which came across land borders with India), These wheat imports can be expected at approximately these levels barring trade restrictions or shifts in intemational prices. Government policy has implicit ly promoted this trade through only minimal tari f fs on rice and wheat imports. Maintaining these incentives for private sector imports i s crucial to ensuring adequate availability and keeping market prices stable.
2.9 Rice and wheat prices in markets across Bangladesh have generally been stable since the floods began - consistent with the relatively small size o f the flood-related estimated aus and aman rice production shortfall and with continuing large-scale private sector grain imports. Rice prices in some markets rose slightly at the height o f the floods due to transport and other disruptions, but returned to approximate pre-flood levels thereafter. Overall, the wholesale national average price o f coarse rice rose only marginally (3.6 percent) from 12.62 Tk/kg in June (at the time o f the boro harvest) to 13.07 Tk/kg. Note that in real terms (adjusted for inflation
" In 1998-99 private sector imports o f r ice from India averaged over 200 thousand tons o f rice, and stabilized domestic rice prices at about 14.5 M g (wholesale, Dhaka).
12

using the non-food consumer price index) i s about 30 percent lower than the September 1998 real price o f coarse rice in 1998-99 (14.2 Tkkg in 1998 prices; 18.1 Tklkg in 2004 prices).
3. IMPACT OF THE 2004 FLOODS ON ASSETS, EMPLOYMENT, AND INCOMES
2.10 Even with adequate availability o f rice and wheat in markets at approximately the same prices as before the floods, household food security and overall welfare i s threatened by losses o f assets, employment and other incomes. These problems can be especially acute for poor households, particularly those living in char areas.
2.1 1 Poverty in Bangladesh i s concentrated in rural areas: according to the Bangladesh Bureau o f Statistics, 53 percent o f rural households are poor (compared to 37 percent o f urban households) and 85 percent o f the country’s poor l ive in rural areas. The sample size and sampling frame do not permit statistically valid information at the District level, so it i s not possible to assess average incomes o f households in flood-affected districts.
2.12 In rural areas, households living in the Sylhet basin howar areas o f northeast Bangladesh and near major rivers suffered from the longest, and generally the most severe floods. Within these areas, landless laborers and small farmers who lost crops were l ikely the most affected. Although average agricultural crop and livestock losses for the year are l ikely to have been small, individual losses were much larger. Data from a sample survey following the 1998 flood indicated production losses (including all crops) for households that cultivated crops averaged 7,500 Tkhousehold, about 48 percent o f expected production. Moreover, total asset loss among the 55 percent o f rural households in flood-affected areas in 1998 that lost assets averaged 6,900 Tkhousehold, 16 percent of average household assets. Given that the onset o f floods in 2004 was reportedly more rapid than in 1998, loss o f assets per flood-affected household may have been greater, though the number o f flood-affected households may be less.
2,13 Coping strategies to rescue assets. People living in the flood-prone areas, especially the chars, have a coping strategy for saving their assets and themselves during floods. Over the years, they have learned how to identify precursors to floods - dark clouds in the north signaling impending heavy monsoon rains and increasing currents in the rivers. Within the household, men, women, boys and girls each have responsibilities for saving assets. Landless, poor families usually do not have many assets and build their houses with flexible materials (bamboo, grass, straw, mud), so that when they see water i s rising they are able to dismantle their houses, take their children and livestock, and move upland. Men have the responsibility o f dismantling and moving the house materials, while adolescent boys and girls rescue livestock and poultry. Women typically keep a packet ready in the machang (a bamboo platform in the room for storage) with a potable cooking stove, matches, clothes, and food, and usually leave higher grounds with the packet, food, and children. Some households move to embankments and highways, and construct makeshift homes with their own materials and, plastic sheets. Women will stay with the children, while men go to nearby towns to look for jobs and relief. If the flood water i s very high, public buildings, such as schools and clinics, will be opened as shelters, where people will take refuge.
2.14 Households with more substantial assets have a different coping strategy because they have less flexibility than the landless people. Their houses are built with stronger materials and they have some furniture, so they usually remain at their house in order to protect their assets. Women, children and elderly to relatives and young men may stay either on the machang or on the roof. Cattle will be taken to higher ground. If fields are flooded for a long time (2-3 months in 1998), farmers will sow aman paddy seeds in makeshift seedbeds made out o f water hyacinth,
13

jute sticks and mud. Women will sow seeds o f vegetables, especially creepers in earthen pots and tie them on trees. Seedlings are planted in the fields when flood waters recede.
2.15 Employment. Loss o f employment i s l ikely to be far less than it was in 1998, when average monthly wage earnings during July-October 1998 were 46 percent below their average monthly earnings one year earlier. Given that ,the duration o f the 2004 floods was approximately one-half that o f 1998, and that the damage to the aman rice crop and overall economy was also about one-half the size, labor earnings losses may also have been proportionately less severe than in 2004.
2.16 Urban households. In urban areas, slum dwellers typically live in poorly drained areas that suffered from long periods o f standing water that led to increased prevalence o f diarrheal disease with particularly adverse effects on children. Flood waters also reduced employment opportunities and incomes o f these households. Moreover, though the value o f their housing i s not large (according to NGO estimates, the cost o f rebuilding a simple house made o f corrugated iron and bamboo panel walls using new materials i s only about Tk 11,800 (US$200), loss o f housing assets bring about severe hardships for poor households.
C. GOVERNMENT RESPONSE: FOOD DISTRIBUTION PROGRAMS
2.17 Government relief programs to provide for the immediate needs o f flood-affected households consisted mainly o f food transfers (mainly rice) through the Gratuitous Relief (GR) program. Survey data from 1998 indicate that GR distribution was well-targeted to flood-affect, though not necessarily poor, households in 1998, and most reports suggest that these programs were in general well-targeted in 2004, as well. These relief programs involved only a small amount o f resources transferred per participant, however.
2.18 Two food-assisted programs, Vulnerable Group Feeding and Food For Work, are major components o f medium-term efforts to assist the poor who suffered from the floods. In order to increase access to food by poor rural households, the government’s Vulnerable Group Feeding program has been expanded by 81 thousand tons from an initial budget allocation o f about 90 thousand tons to 170 thousand tons. This increase is, in principle, supported by food aid resources under the Emergency Operation (EMOP) o f the World Food Program.” Under this program, a general one-time food ration o f 30 kgs o f grainI3 i s to be provided to one mil l ion card-holding households (reaching approximately 5 mil l ion people). Timing o f this ration i s to be geographically based, with six districts (Sirajganj, Netrokana, Sunamganj, Habibganj, Kishoreganj, and Brahmanbaria, al l in the flood-affected northeast region of Bangladesh) receiving their ration in September, and districts in various other parts o f Bangladesh receiving their rations in subsequent months from October through January 2005. Cards will be allocated according to the same criteria used in the regular VGF program.
2.19 Because the number o f households that meet the criteria for VGF exceeds the planned program size, there will be considerable discretion amongst union parishad authorities regarding who receives these cards. Nonetheless, data from the 1998 flood suggests that the VGF criteria
”The EMOP also contains resources for expanded Food for Work from October 2004 to May 2005 through the Local Govemment Engineering Department (LGED). The Bangladesh Water Development Board and the Department of Forestry and Environment may also be involved in special interventions, as well.
I3Given a shortage o f Govemment wheat stocks, but ample rice stocks, VGF distribution i s likely to be entirely in the form of rice, with WFP food aid wheat swapped with the GOB on a 1: 1 basis that reflects the approximate current costs of the two commodities. In previous years, such swaps typically involved a higher ration of wheat to rice, e.g. 1.25: 1 that reflected lower costs of wheat than of rice.
14

effectively target the poor, though not necessarily the most flood-affected among flood-exposed households, 35 percent o f households in the bottom quintile o f expenditureslcapita received grain transfers compared to 18 percent and 8 percent in the top two quintiles. Thus, the 1998 experience suggests that if similar mechanisms are employed, VGF may be relatively well-targeted to poor households, though not necessarily to the most flood-affected, Expanded Food for Work programs will begin mostly in January 2005 after water logged soils have partially drained and heavy earthwork involved in building roads i s feasible.
2.20 The cost o f the proposed expansion in VGF and FFW will be met by food aid resources under the Emergency Operation (EMOP) o f the World Food Program. As o f mid-September, however, only about US$24 mil l ion o f the US$74 mil l ion in resources has been committed by donors. Nonetheless, the Government currently has sufficient stocks for this program. Food aid in kind i s not necessary for the expansion in program, nor i s there a market shortfall o f grain. Market prices have remained relatively stable since the floods (the wholesale national average price o f coarse rice rose only 3.6 percent between June and August). Given ample availability o f foodgrain, stable prices and the prospect for continued private sector imports, cash transfers or cash for work public employment schemes are a promising alternative to food transfers in-kind in the coming months. The implication i s that the major contribution o f EMOP food aid i s as a fiscal support to targeted transfer programs.I4
2.21 Even with the benefits o f Government and private transfers, existing microcredit programs, and stable food prices, many households that suffered from lost labor earnings, illness, crop losses, and damage to productive assets and housing, resorted to informal sector loans as a major thrust o f their coping strategies. Though these loans can be instrumental in preventing serious reductions in food consumption and health status, the burden o f these debts i s l ikely to remain long after the visible effects o f the flood are gone. Following the 1998 floods, borrowing was also a major coping strategy, with households borrowing the equivalent o f about 1 month o f consumption. Th is debt remained essentially intact one year later, however, suggesting the need for additional mechanisms to provide credit or retire loans o f poor flood-affected households.
2.22 The Need for Continued Monitoring. To date, the policies o f the Government o f Bangladesh, and in particular the Ministry o f Food and Disaster Management, have been highly effective in helping to ensure sufficient availability o f food. Stocks o f grain are sufficient for planned distribution, and a policy o f promoting private sector international trade has helped stabilize market supplies and prices. Food markets are very fluid, however, necessitating continued monitoring and analysis to adjust policies and distribution to avoid further losses in expected production or disruptions in markets. In addition, because food insecurity resulting from lack o f purchasing power i s less obvious than price movements, indicators o f worsening deprivation, such as increased incidence o f migration, asset sales, and child malnutrition, should be carefully monitored.
D. SPECIAL NEEDS OF WOMEN AND CHILDREN
2.23 Relief agencies (Government, NGOs, and donors) do not always adequately address the special needs o f women and children, who tend to suffer adverse consequences both in the short
l4 In principle, in the absence o f food aid, the Ministry o f Food and Disaster Management can float tenders for imports o f wheat. The most recent tender for wheat was largely unsuccessful, however, (resulting in contracts for only about 10,000 tons out of 50,000 tons in the tender), because o f a lack o f bidders. Since India has been subsidizing exports and their export prices are lower than intemational prices, international trading companies may have been reluctant to submit bids. In this situation, local tenders or a change o f tender specifications may be alternative means of government procurement.
15

and long term. Relief food (usually rice, wheat flour, pulses) does not provide essential nutrition for infants and children. Lactating women may not have milk due to flood related stress and lack o f nutritious food - so infants and children under two years o f age become malnourished quickly. Government and NGO nutrition and feeding programs for pregnant and lactating mothers and young children oRen stop during floods, with adverse nutritional consequences. WFP estimates that nearly one mil l ion children suffered from malnutrition during the 2004 floods because o f inadequate intake o f appropriate food.
2.24 Lack o f sanitation facilities also causes severe problems to women at the time o f floods. Reports indicate that majority o f shelters do not have latrine andlor the latrines were submerged under water. Elsewhere, even where latrines were available, the supply was inadequate: one latrine for over 500 families, Furthermore, during the floods, essential health services discontinued and women were unable to get their regular contraceptives supply, potentially resulting in thousands o f unwanted pregnancies, botched abortions, increased morbidity for women, and reduced health outcomes.
2.25 Security o f Women, Adolescent Girls and Children. Social cohesion i s st i l l effective in rural areas o f Bangladesh and, in general, provided security to women, adolescent girls and children during the floods. Security in the rural shelters i s provided by the local leaders (e.g. Union Parishad chairlmember, school teachers, and religious leaders) and there were no reports o f robberies or harassment at rural shelters during the 2004 floods. People living on roads and embanhents, however, were much more vulnerable. Social capital i s lacking in urban areas, as people from different districts l ive in slums and usually do not socialize with each other. As a result, inadequate security o f women, adolescent girls and children was reported as a problem in urban shelters, particularly harassment o f women and girls.
2.26 programs for women, children and other vulnerable groups, including:
Several measures could be undertaken to improve post-flood relief and recovery
(a) Increase security for women, girls and children in flood shelters, especially in urban areas. The local govemment representatives, school teachers, religious leaders and NGOs could be mobilized and form flood mitigation committees to manage local flood shelters with the help o f civi l administration and to provide security with the assistance o f police, village defense party (VDP), community police, and guards (chowkidars).
(b) Assist people with disabilities. People with disabilities (PWD) require special attention for their rescue, as well as in shelters. Rescue workers and shelter volunteers need to be trained to assist with PMb. Within shelters, mothers and wives o f PWD are also vulnerable, as they are unable to search for relief or work. The locations o f shelters should be well publicized so that family and friends can take people with disabilities.
(c) Special attention to other vulnerable groups, Stigmatized groups, such as commercial sex workers and transgender people, are usually driven from shelters andlor harassed if their identity i s known. Shelter management committees should provide security to these (and other) vulnerable groups.
16

Table 1: Production Losses due to Floods, 1998 and 2004
1998-99 Pre-flood estimateharget Estimated loss Revised Production Estimate Losseshitial Production Est.
2004-05 Pre-flood estimateitarget Estimated loss Revised Production Estimate Lossesflnitial Production Est.
Aus, Total Aus Atnan Atnan B O r O Total Rice Wheat Foodgrain
1.9 9.5 11.4 7.8 19.2 1.8 21 -0.3 -1.76 -2.06 2.25 0.19 0.11 0.3 1.6 7.74 9.34 10.05 19.39 1.91 21.3 -16% -19% -18% 29% 1% 6% 1%
1.80 12.00 13.8 13.20 27.00 1.20 28.20 -0.40 -0.60 -1.00 0 -1.00 0.00 -1.00 1.40 11.40 , 12.80 13.20 26.00 1.20 27.20 -22 Yo -5 % -7 % 0 % -4 Yo 0 % -4 %
Note: 1998-99 audaman loss as share of initial production estimate: -1 1 percent. Source: del Ninno, Dorosh, Smith and Roy (2001); Food Planning and Monitoring Unit.
17

ANNEX 3 - RAPID ENVIRONMENTAL IMTACT ASSESSMENT
3.1 The field assessment was conducted during 18-21 September 2004 to assess the scope o f sectoral flood damage. Preliminary environmental impacts o f flood were assessed based on the observation o f the damaged sites visited during the field assessment period, discussion with World Bank and ADB team members, and evaluation o f available documents and other information. The following i s the summary o f the preliminary environmental impacts and recommended actions.
A. ENVIF~ONMENTAL IMPACTS
3.2 Riverbank Erosion and Siltation. Most o f the rivers are morphologically very active. All major rivers such as Meghna, Brahmaputra, and Ganges, carry huge sediment loads from the large catchments that l i e in neighboring countries. Shifting o f river course i s a common problem and contributes to the riverbank erosion and siltation. The recent flood accelerated riverbank erosion and siltation in a number o f locations, which was observed during the field visits. This erosion caused substantial irrigation loss and displacement o f large number o f people due to loss o f land, crops, and housing. In addition, siltation caused closing o f the offtakes o f the distributory channels.
3.3 Soil Erosion. Overall, soil erosion i s apparent along the river embankments. Soil erosion along the road and railway embankments was most severe in the areas situated close to major rivers, where road sections had been completely washed away by the erosion. The overflow o f the river water, together with strong currents, contributed to the physical damage o f the embankments and sedimentation in adjoining rice paddy fields. The continuous use o f damaged roads, encroachment, debris, uprooted trees on the roadside, and sandy soil base in the embankment, have al l exacerbated the soil erosion o f the damaged areas and are posing safety r isks for communities.
3.4 Loss o f Flood Flows due to Encroachment. Sedimentation and encroachment that has occurred over the years has contributed to the aggravation o f flood damage. Lakes, wetlands, and natural drainage have been encroached upon by earth filling, conversion to agricultural land, depositing o f city garbage and construction o f buildings and roads, As a result, natural water retaining ponds have disappeared and many o f the drainage channels lost their original conveyance capacity, which has caused stagnation o f flood flows. The flood and resulting inundation o f the land caused socioeconomic impacts such as loss o f crops and agricultural land, livestock, housing, and the interruption o f industrial production activities.
3.5 Water Contamination and Health Impacts. The impact o f the flood on water quality has posed major health concerns. Due to mismanagement o f collection and disposal o f solid waste in urban areas, especially in Dhaka, considerable amounts o f waste were disposed in the storm drainage system, which caused blockage o f storm drains and overflow o f the storm water. Urban environmental facilities including production wells, tube wells, pit latrines, and ground level water reservoirs in the flooded areas were submerged. The drinking water in the flooded areas i s then contaminated by flood water and industrial storm run-off. Due to lack o f adequate water and wastewater treatment facilities, the contamination o f surface and ground water, particularly in the urban areas, spreads diseases and has become a major public health concem, particularly for children.
18

3. NEEDS AND ACTIONS
3.6 Environmental Assessment Framework. The needed immediate response to flood damage i s to restore andlor improve the damaged facilities with flood protection measures. While rehabilitation and protection work will result in major positive environmental impacts, some negative impacts may occur due to the site selection and during the construction. To ensure that environmental consideration i s taken into account the rehabilitation and protection work, an appropriate environmental assessment framework should be developed in accordance with the environmental assessment requirements o f the Government. The EA framework should include the following environmental assessment requirements: the development o f environmental site selection criteria; preparation o f environmental assessment reports; review and clearance; institutional responsibilities; estimated budgets for environmental mitigation measures and monitoring; and staffing and training needs. I
3.7 Environmental Monitoring. There are a several environmental monitoring needs which are required to: (i) test the drinking water quality; (ii) monitor the efficacy o f the erosion protection measures for embankments; and (iii) monitor river hydrology and morphology, While it should be inspected urgently, well water used for drinking purposes should undergo ongoing water quality tests to check the health impacts and reduce health risks. Soil erosion monitoring should be conducted during the rehabilitation work and also as part o f ongoing monitoring. As a long-term monitoring initiative, online monitoring o f river erosion and platform changes, as well as morphological changes, should be developed and institutionalized among relevant agencies in order to utilize the flood information database in their design and installation structure o f roads, railways and bridges, and for planning flood preparedness activities.
3.8 Community Disaster Preparedness and Management. Due to poor socioeconomic conditions, the poor mostly l ive in the disaster-prone areas and are more vulnerable to the effects o f disasters. Since the poor depend on the natural resources, they cannot recover from the damage o f natural disasters only on relief resources. Awareness building o f the flood related environmental r isks i s important to understand the linkage between environmental degradation and natural disaster. Enhancement o f people’s capacity to protect and manage natural resources and ecosystem i s essential to cope with natural disasters and sustain their livelihoods. Community-based awareness and capacity building activities should include not only emergency response activities, but also proactive community-based environmental management approaches.
19

ANNEX 4 - HOUSING
4.1 This housing damage assessment i s based on damage reports provided by the Ministry o f Food and Disaster Management (MFDM); the. most recent figures were given on September 21, 2004. Further information was available through other sources and reports, including the Disaster & Emergency Response (DER) Sub-group.
4.2 In addition, the joint A D B M mission visited the Narayanganj and Manikganj Districts between September 18 and 19, 2004 to review the damage and discuss with local officials the need for reconstruction and recovery.
A. ESTIMATED HOUSING DAMAGE
4.3 Reported Damage. The 2004 flood severely impacted the housing stock and left hundreds of thousands of homes destroyed or heavily damaged. According to MFDM, 39 districts were affected with total o f 896,000 un i ts fully damaged and 3.39 mil l ion uni ts partially damaged,
4.4 The flood washed away homes, particularly at the riverbanks. Due to the severe erosion, not only the home disappeared but also the land was washed away. Many o f the affected people took shelter in their relatives’ homes or in schools, religious institutions, or other community buildings. A considerable portion o f flood victims are st i l l occupying the temporary shelters on the flood protection embankments. Lack o f access to safe drinking water and lack o f sanitary infrastructure within flood shelters contributed to the critical condition. In rural areas, villagers who did not leave their homes built bamboo platforms at a higher level or raised the height o f their beds by tightening them with bamboo and wooden poles.
4.5 Housing types. Three different type o f housing can be found in the flood affected areas:
(a) Kutcha houses are mainly constructed o f corrugated iron sheets or bamboo. Structural support material used for this type i s bamboo or wood. Kutcha houses have no foundation and some o f them are constructed on an elevated mud base or bamboo columns to offer a minimum protection against raising water. Due to the structural weakness, this type o f housing does not provide a high degree o f protection against floods.
(b) Semi-pucca houses use a combination o f materials such as bricks, iron sheets and concrete. I t can be observed throughout the region that the use o f low quality construction material, and the lack. o f structural binding material and proper bracing, increases this housing type’s vulnerability to floods.
(c) Pucca houses are in general masonry structures, with mainly reinforced concrete foundations. These houses have either load bearing brick walls with bracings or reinforced frames. The construction quality seems to be weak. However, compared with the previous described housing types, Pucca houses offer a higher degree of flood protection. Flood damage was reported mainly with regard to the Kutcha and Semi-pucca housing.
20

Pre-flood Asset Value
Type of Damage Unit Number Average Value Total (Thousands) Taka Million Taka
4.6 Heavily Damaged Units. The average construction cost o f new homes varies widely throughout the region. According to the information provided by local officials during the site visits and the latest damage reports prepared by the Disaster Emergency Response (DER) sub- group, the average replacement cost o f a minimum standard house i s about Tk 16,500 +/- 7,000. In addition, a depreciation factor o f 20 percent was introduced to determine the pre-flood value. Thus, the average pre-flood asset value i s estimated at 13,200 TWunit. Th is amount was confirmed with local NGOs, which determined the pre-flood asset value to be in the range o f Tk12,OOO to 15,000.
Total Million US$
4.7 Partially Damaged Units. The flood affected the stability o f several houses by washing out or decreasing the bearing capacity o f the soil beneath the foundation, causing the homes to either fall down or tilt sideways. Partially damaged houses maintained their structural integrity, but the non-structural elements were affected. Thus, damage i s specific to the individual unit. In order to calculate a damage estimate, a ratio o f 25 percent o f the average replacement cost has been applied in this assessment for partially damaged housing units.
Heavily Damaged Units Partially Damaged Units Loss o f House-hold Goods
Loss of Goods 4.8 The houses visited during site visits revealed that the majority o f the damaged homes met minimal human needs and did not have in-house water and sanitation facilities, Especially in rural areas, homes did not have washing machines, TVs, refiigerators, etc. Although the houses contained extremely basic necessities (spread beds, cloths, few kitchen goods), these goods must be replaced. The value o f these goods may be estimated at Tk 1,500 for a family living in a heavily damaged house.
896.0 13,200 11,827 200.5
3,391 .O 4,125 13,988 237.1
896.0 1,500 1,344 22.8
Total Estimated Damage 4.9 Based on the calculation assumption above, the total damage i s estimated as follows:
Sum
Table 2: Housing Damage Estimate
27,159 460.4
4.10 Given the high uncertainty in the number o f damaged units, a damage ratio has been introduced. Experience f iom other assessments carried out by the team has shown that the damage reports prepared without a detailed validation process result in a 20 and 30 percent overestimation, in some cases even 50 percent. It was thus decided to present the init ial damage estimate in a range between -20 percent and +5 percent. The high case o f 5 percent has been introduced to reflect the additional damage caused by the September flood. Based on these assumptions, the total damage i s estimated between US$370 mil l ion and US$480 million.
21

Table 3: Range of Estimated Damage
Heavily Damaged Units Partially Damaged Units
" ...........
1 High Case +5 percent I Base 1 LOW Case -20 percent
Unit Number Average Value Total Total (Thousands) Tk Million Tk Million US$
896 19,800 11,827 301
3,391 4,125 13,988 237 "" ......... " ........ I" ....... "" " .... ....... l..".l l.l.l ..... "" ........ " .....I..."....I.." .... ",..I ".."....."......".I...I
US$370 mill ion 1 US$460 million US$480 mill ion I
Sum
B. ESTIMATED RECONSTRUCTION/RECOVERY NEEDS
25,815 538
4.11 Reconstruction Costs. The condition o f the housing buildings i s poor. During the reconstruction scheme, at least to some extent, safety measures should be considered in the designs and the construction methods to reduce the vulnerability o f the houses to future floods and other hazards.
Low Case -20 percent
US$430 Mil l ion
4.12 The additional cost o f these measures depends on the level o f improvement to be introduced. At a minimum, the buildings should be reconstructed on a relatively elevated foundation, resistant to certain level o f scouring affect o f flood. The cost o f such improvement might be anticipated to increase the reconstruction cost o f Tk 16,500 by 20 percent. Th is results in an average reconstruction cost o f Tk19,800. However, the repair cost would remain the same.
Base High Case +5 percent
US$S38 Mil l ion US$S60 Mil l ion
Table 4: Estimated Reconstruction Cost (including improved design standards)
4.13 Following the rationale presented in section B, a range between -20 percent and +5 percent should be considered to reflect uncertainty, particularly with regard to the reported damaged units. Thus, the total reconstruction cost i s estimated between US$430 mil l ion and US$560 million.
C. RESPONSE TO HOUSING NEEDS
4.14 Repair and reconstruction o f damaged homes has been supported by the Government's recovery program. As part o f the flood rehabilitation program, the Ministry o f Food and Disaster Management distributed 10,800 bundles o f corrugated iron (CI) sheets and Tk 540,000 (US$91,525) in the affected districts as house building grants. Additional distribution o f C I sheets
22

i s foreseen in the amount of Tk 200 mill ion (US$3.4 million). UNDP i s providing an additional 100,000 bundles o f CI.
4.15 In addition, a Disaster Risk Mitigation fund was established to support victims who have lost their income generating assets due to the flood disaster. An amount o f Tk 750 mil l ion (US$12.7 million) has been allocated to this fund under the current budget. In the United Nations Bangladesh Floods Flash Appeal 2004, family shelter and non-food item needs total US$34 million.
4.16 International NGOs, such as CARE, CONCERN, and Oxfam, have also provided emergency shelter. CARE-Bangladesh has provided 5,OOOMT o f plastic sheeting, Oxfam has provided reconstructiodrehabilitation support to 16,000 flood affected households in Sunamganj and Gaibandha Districts (as o f the end o f July) and plans to extend i ts support for the reconstructionhehabilitation o f another 7,500 homes in Faridpured and Rajbari.
D. RECOMMENDATIONS
Short-term 4.17 Although the exact number o f affected households cannot be verified, the demand for housing repair and reconstruction i s large. Aside from supplying building materials, the Government should consider offering assistance targeted to the poorest flood victims. A program could be created following the criteria o f the VGF program, providing cash grants to those who lost their homes and other assets. The cash grants would allow beneficiaries to decide directly on how best to restore their livelihood and homes. However, technical guidance i s also recommended.
Mid-to long-term 4.18 The incorporation o f multihazard risk mitigation measures in the design o f infrastructure systems, housing, health, and education facilities i s essential to reducing damage to the built environment.
4.19 A mechanism for housing reconstruction should be considered to allow affected households to receive financial assistance soon after a disaster. The funding scheme could combine micro-credit with a grant element to make the financing affordable. The maturity o f the loan as well the collateral issue would need to be addressed. Furthermore, a financial r i s k mitigation mechanism should be incorporated to strengthen the sustainability o f such a program.
4.20 Further support should be given to NGO and local initiatives that have introduced innovative design approaches for minimum standard housing. The design increases the structural integrity and allows easy dismantling o f the house in case o f a flood, thus reducing future vulnerability.
23

3 5 Jaipurhat 36 Barisal 9 37 Noakhali - 38 Kushtia 39 Laxmipur 7
TOTAL 896
24
4 4 103 112 17 17 4 4 19 26 3,391 4,287

ANNEX 5 - TRANSPORT INFRASTRUCTURE
5.1 The preliminary assessment o f the transport sector covers road, bridge, ra i l and inland water transport infrastructure. The joint team reviewed field data and preliminary assessment reports prepared by the Roads and Highway Department (RHD), Local Government Engineering Department (LGED), Bangladesh Railway (BR), Dhaka City Corporation (DCC) and Ministry o f Shipping (MOS). The team visited the Districts o f Bogra, Brahmanbaria, Habiganj, Jamalpur, Mymensingh, Natore, Sirajganj, Sunamganj, and Sylhet to assess flood-related damage.
A. DAMAGE ASSESSMENT
5.2 The transport sector, specifically the road sector, was the most seriously affected o f the infrastructure sectors. The 2004 floods caused extensive damage to the primary road network, managed by the RHD, and to the secondary road network, managed by the LGED. About 2,970 km, or 14 percent, o f the primary road network was affected by the floods. Damage was particularly severe on some road sections because incidences o f flash flooding led to wave action and erosion o f many embankments. About 25,000 km, or 25 percent, o f the secondary road network comprising Upazila Roads (UZRs) and Union Roads (URs) , were affected by the floods. Many UZRs and U R s were found to have failed sections and structures that were washed away. This was partly due to l ow design standards. Dhaka division suffered the most damage in the road sector, including urban roads. Railways suffered damage on several network sections. Inland waterways and airports were marginally affected by the floods, according to information received from the Government. The team noted that insufficient maintenance adversely impacted and increased the damage on road and railway infrastructure.
5.3 The preliminary cost o f asset damage caused by the 2004 floods to the transport infrastructure sector has been assessed at about U S 2 6 0 mil l ion (Tk 15 billion). The asset replacement cost i s estimated to be U S 3 4 0 mil l ion (Tk 20 billion) to US$380 mil l ion (Tk 22 billion), depending on the engineering standards adopted during the reconstruction phase.
Road Sector Infrastructure
5.4 Road transport infrastructure suffered extensive localized damage in al l o f the 39 flood- affected districts. During the field visits, the team observed: (a) damage to'road pavements; (b) damage to bridges and culverts; (c) damage to embankments; (d) total failure o f embankments including pavements; and (e) total failure o f bridges and culverts. The damage was caused by a combination o f factors, including heavy persistent rainfall combined with flooding, and in some cases, flash flooding.
5.5 The institutions (RHD, LGED and DCC) responsible for most o f the country's road infrastructure provided the mission with their preliminary assessments. Total damage was estimated at about US$236 mil l ion (Tk 14 billion).l5 The breakdown o f the estimated damage by type o f road asset i s as follows: (a) National Highways (NHs), Regional Roads (RHs), District Roads (DRs) and related structures - about US$111 mi l l ion (Tk 6.5 billion); (b) WZRs, U R s and related bridgeslculverts - about US109 mil l ion (Tk. 6.4 billion); and (c) Dhaka City urban roads - about US$16 mil l ion (Tk 944 million).
"This amount does not include the damage caused by the flooding to Village Roads A and B, which are the responsibility o f Local Government Institutions (LGIs).
25

Primary Road Network
zone
5.6 RHD i s responsible for the management o f the primary road network, which i s broken down into 3,473 km o f NHs, 4,254 km o f RHs, and 13,724 km of DRs, totaling about 21,45 1 km of roads, The preliminary flood damage assessment for the RHD road network i s summarized as follows:
Affected road Affected structures Total damage Assessed Replacement length bridgeslculverts (US$ million) Cost
Affected Road Length: 2,970 km Affected Number o f Bridges: 171
= Affected Number o f Culverts: 135 Affected Number o f River Jetties: 26
Dhaka Comilla Rangpur
Barisal Total
Rajshahi
5.7 The R H s and DRs sections o f the primary road network suffered more extensive and structural damage than the N H s . This i s due to their much lower design standards, inadequate drainage, and low and weak embankments. Furthermore, a substantial portion o f the R H s and DRs suffer from inadequate maintenance, which further weakened their structural integrity. The Dhaka and Comilla zones (about 21 - 22 percent o f the total network affected) seem to have been two o f the most affected zones by the 2004 flood.
(km) (US$ million) 840.70 95 40 58 887.50 127 35 32 475.00 12 8 23 471.75 23 18 18 294.00 75 10 19 2968.95 332 111 150
5.8 The mission’s preliminary assessment o f the damages to the primary road network by zone i s estimated at about U S $ l 1 1 mil l ion (Tk 6.5 billion). The replacement cost for the damage to the RHD managed road network i s estimated at US$l50 mil l ion (Tk 8.8 billion), as shown in Table 1.
Secondary Road Network
5.9 LGED i s responsible for the management o f the secondary road network, which includes about 90,000 km o f roads - about 23,400 km o f UZRs and 68,600 km o f U R s . The 2004 flood damage to the secondary road network i s as follows:
Affected Road Length: 25,000 km,
Affected Number o f River Jetties: Affected BridgeslCulverts: . 31,538 meters; and
41
5.10 shown in Table 2.
The preliminary District assessment o f the damage to the secondary road network i s
26

Affected Affected Road Structures Length (km) Bridge/ District
Culverts (m)
Dhaka 5,030 17,270
Chittagong 1,6 15 3,050 Barisal 650 4,940
Khulna 60 90 Rajshahi 1,810 3,975 Sylhet 1,015 2,185 Total 10,180 31,510
5.1 1 The preliminary assessment shows that Dhaka District was most affected by the floods, with 45 percent o f all damaged roads and 60 percent o f all bridges and culverts. A higher percentage o f the unpaved portion o f the secondary road network was affected by the flooding. In some cases UZRs and U R s were completely cut o f f because o f section failure or because structures were washed away. Rural areas were adversely affected by disruption in road transport services, which decreased rural mobility.
Assessed Total Damage Replacement (US% million) Cost
(US$ million)
57 73 5 6 15 19 1 2 21 27 10 13 109 140
Urban Roads
5.12 area. The 2004 flood damage to the urban road network in Dhaka i s estimated as follows:
The DCC i s responsible for managing about 2,000 km o f urban roads in the Dhaka metro
Affected Road Length: about 15 0 km, = Estimated Cost o f Damage: about US$16 million; and
Estimated Replacement Cost: about US$25 mil l ion
Disruption to Road Transport Services
5.13 Some sections o f NH network, which i s the backbone o f the primary road network, have suffered extensive pavement damage caused by the heavy rains and flooding. On the R H s and DRs the flood and rain damage was even more extensive and severe. This means that, until the sections o f the damaged primary road network have been fully rehabilitated, the Vehicle Operating Costs (VOCs) and time required for moving goods and people around the country will increase. In the case o f the secondary road network, because o f total failure o f certain structures and stretches o f roads, transport services (and therefore access to public services and markets) have been severely disrupted. Th is type o f disruption could have a significant impact on rural populations due to the fact that in many cases, there are few alternative roads connecting most villages.
Railway Infrastructure
5.14 The 2004 flood caused severe damage to railway embankments, track, bridges, ferry landings, buildings, station and colony, equipment and machinery and signaling electrical and telecommunications facilities. Typical damage included embankment erosion and slide, loss o f ballast and track components, displacement o f track at certain locations, damage to brick abutment protection o f bridges, and non functional communication facilities, Init ial assessment
27
by Bangladesh Railway shows that about 3 2 0 . h o f track in 117 spots and 110 bridges in East Zone and 96 km o f track in 40 spots and 18 bridges have sustained physical damage.
Jamalpur -Dewanganj bazar ................. " .. Narsingdi- Bhairab
" -...-I.I__-"
5.15 The mission noted damage to track, ballast, bridges, culverts retentiodprotection works o f bridges and embankments. Maintenance facilities, station access roads, and buildings were also affected. The BR undertook emergency repairs to allow continued ra i l operations. Due to the rehabilitation work undertaken under a previous flood damage rehabilitation project, the railway network was spared from the damage one would have normally expected from such a flood.
Dewanganj bazar- Jamalpur - M ymensing-Gouripur Bahadurabad Jagannathgan. Ghat Mpensing Bhairab Bazar- Bhairab Bazar- Akhaura - Shaistagnaj
~ "-."..-".--.-..I_.
5.16 In late August 2004, BR assessed the 2004 flood damage and estimated temporary and permanent rehabilitation costs associated with these damages. The estimate was prepared after several site surveys conducted by BR officials to evaluate the damage and the cost to repair the infrastructures. Damage estimates were prepared by the Chief Engineers o f the two zones o f BR who are in charge o f these assets. Field assessment reports were prepared by the Divisional Engineers. The total estimated cost o f damage was about US$16 million. BR also completed an assessment o f mitigation measures which could, through infrastructure improvements or better flood preparedness, lessen the impact o f future floods on the railway infrastructure.
I I Bazar ......... " .... " ".-l""lll"
Shaistganj- Srimangol Atharbari .. ... Akahura Srimongal -Kulaura Kulaura-Sylhet Sylhet- Chatak Bazar
"....I ... " ...... " .- " .......................................................................................... ........ ".."..l ..... I .... ........ .... .tlll.l "_ " ...... ".
__-_lll"" Pachuria .................... -Goalondo I - Ishurdi I "1""11" -Jamtoil "l"l"tltl"" _-I. Jamtoil -Joydebpur ............... ........... Santahar- ____(_ Bonarpara Kaunia-Bonarpara Kaunia -Lalmonrihat
Kanchan-Panchagar Bonarpara-Bharatkhali Trimohoni-Balashi ................. . . . .l-l..-l.--." .-I._I.. ",__" -__(___(----..-.-.
Ishurdi- Santahar Tista-Ramna
................................................................ l." ........ . ......... - ....... . __l_-_-.l-l--
5.17 flood adversely affected BR in several areas including:
The sections include ghat areas, ferry locations and non-important branch lines. The 2004
m
Disruption o f passenger and goods movement in the affected sections; Loaded wagons kept stabled caused a deterioration o f . time-sensitive consignment, resulting in price hikes in different areas; Loss o f punctuality and consequent service deterioration in other sections; Loss o f revenue for the railway sub-sector; and Time delay and cost overrun. in implementation o f ongoing projects.
Inland Water Transport Infrastructure
5.18 From the preliminary assessment provided by the MOS-related Bangladesh Inland Water Transport Corporation (BIWTA) and Bangladesh Inland Water Transport Authority (BIWTA), the costs o f flood damage reached about US$3 mil l ion (Tk 177 million). The worst affected areas were the Narayanganj and Mawa Districts,
28

B. RECONSTRUCTION AND RECOVERY NEEDS
5.19 The total cost o f reconstructin~rehabilitating al l flood damaged transport infrastructure (roads, bridges, railway and inland water transport infrastructure) i s in the range o f US$340 mi l l ion (Tk 20 billion) to US$380 mil l ion (Tk. 22 billion).
Road Transport Infrastructure
5.20 The estimated total reconstructio~rehabilitation costs for the flood-damaged road transport infrastructure i s about US$315 mill ion (Tk18.6 billion) to US$350 mil l ion (Tk 20.6 billion), depending on the final mix o f reconstruction engineering standards that are adopted and implemented. Taking into consideration the type o f works to be executed, most o f the reconstructio~rehabilitation road works should be completed within a 36 month implementation period, broken down into two major phases. Phase One (implementation within 15 months) would cover the repairhehabilitation o f roads and some small structures damaged by the flooding with the objective o f restoring full connectivity. Phase Two (implementation within 36 months) would cover more extensive rehabilitation, and in some cases reconstruction, o f selected stretches of roads and structures that were damaged by the flooding in order to restore full structural integrity and riding quality.
5.21 For the Phase One recovery program, RHD plans to spend about US$50 mil l ion (Tk 2,950 million) on the emergency rehabilitation o f about 500-600 km o f worst affected NHs, R H s and DRs. LGED could also spend about US$50 mil l ion (Tk 2.9 billion) on the repair and emergency rehabilitation o f priority UZRs and U R s and a select number o f structures. DCC plans to spend about US$25 mil l ion (Tk 1,480 million) on the repair and emergency rehabilitation o f priority urban roads in Dhaka. Depending on when the works start for the Phase One recovery program, a substantial portion o f the road repairhehabilitation could be completed by June 2005, before the start o f the next monsoon season.
5.22 For the Phase Two recovery program, LGED and RHD have so far identified another US$l90 mil l ion (Tk 1,12 10 million) to about US$225 mil l ion (Tk. 13280 million) that i s required to cater to the full reconstruction needs o f the primary and secondary road networks in the flood- affected districts. However, since Phase Two will require more detailed surveying o f the rehabilitatio~reconstruction needs o f the damaged bridges and culverts, it will take several months to prepare and more than one construction season to implement.
5.23 For the long term (more than 36 months) recovery program, RHD and LGED need to carefully assess and review the design and engineering standards currently used for the construction o f roads in Bangladesh to ensure that the l i fe cycle costs o f periodic flooding are properly taken into account when designing, repairing and constructing new roads, Possible measures that could be adopted to improve future road design are as follows:
=
= =
= =
Adoption o f asphalt or cement treated base course to minimize the deterioration by submergence; Increasing the number o f bridges and culverts to facilitate the f low o f f lood waters; Application o f PCCP (Portland cement concrete pavement) where the stable sub- grade and sub-base conditions are expected; Higher embankment design to avoid submergence; and More stable slope protection measures, such as concrete surfacing or appropriate vegetation.
29
5.24 Although the above measures may be costly to implement, they can be selectively adopted on certain road segments based on their current vulnerability to flooding, flash flooding, and wave action. These improved design standards could then become part o f the pavement design guidelines for the primary and secondary road networks. Finally, for slope and shoulder protection, economical methods o f appropriate protection solutions should be implemented, such as using specific types o f grasses that have strong and dense root structures.
Railway Transport Infrastructure
5.25 Urgent Needs. Recovery needs for the railway network are approximately Tk 1.2 bil l ion (US$20 million). Temporary restoration work was done by BR using i ts own resources. Train services have been restored at other sections at a minimum level with speed restrictions and other safety regulations. Running time has increased due to such restrictions, and overall punctuality o f train services cannot be restored to pre-flood level.
5.26 years) will include:
Short-Term Needs (within the next year). Short-term rehabilitation works (up to two
Repair and protection works o f embankment slide; Repair and protection works of bridge approach; Protect embankment with geo-textile and brick blocks; Repair o f station buildings; Prepare electrical and signaling facilities; Restore tracks in Sylhet- Chatakbazar section with construction o f new bridges; Raise tracks at locations where overtopping occurs; and Procure specific equipment for track, ballast, sleepers, and boulders.
C. SOCIAL AND ENVIRONMENTAL ASPECTS
5.27 The primary focus o f the rehabilitationheconstruction effort o f the sector will be on existing transport infi-astructure. This means that the social and environmental impacts will be limited to impacts during the rehabil i tat io~recons~ction works. Where structural failures o f road sections have occurred, there might be a need for some realignment, which could require the acquisition o f land and thus a proper environmental assessment. However, these cases should be very few. The primary social and environmental impacts o f the rehabilitationheconstruction works will be construction-related impacts which can be easily mitigated.
30

ANNEX 6 - WATER SUPPLY AND SANITATION
6.1 Ground water i s the main source o f drinking water in Bangladesh. I t i s extracted by hand- pumps in both rural areas as well as most o f the urban municipalities, except the six City Corporations and some o f the 100 larger municipalities, where piped water supply i s provided for parts o f the city. In urban towns, piped water supply provides access to about a third o f the households, while the rest rely on hand-pumps. Access to water through hand-pumps i s over 76 percent, based on one scheme for about 100 persons, which varies by the type o f hand-pumps and the ground water hydrogeology o f the area. Over the last ten years, areas affected by arsenic contamination have also created severe coverage disparity, and in some villages, over 90 percent o f the sources are contaminated by arsenic. Alternatives to ground water sources are dug wells, rain water harvesting, and filtered surface water (using pond sand filters).
6.2 Rural sanitation coverage i s relatively low (around 40 percent) with only 10 percent having pour-flush pit latrines, while the remaining 30 percent have simple pit latrines andlor fixed places for defecation. Urban areas also use pour-flush pit latrines, with a nominal few percent having septic tanks and soakage pits. Only Dhaka city has a piped sewerage system that serves about 30 percent o f the population.
Consultations and Site Visits
6.3 The mission consulted with the Ministry o f Local Government Rural Development and Cooperatives (MLGRD&C) responsible for Water Supply and Sanitation. Meetings and consultations were also held with the Department of Public Health Engineering (DPHE) which i s the lead sector agency, and with Dhaka Water and Sewerage Authority (DWASA).
6.4 Field visits were undertaken to Naryanganj, Munshiganj and Manikganj Districts to assess the damage o f the water and sanitation infrastructures, the effectiveness o f emergency coping strategies, and to understand the nature o f damage, in order to establish the rationale for a prioritized recovery program. The mission i s thankful to the DPHE for arranging the field visit. The team noted with appreciation the emergency mitigation efforts undertaken by the DPHE to raise hand-pumps during the flood, instal l hand-pumps and community latrines in flood relief shelters, and disinfect water sources after the flood waters receded.
A. DAMAGE ASSESSMENT
6.5 According to DPHE 240 Upazilas were affected by flood, damaging about 200,000 (30 percent) o f the public-hand pumps. These are mostly community schemes installed by the DPHE. The estimate, however, does not include any private hand pumps, which, if extrapolated, would amount to over 700,000. The DPHE report does not provide specific details o f sanitation units, i.e., community latrines, school latrines, and household latrines, damaged by the flood. However, it proposes to construct 100,000 pit latrines and 10,000 community latrines in rural areas and 1,000 community latrines in urban areas. An extrapolation o f the total population affected by the flood, based on a coverage figure o f 40 percent, the number o f pit latrines in the flood affected areas amounts to more than 2,472,000, o f which about 620,000 (10 percent) are durable units. It i s highly likely that most o f the unlined pits (approximately 1,852,000) have been damaged to some degree. A revised damage assessment report provided by DPHE provides a total damage assessment o f Tk 900 mil l ion (US$15 million).
31

6.6 According to DWASA, a third o f the Dhaka city was inundated by flood waters, resulting in damage to most o f the deep tube-wells, pump houses, distribution network, sewerage l ines and drainage infrastructures in the affected area. A revised damage assessment provided by DWASA provides a total damage assessment o f Tk 1.4 bil l ion (US$23 million). The D W A S A damage assessments are categorized into the following three categories:
Construction o f Deep Tubewells Emergency repairlprotection and operation o f Saidabad Treatment plant Emergency repairlprotection and operation o f Naryanganj Treatment Plant
Table 1: Dhaka WASA Damage Assessment Cateeorv I Rehabilitation Works I Numbers
3 1 2
Water Supply I Rehabilitation o f uumu house 1 42
- Repair and maintenance of sewer lift station
Replacement of damaged manhole covers
Cleaning box culverts Cleaning pipe drain and brick sewer Rehabilitation o f drains
Repair and maintenance o f Pagla Sewer Treatment Plant
Drainage
Repair and maintenance o f Storm Water Pumping Stations
26 1 600
N.A. N.A. N.A. N.A.
Sewerage I Rehabilitation and cleaning: o f sewers I 180km
Other Observed Impacts
6.7 Rural Flood Impacts. During field visit the mission noted that households in arsenic affected areas have installed new hand-pumps near the damages sites o f community ring wells, which were constructed to provide alternate water to mitigate arsenic. However, these hand- pumps installed over shallow tubewells are not tested for arsenic, and are therefore l ikely to be contaminated by arsenic.
6.8 Damage o f safe water sources has also prompted may people to resort to surface water bodies and stagnant pools. With the washing away o f sanitary and fix place excreta disposal facilities, people are compelled to resort to open defecation. With flood water receding, the pollution o f surface water bodies i s l ikely to increase and will be further aggravated due to open defecation. Although as o f late September, incidences o f waterborne disease have not posed a serious problem, they are l ikely to increase - especially morbidity rates for children under five, DPHE has so far done a commendable job o f disinfecting water sources, with support from UNICEF. Many NGOs also undertook water source disinfection and repair activities. However, unless basic hygienic practice i s restored within the community, fresh water i s l ikely to be contaminated during handling. The mission team recommends prompting community motivation through NGOs and grassroots organizations to reinforce good hygienic practices at the local level, including fixed place defecation.
6.9 Urban Flood Impacts. Flooding o f urban areas, specifically Dhaka city, has caused major health and economic losses. A large part o f the city was flooded twice during the four days o f heavy rain in September. Dhaka was completely shut down for one day and partially functioning for three days. Drainage obstructions, mixing o f sewage with flood water, and
32

infiltration o f polluted water into the water supply networks and ground water tanks have posed serious health r isks to the citizens o f Dhaka. Further, nearly 40 percent o f the city dwellers reside in low income slums and shanties without adequate water and sanitation services. Located mostly in low-lying areas, these slums are subject to inundation and cause severe health and economic loss to the affected people and an indirect productivity and economic loss for Dhaka city.
B. RECONSTRUCTION AND RECOVERY NEEDS
6.10 The DPHE reconstruction needs include a l i s t o f physical works for both the urban and rural areas. Items in urban areas include the repairhehabilitation o f 100 pump houses, 50 pumps, 50 km o f pipelines, and 1000 community latrines. In rural areas the l i s t includes the installatiodreplacement of 20,000 Tara tubewells with raised platforms, 20,000 Tara deep tubewells with raised platforms, 1000 new ring wells, the repair o f 100 ring wells, construction o f 100,000 pit latrines and 50,000 community latrines, the disinfection o f a further 50,000 water sources, the repair o f 400 sanitation sheds, and the rehabilitation o f 20 village piped water schemes. The estimated total cost o f these activities i s approximately US$46 million.
6.11 DWASA has prepared an ambitious recovery plan for Drainage, Sewerage and Water Supply rehabilitation amounting to US$7 1 mill ion that includes emergency works during floods (US$2 mil l ion already spent from WASA's own funds), post-flood emergency rehabilitation works (US$6.61 mil l ion from GOB), and post-flood medium-term recovery works (US$63 mil l ion expected from: GOB - US$14 mil l ion and donors: US$49 million).
Estimated Replacement Costs
6.12 Priority flood response under the DPHE should focus on the following items under the Phase One emergency post flood rehabilitation program: Urban areas - repairhehabilitation o f 100 pump houses and 50 pumps, rehabilitation o f 20 km pipelines, and constructiodrepair o f 1000 community latrines. For the rural areas - rehabilitation o f 100 ring wells, and constructionhepair o f 2,000 community latrines, and repair o f 20,000 hand-pump platforms. The total cost will amount to US$3.5 million.
6.13 Under Phase Two sustainable rehabilitation program, the mission recommends installation o f at least one hand-pump and two pit latrines in each o f the flood shelter, The DPHE report indicates that there are 824 hand-pumps and 2197 latrines in 5554 flood shelters. There i s a need to install at least 4700 hand-pumps and 9000 community latrines in the flood shelters. The numbers may increase as many flood shelters already have more than one hand-pump and two latrines. The cost estimate for installation i s US$3.5 mil l ion for hand-pumps and US$3 mil l ion for latrines. A total o f US$6.5 mil l ion will be required for this phase.
6.14 According to the revised D W A S A proposal for priority replacement o f the drainage, sewerage and water supply components, the 'estimates are U S 4 8 million, US$9 million, and US$6 million, respectively. Out o f the total o f US$63 million, GOB will provide about US$14 million, and the remaining US$49 mil l ion has been requested from donors.
c. IMPLEMENTATION ARRANGEMENTS AND COORDINATION
6.15 Implementation o f a flood recovery program for the water and sanitation sector should be well coordinated among the implementing agencies, which include the DPHE, Local Governments (Municipalities and Union Pari~hads), and NGOs. A large number o f NGOs are acting as service providers and facilitators in the rural water supply and sanitation sector. Thus a
33

well-coordinated effort will help maximize benefits and eliminate duplication. For Dhaka, WASA needs to coordinate with the City Corporation, which remains a serious challenge. WASA should also work closely with NGOs working in low income urban communities, as NGO outreach programs are extremely effective in mobilizing community capital and providing local level monitoring.
D. ENVIRONMENTAL AND SOCIAL ASPECTS
6.16 The flood rehabilitation components in the water and sanitation sector are largely infrastructures to effectively mitigate the public health externalities o f poor water supply and sanitation, especially for the poor rural and urban households affected by the flood. Addressing the water and sanitation needs will enhance environmental and social quality o f l i fe o f the affected people. No negative impact i s expected from the proposed interventions.
34

ANNEX 7 - PRIMARY AND POST-PRIMARY EDUCATION
7.1 The education sector suffered damage due to a combination o f factors - direct flood damage, use o f educational facilities as emergency shelters, and river erosion, which intensified during the flood. Mission members received detailed information from the two concerned Government Ministries, in addition to supplementary information from other sources. The team visited institutions in several Districts, including Bogra, Comilla, Manikganj , Munshiganj, Narayanganj and Siraj ganj .
Field Visit Findings
7.2 Generally, except in river eroded areas, the damage appears to be light and easy to fix. However, there i s a need to consider new design standards for future construction and additions, not only to reduce future damage, but also to, be more effective as emergency shelters. Classes were interrupted for an average o f twenty days but resumed as quickly as possible once the flood waters receded. In primary schools, al l the children took their textbooks home with them when the flooding started. Very few lost them during the flood, and the Government replenished lost books from existing stocks. The field visi ts confirmed physical damage to school structures, but i t was evident that good deal o f the damage was due in part to deferred maintenance. Furniture was damaged particularly in those schools that had served as flood shelters. The schools which were used as shelters also had their toilets damaged beyond repair.
A. DAMAGE ASSESSMENT
Primary Education 7.3 The mission assessed the damage estimates produced by the Government through field v i s i t validation and using statistical analysis on the correlation between flood damage and the estimates. Damage i s assessed at about Tk 2.4 bi l l ion (about US$41 million). The correlation16 was found to be highly significant which in large part validates the Government estimates but the flood does not fully explain the variation in damages. Some o f the damage i s also explained by the effect o f deferred maintenance and the heterogeneity among the different areas including in construction standards. The actual impact o f the flood damage i s significantly less than the replacement costs but the replacement cost i s the appropriate figure to chose because that i s the amount that will be needed to reach full functionality. Almost 70 percent o f the damage was to Government primary schools, 28 percent to non-Government primary school~,~’ and the rest to community schools.
Post-Primary Education 7.4 The damage amounts are more difficult to validate because o f the large variation between various private and public institutions that use different standards for construction and maintenance. Through field visi ts and data analysis, the mission team estimates the damage to Tk 1.8 billion, or about US$3 1 million, o f which 78 percent o f the damage was to buildings, and 22 percent to fumiture and equipment.
16Both multiple regression estimates and correlation coefficient estimates showed that the damage estimates were
17Non-Govemment schools receive a significant amount o f Government support. linked to the intensity of f lood with very levels o f confidence (significance levels better than ,0001).
35

B. RECONSTRUCTION AND RECOVERY NEEDS
7.5 The replacement cost i s expected to be about Tk 2.4 bi l l ion or about US$40 million. The replacement cost estimates are based on current standards which may not be suitable for the future.
c. PREPARING FOR BETTER FLOOD RISK MANAGEMENT
7.6 There i s a need to redesign buildings to take account of the flood risks, some seismic risks and also bearing in mind there future use as shelters during emergencies, The Local Government Engineering Department (LGED) has developed new designs for implementation during the second phase of the Primary Education Development Project (PEDP-II). Even though these designs are for primary schools they can be adapted to post-primary schools - the main difference i s the amount o f space allowed per student. These designs include options for normal plain areas, normal flood areas and high f lood tidal surge areas. All designs include reinforced concrete pillar structures. The high f l o o d coastal surge designs costs 65 percent more per student with a single story structure because it i s built on ten-foot pillars. If two floors are built on top o f the pillars, the increase in cost per student drops to 25 percent.
7.7 Note that the area surrounded by pillars can also be used as class space and this would drop the unit cost per student down significantly. The normal flooded area design costs 20 percent more per student, but by adding a second floor, the additional cost i s only 2 percent, The cost per student for the base design drops by 7 percent when a second floor i s added. Bangladesh i s densely populated country with a small land supply, which further boosts the idea o f building multiple story schools. The team recommends making these designs standard in new school construction and requiring a minimum o f two usable floors.
7.8 A flexible school calendar should be considered to ensure optimum use of school timing and quality primary education - currently rural schools lose an average o f 40 days due to floods and other such events. Responsibility o f the school calendar, based on the local weather conditions, will be decided by the District Administration, together with education and social welfare officer and NGOs providing education services. School vacation should be given during July-August in mid and north Bangladesh and in May and June in the Northeast haor areas. Similarly in the cyclone belt, classes lost could be made up during planned summer holidays at the discretion o f the District Administration.
36
ANNEX 8 - HEALTH AND NUTRITION
8.1 Field visits to the Bogra, Narayanganj, and Sirajganj Districts helped confirm that the health status o f the population was affected by the deterioration o f water supply and sewerage systems, and loss o f income. Scarcity o f food and unhealthy cooking practices has further aggravated the situation, especially for children, pregnant women, lactating mothers, and elderly and sick persons, People who visited health centers were generally injured by accidents related to the flood (head trauma, snake bites), water and food borne diseases, respiratory infections, skin diseases, eye infections, malnutrition, and stomach diseases. The doctors working in the field and heads o f the family welfare centers (FWC) interviewed by the mission estimated that the actual demand for these essential medicines during the flood exceeded almost five times the actual provision, This i s consistent with the fact that the teachers in the schools mentioned that at least one third o f their students below the fourth grade were reported sick (for at least 2 days) during the flood period. Doctors also reported an increase in diarrhea cases by about 30 percent, especially in children, as well as a similar increase in outpatient attendance. Medical services have returned to their original capacity.
A. RJiSPONSE TO HEALTH R I S K S DUE TO THE FLOODS
8.2 No major epidemic o f waterborne or other diseases followed the 2004 floods. Although 747 people died during the floods, most o f the’ deaths were due to snake-bites and drowning, and unlike in past disasters, few deaths were attributed to diseases. Only 400,000 cases o f diarrhea were reported, although the floods covered 39 percent o f the country and affected 36 mil l ion people with large numbers living in shelters. In addition to the health centers administering ORS to patients to treat diarrhea, most Bangladeshi households know how to make oral rehydration solutions themselves as a result o f successful public health education programs.
8.3 The absence o f major health epidemics testifies to good management o f health issues during the flood. Key factors to explain th i s outcome are: political commitment at high levels to address the problem (visits from high ranked officials, suspension o f all time off, suspension o f personnel who did not perform their duties), relatively prompt response o f the Ministry o f Health and Family Welfare (MOHFW) (i.e., immediate allocation o f budget and formation o f health teams), effective public and private collaboration (civil surgeon, NGO officials, chairman o f city council and local government), provision o f essential medicines to flood-affected areas (ie. oral rehydration saline or ORs, antibiotics for children, water purification tables, etc.), and sharing o f information on prevention and mitigation practices to reduce the flood’s adverse effects on the health o f the affected population.
B. DAMAGE ASSESSMENT
8.4 The total estimated requirement for flood rehabilitation o f health centers i s Tk 413 mil l ion ( U S 7 million). The Government has already allocated almost half o f t h i s amount (Tk, 200 million) from i ts own budget. While electricity was temporally affected in some places, the drug supply was not damaged. No major losses o f equipment have been reported. MOHFW announced that there i s no need for any further rehabilitation financing support, which was also confirmed by the joint team during the field visits.
37

Malnutrition Risk
8.5 There i s a need for targeted assistance to avoid severe malnutrition and morbidity among the poorest households. A total o f 3,802 community nutrition centers were temporally not functioning during the flood. UNICEF forecasts that at least one mil l ion children will be at serious r isk due to lack o f food. This should be monitored closely because the flood affected the livelihoods o f the poorest - such as agriculture laborers - quite significantly. These households will suffer from food shortages even though overall food shortages may be negligible.
c. PREPARING FOR BETTER FLOOD RISK MANAGEMENT
8.6 The following preventive measures are recommended to minimize r isk in the future:
(a) Improve facilities to better deal 'with flood risk Use different building standards with higher plinth levels to avoid future damage to health centers, Provide health facilities in flood prone areas with access to boats and related equipment to improve their disaster response capacity. Develop a basic package o f medicines to give to health teams for distribution among the population in flood-affected areas. Procure essential commodities (WPT, ORs, antibiotics for children, intravenous saline, etc.).
(b) Allow flexibility to increase emergency response capacity by authorizing the district govemment to hire drivers and other support personnel directly without requiring immediate clearance o f the central government. These personnel can be used to drive ambulances, boats, or conduct specific tasks during emergency situations. The health teams should continue functioning for at least three months after the flooding has receded. Bonuses could be given to doctors who work in the most critical f lood affected areas and who met targets in health outcomes.
(c) Ensure that nutrition services continue during the floods. Government and NGOs providing nutrition programs should include a flexible nutrition activity during a disaster. Before the flood season, they should build the stock o f nutrition packets, so that these can be delivered to flood shelters and households marooned by flood water. Women's groups in non-flooded areas should be asked to make more packets for delivery to flood-affected children and mothers. The information about exact contents o f nutrition packets should be disseminated by public media so that people themselves, along with community organizations, scouts, and volunteers, are able to make these packets for distribution.
(d) Maintain Reproductive Health Services in shelters and households affected by floods to reduce the r isk o f unwanted pregnancy and related complications. Government and NGOs field workers should give women at least a three-month supply before the flood season, and keep local stocks for delivery during floods.
38

ANNEX 9 - WATER RESOURCES MANAGEMENT
s1. No. Type of Facility
1 Embankment 2 Irrigationl
Drainage channels 3 Water Control
Structures (WCS) 4 Protective Works
9.1 Appropriate water resources management has played a major role in agriculture growth, and in poverty reduction in Bangladesh. Structural interventions in the coastal areas and the floodplains have significantly reduced the country’s vulnerability to natural disasters and have created economic opportunities for the poor by ensuring increased agricultural production. In total, about 9,000 km o f embankments have been constructed by the Government, incorporating more than 12,000 hydraulic structures, such as sluice gates. The Bangladesh Water Development Board (BWDB) has constructed over 600 flood control and drainage (FCD) and flood control, drainage and irrigation (FCDI) schemes covering about 6 mil l ion hectares o f land.
Damage to
Full Part Mill ion Tk Million US$
Total Damage to Infrastructure Unit Infrastructure
Km 147 2,390 2,460 42 km 219 336 69 1
Nos. 35 400 33 1 6
Kill 10 35 1007 17
Consultations and Site Visits
Total
9.2 The mission members focused on the water infrastructure under BWDB and1 LGED. The irrigation-drainage facilities through Bangladesh Agriculture Development Corporation (BADC) and Barind Multipurpose Development Authority (BMDA) have been covered under the agriculture sector assessment. The team held discussions with staff from the BWDB and LGED, along with local people in the flood-affected areas during the field visi t . The team visited the Districts o f Bazaar, Bogra, Gaibandha, Moulavi, Sirajganj, Sunamganj, and Sylhet from September 18 to 20, 2004 to obtain first-hand information on the extent and nature o f flood damage.
3,867 66
A. DAMAGE ASSESSMENT
FCDD Schemes under BWDB
9.3 According to BWDB’s estimates, the costs for repair and rehabilitation o f the flood damages to FCDA infrastructure in 39 districts would amount to about Tk 3.9 bi l l ion (or about US$66 million). Th is estimate includes damages to 2,537 kilometers o f embankments, 555 kilometers o f irrigation-drainage system, 45 lulometers o f riverbank protection works and 435 water control structures in 33 1 schemes (Table 1). Embankments and river bank protective works account for 88 percent o f the damage; the remaining 12 percent comprise water control structures and irrigation-drainage systems.
9.4 There i s agreement about the general extent o f damages to FCDl I infrastructure, and about the immediate repair and rehabilitation needs. Nevertheless, BWDB has appointed a
39

national consulting firm to conduct a detailed survey and assessment in order to ascertain the damage and prepare a fmal cost estimate.
Total Damage to Total Rehabilitation SI. Type of Facility Infrastructure No. Mill ion Mil l ion Mill ion Mill ion US$
1 Embankment 2460 42 2706 46 Tk US% Tk
2 Irrigation/ 69 1 76 1 Drainage Channels
Structures 3 Water Control 331 6 365 6
4 Protective Works 1007 17 1108 19
Grand Total 3867 66 4255 72
Small-scale W a t e r Resources Development Subprojects under LGED
Remarks
(About $2.0 M for TA)
9.5 The flood has caused damage to a total o f 112 small-scale water resources development subprojects in 24 flood-affected districts. Field assessment showed damages on 242 km o f flood protection embankments, 154 km o f drainage canals, and 153 water management structures. The estimated loss o f annual agricultural production o f the 38,000 ha i s about 125,000 tons. The immediate impact of the flood damage will be reduced agricultural production from these subprojects, which will also reduce income o f some 44,000 households. The rehabilitation cost i s estimated at about US$2 million.
Other Observed Impacts
9.6 The Government i s considering a three-year recovery plan, which wil l influence the sectoral annual development budgets. In the water sector, the FY05 total GOB budget i s Tk 8 bi l l ion (US$137 million). The flood rehabilitation works will require about 23 percent o f the sectoral ADP (Tk1.8 bil l ion out o f Tk 3.9 billion), Some o f the emergency works have already been taken up by the Government at a cost o f Tk 250 mil l ion (about US$4 million).
13. RECONSTRUCTION AND RECOVERY NEEDS
9.6 BWDB’s damage cost estimates are based on current standards, which require upgrading. The estimated rehabilitation cost i s Tk 4.3 bi l l ion (equivalent to US$72 million), includes a 10 percent increase above the estimate from BWDB to cover improved design standards, flood proofing, consultancy and physical contingencies (Table 2). Of this amount, the repairlor rehabilitation o f 2,537 km damaged embankment have been estimated to cost Tk 2.7 bi l l ion (US$46 million), while the costs for protective works i s Tk 1.1 bi l l ion (about US$19 million) and the repair o f irrigation-drainage system i s Tk 76 mil l ion (or US$1 million).
40

Recovery Strategy
N o of Affected Schemes
91
65
28
" ................ " ............ "
.__.....-
......... "I ..... 48
^" .- ......................... " ...... " .... ". 75
18
6 I_..-"
33 1
9.7 The M O W W D B plans to complete the rehabilitation works in following three phases:
Phase I: Emergency
MTk (MUS$)
283
195
561
........ " ........... .....
-._I-.___...." -.--I- -.
240
......................... " ........ " ......... " 442
_"
44
65 " 111111 ~..-
1,830 (31)
(a) Phase One: Emergency (1 yeadJune 2005): Given the BWDB estimates for damage, the immediate repair and reconstruction works in the 33 1 schemes are now estimated to cost Tk 1.8 bil l ion ( U S 3 1 million). Some o f these works have already been taken up at a cost o f Tk 250 mil l ion (about US$4 million) by GOB financing.
1
(b) Phase Two: Short-term (2 yrs./ June 2006): BWDB estimate for damages suggests that short-term rehabilitation works in the 331 schemes are estimated to cost Tk 1.5 bi l l ion (US$25 million), These works will be taken up after detailed survey and verification for completion by June 30,2006.
Central Zone 12
(c) Phase Three: Mid-term (3 yrs./June 2007): BWDB estimate for damages suggests that mid-term rehabilitation works in the 306 schemes are estimated to cost Tk 558 mil l ion (US$9.5 million). These works will be taken up after detailed survey and verification for completion by June 30,2007.
96
139
533
....... " ...... " ...
-_.C_--.__.-....-...--.~-._I.-.
I " .- ......................... 261
.." ....-..llltl" - ............ 395
llllll"t" " ". 15
43
1,482 (25)
Table 3: Damage Assessment for FCDn schemes by Phases for all BWDB Zones
25 404
63 397
230 1324
.- .............. ....I..I...." ................... 171 ..................... " .......
" ..-.__. (89" (22)
(10)
(17)
I I 4)" ....
........ " l"l.. ....I." " ....... 57 558
" " .................... " ................... " ............... " 154 99 1
....... "" I ~ .
10 69
18 125 (2)
557 (9.5) 3,867 (65.5)
Affected Districts
.-.....I.. ................. 3
" ~
4
,,-.--"I._
5
(Ran@%! -l-._...-l._l" North-West 6 Zone
.._ce... ajshahi) ____ ........ ".. ................................. "
South-West 6 Zone
North-East 7 Zone
........................ "l".."." ......
._,... (Faridpur) " ...... " .... " ... "... ..... " .... .- "
...... "..".l.".l..l." .."".............
................... ........ .......
.............. .
I Zone I
Short-
41

ANNEX 10 - URBAN AND MUNICIPAL INFRASTRUCTURE
10.1 The joint team held discussions with staff from the Local Government Engineering Department (LGED) at Dhaka and at field level as well as i t s consultants, elected local government (municipality) officials and staff, and local people in the flood-affected districtsltowns during the field visit. The joint teeam visited Moulv i Bazar, Habiganj, Brahmanbaria, and Mymensingh municipalities and the Sylhet City Corporation between September 18 and 20, 2004 to gain first-hand information on the extent and nature o f damage in these towns.
A. DAMAGE ASSESSMENT
10.2 According to the estimates prepared by LGED and i t s consultants, the costs for repair and rehabilitation o f the flood damages to urban infrastructure in 159 municipal areas would amount to Tk 3.1 bi l l ion (or about US$52.5 million). T h i s estimate includes damage to 2,277 kilometers o f roads, 80 kilometers o f drainage and 1,559 meters o f bridges or culverts as well as other structures in these 159 towns.
10.3 The flood damage assessments have been prepared by each municipality and reported through the LGED after a preliminary verification by a group o f consultants working under LGED-executed projects. However, based on the field visits, the team considered that some o f the assessments and repair costs may have been overestimated, both in terms o f quantity (of items) and related cost estimates.
Other Observed Impacts
10.4 In addition to damages to the physical infrastructure, housing and business establishments in some towns (such as Habiganj, Sunamganj and Sylhet) also had extensive damages due to flooding and water-logging with consequent losses to the households and firms. These losses have not been included in the estimates, but are reflected, to some extent, under the trade and industry sector assessment.
B. RECONSTRUCTION AND RECOVERY NEEDS
10.5 Given the LGED estimates for damages, the immediate repair and reconstruction works in the 159 municipalities are now estimated to cost about Tk 3 bil l ion (US$53 million) (Table 1). Of this amount, the reconstruction o f 2,277 km damaged roads have been estimated to cost Tk 2.8 bi l l ion (US$48 million), while the costs for drainage rehabilitation i s Tk176 mil l ion (US$3 million) and the repair o f bridges and culverts i s Tk 100 mi l l ion (or about US$2 million).
10.6 There i s broad agreement on the general extent o f damages to urban infrastructure which need immediate reconstruction However, to ascertain the assessment and verify the cost estimates, further extensive and detailed survey by a team o f consultants should be carried out as soon as possible.
42

Table 1: Summary o f Flood Damage to Municipal Infrastructures
SI. No.
1. 2. 3.
4.
Type of Urban Communication Infrastructure
Road Drain BridgelCulvert Others (Municipal Centers)
Quantity
2,277 k;n 80 km
1,559 m _--
Rehabilitation Cost (million Taka)
~~ ~
Sources: LGED; &kilometer; m e t e r
Rehabilitation Cost (US$ miliion)
~ 2,803
3,099 I 53
43

ANNEX 11 - TRADE AND INDUSTRY
1 1.1 The country’s manufacturing sector includes sub-sectors such as ready-made garments (RMG), textiles, frozen shrimp, leather, chemicals, pharmaceuticals, fertilizers, engineering, food processing, sugar, and light engineering. From the point o f view o f exports, the RMG industry, both woven and knitwear, i s the most important. The RMG industry i s also the biggest employer outside o f the agriculture sector, and employs mostly women. Knitwear i s a fast growing segment o f the RMG sector, and it i s in a better position to face the post-MFA challenges. I t s backward integration i s over 80 percent.
11.2 According to Government data, industry was worst hit by the recent floods in the greater Dhaka and Narayanganj Districts, These Districts account for a substantial part o f the manufacturing sector, while about 70 percent o f knitwear f i rms are concentrated in Narayangnaj. There was also some damage documented in the Districts o f Sirajganj, Bogra, and Pabna.
Field Visits
1 1.3 The ADB and the World Bank conducted a field visit to Narayanganj to asses the damage to industry and trade. The team was joined by a representative from the Export Promotion Bureau (EPB). The team went to 5 knitwear enterprises in different locations o f Narayanganj, three o f which were small (400 to 500 employees per enterprise) and two were large (3000 to 5000 employees). Three o f these enterprises were located in a BSCIC Industrial Estate and two were located outside the estate, Discussions with the entrepreneurs, site visits, and the visit to the BSCIC estate provided the team with a better understanding o f the overall damage to exports and infrastructure.
A. DAMAGE AND OUTPUT LOSS ASSESSMENT
11.4 The GOB asked the Ministries o f Commerce and Industry to assess the damage to industry and trade. The damage caused in the RMG sector was varied and included losddamage to raw materials, capital machinery, disruption in production (which resulted in cancellation o f orders), air lifting of cargo, etc. The Ministry formed a committee in the EPB with representatives from Bangladesh Garments Manufacturers and Exporters’ Association and Bangladesh Knit Wear Manufacturers and Exporters’ Association to assess the damage caused by the recent flood. Given the concentration o f export-oriented industry around Dhaka and Chittagong, the Ministry o f Commerce asked the Committee to conduct the damage assessment survey o f industries in these areas and to assess the impact on exports.
Damage in RMG and Knit Wear
11.5 Dhaka Area. The EPB database shows that there are about 850 RMG units in the flood- affected areas o f Dhaka; the survey indicated that 231 RMG units were seriously affected. The damage in these flood-affected RMG uni ts i s shown in Table 1.
44

Table 1: Damage to RxlG and Knit Wear Units in Dhaka Area
Type of Loss Lossldamage o f Capital Machinery
Type of Loss I Amount
Amount Tk. 71,784,245
Lossldamage o f capital machinery I Tk. 51,884,612 Production lossldamage Loss from damage of raw materials Others lossldamage in production Lossldamage due to cancellation o f orders Lossldamage due to late shipment (cost o f air lifting) Other lossldamage to exports
Tk.436,034,703 Tk. 27,490,125 Tk. 16,80,500 Tk.160,113,095 Tk. 182,218,966 Tk. 1,152,230
I
Total I Tk. 885,844,301 (US$15 m) Source: Government of Bangladesh Survey
11.6 Narayanganj Area. The EPB database shows that there are around 640 RMG units in Narayanganj and the survey revealed that 450 RMG units were affected by the floods. These units are located in BSCIC Industrial Area (Enayet Nagar), Nayamati, Netaigonj, Masdair, Tanbazar. Table 2 shows the lossldamage in RMG and Knit Wear sector in Narayanganj area.
Table 2: DamageAosses in RMG and Knit Wear Units in the Narayanganj Area
Production lossldamage Loss from damage o f Raw Materials Others lossldamage in production Lossldamage from cancellation o f Orders Lossldamage due to late shipment (cost o f air lifting) Other lossldamage in export
Tk.594,578,835 Tk.253,474,521 Tk.115,970,054 Tk.999,020,219 Tk.337,695,061 ----- - I
Total I Tk.2,372,422,935 (US$40.6 m) Source: Government of Bangladesh Survey
1 1.7 Overall Damage in both Areas. The total amount o f lossldamage caused by flood in the RMG sector amounts to about Tk 3.3 billion, The total export earnings in the RMG sector amounted to Tk 33.5 bi l l ion in 2003-04. In that respect, the total loss from damage caused by the devastating flood stood at almost 1 percent o f total export earnings.
Damage in other sectors
11.8 Besides the RMG and knitwear industries, the committee with the help o f the survey teams and thorough discussion with the concerned trade bodies estimated the damage in some other exportable products. The lossldamage in these sectors i s shown in Table 3.
45

Table 3: Damage in Other Exportable Products
.I..._." ... - . ............................... _ Frozen Foods
l." .................................................................... ".."...I" .............. ll.l..lll...
Name of Products 1 Damage in million Taka
.. .. ..tl ...I....-.." ...... " -. . 350 ( 2,000 long term loss) . . "__._--......I_...-__,_"-.,,I." ..... ,,,I, .................. .,.l,l ................................
Textile Products I 504.3
Leather Goods Handicrafts Ceramic Products
..... - .................................................... ............ ......................... . ".I-.." . ....................
.............. ...l.....l.l......-.. ................................. ............. 1- .......
Terry Tower and Linen Products I 156.3
2100 3.1 3.1 Cancellation of export order worth US$22,530
..... ............... ............ I.-.-._ ............................................................... .............
"_ ............................... "l..." .......... ...................... ............................................... .........
. . .-.-.-.-.--ll..l-. .. ...... ........................... - .............................
Vegetables and Fruits I 4.3
Melamine Products Raw Jute Jute Goods
- " ........ 1.1. .. . . ..~_C_----.~....-.-l__(((__(l__(.
.. .................................. .... . ..............................................................
10.3 100 1,042.5
............................................................... . "-"
I" ........................................................... ".l.." ................. .............. .........
Overal l loss in Expor t Goods
11.9 The damage described above indicates that the total loss in RMG, knitwear, and other exportable products i s about Tk 9.6 billion, or over 2.0 percent o f the total export earnings (Tk 448 billion) o f 2003-2004. The Ministry o f Industry has also conducted a damage assessment, and these results are summarized in Table 3. The MOI estimates show that there was some infrastructural damage amounting Tk 60 mil l ion in the enterprises of: Chemical Industries Corporation, Sugar and Food Industries Corporation, and Steel and Engineering Corporation located in flood-affected areas l ike Jamalpur, Pabna, Narayanganj. T h i s damage i s being repaired by the affected corporations using their own resources.
11.10 The main damage assessed by MOI i s to the 54 industrial estates in the flood-affected Districts. These industrial estates are managed by the Bangladesh Small and Cottage Industries Corporation (BSCIC). The main damage i s related to infrastructure, for which the estimate i s Tk 350 million. The MOI report also shows that there i s partial damage to installations, machineries, raw materials, and finished goods. T h i s damage has been estimated to be Tk 5 1 1 million.
1 1.11 The BSCIC also runs some poverty alleviation programs for women that help them get involved in income generating activities and cottage industries. The damage has been estimated to be Tk 335 million. The BSCIC has prepared a rehabilitation plan costing Tk 528 mil l ion and has sent it to Planning Commission for approval.
B. RECOVERY STRATEGY
11.12 While the industrial production in flood-affected areas was hampered and suffered production loss, this may have negligible impact on overall exports o f RMG. The lost production will be met through mechanisms such as overtime production and air-shipment. But these actions will be at individual excess cost to the entrepreneurs, who are facing cash-flow shortages until they return to a normal production and export cycle.
46

11.13 The key support that the entrepreneurs are looking for i s timely implementation o f the cash incentive scheme that the Government has budgeted to support local value addition. The Government has responded to this by allocating Tk 1.5 bi l l ion o f arrear cash-incentive money. The entrepreneurs are asking that this be made current. The reason quoted by the knitwear manufacturers i s that the price that they pay for yarn procured from the spinning m i l l s already takes into account the cash incentive portion. Since they have spent the money, they want this to be replenished quickly.
11.14 Since many o f these industries are located in the BSCIC estates, the repair o f damaged infrastructure needs to be completed. The Government has plans to repair infrastructure in 54 BSCIC estates identified by BSCIC as having been damaged by the flood. The Government has also taken programs for repair o f damaged roads, a necessity for industry and exports.
47
ANNEX 12 - AGRICULTURE (CROPS, LIVESTOCK, AND FISHERIES)
Sub-sector
12.1 The 2004 floods have seriously disrupted l i fe in the rural areas by causing damages to assets, loss in production, loss o f income and an increase in unemployment. The impact o f the floods i s magnified by the fact that poverty in Bangladesh i s primarily a rural phenomenon - about 85 percent o f the poor (which constitute about ha l f o f the total population) are rural poor. Moreover, about 80 percent o f Bangladesh's population lives in the rural areas and their main livelihoods come from the agriculture and rural non-farm sectors. Agriculture i s dominated by small and marginal farmers, and a large share o f the rural population consists o f landless laborers who depend on the agriculture and rural non-farm sectors for employment." At the same time, agriculture (crops, livestock, and fisheries) accounts for about 23 percent o f GDP. The rural non- farm sector, which i s driven primarily by agriculture through forward and backward linkages, accounts for another 33 percent o f GDP.
Damage and Loss (Million US$) Direct Damage Loss
Damage and Loss (Million US$) Indirect
Total Public Private Total
A. DAMAGE AND LOSS ASSESSMENT
Crops 60 435 495 45 450
12.2 sectors i s summarized below:
The preliminary damage and loss assessment for the crops, livestock, and fisheries sub-
495 Livestock 60 15 74.8 75 Fisheries 180 10 1~~ 1 ~ : ~ 179.3 180
Total I200 1450 1650 146 1525 1650 Sources: GOB Data; Asian Development Bank and World Bank Staff estimates
Crops
12.3 About 4.9 mil l ion farm families (42 percent o f a l l farm families) have been affected by the floods in terms o f potential production loss (US$435 million) for aus and aman rice, jute, summer vegetables, papaya, bananas and sugarcane. The value o f production loss estimate may be on the higher side, particularly for crops such as rice where retail prices, as opposed to prices received by farmers, have been used to determine the value o f production loss. This estimate, however, does not include an estimated loss o f US$ lS l mil l ion to the bovo rice crop due to flash floods in April 2004.
12.4 Even though it i s early to forecast, the rice production i s expected to be lower by about one mil l ion MT, or about 4 percent o f rice production in 2004105. Given the vibrant private sector trade and large stocks o f cereals, this reduction i s not l ikely to affect rice prices or availability at the national level. On the other hand, adequate access to food and food security may be affected at the household level, depending on the level o f household income, purchasing power, and
'' Approximately 75 percent o f the rural households are either landless (34 percent) or own less than 0.5 ha o f land (41 percent).
48

available social safety nets. All o f the crop loss i s in the private sector, and a large number o f the small, poor farmers have been left with a very limited capacity to bear the loss from the floods. Unless the country experiences bumper bovo rice and other crops, incomes for flood-affected rural families are l ikely to decline. In addition to crop production loss, the Ministry o f Agriculture has indicated damage to physical infrastructure and rehabilitation needs o f about US$45 million.
Livestock
12.5 Both the subsistence and commercial farms have experienced damage and suffered livestock losses. These include: losses due to dead animals - cattle (8,300) as well as poultry birds (366,000 chickens and 81,000 ducks), and to production o f milk, eggs and meat; damage to animallpoultry sheds; and the loss o f feed, fodder and pasture. Many poor and small landless farmers had to sell their animals (probably one o f the few assets they had) at “distress sale” prices. Total damage and loss i s about US$75 million, almost all o f which i s in the private sector. In addition, there has been a temporary reduction in animal weight, productivity, and value, which i s estimated to be about US$230 million. Th is loss i s not included in the estimated damage and output loss to the livestock sub-sector.
Fisheries
12.6 Losses in the fisheries sub-sector are related to damage to infrastructure (farms, ponds, hatcheries and nurseries) and loss o f fries, fingerlings and fish. The total loss (not including production loss that may have been suffered by shrimp farms) i s estimated to be about US$80 million, almost all o f which i s in the private sector. Although there have been losses for individual households and the private sector, i t i s l ikely that catches in open water capture fisheries will increase, as happened after the previous floods. The information reported by the Bangladesh Bureau o f Statistics indicates that overall the shrimp production did not suffer any losses during 1998 floods, which were equally severe and lasted much longer than the 2004 floods. The production and exports o f shrimp in 1998199 were higher than in 1997198. There may be some, but relatively small, losses to the fresh water shrimp (golda) due to loss o f fries and to the brackish water shrimp (bagda), particularly in those shrimp farms that are suitable for growing shrimp year round.
B. FLOOD-RELATED GOVERNMENT PROGRAMS
12.7 The Ministry o f Agriculture has initiated a rehabilitation program to provide free seed (and seedlings for aman rice) and fertilizer to small and marginal farmers.” The amount o f free seed and fertilizer provided by MOA can adequately be used to cultivate only 1 bigha (0.33 acre) of crop land. The total cost o f the program i s about US$28 million. The program i s s t i l l under implementation and covers about 12 crops, including bovo rice and maize.
12.8 The Ministry o f Fisheries and Livestock has also initiated rehabilitation programs for livestock and fisheries. The livestock program i s relatively small, and the Ministry has proposed a larger recovery program that requires hnding. The fisheries program i s designed to provide fries, fingerlings, lime, feed, fertilizer, and repair infrastructure for both affected families and public sector entities. In addition, the Ministry has prepared a two-phased program for the fisheries sub- sector which also needs funding. Overall, thus far the MOFL has provided about US$2 mil l ion to
190ut o f the 4.9 million affected farm families, 2.7 million, or about 55 percent, are small and marginal farmers who cultivate up to 2.5 acres o f land.
49
support the recovery o f the livestock sub-sector and US$2 mill ion to support the fisheries sub- sector.
Agricultural Credit
12.9 The Government has initiated an agricultural credit program that consists o f (i) an additional US$50 mil l ion for flood rehabilitation through commercial banks for 2004105; and (ii) rescheduling of existing loans to delay repayment for up to one year. However, given the history o f agricultural credit in Bangladesh, the small and marginalized farmers and the rural poor are not very likely to benefit from these programs. These farmers may end up borrowing from informal credit markets (friends, relatives and money-lenders) at very high rates o f interest to compensate for the production loss andlor to finance the rehabilitation o f damage to assets caused by the floods.
c. RECOVERY NEEDS AND STRATEGY
12.10 Ensuring fast recovery o f the agricultural sector and the rural economy i s critical to reduce poverty and promote economic growth. At the same time, as emphasized in this report, the recovery process should promote disaster preparedness and mitigation. Accordingly, the recovery (short, medium and long-term) strategy for the rural sector must address the need to facilitate access to financial resources to affected rural households, including credit and grants (especially to support recovery o f the livestock sub-sector). In addition, it should support measures to reduce losses to aquaculture and ensure rehabilitation o f facilities in key sector agencies. Total recovery needs are estimated at about Tk 21 bi l l ion (US$360 million).
12.11 Access to Credit. Credit should be provided to ensure the rapid recovery o f flood affected farmers, fishermen and other rural poor families. Experience in Bangladesh indicates that a small, low interest loan o f between Tk.5,000 to 10,000 (an average Tk.7,500 per targeted rural family) would adequately help rural households finance rehabilitation o f farms, sheds, storage facilities and house, and repaymentkonsolidation o f existing debts; purchase o f agricultural inputs; meet emergency household needs; and finance repayment o f existing debts. Credit can be delivered using proven mechanisms such as PKSF and i ts partner organizations, as well as other NGOs providing microfinance seFices in affected areas.
12.12 Evidence from the 1998 flood suggests that poor flood-affected households may have credit needs amounting to about one month o f normal household expenditures. Assuming that, on average, monthly expenditure o f a rural poor family i s US$125 and that about 2.67 mil l ion small and marginal farmers and other rural poor families were affected by the flood, credit needs could amount to as much as US$335 million, The development o f a sound monitoring and evaluation system would be needed to oversee the implementation o f this type o f credit program.
12.13. Access to Cash Grants. The Government has proposed a program to promote rehabilitation and recovery o f the livestock sub-sector in the 245 Upazilas affected by the floods. The program consists o f (i) provision o f medicine, (ii) distribution o f chicks, ducks, goats and heifer calves; (iii) repair o f animal and poultry sheds; (iv) provision o f poultry, cattle and goat feed; (v) provision o f fodder seed; (vi) support for vaccines; and (vii) rehabilitation o f selected DLS (Department o f Livestock Services) facilities. The total cost o f the proposed program i s
50

about US$18 million.'' Making sure that the benefits reach the affected low-income households will be essential to the success of this program.
Department o f Fisheries (DOF) _" .............................................................. - ".-..~.-.-...~....-...I
Bangladesh Fisheries Research Institute (BFRI)
12.14 Crit ical Rehabilitation Needs for Selected Sector Institutions. Based on the Government assessment, physical rehabilitation needs that are critical to the recovery o f the forthcoming boro rice and other dry season crops amount to about US$4.5 million, comprising the following;
Fish Farms 0.10
Research facility 0.25 .......................... ......................................................................................................................
Agency Type of Facility I Activity 1 million)
Ministrv of Agriculture Bangladesh Agricultural Development Corporation
Berind Multi-Purpose Development Authority (BMDA)
Seed storage facilities h w irrigation works Boro irrigation works
................................ .. ...... .".-...~-II.. ....... I..." .................................... 1 ( B A w
................ ..................... 1"" I..-" ..... 1"" ...... .. """._ll". .. 1,1 1-,,11,-1 I .... Bangladesh Jute Research Institute (BJRI) 1 Research facilities
0.42 1.90 1.31
...................... " " ........... " ..... "" .....
..... "- ..................... 0.42
." .......... " " .. "" " ~ 1 .. ....... "".l".."l" ..""..I."...I ......... " ..................... "".l .... " ...... Research facilities I 0.10 1 Bangladesh Rice Research Institute (BRRI)
Subtotal I 4.15 Ministw of Fisheries & Livestock
Subtotal I 0.35 TOTAL 1 4.50
Th is program can be linked with the ongoing second Participatory Livestock Development Project funded by ADB and NGOs supported programs.
51

ANNEX. 13 - MICRO CREDIT^^
A. POSSIBLE IMPACT OF THE FLOODS
13.1 Pall i Karma Sahayak Foundation (PKSF) - the apex funding institution for microcredit in Bangladesh - has conducted a preliminary survey on the flood affected areas under the coverage o f i ts partner organizations (POs). A total o f 62 small POs o f PKSF have severely been affected by the flood, amounting to 384,256 members. Among worst affected POs include TMSS (78,463 members), SSS (53,910 members), POP1 (20,828 members), CDIP (19,746 members) and CCDA (18,347 members). However, there are other POs that are to be accounted for the total loss assessment.’
B. FUNDING NEEDS
13.2 Assuming a rehabilitation cost o f Tk1,OOO per borrower, and that 20 percent o f all borrowers o f OOSA22 and 3IPOOLz3 have been affected, PKSF has calculated the total required fund for borrower rehabilitation to be Tk.l bi l l ion (US$17 million). PKSF does not have enough resources to support the entire loss o f i ts borrowers, and proposes to provide some support in mitigating these losses on priority basis o f the borrower. Hence the foundation has been advocating the POs in tapping potential external resources to acquire funds to complement their resources.
Disaster Management Fund
13.3 PKSF views floods as another predicament for i t s poor borrowers and considers preparing them to mitigate natural calamities o f day-to-day l i fe as the ultimate goal o f the institution. PKSF terms the rehabilitation o f the affected borrower as “vulnerability mitigation.” This approach i s also considered as a long term effort to establish a revolving fund for disaster management o f the destitute. There has been a paradigm shift in the microfinance sector, where practitioners are placing more emphasis on strengthening the crisis coping capacity o f the borrower instead o f waiting for the disaster.
13.4 Specifically, the Disaster Management Fund (DMF) i s currently disbursed as loans to the affected borrowers at very nominal rate (1 percent or less), which i s repaid to the POs on soft terms with a flexible repayment period o f up to two years and a grace period o f six months. This fund in turn may be used by the beneficiaries to meet some o f their immediate consumption needs, reconstruct their homes, replace their tubewells, and remake their latrine facilities, depending on persona1 priorities.
C. POLICY IMPLICATIONS
13.5 PKSF has sanctioned Tk 56 bi l l ion to fund the Disaster Management Fund (DMF) for flood rehabilitation purposes. The latest information from PKSF shows that up through early September 2004, an amount o f Tk.9,l bi l l ion has been disbursed. During the post f lood period in 1998, PKSF sanctioned Tk 5.5 bil l ion for flood rehabilitation activities, o f which POs only could
~
”The needs assessment does not include the Government’s microcredit programs, such as those implemented by the Bangladesh Rural Development Board (BRDB).
’’OOSA: Organizations Operating in Small Areas. 23BIP00L: Big Partner Organizations Operating in Large Areas.
52

utilize Tk 4.6 billion. Therefore the track record shows that the sanctioned amount i s not fully utilized due to several reasons:
Per borrower allocation i s found to be inadequate given the allocation across affected POS. POs are reluctant in taking partial financial support considering the loss in totality. Some POs are more accustomed to relief programs and have not adapted to loan programs during disaster periods. ,
The borrowers are mostly reluctant to borrow money instead o f receiving free relief at the time o f a disaster There i s a preference among the POs to have a longer disaster loan cycle than the proposed two years at PKSF-PO level The operational cost o f conducting a loan program (disaster) i s much higher than the stated 1 percent service charge. The POs require it to be approximately 4 percent at a minimum. The POs find it easier to utilize the accumulated savings o f the borrowers, which they distribute among the borrowers during disaster period The POs find it easy to tap donor funds directly during the time o f disaster The Disaster Management Fund (DMF) i s disbursed as loans to POs which they must refund back to PKSF at zero percent service charge. The POs also are directed to lend this money at a 1 percent service charge to the affected borrowers. Therefore, the POs typically show reluctance in credit management because they find it burdensome.
13.6 The POs themselves have their own Disaster Management Fund (DMF). The POs are required to allocate 1 percent o f total profits as Disaster Management Fund (DMF) every quarter. Up to June 2004, the affected 62 POs have accumulated Tk 13.9 bi l l ion as a DMF. Given their localized operation at the grassroots level, the POs have been very effective in delivering microcredit to rural assetless and landless families. PKSF at present has 177 active POs that have organized a wide network of samities (societies) o f assetless and landless poor in rural areas o f 64 districts. It i s assumed that the network o f local NGOs would be effective in delivering the Disaster Fund in a transparent and efficient way.
13.7 As for the Microcredit Program (MCP), historically some flexibility has been allowed for POs beyond the typical 46 installment period due to natural disaster reasons. Th is includes the postponement (up to three months) o f the repayment schedule based upon the status o f the income generating activities o f the beneficiaries as well as availing a second microcredit loan while servicing the first loan concurrently. In general, the POs are not subject to put pressure on the borrower in installment collection during a disaster period.
13.8 Given their financial position, the smaller NGOs are unable to provide grant money. Therefore the revolving fund could serve as cushion against an unanticipated requirement o f funds to rehabilitate the beneficiaries during a disaster period. As practitioners advocate for the revolving disaster management fund, initially i t shall not be declared as a priori (i.e. grants to borrowers) provided the objective o f developing crisis coping capacity o f the beneficiaries. Irrespective o f the repayment behavior o f the borrowers, an appropriate provisioning option o f the DMF has been adopted by PKSF.
13.9 Nevertheless, the NGOs typically opt for relief programs rather than credit facilities at the time o f a disaster, given people’s demand. The NGOs view PKSF as a credit organization, and given PKSF’s role, the NGOs shy away from taking funds from PKSF due to their preference for relief and cost effectiveness o f the credit operation.
53

Table 1: Partner Organizations @Os) of PICSF and Affected Areas
Name of PO (NGO) SABALAMBI
ANNESHA CEDAR
CARSA BEES
SDC
ASPADA
VARD
OSAKA SATU EC Bangladesh
PCD
RDWF
GRAMAUS PRODIPAN
suss SKS SOLIDARITY
ASOD CCDA
CDIP PDIM
K S
DNP
SPUS
V P U
T A W SARTAJ
ASUK NOBLE
GSS SDI ARCHES CREED
VERC GUP GUK
sus
Name of the District Netrokona
Gopalganj, Pirojpur, Borisal Narayanganj, Narsingdi '
Madaripur, Shariatpur, Borisal Narsingdi, Hobiganj, Gazipur, B.Baria, Kishoreganj
Faridpur
Myrnensingh
Sylhet, Moulovibazar
Pabna
Tangail
Munshiganj
Pabna Dhaka
Mymensingh
Jamalpur Tang ail
Gaibandha
Kurigram
Rangpur
Comilla, B.Baria
B.Baria, Comilla Gazipur Rajbari Faridpur Manikganj
Rajbari
Bogra
Borisal
Bogra
Manikganj
Dhaka, Manikganj
Siraj ganj Gazipur
Dhaka, Manikganj, Narayanganj
Madaripur Bogra
Dhaka
iffected People 1,179 $900 1,067 3,810 5,857 558
510 2,468
266 199 550
751 1,637
408 1,26 1 35 5,879 3,384
327 18,347
19,746 2,280 1416
752
3,700 784 1,110
391 475 1,274
6,909 2,910 1,310 6,162
1,180 4,351 6,463
54

Name of PO (NGO) PBK
VDA
SDS
PPD
RIC
N U S
ARAB POP1
ORA
SOJAG GKT
P M K
TMSS
sss UDDIPAN
PPSS
PMUK
BDS BASA
DSK
DAB1
SHONIRVAR
PROGRESS POSOBID
UDPS Total
Source: PKSF
Name of the District ~ ~~
Kishoreganj Faridpur
Shariatpur
Sirajganj
Munsiganj, Narsingdi
S hariatpur
Manikganj, Dhaka
Netrokona, Kishoreganj, Narsingdi, B .Baria Kishoreganj Dhaka
Manikganj
Manikganj, Dhaka, Gazipur, Tangail
12 Districts
4 Districts
Chandpur, Comilla
Faridpur
Netrokona, Gazipur, B.Baria, Chittagong, Pirojpur Barisal, Madaripur, Gopalganj
Tangail, Gazipur
Netrokona, Kishoreganj
Naogaon, Jaipurhat Gaibandha
Jamalpur
Moulovibazar
Sirajganj
Affected People
7,210 2,679 3,912 7,621
4,4 16 5,173 3,410
20,828 1,891 4,290 6,977
9,889 78,463 53,910
16,276 1,256 5,748
3,684 7,547
4,59 1 1,740 4,925 700 350 4,064
384,256
55