2004 Annual Report - Cracker Barrel Old Country Store, Inc.
66
Danny Don Leon Becky Mike Cheryl Linda Peggy Jeff Diane Suzanne Eric Georgetta Julie Sheree Gilbert Dewitt Sarah Harold Lila Jimmie Judy Eric Charles Zeb Gerald Lindsea Evan Kathy Derrell Margareta Susan Juanita Nicki John David Rochell Ronald Andy Rita Wanda Kathy Betty William Teresa Joyce Tony Martha Charlene Paul Brenda Diane George Ronnie Donna Elizabeth Vernita Pearl Thomas Donna Sanford Michele Betty Sherry Heather Pamela Mark Terri Sarah Charles Bradley Jerry Kevin Larry Janice Charles Roy James Mark Sara Jacquelyn Jim Mark Anna Terry Thomas Cheryl Aaron Shirley Mary Kenneth Malinda Troy Bobby William Doris Linda Barb Charlene Patricia Edgar Tyronne Mark Marilyn Priscilla Al Carolyn Matt Robert Mickey Janice Betty Sean Rosabelle Cy Thomas Brenda Kenard Juanita William ZelmaWendy Gerene Sharon Glennia Helen Donald Zach Stella Phyllis Doris Mattie Cecilia Holly Lou Gail Evalena Chad Margaret Steven Patrice Mark Crystal Jon Brian Jenny Andrea Adam Laura Mark Ben Cathy Bruce Charles Jodee Lindsay Michael Mervin Jessica Lisa Betsy David Ruby Jacqueline Tammy Natasha Jason Shanta Sara Jack Terry Danny Dawn Laurie Christy Liz Tanya Charity Gail Brenda Kayla Sherlanda Donna Gerry Daniel Loran Brandon Matthew William Stephen Noah James Michael Layne Casey James Ryan Frank Diane Misty Gregory Ed Jeff Michael Joe Rosalind Andre Heidi Ashley Musfequs Danielle Robin Alejandro Michael Linda Kim Kesha Guido Ed Dave Jerry Brandon Patricia Shawn Nicholas Crystal Christopher Aaron Emanuel Michelle Sara Kyle Elizabeth Robert Rachel Angela Jeffrey Rex Susie Peter Ryan Gloria Linda Camille Tony Robert Audra Gregg Joel Robert Sharon Joseph Ashleigh Craig Kelly Lori Stewart Katrina Julie Linda Princess Donna Sharon Tiffany Charlotte Kris Virginia Ann Mary Jessica Daniel Brenda Leann Barbara Michael Ruth John Joseph Edward Erin Kari Carlene Sara Robert Philip Lonnie Steven Bonnie Ed Brian Janet James William Joseph Beka Susan Phyllis Jennifer Michelle Linda Marla Ruby Dan Rochelle Donna Mike Jamie Karen Anthony Dominique Colene Thomas Barbara Mary Eric James Scott Cathy Dawn Michella Melanie Wealthie Jason Betty Jody Brenda Dylan Phil Catherine Stuart Kelly Carl Marjie Mary Jill Charlie Tina Steve Dianna Jennifer Brenda Kenny Daniel William Joseph Dan Randy Shirley Jason Jeffrey Trevor Christy Patricia Criado Emily Edward Jeremy Brandi Grace Diana Jeannette Angela Jonathan Tonja Melissa Jeana Dawn Al Zandra Madelyn Tina Christina Matthew Thomas Christi Casey Frank Vera Barbara Terry Karen Bobby Diane Joshua Holly Maya Sandy George William Kevin Melissa Josh Necole Daniel Thomas Danette Leonard Leah James Karinn Lindsey Rachel Karen Amanda Tiffany Mickey Recina Mark Andrea James Tom Dee Stella Steve Lekeisha Jose Timothy Garrett Bonnie Richard Robert Lewis William Tiffany Ruth Crystal Kyle Sid Steve Lora Amanda Paula Scott Tammy Delores Jamie Robert Lonnie Lynn Danny Iron Linda Onia Beverly Patricia Matthew Greg James Robert Debbie Jon Madena Dianne Nicole Carolyn Joseph Michael Bill David Suzzanne Danna Christina William Franco Melanie Tony Trey Angela Todd Diane David Ivory Phil Raymond Jeff Margo Mary Ralph Janelle Janet Chris Paul Fay Josh Sara Kerri Jennifer Jeannie Frank Larry Brandy Paula Cynthia Paul Eugene Dawn Lucan Connie Ruby Tamara Crystal Billie Stacy Deborah Matthew Mark Shawna DeAnna Ebony Shirley Vicki Dennis Leslie William Sylvia Sheryl Andrew Alan Adam Natalie Danielle Shaffiena David Larry Teresa Bonnie James Michael James Shannon Jim Latoya Paula Charles Jackie Keysha Karyn Ansley Gary Nikki Edward Scott Joseph Arain Norman Loran Laura Angela Lebardo Dionne Lesley Rebecca James Graylin Denise Colby Doug Albert Phillip Christi Angeline Jack Penny Nicole Cheryl Marilyn Amy Charles Duane Carol Amber Michelle Lacy Sherry Valerie Michael Gary Jill Lindsay Connie Doug Donald Mark Angela Eduardo Ryan Tiffany Edward Margaret Gary Carlos Susan William Mark Minerva Autumn Chica Ginny Laura Richard Joseph Vernon Christine Frederick Bessie Wendy William Jacqueline Denise Richard Nicole Crystal Paul Janet Zeffelin Jo Anne Sharon Wesley Frederick Amanda Mark Jeffrey Karen Suzanne Roseanna Donald Brenda Jeffrey Nicole Carrie Janet Valerie Meredith Heather Stephanie David Shona Mark Jennifer William Joel Shelby Norman Peggy Alice Ginger Morgan Jay David Josh Jeri Melissa Chase Aaron Tamaria Michael Douglas Nolan Brian Stephen Valerie Della Melanie Jodee Brenda Tara Edie Stacy Tiere Melissa Janina Debbie Andrew Shanda Charlene Eugene Jamie Cami Gena Darren Elisa Heather Michael Fred Julie Michael Jermaine Reginald James Robert Lori Michelle Pamela Brett James Priscilla Charles Samantha Greg Valerie William Mona Alana Darla Sue Linda Darrin Chris Melba Cessna Chris Kelly Carl Noelle Brian Mike Donna Gary Kelli Michelle Robin Tom Mike Dieter Amy Louise Janice Musfegus Lisa Markisa Courtney Estella Emma Carrie Danielle Jackie Cory Chris Kevin Richard Delinda James Betty Teresa Doug Amber Jenell Anthony Brenda Terresia Raymond Thomas Robert Peter Tamara Diantha Ruben Betty Michael Don Joy Kurt Pamela Christy Sarah Tiffany Glen Robin Samuel Ricki Carl William Loran Jamie Marcia Josh Michael Loretta Alan Daniel Barbara Tamika Scott Cindy John Grace Lisa Christi Alisha Rachel Jamie Timothy Barbie John William Heather Franco Marisa Ronald Dana Donna Brian Lori Matthew 2004 Annual Report
Transcript of 2004 Annual Report - Cracker Barrel Old Country Store, Inc.

Warren Megan Damon Darlene John Negel Louise Nathan Richard Randy Travis Christopher James Cynthia Jeremy Charlene
Abigail Shamika Nicole Jeff Kristin Theresa Brittny Bonnie Shannon Brady Gigi Teresa Greg Jennifer James Amy Tracey Melissa
Sherry Warren Janiece Julie Amanullah Tommy Alison Keta Latoya Anne Marie Brandon Nicki Saneki Donald Jenelle Michael
Kelly Greg Mark Sheila David Paul Rhonda Pauline Kristen Robert Nicole Evelyn Stacy Frances Tabitha Susan Teresa Victor
Thomas Jason Valerie James Gregory Kristina Karen Micky Virginia Karen Terrence Greg Deborah Charles Chris Kimberlee
Misty Timothy Steven Eileen Garfield Carl Quiozell Mel Anthony Richard Princess Beverly Rebecca Nelson Tara Rip William
Sanford Joseph Nicole Jean Nicholas Brent Steven Garret Claire Nancy Jon Shane Jeffery Cathy Adam Tammie Lynette David
Lorraine Sharon Chris Penny Marianne Matthew Lisa Veronica Antoinette Melinda Genevieve Dennis Lonna Pamela Rex
Johnny Deborah Shawnee Donald Geri Pattie Jennifer Jeannie Donna Ernest Earl Kevin Anthony Don Mohammad Carol
Mona Robert Gary Jerry Kylene Sandra Kristin Tammy Edith Sid James Mickie Ella Wanda Bobbi Douglas Megan Shelia
Deborah Linda Janelle Nicole Zeb Gloria Jowaner Tresa Susan Sherry James Lindsey Harold Jacqueline Edward Patricia Ronald
Gary Joe Scott Virginia Teresa Melissa Karen Robert Earl Rozanne Jean Trisha Lisa Alixon Victor Brian Megan Christina Franco
Andy Christine Jermerne Nicolas Geoff Beth Steven Cindy Valerie Kevin Misty Michael Erin Amy Rachel Mary Marie Paul Richard
Shannon Tina Stacey Eunique Heather Stacy Beverly David Lance Bryan Keithan Bradley Jerri Jeffrey Gwendolyn James Angela
Tyronne Christine Jonathan Scott Melissa Daniel Dennis Al Candie Doug Jennifer Sherry Sarah Clay Jacqueline Tony Natasha
Tommy Robyn Jennifer Deirdre Nancy Barb Biran Linda Chris Amanda Susan Jessie Matt Michelle Barbara Serrina Janis Ronda
Wendy Danielle Nichole Josh Donna Kimberly Sharrae Aaron Edric Kendra Todd Lakeesha Faye Makia Lauren Sean Edna
Angela Debra Beth Noah Nancy Robert Susan Kayla Deanna Ciara Jenny Kalyn Dana Victoria
Denise Morgan Candis Edgar Janice Lindsay Yvetta Angel Brandon Omar Patrick Amanda
Jennifer Beka Lonnie Graclynn Melanie Buffie Tomeka Laura Will Rosa Marla Mary Ann Sandi
Daven Nathalia Gwyneth Kenny Deterria Brian Josh Jessica Julie Wendy Franco Tracy Jacqueline
Joe Christopher Crystal Terry Stanislav Melissa Bryan Willie Deborah Cortney Virginia Terry
Robin Robert Juliar Melissa Katrina Liz Leslie Jennifer Emanuel Glynda Gina Dustin Derek
Deborah Troy Craig Bernie Amanuallah Mary Angela Michelle Elizabeth Hollie Alex Yvonne Trudy Bobby Harold Dorothea
Cheri Steven Joe Darlette Holly Margaret Julian Jamie Grace Sarah Philip Todd Tiffany Misty Adela Amber Teresa Rachel
Eduardo Melody Robert Melody Jean Ashley George Nicholas Susan Anne Trevor Shannon Steve Carissa Leah Candice Rena
Opal Karolyn Jan Christina Elizabeth Constance Cesar Bruce Yvonne Veronica Daniel Constance Bruce Patricia Nichole
Matthew Diane James Yelena Olivia Nicole James Bill Gina Marie Esther Angel Nicholas Danyelle Erika Joan Jessica Connie
William Darren Samantha Melissa Jenne Joseph April Timothy Walter Thomas Theresa Tanya Jermaine Norma Michael Melissa
Lynn Carlos Robin Melissa Elizabeth Bonnie Jeana Anne Patricia Kristie Jannifer Arain Jessica Tonya Patsy Laura Kelley Jenell
Dolores Omar Nicole Joyce Cheryl Travis Jo Anda Nicolette Jeremy Jeff Valerie Melanie Joshua Craig Bernardo Vicente Patricia
Nathaniel Clay Heather Bernadette Mickey Thomas Darlene Nicolas Cheryl John Norma Jim Joy Roger Pedro Misty Joe
Chequita Rebecca Leeann Laura Benjamin Kerrie Kelli Jeffery Daymon Chris Dominique Jarod Zaria Charles Jason Joshua
Gordon Bessie Jackie Tracy Rodrick Matthew Danielle Kelly Olga Valerie Fuzell Monique Marilyn Jerry Carlos Cedric Brittany
Victor Susan Raquel Melba Lisa Laura Sarah Amber Kimberly Melinda Amanda Shellie Lindsay Frankie Cynthia Carlo Perry
Loretta Merissa Keisha Cindy Daniel Vera Vennessa Tony Jeff James Richard Joy Jillian Chica Tina Sarah Nicholas Kerry Kurt
Anita Troy Terry Robert Nancy Julia Jessica Frank Earl Anaiat Diantha Lori Chelsey Mildred John Craig Rhonda Scott Richard
Leslie Barbara Julie Eric Diane Dane Anita Catherine Meredith Roderick Denise Carol Tracie Kay Tony Tiffany Heather Eric
Stacie Marcus Kathleen John Nathan Rachel Phyllis Michelle Lauren Kellie Joni Amber Amanda Tabatha Kristina Joelle Jeff
Annie Christy Angela Lindsey Lauren Latasha Kristen Shannon Britney Stephanie Omar Joshua Noelle Sully Stephanie
Shannon Ricardo Matt Alisha Lindsey Eileen Kathryn Candee Byron Morgan Whitney Todd Tammy Kyla Joshua Christopher
Tiffani Leslie Dawn Charity Aurora Ralph Mary Ann Heather Robin Bonnie Karen Francesca Esau Patricia Sharon Lekeisha
Cami Eunique Donna Tammie Deanna Wavelene Randy Stephen Patrick Okie Margie Natlie Tony Danielle Vanessa Michelle
Kara Judy Jennifer Giselle Charlotte Stephen Shari Lindsey Linda Brandy Kacey Janson Chyla Shawna Rachel Janson Christina
Sherry Jessica Jason Steven Carol Lane Glen Adam Kathi Annie Barbara Greg Lynette Garret Gordon Sherry Winnie Rob
Nathalia Darrin Layne Theresa Betty Chrisandra Renitra Scarlett Mark Max Josephine Vicki Amanda Shellie Lisa Amy Nicole
Jennifer Lesley Dorothy Donald Denise Carol Gary Annie Veronica Angela Brady Stephanie Roxanna Rhonda Nick Wendy
Danny Don Leon Becky Mike Cheryl Linda Peggy Jeff Diane Suzanne Eric Georgetta Julie Sheree Gilbert Dewitt Sarah
Harold Lila Jimmie Judy Eric Charles Zeb Gerald Lindsea Evan Kathy Derrell Margareta Susan Juanita Nicki John David
Rochell Ronald Andy Rita Wanda Kathy Betty William Teresa Joyce Tony Martha Charlene Paul Brenda Diane George Ronnie
Donna Elizabeth Vernita Pearl Thomas Donna Sanford Michele Betty Sherry Heather Pamela Mark Terri Sarah Charles Bradley
Jerry Kevin Larry Janice Charles Roy James Mark Sara Jacquelyn Jim Mark Anna Terry Thomas Cheryl Aaron Shirley Mary
Kenneth Malinda Troy Bobby William Doris Linda Barb Charlene Patricia Edgar Tyronne Mark Marilyn Priscilla Al Carolyn
Matt Robert Mickey Janice Betty Sean Rosabelle Cy Thomas Brenda Kenard Juanita William ZelmaWendy Gerene Sharon
Glennia Helen Donald Zach Stella Phyllis Doris Mattie Cecilia Holly Lou Gail Evalena Chad Margaret Steven Patrice Mark Crystal
Jon Brian Jenny Andrea Adam Laura Mark Ben Cathy Bruce Charles Jodee Lindsay Michael Mervin Jessica Lisa Betsy David
Ruby Jacqueline Tammy Natasha Jason Shanta Sara Jack Terry Danny Dawn Laurie Christy Liz Tanya Charity Gail Brenda
Kayla Sherlanda Donna Gerry Daniel Loran Brandon Matthew William Stephen Noah James Michael Layne Casey James Ryan
Frank Diane Misty Gregory Ed Jeff Michael Joe Rosalind Andre Heidi Ashley Musfequs Danielle Robin Alejandro Michael
Linda Kim Kesha Guido Ed Dave Jerry Brandon Patricia Shawn Nicholas Crystal Christopher Aaron Emanuel Michelle Sara
Kyle Elizabeth Robert Rachel Angela Jeffrey Rex Susie Peter Ryan Gloria Linda Camille Tony Robert Audra Gregg Joel Robert
Sharon Joseph Ashleigh Craig Kelly Lori Stewart Katrina Julie Linda Princess Donna Sharon Tiffany Charlotte Kris Virginia Ann
Mary Jessica Daniel Brenda Leann Barbara Michael Ruth John Joseph Edward Erin Kari Carlene Sara Robert Philip Lonnie
Steven Bonnie Ed Brian Janet James William Joseph Beka Susan Phyllis Jennifer Michelle Linda Marla Ruby Dan Rochelle
Donna Mike Jamie Karen Anthony Dominique Colene Thomas Barbara Mary Eric James Scott
Cathy Dawn Michella Melanie Wealthie Jason Betty Jody Brenda Dylan Phil Catherine Stuart
Kelly Carl Marjie Mary Jill Charlie Tina Steve Dianna Jennifer Brenda Kenny Daniel William
Joseph Dan Randy Shirley Jason Jeffrey Trevor Christy Patricia Criado Emily Edward Jeremy
Brandi Grace Diana Jeannette Angela Jonathan Tonja Melissa Jeana Dawn Al Zandra Madelyn
Tina Christina Matthew Thomas Christi Casey Frank Vera Barbara Terry Karen Bobby Diane
Joshua Holly Maya Sandy George William Kevin Melissa Josh Necole Daniel Thomas Danette Leonard Leah James Karinn
Lindsey Rachel Karen Amanda Tiffany Mickey Recina Mark Andrea James Tom Dee Stella Steve Lekeisha Jose Timothy Garrett
Bonnie Richard Robert Lewis William Tiffany Ruth Crystal Kyle Sid Steve Lora Amanda Paula Scott Tammy Delores Jamie
Robert Lonnie Lynn Danny Iron Linda Onia Beverly Patricia Matthew Greg James Robert Debbie Jon Madena Dianne Nicole
Carolyn Joseph Michael Bill David Suzzanne Danna Christina William Franco Melanie Tony Trey Angela Todd Diane David
Ivory Phil Raymond Jeff Margo Mary Ralph Janelle Janet Chris Paul Fay Josh Sara Kerri Jennifer Jeannie Frank Larry Brandy
Paula Cynthia Paul Eugene Dawn Lucan Connie Ruby Tamara Crystal Billie Stacy Deborah Matthew Mark Shawna DeAnna
Ebony Shirley Vicki Dennis Leslie William Sylvia Sheryl Andrew Alan Adam Natalie Danielle Shaffiena David Larry Teresa
Bonnie James Michael James Shannon Jim Latoya Paula Charles Jackie Keysha Karyn Ansley Gary Nikki Edward Scott Joseph
Arain Norman Loran Laura Angela Lebardo Dionne Lesley Rebecca James Graylin Denise Colby Doug Albert Phillip Christi
Angeline Jack Penny Nicole Cheryl Marilyn Amy Charles Duane Carol Amber Michelle Lacy Sherry Valerie Michael Gary
Jill Lindsay Connie Doug Donald Mark Angela Eduardo Ryan Tiffany Edward Margaret Gary Carlos Susan William Mark
Minerva Autumn Chica Ginny Laura Richard Joseph Vernon Christine Frederick Bessie Wendy William Jacqueline Denise
Richard Nicole Crystal Paul Janet Zeffelin Jo Anne Sharon Wesley Frederick Amanda Mark Jeffrey Karen Suzanne Roseanna
Donald Brenda Jeffrey Nicole Carrie Janet Valerie Meredith Heather Stephanie David Shona Mark Jennifer William Joel Shelby
Norman Peggy Alice Ginger Morgan Jay David Josh Jeri Melissa Chase Aaron Tamaria Michael Douglas Nolan Brian Stephen
Valerie Della Melanie Jodee Brenda Tara Edie Stacy Tiere Melissa Janina Debbie Andrew Shanda Charlene Eugene Jamie Cami
Gena Darren Elisa Heather Michael Fred Julie Michael Jermaine Reginald James Robert Lori Michelle Pamela Brett James
Priscilla Charles Samantha Greg Valerie William Mona Alana Darla Sue Linda Darrin Chris Melba Cessna Chris Kelly Carl
Noelle Brian Mike Donna Gary Kelli Michelle Robin Tom Mike Dieter Amy Louise Janice Musfegus Lisa Markisa Courtney
Estella Emma Carrie Danielle Jackie Cory Chris Kevin Richard Delinda James Betty Teresa Doug Amber Jenell Anthony Brenda
Terresia Raymond Thomas Robert Peter Tamara Diantha Ruben Betty Michael Don Joy Kurt Pamela Christy Sarah Tiffany Glen
Robin Samuel Ricki Carl William Loran Jamie Marcia Josh Michael Loretta Alan Daniel Barbara Tamika Scott Cindy John Grace
Lisa Christi Alisha Rachel Jamie Timothy Barbie John William Heather Franco Marisa Ronald Dana Donna Brian Lori Matthew
CBR
LG
roup
, Inc.
2004 Annual Report
PO Box 787, Lebanon, TN 37088-0787
20
04
An
nu
al R
epo
rt

The names you see on the cover of this year’s Annual Report forCBRL Group, Inc. are just a few of our many employees – somewho have been a part of our family for over 20 years, others whowere specifically mentioned or thanked by a guest in 2004, andsome who have simply done a wonderful job of making folks feelwelcome during the past year.

One of the best parts of traveling is all the greatstories you get to hear. Stories that make you laugh.
Others that warm your heart. And some that make you remember folks really
aren’t all that different – we just happen to live in different places.
At CBRL Group, Inc., our own story is really a pretty simple one. In 1969,
we built a place called Cracker Barrel Old Country Store® that had good food and good
products at a fair price offered by friendly people – the kind who treated you the way
we would want to be treated if we were away from home, traveling America’s highways.
Eventually, these became the values upon which we would build our entire company.
And build we have. Today CBRL Group, Inc. has over 69,000 valued employees
around the country working hard every day at our two restaurant concepts.
They’re at Cracker Barrel Old Country Store locations where we welcome guests to a
comfortable, down-home restaurant combined with an authentic country store.
And Logan’s Roadhouse® restaurants, each a real American roadhouse, where the
faces are smiling, the food keeps coming, and the peanut buckets are always full.
The interesting thing is, no matter which one of our more than 600 Cracker Barrel
and Logan’s locations you visit, you’ll meet people who continue to exemplify
the values and traditions contained in that very first story we set out to tell back in 1969.
And these long-standing traditions have helped us to do some great things.
Like achieve solid growth in net income and diluted net income
per share during fiscal 2004, a year of extraordinary product cost pressure for
our industry. We generated strong cash flow and increased our dividend.
We were also able to achieve positive comparable store sales across our business
and achieve some important consumer satisfaction recognition.
So we hope you’ll sit back, relax, and allow us to share some new versions of our old
story with you, as demonstrated by just a few of our many dedicated employees. We think
you’ll see why we’re looking forward to telling even more of them in the years ahead.
1

Some New, Old
WheelsL E O N M c C L A I N
C R A C K E R B A R R E L O L D C O U N T RY S TO R E N O . 4 4 1
WA S H I N G TO N , P E N N S Y LVA N I A
Every day, Leon McClain rides his bike four miles to work. Or,
maybe we should say, one of his bikes. You see, Leon’s what you might call a bicycle
aficionado, and he has over 20 of them.
So it’s no surprise that, on the very first day that he came to work at Cracker Barrel,
one of the numerous artifacts that decorate our country store caught his eye – an antique
red-speckled Huffy® Custom Liner that was hanging from the rafters.
For the next two years, Leon rode his bicycle to work every day. And he was never late,
and never missed a day, regardless of whether it was raining, snowing or broiling hot.
Good thing, too, because Leon is one of those people who everyone knows and enjoys
seeing each day – you know, the kind of person who has a way of making work seem
a little bit less like “work.”
On Leon’s 56th birthday, he pedaled over to Cracker Barrel, just like always. And
there he saw his favorite Huffy Custom Liner, just like always. But on this particular
day, it was down from the rafters and newly polished . . . just for Leon. His fellow
employees knew it was the best gift they could give, especially to someone who helped
make being at Cracker Barrel such an enjoyable ride.
“Huffy” is a registered trademark of the Huffy Corporation.

3
Unless specifically noted otherwise, references in this annual report to“CBRL” or “The Company” refer to CBRL Group, Inc. and its subsidiaries;to “Cracker Barrel” refer to Cracker Barrel Old Country Store, Inc. or itsCracker Barrel Old Country Store® restaurant and gift shop concept; andto “Logan’s” or “Logan’s Roadhouse,” refer to Logan’s Roadhouse, Inc.or its Logan’s Roadhouse® restaurant concept.
Cracker Barrel Old Country Store®
Logan’s Roadhouse® Company Operated
Logan’s Roadhouse® Franchised
As of July 30, 2004
517
1927
1
2
3 4
39 6
5
2
1
1 2
3
10
5
22
1017
1025 331
526
1644
1122
550
71818
1027
10 133
4
18
8 1
4
62
5
9
115
411
1
4
1

4
As we complete our 35th year of operation, we can
look back and see years in which we found uncertain
operating environments and difficult challenges.
Fiscal 2004 was such a year. The year began with a big
challenge: grow diluted net income per share (EPS)
on top of the 28% increase achieved in fiscal 2003,
which itself was on top of a prior year in which we
also substantially exceeded our long-term growth
objective of 15%. Plus, we set objectives to strengthen
the Company and generate more cash from operations
than we needed to fund our growth and dividends.
While we began 2004 well ahead of our plan, we
ran into some extraordinary external conditions that
added unforeseen challenges for many restaurant
operators, including us. Most notable were soaring
commodity costs, which pressured operating margins,
and the apparent impact of high gasoline prices that
squeezed consumers’ discretionary income and
dampened guest traffic. As a result of this confluence
of external events, the second half of the year had
much lower financial performance than the very strong
first half, but we still achieved a solid increase in
EPS for the year, and we achieved a number of our
other objectives. We believe that we made it
through the unexpectedly tough conditions in fiscal
2004 reasonably well, and we expect in fiscal 2005
to get back on track for long-term 15% EPS growth.
We are pleased with our accomplishments, both
financially and operationally, in fiscal 2004 in spite
of all the unforeseen changes in conditions:• EPS grew 8.3% from $2.06 in fiscal 2003 to $2.23
in fiscal 2004. And, the 2004 results included a
fourth quarter charge of $0.06 per share for the
settlement of long outstanding litigation. Apart
from that charge, EPS grew 11.2%. The litigation
settlement is discussed below.• Operating income margin was down slightly to 7.7%
of total revenue from 7.8% in fiscal 2003.
Excluding the settlement charge, operating margin
would have improved to 7.9%.• Cracker Barrel Old Country Store (“Cracker Barrel”)
passed the $2 billion mark in revenues, and
Logan’s Roadhouse (“Logan’s”) passed the $300
million mark, resulting in 8.3% consolidated total
revenue growth.• Cracker Barrel recorded a 2.0% increase in
comparable store restaurant sales for the year, its
fifth consecutive full year of increases, and a
5.3% increase in comparable store retail sales.
Overall retail sales as a percent of total Cracker
Barrel sales improved from 23.1% in fiscal 2003
to 23.6% in fiscal 2004.• Logan’s comparable restaurant sales improved 4.8%.• We opened 24 new Cracker Barrel stores, reaching
the 500 mark with a May opening in Missouri, and
ending the year with 504 stores in 41 states.
We also opened 11 company-operated and 4 fran-
chised Logan’s restaurants, bringing our total
in 17 states to 107 company-operated and 20
franchised locations.• Net cash provided by operating activities of
$200 million exceeded the $145 million used for
purchase of property and equipment (capital
expenditures), the fifth consecutive year in which
cash generated by operations exceeded capital
expenditures and the fourth consecutive year that
the surplus was more than $50 million.• We returned cash to our shareholders through
$69 million in share repurchases and a new dividend
policy that increased from the previous $0.02 per
share annual dividend to $0.11 per share quarterly.
Recently we increased the dividend again, to
$0.12 per share.
So, in spite of extraordinary external challenges,
we believe we fared reasonably well. And we expect
fiscal 2005 to be another improved year with a
goal of $2.6 billion in revenues and EPS percentage
growth in the mid-teens on a comparable basis.
Before discussing some of our other accomplish-
ments and our outlook, I think it’s useful to
describe some of those extraordinary external factors
in more detail.
Generally, we believe that we historically have
enjoyed a relatively advantageous position in our indus-
try with respect to food commodity cost increases.
To Our Shareholders: (Please see discussion of forward-looking statements on page 34 of this report)
This letter has been revised to reflect the restatement further discussed in Note 2 to the accompanying consolidated financial statements.

5
Cracker Barrel has a highly diversified product offering,
with products among all major protein categories,
and achieves further diversification by serving our
breakfast menu all day long. Product diversification
also is benefited by Logan’s, with its significant
product mix of fresh beef, and by the retail component
of our business, which, while not substantially food-
related, does mitigate food cost inflationary effects
on overall cost of goods sold. Typically our experience,
and our expectation, has been that when market
pressures drive up one food category others will be
more benign and mitigate the pressures. We have
expected cost pressure in the beef market for some
time, primarily because demand has been outpacing
supply and the cattle herd has been diminishing,
including a reduction in heifers, the breeding stock,
as cattlemen seek to take advantage of strong prices.
It’s a cycle that, while not perfectly predictable, tends
to repeat every several years to some degree. But
this year was unusual for its many market dynamics.
Issues such as mad cow disease that closed US
borders to Canadian imports, and, after a single reported
incident in Washington state, closed our borders to
exports to the Far East, and the apparent increased
demand from high-protein, low-carbohydrate diets
greatly disrupted the supply and demand equation and
helped send beef prices skyrocketing. After its favor-
able prior contract expired at the end of calendar
2003, Logan’s, for example, saw beef prices increase
15% or more. And, further exacerbating a bad
situation, pressures mounted across the commodity
spectrum. This time, unlike more typical conditions,
it seemed like everything was under extraordinary
pressure. Pork products, especially bacon, sausage
and ribs, were under pressure from the demand of diet
trends and, for bacon, from the high usage in salads
and sandwiches in the quick service sector of the
restaurant industry. Poultry and eggs, variously, were
pressured by such factors as animal rights concerns
about breeding and laying conditions, and the effect of
avian flu on world poultry markets. Dairy was affected
by the herd size and by such factors as reduced use of
hormone supplements by farmers to augment produc-
tion. In short, pressures not just in one area, but across
multiple commodity categories. And, pricing power,
while present, was used judiciously by the restaurant
industry reflecting a cautious approach to other
economic conditions.
While the unsettling political rhetoric of an election
year, and such sometimes ominous news events
as the continued unrest in Iraq and the Abu Ghraib
prison scandal, were often bad, and the specter of
returning inflation was reported frequently by the
media, the big news was the price of gasoline. And
big news it was, making it nearly impossible to turn
on the TV or radio news, or to pick up a newspaper
or news magazine, without encountering predictions
of dire consequences as gasoline approached and
then passed the $2 a gallon mark for the first time
ever for much of the country. Never mind that,
adjusted for inflation, gasoline stayed well below the
record levels of the early 80s. Never mind that
today’s vehicles are more fuel efficient than ever, in
spite of the popularity of SUVs. Never mind that
the economy was picking up and that Americans are
more affluent than ever. The news was the price,
and the news was everywhere. Now, no doubt a rapid
rise in a basic expense did put pressure on dispos-
able income, and certainly consumers, especially
those on the margin, felt it and adapted by cutting
purchases elsewhere. But the psychological effects,
we believe, also played an important role that made
an unfavorable situation worse. Historically, we
have observed little if any correlation between our
sales and gasoline prices. The notable exception
was when Middle-East oil embargoes threatened not
just the price, but more importantly the availability
of gasoline, and people stayed home. But this appears
to have been different, with many restaurant
chains and some retailers reporting sudden softness
as gasoline prices rose. And, concern over consumer
sentiment seems to have caused most restaurant
operators to be moderate in their menu price increases.
Unlike grocery prices, which rise and fall with
market conditions, restaurant prices tend to increase
gradually over time more in line with general

6
inflationary trends than specific market conditions.
So, fiscal 2004 was a year of unusual and even
extraordinary events, but we generated some good
financial results for the full year even though
external pressures mounted through the year. As noted
earlier, Cracker Barrel also recorded a charge in the
fourth quarter to recognize a settlement of certain
litigation that had been in process since as far back
as 1999. We also settled a matter of alleged discrimi-
nation in public accommodation, which we deny,
with the U.S. Department of Justice. We are pleased
to have both of these matters resolved and look
forward to a future without the distractions and
expense of defense, and with the opportunity to make
our business even more appealing to our guests.
And our guests do like us! With 1,100 to 1,200
guests per day on average in each of our stores, and
retail sales of over $470 per square foot of retail
shop space (by comparison, successful malls do $300
or more), Cracker Barrel continues to be one of the
most unique, successful, and favored concepts in the
restaurant industry. Just recently, Cracker Barrel
was named “Best Family Dining Chain in America”
for the 14th consecutive year by Restaurants and
Institutions magazine’s annual “Choice in Chains”
consumer survey. And, also recently, J. D. Power
and Associates, in its inaugural study of customer
satisfaction in the restaurant industry, found
Cracker Barrel highest among family dining chains
in overall customer satisfaction in our core markets.
Cracker Barrel continues to win these, and other,
honors because of a commitment to the Cracker Barrel
mission statement of “Pleasing People”. That means
all people, guests and employees alike, and it means
all the time, through relentless repetition of execu-
tion to high standards of quality and service, with
reasonable and affordable prices.
In fiscal 2004, Cracker Barrel pursued its mission
with a number of initiatives and achievements. A
new, easier-to-read menu was introduced that featured
several new products, including a different daily
dinner feature for each day of the week to stimulate
frequency, and low-carb selections on both the
breakfast and lunch/dinner menus to begin to address
rising consumer interest in nutritional awareness.
A Spanish menu also was introduced with server
training to make a more welcoming and hospitable
experience for the growing number of Hispanic people
we would like to become regular Cracker Barrel
guests. Enhancements were begun to improve guest
relations with additional training and monitoring
of our operations, including an expanded guest feed-
back hotline department and preparation for an
interactive voice response (IVR) system for soliciting
guest feedback regularly in all our stores. Our goal
is to make the Cracker Barrel dining experience more
satisfying and interesting to build guest trial
and frequency.
The retail experience is an integral part of
the Cracker Barrel experience. Our retail customers
are almost exclusively our dining customers. We
aren’t a destination retailer, but we have the advantage
of drawing a lot of potential retail customers from
our restaurant guest traffic. Retail initiatives have
included a “Service Sells” training and operational
focus, and continued evolution of our merchandise
selection and merchandising strategies. We learned
from studying our retail shopper behavior that the
likelihood of a shopper becoming a buyer increases
significantly from helpful interaction with a sales-
person. Service Sells trains our retail staff how to
make that contact, and improved merchandising turns
more guests into shoppers. In 2004, we introduced
CBRL Group, Inc. Total Revenue
$3,000
$2,500
$2,000
$1,500
$1,000
$500
$0
$ M
illi
ons
2000 2001 2002 2003 2004 2005Projected
™ Cracker Barrel Restaurant ™ Logan’s™ Cracker Barrel Retail ™ Carmine’s

7
the “American Music Legends” series of compact discs,
featuring well known artists, to complement our
“Heritage Music” collection, a proprietary series of
compact discs of various genres of American folk and
traditional music by artists specializing in these
varied and uniquely American styles. We also intro-
duced, late in the year, a ready-to-assemble (RTA)
version of our popular rocking chairs. Long a Cracker
Barrel icon, the rockers on the front porch not only
have been a popular way for guests to relax while
waiting for a table, but they are a favorite product
in our retail shop, with over $15 million in sales in
fiscal 2004. The RTA version, designed for shipping
convenience for our website sales, has recently been
introduced in the retail shops to make it more
convenient to ship home or squeeze into the car,
especially for the important traveling guest. Our goal
is to increase the frequency of having our restaurant
guests make a retail purchase and grow revenues.
For fiscal 2005, we expect retail will continue to
build on the successes we saw last year in the areas
of merchandising strategy, improved sell-through and
freshening of both seasonal and non-seasonal products
to realize the benefits from the rollout of Service
Sells. Retail is a very critical factor in our success; it
provides a major competitive advantage and a point
of differentiation. And to reflect the importance of
retail to us, we have added the position of general
merchandising manager to lead the merchandising
and planning teams. We are pleased to have added
an experienced retail executive who will be a member
of the executive team at Cracker Barrel, which will
give retail an important voice in the overall leadership
of the business.
We have two operational initiatives that we will
be testing in fiscal 2005 in Cracker Barrel. Both
are intended to enhance the guest experience while
improving sales and lowering costs. Both have the
potential to have a major positive impact on the
business. The first, which we began testing last year,
is the retail floor plan initiative designed to
improve traffic flow from the front door to the dining
room and from the dining room to the cash register,
and at the same time, improve the ease of shopping
and the presentation of the merchandise. We are
moving to a second round of testing right now, and
we expect to have a rollout plan in place by the
end of the fiscal year. The second initiative is the
application of industry best practices to the kitchen
and, potentially, to the front of the house. These are
designed to decrease wait and service times in
the dining room and at the same time, improve food
quality, and, as a byproduct, lower our labor costs.
We have been through the analysis and mock-up
phase and we’ll be field-testing this in fiscal 2005.
The goal is to develop a new kitchen design and
service processes for use in new stores and for cost-
effective retro-fitting of our existing store base.
The development strategy at Cracker Barrel con-
tinues to focus on building out our Interstate Highway
presence in core markets while building selectively on
Interstates in developmental markets. Off-Interstate
development will continue to be pursued on a very
selective basis in the near term. We have identified
the potential for Cracker Barrel to reach over 1,000
total stores, approximately double the current number.
This potential is based on a new annual process
that we have initiated, a detailed market-by-market
evaluation which does not yet include the West
Coast states of California, Oregon and Washington.
Logan’s saw some significant accomplishments
in fiscal 2004 also. At this time last year, Tom Vogel,
Logan’s new president, had just joined us. Tom’s
CBRL Group, Inc. Cracker Barrel RestaurantComparable* Store Sales
% C
hang
e vs
. Pr
ior
Year
7%
6%
5%
4%
3%
2%
1%
0%
+0.6% +4.6% +5.3% +0.5% +2.0%
2000 2001 2002 2003 2004Fiscal Year
*Comparable stores are those open for eighteen months or more, atthe beginning of the year, and represent a changing group of storeseach year.

8
background in restaurant operations, concept and
brand development and marketing were exactly what
Logan’s needed. During fiscal 2004, Tom focused on
building his leadership team, bringing in key exec-
utives to round out the functions needed to position
Logan’s for growth.
A new prototype is well along in design to be
used for future Logan’s development. The new proto-
type is expected to incorporate design features to
make the Logan’s experience more fun and inviting,
to strengthen a differentiated brand identity, and
to be more efficient, both operationally, with a much
improved kitchen layout, and from a real estate
perspective, having a narrower frontage to fit more
easily on typically available sites. The first opening
of a new prototype should occur in late fiscal 2005
or early fiscal 2006, and, after adapting the learning
from that initial opening, it should become the design
for all openings regularly sometime thereafter. By
the end of fiscal 2005 we expect Logan’s to be at an
annual unit expansion rate of 20%.
One of the additions to the Logan’s team is its
first full-time senior director of food and beverage.
This increased focus on product offerings is begin-
ning to have an impact with the introduction of a
new menu and Happy Hour initiative in May, and
establishment of an ongoing regimen of product
development, testing, evaluation, and training for
introduction. In preparation for an increasing focus
on advertising, Logan’s recently retained a new
advertising agency. By the end of fiscal 2005, Logan’s
is expected to be media efficient (i.e., to have
sufficient market penetration to advertise regularly
and cost effectively) in about half its locations.
As time goes on, we must be prepared for
change on many fronts. During fiscal 2005 we will
be in leadership transition at CBRL Group and at
Cracker Barrel. Our founder, and long-time chairman
of the Board, Dan Evins has decided not to run
for re-election this year, one year before the Board’s
mandatory age-70 retirement policy. Over the past
three years, Danny has gradually stepped away from
the day-to-day activities of the business, so this
was not totally unexpected. Recognizing Danny’s unique
role, the Board of Directors has named him chairman
emeritus, and as such Danny will continue as an advi-
sor to the Board from time to time providing his
unique insight into the Cracker Barrel culture. We all
owe Danny many thanks for the intuition he demon-
strated back in 1969 when he realized that people
would return to Cracker Barrel if they were welcomed
with courtesy and respect and could get good food
and quality retail products. Danny’s approach to busi-
ness led to the company’s mission statement of
“pleasing people,” and he frequently says that this
mission statement applies to all people – guests,
employees, suppliers, and shareholders. I am honored
and excited to have been selected to step into this
role as your new chairman, effective at the November
2004 annual shareholders meeting, and I can tell
you that this does not signal any change in direction.
We are on a clear strategic path and the “pleasing
people” values that Danny established will stand us in
good stead as we look to continued success in the
future. Another leadership transition happening in fiscal
2005 involves the president of Cracker Barrel. Don
Turner, who returned from a previous retirement in late
1999 to play a pivotal role in turning around a then-
struggling Cracker Barrel, has announced his intention to
retire again at the end of calendar 2004. Fortunately,
a priority for us has been to develop the management
teams in our operating companies to keep the
strategies and momentum going when inevitable
CBRL Group, Inc. Selected Cash Flow Components
$250
$200
$150
$100
$50
$0
$ M
illi
ons
2000 2001 2002 2003 2004Fiscal Year
™ Cash Provided by Operating Activities™ Cash Used for Purchase of Property & Equipment

transitions occur. A few years ago we established an
Executive Team (the ET) at Cracker Barrel to guide the
business both strategically and operationally. Don,
of course, has been a member of that team, as have I,
and I will continue as the CEO of both Cracker Barrel
and CBRL Group. The ET also has several other key
leaders, representing a cross-section of functions
and experience. The succession plan for replacing Don
involved both the ET and consideration of possible
outside sources of talent. We are extremely pleased to
have announced the successful completion of this
process by naming a member of the ET and 26-year
Cracker Barrel veteran, Cy Taylor, to become Don’s
successor. Cy started at Cracker Barrel as an associate
manager and has worked his way up through a
variety of increasing responsibilities and exposure to
new experiences. He is highly respected throughout
the Cracker Barrel organization for his integrity and
values, and for his ability to translate the corporate
culture and philosophy into business results. We all
thank Don Turner for his critical contribution to
Cracker Barrel, not just over these last five very success-
ful years, but over a long and fruitful career. And we
welcome Cy to his new role and are confident of the
many years of continued successful leadership that
he will bring. Finally, we will remember fiscal 2004 as
the year in which our long-time Board member,
Dr. Gordon Miller, passed away. Gordon was one of the
earliest investors in Cracker Barrel, joining the Board
in 1974, and we miss him and wish his family and many
friends our continued condolences.
CBRL Group, Inc., and our two key operating
subsidiaries, Cracker Barrel and Logan’s, are successful
for many reasons, but none more important than
our people. In this Annual Report, we’ve tried to tell
a few stories that you might not otherwise hear
about how our people strive daily to make things
better for our guests, for their fellow employees,
and for their communities. We are approaching 70,000
employees, almost 3,800 more than a year ago, who
are working hard every day to deliver the experiences
that make us successful. On our cover you will see
a selection of names of some of our most important
people at Cracker Barrel and Logan’s. These are real
people who have been employed with us for twenty
years or more, or who have been singled out by
our guests for special service or a great experience.
Whether they are “Pleasing People” at Cracker Barrel
or making “Life-Long Friends” at Logan’s, we are
grateful for the day-in and day-out contributions of
these and so many other of our dedicated employees.
As we reach our 35th anniversary at Cracker Barrel,
we believe that we are well positioned to continue
to grow the company profitably. We believe that we
have two quality concepts led by two strong leader-
ship teams. In both cases the leadership teams combine
in-depth experience of the business and talents
and experience of newcomers from the outside. We
have a commitment to strong and clear brand posi-
tioning, backed up with a consistently high standards
of execution. This is the foundation on which our
long-term success will be built.
We look forward to more successes in 2005 and
beyond, and we thank you for your continued interest
and participation as an owner of CBRL Group, Inc.
Sincerely,
Michael A. Woodhouse
President and Chief Executive Officer
9
CBRL Group, Inc. Diluted Net IncomePer Share (“EPS”)
$2.50
$2.00
$1.50
$1.00
$0.50
$0
$EP
S
2000 2001 2002 2003 2004Fiscal Year
ª EPSª EPS Excluding Charges*
*Excludes effects of charges in 2000, 2001 and 2004 (see notes to Selected Financial Data table)

H a l f R e s t a u r a n t . H a l f S t o r e . A l l C o u n t r y .®
10
C r a c k e r B a r r e l O l d C o u n t r y S t o r e
11
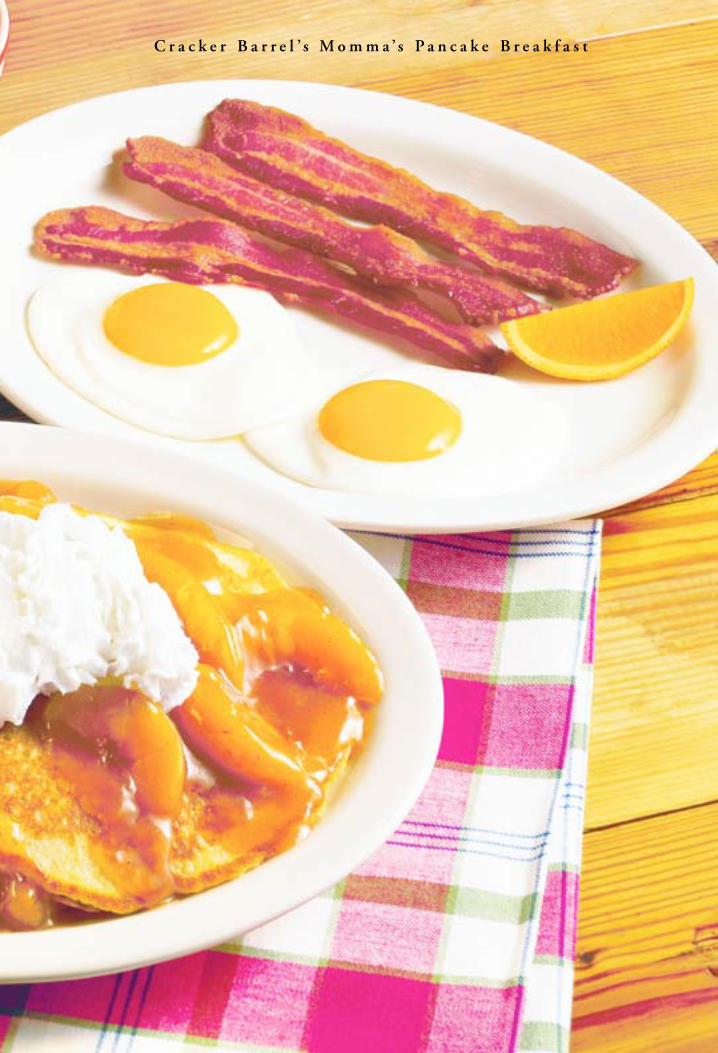
C r a c k e r B a r r e l ’ s M o m m a ’s P a n c a k e B r e a k f a s t

O f f e r i n g F o l k s A W a r m W e l c o m e S i n c e 1 9 6 9 .
If you had walked into the Cracker Barrel Old Country Store
restaurant back when we first opened in 1969, you would have found
something that was pretty unique for the American road.
Back then, the new Interstate Highway System was finally stretching
its way from coast to coast and border to border and there were
very few, if any, places where travelers could stop for a reliable and
comfortable break along the way. It was a time when many people
saw the new interstates as the end of the line for small towns and things
like country stores. But, to us, country stores were just what
travelers needed – a home away from home where you could find a
friendly face serving familiar food and hearty breakfasts all day
long, and maybe even pick up some authentic country wares that
reminded you of a time gone by.
Thirty-five years and more than 500 locations later, it seems that
our hunch was right. We like to think that’s because ever since
we opened that very first Cracker Barrel store alongside a stretch of
Highway 109 in Lebanon, Tennessee, we’ve been taking great
traditions and trying our best to make them current and keep them
relevant for our guests, year after year.
12

800 Meals,
To Go.B E C K Y G O R M A N Y
C R A C K E R B A R R E L O L D C O U N T RY S TO R E N O . 4 1 6
K I N G M A N , A R I Z O N A
One day, around noon, the phone rang in our Kingman,
Arizona store. The person calling was wondering if they could get 800 meals to go.
At the time, the nearby Hulalapia Mountains were being ravaged by wildfires and it seems
the American Red Cross was desperately trying to get all of the firefighters properly fed.
After what we’re sure was a moment of shock, the Associate Manager who answered
the phone said, “Absolutely,” and set to work.
Of course, it was too late to call in reinforcements. But the store’s Employee Training
Coordinator, Becky Gormany, knew the staff was ready. “Boy, did our staff rock… It
was awesome to see what can be done when you use teamwork.”
With just four cooks on hand, the store managed to turn out 16 cases of meatloaf,
8 cases of fried chicken, 400 pounds of mashed potatoes, and 3,200 biscuits and corn-
bread. All while still cooking regular orders for guests in the restaurant.
Later, the firefighters asked the Arizona Bureau of Land Management to work specif-
ically with Cracker Barrel, because Cracker Barrel employees really supported their efforts.
And we do. Just as much as we appreciate the efforts of four hardworking cooks, a
resourceful trainer, and one pretty special store, out in Kingman, Arizona.

C r a c k e r B a r r e l O l d C o u n t r y S t o r e
14

Tr a d i t i o n S e r v e d D a i l y .
And 2004 was no different. This year, we were proud to introduce
our guests to two brand new menus – one for breakfast, and one
for lunch and dinner – that we rolled out system wide after extensive
testing in approximately 75 of our locations. While these menus
were designed, of course, to help us increase sales, traffic and margins,
their new look was based on one of our most basic principles:
make life a little easier for our guests. That’s why our new menus are
less cluttered, feature illustrations of different menu selections,
and are easier to read overall, making it simpler for guests to find and
order their favorite Cracker Barrel meals.
One important menu change was the addition of our new “Daily
Dinner Feature” section where, every day of the week, a different
special made with quality ingredients is offered for an attractive price.
These seven dinners – which include popular selections like our
Turkey n’ Dressing, Friday Fish Fry, and hand-breaded Homestyle
Chicken – are true, traditional, down-home country favorites that
also have proven track records as successful promotional items in our
restaurant. Now, they are specially positioned to increase trial and
encourage repeat visits by our guests.
15

H a l f R e s t a u r a n t . H a l f S t o r e . A l l C o u n t r y .®
16C r a c k e r B a r r e l ’s T h u r s d a y D i n n e r F e a t u r e – Tu r k e y n ’ D r e s s i n g

C r a c k e r B a r r e l O l d C o u n t r y S t o r e
17

W e S t a r t F r o m S c r a t c h . E v e r y d a y .
Of course there’s one tradition we’d never change, and that’s
breakfast. Ever since we opened our doors, we’ve been serving hearty
country breakfasts all day, every day, from open ’til close. And from
the beginning we’ve insisted on using nothing but the highest-quality
ingredients we could find. Like fresh Grade A eggs, real butter and
100% pure maple syrup. But even the best traditions can use a little
improvement now and then. So, recently, we decided to strengthen
the restaurant-to-retail connection of the maple syrup we serve in our
restaurant by redesigning the label and bottle to make it a true
Cracker Barrel “private label” product that soon will be available to
purchase in our retail store.
We realized long ago that our unique combination of restaurant
and retail offerings makes Cracker Barrel Old Country Store
arguably one of the most differentiated concepts in the industry.
Over the course of this past year, we were particularly pleased
with the performance of our retail business, which benefited not only
from improved merchandise selection and availability, but also
from our continued focus on retail operations. In fact, year-over-year
sales in our retail stores were up almost 10% for fiscal 2004.
18

Always Happy To
Lend A Flag.M I K E K I L L E E N
C R A C K E R B A R R E L O L D C O U N T RY S TO R E N O . 1 9 2
P O O L E R , G E O R G I A
Being away from home is never easy. Sometimes, though, having
a little piece of home with you can make it a whole lot better.
That’s why, before they shipped out, the National Guard’s 165th Airlift Wing was
looking for an American flag to carry with them into the Persian Gulf. They decided
to stop by the Cracker Barrel store in Pooler, Georgia before heading out to find one.
During breakfast, the men noticed that the store had an American flag displayed in a flag
stand. With a little bit of encouragement, the Lieutenant Colonel approached Associate
Manager Mike Killeen and asked if they could borrow the flag.
Without hesitation Mike picked up the flag, presented it to the men, and thanked
them for their willingness to serve our country. Lending them the flag was the least he
could do – aside from, of course, picking up their check.
The next day, as the crew shipped out, one of the pilots popped out of the hatch of their
C-130 to wave their new flag before take off.
About a year later, the entire 165th Airlift Wing was safely back at home. Along with one
well-worn, well-traveled, and well-appreciated American flag.

20
C r a c k e r B a r r e l O l d C o u n t r y S t o r e

H a l f R e s t a u r a n t . H a l f S t o r e . A l l C o u n t r y .®
This year, we re-evaluated many retail items – even well-established
ones like Cracker Barrel Rockers. Early on, we realized how much
folks enjoyed relaxing in the rockers for sale on our front porch. We
also realized how hard it was to fit one in a car. So, this summer,
we began offering select styles of Cracker Barrel Rockers boxed flat
and ready to assemble, along with our fully assembled rockers.
We hoped this might make it a bit easier for folks to be as comfortable
in Cracker Barrel Rockers on their front porch as they are on ours.
All told, by the end of fiscal 2004, we’d sold over 150,000 rockers.
We also continued our target retail item program, in which we select
items to actively promote in our retail store. One of our best efforts
came around Valentine’s Day when we highlighted HERSHEY’®S Candy
Bars, nostalgically packaged just for us. Not only is this a wonderful
product from a company with its own strong traditions, the candy
bars were displayed near our cashiers – an area of the store that
benefits from so-called “impulse purchases,” not to mention some
smiling faces behind the counter. By the promotion’s end, sales
neared $700,000, which was over 40% of the approximately $1.5 million
in sales for this new product in fiscal 2004.
21

C o m f o r t F o o d . P l e a s i n g P e o p l e .
Today, just like back in 1969, our Cracker Barrel locations are
“destinations of choice” for highway travelers. We think that distinction
could become even more important as America’s Baby Boomers
begin to enjoy their active retirements. This is just one reason we’ve
focused on improving the quality of our Country Coach Service for
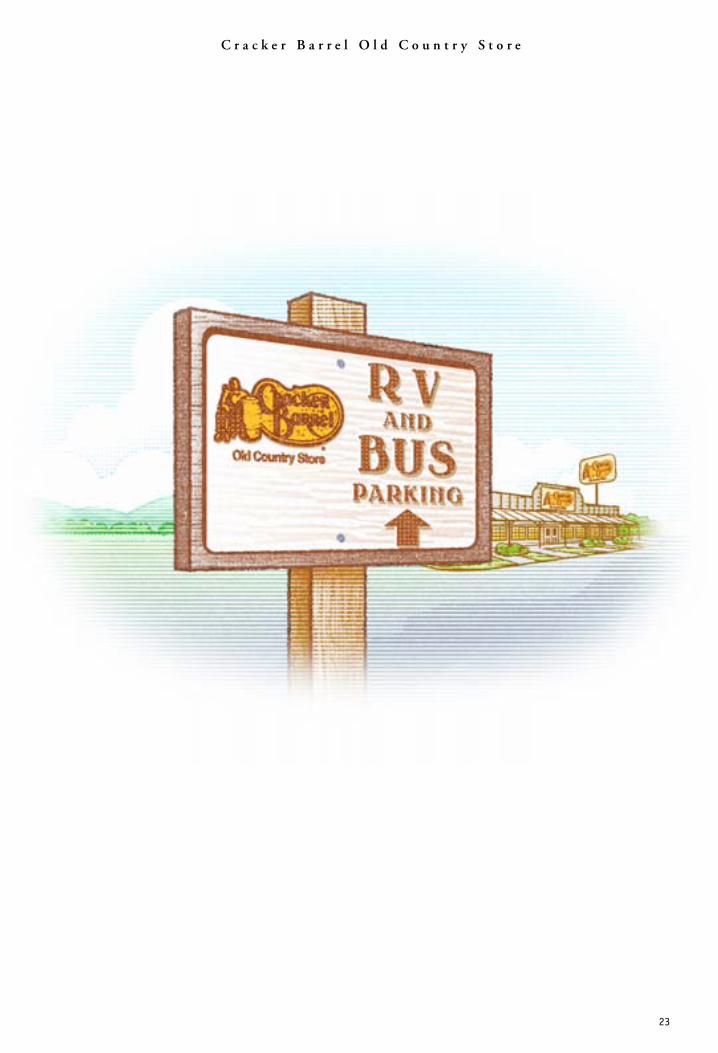
tour bus groups, as well as our RV (Recreational Vehicle) program.
In 2004 we received the Good Sam Welcome Mat Award for
Best Sit-Down Restaurant – the third year in a row members of this
national RV organization have recognized us with such an honor.
We’re also proud to announce that our long-established Personal
Achievement and Responsibility (PAR) Program went fully online
this year. The new eLEARNING*PAR program makes it easier for
our hourly employees to learn, improve their skills, and advance in
wages, benefits and position. Why is this so exciting? After all, our
well-trained and dedicated employees are a major reason consumer
surveys have named us “Best In Family Dining” in Restaurants &
Institutions magazine for 14 consecutive years. And, this year, we
were also named Best Overall in Family Dining in our core regions by
J.D. Power and Associates in an inaugural survey of guest satisfaction.
22
C r a c k e r B a r r e l O l d C o u n t r y S t o r e
23

G o o d C o u n t r y C o o k i n’. F o r 3 5 Y e a r s A n d C o u n t i n’.
24
But those were just some of many milestones that we are pleased to
look back on in 2004. During this past year, we celebrated our
35th Anniversary with the opening of our 500th location in O’Fallon,
Missouri. Impressive as that number may be, we believe we actually
have far more to look forward to, and have already established the goal
of opening our 1,000th Cracker Barrel location. While that may
sound like an aggressive plan, we’re confident we can get there through
hard work and our continued rigorous site selection process – the
kind of process that has allowed us to close a mere nine locations in
our entire history, far fewer than any other restaurant concept we
know of comparable size or years in business.
Most of all, we’ll get there with the help, enthusiasm and dedication
of approximately 60,000 valued employees – the people who help
Cracker Barrel to carry on the traditions and values that have taken
us so far over these past 35 years. And, of course, we can never
forget the more than half a million daily guests, neighbors and friends
whom we are privileged to welcome to our Cracker Barrel Old
Country Store locations for some good country cookin’ and plenty
of country hospitality.

On The Road Again
And Again.C H E RY L AY E R S , L I N D A J O N E S & P E G G Y L E M KO W I T Z
C R A C K E R B A R R E L O L D C O U N T RY S TO R E
3 0 0 L O C AT I O N S , A N D C O U N T I N G .
Over the years, we’ve opened quite a few Cracker Barrel Old Country Store
locations. And, as you might guess, it can be a pretty busy and exciting time. So, to
help make things a bit easier, we always like to have a Store Opening Supervisor on
hand. Though what they do is anything but easy.
For Cheryl Ayers, Linda Jones and Peggy Lemkowitz, this has meant traveling to over 100
stores apiece. And at every one, they’ve helped our new store managers and employee
trainers to hire over 200 employees, to teach these employees what the Cracker Barrel
family is all about, and to help get them ready for when the first guests arrive.
Cheryl, Linda and Peggy have all seen that deer-in-the-headlights stare come over our
new employees’ faces as they wonder if they’ll ever figure out what’s going on. But, just
a few short days after opening, they always see that special twinkle – that knowing look
that our new employees get when they realize everything really will be OK.
So what’s the secret to success? Linda says, “Your heart’s got to be in it. You have
to truly, truly be a team player. And you have to be family.” With more than 300
successful store openings to look back upon, we think it’s fair to say that Cheryl, Linda
and Peggy certainly have one very big, and very lucky, family.

26

27L o g a n ’ s 9 o z . S i r l o i n D i n n e r

H i t T h e R o a d . H e a d T o L o g a n ’s .T M
Ever since Logan’s Roadhouse opened its first restaurant in
Lexington, Kentucky in 1991, people have been drawn to the way we
combine an everyday steakhouse with a wonderfully rough-around-
the-edges roadhouse. Today, Logan’s has grown to over 130 locations
in 18 states. But, in fiscal 2004, we did some research and took a
fresh look at Logan’s and the market we’re in. What we confirmed is
that there should be a lot of room for us to grow. We were also
happy to hear something of which we’ve always been pretty certain:
that Logan’s is a strong concept, attracting a broad range of guests –
whether they’re wearing shirts and ties, jeans and boots, or shorts and
sandals – for lots of different dining occasions.
So we set out to achieve and maintain our operational excellence by
building a strong leadership team that combines some new faces
with some Logan’s veterans. Then we began work on sharpening our
brand appeal. That meant emphasizing our strengths – that Logan’s
is a kickin’ place with lots of toe-tappin’ energy, where we always
encourage people to be themselves. Whether they’re enjoying a bucket
of peanuts and tossing the shells on the floor, or settling in with
generous portions of downright craveable food at attractive prices.
28

L o g a n ’s R o a d h o u s e
29

L o g a n ’s R o a d h o u s e
You can taste it in our new offerings that combine appealing product
ideas with plenty of distinctive Logan’s flavor. There are San Antonio
Chicken Wraps, Carolina Batter-Fried Shrimp and a true Southern Fried
Catfish. Items like these were introduced as a part of our successful
Stand Alone Menu program which not only helped us to highlight Logan’s
outstanding food and to continue to build our responsible alcohol
and beverage program, but also to increase year-over-year revenues at
Logan’s by almost 17% in fiscal 2004. Of course, Logan’s has long
been known for value, and that’s what you’ll find in meals like our
9 oz. USDA Choice sirloin dinner that comes with a salad, side dish –
like a large baked yam or loaded potato – all the fresh-baked yeast
rolls and complimentary in-shell peanuts you can eat for just $9.99.
Most of all, we want our guests to feel that Logan’s is a place where
they can truly be regulars and life-long friends – a local place where
we recognize them when they walk through the door, and they recognize
us. So we’re working on a new prototype that will help guests
immediately feel at home. And we’ll continue to extend the kind of
warm, informal and familiar attitude people have come to expect
from our more than 9,000 dedicated Logan’s employees.
30

No Request Too Big,
Or Small.J E F F D I O N N E
L O G A N ’ S R O A D H O U S E
WA L K E R , M I C H I G A N
One winter day, a guest named Robin and her family were visiting
some relatives who decided to bring everybody to one of their favorite restaurants,
Logan’s Roadhouse, in Walker, Michigan.
The group was seated and given menus by their server, Eric DePeel. Before long,
another server was at the table talking with Robin’s daughter, Ashley. The server was
helping Ashley read the menu, seeing what she’d like to eat. Before he left, he made
Ashley a deal: if she finished her meal, he’d bring her some ice cream.
When Ashley was just about finished, the second server came back and, true to his
word, asked if she’d like chocolate on her ice cream. “Yes,” Ashley answered. “And
M&Ms®!” He said that he’d see what he could do.
Soon, Ashley’s face was lit up behind a bowl of ice cream topped with hot fudge, and
plenty of M&Ms. When Robin asked Eric where the second server was so that she
could thank him, Eric said the server was actually the General Manager, Jeff Dionne.
Turns out Jeff was getting warm after a quick trip across the snow-covered street to a
nearby store where he’d gone for a special package of M&Ms. Seems that night the
entire family got a chance to see how sweet Logan’s hospitality can be.
“M&Ms” is a registered trademark of Mars, Incorporated.

CBRL GROUP, INC.Selected Financial Data
The following selected financial data has been restated to reflect adjustments to the Original Filing that are furtherdiscussed in the “Explanatory Note” in the forepart of the Company’s Form 10-K/A filed with the Securities andExchange Commission on March 30, 2005 and in Note 2 to the accompanying consolidated financial statements.
(Dollars in thousands except share data)For each of the fiscal years ended
July 30, 2004(c)
August 1,2003
August 2, 2002
August 3, 2001 (d)(e)(f)
July 28, 2000(g)
(As Restated, see Note 2)
(As Restated, see Note 2)
(As Restated, see Note 2)
(As Restated) (As Restated)
Selected Income Statement Data:Total revenue $2,380,947 $2,198,182 $2,071,784 $1,967,998 $1,777,119Net income 111,885 105,108 90,444 48,550 58,273Net income per share:
Basic 2.29 2.13 1.67 0.86 1.01 Diluted 2.23 2.06 1.61 0.85 1.00
Dividends paid per share(a) $ 0.33 $ 0.02 $ 0.02 $ 0.02 $ 0.01
As Percent of Revenues:Cost of goods sold 33.0% 32.0% 32.7% 33.8% 34.6%Labor and related expenses 37.0 37.3 37.5 37.2 36.3Other store operating expenses 17.0 17.3 17.1 18.2 16.9Store operating income 13.0 13.4 12.7 10.8 12.2General and administrative
expenses 5.3 5.6 5.6 5.2 5.4Operating Income 7.7 7.8 7.1 4.9 6.6Income before income taxes 7.3 7.4 6.8 4.2 5.3Memo: Depreciation and
amortization 2.7 2.9 3.0 3.3 3.7
Selected Balance Sheet Data:Working capital (deficit) $ (39,195) $ (66,880) $ (51,252) $ (34,701) $ (23,262)Total assets 1,435,704 1,327,165 1,264,673 1,213,697 1,335,974Long-term debt 185,138 186,730 194,476 125,000 292,000Other Long-term obligations 36,225 30,454 25,992 19,697 11,053Shareholders' equity 873,336 789,362 778,881 843,340 826,833
Selected Cash Flow Data:Cash provided by operating activities $ 200,365 $ 240,586 $ 196,277 $ 147,859 $ 160,247Purchase of property and equipment 144,611 120,921 96,692 91,439 138,032Share repurchases 69,206 166,632 216,834 36,444 21,104
Selected Other Data:Common Shares outstanding at end
of year 48,769,368 47,872,542 50,272,459 55,026,846 56,668,349Stores Open at End of Year:
Cracker Barrel 504 480 457 437 426 Logan's company-operated 107 96 84 75 65 Logan's franchised 20 16 12 8 7 Carmine Giardini's - - - - 3

Comparable Store Sales(b):Average Unit Annual Sales:
Cracker Barrel restaurant $ 3,217 $ 3,157 $ 3,150 $ 3,082 $ 2,922Cracker Barrel retail 988 939 945 946 930Memo: Cracker Barrel number of
stores in comparable base 445 430 414 376 326Logan's company-operated $3,040 $2,915 $2,959 $3,041 $3,157Memo: Logan’s number of
restaurants in comparable base 83 71 59 40 25Period to period increase (decrease)
in comparable store sales:Cracker Barrel restaurant 2.0% 0.5 % 5.3% 4.6% 0.6 %Cracker Barrel retail 5.3 (0.4) 2.3 1.1 (2.3)Logan's company-operated 4.8 0.0 2.4 (1.1) 3.2
(a) On September 25, 2003, the Company’s Board of Directors (the “Board”) adopted a new policy to consider andpay dividends, if declared, on a quarterly basis, initially declared at $0.11 per share per quarter (an annualequivalent of $0.44 per share). During 2004, the Company paid such dividends of $0.11 per share during thesecond, third and fourth quarters of 2004. On July 29, 2004, the Board declared another dividend of $0.11 pershare payable on September 1, 2004 to shareholders of record on August 9, 2004. Additionally, on September23, 2004, the Board declared a dividend of $0.12 per share payable on November 1, 2004 to shareholders ofrecord on October 8, 2004. This dividend reflects a 9.1% increase from the previous quarterly dividend.
(b) Comparable store sales consist of sales of units open six full quarters at the beginning of the year; and aremeasured on calendar weeks. Average unit volumes are normalized to 52 weeks for fiscal 2001.
(c) Includes charges of $5,210 before taxes, as a result of settlement of certain lawsuits against the Company’sCracker Barrel Old Country Store, Inc. (“Cracker Barrel”) subsidiary (see Note 10 to the Company’sConsolidated Financial Statements).
(d) Includes charges of $33,063 before taxes, principally as a result of exiting the Carmine Giardini’s GourmetMarket™ business and closing four Cracker Barrel units and three Logan’s Roadhouse restaurants, as well asan accrual for a settlement proposal for a collective action under the Fair Labor Standards Act, which was latersettled as noted in (b) above.
(e) The Company’s fiscal year ended August 3, 2001 consisted of 53 weeks. As a result, comparisons to fiscal2002 and fiscal 2000 also reflect the impact of having one more week in fiscal 2001 than in fiscal 2002 andfiscal 2000.
(f) Includes a sale-leaseback transaction under which $138,300 of long-term debt was paid down.(g) Includes charges of $8,592 before taxes, principally as a result of management changes and the resulting
refocused operating priorities.
MARKET PRICE AND DIVIDEND INFORMATION
The following table indicates the high and low sales prices of the Company’s common stock, as reported by TheNasdaq Stock Market (National Market), and dividends paid.
Fiscal Year 2004 Fiscal Year 2003Prices Prices
High LowDividends
Paid High LowDividends
PaidFirst $39.02 $32.25 − $27.95 $19.54 −Second 42.07 36.61 $.11 32.85 22.35 $.02Third 41.24 37.09 .11 32.99 24.86 −Fourth 38.11 30.55 .11 39.95 31.31 −

CBRL GROUP, INC.Management’s Discussion and Analysis of Financial Condition and Results of Operations
The following discussion and analysis provides information which management believes is relevant to anassessment and understanding of the Company’s consolidated results of operations and financial condition. Thediscussion should be read in conjunction with the Consolidated Financial Statements and notes thereto. Allapplicable disclosures in the following discussion have been modified to reflect the restatement described in Note 2to the Consolidated Financial Statements. Except for specific historical information, the matters discussed in thisAnnual Report to Shareholders, as well as the Company’s Annual Report on Form 10-K/A filed with the Securitiesand Exchange Commission (“SEC”) on March 30, 2005 for the year ended July 30, 2004, contain forward-lookingstatements that involve risks, uncertainties and other factors which may cause actual results and performance ofthe Company to differ materially from those expressed or implied by these statements. All forward-lookinginformation is provided by the Company pursuant to the safe harbor established under the Private SecuritiesLitigation Reform Act of 1995 and should be evaluated in the context of these factors. Forward-looking statementsgenerally can be identified by the use of forward-looking terminology such as “assumptions,” “target,” “guidance,”“outlook,” “plans,” “projection,” “may,” “will,” “would,” “expect,” “intend,” “estimate,” “anticipate,” “believe,” “potential”or “continue” (or the negative or other derivatives of each of these terms) or similar terminology. Factors which couldmaterially affect actual results include, but are not limited to: changes in or implementation of additionalgovernmental or regulatory rules, regulations and interpretations affecting accounting (including but not limited to,accounting for convertible debt under Emerging Issues Task Force (“EITF”) Issue Abstract No. 04-08 of theFinancial Accounting Standards Board (“FASB”)), tax, wage and hour matters, health and safety, pensions,insurance or other undeterminable areas; the effects of uncertain consumer confidence or general or regionaleconomic weakness on sales and customer travel activity; the ability of the Company to identify, acquire and sellsuccessful new lines of retail merchandise; commodity, workers’ compensation, group health and utility pricechanges; consumer behavior based on concerns over nutritional or safety aspects of the Company’s products orrestaurant food in general; competitive marketing and operational initiatives; the effects of plans intended to improveoperational execution and performance; the actual results of pending or threatened litigation or governmentalinvestigations or charges and the costs and effects of negative publicity associated with these activities; practical orpsychological effects of terrorist acts or war and military or government responses; the effects of increasedcompetition at Company locations on sales and on labor recruiting, cost, and retention; the ability of and cost to theCompany to recruit, train, and retain qualified restaurant hourly and management employees; disruptions to theCompany's restaurant or retail supply chain; changes in foreign exchange rates affecting the Company’s future retailinventory purchases; the availability and cost of acceptable sites for development and the Company’s ability toidentify such sites; changes in generally accepted accounting principles in the United States of America (“GAAP”) orchanges in capital market conditions that could affect valuations of restaurant companies in general or theCompany’s goodwill in particular; increases in construction costs; changes in interest rates affecting the Company’sfinancing costs; and other factors described from time to time in the Company’s filings with the SEC, press releases,and other communications.
All dollar amounts reported or discussed in Management’s Discussion and Analysis of Financial Conditionand Results of Operations are shown in thousands. References in Management’s Discussion and Analysis ofFinancial Condition and Results of Operations to a year or quarter are to the Company’s fiscal year or quarterunless otherwise noted.
EXECUTIVE OVERVIEWCBRL Group, Inc. (the “Company,” “our” or “we”) is a publicly traded (Nasdaq: CBRL) holding company that,
through certain subsidiaries, is engaged in the operation and development of the Cracker Barrel Old Country Store®(“Cracker Barrel”) and Logan’s Roadhouse® (“Logan’s”) restaurant and retail concepts. The Company wasorganized under the laws of the state of Tennessee in August 1998 and maintains an Internet website athttp://www.cbrlgroup.com.
We are in the business of delivering excellent guest dining experiences, and we strive to do that in 41 statesat a collective total of 611 company-owned units and an additional 20 franchised units as of July 30, 2004. Whileeach restaurant concept offers its own unique atmosphere and an array of distinct menu items, both are equallycommitted to executing outstanding guest service while focusing on delivery of high quality products at affordableprices. During 2004 we served approximately 206 million meals in Cracker Barrel and approximately 27 millionmeals in Logan’s.
Restaurant IndustryOur businesses operate in the full-service segment of the restaurant industry in the United States. The
restaurant business is highly competitive with respect to quality, variety and price of the food products offered. Theindustry is often affected by changes in the taste and eating habits of the public, local and national economicconditions affecting spending habits, and population and traffic patterns. There are many segments within therestaurant industry, which overlap and often provide competition for widely diverse restaurant concepts.

Competition also exists in securing prime real estate locations for new restaurants, in hiring qualified employees, inadvertising, in the attractiveness of facilities and among competitors with similar menu offerings or convenience.
The restaurant industry has experienced sharp increases in the prices of many key commodities over thelast year, and commodity price pressures are expected to continue for various beef, pork, poultry, dairy and eggproducts. We have developed various initiatives to focus on purchasing of the same or higher quality products moreefficiently and at lower costs or to mitigate or manage cost pressures.
Additionally, seasonal aspects also affect the restaurant business. Historically, interstate tourist traffic andthe propensity to dine out during the summer months have been much higher, thereby attributing to higher profits inour fourth quarter. While retail sales in Cracker Barrel are almost exclusively to restaurant customers, such salesare strongest in the second quarter, which includes the Christmas holiday shopping season.
Key Performance IndicatorsManagement uses a number of key performance measures to evaluate the Company’s operational and
financial performance, including the following:Comparable store sales and traffic consist of sales and number of guests, respectively, of units open six full
quarters at the beginning of the year; and are measured on comparable calendar weeks. This measure highlightsperformance of existing stores as the impact of new stores openings are excluded.
Percentage of restaurant sales by day-part assists management in identifying the breakdown of salesprovided by meals served for breakfast, lunch or dinner. This measure not only provides a financial measure ofrevenues by type of meal, but also assists operational management in analyzing staffing levels needed throughoutthe day.
Average check per person is an indicator which management uses to analyze the dollars spent in our storesper guest. This measure aids management in identifying trends in guest preferences as well as the effectiveness ofmenu price increases and other menu changes.
Turnover rates are considered separately for both hourly turnover and managerial turnover. These indicatorshelp management to anticipate future training needs and costs, as well as helping management to recognize trends instaffing levels that would potentially affect operating performance.
Store Operating Margins are defined as total revenue less cost of goods sold, labor and other relatedexpenses and other store operating expenses. Management uses this indicator as a primary measure of operatingprofitability.
RESULTS OF OPERATIONSThe following table highlights operating results over the past three years:
Period to PeriodRelationship to Total Revenue Increase (Decrease)
2004 2003 20022004
vs 20032003
vs 2002
Total revenue: 100.0% 100.0% 100.0% 8% 6%Cost of goods sold 33.0 32.0 32.7 12 4Gross profit 67.0 68.0 67.3 7 7Labor and other related expenses 37.0 37.3 37.5 7 5Other store operating expenses 17.0 17.3 17.1 6 7Store operating income 13.0 13.4 12.7 5 12General and administrative 5.3 5.6 5.6 4 6Operating income 7.7 7.8 7.1 6 17Interest expense 0.4 0.4 0.3 (5) 31Interest income − − − − −Income before income taxes 7.3 7.4 6.8 7 16Provision for income taxes 2.6 2.6 2.4 8 16Net income 4.7 4.8 4.4 6 16
The Company recorded charges of $5,210 before taxes, during the quarter ended July 30, 2004, as a resultof a settlement in principle of certain previously reported lawsuits against its Cracker Barrel subsidiary (see Note 10to the Company’s Consolidated Financial Statements). The charge increased general and administrative expensein the Company’s Consolidated Statement of Income in both dollars and as a percent of total revenue for the yearended July 30, 2004 by $5,210 and 0.2%, respectively.
(As Restated) (As Restated) (As Restated) (As Restated) (As Restated)

Total RevenueThe following table highlights the components of total revenue by percentage relationships to total revenue
for the past three years:
2004 2003 2002Net Sales:
Cracker Barrel restaurant 66.1% 67.3% 67.8%Logan’s company-operated 13.4 12.4 11.6
Total restaurant 79.5 79.7 79.4Cracker Barrel retail 20.4 20.2 20.5
Total net sales 99.9 99.9 99.9Franchise fees and royalties 0.1 0.1 0.1
Total revenue 100.0% 100.0% 100.0%
The following table highlights comparable store sales* results over the past two years:
Cracker BarrelPeriod to Period
Increase (Decrease)
Logan’sPeriod to Period
Increase2004 vs 2003 2003 vs 2002 2004 vs 2003 2003 vs 2002(445 Stores) (430 Stores) (83 Stores) (71 Stores)
Restaurant 2.0% 0.5% 4.8% 0.0%Retail 5.3 (0.4) −− −−Restaurant & Retail 2.8 0.3 4.8 0.0*Comparable store sales consist of sales of units open six full quarters at the beginning of the year; and are measuredon calendar weeks.
Cracker Barrel comparable store restaurant sales increased 2.0% for 2004 versus 2003. Comparable storerestaurant sales increased 0.5% in 2003 versus 2002. The increase in comparable store restaurant sales from2003 to 2004 was due to an increase in average check of 1.7%, including 1.0% of menu pricing and 0.7% of productmix changes, and an increase in guest traffic of 0.3%.
Cracker Barrel comparable store retail sales increased 5.3% for 2004 versus 2003. Comparable store retailsales decreased 0.4% in 2003 versus 2002. The comparable store retail sales increase from 2003 to 2004 was due toimproved merchandise selection with broader appeal and greater variety at lower price points, improved merchandiseplanning, and retail staff sales training as well as the restaurant guest traffic increase.
In 2004 total net sales (restaurant and retail) in the 445 Cracker Barrel comparable stores averaged $4,206.Restaurant sales were 76.5% of total net sales in the comparable 445 stores in 2004 and 77.1% in 2003.
Logan’s comparable store sales increased 4.8% for 2004 versus 2003 at an average of $3,040 per restaurant.Comparable store sales were flat in 2003 versus 2002. The increase in comparable store sales from 2003 to 2004 wasdue to an increase in guest traffic of 3.1% and an increase in average check of 1.7%. The higher check included 1.1%of menu pricing and 0.6% lower sales deductions for complimentary meals (resulting from focus on execution and lessneed to resolve guest product and service issues).
Total revenue, which increased 8.3% and 6.1% in 2004 and 2003, respectively, benefited from the opening of24, 23 and 20 Cracker Barrel stores in 2004, 2003 and 2002, respectively, and the opening of 11, 12 and 9 company-operated and 4, 4 and 4 franchised Logan’s restaurants in 2004, 2003 and 2002, respectively. Average unit volumes,based on weeks of operation, were approximately $61.7 per week for Cracker Barrel restaurants in 2004 (comparedwith $60.9 in 2003 and $60.6 in 2002), $19.1 for Cracker Barrel retail (compared with $18.2 for 2003 and $18.3 for2002), and $59.5 for Logan’s (compared with $57.0 for 2003 and $56.6 for 2002).
Cost of Goods SoldCost of goods sold as a percentage of total revenue increased in 2004 to 33.0% from 32.0% in 2003. This
increase was due to higher commodity costs for beef, butter, bacon and other dairy, including eggs, all of which hadhigh single-digit percentage increases due to unfavorable market conditions. Also affecting cost of goods sold in 2004was a higher mix of retail sales as a percent of total revenue (retail has a higher product cost than restaurant) andhigher markdowns of retail merchandise versus the prior year. Management believes that increases in 2004 wereunusual in both magnitude and the breadth of commodities affected. These increases were partially offset by highermenu pricing and higher initial mark-ons of retail merchandise.
Cost of goods sold as a percentage of total revenue decreased in 2003 to 32.0% from 32.7% in 2002. CrackerBarrel has had various focused initiatives aimed at improving cost of product from vendors. This decrease was due to

lower commodity costs for orange juice and certain pork and dairy products versus the prior year, higher menu pricing,higher initial mark-ons of retail merchandise, lower retail shrink and in-store damages, a lower mix of retail sales as apercent of total revenues (retail has a higher product cost than restaurant) and improvements in restaurant-levelexecution. These decreases were offset partially by higher markdowns of retail merchandise and higher commoditycosts for beef, eggs and butter versus the prior year.
Labor and Related ExpensesLabor and other related expenses include all direct and indirect labor and related costs incurred in store
operations. Labor expenses as a percentage of total revenue were 37.0%, 37.3% and 37.5% in 2004, 2003 and 2002,respectively. The year to year decrease from 2003 to 2004 was due to higher menu pricing, lower hourly labor,including wage rates, and decreased workers’ compensation and group health costs offset partially by increases inmanager wages and bonuses versus the prior year. The year to year decrease from 2002 to 2003 was due to highermenu pricing, lower hourly labor, including wage rates, decreased compensation under unit-level bonus programs anddecreased workers’ compensation costs offset partially by increases in manager wages and increased group healthcosts versus the prior year.
Other Store Operating ExpensesOther store operating expenses include all unit-level operating costs, the major components of which are
operating supplies, utilities, repairs and maintenance, advertising, rent, depreciation and amortization. Other storeoperating expenses as a percentage of total revenue were 17.0%, 17.3% and 17.1% in 2004, 2003 and 2002,respectively. The year to year decrease from 2003 to 2004 was due to lower advertising and depreciation and highermenu pricing versus the prior year offset partially by higher losses on disposition of property and equipment versus theprior year. The increase from 2002 to 2003 was due to higher maintenance versus the prior year offset partially byhigher menu pricing versus the prior year.
General and Administrative ExpensesGeneral and administrative expenses as a percentage of total revenue were 5.3%, 5.6% and 5.6% in 2004,
2003 and 2002, respectively. The year to year decrease from 2003 to 2004 was due to lower professional fees and thedecrease in bonus accruals reflective of lower performance against financial objectives versus the prior year offsetpartially by the legal settlement discussed earlier. Higher professional fees, higher costs for store managerconferences and higher corporate bonuses reflective of performance improvements in 2003 versus 2002 wereoffset by higher revenues from menu pricing and new stores in 2003 versus 2002.
Interest Expense Interest expense decreased to $8,444 in 2004 from $8,892 in 2003, which represented an increase from
$6,769 in 2002. The year to year decrease from 2003 to 2004 was due to lower average outstanding debt versus theprior year. The increase from 2002 to 2003 resulted from higher average outstanding debt as compared to the prioryear offset partially by lower average interest rates as compared to the prior year.
Provision for Income TaxesProvision for income taxes as a percent of income before income taxes was 35.9% for 2004, 35.5% for 2003
and 35.6% for 2002. The reason for the increase in the tax rate from 2003 to 2004 was the expiration of certain federaltax credit legislation on January 1, 2004. The reason for the decrease in the tax rate from 2002 to 2003 was adecrease in effective state tax rates.
QUANTITATIVE AND QUALITATIVE DISCLOSURES ABOUT MARKET RISKInterest Rate Risk. With certain instruments entered into for other than trading purposes, the Company is
subject to market risk exposure related to changes in interest rates. As of September 28, 2004, the Company has inplace a $300,000 revolving credit facility, which matures February 21, 2008. The facility bears interest, at theCompany’s election, either at the prime rate or a percentage point spread from LIBOR based on certain financial ratiosset forth in the loan agreement. At July 30, 2004, the Company had no outstanding borrowings under the RevolvingCredit Facility, and the Company’s percentage point spread from LIBOR was 1.25%, as it was through all of 2004. Thepercentage point spread will decrease to 1.0% for the first quarter of 2005 then increase to 1.25% in the second quarterof 2005. The percentage point spread from LIBOR for the third and fourth quarters of 2005 remains to be determined.While changes in the prime rate or LIBOR would affect the cost of funds borrowed in the future, the Company believesthat the effect, if any, of reasonably possible near-term changes in interest rates on the Company’s consolidatedfinancial position, results of operations or cash flows would not be material.
Commodity Price Risk. Many of the food products purchased by the Company are affected by commoditypricing and are, therefore, subject to price volatility caused by weather, production problems, delivery difficulties andother factors which are outside the control of the Company and which are generally unpredictable. Four food categories(beef, dairy, including eggs, pork and poultry) account for the largest shares of the Company’s food purchases atapproximately 18%, 13%, 11% and 10%, respectively. Other categories affected by the commodities markets, such asproduce, seafood and coffee, may each account for as much as 9% of the Company’s food purchases. While the

Company has some of its food items prepared to its specifications, the Company’s food items are based on generallyavailable products, and if any existing suppliers fail, or are unable to deliver in quantities required by the Company, theCompany believes that there are sufficient other quality suppliers in the marketplace that its sources of supply can bereplaced as necessary. The Company also recognizes, however, that commodity pricing is extremely volatile and canchange unpredictably and over short periods of time. Changes in commodity prices would affect the Company and itscompetitors generally, and depending on the terms and duration of supply contracts, sometimes simultaneously. TheCompany also enters into supply contracts for certain of its products in an effort to minimize volatility of supply andpricing. In many cases, or over the longer term, the Company believes it will be able to pass through some or much ofthe increased commodity costs by adjusting its menu pricing. From time to time, competitive circumstances, orjudgments about consumer acceptance of price increases, may limit menu price flexibility, and in those circumstancesincreases in commodity prices can result in lower margins for the Company, as happened in 2004. Some of theCompany’s purchase contracts are used to hedge commodity prices and may contain features that could be classifiedas derivative financial instruments under Statement of Financial Accounting Standards (“SFAS”) Nos. 133, “Accountingfor Derivative Investments and Hedging Activities,” 137, “Accounting for Derivative Investments and Hedging Activities– Deferral of the Effective Date of FASB Statement No. 133,” 138, “Accounting for Certain Derivative Instruments andCertain Hedging Activities, an Amendment of FASB Statement No. 133,” and 149, “Amendments of Statement 133 onDerivative Instruments and Hedging Activities.” However, these features that could be classified as derivative financialinstruments are exempt from fair value accounting based on the normal purchases exemption.
LIQUIDITY AND CAPITAL RESOURCESThe following table presents a summary of the Company’s cash flows for the last three years:
2004 2003 2002Net cash provided by operating activities $200,365 $240,586 196,277Net cash used in investing activities (143,666) 118,953) (90,879)Net cash used in financing activities (42,313) (122,318) (102,131)
Net increase (decrease) in cash and cash equivalents $ 14,386 $ (685) $ 3,267
The Company’s cash generated from operating activities was $200,365 in 2004. Most of this cash wasprovided by net income adjusted by depreciation and amortization, the tax benefit realized upon exercise of stockoptions, accretion on zero coupon contingently convertible senior notes and loss on disposition of property.Increases in deferred income taxes, income taxes payable, other accrued expenses, deferred revenues, other long-term obligations, taxes withheld and accrued and accrued employee benefits and decreases in prepaid expenseswere partially offset by decreases in accounts payable and accrued employee compensation and increases ininventories, other assets and receivables.
The Company had negative working capital of $39,195 at July 30, 2004 versus negative working capital of$66,880 at August 1, 2003. In the restaurant industry, substantially all sales are either for cash or third-party creditcard. Like many other restaurant companies, the Company is able to, and may from time to time, operate withnegative working capital. Restaurant inventories purchased through the Company's principal food distributor are onterms of net zero days, while restaurant inventories purchased locally generally are financed from normal tradecredit. Retail inventories purchased domestically generally are financed from normal trade credit, while importedretail inventories generally are purchased through letters of credit and wire transfers. These various trade terms areaided by rapid turnover of the restaurant inventory. Employees generally are paid on weekly, bi-weekly or semi-monthly schedules in arrears for hours worked, and certain expenses such as certain taxes and some benefits aredeferred for longer periods of time.
Capital expenditures (purchase of property and equipment) were $144,611, $120,921 and $96,692 in 2004,2003 and 2002, respectively. Costs of new locations accounted for the majority of these expenditures.
The Company's internally generated cash, along with cash at August 1, 2003, the Company’s new operatingleases, proceeds from stock option exercises and, for interim periods of time, the Company’s available revolver, weresufficient to finance all of its growth, share repurchases and other cash payment obligations in 2004.
In 2002, the Company issued $422,050 (face value at maturity) of Notes, maturing on April 2, 2032, andreceived proceeds totaling approximately $172,756 prior to debt issuance costs. The Notes require no cash interestpayments and were issued at a discount representing a yield to maturity of 3.00% per annum. The Notes areredeemable at the Company's option on or after April 3, 2007, and the holders of the Notes may require theCompany to redeem the Notes on April 3, 2005, 2007, 2012, 2017, 2022 or 2027, and in certain othercircumstances. In addition, each $1 (face value at maturity) Note is convertible into 10.8584 shares of theCompany's common stock (approximately 4.6 million shares in the aggregate) if any of the following conditionsoccur: 1) the closing price of the Company’s common stock exceeds a specified price (initially, 120% of the accretedconversion price, and declining .08474% per quarter thereafter to approximately 110% of the accreted conversionprice on the last day of the quarter ending January 30, 2032, with a specified price of $48.21 at July 30, 2004); 2)the Company exercises its option to redeem the Notes; 3) the credit rating of the Notes is reduced by Moody’s and

Standard and Poor’s to or below both Ba3 and BB-, respectively; or 4) certain specified corporate events. Theaccreted conversion price is equal to the issue price of the Note plus accrued original issue discount divided by10.8584 shares, and was $40.40 per share at July 30, 2004. The Company’s closing share price, as reported byNasdaq, on July 30, 2004 was $33.22. Although the holders of the Notes have the ability to require the Company torepurchase the Notes on April 3, 2005, the Company has classified this debt as long-term due to its intent andability, in the event of a requirement to repurchase any portion of the Notes by the holders, to refinance thisindebtedness on a long-term basis through borrowings under the Revolving Credit Facility. In addition to the manyrisks and uncertainties listed above, the Company notes a certain specific risk that would have a material impact onfuture results if it occurred. This risk is the potential effect of a change in accounting rules for convertible debtproposed by the EITF Issue Abstract No. 04-08, that would require the use of “if-converted” accounting forcontingently convertible debt regardless of whether the contingency allowing debt holders to convert is met. Undercurrent rules (SFAS No. 128, “Earnings Per Share”), contingently issuable shares should be included as dilutedshares outstanding only when the contingency (i.e., when the common stock trades for a specified period of time ator above the specified contingent conversion price, $48.21 as of July 30, 2004) is met. Should the rule change beadopted, the Company would be required, among other things, to include approximately 4.6 million shares in itsdiluted shares outstanding related to its convertible debt. The likelihood and timing of implementation of the rulechange is uncertain. The Company noted that, if implemented, the change would have no economic effect becausethe terms of the Notes would be unchanged. The Company has not yet determined what response or change inpolicy, if any, it would make if the new accounting took effect.
On February 21, 2003, the Company entered into a new five-year $300,000 Revolving Credit Facility andterminated its previous $250,000 Revolving Credit Facility, which was set to expire on December 31, 2003. The newfacility has substantially the same terms as the prior facility; however, there is a slightly more favorable credit spreadgrid, as well as certain less restrictive covenants. The new $300,000 revolving credit facility will expire on February21, 2008. At July 30, 2004, the Company had no outstanding borrowings under the Revolving Credit Facility.
During 2004, the Company’s Board of Directors (the “Board”) authorized the repurchase of up to 4 millionshares of the Company’s common stock under two separate repurchase authorizations. The repurchases are to bemade from time to time in the open market at prevailing market prices. The Company completed repurchases of1,769,300 shares of its common stock for a net expenditure of $69,206, or approximately $39.11 per share. Thetotal 2004 share repurchases were made up of the following: 661,300 shares were repurchased under a repurchaseauthorization previously in effect at the end of fiscal 2003 and 1,108,000 shares were repurchased under the first2004 repurchase authorization. The Company presently expects to complete the remaining 892,000 shares of thefirst repurchase authorization and the 2 million shares of the second repurchase authorization during 2005, althoughthere can be no assurance that such repurchases actually will be completed in that period of time. The Company’sprincipal criteria for share repurchases are that they be accretive to net income per share and that they do notunfavorably affect the Company’s investment grade debt rating and target capital structure.
During 2004 the Company received proceeds of $50,210 from the exercise of stock options on 2,634,126shares of its common stock and tax benefit upon exercise of stock options of $12,641.
During the first quarter of 2004, the Board approved a quarterly dividend policy declaring a quarterly dividend of$0.11 per common share (an annual equivalent of $0.44 per share), an increase from an annual dividend of $0.02 paidin 2003. The Company paid such dividends of $0.11 per share during the second, third and fourth quarters of 2004.Additionally, on July 29, 2004, the Board declared another dividend of $0.11 per share payable on September 1, 2004to shareholders of record on August 9, 2004. Additionally, on September 23, 2004, the Board declared a dividend of$0.12 per share payable on November 1, 2004 to shareholders of record on October 8, 2004. This dividend reflectsa 9.1% increase from the previous quarterly dividend.
The Company estimates that its capital expenditures (purchase of property and equipment) for 2005 will beapproximately $160,000 to $165,000, most of which will be related to the acquisition of sites and construction of 25 newCracker Barrel stores and 18 new Logan’s restaurants and openings that will occur after 2005.
Management believes that cash at July 30, 2004, along with cash generated from the Company’s operatingactivities, stock option exercises and its available Revolving Credit Facility, will be sufficient to finance its continuedoperations, its remaining share repurchase authorization, its continued expansion plans and its dividend paymentsthrough 2005. At July 30, 2004, the Company had $300,000 available under its Revolving Credit Facility. TheCompany estimates that it will generate excess cash of approximately $100,000 to $110,000, which it defines as netcash provided by operating activities less cash used for purchase of property and equipment (the most comparablemeasure under GAAP). The Company intends to use this excess cash along with proceeds from the exercise ofstock options in 2005 to apply toward completing its remaining 2,892,000 share repurchase authorization, possiblefuture share repurchase authorizations and dividend payments or other general corporate purposes.
MATERIAL COMMITMENTSFor reporting purposes, the schedule of future minimum rental payments required under operating leases,
excluding leases for advertising billboards, has been restated to conform the lease term to that used in the straight-line rent calculation as described in Note 2 to the Consolidated Financial Statements, and correct miscellaneouserrors due to keying mistakes and summation errors, omission of certain leases and miscalculation of certain leaseterms. Although the Company is not currently legally obligated for all optional renewal periods, this method was

deemed appropriate under SFAS No. 13, “Accounting for Leases,” to be consistent with the lease term used in thestraight-line rent calculation.
The Company’s contractual cash obligations and commitments as of July 30, 2004, are summarized in thetables below:
Payments due by Year
Total 2005 2006-2007 2008-2009 After 2009(As Restated) (As Restated) (As Restated) (As Restated) (As Restated)
Convertible debt $185,138 -- -- -- $185,138Revolving credit facility -- -- -- -- --
Long-term Debt (a) 185,138 -- -- -- 185,138Operating lease base term and exercised
options – excluding billboards (b) 439,482 $30,174 $59,318 $59,068 290,922Operating lease renewal periods not yet
exercised – excluding billboard (c) 284,057 -- 563 1,498 281,996Operating leases for billboards 39,489 20,218 19,162 109 --Trade letters of credit 7,497 7,497 -- -- --Capital leases 637 235 359 43 --Purchase obligations (d) 330,271 253,268 77,003 -- --
Total contractual cash obligations $1,286,571 $311,392 $156,405 $60,718 $758,056
Amount of Commitment Expirations by Year
Total 2005 2006-2007 2008-2009 After 2009
Revolving credit facility $300,000 -- -- $300,000 --Standby letters of credit 17,830 $17,830 -- -- --Guarantees (e) 4,473 457 $913 913 $2,190
Total commitments $322,303 $18,287 $913 $300,913 $2,190
(a) The convertible debt was issued at a discount representing a yield to maturity of 3.00% per annum. The$185,138 balance is the accreted carrying value of the debt at July 30, 2004. The convertible debt will continueto accrete at 3.00% per annum and if held to maturity on April 2, 2032 the obligation will total $422,050.Additionally, since the Company had no amounts outstanding under its variable rate Revolving Credit Facility asof July 30, 2004 interest is excluded from the contractual cash obligations table.
(b) Includes base lease terms and certain optional renewal periods that have been exercised and are included inthe lease term in accordance with SFAS No. 13 (see Note 2).
(c) Includes certain optional renewal periods that have not yet been exercised, but are included in the lease termfor the straight-line rent calculation, since at the inception of the lease, it is reasonably assured that theCompany will exercise those renewal options (see Note 2).
(d) Purchase obligations consist of purchase orders for food and retail merchandise; purchase orders for capitalexpenditures, supplies and other operating needs and other services; and commitments under contracts formaintenance needs and other services. We excluded long-term agreements for services and operating needsthat can be cancelled within 60 days without penalty. We included long-term agreements for services andoperating needs that can be cancelled with more than 60 days notice without penalty only through the term ofthe notice. We included long-term agreements for services and operating needs that can be cancelled with apenalty through the entire term of the contract. Due to the uncertainties of seasonal demands and promotionalcalendar changes, our best estimate of usage for food, supplies and other operating needs and services isratably over either the notice period or the remaining life of the contract, as applicable, unless we had betterinformation available at the time related to each contract.
(e) Consists solely of guarantees associated with properties that have been subleased or assigned. The Companyis not aware of any non-performance under these arrangements that would result in the Company having toperform in accordance with the terms of those guarantees.
CRITICAL ACCOUNTING POLICIESThe Company prepares its Consolidated Financial Statements in conformity with GAAP. The preparation of
these financial statements requires the Company to make estimates and assumptions that affect the reportedamounts of assets and liabilities and disclosure of contingent assets and liabilities at the date of the financialstatements, and the reported amounts of revenues and expenses during the reporting period (see Note 3 to theCompany's Consolidated Financial Statements). Actual results could differ from those estimates. Critical accountingpolicies are those that management believes are both most important to the portrayal of the Company's financialcondition and operating results, and require management's most difficult, subjective or complex judgments, often asa result of the need to make estimates about the effect of matters that are inherently uncertain. The Companybases its estimates on historical experience, outside advice from parties believed to be experts in such matters, andon various other assumptions that are believed to be reasonable under the circumstances, the results of which formthe basis for making judgments about the carrying value of assets and liabilities that are not readily apparent fromother sources. Judgments and uncertainties affecting the application of those policies may result in materiallydifferent amounts being reported under different conditions or using different assumptions. The Company considersthe following policies to be most critical in understanding the judgments that are involved in preparing itsConsolidated Financial Statements.
IMPAIRMENT OF LONG-LIVED ASSETS AND PROVISION FOR ASSET DISPOSITIONSThe Company assesses the impairment of identifiable intangibles, long-lived assets and goodwill whenever
events or changes in circumstances indicate that the carrying value may not be recoverable. Recoverability ofassets is measured by comparing the carrying value of the asset to the future cash flows expected to be generatedby the asset. If the total expected future cash flows were less than the carrying amount of the asset, the carryingamount is written down to the estimated fair value, and a loss resulting from impairment is recognized by a chargeto earnings. Judgments and estimates made by the Company related to the expected useful lives of long-livedassets are affected by factors such as changes in economic conditions and changes in operating performance. Asthe Company assesses the ongoing expected cash flows and carrying amounts of its long-lived assets, thesefactors could cause the Company to realize a material impairment charge. From time to time the Company hasdecided to exit from or dispose of certain operating units. Typically such decisions are made based on operatingperformance or strategic considerations and must be made before the actual costs of proceeds of disposition areknown, and management must make estimates of these outcomes. Such outcomes could include the sale of aproperty or leasehold, mitigating costs through a tenant or subtenant, or negotiating a buyout of a remaining leaseterm. In these instances management evaluates possible outcomes, frequently using outside real estate and legaladvice, and records in the financial statements provisions for the effect of such outcomes. The accuracy of suchprovisions can vary materially from original estimates, and management regularly monitors the adequacy of theprovisions until final disposition occurs. In addition, at least annually, the Company assesses the recoverability ofgoodwill and other intangible assets related to its restaurant concepts with assistance from an outside expert. Theimpairment tests require the Company to estimate fair values of its restaurant concepts by making assumptionsregarding future cash flows and other factors. This valuation may reflect, among other things, such external factorsas capital market valuation for public companies comparable to the operating unit. If these assumptions change inthe future, or if operating performance declines, the Company may be required to record impairment charges forthese assets and such charges could be material.
INSURANCE RESERVESThe Company self-insures a significant portion of expected losses under its workers’ compensation, general
liability and health insurance programs. The Company has purchased insurance for individual claims that exceed$250 for workers’ compensation and general liability insurance prior to 2003, but increased this amount to $500 for2003 and to $1,000 for certain coverages for 2004 going forward. The Company has decided not to purchase suchinsurance for its primary group health program, but its offered benefits are limited to not more than $1,000 duringthe lifetime of any employee (including dependents) in the program. The Company records a liability for workers’compensation and general liability for all unresolved claims and for an actuarially determined estimate of incurredbut not reported claims at the anticipated cost to the Company as of the end of the Company’s third quarter andadjusting it by the actuarially determined losses and actual claims payments for the fourth quarter. Those reservesand losses are determined actuarially from a range of possible outcomes within which no given estimate is morelikely than any other estimate. In accordance with SFAS No. 5, “Accounting for Contingencies,” the Companyrecords the losses at the low end of that range and discounts them to present value using a risk-free interest ratebased on actuarially projected timing of payments. The Company records a liability for its group health program forall unpaid claims based primarily upon a loss development analysis derived from actual group health claimspayment experience provided by the Company’s third party administrator. The Company's accounting policiesregarding insurance reserves include certain actuarial assumptions or management judgments regarding economicconditions, the frequency and severity of claims and claim development history and settlement practices.Unanticipated changes in these factors may produce materially different amounts of expense that would be reportedunder these insurance programs.

TAX PROVISIONThe Company must make estimates of certain items that comprise its income tax provision. These
estimates include employer tax credits for items such as FICA taxes paid on employee tip income, WorkOpportunity and Welfare to Work, as well as estimates related to certain depreciation and capitalization policies.These estimates are made based on the best available information at the time of the provision and historicalexperience. The Company files its income tax returns many months after its year end. These returns are subject toaudit by various federal and state governments years after the returns are filed and could be subject to differinginterpretations of the tax laws. The Company then must assess the likelihood of successful legal proceedings orreach a settlement, either of which could result in material adjustments to the Company’s Consolidated FinancialStatements and its consolidated financial position. The Internal Revenue Service (“IRS”) completed its examinationof the Company’s federal income tax returns for 1997 through 2001. On August 1, 2002 the Company reached asettlement with the IRS for these tax periods. Adjustments related primarily to temporary or timing differences.The settlement had no material effect on the Company’s Consolidated Financial Statements. Additionally, the IRShas examined the Company’s federal payroll tax filings for the calendar years ended December 31, 1997 throughDecember 31, 2001. This examination was completed on July 21, 2003 resulting in no adjustment to the payrolltaxes originally reported by the Company (see Note 8 to the Company’s Consolidated Financial Statements).
LEGAL PROCEEDINGSAs more fully discussed in Note 10 to the Consolidated Financial Statements, the Company’s Cracker Barrel
subsidiary, on September 8, 2004, agreed in principle to settle certain litigation alleging violations of the Fair LaborStandards Act as well as allegations of discrimination in employment and public accommodations. The totalpayment agreed to by Cracker Barrel was $8,720 (including $3,500 accrued in the fourth quarter of 2001), in fullsatisfaction of all claims, including attorneys’ fees and costs. The effects of this charge upon net income andearnings per share in both the fourth quarter of and the entire 2004 year are discussed above.
The Company and its subsidiaries are party to other legal proceedings incidental to their business. In theopinion of management, based upon information currently available, the ultimate liability with respect to these otheractions will not materially affect the Company’s Consolidated Financial Statements.

CBRL GROUP, INC.Consolidated Balance Sheet
(In thousands except share data)
ASSETSJuly 30,
2004August 1,
2003(As Restated,
see Note 2)(As Restated,
see Note 2)Current Assets:Cash and cash equivalents $ 28,775 $ 14,389Receivables 9,802 9,150Inventories 141,820 136,020Prepaid expenses 8,369 8,932Deferred income taxes 14,274 7,568Total current assets 203,040 176,059
Property and Equipment:Land 298,233 273,831Buildings and improvements 662,682 625,541Buildings under capital leases 3,289 3,289Restaurant and other equipment 315,512 331,065Leasehold improvements 193,859 164,937Construction in progress 28,739 19,268Total 1,502,314 1,417,931Less: Accumulated depreciation and amortization of
capital leases 383,741 377,616Property and equipment – net 1,118,573 1,040,315Goodwill 93,724 93,724Other Assets 20,367 17,067Total $1,435,704 $1,327,165
LIABILITIES AND SHAREHOLDERS’ EQUITYCurrent Liabilities:Accounts payable $ 53,295 $ 82,172Current maturities of long-term debt
and other long-term obligations 189 100Taxes withheld and accrued 34,539 32,103Income taxes payable 18,571 8,177Accrued employee compensation 49,466 50,153Accrued employee benefits 39,290 38,782Deferred revenues 19,347 15,634Other accrued expenses 27,538 15,818Total current liabilities 242,235 242,939Long-term Debt 185,138 186,730Other Long-term Obligations 36,225 30,454Deferred Income Taxes 98,770 77,680
Commitments and Contingencies (Note 10)Shareholders’ Equity:Preferred stock – 100,000,000 shares of
$.01 par value authorized; no shares issued -- --Common stock – 400,000,000 shares of $.01 par value
authorized; 2004 - 48,769,368shares issued and outstanding; 2003 –47,872,542 shares issued and outstanding 488 479
Additional paid-in capital 13,982 --Retained earnings 858,866 788,883Total shareholders' equity 873,336 789,362Total $1,435,704 $1,327,165
See Notes to Consolidated Financial Statements.

CBRL GROUP, INC.Consolidated Statement of Income
(In thousands except share data)Fiscal years ended
July 30,2004
August 1,2003
August 2,2002
(As Restated,see Note 2)
(As Restated,see Note 2)
(As Restated,see Note 2)
Total revenue $2,380,947 $2,198,182 $2,071,784Cost of goods sold 785,703 703,915 677,738Gross profit 1,595,244 1,494,267 1,394,046Labor & other related expenses 880,617 819,957 777,617Other store operating expenses 405,139 380,534 354,040Store operating income 309,488 293,776 262,389General and administrative 126,501 121,898 115,179Operating income 182,987 171,878 147,210Interest expense 8,444 8,892 6,769Interest income 5 73 --Income before income taxes 174,548 163,059 140,441Provision for income taxes 62,663 57,951 49,997Net income $ 111,885 $ 105,108 $ 90,444Net income per share – basic $ 2.29 $ 2.13 $ 1.67Net income per share – diluted $ 2.23 $ 2.06 $ 1.61Basic weighted average shares
outstanding 48,877,306 49,274,373 54,198,845Diluted weighted average shares
outstanding 50,369,845 50,998,339 56,090,940
See Notes to Consolidated Financial Statements.

CBRL GROUP, INC.Consolidated Statement of Changes in Shareholders’ Equity
(In thousands except share data)
Common StockAdditional
Paid-In RetainedTotal
Shareholders’Shares Amount Capital Earnings Equity
Balances at August 3, 2001 (previously reported) 55,026,846 $550 $149,073 $ 696,485 $846,108Prior year adjustment (see Note 2) −− −− −− (2,768) (2,768)
Balances at August 3, 2001(As Restated, see Note 2) 55,026,846 550 149,073 693,717 843,340
Cash dividends declared - $.02 per share −− −− −− (1,163) (1,163)Exercise of stock options 2,878,567 29 53,074 −− 53,103Tax benefit realized upon exercise of stock
options −− −− 9,991 −− 9,991Purchases and retirement of common stock (7,632,954) (76) (212,138) (4,620) (216,834)Net income (As Restated, see Note 2) −− −− −− 90,444 90,444
Balances at August 2, 2002(As Restated, see Note 2) 50,272,459 503 −− 778,378 778,881
Cash dividends declared - $.02 per share −− −− −− (1,043) (1,043)Exercise of stock options 2,938,783 29 59,620 −− 59,649Tax benefit realized upon exercise of stock
options −− −− 13,399 −− 13,399Purchases and retirement of common stock (5,338,700) (53) (73,019) (93,560) (166,632)Net income (As Restated, see Note 2) −− −− −− 105,108 105,108
Balances at August 1, 2003(As Restated, see Note 2) 47,872,542 479 −− 788,883 789,362
Cash dividends declared - $.33 per share −− −− −− (21,556) (21,556)Exercise of stock options 2,666,126 27 50,183 −− 50,210Tax benefit realized upon exercise of stock
options −− −− 12,641 −− 12,641Purchases and retirement of common stock (1,769,300) (18) (48,842) (20,346) (69,206)Net income (As Restated, see Note 2) −− −− −− 111,885 111,885
Balances at July 30, 2004(As Restated, see Note 2) 48,769,368 $488 $13,982 $858,866 $873,336
See Notes to Consolidated Financial Statements.

CBRL GROUP, INC.Consolidated Statement of Cash Flows
(In thousands)Fiscal years ended
July 30,2004
August 1,2003
August 2,2002
(As Restated,see Note 2)
(As Restated,see Note 2)
(As Restated,see Note 2)
Cash flows from operating activities:Net income $111,885 $105,108 $90,444
Adjustments to reconcile net income to netcash provided by operating activities:
Depreciation and amortization 63,868 64,376 62,759Loss (gain) on disposition of property and
equipment 3,334 903 (781)Accretion on zero-coupon contingently
convertible senior notes 5,408 5,254 1,720Tax benefit realized upon exercise of
stock options 12,641 13,399 9,991Changes in assets and liabilities:
Receivables (652) (691) 2,281Inventories (5,800) (11,327) (8,103)Prepaid expenses 563 2,792 (2,161)Other assets (4,863) (3,136) (813)Accounts payable (28,877) 8,366 17,108Taxes withheld and accrued 2,436 3,422 (1,153)Income taxes payable 10,394 (7,349) (3,891)Accrued employee compensation (687) 6,691 7,169Accrued employee benefits 508 5,361 7,871Deferred revenues 3,712 2,673 3,921Other accrued expenses 6,356 928 1,848Other long-term obligations 5,755 4,562 6,322Deferred income taxes 14,384 39,254 1,745
Net cash provided by operating activities 200,365 240,586 196,277
Cash flows from investing activities:Purchase of property and equipment (144,611) (120,921) (96,692)Proceeds from sale of property and
equipment 945 1,968 5,813 Net cash used in investing activities (143,666) (118,953) (90,879)
Cash flows from financing activities:Proceeds from issuance of long-term debt 150,000 353,200 591,756Proceeds from exercise of stock options 50,210 59,649 53,103Principal payments under long-term debt
and other long-term obligations (157,125) (366,287) (524,140)Purchases and retirement of common stock (69,206) (166,632) (216,834)Deferred financing costs (1) (1,205) (4,853)Dividends on common stock (16,191) (1,043) (1,163)Net cash used in financing activities (42,313) (122,318) (102,131)Net increase (decrease) in cash and cash
equivalents 14,386 (685) 3,267Cash and cash equivalents, beginning of
year 14,389 15,074 11,807Cash and cash equivalents, end of year $28,775 $14,389 $15,074
Supplemental disclosure of cash flow information:Cash paid during the year for:
Interest $ 1,108 $ 1,604 $ 4,839Income taxes 26,501 15,229 43,340
See Notes to Consolidated Financial Statements.

CBRL GROUP, INC.Notes to Consolidated Financial Statements(In thousands except share data)
1. DESCRIPTION OF THE BUSINESSCBRL Group, Inc. and its affiliates (collectively, in the Notes, the “Company”) are principally engaged in the
operation and development in the United States of the Cracker Barrel Old Country Store® (“Cracker Barrel”) restaurantand retail concept and the Logan’s Roadhouse® (“Logan’s”) restaurant concept. Logan’s has two non-affiliated areadevelopment agreements and accompanying franchise agreements covering development of its concept in all or partof five states. CBRL Group, Inc. Common Stock is traded on The Nasdaq Stock Market (National Market) under thesymbol CBRL.
2. RESTATEMENT OF FINANCIAL STATEMENTSOn February 17, 2005, the Company announced that it was restating certain prior financial results because
of changes it made in the way it accounted for leases. The decision to restate was made following a review of itsaccounting policies that was prompted by views expressed on February 7, 2005 by the staff of the SEC (and similarrestatements by numerous other companies in the restaurant, retail and other industries) that indicated that themanner in which the Company had been accounting for leases needed to be corrected.
Prior to this review, the Company had believed that its accounting was consistent with generally acceptedaccounting principles. For purposes of recognizing rental expense, the Company had historically averaged its leasepayments over the base term of the lease, excluding the optional renewal periods and initial build-out periods,during which it typically has not been required to make lease payments. For purposes of depreciating leaseholdimprovements, the Company had historically amortized the amounts over a longer period, including both the baseterm of the lease and the optional renewal periods.
The Company has now determined that the period in which rental expense is recognized on a straight-line,or average, basis should include any pre-opening periods during construction for which the Company is legallyobligated under the terms of the lease, and any optional renewal periods, for which at the inception of the lease, it isreasonably assured that the Company will exercise those renewal options. This lease period will be consistent withthe period over which leasehold improvements are amortized.
As a result, the Company has restated its historical consolidated financial statements for years ended July30, 2004, August 1, 2003 and August 2, 2002. These effects are summarized below:
CBRL GROUP, INC. CONSOLIDATED STATEMENT OF INCOME
(In thousands, except share data)
TotalRevenue
Operatingincome
Incomebeforeincometaxes Net income
Basic netincome per
share
Diluted netincome per
share
Basicweightedaverageshares
Dilutedweightedaverageshares
Year Ended July 30, 2004As Previously Reported $2,380,947 $185,136 $176,697 $113,262 $2.32 $2.25 48,877,306 50,369,845
Lease Adjustment -- (2,149) (2,149) (1,377) (0.03) (0.02) -- -- As Restated $2,380,947 $182,987 $174,548 $111,885 $2.29 $2.23 48,877,306 50,369,845
Year Ended August 1, 2003As Previously Reported $2,198,182 $174,081 $165,262 $106,529 $2.16 $2.09 49,274,373 50,998,339Lease Adjustment -- (2,203) (2,203) (1,421) (0.03) (0.03) -- --
As Restated $2,198,182 $171,878 $163,059 $105,108 $2.13 $2.06 49,274,373 50,998,339
Year Ended August 2, 2002 As Previously Reported $2,071,784 $149,300 $142,531 $ 91,789 $1.69 $1.64 54,198,845 56,090,940 Lease Adjustment -- (2,090) (2,090) (1,345) (0.02) (0.03) -- -- As Restated $2,071,784 $147,210 $140,441 $ 90,444 $1.67 $1.61 54,198,845 56,090,940

CBRL GROUP, INC.Consolidated Balance Sheet
(In thousands)
July 30, 2004
July 30, 2004
August 1, 2003
August 1, 2003
(As PreviouslyReported)
LeaseAdjustment (As Restated)
(As PreviouslyReported)
LeaseAdjustment (As Restated)
ASSETSTotal current assets $ 203,040 $ -- $ 203,040 $ 176,059 $ -- $ 176,059Net property and equipment 1,118,573 -- 1,118,573 1,040,315 -- 1,040,315Total other assets 113,249 842 114,091 109,949 842 110,791Total assets $1,434,862 $ 842 $1,435,704 $1,326,323 $ 842 $1,327,165
LIABILITIES ANDSHAREHOLDERS’ EQUITY
Total current liabilities $ 246,782 $(4,547) $ 242,235 $ 246,714 $(3,775) $ 242,939Long-term debt 185,138 -- 185,138 186,730 -- 186,730Other long-term obligations 122,695 12,300 134,995 97,983 10,151 108,134Total shareholders’ equity 880,247 (6,911) 873,336 794,896 (5,534) 789,362Total liabilities and
shareholders’ equity $1,434,862 $ 842 $1,435,704 $1,326,323 $ 842 $1,327,165
Certain amounts and disclosures in Notes 3, 8, 10 and 13 have been restated to reflect the restatementadjustments described above. The restatement adjustments did not affect net cash provided by or used in operating,investing or financing activities.
3. SUMMARY OF SIGNIFICANT ACCOUNTING POLICIESGAAP – The accompanying Consolidated Financial Statements have been prepared in accordance with
generally accepted accounting principles in the United States (“GAAP”).Fiscal year – The Company's fiscal year ends on the Friday nearest July 31st and each quarter consists of
thirteen weeks unless noted otherwise. References in these Notes to a year or quarter are to the Company’s fiscalyear or quarter unless noted otherwise.
Principles of consolidation – The Consolidated Financial Statements include the accounts of the Company andits subsidiaries, all of which are wholly owned. All significant intercompany transactions and balances have beeneliminated.
Financial instruments – The fair values of cash and cash equivalents, accounts receivable, and accountspayable as of July 30, 2004, approximate their carrying amounts due to their short duration. The carrying value andfair value of the Company’s zero-coupon contingently convertible senior notes (the “Notes”) in long-term debt at July30, 2004 were $185,138 and $194,671, respectively. The fair value of the Notes in long-term debt is determinedbased on market prices using the average of the bid and ask prices as of July 30, 2004.
Cash and cash equivalents – The Company's policy is to consider all highly liquid investments purchased withan original maturity of three months or less to be cash equivalents.
Inventories – Inventories are stated at the lower of cost or market. Cost of restaurant inventory is determinedby the first-in, first-out (FIFO) method. Approximately 70% of retail inventories are valued using the retail inventorymethod and the remaining 30% are valued using an average cost method. Valuation provisions are included for retailinventory obsolescence, returns and amortization of certain items.
Start-up costs – Start-up costs of a new store are expensed when incurred.Property and equipment – Property and equipment are stated at cost. For financial reporting purposes,
depreciation and amortization on these assets are computed by use of the straight-line and double-declining balancemethods over the estimated useful lives of the respective assets, as follows:
YearsBuildings and improvements 30-45Buildings under capital leases 15-25Restaurant and other equipment 3-10Leasehold improvements 1-35
Depreciation expense was $62,304, $62,552 and $61,883 for 2004, 2003 and 2002, respectively. Accelerateddepreciation methods are generally used for income tax purposes.
Capitalized interest was $615, $463 and $364 for 2004, 2003 and 2002, respectively.Gain or loss is recognized upon disposal of property and equipment, and the asset and related accumulated
depreciation and amortization amounts are removed from the accounts.Maintenance and repairs, including the replacement of minor items, are charged to expense, and major
additions to property and equipment are capitalized.Impairment of long-lived assets – The Company evaluates for possible impairment of long-lived assets and
certain identifiable intangibles to be held and used in the business whenever events or changes in circumstances

indicate that the carrying amount of an asset may not be recoverable. An impairment is determined by comparingestimated undiscounted future operating cash flows to the carrying amounts of assets on a location by location basis. Ifan impairment exists, the amount of impairment is measured as the sum of the estimated discounted future operatingcash flows of such asset and the expected proceeds upon sale of the asset less its carrying amount. If applicable,assets held for sale are reported at the lower of carrying amount or fair value less costs to sell.
Operating leases – The Company has ground leases and office space leases that are recorded asoperating leases. Most of the leases have rent escalation clauses and some have rent holiday and contingent rentprovisions. In accordance with FASB Technical Bulletin (“FTB”) No. 85-3, “Accounting for Operating Leases withScheduled Rent Increases,” the liabilities under these leases are recognized on the straight-line basis over theshorter of the useful life, with a maximum of 35 years, or the related lease life. The Company uses a lease life thatgenerally begins on the date that the Company becomes legally obligated under the lease, including the pre-openingperiod during construction, when in many cases the Company is not making rent payments, and generally extendsthrough certain of the renewal periods that can be exercised at the Company’s option, for which at the inception ofthe lease, it is reasonably assured that the Company will exercise those renewal options.
Certain leases provide for rent holidays, which are included in the lease life used for the straight-line rentcalculation in accordance with FTB No. 88-1, “Issues Relating to Accounting for Leases.” Rent expense and anaccrued rent liability are recorded during the rent holiday periods, during which the Company has possession of andaccess to the property, but is not required or obligated to, and normally does not, make rent payments.
Certain leases provide for contingent rent, which is determined as a percentage of gross sales in excess ofspecified levels. The Company records a contingent rent liability and corresponding rent expense when sales havebeen achieved in amounts in excess of the specified levels.
The same lease life is used for reporting future minimum lease commitments as is used for the straight-linerent calculation. The Company uses a lease life that extends through certain of the renewal periods that can beexercised at the Company’s option.
Advertising – The Company expenses the costs of producing advertising the first time the advertising takesplace. Net advertising expense was $38,442, $39,782 and $37,423 for 2004, 2003 and 2002, respectively.
Insurance – The Company self-insures a significant portion of expected losses under its workers’compensation, general liability and health insurance programs. The Company has purchased insurance forindividual claims that exceed $250 for workers’ compensation and general liability insurance prior to 2003, but hasincreased this amount to $500 for 2003 and $1,000 for certain coverages for 2004 going forward. The Companyhas decided not to purchase such insurance for its primary group health program, but its offered benefits are limitedto not more than $1,000 during the lifetime of any employee (including dependents) in the program. The Companyrecords a liability for workers’ compensation and general liability for all unresolved claims and for an actuariallydetermined estimate of incurred but not reported claims at the anticipated cost to the Company as of the end of theCompany’s third quarter and adjusting it by the actuarially determined losses and actual claims payments for thefourth quarter. The reserves and losses are determined actuarially from a range of possible outcomes within whichno given estimate is more likely than any other estimate. In accordance with Statement of Financial AccountingStandards (“SFAS”) No. 5, “Accounting for Contingencies,” the Company records the losses at the low end of thatrange and discounts them to present value using a risk-free interest rate based on actuarially projected timing ofpayments. The Company records a liability for its group health program for all unpaid claims based primarily upon aloss development analysis derived from actual group health claims payment experience provided by the Company’sthird party administrator. The Company's accounting policies regarding insurance reserves include certain actuarialassumptions or management judgments regarding economic conditions, the frequency and severity of claims andclaim development history and settlement practices. Unanticipated changes in these factors may produce materiallydifferent amounts of expense that would be reported under these insurance programs.
Goodwill –- Goodwill represents the excess of the cost over the net tangible and identifiable intangible assetsfrom the acquisition of Logan’s in 1999. Effective August 4, 2001, the Company elected early adoption of SFAS No.142, “Goodwill and Other Intangible Assets.” SFAS No. 142 eliminated the amortization for goodwill and otherintangible assets with indefinite lives. Intangible assets with lives restricted by contractual, legal, or other means willcontinue to be amortized over their useful lives. Goodwill and other intangible assets not subject to amortization aretested for impairment annually or more frequently if events or changes in circumstances indicate that the asset mightbe impaired. SFAS No. 142 requires a two-step process for testing impairment. First, the fair value of each reportingunit is compared to its carrying value to determine whether an indication of impairment exists. This valuation mayreflect, among other things, such external factors as capital market valuation for public companies comparable tothe operating unit. If an impairment is indicated, then the implied fair value of the reporting unit’s goodwill is determinedby allocating the unit’s fair value to its assets and liabilities (including any unrecognized intangible assets) as if thereporting unit had been acquired in a business combination. The amount of impairment for goodwill and otherintangible assets is measured as the excess of its carrying value over its implied fair value. The Company conductedthe initial test of the carrying value of its goodwill, as required by SFAS No. 142, during the second quarter of 2002 andconcluded that there was no current indication of impairment to goodwill. The Company performed its annualassessment with assistance from an outside expert in the second quarters of 2003 and 2004, and concluded thatthere was no current indication of impairment. This annual assessment is performed in the second quarter of each

year. Additionally, an assessment is performed between annual assessments if an event occurs or circumstanceschange that would more likely than not reduce the fair value of a reporting unit below its carrying amount.
Revenue recognition – The Company records revenue from the sale of products as they are sold. TheCompany provides for estimated returns based on return history and sales levels. Initial fees received from afranchisee to establish a new franchise are recognized as income when the Company has performed all of itsobligations required to assist the franchisee in opening a new franchise restaurant, which is generally upon theopening of that restaurant. Continuing royalties, which are a percentage of net sales of franchised restaurants, areaccrued as income when earned.
Deferred revenue – Unredeemed gift certificates and cards represent the Company’s only liability related tounearned income and are recorded at their expected redemption value. When gift certificates and cards areredeemed, the Company recognizes revenue and reduces the liability.
Income taxes – Employer tax credits for FICA taxes paid on employee tip income are accounted for by theflow-through method. Deferred income taxes reflect the net tax effects of temporary differences between the carryingamounts of assets and liabilities for financial reporting purposes and the amounts used for income tax purposes (seeNote 8).
Net income per share – Basic net income per share is computed by dividing income available to commonshareholders by the weighted average number of common shares outstanding for the reporting period. Diluted netincome per share reflects the potential dilution that could occur if securities, options or other contracts to issuecommon stock were exercised or converted into common stock. The Notes had no effect on diluted shares in 2004,2003 or 2002, since none of the contingencies that would allow conversion had occurred (see Note 5). Outstandingemployee and director stock options and restricted stock issued by the Company represent the only dilutive effectsreflected in diluted weighted average shares.
Comprehensive income – Comprehensive income is defined as the change in equity of a business enterpriseduring a period from transactions and other events and circumstances from non-owner sources. Comprehensiveincome for 2004, 2003 and 2002 is equal to net income as reported.
Stock-based compensation – The Company accounts for its stock based compensation under the recognitionand measurement principles of Accounting Principles Board (“APB”) Opinion No. 25, “Accounting for Stock Issued toEmployees,” and related interpretations, and has adopted the disclosure-only provisions of SFAS No. 123, “Accountingfor Stock-Based Compensation,” (see Note 7) and below is providing disclosures required by SFAS No. 148,“Accounting for Stock-Based Compensation-Transition and Disclosure.” Under APB Opinion No. 25, no stock-basedcompensation cost is reflected in net income for grants of stock options to employees because the Company grantsstock options with an exercise price equal to the market value of the stock on the date of grant. The reported stock-based compensation expense, net of related tax effects, in the table represents the amortization of restricted stockgrants to three executive officers of the Company.
Had the Company used the alternative fair value based accounting method for stock compensation expenseprescribed by SFAS Nos. 123 and 148, the Company’s net income and earnings per share for the past three yearswould have been reduced to the pro-forma amounts illustrated in the following table:
2004(As Restated,see Note 2)
2003(As Restated,see Note 2)
2002(As Restated,see Note 2)
Net income – as reported $111,885 $105,108 $90,444Add: Total stock-based employee compensation
included in reported net income, net of related taxeffects 74 298 397
Deduct: Total stock-based compensation expensedetermined under fair-value based method for allawards, net of tax effects (10,900) (11,496) (12,709)
Pro forma, net income $101,059 $ 93,910 $ 78,132
Net income per share:Basic – as reported $2.29 $2.13 $1.67Basic – pro forma 2.07 1.91 1.44
Diluted – as reported 2.23 2.06 1.61Diluted – pro forma 2.01 1.84 1.39
Segment Reporting – The Company accounts for its segment in accordance with SFAS No. 131, “DisclosureAbout Segments of an Enterprise and Related Information.” SFAS No. 131 requires that a public company reportannual and interim financial and descriptive information about its reportable operating segments. Operating segments,as defined, are components of an enterprise about which separate financial information is available that is evaluatedregularly by the chief operating decision maker in deciding how to allocate resources and in assessing performance.SFAS No. 131 allows aggregation of similar operating segments into a single operating segment if the businesses are

considered similar under the criteria established by SFAS No. 131. Utilizing these criteria, the Company manages itsbusiness on the basis of one reportable operating segment (see Note 9).
Derivative instruments and hedging activities – The Company adopted SFAS No. 133, “Accounting forDerivative Instruments and Hedging Activities,” in 2000 and its subsequent amendments, SFAS Nos. 137, “Accountingfor Derivative Instruments and Hedging Activities – Deferral of the Effective Date of FASB Statement No. 133,” and138, “Accounting for Certain Derivative Instruments and Certain Hedging Activities, an Amendment of FASB StatementNo. 133,” in 2001 and SFAS No. 149, “Amendments of Statement 133 on Derivative Instruments and HedgingActivities,” in the fourth quarter of 2003. These statements specify how to report and display derivative instruments andhedging activities. The adoption of these statements did not have a material effect on the Company’s ConsolidatedFinancial Statements. During 2004, 2003 and 2002, the Company had no derivative financial instruments that requiredfair value accounting treatment.
The Company is exposed to market risk, such as changes in interest rates and commodity prices. To managethe volatility relating to these exposures, the Company nets the exposures on a consolidated basis to take advantage ofnatural offsets. For the residual portion, the Company may enter into various derivative financial instruments pursuantto the Company’s policies in areas such as counterparty exposure and hedging practices. The Company reviews thesederivative financial instruments on a specific exposure basis to support hedge accounting. The changes in fair value ofthese hedging instruments are offset in part or in whole by the corresponding changes in the fair value or cash flows ofthe underlying exposures being hedged. The Company does not hold or use derivative financial instruments for tradingpurposes. The Company’s historical practice has been not to enter into derivative financial instruments.
The Company’s policy has been to manage interest cost using a mix of fixed and variable rate debt (seeNotes 5, 10 and 12).
Many of the food products purchased by the Company are affected by commodity pricing and are, therefore,subject to price volatility caused by weather, production problems, delivery difficulties and other factors which areoutside the control of the Company and generally are unpredictable. Changes in commodity prices would affect theCompany and its competitors generally and, depending on terms and duration of supply contracts, sometimessimultaneously. In many cases, the Company believes it will be able to pass through some or much of increasedcommodity costs by adjusting its menu pricing. From time to time, competitive circumstances or judgments aboutconsumer acceptance of price increases may limit menu price flexibility, and in those circumstances, increases incommodity prices can result in lower margins for the Company as occurred in 2004. Some of the Company’s purchasecontracts are used to hedge commodity prices and may contain features that could be classified as derivative financialinstruments under SFAS Nos. 133, 137, 138 and 149. However, these features that could be classified as derivativefinancial instruments are exempt from fair value accounting based on the normal purchases exemption.
Use of estimates - Management of the Company has made certain estimates and assumptions relating to thereporting of assets and liabilities and the disclosure of contingent liabilities at the date of the Consolidated FinancialStatements and the reported amounts of revenues and expenses during the reporting periods to prepare theseConsolidated Financial Statements in conformity with GAAP. Management believes that such estimates have beenbased on reasonable and supportable assumptions and that the resulting estimates are reasonable for use in thepreparation of the Consolidated Financial Statements. Actual results, however, could differ from those estimates.
Reclassifications - Certain reclassifications have been made in the 2002 and 2003 financial statements toconform to the classifications used in 2004. The balance sheet at August 1, 2003 and the cash flow statement for2003 and 2002 reflect certain reclassifications that increased receivables and decreased prepaid expenses.
4. INVENTORIES Inventories were composed of the following at:
July 30,2004
August 1,2003
Retail $104,148 $101,955Restaurant 19,800 17,091Supplies 17,872 16,974Total $141,820 $136,020
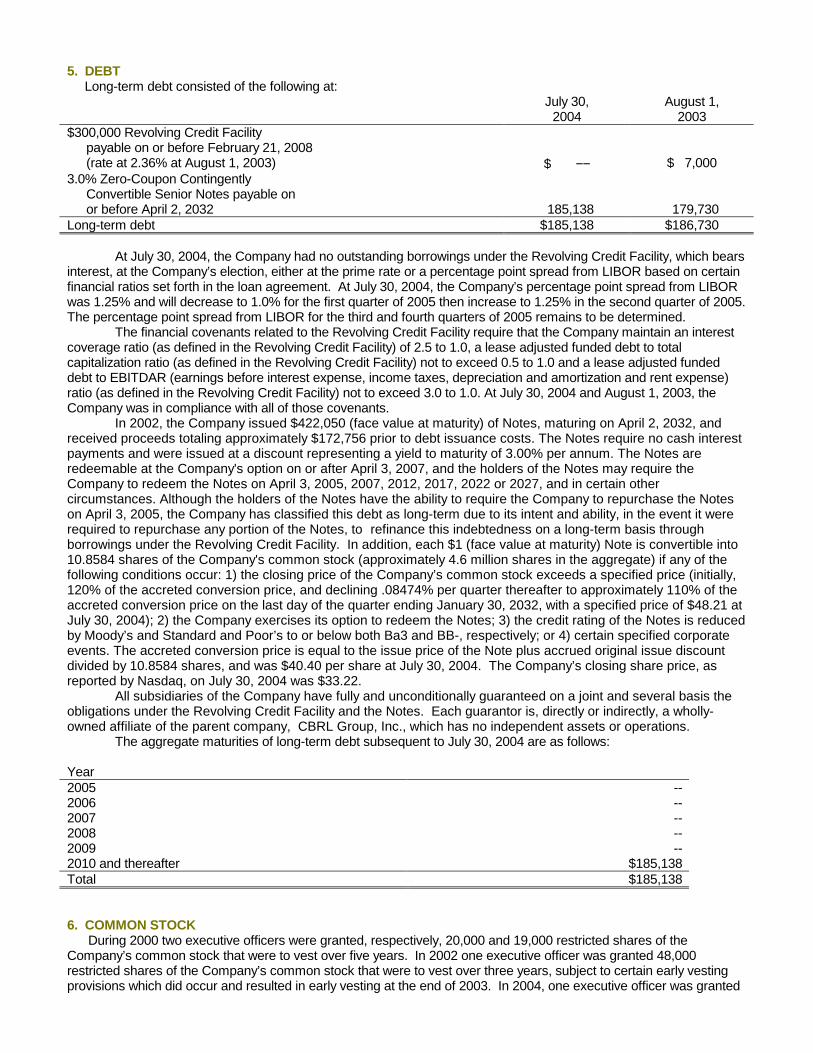
5. DEBT Long-term debt consisted of the following at:
July 30,2004
August 1,2003
$300,000 Revolving Credit Facilitypayable on or before February 21, 2008(rate at 2.36% at August 1, 2003) $ −− $ 7,000
3.0% Zero-Coupon ContingentlyConvertible Senior Notes payable onor before April 2, 2032 185,138 179,730
Long-term debt $185,138 $186,730
At July 30, 2004, the Company had no outstanding borrowings under the Revolving Credit Facility, which bearsinterest, at the Company’s election, either at the prime rate or a percentage point spread from LIBOR based on certainfinancial ratios set forth in the loan agreement. At July 30, 2004, the Company’s percentage point spread from LIBORwas 1.25% and will decrease to 1.0% for the first quarter of 2005 then increase to 1.25% in the second quarter of 2005.The percentage point spread from LIBOR for the third and fourth quarters of 2005 remains to be determined.
The financial covenants related to the Revolving Credit Facility require that the Company maintain an interestcoverage ratio (as defined in the Revolving Credit Facility) of 2.5 to 1.0, a lease adjusted funded debt to totalcapitalization ratio (as defined in the Revolving Credit Facility) not to exceed 0.5 to 1.0 and a lease adjusted fundeddebt to EBITDAR (earnings before interest expense, income taxes, depreciation and amortization and rent expense)ratio (as defined in the Revolving Credit Facility) not to exceed 3.0 to 1.0. At July 30, 2004 and August 1, 2003, theCompany was in compliance with all of those covenants.
In 2002, the Company issued $422,050 (face value at maturity) of Notes, maturing on April 2, 2032, andreceived proceeds totaling approximately $172,756 prior to debt issuance costs. The Notes require no cash interestpayments and were issued at a discount representing a yield to maturity of 3.00% per annum. The Notes areredeemable at the Company's option on or after April 3, 2007, and the holders of the Notes may require theCompany to redeem the Notes on April 3, 2005, 2007, 2012, 2017, 2022 or 2027, and in certain othercircumstances. Although the holders of the Notes have the ability to require the Company to repurchase the Noteson April 3, 2005, the Company has classified this debt as long-term due to its intent and ability, in the event it wererequired to repurchase any portion of the Notes, to refinance this indebtedness on a long-term basis throughborrowings under the Revolving Credit Facility. In addition, each $1 (face value at maturity) Note is convertible into10.8584 shares of the Company's common stock (approximately 4.6 million shares in the aggregate) if any of thefollowing conditions occur: 1) the closing price of the Company’s common stock exceeds a specified price (initially,120% of the accreted conversion price, and declining .08474% per quarter thereafter to approximately 110% of theaccreted conversion price on the last day of the quarter ending January 30, 2032, with a specified price of $48.21 atJuly 30, 2004); 2) the Company exercises its option to redeem the Notes; 3) the credit rating of the Notes is reducedby Moody’s and Standard and Poor’s to or below both Ba3 and BB-, respectively; or 4) certain specified corporateevents. The accreted conversion price is equal to the issue price of the Note plus accrued original issue discountdivided by 10.8584 shares, and was $40.40 per share at July 30, 2004. The Company’s closing share price, asreported by Nasdaq, on July 30, 2004 was $33.22.
All subsidiaries of the Company have fully and unconditionally guaranteed on a joint and several basis theobligations under the Revolving Credit Facility and the Notes. Each guarantor is, directly or indirectly, a wholly-owned affiliate of the parent company, CBRL Group, Inc., which has no independent assets or operations.
The aggregate maturities of long-term debt subsequent to July 30, 2004 are as follows:
Year2005 --2006 --2007 --2008 --2009 --2010 and thereafter $185,138Total $185,138
6. COMMON STOCK During 2000 two executive officers were granted, respectively, 20,000 and 19,000 restricted shares of theCompany’s common stock that were to vest over five years. In 2002 one executive officer was granted 48,000restricted shares of the Company’s common stock that were to vest over three years, subject to certain early vestingprovisions which did occur and resulted in early vesting at the end of 2003. In 2004, one executive officer was granted

7,500 restricted shares which will vest one-third each year starting three years from the date of the grant. Theexecutive officer granted 19,000 restricted shares in 2000 left the company in 2003 and forfeited 9,500 restrictedshares. The Company's compensation expense, net of forfeitures, for these restricted shares was $116, $462 and$616 in 2004, 2003 and 2002, respectively.
7. STOCK COMPENSATION PLANSThe Company’s employee compensation plans are administered by the Compensation and Stock Option
Committee (the “Committee”) of the Board. The Committee is authorized to determine, at time periods within itsdiscretion and subject to the direction of the Board, which employees will be granted options and other awards, thenumber of shares covered by any awards granted, and within applicable limits, the terms and provisions relating tothe exercise of any awards.
On September 26, 2002, the Board approved the CBRL Group 2002 Omnibus Incentive Compensation Plan(“Omnibus Plan”) for all employees and non-employee directors of the Company. That Omnibus Plan wassubsequently approved by shareholders at the Company’s 2002 Annual Shareholders Meeting. The Omnibus Planallows the Committee to grant awards for an aggregate of 2,500,000 shares of the Company's common stock. TheOmnibus Plan authorizes the following types of awards to all eligible participants other than non-employee directors:stock options, stock appreciation rights, stock awards, performance shares, cash bonuses, qualified performance-based awards or any other type of award consistent with the Omnibus Plan’s purpose. Under the Omnibus Plan,non-employee directors are granted annually on the day of the Annual Shareholders Meeting an option to purchase5,000 shares of the Company’s common stock with an option price per share of at least 100% of the fair marketvalue of a share of the Company's common stock based on the closing price on the day preceding the day theoption is granted. Additionally, non-employee directors newly elected or appointed between the AnnualShareholders Meeting and July 31 of the next year receive an option to purchase 5,000 shares of the Company’scommon stock with an option price per share of at least 100% of the fair market value of a share of the Company'scommon stock based on the closing price on the day preceding the day the option is granted. Options granted todate under the Omnibus Plan become exercisable each year on a cumulative basis at a rate of 33% of the totalshares covered by the option beginning one year from the date of grant, expiring ten years from the date of grantand are non-transferable. At July 30, 2004, there were 2,108,515 shares of the Company’s common stock reservedfor issuance under the Omnibus Plan.
On May 25, 2000, the Board approved the CBRL Group, Inc. 2000 Non-Executive Stock Option Plan(“Employee Plan”) for employees who are not officers or directors of the Company. The Employee Plan allows theCommittee to grant options to purchase an aggregate of 4,750,000 shares of the Company’s common stock. Theoption price per share under the Employee Plan must be at least 100% of the fair market value of a share of theCompany’s common stock based on the closing price on the day preceding the day the option is granted. Optionsgranted to date under the Employee Plan become exercisable each year on a cumulative basis at a rate of 33% ofthe total shares covered by the option beginning one year from the date of grant, to expire ten years from the date ofgrant and are non-transferable. At July 30, 2004, there were 159,428 shares of the Company’s common stockreserved for issuance under the Employee Plan.
The Company also has an Amended and Restated Stock Option Plan (the “Plan”) that originally allowed theCommittee to grant options to purchase an aggregate of 17,525,702 shares of the Company’s common stock. AtJuly 30, 2004, there were 1,519,603 shares of the Company’s common stock reserved for issuance under the Plan.The option price per share under the Plan must be at least 100% of the fair market value of a share of theCompany’s common stock based on the closing price on the day preceding the day the option is granted. Optionsgranted to date under the Plan generally have been exercisable each year on a cumulative basis at a rate of 33% ofthe total number of shares covered by the option beginning one year from the date of grant, expire ten years fromthe date of grant and are non-transferable. Beginning in 2000, a long-term incentive award was granted to certainofficers, which included stock options. The options granted under this award would vest at the end of five yearsafter the grant (subject to earlier vesting upon accomplishments of specified Company performance goals) and arenon-transferable. As of August 1, 2003, options to purchase 261,826 shares of the Company’s common stockvested early and options to purchase 255,050 shares vested on July 30, 2004 under the long-term incentive award.The options have a six-month life following confirmation of vesting by the Committee.
In 1989, the Board adopted the Cracker Barrel Old Country Store, Inc. 1989 Stock Option Plan for Non-employee Directors (“Directors Plan”). The stock options were granted with an exercise price equal to the fairmarket value of the Company’s common stock as of the date of grant and expire one year from the retirement of thedirector from the Board. An aggregate of 1,518,750 shares of the Company’s common stock were authorized bythe Company’s shareholders under this plan. Due to the overall plan limit, no shares have been granted under thisplan since 1994.
A summary of the status of the Company’s stock option plans for 2004, 2003 and 2002, and changes duringthose years follows:

(Shares in thousands) 2004 2003 2002
Fixed Options Shares
Weighted-Average
Price Shares
Weighted-Average
Price Shares
Weighted-Average
Price
Outstanding at beginning of year 7,599 $20.73 9,504 $20.23 10,504 $19.77Granted 1,146 38.35 1,907 23.85 2,506 20.13Exercised (2,634) 19.68 (2,922) 20.90 (2,869) 18.67Forfeited or canceled (294) 23.76 (890) 21.54 (637) 19.33Outstanding at end of year 5,817 24.52 7,599 20.73 9,504 20.23Options exercisable at year-end 3,011 20.62 3,696 20.69 5,148 22.58Weighed-average fair value per share of
options granted during the year $14.14 $10.20 $ 9.46
The fair value of each option grant is estimated on the date of grant using the Black-Scholes option-pricingmodel with the following weighted-average assumptions used for grants in 2004, 2003 and 2002:
2004 2003 2002Dividend yield range 0.1% - 1.4% 0.1% 0.1%Expected volatility range 22 % - 42 % 41% - 45% 43%Risk-free interest rate range 1.3% - 4.0% 2.2% - 3.8% 4.0% - 4.9%Expected lives (in years) 1 - 8 5 - 8 6
Expected volatility has been measured based on an average of past daily fluctuations in the share price ofthe Company’s common stock.
The following table summarizes information about fixed stock options outstanding at July 30, 2004:
(Shares in thousands) Options Outstanding Options Exercisable
Range ofExercise Prices
NumberOutstandingat 7/30/04
Weighted-Average
RemainingContractual Life
Weighted-Average
Exercise Price
NumberExercisableat 7/30/04
Weighted-Average
Exercise Price$ 5.09 – 10.00 38 1.93 $7.63 38 $7.63$10.01 – 20.00 1,186 5.50 14.94 1,186 14.94$20.01 – 30.00 3,181 6.45 22.83 1,495 23.38$30.01 – 40.00 970 7.37 35.28 292 31.28$40.01 – 41.25 442 9.32 40.26 −− −−$ 5.09 – 41.25 5,817 5.89 24.52 3,011 20.62
The Company recognizes a tax deduction, subject to certain limitations imposed by the Internal RevenueCode, upon exercise of non-qualified stock options in an amount equal to the difference between the option priceand the fair market value of the common stock on the date the option is exercised. These tax benefits, whenrealized, are credited to additional paid-in capital.

8. INCOME TAXESDeferred income taxes reflect the net tax effects of temporary differences between the carrying amounts of
assets and liabilities for financial reporting purposes and the amounts used for income tax purposes.Significant components of the Company's net deferred tax liability consisted of the following at:
July 30,2004
August 1,2003
Deferred tax assets:Financial accruals without economic performance $24,818 $20,252Other 3,637 8,284
Deferred tax assets 28,455 28,536
Deferred tax liabilitiesExcess tax depreciation over book 89,627 72,846Other 23,324 25,802
Deferred tax liabilities 112,951 98,648Net deferred tax liability $ 84,496 $70,112
The Company provided no valuation allowance against deferred tax assets recorded as of July 30, 2004 andAugust 1, 2003, as the "more-likely-than-not" valuation method determined all deferred assets to be fully realizable infuture taxable periods.
The components of the provision for income taxes for each of the three years were as follows:
2004 2003 2002(As Restated,see Note 2)
(As Restated,see Note 2)
(As Restated,see Note 2)
Current:Federal $44,006 $17,214 $45,223State 4,273 1,483 3,029
Deferred 14,384 39,254 1,745Total income tax provision $62,663 $57,951 $49,997
A reconciliation of the provision for income taxes and the amount computed by multiplying the incomebefore the provision for income taxes by the U.S. federal statutory rate of 35% was as follows:
2004 2003 2002(As Restated,see Note 2)
(As Restated,see Note 2)
(As Restated,see Note 2)
Provision computed at federal statutoryincome tax rate $61,092 $57,071 $49,154
State and local income taxes, net of federalbenefit 5,578 4,399 4,622
Employer tax credits for FICA taxes paid onemployee tip income (4,781) (4,323) (3,875)
Other-net 774 804 96Total income tax provision $62,663 $57,951 $49,997
The Internal Revenue Service (“IRS”) has completed its examinations of the Company’s federal income taxreturns for 1997 through 2001. Additionally, the IRS has completed its examinations of the Company’s federalpayroll tax filings for the calendar years ended December 31, 1997 through December 31, 2001.
9. SEGMENT INFORMATIONCracker Barrel units represent a single, integrated operation with two related and substantially integrated
product lines. The operating expenses of the restaurant and retail product lines of a Cracker Barrel unit are shared andare indistinguishable in many respects. Likewise, Logan’s units are restaurant operations with investment criteria andeconomic and operating characteristics similar to those of Cracker Barrel. The chief operating decision makersregularly evaluate the Cracker Barrel and Logan’s restaurant and retail components in determining how to allocateresources and in assessing performance. Accordingly, the Company manages its business on the basis of onereportable operating segment. All of the Company’s operations are located within the United States. The followingdata are presented in accordance with SFAS No. 131 for all periods presented.

2004 2003 2002Net sales in Company-Owned stores:
Restaurant $1,892,487 $1,753,361 $1,645,696Retail 486,433 443,397 424,949
Total net sales 2,378,920 2,196,758 2,070,645Franchise fees and royalties 2,027 1,424 1,139
Total revenue $2,380,947 $2,198,182 $2,071,784
10. COMMITMENTS AND CONTINGENCIESOn September 8, 2004, Cracker Barrel agreed in principle to settle certain litigation alleging violations of the
Fair Labor Standards Act as well as allegations of discrimination in employment and public accommodations. Thetotal payment agreed by Cracker Barrel was $8,720 (including $3,500 accrued in 2001), in full satisfaction of allclaims, including attorneys’ fees and costs.
The Company and its subsidiaries are parties to other legal proceedings incidental to its business. In theopinion of management, based upon information currently available, the ultimate liability with respect to these otheractions will not materially affect the Company's Consolidated Financial Statements.
The Company makes trade commitments in the course of its normal operations. As of July 30, 2004 theCompany was contingently liable for approximately $7,497 under outstanding trade letters of credit issued inconnection with purchase commitments. These letters of credit have terms of three months or less and are used tocollateralize obligations to third parties for the purchase of a portion of the Company's imported retail inventories.Additionally, the Company was contingently liable pursuant to standby letters of credit as credit guarantees toinsurers. As of July 30, 2004, the Company had $17,830 of standby letters of credit related to workers'compensation and commercial general liability insurance. All standby letters of credit are renewable annually.
The Company is secondarily liable for lease payments under the terms of an operating lease that has beenassigned to a third party. The operating lease has a remaining life of approximately 9.2 years with annual leasepayments of $361. The Company's performance is required only if the assignee fails to perform the obligations aslessee. At this time, the Company has no reason to believe that the assignee will not perform and, therefore, noprovision has been made in the accompanying consolidated financial statements for amounts to be paid as a resultof non-performance by the assignee.
The Company also is secondarily liable for lease payments under the terms of another operating lease thathas been sublet to a third party more than one year ago. The operating lease has a remaining life of approximately12.2 years with annual lease payments of $96. The Company's performance is required only if the sublessee fails toperform the obligations as lessee. The Company has a liability of $447 in the accompanying consolidated financialstatements for estimated amounts to be paid in case of non-performance by the sublessee. The Company maintains insurance coverage for various aspects of its business and operations. The Company haselected, however, to retain all or a portion of losses that occur through the use of various deductibles, limits andretentions under its insurance programs. This situation may subject the Company to some future liability for which it isonly partially insured, or completely uninsured. The Company intends to mitigate any such future liability by continuingto exercise prudent business judgment in negotiating the terms and conditions of its contracts. See Note 3 for a furtherdiscussion of insurance and insurance reserves. As of July 30, 2004, the Company operated 141 Cracker Barrel stores and 51 Logan’s Roadhouse restaurants fromleased facilities and also leased certain land and advertising billboards (see Note 12). These leases have beenclassified as either capital or operating leases. The interest rates for capital leases vary from 5% to 17%. Amortizationof capital leases is included with depreciation expense. A majority of the Company's lease agreements provide forrenewal options and some of these options contain escalation clauses. Additionally, certain store leases provide forpercentage lease payments based upon sales volume in excess of specified minimum levels.
The following is a schedule by year of future minimum lease payments under capital leases, together with thepresent value of the minimum lease payments as of July 30, 2004:
Year2005 $ 2352006 2352007 1242008 432009 --Total minimum lease payments 637Less amount representing interest 81Present value of minimum lease payments 556Less current portion 189Long-term portion of capital lease obligations $ 367

For reporting purposes, the schedule of future minimum rental payments required under operating leases,excluding leases for advertising billboards, has been restated to conform the lease term to that used in the straight-linerent calculation as described in Note 2, and correct miscellaneous errors due to keying mistakes and summationerrors, omission of certain leases and miscalculation of certain lease terms.
The following is a schedule by year of the future minimum rental payments required under operating leases,excluding leases for advertising billboards, as of July 30, 2004. Included in the amounts below are optional renewalperiods associated with such leases that the Company is currently not legally obligated to exercise; however, it isreasonably assured that the Company will exercise these options.
YearBase term and
exercised options*Renewal periods
not yet exercised** Total(As Restated,see Note 2)
(As Restated,see Note 2)
(As Restated,see Note 2)
2005 $ 30,174 $ -- $ 30,1742006 29,741 206 29,9472007 29,577 357 29,9342008 29,578 612 30,1902009 29,490 886 30,376Later years 290,922 281,996 572,918Total $439,482 $284,057 $723,539*Includes base terms and certain optional renewal periods that have been exercised and are included in the lease termin accordance with SFAS No. 13 (see Note 2).**Includes certain optional renewal periods that have not yet been exercised, but are included in the lease term for thestraight-line rent calculation. Such optional renewal periods are included because it is reasonably assured by theCompany that it will exercise such renewal options (see Note 2).
The following is a schedule by year of the future minimum rental payments required under operating leases foradvertising billboards as of July 30, 2004:
Year2005 $20,2182006 13,6042007 5,5582008 109Total $39,489
Rent expense under operating leases, excluding leases for advertising billboards are recognized on astraight-line, or average, basis and include any pre-opening periods during construction for which the Company islegally obligated under the terms of the lease, and any optional renewal periods, for which at the inception of thelease, it is reasonably assured that the Company will exercise those renewal options. This lease period isconsistent with the period over which leasehold improvements are amortized. Rent Expense for each of the threeyears was:
Minimum Contingent Total(As Restated,see Note 2)
(As Restated,see Note 2)
(As Restated,see Note 2)
2004 $33,111 $852 $33,9632003 31,084 753 31,8372002 28,248 776 29,024
Rent expense under operating leases for billboards for each of the three years was:
Minimum Contingent Total2004 $23,042 -- $23,0422003 22,811 -- 22,8112002 21,442 -- 21,442

11. EMPLOYEE SAVINGS PLANS
The Company sponsors a qualified defined contribution retirement plan ("Plan I") covering salaried andhourly employees who have completed one year of service and have attained the age of twenty-one. Plan I allowseligible employees to defer receipt of up to 16% of their compensation, as defined in the plan.
The Company also sponsors a non-qualified defined contribution retirement plan ("Plan II") covering highlycompensated employees, as defined in the plan. Plan II allows eligible employees to defer receipt of up to 50% oftheir base compensation and 100% of their eligible bonuses, as defined in the plan. Contributions under both Plan Iand Plan II may be invested in various investment funds at the employee’s discretion. Such contributions, includingthe Company matching contribution described below, may not be invested in the Company’s common stock. TheCompany matches 25% of employee contributions for each participant in either Plan I or Plan II up to a total of 6%of the employee’s compensation. Employee contributions vest immediately while Company contributions vest 20%annually beginning on the participant's first anniversary of employment. In 2004, 2003, and 2002, the Companycontributed approximately $1,321, $1,524 and $1,609, respectively, under Plan I and approximately $345, $280 and$203, respectively, under Plan II. At the inception of Plan II, the Company established a Rabbi Trust to fund Plan IIobligations. The market value of the trust assets of $12,479 is included in other assets and the liability to Plan IIparticipants of $12,479 is included in other long-term obligations. Company contributions under Plan I and Plan IIare recorded as other store operating expenses.
12. SALE-LEASEBACK
On July 31, 2000, Cracker Barrel completed a sale-leaseback transaction involving 65 of its owned units.Under the transaction, the land, buildings and building improvements at the locations were sold for net considerationof $138,325 and were leased back for an initial term of 21 years. Equipment was not included. The leases includespecified renewal options for up to 20 additional years and have certain financial covenants related to fixed chargecoverage for the leased units. At July 30, 2004 and August 1, 2003, the Company was in compliance with all thosecovenants. Net rent expense during the initial term is $14,963 annually, and the assets sold and leased backpreviously had depreciation expense of approximately $2,707 annually. The gain on the sale is being amortizedover the initial lease term of 21 years.
13. QUARTERLY FINANCIAL DATA (UNAUDITED)
Quarterly financial data for 2004 and 2003 are summarized as follows:
1st Quarter(As Previously
Reported)Lease
Adjustment
1st Quarter(As Restated,see Note 2)
2004Total revenue $576,365 -- $576,365Gross profit 390,465 -- 390,465Income before income taxes 43,794 (481) 43,313Net income 28,160 (309) 27,851Net income per share – basic $0.59 (0.01) $0.58Net income per share - diluted $0.56 (0.01) $0.552003Total revenue $527,539 -- $527,539Gross profit 361,574 -- 361,574Income before income taxes 35,635 (638) 34,997Net income 22,985 (412) 22,573Net income per share – basic $0.46 (0.01) $0.45Net income per share - diluted $0.45 (0.01) $0.44
2nd Quarter(As Previously
Reported)Lease
Adjustment
2nd Quarter(As Restated,see Note 2)
2004Total revenue $612,801 -- $612,801Gross profit 399,274 -- 399,274Income before income taxes 45,381 (553) 44,828Net income 29,001 (353) 28,648Net income per share – basic $0.59 (0.01) $0.58Net income per share - diluted $0.57 (0.01) $0.56
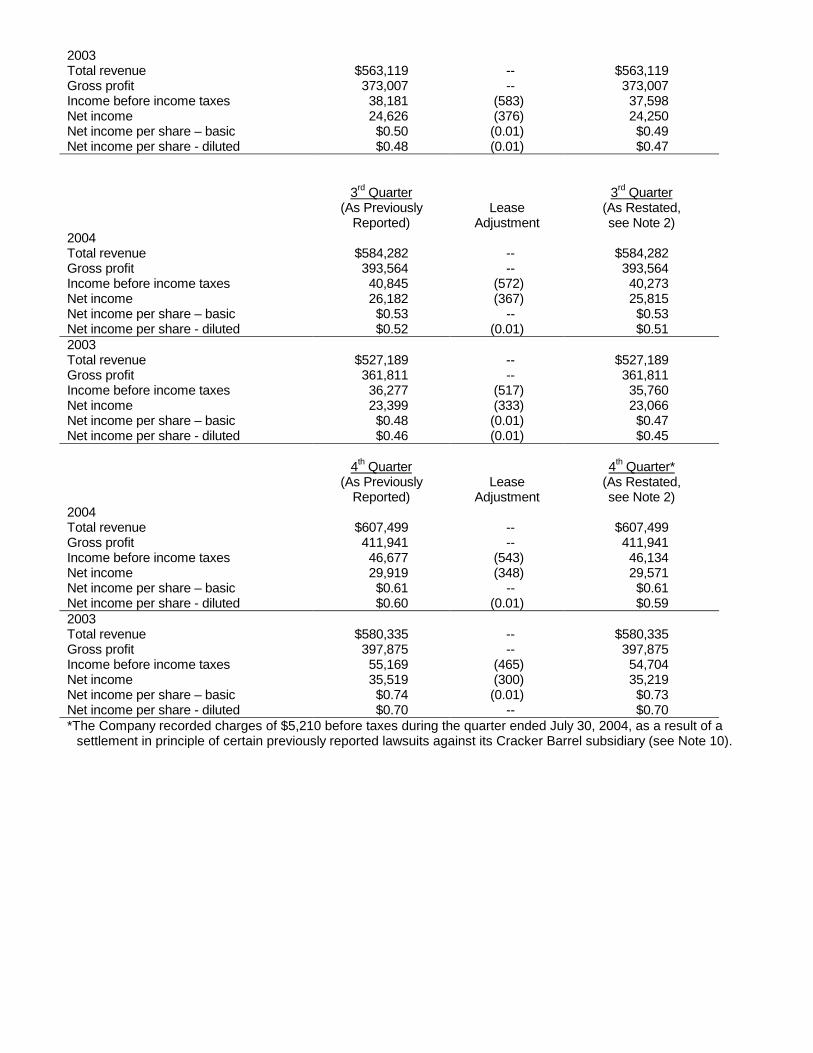
2003Total revenue $563,119 -- $563,119Gross profit 373,007 -- 373,007Income before income taxes 38,181 (583) 37,598Net income 24,626 (376) 24,250Net income per share – basic $0.50 (0.01) $0.49Net income per share - diluted $0.48 (0.01) $0.47
3rd Quarter(As Previously
Reported)Lease
Adjustment
3rd Quarter(As Restated,see Note 2)
2004Total revenue $584,282 -- $584,282Gross profit 393,564 -- 393,564Income before income taxes 40,845 (572) 40,273Net income 26,182 (367) 25,815Net income per share – basic $0.53 -- $0.53Net income per share - diluted $0.52 (0.01) $0.512003Total revenue $527,189 -- $527,189Gross profit 361,811 -- 361,811Income before income taxes 36,277 (517) 35,760Net income 23,399 (333) 23,066Net income per share – basic $0.48 (0.01) $0.47Net income per share - diluted $0.46 (0.01) $0.45
4th Quarter(As Previously
Reported)Lease
Adjustment
4th Quarter*(As Restated,see Note 2)
2004Total revenue $607,499 -- $607,499Gross profit 411,941 -- 411,941Income before income taxes 46,677 (543) 46,134Net income 29,919 (348) 29,571Net income per share – basic $0.61 -- $0.61Net income per share - diluted $0.60 (0.01) $0.592003Total revenue $580,335 -- $580,335Gross profit 397,875 -- 397,875Income before income taxes 55,169 (465) 54,704Net income 35,519 (300) 35,219Net income per share – basic $0.74 (0.01) $0.73Net income per share - diluted $0.70 -- $0.70*The Company recorded charges of $5,210 before taxes during the quarter ended July 30, 2004, as a result of a
settlement in principle of certain previously reported lawsuits against its Cracker Barrel subsidiary (see Note 10).

CBRL GROUP, INC.Report of Independent Registered Public Accounting Firm
To the Board of Directors and Shareholders of CBRL Group, Inc.:
We have audited the accompanying consolidated balance sheets of CBRL Group, Inc. and subsidiaries (the“Company”) as of July 30, 2004 and August 1, 2003, and the related consolidated statements of income, changes inshareholders’ equity, and cash flows for each of the three fiscal years in the period ended July 30, 2004. Thesefinancial statements are the responsibility of the Company’s management. Our responsibility is to express anopinion on these financial statements based on our audits.
We conducted our audits in accordance with standards of the Public Company Accounting Oversight Board (UnitedStates). Those standards require that we plan and perform the audit to obtain reasonable assurance about whetherthe financial statements are free of material misstatement. An audit includes examining, on a test basis, evidencesupporting the amounts and disclosures in the financial statements. An audit also includes assessing theaccounting principles used and significant estimates made by management, as well as evaluating the overallfinancial statement presentation. We believe that our audits provide a reasonable basis for our opinion.
In our opinion, such consolidated financial statements present fairly, in all material respects, the financial position ofthe Company at July 30, 2004 and August 1, 2003, and the results of its operations and its cash flows for each ofthe three fiscal years in the period ended July 30, 2004, in conformity with accounting principles generally acceptedin the United States of America.
As discussed in Note 2, the accompanying consolidated financial statements have been restated.
Nashville, TennesseeSeptember 23, 2004 (March 30, 2005 as to theeffects of the restatement discussed in Note 2)

CORPORATE OFFICES
CBRL Group, Inc.P.O. Box 787305 Hartmann DriveLebanon, Tennessee 37088-0787Phone 615-443-9869cbrlgroup.com
TRANSFER AGENT
SunTrust BankCorporate Trust Department58 Edgewood AvenueAtlanta, Georgia 30303Phone 800-568-3476
INDEPENDENT REGISTERED PUBLIC ACCOUNTING FIRM
Deloitte & Touche LLP, Nashville, Tennessee
GENERAL COUNSEL
James F. Blackstock, Senior Vice President, GeneralCounsel and Secretary, Corporate Offices
10-K REPORT
A copy of the CBRL Group, Inc. Form 10-K AnnualReport for Fiscal 2004 filed with the Securities andExchange Commission, may be obtained withoutcharge through our Internet website, located atcbrlgroup.com and (without exhibits) by writing to the Company, attention: Investor Relations.If requested in writing, exhibits to the Form 10-KAnnual Report are available for a reasonable fee.
ANNUAL MEETING
The annual meeting of shareholders will be held at10:00 a.m. Tuesday, November 23, 2004, at theCracker Barrel Old Country Store offices on HartmannDrive, Lebanon, Tennessee. There were 14,128shareholders of record as of September 24, 2004.
DIVIDEND REINVESTMENT AND STOCK PURCHASE PLAN
CBRL Group, Inc. offers shareholders a DividendReinvestment and Common Stock Purchase Plan. Ifyou would like to receive a Prospectus, EnrollmentCard and Cash Investment Transmittal Card describingthe various features of the Plan or if you have anyquestions regarding the Plan, please call SunTrustBank at 800-568-3476.
CBRL GROUP, INC .
Corporate Information

CBRL GROUP, INC .
Corporate Officers
CBRL GROUP, INC.
Dan W. EvinsChairman of the Board
Michael A. WoodhousePresident and Chief Executive Officer
James F. BlackstockSenior Vice President/General Counsel andSecretary
Norman J. HillSenior Vice President/Human Resources
Lawrence E. WhiteSenior Vice President/Finance and ChiefFinancial Officer
Bruce C. CottonVice President/Government Relations
Patrick A. ScruggsVice President/Accounting and Tax andChief Accounting Officer
CRACKER BARREL OLD COUNTRYSTORE, INC.
Donald M. TurnerPresident and Chief Operating Officer
David L. GilbertChief Administrative Officer
Cyril J. TaylorExecutive Vice President
Michael D. AdkinsDivisional Vice President/RestaurantOperations
Douglas E. BarberDivisional Vice President/RestaurantOperations
Terry A. MaxwellDivisional Vice President/Retail Operations
Brently G. BaxterVice President/Controller
P. Doug CouvillionVice President/Finance
Nelson P. GriffinVice President/Purchasing and Distribution
Mattie H. HankinsVice President/Financial Operations
Robert J. HarigSenior Vice President/Human Resources
Steve L. HeckleVice President/Risk Management
Debra K. KidwellVice President/Merchandising
Timothy W. MullenVice President/Information Services
Carol L. NormanVice President/General Merchandise Manager
Thomas R. PateVice President/Management Training andDevelopment
Mark W. TanzerVice President/Product Development
Christopher A. TomassoVice President/Marketing
Michael J. ZylstraVice President/General Counsel andSecretary
Charlie E. AustinRegional Vice President/RestaurantOperations
Lisa P. ChristmanRegional Vice President/Retail Operations
Kathleen A. DilleyRegional Vice President/RestaurantOperations
Alvin M. DozierRegional Vice President/RestaurantOperations
Nicholas V. FlanaganRegional Vice President/RestaurantOperations
Kristie S. FumagalliRegional Vice President/Retail Operations
Cecilia S. GibsonRegional Vice President/Retail Operations
Douglas R. GoolsbyRegional Vice President/RestaurantOperations
Anthony P. GuadagnoRegional Vice President/RestaurantOperations
Sandra K. HayesRegional Vice President/Retail Operations
Patricia LewisRegional Vice President/Retail Operations
H. Stacey MonteleoneRegional Vice President/Retail Operations
Laura E. MurchisonRegional Vice President/Retail Operations
Ron PhillipsRegional Vice President/RestaurantOperations
Beth J. QuinnRegional Vice President/Retail Operations
Michelle R. Scott-Ramirez Regional Vice President/Retail Operations
David R. SwartlingRegional Vice President/RestaurantOperations
Stanley T. WarnerRegional Vice President/RestaurantOperations
LOGAN’S ROADHOUSE, INC.
G. Thomas VogelPresident and Chief Operating Officer
John F. LushSenior Vice President/Operations
Amy L. BertauskiVice President/Controller
Jeffery S. CampbellVice President/Human Resources
Scott E. DeverVice President/Information Services
Robert R. EffnerVice President/Concept Development
James B. KuehnholdRegional Vice President/Operations
Paul S. PendletonRegional Vice President/Operations
Steven M. WilsonRegional Vice President/Operations
(a) Member of Executive Committee(b) Member of Audit Committee(c) Member of Compensation and Stock
Option Committee(d) Member of Nominating and Corporate
Governance Committee(e) Member of Public Responsibility
Committee
Directors
James D. Carreker(b)(c)
Chairman and Chief Executive Officer, The Bombay Company, Inc.(retail company)
Robert V. Dale, Retired(a)(b)(c)(d)
Dan W. Evins(a)(e)
Chairman of the Board, CBRL Group, Inc.
Robert C. Hilton(b)(d)
President, Autumn Capital (private investment firm)
Charles E. Jones, Jr.(a)(d)(e)
President, Corporate Communications,Incorporated (investor relations firm)
B.F. Lowery(a)(e)
Attorney at Law
Martha M. Mitchell (a)(d)(e)
Senior Partner, Fleishman-Hillard, Inc. (public relations firm)
Andrea M. Weiss(c)(e)
President and Chief Executive Officer, Retail Consulting, LLC
Jimmie D. White, Retired(b)(c)
Michael A. Woodhouse(a)
President and Chief Executive Officer, CBRL Group, Inc.
©2004 CBOCS Properties, Inc.


Warren Megan Damon Darlene John Negel Louise Nathan Richard Randy Travis Christopher James Cynthia Jeremy Charlene
Abigail Shamika Nicole Jeff Kristin Theresa Brittny Bonnie Shannon Brady Gigi Teresa Greg Jennifer James Amy Tracey Melissa
Sherry Warren Janiece Julie Amanullah Tommy Alison Keta Latoya Anne Marie Brandon Nicki Saneki Donald Jenelle Michael
Kelly Greg Mark Sheila David Paul Rhonda Pauline Kristen Robert Nicole Evelyn Stacy Frances Tabitha Susan Teresa Victor
Thomas Jason Valerie James Gregory Kristina Karen Micky Virginia Karen Terrence Greg Deborah Charles Chris Kimberlee
Misty Timothy Steven Eileen Garfield Carl Quiozell Mel Anthony Richard Princess Beverly Rebecca Nelson Tara Rip William
Sanford Joseph Nicole Jean Nicholas Brent Steven Garret Claire Nancy Jon Shane Jeffery Cathy Adam Tammie Lynette David
Lorraine Sharon Chris Penny Marianne Matthew Lisa Veronica Antoinette Melinda Genevieve Dennis Lonna Pamela Rex
Johnny Deborah Shawnee Donald Geri Pattie Jennifer Jeannie Donna Ernest Earl Kevin Anthony Don Mohammad Carol
Mona Robert Gary Jerry Kylene Sandra Kristin Tammy Edith Sid James Mickie Ella Wanda Bobbi Douglas Megan Shelia
Deborah Linda Janelle Nicole Zeb Gloria Jowaner Tresa Susan Sherry James Lindsey Harold Jacqueline Edward Patricia Ronald
Gary Joe Scott Virginia Teresa Melissa Karen Robert Earl Rozanne Jean Trisha Lisa Alixon Victor Brian Megan Christina Franco
Andy Christine Jermerne Nicolas Geoff Beth Steven Cindy Valerie Kevin Misty Michael Erin Amy Rachel Mary Marie Paul Richard
Shannon Tina Stacey Eunique Heather Stacy Beverly David Lance Bryan Keithan Bradley Jerri Jeffrey Gwendolyn James Angela
Tyronne Christine Jonathan Scott Melissa Daniel Dennis Al Candie Doug Jennifer Sherry Sarah Clay Jacqueline Tony Natasha
Tommy Robyn Jennifer Deirdre Nancy Barb Biran Linda Chris Amanda Susan Jessie Matt Michelle Barbara Serrina Janis Ronda
Wendy Danielle Nichole Josh Donna Kimberly Sharrae Aaron Edric Kendra Todd Lakeesha Faye Makia Lauren Sean Edna
Angela Debra Beth Noah Nancy Robert Susan Kayla Deanna Ciara Jenny Kalyn Dana Victoria
Denise Morgan Candis Edgar Janice Lindsay Yvetta Angel Brandon Omar Patrick Amanda
Jennifer Beka Lonnie Graclynn Melanie Buffie Tomeka Laura Will Rosa Marla Mary Ann Sandi
Daven Nathalia Gwyneth Kenny Deterria Brian Josh Jessica Julie Wendy Franco Tracy Jacqueline
Joe Christopher Crystal Terry Stanislav Melissa Bryan Willie Deborah Cortney Virginia Terry
Robin Robert Juliar Melissa Katrina Liz Leslie Jennifer Emanuel Glynda Gina Dustin Derek
Deborah Troy Craig Bernie Amanuallah Mary Angela Michelle Elizabeth Hollie Alex Yvonne Trudy Bobby Harold Dorothea
Cheri Steven Joe Darlette Holly Margaret Julian Jamie Grace Sarah Philip Todd Tiffany Misty Adela Amber Teresa Rachel
Eduardo Melody Robert Melody Jean Ashley George Nicholas Susan Anne Trevor Shannon Steve Carissa Leah Candice Rena
Opal Karolyn Jan Christina Elizabeth Constance Cesar Bruce Yvonne Veronica Daniel Constance Bruce Patricia Nichole
Matthew Diane James Yelena Olivia Nicole James Bill Gina Marie Esther Angel Nicholas Danyelle Erika Joan Jessica Connie
William Darren Samantha Melissa Jenne Joseph April Timothy Walter Thomas Theresa Tanya Jermaine Norma Michael Melissa
Lynn Carlos Robin Melissa Elizabeth Bonnie Jeana Anne Patricia Kristie Jannifer Arain Jessica Tonya Patsy Laura Kelley Jenell
Dolores Omar Nicole Joyce Cheryl Travis Jo Anda Nicolette Jeremy Jeff Valerie Melanie Joshua Craig Bernardo Vicente Patricia
Nathaniel Clay Heather Bernadette Mickey Thomas Darlene Nicolas Cheryl John Norma Jim Joy Roger Pedro Misty Joe
Chequita Rebecca Leeann Laura Benjamin Kerrie Kelli Jeffery Daymon Chris Dominique Jarod Zaria Charles Jason Joshua
Gordon Bessie Jackie Tracy Rodrick Matthew Danielle Kelly Olga Valerie Fuzell Monique Marilyn Jerry Carlos Cedric Brittany
Victor Susan Raquel Melba Lisa Laura Sarah Amber Kimberly Melinda Amanda Shellie Lindsay Frankie Cynthia Carlo Perry
Loretta Merissa Keisha Cindy Daniel Vera Vennessa Tony Jeff James Richard Joy Jillian Chica Tina Sarah Nicholas Kerry Kurt
Anita Troy Terry Robert Nancy Julia Jessica Frank Earl Anaiat Diantha Lori Chelsey Mildred John Craig Rhonda Scott Richard
Leslie Barbara Julie Eric Diane Dane Anita Catherine Meredith Roderick Denise Carol Tracie Kay Tony Tiffany Heather Eric
Stacie Marcus Kathleen John Nathan Rachel Phyllis Michelle Lauren Kellie Joni Amber Amanda Tabatha Kristina Joelle Jeff
Annie Christy Angela Lindsey Lauren Latasha Kristen Shannon Britney Stephanie Omar Joshua Noelle Sully Stephanie
Shannon Ricardo Matt Alisha Lindsey Eileen Kathryn Candee Byron Morgan Whitney Todd Tammy Kyla Joshua Christopher
Tiffani Leslie Dawn Charity Aurora Ralph Mary Ann Heather Robin Bonnie Karen Francesca Esau Patricia Sharon Lekeisha
Cami Eunique Donna Tammie Deanna Wavelene Randy Stephen Patrick Okie Margie Natlie Tony Danielle Vanessa Michelle
Kara Judy Jennifer Giselle Charlotte Stephen Shari Lindsey Linda Brandy Kacey Janson Chyla Shawna Rachel Janson Christina
Sherry Jessica Jason Steven Carol Lane Glen Adam Kathi Annie Barbara Greg Lynette Garret Gordon Sherry Winnie Rob
Nathalia Darrin Layne Theresa Betty Chrisandra Renitra Scarlett Mark Max Josephine Vicki Amanda Shellie Lisa Amy Nicole
Jennifer Lesley Dorothy Donald Denise Carol Gary Annie Veronica Angela Brady Stephanie Roxanna Rhonda Nick Wendy
Danny Don Leon Becky Mike Cheryl Linda Peggy Jeff Diane Suzanne Eric Georgetta Julie Sheree Gilbert Dewitt Sarah
Harold Lila Jimmie Judy Eric Charles Zeb Gerald Lindsea Evan Kathy Derrell Margareta Susan Juanita Nicki John David
Rochell Ronald Andy Rita Wanda Kathy Betty William Teresa Joyce Tony Martha Charlene Paul Brenda Diane George Ronnie
Donna Elizabeth Vernita Pearl Thomas Donna Sanford Michele Betty Sherry Heather Pamela Mark Terri Sarah Charles Bradley
Jerry Kevin Larry Janice Charles Roy James Mark Sara Jacquelyn Jim Mark Anna Terry Thomas Cheryl Aaron Shirley Mary
Kenneth Malinda Troy Bobby William Doris Linda Barb Charlene Patricia Edgar Tyronne Mark Marilyn Priscilla Al Carolyn
Matt Robert Mickey Janice Betty Sean Rosabelle Cy Thomas Brenda Kenard Juanita William ZelmaWendy Gerene Sharon
Glennia Helen Donald Zach Stella Phyllis Doris Mattie Cecilia Holly Lou Gail Evalena Chad Margaret Steven Patrice Mark Crystal
Jon Brian Jenny Andrea Adam Laura Mark Ben Cathy Bruce Charles Jodee Lindsay Michael Mervin Jessica Lisa Betsy David
Ruby Jacqueline Tammy Natasha Jason Shanta Sara Jack Terry Danny Dawn Laurie Christy Liz Tanya Charity Gail Brenda
Kayla Sherlanda Donna Gerry Daniel Loran Brandon Matthew William Stephen Noah James Michael Layne Casey James Ryan
Frank Diane Misty Gregory Ed Jeff Michael Joe Rosalind Andre Heidi Ashley Musfequs Danielle Robin Alejandro Michael
Linda Kim Kesha Guido Ed Dave Jerry Brandon Patricia Shawn Nicholas Crystal Christopher Aaron Emanuel Michelle Sara
Kyle Elizabeth Robert Rachel Angela Jeffrey Rex Susie Peter Ryan Gloria Linda Camille Tony Robert Audra Gregg Joel Robert
Sharon Joseph Ashleigh Craig Kelly Lori Stewart Katrina Julie Linda Princess Donna Sharon Tiffany Charlotte Kris Virginia Ann
Mary Jessica Daniel Brenda Leann Barbara Michael Ruth John Joseph Edward Erin Kari Carlene Sara Robert Philip Lonnie
Steven Bonnie Ed Brian Janet James William Joseph Beka Susan Phyllis Jennifer Michelle Linda Marla Ruby Dan Rochelle
Donna Mike Jamie Karen Anthony Dominique Colene Thomas Barbara Mary Eric James Scott
Cathy Dawn Michella Melanie Wealthie Jason Betty Jody Brenda Dylan Phil Catherine Stuart
Kelly Carl Marjie Mary Jill Charlie Tina Steve Dianna Jennifer Brenda Kenny Daniel William
Joseph Dan Randy Shirley Jason Jeffrey Trevor Christy Patricia Criado Emily Edward Jeremy
Brandi Grace Diana Jeannette Angela Jonathan Tonja Melissa Jeana Dawn Al Zandra Madelyn
Tina Christina Matthew Thomas Christi Casey Frank Vera Barbara Terry Karen Bobby Diane
Joshua Holly Maya Sandy George William Kevin Melissa Josh Necole Daniel Thomas Danette Leonard Leah James Karinn
Lindsey Rachel Karen Amanda Tiffany Mickey Recina Mark Andrea James Tom Dee Stella Steve Lekeisha Jose Timothy Garrett
Bonnie Richard Robert Lewis William Tiffany Ruth Crystal Kyle Sid Steve Lora Amanda Paula Scott Tammy Delores Jamie
Robert Lonnie Lynn Danny Iron Linda Onia Beverly Patricia Matthew Greg James Robert Debbie Jon Madena Dianne Nicole
Carolyn Joseph Michael Bill David Suzzanne Danna Christina William Franco Melanie Tony Trey Angela Todd Diane David
Ivory Phil Raymond Jeff Margo Mary Ralph Janelle Janet Chris Paul Fay Josh Sara Kerri Jennifer Jeannie Frank Larry Brandy
Paula Cynthia Paul Eugene Dawn Lucan Connie Ruby Tamara Crystal Billie Stacy Deborah Matthew Mark Shawna DeAnna
Ebony Shirley Vicki Dennis Leslie William Sylvia Sheryl Andrew Alan Adam Natalie Danielle Shaffiena David Larry Teresa
Bonnie James Michael James Shannon Jim Latoya Paula Charles Jackie Keysha Karyn Ansley Gary Nikki Edward Scott Joseph
Arain Norman Loran Laura Angela Lebardo Dionne Lesley Rebecca James Graylin Denise Colby Doug Albert Phillip Christi
Angeline Jack Penny Nicole Cheryl Marilyn Amy Charles Duane Carol Amber Michelle Lacy Sherry Valerie Michael Gary
Jill Lindsay Connie Doug Donald Mark Angela Eduardo Ryan Tiffany Edward Margaret Gary Carlos Susan William Mark
Minerva Autumn Chica Ginny Laura Richard Joseph Vernon Christine Frederick Bessie Wendy William Jacqueline Denise
Richard Nicole Crystal Paul Janet Zeffelin Jo Anne Sharon Wesley Frederick Amanda Mark Jeffrey Karen Suzanne Roseanna
Donald Brenda Jeffrey Nicole Carrie Janet Valerie Meredith Heather Stephanie David Shona Mark Jennifer William Joel Shelby
Norman Peggy Alice Ginger Morgan Jay David Josh Jeri Melissa Chase Aaron Tamaria Michael Douglas Nolan Brian Stephen
Valerie Della Melanie Jodee Brenda Tara Edie Stacy Tiere Melissa Janina Debbie Andrew Shanda Charlene Eugene Jamie Cami
Gena Darren Elisa Heather Michael Fred Julie Michael Jermaine Reginald James Robert Lori Michelle Pamela Brett James
Priscilla Charles Samantha Greg Valerie William Mona Alana Darla Sue Linda Darrin Chris Melba Cessna Chris Kelly Carl
Noelle Brian Mike Donna Gary Kelli Michelle Robin Tom Mike Dieter Amy Louise Janice Musfegus Lisa Markisa Courtney
Estella Emma Carrie Danielle Jackie Cory Chris Kevin Richard Delinda James Betty Teresa Doug Amber Jenell Anthony Brenda
Terresia Raymond Thomas Robert Peter Tamara Diantha Ruben Betty Michael Don Joy Kurt Pamela Christy Sarah Tiffany Glen
Robin Samuel Ricki Carl William Loran Jamie Marcia Josh Michael Loretta Alan Daniel Barbara Tamika Scott Cindy John Grace
Lisa Christi Alisha Rachel Jamie Timothy Barbie John William Heather Franco Marisa Ronald Dana Donna Brian Lori Matthew
CBR
LG
roup
, Inc.
2004 Annual Report
PO Box 787, Lebanon, TN 37088-0787
20
04
An
nu
al R
epo
rt