2004 Annual GOCC financial report
62
2004 Annual Financial Report Government-Owned and/or Controlled Corporations Volume II-A
-
Upload
r-seachon-lanete -
Category
Documents
-
view
225 -
download
4
description
GOCCFinancialAFRPCSO
Transcript of 2004 Annual GOCC financial report
2004
Annual Financial Report
Government-Owned and/or Controlled Corporations
Volume II-A

TABLE OF CONTENTS
Page
I INTRODUCTION 1
II FINANCIAL STATEMENTS Condensed Balance Sheet 2 Condensed Statement of Income and Expenses 3 Condensed Statement of Cash Flows 4
III NOTES TO FINANCIAL STATEMENTS 5
IV FINANCIAL HIGHLIGHTS AND ANALYSES Executive Summary 10 Balance Sheet Assets 13 Liabilities 22 Deferred Credits 28 Equity 28 Statement of Income and Expenses Income 33 Subsidy Income 36 Expenses 38 Share of the National Government on the Income of GOCCs 42 Provision for Income Tax 42 Statement of Cash Flows Operating Activities 43 Investing Activities 44 Financing Activities 45
V LIST OF ACRONYMS 47

Introduction
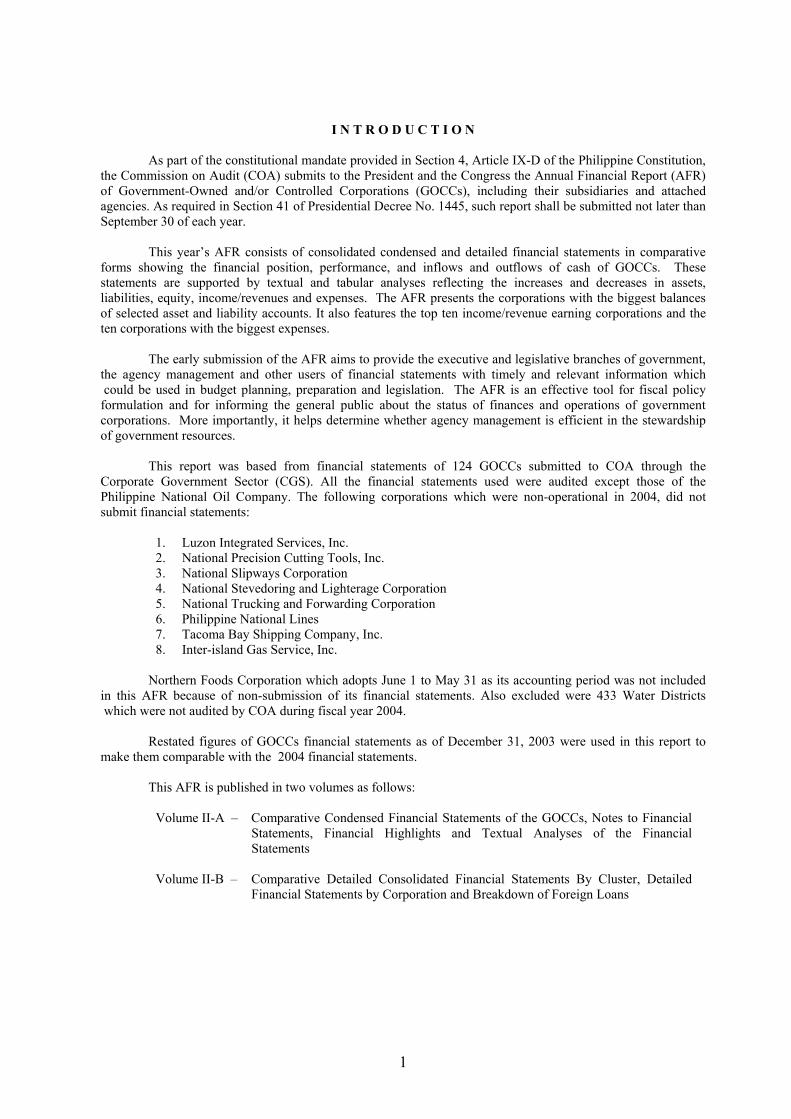
I N T R O D U C T I O N
As part of the constitutional mandate provided in Section 4, Article IX-D of the Philippine Constitution, the Commission on Audit (COA) submits to the President and the Congress the Annual Financial Report (AFR) of Government-Owned and/or Controlled Corporations (GOCCs), including their subsidiaries and attached agencies. As required in Section 41 of Presidential Decree No. 1445, such report shall be submitted not later than September 30 of each year. This year’s AFR consists of consolidated condensed and detailed financial statements in comparative forms showing the financial position, performance, and inflows and outflows of cash of GOCCs. These statements are supported by textual and tabular analyses reflecting the increases and decreases in assets, liabilities, equity, income/revenues and expenses. The AFR presents the corporations with the biggest balances of selected asset and liability accounts. It also features the top ten income/revenue earning corporations and the ten corporations with the biggest expenses. The early submission of the AFR aims to provide the executive and legislative branches of government, the agency management and other users of financial statements with timely and relevant information which could be used in budget planning, preparation and legislation. The AFR is an effective tool for fiscal policy formulation and for informing the general public about the status of finances and operations of government corporations. More importantly, it helps determine whether agency management is efficient in the stewardship of government resources. This report was based from financial statements of 124 GOCCs submitted to COA through the Corporate Government Sector (CGS). All the financial statements used were audited except those of the Philippine National Oil Company. The following corporations which were non-operational in 2004, did not submit financial statements:
1. Luzon Integrated Services, Inc. 2. National Precision Cutting Tools, Inc. 3. National Slipways Corporation 4. National Stevedoring and Lighterage Corporation 5. National Trucking and Forwarding Corporation 6. Philippine National Lines 7. Tacoma Bay Shipping Company, Inc. 8. Inter-island Gas Service, Inc.
Northern Foods Corporation which adopts June 1 to May 31 as its accounting period was not included in this AFR because of non-submission of its financial statements. Also excluded were 433 Water Districts which were not audited by COA during fiscal year 2004. Restated figures of GOCCs financial statements as of December 31, 2003 were used in this report to make them comparable with the 2004 financial statements. This AFR is published in two volumes as follows:
Volume II-A – Comparative Condensed Financial Statements of the GOCCs, Notes to Financial Statements, Financial Highlights and Textual Analyses of the Financial Statements
Volume II-B – Comparative Detailed Consolidated Financial Statements By Cluster, Detailed Financial Statements by Corporation and Breakdown of Foreign Loans
1
Financial Statements

2003As Restated Amount Percent
Current Assets 1,660,041,070.0 1,597,465,814.7 62,575,255.3 3.9
International Reserves (Note 2) 356,000,378.0 372,867,809.0 (16,867,431.0) (4.5) Cash and Cash Equivalents (Note 3) 575,272,940.1 851,045,471.8 (275,772,531.6) (32.4) Short-Term Investments 285,709,095.0 41,778,029.4 243,931,065.5 583.9 Receivables - Net (Note 1c) 368,595,731.3 260,561,897.4 108,033,833.9 41.5 Inventories - Net (Note 1d) 64,314,954.2 61,783,531.5 2,531,422.7 4.1 Other Current Assets 10,147,971.3 9,429,075.5 718,895.8 7.6
Other Assets 206,667,921.0 249,780,664.3 (43,112,743.3) (17.3)
Miscellaneous Assets and Deferred Charges 65,412,814.3 61,779,898.4 3,632,916.0 5.9 Other Assets 141,255,106.7 188,000,765.9 (46,745,659.2) (24.9)
Contingent Assets 8,569,629.9 8,554,007.5 15,622.4 0.2
Investments and Fixed Assets 2,630,752,655.0 2,643,430,064.8 (12,677,409.8) (0.5)
Investments - Net 1,327,986,264.6 1,295,709,623.5 32,276,641.2 2.5 Fixed Assets - Net (Note 4) 1,302,766,390.4 1,347,720,441.3 (44,954,051.0) (3.3)
TOTAL ASSETS 4,506,031,276.0 4,499,230,551.2 6,800,724.7 0.2
Current Liabilities 1,242,970,458.1 1,205,441,325.1 37,529,133.0 3.1
Payables 331,016,005.9 299,874,713.1 31,141,292.8 10.4 Trust Liablities (Note 5) 20,090,360.7 20,895,702.2 (805,341.5) (3.9) Depository Liabilities 537,763,466.2 558,383,759.2 (20,620,292.9) (3.7) Other Current Liabilities 354,100,625.3 326,287,150.7 27,813,474.7 8.5
Contingent Liabilities 1,083,567.9 1,102,979.6 (19,411.7) (1.8)
Other Liabilities 174,542,079.8 213,954,495.9 (39,412,416.1) (18.4)
Long Term Liabilities 2,279,523,469.4 2,472,022,121.0 (192,498,651.6) (7.8)
3,698,119,575.3 3,892,520,921.6 (194,401,346.3) (5.0)
Deferred Credits 58,561,114.0 76,881,149.3 (18,320,035.3) (23.8)
Capital 476,332,841.5 272,641,432.1 203,691,409.4 74.7
Paid-in Capital 386,123,244.7 374,576,938.0 11,546,306.6 3.1 Retained Earnings(Deficit) (Note 6) (619,201,559.3) (758,146,144.6) 138,944,585.3 (18.3) Restricted Capital 709,411,156.1 656,210,638.7 53,200,517.5 8.1
Surplus 273,017,745.1 257,187,048.2 15,830,696.9 6.2
Donated Surplus 20,834,187.0 20,153,475.1 680,711.8 3.4 Invested Surplus 27,722,571.4 27,781,071.0 (58,499.6) (0.2) Appraisal Surplus 217,753,320.6 202,350,486.8 15,402,833.8 7.6 Contingent Surplus 6,707,666.3 6,902,015.3 (194,349.0) (2.8)
749,350,586.7 529,828,480.3 219,522,106.4 41.4
4,506,031,276.0 4,499,230,551.2 6,800,724.7 0.2
Difference between totals and sum of components is due to rounding off
ASSETS
EQUITY
TOTAL EQUITY
TOTAL LIABILITIES AND EQUITY
LIABILITIES AND EQUITY
LIABILITIES
TOTAL LIABILITIES
Increase (Decrease)
Republic of the PhilippinesGovernment Owned and/or Controlled Corporations
Condensed Balance SheetDecember 31, 2004
( in thousand pesos )
Particulars 2004
2

2003Restated Amount Percent
Income 559,632,333.5 491,612,261.9 68,020,071.7 13.8 Operating and Service Income (Note 7) 482,526,119.7 418,841,179.4 63,684,940.3 15.2 Non-Operating Income (Note 8) 77,106,213.9 72,771,082.5 4,335,131.4 6.0
Less: Share of the National Government (Note 9) 9,810,414.5 8,481,102.7 1,329,311.8 15.7 Income After Share of National Government 549,821,919.0 483,131,159.2 66,690,759.9 13.8
Expenses 532,489,420.9 559,797,647.3 (27,308,226.4) (4.9) Personal Services 44,675,821.7 43,191,533.3 1,484,288.4 3.4 Maintenance and Other Operating Expenses 486,945,270.4 515,885,531.0 (28,940,260.6) (5.6) Capital Expenditures (Note 10) 868,328.9 720,582.9 147,745.9 20.5
Net Income(Loss) Before Subsidy 17,332,498.1 (76,666,488.1) 93,998,986.2 (122.6) Add: Subsidy from National Government (Note 11a) 9,976,699.6 13,023,665.5 (3,046,965.9) (23.4) Subsidy from LGUs (Note 11b) 473,302.5 220,205.6 253,097.0 114.9 Subsidy from GOCCs (Note 11c) 1,111,935.3 93,912.5 1,018,022.7 1,084.0 Subsidy from Other Sources 7,042.7 7,958.1 (915.5) (11.5)
Net Income (Loss) Before Extraordinary Loss 28,901,478.2 (63,320,746.4) 92,222,224.5 (145.6) Less: Loss from Reclassification of Investments from
Investment in Associates to InvestmentAvailable for Sale Securities 7,519,938.0 (7,519,938.0) (100.0)
Net Income (Loss) Before Income Tax 28,901,478.2 (70,840,684.4) 99,742,162.5 (140.8) Less: Provision for Income Tax 3,953,578.6 3,692,202.8 261,375.9 7.1
NET INCOME (LOSS) AFTER TAX 24,947,899.5 (74,532,887.1) 99,480,786.7 (133.5)
Difference between totals and sum of components is due to rounding off
2004
Republic of the PhilippinesGovernment Owned and/or Controlled Corporations
Condensed Statement of Income and ExpensesFor the Year Ended December 31, 2004
(in thousand pesos)
Increase/(Decrease)Particulars
3

Amount Percent
Cash Flows from Operating Activities:Cash Inflows 447,739,689.6 313,170,344.3 134,569,345.4 43.0 Cash Outflows 381,188,902.9 267,109,733.1 114,079,169.8 42.7
Cash Provided by (Used in) Operating Activities 66,550,786.7 46,060,611.2 20,490,175.5 44.5
Cash Flows from Investing Activities:Cash Inflows 309,293,905.7 224,355,541.7 84,938,363.9 37.9 Cash Outlows 458,400,074.3 368,633,459.0 89,766,615.3 24.4
Cash Provided by (Used in) Investing Activities (149,106,168.7) (144,277,917.3) (4,828,251.4) 3.3
Cash Flows from Financing Activities:Cash Inflows 306,168,472.5 287,860,908.0 18,307,564.5 6.4 Cash Outflows 291,905,219.5 154,696,890.1 137,208,329.3 88.7
Cash Provided by (Used in) Financing Activities 14,263,253.0 133,164,017.9 (118,900,764.9) (89.3)
Effects of Exchange Rate Changes on Cash and Cash Equivalents 1,683,962.7 19,293,700.7 (17,609,737.9) (91.3)
Increase (Decrease) in Cash and Cash Equivalents (66,608,166.3) 54,240,412.4 (120,848,578.7) (222.8)
Add: Cash and Cash Equivalents, Beginning 641,816,885.5 634,246,584.6 7,570,300.8 1.2
Cash and Cash Equivalents at the End 575,208,719.2 688,486,997.0 (113,278,277.8) (16.5)
Difference between totals and sum of components is due to rounding off
Increase (Decrease)20032004
Republic of the Philippines
Comparative Condensed Statement of Cash FlowsFor the Year Ended December 31, 2004
(in thousand pesos)
Government Owned and/or Controlled Corporations
Particulars
4

Notes to Financial Statements

NOTES TO FINANCIAL STATEMENTS
1. Summary of Significant Accounting Policies
a. Basis for Consolidation
The Consolidated Financial Statements show the total account balances of the financial statements submitted within the cut-off date by 124 GOCCs through the Corporate Government Sector of the Commission on Audit as shown below.
Submitted
Cluster
Total No. of GOCCs by Cluster
Total
Parent
Attached Agency
Subsidiary
I Financial A 15 15 4 2 9 II Financial B 31* 23 12 11 III Public Utilities 450** 17 9 8 IV Industrial and Area
Development and Regulatory
26
26
16
10
V Agricultural, Trading and Promotional
27
26
17
9
VI Social, Cultural and Scientific
17
17
17
__
___
Total 566 124 75 2 47
* Includes 8 Subsidiaries which are no longer operational ** Includes 433 Water Districts the financial transactions of which for fiscal year 2004 have not yet been audited as of date
The consolidated figures in this report include unaudited financial statements of PNOC, the
parent corporation, as of June 30, 2005.
Of the 121 Statements of Cash Flows submitted, 90 GOCCs used the Direct Method, while 31 used the Indirect Method.
b. Basis of Accounting for Income and Expenses
Majority of the GOCCs use the accrual method of recognizing income and expenses. Cash
basis is used only when accrual method is impractical. Other GOCCs apply the modified accrual, modified cash and the percentage of completion method for income from sale of condominium units and contract job, respectively. Under this method, the BCDA’s gross profit on the sale of condominium units is recognized only after the related obligations of the Joint Venture Partners are fulfilled, while NIA Consult, Incorporated’s amount of revenue is related to the percentage of the total project work that was performed during the period.
c. Allowance for Doubtful Accounts
The Allowance for Doubtful Accounts is provided based either on the age of the accounts,
collection experience of the corporations, past and expected loss experience and identified doubtful accounts. The rates are dependent upon the approval of their respective Boards.
d. Inventories
Consistently, inventories are valued by corporations using the First-in First-out, specific identification, moving average, Last-in First-out and historical cost.
For PEA, completed buildings which are for sale and those under construction are stated at construction cost. Land shares from joint venture arrangements are recorded based on agreed upon values. Expenditures incurred for further development of buildings are added as part of the cost.
5

e. Fixed Assets
Majority of the fixed assets of government corporations are carried at cost less depreciation
in pursuance to IAS No. 16. The useful life and methods of depreciation and amortization are being reviewed periodically to ensure that the period and methods of depreciation are consistent with the expected pattern of economic benefits from items of fixed assets. Under the Public Utilities Cluster, utility plant of PNOC, NPC and the MWSS are carried in the books at appraised values except for additions during the year which are recorded at cost. These assets in the case of the NPC are revalued in consonance with loan covenants with creditor banks and in pursuance to said standard which permits revaluation of properties, plant and equipment. These assets are depreciated on a straight-line method over their estimated useful life.
IAS No. 17 on Leases, which prescribes the accounting policies and disclosures, is applied to
finance and operating lease transactions of government corporations. Leasehold improvements are amortized over the estimated useful life of the improvements or the term of the related lease, whichever is shorter.
In the case of the NPC, electric plants under lease are carried at the amount equivalent to the
computed capacity fees of Built-Operate-Transfer (BOT) Projects for the duration of the cooperation period.
Construction in Progress is stated at cost and is not depreciated until such time that the assets are completed/or put into operational condition.
f. Foreign Currency Translation/Conversion
IAS No. 21 on the effects of changes in foreign exchange rates is adopted. It provides that exchange differences should be recognized as gain or loss in the period in which they arise. Transactions in foreign currency are translated to Philippine Peso using exchange rates applying on the value/settlement date of the transaction. For reporting purposes, foreign currency-denominated accounts (monetary assets and liabilities) are translated/converted into Philippine Peso using the closing exchange rate per BSP at reporting date. Gain or Loss arising from foreign exchange is included in the computation of the annual profits and losses.
g. Financial Statements Presentation
In compliance with IAS No. 13, Retained Earnings and related accounts of fiscal year 2003 are restated for comparative presentation with those accounts in fiscal year 2004.
2. International Reserves
This account consists of international reserves of P356,000,378,000 as reported by the BSP and
the CB-BOL, lower by P16,867,431,000 or 4.5 percent compared to fiscal year 2003. The amount includes profits realized and losses sustained from the revaluation of assets and liabilities in gold of foreign currencies as a result of changes in gold value of the peso or of changes in parities/exchange rates of foreign currencies in peso. The components of the international reserves excluding the amount of P564,763,358,000 which was considered in this report as cash and cash equivalent for the cash flow is shown below.
Amount (in pesos) Particulars 2004 2003 a. BSP (net of cash and cash equivalent)
Gold in bullion vault P30,287,582,000.00 P11,797,812,000.00 Gold with Foreign financial Institutions 145,049,614,000.00 177,650,005,000.00 International Monetary Fund Special Drawing Rights
56,283,000.00
98,517,000.00
Investments 151,753,027,000.00 147,809,638,000.00 Accrued Interest Receivables 3,534,356,000.00 4,404,836,000.00
Sub-Total 330,680,862,000.00 341,760,808,000.00b. CB-BOL Revaluation 25,319,516,000.00 31,107,001,000.00
Total (Net) P356,000,378,000.00 P372,867,809,000.00
6
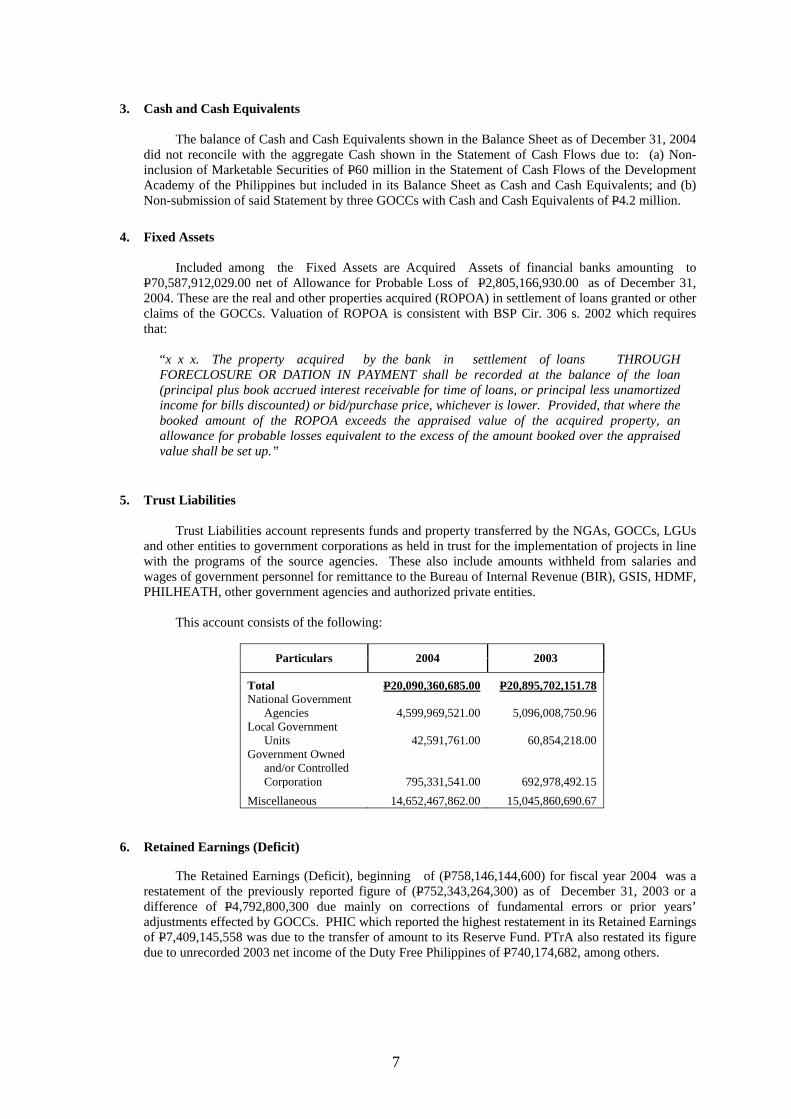
3. Cash and Cash Equivalents
The balance of Cash and Cash Equivalents shown in the Balance Sheet as of December 31, 2004
did not reconcile with the aggregate Cash shown in the Statement of Cash Flows due to: (a) Non-inclusion of Marketable Securities of P60 million in the Statement of Cash Flows of the Development Academy of the Philippines but included in its Balance Sheet as Cash and Cash Equivalents; and (b) Non-submission of said Statement by three GOCCs with Cash and Cash Equivalents of P4.2 million.
4. Fixed Assets
Included among the Fixed Assets are Acquired Assets of financial banks amounting to P70,587,912,029.00 net of Allowance for Probable Loss of P2,805,166,930.00 as of December 31, 2004. These are the real and other properties acquired (ROPOA) in settlement of loans granted or other claims of the GOCCs. Valuation of ROPOA is consistent with BSP Cir. 306 s. 2002 which requires that:
“x x x. The property acquired by the bank in settlement of loans THROUGH FORECLOSURE OR DATION IN PAYMENT shall be recorded at the balance of the loan (principal plus book accrued interest receivable for time of loans, or principal less unamortized income for bills discounted) or bid/purchase price, whichever is lower. Provided, that where the booked amount of the ROPOA exceeds the appraised value of the acquired property, an allowance for probable losses equivalent to the excess of the amount booked over the appraised value shall be set up.”
5. Trust Liabilities Trust Liabilities account represents funds and property transferred by the NGAs, GOCCs, LGUs
and other entities to government corporations as held in trust for the implementation of projects in line with the programs of the source agencies. These also include amounts withheld from salaries and wages of government personnel for remittance to the Bureau of Internal Revenue (BIR), GSIS, HDMF, PHILHEATH, other government agencies and authorized private entities.
This account consists of the following:
Particulars 2004 2003
Total P20,090,360,685.00 P20,895,702,151.78National Government
Agencies 4,599,969,521.00 5,096,008,750.96 Local Government
Units 42,591,761.00 60,854,218.00 Government Owned
and/or Controlled Corporation 795,331,541.00 692,978,492.15
Miscellaneous 14,652,467,862.00 15,045,860,690.67
6. Retained Earnings (Deficit)
The Retained Earnings (Deficit), beginning of (P758,146,144,600) for fiscal year 2004 was a restatement of the previously reported figure of (P752,343,264,300) as of December 31, 2003 or a difference of P4,792,800,300 due mainly on corrections of fundamental errors or prior years’ adjustments effected by GOCCs. PHIC which reported the highest restatement in its Retained Earnings of P7,409,145,558 was due to the transfer of amount to its Reserve Fund. PTrA also restated its figure due to unrecorded 2003 net income of the Duty Free Philippines of P740,174,682, among others.
7

7. Operating and Service Income
The top ten corporations with the biggest amount of Operating and Service Income whose
combined earnings constitute 84.6 percent of the aggregate income of 124 GOCCs are the following:
Corporation Amount 1. NPC P167,275,848,371.00 2. SSS 43,935,823,635.00 3. BSP 43,777,882,000.00 4. GSIS-SIF 41,175,336,624.00 5. PNOC 24,104,806,584.00 6. PAGCOR 20,905,026,874.00 7. LBP 20,785,064,000.00 8. NFA 20,014,010,000.00 9. PHIC 13,958,173,728.00 10. DBP 12,265,584,000.00
Total P 408,197,555,816.00
Members’ contribution to the SSS and GSIS-SIF amounting to P43,935,823,635.00 and P39,508,002,512.00 were recorded as their Operating and Service Income.
8. Non-Operating Income
The following shows the nature/details of Non-Operating Income:
Nature 2004 2003
Income from Public Enterprises/Investments P58,394,754,422.80 P56,149,040,220.72
Miscellaneous Income 17,590,377,450.95 14,989,243,354.42 Fines and Penalties on Non-Tax Revenue 418,107,180.97 462,771,019.19 Capital Revenue 685,924,876.00 1,169,083,524.54 Grants and Aids 17,049,923.00 944,347.00
Total P77,106,213,853.72 P72,771,082,465.87
9. Share of the National Government from Income of PAGCOR and MIAA
This account refers to the share in income given by PAGCOR and MIAA to the National Government in compliance with Presidential Decree No. 1869 dated July 11, 1983 for PAGCOR and Executive Order No. 298 dated July 26, 1987 for MIAA. Comparative data for this income are shown below.
Corporation 2004 2003
PAGCOR P9,196,915,489.00 P7,871,201,671.00 MIAA 613,499,000.00 609,901,000.00 Total P9,810,414,489.00 P8,481,102,671.00
10. Capital Expenditures
This account pertains to PAGCOR’s acquisition of Property, Plant and Equipment (PPE) under
the modified cash basis of accounting wherein capital expenditures in a given period are immediately expensed so that depreciation is no longer provided. The modified cash basis of accounting was adopted by PAGCOR due to its commitment to transfer its net income to the Social Fund under the Office of the President effective August 1, 1988.
8
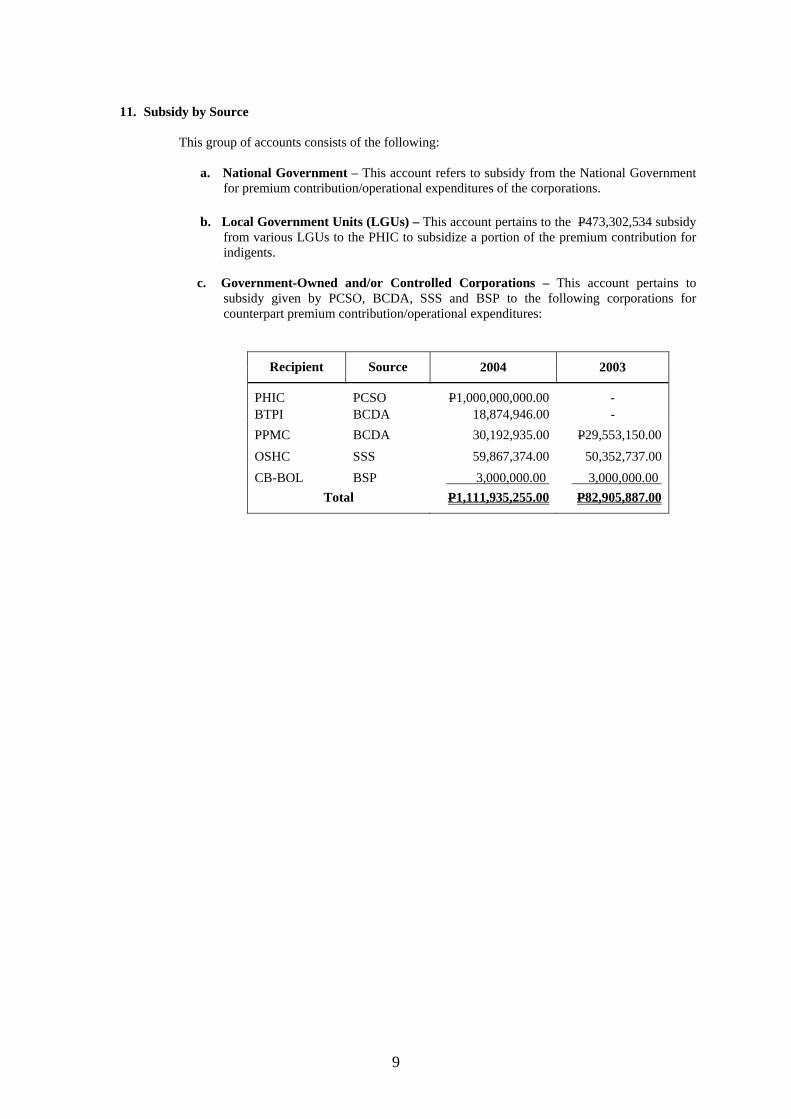
11. Subsidy by Source
This group of accounts consists of the following:
a. National Government – This account refers to subsidy from the National Government
for premium contribution/operational expenditures of the corporations.
b. Local Government Units (LGUs) – This account pertains to the P473,302,534 subsidy from various LGUs to the PHIC to subsidize a portion of the premium contribution for indigents.
c. Government-Owned and/or Controlled Corporations – This account pertains to
subsidy given by PCSO, BCDA, SSS and BSP to the following corporations for counterpart premium contribution/operational expenditures:
Recipient Source 2004 2003
PHIC PCSO P1,000,000,000.00 - BTPI BCDA 18,874,946.00 - PPMC BCDA 30,192,935.00 P29,553,150.00 OSHC SSS 59,867,374.00 50,352,737.00 CB-BOL BSP 3,000,000.00 3,000,000.00
Total P1,111,935,255.00 P82,905,887.00
9

Financial Highlights and Analyses

EXECUTIVE SUMMARY
1.0 BALANCE SHEET
1.1 Assets – P 4,506 billion
The Consolidated Balance Sheet of the government corporate sector reflected a total assets of P4,506 billion. This amount is higher by P6.8 billion or 0.2 percent than last year’s restated figure of P4,499.2 billion. Investments and Fixed Assets of P2,630.8 billion represents 58.4 percent of the total assets. Current Assets of P1,660 billion constitutes 36.8 percent while Other Assets of P206.7 billion and Contingent Assets of P8.6 billion share 4.6 percent and 0.2 percent, respectively.
1.2 Liabilities – P 3,698.1 billion
Total liabilities of P3,698.1 billion decreased by P194.4 billion or five percent from
previous year’s level of P3,892.5 billion, as restated. Liabilities consist of Long Term Liabilities – P2,279.5 billion or 61.6 percent, Current Liabilities – P1,243 billion or 33.6 percent, Other Liabilities – P174.5 billion or 4.7 percent and Contingent Liabilities – P1.1 billion or 0.02 percent.
1.3 Deferred Credits – P58.6 billion
Deferred Credits of P58.6 billion decreased by P18.3 billion or 23.8 percent. This account is composed of Deferred Credits – Miscellaneous of P35.9 billion or 61.4 percent, Deferred Credits to Income of P21.9 billion or 37.4 percent, and other components of P689.2 million or 1.2 percent.
1.4 Equity – P749.3 billion
Equity account totaled P749.3 billion. Net increase in Equity of P 203.7 resulted from increase in Paid-in Capital of P11.5 billion, increase in Restricted Capital of P53.2 billion and decrease in Deficit of P138.9 billion. Seventy nine corporations reported net income, while 44 incurred deficit.
On the aggregate, Surplus account also increased. Appraisal Surplus registered an
increment of P15.4 billion or 7.6 percent while Donated Surplus increased by P680.7 million or 3.4 percent. Contingent Surplus and Invested Surplus decreased by P194.3 million and P58.5 million, respectively.
2.0 STATEMENT OF INCOME AND EXPENSES
2.1 Income and Receipts
The Consolidated Statement of Income and Expenses showed a net income of P24.9 billion, or an increase of 133.4 percent compared to last year’s deficit of P74.5 billion, as restated.
Gross income totaled P559.6 billion, showing an increment of P68 billion or 13.8
percent over last year’s P491.6 billion, as restated. This consists of Operating and Service
10

Income – P482.5 billion or 86.2 percent and Non-Operating Income – P77.1 billion or 13.8 percent.
Income from Public Enterprises/Investments of P58.4 billion and Miscellaneous
Income of P17.6 billion are the two significant components of Non-Operating Income, representing 75.7 percent and 22.8 percent, respectively. Capital Revenue at a minimal figure of P685.9 million, posted a decline of 41.3 percent from last year’s restated figure of P1.2 billion. Grants and Aids amounted to P17 million, recording a P16.1 million growth from last year’s P0.9 million.
. Decrease in gross income of GOCCs by P9.8 billion resulted from remittance of the
National Government’s share from the operating income of PAGCOR and MIAA amounting to P9.2 billion and P6 million, respectively.
Subsidies to GOCCs amounting to P11.6 billion came from the following sources:
National Government – P10 billion, GOCCs – P1.1 billion, LGUs – P0.5 billion and other sources – P7 million. Thirty-three GOCCs benefited from these subsidies, 13 of which were spared from incurring overdraft in their operations and were even able to report net income because of the said subsidies. The following GOCCs were the recipients of substantial amounts of subsidies from the National Government: NFA – P4.8 billion, PHIC – P1.1 billion, NHA – P760.8 million, NHMFC – P680 million and NEA – P439.7 million.
2.2 Expenses and Provisions for Income Taxes
This year’s aggregate expenses of P532.5 billion decreased by P27.3 billion or 4.9 percent based on previous year’s restated amount of P559.8 billion. Personal Services amounted to P44.7 billion or 8.4 percent. Maintenance and Other Operating Expenses totaled P486.9 billion or 91.4 percent while Capital Expenditures amounted to only P868.3 million or 0.2 percent.
Thirty five corporations recorded a total of P4 billion provision for income taxes, higher
by P261.4 million or 7.1 percent than last year’s P3.7 billion, as restated. The combined provision for income taxes of PNOC and BSP of P2.6 billion accounted for 66 percent.
3.0 STATEMENT OF CASH FLOWS
The net effect of inflows and outflows of cash based on the Consolidated Statement of Cash Flows of GOCCs, inclusive of the effects of exchange rate changes, was a negative P66.6 billion for the three activities. Operating and Financing Activities had a positive net effect of P66.6 billion and P14.3 billion, respectively, while Investing Activities showed a negative P149.1 billion. The net effect of exchange rate changes amounted to P1.7 billion.
3.1 Cash Inflows
Cash inflows reflected in the Consolidated Statement totaled P1,063.2 billion, broken
down as follows: Operating – P447.7 billion, Investing – P309.3 billion, and Financing P306.2 billion.
11

3.2 Cash Outflows
Total cash outflows amounted to P1,131.5 billion, 40.5 percent or P458.4 billion of which resulted from Investing Activities, 33.7 percent or P381.2 billion from Operating Activities, and 25.8 percent or P291.9 billion from Financing Activities.
3.3 Cash and Cash Equivalents, End of Year
The accumulated Cash and Cash Equivalents totaled P575.2 billion. The largest amount of P482.5 billion belongs to Financial A Cluster. Figures pertaining to other Clusters in the order of the biggest to the lowest are as follows: Public Utilities – P35.6 billion; Financial B with P30.6 billion; Industrial and Area Development and Regulatory – P11.8 billion; Agricultural, Trading and Promotional and Social, Cultural and Scientific – P7.2 billion each.
12

BALANCE SHEET
1.0 ASSETS – P 4,506 billion
Cu
(in billion pesos)
The fiscal year 2004 Consolidated Balance Sheet of Government Owned and/or Controlled Corporations showed a total assets of P4,506 billion, total liabilities of P3,698.1 billion, a total
deferred credits of P58.6 billion and atotal equity of P749.3 billion. Compared with the restated figures of fiscal year 2003 Consolidated Balance Sheet, Assets and Equity accounts showed increases of P6.8 billion and P219.5 billion, respectively. Liability and Deferred Credits accountsreflected decreases of P194.4 billion and P18.3 billion, respectively. Chart 1 shows the comparative components of the Balance Sheet for fiscal years 2004 and 2003.
Total Assets of the 124 GOCCs reached P4,506 billion at the end of December 31, 2004. Investments and Fixed Assets aggregating P2,630.8 billion represents 58.4 percent of the total Assets.
4,506.0
3,698.1
58.6
749.3
4,499.2
3,892.5
76.9529.8
0
500
1,000
1,500
2,000
2,500
3,000
3,500
4,000
4,500
5,000
2004 2003Assets Liabilities Deferred Credits Equity
(in billion pesos)
1,328.0 29.5%
1,302.8 28.9%
1,660.0 36.8%
206.7 4.6%
249.85.6%
1,597.535.5%
1,347.730.0%
1,295.728.8%
rrent Assets Other Assets Investments Fixed Assets
2004 2003
Table 1. Top Ten GOCCs with the Biggest Amoun (in million pesos)
GOCCs Am unt o GOCCs 1. BSP 1,259,133.4 6. HDMF 2. NPC 1,055,551.9 7. DBP 3. GSIS 309,199.4 8. PNOC 4. LBP 287,698.7 9. PDIC 5. SSS 175,731.2 10. BCDA
1.1 Current Assets – P1,660 billion
Current Assets amounting to P1,660 billion increased b
higher than the 2003 level of P1,597.5 billion. It consists ofP575.3 billion, International Reserves – P356.0 billion, Shobillion, Receivables (net) – P368.6 billion, Inventories (neCurrent Assets – P10.1 billion.
13
The balance of P1,875.2 billion is shared by accounts Current Assets –P1,660 billion, 36.8 percent; Other Assets – P206.7 billion or 4.6 percent and Contingent Assets –P8.6 billion or 0.2 percent. Chart 2 shows the comparative components of the Assets. Table 1 below presents the top ten GOCCs which recorded the biggest amount of Assets.
Chart 1. Components of the Balance Sheet
Chart 2. Components of Assets
t of Assets
Amount 163,595.9 157,121.8 134,462.9 127,619.1
80,453.3
y P62.6 billion or 3.9 percent Cash and Cash Equivalents – rt-term Investments – P285.7 t) – P64.3 billion, and Other
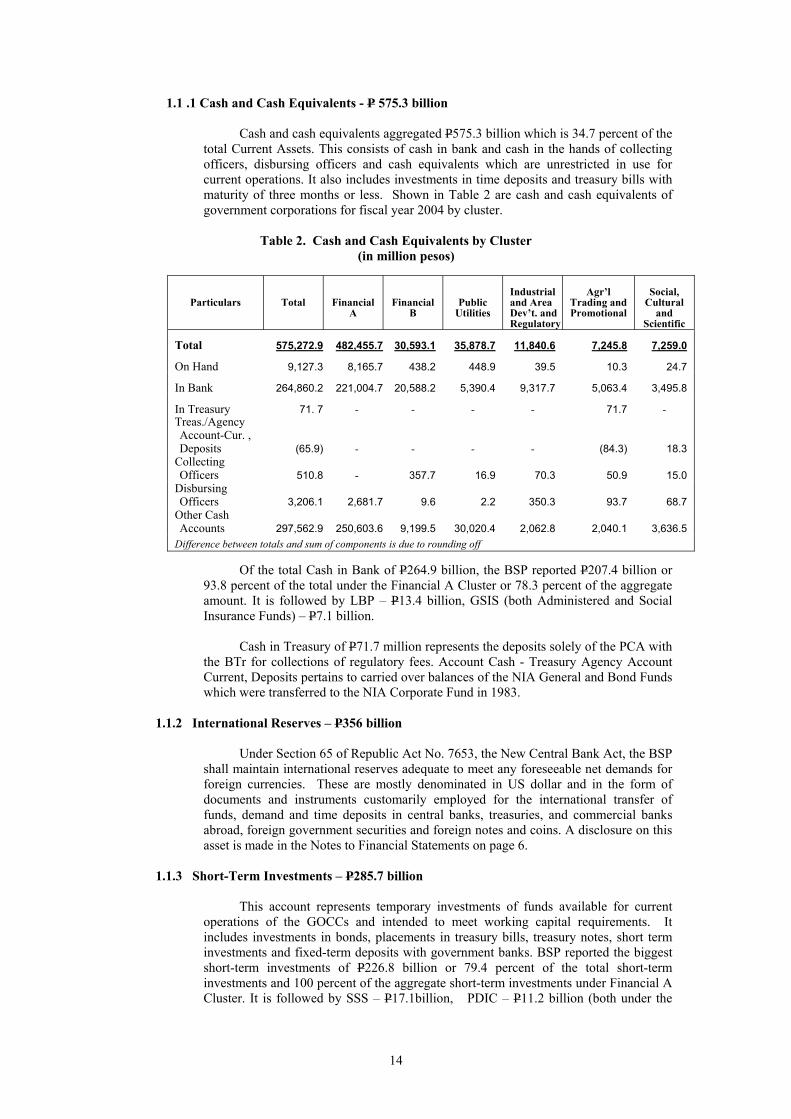
1.1 .1 Cash and Cash Equivalents - P 575.3 billion
Cash and cash equivalents aggregated P575.3 billion which is 34.7 percent of the total Current Assets. This consists of cash in bank and cash in the hands of collecting officers, disbursing officers and cash equivalents which are unrestricted in use for current operations. It also includes investments in time deposits and treasury bills with maturity of three months or less. Shown in Table 2 are cash and cash equivalents of government corporations for fiscal year 2004 by cluster.
Table 2. Cash and Cash Equivalents by Cluster
(in million pesos)
Particulars
Total
Financial A
Financial B
Public Utilities
Industrial and Area Dev’t. and Regulatory
Agr’l
Trading and Promotional
Social,
Cultural and
Scientific Total
575,272.9
482,455.7
30,593.1
35,878.7
11,840.6
7,245.8
7,259.0
On Hand
9,127.3
8,165.7
438.2
448.9
39.5
10.3
24.7
In Bank
264,860.2
221,004.7
20,588.2
5,390.4
9,317.7
5,063.4
3,495.8
In Treasury
71. 7
-
-
-
-
71.7
- Treas./Agency Account-Cur. , Deposits
(65.9)
-
-
-
-
(84.3)
18.3 Collecting Officers
510.8
-
357.7
16.9
70.3
50.9
15.0
Disbursing Officers
3,206.1
2,681.7
9.6
2.2
350.3
93.7
68.7
Other Cash Accounts 297,562.9 250,603.6 9,199.5 30,020.4 2,062.8 2,040.1 3,636.5
Difference between totals and sum of components is due to rounding off
Of the total Cash in Bank of P264.9 billion, the BSP reported P207.4 billion or 93.8 percent of the total under the Financial A Cluster or 78.3 percent of the aggregate amount. It is followed by LBP – P13.4 billion, GSIS (both Administered and Social Insurance Funds) – P7.1 billion.
Cash in Treasury of P71.7 million represents the deposits solely of the PCA with the BTr for collections of regulatory fees. Account Cash - Treasury Agency Account Current, Deposits pertains to carried over balances of the NIA General and Bond Funds which were transferred to the NIA Corporate Fund in 1983.
1.1.2 International Reserves – P356 billion
Under Section 65 of Republic Act No. 7653, the New Central Bank Act, the BSP shall maintain international reserves adequate to meet any foreseeable net demands for foreign currencies. These are mostly denominated in US dollar and in the form of documents and instruments customarily employed for the international transfer of funds, demand and time deposits in central banks, treasuries, and commercial banks abroad, foreign government securities and foreign notes and coins. A disclosure on this asset is made in the Notes to Financial Statements on page 6.
1.1.3 Short-Term Investments – P285.7 billion
This account represents temporary investments of funds available for current
operations of the GOCCs and intended to meet working capital requirements. It includes investments in bonds, placements in treasury bills, treasury notes, short term investments and fixed-term deposits with government banks. BSP reported the biggest short-term investments of P226.8 billion or 79.4 percent of the total short-term investments and 100 percent of the aggregate short-term investments under Financial A Cluster. It is followed by SSS – P17.1billion, PDIC – P11.2 billion (both under the
14

Financial B Cluster) and OWWA – P4.2 billion (Social, Cultural and Scientific Cluster).
1.1.4 Receivables (net) – P368.6 billion
Total Receivables accounted for 8.2 percent of the aggregate assets of
government corporations. From P260.6 billion in fiscal year 2003 an increase of P108 billion or 41.5 percent, net of Allowance for Doubtful Accounts of P20.3 billion was posted. The receivables represent 22.2 percent of the total current assets.
Table 3 presents the breakdown of receivables, by account and by cluster.
Table 3. Receivables by Cluster (in million pesos)
Particulars
Total
Financial
A
Financial
B
Public
Utilities
Industrial and Area Develop-ment
Agr’l, Trading
and Promotional
Social, Cultural,
and Scientific
Total 368,595.7 91,926.0 81,413.7 157,174.3 12,768.3 22,778.9 2,534.6 Accounts Receivable 170,195.2 25,688.2 12,655.1 131,108.9 177.7 124.2 441.1
Loans Receivable 27,563.2 3,556.0 17,717.0 1,670.3 468.7 4,131.6 19.6 Interest Receivable
18,213.8 7,440.7 5,765.7 4,746.0 46.1 33.1 182.2
Receivable-NGA 6,821.6 - 1,108.2 3,921.1 416.8 985.4 390.1 Receivable-LGU 64.2 - 4.6 - 42.4 1.0 16.2 Receivable-GOCCs 16,542.7 (0.1) 4,785.3 3,964.5 860.6 6,607.4 324.9
Advances to Officers/ Employees
174.1
0.1
6.2
66.9
32.0
12.3
56.7
Trade Business 28,778.0 25.4 445.7 13,932.2 5,609.5 7,812.5 952.7 Notes Receivable 3,157.9 1,370.2 1,430.4 - 16.7 186.0 154.6 Installment Receivable 3,230.0 2.9 213.3 - 815.2 2,198.6 -
Miscellaneous1 114,142.1 53,942.6 41,492.4 9,862.8 5,908.9 2,412.6 522.9 Allowance for Doubtful Accounts (20,287.2) (99.9) (4,210.3) (12,098.4) (1,626.3) (1,725.8) (526.5) Difference between totals and sum of components is due to rounding off 1 Includes account Claims Against GFIs and GSIS totaling P1.8 million
Corporations with the biggest recorded receivables are shown in Table 4.
Table 4. GOCCs with the Biggest Receivables
(in million pesos) GOCC Amount Nature
BSP 87,357.1 National Government’s share in the annual
revaluation of the IMF holdings of the Philippine peso with the BSP based on change in PHP/SDR exchange rate
GSIS 21,385.0 Contributions/Premium receivables
15

(Table 4, continued)
HDMF 40,564.9 Receivables from NG representing unpaid employer’s counterpart for PAG-IBIG contributions of government employees; advances to delinquent housing loan borrowers; loans extended to workers in government and public sectors
NPC 130,682.5 Receivables from customers for accrued utility revenue; tax credit certificates; receivables from fuel oil suppliers
PPC 1,791.2 Amounts due from foreign postal administrations and trade/business-postage charge account/lock box rental/bulk pre-sorted mails
DBP 3,408.5 Loans and placements granted to banks both foreign and domestic
NEA 1,682.6 Loans granted to electric cooperatives PHIC 2,387.9 Receivables from government agencies
representing unpaid employers’ contributions
1.1.5 Inventories – P64.3 billion
Ending Inventories of government corporations amounted to P64.3 billion, net of Allowance for Obsolescence amounting to P426 million. This account group is composed of the following: Items for Sale – P21.1 billion; Supplies and Materials – P19.6 billion; Raw Materials – P16.5 billion; Work-in-Process – P5.5 billion, and Other Inventories – P1.6 billion.
Corporations with significant amount balances for a specific inventory account
are shown in Table 5 below:
Table 5. GOCCs with Huge Amount of Inventories (in million pesos)
GOCC
Amount
Nature of Inventory
NPC P17,409.9 Supplies and Materials – Fuel and Non-fuel
BSP 16,453.2
Raw Materials – a) gold and silver for refining; b) materials for the printing of bank notes and other security documents such as checks, passports, land titles, BIR stamps; and c) materials and supplies for the production of circulation coins as well as special coinage and medals
3,295.8
Work-in-Process – held for printing and minting
NHA 7,870.1 Items for Sale – land and housing units
PRA (formerly PEA)
6,580.3 Items for Sale – reclaimed lands at the Central Business Park representing PRA’s in the Joint Venture Agreement with Shoemart, Inc.; reclaimed lands at the Seaside Channel and condominium units at the Coastal Plaza Condominium Project
NFA 5,338.7 Items for Sale – Palay, grain and non-grain
16
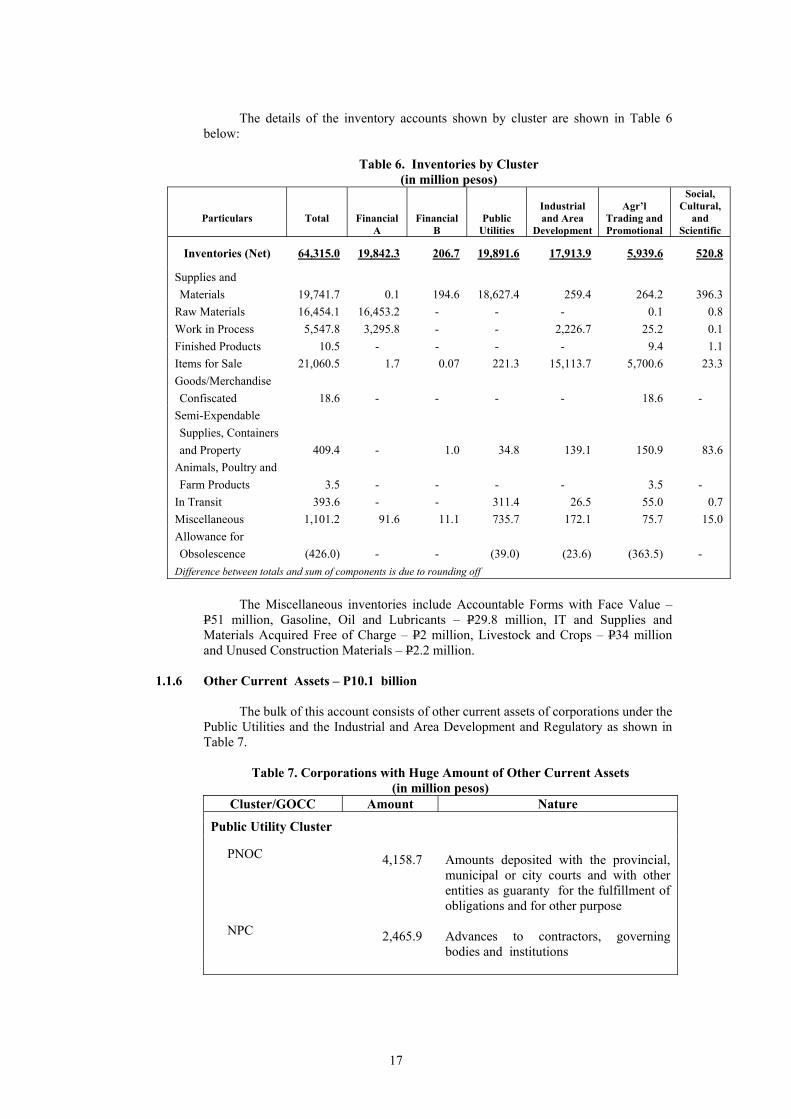
The details of the inventory accounts shown by cluster are shown in Table 6
below:
Table 6. Inventories by Cluster (in million pesos)
Particulars
Total
Financial
A
Financial
B Public
Utilities
Industrial and Area
Development
Agr’l Trading and Promotional
Social, Cultural,
and Scientific
Inventories (Net) 64,315.0 19,842.3 206.7 19,891.6 17,913.9 5,939.6 520.8
Supplies and Materials 19,741.7 0.1 194.6 18,627.4 259.4 264.2 396.3
Raw Materials 16,454.1 16,453.2 - - - 0.1 0.8 Work in Process 5,547.8 3,295.8 - - 2,226.7 25.2 0.1 Finished Products 10.5 - - - - 9.4 1.1 Items for Sale 21,060.5 1.7 0.07 221.3 15,113.7 5,700.6 23.3 Goods/Merchandise Confiscated 18.6 - - - - 18.6 -
Semi-Expendable Supplies, Containers and Property 409.4 - 1.0 34.8 139.1 150.9 83.6
Animals, Poultry and Farm Products 3.5 - - - - 3.5 -
In Transit 393.6 - - 311.4 26.5 55.0 0.7 Miscellaneous 1,101.2 91.6 11.1 735.7 172.1 75.7 15.0 Allowance for Obsolescence (426.0) - - (39.0) (23.6) (363.5) -
Difference between totals and sum of components is due to rounding off
The Miscellaneous inventories include Accountable Forms with Face Value –
P51 million, Gasoline, Oil and Lubricants – P29.8 million, IT and Supplies and Materials Acquired Free of Charge – P2 million, Livestock and Crops – P34 million and Unused Construction Materials – P2.2 million.
1.1.6 Other Current Assets – P10.1 billion
The bulk of this account consists of other current assets of corporations under the
Public Utilities and the Industrial and Area Development and Regulatory as shown in Table 7.
Table 7. Corporations with Huge Amount of Other Current Assets
(in million pesos) Cluster/GOCC Amount Nature
Public Utility Cluster PNOC
4,158.7
Amounts deposited with the provincial, municipal or city courts and with other entities as guaranty for the fulfillment of obligations and for other purpose
NPC
2,465.9
Advances to contractors, governing bodies and institutions
17
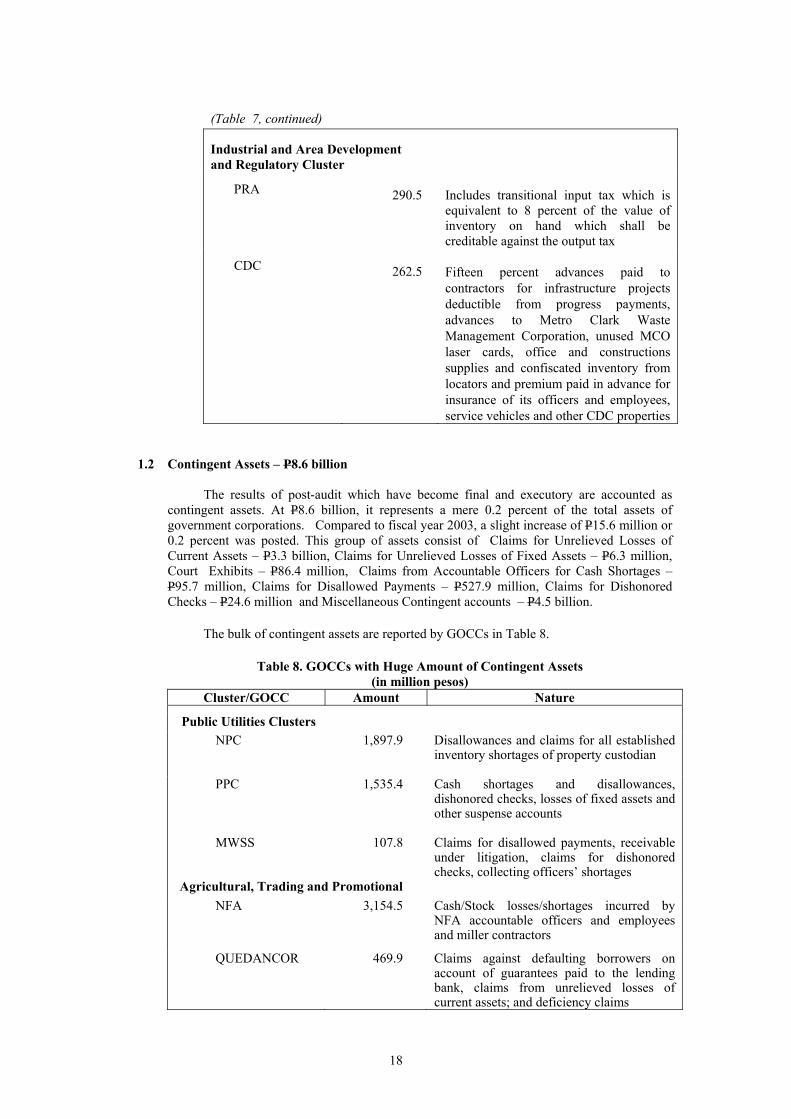
(Table 7, continued)
Industrial and Area Development and Regulatory Cluster
PRA
290.5
Includes transitional input tax which is equivalent to 8 percent of the value of inventory on hand which shall be creditable against the output tax
CDC
262.5
Fifteen percent advances paid to contractors for infrastructure projects deductible from progress payments, advances to Metro Clark Waste Management Corporation, unused MCO laser cards, office and constructions supplies and confiscated inventory from locators and premium paid in advance for insurance of its officers and employees, service vehicles and other CDC properties
1.2 Contingent Assets – P8.6 billion
The results of post-audit which have become final and executory are accounted as contingent assets. At P8.6 billion, it represents a mere 0.2 percent of the total assets of government corporations. Compared to fiscal year 2003, a slight increase of P15.6 million or 0.2 percent was posted. This group of assets consist of Claims for Unrelieved Losses of Current Assets – P3.3 billion, Claims for Unrelieved Losses of Fixed Assets – P6.3 million, Court Exhibits – P86.4 million, Claims from Accountable Officers for Cash Shortages – P95.7 million, Claims for Disallowed Payments – P527.9 million, Claims for Dishonored Checks – P24.6 million and Miscellaneous Contingent accounts – P4.5 billion.
The bulk of contingent assets are reported by GOCCs in Table 8.
Table 8. GOCCs with Huge Amount of Contingent Assets
(in million pesos) Cluster/GOCC Amount Nature
Public Utilities Clusters
NPC 1,897.9 Disallowances and claims for all established inventory shortages of property custodian
PPC
1,535.4
Cash shortages and disallowances, dishonored checks, losses of fixed assets and other suspense accounts
MWSS 107.8 Claims for disallowed payments, receivable under litigation, claims for dishonored checks, collecting officers’ shortages
Agricultural, Trading and Promotional NFA
3,154.5
Cash/Stock losses/shortages incurred by NFA accountable officers and employees and miller contractors
QUEDANCOR 469.9 Claims against defaulting borrowers on account of guarantees paid to the lending bank, claims from unrelieved losses of current assets; and deficiency claims
18

(Table 8, continued)
PTrA 156.1 Claims for disallowed payments and unrelieved losses of assets
PCA 137.4 Claims for disallowed payments made to various suppliers/creditors and officers and employees
Social, Cultural and Scientific TLRC
638.7
Claims for dishonored payments made, loans and accounts under litigation
1.3 Other Assets – P206.7 billion
This account consists of Miscellaneous Assets and Deferred Charges and Other Assets amounting to P206.7 billion. The components of Other Assets account are shown in Table 9.
Table 9. Components of Other Assets
(in million pesos)
Particulars
Total
Financial A
Financial B
Public Utilities
Industrial and Area Dev. and
Regulatory
Agr’l Trading
and Promotional
Social, Cultural
and Scientific
Total 206,667.9 19,045.9 37,898.5 120,590.0 22,914.3 4,098.3 2,120.9 Misc. Assets and Deferred Charges
65,412.8 4.2 3,100.8 50,385.7 10,409.1 485.4 1,027.6
Prepayments 8,912.3 2.4 7.5 1,670.9 7,113.9 109.6 7.9 Organization Costs 5,415.5 - 386.2 4,967.0 59.1 3.3 -
Guaranty Deposits 422.4 1.3 93.8 136.6 168.2 12.0 10.5
Marginal Deposits 43.5 - - 2.9 40.5 0.1 a
Deposit on Containers 9.8 - - - 7.3 2.4 0.1
Backpay Certificates of Indebtedness
a - - - - a -
Stocks and Securities of Service Enterprises
1,414.7 a 6.4 1.1 1,404.1 2.4 0.6
Miscellaneous 49,194.6 0.5 2,606.9 43,607.2 1,616.1 355.5 1,008.4
Other Assets 141,255.1 19,041.7 34,797.7 70,204.3 12,505.2 3,612.9 1,093.3 Difference between totals and sum of components is due to rounding off a – below P35 thousand
1.4 Investments and Fixed Assets – P2,630.8 billion
Investments and Fixed Assets valued at P2,630.8 billion is net of Allowance for Doubtful Accounts, Long-Term Investments – P33.8 billion and Allowance for Decline in Value of Investments – P5.4 billion and Accumulated Depreciation/Depletion – P432.2 billion.
19
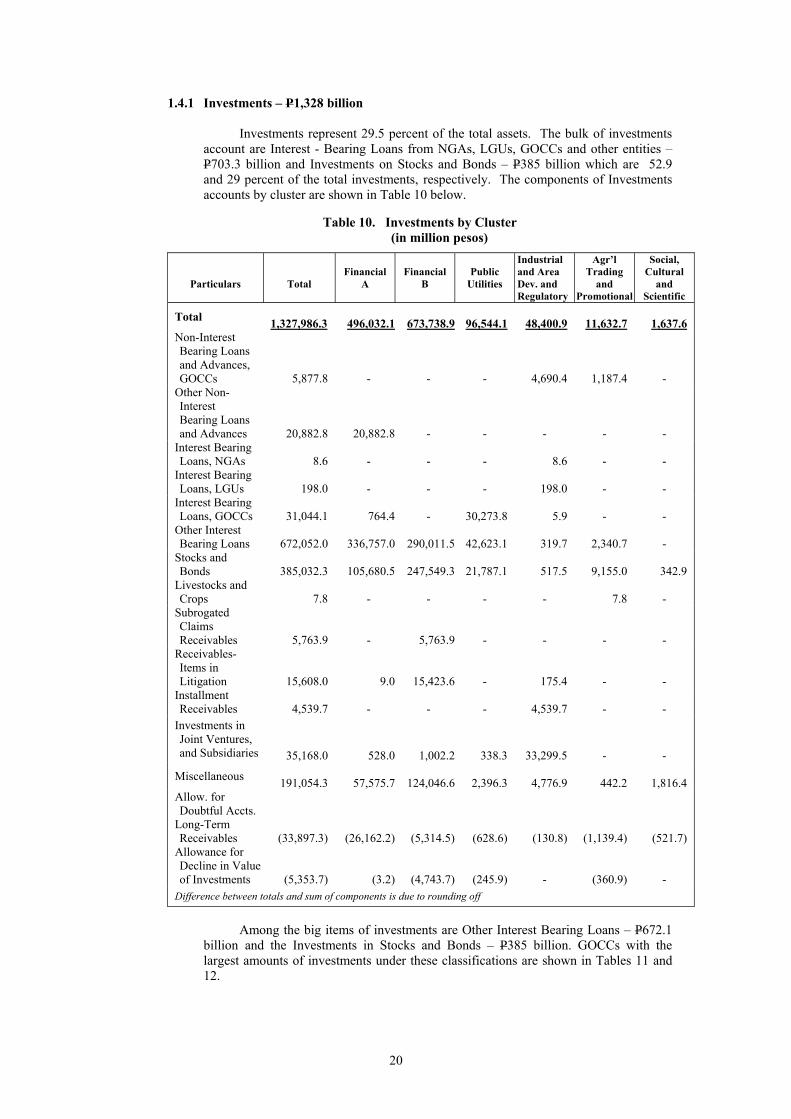
1.4.1 Investments – P1,328 billion
Investments represent 29.5 percent of the total assets. The bulk of investments account are Interest - Bearing Loans from NGAs, LGUs, GOCCs and other entities – P703.3 billion and Investments on Stocks and Bonds – P385 billion which are 52.9 and 29 percent of the total investments, respectively. The components of Investments accounts by cluster are shown in Table 10 below.
Table 10. Investments by Cluster (in million pesos)
Particulars
Total
Financial
A
Financial
B
Public
Utilities
Industrial and Area Dev. and Regulatory
Agr’l Trading
and Promotional
Social, Cultural
and Scientific
Total 1,327,986.3 496,032.1 673,738.9
96,544.1
48,400.9
11,632.7
1,637.6
Non-Interest Bearing Loans and Advances, GOCCs
5,877.8 - - -
4,690.4
1,187.4 -
Other Non-Interest Bearing Loans and Advances
20,882.8 20,882.8 - - - - -
Interest Bearing Loans, NGAs
8.6 - - - 8.6 - -
Interest Bearing Loans, LGUs
198.0 - - - 198.0 - -
Interest Bearing Loans, GOCCs
31,044.1 764.4 -
30,273.8 5.9 - -
Other Interest Bearing Loans
672,052.0 336,757.0 290,011.5
42,623.1 319.7
2,340.7 -
Stocks and Bonds
385,032.3 105,680.5 247,549.3
21,787.1 517.5
9,155.0
342.9
Livestocks and Crops
7.8 - - - -
7.8 -
Subrogated Claims Receivables
5,763.9 - 5,763.9 - - - -
Receivables-Items in Litigation
15,608.0 9.0 15,423.6 - 175.4 - -
Installment Receivables
4,539.7 - - - 4,539.7 - -
Investments in Joint Ventures, and Subsidiaries
35,168.0 528.0 1,002.2
338.3 33,299.5 - -
Miscellaneous 191,054.3 57,575.7 124,046.6
2,396.3
4,776.9
442.2
1,816.4
Allow. for Doubtful Accts.
Long-Term Receivables (33,897.3) (26,162.2) (5,314.5) (628.6) (130.8) (1,139.4) (521.7)
Allowance for Decline in Value of Investments (5,353.7) (3.2) (4,743.7) (245.9) - (360.9) -
Difference between totals and sum of components is due to rounding off
Among the big items of investments are Other Interest Bearing Loans – P672.1
billion and the Investments in Stocks and Bonds – P385 billion. GOCCs with the largest amounts of investments under these classifications are shown in Tables 11 and 12.
20

Table. 11 GOCCs with Other Interest Bearing Loans
(in million pesos) GOCC Amount Nature
LBP 151,299.3 Non-performing loans (including current
restructured loans) net of loans classified as loss which are fully covered by allowance for probable losses.
DBP 69,998.7 Consists of loans and discounts, underwritten debt securities purchased and bills purchased
BSP 109,373.5 Foreign currency loans and advances for special purpose and rediscounting; also local currency loans and advances to PDIC for re-lent ; financial assistance to distressed banks
GSIS-Social Insurance Fund
120,223.3
Various Loans granted to members of the GSIS
SSS 72,367.7 Loans to members and to other government agencies
Table. 12 GOCCs with Investments in Stocks and Bonds (in million pesos)
GOCC Amount Nature
LBP 80,594.2 Investments in bonds and other debt instruments
DBP 24,726.9 Investments in bonds and other debt instruments
GSIS Social Insurance Fund
109,029.0 Investments in subsidiaries – shares of stocks in which the GSIS holds at least 20% ownership interest or where it has the ability to exercise significant influence over the companies’ operating and financial affairs.
Investments in Commercial Papers and Government Securities
Investments in Traded Stocks – these are stocks for trading and available for sale
PHIC 35,132.4 Debenture bonds, MERALCO common stocks, Investment in PLDT stocks; Treasury Bonds with one year maturity
PDIC 35,073.4 Peso and dollar denominated Treasury Bonds and Preferred Stocks with PNB
HDMF 30,500.9 Treasury Bonds and Treasury Notes, Debenture Bonds
PSALM 19,851.9 On lending agreement –Tranches A and B with the NPC to cover its funding requirements for fiscal years 2002 and 2003
NFA 5,582.5 Zero Coupon bonds in DBP-EQPCIB, DBP-METRO BANK AND LBP, Investments in Stocks of the FTI
QUEDANCOR 2,943.5 Zero coupon issued by ROP with aggregate maturity of P5 billion for a term of 7 years to serve as security for a Syndicated Loan granted by the LBP/EPCIB
21
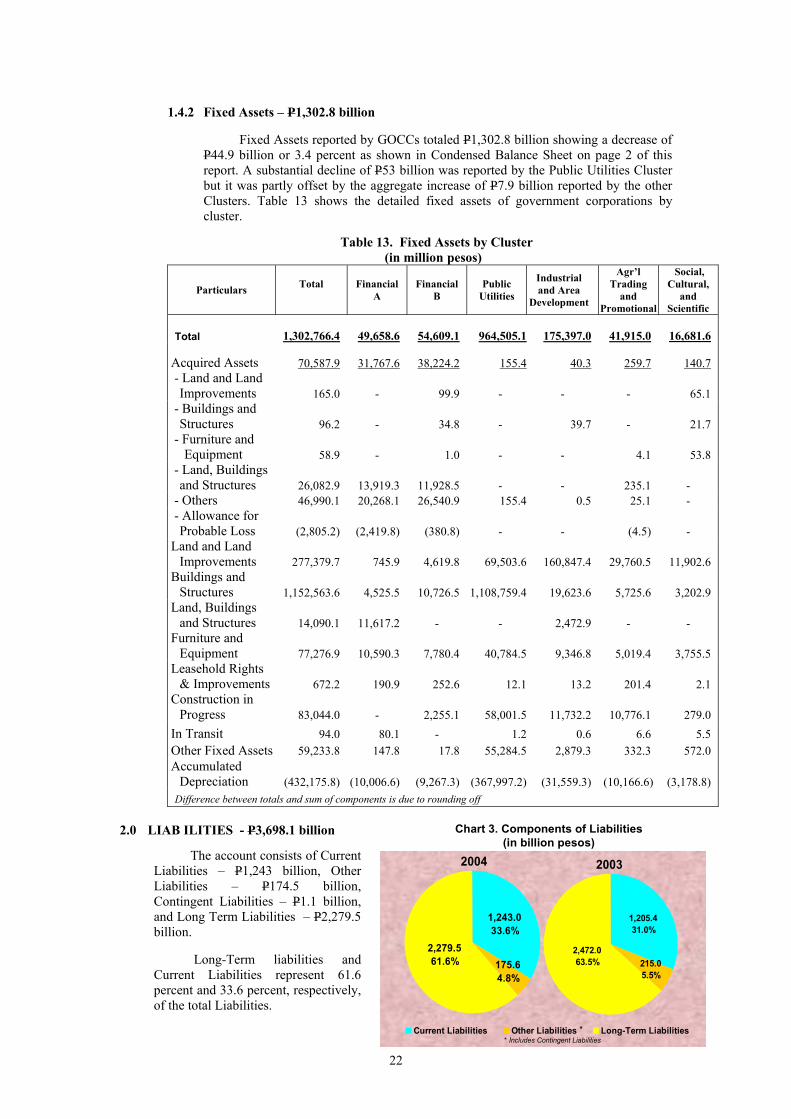
1.4.2 Fixed Assets – P1,302.8 billion
Fixed Assets reported by GOCCs totaled P1,302.8 billion showing a decrease of P44.9 billion or 3.4 percent as shown in Condensed Balance Sheet on page 2 of this report. A substantial decline of P53 billion was reported by the Public Utilities Cluster but it was partly offset by the aggregate increase of P7.9 billion reported by the other Clusters. Table 13 shows the detailed fixed assets of government corporations by cluster.
Table 13. Fixed Assets by Cluster
(in million pesos)
Particulars Total
Financial A
Financial B
Public Utilities
Industrial and Area
Development
Agr’l Trading
and Promotional
Social, Cultural,
and Scientific
Total 1,302,766.4 49,658.6 54,609.1 964,505.1 175,397.0 41,915.0
16,681.6
Acquired Assets
70,587.9
31,767.6
38,224.2 155.4
40.3
259.7
140.7 - Land and Land
Improvements 165.0 - 99.9 - - - 65.1 - Buildings and
Structures 96.2 - 34.8 - 39.7 - 21.7 - Furniture and Equipment 58.9 - 1.0 - - 4.1 53.8 - Land, Buildings
and Structures 26,082.9 13,919.3 11,928.5 - - 235.1 - - Others 46,990.1 20,268.1 26,540.9 155.4 0.5 25.1 - - Allowance for
Probable Loss (2,805.2) (2,419.8) (380.8) - - (4.5) - Land and Land
Improvements 277,379.7 745.9 4,619.8 69,503.6 160,847.4 29,760.5 11,902.6 Buildings and
Structures 1,152,563.6 4,525.5 10,726.5 1,108,759.4 19,623.6 5,725.6 3,202.9 Land, Buildings
and Structures 14,090.1 11,617.2 - - 2,472.9 - - Furniture and
Equipment 77,276.9 10,590.3 7,780.4 40,784.5 9,346.8 5,019.4 3,755.5 Leasehold Rights
& Improvements 672.2 190.9 252.6 12.1 13.2 201.4 2.1 Construction in
Progress 83,044.0 - 2,255.1 58,001.5 11,732.2 10,776.1 279.0 In Transit 94.0 80.1 - 1.2 0.6 6.6 5.5 Other Fixed Assets 59,233.8 147.8 17.8 55,284.5 2,879.3 332.3 572.0 Accumulated
Depreciation (432,175.8) (10,006.6) (9,267.3) (367,997.2) (31,559.3) (10,166.6) (3,178.8) Difference between totals and sum of components is due to rounding off
2.0 LIAB ILITIES - P3,698.1 billion
The account consists of Current Liabilities – P1,243 billion, Other Liabilities – P174.5 billion, Contingent Liabilities – P1.1 billion, and Long Term Liabilities – P2,279.5 billion. Long-Term liabilities and Current Liabilities represent 61.6 percent and 33.6 percent, respectively, of the total Liabilities.
Chart 3. Components of Liabilities
(in billion pesos)2004 2003
1,243.0 33.6%
2,279.5 61.6% 175.6
4.8%
2,472.063.5%
1,205.431.0%
215.05.5%
Current Liabilities Other Liabilities Long-Term Liabilities** Includes Contingent Liabilities
22
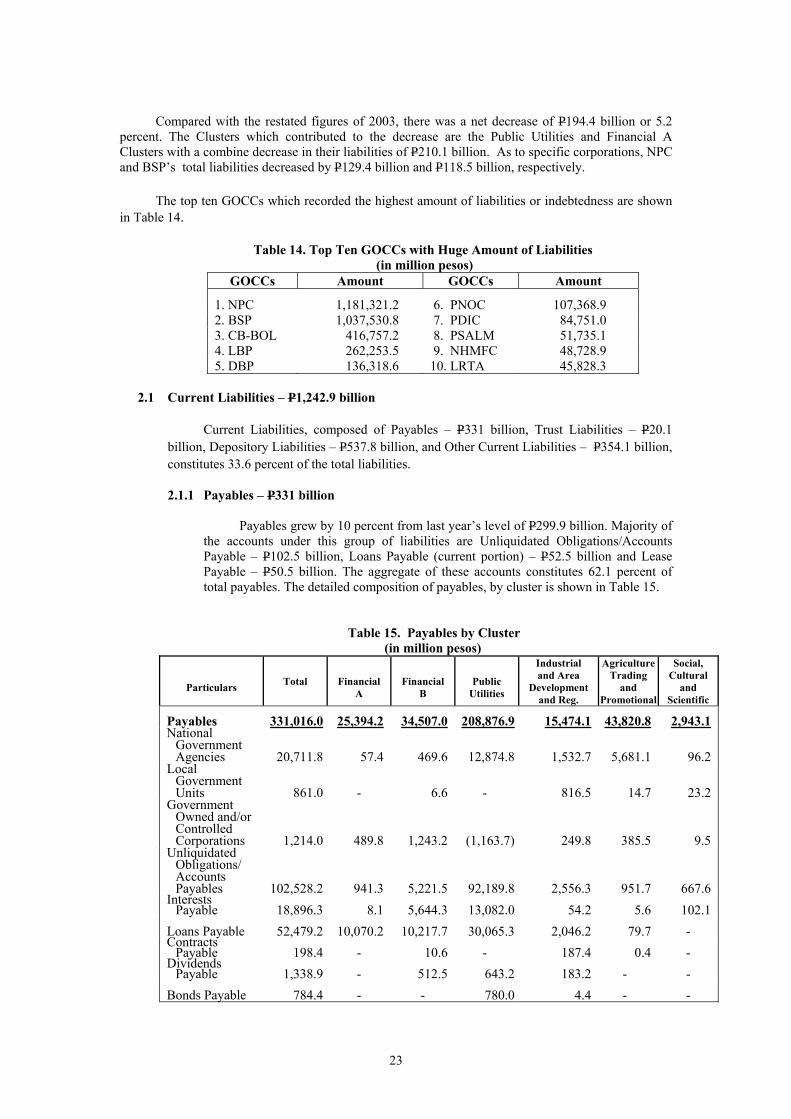
Compared with the restated figures of 2003, there was a net decrease of P194.4 billion or 5.2
percent. The Clusters which contributed to the decrease are the Public Utilities and Financial A Clusters with a combine decrease in their liabilities of P210.1 billion. As to specific corporations, NPC and BSP’s total liabilities decreased by P129.4 billion and P118.5 billion, respectively.
The top ten GOCCs which recorded the highest amount of liabilities or indebtedness are shown in Table 14.
Table 14. Top Ten GOCCs with Huge Amount of Liabilities (in million pesos)
GOCCs Amount GOCCs Amount
1. NPC 1,181,321.2 6. PNOC 107,368.9 2. BSP 1,037,530.8 7. PDIC 84,751.0 3. CB-BOL 416,757.2 8. PSALM 51,735.1 4. LBP 262,253.5 9. NHMFC 48,728.9 5. DBP 136,318.6 10. LRTA 45,828.3
2.1 Current Liabilities – P1,242.9 billion
Current Liabilities, composed of Payables – P331 billion, Trust Liabilities – P20.1
billion, Depository Liabilities – P537.8 billion, and Other Current Liabilities – P354.1 billion, constitutes 33.6 percent of the total liabilities.
2.1.1 Payables – P331 billion
Payables grew by 10 percent from last year’s level of P299.9 billion. Majority of
the accounts under this group of liabilities are Unliquidated Obligations/Accounts Payable – P102.5 billion, Loans Payable (current portion) – P52.5 billion and Lease Payable – P50.5 billion. The aggregate of these accounts constitutes 62.1 percent of total payables. The detailed composition of payables, by cluster is shown in Table 15.
Table 15. Payables by Cluster (in million pesos)
Particulars
Total
Financial
A
Financial
B
Public
Utilities
Industrial and Area
Development and Reg.
AgricultureTrading
and Promotional
Social, Cultural
and Scientific
Payables
331,016.0
25,394.2
34,507.0
208,876.9
15,474.1
43,820.8
2,943.1 National
Government Agencies
20,711.8
57.4
469.6
12,874.8
1,532.7
5,681.1
96.2
Local Government Units
861.0 -
6.6 -
816.5
14.7
23.2
Government Owned and/or Controlled Corporations
1,214.0
489.8
1,243.2
(1,163.7)
249.8
385.5
9.5
Unliquidated Obligations/ Accounts Payables
102,528.2
941.3
5,221.5
92,189.8
2,556.3
951.7
667.6
Interests Payable
18,896.3
8.1
5,644.3
13,082.0
54.2
5.6
102.1
Loans Payable
52,479.2
10,070.2
10,217.7
30,065.3
2,046.2
79.7 - Contracts
Payable
198.4 -
10.6 -
187.4
0.4 - Dividends
Payable
1,338.9 -
512.5
643.2
183.2 - - Bonds Payable
784.4 - -
780.0
4.4 - -
23
(Table 15, continued)
Lease Payable
50,538.2
114.0 -
50,393.3
30.9 - - Letters of Credit
1,405.4
1,391.6 - - -
13.8 -
Trade/Business
14,114.1 -
132.3
15.8
2,256.5 11,419.9
289.5 Notes and
Acceptances
18,015.1
22.2
13.0
1,406.7
62.0
16,511.3 - Supplies and
Materials Requisitioned for Stock
105.0 - - - - -
105.0
Accrued Expenses Payable
18,165.3
9,831.5
1,018.8
4,996.1
2,081.1
181.8
56.0
Income Tax Payable
158.8
4.0
0.3
28.5
76.8
36.4
12.8
Miscellaneous
29,501.7
2,464.1
10,016.5
3,565.2
3,336.1
8,538.7
1,581.0 Difference between totals and sum of components is due to rounding off
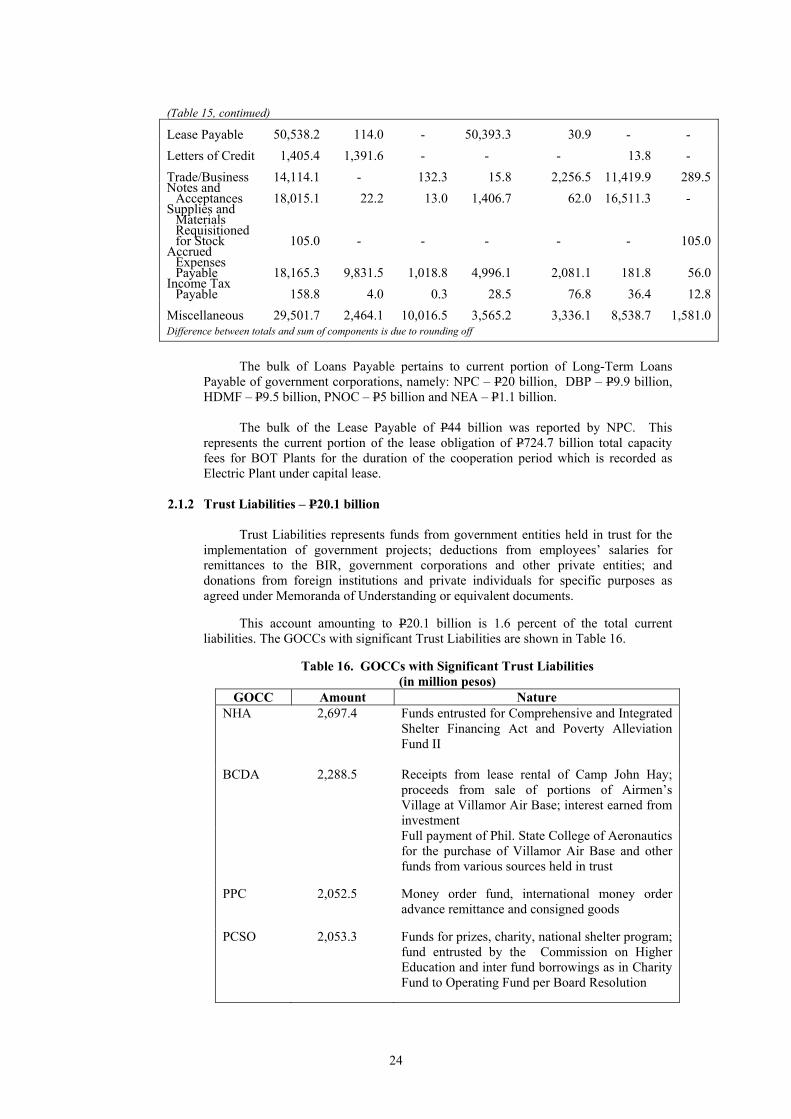
The bulk of Loans Payable pertains to current portion of Long-Term Loans
Payable of government corporations, namely: NPC – P20 billion, DBP – P9.9 billion, HDMF – P9.5 billion, PNOC – P5 billion and NEA – P1.1 billion.
The bulk of the Lease Payable of P44 billion was reported by NPC. This
represents the current portion of the lease obligation of P724.7 billion total capacity fees for BOT Plants for the duration of the cooperation period which is recorded as Electric Plant under capital lease.
2.1.2 Trust Liabilities – P20.1 billion
Trust Liabilities represents funds from government entities held in trust for the
implementation of government projects; deductions from employees’ salaries for remittances to the BIR, government corporations and other private entities; and donations from foreign institutions and private individuals for specific purposes as agreed under Memoranda of Understanding or equivalent documents.
This account amounting to P20.1 billion is 1.6 percent of the total current liabilities. The GOCCs with significant Trust Liabilities are shown in Table 16.
Table 16. GOCCs with Significant Trust Liabilities
(in million pesos) GOCC Amount Nature
NHA 2,697.4 Funds entrusted for Comprehensive and Integrated Shelter Financing Act and Poverty Alleviation Fund II
BCDA 2,288.5 Receipts from lease rental of Camp John Hay; proceeds from sale of portions of Airmen’s Village at Villamor Air Base; interest earned from investment
Full payment of Phil. State College of Aeronautics for the purchase of Villamor Air Base and other funds from various sources held in trust
PPC 2,052.5 Money order fund, international money order advance remittance and consigned goods
PCSO 2,053.3 Funds for prizes, charity, national shelter program; fund entrusted by the Commission on Higher Education and inter fund borrowings as in Charity Fund to Operating Fund per Board Resolution
24

(Table 16, continued) HGC 1,607.5 Represents funds held as designated trustee for
various housing /resettlement projects
NHMFC 935.2 Amount received from the National Government for amortization support and development financing in accordance with the implementing guidelines of RA No. 6846, as amended, creating the Abot-Kaya Pabahay Fund
2.1.3 Depository Liabilities – P537.8 billion Depository Liabilities solely of Miscellaneous account amounted to P537.8
billion. Ninety nine percent of the total amount was recorded in the books of three banks under the Financial A Cluster, namely BSP – P280 billion, LBP – P214.9 billion and DBP – P36.4 billion, consisting of time, demand and savings deposits in local and foreign currencies of the banks’ clients.
The biggest amount of BSP’s Depository Liabilities consists of the following:
National Government short-term and long-term deposits – P52.7 billion, demand deposits from banks/non-bank performing quasi-banking functions, reserve deposits and other deposits – P106.2 billion, and IMF and other financial institutions currency holdings– P97.8 billion.
2.2 Contingent Liabilities – P1.1billion
Contingent Accounts for fiscal year 2004 decreased by P19.4 million or 1.76 percent
from the previous year figure. This resulted from audit disallowances of accounts of officers and employees and those outside government service which became final and executory. Among the GOCCs with the highest amount of contingent liability accounts are shown in Table 17.
Table 17. Corporations with Biggest Contingent Liabilities
(in million pesos) GOCC Amount Cluster Nature
PPC
603.9 Public Utilities
Balance of the then Postal Service Office and all unreconciled accounts from June 1992 to December 31, 1998 awaiting final adjustment in the books of the Corporation
MWSS 197.6 Public Utilities Set up for possible loss and cost of damages in connection with existing lawsuits pending in court
CPA 183.0 Industrial and Area Dev. And Regulatory
Realty taxes due the City Government of Cebu which is being contested by the Authority in court and CPA’s share in its employees’ Provident Fund pending approval by DBM
2.3 Long-Term Liabilities – P2,279.5 billion
As of December 31, 2004, Long-Term Liabilities amounted to P2,279.5 billion, broken down as follows: Loans Payable-Foreign – P714.2 billion, Loans and Advances Payable (for NGAs, LGUs and GOCCs ) – P554.5 billion, Bonds Payable – P285 billion, Loans Payable-Domestic – P24.2 billion, Contracts Payable – P1.2 billion, Notes Payable – P279.5 million
25

and Miscellaneous – P700.1 billion. Table l8 shows the details of Long-Term Liabilities by cluster.
Table 18. Long-Term Liabilities by Cluster (in million pesos)
Particulars
Total
Financial A
Financial B
Public Utilities
Industrial and Area
Developmentand Reg.
Agriculture, Trading and Promotional
Social, Cultural
and Scientific
Total
2,279,523.5
800,281.2
156,831.0
1,246,564.9
46,228.2
28,480.8
1,137.3 Loans Payable, Foreign
714,152.9
340,246.0
5,865.6
333,989.5
30,815.3
2,099.2
1,137.3
Loans Payable, Domestic
24,154.9 -
1,850.3
7,259.2
898.7
14,146.7 -
Loans and Advances Payable, NGAs and
LGUs
403,240.0
367,957.1
157.1
19,499.0
5,718.7
9,908.22 - Loans and
Advances Payable, GOCCs
151,302.0
3,115.2
130,511.1
14,607.2
968.1
2,100.5 -
Bonds Payable
285,048.2
85,443.6
17,791.6
179,129.9 2,683.2 - - Contracts
Payable
1,216.9 -
9.2
1,196.3
1.4
10.0 -
Notes Payable
279.5 -
279.5 - - - -
Miscellaneous
700,129.0 3,519.4
366.6
690,883.8
5,142.9
216.3 - Difference between totals and sum of components is due to rounding off 2Includes P1 million Loans and Advances Payable under the Agriculture, Trading and Promotional Cluster
2.3.1 Loans Payable – P738.3 billion
Loans Payable to foreign and domestic creditors amounted to P714.2 billion and P24.2 billion, respectively or a total of P738.3 billion. For fiscal year 2004, there was a decrease in foreign loans by P51.5 billion or 6.7 percent from last year’s P765.6 billion. On the other hand, there was an increase in domestic loans by P14.6 billion or 152.1 percent. Government corporations with huge amount of foreign and domestic loans are shown in Tables 19 and 20.
Table 19. Top 20 GOCCs with Biggest Loans Payable - Foreign
(in million pesos)
GOCC 2004 2003 Increase/ (Decrease)
1. NPC 339,312.7 454,174.7 (114,862.0) 2. BSP 178,132.5 238,674.3 (60,541.8) 3. DBP 82,146.0 74,931.3 7,214.7 4. CB-BOL 48,489.9 60,541.1 (12,051.2) 5. PNOC ECD 44,575.6 41,632.6 2,943.0 6. LRTA 36,754.6 33,633.5 3,121.1 7. PSALM 33,715.5 32,035.9 1,679.6 8. LBP 28,725.4 27,538.1 1,187.3 9. MWSS 23,195.6 15,156.1 8,039.5 10. PNOC (Parent Corp.) 21,714.2 22,339.1 (624.9) 11. MIAA 8,873.7 9,073.0 (199.3) 12. LWUA 8,739.2 7,556.6 1,182.6 13. PPA 7,832.8 6,692.1 1,140.7 14. SBMA 5,474.6 4,799.7 674.9 15. PHIVIDEC Industrial Authority 3,876.2 2,948.3 927.9
26

(Table 19, continued) 16. NEA 2,798.6 3,147.7 (349.1) 17. PNR 2,028.8 5,856.7 (3827.9) 18. PCFC 1,516.4 1,620.7 (104.3) 19. PEZA 1,513.8 1,538.8 (25.0) 20. IGLF 1,235.8 1,381.9 (146.1)
The breakdown of foreign loans by source each of the government corporations
are shown in Volume II-B of this Report
Table 20. Top Five GOCCs with Outstanding Loans Payable - Domestic (in million pesos)
GOCC Amount Nature of Loan 1. NDC 1,173.8 Loans obtained from SSS, GSIS and LBP
for equity infusion and relending to the First Centennial Clark Corporation
2. NFA 9,100.6 Various loans from DBP, HSDC, LBP, DA, Equitable PCIBank, Metrobank and LBP
3. QUEDANCOR 5,000.0 LBP/Equitable PCIB Syndicated Loan
4. PNR 3,708.1 Relent Loans by National Government
5. LRTA 1,648.5 Loans obtained from LBP, Bond conversion and STCF loan converted into Treasury Bills. This is used to purchase the light rail vehicles and the construction of the LRT depot, stations and terminals and other structures.
2.3.2 Loans and Advances Payables – P554.5 billion
The balance of the Loans and Advances Payable is broken down as to National
Government Agencies – P403.2 billion, Government Owned and/or Controlled Corporations – P151.3 billion and Local Government Units – P1 million. Among the government corporations which reported the highest loans and advances payable are: CB-BOL – P367.9 billion representing, among others, payment of National Government for its liability; NPC – P9.3 billion ING Zero Coupon Bond and RP Bonds including payable to the Department of Energy representing the share of the government from the net proceeds or quarterly assigned petroleum from Malampaya; NEA – P5.7 billion relent loans; and LRTA – P4.6 billion, representing advances for the payment of principal and interest on foreign loans incurred for LRT Line 1.
2.3.3 Bonds Payable – P285 billion
Flotation of bonds is one of the sources of long-term liabilities. Out of the total
outstanding bonds payable for this year, 92.7 percent is shared by NPC – P145.1 billion, BSP – P85.4 billion and PSALM – P33.7 billion.
2.3.4 Miscellaneous Long-Term Liabilities – P700.1 billion
Ninety seven percent of this long term liabilities pertains to the lease obligation
of NPC relative to the Built to Operate Transfer (BOT) projects amounting to P680.7 billion.
27

3.0 DEFERRED CREDITS – P58.6 billion Deferred Credits of P58.6 billion is composed of Deferred Credits to Income – P21.9
billion; Undistributed Collections – P618.2 million; Semi-Expendable Supplies, Containers and Property – P31.8 million; Goods/ Merchandise Confiscated and Gasoline, Oil and Lubricants – P0.6 million; Supplies and Materials Acquired Free of Charge and Charged to Appropriation – P38.6 million. This group of accounts except the Deferred Credits to Income and Undistributed Collections are contra accounts to the unused inventory accounts for supplies and materials including gasoline, oil and lubricants. Government corporations which reported a huge amount of Deferred Credits to Income are shown in Table 21.
Table 21. GOCCs with Biggest Deferred Credits to Income
(in million pesos) GOCC Amount Nat re u
PNOC 2,960.8 Net entitlement of the Company from the “Take-of-
Pay” transactions of SC 38 Malampaya Project. Under the Take-of-Pay agreement, the customers are obliged to pay even if there is no delivery or consumption – these are unearned revenue until the aforementioned delivery is actually effected
MWSS 2,076.4 These are penalties, by way of interests, imposed against the concessionaires due to delay in their payment of concession fees
BCDA 1,869.3 Advance rentals and earnest money from various lessees
SBMA 1,638.9 Unearned income on rentals received in advance from various investors/locators under long term lease
PRA 891.2 Value of unrealized land used in payment for the upgrading of the R1 expressway being amortized as income over 35 years; future income from the lease-purchase agreements with the Sandiganbayan, BIR and OP for the Presidential Action Center (PACE)
NIA 10,095.6 Income to be realized upon collection of previously billed irrigation fees and unearned income on installment sales, equipment rentals and Communal Irrigation System (CIS) amortizations
NFA 486.6 Advance payments from retailers, private and government institutions and other income received but not yet earned.
4.0 EQUITY – P749.3 billion
476.3
273.0 272.6 257.2
0
50
100
150
200
250
300
350
400
450
500
2004 2003
Capital Surplus
At year end, the total equity of all GOCCs amounted to P749.3billion with an increase of P219.5billion or 41.4 percent compared to that of fiscal year 2003 P529.8billion. It is composed of Capital and Surplus accounts at P476.3 billion and P273 billion, respectively. Chart 4 shows the comparison of the capital and surplus accounts while Table 22presents the composition of equity accounts for the year.
Chart 4. Components of Equity(in billion pesos)
28
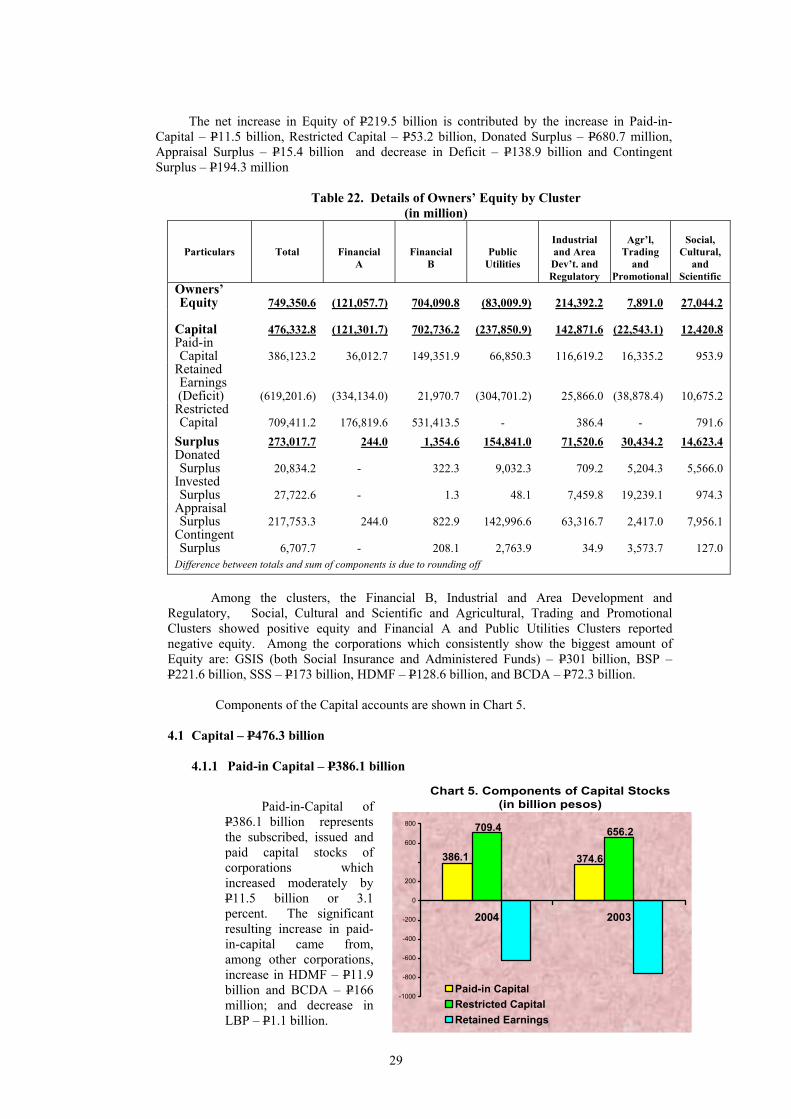
The net increase in Equity of P219.5 billion is contributed by the increase in Paid-in-Capital – P11.5 billion, Restricted Capital – P53.2 billion, Donated Surplus – P680.7 million, Appraisal Surplus – P15.4 billion and decrease in Deficit – P138.9 billion and Contingent Surplus – P194.3 million
Table 22. Details of Owners’ Equity by Cluster (in million)
Particulars
Total
Financial A
Financial B
Public Utilities
Industrial and Area Dev’t. and Regulatory
Agr’l,
Trading and
Promotional
Social,
Cultural, and
Scientific Owners’ Equity 749,350.6 (121,057.7) 704,090.8 (83,009.9) 214,392.2 7,891.0 27,044.2
Capital
476,332.8
(121,301.7)
702,736.2
(237,850.9)
142,871.6
(22,543.1)
12,420.8 Paid-in Capital
386,123.2
36,012.7
149,351.9
66,850.3
116,619.2
16,335.2
953.9
Retained Earnings
(Deficit)
(619,201.6)
(334,134.0)
21,970.7
(304,701.2)
25,866.0
(38,878.4)
10,675.2 Restricted Capital
709,411.2
176,819.6
531,413.5 -
386.4 -
791.6
Surplus 244.0 1,354.6 154,841.0 71,520.6 30,434.2 14,623.4 Donated Surplus
20,834.2 -
322.3
9,032.3
709.2
5,204.3
5,566.0
Invested Surplus
27,722.6 -
1.3
48.1
7,459.8
19,239.1
974.3
Appraisal Surplus
217,753.3
244.0
822.9
142,996.6
63,316.7
2,417.0
7,956.1
Contingent Surplus
6,707.7 -
208.1
2,763.9
34.9
3,573.7
127.0
Difference between totals and sum of components is due to rounding off
273,017.7
Among the clusters, the Financial B, Industrial and Area Development and Regulatory, Social, Cultural and Scientific and Agricultural, Trading and Promotional Clusters showed positive equity and Financial A and Public Utilities Clusters reported negative equity. Among the corporations which consistently show the biggest amount of Equity are: GSIS (both Social Insurance and Administered Funds) – P301 billion, BSP – P221.6 billion, SSS – P173 billion, HDMF – P128.6 billion, and BCDA – P72.3 billion. Components of the Capital accounts are shown in Chart 5.
4.1 Capital – P476.3 billion
(758.1) (619.2)
4.1.1 Paid-in Capital – P386.1 billion
Paid-in-Capital of P386.1 billion represents the subscribed, issued andpaid capital stocks of corporations which increased moderately by P11.5 billion or 3.1 percent. The significant resulting increase in paid-in-capital came from, among other corporations, increase in HDMF – P11.9 billion and BCDA – P166 million; and decrease in LBP – P1.1 billion.
400
Chart 5. Components of Capital Stocks(in billion pesos)
386.1 374.6
656.2709.4
-1000
-800
-600
-400
-200
0
200
600
800
2004 2003
Paid-in CapitalRestricted CapitalRetained Earnings
29

4.1.2 Retained Earnings (Deficit) – (P619.2 billion)
Deficit of P619.2 billion represents the cumulative balance of net income or loss, dividend contributions, fundamental errors and other capital adjustments. By cluster, huge deficit is shown under the Financial A amounting to P334.1 billion, followed by Public Utilities - P304.7 billion. This is shared consistently by CB-BOL, an institution under liquidation, and by NPC with a remarkable deficit of P390.5 billion and P266 billion, respectively.
Although NPC still showed a high deficit in 2004, there was a substantial
reduction of its deficit from P456 billion in 2003 to P266 billion in 2004. This is due mainly on account of the Government Debt Absorption of ROP Purchase Bonds by the National Government amounting to P200 billion as mandated under Republic Act No. 9136 otherwise known as the Electric Power Industry Reform Act (EPIRA) and Executive Order No. 370. A DBCC Resolution No. 2004-3 dated November 12, 2004 further approved this debt assumption process.
For this year, the total deficit decreased by P138.9 billion. The substantial
improvement in financial performance was contributed by NPC whose deficit decreased by P190 billion on account of the Government Debt Absorption of P200 billion as mentioned above.
Retained Earnings (Deficit) of all Clusters are shown below.
Table 23. Retained Earnings (Deficit) by Cluster
( in million pesos) Clusters Amount
Deficit ( 677,713.6) Financial A (334,134.0) Public Utilities (304,701.2) Agricultural Trading & Promotional (38,878.4) Retained Earnings 58,511.9 Financial B 21,970.7 Industrial & Area Dev't & Regulatory 25,866.0 Social, Cultural & Scientific 10,675.2 Balance (619,201.7)
4.1.3 Restricted Capital – P709.4 billion
Restricted Capital represents the amount earmarked from retained earnings
intended for various purposes, such as currency insurance, fidelity insurance, and medical benefit, and retirement benefit, fluctuations in foreign exchange rates, gold holdings and for contingency. Among the GOCCs which reported the huge amount of restricted capital are shown in Table 24.
30

Table 24. GOCCs With Huge Amount of Restricted Capital ( in million pesos)
GOCC Amount Nature GSIS 286,437.8 Actual reserves requirement set
for the various funds – Social Insurance, Optional Insurance, Employee Compensation Insurance, Pre-Need Insurance, General Insurance and Property Replacement
BSP 174,478.0 Capital Reserves as provisions for potential loss arising from the volatility of the exchange rates and price of gold
SSS 173,007.8 Reserved fund for property valuation and insurance
PDIC 36,578.2 Reserves for estimated insurance losses
PHIC 35,287.0 Represents the actuarial estimate for two years’ projected program expenditures
4.2 Surplus – P273 billion
4.2.1 Donated Surplus – P20.8 billion
Donated Surplus increased by P680.7 million or 3.4 percent, compared to the figure of fiscal year 2003. Government corporations which received the biggest donations are listed in Table 25.
Table 25. Corporations with Biggest Amount of Donated Capital
( in million pesos) GOCC Amount Nature
NPC 4,022.0 Represents grants received from foreign governments and lending institutions which were used to finance the implementation of various projects
PTrA 3,645.7 Donated lands for tourism purpose
LWUA 2,647.9 Represents subsidy support from the National Government for water supply projects.
MWSS 1,047.0 Represents waterworks facilities turned over by private subdivision by way of a deed of donation. Included herein is the grant from the Japan International Cooperation Agency for the rehabilitation of Balara Water Treatment Plant
31

(Table 25, continued) LCP 2,962.7 The 12-hectare lot donated by the NHA with an
appraisal value of P2.89 billion subject to reappraisal
CCP 1,464.2 Includes the vast parcels of reclaimed land where the CCP Complex is situated, the initial capitalization of CCP
NFA 471.8 Cash and fixed assets donated by various individuals, organizations and offices. The fixed assets are buildings and equipment mostly technical and scientific in nature received from Japanese government specially for Food Development Center
4.2.2 Invested Surplus – P27.7 billion
Compared to the previous year, there was a decrease in Invested Surplus in
the amount of P58.5 million. This account is a contra account of Investments and Fixed Assets accounts. Of the outstanding balance, 96 percent was reported by NIA and PRA of P19.2 billion and P7.4 billion, respectively. The Invested Surplus of NIA pertains to the asset accounts transferred by the DA and the DPWH since 1990. PRA’s surplus represent the appraised share of lands on various reclamation agreements entered into with private parties at no cost.
4.2.3 Appraisal Surplus – P217.8 billion
Appraisal Surplus is the excess of the sound value over the net book value of the corporations’ assets. This resulted from the appraisal of the Fixed Assets of GOCCs by independent appraisers. For this year, the corporations which accumulated the biggest appraisal surplus were: NPC – P95.8 billion or 44 percent; PPA – P51.8 billion or 23.8 percent; MWSS – P28.7 or 13.2 percent and PNOC – P17.5 or 8 percent.
4.2.4 Contingent Surplus – P 6.7 billion
Contingent Surplus amounting to P6.7 billion is the contra account of the
Contingent Assets and Contingent Liabilities. Of the amount, NFA and NPC recorded the highest amount of Contingent Surplus of P3.2 billion or 47.8 percent and P1.9 billion or 28.4 percent, respectively. These are disallowances in post audit, claims for unrelieved losses of properties and claims for all established inventory shortages of accountable officers.
32

STATEMENT OF INCOME AND EXPENSES
The GOCCs showed a better financial performance for the period ended December 31, 2004. From a net loss of P74.5 billion (restated) in the preceding year, GOCCs posted a combined net income of P24.9 billion or 133.4 percent. The amount represents the difference between the P56.1 billion aggregate net income of GOCCs belonging to Financial B, Industrial and Area Development and Regulatory and Social, Cultural and Scientific Clusters and the P31.2 billion aggregate losses incurred by GOCCs under Financial A, Public Utilities and Agricultural, Trading and Promotional Clusters. This year’s over-all financial performance of GOCCs showed an increase of P68 billion in income and a decrease of P27.3 billion in expenses.
Table 26 shows the GOCCs that realized substantial net income in 2004 while Table 27 presents those that incurred significant net loss.
Table 26. GOCCs that Realized Substantial Net Income (in million pesos)
GOCC Amount GOCC Amount 1. GSIS 36,854.7 20. MCIAA 186.5 2. PNOC 8,634.7 21. PHILSUCOR 186.2 3. HDMF 6,467.9 22. QUEDANCOR 169.6 4. PHIC 5,854.7 23. PSALM 166.2 5. SSS 2,615.0 24. PHC 145.7 6. DBP 2,270.2 25. MIAA 128.5 7. LBP 2,250.7 26. PPC 98.9 8. BSP 2,149.0 27. GSIS-MFI 92.6 9. PPA 1,965.2 28. PRA 80.4 10. NHMFC 1,405.1 29. PFDA 67.9 11. OWWA 1,159.9 30. CPA 67.4 12. PAGCOR 1,048.0 31. PCFC 66.1 13. NHA 765.7 32. TIDCORP 64.2 14. PTrA 675.5 33. NKTI 62.6 15. MWSS 662.0 34. SBGFC 62.4 16. PEZA 491.9 35. LIBI 57.6 17. PEATC 330.6 36. PPSBI 51.6 18. IGLF 220.1 37. LLC 51.0 19. PDIC 202.2
Table 27. GOCCs that Incurred Significant Net Loss (in million pesos)
GOCC Amount GOCC Amount 1. NPC 29,901.1 17. CCP 62.0 2. CB-BOL 9,283.9 18. GSIS-FB 60.3 3. NFA 6,470.0 19. AIIBP 56.7 4. LRTA 1,463.6 20. KKK-PCA 56.6 5. PNR 1,124.7 21. PCIC 50.1 6. SBMA 927.8 22. SRA 42.3 7. BCDA 711.5 23. NEA 41.0 8. TLRC 596.1 24. NTA 38.0 9. HGC 553.5 25. ZCEZA 36.9 10. FCCC 339.2 26. FTI 35.5 11. NDC 311.1 27. BTPI 26.5 12. GTEB 287.0 28. PITC 23.3 13. PDA 276.7 29. MGC 18.3 14. LWUA 260.5 30. CFI 16.3 15. NIA 131.7 31. NRDC 11.7 16. PTNI 69.9 32. JHMC 10.9
33

482.5
77.1
418.8
72.8
2004 2003
Operating Non-Operating
Chart 6. Comparative Income (in billion pesos)
1.0 Income – P559.6 billion
For the period ended December 31, 2004, GOCCs generated a total income of P559.6 billion, up by P68 billion or 13.8 percent from last year’s P491.6 billion, as restated. The biggest share amounting to P176.8 billion or 31.6 percent of the total was realized by the NPC from its government business operations and non-business activities. Despite the huge revenues generated by NPC, its Statement of Income and Expenses showed a net loss of P29. 9 billion due to huge operating and non-operating expenses of P206.7 billion. Chart 6 shows the comparative income of GOCCs.
Other GOCCs/GFIs that earned significant revenues in fiscal year 2004 are shown in Table 28.
Table 28. GOCCs/GFIs that Earned Significant Revenues
(in million pesos) GOCC/GFI Amount
GSIS 77,725.7 SSS 52,824.9 BSP 46,240.7 LBP 21,398.5 PAGCOR 20,905.0 NFA 20,548.8 PHIC 18,410.0 DBP 14,029.9 HDMF 12,996.2 PTrA 9,412.1 PDIC 8,557.9
1.1 Operating and Service Income – P482.5 billion
At P482.5 billion, Operating and Service Income represents 86.2 percent of the over-all
income. It consists of the following: Income from Government Business Operations – P218.4 billion; Insurance/Fiduciary Bond Premiums – P106 billion; Interests – P82.6 billion; Trading/Production – P41.4 billion; Income from Government Services – P9.8 billion; Gain on Foreign Exchange – P5.4 billion; Rents – P5 billion; and Miscellaneous – P13.8 billion.
Among the GOCCs, top earner of Income from Business Operations was the NPC which
generated P167.3 billion, particularly from utility operating income, transmission services, ancillary service charge, other demand and energy adjustment and foreign exchange adjustment. PAGCOR shared P18.4 billion from winnings in table games, slot machines and dollar pit. PTrA generated P8.5 billion from the operation of Duty Free Philippines and other tourist facilities. PPA contributed P5 billion, while PPC and MIAA shared P3.4 billion and P3.1 billion, respectively.
34
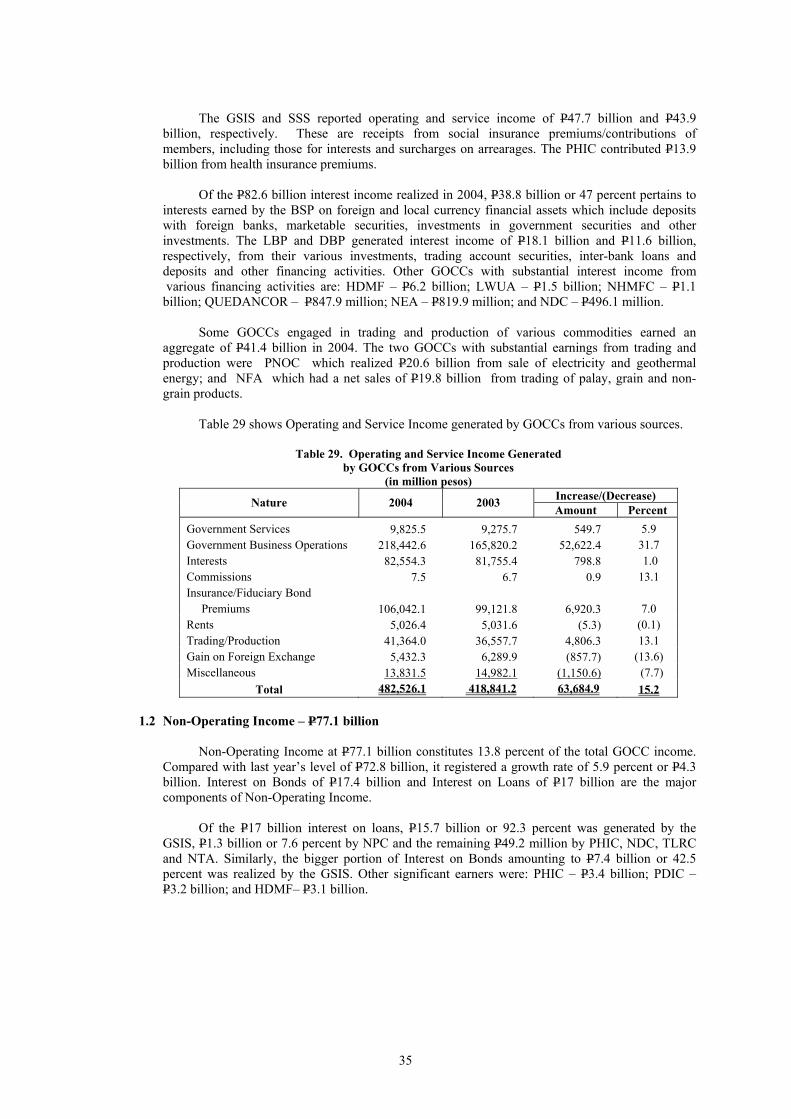
The GSIS and SSS reported operating and service income of P47.7 billion and P43.9
billion, respectively. These are receipts from social insurance premiums/contributions of members, including those for interests and surcharges on arrearages. The PHIC contributed P13.9 billion from health insurance premiums.
Of the P82.6 billion interest income realized in 2004, P38.8 billion or 47 percent pertains to
interests earned by the BSP on foreign and local currency financial assets which include deposits with foreign banks, marketable securities, investments in government securities and other investments. The LBP and DBP generated interest income of P18.1 billion and P11.6 billion, respectively, from their various investments, trading account securities, inter-bank loans and deposits and other financing activities. Other GOCCs with substantial interest income from various financing activities are: HDMF – P6.2 billion; LWUA – P1.5 billion; NHMFC – P1.1 billion; QUEDANCOR – P847.9 million; NEA – P819.9 million; and NDC – P496.1 million.
Some GOCCs engaged in trading and production of various commodities earned an
aggregate of P41.4 billion in 2004. The two GOCCs with substantial earnings from trading and production were PNOC which realized P20.6 billion from sale of electricity and geothermal energy; and NFA which had a net sales of P19.8 billion from trading of palay, grain and non- grain products.
Table 29 shows Operating and Service Income generated by GOCCs from various sources.
Table 29. Operating and Service Income Generated
by GOCCs from Various Sources (in million pesos)
Increase/(Decrease) Nature 2004 2003 Amount Percent Government Services 9,825.5 9,275.7 549.7 5.9 Government Business Operations 218,442.6 165,820.2 52,622.4 31.7 Interests 82,554.3 81,755.4 798.8 1.0 Commissions 7.5 6.7 0.9 13.1 Insurance/Fiduciary Bond Premiums 106,042.1 99,121.8 6,920.3 7.0 Rents 5,026.4 5,031.6 (5.3) (0.1) Trading/Production 41,364.0 36,557.7 4,806.3 13.1 Gain on Foreign Exchange 5,432.3 6,289.9 (857.7) (13.6) Miscellaneous 13,831.5 14,982.1 (1,150.6) (7.7)
Total 482,526.1 418,841.2 63,684.9 15.2
1.2 Non-Operating Income – P77.1 billion
Non-Operating Income at P77.1 billion constitutes 13.8 percent of the total GOCC income. Compared with last year’s level of P72.8 billion, it registered a growth rate of 5.9 percent or P4.3 billion. Interest on Bonds of P17.4 billion and Interest on Loans of P17 billion are the major components of Non-Operating Income.
Of the P17 billion interest on loans, P15.7 billion or 92.3 percent was generated by the
GSIS, P1.3 billion or 7.6 percent by NPC and the remaining P49.2 million by PHIC, NDC, TLRC and NTA. Similarly, the bigger portion of Interest on Bonds amounting to P7.4 billion or 42.5 percent was realized by the GSIS. Other significant earners were: PHIC – P3.4 billion; PDIC – P3.2 billion; and HDMF– P3.1 billion.
35
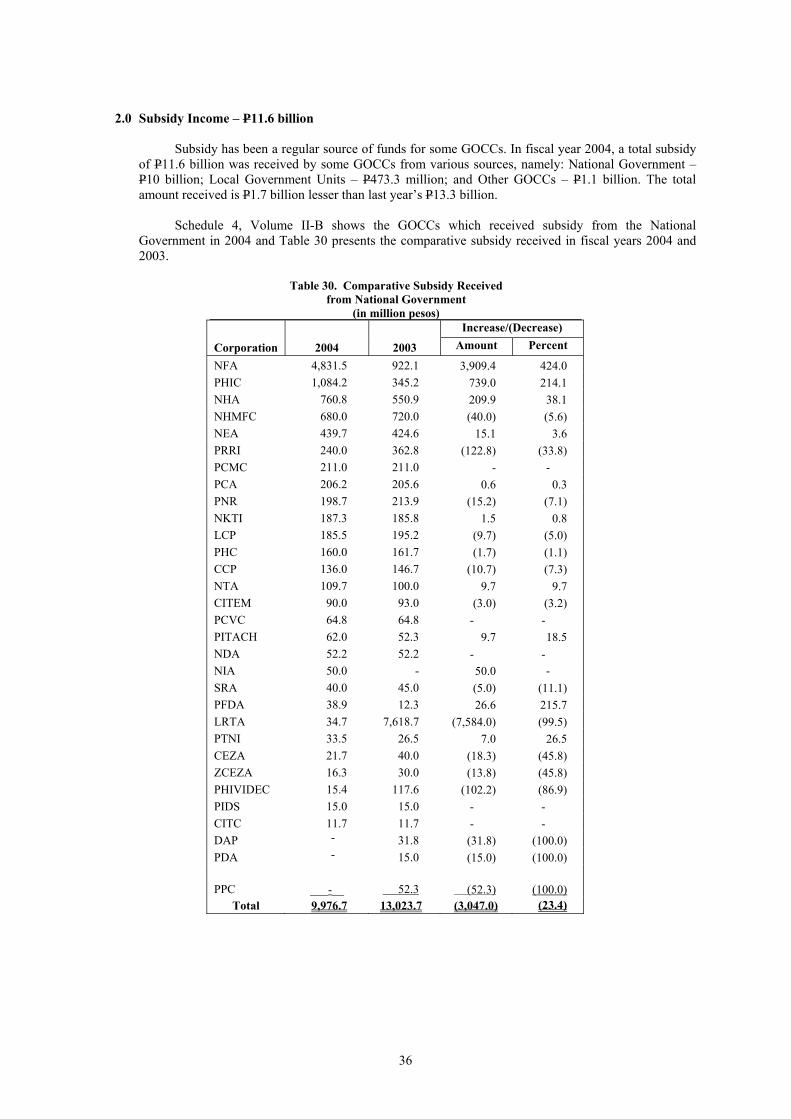
2.0 Subsidy Income – P11.6 billion
Subsidy has been a regular source of funds for some GOCCs. In fiscal year 2004, a total subsidy of P11.6 billion was received by some GOCCs from various sources, namely: National Government – P10 billion; Local Government Units – P473.3 million; and Other GOCCs – P1.1 billion. The total amount received is P1.7 billion lesser than last year’s P13.3 billion.
Schedule 4, Volume II-B shows the GOCCs which received subsidy from the National
Government in 2004 and Table 30 presents the comparative subsidy received in fiscal years 2004 and 2003.
Table 30. Comparative Subsidy Received
from National Government (in million pesos)
Increase/(Decrease)
Corporation 2004 2003 Amount Percent
NFA 4,831.5 922.1 3,909.4 424.0 PHIC 1,084.2 345.2 739.0 214.1 NHA 760.8 550.9 209.9 38.1 NHMFC 680.0 720.0 (40.0) (5.6) NEA 439.7 424.6 15.1 3.6 PRRI 240.0 362.8 (122.8) (33.8) PCMC 211.0 211.0 - - PCA 206.2 205.6 0.6 0.3 PNR 198.7 213.9 (15.2) (7.1) NKTI 187.3 185.8 1.5 0.8 LCP 185.5 195.2 (9.7) (5.0) PHC 160.0 161.7 (1.7) (1.1) CCP 136.0 146.7 (10.7) (7.3) NTA 109.7 100.0 9.7 9.7 CITEM 90.0 93.0 (3.0) (3.2) PCVC 64.8 64.8 - - PITACH 62.0 52.3 9.7 18.5 NDA 52.2 52.2 - - NIA 50.0 - 50.0 - SRA 40.0 45.0 (5.0) (11.1) PFDA 38.9 12.3 26.6 215.7 LRTA 34.7 7,618.7 (7,584.0) (99.5) PTNI 33.5 26.5 7.0 26.5 CEZA 21.7 40.0 (18.3) (45.8) ZCEZA 16.3 30.0 (13.8) (45.8) PHIVIDEC 15.4 117.6 (102.2) (86.9) PIDS 15.0 15.0 - - CITC 11.7 11.7 - - DAP - 31.8 (31.8) (100.0) PDA - 15.0 (15.0) (100.0)
PPC .___-__
. 52.3 (52.3) (100.0) Total 9,976.7 13,023.7 (3,047.0) (23.4)
36

Subsidy from LGUs reached to P473.3 million, up by P253.1 million or 114.9 percent from last
year’s level of P220.2 million. The amount was received by PHIC for premium contributions of indigent families nationwide as provided under the National Health Insurance Act, Republic Act No. 7875.
Subsidy from other GOCCs went up to P1.1 billion from a mere P93.9 million in 2003. Of the
amount, P1 billion was received by PHIC from PCSO as subsidy for indigents’ National Health Insurance premium contributions, while the remaining P112 million was accounted as shown in Table 31.
Table 31. Subsidy from Other GOCCs
(in million pesos) Recipient Source Amount Purpose OSHC SSS 59.9 Share of SSS in the operating expenses of the
Center as authorized under E.O. No. 307 dated November 4, 1987
PPMC BCDA 30.2 Operating Expenses
BTPI BCDA 18.9 Operating Expenses
CB-BOL BSP 3.0 Financial Assistance
It was noted that despite the substantial amount of subsidy received some GOCCs still incurred significant net loss in their operations. Table 32 shows the GOCCs that incurred net loss despite the subsidy received.
Table 32. GOCCs that Incurred Net Loss Despite Subsidy Received
(in million pesos) GOCC Net Loss Before
Subsidy Subsidy Net Loss After Subsidy
Rank
CB-BOL 9,286.9 3.0 9,283.9 1 CCP 198.0 136.0 62.0 7 CEZA 23.6 21.7 2.0 14 CITC 18.9 11.7 7.2 13 LRTA 1,498.3 34.7 1,463.6 3 NEA 480.7 439.7 41.0 9 NFA 11,301.5 4.8 6,470.0 2 NIA 181.7 50.0 131.7 5 NRDC 18.7 7.0 11.7 12 NTA 147.6 109.7 38.0 10 PNR 1,323.4 198.7 1,124.7 4 PTNI 198.0 33.5 69.9 6 SRA 82.3 40.0 42.3 8 ZCEZA 53.2 16.3 36.9 11
37
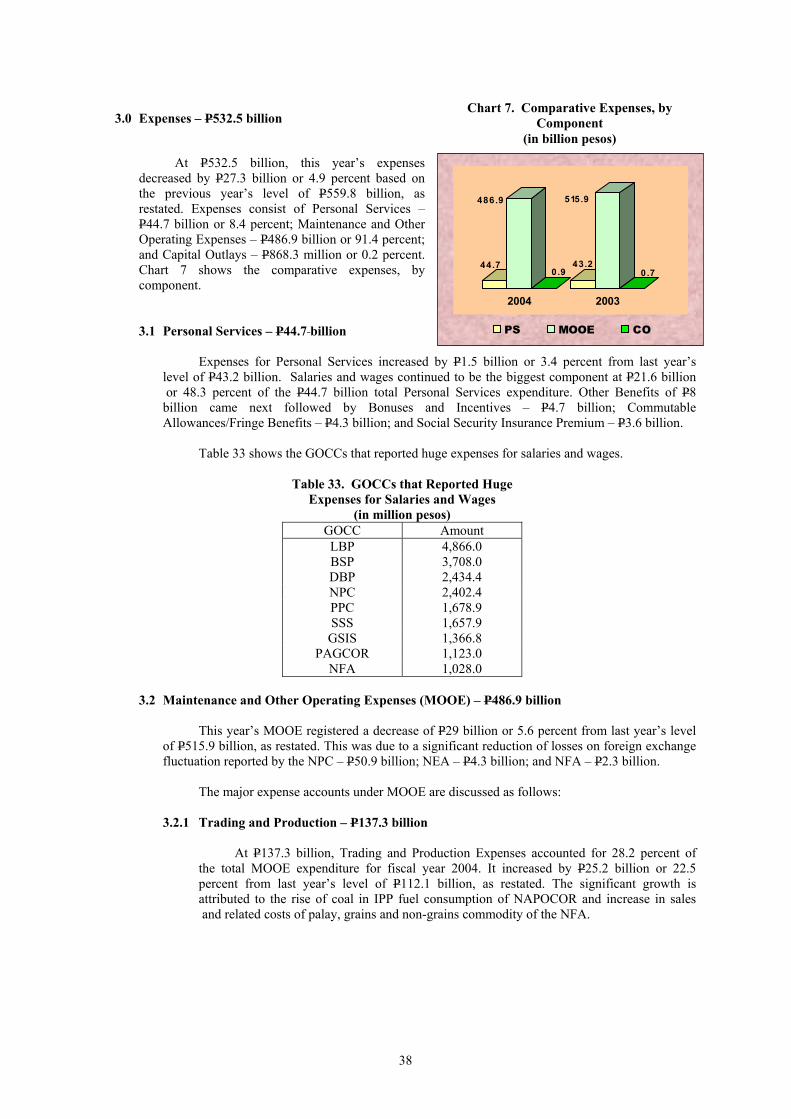
44.7
486.9
0.943.2
515.9
0.7
2004 2003
PS MOOE CO
Chart 7. Comparative Expenses, by Component
(in billion pesos) 3.0 Expenses – P532.5 billion
At P532.5 billion, this year’s expenses decreased by P27.3 billion or 4.9 percent based on the previous year’s level of P559.8 billion, as restated. Expenses consist of Personal Services – P44.7 billion or 8.4 percent; Maintenance and Other Operating Expenses – P486.9 billion or 91.4 percent; and Capital Outlays – P868.3 million or 0.2 percent. Chart 7 shows the comparative expenses, by component.
3.1 Personal Services – P44.7 billion
Expenses for Personal Services increased by P1.5 billion or 3.4 percent from last year’s level of P43.2 billion. Salaries and wages continued to be the biggest component at P21.6 billion or 48.3 percent of the P44.7 billion total Personal Services expenditure. Other Benefits of P8 billion came next followed by Bonuses and Incentives – P4.7 billion; Commutable Allowances/Fringe Benefits – P4.3 billion; and Social Security Insurance Premium – P3.6 billion.
Table 33 shows the GOCCs that reported huge expenses for salaries and wages.
Table 33. GOCCs that Reported Huge
Expenses for Salaries and Wages (in million pesos)
GOCC Amount LBP 4,866.0 BSP 3,708.0 DBP 2,434.4 NPC 2,402.4 PPC 1,678.9 SSS 1,657.9 GSIS 1,366.8
PAGCOR 1,123.0 NFA 1,028.0
3.2 Maintenance and Other Operating Expenses (MOOE) – P486.9 billion
This year’s MOOE registered a decrease of P29 billion or 5.6 percent from last year’s level
of P515.9 billion, as restated. This was due to a significant reduction of losses on foreign exchange fluctuation reported by the NPC – P50.9 billion; NEA – P4.3 billion; and NFA – P2.3 billion.
The major expense accounts under MOOE are discussed as follows:
3.2.1 Trading and Production – P137.3 billion
At P137.3 billion, Trading and Production Expenses accounted for 28.2 percent of
the total MOOE expenditure for fiscal year 2004. It increased by P25.2 billion or 22.5 percent from last year’s level of P112.1 billion, as restated. The significant growth is attributed to the rise of coal in IPP fuel consumption of NAPOCOR and increase in sales and related costs of palay, grains and non-grains commodity of the NFA.
38

Shown in Table 34 are GOCCs that incurred significant amount of this expense item.
Table 34. GOCCs that Incurred Significant Trading
and Production Expenses (in million pesos)
GOCC Amount Purpose NPC 93,769.6 Power Generation NFA 25,149.0 Sale of Grains and Non-Grains Commodity PNOC 11,142.6 Power Generation PTrA 6,488.9 Cost of Sales PITC 341.9 Trading Costs MSI 110.4 Cost of Sales
3.2.2 Social Security Benefits, Rewards and Other Claims – P89.1 billion
Expenses for Social Security Benefits, Rewards and Other Claims reached P89.1 billion, representing 18.3 percent of the total MOOE. Of this amount, P44.9 billion or 50.4 percent was incurred by the SSS for payment to its members of social security benefits which include: Retirement – P19.8 billion; Death – P16.1 billion; Disability – P3.1 billion; Maternity – P2.4 billion; Funeral Grant – P1.9 billion; Sickness and Other Medical Services – P1.6 billion.
The next biggest amount of P30.5 billion was incurred by the GSIS for payment of
benefits under the Social Insurance Fund – P29.1 billion and under the Administered Fund – P1.4 billion.
Other GOCCs that incurred similar expenses were: OWWA – P461.6 million for
payment of insurance benefits and medicare claims of overseas workers; and NPC – P151.2 million for payment of terminal leave as part of separation benefits.
3.2.3 Interests – P88.4 billion
Interest Expense is the third biggest item under MOOE, accounting for 18.2 percent
of the total MOOE. This year’s level is P5.8 billion or 7.0 percent higher than last year’s 82.6 billion. Topping the list among GOCCs which incurred huge interest expense is NPC with P30.2 billion, recording the biggest growth of P5.4 billion compared to the previous year. Increased foreign exchange rates gave rise to the substantial increase in interest payments made by NPC on its foreign loans. Other GOCCs that incurred huge expenses on interests were the following: BSP – P28.2 billion; LBP – P7.2 billion; DBP – P6.1 billion; NFA– P2.9 billion; CB-BOL – P2.5 billion; HDMF – P2.1 billion; PNOC – P1.5 billion; and LRTA – P1 billion. Interest expenses include those for deposit liabilities of banks, foreign and domestic borrowings, finance charges and other payables.
Noteworthy is interest expense incurred by the NHMFC which drastically went
down to P716.7 million from P4 billion in the preceding year due to restructuring of its loans from the SSS and HMDF.
3.2.4 Loss on Foreign Exchange – P38.4 billion
Loss on Foreign Exchange (FOREX) represents losses incurred from the conversion
of foreign currencies to Philippine peso during the year. At P38.4 billion, this account showed a decrease of P55.3 billion from last year’s figure of P93.7 billion. The substantial drop of P50.9 billion was reported by NPC. The GOCCs that reported huge loss on FOREX are shown in Table 35.
39

Table 35. GOCCs that Reported
Huge Loss on FOREX (in million pesos)
GOCC Amount NPC 26,963.8 CB-BOL 6,778.9 PNOC 1,980.0 PSALM 673.1 LRTA 465.2 MIAA 309.0 PEZA 305.1 LWUA 276.8 NEA 208.0
3.2.5 Depreciation – P25.9 billion
For the period ended December 31, 2004, GOCCs reported a total depreciation
expense of P25.9 billion. The GOCCs that recorded substantial depreciation expenses for the year are: NPC – P16.7 billion; MWSS – P1.4 billion; HDMF – P841.5 million; MIAA – P831.2 million; and SBMA – P791.2 million.
3.2.6 Amortization of Capacity Costs – P24.2 billion
This year’s capacity costs paid by NPC to independent power producers for Build-
Operate -Transfer Plants amounted to P24.2 billion with the details on Table 36.
Table 36. Amortization of Capacity Costs Paid by GOCCs (in million pesos)
Projects Amount Sual Coal Fired Power Plant I and II 7,738.7 Hopewell Power Plant I and II 4,954.4 Iligan Natural Gas 4,295.5 Bakun Plant Unit I and II 2,450.1 San Roque Power Corporation 2,323.9 Kalayaan Unit I and II 869.4 Bauang 809.5 Subic – Enron 581.5 NMPC 2 106.2 Hopewell Tileman 90.7
3.2.7 Bad Debts – P16.8 billion
Bad Debts recorded by GOCCs during the year amounted to P16.8 billion. Of this
amount, P16.4 billion or 97.6 percent was reported by the GOCCs in Table 37.
Table 37. Bad Debts Recorded by GOCCs (in million pesos)
GOCC Amount PDIC 7,571.5 NPC 2,259.3 LBP 1,739.7 DBP 1,203.4
40
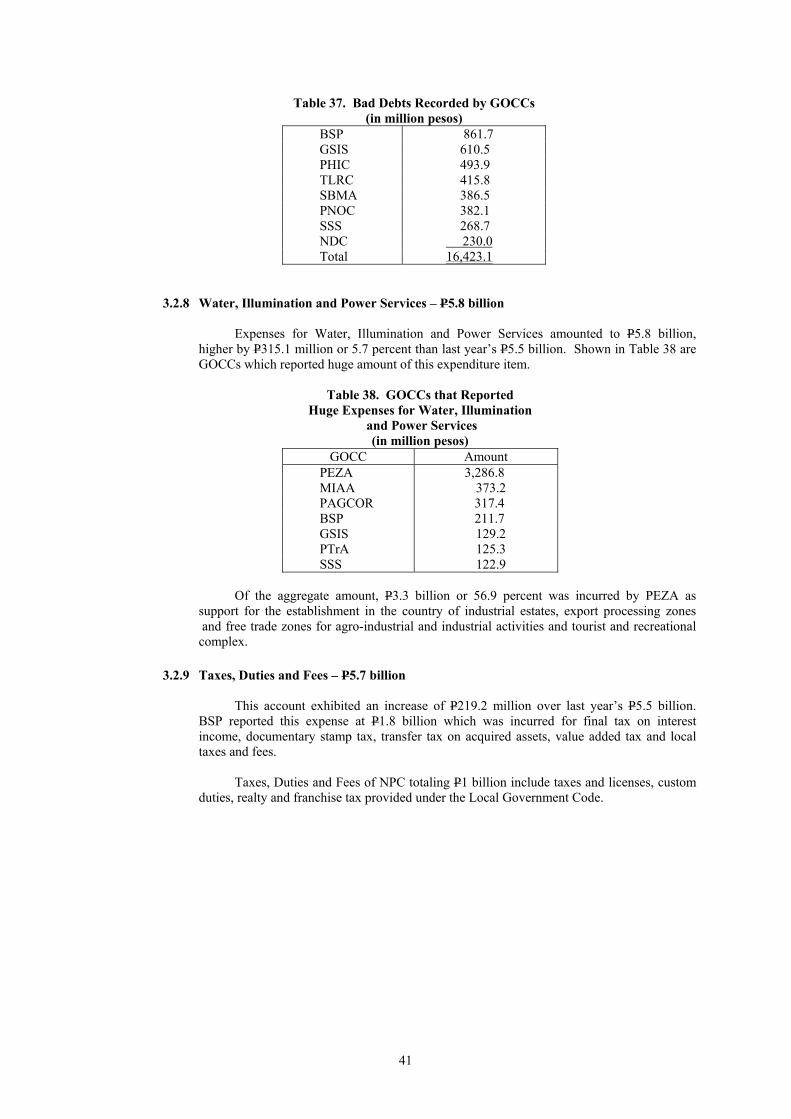
Table 37. Bad Debts Recorded by GOCCs (in million pesos)
BSP 861.7 GSIS 610.5 PHIC 493.9 TLRC 415.8 SBMA 386.5 PNOC 382.1 SSS 268.7 NDC 230.0 Total 16,423.1
3.2.8 Water, Illumination and Power Services – P5.8 billion
Expenses for Water, Illumination and Power Services amounted to P5.8 billion, higher by P315.1 million or 5.7 percent than last year’s P5.5 billion. Shown in Table 38 are GOCCs which reported huge amount of this expenditure item.
Table 38. GOCCs that Reported
Huge Expenses for Water, Illumination and Power Services
(in million pesos) GOCC Amount
PEZA 3,286.8 MIAA 373.2 PAGCOR 317.4 BSP 211.7 GSIS 129.2 PTrA 125.3 SSS 122.9
Of the aggregate amount, P3.3 billion or 56.9 percent was incurred by PEZA as
support for the establishment in the country of industrial estates, export processing zones and free trade zones for agro-industrial and industrial activities and tourist and recreational complex.
3.2.9 Taxes, Duties and Fees – P5.7 billion
This account exhibited an increase of P219.2 million over last year’s P5.5 billion.
BSP reported this expense at P1.8 billion which was incurred for final tax on interest income, documentary stamp tax, transfer tax on acquired assets, value added tax and local taxes and fees.
Taxes, Duties and Fees of NPC totaling P1 billion include taxes and licenses, custom
duties, realty and franchise tax provided under the Local Government Code.
41

GOCCs that incurred huge amount of expenses for taxes are shown in Table 39.
Table 39. GOCCs that Incurred
Huge Amount for Taxes (in million pesos)
GOCC Amount BSP 1,760.9 NPC 1,046.1 LBP 818.1 DBP 473.2 PPA 410.3 HDMF 263.4 NFA 135.9 BCDA 126.0 PDIC 107.5
3.2.10 Provision for Insurance Losses – P3.1 billion
Total expenses of P3.1 billion for this particular item was incurred by BSP to fund the self-insurance scheme for the fidelity bond of bank officers and staff with cash and gold accountabilities in excess of P100 million and potential losses that are in excess of what are presently covered by the insurance policy written by GSIS charged against the insurance fund created for the purpose.
3.3 Capital Outlays – P868.3 million
Capital expenditures were reported by PAGCOR only as a result of an accounting
procedure whereby capital outlays are treated as outright expenses. During the year, PAGCOR incurred a total of P868.3 million for the acquisition of Bingo furniture, fixtures and equipment, transportation equipment, chips and tokens, casino improvements and other capital expenditures. This year’s capital expenditures increased by P147.7 million or 20.5 percent from last year’s figure of P720.6 million.
4.0 Share of the National Government on the Income of GOCCs – P9.8 billion
Presidential Decree No.1869 dated July 11, 1983 requires PAGCOR to remit to the National Government 50 percent of its aggregate gross earnings while Executive Order No. 298 requires MIAA to remit 20 percent of its operating income based on actual cash collection excluding payment of utilities and terminal fee collections. Pursuant thereto, a total amount of P9.8 billion was remitted during the year, P9.2 billion by PAGCOR and P613.5 million by MIAA. The aggregate amount remitted this year is P1.3 billion higher than last year’s P8.5 billion with the total increase accounted for by PAGCOR.
5.0 Provision for Income Tax – P4 billion
This year’s provision for income tax totaled P4 billion, up by P261.4 million from previous year’s level of P3.7 billion. It consists of normal tax, minimum corporate income tax, and final tax.
42

STATEMENT OF CASH FLOWS
The Statement of Cash Flows of the GOCCs summarizes all the cash activities for fiscal year 2004. This includes Operating, Investing and Financing Activities which provide information on cash receipts and cash payments made during the year.
Out of 121 cash flow statements, 90 were presented under the Direct Method while 31 were under the
Indirect Method. Cash inflows from all activities totaled P1,063.2 billion, broken down as follows: Operating – P447.7 billion or 42.1 percent, Investing – P309.3 billion or 29.1 percent, and Financing – P306.2 billion or 28.8 percent. Total cash inflows of P1,063.2 billion is 28.8 percent higher than the previous year’s P825.4 billion.
Total cash outflows reached P1.1 billion, composed of Operating – P381.2 billion or 33.7 percent, Investing – P458.4 billion or 40.5 percent, and Financing – P291.9 billion or 25.8 percent. Compared to the previous year, an increase of P341 billion, representing 43.1 percent is noted. Financing Activities posted the biggest increase of 88.7 percent in cash outflows. Net Cash Used by all activities amounting to P68.3 billion, and the Effects of Exchange Rate Changes of P1.7 billion resulted to a net decrease in Cash and Cash Equivalents by P66.6 billion. From last year’s balance of P54.2 billion, Cash and Cash Equivalents decreased by P120.8 billion or 222.8 percent. Table 40 shows the comparative cash flows from Operating, Investing, and Financing Activities.
Table 40. Cash Flows from Operating, Investing and Financing Activities (in million pesos)
Increase (Decrease) Particulars 2004 2003 Amount Percent Cash Inflows Operating Investing Financing Less: Cash Outflows Operating Investing Financing Net Cash Provided by (Used In) Effects of Exchange Rate Changes on Cash and Cash Equivalents Increase (Decrease) in Cash and Cash Equivalents Add: Cash and Cash Equivalents, Beginning of Year Cash and Cash Equivalents, End of Year
1,063,202.1 447,739.7 309,293.9 306,168.5
1,131,494.2 381,188.9 458,400.1 291,905.2
(68,292.1)
1,684.0
(66,608.2)
641,816.9
575,208.7
825,386.7 313,170.3 224,355.5 287,860.9 790,440.1 267,109.7 368,633.5 154,696.9
34,946.6
19,293.7
54,240.3
634,246.6
688,486.9
237,815.4 134,569.4
84,938.4 18,307.6
341,054.1 114,079.2
89,766.6 137,208.3
(103,238.7)
(17,609.7)
(120,848.5)
7,570.3
(113,278.2)
28.8 43.0 37.9
6.4 43.1 42.7 24.4 88.7
(295.4)
(91.3)
(222.8)
1.2
(16.5) Difference between totals and sum of components is due to rounding off
1.0 Operating Activities
Cash flows from Operating Activities are derived from principal revenue producing activities of GOCCs. During the year, net cash provided by Operating Activities reached P66.6 billion, higher by P20.5 billion or 44.5 percent compared to last year’s P46.1 billion. Total cash inflows reached P447.7 billion, while total cash outflows registered at P381.2 billion. Cash inflows and cash outflows showed increases of P134.6 billion and P114.1 billion, respectively as shown in Table 40.
Forty two percent or P187.5 billion of total cash inflows of P447.7 billion came from collections
of operating income, constituting 41.9 percent of the total cash inflows. Other sources were:
43
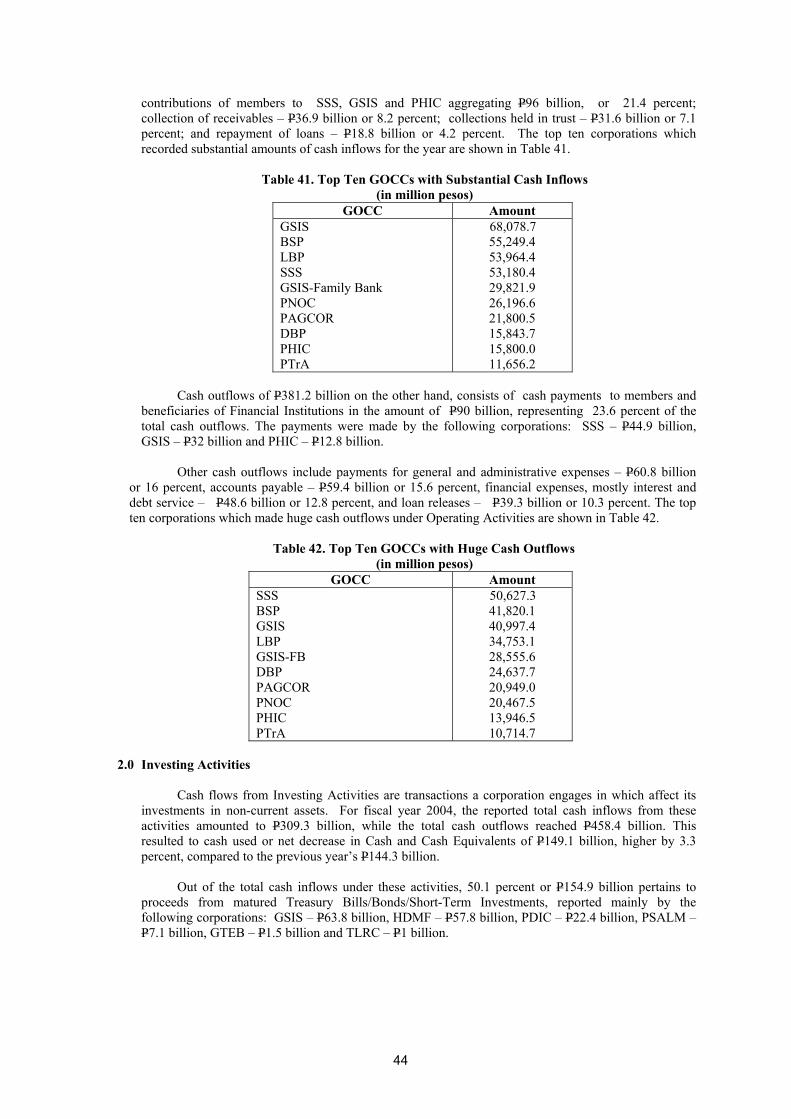
contributions of members to SSS, GSIS and PHIC aggregating P96 billion, or 21.4 percent; collection of receivables – P36.9 billion or 8.2 percent; collections held in trust – P31.6 billion or 7.1 percent; and repayment of loans – P18.8 billion or 4.2 percent. The top ten corporations which recorded substantial amounts of cash inflows for the year are shown in Table 41.
Table 41. Top Ten GOCCs with Substantial Cash Inflows
(in million pesos) GOCC Amount
GSIS BSP LBP SSS GSIS-Family Bank PNOC PAGCOR DBP PHIC PTrA
68,078.7 55,249.4 53,964.4 53,180.4 29,821.9 26,196.6 21,800.5 15,843.7 15,800.0 11,656.2
Cash outflows of P381.2 billion on the other hand, consists of cash payments to members and
beneficiaries of Financial Institutions in the amount of P90 billion, representing 23.6 percent of the total cash outflows. The payments were made by the following corporations: SSS – P44.9 billion, GSIS – P32 billion and PHIC – P12.8 billion.
Other cash outflows include payments for general and administrative expenses – P60.8 billion
or 16 percent, accounts payable – P59.4 billion or 15.6 percent, financial expenses, mostly interest and debt service – P48.6 billion or 12.8 percent, and loan releases – P39.3 billion or 10.3 percent. The top ten corporations which made huge cash outflows under Operating Activities are shown in Table 42.
Table 42. Top Ten GOCCs with Huge Cash Outflows (in million pesos)
GOCC Amount SSS BSP GSIS LBP GSIS-FB DBP PAGCOR PNOC PHIC PTrA
50,627.3 41,820.1 40,997.4 34,753.1 28,555.6 24,637.7 20,949.0 20,467.5 13,946.5 10,714.7
2.0 Investing Activities
Cash flows from Investing Activities are transactions a corporation engages in which affect its
investments in non-current assets. For fiscal year 2004, the reported total cash inflows from these activities amounted to P309.3 billion, while the total cash outflows reached P458.4 billion. This resulted to cash used or net decrease in Cash and Cash Equivalents of P149.1 billion, higher by 3.3 percent, compared to the previous year’s P144.3 billion.
Out of the total cash inflows under these activities, 50.1 percent or P154.9 billion pertains to
proceeds from matured Treasury Bills/Bonds/Short-Term Investments, reported mainly by the following corporations: GSIS – P63.8 billion, HDMF – P57.8 billion, PDIC – P22.4 billion, PSALM – P7.1 billion, GTEB – P1.5 billion and TLRC – P1 billion.
44
Other sources of inflows were: collection of non-current receivables of P73.3 billion out of
which, P72.6 billion was repayment of various loans from members of GSIS and HDMF amounting to P44.8 billion and P27.7 billion, respectively. The remaining P692.6 million represents collections from investments on assets and securitization, and PDIC’s collection from Banco de Oro regarding recoveries from the First E-Bank. Other inflows include the following: GSIS’s proceeds from reverse repurchase – P21.2 billion, redemption/sale of securities/bonds/stocks – P18 billion, and PDIC’s receipts from BSP regarding financial assistance granted to banks – P15.8 billion. The top five corporations with huge inflows were: GSIS – P142.5 billion, HDMF – P85.5 billion, PDIC – P38.8 billion, BSP – P17.7 billion, and PSALM – P7.1 billion.
Total cash outflows from Investing Activities amounted to P458.4 billion, out of which, P197.7
billion or 43.1 percent was invested and/or placed in retail Treasury Bonds, Stocks, Marketable Securities, Special Fund, and Deposit. Substantial outflows were reported by GSIS – P85.4 billion, PDIC - P27.6 billion, LBP – P10.3 billion, PHIC – P6.8 billion, BSP – P3.9 billion, DBP – P2.9 billion and TLRC – P1.2 billion. Cash outflows for loans/advances amounted to P102 billion, out of which P101.9 billion was released by GSIS, HDMF, HGCC, and SSS. The top five corporations with huge cash outflows under these activities were: GSIS – P165.8 billion, HDMF – P88.2 billion, BSP – P87.1 billion, PDIC – P42.3 billion, and LBP – P11.2 billion.
3.0 Financing Activities
Financing Activities are cash transactions a corporation engages in to acquire and repay capital.
During the year, the total cash provided under these activities amounted to P14.3 billion, registering a significant decrease of 89.3 percent from last year’s P133.2 billion. Total cash inflows was recorded at P306.2 billion while outflows reached P291.9 billion, showing an increase of P18.3 billion and P137.2 billion, respectively (Table 40).
Almost 58 percent or P178.6 billion of the total cash inflows under this category came from
borrowings in the form of loans and stocks, and bonds issued. Advances/subsidy from GOCCs/NGs amounted to P60.5 billion or 21 percent, P59.1 billion of which was given to NPC. The BSP’s net issue of circulating currency amounted to P27.7 billion or 9.1 percent while inflows from HDMF members contribution reached P12.3 billion or 11.9 percent. The Philippine Reclamation Authority (PRA) also reported substantial inflows of P3.7 billion or 3.6 percent pertaining to advances from National Government.
Cash outflows of P291.9 billion consists mainly of payment of loans, bonds payable, and
redemption of capital stocks amounting to P148.5 billion or 50.9 percent of the total outflows. The balance of P143.4 billion or 49.1 percent is composed of the following items: advances – P63 billion, fees/deposit/lease obligations – P43.2 billion, loans of P15.3 billion, dividends paid to national government/other investors, provident benefit claims, remittance of net income, interest expense and other charges to capital – P21.9 billion. Among the corporations which reported large outflows were BSP – P58.1 billion, GSIS Family Bank – P14.4 billion, PNOC – P14 billion, PDIC – P10.4 billion, and LBP – P10.2 billion.
The Effects of Foreign Exchange Rate Fluctuations on cash balances amounting to P1.7 billion is included in the cash flows of GOCCs with foreign currency transactions. The BSP recorded an increase of P1.7 billion, while MWSS showed a decrease of P48.3 million.
The net cash flows from Operating, Investing and Financing Activities, including the Effects of
Foreign Exchange Rate Fluctuations on cash balances exhibited a decrease in Cash and Cash Equivalents of P66.6 billion. Corporations with significant increase/decrease in Cash and Cash Equivalents are presented in Table 43.
45

Table 43. GOCCs with Significant Increase/Decrease in Cash and Cash Equivalents
(in million pesos) Cluster/GOCC Increase Decrease Cluster/GOCC Increase Decrease Financial Public Utilities GSIS 2,265.9 PSALM 1,364.2 LBP 2,137.1 PPC 197.7 HDMF 1,138.7 NEA 53.7
NHMFC 903.6 BSP 84,571.8 PNOC 3,439.0 DBP 3,418.7 MWSS 536.6 HGC 1,700.2 LWUA 80.0 PHIC 657.4 PNR 7.4
Industrial and Area Development and Regulatory
Agricultural, Trading and Promotional
GTEB 69.3 PRRI 287.8 PRA 38.1 HSDC 136.4 CPA 36.1 PCA 91.8 PEATC 16.7 CITEM 40.6 PPA 130.6 KKK-PCA 31.2 SRA 128.5 NRDC 1.7 SBMA 121.5 CITC 1.6 ZCSEZA 32.7 PCPDSSD 0.1
Social, Cultural and Scientific OWWA 938.3 PAGCOR 416.0 PRA 50.6 PCMC 40.0 PCSO 621.4 TLRC 280.5 LCP 59.6 CCP 25.1
At the end of fiscal year 2004, the Statement of Cash Flows under the Direct and Indirect Method,
showed Cash and Cash Equivalents of P575.2 billion, lower by P113.3 billion or 16.5 percent from last year’s P688.5 billion. The balance of Cash and Cash Equivalents shown in the Balance Sheet as of December 31, 2004 does not reconcile with the aggregate cash shown in the Statement of Cash Flows, indicating a discrepancy of P64.2 million, as shown in Table 44.
Table 44. Reconciliation of Cash and Cash Equivalents
(in million pesos) Particulars Amount
Per Balance Sheet 575,272.9 Per Statement of Cash Flows 575,208.7 Difference 64.2 Difference accounted for as:
Marketable Securities as part of Cash and Cash Equivalents on the Balance Sheet 60.0 Cash and Cash Equivalents of GOCCs which did not submit Statement of Cash Flows 4.2 Total 64.2
46

List of Acronyms
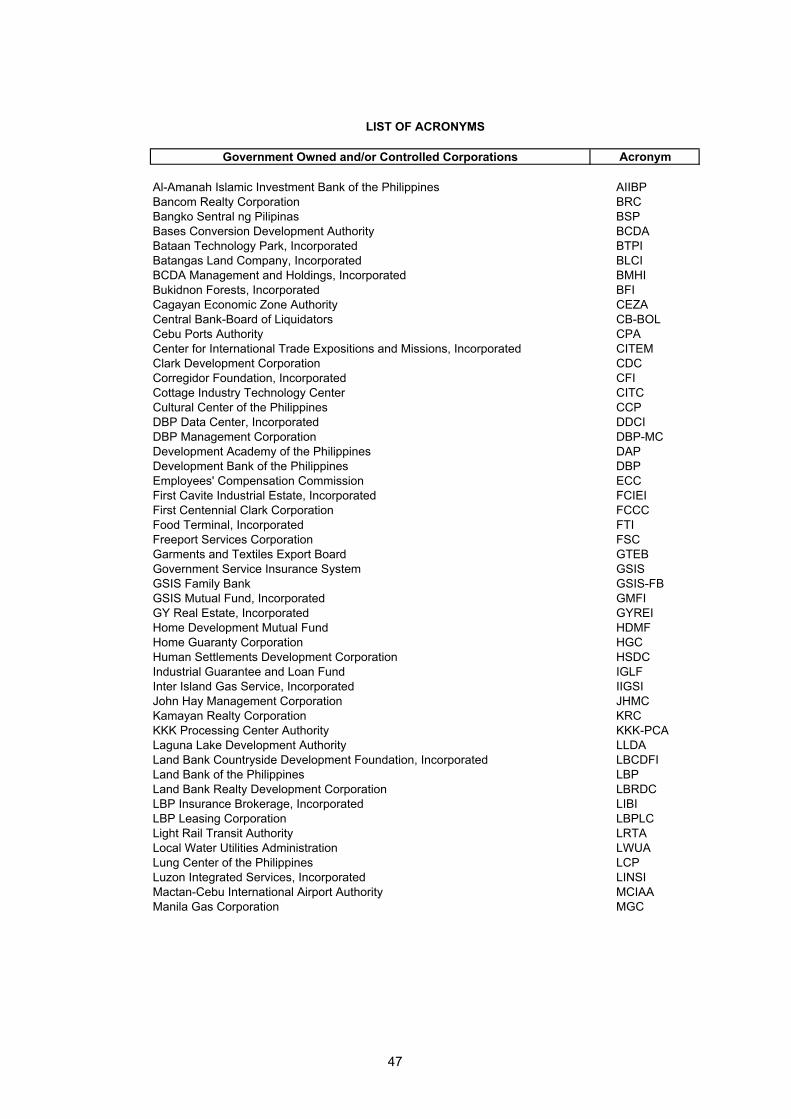
Government Owned and/or Controlled Corporations
Al-Amanah Islamic Investment Bank of the Philippines AIIBPBancom Realty Corporation BRCBangko Sentral ng Pilipinas BSPBases Conversion Development Authority BCDABataan Technology Park, Incorporated BTPIBatangas Land Company, Incorporated BLCIBCDA Management and Holdings, Incorporated BMHIBukidnon Forests, Incorporated BFICagayan Economic Zone Authority CEZACentral Bank-Board of Liquidators CB-BOLCebu Ports Authority CPACenter for International Trade Expositions and Missions, Incorporated CITEMClark Development Corporation CDCCorregidor Foundation, Incorporated CFICottage Industry Technology Center CITCCultural Center of the Philippines CCPDBP Data Center, Incorporated DDCIDBP Management Corporation DBP-MCDevelopment Academy of the Philippines DAPDevelopment Bank of the Philippines DBPEmployees' Compensation Commission ECCFirst Cavite Industrial Estate, Incorporated FCIEIFirst Centennial Clark Corporation FCCCFood Terminal, Incorporated FTIFreeport Services Corporation FSCGarments and Textiles Export Board GTEBGovernment Service Insurance System GSISGSIS Family Bank GSIS-FBGSIS Mutual Fund, Incorporated GMFIGY Real Estate, Incorporated GYREIHome Development Mutual Fund HDMFHome Guaranty Corporation HGCHuman Settlements Development Corporation HSDCIndustrial Guarantee and Loan Fund IGLFInter Island Gas Service, Incorporated IIGSIJohn Hay Management Corporation JHMCKamayan Realty Corporation KRCKKK Processing Center Authority KKK-PCALaguna Lake Development Authority LLDALand Bank Countryside Development Foundation, Incorporated LBCDFILand Bank of the Philippines LBPLand Bank Realty Development Corporation LBRDCLBP Insurance Brokerage, Incorporated LIBILBP Leasing Corporation LBPLCLight Rail Transit Authority LRTALocal Water Utilities Administration LWUALung Center of the Philippines LCPLuzon Integrated Services, Incorporated LINSIMactan-Cebu International Airport Authority MCIAAManila Gas Corporation MGC
Acronym
LIST OF ACRONYMS
47
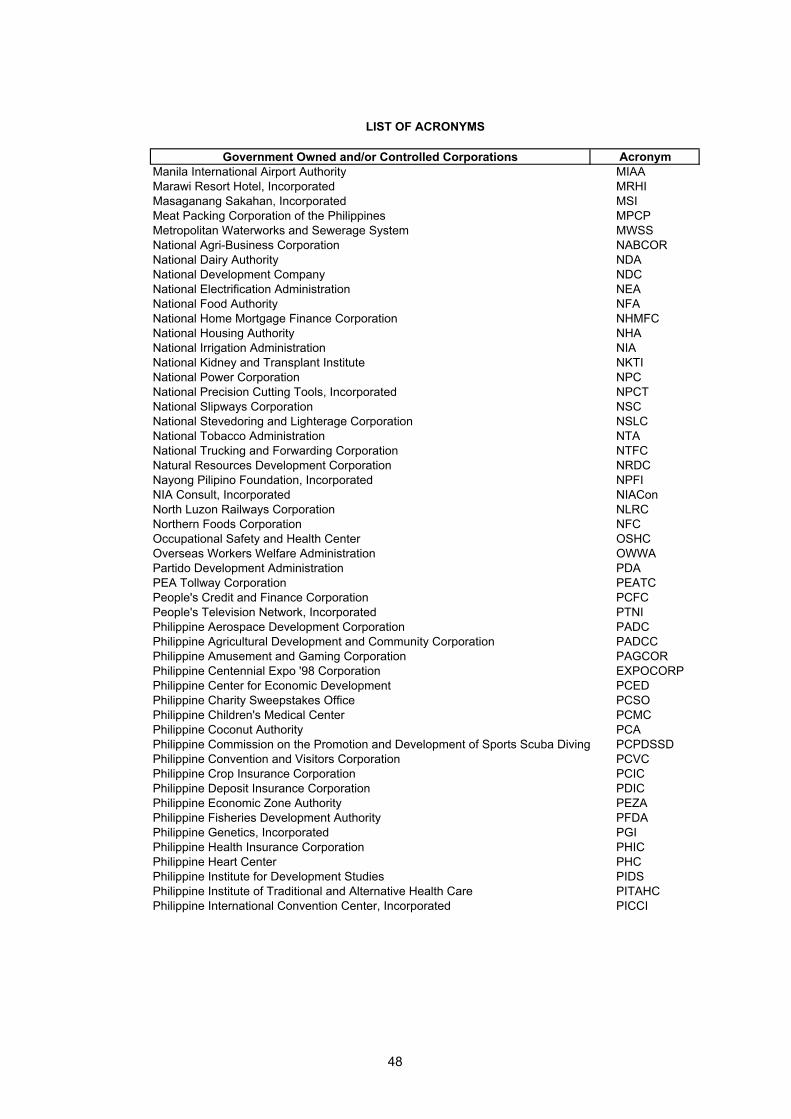
Government Owned and/or Controlled Corporations Acronym
LIST OF ACRONYMS
Manila International Airport Authority MIAAMarawi Resort Hotel, Incorporated MRHIMasaganang Sakahan, Incorporated MSIMeat Packing Corporation of the Philippines MPCPMetropolitan Waterworks and Sewerage System MWSSNational Agri-Business Corporation NABCORNational Dairy Authority NDANational Development Company NDCNational Electrification Administration NEANational Food Authority NFANational Home Mortgage Finance Corporation NHMFCNational Housing Authority NHANational Irrigation Administration NIANational Kidney and Transplant Institute NKTINational Power Corporation NPCNational Precision Cutting Tools, Incorporated NPCTNational Slipways Corporation NSCNational Stevedoring and Lighterage Corporation NSLCNational Tobacco Administration NTANational Trucking and Forwarding Corporation NTFCNatural Resources Development Corporation NRDCNayong Pilipino Foundation, Incorporated NPFINIA Consult, Incorporated NIAConNorth Luzon Railways Corporation NLRCNorthern Foods Corporation NFCOccupational Safety and Health Center OSHCOverseas Workers Welfare Administration OWWAPartido Development Administration PDAPEA Tollway Corporation PEATCPeople's Credit and Finance Corporation PCFCPeople's Television Network, Incorporated PTNIPhilippine Aerospace Development Corporation PADCPhilippine Agricultural Development and Community Corporation PADCCPhilippine Amusement and Gaming Corporation PAGCORPhilippine Centennial Expo '98 Corporation EXPOCORPPhilippine Center for Economic Development PCEDPhilippine Charity Sweepstakes Office PCSOPhilippine Children's Medical Center PCMCPhilippine Coconut Authority PCAPhilippine Commission on the Promotion and Development of Sports Scuba Diving PCPDSSDPhilippine Convention and Visitors Corporation PCVCPhilippine Crop Insurance Corporation PCICPhilippine Deposit Insurance Corporation PDICPhilippine Economic Zone Authority PEZAPhilippine Fisheries Development Authority PFDAPhilippine Genetics, Incorporated PGIPhilippine Health Insurance Corporation PHICPhilippine Heart Center PHCPhilippine Institute for Development Studies PIDSPhilippine Institute of Traditional and Alternative Health Care PITAHCPhilippine International Convention Center, Incorporated PICCI
48

Government Owned and/or Controlled Corporations Acronym
LIST OF ACRONYMS
Philippine International Trading Corporation PITCPhilippine National Lines PNLPhilippine National Oil Company PNOCPhilippine National Railways PNRPhilippine Ports Authority PPAPhilippine Postal Corporation PPCPhilippine Postal Savings Bank PPSBPhilippine Reclamation Authority PRAPhilippine Retirement Authority PRAPhilippine Rice Research Institute PRRIPhilippine Sugar Corporation PHILSUCORPhilippine Tourism Authority PTrAPHIVIDEC Industrial Authority PIAPinagkaisa Realty Corporation PRCPNOC Coal Corporation PNOC-CCPNOC Development and Management Corporation PNOC-DMCPNOC Energy Development Corporation PNOC-EDCPNOC Exploration Corporation PNOC-ECPNOC Malampaya Production Corporation PNOC-MPCPNOC Petrochecmical Development Corporation PNOC-PDCPNOC Shipping and Transport Corporation PNOC-STCPoro Point Management Corporation PPMCPower Sector Assets and Liabilities Management Corporation PSALM CorpQuedan and Rural Credit Guarantee Corporation QUEDANCORSmall Business Guarantee and Finance Corporation SBGFCSocial Security System SSSSubic Bay Metropolitan Authority SBMASugar Regulatory Administration SRATacoma Bay Shipping Company, Incorporated TBSCITechnology and Livelihood Research Center TLRCTrade and Investment Development Corporation of the Philippines TIDCORPZamboanga City Special Economic Zone Authority ZCSEZAZNAC Rubber Estate Corporation ZREC
49
COMMISSION ON AUDIT KEY OFFICIALS
and
GOVERNMENT ACCOUNTING and FMIS
OFFICIALS and STAFF
• As of submission date

COMMISSION ON AUDIT KEY OFFICIALS
COMMISSION PROPER
GUILLERMO N. CARAGUE Chairman
EMMANUEL M. DALMAN REYNALDO A. VILLAR Commissioner Commissioner
Assistant Commissioners
ROBERTO B. CATLI
FLERIDA V. CREENCIA
ARCADIO B. CUENCO, JR.
LOURDES B. DIMAPILIS
EMMA M. ESPINA
JUANITO G. ESPINO, JR.
SOFRONIO L. FLORES, JR.
RAQUEL R. HABITAN
CARMELA S. PEREZ

KEY OFFICIALS CORPORATE GOVERNMENT SECTOR
JUANITO G. ESPINO, JR. Assistant Commissioner
TITO S. NABUA Director IV
Cluster I – Financial A
ROSEMARIE L. LERIO Director IV
Cluster II – Financial B
JAIME P. NARANJO Director IV
Cluster III – Public Utilities
DIBAGULUN M. GANDAMRA Director IV
Cluster IV – Industrial and Area Development and Regulatory
RODULFO J. ARIESGA Director IV
Cluster V – Agricultural, Trading and Promotional
ROLAND A. REY Director IV
Cluster VI – Social, Cultural and Scientific

DIVINIA M. ALAGON Director III
Cluster I – Financial A
MA. CRISTINA D. DIMAGIBA Director III Cluster IV – Industrial and Area Development and Regulatory
AMANTE A. LIBERATO
Director III Cluster III – Public Utilities
AIDA MARIA A. TALAVERA Director III
Cluster V – Agricultural, Trading and Promotional

Lualhati F. Azuero - State Auditor IVDinah B. Pagao - Administrative Officer III
Elizabeth D. Ducay - State Auditor ITeresita P. Reyes - State Auditor I
Editha C. Ramirez - Secretary IIMaria C. Lainez - Process ServerRufa L. Gunabe - Process Server
Roberto L. Palita, Jr. - MessengerLolita N. Silva - Utility Worker II
NATIONAL I NATIONAL II
CORAZON A. SALDIVAR - State Auditor V ESTELA C. DELA PAZ - State Auditor V(Chief of Division) (Chief of Division)
Fidela S. Gonzaga - State Auditor IV Emelita V. Cayetano - State Auditor IVAgustina Q. Baseo - State Auditor IV Marilyn C. Bibat - State Auditor IV
Amelia F. Guevarra - State Auditor III Rosa Maria V. Santiago - State Auditor IIIMa. Lourdes D. Marayan - State Auditor II Mercedes D. Empleo - State Auditor II
Zenaida P. Balmes - State Auditor II Josefino O. Lainez - State Auditor IIHazel M. Sarmiento - State Auditing Cristina C. Gungon - State Auditor I
Examiner II
LOCAL I LOCAL II
ELENA B. MONTEZA - State Auditor V EDITHA M. RAMIREZ - State Auditor V(Chief of Division) (Chief of Division)
Esperanza V. Oreas - State Auditor IV Anicia H. Guillermo - State Auditor IVLydia L. Asiado - State Auditor III Imelda G. Celso - State Auditor III
Wilhelmina A. Maghari - State Auditor III Susan C. Vega - State Auditor IIElmer M. Grande - State Auditor III Avelina G. Marquez - State Auditor II
Lorelei L. Datu - State Auditor II Maribel G. Cablayan - State Auditor IAida A. Donasco - State Auditor II Narcisa S. dela Rosa - State Auditor I
MARIETTA M. LORENZODirector IV
OFFICE OF THE DIRECTOR
GOVERNMENT ACCOUNTING AND FMIS
Assistant CommissionerCARMELA S. PEREZ, DBA
CORPORATE I CORPORATE II
CECILIA B. CAMON - State Auditor V JUANITA B. ABE - State Auditor V(Chief of Division) (Chief of Division)
Salome L. Llaguno - State Auditor IV Thelma F. Panganiban - State Auditor IVFe O. Villanueva - State Auditor III Annabella P. Gabiran - State Auditor III
Susana M. de Guzman - State Auditor II Aurea J. Elmido - State Auditor IIAngelita C. Lomentigar - State Auditor II Guillermo S. Malabanan - State Auditor II
Joven L. Recto - State Auditing Ma. Belen L. Estuaria - State Auditor IIExaminer II
ACCOUNTING RESEARCH
PERLEGIO S. PADERES - State Auditor V(Chief of Division)
Annabelle A. Puserio - State Auditor IVCarmen Z. Zafe - State Auditor IV
Rudy M. Villareña - State Auditor IVRomeo C. Cruz - State Auditor IV
Ma. Francisca C. Medialdea - State Auditor IIJorgen Z. Fulleros - State Auditor II
Virgilita A. Cabachete - State AuditingExaminer II
Mary Beverly C. Flores - Clerk III

![PROJECTS...6 specified in the Treaty or International or Executive Agreement. (2016 revised IRR, Section 5[b]). GFI – Government Financial Institution. GOCC – Government-owned](https://static.fdocuments.us/doc/165x107/60d0f3c3a141bd7bfc68b66a/projects-6-specified-in-the-treaty-or-international-or-executive-agreement.jpg)