2004-2005 Exit Cohort Five-Year Longitudinal Study
20
AUTOMATED FOLLOW-UP SYSTEM 2010 Report SNAP Employment & Training: 2004-2005 Exit Cohort Five-Year Longitudinal Study Hiwot Berhane and Jesse Sampson Contact: [email protected]
Transcript of 2004-2005 Exit Cohort Five-Year Longitudinal Study

AUTOMATED FOLLOW-UP SYSTEM 2010 Report
SNAP Employment & Training:
2004-2005 Exit Cohort
Five-Year Longitudinal Study
Hiwot Berhane and Jesse Sampson Contact: [email protected]

Automated Follow-up System 2010 Report | 2
SNAP Employment and Training is one of the only federal programs designed solely to provide targeted employment and training resources to help extremely low-skilled, low-income adults achieve economic self-sufficiency.
—National Skills Coalition Report, 2011 The Supplemental Nutrition Assistance Program Employment & Training (SNAP E&T) program promotes long-term self-sufficiency and independence by preparing SNAP recipients for employment through work-related education and training activities. The goal of SNAP E&T is to assist SNAP recipients in obtaining employment, including provision of work opportunities for 18- to 50-year-old Able-Bodied Adults Without Dependents (ABAWDs) through participation in work programs and education and training activities. The SNAP population comprises many individuals with severe barriers to employment including a lack of education, skills and employment history (National Skills Coalition 2011). In the Texas PY 2009 SNAP E&T cohort population, for example, one-third of the cohort had less than a high school degree or GED while only one in five had any postsecondary education. Fully 44 percent were males with no postsecondary education. Employment and training services are often otherwise unavailable to SNAP recipients who do not receive Temporary Assistance for Needy Families/TANF). Thus, SNAP E&T plays a vital role in the Texas workforce delivery system for individuals facing high barriers to employment. SNAP E&T is currently under discussion at the national level as Congress considers the program as part of deliberations surrounding the 2012 “Farm Bill.” For a description of SNAP E&T in Texas including eligibility and services, visit http://www.twc.state.tx.us/welref/supplemental-nutrition-assistance-program-overview.html
Automated Follow-up System 2010 Report | 3
Methodology The Labor Market and Career Information (LMCI) division of TWC received the original program year 2009 (PY2009) file containing 274,606 seed records for the Choices program. Each seed record represents a unique program service event associated with a participant Social Security Number (SSN). Because many participants received more than one service, the input file included many duplicates of the same SSN. The records were grouped by SSN and service code in order to eliminate as much duplication as possible, and records with service codes not used by the Choices program were deleted. We then deleted records with invalid registration dates. Once that was complete, the records were unduplicated by SSN and by activity. If a participant appeared in more than one activity, the record for the activity of priority was retained and other record was deleted. This left 25,900 unique seed records for analysis. Purpose of the Report Senate Bill 281 (2003) requires the Texas Workforce Commission (TWC) to, at least annually, issue an analysis of the job placement performance of each workforce development program by occupation and by training provider (possibly including other relevant data), for the previous one-year, three-year, and five-year periods. TWC’s Labor Market and Career Information (LMCI) department fulfills this mandate. We provide these data in the spirit of continuous improvement and do not seek to single out or punish any program, provider or geography. LMCI’s mission is to improve the way Texans make career and educational decisions by providing useful and reliable information about careers, educational training options and jobs. For more information, visit www.lmci.state.tx.us. Structure of the Report This report addresses the set of individuals (cohort) that exited Choices programs in 2007-2009. The report examines a snapshot of the cohort’s outcomes, i.e. their employment and median earnings, in the fourth quarter of 2009 (Q42009). Three-year and five-year snapshots of this cohort’s outcomes in Q42012 and Q42014 will be added to the report as the data become available. The report’s body provides a high-level overview and analysis of the data. Detailed tables of all measures discussed can be found in appendix A. All data are from LMCI’s follow-up analysis unless otherwise noted. Methodology If the linkage to the Q42009 UI Wage Record database records resulted in a match for any program participant, that participant’s earnings and the North American Industry Classification System (NAICS) code for the employer of record were both retained for analysis. If a participant was found employed by more than one employer, the sum of the participant’s earnings and the NAICS code of the employer paying the most wages were retained for analysis. Caveats About the Data and Analysis To our knowledge, there is no better source of data on labor market outcomes than UI wage records, but these data have some limitations. UI wage records do not cover individuals engaged in certain types of employment ranging from domestic workers to railroads. The collection of UI wage data involves editing to clean incoming data, but

Automated Follow-up System 2010 Report | 4
inaccurate records may remain in the system unless and until a claim for UI benefits is filed. SSNs are not validated against a national database: fraudulent SSNs may be present in the data as well as multiple individuals using one SSN (leading to outlandishly high earnings in some cases). Neither occupational title nor hours worked per quarter are reported, preventing us from calculating hourly wage and determining relatedness of training to employment or part-time/full-time status. This characteristic of the data sometimes leads to very low earnings in the case of individuals who worked for only part of a quarter we sampled. Despite these limitations, data from UI wage records provide an invaluable glimpse of post-exit achievements of workforce training participants.
The period 2005-2009 was characterized by extreme economic volatility due to the collapse of the U.S. housing market and subsequent global financial crisis. As a result, the unemployment rate of the U.S. and of Texas both increased markedly: from 5.2 percent to 8.1 percent in Texas and from 5.0 to 9.9 percent nationally.1 The Texas median worker’s earnings grew by 6.8 percent from 2005-2009 on a current-dollar basis.2 After adjusting for inflation, we see that the Texas median worker experienced a loss in earnings over the period of 2.76 percent.3 Many factors, particularly the dynamics of the local economy and interplay with national and international trends all drive the metrics we use. The metrics tell part of the story about performance, but should not be used alone to make judgments about the quality (or lack thereof) of a single provider, Workforce Development Area or program.
1 US Bureau of Labor Statistics Local Area Unemployment Statistics.
2 US Census Bureau, American Community Survey One-Year Estimates, Median Worker Earnings divided by four to derive median quarterly earnings.
3 LMCI uses the Bureau of Labor Statistics’ Consumer Price Index (CPI) to adjust for inflation. We solve the equation E2/E1=CPI2/CPI1 where E1 = current-dollar earnings, E2=adjusted earnings, CPI1=average CPI for past years and CPI2=average CPI for 2009.

Automated Follow-up System 2010 Report | 5
Figure 1: Employment by Selected Characteristics
Results: Exit Cohort Figure 1 displays change in labor market outcome measures for the 2004-2005 SNAP E&T exit
cohort by selected demographic characteristics. ABAWDs saw a larger loss in employment and a
smaller gain in earnings than
the general SNAP population,
possibly indicating greater
barriers to employment for
this group.
Females again had superior
labor market outcomes to
makes.
African-American/Black
customers had the highest
median quarterly earnings
growth but had a greater loss
in employment than other
groups. At the same time,
Asian and Hawaiian/Pacific
Islander customers had the
lowest losses in employment
but had relatively small gains
in median quarterly earnings.
Younger customers tended to
have better labor market
trends over the period as they
are likely to enter
employment for the first time.

Automated Follow-up System 2010 Report | 6
Figure 2: Distribution of (Nonzero) Median Quarterly Earnings
Over the period 2005-2009 we see a dramatic improvement in the earnings distribution for this
exit cohort. The distribution became much more equitable, with the median increasing by two-
thirds over the period. The greatest change was seen in the lowest-earning “bin” of individuals
(less than $1,600)—over 6,000 were found in this earnings range in 2005, while fewer than
3,000 were found in the same range in 2009.

Automated Follow-up System 2010 Report | 7
Figure 3: Employment and Median Quarterly Earnings by LWDA
Participants in all Workforce Development Areas were employed at a lower rate in 2005 than in
2009. The smallest losses were seen in South Texas and the Rio Grande Valley, with the percent
found employed staying nearly flat in Lower Rio Grande Valley WDA (McAllen-Harlingen area)
and falling by 3.3 percent in South Texas (Laredo area).
Median quarterly earnings more than doubled in South Plains WDA (Lubbock area). Relatively
small gains were observed in Rural Capital WDA (Round Rock-San Marcos area excluding
Travis County) and in Brazos Valley WDA (College Station-Bryan area).

Automated Follow-up System 2010 Report | 8
Home Health Care services increased its share of employment by 2.2 percent and was the
number one employer for the cohort in 2009, replacing the often temporary Employment
Services industry. General government support replaced Services to Buildings and Dwellings in
the top ten.
Table 1: Outcomes by Top Ten Industries, 2005
Industry of Employment N Working Median
Earning % of Employed
Employment Services 2,336 $1,893 15.2%
Home Health Care Services 1,051 $1,288 6.8%
Limited-Service Eating Places 1,024 $1,610 6.6%
Elementary and Secondary Schools 664 $2,170 4.3%
Other General Merchandise Stores 599 $2,714 3.9%
Full-Service Restaurants 550 $1,749 3.6%
Nursing Care Facilities 344 $2,487 2.2%
Grocery Stores 328 $2,283 2.1%
Services to Buildings and Dwellings 320 $1,947 2.1%
Gasoline Stations 309 $2,487 2.0%
Table 2: Outcomes by Top Ten Industries, 2009
Industry of Employment N Working Median
Earning
% of
Employed
Home Health Care Services 1,123 $2,168 9.0%
Employment Services 998 $2,843 8.0%
Limited-Service Eating Places 733 $2,684 5.9%
Elementary and Secondary Schools 630 $4,104 5.0%
Other General Merchandise Stores 490 $4,164 3.9%
Full-Service Restaurants 452 $2,935 3.6%
Nursing Care Facilities 368 $3,959 2.9%
Grocery Stores 287 $3,731 2.3%
Gasoline Stations 252 $3,828 2.0%
Executive, Legislative, and Other General Government Support 229 $6,786 1.8%
Automated Follow-up System 2010 Report | 9
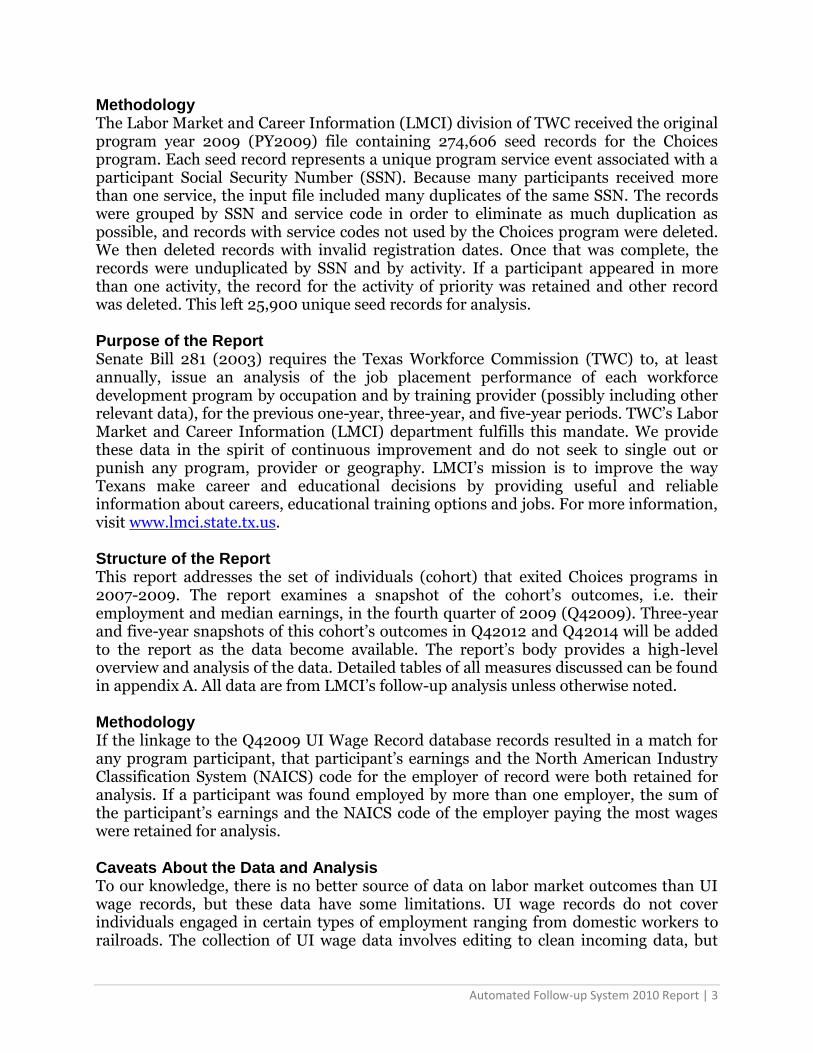
Figure 4: Employment by Selected Characteristics
Results: Retainers Most of the same trends that applied to the exit cohort as a whole also held true for retainers.
ABAWDs were retained at a
lower rate and had less earnings
growth than the general
population, and females
exceeded males in employment
retention and median quarterly
earnings growth.
Those under 21 were retained at
a comparable rate to those 22-
40, indicating that while many
of these individuals entered
employment, relatively few were
able to remain employed
steadily over the study period.

Automated Follow-up System 2010 Report | 10
Figure 5: Distribution of (Nonzero) Median Quarterly Earnings
Retainers also saw strong earnings growth and an improved earnings distribution. The number
of retainers in extreme poverty dwindled over the study period, many bringing in over $5,000 in
quarterly earnings as compared to 2005.

Automated Follow-up System 2010 Report | 11
Figure 6: Employment Retention and Median Quarterly Earnings by LWDA
In terms of emplyoment retention, South Texas again performed well, this time with South
Texas WDA in the lead followed by Lower Rio Grande and Coastal Bend (Victoria area). Central
Texas (Killeen area) faced a particularly difficult labor market with a retention rate of 34
percent. Earnings growth for retainers mirrored that for the cohort overall, with particularly
positive results seen in South Plains WDA and also in South East Texas WDA (Beaumont-Port
Arthur area).

Automated Follow-up System 2010 Report | 12
Most retainers were also employed in Home Health Care Services or Employment Services.
General Government Support had the highest median earnings of the top ten industries.
Table 3: Outcomes by Top Ten Industries
Industry of Employment N
Working
Median
Earning
% of
Retainers
Home Health Care Services 598 $2,494 8.1%
Employment Services 567 $3,716 7.7%
Elementary and Secondary Schools 430 $4,227 5.8%
Limited-Service Eating Places 392 $2,869 5.3%
Other General Merchandise Stores 308 $4,533 4.2%
Nursing Care Facilities 240 $4,149 3.2%
Full-Service Restaurants 225 $3,269 3.0%
Grocery Stores 162 $4,195 2.2%
Executive, Legislative, and Other General Government Support 155 $7,089 2.1%
General Medical and Surgical Hospitals 139 $6,425 1.9%

Automated Follow-up System 2010 Report | 13
Appendix A: Detailed Labor Market Outcomes (Cohort)
Table 4: Outcomes by Workforce Development Area, 2005
LWDA N % Working Median Earning
Alamo 1,742 62.8 $2,813
Capital Area 585 62.2 $3,000
Rural Capital 126 61.1 $3,196
Permian Basin 669 58.0 $2,446
Golden Crescent 729 57.9 $2,423
Concho Valley 327 57.5 $2,515
Tarrant County 1,224 56.9 $3,130
Heart of Texas 411 56.2 $2,704
North Texas 519 55.5 $2,241
South Texas 244 55.3 $2,678
North Central 669 54.6 $2,809
Dallas 2,458 54.6 $2,631
Brazos Valley 487 54.2 $2,887
West Central 526 53.8 $2,321
South East Texas 432 53.7 $2,002
Coastal Bend 1,037 52.6 $2,161
South Plains 326 52.5 $1,761
Central Texas 292 52.4 $2,171
Panhandle 392 51.5 $2,076
Unknown 812 51.5 $2,458
East Texas 546 51.3 $2,222
Gulf Coast 9,038 49.9 $2,597
Middle Rio Grande 481 49.1 $2,025
Upper Rio Grande 790 49.0 $1,939
Deep East Texas 986 47.3 $1,991
Lower Rio Grande Valley 2,537 46.8 $2,035
Cameron County 403 45.2 $1,930
North East Texas 466 44.4 $1,866
Texoma 194 43.8 $2,748
Total 29,448 52.3 $2,459

Automated Follow-up System 2010 Report | 14
Table 5: Outcomes by Workforce Development Area, 2009
LWDA N % Working Median Earning
South Texas 244 52.1 $3,897
Alamo 1,742 49.4 $4,340
Golden Crescent 729 47.7 $3,630
Rural Capital 126 47.6 $4,336
Lower Rio Grande Valley 2,537 46.9 $3,698
Concho Valley 327 46.8 $4,402
Coastal Bend 1,037 46.6 $3,377
Capital Area 585 46.5 $4,655
Middle Rio Grande 481 42.8 $3,481
Brazos Valley 487 42.7 $4,079
West Central 526 42.0 $3,791
Tarrant County 1,224 42.0 $4,960
Unknown 812 41.9 $3,589
Gulf Coast 9,038 41.8 $4,487
Dallas 2,458 41.7 $4,423
North Central 669 41.4 $4,350
South Plains 326 41.1 $3,849
Upper Rio Grande 790 41.1 $3,519
South East Texas 432 41.0 $3,837
Permian Basin 669 40.7 $3,706
Heart of Texas 411 40.4 $3,968
Cameron County 403 39.7 $3,334
Panhandle 392 38.5 $3,400
Deep East Texas 986 37.9 $3,708
North Texas 519 35.8 $3,747
East Texas 546 35.2 $3,823
North East Texas 466 34.8 $3,509
Texoma 194 34.5 $3,906
Central Texas 292 31.5 $3,721
Total 29,448 42.5 $4,067

Automated Follow-up System 2010 Report | 15
Table 6: Outcomes by Gender, 2005
Gender N % Working Median Earning
Female 16,428 53.5 $2,188
Male 13,020 50.8 $2,890
Total 29,448 52.3 $2,459
Table 7: Outcomes by Gender, 2009
Gender N % Working Median Earning
Female 16,428 46.6 $3,865
Male 13,020 37.3 $4,553
Total 29,448 42.5 $4,067
Table 8: Outcomes by SNAP E&T Classification, 2005
Classification N % Working Median Earning
ABAWD 14,821 53.4 $2,496
E&T General Population 14,627 51.2 $2,420
Total 29,448 52.3 $2,459
Table 9: Outcomes by SNAP E&T Classification, 2009
Classification N % Working Median Earning
E&T General Population 14,627 45.8 $4,155
ABAWD 14,821 39.3 $3,986
Total 29,448 42.5 $4,067
Table 10: Outcomes by Ethnicity, 2005
Ethnicity N % Working Median Earning
Unknown 37 62.9 $2,611
Black 9,923 55.1 $2,361
Hispanic 11,092 52.9 $2,431
American Indian 296 52.7 $2,047
Asian 205 48.3 $2,933
White 7,852 48.0 $2,633
Hawaiian/Pacific Islander 43 46.5 $2,839
Total 29,448 52.3 $2,459

Automated Follow-up System 2010 Report | 16
Table 11: Outcomes by Ethnicity, 2009
Ethnicity N % Working Median Earning
Hispanic 11,092 46.5 $3,950
Hawaiian/Pacific Islander 43 44.2 $4,464
Asian 205 43.4 $4,356
Black 9,923 42.0 $4,078
White 7,852 37.8 $4,285
American Indian 296 36.2 $2,970
Unknown 37 34.3 $4,748
Total 29,448 42.5 $4,067
Table 12: Outcomes by Age, 2005
Age N % Working Median Earning
22- 40 13,997 55.7 $2,492
Less than 21 2,049 51.7 $1,580
41- 65 13,402 48.9 $2,586
Total 29,448 52.3 $2,459
Table 13: Outcomes by Age, 2009
Age N % Working Median Earning
Less than 21 2,049 50.3 $3,382
22- 40 13,997 46.3 $4,096
41- 65 13,402 37.3 $4,202
Total 29,448 42.5 $4,067

Automated Follow-up System 2010 Report | 17
Table 14. Higher Education Dashboard Summary of Linkage N
% of Cohort
Median Earnings
N % Higher Education Enrollment by Institution Type
Working Only 9,708 35.0 $4,172
2,622 82.0 Community/Technical Colleges & Career Schools/Colleges
Pursuing Higher Education Only 1,338 4.8 .
271 8.4 Public or Private Universities & Health Science Centers
Working & Pursuing High Ed. 1,861 6.7 $4,550
3,199 100.0 Total Found Enrolled
Subtotal for All Working 11,569 41.7 $4,227
All Enrolled 3,199 11.5 $4,550
Not Verified 14,813 53.4 .
Subtotal 27,720 100.0 $4,227
TX Vital Statistics 2,335 7.8 $2,185
Total 30,055 . $4,090
Top 10 LWDAs by Enrollment N Number Enrolled
%of All Enrolled
Top 10 Public Postsecondary Institutions
N % of All Enrolled
Top 10 Majors (6-digit Classification of Instructional Programs Code)
N % of All Enrolled
Gulf Coast 8,436 1,024 12.1 Houston Community
College 345 10.8 Liberal Arts and Sciences 366 12.8
Dallas 2,231 274 12.3 South Texas College 149 4.7 Nursing 234 8.2
Lower Rio Grande Valley 2,325 245 10.5 DCCCD El Centro 80 2.5 Undeclared 214 7.5
Alamo 1,667 170 10.2 Howard College 66 2.1 Business Operations
Support & Assistant 197 6.9
Tarrant County 1,129 124 11.0 El Paso CCD 65 2.0 Ground Transportation 148 5.2
Permian Basin 633 119 18.8 Victoria College 60 1.9 Criminal Justice and
Corrections 107 3.7
Coastal Bend 991 110 11.1 TSTC Harlingen 60 1.9 Human Development 92 3.2
Heart of Texas 395 82 20.8 Lone Star College - N.
Harris 59 1.8 Allied Health Professions 79 2.8
Upper Rio Grande 757 80 10.6 TSTC West Texas 57 1.8 Business Administration,
Management & Operations 78 2.7
Capital Area 548 74 13.5 Austin Community
College 56 1.8
Computer and Information
Sciences, General 73 2.6

Automated Follow-up System 2010 Report | 18
Appendix B: Detailed Labor Market Outcomes (Retainers)
Table 15: Outcomes by Workforce Development Area
LWDA N of
Retainers % Working
Median
Earnings
Median
Earnings
% Change,
Median
Earnings
South Texas 89 65.93 $2,912 $4,183 43.6%
Alamo 578 52.83 $3,285 $4,830 47.1%
Coastal Bend 284 52.11 $2,504 $3,757 50.1%
Lower Rio Grande Valley 618 52.06 $2,306 $3,973 72.3%
Middle Rio Grande 120 50.85 $2,224 $3,968 78.4%
Golden Crescent 214 50.71 $2,600 $4,339 66.9%
Concho Valley 95 50.53 $2,888 $5,081 75.9%
Brazos Valley 132 50 $3,417 $4,701 37.6%
Gulf Coast 2,200 48.75 $3,107 $5,164 66.2%
Dallas 652 48.58 $3,227 $4,960 53.7%
Texoma 41 48.24 $3,362 $4,366 29.9%
West Central 136 48.06 $2,705 $4,405 62.8%
Upper Rio Grande 184 47.55 $2,247 $4,034 79.5%
Capital Area 173 47.53 $3,954 $5,830 47.4%
Unknown 196 46.89 $2,710 $3,901 44.0%
North Central 171 46.85 $3,162 $4,738 49.8%
Rural Capital 36 46.75 $3,774 $5,350 41.8%
Tarrant County 321 46.12 $4,165 $5,518 32.5%
Deep East Texas 211 45.28 $2,388 $4,141 73.4%
Cameron County 82 45.05 $2,527 $4,159 64.6%
South East Texas 104 44.83 $2,289 $4,423 93.2%
Heart of Texas 100 43.29 $3,247 $4,549 40.1%
South Plains 74 43.27 $2,306 $4,353 88.8%
Permian Basin 159 40.98 $3,091 $4,032 30.4%
Panhandle 82 40.59 $2,449 $3,434 40.3%
East Texas 113 40.36 $2,800 $4,492 60.4%
North Texas 114 39.58 $2,942 $3,977 35.2%
North East Texas 80 38.65 $2,325 $4,156 78.8%
Central Texas 52 33.99 $3,132 $4,496 43.6%
Total 7,411 48.12 $2,894 $4,619 59.6%

Automated Follow-up System 2010 Report | 19
Table 18: Outcomes by Gender
Gender N of
Retainers % Working
Median
Earnings
Median
Earnings
% Change,
Median
Earnings
Female 4,640 52.82 $2,541 $4,336 70.6%
Male 2,771 41.88 $3,569 $5,255 47.2%
Total 7,411 48.12 $2,894 $4,619 59.6%
Table 17: Outcomes by SNAP E&T Classification
Classification N of
Retainers % Working
Median
Earnings
Median
Earnings
% Change,
Median
Earnings
E&T General Population 3,913 52.24 $2,769 $4,626 67.1%
ABAWD 3,498 44.22 $3,065 $4,603 50.2%
Total 7,411 48.12 $2,894 $4,619 59.6%
Table 18: Outcomes by Ethnicity
Ethnicity N of
Retainers % Working
Median
Earnings
Median
Earnings
% Change,
Median
Earnings
Hawaiian/Pacific Islander 13 65 $2,768 $5,029 81.7%
Asian 59 59.6 $3,138 $5,088 62.1%
Hispanic 3,023 51.56 $2,753 $4,426 60.8%
Black 2,584 47.26 $2,846 $4,692 64.9%
Unknown 11 45.45 $3,216 $4,748 47.6%
White 1,663 44.1 $3,253 $4,936 51.7%
American Indian 58 37.18 $3,251 $3,999 23.0%
Total 7,411 48.12 $2,894 $4,619 59.6%

Automated Follow-up System 2010 Report | 20
Table 19: Outcomes by Age
Age N of
Retainers % Working
Median
Earnings
Median
Earnings
% Change,
Median
Earnings
22-40 3,836 49.24 $2,916 $4,683 60.6%
Under 21 519 49.01 $1,926 $3,792 96.9%
41-65 3,056 46.65 $3,073 $4,697 52.8%
Total 7,411 48.12 $2,894 $4,619 59.6%