2003s-42 Is the Demand for Corporate Insurance a Habit? … · 2003-07-09 · to Steve Fortin,...
41
Montréal Juillet 2003 © 2003 M. Martin Boyer. Tous droits réservés. All rights reserved. Reproduction partielle permise avec citation du document source, incluant la notice ©. Short sections may be quoted without explicit permission, if full credit, including © notice, is given to the source. Série Scientifique Scientific Series 2003s-42 Is the Demand for Corporate Insurance a Habit? Evidence from Directors' and Officers' Insurance M. Martin Boyer
Transcript of 2003s-42 Is the Demand for Corporate Insurance a Habit? … · 2003-07-09 · to Steve Fortin,...

Montréal Juillet 2003
© 2003 M. Martin Boyer. Tous droits réservés. All rights reserved. Reproduction partielle permise avec citation du document source, incluant la notice ©. Short sections may be quoted without explicit permission, if full credit, including © notice, is given to the source.
Série Scientifique Scientific Series
2003s-42
Is the Demand for Corporate Insurance a Habit? Evidence from Directors' and Officers' Insurance
M. Martin Boyer

CIRANO
Le CIRANO est un organisme sans but lucratif constitué en vertu de la Loi des compagnies du Québec. Le financement de son infrastructure et de ses activités de recherche provient des cotisations de ses organisations-membres, d’une subvention d’infrastructure du ministère de la Recherche, de la Science et de la Technologie, de même que des subventions et mandats obtenus par ses équipes de recherche.
CIRANO is a private non-profit organization incorporated under the Québec Companies Act. Its infrastructure and research activities are funded through fees paid by member organizations, an infrastructure grant from the Ministère de la Recherche, de la Science et de la Technologie, and grants and research mandates obtained by its research teams.
Les organisations-partenaires / The Partner Organizations PARTENAIRE MAJEUR . Ministère du développement économique et régional [MDER] PARTENAIRES . Alcan inc. . Axa Canada . Banque du Canada . Banque Laurentienne du Canada . Banque Nationale du Canada . Banque Royale du Canada . Bell Canada . Bombardier . Bourse de Montréal . Développement des ressources humaines Canada [DRHC] . Fédération des caisses Desjardins du Québec . Gaz Métropolitain . Hydro-Québec . Industrie Canada . Ministère des Finances [MF] . Pratt & Whitney Canada Inc. . Raymond Chabot Grant Thornton . Ville de Montréal . École Polytechnique de Montréal . HEC Montréal . Université Concordia . Université de Montréal . Université du Québec à Montréal . Université Laval . Université McGill ASSOCIÉ AU : . Institut de Finance Mathématique de Montréal (IFM2) . Laboratoires universitaires Bell Canada . Réseau de calcul et de modélisation mathématique [RCM2] . Réseau de centres d’excellence MITACS (Les mathématiques des technologies de l’information et des systèmes complexes)
ISSN 1198-8177
Les cahiers de la série scientifique (CS) visent à rendre accessibles des résultats de recherche effectuée au CIRANO afin de susciter échanges et commentaires. Ces cahiers sont écrits dans le style des publications scientifiques. Les idées et les opinions émises sont sous l’unique responsabilité des auteurs et ne représentent pas nécessairement les positions du CIRANO ou de ses partenaires. This paper presents research carried out at CIRANO and aims at encouraging discussion and comment. The observations and viewpoints expressed are the sole responsibility of the authors. They do not necessarily represent positions of CIRANO or its partners.
Is the Demand for Corporate Insurance a Habit? Evidence from Directors' and Officers' Insurance*
M. Martin Boyer†
Résumé / Abstract
Une des grandes questions fondamentales qui demeurent en finance est pourquoi des firmes présumément neutres au risque achètent de l'assurance et gèrent leur risque. Notre hypothèse est que l'achat d'assurance est plus lié aux habitudes prises par les corporations qu'à une décision étudiée de gérer les risques. Étant donné la quasi-impossibilité d'obtenir des données publiques sur l'achat d'assurance des corporations et leur gestion de risques, nous examinons un aspect particulier de cette demande pour laquelle l'information existe dans le public, soit l'assurance de la responsabilité civile des administrateurs et des dirigeants. Cette information est disponible dans le public au Canada depuis 1993 seulement. Nos résultats suggèrent que la décision de s'assurer et le niveau de couverture semblent être déterminés uniquement par la décision de la firme à l'année précédente. Ainsi aucun facteur fondamental (santé financière ou gouvernance) de l'entreprise ne semble pouvoir expliquer la décision d'une entreprise de s'assurer ni la limite son type de couverture. Nous concluons que les corporations ne gèrent pas leur risque de manière optimale puisqu'elles semblent baser leur décision d'assurance davantage sur leurs habitudes que sur une stratégie claire et concise de gestion des risques d'entreprise. Par conséquent, et contrairement aux résultats obtenus par Core (1997, 2000) et Chalmers et al. (2002), nous ne trouvons aucune raison d’affirmer que l’achat d’assurance est lié à l’opportunisme des dirigeants.
Mots clés : Assurance de la responsabilité civile des administrateurs et des dirigeants, formation d'habitude, assurance des corporations, rémunération des conseils d'administration.
* I wish to thank seminar participants at McGill University, the University of Georgia, the Atlanta Finance Workshop at Georgia State University, ARIA and NFA for their insightful comments; including but not limited to Steve Fortin, Norma Neilsen, Chuck Nyce, Rob Hoyt and Richard Phillips. The valuable inputs of Robert Gagné and of Mathieu Delvaux-Derome are acknowledge. This paper would not have been possible without the able research assistance of Mathieu Richard in constructing the data set. This research was sponsored by SSHRC-Canada and by FCAR-Québec. The continuing financial support of Cirano is also gratefully acknowledged. † Associate Professor of Finance, HEC - Montréal, Université de Montréal. 3000 Côte-Sainte-Catherine, Montréal, QC H3T 2A7 Canada; and CIRANO, 2020 University Ave., 25th floor, Montréal, QC. Email: [email protected]

Of the many fundamental questions left unanswered in finance, one relates to corporate risk management practices. It is still relatively unclear what are the reasons that motivate risk neutral corporations to manage their idiosyncratic risk. Our contention in this paper is that corporate insurance purchases are driven by habit rather than an optimal approach to corporate risk management. Because public access to corporate insurance purchases and risk management strategies is limited at best, we examine a particular aspect of the corporate demand for insurance for which public information is available: Directors' and Officers' (D&O) insurance. Information regarding D&O insurance purchases has been publicly available in Canada since 1993. Our results suggest that the decision to insure as well as the amount of coverage purchased (policy limit and deductible) are more driven by the previous year's decision than any other. We find that a corporation's fundamental financial and governance measures do not appear to have any impact on the decision to purchase insurance nor on the amount of insurance to purchase. Our results suggest that corporations may not choose optimally their risk management decisions; rather they may rely more on a force of habit than on a clear and concise strategy to manage corporate risk. As a result, and in contrast to Core (1997, 2000) and Chalmers et al. (2002), we find no evidence of managerial opportunism in regards to D&O insurance coverage.
Keywords: Directors' and officers' insurance, habit formation, corporate insurance and risk management, board compensation. Codes JEL : G3
1 Introduction and Motivation
1.1 Introduction
Of the many fundamental questions left unanswered in finance, one relates to corporate risk management
practices. It is still relatively unclear what are the reasons that motivate risk neutral corporations to
actively manage their idiosyncratic risk through costly practices such as the purchasing of insurance policies
and investing in risk management strategies. These practices do not necessarily increase shareholder wealth
since shareholders are, perhaps, better equiped to hedge idiosyncratic risk using the financial markets than
individual corporations can be.
Some authors have suggested that the progressive nature of the tax system is one important reason why
corporations want to manage risk (Smith and Stulz, 1985) because it lowers their expected tax liability. As
a consequence, the more volatile a firm’s earnings are, the greater benefits associated with managing this
risk. This argument holds best when earnings are indeed insurable. Unfortunately, insurance is purchased to
cover incidents that may or may not be correlated with earning; in other words, the basis risk associated with
most insurance policies is very large. Another aspect of the tax code, the possibility to carry forward and
carry back earnings, also weekens the convexity-in-the-tax-schedule argument to explain coporate insurance
purchases.
The presence of non-tradable human capital within a corporation also appears to be a good intuitive
explanation to insure. Given that some stakeholders, such as workers and managers, may have the great
majority of their human capital tied up in a corporation, it becomes essential for such a corporation to
manage its risk in order to attract and retain the best workers and the best managers. Financial distress is
another apparent good intuitive and theoretical reason to hedge to calm consumer and supplier fears about
the future of the corporation. Finally, over-investment (investing in negative net present value projects)
and under-investment (not investing in positive net present value projects) may be curtailed through risk
management and insurance.1
Based on the theoretical findings of Froot et al. (1993) and Stulz (1996), Tufano (1996) conjectures that
only two reasons explain why corporation should and would manage their risk. The first is to maximize the
value of the firm; the second is to protect risk averse managers. Tufano (1996) tests these two hypotheses
using a sample of 48 gold mining firms. He finds that value maximization does not seem to play an important
role in determining risk management practices, although corporate governance does. More to the point,
corporations whose managers own more call options manage risk the least whereas corporations whose
managers own more shares manage risk the most (see also Smith and Stulz, 1985). On the other hand
Dionne and Garand (2000) find that value maximization is an important contributor to risk management
1See Trieschmann et al. (1994) for a quick overview of the insurance practices in this area.
3
practices, especially the convexity of the tax regime and financial distress. The two main differences between
the Tufano study and the Dionne and Garand study are the time period (three years for Tufano and eight for
Dionne and Garand) and the fact that Dionne and Garand did not control for managerial incentives and/or
corporate governance aspects of the firms. In both studies, however, the sample of firms is the same (48).
From a corporate insurance perspective rather than a risk management perspective, Mayers and Smith
(1990), studying the demand for reinsurance of property and liability insurers, find that the probability
of a firm ending in financial distress is a prime determinant of reinsurance purchases. For example very
small insurers purchase relatively more reinsurance than larger insurers, which the authors attribute to the
relatively higher cost of financial distress of small firms.
The type of insurance we want to look at in this paper is linked to the human capital argument wherein
corporations must manage risk to attract and retain the best managers, officers and corporate directors. As
representative of the corporation directors and officers are liable for actions committed by the corporation.
More importantly, they are personally responsible for actions taken in the name of the corporation. This
means that their own personal assets are at risk in the event of a lawsuit against the corporation and its
management. One way for a corporate director to protect his personal wealth is to have the corporation buy
insurance on his behalf. This insurance is known as Directors’ and Officers’ (D&O) insurance.
1.2 Motivation and Goal
Although Directors’ and Officers’ (D&O) insurance offers protection to corporate managers, it does so for
strange events. D&O insurance protects managers against liability lawsuits brought upon them as managers
of the corporation. In this sense, this is not too different from other types of insurance. What is surprising,
however, is that most lawsuits are brought by the firm’s stakeholders. According to a study of Tillinghast-
Towers Perrin (1999), lawsuits usually originate from shareholders (44%), employees (29%) and clients (14%).
In a sense, shareholders purchase insurance for managers to protect them against shareholders lawsuits.
According to a recent article in The Economist (June 14th, 2003, p. 14), D&O insurance provided by
corporations goes against managerial accountability. Why, The Economist asks, do corporations purchase
D&O insurance on behalf of their directors instead of letting directors purchase such liability insurance
directly on the market place, just as medical malpractice insurance? This remains an open question.
D&O insurance covers managers for their court expenses as well as for any settlement arising from the
lawsuit, subject of course to a policy limit (the maximum amount). This settlement may sometimes be
substantial. The largest D&O lawsuit settlement occurred in 2001 when Cendant Corp. was ordered to pay
2.83 billion dollars to shareholders because of accounting fraud. The most notorious case, however, may be
that of Drexel Burnham Lambert Group Inc. where a 1.2 billion dollars settlement was paid.
D&O insurance is quite common amongst U.S. and Canadian public corporations. According to Tillinghast-
4
Towers Perrin (1998, 1999) the proportion of U.S. firms that had D&O insurance was 92% in 1998 and 93%
in 1999,2 up from 81 % in 1992. The market penetration of D&O insurance is smaller in Canada where 84%
of surveyed corporation had D&O insurance in 1998, and 73% in 1999. One possible reason why D&O insur-
ance has become more and more popular is that lawsuits against management are becoming more frequent.
Tillinghast-Towers Perrin (1999) reports that about 24% of U.S. public corporation (and 14% of Canadian
public corporations) had to face lawsuits related to the behavior of their management between 1989 and
1999. This proportion was 64% for U.S. corporations whose assets are worth in excess of 10 billion dollars.
D&O insurance therefore appears to be an important feature of the compensation package of managers. One
must then wonder what affects the purchase of D&O insurance and its structure.
The study of D&O insurance is important for three reasons. First, it remains an unexplored territory
as few papers have been devoted to this aspect of corporate governance. Is D&O insurance part of the
compensation package? Is it a tool to align the manager’s incentives with those of the shareholders? Second,
it gives us a further insight into the general corporate demand for insurance. Why do firms hedge their risk
given that it is more costly to them than to shareholders? Finally, we are able to observe how presumably
highly rational agents (i.e., the managers) behave when faced with a possible catastrophic personal loss.
The goal of this paper is therefore to present an analysis of the demand for D&O insurance for Canadian
corporations. Data related to Canadian corporations is used instead of American data because Canadian
corporations listed on the Toronto Stock Exchange (Canada’s most important exchange) have been required
since 1993 to divulge information pertaining to their D&O insurance coverage. Using Canadian corporations
allows us to use public information which may be more reliable than survey data.
1.3 Findings
Our results do not appear to support any of the six main theories in finance and economics with respect
to corporate risk management and insurance purchases presented in section 2 of the paper. D&O insurance
purchases does not seem to be a matter of corporate size or value or even a matter of board member wealth.
Financial distress and financial structure does not appear to play any significant role in the decision to
carry insurance and how much to carry. Even corporate governance, which Tufano (1996) found to be an
important determinant, plays no role. In fact the only factor that appears to be significant in determining
the purchase or not of insurance and the amount of insurance coverage purchased is whether the corporation
carried insurance the previous year and how much it carried. All other fundamental financial and governance
aspect of the firm have no impact on the amount of insurance coverage. In contrast to Core (1997, 2000) and
Chalmers et al. (2002), we find, amongst other things, no evidence of managerial opportunism with respect
to the amount of D&O insurance purchased.
2One notable exception, according to The Economist (op.cit.), is Berckshire-Hathaway that does not provide D&O insuranceto its directors.
5
Before discussing the D&O insurance literature, we briefly present the six reasons why firms should
manage their risk. We then present a short primer on D&O insurance. Section 3 presents a model of habit
formation in insurance. The data and the theoretical predictions are presented in section 4. Section 5 presents
the results. We divided the result section into four parts. In the first part, we determine the likelihood that
an agent will purchase D&O insurance. In the second and third part we find the determinants of the policy
limit and deductible amount respectively. The fourth part of section 5 presents the case where it is assumed
that the policy limit and the deductible amounts are chosen simultaneously. We conduct robustness checks
in section 6. Finally, section 7 concludes.
2 Risk Management and Corporate Insurance
2.1 Six Reasons to Manage Risk
There are six basic reasons why firms should manage their risk. First, risk averse managers may assign
positive value to a financial instrument that protects their personal wealth in the event of a lawsuit. Indeed,
a risk averse manager should be willing to accept a reduction in his expected wealth in exchange for protection
against large fluctuations of that wealth. It should therefore be the case that managers trade a portion of
their wealth against some insurance of such wealth.
Second, absent sound risk management practices, managers may under-invest in positive NPV projects
because they focus too much on the downside of the project. The argument is basically that managers put
too much weight on the bad outcomes and too little on the good outcomes. By managing risk, a manager
can better evaluate the weights of the different outcomes so that the incentives to under-invest are reduced.
Risk management forces managers to reinvest in risky positive NPV projects in the event of an insured loss.
Third, over-investment may be curtailed. Over-investment occurs when managers, who act in the stock-
holders’ best interest, over-invest in risky project (possibly in negative NPV projects) because all of the risk
is borne by the creditors. Risk management is argued to reduce such over-investment by better aligning the
goals of the stockholders with those of the creditors.
Fourth, and probably truer for insurance in particular than for risk management in general, firm that
provide risk management and insurance services are often better equipped to assess and control the risk than
the insured party. Because of their expertise on the topic, insurers and other risk management professionals
are better able to evaluate the level of risk, and therefore propose programs to reduce the frequency and the
severity of losses. That is their core business.
Fifth, risk management reduces the expected cost of bankruptcy and financial distress. Because of the
costs associated with reorganization and bankruptcy procedures, a corporation will want to reduce expected
costs by reducing the likelihood of finding itself in that situation. Risk management achieves that goal
because it reduces the impact of large unexpected losses that may severely affect the financial health of the
6

corporation. Risk management also reduces the cost of financial distress. Financial distress is associated
with higher operating costs and lower revenues: Workers demands a high salary, suppliers do not extend
credit and consumers are willing to pay a lower price. By reducing the probability of financial distress risk
management increases the value of the firm by reducing operating costs and increasing unit sales and prices.
The convexity of the tax schedule is the sixth argument in favor or risk management. Corporations
that want to reduce their expected tax liability will want to smooth earnings when the tax schedule is
convex. Moreover, the more convex the tax schedule the more important smoothing earnings is and the
more important risk management becomes.
2.2 A Primer on D&O Insurance
2.2.1 D&O Insurance and Legal Indemnification Schemes
The environment in which directors and officers of a corporation operate may sometimes be extremely diffi-
cult. A corporate manager’s fiduciary duty as well as his behavior as a representative of the corporation may
be called into question by any stakeholder in the economy, whether they are the corporation’s shareholders,
employees, consumers or a government agency. Not only can a corporation be liable for its behavior, the
corporation’s managers may also be liable. This means that lawsuits may be brought upon the managers
personally on the basis that they did not meet their fiduciary duty. Although managers may have made a
mistake in good faith, the strict liability rule governing the fiduciary duty of managers does not allow a good
faith defense. To compensate managers for their legal fees and any loss they are assessed corporations can
either purchase D&O insurance coverage prior to the lawsuit, or use a pay-as-you-go-like legal indemnifica-
tion plan. Our study focuses exclusively on the insurance component recourse, as corporations do not need
to divulge the specifics of their legal idemnification plan.
2.2.2 The D&O Insurance Contract
The D&O contract is purchased by corporations to protect their managers. The insurance policy covers all
expenses and losses incurred by a manager as the result of a lawsuit brought upon him as a representative of
the corporation. The insurance company indemnifies the corporation and/or the manager only if the manager
acted in good faith on behalf of the company; i.e., managers are not covered in case of gross negligence or
criminal behavior. Depending on the type of D&O contract, sometimes the manager will be indemnified
directly, other times the corporation will be indemnified for the expenses incurred in the manager’s defense
(for example when the corporation has its own in house legal team). As with other standard insurance
contracts, D&O insurance contracts stipulate a premium to be paid, a policy limit as well as a deductible.
Most D&O insurance contracts are written on a "claims made and reported" basis (CMR).3 CMR con-
3See Doherty (1991) for more details regarding claims made and reported insurance contracts compared with occurrencebased contracts.
7
tracts differ from regular occurrence based contracts in that they cover losses that are made and reported
during the policy year even though such claims may have been incurred in previous years. Occurrence based
contracts cover losses that are incurred during the policy year no matter when the claim is reported in the
future. Suppose for example that an incident occurs in 1995 (say the accidental pollution of a river), but is
not reported until 1998 when a claim is filed. Under a CMR contract, all the financial responsibility for the
loss falls upon the 1998 insurer. Under an occurrence based insurance contract, it is the 1995 insurer who is
responsible.
Past behavior therefore has a double importance in designing the current year’s insurance contract.
Firstly, if past behavior is any indication of current behavior, any information related to the risk of the
insured gathered in the past by the insurance company will be used as a signal regarding the current risk
of the insured. This is true both for occurrence based and the CMR contract. Secondly, past behavior is
not only an indication of current risk, it is also an indication of current losses paid. As such past behavior
becomes doubly important in choosing the components of the D&O insurance contract that is written on a
claims made and reported basis.
2.2.3 The D&O Insurance Market
Directors’ and Officers’ insurance policies are mainly sold by insurance brokers who negotiate with insurance
companies on behalf of the insured. Although the number of insurance brokers is quite large, the most
important primary D&O insurer in Canada has a significant market power as its market share is above 50%.
The D&O insurance coverage market is also characterized by so-called sticky points. Typically coverage
limit is sold by layers of $1,000,000, although the most important steps appear to be $5,000,000. For our
sample of companies, in 1998, out of the 173 companies that purchased D&O insurance, the most common
policy limits were $5,000,000 (18 times), $10,000,000 (43 times), $15,000,000 (12 times), $20,000,000 (18
times), $25,000,000 (10 times) and $50,000,000 (13 times). These six policy limit sticky points account for
two-thirds of all D&O insurance policy sold in 1998. Other years have similar sticky points.
2.3 Previous Literature on D&O Insurance
It should be straightforward to see that if there is a market for D&O insurance it is because managers are
risk averse. Given that their own personal wealth is fair game when a suit is filed against a corporation and
its representatives, and given that there is a probability that the corporation will not be able to compensate
managers for their court expenses (or settlement), managers require that their personal wealth be insured
if they are to be involved with a corporation. In place of insurance, managers may demand higher pay to
compensate for the risk they are facing. D&O insurance is therefore a risk management tool to manage the
risk faced by risk averse managers.
8
Few studies have been conducted on the demand for D&O insurance. This is mainly due to the lack of
public information prior to 1990.4 The Cadbury report in the United Kingdom and the Dey report in Canada
changed that by recommending to their respective securities commission to make available more information
on the risk faced by publicly traded corporation and the tools used to manage that risk. The reports also
recommended that more information be made available regarding managerial compensation. Given that
the purchase of D&O insurance is one part risk management and two parts compensation, corporations in
the United Kingdom and in Canada were mandated to make public basic information regarding their D&O
insurance practices.
Core (1997) was the first to use the newly available data on D&O insurance purchases by Canadian
companies. Using a sample of 222 firms whose fiscal year ended between 31 May 1994 and 31 December
1994, he finds that the most important determinants of D&O insurance purchase is whether the risk of a
lawsuit5 or the risk of financial distress are high. Although he finds significant determinants of the corporate
demand for D&O insurance, he cannot find any evidence that D&O insurance is in any way part of the
overall compensation package offered to managers. Our study builds upon his approach by increasing the
sample size and the number of years used. In a follow-up article, Core (2000) examines the premium paid
by corporations to insure managers. He finds that the factors explaining premiums are about the same at
the factors explaining the demand for D&O insurance.
Using a sample of 366 corporations in the United Kingdom, O’Sullivan (1997) finds that the factors that
explained D&O purchase in Canada (Core, 1997) also explain D&O purchase in the United Kingdom. He
concludes that D&O insurance coverage is used by large corporations as an incentive tool for managers to
work in the best interest of shareholders so that manager share ownership and D&O insurance coverage are
corporate governance instrument substitutes.
Earlier papers by Bhagat, Brickley and Coles (1987) and Janjigian and Bolster (1990) find that D&O
insurance coverage does not seem to alter shareholder wealth nor returns. A similar result is obtained by
Brook and Rao (1994) who find that corporations that make provisions for lawsuits do not have significantly
different stock returns than corporations that do not make any provisions.
Our approach to corporate risk management issues is similar to that used by Mayers and Smith (1982,
1987). Given that it is near impossible to obtain data on corporate risk management directly, Mayers and
Smith had to infer the behavior of corporation faced with the possibility of managing risk indirectly. To do
that they studied the demand for reinsurance of insurance companies. Our approach looks at the behavior
of directors and officers in choosing their insurance contract and on the presumption that firms manage risk
to reduce the cost of bankruptcy and of financial distress. Without insurance, employees at the bottom of
4The only information available prior to 1990 was collected by Wyatt and Associates (now part of the Tillinghast-TowersPerrin group) via surveys.
5As in Romano (1991), Core (1997) argues that the most important factor used to determine the risk of a future lawsuit iswhether the corporation was sued in previous years.
9

the pyramid as well as at the top may not invest an optimal level of effort in increasing their firm-specific
human capital. Thus, by managing risk firms may reduce labor costs and/or increase productivity.6
A recent paper by Chalmers et al. (2002) studies the interaction between of D&O insurance coverage
and IPO under-pricing using an original sample of firms going public with a specific investment bank. Their
study, using 72 observations points, is based on earlier studies by Ibbotson (1975) and Tinic (1988) who
argued that IPOs are initially underpriced as a way to prevent shareholder lawsuits7 when the stock falls
in the long run. They find that corporations with substantial D&O insurance coverage were, on average,
more likely to be sued in the future for mispricing. Specifically, that the three-year performance is negatively
related to the amount of D&O insurance purchased at the IPO inception. Put another way, the greater the
D&O insurance coverage, the less underpriced was the stock at the time of the initial public offering. One
aspect of the D&O insurance market that Chalmers et al. (2002) did not consider in their analysis is that
D&O contracts as signed on a CMR basis. As such it is not important what the D&O insurance coverage
was at inception; what is important, however, is what was the D&O insurance coverage when the claim
was made. Given that the Chalmers et al. (2002) data set reflects only the information related to the IPO
at inception, the database does not include the information regarding the D&O policy when the claim was
made.
3 Habit Formation
Economic agents often make choices based on habits. Buckling one’s seat belt in an automobile has become
a habit for many, even if it is only to drive around the block. Smoking may have more to do with habit than
a clear and calculated decision to light up.8
Economists are recognizing more and more the importance of habit formation in consumption. For
example, although it is generally accepted that the consumer price index overstates increases in the real
cost of living9 because it assumes that agents do not change their consumption habit when prices fluctuate,
for the elderly, however, the CPI overstates increases less. This is known as the substitution effect in the
CPI-basket. One reason why the CPI overstates inflation less for the elderly is that they are less likely to
alter their behavior than younger individuals. In other words, older individuals are more likely to keep their
habit. Given that the substitution effect accounts for more than 40% of the overstatement, it is argued that
6The few papers that studied D&O insurance did not consider the insurance aspects of the contracts. For example, researchersin finance (Holderness, 1990) and accounting (Core, 1997) view D&O insurance as part of the managers’ compensation package.The insurance aspects of D&O insurance contracts is largely left untouched.
7 See also Hughes and Thakor (1992) and Drake and Vetsuypens (1993).8The medical profession has for a longtime recognized the importance of habit in smoking. This is why it suggests to those
who want to quit smoking to avoid places and circumstances they associate with smoking (bar, parties) for a certain period oftime, at least until they no longer associate the place or the circumstance with their habit.
9The 1996 Boskin commission in the United States (see the Advisory Commission to the U.S. Senate, 1996) argued that theconsumer price index overstates the real inflation by approximately 1.1%. See also Crawford (1998), and Shapiro and Wilcox(1996), Cunningham (1996) and Hoffmann (1998).
10
the elderly have more to lose following a restatement of the CPI.
Habit is also an important part of political life. Shachar (2002) argues that one of the most important
determinants of a voter’s decision in the voting booth is for whom he voted in the previous election (see
also Zuckerman, 1990). Schachar presents evidence that two-thirds of British voters between 1959 and 1983
voted for the same party in each election. That proportion goes up to 75% in Germany between 1949 and
1980 and 90% in Austria between 1962 and 1982. In the United States, the proportion of voters who voted
for the same party in 1988 as in 1984 is 80%. To confirm that older individuals have a tendency to keep
their habits more frequently, Schachar shows that older voters are less likely to change the party they voted
for than younger voters.
In the finance literature, Campbell and Cochrane (1999) present a model of habit formation to explain
the equity premium puzzle. Their arguments relies on the fact that in periods of low consumption growth
the marginal utility of consumers is very volatile so that they require a higher premium to invest in risky
assets. Although Campbell and Cochrane assume a constant risk free rate to achieve their result, their model
predicts relatively well the observed risk premium. In a recent paper Wachter (2002) relaxes the constant
risk free rate assumption. Her contention is that past consumption growth is a good (negative) predictor of
short term interest rates. The reason is that agents finance their habits through short-term borrowing when
past consumption growth has been low. As consumption growth is low, agents borrow more, which drives
short term interest rates up.
In each of these approaches it is always assumed, implicitly if not explicitly, that it is very costly for
some individuals to move away from a habit. Although the habit is different in each setting (smoking in the
case of addicts, personal consumption in the case of the elderly, party affiliation in the case of voters and
aggregate consumption in the case of financiers), the gist of the argument is the same: Changing one’s habit
is difficult and costly.
There are two possible ways in which habit formation may play a role in risk management decisions (and
general management decision for that matter) and in corporate governance. The first explanation is that
managers may have taken an optimal decision in the past and wait a few years before amending it. As the
outcome of a strategic decision may take a few years to pan out, it may appear that habits are important
when in fact there is a clear decision to delay evaluating the past decision. Another possible way to explain
managerial habits is to say that managers who have made a decision in the past may fear to look week if
they change that decision in the future. Changing one’s decision is to admit that one has made a mistake.
The corporate world may not be very kind to managers who admit to have made mistakes. Managers may
therefore be unwilling to change their decision, and therefore implicitly admit they were wrong, by fear of
reprisal by stockholders and the board of directors.
In both cases managers will appear to base their decisions more on what they did in the past than on
11
perceptions of what will happen in the future. In that sense, habit formation may play an important role in
managing corporations and in managing risk within the corporation.
4 Econometric Approach
4.1 Data Source and Sample
Our sample includes 354 Canadian corporations drawn from 7 economic sectors: bio-pharmaceutical, forest
and paper, industrial products, technological, consumer products (including consumer and industrial prod-
ucts), merchandising, and communication and media.10 This yields a total of 1519 observations. Because
of incongruities in the financial and management proxies (for example returns on assets of less than -1 and
board or CEO ownership of more than 100% of the company’s stock), we had to remove 112 observations so
that our final data set includes 1407 observations for 318 companies. There is no survivor bias as we collected
data on new companies as well as companies that disappeared during the sampled years. Because of this
incomplete panel we have an average of about 4.4 years per company (out of a maximum of 6). Of the 318
firms used in our final sample, close to 60% have information for five or six years and 17% no longer existed
at the start of 2000. For each sample year, around 70% of the firms purchased D&O insurance, although the
trend appears to be increasing. Table 1 presents the number of firms per year per economic sector included
in our sample.11
The proportion of firms in our sample that purchased D&O insurance increased from 67% for fiscal year
1993 to 73% in 1998. For comparison, Tillinghast-Towers Perrin (1999) reports that 84 % of Canadian
corporations purchased D&O insurance in 1998 compared to 73% in 1999 (no Canadian data is available
prior to 1998). For the United States Tillinghast-Towers Perrin (1999) reports proportions of D&O insurance
penetration of 84% in 1993, 92% in 1998 and 93% in 1999.
By law (see the statutes of the Ontario Securities Commission), basic information regarding D&O cov-
erage is available from the management proxies, along with details related to managerial compensation
and board composition. We obtained financial data from three different sources, depending on the com-
pany: Compustat, Stock Guide and CanCorp Financial. Stock prices and total returns are drawn form the
TSE-Western tapes.
Information regarding D&O insurance purchases and executive compensation of publicly traded Cana-
dian companies listed on the Toronto Stock Exchange were collected from the annual management proxies
(information circulars). With respect to managerial compensation, the information contained in these proxies
include 1) the name of the main stockholder; 2) the total compensation package (base salary, bonus, number
of common shares and call options received) for the firm’s top-5 executives; 3) the number of exercised
10Two very big sectors of the Canadian economy were deliberatly ommitted: Financial and Mining. We did that in order tokeep our sample more homogenous.
11All tables are in the appendix.
12
options and their value, as well as the number and the value of vested and non-vested options; and 4) the
board structure (name and position) and the number of shares owned by each member. Management proxies
also gives us the details about the type of vesting rights the executives have, as well as the voting rights of
each type of common shares. With respect to D&O insurance the information circular state whether the
corporation had D&O insurance or not, and if so what was the D&O insurance policy limit and occasionally
the deductible.
Since 1996 all this information is available on the internet site of SEDAR (http://www.sedar.com/).
Prior to this date the information must be collected from the companies directly (for free allegedly), or from
Micromedia (at a price).
4.2 Dependent Variables
We use three different dependent variables. First, we have a dichotomous variable to see whether D&O
insurance was purchased or not. Second, we have the policy limit that gives us the maximum possible
indemnity paid by the D&O insurance policy for any single event, or for any single year. This coverage limit
is given in Canadian dollars; any amount in U.S. dollar has been converted to Canadian dollars using the
exchange rate at year end. Although D&O insurance is usually sold in excess layers (see Chalmers et al.,
2002), such information is not available in the management proxies. Third, we have information regarding
the contract’s deductible. This deductible gives us the amount the corporation (or the managers) must pay
out-of-pocket before the insurance coverage kicks in.12
Our sample gives us 988 firm-years that report having D&O insurance. Of these, we have information
about the policy limit for 985 firm years, the other three observation are for a company whose parent provided
D&O coverage. Information about the deductible amount is revealed in only 861 cases, as some companies
did not specify whether there was any deductible even though it had purchased D&O insurance. This causes
an identification problem since we do not know whether the deductible was omitted by mistake of whether
it was equal zero and not mentioned as such. Three possibilities are offered to us. We can set the deductible
to zero, we can eliminate the hundred-odd observations for which no deductible is mentioned or we can set
the deductible to the lowest amount in our data set (10,000 dollars). We opted for the last option, although
the results are sensibly the same whatever the approach we use (see the robustness section).
4.3 Explanatory Variables
We have defined five classes of explanatory variables: Operational Risk, Financial Risk, Human Capital
Risk, Long-Term Contracting and Habit. We will also use Company and Time fixed effects. We present each
12To reduce problems associated with the extreme measures of policy limit and deductibles, we used the logarithm of thedollar figure in our analysis. In the case of deductibles, there are times where the insurance contract specifies an individualdeductible, a corporate deductible, or both. For the purpose of this paper, we used the highest amount available, typically thecorporate deductible.
13
class in order.
4.3.1 Operational Risk
Size should be an important determinant of a corporation’s litigation risk as larger corporations are faced with
more potential lawsuits than smaller corporations since they have more employees, more clients and more
assets. Also, management monitoring of operations in larger corporations is more costly because the chain
of information is longer. According to this argument, larger corporations are hypothesized to need higher
policy limits. The Mayers and Smith (1982) and Smith and Stulz (1985) argument about larger corporations
needing less insurance than smaller corporations is not meant to apply to policy limits. Rather it is the
deductible amount that should be affected by the lower bankruptcy costs of larger corporations. Also large
corporations should have smaller litigation fees because they may have an in house litigation department that
handles lawsuits. The impact on the deductible amount should therefore be positive. Another reason why
larger corporation do not need a small deductible is that they may be better able to self insure (see Stulz,
1996). To measure the impact of size, we shall use the log of the market value of equity (Ln (MVE)).13
We also control for important changes in a corporation’s size. Large changes in the book value of assets
result in greater litigation risk since it appears that many D&O lawsuits occur following an acquisition
(purchased for too high a price) or a divestiture (sold for too low a price). We should therefore expect larger
policy limits when there are important changes in the book value of assets. We define major changes in the
book value of assets as changes of more than 20% over the previous year’s book value. In order to account
for the differences between increases and decreases in book value, we constructed two dichotomous variables:
Acquiror and Divestor. Acquiror equals 1 when the book value of assets increased by 20% or more, and
Divestor equals 1 when the book value of assets decreased by 20% or more. Both these variables should have
a positive impact on the policy limit and on the deductible. Indeed, one may view the Acquiror variable as
a proxy for overinvestment whereas the Divestor variable may be seen as a proxy for underinvestment.
A corporation that has important activities in the United States should be faced with more litigation. As
reported by Core (1997) and Clarkson and Simunic (1994), the Canadian legal system is less litigious than
the American legal system. It follows that claims filed in the United States should be costlier than claims
filed in Canada. Given that almost half of the D&O lawsuits originate from shareholders, we feel that the
most important D&O risk that corporations face is whether they have violated some SEC rule, typically an
accounting irregularity (see Eitel, 2000).14 It follows that corporations that are listed on a stock exchange
13We use a firm’s assets to construct five other explanatory variables: Acquiror, Divestor, Bankruptcy, Growth, Debt andROA. Because of potential near-multicollinearity problems, we prefer to refrain from using Assets directly as an explanatoryvariable.
14The laws governing corporations in the United States allow more lawsuits than the laws governing Canadian corporations.Moreover, the jurisprudence in the United States is such that lawsuits are very common; this is not the case in Canada wherelawsuits are not considered a normal business expense for corporations. The probability of litigation is therefore higher forfirms that are listed in both the United States and Canada as opposed to firms listed in Canada only. Although it is true thatsexual harassment and/or employment discrimination suits against managers fall under the D&O coverage, most lawsuits are
14
in the United States (USListed) should have a greater policy limit and a larger deductible.
4.3.2 Financial Risk
Most D&O lawsuits originate from unhappy shareholders who feel they were cheated following a collapse in
the stock price. This means that corporations that have a more volatile stock are more likely to face D&O
litigation. On the other hand, bad managers and managers who made a mistake may be better able to hide
their incompetence behind the stock volatility screen. This means that litigation against corporation that
have a very volatile stock are less likely to be successful. Because of the greater probability of lawsuits,
but the smaller expected settlements, the deductible should be larger when the corporation’s stock price is
volatile, but the policy limit should not be affected. To measure V olatility, we compounded the stock’s daily
returns to find its annual volatility (see Hull, 2000). Volatility increases the probability that the price of the
stock will decline sharply, thus increasing the probability that a lawsuit will be filed against the corporation
and its managers on behalf of the shareholders.
The way in which a corporation is financed should affect the decision to purchase D&O insurance. For
example, a corporation in financial distress stands a greater risk to go bankrupt. By definition a bankrupt
firm cannot honor its promise to financially support its managers’ legal fees in the event of a lawsuit. In such
an event the expected loss borne by managers should increase as a corporation’s bankruptcy risk increases.
This bankruptcy risk should increase both the policy limit and the deductible. Our measure of Bankruptcy
is calculated as
Bankruptcy = −µBook Value of AssetsBook Value of Debt
¶µ1
V olatility
¶This variable measures the probability that a put option on the corporation’s assets will be exercised at a
strike price equal to the book value of debt.
A firm’s profitability may also be an important factor in determining the amount of insurance that is
needed by the officers and the directors of a corporation. Because D&O litigation occurs usually after a bad
performance, a firm’s past return may be an indication of whether lawsuits are likely or not. Presumably,
the higher the return the more likely shareholders will be happy, and clients and employees will feel safe
with the company. As a consequence, the higher the return the lower should be the frequency of litigation
against managers. The policy limit and the deductible should therefore be smaller when past returns are
high. We shall use the firm’s return on assets (ROA) as our past return measure. We calculate the ROA as
the ratio of net earnings to total assets.
The financial structure of the corporation is measured through the ratio of the book value of debt to the
quasi-market value of assets (Debt). This market value of asset is calculated as the book value of debt plus
brought by stockholders under the different security laws.
15

the market value of equity. Thus,
Debt =Book Value of Debt
Book Value of Debt+Market Value of Equity
Corporations that have a higher measure of Debt are more at risk of being in financial distress. We may also
see the inverse of Debt as a measure of the firm’s creditworthiness; the smaller is Debt, the more creditworthy
is the firm.
A final measure of financial risk is whether the corporation may be thought of as a growth or a value
company. We hypothesize that the type of firm (growth versus value) may be a determinant of D&O
insurance purchase as managers of so-called growth corporations have more complex decisions to make than
managers in so-called value corporations, thus raising the probability of litigation. The deductible and the
policy limit should therefore be larger for growth firms. We measure Growth as the ratio of the market value
of equity to the its book value.
4.3.3 Human Risk
Because D&O insurance may be considered part of the overall compensation package of managers, we feel that
it is important to control as much as possible for the corporate governance specificities of the corporations.
To do that, we shall use four different measures to try to find whether D&O purchases are influenced by
the composition of the board of directors or the compensation of the officers. We can divide the corporate
governance into two categories: Compensation and Composition.
With respect to compensation, Core (1997) has argued that D&O insurance is part of the director’s
compensation package so that directors who have better coverage should be willing to accept a smaller
compensation. We therefore need to control for directors income. To do so, we calculated the corporation
board members’ annual compensation15 as
Compensation =
µBoard Ownership
Total number of stock
¶t
−µ
Board OwnershipTotal number of stock
¶t−1
We hypothesize that D&O insurance coverage should be negatively correlated with the board members’
income. This means that the policy limit should decrease and the deductible increase as the board members’
income increases.
With respect to composition, we shall use three measures. First, the number of board members. Second,
the percentage of firm insiders on the board. Third the percentage of firm outsiders on the board. Presumably
the more members on the board of directors, the more costly it could be to defend all of them in case of a
lawsuit since each defendant may have has a right to his own attorney. We should therefore expect a greater
policy limit and a greater deductible when the number of board members (Members) is larger.
15This variable is similar to the variable used by Tufano (1996) to express the CEO’s wealth involvement in the corporation.Using directly Board Ownership in the regressions rather than Compensation does not alter our results.
16
We divided the origin of board members in three categories: Outsiders, Insiders and Others. An insider
is defined as being a corporate officer, an employees or the chairman of the board. A board members is
categorized as an outsider if he is not an insider, related to an insider, nor a former employee. The final
category includes all those who are not insiders nor outsiders; typically an ex employee or an officer’s relative.
We expect that the greater the proportion of outsiders (Outsiders) on the board, the greater the need for
insurance in order to attract better directors to sit on the board. Corporations that have relatively more
outsiders on its board should therefore purchase an insurance policy that has a greater limit and a smaller
deductible. As for the proportion of insiders (Insiders), we expect the impact to be the opposite16 to that
of Outsiders: A lower policy limit and a greater deductible.
4.3.4 Long-Term Contracting
To control for insurance contracts that are signed for many years, we want to control for the number of years
during which the parameters of the contract did not change. This LongTerm variable counts the number
of years during which the deductible amount and the policy limit remained unchanged; both amounts need
to remain unchanged for the contract to be considered multi year.17 No contract is ever longer than three
years. It is important to consider the possibility that an insurance contract may be signed for more than
one year because we may otherwise artificially increase the likelihood that corporate insurance purchases are
habit driven.
4.3.5 Habit
Our main hypothesis is that risk management decisions are a question of habit. To test this, we shall include
in the different regressions the lagged value of the dependent variables. Our contention is that this lagged
value should have a strong impact on the current dependent variable. In fact, we expect that aside from the
LongTerm variable that controls for the length of the insurance contract, the only significant explanatory
variable should be the lagged dependent variable.
5 Results
5.1 Basic Statistics
Table 2A presents the basic descriptive statistics of our data set before running the regressions. Once we
include the variables that use lagged values our data set is reduced from 1407 to 1074 observations. Table
2B presents the descriptive statistics of the remaining observations. Looking only at those corporations that
purchased D&O insurance on the open market (766 firms), Table 2C presents their descriptive statistics and
16 If corporate officers are entrenched, we may have a positive impact of corporate board insiders on D&O insurance coverage.17Whether we also require of a multi year contract that the premium does not change from year to year does not alter the
results.
17
highlights the statistical differences between the corporations that carry D&O insurance and the corporations
that do not.
5.2 D&O Purchase
Before exploring what affects the limit and the deductible of the policy, it is essential that we determine
what influences the purchase or not of D&O insurance. Once we have determined what type of corporation
purchases D&O insurance, we will then be able to study what determines the policy limit and the deductible
of such policies. The same variables shall be used to determine D&O insurance purchases and to determine
the policy limit and the deductible.
The likelihood of coverage will then be given by the difference between a variable’s impact on the policy
limit and on the deductible. A variable that increases the limit and reduces the deductible should increase
the likelihood that a corporation will carry D&O insurance. Conversely, a variable whose impact is to reduce
the limit and increase the deductible is predicted to reduce the overall likelihood of insurance. When the
impact on policy limit and on the deductible is the same, our prediction is that the impact on limit should
win. The reason is that the utility gained from insuring high losses outweighs the disutility of having a
high deductible, and vice versa. For example, V olatility is expected to increase the deductible, but is not
predicted to have an impact on the policy limit. The overall impact should therefore be to decrease the
likelihood that a corporation will carry D&O insurance.
Looking at table 2C, one could think that there are indeed differences between corporations that purchase
D&O insurance and corporations that do not. For instance, it appears that corporations who purchase D&O
insurance have a larger market valuation, are more growth oriented, have a higher probability of being listed
on an American stock exchange, have more corporate insiders on the board and are more likely to have
acquired a new business unit as defined by a sizeable increase in the book value of assets.
In Table 3, we present a probit regression where we attempt to determine the likelihood of D&O insurance
purchase for a corporation. Model 3.1 in Table 3 presents a basic probit model where the lag of the dependent
variable is not used as an explanatory variable and where there are no fixed effects. The results of model
3.1 suggest that size, stock volatility, listing in the United States, the proportion of outsiders and the
proportion of insiders on the board are important determinants of D&O purchase. Of these five variables,
four (Ln(MVE), V olatility, USListing and Outsiders) have the predicted impact on the likelihood to carry
D&O insurance. Insiders has a positive impact on the likelihood of having D&O insurance, suggesting that
entrenched officers use D&O insurance as a way to further extract wealth from shareholders by better
protecting themselves against lawsuits. It appears that larger corporations are more likely to carry D&O
insurance, which suggests that the chain of information hypothesis outweighs the lower bankruptcy and
litigation cost hypothesis, as we hypothesized. Being listed in the United States increases also the likelihood
18

of carrying D&O insurance, which supports the view that coverage may be more important to have in the
United States because of the more litigious legal environment.
It also appear that having more outsiders and insiders on the board increases the likelihood of carrying
D&O insurance. Although this was expected for Outsiders to attract the best possible directors, it is
surprising to find the same result for Insiders. One possible explanation is that corporate insiders use
their power on the board to purchase D&O insurance to extract wealth from shareholders without too much
fear of reprisal. This is consistent with the findings of Core (1997) and Chalmers et al. (2002) where firm
entrenched firm insiders purchase more D&O insurance. As for V olatility, corporation that have a more
volatile stock may feel that there is no need to carry insurance because investor are not likely to win in court.
In Model 3.1, however, we did not take into account whether the corporation carried D&O insurance the
year before. In Model 3.2, we introduce as an explanatory variable whether the corporation carried D&O
insurance the year before (Lagged Insured). The testable equation is then
Insurancei,t = Xi,t + Insurancei,t−1 + εi,t
By including this lagged variable all model significance disappears. The reason is that corporations who
purchase insurance always do. We are in fact able to explain all the variability of the model by including
firm fixed effects (result not shown). It therefore appears that the decision to manage board liability risk
by purchasing D&O insurance is more based on whether the corporation carried such insurance in the past
than on any current market condition or firm condition.
It is interesting to note that being listed on a stock market in the United States does not seem to have
any explanatory power once we include a lagged dependent variable, firm fixed effects and year fixed effects.
As such one may wonder whether having operation in the United States is indeed a determinant of D&O
purchase. Looking at the data more carefully we note that every corporation listed in the United States
carried D&O insurance. That is not a sufficient determinant, however, since size is an important determinant
of being listed in the United States.
These results are consistent with the popular view in the insurance industry that denied coverage is
almost unheard of.18 This explains why corporations that purchase D&O insurance do so for a long time,
whereas corporation that do not purchase D&O insurance do not care about it.
5.3 Policy Limits and Deductible
It therefore appears that market conditions have no impact on a corporation’s decision to purchase D&O
insurance or not. These market and corporate structure conditions may, however, have an impact on the
contract’s specifications such as the policy limit and the deductible.
18 See Chalmers et al. (2002), page 615.
19

The results we present in Table 4 assume that the choice of the deductible and of the policy limit are
made independently of each other. This is certainly not the case, however. Indeed, when a risk averse
agent purchases insurance, he negotiates simultaneously the policy limit and the deductible. It may then be
important to control for that simultaneity in the insurance contract parameters. Using a two-step approach,19
we present in Table 5 the results when we assume that deductible and policy limit choices are made in
combination (the results of the reduced form regressions20 are not presented). The structural equations for
the regression presented in Table 5 are
Limiti,t = XLimiti,t + Limiti,t−1 + dDeductiblei,t + dt + di + ηi,t
and
Deductiblei,t = XDeducti,t +Deductiblei,t−1 + dLimiti,t + dt + di + ξi,t
whereXk is the matrix of independent variables that explains dependent variable, where k = {Limit,Deductible},dt is the dummy variable for the years (the year fixed effect) and di is the dummy variable for the corpo-
rations (the firm fixed effect). Variables that have abare the predicted value of the dependent variablesobtained from the reduced form regressions.
In both tables, it appears that none of the financial and/or economic explanatory variables have any
significant power (5 % or better) in predicting the amount of D&O insurance purchased. Only the lagged
values of the dependent variables appear to be consistently of the predicted sign (positive) and significant
in explaining the current policy limit and the current deductible. The length of the contract also appears to
be significant and negative as predicted. Again, this is an indication that the amount of D&O coverage has
more to do with a purchasing habit than with a clear and concise insurance or risk management decision by
the corporation.
6 Robustness
We want to test the robustness of our results in five ways. First, for each year we run a cross section
regression similar to that of Model 3.1 (no lagged dependent variable and no fixed effect), but including a
sector fixed effect. Second, we run the same simultaneous equation regression as in Table 5 but including
only one explanatory variable at the time other than the lagged and predicted dependent variables. Third,
19This approach entails using the predicted value of the deductible amount in the policy limit regression, and using thepredicted policy limit amount in the deductible regression.20The reduced form regressions are
Limiti,t =³XLimit
i,t ∪XDeducti,t
´+ Limiti,t−1 +Deductiblei,t−1 + dt + di + εi,t
andDeductiblei,t =
³XLimit
i,t ∪XDeducti,t
´+ Limiti,t−1 +Deductiblei,t−1 + dt + di + εi,t
where³XLimit
i,t ∪XDeducti,t
´means the union of the independent variables.
20

we run a regression in two stages. Fourth, we use the one year difference in policy limit and deductible as
our dependent variable. Finally, we use other measures of the deductible to see if our results are driven by
the $10,000 mark used so far.
6.1 Cross-Sections
It appears clear in Table 6 that almost none of the hypothesized explanatory variables have any significant
impact on the purchase or not of D&O insurance. In fact only in 1996 does it seem that being listed on
a stock market in the United States and having a greater bankruptcy risk increase the likelihood that a
corporation will carry D&O insurance. For any other year and any other variable, the purchase of D&O
insurance does not seem to depend on any financial and/or economic factor. What is then so special about
1996 in the United States?
What happened is the Private Securities Litigation Reform Act of 1995. One of the goals of the 1995
Reform Act was to encourage institutional investors to become more involved in the prosecution of securities
and fraud lawsuits. This has increased the size of the settlements. Another goal was to make it easier for
judges to dismiss securities fraud class action lawsuits. This had the unanticipated result that plaintiffs sued
for greater amount. The reason is that plaintiffs, who saw an increase in the probability that their case was
going to be dismissed, began to demand higher settlement payments in order, perhaps, to keep the same level
of revenue as before the Reform Act of 1995. That is a perfect recipe for an increase demand for insurance.
An agent whose loss occurs with greater severity but lower frequency will always be more likely to purchase
insurance that an agent whose loss occurs with lower severity but greater frequency, even if the expected
loss is the same for the two agents. If we were to remove all Canadian firms listed in the United States, none
of the variables in any of the years are significant in explaining D&O insurance purchases.
6.2 Pseudo-Univariate
In what we call the pseudo-univariate models, we run a simultaneous equations fixed effect regression using
the lagged dependent variable as the instrument, while putting each explanatory variable in the regression
one by one. These results are presented in Table 7.21 Of all the variables used in the different pseudo-
univariate simultaneous equation regressions, it appears that only the log of the market value of equity has
a significant impact on the deductible. No other variable seem to explain significantly the policy limit or the
deductible chosen by the different corporations.
21The reader will note that the number of usable observations used in Table 7 is different from the number of observations usedin Table 5. This occurs because we only have 704 entries for the variable Bankruptcy, which means that only 704 observationsare usable in the full model regressions displayed in Table 5.
21
6.3 Two Stages
Table 8 presents the results of a regression in two stages. In the first stage we ran a fixed effect regression
on the policy limit and the deductible using only the lagged dependent and the LongTerm variables on the
right hand side of the equation. We then used the residual of that equation and regressed it on the other
exogenous variables which we hypothesized should have an impact on insurance coverage. We can clearly see
in Table 8 that no exogenous variable is even close to be significant in Models 8.3 and 8.4. In fact the Model
8.3 regression explains less than 1% of the variation in the policy limit whereas the Model 8.4 regression
explains less than 1.5% of the variation in the deductible. More than 90% of the variation in the policy limit
and in the deductible is explained only by the lagged value of each variable as well as the firm and time fixed
effects.
6.4 One Year Variation
What we did here is transform the dependant variable so that it is now defined as year t0s policy limit
(deductible) minus year t − 10s policy limit (deductible). In other words, we want to explain variations inthe terms of the contract. Our basic results do not change much as we can see in Table 9. The straight OLS
regression presented in Model 9.1 for the policy limit and in Model 9.2 for the deductible show no sign that
the results presented previously are not robust.
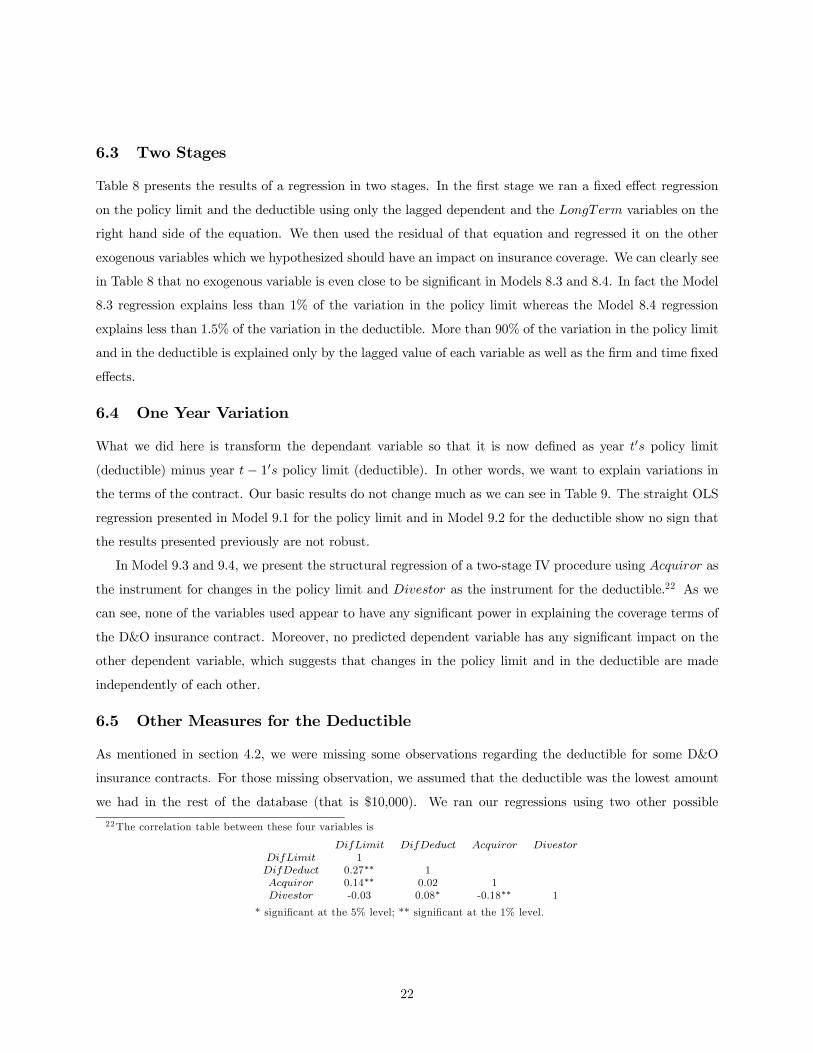
In Model 9.3 and 9.4, we present the structural regression of a two-stage IV procedure using Acquiror as
the instrument for changes in the policy limit and Divestor as the instrument for the deductible.22 As we
can see, none of the variables used appear to have any significant power in explaining the coverage terms of
the D&O insurance contract. Moreover, no predicted dependent variable has any significant impact on the
other dependent variable, which suggests that changes in the policy limit and in the deductible are made
independently of each other.
6.5 Other Measures for the Deductible
As mentioned in section 4.2, we were missing some observations regarding the deductible for some D&O
insurance contracts. For those missing observation, we assumed that the deductible was the lowest amount
we had in the rest of the database (that is $10,000). We ran our regressions using two other possible
22The correlation table between these four variables is
DifLimit DifDeduct Acquiror Divestor
DifLimit 1DifDeduct 0.27∗∗ 1Acquiror 0.14∗∗ 0.02 1Divestor -0.03 0.08∗ -0.18∗∗ 1
* significant at the 5% level; ** significant at the 1% level.
22
specifications for the deductible. In one case, we assumed there was no deductible23, and in the other case
we removed the observation entirely from the analysis. For these two cases, the structural forms for the
deductible and the policy limit under the two-stage regression approach are presented in table 10. As we can
see little has changed in the results, except that we observe some significance for the market value of equity
variable in explaining the policy limit.
7 Conclusion
The goal of this paper was to further our understanding of the corporate demand for insurance. To do so we
analyzed the determinants of the demand for insurance of corporate managers as part of their function within
the corporation. Directors’ and Officers’ liability insurance protects managers against lawsuits brought onto
them as representative of the corporation. Corporation can buy insurance coverage to compensate their
managers in the event of losses arising from such lawsuits. In this paper we analyze what influences the
purchase by a corporation of insurance on behalf of its corporate managers. Moreover, we determine how
the policy limit and the deductible are chosen.
Our conclusion is straightforward. D&O insurance purchases are more due to whether the corporation
carried D&O insurance the previous year (and the amount of coverage) than any other factor. In fact, after
controlling for the length of the insurance contract and for time and firm fixed effects, no factor seems to be
able to explain the amount of insurance purchased other than the previous year’s coverage.
What do our results tell us about risk management and insurance practices within corporations? What
is the implication of such practices when studying risk management strategies? Let us first look at the
consequence of risk management practices being more due to habit than to a clear and concise strategy in
managing the risk faced by a corporation. If this result holds as it does for directors’ and officers’ insurance,
then one has to wonder if managing idiosyncratic risk does not in fact waste valuable corporate resources.
This argument has been used previously in the literature in trying to justify that stockholders are better
equipped to manage idiosyncratic risk by diversifying their assets portfolios. Another possible explanation is
that managers do not care about the cost of D&O insurance because it is borne by others. As is well known
from basic microeconomics demand for a good is much larger than the equilibrium demand when the price
is kept artificially below market. In the case of insurance in general and of D&O insurance in particular,
moral hazard then leads to over-consumption of the insured product.
The results presented in this paper appear to confirm the wastefulness of corporate risk management,
especially against the argument based on the lack of diversification of human capital. Indeed, since it appears
that board members do not trade D&O insurance against income, one has to wonder whether board members
23Or rather the deductible was set to equal one dollar so as to make the natural log of the deductible equal to zero. Accordingto Chalmers et al. (2002), a personnal deductible equal to zero is often seen.
23
actually value such human capital protection. This interpretation is even more robust when we realize that
board members have a lot to lose (their personal wealth) and relatively little to gain (their corporate director
income) in a corporation. Of all the stakeholders in the corporation, it should therefore be the corporate
directors who value this type of risk management the most. Based on our results, the argument in favor of
corporate risk management based on the protection of human capital is weakened.
The second line of defense against the argument that corporate risk management is a waste of resources
is that it prevents over- and under-investment in a corporation. Our result do not seem to support this
view. Indeed, corporate purchased of D&O insurance does not seem to be at all related to large increases
in the book value of assets, which could be seen as a proxy for over-investment. The same can be said
for large decreases in the book value of assets as a proxy for under-investment. Even the free cash flow
argument which stipulates that risk management allows to better monitor free cash flow does not hold.
Growth corporation in which the monitoring of free cash flows is harder do not carry more or less insurance
than value corporations. A similar argument applies to firm size: Larger corporations in which free cash flow
problems are more likely to arise do not seem to purchase more insurance than smaller corporations.
Being in financial distress does not increase the demand for D&O insurance as our measure of risk
demonstrates. This counters the argument that firms close to financial distress should manage risk more to
reduce the expected cost of bankruptcy. Our measure of financial risk incorporated an aspect of financial
leverage through the asset-to-debt ratio, as well as through the market price volatility of the corporation’s
equity. Our results therefore suggest that financial risk is not an important determinant of D&O insurance
purchases.
One final argument in favor of corporate risk management that we tested in our study is the fact that risk
management may allow corporate boards to better monitor management activities through an outside audit.
This is especially true in the case of insurance corporations who must evaluate the risk of corporations they
intend to insure. By conducting an audit of the firm’s activities, an insurer may be in a position to reveal to
board members information about the firm’s risk. And the more coverage a corporation wants to purchase,
the more intensive will be the audit. The information gathered through audits would be especially valuable
to corporate outsiders on the board of directors. It appears, however, that the proportion of outsiders on the
board does not influence the amount of insurance purchased. If the auditing hypothesis held, we should have
observed more insurance when there are more outsiders because outsiders would have valued the auditing
service more.
The only argument in favor or corporate risk management left untested in this paper is the convexity of
the tax schedule argument. Given that the tax schedule for Canadian firms is not very convex (there are
only two tax rates, 0 % and 30 %), firms may not have a very big incentive to manage risk. This is even
more true because of losses that can be carried forward for a long time, thus providing corporations with a
24
natural hedge over time. Nevertheless, we did not test explicitly for that particular aspect of corporate risk
management motivations.
As a final conclusion, it appears that directors’ and officers’ insurance purchases are not due to a rational
planning on the part of the management team. Rather it appears that the best indicator of insurance coverage
is the insurance coverage the corporation had in the previous year. Our result begs the question of what
happens to other types of risk that may require management? If there is no explicit decision making in the
management of corporate board risk - a risk that affects board members more directly than any other risk
in the corporation - one has to wonder whether other types of risk are manage similarly. If that is the case,
then surely there is a loss of efficiency by having corporations manage their own risk.
25
8 References
1. Advisory Commission to Study the Consumer Price Index (1996). Towards a More Accurate Measure
of the Cost of Living. Final Report to the U.S. Senate Finance Committee, Washington (DC).
2. Bhagat, S., J. A. Brickley and J. L. Coles (1987). Managerial Indemnification and Liability Insurance
: The Effect on Shareholder Wealth. Journal of Risk and Insurance, 54: 721-736.
3. Brook, Y. and R. K. S. Rao (1994). Shareholder Wealth Effects of Directors’ Liability Limitation
Provisions. Journal of Financial and Quantitative Analysis, 29: 481-497.
4. Campbell and Cochrane (1999). By Force of Habit: A Consumption-Based Explanation of Aggregate
Stock Market Behavior. Journal of Political Economy, 107: 205-251.
5. Chalmers, J. M. R., L. Y. Dann and J. Harford (2002). Managerial Opportunism? Evidence from
Directors’ and Officers’ Insurance Purchases. Journal of Finance, 57: 609-639.
6. Clarkson, P. and D. Simunic (1994). The Association Between Audit Quality, Retained Ownership and
Firm-Specific Risk in United States vs. Canadian IPO markets. Journal of Accounting and Economics,
17: 207-228.
7. Core, J. E. (1997). On the Corporate Demand for Directors’ and Officers’ Insurance. Journal of Risk
and Insurance, 64: 63-87.
8. Core, J. E. (2000). The Directors’ and Officers’ Insurance Premium: An Outside Assessment of the
Quality of Corporate Governance. Journal of Law, Economics and Organization, 16: 449-477.
9. Crawford, A. (1998). Measurement Biases in the Canadian CPI: An Update. Bank of Canada Technical
Report, Ottawa (ON).
10. Cunningham, A. (1996). Measurement Bias in Price Indices: An Application to the UK’s RPI.Working
paper 47, Bank of England.
11. Dionne, G. and M. Garand (2000). Risk Management Determinants Affecting Firms’ Values in the
Gold Mining Industry: New EMpirical Results. Risk Management Chair Working Paper 00-11, HEC
- Montréal.
12. Doherty, N. A. (1991). The Design of Insurance Contracts when Liability Rules are Unstable. Journal
of Risk and Insurance, 58: 227-246.
13. Doherty, N. A. (1997). Corporate Insurance: Competition from Capital Markets and Financial Insti-
tutions. Assurances, 65: 63-94.
26
14. Drake, P. D. and M. R. Vetsuypens (1993). IPO Underpricing and Insurance Against Legal Liability.
Financial Management, X:64-73.
15. Eitel, N. R. (2000). Now You Have It, Now You Don’t: Directors’ and Officers’ Insurance after a
Corporate Bankruptcy. Loyola Law Review, 46: 585-617.
16. Froot, K. A., D. S. Scharfstain and J. C. Stein (1993). Risk Management: Coordinating Corporate
Investment and Financing Policies. Journal of Finance, 48: 1629-1658.
17. Greene, W. H. (1997). Econometric Analysis. Third Edition, Prentice-Hall, Upper Saddle River, New
Jersey, 1075 pages.
18. Heckman, J. J. (1979). Sample Selection Bias as a Specification Error. Econometrica, 47: 153-161.
19. Hoffmann, J. (1998). Problems of Inflation Measurement in Germany. Discussion paper 1/98, Deutsche
Bundesbank.
20. Holderness, C.G. (1990). Liability Insurers As Corporate Monitors. International Review of Law and
Economics, 10:115 -129.
21. Holderness, C.G. (1986). The Economics of Corporate Indemnification and Liability Insurance. Uni-
versity of Rochester Managerial Economics Research Center Working Paper: MERC86-05.
22. Hughes, P. J. and A. V. Thakor (1992). Litigation Risk, Intermediation, and the Underpricing of Initial
Public Offerings. Review of Financial Studies, 5:709-742.
23. Hull, J. C. (2000). Options, Futures and Other Derivatives. Fourth Edition, Prentice-Hall, Upper
Saddle River, New Jersey , 698 pages.
24. Ibbotson, R. (1975). Price Performance of Common Stock New Issues. Journal of Financial Economics,
X:235-272.
25. Janjigian, V. and P. J. Bolster (1990). The Elimination of Director Liability and Stockholder Returns:
An Empirical Investigation. Journal of Financial Research, 13: 53-60.
26. Mayers, D. and C. W. Smith Jr. (1990). On the Corporate Demand for Insurance: Evidence from the
Reinsurance Market. Journal of Business, 63: 19-40.
27. Moreau, R. (1995). L’indemnisation des administrateurs et des dirigeants: legislation, réglementation
d’indemnisation, assurance. Assurances, 63: 19-45.
28. O’Sullivan, N. (1997). Insuring the Agents: The Role of Directors’ and Officers’ Insurance in Corporate
Governance. Journal of Risk and Insurance, 64: 545-556.
27
29. Romano, R. (1991). The Shareholder Suit: Litigation without Foundation? The Journal of Law,
Economics and Organization, 7: 55-87.
30. Rothschild, M. and J. Stiglitz (1976). Equilibrium in Competitive Insurance Markets: An Essay on
the Economics of Imperfect Information. Quarterly Journal of Economics, 90: 629-649.
31. Shachar, R. (2002). Party Loyalty as Habit Formation. Mimeo, Tel Aviv University.
32. Shapiro, M.D. and D.W. Wilcox (1996). Mismeasurement in the COnsumer Price Index. NBER
Macroeconomics Annual, 11: 93-142.
33. Stulz, R. M. (1996). Rethinking Risk Management. Journal of Applied Corporate Finance, 9: 8-24.
34. Smith, C. W. and R. M. Stulz (1985). The Determinants of Firms’ Hedgind Policies. Journal of
Financial and Quantitative Analysis, 19: 127-140.
35. Tillinghast - Towers Perrin (1999, 2000). Directors and Officers Liability Survey, US and Canadian
Results 1998 et 1999.
36. Trieschmann, J. S., E. A. Wiening, B. A. Hedges, J. Trupin and A. L. Flitner (1994). Commercial
Property Insurance and Risk Management Volume 1. American Institute for CPCU, Malvern (PA),
363 pages.
37. Tufano, P. (1996). Who Manages Risk? An Empirical Examination of Risk Management Practices in
the Gold Mining Industry. Journal of Finance, 51: 1097-1137.
38. Tinic, S. M. (1988). Anatomy of Initial Offering of Common Stock. Journal of Finance, 43: 789-822.
39. Wachter, J.A. (2002). Habit Formation and Return on Stocks and Bonds, mimeo New York University.
40. Watson Wyatt Worldwide (1995, 1996, 1997). Directors and Officers Liability Survey.
41. Wyatt (1992, 1993, 1994). Directors and Officers Liability Survey.
42. Zuckerman, A. (1990). The Flow of the Vote in Israel: A Reconsideration of Stability and Change. In
The Elections In Israel - 1988, A. Arian and M. Shamir (eds). Westview: Boulder
28
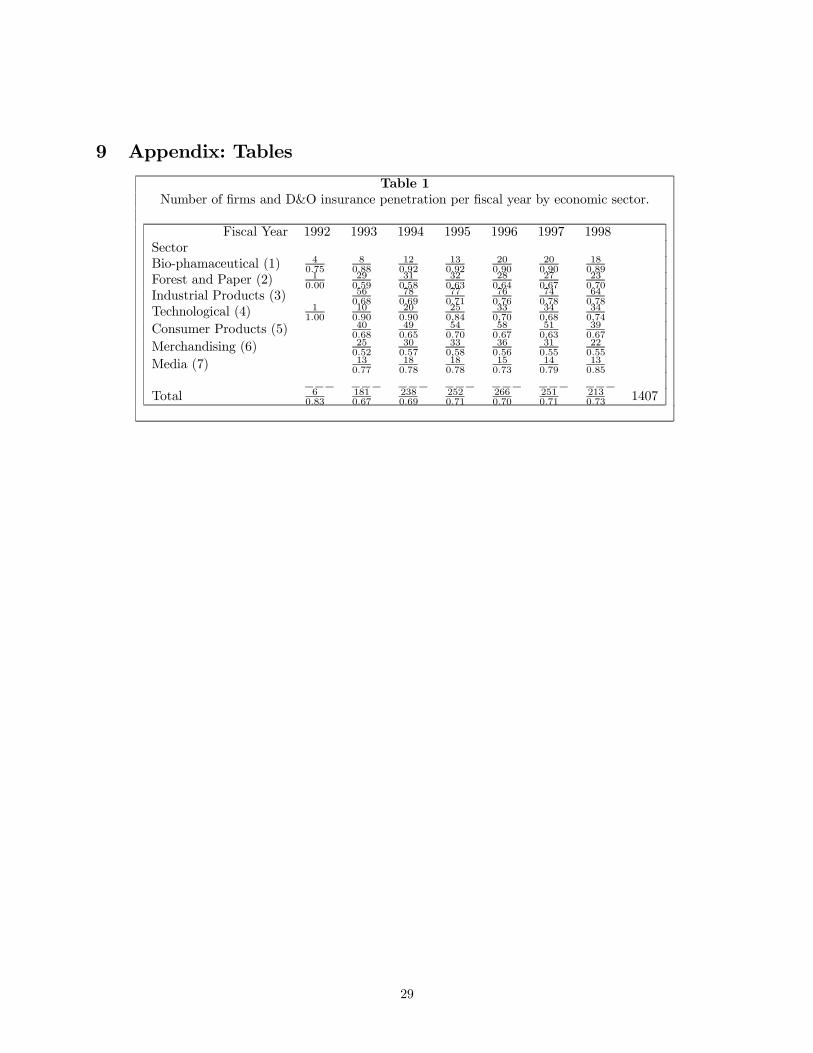
9 Appendix: Tables
Table 1Number of firms and D&O insurance penetration per fiscal year by economic sector.
Fiscal Year 1992 1993 1994 1995 1996 1997 1998SectorBio-phamaceutical (1) 4
0.7580.88
120.92
130.92
200.90
200.90
180.89
Forest and Paper (2) 10.00
290.59
310.58
320.63
280.64
270.67
230.70
Industrial Products (3) 560.68
780.69
770.71
760.76
740.78
640.78
Technological (4) 11.00
100.90
200.90
250,84
330,70
340,68
340,74
Consumer Products (5) 400.68
490.65
540.70
580.67
510,63
390.67
Merchandising (6) 250.52
300.57
330,58
360.56
310.55
220.55
Media (7) 130.77
180.78
180.78
150.73
140.79
130.85
___ ___ ___ ___ ___ ___ ___Total 6
0.831810.67
2380.69
2520.71
2660.70
2510.71
2130.73 1407
29
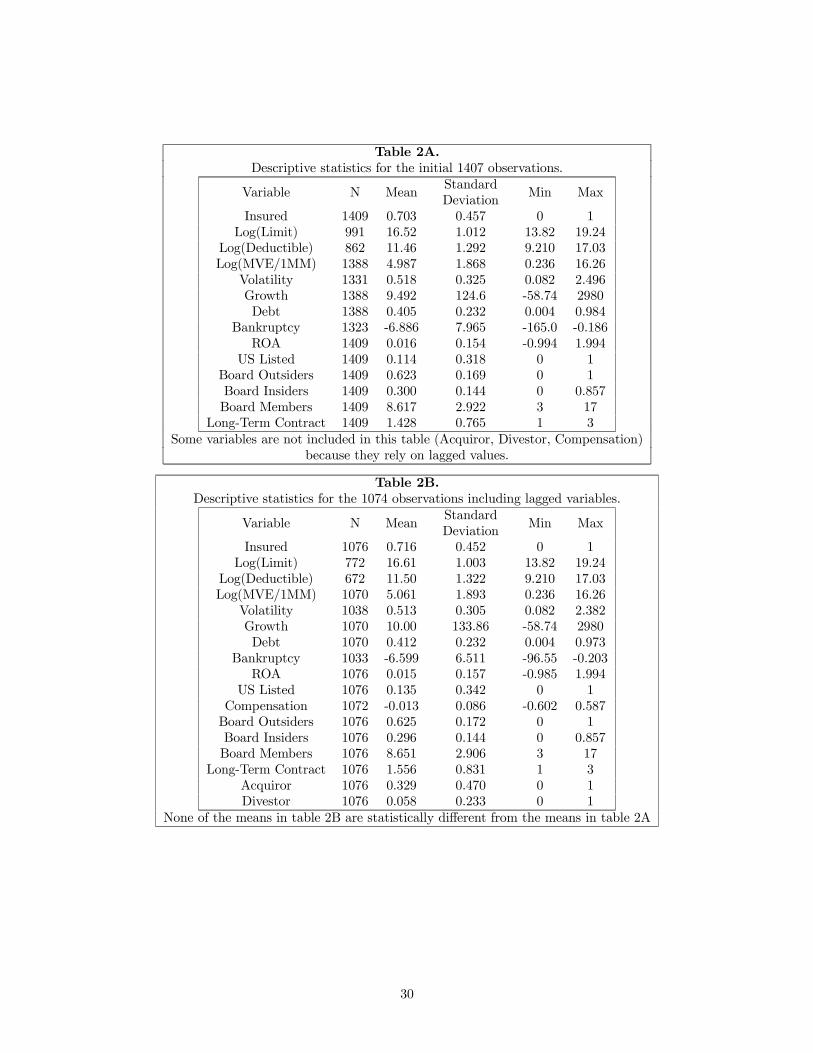
Table 2A.Descriptive statistics for the initial 1407 observations.
Variable N MeanStandardDeviation
Min Max
Insured 1409 0.703 0.457 0 1Log(Limit) 991 16.52 1.012 13.82 19.24
Log(Deductible) 862 11.46 1.292 9.210 17.03Log(MVE/1MM) 1388 4.987 1.868 0.236 16.26
Volatility 1331 0.518 0.325 0.082 2.496Growth 1388 9.492 124.6 -58.74 2980Debt 1388 0.405 0.232 0.004 0.984
Bankruptcy 1323 -6.886 7.965 -165.0 -0.186ROA 1409 0.016 0.154 -0.994 1.994
US Listed 1409 0.114 0.318 0 1Board Outsiders 1409 0.623 0.169 0 1Board Insiders 1409 0.300 0.144 0 0.857Board Members 1409 8.617 2.922 3 17
Long-Term Contract 1409 1.428 0.765 1 3Some variables are not included in this table (Acquiror, Divestor, Compensation)
because they rely on lagged values.
Table 2B.Descriptive statistics for the 1074 observations including lagged variables.
Variable N MeanStandardDeviation
Min Max
Insured 1076 0.716 0.452 0 1Log(Limit) 772 16.61 1.003 13.82 19.24
Log(Deductible) 672 11.50 1.322 9.210 17.03Log(MVE/1MM) 1070 5.061 1.893 0.236 16.26
Volatility 1038 0.513 0.305 0.082 2.382Growth 1070 10.00 133.86 -58.74 2980Debt 1070 0.412 0.232 0.004 0.973
Bankruptcy 1033 -6.599 6.511 -96.55 -0.203ROA 1076 0.015 0.157 -0.985 1.994
US Listed 1076 0.135 0.342 0 1Compensation 1072 -0.013 0.086 -0.602 0.587Board Outsiders 1076 0.625 0.172 0 1Board Insiders 1076 0.296 0.144 0 0.857Board Members 1076 8.651 2.906 3 17
Long-Term Contract 1076 1.556 0.831 1 3Acquiror 1076 0.329 0.470 0 1Divestor 1076 0.058 0.233 0 1
None of the means in table 2B are statistically different from the means in table 2A
30
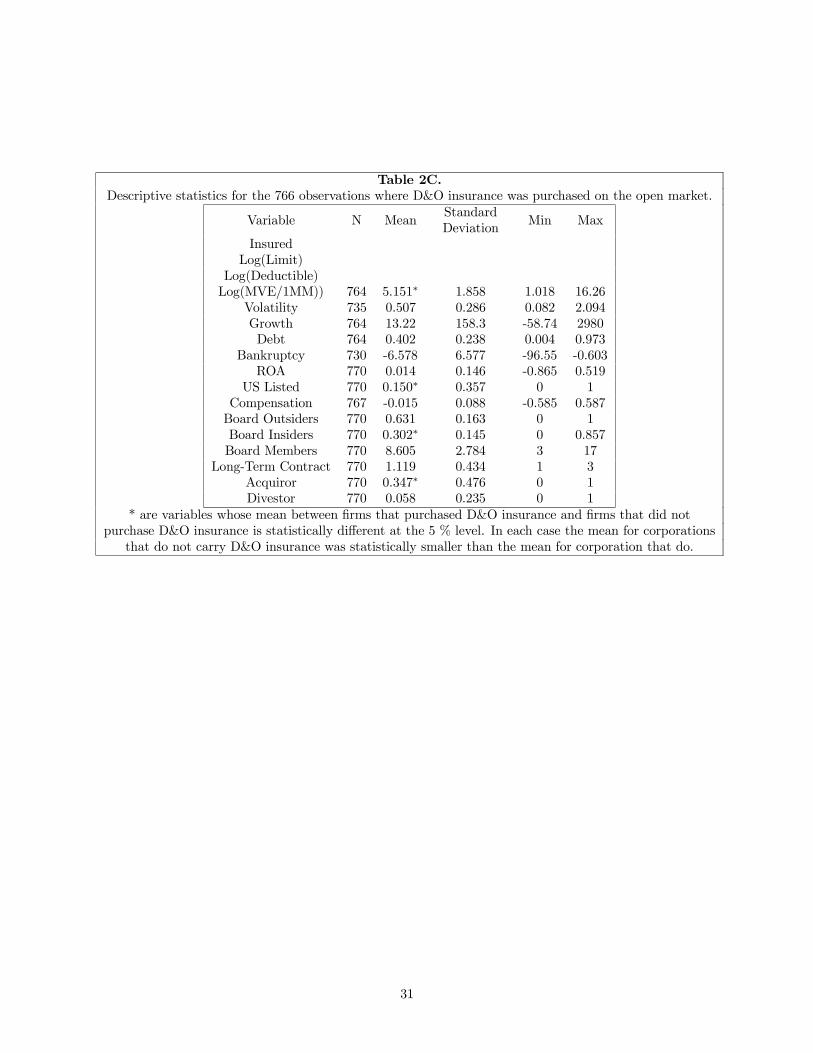
Table 2C.Descriptive statistics for the 766 observations where D&O insurance was purchased on the open market.
Variable N MeanStandardDeviation
Min Max
InsuredLog(Limit)
Log(Deductible)Log(MVE/1MM)) 764 5.151∗ 1.858 1.018 16.26
Volatility 735 0.507 0.286 0.082 2.094Growth 764 13.22 158.3 -58.74 2980Debt 764 0.402 0.238 0.004 0.973
Bankruptcy 730 -6.578 6.577 -96.55 -0.603ROA 770 0.014 0.146 -0.865 0.519
US Listed 770 0.150∗ 0.357 0 1Compensation 767 -0.015 0.088 -0.585 0.587Board Outsiders 770 0.631 0.163 0 1Board Insiders 770 0.302∗ 0.145 0 0.857Board Members 770 8.605 2.784 3 17
Long-Term Contract 770 1.119 0.434 1 3Acquiror 770 0.347∗ 0.476 0 1Divestor 770 0.058 0.235 0 1
* are variables whose mean between firms that purchased D&O insurance and firms that did notpurchase D&O insurance is statistically different at the 5 % level. In each case the mean for corporations
that do not carry D&O insurance was statistically smaller than the mean for corporation that do.
31

Table 3.The Determinants of D&O Insurance Purchases: Probit Regression
Dependant Variable Equals 1 if the Corporation Carries Insurance and 0 Otherwise.
VariableModel 3.1No Lag
Model 3.2With Lag
Intercept -1.655∗∗ (0.487) 221.6 (16530)Ln(MVE) + 0.115∗∗ (0.038) 0.121 (0.110)Volatility - -0.240 (0.181) -1.079 (0.708)Growth + 0.001 (0.002) -0.073 (0.098)Debt + -0.090 (0.253) -1.059 (0.016)
Bankruptcy + 0.013 (0.008) 0.057 (0.038)ROA - -0.374 (0.307) -0.149 (1.015)
US Listed + 0.319∗∗ (0.143) 0.568 (0.396)
Compensation - -0.524 (0.504) -1.690 (0.147)
Outsiders + 2.073∗∗ (0.374) 0.515 (0.975)Insiders ? 2.859∗∗ (0.477) 1.370 (1.382)Members + -0.036 (0.021) -0.115 (0.066)Acquiror + 0.070 (0.098) -0.018 (0.273)
Divestor + 0.145 (0.206) -0.519 (0.736)
Lagged Insured + -222.0 (16530)FIRM Fixed EffectTIME Fixed Effect
LL -586.45 -70.32n 1031 1031
∗significant at the 5 % level; ∗∗significant at the 1 % levelStandard error in parentheses.
32
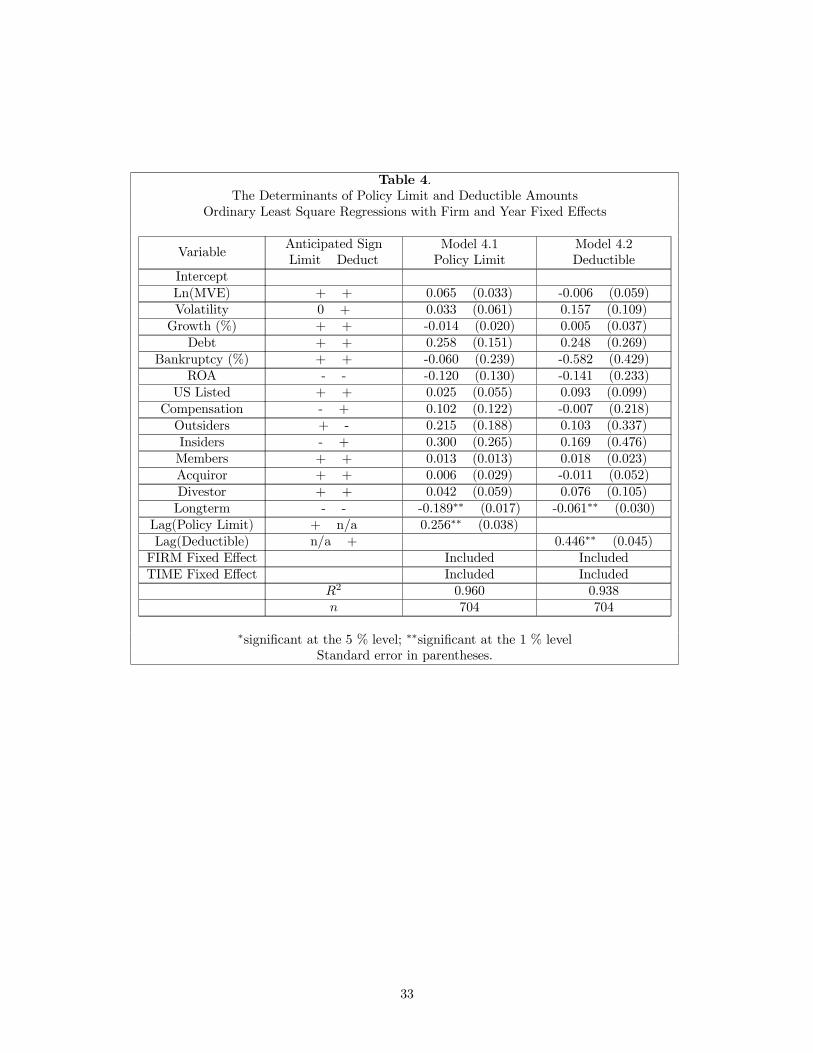
Table 4.The Determinants of Policy Limit and Deductible Amounts
Ordinary Least Square Regressions with Firm and Year Fixed Effects
VariableAnticipated SignLimit Deduct
Model 4.1Policy Limit
Model 4.2Deductible
InterceptLn(MVE) + + 0.065 (0.033) -0.006 (0.059)Volatility 0 + 0.033 (0.061) 0.157 (0.109)Growth (%) + + -0.014 (0.020) 0.005 (0.037)
Debt + + 0.258 (0.151) 0.248 (0.269)
Bankruptcy (%) + + -0.060 (0.239) -0.582 (0.429)ROA - - -0.120 (0.130) -0.141 (0.233)
US Listed + + 0.025 (0.055) 0.093 (0.099)Compensation - + 0.102 (0.122) -0.007 (0.218)
Outsiders + - 0.215 (0.188) 0.103 (0.337)
Insiders - + 0.300 (0.265) 0.169 (0.476)Members + + 0.013 (0.013) 0.018 (0.023)Acquiror + + 0.006 (0.029) -0.011 (0.052)Divestor + + 0.042 (0.059) 0.076 (0.105)
Longterm - - -0.189∗∗ (0.017) -0.061∗∗ (0.030)Lag(Policy Limit) + n/a 0.256∗∗ (0.038)Lag(Deductible) n/a + 0.446∗∗ (0.045)FIRM Fixed Effect Included IncludedTIME Fixed Effect Included Included
R2 0.960 0.938n 704 704
∗significant at the 5 % level; ∗∗significant at the 1 % levelStandard error in parentheses.
33

Table 5.The Determinants of Policy Limit and Deductible Amounts
Simultaneous Instrumental Variable Regressions with Firm and Year Fixed Effects
VariableAnticipated SignLimit Deduct
Model 5.1Policy Limit
Model 5.2Deductible
InterceptLn(MVE) + + 0.065 (0.034) -0.092 (0.065)Volatility 0 + 0.035 (0.062) 0.120 (0.109)Growth (%) + + -0.013 (0.021) 0.022 (0.037)
Debt + + 0.259 (0.152) -0.062 (0.285)
Bankruptcy (%) + + -0.066 (0.243) -0.579 (0.425)ROA - - -0.120 (0.130) -0.003 (0.236)
US Listed + + 0.026 (0.056) 0.037 (0.099)Compensation - + 0.103 (0.122) -0.092 (0.218)
Outsiders + - 0.214 (0.189) -0.132 (0.342)
Insiders - + 0.297 (0.266) -0.121 (0.481)Members + + 0.013 (0.013) 0.010 (0.023)Acquiror + + 0.006 (0.029) -0.001 (0.052)Divestor + + 0.043 (0.059) 0.025 (0.105)
Longterm - - -0.190∗∗ (0.017) 0.087 (0.056)Lag(Policy Limit) + n/a 0.258∗∗ (0.041)Lag(Deductible) n/a + 0.436∗∗ (0.044)Deductible(Predicted)
+ n/a -0.007 (0.058)
Limit(Predicted)
n/a + 0.818∗∗ (0.266)
FIRM Fixed Effect Included IncludedTIME Fixed Effect Included Included
R2 0.960 0.940n 704 704
∗significant at the 5 % level; ∗∗significant at the 1 % levelStandard error in parentheses.
34

Table 6.The Determinants of D&O Insurance Purchases: Probit Regression by Year
Dependant Variable Equals 1 if the Corporation Carries Insurance and 0 Otherwise.
VariableModel 6.1
1994Model 6.2
1995Model 6.3
1996Model 6.4
1997Model 6.5
1998
Ln(MVE) +-0.224(0.309)
0.382(0.311)
-0.502(0.401)
0.195(0.340)
0.080(0.288)
Volatility --0.195(0.493)
-0.613(0.410)
-0.801(0.423)
-0.598(0.412)
-0.052(0.391)
Growth +0.204(0.178)
0.053(0.092)
0.300(0.174)
-0.040(0.107)
-0.049(0.099)
Debt +0.204(0.178)
0.204(0.178)
0.204(0.178)
0.204(0.178)
0.204(0.178)
Bankruptcy +-0.077(0.071)
0.010(0.052)
0.129∗∗
(0.039)-0.079(0.044)
0.006(0.038)
ROA --0.219(1.610)
1.092(1.079)
0.441(0.946)
-0.015(0.814)
-0.205(0.521)
US Listed +6.649(26.42)
0.426(0.572)
0.857∗
(0.405)0.170(0.268)
-0.028(0.275)
Compensation -1.635(2.393)
-0.216(1.630)
-0.198(2.246)
-1.002(1.513)
3.312(1.898)
Outsiders +4.764(2.575)
1.153(2.098)
-4.132(2.675)
0.302(1.946)
-0.601(1.688)
Insiders -1.283(0.793)
1.104(0.721)
1.775(0.788)
1.293(0.756)
0.642(0.818)
Members +0.002(0.042)
-0.073(0.041)
-0.004(0.040)
0.017(0.039)
0.037(0.045)
Acquiror +-0.074(0.250)
-0.389(0.235)
-0.131(0.253)
0.299(0.221)
0.436(0.268)
Divestor +0.293(0.652)
0.371(0.647)
0.761(0.538)
0.730(0.600)
-0.060(0.428)
SECTORFixed Effects
Included Included Included Included Included
LL -88.39 -113.78 -110.74 -126.09 -106.17n 166 212 217 227 203
∗significant at the 5 % level; ∗∗significant at the 1 % levelStandard error in parentheses.
35

Table 7.The Determinants of Policy Limit and Deductible Amounts
Univariate Simultaneous Instrumental Variable Regressions with Firm and Year Fixed Effects
VariableAnticipated SignLimit Deduct
Model 5.1Policy Limit
Model 5.2Deductible
UsableObservations
Ln(MVE) + + 0.024 (0.021) -0.075∗ (0.040) 736Volatility 0 + 0.037 (0.055) 0.139 (0.096) 707Growth + + -0.120 (0.219) 0.119 (0.381) 736Debt + + 0.061 (0.106) 0.271 (0.180) 736
Bankruptcy + + -0.050 (0.221) -0.317 (0.391) 704ROA - - -0.134 (0.114) -0.218 (0.201) 741
US Listed + + 0.052 (0.057) 0.075 (0.099) 741Compensation - + 0.074 (0.123) -0.084 (0.212) 741Outsiders + - 0.065 (0.134) -0.085 (0.234) 741Insiders - + 0.071 (0.189) 0.056 (0.326) 741Members + + 0.019 (0.012) 0.006 (0.021) 741Acquiror + + 0.032 (0.027) -0.021 (0.047) 741Divestor + + 0.040 (0.055) 0.115 (0.095) 741Longterm - - Included Included
Lag(Policy Limit) + n/a IncludedLag(Deductible) n/a + IncludedDeductible(Predicted)
+ n/a Included
Limit(Predicted)
n/a + Included
FIRM Fixed Effect Included IncludedTIME Fixed Effect Included Included
R2 >0.96 >0.94
∗significant at the 5 % level; ∗∗significant at the 1 % levelStandard error in parentheses.
36

Table 8.The Determinants of Policy Limit and Deductible Amounts
Ordinary Least Square Regressions with Firm and Year Fixed Effects
VariableModel 8.1Policy Limit
Model 8.2Deductible
Model 8.3Policy LimitResidual
Model 8.4DeductibleResidual
Intercept-0.056(0.086)
-0.084(0.137)
Ln(MVE)0.003(0.006)
0.003(0.009)
Volatility0.012(0.035)
0.087(0.056)
Growth-0.007(0.007)
-0.005(0.014)
Debt-0.007(0.007)
-0.007(0.007)
Bankruptcy-0.020(0.125)
-0.002(0.002)
ROA-0.026(0.063)
0.024(0.103)
US Listed0.005(0.023)
0.039(0.038)
Compensation0.009(0.008)
-0.006(0.012)
Outsiders0.028(0.078)
-0.032(0.124)
Insiders0.035(0.090)
0.040(0.145)
Members0.001(0.003)
0.001(0.006)
Acquiror0.021(0.018)
0.005(0.029)
Divestor0.021(0.037)
0.008(0.058)
Longterm-0.198∗∗
(0.017)-0.102∗∗
(0.027)
Lag(Policy Limit)0.269∗∗
(0.035)
Lag(Deductible)0.404∗∗
(0.051)FIRM Fixed Effect Included IncludedTIME Fixed Effect Included Included
R2 0.956 0.943 0.007 0.015n 704 704 704 704
∗significant at the 5 % level; ∗∗significant at the 1 % levelStandard error in parentheses.
37

Table 9.The Determinants of Changes in the Policy Limit and in the Deductible Amounts
Models 9.1 and 9.2, Ordinary Least Square Regressions with Firm and Year Fixed Effects.Models 9.3 and 9.4, Structural Regression of Second Stage IV Procedure with Firm and Year Fixed Effects.
VariableModel 9.1Change inPolicy Limit
Model 9.2Change inDeductible
Model 9.3Change inPolicy Limit
Model 9.4Change inDeductible
Ln(MVE)-0.048(0.044)
-0.002(0.067)
-0.049(0.045)
-0.045(0.072)
Volatility-0.004(0.081)
0.132(0.125)
0.031(0.213)
0.128(0.125)
Growth-0.040(0.280)
0.071(0.428)
0.058(0.297)
0.106(0.431)
Debt-0.104(0.201)
0.131(0.308)
-0.069(0.250)
0.038(0.305)
Bankruptcy-0.002(0.003)
-0.005(0.005)
-0.004(0.007)
-0.007(0.005)
ROA0.030(0.174)
-0.332(0.267)
-0.058(0.513)
-0.305(0.272)
US Listed-0.115(0.073)
-0.096(0.112)
-0.141(0.145)
-0.199(0.167)
Compensation0.093(0.163)
-0.087(0.250)
0.070(0.201)
-0.004(0.264)
Outsiders0.027(0.251)
0.429(0.386)
0.141(0.655)
0.453(0.388)
Insiders0.177(0.354)
0.748(0.543)
0.376(1.092)
0.907(0.567)
Members0.020(0.017)
0.004(0.027)
0.021(0.018)
0.022(0.032)
Acquiror0.058(0.039)
-0.052(0.060)
0.044(0.081)
Divestor-0.015(0.078)
0.058(0.120)
0.044(0.122)
Longterm-0.217∗∗
(0.022)-0.091∗∗
(0.034)-0.241(0.126)
-0.285(0.232)
Predicted (∆ Limit)-0.895(1.035)
Predicted (∆ Deductible)-0.266(1.355)
FIRM Fixed Effect Included Included Included IncludedTIME Fixed Effect Included Included Included Included
R2 0.429 0.341 0.429 0.341n 704 704 704 704
∗significant at the 5 % level; ∗∗significant at the 1 % levelStandard error in parentheses.
38
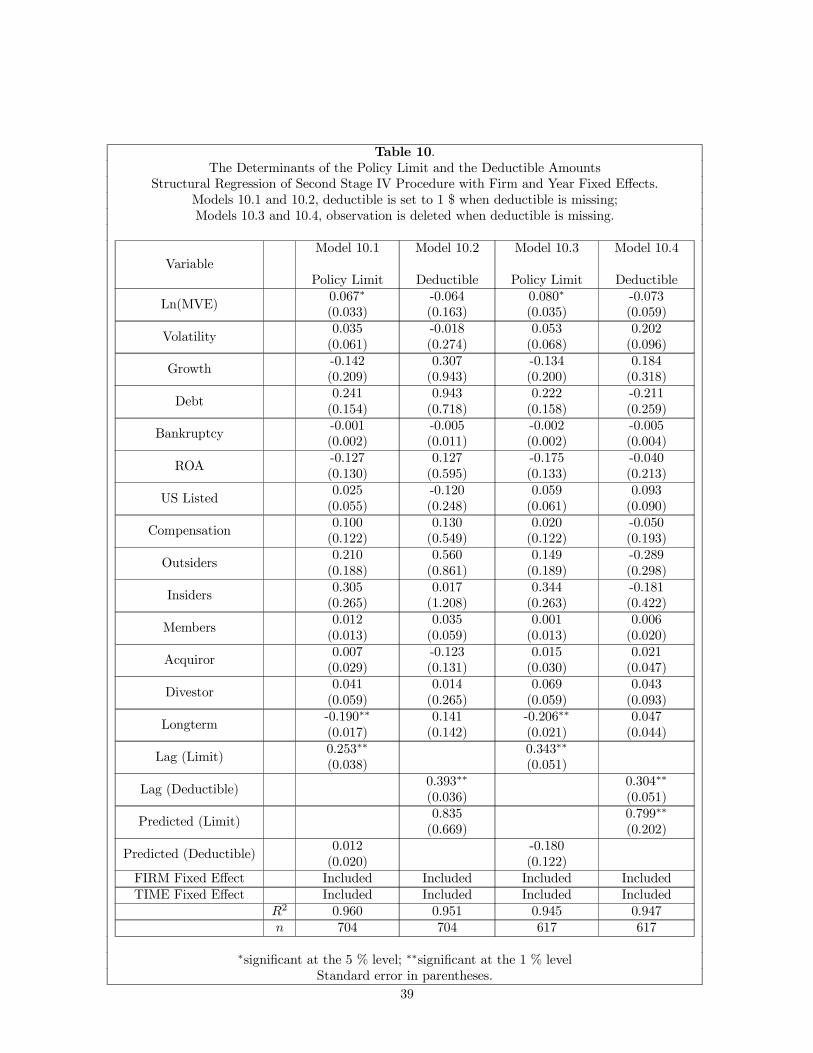
Table 10.The Determinants of the Policy Limit and the Deductible Amounts
Structural Regression of Second Stage IV Procedure with Firm and Year Fixed Effects.Models 10.1 and 10.2, deductible is set to 1 $ when deductible is missing;Models 10.3 and 10.4, observation is deleted when deductible is missing.
VariableModel 10.1
Policy Limit
Model 10.2
Deductible
Model 10.3
Policy Limit
Model 10.4
Deductible
Ln(MVE)0.067∗
(0.033)-0.064(0.163)
0.080∗
(0.035)-0.073(0.059)
Volatility0.035(0.061)
-0.018(0.274)
0.053(0.068)
0.202(0.096)
Growth-0.142(0.209)
0.307(0.943)
-0.134(0.200)
0.184(0.318)
Debt0.241(0.154)
0.943(0.718)
0.222(0.158)
-0.211(0.259)
Bankruptcy-0.001(0.002)
-0.005(0.011)
-0.002(0.002)
-0.005(0.004)
ROA-0.127(0.130)
0.127(0.595)
-0.175(0.133)
-0.040(0.213)
US Listed0.025(0.055)
-0.120(0.248)
0.059(0.061)
0.093(0.090)
Compensation0.100(0.122)
0.130(0.549)
0.020(0.122)
-0.050(0.193)
Outsiders0.210(0.188)
0.560(0.861)
0.149(0.189)
-0.289(0.298)
Insiders0.305(0.265)
0.017(1.208)
0.344(0.263)
-0.181(0.422)
Members0.012(0.013)
0.035(0.059)
0.001(0.013)
0.006(0.020)
Acquiror0.007(0.029)
-0.123(0.131)
0.015(0.030)
0.021(0.047)
Divestor0.041(0.059)
0.014(0.265)
0.069(0.059)
0.043(0.093)
Longterm-0.190∗∗
(0.017)0.141(0.142)
-0.206∗∗
(0.021)0.047(0.044)
Lag (Limit)0.253∗∗
(0.038)0.343∗∗
(0.051)
Lag (Deductible)0.393∗∗
(0.036)0.304∗∗
(0.051)
Predicted (Limit)0.835(0.669)
0.799∗∗
(0.202)
Predicted (Deductible)0.012(0.020)
-0.180(0.122)
FIRM Fixed Effect Included Included Included IncludedTIME Fixed Effect Included Included Included Included
R2 0.960 0.951 0.945 0.947n 704 704 617 617
∗significant at the 5 % level; ∗∗significant at the 1 % levelStandard error in parentheses.
39


![Index [assets.cambridge.org]assets.cambridge.org/97805218/51534/index/9780521851534_index… · Steven A. Nyce and Sylvester J. Schieber Index More information. 374 Index Alternative](https://static.fdocuments.us/doc/165x107/5f43a72771d3a012da6005a2/index-steven-a-nyce-and-sylvester-j-schieber-index-more-information-374-index.jpg)