2003 Lummi Clam Survey Summary analysis of 2013 Clam...2013 Lummi Clam Survey Summary ... Using the...
46
2013 Lummi Clam Survey Summary Prepared by: Craig Dolphin, LNR Natural Resources Analyst 10/8/2013
Transcript of 2003 Lummi Clam Survey Summary analysis of 2013 Clam...2013 Lummi Clam Survey Summary ... Using the...

2013 Lummi Clam Survey Summary
Prepared by: Craig Dolphin, LNR Natural Resources Analyst
10/8/2013


i
Executive Summary In 2013 Lummi Natural Resources contracted with Wilbert LeClair to survey clam densities on several important clam beaches. A total of 2,698 samples were dug, which was equivalent to 10,746 square feet. Legal biomass estimates were 950,205 lbs for Lummi Bay and 218,778 lbs for Portage Bay (excluding S6, S7A, and S7E). Northern and Southern Lummi Bay, and the Senior’s Beach in Portage Bay have shown increases in population. However, central Lummi Bay and the rest of Portage Bay have significantly reduced populations compared to the target densities. A survey of the conditionally approved section of Drayton Harbor was undertaken in 2013 and results indicate a total population size of 131,467 lbs of legal sized clams. Using the 33% harvest rate, the 50% tribal share would indicate a harvest of 21,692 lbs could be undertaken. This would be the first harvest in Drayton Harbor since the 1997-1998 season. Recommended harvest levels for the 2013-2014 season could provide up to 221,355 lbs of on-reservation harvest in the coming season. Note that this does not include any harvest that might be taken from Inside Portage Bay (S6), Inside Brant Point (S7A), or from off-reservation beaches (Birch Bay State Park, Drayton Harbor). However, the sorry state of most Portage Bay populations may warrant additional caution and lower harvest targets than suggested here. A separate survey in 2013 by WDFW, with participation by some LNR staff, of Birch Bay State Park resulted in a calculated tribal quota of 26,069 lbs for the upcoming season. When combined with the LNR Drayton Harbor results, this would indicate that up to 46,155 lbs could be harvested off-reservation in the coming season.

ii
Table of Contents
Executive Summary ............................................................................................................. i Table of Contents ................................................................................................................ ii List of Figures .................................................................................................................... iii List of Tables ..................................................................................................................... iv Introduction ......................................................................................................................... 1
General Harvest History ................................................................................................. 1 Semiahmoo History ........................................................................................................ 3
Growing Area Status ................................................................................................... 3 Harvest History ........................................................................................................... 4 Survey History ............................................................................................................ 5
Birch Bay State Park History .......................................................................................... 7
Growing Area Status ................................................................................................... 7 Harvest History ........................................................................................................... 8
Survey History ............................................................................................................ 9
Portage Bay History ...................................................................................................... 10 Growing Area Status ................................................................................................. 11 Harvest History ......................................................................................................... 12
Lummi Bay History ...................................................................................................... 14 Growing Area Status ................................................................................................. 15
Harvest History ......................................................................................................... 16 General Harvest Strategy .............................................................................................. 18 2012 – 2013 Season Landings by Area......................................................................... 19
2013 Survey Aims......................................................................................................... 20 Methods............................................................................................................................. 20
Field Protocol ................................................................................................................ 20 Data Processing ......................................................................................................... 21
Data Analysis ............................................................................................................ 23 To get the best estimate of clam density… ........................................................... 23
To calculate the area covered by the survey… ..................................................... 24 Further operations necessary for further analysis ................................................. 24 To calculate the spatially weighted average clam density .................................... 24
Precision of the estimate ....................................................................................... 25 Determining Production Rates .............................................................................. 26
Data Validation ......................................................................................................... 28
Results ............................................................................................................................... 28 Discussion ......................................................................................................................... 36
References ......................................................................................................................... 38

iii
List of Figures Figure 1. Seasonal Commercial Harvests of Manila Clams Since 1988 ............................ 2 Figure 2. Growing Area Status in Drayton Harbor ............................................................. 3 Figure 3. Recorded Seasonal Harvest from Drayton Harbor Since 1988 ........................... 4 Figure 4. Manila Clam Distribution in Western Drayton Harbor (based on LNR Survey
Data) ............................................................................................................................ 6
Figure 5. Growing Area Status at Birch Bay State Park ..................................................... 7 Figure 6. Recorded Seasonal Harvest From Birch Bay State Park Since 1988 .................. 8 Figure 7. Portage Bay Clam Management Area Codes .................................................... 10 Figure 8. Growing Area Status in Portage Bay and Hale Passage .................................... 11 Figure 9. Recorded Harvest from Portage Bay Clam Management Areas Since 1989 .... 12
Figure 10. Lummi Bay Clam Management Area Codes ................................................... 14
Figure 11. Growing Area Status of Lummi Bay ............................................................... 15 Figure 12. Recorded Harvest from Lummi Bay Clam Management Areas Since 1989... 17
Figure 13. Survival rates used in calculating Production Estimates (from Dolphin, 2004b)
................................................................................................................................... 26 Figure 14. Annual size-specific growth rates used in calculating production estimates .. 27 Figure 15. Legal-sized Manila clam densities in Lummi Bay based on 2013 survey data29
Figure 16. Legal-sized Manila clam densities at Portage Spit and Senior’s Beach based on
2013 survey data ....................................................................................................... 30
Figure 17. Legal-sized Manila clam densities surveyed at Brant Flats and Brant Island in
2013........................................................................................................................... 31 Figure 18. Legal-sized Manila clam densities surveyed at Drayton Harbor in 2013 ....... 32
Figure 19. Change in Harvestable Biomass in Lummi Bay Management Areas since 2002
................................................................................................................................... 33
Figure 20. Change in Harvestable Biomass in Portage Bay Management Areas since 2002
................................................................................................................................... 34
Figure 21. Comparison of 2013-2014 Season Harvest Recommendation to Past Harvest
Totals......................................................................................................................... 35

iv
List of Tables
Table 1. 2012—2013 Harvested Pounds .......................................................................... 19 Table 2. Summary of 2013 Survey Results. ..................................................................... 28 Table 3. Annual Production Estimates Based on LNR Manila Clam Survey Results. ..... 34 Table 4. Recommended Harvest Totals for 2013-2014 .................................................... 35
1
Introduction
General Harvest History
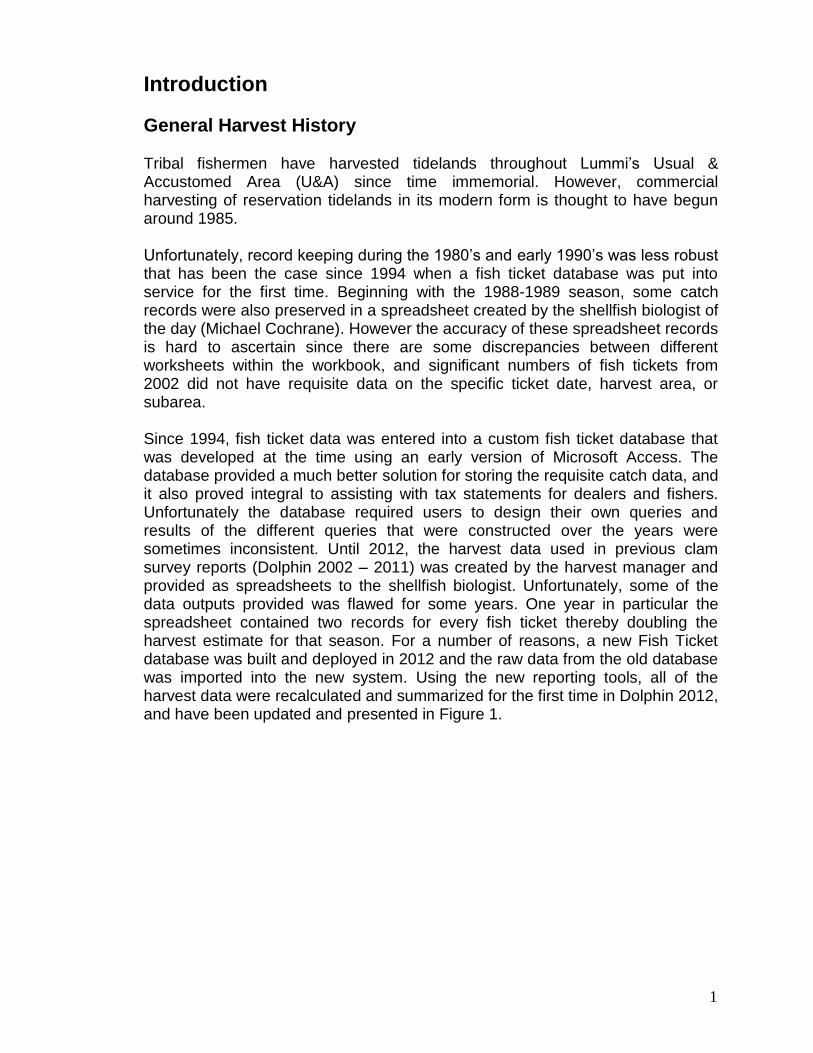
Tribal fishermen have harvested tidelands throughout Lummi’s Usual & Accustomed Area (U&A) since time immemorial. However, commercial harvesting of reservation tidelands in its modern form is thought to have begun around 1985. Unfortunately, record keeping during the 1980’s and early 1990’s was less robust that has been the case since 1994 when a fish ticket database was put into service for the first time. Beginning with the 1988-1989 season, some catch records were also preserved in a spreadsheet created by the shellfish biologist of the day (Michael Cochrane). However the accuracy of these spreadsheet records is hard to ascertain since there are some discrepancies between different worksheets within the workbook, and significant numbers of fish tickets from 2002 did not have requisite data on the specific ticket date, harvest area, or subarea. Since 1994, fish ticket data was entered into a custom fish ticket database that was developed at the time using an early version of Microsoft Access. The database provided a much better solution for storing the requisite catch data, and it also proved integral to assisting with tax statements for dealers and fishers. Unfortunately the database required users to design their own queries and results of the different queries that were constructed over the years were sometimes inconsistent. Until 2012, the harvest data used in previous clam survey reports (Dolphin 2002 – 2011) was created by the harvest manager and provided as spreadsheets to the shellfish biologist. Unfortunately, some of the data outputs provided was flawed for some years. One year in particular the spreadsheet contained two records for every fish ticket thereby doubling the harvest estimate for that season. For a number of reasons, a new Fish Ticket database was built and deployed in 2012 and the raw data from the old database was imported into the new system. Using the new reporting tools, all of the harvest data were recalculated and summarized for the first time in Dolphin 2012, and have been updated and presented in Figure 1.
2
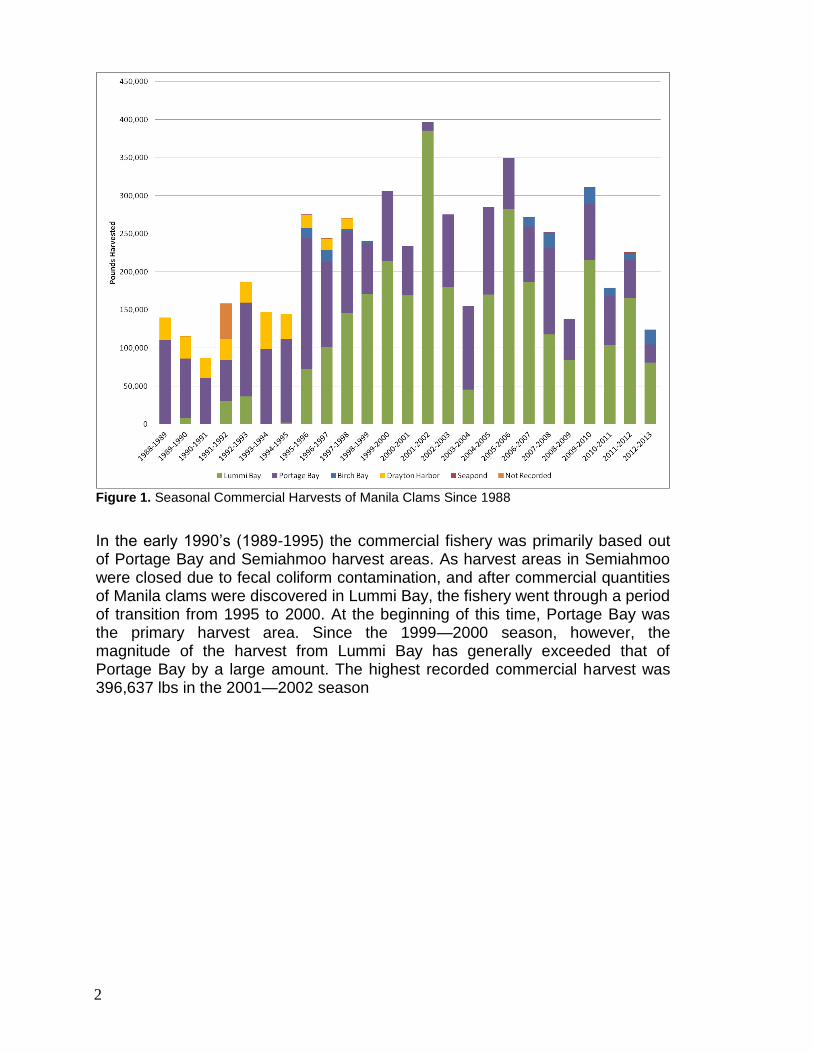
Figure 1. Seasonal Commercial Harvests of Manila Clams Since 1988
In the early 1990’s (1989-1995) the commercial fishery was primarily based out of Portage Bay and Semiahmoo harvest areas. As harvest areas in Semiahmoo were closed due to fecal coliform contamination, and after commercial quantities of Manila clams were discovered in Lummi Bay, the fishery went through a period of transition from 1995 to 2000. At the beginning of this time, Portage Bay was the primary harvest area. Since the 1999—2000 season, however, the magnitude of the harvest from Lummi Bay has generally exceeded that of Portage Bay by a large amount. The highest recorded commercial harvest was 396,637 lbs in the 2001—2002 season

3
Semiahmoo History
Growing Area Status Prior to 1995, Semiahmoo/Drayton Harbor was classified as an approved shellfish growing area. However, worsening fecal coliform contamination of the waters in Drayton Harbor led to a partial closure of some Semiahmoo harvest areas in 1995, and then a complete closure in 1999. Subsequently, the area has remained closed to shellfish harvest except for a portion of Drayton Harbor that was reclassified to conditionally approved in 2006. The spatial extent of the conditionally approved area was subsequently expanded in December 2010 (Figure 2). No further changes have occurred in classification since the 2010 review (WADOH 2012a). Until the 2010 review, the conditionally approved portion of Drayton Harbor did not contain areas that were known to be productive enough to sustain a tribal harvest. However, the conditionally approved area now encompasses the portion of shoreline adjacent to the bluffs on the western part of the harbor. This area does contain a narrow ribbon featuring good densities of Manila clams and can now be considered to be a viable option for a springtime harvest. The conditionally approved area is unavailable for harvest from December through February, and likewise for 6 days following any rainfall event larger than 0.75 inches in 24-hours.
Figure 2. Growing Area Status in Drayton Harbor

4
Harvest History Total landings from Semiahmoo averaged approximately 26,599 lbs from 1988 – 1997 (Figure 3). The highest annual harvest from Semiahmoo was 48,483 lbs that were landed during the 1993—1994 season. However, the last productive portions of Drayton Harbor were closed to commercial harvest in 1997 due to fecal coliform contamination. No tribal harvest of Manila clams from Semiahmoo/Drayton Harbor has occurred since the closure in 1997, although there is still interest in harvesting the area.
0
10,000
20,000
30,000
40,000
50,000
60,000
Po
un
ds
Har
vest
ed
20A 001
20A 003
Figure 3. Recorded Seasonal Harvest from Drayton Harbor Since 1988

5
Survey History
The first clam survey of the area that is known to the author was conducted by the Whatcom County Parks Department (Peterschmidt, 1990). This survey covered the Boundary Bay side of Semiahmoo Spit (prohibited classification), as well as a portion of the Drayton Harbor side of Semiahmoo Spit near the marina. On the Drayton Harbor side of the Semiahmoo Spit, Peterschmidt estimated there was a biomass of c. 76,000 lbs present in the portion of beach surveyed. A further 40,000 lbs of Manila clams were estimated to be present on the outside of Semiahmoo Spit. LNR first surveyed Drayton Harbor in 2003 (Dolphin, 2003). At that time, 39 Acres were surveyed along the western portion of Drayton Harbor, and a biomass of 104,567 lbs of legal-sized Manila clams was estimated to be present within the 2003 survey boundaries (Figure 4). Clam densities in the part of the beach that were surveyed by both LNR and Whatcom County Parks, were found to be about 60% lower than those reported in 1990. However, it should be noted that the 2003 survey area included a productive portion of the beach that is immediately adjacent to the marina and that remains in a prohibited status. LNR did not survey the Boundary Bay side of Semiahmoo Spit due to the prohibited status of the beach on that side. Based on the size-frequency distribution of the clam population in 2003, and using estimates for size-specific growth and natural mortality rates, it was estimated that the surveyed area could support a harvest of 22,667 lbs over the following year. If the 33% rate used in State-Tribal management agreements were used instead, then the TAC would have been set at 34,852 lbs. A re-survey the area that was surveyed by LNR in 2003 was first attempted in 2012. Unfortunately, a number of issues arose with the survey dataset that could not be remedied with post-survey quality assurance measures. The deficiencies with the survey data included the spatial coverage of the data collection effort, ambiguity in field form records, and large GPS error caused by interference with a steep bluff and overhanging trees that are immediately adjacent to the beach. Although the densities reported were very encouraging the survey could not be used with confidence. Accordingly, a new survey of the conditionally approved area was required in 2013.

6
Figure 4. Manila Clam Distribution in Western Drayton Harbor (based on LNR Survey Data)

7
Birch Bay State Park History Growing Area Status Birch Bay State Park (Figure 5) is located within an approved growing area (WADOH 2012b).
Figure 5. Growing Area Status at Birch Bay State Park

8
Harvest History Birch Bay State Park (BBSP) has been commercially harvested during two distinct periods within the period of record by Lummi clam diggers (Figure 6). Prior to 1997, tribal diggers were more interested in harvesting at Drayton Harbor than at Birch Bay. The forced partial closure of Drayton Harbor in the early 1990’s led to tribal diggers experimenting with conducting a harvest at Birch Bay, beginning in the 1995-1996 season, to replace some of the lost opportunity at Drayton Harbor. However, digger dissatisfaction with the clam densities encountered there, together with travel costs, reduced enthusiasm for harvesting at BBSP after just a couple of seasons, and no significant commercial harvests were undertaken from 1999-2005. In more recent years, however, the growing number of tribal members participating in the clam harvest has led to greater interest in resuming off-Reservation harvest activities. Accordingly, clam harvests at BBSP resumed in 2006. Overall, the amount of clams harvested at BBSP has averaged approximately 12,739 lbs. during years where the tribe has actively harvested.
Figure 6. Recorded Seasonal Harvest From Birch Bay State Park Since 1988

9
Survey History
LNR has conducted stock assessment surveys at BBSP using Lummi protocols on three
occasions: in 2003, 2004, and 2005. In addition, LNR jointly surveyed BBSP with
WDFW personnel after a mass mortality-event was reported in 2006. WDFW separately
surveyed BBSP in 2003, 2005, 2007, 2009, and also in 2011 and 2013 (with participation
by some LNR staff).
Historically, WDFW have used the Campbell protocol referenced in the Region 1
Bivalve agreement to conduct surveys. In 2011, this approach was changed by agreement
with the tribe so that the overall survey effort could be reduced while preserving the
original 30% precision goal. This outcome was made possible by stratifying the area to
be surveyed using the combined geo-positioned survey results from previous tribal and
state surveys to delineate the area that encompassed the majority of the Manila clam
population.
The results of past surveys were used to estimate the percentage of the biomass at BBSP
present outside of the new survey area, and thereby to extrapolate the final biomass
estimate for BBSP from future survey results.
In 2013, the WDFW/LNR survey results indicated that a population biomass of
98,747 lbs was present at BBSP, and that this would equate to a tribal TAC allocation of
26,069 lbs (Alex Bradbury, WDFW, Pers. Comm.).

10
Portage Bay History
Figure 7. Portage Bay Clam Management Area Codes

11
Growing Area Status Prior to 1997, Portage Bay was an approved growing area. However, worsening fecal coliform contamination led to Brant Island (21A-S7E) and much of the Senior's Beach (21A-S4) being closed to harvest in 1997. Subsequently, the southern half of Brant Flats (21A-S7D) was also closed in 1999. Following stepped-up enforcement of agricultural waste management regulations, improving water quality indicators led to the restricted portion of Brant Flats being re-opened in 2003, and Brant Island and the northern portion of Senior's Beach was re-approved for harvest in June 2006. In 2009, a 20-Acre portion (Figure 8) of Portage Bay (21A-S6) was closed to harvest due to elevated fecal coliform counts from a small stream discharging from Portage Island into Portage Bay (WADOH 2011c). The fecal coliform counts are likely the result of contamination by a semi-wild herd of cattle living on Portage Island. Efforts to eradicate the cattle were made in 2011 and monitoring is ongoing to try to get the closure status removed. More recently, The 2012 growing area report indicates that the growing area status of Portage Bay may be downgraded again due to worsening fecal coliform results.
Figure 8. Growing Area Status in Portage Bay and Hale Passage

12
Harvest History Although clam harvests have occurred in Portage Bay prior to 1989, no harvest records have been kept from that time period. Subsequent to 1989, the total harvest from Portage Bay beaches has ranged from a low of approximately 10,974 lbs to a high of approximately 171,729 lbs (Figure 9). Overall, the average harvest during this time period has been approximately 86,416 lbs per year. During the period when the growing area classification-related closures were at their largest extent, the average harvest from Portage Bay was reduced by about 38,000 lbs per year compared to years when no closures were in effect. However, this analysis is compounded by an anomalous season in 2001—2002 when wholesale buyers exhibited a transitory preference for larger clams that were available from Lummi Bay, resulting in a shift in digger effort to Lummi Bay. In most seasons, buyers have preferred to buy the smaller and thinner-shelled clams from Portage Bay.
Figure 9. Recorded Harvest from Portage Bay Clam Management Areas Since 1989
Most of the harvest in Portage has historically derived from two management areas: Portage Spit (S5) and Brant Flats (S7D), which have averaged approximately 27,015 lbs and 34,311 lbs per year respectively. Next in importance is Brant Point (S7A; 9,484 lbs per year), Brant Island (S7E; 5,817 lbs per year) and Portage Bay (S6) (5,087 lbs). S4 is designated as an area to be dug by tribal seniors only and typically produces less than 2,000 lbs per year. Other management area codes are no longer used as they relates to areas on

13
the outer perimeter of Portage Island which do not have a growing area classification. Note that some of the particularly large harvests attributed to S7A from 1994-1997 may have actually come from S7D which is immediately adjacent and much larger. Management area boundaries were less well known at the time and it is possible that changes in boundaries, or interpretation of boundaries, have occurred since that time. It is certainly true that S7A has only been a very minor contributor to the Portage Bay harvest in more recent times.

14
Lummi Bay History
Figure 10. Lummi Bay Clam Management Area Codes

15
Growing Area Status Lummi Bay has been an approved shellfish growing area (Figure 11) during the period of record (WADOH 2012d).
Figure 11. Growing Area Status of Lummi Bay

16
Harvest History Prior to 1990, Manila clams were not harvested from Lummi Bay. In 1990, the Lummi Bay Manila clam population was discovered and nearly 8,000 lbs were harvested from along Robertson Road (S1B). Sporadic effort continued over the following years, mostly focused on the S1B management area. However, in 1994 clams were also located in the management areas S1C, S1D, & S1E. Subsequently, digger effort quickly ramped up and eventually Lummi Bay became the dominant fishery for Manila clams, peaking during the 2001—2002 season at 385,663 lbs (Figure 12). Since 2000, total landings from Lummi Bay management areas have averaged c. 168,500 lbs per year. The lowest annual harvest during this period was c. 46,000 lbs recorded for the 2003—2004 season. The harvest reduction in that season was caused by a temporary reluctance by wholesale buyers to purchase clams from Lummi Bay. During that year, the buyers deemed Lummi Bay clams to be less marketable due to their larger size and thicker shells. This pattern of buyer preference was the inverse of that two seasons prior when Lummi Bay clams were strongly preferred. The 2005—2006 season harvest was impacted by a significant winterkill event that took place in Lummi Bay. The 2005 winterkill was equivalent to losing an entire year's harvest as well as disrupting recruitment for the following three years. An unreported winterkill is also suspected to have occurred on Portage Bay beaches and in central Lummi Bay (S1C) during the winter of 2008—2009. These circumstances combined to result in an unforeseen, severe, and widespread decline in stock abundance on most Reservation beaches that was finally detected during the 2010 survey. This resulted in the dramatic reduction in harvest for the 2010-2011 season. The other notable years for reduced landings were the 2007—2008 season, and the 2010-2011 season, when less than 110,000 lbs were landed from Lummi Bay. These catch reductions were due to reduced harvest targets based on the stock assessment survey results from the preceding year. Similarly, weak stock assessment survey results in 2012 led to low harvest targets for the 2012-2013 season.

17
Figure 12. Recorded Harvest from Lummi Bay Clam Management Areas Since 1989
Harvest records indicate that the majority of the Lummi Bay harvest came from S1C during the initial years of the Lummi Bay fishery, but subsequently the digger effort switched to the S1D and S1E management areas. Following the first wide-scale survey of manila clam distributions in Lummi Bay (Dolphin, 2002) it was evident that there was no meaningful break in the population between areas S1D and S1E and, consequently, both of these areas are now managed as one area. All subsequent surveys show that these two management areas combined contain the majority of the biomass present in Lummi Bay. The clam biomass in S1C in 2002 was revealed to be approximately one-third of the biomass in the S1D/S1E area. As a consequence, of declining biomass in S1C, harvest effort in S1C has been limited since 2005 to 'senior' diggers, or diggers with medical issues to provide an opportunity for the population in S1C to recover. However, little recovery has been detected to date, and the population was severely setback by the 2005 winterkill event, and again by an even more severe mortality event in the winter of 2008—2009. There is some question as to whether the catch data attributed to S1C between 1994 and 2001 may have actually been taken from S1D/S1E, at least in part. Alternatively, a long term shift in substrates in S1C, resulting from the construction of the Seapond in 1971, may be gradually reducing the suitability of the area for Manila clams.

18
Harvest effort in S1B (Robertson Road) has been sporadic over the years and survey data suggests that population in this area is more sensitive to harvest activities than fish ticket data would suggest should be the case. It is possible that unreported, illegal harvesters might be targeting this area in particular, probably due to ease of access. However, in recent years this area has increased in relative importance due mainly to the decline of harvest in the other areas.
General Harvest Strategy Openings during the season have sometimes been limited in an attempt to spread the harvest effort throughout the year, and daily limits for diggers have also periodically been used to try to extend the duration of the season. Generally speaking, diggers collectively choose where and when to focus harvest efforts temporally and spatially until the harvest targets are met. However, clam digger attendance and participation at scheduled meetings remains low. There is also a schism within the clam digger community between those who consider themselves to be ‘fulltime’ clam diggers (usually those that participate in the fishery both during the nighttime winter tides as well as the daytime spring tides) and others diggers who only participate actively during the daytime tide series. The ‘fulltime’ diggers are seeking to have more of the catch allocation set-aside for them rather than being left available for part-time diggers to harvest during the daylight tides.

19
2012 – 2013 Season Landings by Area
Table 1. 2012—2013 Harvested Pounds
Percent Area SubArea Lbs
0.0% Drayton Harbor
20A 001 0
20A 003 0
15.8% Birch Bay 20A 60 19,579
65.2% Lummi
Bay
20A S1B 36,913
20A S1C 2,528
20A S1D 12,536
20A S1E 28,934
19% Portage
Bay
20A S5A 0
21A S3 0
21A S4 3,442
21A S5 7,317
21A S6 0
21A S7A 236
21A S7D 12,634
21A S7E 0
21A S8 0
21A S9 0
100.0% Total 124,119
Landings from during the 2012—2013 season totaled 124,119 lbs of Manila clams. This harvest was the lowest on record since the 1990-1991 season. Approximately two thirds of the total harvest during the 2012-2013 season was taken from Lummi Bay, one fifth was taken from Portage Bay, and the remainder was harvested from Birch Bay State Park (Table 1).

20
2013 Survey Aims The purpose of the 2013 Manila clam survey program was to provide critical data for management purposes such as quantifying the harvestable biomass remaining on the beaches, and to make sustainable harvest recommendations for the 2013—2014 season. Beaches were surveyed in Lummi Bay, Portage Bay, and Drayton Harbor.
Methods The routine aspects of the clam survey were once again contracted out to a private contractor (Wilbert Hillaire), who also successfully conducted the survey field efforts in 2006, 2007, 2008, 2010, 2011, and 2012.
Field Protocol Due to the size of the area to be covered at most beaches, and limitations in staff availability, it has never been feasible to use the Campbell clam surveying protocol (WDFW 1996) to survey on-Reservation beaches. Instead, the Lummi
survey protocol was developed to attain a maximum precision of ±30% for the final estimate of biomass despite employing a much larger block size. This is attainable because the very large areas to be surveyed still require a large number of samples to be excavated, even with large block sizes, and also because larger sampling units are used which lowers the detection limit threshold and this helps reduces variance in the results. Similar to the Campbell protocol, the Lummi protocol uses a series of parallel transects that extend across the beach. Along each transect, a series of samples are taken at a predetermined number of steps apart. The orientation of each transect line is maintained by using distant visual reference points, such as mountain peaks, houses etc, and walking directly toward that same reference point after each sampling station is excavated. The spacing between the transect lines is determined using a pre-determined number of paces along the beach, and varied depending on factors such as staff availability, and the amount of area to be covered in the time available. Typically, transect lines are spaced at 50 steps apart in the Portage area surveys, and 200 steps in Lummi Bay. Along each transect line a predetermined number of paces separates each sample station. The number of paces between stations in each transect line is varied according to the beach slope and the overall length of the transect line. Distances between samples typically ranged from 15 - 70 paces, depending on the area. Intervals between samples smaller than 10 steps are not possible due to the limitations on the precision of the relatively inexpensive handheld GPS unit used to spatially geolocate each station. At each sample station, a quadrat is established, using either a 2.25 ft2 (Portage Bay) or a 9 ft2 (Lummi Bay) square frame constructed out of PVC pipe. The size

21
of the quadrat being used is noted at the bottom of each data sheet. The position of each sample station is determined using a hand-held WAAS enabled Garmin GPS unit (“Etrex Legend”, “Etrex Summit”, etc), set to display decimal degrees (NAD 83), and recorded on a data sheet. The Etrex has a theoretical accuracy of
9 ft with WAAS enabled, but typical operating accuracies vary between 10 and 25 feet. The top 4 - 6 inches of the substrate is excavated using various implements, such as specially sharpened, cut-down rakes. All Manila clams found in the quadrat are removed to the best ability of each digger as the ground is excavated, and then piled on a plastic bag to ensure none re-bury themselves while the rest of the quadrat is being excavated. The shells of the manila clams are measured to the nearest 1mm with a pair of plastic calipers with 1mm graduations. The clamshell dimension chosen for measurement in the Lummi surveys protocol is shell width, rather than the more customary metric of shell length. This is because comparative data on shell width and shell length measurements indicated that; overall, shell width is a marginally better predictor of actual clam weight than shell length (Unpublished data, Dolphin 2005). The dimensions of each Manila clam are recorded on the data sheet beside the GPS coordinates for that quadrat. Other species of clams, such as native littleneck clams (Leukoma staminea), Mahogany clams (Nuttalia obscurata), Softshell clams (Mya arenaria), butter clams (Saxidomus giganteus), and cockles (Clinocardium nuttalli), are also counted but no size measurements are recorded for these non-target species. Macoma clams (Macoma spp.) are also encountered frequently but these are not recorded. However, counts of species other than Manila clams and Cockles are probably incomplete because they typically live deeper in the substrate than Manila clams and could easily be missed using this protocol. The identification of Manila clams is primarily based on the external morphology of the shell. In particular, this is accomplished using the presence of a ‘scooped out’ hollow found immediately posterior to the dorsal hinge. The same part of the shell in native littleneck shells usually has a raised ridge extending all the way to the hinge and looks less ‘scooped out’. Any clams that are particularly difficult to identify using the overall shell shape, and the ‘scooped out hollow’ characteristic, are opened up and internal shell characteristics are used (such as the purple suffusion found inside manila shells but absent in littlenecks, or the tiny ridges on the inside ‘lips’ of native littlenecks shells, but not manilas). All other clams are returned to the excavated holes and given the opportunity to rebury themselves. In practice, very few clams need to be opened up for identification.
Data Processing GPS co-ordinates, quadrat size, and individual shell widths are entered into a custom-built Microsoft Access database. Prior to 2005, length-weight data attributed to an unsourced WDFW Manila clam survey in Birch Bay was used to

22
convert individual clam lengths into individual clam weights. However, in 2005 Lummi collected size-weight data for freshly caught, unfrozen Manila clams taken from Lummi Bay, Portage Bay, and Birch Bay State Park. All weights were measured using an Acculab AL 203 electronic scale. Based on these samples, beach-specific shell-width-weight relationships were derived and are now used to estimate individual clam weights based on the shell-width data that is collected in the field. Since the calipers used in the field can only measure clams to the nearest 1mm increment, it is assumed that only half of the clams that are recorded to be equal to the legal-size threshold were actually legal-sized, and the remaining half would have been marginally sublegal. Unfortunately, it is not possible to determine which of these threshold-sized individuals were sublegal during data analysis. Including all of these clams as legal-sized could artificially inflate the final biomass estimate and, conversely, excluding all of the threshold clams would underestimate the final biomass estimate. Consequently, the approach used in our analysis is to include all threshold individuals as if they were legal-sized, but assign each of these threshold-sized clams half of their probable weight. The threshold shell width (equivalent to a shell length of 38mm) was estimated to be 20mm at both Birch Bay and Portage Bay beaches, while the more globular/walnut-shaped clams at Lummi Bay had a threshold shell width of 21mm. Sublegal clam weights in each quadrat are determined by subtracting the legal-sized clam weight for each quadrat, from the total clam weight for each quadrat. Legal-sized clam densities for each quadrat are then determined by dividing the summed weight of the legal-sized clams found in the quadrat by the area of the quadrat used. The clam survey database is then used to export a table with the following columns: latitude, longitude, and legal pounds per square foot. This table is imported into ESRI ArcMap 10 GIS software and displayed using the GPS coordinates to determine the spatial location of each quadrat. At this point, the data is overlaid with rectified and registered aerial ortho-photographs of the tidelands to check for data entry and transcription/transposition errors in the coordinates. The positions of any quadrats that are obviously out of their correct place are then checked against the original data sheets, and corrected if a data entry error was found, or if a transcription error may have occurred in the field. If the GPS coordinate was recorded incorrectly, and data points existed on either side of the wrongly recorded data, a position midway between the two ‘good’ points is used instead, and the revised data is re-imported into the ArcMap GIS software. This process is performed iteratively to ensure data integrity and accuracy. From the revised file, a final point shapefile is finally created and used as the basis for subsequent analysis.

23
Data Analysis Because the placement of quadrats is systematically distributed but sampling density can vary between and within management areas, a simple average of the measured clam densities could result in significant bias since clam densities also vary spatially. Consequently, spatial analysis of the data is undertaken in order to account for any spatial bias in the survey layout. To get the best estimate of clam density…
To remove spatial bias introduced by unequal sample densities, the point data in the survey shapefile is analyzed using Thiessen polygons (Dolphin, 2004a). The software used is ArcGIS 10 (ESRI), which includes ArcMap, ArcCatalog, and ArcToolbox.
Firstly, polygon shapefiles are created within ArcMap that connect up all the end points of the transect lines on each beach that form polygons enclosing the entire surveyed area for each beach. These survey area polygons are used to set the boundary extents for the Thiessen polygon analysis. Boundary polygons for the analysis were created for entire beaches or bays where survey effort was contiguous, even where the extent included more than one management area. The ‘snapping’ feature of the shapefile editor was used to get the best possible accuracy.
Separate polygon shapefiles were also created using the survey area shapefile as a basis, but with the entire polygon area broken into separate management area polygons.
A Thiessen polygon layer is then created from the survey data point shapefile using the Thiessen Polygon Tool in ArcToolbox. The Thiessen polygon layer produced by this tool includes all of the attribute fields from the original point shapefile and covers the entire vertical and horizontal extent of the data. To reduce the output to match the shape of the survey area, this Thiessen polygon layer is clipped to match the survey area polygon layer using the Intersect Tool in ArcToolbox. The result of this process is a new polygon shapefile that has a polygon surrounding the area represented by each of the survey points, and limited to the boundaries of the survey area. The attribute table for the new shapefile contains all of the fields from the original point shapefile, as well as from the survey area polygon shapefile. The Leg_Lbs_Ft field contains the surveyed legal-sized Manila clam densities (lbs/ft2). The Xtools extension for ArcGIS is then used to add attribute fields to the shapefile table, which represent the Area (ft2) and Acreage of each polygon within the layer. This shapefile is used as the basis for estimating biomass in the total surveyed area, and is also subsequently clipped into separate management areas, using the management area polygons derived earlier, to calculate individual biomass estimates for each management area. Because the management area

24
boundaries within surveyed beach areas did not fall along the boundaries of the polygons generated by the Thiessen Polygon analysis this meant that some polygons were split into two during the clipping process. Consequently, the summed number of polygons for each management area sometimes exceeded the total number of polygons generated for the total survey area. To calculate the area covered by the survey…
The area field in the final Thiessen polygon table is summed to calculate the surveyed area in square feet. Further operations necessary for further analysis It is necessary to export the attribute table into a format compatible with spreadsheet software (e.g., Microsoft Excel) to perform further mathematical operations. We export the data as a dbf table for this purpose, and then open the file in Excel. In the spreadsheet workbook, the area column is summed to derive a grand total for the area surveyed. A ‘Proportion’ column is then added to the spreadsheet. The values in the proportion column are calculated by dividing each polygon’s area by the grand total of the surveyed area, and the values are rounded to 5 decimal places. Note that the summed values in the ‘Proportion’ column equal 1. Another new column is then created which is named ‘Proportion Squared’. This column contains values that are calculated by squaring the values in the ‘Proportion’ column. The final column to be added to the spreadsheet is named ‘Biomass’ and the values in this column are calculated by multiplying the value in the ‘Proportion’ column by the corresponding clam density value from the ‘Leg_Lbs_Ft’ column. To calculate the spatially weighted average clam density The spatially weighted average clam density can be represented by the equation:
…Equation 1
Where Xi represents the spatially weighted average clam density, wi represents the proportion of the total area represented by each Thiessen polygon, and xi represents the clam density found in each Thiessen polygon. In terms of the spreadsheet discussed above, this means that the spatially weighted average clam density is calculated by summing all of the values in the ‘Biomass’ column.

25
Precision of the estimate
Precision is a comparison of the width of the 95% confidence intervals to the magnitude of the value being estimated, and is expressed as a percentage. The lower the precision the more accurate the estimate is likely to be. 95% Confidence Intervals are calculated by the following equation:
… Equation 2
And the Standard Error is calculated using the equation:
… Equation 3
…Where s equals the standard deviation and n equals the number of observations/samples.
However, because we are estimating the precision of a spatially weighted average clam density, we cannot use the unmodified standard deviation of the observations in Equation 3. Instead, the spatially weighted standard deviation of the spatially weighted average has to be calculated, which first requires calculating the spatially weighted variance. The spatially weighted Variance (Varw) is calculated using the following formula:
…Equation 4
…where s2 is the spatially unweighted variance of the observations, and wi is the proportion of the total area represented by each Thiessen Polygon.
In terms of the spreadsheet above, s2 is calculated using the spreadsheet function VAR on the values in the Leg_Lbs_Ft column. The value within the brackets is calculated by summing all the values in the ‘Proportion Squared’ column. The weighted variance is the product of these two values. The weighted standard deviation (sw) is finally obtained by calculating the square root of the weighted variance. Once the weighted standard deviation is known, the spatially weighted standard error of the weighted mean is calculated using equation 3, and then the half-width of the spatially weighted 95% confidence interval is calculated using Equation 2.

26
Finally, the precision of the survey is determined by dividing the half-width of the 95% confidence interval (calculated in Equation 2) by the average clam density (obtained from Equation 1), and then multiplying the result by 100%. Determining Production Rates Size-frequency data for the clams from each management area are compiled and assumed to represent an unbiased size-frequency ‘snapshot’ of the population in each area. The individual weights of clams in each 1mm size increment are put in a column beside the size-frequency data, and the collective weight of all individuals within that size increment is calculated in the next column. The cumulative weight of individuals that are estimated to have a shell-length of 38mm or larger is divided by the total area sampled in that management area to provide a spatially biased sample estimate of legal clam density. This sample estimate was corrected for spatial bias by dividing the sample estimate of clam density by the spatially weighted estimate of clam density for that area. Because some clams die from natural mortality, and the surviving clams will grow during the following year, the ‘population’ represented by each size-frequency distribution was ‘grown out’ using the spreadsheet. To do this it is necessary to make predictions about growth rates and natural mortality rates that will occur over the following year.
0.0
0.1
0.2
0.3
0.4
0.5
0.6
0.7
0.8
0.9
1.0
8 13 18 23 28 33 38 43 48 53 58 63 68
Shell Length (mm)
Pro
bab
ilit
y o
f S
urv
ival
Figure 13. Survival rates used in calculating Production Estimates (from Dolphin, 2004b)
Clam survival and growth rates were obtained from a 2004 grow-out experiment in Lummi Bay (Dolphin 2004b), and these are incorporated into production rate calculations. Figure 13 shows the size-specific survival rates. However, it should be noted that this survival rate data is extremely limited and much more work is needed to better understand this critical parameter.

27
0
2
4
6
8
10
12
14
16
18
8 13 18 23 28 33 38 43 48 53 58 63 68
Shell Length (mm)
Pro
jec
ted
Gro
wth
(m
m)
Figure 14. Annual size-specific growth rates used in calculating production estimates
Annual growth rates used to ‘grow-out’ the observed size-frequency distribution by one year are shown in Figure 14. The relationships in Figure 13 and Figure 14 are converted to equivalent shell widths for use in the production rate model. By predicting the growth of clams in each size increment, and estimating the reduced frequency of clams after natural mortality occurs, it is possible to recalculate the collective weight of clams in each size increment for the following year. The cumulative weight of the clams that will exceed the legal-size threshold next year is then divided by the same ‘sampled area’ in order to predict the clam density that is expected to be present the following year. The predicted sample estimate is again corrected for spatial bias by factoring in the spatially weighted estimate of clam density, divided by the original sample estimate. This assumes that population distribution patterns are persistent from year to year. Next year’s legal biomass can then be predicted by multiplying next year’s calculated clam density by the area surveyed. The difference between the predicted legal clam biomass for next year and the estimate for this year is the total amount of new biomass that is expected.

28
Data Validation To audit the accuracy of the survey data being received from the contractor, the author conducted an independent re-survey of a section of Lummi Bay in 2010. No statistical difference was found to exist between the results of the resurvey and the contractor.
Results Survey activities began on June 5, 2013, and ended on August 19, 2013. Clam populations were surveyed in Lummi Bay Portage Bay, and a portion of Drayton Harbor/Semiahmoo. Survey results are presented in Table 2. Clam density maps for Lummi Bay, Portage Spit, the Brant area, and Drayton Harbor are presented in Figure 15, Figure 16, Figure 17, and Figure 18 respectively.
Table 2. Summary of 2013 Survey Results.
Drayton Harbor
Area Description
Thiessen Polygons
Individual Station
Areas (ft2)
Acres Surveyed Lbs/ft
2
Statistical Precision*
of Estimate
Lower 95%
Biomass Estimate*
Mean Biomass Estimate
Upper 95%
Biomass Estimate*
20A-001 286 2.25 23.85 0.12654 22.74% 101,576 131,467 161,358
Portage Bay
Area Description
Thiessen Polygons
Individual Station
Areas (ft2)
Acres Surveyed Lbs/ft
2
Statistical Precision*
of Estimate
Lower 95%
Biomass Estimate*
Mean Biomass Estimate
Upper 95%
Biomass Estimate*
S4 443 2.25 27.4 0.07683 13.2% 79,596 91,691 103,786
S5 557 2.25 27.8 0.03083 14.8% 31,806 37,332 42,859
S6 Not Surveyed
S7A Not Surveyed
S7D 439 2.25 39.3 0.04622 19.69% 53,664 66,823 79,982
S7E 260 2.25 22.5 0.01087 29.19% 7,539 10,647 13,756
All Combined 182,940 218,778 254,617
Lummi Bay
Area Description
Thiessen Polygons
Individual Station
Areas (ft2)
Acres Surveyed Lbs/ft
2
Statistical Precision*
of Estimate
Lower 95%
Biomass Estimate*
Mean Biomass Estimate
Upper 95%
Biomass Estimate*
S1B 224 9 152.7 0.03138 16.8% 173,674 208,745 243,816
S1C 138 9 194.6 0.00886 35.5% 48,245 75,048 101,852
S1D & S1E 399 9 749.1 0.02042 17.8% 547,630 666,412 785,194
All Combined 769,549 950,205 1,130,862
* Precision estimates used here are spatially weighted estimates derived from the Thiessen Polygon Analysis. See methods for fuller discussion of this parameter.

29
Figure 15. Legal-sized Manila clam densities in Lummi Bay based on 2013 survey data

30
Figure 16. Legal-sized Manila clam densities at Portage Spit and Senior’s Beach based on 2013 survey data

31
Figure 17. Legal-sized Manila clam densities surveyed at Brant Flats and Brant Island in 2013

32
Figure 18. Legal-sized Manila clam densities surveyed at Drayton Harbor in 2013

33
Although most beaches are surveyed annually, and large proportions of the area are typically surveyed each year, the full extent of the beach area that is surveyed differs from year to year. Consequently, it is not always meaningful to directly compare the different survey results across years. However, a meaningful comparison can still be made between the clam densities found inside the sections of the beach that are common to multiple survey years. By restricting the analysis for subsequent surveys to just those results that are located within the common area, an index of clam biomass can be produced that approximates the total biomass present each year. Figure 19 shows the relative change in the biomass present in the each management area surveyed in Lummi Bay, and Figure 20 shows relative change in biomass in management areas in Portage Bay.
Figure 19. Change in Harvestable Biomass in Lummi Bay Management Areas since 2002

34
Figure 20. Change in Harvestable Biomass in Portage Bay Management Areas since 2002
Table 3. Annual Production Estimates Based on LNR Manila Clam Survey Results.
Survey Year
Lummi Bay Portage Bay Birch Bay State Park
S1B S1C S1D&E S4 S5 S7D S7E 60
2002 35,254 36,179 100,012 N/A 49,701 65,052 16,040 N/A
2003 30,237 29,448 77,488 N/A 41,703 63,159 32,371 49,266
2004 28,466 10,349 89,299 N/A 34,617 58,458 27,162 61,824
2005 28,490 23,904 109,684 N/A 18,249 53,381 31,794 49,013
2006 17,531 41,033 81,210 N/A 31,903 N/A N/A N/A
2007 19,657 18,529 55,858 N/A 29,910 28,236 N/A N/A
2008 25,251 12,097 61,445 N/A 17,685 43,478 14,005 N/A
2009 N/A N/A N/A N/A N/A N/A N/A N/A
2010 45,692 21,040 81,886 N/A 20,294 47,890 12,126 N/A
2011 18,270 12,292 57,059 N/A 20,502 52,215 N/A N/A
2012 24,066 13,285 33,593 14,491 21,338 26,254 17,864 N/A
2013 11,290 17,411 75,970 14,673 11,776 34,888 4,070 N/A
Production estimates for each beach, based on the 2013 survey data, are presented in Table 3 along with previous estimates that were derived from 2002 – 2012 survey data. (Note that these production estimates are not directly comparable for some Portage Bay beaches because of differences in the

35
surveyed areas between years. In particular, one productive area in S7D was not surveyed in 2002 or 2007). Because the total biomass on these beaches has changed since 2002, the recommended harvest strategy for 2013—2014 does not directly reflect the anticipated production for the coming year. The recommended harvest amounts for all approved areas are detailed in Table 4 and these values are shown in context with previous harvests in Figure 21.
Table 4. Recommended Harvest Totals for 2013-2014
Expected Production from Grow-out Model
Biomass Accumulation Since First Survey
Recommended TAC
S1B 11,290 37,793 30,186
S1C 17,411 -233,153 8,706
S1DE 75,970 69,168 110,554
S4 14,673 63,740 46,543
S5 11,776 -17,715 5,888
S7D 34,888 -63,065 17,444
S7E 4,070 -53,976 2,035
001 N/A N/A 21,692*
060 N/A N/A 26,069**
Total 170,077 -197,210 267,510
*= (Legal Biomass) * 0.33 * 0.5 ** = (Legal Biomass) * 0.33 * 0.8
Figure 21. Comparison of 2013-2014 Season Harvest Recommendation to Past Harvest Totals

36
Discussion
Manila clam populations on some beaches in northern and southern Lummi Bay appear to be stable and are slightly above first-survey densities. However, central Lummi Bay still appears to show no signs of recovery. All of the Portage Bay beaches, with the exception of S4, have declined markedly from first-survey densities. Most worryingly, the two historically most important beaches, Portage Spit (S5) and Brant Flats (S7D), have only 40% and 50% of their 2002 population remaining respectively. And though it is a less important area historically, Brant Island (S7E) is at only 20% of the population that was present in 2002. However, the growing population in the Senior Beach area (S4) is encouraging news. It has now been 11 years since the first comprehensive clam surveys were conducted on the reservation tidelands. Management of the resource during this time has attempted to use limited growth/mortality data, together with annual survey results, to try to match commercial harvest rates to expected biomass increases, along with a target clam density for each beach. Unfortunately, this system has not proved to be as sustainable as hoped, as evidenced by large reductions in clam densities on some important beaches. Some possible reasons for the poor performance of the harvest strategy could include:
Unanticipated Winterkill events
No accounting for clams taken in Ceremonial and Subsistence Harvests
Illegal Harvest
No accounting for sublegal clam mortalities due to harvest activities o Suffocation in spoil o Freezing when exposed to nighttime winter temperatures o Undersize clams rejected at the buyer
Changing environmental conditions in Central Lummi Bay
Currently, none of these potential issues are factored into the process of how harvest targets are derived, or how they are allocated to Lummi tribal members. Nor is any information on the quantity of sublegal clam mortality due to harvest, or legal clam C&S harvest, or illegal clam harvest available to LNR that would permit such allowances to be made in the future. In all these cases, however, accounting for these issues would lead to a reduction in the TAC for commercial harvest. Until such time as a policy direction is given to set aside some of the harvest to account for these problems, and meaningful data becomes available to document the extent and quantity of C&S harvest etc, it is likely that the current management strategy will continue to struggle to maintain clam densities at the original levels seen in 2002. Other strategies to help might include meaningful substrate enhancement activities (gravelling in Lummi Bay) and clam

37
seed planting in ares with weak recruitment but that already have suitable substrates (e.g., Portage Bay beaches).

38
References Dolphin, C.H. 2002 An Analysis of 2002 Clam Surveys. Lummi Natural
Resources Technical Report.
Dolphin, C.H. 2003 An Analysis of 2003 Clam Surveys. Lummi Natural
Resources Technical Report.
Dolphin, C.H. 2004a Evaluation of Some Spatial Analysis Methods for Analyzing
Survey Results from Three Simulated Clam Populations. Lummi Natural
Resources Technical Report.
Dolphin, C.H. 2004b Manila Clam Growth and Mortality Rates Observed in a
Small-Scale Grow-out Experiment in Lummi Bay. Lummi Natural
Resources Technical Report.
Dolphin, C.H. 2004c An Analysis of 2004 Clam Surveys. Lummi Natural
Resources Technical Report.
Dolphin, C.H. 2005a 2006 Lummi Bay Winterkill Event. Lummi Natural
Resources Internal Memo.
Dolphin, C.H. 2005b An Analysis of 2005 Clam Surveys. Lummi Natural
Resources Technical Report.
Dolphin, C.H. 2006 An Analysis of 2006 Clam Surveys. Lummi Natural
Resources Technical Report.
Dolphin, C.H. 2007 An Analysis of 2007 Clam Surveys. Lummi Natural
Resources Technical Report.

39
Dolphin, C.H. 2008 An Analysis of 2008 Clam Surveys. Lummi Natural
Resources Technical Report.
Dolphin, C.H. 2010 An Analysis of 2010 Clam Surveys. Lummi Natural
Resources Technical Report.
Dolphin, C.H. 2011 An Analysis of 2011 Clam Surveys. Lummi Natural
Resources Technical Report.
Dolphin, C.H. 2012 An Analysis of 2012 Clam Surveys. Lummi Natural
Resources Technical Report.
Lummi Natural Resources (LNR). 2010 Lummi Intertidal Baseline Inventory (LIBI)
Final Report. Lummi Natural Resources Technical Report.
Peterschmidt, M. 1990. Population Survey of Intertidal Clams on Semiahmoo
Spit. Whatcom County Parks Department Technical Report.
Washington Department of Fish and Wildlife (WDFW) 1996. Procedures to
Determine Intertidal Populations of Protothaca Staminea, Tapes
Philippinarum, and Crassostrea Gigas in Hood Canal and Puget Sound,
Washington. Procedures Manual MRD96-01.
Washington Department of Health (WADOH) 2012a Annual Growing Area
Review for Drayton Harbor. Annual Report.
Washington Department of Health (WADOH) 2012b Annual Growing Area
Review for Birch Bay. Annual Report.
Washington Department of Health (WADOH) 2012c Annual Growing Area
Review for Portage Bay. Annual Report.

40
Washington Department of Health (WADOH) 2012d Annual Growing Area
Review for Lummi Bay. Annual Report.